Investigation of superconducting order parameters in heavy ...
162
Investigation of superconducting order parameters in heavy-fermion and low-dimensional metallic systems under pressure Dissertation zur Erlangung des akademischen Grades Doctor rerum naturalium (Dr. rer. nat.) vorgelegt der Fakult¨ at Mathematik und Naturwissenschaften der Technischen Universit¨ at Dresden von Corneliu Florin Miclea geboren am 04. April 1974 in Petrosani, Rum¨ anien MAX-PLANCK-INSTITUT F ¨ UR CHEMISCHE PHYSIK FESTER STOFFE DRESDEN, 2005
-
Upload
khangminh22 -
Category
Documents
-
view
2 -
download
0
Transcript of Investigation of superconducting order parameters in heavy ...
Investigation of superconducting order parameters
in heavy-fermion and low-dimensional metallic
systems under pressure
Dissertation
zur Erlangung des akademischen Grades
Doctor rerum naturalium(Dr. rer. nat.)
vorgelegt
der Fakultat Mathematik und Naturwissenschaftender Technischen Universitat Dresden
von
Corneliu Florin Miclea
geboren am 04. April 1974 in Petrosani, Rumanien
MAX-PLANCK-INSTITUT FUR CHEMISCHE PHYSIK FESTER STOFFEDRESDEN, 2005


Contents
Introduction 1
1 Theoretical concepts 5
1.1 Fulde-Ferrell-Larkin-Ovchinnikov state . . . . . . . . . . . . . . . . . 5
1.1.1 Introduction . . . . . . . . . . . . . . . . . . . . . . . . . . . . 5
1.1.2 Pauli paramagnetism and superconductivity . . . . . . . . . . 6
1.1.3 FFLO state . . . . . . . . . . . . . . . . . . . . . . . . . . . . 8
1.1.4 Order of the FFLO phase transition and dimensionality . . . . 12
1.1.5 Orbital effects . . . . . . . . . . . . . . . . . . . . . . . . . . . 14
1.1.6 FFLO state in d-wave superconductors . . . . . . . . . . . . . 17
1.1.7 Conclusions . . . . . . . . . . . . . . . . . . . . . . . . . . . . 18
1.2 Charge-density wave phenomena . . . . . . . . . . . . . . . . . . . . . 20
1.2.1 Introduction . . . . . . . . . . . . . . . . . . . . . . . . . . . . 20
1.2.2 Instability in a one-dimensional electron gas . . . . . . . . . . 20
1.2.3 Mean-field approach to charge-density wave phenomena . . . . 21
1.2.4 Fluctuations and strong electron-phonon coupling effects . . . 24
1.2.5 Conclusions . . . . . . . . . . . . . . . . . . . . . . . . . . . . 25
i
2 Experimental methods: Pressure cells 27
2.1 Miniaturized specific heat pressure cell . . . . . . . . . . . . . . . . . 27
2.2 Pressure cell for resistivity studies . . . . . . . . . . . . . . . . . . . . 29
2.2.1 MP35N . . . . . . . . . . . . . . . . . . . . . . . . . . . . . . 32
2.3 Uniaxial stress pressure cell . . . . . . . . . . . . . . . . . . . . . . . 34
3 Possible Fulde-Ferrell-Larkin-Ovchinnikov state in the heavy-fermioncompound CeCoIn5 37
3.1 CeCoIn5 a good candidate for the FFLO state formation . . . . . . . 37
3.1.1 Crystal structure and basic properties . . . . . . . . . . . . . . 38
3.1.2 Quasi-2D electronic structure . . . . . . . . . . . . . . . . . . 40
3.1.3 Unconventional superconductivity . . . . . . . . . . . . . . . . 41
3.1.4 Clean-limit superconductor . . . . . . . . . . . . . . . . . . . 47
3.1.5 Pauli-limited SC and signatures of the FFLO state . . . . . . 48
3.2 Non-Fermi liquid behavior in the normal state in CeCoIn5 . . . . . . 53
3.3 Specific heat experiments under pressure and in magnetic field . . . . 55
3.3.1 Heat capacity setup . . . . . . . . . . . . . . . . . . . . . . . . 56
3.3.2 Experimental results . . . . . . . . . . . . . . . . . . . . . . . 57
3.3.3 Magnetic field effect on the SC transition for B ‖ (a, b) . . . . 63
3.3.4 Magnetic field effect on the SC transition for B ‖ c . . . . . . 71
3.3.5 Discussion and conclusions . . . . . . . . . . . . . . . . . . . . 73
4 Superconducting order parameter symmetry in UBe13 probed byuniaxial stress 85
4.1 Introduction . . . . . . . . . . . . . . . . . . . . . . . . . . . . . . . . 85
4.2 Normal state and non-Fermi liquid behavior in UBe13 . . . . . . . . . 86
4.3 Unconventional superconductivity in UBe13 . . . . . . . . . . . . . . . 89
ii

4.4 Possible uniaxial strain effect on the SC order parameter . . . . . . . 91
4.5 Effect of tetragonal distortion on the superconducting transition in UBe13 96
4.5.1 Conclusions . . . . . . . . . . . . . . . . . . . . . . . . . . . . 102
5 Interplay of superconductivity and charge-density wave instabilityin TlxV6S8 103
5.1 Introduction . . . . . . . . . . . . . . . . . . . . . . . . . . . . . . . . 103
5.1.1 Crystal structure . . . . . . . . . . . . . . . . . . . . . . . . . 104
5.1.2 Possible charge-density wave formation in TlxV6S8 . . . . . . 104
5.1.3 Superconductivity in TlxV6S8 . . . . . . . . . . . . . . . . . . 106
5.2 Interplay of SC and CDW in TlxV6S8 . . . . . . . . . . . . . . . . . . 108
5.2.1 Experimental setup . . . . . . . . . . . . . . . . . . . . . . . . 109
5.2.2 Influence of Tl content . . . . . . . . . . . . . . . . . . . . . . 110
5.2.3 Influence of pressure on the charge-density wave instability andon the superconductivity . . . . . . . . . . . . . . . . . . . . . 121
5.3 Conclusions . . . . . . . . . . . . . . . . . . . . . . . . . . . . . . . . 128
6 Conclusions 129
Appendix: AC specific heat under uniaxial stress in CeCoIn5 133
Bibliography 135
Acknowledgments 151
iii

Introduction
The understanding of new emerging unconventional ground states is a great chal-
lenge for experimental and theoretical solid-state physicists. New ground states are
developing, where different energy scales compete, leading to a high sensitivity of the
system to external tuning parameters like doping, pressure or magnetic field.
The exploration of superconductivity proved to be a fascinating and challeng-
ing scientific undertaking. Discovered by H. Kammerlingh Onnes in 1911, prior to
the development of the quantum theory of matter, superconductivity was defying a
microscopic theory for more than four decades until the BCS theory was formulated
in 1957 by J. Bardeen, L. N. Cooper and J. R. Schrieffer. Superconductivity of most
of the simple metals or metallic alloys is well described within the frame of the BCS
scenario, however, in the last thirty years numerous new superconducting materials
were found to exhibit exotic properties not accounted for by the BCS theory. Among
them are included the high-Tc compounds, the heavy-fermion superconductors and
as well the organic superconductors. It was the purpose of this work to probe dif-
ferent facets of superconductivity in heavy-fermion and in low-dimensional metallic
compounds.
In the class of the heavy-fermion systems the Kondo-effect, leading to a non-
magnetic ground state, competes with the Ruderman-Kittel-Kasuya-Yosida (RKKY)
interactions which favors magnetic order. It is this competition which leads to un-
usual physical properties in proximity to a quantum critical point, where the magnetic
ordering temperature is suppressed to zero. The heavy-fermion compound CeCoIn5 is
superconducting at atmospheric pressure having the highest superconducting transi-
1

2 Introduction
tion temperature, among all Ce-based heavy-fermion systems [1]. CeCoIn5 is assumed
to be situated close to an antiferromagnetic quantum critical point giving rise to non-
Fermi liquid behavior in the normal state [2]. Recently, the possible appearance
of an inhomogeneous superconducting state in CeCoIn5, called Fulde-Ferrell-Larkin-
Ovchinnikov (FFLO) state, attracted much attention not only among solid state
physicists [3, 4]. The FFLO state, predicted independently by Fulde and Ferrell [5]
and by Larkin and Ovchinnikov [6] 40 years ago, is a spatially inhomogeneous su-
perconducting phase, where the order parameter is periodically modulated in real
space. It is predicted to appear in type-II superconductors close to the upper critical
field if the orbital pair-breaking is negligible relative to the Pauli-limiting effect, in
sufficiently clean systems. The theoretical concept of the FFLO state is not only of
importance in solid state physics, but also in elementary-particle physics [7]. The
FFLO state eluded the experimental confirmation until very recently. CeCoIn5 is the
first material where different physical experiments show strong evidence pointing to
the realization of the FFLO state at low temperatures close to the upper critical field
for superconductivity. However, the presence of strong antiferromagnetic fluctuations
in this compound might be responsible for the anomaly taken as signature of the
FFLO state.
The central part of the present work is the exploration of the nature of this
low temperature phase observed inside the superconducting state in CeCoIn5 at high
magnetic fields. Using external pressure to suppress the magnetic fluctuations we
were able for the first time to provide evidence that the FFLO state in CeCoIn5
exists away from the influence of the strong magnetic fluctuations present at atmo-
spheric pressure. For this purpose we developed a new type of miniature pressure
cell allowing us to conduct heat capacity studies under quasi-hydrostatic pressure
conditions at high magnetic fields up to B = 14 T and at low temperatures down to
T = 100 mK, on precisely oriented CeCoIn5 single crystals. We studied the evolu-
tion of the magnetic field – temperature phase diagram with pressure. Not only the
first-order character of the transition from the normal to the superconducting state
at high magnetic fields persists with increasing pressure, but we could also follow the

Introduction 3
transition from the vortex to the FFLO state for all pressures. Moreover, the FFLO
region in the phase diagram is extended at high pressures. This strongly supports
the genuine FFLO origin of the anomaly in the superconducting state and makes a
magnetic origin very unlikely.
Despite of more than two decades of intensive experimental studies to char-
acterize the heavy-fermion superconductor UBe13, many details behind its physi-
cal properties remain undisclosed. Several experiments probing the superconducting
state of this material, revealed anomalous features which are regarded as evidence
for unconventional superconductivity. The most compelling evidence obtained so far
for unconventional superconductivity regards the giant ultrasonic absorption anomaly
observed directly below Tc [8, 9] which was ascribed to collective modes or domain-wall
damping due to a multi-component order parameter [10]. Theoretical calculations by
Sigrist et al. [11, 12] predict the behavior of a multi-component order parameter for
an anisotropic superconductor under uniaxial stress. Uniaxial stress is lowering the
crystal symmetry and the degeneracy in the order parameter representation might
be lifted leading to a split of the superconducting transition. We performed high
resolution AC specific heat experiments under uniaxial pressure up to p = 0.55 GPa.
A small feature resembling a superconducting temperature splitting is induced by
pressure. However, this feature has to be regarded carefully as, though improbable,
pressure anisotropy cannot be completely ruled out as origin.
The interplay between superconductivity and a charge-density wave (CDW) in-
stability remains an interesting experimental and theoretical challenge. The opening
of a dielectric gap in the electronic spectrum due to electron-hole pairing, reduces
the density of states at the Fermi-level. However, not uncommon are the examples of
compounds displaying a CDW instability which at lower temperatures enter a super-
conducting ground state. In such cases the superconductivity sets in from a normal
but gapped state. We thoroughly investigated the quasi-one-dimensional, metallic
compound TlxV6S8 employing resistivity, specific heat and susceptibility measure-

4 Introduction
ments at ambient pressure for different Tl fillings. Moreover, in resistivity studies,
we followed the evolution with pressure of both superconducting and CDW phases in
the above mentioned compounds.
This dissertation is divided into six chapters. After this introduction, in Chap-
ter 1 we will outline the basic theoretical concepts later needed for the analysis of the
experimental results. In Chapter 2 we briefly introduce the experimental techniques
with a special focus on the new pressure cells developed during this thesis and used
for the measurements presented in Chapters 3 to 5. In Chapter 3 the possible real-
ization of the inhomogeneous superconducting FFLO state in CeCoIn5 is studied by
specific heat measurements under hydrostatic pressure, while in Chapter 4 the results
of AC specific heat experiments on UBe13 under uniaxial pressure are presented. The
ambient pressure properties as well as results obtained by resistivity measurements
under hydrostatic pressure on the one-dimensional metallic compounds TlxV6S8 are
discussed in Chapter 5. At the end, Chapter 6 summarizes and concludes this thesis.

Chapter 1
Theoretical concepts
This chapter serves to outline some of the basic theoretical concepts which are related
to the experimental results to be presented in the following chapters.
1.1 Fulde-Ferrell-Larkin-Ovchinnikov state
1.1.1 Introduction
For a type-II singlet superconductor (SC), in the clean-limit and for which the main
pair-breaking mechanism is due to the spin susceptibility (Pauli paramagnetism), an
inhomogeneous superconducting phase is predicted to appear at low temperatures and
close to the upper critical field (Bc2), between the normal and the vortex state [5, 6].
At the core of this phase, called Fulde-Ferrell-Larkin-Ovchinnikov (FFLO), lie com-
peting interactions of basic nature. One is the energy necessary to bind the electrons
into Cooper pairs (the condensation energy) and the other is the interaction between
the spin of the electrons and the magnetic field. In the normal state, the electrons are
free to lower their total energy by preferentially aligning their spins along to the ex-
ternal magnetic field, leading to a temperature-independent Pauli susceptibility. On
the other hand, in the superconducting state, the numbers of spin-down and spin-up
electrons are equal and since they cannot all be aligned along the magnetic field, the
ground state energy is higher than in normal state. In this way, Pauli paramagnetism
will always favor the normal state against the spin-singlet superconducting phase.
This effect, called Pauli-limiting, is reducing the upper critical field Bc2 to the char-
5

6 Chapter 2
acteristic Pauli field BP , defined in the absence of all other pair-breaking mechanisms.
The magnetic field can also suppress superconductivity when the kinetic energy of
the supercurrent around the superconducting vortices becomes greater than the su-
perconducting condensation energy; this is the orbital limiting effect and reduces the
Bc2 to the orbital-limiting field Borbc2 defined in the absence of Pauli-limiting.
1.1.2 Pauli paramagnetism and superconductivity
The Pauli field for a classical BCS-superconductor was determined by A. M. Clogston
[13] and B. S. Chandrasekhar [14]. The stability of the superconducting state com-
pared to the normal state is given by the free-energy balance
Fs − Fn = −B2c
8π, (1.1)
where Fn and Fs are the free energies per volume unit in the normal and supercon-
ducting state, respectively, and Bc is the thermodynamic critical field. A metal, in
the normal state, has a finite paramagnetic susceptibility χn caused by the electronic
density of states at the Fermi-level. Upon applying magnetic field B the free energy
will be lowered, due to the spin polarization, by an amount of 12χnB
2. The same
metal, in the superconducting state, will have a susceptibility χs which is smaller
than in the normal state due to the formation of Cooper pairs. According to the BCS
theory, χs vanishes as the temperature is lowered to T = 0 K. Therefore, the free
energy balance between the normal and the superconducting state, at absolute zero
temperature, can be written as:
Fn −1
2χnB
2c = Fs. (1.2)
Considering the electronic gyromagnetic factor g and the electronic density of states
at T = 0 K, N(0), the spin susceptibility becomes:
χn =1
2(gµB)2N(0), (1.3)
where µB is the Bohr-Procopiu magneton. The jump in the free energy at the su-
perconducting phase transition can be related to the superconducting energy gap at

Theoretical concepts 7
0.0 0.5 1.00.00
0.25
0.50
(µBH
P/∆0)2
T/Tc
Figure 1.1: Above the critical point t0 = T0/Tc = 0.556 the solid line is the critical field forthe second-order phase transition. Below t0 the dotted line corresponds to the first-orderphase transition and the solid line to the supercooling critical field.
T = 0 K, ∆(0) by:
Fn − Fs =1
2N(0)∆(0)2. (1.4)
Therefore, the upper limit for the critical field in the absence of any orbital effect
(i.e., the Pauli field BP ), for a BCS superconductor, can be written as [13]:
BP = Bc2(0) =
√2∆(0)
gµB
. (1.5)
The effect of Pauli paramagnetism on the order of the superconducting phase
transition was discussed by G. Sarma [15] and K. Maki and T. Tsuneto [16]. They
found that for a clean superconductor in which the Pauli paramagnetism is the dom-
inant limiting factor for the upper critical field, the phase transition changes from
second- to first-order as the temperature is lowered (Fig. 1.1). Below the critical
point t0 = T0/Tc = 0.556 the phase transition between the normal and the supercon-
ducting phase, changes from second- to first-order; in this region, the gap equation
has two solutions, one corresponding to the actual gap (dotted line) and the other
corresponding to a supercooling critical field. It is important to remark that the lower
line, below t0 is not associated with a phase transition between a classical BCS phase
8 Chapter 2
and an inhomogeneous superconducting state.
In the dirty-limit (one would intuitively expect a short mean-free path for super-
conductors for which the orbital effect can be neglected) the phase transition should
remain second-order for the whole temperature range [16].
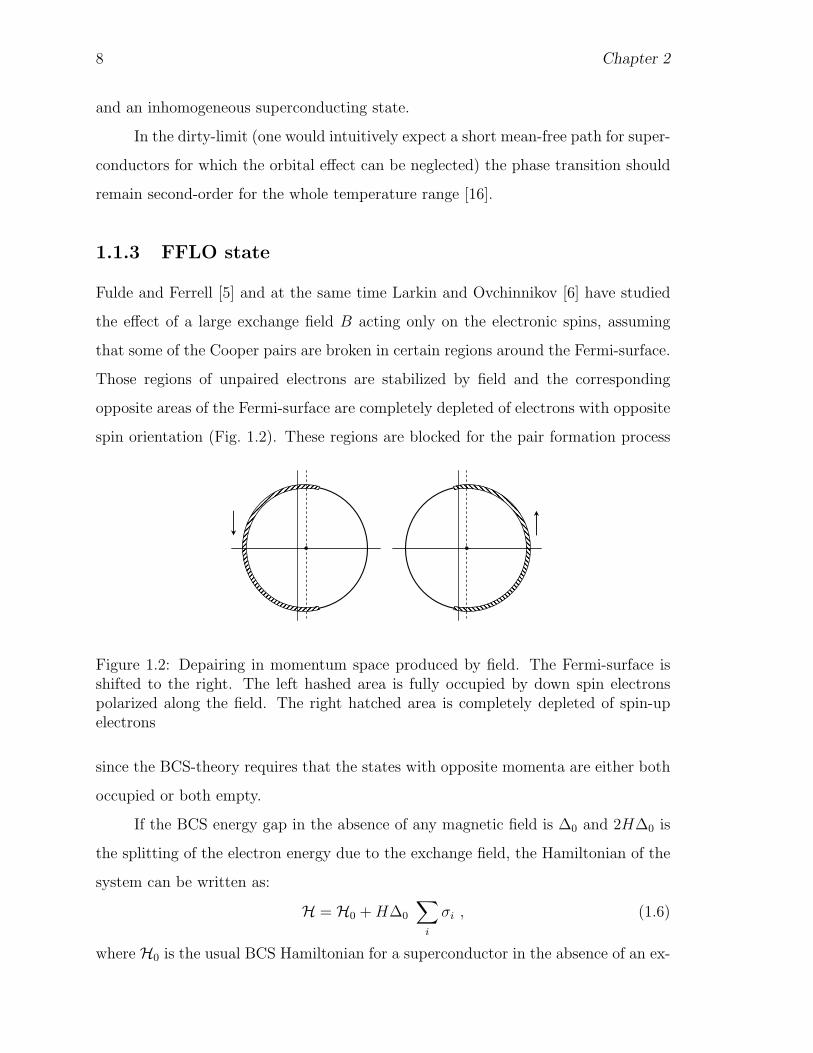
1.1.3 FFLO state
Fulde and Ferrell [5] and at the same time Larkin and Ovchinnikov [6] have studied
the effect of a large exchange field B acting only on the electronic spins, assuming
that some of the Cooper pairs are broken in certain regions around the Fermi-surface.
Those regions of unpaired electrons are stabilized by field and the corresponding
opposite areas of the Fermi-surface are completely depleted of electrons with opposite
spin orientation (Fig. 1.2). These regions are blocked for the pair formation process
Figure 1.2: Depairing in momentum space produced by field. The Fermi-surface isshifted to the right. The left hashed area is fully occupied by down spin electronspolarized along the field. The right hatched area is completely depleted of spin-upelectrons
since the BCS-theory requires that the states with opposite momenta are either both
occupied or both empty.
If the BCS energy gap in the absence of any magnetic field is ∆0 and 2H∆0 is
the splitting of the electron energy due to the exchange field, the Hamiltonian of the
system can be written as:
H = H0 + H∆0
∑i
σi , (1.6)
where H0 is the usual BCS Hamiltonian for a superconductor in the absence of an ex-

Theoretical concepts 9
change field and σi is the operator ±1 reflecting the spin alignment (”up” or ”down”)
of the i-th electron with respect to the magnetic field. The second term of the Hamil-
tonian is proportional to the total electronic spin component parallel to the field,
which operator commutes with H0 and therefore has the same set of eigenfunctions
and associated eigenvalues with H0. Thus an approximate eigenfunction of H is the
BCS ground state wave function.
For a field which produces a split of the conduction electrons energy of√
2∆0,
the normal state undergoes already enough spin orientation to acquire a lower free
energy than the BCS ground state [17]. Electronic configurations which lower further
the energy of the system have even lower symmetry than in Fig 1.2 [5]. Therefore,
the unpaired electrons are distributed asymmetrically around the Fermi-surface and
this leads to a net current flow. But in the absence of magnetic field acting on the
electron orbits, the ground state should not carry any current (Bloch’s theorem).
Consequently, it is necessary for the remaining paired electrons to establish
a counterflow current exactly canceling out that of the unpaired electrons. This
leads to a remarkable result: the Cooper pairs are formed from states (k,−σ) and
(k′ = −k + q, σ) and have a finite momentum q, where k and σ are the momentum
and the spin of the one electron wave function (Fig. 1.3). The choice of q determines
the size of regions with unpaired electrons and the value of the superconducting gap.
The pairing wave vector q is determined as a function of the magnetic field imposing
that the depaired current and the supercurrent (which both depend on q) sum up to
zero.
This new inhomogeneous superconducting phase yields a highly degenerate
ground state characterized by the direction of the pairing momentum. For this phase
to qualify as a ground state, the single-particle excitations must all have positive en-
ergies. Goldstone’s theorem [18, 19], implies that there must exist low-lying collective
modes. The mixed state was found to be stable over a finite range of the magnetic
field. This range, for weakly coupled electrons is:
0.71∆0
µB
< B < 0.76∆0
µB
[5]. (1.7)

10 Chapter 2
ε
kεF k´ k
q=k´+k
B
T=0 K
Figure 1.3: The Cooper pairs are formed from (k,−σ) and (k′, σ) states, with a finitemomentum q. The energy is lowered for the electrons with the spins parallel to themagnetic field B.
An increased coupling strength will decrease the stability of the depaired phase rel-
ative to the BCS state, but will decrease the energy of the normal state even more,
due to enhanced magnetization. Therefore, the stability range for the strong coupling
case is significantly extended to:
0.83∆0
µB
< B < 1.13∆0
µB
[5]. (1.8)
The BCS superconducting gap has to be integrated taking into account the
regions of the Fermi-surface allowed to pairing:
∆ = N(0)V
(∫ ~ω0
0
∆
Ek
dεk −∫
blocked
∆
Ek
dεk
), (1.9)
where the second integral is over all depaired regions, Ek =√
ε2k + ∆2, εk is the
electron energy relative to the Fermi-level εF and εF − ~ω0 < εk < εF + ~ω0, N(0)
is the density of states at the Fermi-level and V is the volume. For this phase to
be a ground state, all single-particle excitations must have positive energies. The
quasiparticle energy associated with the addition of a particle with the wave vector
k and energy εk is given by:
Eq,B = Ek +1
2gµBBσ +
~m
qk ≥ 0 , (1.10)

Theoretical concepts 11
where 12gµBBσ is the energy change due to the Zeeman effect (σ = ±1), ~
mqk = |q|vF
is caused by the finite momentum |q| pairing (i.e., shift of the Fermi-surface) and vF
is the Fermi velocity. At the boundary of the blocking region we have:
Eq,B = 0 . (1.11)
The width of the blocking regions in momentum space is determined by solving the
equation 1.11. Using this in the integral 1.9 one can obtain the gap equation which
in real space can be written as:
∆(r) = |∆q| exp(iqr) [5] (1.12)
or
∆(r) = |∆q| cos(qr) [6] . (1.13)
Therefore this inhomogeneous superconducting phase, called Fulde-Ferrell-Larkin-
Ovchinnikov state, shows an unusual and remarkable spatial modulation of the order
parameter in real space, meaning that the normal and the superconducting regions
of the material are placed alternately perpendicular to the magnetic field and the
vortices (Fig. 1.4). The order parameter has nodes (∆(r) = 0) in the normal planes
with a periodicity of 2π/|q|. The size of the superconducting regions depends on
pairing momentum q.
In contrast to the classical BCS state, the FFLO phase exhibits spin magneti-
zation, almost normal state tunneling and specific heat. This is expected as a result
of an almost constant density of states (though with some structure) qualitatively
similar with the normal state [5]. The spin polarization appears around the nodes of
the order parameter and the wavelength of the spin-density wave is π/|q| with the
spin-density of the quasiparticles given by:
< σ >≈ σn
[1−
(∆(r)
∆0
)2]
, (1.14)
where σn = 2µBBN(0) is the spin polarization in the normal state [20].
According to the Ginzburg-Landau theory, the supercurrent is proportional to
the square of the order parameter, therefore it cannot pass through the nodal planes.

12 Chapter 2
B
T*
T0
Uniform vortex state
2nd ord.
1st ord.
2nd ord.
Normal
FFLO
B
T
Figure 1.4: Generic B(T ) phase diagram. At low temperatures and high magneticfields, an FFLO phase emerges between the BCS-superconducting and the normalstate. In this phase, the order parameter is spatially modulated along the magneticfield. The hatched regions (∆(r) = 0) in the upper inset are in the normal state andthe gray ones are superconducting regions.
Nevertheless, this theory is only valid close to Tc and it has been shown that the
supercurrent is passing, with a phase shift, in the direction of the exchange field,
through the regions where the order parameter is vanishing [20]. It is also important
to note that the FFLO state is readily destroyed by impurities [21].
The findings of Fulde-Ferrell and Larkin-Ovchinnikov apply also if the exchange
field is replaced by an uniform external magnetic field providing that the orbital effects
are sufficiently small.
1.1.4 Order of the FFLO phase transition and dimensionality
According to the original paper of Fulde and Ferrell [5], upon increasing the magnetic
field, the system undergoes a first-order phase transition from the conventional vortex

Theoretical concepts 13
state to the FFLO phase and then, at the upper critical field, a second-order phase
transition into the normal state. The pairing momentum at the latter transition is
given by:
|qc| =gµBBc
0.833 vF
. (1.15)
But depending on how strong is the Pauli-limiting effect and on the details of the
free energy expansion in powers of the order parameter, the order of the transitions
can be reversed. Larkin and Ovchinnikov [6] left open the possibility for a first-
order transition from FFLO to normal state. More recent and extensive calculations
were addressing the problem of the order of the transition in both, two (2D) and
three dimensions (3D) for conventional s-type superconductors and in the absence of
orbital effects.
In 2D it is generally believed that the phase transition from the normal to
the FFLO state is of second-order in the whole temperature range. In particular
Burkhardt and Rainer [22] have found, at finite temperature, an order parameter
∆0(r) cos(qr). This is the order parameter found by Larkin and Ovchinnikov in 3D at
T = 0 K, for a second-order phase transition. However, in 2D and at low temperature,
the order parameter becomes more complicated and can be a superposition of more
than two plane waves [23]. The low temperature case in 2D was addressed in detail
by Combescot and Mora [24]. They found that for an isotropic Fermi surface (i.e., a
circle in 2D) the order parameter changes from a simple cos(qr) close to the tricritical
point to an increasingly more complex one as the temperature is lowered. The order
parameter, at the transition in the normal state, changes to a superposition of planar
waves with equal weights and equal wave vector moduli. The directions of these
wave vectors are equally spaced angularly and with an angle which goes to zero as
the temperature is decreased to zero. This gives rise to an infinite number of planar
waves, singularity related to the fact that in 2D the Fermi-surface is a line. The
transitions between the various FFLO phases and the normal state remain second-
order.
In 3D, in the vicinity of the tricritical point, the order parameter is a simple
cos(qr) at the transition [25–27], and the phase transition from FFLO to normal state

14 Chapter 2
is always first-order [28–30]. Upon decreasing the temperature, the order parameter
changes to a sum of two cosines with equal weights and wave vectors with same moduli
but orthogonal directions. Finally, by further lowering the temperature, one finds
another transition toward an order parameter which is a sum of three cosines, again
with same weights and wave vectors with equal moduli and orthogonal directions [29]:
∆(r) = ∆0[cos(q1r) + cos(q2r) + cos(q3r)] (1.16)
where q1, q2, q3 are orthogonal and |q1| = |q2| = |q3|.
It must be underlined that the orbital effect [31], the pairing symmetry and also
small amounts of impurities [32] may influence the order of the phase transition and
the structure of the order parameter.
1.1.5 Orbital effects
The orbital-limiting effect is the one which, in general, has the main influence in
determining the upper critical field of a superconductor. So taking it into account, in
the context of the FFLO state in type-II superconductors, is of great importance.
The influence on the upper critical field of both, Pauli and orbital-limiting,
was discussed for the dirty-limit case by Werthamer et al. [33] and independently by
Maki [16, 34]. They conclude that the orbital interactions reduce the effect of spin
paramagnetism in limiting Bc2 and also diminish the possibility to have a first-order
phase transition into the normal state at low temperatures and in high magnetic
fields.
The formation of a FFLO state is favorable only in the clean-limit [21, 35, 36].
The realization of this state depends on the relative strength of the Pauli paramag-
netism and of the orbital effects. This is quantified by the Maki parameter α [37]:
α =
√2Borb
c2
BP
, (1.17)
where Borbc2 and BP are the orbital and Pauli field, respectively, defined at the begin-
ning of this chapter.

Theoretical concepts 15
0 2 4 6 80.0
0.2
0.4
0.6
0.8
1.0
T0/Tc
Bc2(0)/BP
α
Figure 1.5: Bc2(0)BP
and T0
Tcas function of the Maki parameter α according to L. W.
Gruenberg and L. Gunther [36].
L. W. Gruenberg and L. Gunther showed for the first time that the FFLO state
formation is possible in the presence of orbital effects [36]. Their results for an s-wave
type-II superconductor are depicted in Fig. 1.5, where Bc2(0) is the upper critical field
at T = 0 K, Tc is the temperature of the normal to superconducting phase transition
and T0 is the temperature of the tricritical point. They found out that the formation
of the FFLO phase is possible only in systems for which
α > αc = 1.8 (1.18)
is fulfilled and below a characteristic temperature T0(α). For α → ∞ the orbital
limiting effect can be neglected and the upper limit for T0 is:
T0 = Tc(B0) = 0.55 Tc(B = 0) [36]. (1.19)
Also, for α → ∞, the phase transition to the normal state is of first-order [15,
16]. Bc2(0) increases monotonously with α and reaches asymptotically, in the pure

16 Chapter 2
T1T0
Normal
BCS-Superconductivity
FFLOB
TFigure 1.6: Generic B(T ) phase diagram proposed by M. Houzet et al. [31] for an s-type superconductor and accounting for both, orbital and Pauli-limiting effects. Thethick lines represent first-order phase transitions.
paramagnetic limit:
Bc2(0)α→∞ = BP . (1.20)
Equation 1.20 gives the lower limit for BP . The Gruenberg-Gunther ansatz is of great
importance since it is valid for d-wave and other nodal superconductors as well. The
orbital field is proportional to the initial slope of Bc2 [38]:
Borbc2 = 0.7 Tc
∂Bc2
∂T
∣∣∣∣Tc
. (1.21)
It was suggested by M. Houzet et al. [31] that in the clean-limit, for an s-
type superconductor, the presence of orbital effects reduces the temperature of the
tricritical point relative to the pure paramagnetic case by:
∆T0 ≈ 1.2Tc
α. (1.22)
The generic phase diagram obtained by M. Houzet et al. [31] is presented in
Fig. 1.6. The inhomogeneous superconducting state has an exp(iqr) (Fulde-Ferrell

Theoretical concepts 17
state) modulation of the order parameter immediately below T0 in a narrow tempera-
ture range ∆T ≈ 0.08Tc/α. The system changes through a first-order phase transition
into another unpaired state with a cos(qr) modulation (Larkin-Ovchinnikov state).
Below a certain temperature T1, with T0 − T1 ≈ 4Tc/α, the transition from normal
to FFLO state changes from second- to first-order.
1.1.6 FFLO state in d-wave superconductors
Figure 1.7: Fermi-surface for a d-wave superconductor. The shadowed ellipses arepockets of unpaired electrons with spins polarized along the magnetic field
It is important to discuss the FFLO state in the context of d-wave superconduc-
tors since for this type of superconductors it is more probable to achieve the conditions
requested for the formation of the inhomogeneous superconducting phase. The main
difference to the s-wave case is that even at zero field the superconducting gap has
nodes. Upon increasing the field, pockets of normal, polarized electrons form around
the initial nodes (Fig. 1.7). The inner and outer parts of the pockets are pieces of

18 Chapter 2
the field-split Fermi surface which come together when the Zeeman energy exceeds
the angle dependent gap function. K. Yang et al. [39] have found that for a 2D d-
wave superconductor, ignoring the orbital effect, the B − T phase diagram remains
qualitatively similar to the s-wave case. Moreover, they showed that the stability
range of the unpaired phase is considerably extended to 0.56 ∆0 < µBB < 1.06 ∆0
compared with 0.71∆0 < µBB < ∆0 [40] for the 2D s-wave case. The transition from
the normal to the FFLO state is second-order and is followed by a first-order phase
transition, at lower fields, into the zero momentum pairing state.
It is also important to remark that for the d-wave case the FFLO state seems
to be more robust against impurities [32].
1.1.7 Conclusions
The realization of the inhomogeneous superconducting FFLO state is possible in type-
II singlet superconductors in the clean-limit and with a high Maki parameter α > 1.8,
at high fields and low temperatures (T ≤ 0.56Tc [39]). Such conditions are extremely
difficult to achieve in conventional superconductors [41]. Therefore, an important
strategy to observe this phase is to eliminate, as much as possible, the orbital currents
which are responsible for the low critical fields in ordinary superconductors. A path to
achieve this is to lower the electronic dimensionality of the system in a geometry where
the orbital currents would have to flow in an actually prohibited direction. Other
systems for which the field coupling to the orbital degrees of freedom is comparable
with the coupling to the electronic spins are, for example, the heavy-fermion systems
due to the largely enhanced electronic masses. But in this last case the sensitivity to
the impurities should be regarded with great attention. It is therefore not surprising
that earlier observations of possible FFLO phases in heavy fermion compounds [42]
have been disputed.
For a very strong Pauli-limiting effect (α 1.8) the phase transition from the
FFLO to the normal state is expected to be of first-order regardless of the system
dimensionality. Nevertheless, in a 2D system, theoretical studies suggest that the
order of the phase transition could change, from first-order in the vicinity of the

Theoretical concepts 19
tricritical point, to second-order, as the temperature is lowered to T = 0 K.
The appearance of unconventional superconductors such as the heavy-fermions,
organic and high-Tc compounds, opens up a new window for exploration of the FFLO
state. Many of these materials have a layered structure with larger Fermi velocities
within the conducting plane. Technical advances in single crystal growth allow now
to obtain samples with an electronic mean-free path of the order of microns which
favors the FFLO state. Finally, for d-wave superconductivity the FFLO state has a
more extended stability region and is more robust against impurities [32] than for the
s-wave superconductors.
In addition to its intrinsic fundamental interest, the FFLO phase has also a
potential practical relevance since it appears in superconductors with very high critical
fields. It was also suggested that this phase is of high importance for the physics of
ultracold gases in their superfluid BCS-like state [43, 44] and also in the physics of
quark matter [7] as it might be found in the center of the neutron stars.
Theoretical models, assuming a weak coupling BCS model with dx2−y2 pairing
symmetry, a quasi-2D electronic structure and the Gruenberg-Gunther ansatz have
been developed [45, 46]. A different approach based on antiferromagnetic (AFM) spin
fluctuations in the frame of a mean-field theory offers as well a way to qualitatively
explore the FFLO state [47].
However, to properly understand the physics of this state, particularly for un-
conventional superconductors, remains an important challenge.

20 Chapter 2
1.2 Charge-density wave phenomena
1.2.1 Introduction
While charge-density wave (CDW) formation occurs in materials with two- or three-
dimensional band structure, they are predominantly a one-dimensional phenomenon.
The basic concepts regarding the physical properties of such CDW states were first ad-
dressed by Peierls [48] more than 50 years ago. He pointed out that a one-dimensional
metal coupled to the underlying lattice is not stable at low temperatures as the sys-
tem favors a new ground state displaying a static periodic lattice distortion and a
modulation of the conduction electron density.
Moreover, the ground state of the coupled electron-phonon system is charac-
terized by a gap in the single-particle excitation spectrum and by a collective mode
formed by electron-hole pairing involving the wave vector |q| = 2kF (kF is the Fermi
wave vector) as the paired electron and hole are situated on opposite points of the
Fermi-surface. The charge-density associated with the collective mode is given by
ρ(r) = ρ0 + ρ1 cos(2kF · r + ϕ) [49], (1.23)
where ρ0 is the unperturbed electron density and the condensate is called the charge-
density wave. The phase ϕ is of fundamental importance as its time and spatial
derivative are related to the electrical current and to the condensate density.
1.2.2 Instability in a one-dimensional electron gas
A one-dimensional electron-gas interacting with a periodic potential φ(r) =∫qφ(q)eiqr
will have a response function (Lindhard susceptibility):
χd(q) =
∫1
(2π)d
fk − fk+q
εk − εk+q
dk [50], (1.24)
where q is the wave vector, εk is the electron energy, fk = f(εk) is the Fermi distri-
bution function, and d is the dimensionality of the system.
In the one-dimensional case, the particular topology of the Fermi-surface leads
to an electronic dispersion εk = EF ± ~vF (k − kF ) (EF is the Fermi-level) [50]. In

Theoretical concepts 21
this case the equation 1.24 can be rewritten as:
χ1D(q) = −e2N(EF ) ln
∣∣∣∣q + 2kF
q − 2kF
∣∣∣∣ , (1.25)
with N(EF ) the density of states at the Fermi-level. χ1D(q) diverges for electron-
phonon pairing q = 2kF . This topology is called perfect nesting and for an arbitrary
cutoff energy ε0, at finite T , the response function becomes [50]:
χ1D(2kF , T ) = −e2N(EF ) ln1.14 ε0
kBT. (1.26)
The system becomes unstable for T → 0.
1.2.3 Mean-field approach to charge-density wave phenom-
ena
For a one-dimensional metal at T = 0 K, in the absence of electron-electron or
electron-phonon interactions the ground state corresponds to the situation depicted
in Fig. 1.8, left panel; the electron states are occupied up to the Fermi-level, EF , and
the undistorted crystal has a lattice constant a. The charge-density is independent
of the spatial coordinates. The presence of the electron-phonon interaction renders
more energetically favorable a periodic lattice distortion. This distortion opens up a
gap at the Fermi-level as depicted in the right panel of Fig. 1.8, where the situation
appropriate for a half-filled band is presented. The electrons only occupy states k
with −|kF | < |k| < |kF | and the gap leads to a reduction of the electronic energy.
In the one-dimensional case the magnitude of the single-particle gap ∆ depends
proportionally on the lattice distortion u and the reduction of the electronic energy
for a small displacement is proportional to u2 ln(u). Moreover, the deformation leads
also to an increase of the elastic energy proportional to u2 [51]. Therefore, a small
distortion might lower the energy of the system compared to the undistorted state.
The magnitude of the distortion is given by the maximum gain in energy. The modi-
fication of the dispersion relation leads also to a spatially dependent electron density.

22 Chapter 2
atoms
EF
Є(k)
k kF=π/(2a) -kF π/a -π/a
∆
2a
ρ(r)
EF
Є(k)
k kF -kF π/a -π/a
a
ρ(r)
atoms
Figure 1.8: Sketch of a Peierls distortion in a one-dimensional metal with a half-filled band and the corresponding ε(k) diagram. Left panel: undistorted lattice.Right panel: the distorted lattice coupled with a spatially periodic modulation of thecharge-density leading to the opening of a gap in the single particle spectrum.
For an arbitrary band filling, the wavelength of the charge-density (λCD
) and
the accompanying periodic lattice distortion are incommensurate with the underlaying
lattice, i.e., λCD
/a is irrational.
Since the CDW instability develops as collective mode involving electron-hole
pairs coupled with the lattice distortion, both the electronic and phononic dispersion
relations are modified in the new ground state. Peierls [48] and Frohlich [52] addressed
the one-dimensional coupled electron-lattice system in the frame of a mean-field the-
ory in the weak coupling electron-phonon limit. In this approximation the system is
described by the following Hamiltonian:
H =∑k,σ
εk c†kσckσ +∑k,σ
~ ωq b†qbq +∑k,q,σ
gk c†k+q,σck,σ(bq + b†−q), (1.27)
where c†k and ck (b†q and bq) are the electron (phonon) creation and annihilation
operators with momenta k and q and spin σ. The electron and phonon dispersions are
denoted by εk and ωq, respectively, and gk is the electron-phonon coupling constant.
The first term of the Hamiltonian describes the one-dimensional free electron gas and

Theoretical concepts 23
the second the one-dimensional chains of ions. The last term denotes the coupling
between the two systems.
By solving the equation of motion for this Hamiltonian and making use of
equation 1.26 one can derive the phonon dispersion relation and from this the CDW
transition temperature:
TMF
CDW=
1.14 ε0
kB
e−1λ , (1.28)
where the dimensionless electron-phonon coupling constant λ is given by:
λ = g2 2kF
ω2kFEF
. (1.29)
The BCS-like expression of the CDW transition temperature (equation 1.28), indi-
cates that the TMF
CDWis enhanced as the electron-phonon coupling is increased. The
complex CDW state order parameter can be defined, similar to the BCS theory, as:
∆ = |∆|eiφ, (1.30)
where |∆| is related to the single-particle gap.
Without going into the details of the calculations which are carried out under
the basic assumptions of the weak-coupling limit (i.e., EF |∆|), we summarize the
main results of the mean-field theory approach in the following:
The periodic lattice distortion:
〈u(x)〉 = ∆u cos(2kF x + φ), (1.31)
with the single-particle gap being proportional to the atomic displacement
∆ u ∼ |∆|/g.
The modulation of the charge-density:
ρ(x) = ρ0
[1 +
∆
~vF kF λcos(2kF x + φ)
], (1.32)
where ρ0 is the spatially constant electronic density for T > TMF
CDW.

24 Chapter 2
The specific heat jump at the CDW phase transition
∆C
γeTMF
CDW
= 1.438 k2B N(EF ), (1.33)
where γe is the linear specific heat coefficient of the electron gas.
The zero-temperature gap is related to TMF
CDWby a BCS-like relation:
∆(0) = 1.76 kBTMF
CDW. (1.34)
1.2.4 Fluctuations and strong electron-phonon coupling ef-
fects
The mean-field description neglects the effect of fluctuations which, in the one-
dimensional case, are particularly important. Fluctuations increase the dimensional-
ity of the system and strongly suppress the transition temperature [53]; for a single
metallic chain the phase transition does not occur at finite temperature anymore.
For a system of coupled 1D chains the phase transition is restored again at non-zero
temperatures with most of the 1D correlations preserved in the CDW state [51, 54].
The coupling between 1D-chains is realized mainly via two mechanisms: the
Coulomb interaction between electrons situated in neighboring chains and via single-
particle tunneling between the chains [50]. In such a picture a new transition temper-
ature T3D has to be defined as the temperature below which the correlations on the
neighboring chains couple together, leading to a 3D long range order [53]. The general
picture that emerges is that chain systems, which are metals at high temperatures,
show strong 1D correlations along the chains above T3D leading to a wide fluctuating
region for the transition: T3D < TCDW
< TMFCDW
.
The effect of inter-chain coupling on the Peierls transitions in 1D chain systems
has been addressed within the mean-field theory, including the effect of fluctuations
by Horovitz et al. [55]. They found, for a given electron-phonon coupling, that the
CDW transition is robust against the inter-chain coupling η up to a critical value
ηc above which the transition temperature is drastically suppressed (Fig. 1.9). The

Theoretical concepts 25
0.002 0.005 0.01 0.02 0.05 1 0.002
0.005
0.02
0.05
0.01
0.01
λ=0.15
λ=0.2
λ=0.25
TC
DW
/ TF
η
Figure 1.9: TCDW
normalized to the Fermi temperature TF as a function of the inter-chain coupling η for different electron-phonon couplings λ. The solid line is themean-field temperature. The dashed lines are obtained when fluctuation effects arealso included into the calculation. From Ref. [55].
additional fluctuations narrow even further the stability range of the CDW state.
Strong coupling theories for CDW instabilities have been developed also by McMillan
[56] and later by Varma [57].
1.2.5 Conclusions
The CDW state occurs preponderantly in low-dimensional systems where parts of
the Fermi-surface are nested. Nevertheless another route towards CDW instabilities,
besides nesting, in low-dimensional systems is the existence of van Hove saddle points
[58]. The appearance of a gap in the single-particle excitation spectrum, together with
the collective mode described by a complex order parameter are features reminiscent
of superconductivity. However, the collective mode here is formed by electron-hole
pairs involving the wave vector 2kF as the electrons and the holes on opposite sides
of the Fermi-surface are combined to lead to the CDW instability and to the accom-

26 Chapter 2
panying lattice distortion. The cutoff energy which enters the CDW gap equation is
large compared to the characteristic phonon frequencies involved in the superconduct-
ing gap. Consequently the CDW transition temperature is considerably larger than
the superconducting transition temperatures. Furthermore, the CDW temperature is
strongly influenced by both, the electron-phonon and inter-chain coupling.
Interestingly, in real 3D compounds although anisotropic, superconductivity
and CDW coexist as proven by numerous experimental results. In the struggle for
the FS the superconductivity is often found to be the weaker competitor.

Chapter 2
Experimental methods: Pressurecells
This chapter serves to outline some of the basic experimental setups used to obtain to
the experimental results to be presented in the following chapters emphasizing mainly
the devices developed during this work.
Pressure is an ideal control parameter to tune a compound through various
parts of its phase diagram. Other control parameters such as doping or magnetic
field have the disadvantage of introducing additional complexities due to the effect
of disorder in the case of doping or due to breaking of the time-reversal symmetry in
the case of magnetic field.
2.1 Miniaturized specific heat pressure cell
Specific heat measurements under pressure, at low temperature and in high magnetic
field, require specially developed pressure cells with the lowest possible contribution
(addenda) to the total heat capacity.
This was the motivation for us to develop a new miniaturized piston-cylinder
type pressure cell built entirely from very clean CuBe. The cell was designed to fit
on the commercially available Quantum Design specific heat platforms and as well to
be easily accommodated on any typical size specific heat platforms used in dilution
cryostats.
Great attention has to be paid to the heat treatment of the CuBe as this is
27

28 Chapter 2
Sample space
Locking nut
Cell body
Piston
Figure 2.1: Left panel: the component parts of the miniaturized specific heat pressurecell. Right, upper panel: size reference for the cell. Right, lower panel: the pressurecell mounted on a self-built specific heat platform designed for a dilution refrigerator.
the determining factor in setting the upper pressure limit achieved in the cell; in our
case the material was annealed at 325oC for 2.5 hours. In Fig. 2.1, a sketch of the
component parts of the cell is displayed. The force is applied via a piston (not shown
in the figure) along the direction depicted by the vertical arrow. Once the desired

Experimental methods 29
force is achieved the locking nut is closed and keeps the whole force. The right panel
shows a size reference for the cell (upper picture) and the cell mounted on a self-built
specific heat platform designed for a dilution refrigerator.
Cell characteristics:
The pressure cell mass is of only 160 mg and its filling factor (sample/addenda
heat capacity ratio) is well above other specific heat pressure cells.
Inner bore diameter: below 1 mm;
Pressure transmitting medium: Pb;
Pressure determination: The pressure is determined by the inductively mea-
sured shift of the SC transition temperature of Pb used also as pressure medium,
relative to a Pb sample placed outside, directly on the cell. Good hydrostatic
conditions, comparable to the liquid filled cells, are achieved;
Maximum pressure: we achieved pressures around p ≈ 1.4 GPa, in the first and
up to date the only study employing this cell, without reaching the upper limit
of the cell. The maximum threshold expected for this CuBe cell is of about
p = 1.6 GPa.
2.2 Pressure cell for resistivity studies
We developed a double-wall piston-cylinder pressure cell designed for resistivity mea-
surements and downsized to fit in a commercially available Quantum Design Physical-
Property-Measurement-System (PPMS) and as well in any of the dilution refrigerator
cryostats available to us.
The schematic drawing of the double-wall piston-cylinder pressure cell used in
the resistivity study is depicted in Fig. 2.2. The cell has an outer wall of annealed
CuBe inside which an inner body made out of a special alloy (hardened MP35N) is
fitted. The inner body has to withstand most of the pressure. The force is applied

30 Chapter 2
CuBe Locking nut
MP35N pressure pad
WC piston
Cu sealing ring
Teflon cap (sample space)
MP35N feedthrough
CuBe locking nut
MP35N pressure pad
CuBe jacket (outer wall)
MP35N inner wall
CuBe sealing ring
Figure 2.2: Schematic drawing of the double-wall piston-cylinder pressure cell usedin the resistivity studies.

Experimental methods 31
VPb
V1 V2 V3
I I
10 mm
Sample
Pb manometer
Cu wires embedded in epoxy
Figure 2.3: Upper panel: schematic of the feedthrough and the sample board. Lowerpanel: picture with the actual feedthrough with two TlxV6S8 samples and Pb (backside) on the board.
with a hydraulic press (from the lower part in Fig. 2.2) and kept by closing the
locking nut. The force is transmitted to the sample space via a tungsten carbide
(WC) piston. The samples are placed on a very thin fiber glass board inside a teflon
cup filled with the pressure transmitting medium. The Cu wires used for the resistivity
measurements are passing from the ambient pressure inside the sample space via the
so called ”feedthrough” shown in Fig. 2.3. This is the most delicate and vulnerable
part of the pressure cell and special attention has to be given while building it. The
wires are sealed inside the bore with a commercially available epoxy (Stycast 2850 FT

32 Chapter 2
hardened with Catalyst 9 from Emerson & Cuming) using the vacuum-impregnation
technique described in Ref. [59]. Great care has to be taken in cleaning the wires and
degassing the epoxy.
Different fluids were tested as pressure transmitting media: fluorinert, Daphne
oil, and a 1:1 mixture of iso-pentane and n-pentane. The latter is the only one
which does not solidify under pressure at room temperature up to p = 3.5 GPa and
assures the best hydrostatic conditions. The pressure inside the cell is determined by
a resistive measurement of the superconducting transition temperature, Tc, of a lead
sample (used as manometer) placed inside the cell, along the whole sample space.
The Tc(p) dependency is well established in the literature (Ref. [60]). Only for the
alcohol mixture, the superconducting transition width of Pb has been found to be
sharp (approx. 5 mK) and pressure independent. However, the disadvantage of this
liquid is its very high volatility which makes it difficult to work with. Feedthroughs
which are sealing fluorinert or Daphne oil are often found to be leaking when the
alcohol mixture is used. This adds extra demands on the quality of the feedthrough
construction but remains the best available option for this particular type of cell.
Nevertheless, the fluorinert and the Daphne oil can also be used successfully for
different constructions of the cells, with lower lenght/diameter ratios for the sample
space.
Pressure cell characteristics:
inner bore: 4 mm;
sample space length: 25 mm;
maximum number of samples: 3 samples plus manometer;
maximum pressure: 3GPa.
2.2.1 MP35N
A limiting and difficult to control factor in determining the upper pressure limit is
the material used to build the inner body of the double-wall pressure cell. We used

Experimental methods 33
MP35N, but a thorough study revealed that its mechanical properties are strongly
dependent on two factors: the amount of cold-work (primary hardening) and the
heat treatment (secondary hardening). MP35N is a metallic alloy containing: 35%
Co, 35% Ni, 20% Cr and 10% Mo. An extensive study of its mechanical properties
can be found in [61–64].
MP35N, when fully annealed at T > 850 oC is a single phase solid solution with
fcc structure. It is a low stacking fault energy (SFE) alloy with a high strength and
high ductility and remarkably stable against corrosion.
-1.0 -0.5 0.0 0.5 1.0540
560
580
600MP35N 4h at 580o C
Mic
roha
rdne
ss (V
HN
)
R/R0
Figure 2.4: Microhardness of a cylindrical sample of MP35N as a function of relativedistance R/R0 to the center.
MP35N is commercially available cold-drawn with a volume reduction of 53%.
However the cold-drawing in cylindrical shape compresses mostly the outer parts of
the material leaving the inner part soft. We measured the microhardness of disk
shaped samples (with the diameter of 2R0 ≈ 1.2 cm) of MP35N prior and after the
heat treatment. We always found a significant hardening reduction (approx. 10%)

34 Chapter 2
in the middle of the sample as depicted in Fig. 2.4. This feature is of increasing
importance for smaller pressure cells.
In summary, the following remarks are important to be considered when design-
ing a pressure cell of this type:
final hardening depends primarily on the amount of cold work;
for high performance pressure cells, MP35N with a volume reduction of about
65% is required;
optimum heat treatment: 4 hours at 590 oC. Extended aging gives no extra
hardening.
for small inner bore pressure cells, cold-rolled MP35N is preferable to the cold-
drawn one due to an accentuate hardness reduction in the latter case in the
middle of the rod.
2.3 Uniaxial stress pressure cell
The AC specific heat measurements under uniaxial stress on the cubic heavy-fermion
UBe13 presented in this work were performed in a pressure cell developed by B. Wand
[65] (Fig. 2.5).
This pressure cell, accommodated in a 3He refrigerator, allows to modify in situ the
uniaxial stress applied to a sample situated between two stainless steel anvils. A
mixture of 3He and 4He from a pressure reservoir is applied via a very thin capillary
to the bellows situated at low temperature. A proportional-integral pressure regulator
at room temperature was added to the system allowing to keep the pressure constant
within 10−4 GPa during a measurement. The force was calibrated in situ using a
piezoceramic sensor so that also friction effects were accounted for. The spring system
in Fig. 2.5 keeps the upper and lower anvils always perfectly parallel one to each other.
The uniaxial pressure depends on the sample cross section and its upper limit is, in
general, given by the mechanical strength of the sample. In order to prevent the

Experimental methods 35
(TMTTF)22XX(TMTSF)22XX
p, x
SC
AFMSP
CO
1022
1000
T (K
)
00p, x
T (K
)
10CePd22Si22CeIn33
AFM
SC00 SC
Nd2-x CexxCuO44
T (K
)
300
AFM
SCSC
La2-x SrxxCuO44
xx
T (K
)
1011
10-4
p (bar)40 00
SF B
SF A
SS
MS
33He
High-TemperatureSuperconductors
f-Electron Metals(Heavy Fermions)
Organic Metals(1 D)
Liquid Helium-3
AFM: Antiferromagnet orMS: Spin-aligned solid
CO Charge-ordered or S: Solid
SC: Superconductor orSF: Superfluid
SP: Spin-Peierls
Unconventional superconductivity
• Order parameter symmetry lower than that of the lattice
• Non-BCS pairing mechanism
• Superconductivity out of non-Fermi-liquid normal state
• Links to other low temperature phases explored by varyinglattice density or carrier density
Multicomponent order parameters(analysis by Sigrist, Ueda, Joynt and Rice [5,6])
• Non-BCS superconducting order parameter may belong to multidimensional representation:
• Crystal symmetry allows expansion of order parameter as:
( )
( ) ) or rep, (3D
) rep, (2D
) rep, (1D
,,
,~
54
3
1
3
2
1
321
2
121
11
ΓΓ
Γ
Γ
∆
ψψψ
λλλ
ψψ
λλ
ψλ
• Form of interaction potential determines which rep. gives highest Tc.
• For 2- or 3-D representation, expand free energy:
( ) ( ) terms-cross order4th222 ++= λλ bTaF ii
• Cubic crystal: ai = a, single transition.
• Tetragonal distortion: ai ≠ aj , can have multiple transitions(but complications due to higher order terms).
Conclusions and open questions
Implications of lack of splitting:
• Single component order parameter?
• The induced stress still too small?
• Depending on details of the free energy F, fourth-order cross-terms can pin the order parameter at the higher temperature transition, preventing the other one even in the case of a multicomponent order parameter.
References
[1] F. Gross et al., Z. Phys. B: Condens. Matter 64 (1986), 175.[2] H.R. Ott et al., Phys. Rev. Lett. 52 (1984), 1915.[3] H.R. Ott at al., Phys. Rev. Lett. 50 (1983), 1595.[4] C. Wälti et al., Phys.Rev.Lett 84 (2000), 5616.[5] M. Sigrist et al., Europhys. Lett.,3 (1987), 629.[6] M. Sigrist et al., Phys. Rev. B, 36 (1987), 5186.[7] C. Langhammer et al., J. of Magn. and Magn. Mater., 177-181 (1998), 443.[8] P.H.P. Reinders et al., Europhys. Lett., 25 (1994), 619.[9] P.F. Sullivan et al., Phys. Rev., 173 (1968), 679.[10] J.D. Thompson, J. of Magn. and Magn. Mater., 63-64 (1987), 358.
• No unambiguous double structure could be detected so far for either one of the sample within our measurement resolution (∆Tac∼1 mK).
• Very different pressure dependence of Tc for L- and H-type.
• The theoretical prediction of the Tc split (0.5 K/GPa) is much larger than the experimental values (less than 0.01K/GPa).
• Slight change in slope near of maximum of C(T)
Heat capacity under uniaxial stress
• Samples ~ 10 mg measured independently of pressure-cell.• Low frequency (< 1 Hz) AC technique. Measuring frequency
depends on thermal time constants of setup.• High relative accuracy gives very good resolution of phase
transition anomalies.
Csample
Heat input Temp. oscillations
T(t)P(t)
Thermo-meter
Piston
Piston
Heater
Sample
Helium bellows
Cell frame
Upper piston
Sample setup
Lower piston
The actual sample setup; a RuO2thermometer and a 10 kΩ resistor as heater, are connected to the sample by silver foil.
Sample mass: 7.3 mg.
Sample size: (1.42 x 1.35 x 1.09) mm3
1 mm
0 1
1sample
ac
P( ) = P + P cos( )
PC = ( , , ) [9]
T i e
t t
F
ω
ω τ τω
×∆
• For L-type: δTc/δp=(8.5±6.8) mK/GPa in good agreement with [8];
• For H-type: δTc/δp=(50±6) mK/GPa consistent with the value reported for hydrostatic pressure(160 mK/GPa) [10];
• For both cases Tc,T30%,T70% vary almost at the same rate while Tmax drifts away significantly.
L-type and H-type phase diagram
L-type H-type
0.0 0.1 0.2 0.3
0.72
0.75
0.78
T30%
T70%
Tmax
Tc
T (K
)
Pressure (GPa)0.0 0.2 0.4 0.6
0.88
0.90
0.92
Tmax
T70%
T30%
Tc T (K
)
L-type UBe13: splitting of Tc under uniaxial stress ?
0.6 0.7 0.8 0.9 1.0
1.0
1.5
2.0
p=0.27 GPa p=0 GPa
C/T
(J/
K2 m
ol )
Temperature (K)
0.7 0.8
1.0
1.5
2.0
Tmax
?
T30%
T70%
Tc
C/T
(J/K
2 mol
)
T(K)
p=0.27 GPa
At p=0:
• Tc=0.755 K taken at 50% of ∆C;
• Transition width (10-90%) ≈ 45 mK;
A small change of slope (marked with “?” in the inset) is visible close to the maximum point of the transition.
stress in [001] direction
H-type UBe13: splitting of Tc under uniaxial stress?
0.8 0.9 1.0 1.1
1.0
1.2
1.4
1.60.015 GPa0.250 GPa0.400 GPa0.550 GPa
(C/T
) / (C
/T) 1K
Temperature (K)
0.85 0.901.0
1.2
p=0.55GPa
Tmax
T30%
?
Tc
T70%
(C/T
) / (C
/T) 1K
T (K)
At p=0:
• Tc ≈ 0.925 K taken at 50% of ∆C;
• Transition width (10-90%) ≈ 23 mK;
A small feature (marked with “?” in the inset) is visible close to the maximum point of the transition at high pressure.
stress in [001] direction
UBe13 unconventional heavy fermion superconductor
• Strongly anisotropic order parameter for which the gap function shows zeros on certain parts of the Fermi surface:
λ(T) -λ(0)∼T2, below Tc [1];
C(T) ∼T2, below Tc [2];
• Two variants of UBe13 [7]:
L-type: Tc ≈0.75 K
H-type: 0.85≤Tc≤0.95 K
0 1 2 30
1
2
3
"L"-type UBe13
"H"-type UBe13
C
(J/K
mol
)
Temperature (K)
[R. H
elfri
ch19
96]
UBe13 - cubic structure with lattice constant a0=1.0257nm
- CsCl sublatice of U and Be(I)atoms are showed in figure.
- 24 Be(II) atoms not shown in fig. form a cube surrounding one U atom
•Strong coupling effects in superconducting UBe13:
γ ≈1.1 J/mol K2 [3];
∆C/Cn(Tc)≈2.5 [2];
2∆/kBTc≈6.7 [4];
• Superconductivity precludes Fermi liquid (Tc ~ TF*)!
Unconventional superconductivity in UBe13 probed by uniaxial stressC. F. Miclea, F. M. Grosche, J. Sichelschmidt, G. R. Stewart*, G.Sparn and F. Steglich
Max-Planck-Institut für Chemische Physik fester Stoffe, Nöthnitzer Str. 40, 01187 Dresden, Germany*) Department of Physics, University of Florida, Gainesville, Florida 32611-8440, USA
Figure 2.5: Sketch of the uniaxial pressure cell. Ref. [65].
TS , CS TH , CH TTh , CTh
Bath, TB
Thermometer Sample Heater
KB
KTh KH
P(t)
Csample T(t) R
P(t)
heater thermometer
anvil
anvil
sample
Force
Figure 2.6: Left panel: Sketch of the sample setup. Right panel: equivalent electricalcircuit.
crystal from breaking and also to allow some sideways movement, we used copper
foil and capton tape between the sample and the anvils. For the AC specific heat
measurements under uniaxial stress, a heater (10 kΩ SMD resistor) and a thermometer
(2.2 kΩ RuO2 thick-film SMD resistor) were glued with silver paste on the opposite

36 Chapter 2
sides of the sample, as schematically depicted in Fig. 2.6 left panel. Assuming that
the thermal resistances between thermometer-sample and heater-sample are negligible
compared to the sample-bath contact and neglecting the thermometer and heater
heat capacity, the equivalent electrical circuit is shown in the right panel of Fig. 2.6,
where R depends on the internal (τi) and external (τe) relaxation times. τi describes
the internal equilibrium of the sample, including the heater and the thermometer
and depends on the sample thermal conductivity and geometry. τe describes the
equilibrium between the sample and the surrounding and is mainly given by the
thermal link to the bath (cryostat). τe can be adjusted by properly choosing the type
of materials placed in between sample and anvils.
An oscillating heating power P (t) = P0 + P1 cos(ωt) is applied through the
heater, generating oscillation of the sample temperature with an amplitude ∆Tac.
The sample heat capacity is then given by:
Csample =P1
ω∆Tac
F (ω, τi, τe) [66]. (2.1)
As can be seen, F depends on the thermal contact to the bath (through τe) which is
constantly improved upon increasing pressure. Therefore great attention had to be
paid to the frequency response of the AC signal. A detailed description of the AC
specific heat method is given in [66].

Chapter 3
PossibleFulde-Ferrell-Larkin-Ovchinnikovstate in the heavy-fermioncompound CeCoIn5
3.1 CeCoIn5 a good candidate for the FFLO state
formation
The Fulde-Ferrell-Larkin-Ovchinnikov(FFLO) phase is expected to be realized at low
temperatures (T ≤ 0.56 Tc [39]) and high magnetic fields in a type-II singlet su-
perconductor in the clean-limit and for which the Pauli paramagnetism dominates
the orbital currents in limiting the upper critical field (Maki parameter α > 1.8).
In this inhomogeneous superconducting phase, situated between the normal and the
vortex state, part of the Cooper pairs are broken on certain regions asymmetrically
distributed around the Fermi-surface. Consequently it is necessary for the remaining
paired electrons to establish a counterflow current exactly canceling out that of the
unpaired electrons. Therefore, the Cooper pairs form with a finite momentum q, in
a (k ↑, (−k + q) ↓) state instead of the conventional (k ↑,−k ↓) pairing, where k is
the momentum of the one electron wave function. This leads to an unusual spatially
modulated order parameter with a wavelength, in the vicinity of the upper critical
field, equal to 2π/|q|, meaning that the normal and the SC regions of the material are
37

38 Chapter 3
placed alternately perpendicular to the magnetic field and the vortices. The size of
the SC regions depends on the pairing momentum q. However, the realization of such
a state in conventional s-wave superconductors is almost impossible [41]. Gruenberg
and Gunther [36] showed that the FFLO state can be realized even in the presence
of the orbital term and their ansatz plays a crucial role, since it is valid for d-wave or
other nodal superconductors as well. For a more thorough introduction to the FFLO
state see Chapter 1.1.
Though predicted by theory more than four decades ago [5, 6], the FFLO phase
proved to be elusive to the experiments and therefore has been constituting an in-
creasing challenge for the physicists, especially in the last few years. Although several
compounds have been proposed as likely candidates for the formation of such a state,
subsequent analysis has called the interpretation of the data into question.
The prerequisites for the realization of the FFLO phase are extremely difficult
to achieve in any known superconductor but recently a new promising system has
been found in CeCoIn5 [1] which seems to meet in an ideal way all the requirements.
3.1.1 Crystal structure and basic properties
CeCoIn5 belongs to the heavy-fermion family of CeTIn5 (T = Co, Rh, or Ir) com-
pounds crystallizing in the tetragonal HoCoGa5 crystal structure, with the lattice
constants a = b = 4.614 A and c = 7.552 A [67, 68]. The structure, analogous to its
isostructural relatives CeRhIn5 and CeIrIn5, is built up by single layers of CeIn3 and
CoIn2 stacked alternatively along the c-axis. It has two crystallographically inequiv-
alent In sites. The first one (In(1)), surrounded by Ce atoms, is located in the Ce-In
plane and has a symmetry which is invariant under four-fold rotations relative to the
c-axis. The second (In(2)) site, surrounded by both, Ce and Co ions, has a lower
crystal symmetry. Due to the anisotropic environment, a large electric field gradient
is expected for both In positions (Fig. 3.1).
A rather remarkable characteristic of this family of materials is their instability
to superconductivity. CeCoIn5 and CeIrIn5 are superconductors at ambient pressure
below Tc = 2.3 K [1] and Tc = 0.4 K [69], respectively, while for CeRhIn5 the super-

FFLO in CeCoIn5 39
T
Ce
In
TIn2
CeIn3
Figure 3.1: The crystal structure of the CeT In5 family. The structure is built up ofalternating layers of CeIn3 and T In2.
conductivity is induced only upon applying pressure: Tc = 2.12 K at p = 2.1 GPa [70].
In each case, superconductivity develops out of a highly correlated state with a large
specific heat coefficient γ and in proximity to antiferromagnetism. Rh substitution
40 Chapter 3
into CeCo1−xRhxIn5 [71] and in CeIr1−xRhxIn5 [72] induces antiferromagnetic order
in both compounds. However CeRhIn5 is the only one in the family showing static
long range antiferromagnetic order with a Neel temperature TN = 3.8 K.
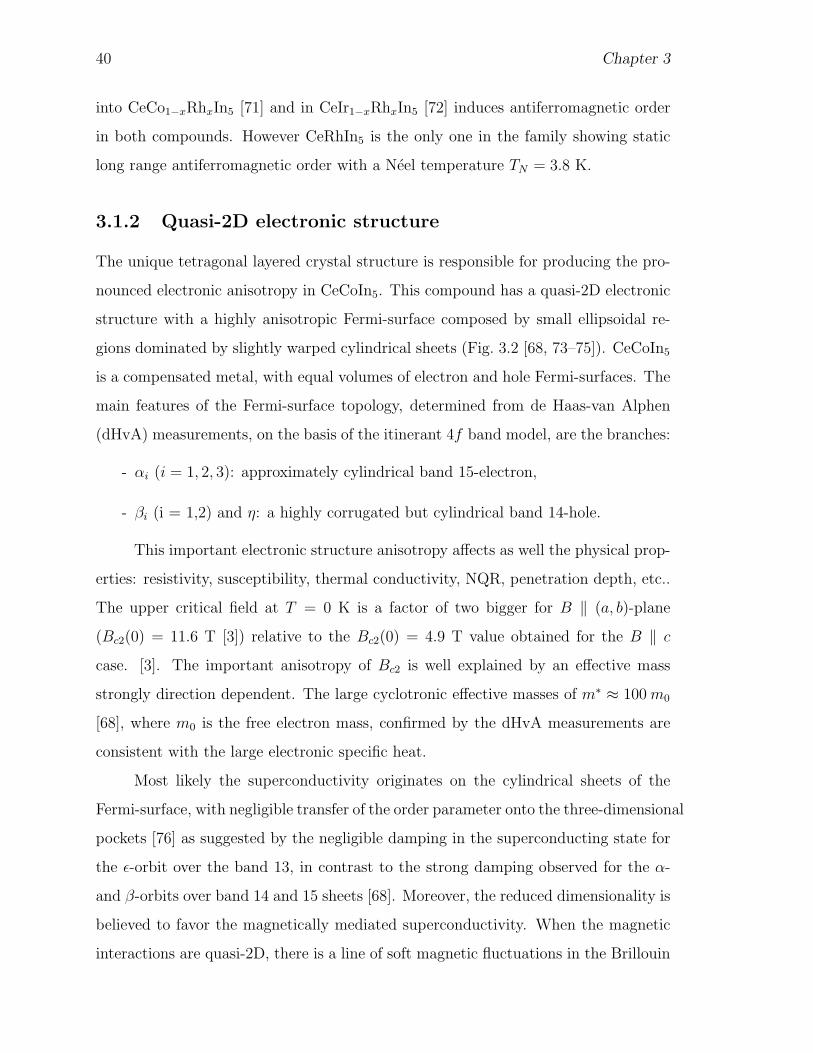
3.1.2 Quasi-2D electronic structure
The unique tetragonal layered crystal structure is responsible for producing the pro-
nounced electronic anisotropy in CeCoIn5. This compound has a quasi-2D electronic
structure with a highly anisotropic Fermi-surface composed by small ellipsoidal re-
gions dominated by slightly warped cylindrical sheets (Fig. 3.2 [68, 73–75]). CeCoIn5
is a compensated metal, with equal volumes of electron and hole Fermi-surfaces. The
main features of the Fermi-surface topology, determined from de Haas-van Alphen
(dHvA) measurements, on the basis of the itinerant 4f band model, are the branches:
- αi (i = 1, 2, 3): approximately cylindrical band 15-electron,
- βi (i = 1,2) and η: a highly corrugated but cylindrical band 14-hole.
This important electronic structure anisotropy affects as well the physical prop-
erties: resistivity, susceptibility, thermal conductivity, NQR, penetration depth, etc..
The upper critical field at T = 0 K is a factor of two bigger for B ‖ (a, b)-plane
(Bc2(0) = 11.6 T [3]) relative to the Bc2(0) = 4.9 T value obtained for the B ‖ c
case. [3]. The important anisotropy of Bc2 is well explained by an effective mass
strongly direction dependent. The large cyclotronic effective masses of m∗ ≈ 100 m0
[68], where m0 is the free electron mass, confirmed by the dHvA measurements are
consistent with the large electronic specific heat.
Most likely the superconductivity originates on the cylindrical sheets of the
Fermi-surface, with negligible transfer of the order parameter onto the three-dimensional
pockets [76] as suggested by the negligible damping in the superconducting state for
the ε-orbit over the band 13, in contrast to the strong damping observed for the α-
and β-orbits over band 14 and 15 sheets [68]. Moreover, the reduced dimensionality is
believed to favor the magnetically mediated superconductivity. When the magnetic
interactions are quasi-2D, there is a line of soft magnetic fluctuations in the Brillouin

FFLO in CeCoIn5 41
Figure 3.2: Fermi-surface dominated by nearly cylindrical sheets. From Ref. [73].
zone, whereas there is only a point when the magnetism is fully 3D. This leads to
an enhanced coupling to magnetic fluctuations in quasi-2D systems relative to their
3D counterparts. This not only favors higher transition temperatures in quasi-2D
materials but also greater robustness of pairing to material imperfections and other
competing interaction channels such as electron-phonon scattering.
3.1.3 Unconventional superconductivity
Even from its discovery, CeCoIn5 proved to be a remarkable heavy-fermion compound.
It is superconducting at ambient pressure with a transition temperature Tc = 2.3 K,

42 Chapter 3
Figure 3.3: The electronic specific heat divided by temperature for CeCoIn5, at am-bient pressure and in zero magnetic field (open squares) and for B = 5 T (B ‖ c)above the upper critical field (solid circles). The inset shows the entropy recoveredas a function of temperature in the superconducting (open squares) and field-inducednormal (solid circles) state. From Ref. [1].
the highest among the Ce based heavy-fermion systems. The specific heat divided by
temperature C/T at normal pressure and in zero field is shown in Fig. 3.3. The large
γ = C/T = 0.290 J/(molK2) ∝ m∗ in the normal state, just above the superconduct-
ing transition (T = 2.5 K), indicates a substantial mass renormalization. The jump
in the specific heat at Tc is remarkably high, the inferred value of ∆C/γTc = 4.5
suggesting very strong coupling. In contrast, the expected value for a weak coupling
superconductor is only ∆C/γTc = 1.43 (from BCS-theory). However, this large jump
has to be considered carefully since the superconductivity sets in while the heavy-
fermion state is not yet completely formed with the effective mass m∗ still increasing
upon lowering the temperature. This was described based on a phenomenological
two-fluid description of the Kondo lattice [77]: the high temperature gas of nonin-

FFLO in CeCoIn5 43
teracting Kondo centers starts to condense into a coherent heavy-fermion fluid below
a characteristic temperature corresponding to the intersite coupling scale. However,
this condensation is partial, and a residual single ion component of the incoherent
Kondo impurity fluid survives down to very low temperatures, well below the single-
ion Kondo temperature TK , where it seems plausible to eventually condensate into
the heavy-fermion ground state albeit inducing unusual behavior in the system [77].
There is even more growing evidence that superconductivity in CeCoIn5 is un-
conventional. The low temperature electronic specific heat, (C−CSchottky)/T , displays
an anomalous behavior. The In quadrupolar nuclear Schottky contribution was sub-
tracted based on the energy levels determined by nuclear quadrupole resonance (NQR)
[78]. The electronic specific heat as function of temperature is non-exponential in the
superconducting state and in the low temperature range 0.095 K ≤ T ≤ 0.400 K is
given by:
(C − CSchottky)(J/(molK)) = 0.04T + 0.25T 2 [79]. (3.1)
The low-T upturn in the data might be related to the entropy revealed at
reduced temperatures when the superconducting state is suppressed in a field B = 5 T
applied along the c-axis. The T 2 term in the electronic specific heat below Tc, observed
as well in a number of unconventional superconductors including both, heavy-fermion
systems (UPt3 [80], CeIrIn5 [79], CeRhIn5 [70]) and high-Tc cuprates (YBa2CuO7 [81],
La2CuO4 [82]), is a signature of lines of nodes presence in the energy gap.
The thermal conductivity (κ) in CeCoIn5 (Fig. 3.4) shows a maximum around
T = 0.7 K where its value is a factor of 15 above the upper limit of the phonon thermal
conductivity (dotted line). In the normal state, κ is dominated by electrons which, at
Tc, contribute over 90 % of the total κ value. Therefore, the maximum in κ is mostly
electronic in origin, probably similar to the thermal conductivity peak observed in
the high-Tc compounds. At very low temperature (0.033 K< T < 0.100 K), the
thermal conductivity follows a κ = const · T 3.37 behavior (inset Fig. 3.4) close to the
T 3 dependency predicted for unconventional superconductors, in the clean-limit and
with nodal structure in the superconducting gap [79, 83].

44 Chapter 3
Figure 3.4: Thermal conductivity of CeCoIn5. The dotted line is an upper limitestimate of the phonon contribution. Inset: κ/T (T 2) for T < 0.1 K. From Ref. [79].
Knight shift (K) studies reveal a strong anisotropy, between the B ‖ (a, b) and
the B ‖ c case, higher than the one observed for the magnetic susceptibility χ [78, 84].
Interestingly K is significantly dropping immediately after the superconducting state
sets in (T < Tc) for the 115In site (both B ‖ (a, b) and B ‖ c case) and for 59Co (B ‖ c)
while K for 59Co (B ‖ (a, b)) is positive and temperature independent, indicative that
the shift for the Co ions is almost entirely determined by the orbital contribution
(Fig. 3.5-a). An analysis of K in the case of even parity superconductivity
K ∝ χ ∝∫
N(E)∂f(E)
∂EdE, (3.2)
- where N(E) is the density of states (DOS) and f(E) is the Fermi distribution
function - reproduces well the T dependency of the measured Knight shift (the solid
lines in Fig. 3.5-a. It is important to remark that at very low temperature, K(T ) has
a close to linear behavior arisen from low-energy excitations of the quasiparticles in
the superconducting state, in support for the d-wave pairing.
Moreover, the spin-lattice relaxation rate 1/T1 obtained by NQR measurements

FFLO in CeCoIn5 45
a) b)
Figure 3.5: a) T dependence of the Knight shift for CeCoIn5 in the superconductingstate. The solid line represents an estimation of K(T ) for spin-singlet pairing. b)The NQR spin-lattice relaxation rate 1/T1(T ). The solid line is a 1/T1 ∝ T 3 fit. ForT < 0.2 K the relaxation rate tends to saturate. In the normal state 1/T1 ∝ T 1/4.From Ref. [84].
[84] is approximately described by a 1/T1 ∝ T 3 law (the solid line in Fig. 3.5-b, remi-
niscent of the relaxation behavior in many heavy-fermion superconductors: CeCu2Si2
[85], UBe13 [86], UPt3 [87], UPd2Al3 [88] and URu2Si2 [89]. For T < 0.2 K the
relaxation rate tends to saturate. In CeCoIn5 as well as in its relative compound
CeIrIn5, no Hebel-Slichter coherence peak is observed as would have been expected
for conventional superconductors.
The superconducting penetration depth (λ) displays also unconventional behav-
ior and reveals an significant anisotropy. While the in-plane λ‖ (B ‖ (a, b)) tends to
follow a power-law λ‖ ∝ T 3/2 below T = 0.8 K, it was argued that a better descrip-
tion of the data would be a crossover from quadratic (T < T ∗) to linear (T > T ∗)
behavior, with the crossover temperature T ∗ = 0.32 K in the strong coupling limit
[91]. There are two routes to provide such a crossover: non-local effects or impurity
scattering. With the latter scenario ruled out by a λ⊥ (B ⊥ (a, b)) linear in T and a
T ∗ five-times higher than the T ∗ value yielded by a dirty-limit d-wave model, the pen-

46 Chapter 3
etration depth measurements constitute strong evidence for non-locality and d-wave
superconductivity with lines of nodes along the c-axis in CeCoIn5.
In conclusion, the power-law behaviors found deep in the superconducting state,
summarized in Table 3.1, are those expected of an order parameter with line nodes and
suggest unconventional spin singlet superconductivity. Indeed, thermal conductivity
κ measurements find a prominent four-fold modulation in κ as a magnetic field is
rotated in the basal plane [90]. The amplitude of the four-fold term increases by an
order of magnitude at T < 0.25 K compared to the normal state. It was suggested by
Izawa et al. [90] that the four-fold symmetry is arising from the Andreev scattering off
Figure 3.6: Four-fold symmetry revealed by thermal conductivity at several temper-atures. From Ref. [90].

FFLO in CeCoIn5 47
Table 3.1: Power-law behavior in the superconducting state in CeCoIn5 and relatedcompounds.
Compound C/T κ 1/T1 λ K
CeCoIn5 T [79] T 3.37 [79] T 3 [84] λ‖ ∝ T 3/2, λ⊥ ∝ T [91] T [84]
T 1.5 [92]
T [93]
T 1.65±0.2 [94]
CeIrIn5 T [79] T 3 [79] T 3 [84] T 1.5±0.2 [94] -
CeRhIn5 at 2.1 GPa T [70] - T 3 [95] - -
the vortex lattice which has a symmetry related to the gap function [96, 97]. κ attains
a maximum value when B is parallel to the nodal directions and has a minimum when
B is directed along the antinodal lines. Therefore, the gap has nodes at every 90o
in k-space as seen in Figure 3.6. The magnitude and location of maxima in k(θ)
(where θ = (q, B)) are consistent with an order parameter having dx2−y2 symmetry
with zeros along the (±π,±π) positions, similar to the high-Tc cuprates. However,
the field-angle dependence of the zero-energy density of states determined by specific
heat measurements point to a dxy symmetry [98].
The flux-line lattice (FLL) found to be hexagonal at very low fields, undergoes
around B = 0.6 T (B ‖ c), a transition, most likely of first-order, to a square sym-
metry with the nearest neighbors oriented along the gap node directions, consistent
with a d-wave order parameter [99].
Unconventional superconductivity is displayed, as well, by the other members
of the CeTIn5 family as seen in Table 3.1.
3.1.4 Clean-limit superconductor
CeCoIn5 is a clean superconductor with a low value of resistivity just above the
superconducting phase transition ρ0 = 3 µΩcm [1] and a very high ratio between the
mean-free path (`tr) and the coherence length (ξ0) of `tr/ξ0 = 14 [79]. Moreover, the

48 Chapter 3
impurity band width, estimated from thermal conductivity, is less than 30 mK [79].
An upper limit estimate of the impurity concentration [100] that would give rise to
such a narrow impurity band is nimp = 20 ppm in the unitary scattering limit. In the
Born limit this value would be increased to nimp = 20 ppt but it was argued [1] that
CeCoIn5 is closer to the unitary scattering limit.
3.1.5 Pauli-limited SC and signatures of the FFLO state
In the case of a superconductor for which the orbital effect as pair breaking mechanism
can be neglected relative to the Pauli paramagnetism, it was predicted by theory that
the superconducting transition changes, upon increasing magnetic field, from second-
to first-order, for T < 0.55 Tc [15, 16]. This scenario which eluded the experimental
probing for almost forty years was recently confirmed in CeCoIn5 [3, 101].
Figure 3.7: Specific heat as function of T at different fields with B ‖ [110]. Uponincreasing the field the superconducting transition changes from second- to first-orderand a second anomaly at low-T (emphasized in the inset) is induced. From Ref. [3].

FFLO in CeCoIn5 49
With the magnetic field perpendicular to the (a, b)-plane, the superconducting
transition changes from second- to first-order at B0 ≈ 4.7 T which corresponds to
T0 ≈ 0.75 K [101]. A similar situation, depicted in Fig. 3.7, has been found for the
field in the (a, b)-plane at B0 ≈ 10 T and T0 ≈ 1 K [3].
The first-order character of the phase transition suggested by the sharpening of
the specific heat anomaly and the increase of the peak value of (C −CSch)/T at T =
T0, is confirmed by the hysteretic behavior in specific heat and magnetization [102],
and as well by magnetocaloric [101] and thermal expansion measurements [103, 104].
Moreover, as expected, a step-like feature in the entropy develops once the transition
becomes first-order (inset Fig. 3.8-a [101]).
The Maki parameter assumes large values, considerably above the minimum
required value of α = 1.8 for the FFLO state formation, and reflects as well the
pronounced anisotropy between the (a, b)-plane and the c-direction:
α ≈ 3.6 for B ‖ c,
α ≈ 4.6 for B ‖ (a, b).
Indeed an anomaly at low temperature (TFFLO) is observed in the specific heat
measurements for both, B ‖ (a, b) and B ‖ c directions close to the upper critical
field. This feature can be observed only inside the superconducting state and was
ascribed to a transition into a FFLO phase [3]. For B ‖ (a, b) this low-T phase could
be resolved for 10.2 T < B < 11.4 T while for the perpendicular field orientation it
spans between 4.8 T< B < 5 T. However, for B ‖ c the TFFLO feature is not resolved
indisputably. The TFFLO anomaly has a very weak field dependence as can be seen
in the B ‖ (a, b) phase diagram. A very small in-plane anisotropy for TFFLO between
the [110] and [100] directions can be observed as well, together with an anisotropy for
Bc2(0) of roughly 1% (Fig. 3.8). The Tc(B) and the TFFLO(B) phase boundary lines
meet at T ∗:
T ∗ ≈ 0.130 K for B ‖ c [3],
T ∗ ≈ 0.310 K for B ‖ (a, b) [3].

50 Chapter 3
(a)
(b)
Figure 3.8: (a). Bc2 phase diagram for B ‖ [110] (filled symbols) and B ‖ [100] (opensymbols). Inset: Entropy gain for B = 11.4, 11, 10.8, 10.6, 10.2, 9.5 and 8.6 T from leftto right. (b). Bc2 phase diagram for B ‖ [001]. Inset: C(T )/T for B = 4.9, 4.875, 4.85and 4.8 T from left to right. The arrow indicates the FFLO anomaly. From Ref. [3].

FFLO in CeCoIn5 51
Figure 3.9: The 115In-NMR spectra at different points in the phase diagram markedwith ”+” in the inset: - in the normal state, slightly above Bc2 (upper spectrum); -in the classical superconducting state, close to the SC-FFLO boundary line (middlespectrum); - well inside the FFLO state (lower spectrum). From Ref. [108].
The much higher T ∗ value for B ‖ (a, b) indicates that the FFLO state is more stable
when the magnetic field is applied in the basal plane, as expected for this quasi-
2D compound since in this direction orbital-limiting effects are less favored by the
Fermi-surface geometry.
Moreover, the signature of the possible FFLO state was confirmed for B ‖ (a, b)
also by thermal conductivity [105], penetration depth [106] and ultrasound velocity
measurements [107].

52 Chapter 3
115In nuclear magnetic resonance studies provide first microscopic insight into
the superconducting order parameter texture in CeCoIn5 [108]. In the conventional
superconducting state, at B = 11.3 T and T = 0.320 K, close to the SC-FFLO phase
boundary, the NMR spectrum is almost symmetric as shown in Fig. 3.9, in the middle
spectrum. This indicates that the influence of the field distribution inside the high-
field superconducting region is negligible as the spatial distribution of the magnetic
field, arising from the flux-line lattice structure, would produce an asymmetric NMR
spectrum. Inside the presumed inhomogeneous superconducting state at B = 11.3 T
and T = 0.180 K, the NMR spectrum has a remarkable feature: a new resonance
peak appears, with small but finite intensity at higher frequency (dashed peak in the
lower spectrum in Fig. 3.9). The intensity of this higher resonance is about 3%− 5%
of the total intensity and is almost T -independent below T = 0.180 K. It was stressed
by Kakuyanagi et al. [108] that, based on the different intensity of the two resonance
lines, the higher frequency peak is unlikely to be generated by the occurrence of
magnetic order.
Should antiferromagnetic order set in, the alternating hyperfine fields would
produce two inequivalent 115In(1) sites, which would generate two resonance lines
with equal intensities. Moreover, an important characteristic of the NMR spectrum
is that the small feature coincides rather well in frequency with the resonance line
obtained in the normal state (upper spectrum in Fig. 3.9). Therefore it was argued
that the higher resonance line observed in CeCoIn5 is a manifestation of a novel
normal quasiparticle structure in the low-temperature − high-field region of the phase
diagram, consistent with the formation of the FFLO state, where normal and the SC
regions are expected to be placed alternately perpendicular to the magnetic field and
the vortices.

FFLO in CeCoIn5 53
3.2 Non-Fermi liquid behavior in the normal state
in CeCoIn5
Although no magnetic order is evident in CeCoIn5 down to the lowest temperatures,
the power-law behavior in the normal state observed for different physical properties
show a non-Fermi liquid regime persisting over an extended temperature range.
1 100
200
400
600
800
0 5 10 15 200
5
10
15
20
(b)
∆C/T ~ -log(T)
CeCoIn5B=5T
C-C
Scho
ttky
- Cla
ttice
(mJ/
(mol
K2 ))
T (K)
(a)
(ρ-ρ(0))=AT1.06, 3K<T<20K
CeCoIn5B = 0 T
ρ (µΩ
cm
)
T (K)
Figure 3.10: (a) The resistivity of CeCoIn5 is linear for Tc < T < 20 K [109]. (b)Theelectronic specific heat C/T ∝ − log(T ) in the normal state [110].

54 Chapter 3
Table 3.2: Power-law behavior in the normal state for different physical properties inCeCoIn5 and related compounds indicating NFL behavior.
Compound C/T ρ 1/T1 χ
CeCoIn5 − ln(T ) T 1.0±0.1 T 1/4 [84] T−0.42, B ‖ c [110]
[1, 110] [109, 111] 1ct.+AT 0.1 , B ⊥ c [110]
CeIrIn5 γ0 − AT 1/2 [110] T 1.3 [69] T(T+0.86K)1/2 [84] − log(T ) [110]
B = 6 T T(T+8K)3/4 [112]
CeRhIn5 - T [113] T(T ∗+1.5K)1/2 [95] -
p = 3.2GPa p = 2.1GPa
Specific heat measurements in a field B = 5 T parallel to the c-axis (the upper
critical field for this orientation is B = 4.95 T) reveal an increase for C/T down to the
lowest temperatures [1, 114]. The electronic specific heat obtained after subtracting
the lattice and the Schottky contribution is plotted for B = 5 T in Fig. 3.10-(b)
and shows C/T ∝ − log(T ) behavior for more than a decade in temperature. This
dependence is associated with strong spin-fluctuations. Moreover, the temperature
dependence of the electrical resistivity ρ(T ) in normal state is linear over an extended
temperature range Tc < T < 20 K [1, 109, 115] (Fig. 3.10-(a)). The spin-fluctuation
theory predicts for the nuclear spin-lattice relaxation rate, near an antiferromagnetic
instability, a 1/T1 ∝ T 1/4 dependence [116, 117], which is observed in CeCoIn5 in the
normal state (Fig. 3.5-(b)) [84].
For a Landau-Fermi liquid, C/T ≈ constant, ∆ρ = ρ(T )− ρ(0) ∝ T 2, 1/T1 ∝ T
and χ ≈ constant are expected at low temperatures. As summarized in Table 3.2, this
is not the case for CeCoIn5 and its related isostuctural compounds. The functional
dependencies are strongly suggestive of NFL behavior induced by antiferromagnetic
quantum critical fluctuations.
All this facts, corroborated with the comparison to the closely related anti-
ferromagnet (ordering temperature TN = 3.8 K) CeRhIn5 [118], argue for a nearby
quantum-critical point in CeCoIn5 situated at an assumed slightly negative pressure.

FFLO in CeCoIn5 55
3.3 Specific heat experiments under pressure and
in magnetic field
All the prerequisites required by the FFLO state formation are met in CeCoIn5:
it is a very clean superconductor, Pauli-limited with a high Maki parameter (α >
1.8). Its reduced electronic dimensionality provides a path to lower orbital currents
and favors magnetically mediated superconductivity. The d -wave symmetry of the
superconducting order parameter would increase as well the stability of a FFLO state
against impurities [32]. Moreover, the formation of a new phase at high magnetic
fields and low temperatures is revealed by a number of experiments like specific heat
and NMR measurements (see previous section).
However, this compound seems to be located close to a quantum critical point
(QCP) manifested by the presence of strong antiferromagnetic fluctuations. This rises
the possibility of a magnetic nature for the low-T anomaly which, in this case, would
indicate the onset of an undisclosed type of magnetically ordered phase superseded
by superconductivity.
In order to rule out the QCP-related origin of this phase, one has to drive
the system away from the influence of the strong magnetic fluctuations. This is ac-
complished by applying hydrostatic pressure p as the system recovers Fermi liquid
behavior for p ≥ 1.6 GPa as indicated by resistivity [111, 119] and specific heat data
[120]. Moreover, the residual resistivity ρ0 is rapidly decreasing by almost two orders
of magnitude from its atmospheric pressure value to p ≈ 1.4 GPa, suggesting the
suppression of spin-fluctuations [111]. Additional evidence for the damping of mag-
netic fluctuations with increasing pressure comes from dHvA [121] and NQR [122]
studies under pressure. Therefore, hydrostatic pressure is an ideal tool to investigate
the possible formation of the FFLO state in CeCoIn5 while suppressing the strong
magnetic fluctuations.

56 Chapter 3
3.3.1 Heat capacity setup
To explore the nature of the low-T phase in CeCoIn5 we measured specific heat
under hydrostatic pressure, down to low temperatures and in high magnetic fields
on high quality single crystals1. They were synthesized in In flux by combining
stoichiometric amounts of Ce and Co in an alumina crucible and encapsulated in
a quartz ampoule [1]. The single crystals grow in a plate-like geometry with the
short side along the crystallographic c-axis. To cut the single crystals selected for
the measurements a spark-erosion device was employed. The mass of the measured
sample was m = 1.532 mg, i.e., 1.98210−6 mol.
We used a new piston-cylinder type pressure cell, specially developed for this
type of experiments, machined entirely from CuBe and described in more detail in
the experimental introductory chapter. The reduced mass of the cell, of only 160 mg,
and the absence of magnetic parts ensure a very high ratio between the sample and
pressure cell (addenda) heat capacity and make this cell suitable to use even in high
magnetic fields and low temperatures. A comparison between the heat capacity of
the sample, addenda and the loaded cell is presented in Fig. 3.11 for a pressure of p =
0.45 GPa. At the maximum temperature, where the phononic contribution of the cell
is highest, the sample represents 16% of the total (cell, pressure transmitting medium
and sample) heat capacity and its contribution increases well above 50% at the top of
the superconducting transition anomaly. At low-T , the sample heat capacity drops
to around 15% of the total value. Under pressure and upon applying magnetic field
the sample/addenda heat capacity ratio is further reduced, but remains at reasonably
large values, significantly higher than observed for other standard pressure cells.
We used, as pressure transmitting medium, Pb and a very small amount of
Apiezon-N grease. The pressure was determined by the inductively measured shift of
the superconducting transition of the Pb inside the cell relative to a reference Pb sam-
ple placed outside the cell (inset Fig. 3.11). This shift was converted into pressure
following the Tc(p) calibration from Eiling et al. [60]. The relatively sharp super-
conducting transition of Pb and a comparison of the zero field data under pressure
1The single crystals were prepared in the group of Dr. J. L. Sarrao at Los Alamos National
Laboratory, Los Alamos, USA.

FFLO in CeCoIn5 57
0.5 1.0 1.5 2.0 2.5 3.0
0
5
10
15
6.8 7.0 7.2-4
-3
-2
-1
0
CeCoIn5
p=0.45 GPaB=0 T
Total Heat Capacity
Addenda
Sample Heat Capacity
T (K)
Pb inside the pressure cell
Pb at ambient
pressure
M (
arb.
uni
ts)
T (K)
Figure 3.11: Comparison between the sample heat capacity and addenda. Total heatcapacity is given by the cell, pressure transmitting medium and the sample.
with previous measurements where a liquid [120, 123] or argon gas [124] was used as
pressure transmitting medium, confirm the good quasi-hydrostatic conditions of our
setup.
3.3.2 Experimental results
The experiments were carried out with the magnetic field applied parallel to the
(a, b)-plane as well as parallel to the c-axis. Temperatures down to T = 0.1 K
and magnetic fields up to B = 12 T could be reached in a dilution refrigerator
cryostat. A quasi-adiabatic specific heat measurement method was employed using a
specially built specific heat platform made out of 80 µm thick silver foil suspended
on thin nylon wires. At low temperatures T < 0.2 K and in high magnetic field, the
Schottky contribution to the heat capacity coming from both, pressure cell (contains
Cu and Be) and sample (contains In) becomes increasingly important. This causes

58 Chapter 3
0 1 2 3 4
1
2
3
0.45 GPa1.34 GPa
CeCoIn5
SC
T(K
)
P(GPa)
0 GPa
Figure 3.12: Tc(p) phase diagram obtained from resistivity measurements [119]. Thespecific heat studies were carried out at the pressures depicted by arrows.
an increased scattering in the low temperature specific heat. In order to avoid any
artifacts in the data, every measurement in the dilution refrigerator was performed at
least twice for each magnetic field. Temperatures down to T = 0.35 K and fields up
to B = 14 T where achievable in a PPMS (Quantum Design) system and a relaxation
method was used to measure the specific heat in this case. The shape of the pressure
cell allows a precise orientation of the c-axis and the (a, b)-plane of the crystals relative
to the magnetic field direction.
Our study was mainly focused on the evolution of the presumed FFLO anomaly
with pressure and in addition, we investigated carefully if the theoretical prerequisites
for the formation of the FFLO state are still satisfied under pressure. The measure-
ments were conducted at p = 0 GPa, p = 0.45 GPa and p = 1.34 GPa, pressures
depicted by arrows in the Tc(p) phase diagram (Fig. 3.12) obtained from resistivity

FFLO in CeCoIn5 59
0 1 2 30
1
2
0 0.5 1.0 1.50.30
0.32
0.34
CeCoIn5
0 GPa 0.45 GPa 1.34 GPa
p
C/T
(J/m
ol K
2 )
T (K)
T = 2.8 K
C/T
2.8K
(J/(m
olK
2 ))
p (GPa)
C/T2.8K(J/mol K2)=0.350-0.04 p(GPa)
Figure 3.13: C/T (T ) dependence at different pressures. Inset: C/T above Tc islinearly decreasing with increasing p.
measurements [119]. The highest pressure was chosen in such a way that it is situ-
ated right at the maximum of Tc(p), where the system starts to recover FL behavior
and the strong antiferromagnetic quantum critical fluctuations present at ambient
pressure are already drastically reduced. To study the evolution of the B − T phase
diagram also measurements at intermediate pressure p = 0.45 GPa were carried out.
The zero field heat capacity data at each measured pressure are presented in
Fig. 3.13. The lattice contribution to the specific heat is negligible in this tempera-
ture range for CeCoIn5. At ambient pressure, we find a superconducting transition
temperature, defined at the 50% value of the specific heat jump, of Tc = 2.24 K, con-
sistent with the literature [1]. In the normal state, just above the superconducting
transition temperature, C/T has a large value, typical for strongly correlated electron
systems: γ = C/T (T = 2.5 K) = 0.360 J/(mol K2). This value is slightly higher

60 Chapter 3
than γ = C/T (T = 2.5 K) = 0.290 J/(mol K2) reported in [1], but in excellent
agreement with [120, 123]. This difference in C/T probably can be accounted for by
some sample dependency between the earlier prepared single crystals and the most
recent ones. While the superconducting state sets in, C/T is still increasing upon
decreasing temperature, which might be a manifestation of the probable incomplete
condensation of the Kondo centers into the heavy-fermion ground state [77]. A linear
fit of the C(T )/T data for 2.4 K< T < 3.1 K yields:
C/T = 0.464 (J/(mol K2))− 0.043 (J/(mol K3)) · T. (3.3)
At ambient pressure, a remarkably high jump in the specific heat is observed at Tc,
which could be explained in part by the not completely formed heavy-fermion state
at Tc and in part by strong correlations:
∆C
γTc
= 4.64, (3.4)
where ∆C = CSC state|Tc − Cnomal state|Tc .
Under pressure the temperature dependence of C/T remains similar to the one
observed at ambient pressure. However, the considerable reduction of the specific
heat jump and of the C/T value just above the superconducting transition, point
to a reduction in the correlation strength and implicit of the effective mass m∗ with
increasing p. Intriguingly enough, this occurs while Tc is enhanced upon pressurizing
the sample at an initial rate of:
∂Tc
∂p
∣∣∣∣p=0 GPa
≈ (0.405± 0.030) K/GPa. (3.5)
The simultaneous increase of Tc with the reduction of the quasiparticle interaction
might be induced by an enhancement of the chemical potential as suggested by a
d-wave density wave (dDW) based theory of superconductivity [125]. Neglecting the
strong coupling effects, the jump in the specific heat normalized to the effective mass
and Tc must fulfill:∆C
Tcm∗ ≈ const. (3.6)

FFLO in CeCoIn5 61
Table 3.3: The pressure evolution of Tc, ∆C, C/T , effective mass m∗ and transitionwidth ∆T .
p (GPa) 0 0.45 1.34
Tc (K) 2.242± 0.005 2.428± 0.005 2.584± 0.010
∆C = (Cs − Cn)|Tc (J/mol K) 3.743 3.325 1.872
C/T |2.8 K (J/mol K2) 0.350 0.335 0.305
m∗(p)/m∗(0) 1 0.83 0.43
∆T (K) 0.020± 0.005 0.042± 0.005 0.110± 0.010
The ”weakness” of the coupling would be justified if one assumes an incomplete
condensation of the Kondo centers into a coherent heavy-fermion state and as well by
the temperature dependence of the upper critical field. The latter can be expressed
in a weak coupling model with strong Pauli-limiting effect and d-wave pairing [46].
Therefore, using the equation 3.6, we can roughly estimate a reduction of the effective
mass at p = 0.45 GPa down to 83% of its ambient pressure value and down to
approximately 43% at p = 1.34 GPa, in reasonable good agreement with [124].
Despite the good hydrostatic conditions attained in the pressure cell, a slight
increase in the transition width is observed as also seen in [120, 123, 124] . This is
a reflection of the significant anisotropy in the physical properties of CeCoIn5. A
steady increase in the c/a ratio upon applying pressure up to p ≈ 2.5 GPa is revealed
by X-ray diffraction measurements [126]. Indeed, the low temperature physics in this
compound seems to be dominated by the in-plane p − f hybridization between Ce
and In(1) ions. This is supported also by the increase of hybridization Vpf across the
CeT In5 series in the order Rh→Ir→Co [126]. For CeRhIn5, SC sets in only under
pressure as Vpf increases, while in CeIrIn5 at ambient pressure Tc = 0.4 K is well
below Tc = 2.24 K for CeCoIn5. For small Vpf magnetic order is favored but this
is replaced by superconductivity as Vpf is enhanced as schematically shown in Fig.
3.14.
The importance of the Ce-In hybridization is suggested also by thermal
expansion measurements which find an increase in Tc upon reducing the a lattice

62 Chapter 3
Applied pressure
SC
CeIrIn5
CeCoIn5
CeRhIn5
Magnetic orderTem
pera
ture
J~V2pf
Figure 3.14: Schematic phase diagram for CeT In5 showing the competition of mag-netism and superconductivity as function of the hybridization Vpf , according to Ref.[126]. The SC line for CeRhIn5 lies between CeIrIn5 and CeCoIn5.
constant, four times faster than upon reducing c [104]:
∂Tc
∂pa
∣∣∣∣pa=0 GPa
= (0.290± 0.030) K/GPa (3.7)
∂Tc
∂pc
∣∣∣∣pc=0 GPa
= (0.075± 0.010) K/GPa (3.8)
where pa and pc are the uniaxial pressures along a and c, respectively. The different
rates at which Tc is enhanced when uniaxial stress is applied along the a or c direction
is probably the main cause for the increase in the superconducting transition width
upon applying hydrostatic pressure.
AC-specific heat measurements under uniaxial stress along the crystallographic
a-axis, performed as part of this thesis (experiment briefly described in the appendix),
reveal an increase of Tc in the low pressure regime in good agreement with the thermal
expansion measurements:
∂Tc
∂pa
∣∣∣∣pa=0 GPa
= (0.305± 0.010) K/GPa. (3.9)

FFLO in CeCoIn5 63
The superconducting transition is gradually moved to higher temperature as pa in-
creases and Tc seems to approach a broad maximum around the highest pressure
achieved pa = 0.7 GPa. ∆C is decreasing drastically under small uniaxial stress
similar with the behavior under hydrostatic pressure. ∆C tends to saturate above
pa ≥ 0.3 GPa.
3.3.3 Magnetic field effect on the SC transition for B ‖ (a, b)
At ambient pressure the specific heat measurements were only conducted with the
magnetic field applied in the (a, b)-plane. At low magnetic fields the SC specific
heat anomaly exhibits a mean-field-like shape, characteristic for a second-order phase
transition. With increasing B, the anomaly moves to lower temperatures and at high
magnetic fields sharpens up and becomes more symmetrical, indicating the change
from a second- to a first-order phase transition (Fig. 3.15, upper panel). This is
even more convincing if one bears in mind that in the B(T ) phase diagram the
superconducting phase transition is crossed at glancing angle in high fields which
would actually lead to a broadening of the specific heat anomaly.
Additionally, the height of the anomaly Cpeak shows a minimum (Fig. 3.16) indi-
cating also the crossover from second- to first-order. We used this minimum to define
the crossover temperature T0 (T0 = Tc at minimum Cpeak) and the corresponding
crossover magnetic field B0. We find T0 = (0.875± 0.050) K and B0 = (10.5± 0.1) T.
This yields T0 = 0.39 Tc smaller than the upper theoretical threshold of 0.55 Tc found
in the purely paramagnetic limit [16]. The first-order character of the phase transition
at high magnetic fields is also established by the hysteretic behavior in specific heat
measurements [3] and magnetization data [102].
Above B ≥ 11.55 T no signature of the superconducting phase transition is
observed anymore, down to the lowest temperature achievable with our setup T =
0.1 K. We estimate an upper critical field of Bc2(0) = 11.6 T by extending our Bc2(T )
phase diagram to T = 0 K and assuming Bc2 ∝ (1 − (T/Tc)2). As it will be shown
later in a detailed analysis of the Bc2(T ), our estimates for the upper critical field are
in good agreement with the theoretical calculations.

64 Chapter 3
0.5 1.0 1.5 2.0 2.5 3.00
2
4
0.5 1.0 1.5
1
2
p=0 GPaB||(a,b)
CeCoIn5
B
C (J
/mol
K)
T (K)
9 T 10 T 10.3 T 10.4 T 10.5 T 10.6 T 10.7 T 10.8 T 10.9 T 11.0 T 11.5 T 11.6 T
1st ord. 2nd ord.B
C (J
/mol
K)
T (K)
Figure 3.15: The ambient pressure evolution of the SC transition with the magneticfield applied in the basal plane for fields up to 11.6 T. Inset: Above 10.5 T thetransition sharpens up and becomes more symmetric indicating a crossover to a first-order phase transition.
The ambient pressure findings for B ‖ (a, b) are in good agreement with the
results of A. Bianchi et al. [3]. They find T0 ≈ 1 K for B in the plane and T0 =
0.7 for B‖c. The small difference in T0 can be explained by the different way of
defining the crossover temperature which in reference [3, 101] was determined using
the magnetocaloric effect. However, Cpeak in the specific heat data published in
the latter mentioned reference, corresponds to a T0 and B0 in excellent agreement
with our findings. Our attempts to follow the first-order phase transition using the
magnetocaloric effect, with the sample inside the pressure cell, and employing the
same method as described in [101] did not provide a precise enough tool to define T0.
The main goal of the low temperature measurements performed in the dilution
refrigerator was to identify the low-T anomaly previously ascribed to a transition into

FFLO in CeCoIn5 65
0.6 0.7 0.8 0.9 1.0 1.1 1.21.5
1.6
1.7
0.6 0.7 0.8 0.9 1.0 1.1 1.2
9.5
10.0
10.5
11.0
CeCoIn5
2nd ord.
T0
Cpe
ak (J
/(mol
K))
Tc (K)
p=0 GPaB||(a,b)
1st ord.
B(T
)
Figure 3.16: Cpeak(Tc) dependency at ambient pressure and in high magnetic fields.Cpeak(Tc) has a minimum at T0 = (0.875±0.050) K which corresponds to B0 = 10.5 Ton the right axis. We take T0 as the crossover temperature from the second to first-order phase transition. For B > B0 the SC transition is first-order (shaded area).Bc2(T ) is depicted by the dashed line.
a FFLO state [3].
The total heat capacity of the loaded cell (no addenda subtracted) is presented in
Fig. 3.17 for different magnetic fields. We chose to plot CT 3(T ) in order to compensate
for the T−2 dependence of the nuclear term which dominates the low-T heat capacity.
The upper two curves in Fig. 3.17 are shifted for convenience by 0.07 µJK2 and
0.14 µJK2, respectively. Our measurement reveals, above B = 10.4 T, a tiny but
clear anomaly which can be traced with changing B. This is consistently reproduced
in successive runs at the same field. The size of the anomaly is around 3% − 4% of
the total heat capacity. For the sake of clarity we denote this anomaly TFFLO though
the verification of its true nature is the aim of this specific heat study under pressure.
We define TFFLO as the temperature corresponding to the top of the transition as it

66 Chapter 3
0.2 0.3 0.4
0.4
0.6
TFFLO
p=0B||(a,b)
CeCoIn5
B=10.9 T
B=11.1 T
B=11.2 T
Cto
talT
3 (µJ
K2 )
T (K)
Figure 3.17: The heat capacity of the loaded pressure cell multiplied with T 3 asfunction of T for B = 10.9 T, 11.1 T and 11.2 T. The upper two curves are shifted,for convenience, by 0.07 µJK2 and 0.14 µJK2 respectively. The TFFLO anomaly,depicted by arrows in figure, is identified unambiguously.
is depicted by arrows in Fig. 3.17.
TFFLO has a weak B dependence: upon increasing the magnetic field, TFFLO
is enhanced monotonically while Tc is gradually moved to lower temperatures. Close
to the upper critical field Bc2, TFFLO is almost field independent. As TFFLO and Tc
approach each other upon rising the field, it becomes increasingly difficult to deconvo-
lute the two anomalies as most of the entropy comes from the high-T superconducting
phase. We find a TFFLO(B) dependency in excellent agreement with [3].
Qualitatively similar result to the ambient pressure findings are obtained for p =
0.45 GPa. The superconducting transition is gradually suppressed upon increasing
the magnetic field and finally driven, close to Bc2(0), from second- to first-order. A
change of symmetry and a sharpening of the superconducting transition is clearly
visible in the specific heat data obtained after subtracting the addenda (Fig. 3.18).

FFLO in CeCoIn5 67
0.5 1.0 1.5 2.0
0.5
1.0
1.5
2.0
p=0.45 GPaB||(a,b)
9.0 T 10.0 T 10.2 T 10.4 T 10.6 T 11.0 T 11.4 T 11.5 T 11.6 T 11.7 T 11.85T 12.0 T
CeCoIn5 2ndord.1stord. BC
( J/
(mol
K ))
T (K)
Figure 3.18: The evolution of the SC transition upon applying high magnetic field inthe basal plane, at p = 0.45 GPa. With increasing B the transition sharpens up andbecomes more symmetrical indicating a crossover to a first-order phase transition.
The resolution of the specific heat measurement at this pressure, remains very high
even at such elevated magnetic fields due to the remarkably good filling factor of this
pressure cell.
The height of the anomaly Cpeak shows a distinct minimum (Fig. 3.19) while
the phase transition changes to first-order at T0 = (1.025 ± 0.050) K = 0.42 Tc. T0
corresponds to a crossover field B0 = 11.2 T. Both T0 and B0 are higher compared with
the ambient pressure values. The pressure stabilizes the superconductivity against
B for B ‖ (a, b) as the upper critical field is enhanced as well to Bc2(0) = 12.5 T.
This trend continues up to the maximum pressure of our experiment (p = 1.34 GPa)
where, despite the reduction of the quasiparticle interaction, Tc is enhanced together
with the upper critical field which reaches Bc2(0) = 14.3 T.
A change in the symmetry of the superconducting transition can still be ob-

68 Chapter 3
0.7 0.8 0.9 1.0 1.1 1.2 1.3 1.4
1.8
2.0
2.2
10.0
10.5
11.0
11.5
12.0
p=0.45 GPaB||(a,b) CeCoIn5
T0
2ndord.1stord.C
peak
( J/
(mol
K ))
TC (K)
B (T
)
Figure 3.19: Cpeak(TC) dependency at p = 0.45 GPa and in high magnetic field.Cpeak(TC) has a pronounced minimum at T0 = 1.025± 0.050 K which corresponds toB0 = 11.2 T on the right axis. For B > B0 the SC transition is first-order (shadedarea). Bc2(T ) is depicted by the dashed line.
served close to Bc2(0) (Fig. 3.20). However, as the superconducting jump ∆C has
been already substantially reduced by pressure at zero field and as the measurement
has to be carried out at higher B, only a shallow minimum can be observed if we
plot the height of the SC transition Cpeak as function of Tc (Fig. 3.21). We obtain a
crossover temperature T0 = 1.17± 0.10 K = 0.44 Tc and the corresponding magnetic
field B0 = 12.4 T. The first-order character of the phase transition is confirmed as
well by magnetization measurements under pressure which display a clear thermal
hysteresis and a step like feature in M(B) [127]. This magnetization study yields a
T0 ≈ 1.1 K at p = 1.34 GPa, in excellent agreement with our results.
A very important result of our study is the fact that we are able to follow
the pressure evolution of TFFLO. Indeed, a small anomaly in the electronic contri-
bution to the low temperature specific heat C − CSchottky (depicted in Fig. 3.22 for

FFLO in CeCoIn5 69
0.5 1.0 1.5
1.0
1.5 CeCoIn5p=1.34 GPaB||(a,b)
B 2nd ord. 11.0 T 11.2 T 11.8 T 12.0 T 12.2 T 12.6 T 12.7 T 13.0 T 13.6 T
1st ord.C
( J/
(mol
K ))
T (K)
Figure 3.20: The evolution of the SC transition upon applying high magnetic fieldin the basal plane at p = 1.34 GPa. Above 11.2 T the transition sharpens up andbecomes more symmetrical indicating a crossover to a first-order phase transition.
selected fields), is resolved unambiguously in the low-T range for both, p = 0.45 GPa
(Fig. 3.22, upper panel) and p = 1.34 GPa (Fig. 3.22, lower panel). This feature
is confirmed by at least two successive runs at each magnetic field. Similar to the
ambient pressure findings, the anomaly is easily visible even in the raw data (not
shown here) before subtracting the addenda. In order to determine the Schottky
contribution of In we assumed that for very low temperatures
C ≈ γT +αN
T 2, (3.10)
where the second term is the nuclear contribution to the specific heat. After sub-
tracting the pressure cell contribution, the zero temperature intercept of a CT 2(T 3)
plot yields the αN values. The size of the anomaly is comparable with the one found
at ambient pressure, in fair agreement with [3]. Under finite pressure, with our ex-

70 Chapter 3
0.8 0.9 1.0 1.1 1.2 1.3 1.4 1.5
1.0
1.2
1.4
0.8 0.9 1.0 1.1 1.2 1.3 1.4 1.5
11
12
13
14
2nd ord.1st ord.
Cpe
ak (
J/(m
ol K
))
Tc (K)
T0
CeCoIn5
p=1.34 GPaB||(a,b)
B (T
)
Figure 3.21: Cpeak(Tc) dependency at p = 1.34 GPa and in high magnetic field.Cpeak(Tc) has a shallow minimum at T0 = (1.17 ± 0.10) K which corresponds toB0 = 12.4 T on the right axis. For B > B0 the SC transition is first-order (shadedarea). Bc2(T ) is depicted by the dashed line.
perimental setup, we are not able to follow TFFLO(H) all the way to the tricritical
point in the phase diagram, because at lowest temperatures our maximum magnetic
field is limited to B = 12 T.
For p = 0.45 GPa, at B = 10.4 T the transition from the normal to the super-
conducting state is still of second-order, but a second anomaly is already observable
at low temperatures. Only for fields higher than 11.2 T (11.5 T and 12 T depicted
in Fig. 3.22) the superconducting phase transition is of first-order. This behavior
is different from results at ambient pressure: for p = 0 GPa, at the field where the
second anomaly is initially found, the transition from the normal to the SC state is
already of first-order. We obtain similar results for p = 1.34 GPa, where, at fixed
field, a normal to superconducting state phase transition, of second-order, is followed,
upon lowering T , by a second anomaly in C(T ).

FFLO in CeCoIn5 71
0
1
2
0 1 20
0.5
1.0
p=0.45 GPaB||(a,b)
B=10.4 T B=11.5 T B=12.0 T
C-C
Scko
ttky
(J/(m
ol K
))
p=1.34 GPaB||(a,b)
B=10.6 T B=11.5 T B=12.0 T
C-C
Scko
ttky
(J/(m
ol K
))
T (K)
Figure 3.22: Electronic contribution to the low temperature specific heat C−CSchottky
for selected magnetic fields B close to Bc2(0) at p = 0.45 GPa (upper panel) andp = 1.34 GPa (lower panel). Data at 11.5 T (4) and 12 T () are shifted by 0.25J/(molK) and 0.5 J/(molK), respectively. The arrows indicate the TFFLO anomaly.
3.3.4 Magnetic field effect on the SC transition for B ‖ c
Specific heat measurements under pressure were carried out also for the magnetic
field perpendicular to the basal plane (i.e., B ‖ c). A change in symmetry of the SC

72 Chapter 3
0.5 1.0 1.5 2.0 2.5
1
2
3
4
0 T 0.2 T 0.4 T 0.6 T 0.8 T 1.0 T 1.5 T 2.0 T 2.5 T 3.0 T 3.5 T 4.0 T 4.5 T
B
CeCoIn5p=0.45 GPaB||c
C (
J/(m
ol K
) )
T (K)
0.5 1.0 1.5 2.0 2.5 3.00
1
2
3
B
0 T 0.25 T 0.50 T 0.75 T 1.00 T 1.25 T 1.50 T 2.00 T 2.50 T 3.00 T 3.25 T 3.50 T 3.75 T 3.85 T 3.90 T
p=1.34 GPaB||c
CeCoIn5
C(J
/(mol
K))
T (K)
Figure 3.23: C(T ) dependence for different magnetic fields applied along the c-axisat p = 0.45 GPa (upper panel) and p = 1.34 GPa (lower panel).

FFLO in CeCoIn5 73
anomaly is observed close to the upper critical field for p = 0.45 GPa (Fig. 3.23,
upper panel). At B = 4.5 T the transition appears to be first-order, however we can
not determine T0 precisely from our data. In contrast, no obvious change of the phase
transition character is observed at p = 1.34 GPa probably due to the drastic reduction
of the superconducting jump (Fig. 3.23, lower panel). Magnetization experiments,
however, reveal similar T0 values for both field orientations [127].
Already at ambient pressure a significant anisotropy has been observed for the
upper critical field. This is not surprising given the quasi-cylindrical Fermi-surface
structure which would allow a more pronounced orbital-limiting effect in the B ‖ c
case. At each pressure, as it will be shown later, the orbital-limiting effect is roughly
by a factor of three stronger for B ‖ c compared to the B ‖ (a, b) case. Interestingly,
while the pressure stabilizes the superconducting state against the in-plane magnetic
field, it has just the opposite effect for B ‖ c. In the latter case the upper critical field
is reduced upon applying pressure from Bc2(0) = 4.9 T at ambient pressure [101] to
Bc2(0) = 4.7 T at p = 0.45 GPa and lower to Bc2(0) = 4.2 T at p = 1.34 GPa. For this
field orientation we do not pursue any possible FFLO anomaly at low temperature.
Though, at ambient pressure an anomaly in specific heat was detected [3], for this
field orientation the FFLO state is less stable as TFFLO is less than half its value for
B ‖ (a, b) (i.e., TFFLO ≈ 0.130 K). Moreover, the existence of the low-T anomaly for
B ‖ c has not yet been confirmed, to our knowledge, in subsequent studies at ambient
pressure.
3.3.5 Discussion and conclusions
The superconducting transition temperature Tc determined from our specific heat
data rises with increasing p, in excellent agreement with previous pressure studies [111,
119, 120]. The electronic specific heat coefficient γ decreases linearly with increasing
p and the drastic reduction of the superconducting jump indicates a substantial drop
of the effective mass above p = 0.45 GPa, a tendency confirmed also by dHvA studies
[121]. At p = 1.34 GPa the electronic effective mass drops below 50% of its ambient
pressure value, in reasonably good agreement with [124].

74 Chapter 3
At ambient pressure we have established a B − T phase diagram for CeCoIn5
as was previously observed [3, 4]. Figure 3.24 displays the combined B − T phase
diagram for p = 0, 0.45, and 1.34 GPa for B ‖ (a, b) and for B ‖ c. First we note the
increasing anisotropy between Bc2(0)B‖(a,b) and Bc2(0)B‖c; in the first case the upper
critical field Bc2(0) is enhanced and in the latter suppressed upon increasing pressure.
Remarkably, for B ‖ c the upper critical field is suppressed by pressure while Tc is
enhanced, behavior which remains a challenge to understand.
As the main goal of our study is to probe the possible realization of the FFLO
state in CeCoIn5, we discuss in the following the evolution of the B−T phase diagram
with pressure and show that the necessary prerequisites for the FFLO state formation
are still satisfied as the system is driven away from the influence of the quantum
critical point.
Foremost, we were able to track the low-T anomaly up to the highest applied
pressure for B ‖ (a, b). The anomaly at TFFLO appears first at almost the same mag-
netic field, B ≈ 10.5 T, independent of pressure. With further increasing the field,
TFFLO(B) moves gradually to higher temperatures for all pressures. The TFFLO(B)
line remains almost unaffected as the applied pressure is increased to p = 0.45 GPa
despite the enhancement of Tc, T0 and Bc2(0). As can be seen in Fig. 3.24, the
TFFLO(B) lines overlap almost perfectly for p = 0 GPa and p = 0.45 GPa. How-
ever, a further increase up to p = 1.34 GPa moves TFFLO(B) to significantly higher
temperatures and Bc2(0) increases considerably too.
Interestingly, like TFFLO(B) at p = 0 GPa and p = 0.45 GPa, the initial slope
of the upper critical field B′c2 = ∂Bc2
∂T
∣∣T=Tc
remains roughly the same. For the initial
slope of the upper critical field B′c2 we obtain for B ‖ (a, b): B′
c2(0 GPa) = −30.5 T/K,
and B′c2(0.45 GPa) = −29.4 T/K.
Correspondingly, the orbital critical field
Borb = h∗0 Tc
∣∣∣∣(∂Bc2
∂T
)T=Tc
∣∣∣∣ (3.11)
does not change significantly. The value of h∗0 depends on the ratio of the mean-
free path `tr and the superconducting coherence length ξ0; h∗0 ranges from 0.69 in

FFLO in CeCoIn5 75
0 0.5 1.0 1.5 2.0 2.50
2
4
6
8
10
12
14
16
p
T*T*
T*
TFFLO
TFFLO
TFFLO
p = 0 GPa
CeCoIn5
B||c
T0
T0
T0 p = 1.34 GPa p = 0.45 GPa
B || (a,b)
p
B (T
)
T (K)Figure 3.24: B − T phase diagram for B ‖ (a, b) and B ‖ c. Arrows mark thecrossover temperature T0 from a second- to a first-order SC phase transition and T ∗
the tricritical point. Data for p = 0 and B‖c, shown by half-filled symbols, are takenfrom [101].

76 Chapter 3
the dirty-limit (`tr/ξ0 1) to 0.73 in the clean-limit case (`tr/ξ0 1) [128], this
last condition being satisfied in CeCoIn5 also under pressure as we will discuss later.
Therefore we obtain:
Borb(0 GPa) = 47.9 T and Borb(0.45 GPa) = 49.9 T.
However, at p = 1.34 GPa, |B′c2| decreases drastically, by roughly 50% to B′
c2 =
−16.4 T/K and consequently Borb(1.34 GPa) = 29.7 T.
A similar behavior is also observed for the field perpendicular to the basal
plane (B ‖ c), as the initial slope of the upper critical field changes significantly
only above p = 0.45 GPa: B′c2(0 GPa) = −10.8 T/K, B′
c2(0.45 GPa) = −10.2 T/K,
B′c2(1.34 GPa) = −6.5 T/K and correspondingly: Borb(0 GPa) = 16.9 T,
Borb(0.45 GPa) = 17.3 T and Borb(1.34 GPa) = 11.7 T.
To determine the Maki parameter
α =√
2Borb
BP
(3.12)
we need to estimate the Pauli-limiting field BP . An accurate estimation of BP could
be obtained considering:
BP =Bc
2√
πχspin
[20], (3.13)
where χspin is the magnetic susceptibility due to the electron spin and
Bc = Tc
√2π
γ0
Vmole
[20], (3.14)
is the thermodynamical critical field with γ0 the Sommerfeld coefficient and Vmole the
molar volume. However, no spin susceptibility or Knight shift data under pressure
are available at the moment.
It is reasonable to assume, as a first approximation, BP ≈ Bc2(0). With this
estimate for BP we get
α(0 GPa) = 5.8,
α(0.45 GPa) = 5.7,
α(1.34 GPa) = 2.9.

FFLO in CeCoIn5 77
This is still sufficiently large, even at the maximum pressure, compared to the min-
imum value α = 1.8 for s-wave superconductors required to realize the FFLO state
[36].
It is as well necessary to verify if the system remains in the clean-limit under
pressure. We find that the ratio between the mean-free path and the coherence length,
`tr/ξ0, increases substantially with pressure for both field orientations. To estimate
the coherence length ξ0 we used the BCS relation
ξ0 =
√Φ0
2πBc2(0)(3.15)
where Φ0 = h/(2e) = 2.067810−15 Wb is the flux quantum. There is no straight-
forward alternative to determine ξ0 without considering as starting assumption the
system either in the clean- or dirty-limit. However, the equation 3.15 gives an upper
limit estimation for ξ0 as it is deduced taking into account the orbital effects. Replac-
ing Bc2 by Borb in 3.15 would yield significantly smaller values for ξ0 and, therefore,
higher `tr/ξ0 ratios.
For the mean-free path, `tr, we then followed the scheme of Orlando et al. de-
veloped for s-wave superconductors [129]:
`tr = 9× 10¹⁹ ~(3π2)13
1
e2ρ0(Ωcm)(n23
SSF
)= 1.27× 10¹² 1
ρ0(Ωcm)(n23
SSF
)(A), (3.16)
ξ0 = 1.781~ < vF >
π2kBTc
= 1.781kB(3π2)−13
n23
SSF
γTc
= 7.95× 10⁻⁹n
23
SSF
γTc
(A), (3.17)
where ρ0 is the low temperature normal state resistivity, S/SF is the Fermi-surface
in units of the Fermi-surface of a free-electron gas density n, < vF > is the average
Fermi velocity and γ is the normal state electronic specific heat coefficient expressed
in (erg cm−3 K−2). Replacing n2/3S/SF determined from equation 3.17 into 3.16 we
obtain:
`tr = 1.00965× 10⁴ 1
ρ0 ξ0 γ Tc
(A). (3.18)

78 Chapter 3
Table 3.4: The mean-free path `tr, coherence length ξ0 and `tr/ξ0 at different pressuresand field orientations.
p(GPa) 0 0.45 1.34
`tr (A) for B ‖ (a, b) 318 451 925
ξ0 (A) for B ‖ (a, b) 53 51 48
`tr/ξ0 for B ‖ (a, b) 6 9.2 20
`tr (A) for B ‖ c 206 277 502
ξ0 (A) for B ‖ c 82 84 88
`tr/ξ0 for B ‖ c 2.5 3.2 5.7
Using the measured γ and Tc values (Table 3.3) together with ρ0 data from [119]
and ξ0 given by equation 3.15 we find the values listed in Table 3.4.
`tr/ξ0 is enhanced substantially with rising p for both field orientations, indi-
cating that the system becomes even ”cleaner” when pressurized. The increase of `tr
with increasing pressure is essentially caused by the drop of the normal state resis-
tance reflecting the reduction of the spin-fluctuations [111, 119]. The difference we
find for `tr/ξ0 at ambient pressure compared to [79] is due to the different normal
state resistivity values we used for our calculation.
Extrapolating the TFFLO(B) lines to higher fields, unaccessible experimentally
with our present setup, we can estimate for the tricritical point T ∗: T ∗(0 GPa) ≈
(0.320 ± 0.015) K ≈ 0.14 Tc, T ∗(0.45 GPa) ≈ (0.37 ± 0.02) K ≈ 0.15 Tc and
T ∗(1.34 GPa) ≈ (0.50 ± 0.05) K ≈ 0.19 Tc. This indicates that the FFLO state
forms well below the temperature T0 where the paramagnetic effect starts to domi-
nate the orbital effect in lowering the upper critical field. This is in good agreement
with a weak coupling BCS model involving singlet dx2−y2 pairing, AFM fluctuations
and which takes into account both orbital and spin depairing [47]. T ∗/T0 ratios at
different pressures are depicted in Table 3.5.

FFLO in CeCoIn5 79
0.5 1 1.5 2 2.5T(K)
15
10
5
0
Hc2
(T)
p=1.34 GPa, g=0.554p=0.45 GPa, g=6365p=0 GPa, g=0.632
Figure 3.25: Theoretical fits to upper critical field data at different pressures forB ‖ (a, b). Upper panel: the whole T range. Lower panel: low-T range. The dashedlines are generated with different g-factors. See text for details.

80 Chapter 3
The Bc2(T ) data in Fig. 3.24 for B ‖ (a, b) were analyzed [130] in terms of
the theory developed in [45, 46] in which d-wave SC and the Gruenberg-Gunther
ansatz [36] are incorporated within a weak-coupling BCS model. The effect of the
quasiparticle mean-free path is neglected, which is valid for CeCoIn5 since `tr/ξ0 1.
We can describe Bc2(T ) for both B ‖ c and B ‖ (a, b) (we neglected the small in-plane
anisotropy for B ‖ (a, b)). The result is summarized in Table 3.5. The Fermi velocities
va and vc are deduced from B′c2 at T = Tc for B ‖ c and B ‖ (a, b), respectively, while
the g-value is obtained from Bc2(T ) for B ‖ (a, b) and T < 0.7 K.
The theoretically estimated values for Bc2(0) are in fair agreement with the
experimental data. The theoretical Bc2(T ) curves, plotted in Fig. 3.25, are obtained
using Tc, va, vc and g as parameters and found to describe the experimental phase
diagram quite well. The relevance of the g-factor at low-T is underscored by the
considerable offset induced by only a slight change of the g-value (dashed lines in
Fig. 3.25).
At p = 1.34 GPa, the high-T data are well described by g = 0.6. However, a
small decrease of the g-factor to g = 0.554 seems to describe the data better for T <
T0. The latter value is also used to calculate Bc2(0). Such a weak g(B) dependence
is not accounted for by the current theory and a different theoretical approach using,
e.g. a generalized Fermi liquid theory might be required. The reduction of the g-
factor at low temperatures is a consequence of an additional enhancement of the
upper critical field at low-T suggesting maybe a stronger effect of the FFLO state
on Bc2 than already included in the theoretical model. This enhancement is easily
seen in the phase diagram if we compare the Bc2(T ) lines: while for p = 0 GPa and
p = 0.45 GPa the Bc2(T ) are roughly parallel to each other for p = 1.34 GPa, Bc2
increases at a faster pace upon lowering T below T0. This is underlined in Fig. 3.26
where the upper critical field Bc2(T ) normalized to Bc2(0) is plotted as a function of
the reduced temperature T/Tc: the p = 1.34 GPa curve starts with a lower slope but
finally, as the transition becomes first-order, at T = T0 = 0.44 Tc, exceeds the values
for ambient pressure. This indicates, together with the enhancement of T0, T ∗ and
Bc2(0) that the FFLO state becomes more robust under pressure, despite a smaller

FFLO in CeCoIn5 81
0 0.2 0.4 0.6 0.8 1.00
0.2
0.4
0.6
0.8
1.0
B||(a,b)
CeCoIn5
p=0 GPa p=0.45 GPa p=1.34 GPa
Bc2
/Bc2
(0)
T/Tc
Figure 3.26: Bc2/Bc2(0) as function of T/Tc. For p = 1.34 GPa a clear enhancementof Bc2 is visible as the superconducting transition becomes first-order.
Maki parameter α.
In order to further check for the consistency of the model used we compare the
Pauli field calculated with the theoretical g-values against the experimental findings.
To obtain BP we follow the scheme proposed by Clogston [13] and adapt it to d-wave
pairing. In the weak coupling limit for a d-wave superconductor, the superconducting
gap can be expressed as:
∆0 = 2.14 kBTc [39, 131] (3.19)
The condensation energy ∆F for a d-wave superconductor is given by:
∆F =1
4N(0)∆2
0 [132] (3.20)
where N(0) is the density of states at the Fermi-level and the normal state spin

82 Chapter 3
P (GPa) 0 0.45 1.34
Tc (K) 2.242 2.428 2.584
Bc2(0) (T) for B ‖ (a, b) 11.6 12.5 14.3
(∂Bc2/∂T )Tc (T/K) for B ‖ (a, b) -30.5 -29.4 -16.4
Bc2(0) (T) for B ‖ c 4.9 4.7 4.2
(∂Bc2/∂T )Tc (T/K) for B ‖ c -10.8 -10.2 -6.5
T0 (K) 0.875± 0.050 1.025± 0.050 1.170± 0.100
T0/Tc 0.39 0.42 0.44
T ∗ (K) 0.320± 0.015 0.370± 0.015 0.500± 0.050
T ∗/Tc 0.14 0.15 0.19
T ∗/T0 0.36 0.36 0.43
α for B ‖ (a, b) 5.8 5.7 2.9
g 0.632 0.6365 0.554
va (cm/s) 7.47× 10⁵ 7.89× 10⁵ 9.59× 10⁵
vc (cm/s) 3.39× 10⁵ 3.37× 10⁵ 3.60× 10⁵
Bc2(0)fit (T) 11.73 12.72 14.28
Table 3.5: Experimental values for Tc, Bc2(0), (∂Bc2/∂T )Tc , T0 and T ∗ and estimationfor α (see text for details). g-factor, Fermi velocity va and vc, and Bc2(0)
fit extractedfrom fitting of Bc2(T ).
susceptibility χn is:
χn =1
2(gµB)2 N(0). (3.21)
Upon applying magnetic field, the Cooper pairs are broken up when B = BP and the
free energy will be lowered by:
∆F =1
2(χn − χs)BP , (3.22)
where the spin susceptibility in the superconducting state χs is zero for T = 0 K. We
therefore obtain for the Pauli field in a d-wave superconductor:
BP =∆0
gµB
= 3.185(T/K)Tc
g. (3.23)

FFLO in CeCoIn5 83
This yields using our calculations for the g factor:
BP (0 GPa) ≈ (11.3± 0.4) T,
BP (0.45 GPa) ≈ (12.2± 0.4) T,
BP (1.34 GPa) ≈ (14.8± 0.4) T,
values which are in reasonable agreement with the experimental findings, indicating
that the orbital-limiting effect is indeed very small.
In conclusion, we have studied the pressure evolution of the superconducting
B − T phase diagram of CeCoIn5 by measurements of the specific heat. The system
remains in the clean-limit, `tr/ξ0 even increases upon applying pressure and the Maki
parameter α remains well above the minimum required value for the formation of
the FFLO state. Moreover, the FFLO anomaly inside the SC state is present at all
pressures, reinforcing the existence of the FFLO state at low-T close to Bc2(0). Under
pressure, the FFLO region in the phase diagram expands to higher temperatures and
higher fields indicating that the FFLO state becomes more robust upon increasing p.
The first-order character of the SC phase transition at high fields is maintained under
pressure and the FFLO state stability increases upon reducing the spin-fluctuations,
as expected in the frame of the AFM-fluctuations based model proposed in [47].
Our result represents the first evidence of the existence of this state away from the
influence of the strong magnetic fluctuations, clearly suggesting its genuine FFLO
nature.
Since the FFLO state should be enhanced with increasing α our results imply
that the AFM fluctuations tend to suppress the FFLO state (i.e., the AFM QCP
is unrelated to the FFLO phenomena) and this is as well supported by theoretical
calculations [47, 133]. The AFM fluctuations may lead to a damping of quasiparticle
interactions and at least one origin of the increase of Tc upon applying pressure
is the suppression of this damping effect. However, theoretical calculations [133]
suggest that the AFM fluctuations have the opposite effect at high B and low-T and
tend to increase Bc2 at lower temperatures. This means that at high B and low-T

84 Chapter 3
the AFM fluctuations are competitive to the paramagnetic effect. However, further
theoretical insight is required to fully understand the intricate role played by the
AFM fluctuations and the development of a theoretical model which accounts for the
AFM fluctuations is under way [133].
We have analyzed the Bc2(T ) data of CeCoIn5 within the microscopic model
which includes:
a) the layered structure (or quasi-two-dimensionality);
b) dx2−y2 symmetry for the SC order parameter ;
c) Gruenberg-Gunther ansatz.
This weak-coupling model gives an excellent description of the observed Bc2(T ) curves
for both B ‖ c and B ‖ (a, b). From Table 3.5 we can read that there are pronounced
changes in g and the Fermi velocity in the basal plane va, between p = 0.45 GPa
and p = 1.34 GPa. The reduction of the effective mass m∗ and the increase of va
with rising p indicate a damping of the quasiparticle-quasiparticle interaction while
the simultaneous enhancement of Tc might be induced by an increase of the chemical
potential [125]. We recall that p = 1.34 GPa corresponds to the top of the SC dome
in CeCoIn5, in analogy to the top of the doping-induced dome in the high-Tc cuprate
superconductors. However, in the high-Tc compounds, the anisotropy is increased
as the antiferromagnetic fluctuations are enhanced with decreasing doping. This
feature is opposite to the pressure effect in CeCoIn5. Very strong fluctuations impede
probably the formation of the FFLO state in high-Tc or organic superconductors
while in CeCoIn5 less pronounced fluctuations allow the inhomogeneous SC state to
form [47]. We find that the damping of the fluctuations stabilize even further the
FFLO state and this might be the route to induce a FFLO state in high-Tc or organic
superconductors. However, there is thus an inescapable parallel between the high-Tc
cuprates and CeCoIn5 [125]. Indeed the exploration of CeCoIn5 from this point of
view should be very fruitful.

Chapter 4
Superconducting order parametersymmetry in UBe13 probed byuniaxial stress
4.1 Introduction
Despite of more than two decades of intensive experimental and theoretical efforts
to characterize the heavy-fermion superconductor (SC) UBe13, many aspects of its
physics remain enigmatic. It crystallizes in the NaZn13 cubic structure with a lattice
constant a = 10.261 A and two different Be-sites [134]. The U-U distance is of about
5.13 A with each U-atom placed in an almost cubic environment of 24 Be-atoms (Be-
II sites) forming a cage around the U-atom. 12 out of the 13 Be-atoms of one formula
unit sit on such Be-II sites, the last one being situated on a non-symmetry equivalent
site, in an icosahedral environment. The CsCl-type sublattice of U-atoms and Be-I
are presented in Fig. 4.1.
A full understanding of the physics in UBe13, in both normal and superconduct-
ing state, remains elusive.
85

86 Chapter 4
Figure 4.1: The crystal structure of UBe13.
4.2 Normal state and non-Fermi liquid behavior in
UBe13
Even in the normal state the actinide intermetallic compound UBe13 is a rather un-
usual metal. It was the first discovered actinide-based system which revealed extreme
heavy-electron behavior [135]. Its properties are dictated by the partially filled 5f
shell. It was shown by photoemission results [136] that the 5f electron level in UBe13
is close to the Fermi energy. Therefore, the heavy-fermion behavior that sets in below
a characteristic fluctuation temperature T ∗, would not correspond well to the Kondo
picture which requires that the 5f states are well separated from the Fermi-level.
However, the system still can be reasonably well described within the framework of
the single- [137] or multi-channel [138, 139] Kondo effect and is in general considered
to be a reasonably good example of a Kondo lattice. Moreover, the quasiparticles have

Uniaxial stress on UBe13 87
Figure 4.2: Low-T specific heat (C) and thermal expansion α of single crystallineUBe13. The width of the SC transition is indicated by the vertical dotted lines.Vertical arrows indicate the position of the Tmax (see text). From Ref. [144].
a record effective mass as a renormalization, by a factor of 1000 compared to the free
electron mass, has been suggested [140, 141]. T ∗ estimates range from T ∗ = 8 K [142]
to T ∗ = 30 K [143].
Furthermore, resistivity [135, 143], thermal expansion [144, 145] and specific
heat measurements [146] (the specific heat and thermal expansion data are depicted
in Fig. 4.2) suggest the presence of a second low energy scale Tmax ≈ 2 K, where these
quantities exhibit an additional maximum. At low temperature T ∼ Tmax, a coherent
Landau-Fermi liquid has not yet formed and the superconductivity emerges out of
an anomalous non-Fermi liquid (NFL) state. If superconductivity is suppressed upon
applying high magnetic field (B ≈ 12 T), C/T displays a logarithmic increase with

88 Chapter 4
reducing T [146] as is characteristic for NFL behavior. This is in contrast with many
other heavy-fermion systems but is similar to CeCoIn5 where the superconductivity
sets in before the complete condensation of the Kondo centers [115]. It is possible
that the magnetic fluctuations of the residual incoherent Kondo liquid are responsible
for the anomalous behavior in the normal state.
Upon applying hydrostatic pressure, the 2 K maximum in both the specific
heat and resistivity grows in magnitude and shifts to higher temperatures at roughly
the same rate dTmax/dp = 2.3 K/GPa [147], whereas the superconducting transition
temperature decreases at a rate of dTc/dp = −0.16 K/GPa [148, 149].
The low temperature resistivity data follow a ρ(T ) = ρ0 + bT 3/2 dependence
[150] in good agreement with theoretical prediction for a three-dimensional system of
itinerant AFM spin fluctuations in the vicinity of a quantum critical point [151]. An
additional anomaly is revealed as a broad minimum in thermal expansion [144, 145]
(inset Fig. 4.2) and as an inflection point in C/T (B) data [144]. This anomaly is
gradually shifted to lower T upon applying magnetic field and finally suppressed at
B ≈ 4 T (B∗(T ) anomaly line in Fig. 4.3). It was suggested [152] that this might
point out toward a field induced QCP responsible for the NFL behavior found in
UBe13.
Similar to CeCoIn5, a low temperature upturn in C/T is observed for T < 0.2 K
even after subtracting the nuclear contribution due to Zeeman splitting of the 9Be
spin states. Its origin is not yet understood but might be related to the possibility
that superconductivity precludes a certain type of magnetic order. However, no clear
signature of magnetic order has been observed down to the lowest temperature.
In addition, the two-channel Kondo effect has been proposed as well as a possible
route to explain the non-Fermi liquid regime in UBe13 [153, 154]. UBe13 starts to
recover Fermi liquid behavior at high magnetic fields, above B = 14 T, as the low-T
resistivity turns to a ∆ρ ∝ T 2 dependency [150].
The normal state properties of UBe13 clearly reveal the attributes of a heavy-
electron metal. The high temperature specific heat C for T > 10 K can be well

Uniaxial stress on UBe13 89
described by the typical expression for an ordinary metal
C(T ) = γT + βT 3, (4.1)
where the first term is the electronic contribution to the specific heat while the latter
is the lattice contribution for T ΘD , where ΘD ≥ 600 K is the Debye temperature
[155, 156]. The electronic specific heat divided by temperature Cel/T is strongly T -
dependent below 7 K and, upon reducing T increases its value by more than a factor
of 4 down to T = 1 K. This upturn of Cel/T with decreasing temperature is a general
feature of heavy-electron systems [157].
The magnetic susceptibility χ of UBe13 at elevated temperatures shows a Curie-
Weiss type behavior with an effective moment µeff = 3.05µB/U ion and a negative
paramagnetic Curie-Weiss temperature θ = −53 K [155]. This indicates the existence
of fairly well localized moments due to the partially filled 5f -electron shell of the U
atoms. Below T = 120 K, deviations from the Curie-Weiss law are detected and
attributed to single-ion effects [142]. At low temperatures, T < 1.2 K, the magnetic
susceptibility becomes almost temperature independent, which is again regarded as
general feature of heavy-electron systems. The room temperature resistivity is rather
large (ρ(300 K) ≈ 100 µΩcm [135]) compared to ordinary metals. On cooling from
room temperature, ρ(T ) steadily increases and saturates around T = 10 K and shows
the already mentioned distinct maximum at Tmax ≈ 2 K. Just above the super-
conducting transition ρ(T ) has still a very high value (ρ(1 K) ≈ 200 µΩcm [135])
attributed to scattering on magnetic fluctuations.
4.3 Unconventional superconductivity in UBe13
UBe13 was the second heavy-fermion after CeCu2Si2 [158] discovered to display su-
perconductivity [135]. The superconductivity in UBe13 has been found to be of ex-
treme type-II, with a coherence length ξ0 ≈ 50 A and a penetration depth λ(0) ≈
8000 A yielding a Ginzburg-Landau parameter κ ≈ 150 [159]. The superconduct-
ing phase transition temperature Tc depends considerably on the type of the sample.

90 Chapter 4
Figure 4.3: The upper critical field Bc2 and the magnetic anomaly line B∗ as deter-mined by specific heat (squares) and thermal expansion (triangles). From Ref. [144].
There are two classes of UBe13 single crystals [160] which, however, are not much dif-
ferent in their impurity content: the ”H”-type (”high-Tc”, Tc ≈ 0.9 K) and ”L”-type
(”low-Tc”, Tc ≈ 0.75 K). A comparative investigation of both types reveals important
differences, both in normal and superconducting state [160]. The determining factor
leading to ”L”- or ”H”-type behavior is most likely related to details of the sample
preparation process.
The enormous Sommerfeld coefficient γ ≈ 1.1 J/molK2 [135], a specific heat
jump ratio ∆C/γTc ≈ 2.5 [161], considerably larger than the BCS value of 1.43
and an energy gap 2∆/kBTc ≈ 6.7 [162] (BCS value: 3.5) clearly point to strong
coupling effects in the superconducting UBe13. Several experiments probing the su-
perconducting state of this material, revealed anomalous features which are regarded
as evidence for unconventional superconductivity. Thus, well below Tc, the pene-
tration depth ∆λ ∝ T 2 [163, 164] and C ∝ T 3 [157], therefore departing from the
temperature dependence expected for a conventional superconductor. NMR spin-
lattice relaxation rate measurements [86] find 1/T1 ∝ T 3 strongly deviating from
Uniaxial stress on UBe13 91
the exponential temperature dependence predicted by the BCS theory. Moreover,
no Hebel-Slichter coherence peak has been observed. All these are taken as evi-
dences for a strongly anisotropic order parameter, for which the gap function shows
zeros on certain parts of the Fermi-surface, in contrast with the overall non-zero gap
function of a conventional superconductor. The most compelling evidence obtained
so far for unconventional superconductivity regards the giant ultrasonic absorption
anomaly observed directly below Tc [8, 9] which was ascribed to collective modes or
domain-wall damping due to a multi-component order parameter [10].
The B − T phase diagram (Fig. 4.3) is quite unusual as the upper critical field
curve Bc2(T ) shows an inflection point around T = 0.45 K (visible only for the ”H”-
type samples) and has a huge initial slope ∂Bc2/∂T |Tc ≈ 55 T/K, one of the highest
ever reported for a bulk superconductor [141, 165]. Even higher values, ranging from
100 T/K to infinity have been reported in [166]. The anomalous inflection point in the
B − T phase diagram was suggested to reflect the formation of an FFLO state [165],
a scenario which however has not been confirmed. The zero temperature value of the
upper critical field is around Bc2(0) ≈ 14 T (for ”H”-type) [165], extremely large for a
superconductor with a superconducting transition temperature of less than Tc = 1 K.
Lower values of Bc2(0) ≈ 8 T have been reported for the ”L”-type crystals [160].
The lower critical field Bc1(0) was reported to be around 4.2 mT and to decrease
quadratically as T increases [167].
4.4 Possible uniaxial strain effect on the SC order
parameter
The behavior of a multi-component order parameter for an anisotropic superconduc-
tor (with p- or d-wave pairing symmetry) under uniaxial stress has been theoretically
investigated by M. Sigrist, R. Joynt and T. M. Rice [11, 12]. By lowering the crystal
symmetry in such a non s-wave superconductor, the degeneracy in the order param-
eter representation might be lifted, leading to a split of the superconducting phase

92 Chapter 4
transition. In the following we are referring to the original analysis of M. Sigrist et
al. [11, 12] resuming our attention to the effect on the order parameter of the strain
applied along a main crystal axis in a cubic crystal.
In a system with spin-orbit coupling only the following symmetry transforma-
tions are possible:
- proper rotation transformation R which is the point group of the lattice;
- time reversal symmetry;
- inversion symmetry;
- U(1) gauge transformation which corresponds to a multiplication with a phase
factor.
The possible superconducting phases for cubic systems including spin-orbit coupling
have been catalogued in [168, 169]. For such a crystal structure (symmetry group O)
with p- or d-wave pairing, four different irreducible representations are possible for the
symmetry group. Following Blounts notations [169] they are: Γ1 - one dimensional,
Γ3 - two dimensional, Γ4 and Γ5 both three dimensional (see table 4.1).
Table 4.1: Cubic basis functions for different irreducible representations followingRef. [169].
Irreducible representations Cubic basis functions
Γ1 d(Γ1) = 1√3(xkx + yky + zkz)
Γ3 d(Γ3, u) = 1√6(2zkz − xkx − yky)
d(Γ3, v) = 1√2(xkx − yky)
Γ4 d(Γ4, x) = 1√2(ykz − zky)
d(Γ4, y) = 1√2(zkx − xkz)
d(Γ4, z) = 1√2(xky − ykx)
Γ5 d(Γ5, ξ) = 1√2(ykz + zky)
d(Γ5, η) = 1√2(zkx + xkz)
d(Γ5, ζ) = 1√2(xky + ykx)

Uniaxial stress on UBe13 93
Since the system of these basis functions is complete, a general gap function
may be written as linear combination:
d(k) =∑
Γ
∑γ
λ(Γ, γ)d(Γ, γ,k), [12] (4.2)
where ∆ = i(d(k)σ)σy is a 2 × 2 gap matrix and σ = (σx, σy, σz) denotes the three
Pauli spin matrices. λ(Γ, γ) are arbitrary coefficients and d(Γ, γ,k) is the γ-th basis
function of the representation Γ for the wave vector k. The gap function near Tc is
given by a linear eigenvalue equation:
ωd(k) = −1
2N(0)〈V (k,k′)d(k′)〉k′ , [12] (4.3)
where N(0) is the density of states and V (k,k′) is the pairing interaction. The
brackets represent an average over the whole Fermi-surface. The eigenvalue ω is
related to Tc by:
Tc = 1.14 εc e−1ω [12] (4.4)
with εc the cutoff energy.
The form of the interaction potential determines which representation gives the
highest Tc (i.e., the actual Tc) so that only one Γ enters the sum in equation 4.2.
There remains a sum over γ with arbitrary coefficients giving a degeneracy greater or
equal to the dimension of the representation. Under uniaxial stress this degeneracy
might be lifted. If we regard λ as order parameter we can write the Ginzburg-Landau
expansion for the free energy as:
F = Fs − Fn =2
3N(0)A(T )
∑γ
|λ(Γ, γ)|2 + f(λ4) [12] (4.5)
where A(T ) = ln(T/Tc). f(λ4) denotes fourth order cross-terms in the order param-
eter which can be written for the cubic representation as:
for Γ1: f(λ4) = η1|λ|4,
for Γ3: f(λ4) = η1(|λu|2 + |λv|2) + η2(λ∗uλv − λuλ
2v)
2,
for Γ4 and Γ5: f(λ4) = η1(|λ|2)2 +η2|λ2|2 +η3(|λi|2|λj|2 + |λi|2|λk|2 + |λj|2|λk|2),

94 Chapter 4
η3
1 transition 2 transitions
2 transitions 1 transition
η2
4η2=η3
a) Tx > Tz
1 transition 3 transitions
2 transitions 2 transition
η2
η3
4η2=η3
b) Tx < Tz
Figure 4.4: Summary of the possible phase diagrams for Γ4 or Γ5 representations.
where the coefficients ηi of the invariant terms are undetermined, independent param-
eters and λ = (λx, λy, λz). The anisotropy in the second-order terms in equation 4.5
is due to the degeneracy of the basis functions of the same representation and there-
fore, they give the same transition temperature. However, uniaxial stress applied on
a cubic crystal along the (0,0,1) direction, lowers its symmetry to a tetragonal one.
The Landau expansion of the free energy for the Γ4 case when the strain is applied
along the z-axis becomes:
F = Ax(T )(|λx|2 + |λy|2) + Az(T )(|λz|2) + η1(|λ|2)2 + η2|λ2|2
+η3(|λx|2|λy|2 + |λx|2|λz|2 + |λy|2|λz|2), (4.6)
where Ax(T ) = Ay(T ) = N(0) log(T/Tx) 6= Az(T ) = N(0) log(T/Tz) and Tx and Ty
are the two superconducting transition temperatures. For stability η1 > 0 is required
but the η2 and η3 values have no additional constrains. Qualitatively η3 determines
the anisotropy. Depending on the sign of η3 and on how Tx compares to Tz multiple
superconducting transitions are possible as can be seen in Fig. 4.4. A generic phase
diagram for Γ4 and strain along z with Tx > Tz and η3 < 0 is depicted in Fig. 4.5.
For the Γ5 representation the form of the Landau free energy is identical with the
Γ4 case, only the basis functions are different. Therefore the phase diagrams for those

Uniaxial stress on UBe13 95
Tc
Tz
Tx
Tem
pera
ture
strain
Figure 4.5: Generic phase diagram in 3D representation, Γ4 or Γ5 for Tx > Tz andη3 < 0.
two representations are identical. However, for the two dimensional Γ3 representation
in the case of a tetragonal distortion, the free energy is:
F = Au(T )|λu|2 + Av(T )|λv|2 + η1(|λu|2 + |λv|2)2 + η2(λ∗uλv − λuλ
∗v) (4.7)
with Au 6= Av and η1 > 0. A splitting of the transition is possible for η2 > 0 with a
degenerated low temperature phase.
For the one dimensional Γ1 representation no splitting of the phase transition
can take place, only a shift of Tc. No splitting is expected for s-wave pairing as
well. The analysis of Sigrist et al. [11, 12] does not distinguish between p- or d-
wave symmetry as the results are qualitatively similar. The symmetry properties and
therefore the possible phase diagrams are the same for both pairing cases.
For the UBe13 case, assuming for the relative splitting ∆Tc/Tc ≈ 20(c/a − 1)
[11, 170], the splitting of the superconducting transition temperature is estimated to
be around 0.5 K/GPa, where a and c are the lattice constants.

96 Chapter 4
4.5 Effect of tetragonal distortion on the super-
conducting transition in UBe13
The theoretically predicted splitting of the SC phase transition as a crystal is distorted
from a cubic to a tetragonal structure, was the motivation for us to measure, under
uniaxial stress along [100] direction, the specific heat of high quality single crystals1
of both ”L”- and ”H”-type [171].
Earlier specific heat measurements on ”L”-type UBe13 under uniaxial stress
along the [110] direction show a linear decrease of Tc by approximately 10 mK/GPa
but no double structure at Tc could be observed up to 0.68 GPa [172].
We measured the specific heat of our samples using an AC calorimetry method
[66] which has the advantage of a high temperature resolution since enables heat-
capacity measurements in a steady-state mode at continuously varying temperature.
The UBe13 crystals have been placed in the pressure cell between two stainless-steel
anvils. In order to prevent the crystal from breaking and also to allow some sideways
movement, we used copper foils and capton tape between the sample and the anvils.
The pressure p on the sample, applied by a bellows filled with He via a very thin
capillary, was kept constant within 10−4 GPa during a run using an proportional-
integral pressure regulator at room temperature. For each run the pressure was
increased linearly at a very low rate of approximative 0.075 kbar/hour. A RuO2
thermometer and a 10 kΩ heater where attached to the sample using Ag-based glue,
in a sandwich-like structure as described in the experimental introduction of this
work. Superconducting wires were used for the electrical contacts for both, heater
and thermometer. The ”L”-type crystal had a mass of m = 15.2 mg and dimensions
of 0.71 mm × 3.05 mm × 5.01 mm. For the ”H”-type crystal, m = 7.33 mg and the
dimensions were 1.095 mm × 1.355 mm × 1.417 mm. In both cases the force was
applied parallel to the longer side of the crystal and the temperature oscillations were
measured across the smaller dimension. An electrical current with frequency ω is
applied through the heater resulting in sample-temperature oscillations ∆Tac around
1The single crystals were prepared in the group of Prof. G. R. Stewart at the University of
Florida, Gainesville, Florida, USA.

Uniaxial stress on UBe13 97
0 5 100
1
2
3
UBe13''H''-type
Tmax
C (J
/(mol
K))
T (K)
0 5 10
0.0
0.2
0.4
0.6
Tmax
∂C/∂
T (J
/(mol
K2 ))
T (K)
Figure 4.6: Specific heat as function of T at ambient pressure for a ”H”-type singlecrystal. A clear maximum is observed at Tmax = 2.25 K. Inset: ∂C/∂T (T ) used todefine Tmax.
a mean temperature T . The specific heat of the sample is given by
C = F (ω, τi, τe)P/(2ω∆Tac), (4.8)
where P is the heating power and F is the frequency response function depending also
on the internal and external relaxation times, τi and τe, respectively (for details see
the experimental chapter). The sample thickness should be well below the thermal
diffusion length and 1/τe ω 1/τi. When these conditions are fulfilled F (ω) ≈ 1.
The thermal diffusion length is given by
l =
√κ
ωρC, (4.9)

98 Chapter 4
0.5 1.0 1.50
1
2
3
0 50 100
1
2
3UBe13''H''-type
C/T
(J/(m
ol K
2 ))
T (K)
C/T
(J/m
ol K
2 )
T (K)
Figure 4.7: C/T as function of T for the ”H”-type single crystal at ambient pressure.Inset: C(T )/T at high-T .
where κ is the thermal conductivity and ρ is the density. At T = 1 K, with κ =
0.433 mW/(K cm) [173] we obtain for a measurement frequency of ω = 0.132 Hz,
l ≈ 3.16 mm. A digital lock-in system amplifying only the difference between the
actual thermometer signal and one corresponding to the averaged T was allowing for
very low frequency measurements with high relative accuracy.
The specific heat of the same ”H”-type single crystal used for the uniaxial
stress studies was also measured at ambient pressure employing a relaxation method
(Quantum Design PPMS), in order to have a reference for the absolute specific heat
values. Our findings are in good agreement with the literature data: we find a sharp
superconducting transition (Fig. 4.6) at Tc = 0.92 K with a jump in the specific
heat of ∆C/(γTc) = 2.7. The superconducting transition width is ∆T ≈ 0.022 K,
an indication for the good sample quality. As well a broad maximum in C(T ) is
clearly observed in the normal state at Tmax = 2.27 K and depicted by the arrows
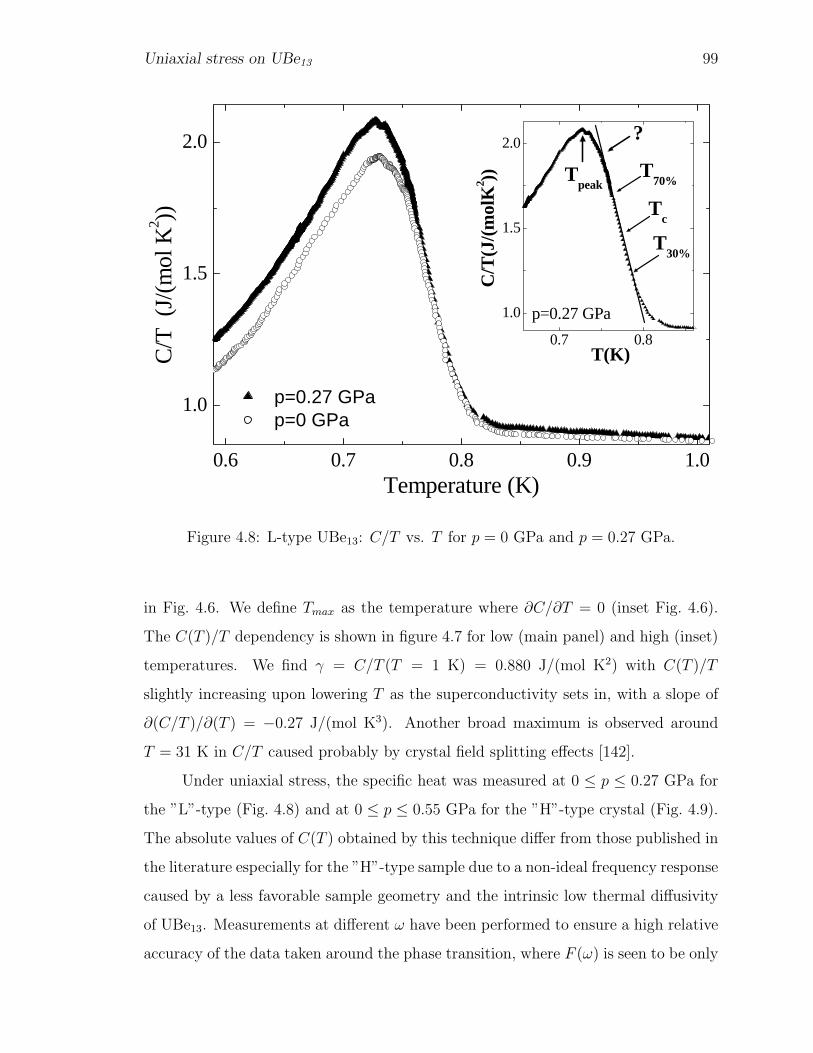
Uniaxial stress on UBe13 99
0.6 0.7 0.8 0.9 1.0
1.0
1.5
2.0
p=0.27 GPa p=0 GPa
C/T
(J/(m
ol K
2 ))
Temperature (K)
0.7 0.8
1.0
1.5
2.0
Tpeak
?
T30%
T70%
Tc
C/T
(J/(m
olK
2 ))
T(K)
p=0.27 GPa
Figure 4.8: L-type UBe13: C/T vs. T for p = 0 GPa and p = 0.27 GPa.
in Fig. 4.6. We define Tmax as the temperature where ∂C/∂T = 0 (inset Fig. 4.6).
The C(T )/T dependency is shown in figure 4.7 for low (main panel) and high (inset)
temperatures. We find γ = C/T (T = 1 K) = 0.880 J/(mol K2) with C(T )/T
slightly increasing upon lowering T as the superconductivity sets in, with a slope of
∂(C/T )/∂(T ) = −0.27 J/(mol K3). Another broad maximum is observed around
T = 31 K in C/T caused probably by crystal field splitting effects [142].
Under uniaxial stress, the specific heat was measured at 0 ≤ p ≤ 0.27 GPa for
the ”L”-type (Fig. 4.8) and at 0 ≤ p ≤ 0.55 GPa for the ”H”-type crystal (Fig. 4.9).
The absolute values of C(T ) obtained by this technique differ from those published in
the literature especially for the ”H”-type sample due to a non-ideal frequency response
caused by a less favorable sample geometry and the intrinsic low thermal diffusivity
of UBe13. Measurements at different ω have been performed to ensure a high relative
accuracy of the data taken around the phase transition, where F (ω) is seen to be only

100 Chapter 4
0.8 0.9 1.0 1.1
1.0
1.2
1.4
1.60.015 GPa0.250 GPa0.400 GPa0.550 GPa
(C/T
) / (C
/T) 1K
Temperature (K)
0.85 0.901.0
1.2
p=0.55GPa
Tpeak
T30%
?
Tc
T70%
(C/T
) / (C
/T) 1K
T (K)
Figure 4.9: H-type UBe13: C/T vs. T normalized to C/T (1 K). Inset: an anomalydevelops at high pressure.
weakly T -dependent. To compensate for a weak p-dependence of F (ω), C/T for the
”H”-type sample has been normalized against C/T at T = 1 K.
At p = 0 the transition width is about ∆T = 46 mK for the ”L”-type crystal
(Tc = 0.775 K) and less than ∆T = 23 mK for the ”H”-type crystal (Tc = 0.925 K).
Tc is taken at 50% of ∆C. The pressure dependence of Tc, together with that of
T30%, T70% (T at 30% and 70% of ∆C) and Tpeak (T at the maximum point of the
transition) are plotted in Fig. 4.10. For the ”L”-type sample, Tc decreases very
slowly with increasing p, ∂Tc/∂p = (8.5 ± 6.8) mK/GPa, in good agreement with
[172]. The ”H”-type sample displays a stronger linear dependence of Tc on p with
∂Tc/∂p = (50±6) mK/GPa. This slope, given the cubic structure, multiplied by 3, is
close to the value reported for hydrostatic pressure of ∂Tc/∂phydrostatic = 160 mK/GPa
[147].
In both cases Tc, T30% and T70% vary almost at the same rate while Tpeak drifts

Uniaxial stress on UBe13 101
0 0.1 0.2 0.3
0.72
0.75
0.78
L-type UBe13
T30%
T70%
Tpeak
TcT
(K)
p (GPa)
0.0 0.2 0.4 0.6
0.88
0.90
0.92
T (K
)
Tpeak
T70%
T30% Tc
H-type UBe13
p (GPa)
Figure 4.10: T (p) phase diagram: Tc, T30%, T70% and Tpeak vs. pressure for both ”L”-and ”H”-type crystals.
away significantly, indicating that the transition becomes broadened at the top. More-
over, a small change of the slope can be seen close to the maximum of the specific

102 Chapter 4
heat at the transition. This feature is marked with ”?” in the insets on Fig. 4.8 and
4.9 and is becoming more pronounced with increasing pressure. This is more clearly
visible in the ”H”-type case where a higher pressure is reached and this feature contin-
uously develops into what could be regarded as a possible onset of a phase transition
splitting (Fig. 4.9). Is should be mentioned that in the previous measurement of
Reinders et al. [172], in the same pressure cell, with uniaxial stress along the [110]
axis, no signature of a splitting or broadening of the transition has been observed up
to p = 0.68 GPa. Their sample geometry was closer to our ”L”-type crystal, therefore
much longer than the ”H”-type crystal we measured. In all cases the longer side of
the sample is parallel with the applied force. Bulging resulting in pressure anisotropy
is more probable to occur in longer samples. The fact that no such effect has been
observed in [172] might be taken as an indication that the small feature we observed
at the top of the transition might be indeed a genuine splitting. However, the effect
is very small (≈ 0.01 K/GPa) compared with the predicted value (0.5 K/GPa [11]).
It should also be emphasized that the theoretically calculated value is only a rough
estimation based on the elastic constants in pure Be and that the real splitting rate,
if any, might be considerably different.
4.5.1 Conclusions
Despite these observations, no unambiguous double structure could be detected so
far for the ”L”-type samples within our measurement resolution (∆Tac ∼ 1 mK on
top of the transition). Moreover, the tiny splitting of Tc for the ”H”-type sample has
to be regarded carefully. Though improbable for such a small sample in this pressure
range, a bulging of the sample which would induce a slight pressure inhomogeneity can
not be completely ruled out. A lack of splitting could imply that: (1) the induced
strain is still too small; (2) the order parameter is single component rather than
multi-component; (3) depending on the details of the free energy fourth-order cross-
terms may pin the order parameter at the higher temperature phase transition [11,
12] preventing the occurrence of the other one even for a multi-component order
parameter.

Chapter 5
Interplay of superconductivity andcharge-density wave instability inTlxV6S8
5.1 Introduction
For systems which display both superconductivity and charge-density wave (CDW)
phenomena, superconductivity sets in from an already gapped normal state. It is
important to understand, if the electron-hole gapping is detrimental or favorable to
the SC state formation. The opening of a partial dielectric gap was shown to cause
destructive effects on Cooper pairing [174–176] and, consequently, a direct way to
enhance the superconducting transition temperature, Tc, would be to avoid the CDW
formation. The model of partial gapping [177, 178] explains many of the characteristic
features observed experimentally in CDW superconductors. However, there is also
an opposite standpoint, according to which Tc is enhanced by the singular electron
density of states near the dielectric gap edge [179–181]. This latter scenario, based
on the model of the doped excitonic insulator with complete gapping [182] has not
been verified experimentally so far.
The interplay of superconductivity and CDW instability remains therefore of
great importance both theoretically and experimentally. In the following we study
the properties of the SC and CDW states in TlxV6S8 compounds.
103

104 Chapter 5
5.1.1 Crystal structure
TlV6S8 is a metallic system which has a quasi-one-dimensional structure based on
hexagonal cells of the Nb3X4-type (P63 space group) [183]. VS6 distorted octahe-
dra are connected by shared edges and faces building up large hexagonal tunnels
along the c-axis (Fig. 5.1). These tunnels are empty for the binary Nb3X4 structure
but for TlV6S8, Tl-atoms are confined inside forming one-dimensional chains [183].
In addition, V-atoms are arranged in zigzag chains possessing a rather small inter-
atomic distance (0.286 nm) comparable to the one found in the pure vanadium metal
(0.261 nm). These zigzag-chains run along the c-axis as well and are well separated
one to each other (Fig. 5.1, lower panel).
However, little is known about the electronic structure of this compound and
scarce previous reports regarding its physical properties are often not in good agree-
ment mainly due to the increased difficulty to grow high quality single crystals.
5.1.2 Possible charge-density wave formation in TlxV6S8
A slight change in the curvature for ρ(T ) at T = TCDW
with 150 K < TCDW
< 170 K
[184] and a simultaneous drop in the magnetic AC susceptibility χ(T ) [185] indicate
a loss in density of states (DOS). This, coupled to a first-order structural phase tran-
sition revealed by X-ray measurements [186] and a sharp anomaly accompanied by
latent heat in differential-scanning calorimetry (DSC) [184, 185] in the same tem-
perature range, indicate the possible formation of a charge-density wave instability
in this compound. Such an opening of a partial gap in the DOS is corroborated by
calculations of the electronic band structure [187], which confirm nesting conditions
for at least four characteristic wave vectors k as can be seen in Fig. 5.2. The band
labeled 1 has considerable parallel regions connected by a nesting vector k along the
Γ-A direction. For the same k direction there are also less prominent nesting regions
of the band 3 sheet near the K point and to a lesser extent close to Γ. Also nesting
conditions are fulfilled close to Γ for the bands 2 and 4.
Preliminary electron diffraction measurements reveal the existence of satellite

SC and CDW in TlxV6S8 105
Tl V S
Tl V S
Figure 5.1: TlV6S8 crystal structure. Upper panel: VS6 octahedra linked togetherforming large hexagonal tunnels along the c-axis. Lower panel: V-V zigzag chains arewell separated one to each other.

106 Chapter 5
K Γ
H A H
K
A H H
1
2 43
Figure 5.2: Fermi-surface sheets in the Γ-A-H-K plane. Nesting conditions are fulfilledfor at least four wave vectors as explained in the text. Ref. [187].
spots at T < TCDW
in addition to the main diffraction spots observed at low-T [184],
similar to what was found for the CDW-compounds Nb3Te4 [188] and InNb3Te4 [189].
Moreover, the formation of a CDW state was suggested also for the iso-structural com-
pounds AV6S8 with A = In, K, Rb and Cs and also for V6S8. This is an indication that
the CDW instability might be a general feature of the whole sulfide series. The ρ(T )
dependency for selected members of the series is depicted in Fig. 5.3. An enhancement
of ρ(T ) is observed for all the investigated compounds suggesting a reduction in the
carrier density. The strongest anomaly with a clear hysteresis of about ∆T ≈ 40 K
is found for the In compound.
5.1.3 Superconductivity in TlxV6S8
Despite the partial gapping at T < TCDW
, TlxV6S8 adopts a superconducting ground
state at much lower temperatures. The superconductivity at Tc ≈ 3.5 K was ini-

SC and CDW in TlxV6S8 107
Figure 5.3: The ρ(T ) dependency for different compounds of the AV6S8 series.Ref. [184]. For all the compounds an anomaly is observed in the high temperaturerange.
tially observed in 1995, in resistivity measurements on single crystals of Tl0.1V6S8
and Tl0.8V6S8 by Bensch et al. [190] and has been confirmed more recently by suscep-
tibility studies on poly-crystalline samples [184, 191]. Similar to the high temperature
anomaly, superconductivity is found to be a common feature among the members of
the AV6S8 family as it is observed for intercalated Tl, In, K, Rb or Cs and also for
the parent compound V6S8. At low temperatures all samples showed perfect diamag-
netism (Fig. 5.4) and this was taken as an indication that superconductivity is a bulk
property in this class of materials [184]. As the SC state sets in, a stepwise drop in
susceptibility is reported for all the poly-crystalline samples [184, 191]. This feature
is strongly influenced by the mechanical and thermal treatment received by the sam-
ples, being much reduced for the sintered ones. It was argued by Fujii et al. [191] that
the higher temperature drop is a signature of intra-grain superconductivity while the
low-T drop corresponds to the inter-grain transition temperature.
For TlxV6S8, a significant anisotropy is observed for the upper critical field Bc2
determined from resistivity measurements on single crystals [190]. For Tl0.8V6S8 for
B ‖ c, B‖c2(0) ≈ 7 T while for B ⊥ c, B⊥
c2(0) ≈ 2.4 T. The yielded anisotropy is
B‖c2(0)/B⊥
c2(0) ≈ 2.9. This value seems to decrease slightly upon reducing the Tl
content of the crystal [190]. Single crystal X-ray investigations reveal a reduction

108 Chapter 5
Figure 5.4: Temperature variations of the AC susceptibility for AV6S8 compounds.A clear stepwise decrease is observed for RbV6S8 and V6S8 samples. Ref. [184].
for the separation of the V-V zigzag chains upon decreasing Tl content [190]. The
coherence lengths for the different field orientations are: ξ‖ ≈ 164 A and ξ⊥ ≈
60 A almost unaffected by the amount of the intercalated Tl [190].
5.2 Interplay of SC and CDW in TlxV6S8
Even though bulk SC still has to be confirmed by Meissner effect or specific heat mea-
surements, it appears challenging to understand how SC competes with the formation
of the CDW. Moreover, if the CDW transition could be suppressed, an increase of Tc
due to the increase of the DOS is expected. This is the aim of our studies of TlxV6S8
at different Tl-chain filling x and under hydrostatic pressure. In the following we
present a thorough investigation of the atmospheric pressure properties by specific
heat, resistivity and magnetization measurements together with a resistivity study
under pressure.

SC and CDW in TlxV6S8 109
5.2.1 Experimental setup
TlxV6S8 (x = 0.1, 0.15, 0.25, 0.47, 0.63 and 1) samples were pressed from powder1
s into pellets and than sintered in closed silica tubes at T = 800oC for seven days.
A scanning electron microscope image of the powdered TlV6S8 sample, depicted in
Fig. 5.5, clearly shows that the sample consists of small rod-like single crystals with
lengths of roughly 10− 30 µm and 2− 5 µm in diameter.
Figure 5.5: Scanning electron microscope image of the powdered TlV6S8 sample.Ref. [191].
During the sintering process the size of the crystals increases substantially and
they start to merge. The actual sample composition for each nominal concentration
was confirmed by X-ray and microprobe analysis.
For the resistivity experiments, the samples were cut in parallelepiped shape
and on the clean surfaces gold wires were connected with gold paste. Standard four-
probe AC resistivity measurements were performed at ambient pressure for all samples
(0.35 K < T < 300 K). In addition, for x =1, 0.15, 0.47 and 0.63, the resistivity,
ρ(T ), was measured under hydrostatic pressure in a newly developed, double-wall,
piston-cylinder type pressure cell at pressures up to p = 2.5 GPa. The pressure cell,
described in the introductory part of this work, was designed to fit in a commercially
1The powder samples were prepared in the group of Prof. H. D. Hochheimer at Colorado State
University, Fort Collins, USA.

110 Chapter 5
Quantum Design PPMS. We used as pressure transmitting medium a mixture of n-
pentane and iso-pentane which ensures excellent hydrostatic conditions. The shift of
the superconducting transition temperature Tc of a Pb sample, used as manometer,
was determined in a four-probe AC resistivity measurement and than converted into
pressure using the Tc(p) calibration from Ref. [60]. No pressure gradient was observed
in the cell as the Pb sample was mounted along the whole sample space and its su-
perconducting transition width remained narrow (∆Tc ≈ 5 mK) and almost pressure
independent.
Specific heat measurements employing a relaxation method (Quantum Design
PPMS), were carried out at atmospheric pressure for the x = 0.47 and x = 0.63
concentrations. The weight of the samples were 5.23 mg and 86.97 mg, respectively.
Moreover, DC magnetization measurements in a SQUID magnetometer (Quantum
Design MPMS) and differential scanning calorimetry studies where performed for the
x = 0.63 sample.
All the measurements (resistivity at all pressures, specific heat and magnetiza-
tion) were performed both while cooling down and warming up in order to check for
thermal hysteresis.
5.2.2 Influence of Tl content
For all Tl compositions studied, the resistivity measurements at ambient pressure
showed an anomaly at T = Tl upon cooling down and at T = Th while warming up
(Fig. 5.6). The size of this anomaly varies strongly with the Tl content. Tl and Th
are defined as the temperatures where ∂ρ/∂T reaches a minimum while cooling down
and warming up, respectively (Fig. 5.7). In the warming up temperature sweeps,
ρ(T ), increases with higher absolute values around Th than during cooling down. A
clear thermal hysteresis (inset Fig. 5.6) which varies with the composition, is visible
for all samples indicating a first-order phase transition. The resistivity measurements
in magnetic field (not presented here) showed that both, the size of the transition
anomaly and Th are very robust against magnetic field as no effect was observed
up to B ≈ 7 T. Tl and Th show a slight dependence on Tl concentration; they are

SC and CDW in TlxV6S8 111
0 50 100 150 200 250 3000
0.5
1.0
Tl0.25V6S8 Tl0.47V6S8 Tl0.63V6S8 TlV6S8
ρ/ρ 30
0K
T (K)
140 160 180 2000.7
0.75
0.80
0.85
ρ/ρ 30
0K
T (K)
Figure 5.6: ρ(T )/ρ(300K) dependency for different Tl concentrations. A clearanomaly and thermal hysteresis (inset) are visible for all the samples in the hightemperature range.
continuously reduced upon increasing x up to x = 0.63 and than enhanced again at
x = 1 (Table 5.1).
Table 5.1: Th and Tl for different Tl concentration.
x 0.1 0.15 0.25 0.47 0.63 1
Th (K) 179 175 172 170 169 178
Tl (K) 169 166 165 157 158 170
The strongly enhanced anomaly observed for Tl0.47V6S8 corresponds to an in-
crease in resistivity of about 36 %. Remarkably, this is the only composition, which
does not display any signature of superconductivity. This might be taken as an

112 Chapter 5
140 150 160 170 180
-4
0
4
8
Tl Th
Tl0.63V6S8
∂ρ/∂T
(µΩ
cm/K
)
T (K)
Figure 5.7: Tl and Th are defined as the temperatures where ∂ρ/∂T (T ) has a localminimum. Exemplified for Tl0.63V6S8.
indication that the gap opened at the Fermi-surface due to the CDW instability is
detrimental to SC. Moreover, a slight upturn of ρ(T ) could be observed for this sample
at T < 2 K.
Zero resistivity in the temperature range of our cryostat, T ≥ 0.35 K, was
found only for x = 0.25, 0.63 and 1 at Tc = 2.41 K, 3.05 K and 1.72 K, respectively
(Fig. 5.8). For x = 0.10 and 0.15, only the onset of superconductivity is visible below
T ≈ 3.5 K. A two-step transition as shown for TlV6S8 in the inset of Fig. 5.8 was also
reported previously by Fujii et al. [191] and attributed to different Tc values for the
intra-grain and inter-grain superconductivity. The upper temperature step is related
to intra-grain SC while the zero resistance needs the development of inter-grain SC
[191]. For x = 0.25 and x = 0.63, ρ(T ) drops to zero in one step. The width of

SC and CDW in TlxV6S8 113
0 10 20 30 400
0.3
0.6ρ/ρ 30
0K
T (K)
Tl0.1V6S8 Tl0.15V6S8 Tl0.25V6S8 Tl0.47V6S8 Tl0.63V6S8 TlV6S8
Figure 5.8: Low temperature dependency of ρ(T ) for different Tl contents. Zeroresistivity is observed only for x = 1, 0.25 and 0.63. An onset of the SC transition isdisplayed by the x = 0.1 and x = 0.15 samples, while for x = 0.47 no trace of SC isobserved. Inset: Two-step SC transition for x = 1.
the superconducting phase transition ∆Tc, is relatively large: ∆Tc ≈ 1 K for x = 1,
∆Tc ≈ 0.5 K for x = 0.25 and ∆Tc ≈ 0.4 K for x = 0.63. The strong variation
of the normal state resistivity value among the measured samples could be related
to the way the samples were prepared, especially to the mechanical treatment. The
transition is sharper and the resistivity value just above the SC transition is lower for
those samples for which a higher force was used for pressing the pellets: x = 0.25 and
x = 0.63 (see the inset of Fig. 5.8). For all x, the SC upper critical fields are around
Bc2(0) ≈ 3 T.
The high temperature anomaly is also clearly evidenced by susceptibility mea-
surements. A significant jump in χ(T ) is observed upon cooling (T ≈ Tl) and warming
(T ≈ Th) as depicted in Fig. 5.9. We define Th and Tl as local maxima in ∂χ(T )/∂T
upon cooling down and warming up, respectively (inset Fig. 5.9). The yielded val-

114 Chapter 5
100 150 200
1.5
1.8
2.1Tl0.63V6S8
χ (a
rb. u
nits
)
T (K)
150 160 170 180
0
4
ThTl
∂χ/∂
T (a
rb. u
nits
)
T (K)
Figure 5.9: χ(T ) for Tl0.63V6S8. A significant jump in χ(T ) is observed upon cooling(T ≈ Tl) and warming (T ≈ Th). Inset: Tl and Th defined as local maxima in∂χ(T )/∂T upon cooling and warming, respectively.
ues are the same as those found in the resistivity measurements: Tl = 158 K and
Th = 169 K.
The high temperature dependence of the susceptibility follows a Curie-Weiss
law, above Tl. The saturation seen below T ≈ 140 K can be regarded as an indication
for Pauli paramagnetism. The drop in the susceptibility below T = Tl is about 28%
for the Tl0.63V6S8 sample. This indicates an important reduction in the density of
states at the Fermi-level as the susceptibility is given by:
χPauli = µ2BN(EF )
NA
M[192], (5.1)
where µB is the Bohr magneton, N(EF ) is the density of states at the Fermi-level
EF , NA is the Avogadro number and M is the molar mass. Therefore, the density
of states reduces by roughly 30% upon opening the CDW gap at Tl. The effective

SC and CDW in TlxV6S8 115
140 160 180 200 220
1.3
1.4
1.5
1.6
140 160 180 200 220200
220
240
260
280
Tl
Th
Tl0.63V6S8
Cp/T
(J/m
ol K
2 )
T (K)
Cp (J
/mol
K)
T (K)
Figure 5.10: The C(T )/T dependency for Tl0.63V6S8 shows a clear signature of thehigh-T anomaly. Inset: C(T ) for the same Tl content.
reduction obtained from equation 5.1 is
∆N(EF ) ≈ 0.83× 10¹⁷ states/(J molecule). (5.2)
Moreover, the high temperature anomaly is detected also in the specific heat
measurements. The results obtained for x = 0.63 are presented in Fig. 5.10. Similar
results, not shown here, are found for the x = 0.47 sample. The Tl and Th temper-
atures, determined from the resistivity and as well from the susceptibility measure-
ments, are depicted by arrows in Fig. 5.10. Th corresponds well to the temperature of
the maximum in C/T upon warming up, while Tl is placed at slightly lower T than
the corresponding cooling down maximum in C/T situated at T = 161 K. However,
in the latter case the anomaly in specific heat is much broader. The height of the
anomaly at T = Th is strongly enhanced compared to the one at T = Tl and the shape

116 Chapter 5
3.0 3.5 4.0 4.5 5.0
0.48
0.50
0.52 Tl0.63V6S8
C/T
(J/(m
ol K
2 ))
T (K)
0 5 10 15 200
5
10
15
C (J
/(mol
K))
T (K)
Figure 5.11: The low temperature C(T )/T dependency in Tl0.63V6S8 revealing thesuperconducting phase transition. Inset: C(T ) for the same sample.
of the anomaly becomes reminiscent of a first-order phase transition upon warming
up. The jump in the specific heat at Th is
∆C ≈ 15 J/(mol K). (5.3)
Furthermore we were able to probe the superconducting state employing a spe-
cific heat measurement. It is natural that the occurrence of two gaps on the Fermi-
surface, one superconducting and the other dielectric, will change the thermody-
namic properties of a CDW superconductor compared to the conventional BCS ones.
In the case of CDW superconductors the formation of electron-hole pairs leads to
∆(0)/(kBTc) always smaller than the BCS value of 1.76, where ∆(0) and Tc are the

SC and CDW in TlxV6S8 117
superconducting energy gap and the SC transition temperature, respectively [193].
The T -dependence of the specific heat for a CDW superconductor is also influenced
by the high temperature gap [194, 195]. The specific heat jump at Tc is reduced rel-
ative to the BCS relation by a main correction quadratic in Tc/∆CDW , where ∆CDW
is the charge-density wave gap [193]. Cases of CDW superconductors for which the
heat capacity reveals no anomaly as the SC state sets in, are not rare. For example
the ceramic BaPb1−xBixO3 with x = 0.25 reveals no signature of SC in calorimetric
measurements [196] but a partial removal of the CDW gapping in this compound
results in the appearance of a jump in the specific heat at Tc [197, 198]. ∆C/(γTc)
ratios considerably lower than the correspondent BCS value of 1.43 are found for a
vast series of CDW superconductors: Li1.16Ti1.84O4 (∆C/(γTc) ≈ 0.6) [199], Nb3S4
(∆C/(γTc) ≈ 1.11) [200], Nb3Se4 (∆C/(γTc) ≈ 0.66) [200], Nb3Te4 (no trace of SC
in specific heat) [200], etc..
Our specific heat study on Tl0.63V6S8 reveals unambiguously an anomaly as the
system enters from the normal, but partially gapped state, into the superconducting
phase (Fig. 5.11). The SC transition temperature Tc = 3.39 K determined using an
equal-area construction, corresponds to the onset of the resistivity drop observed at
Tc. The transition width is ∆T ≈ 0.3 K and the magnitude of the normalized jump
∆C/(γTc) estimated also using the equal-area construction has a small value of only
∆C/(γTc) ≈ 0.08. (5.4)
However, as already mentioned above, finding such a reduced ∆C/(γTc) is not sur-
prising for a CDW superconductor.
In the normal state, the specific heat is almost linear in temperature up to
T = 12 K (inset Fig. 5.11). Assuming for the low-T normal state
C = γT + βT 3, (5.5)
C/T is plotted as function of T 2 in order to estimate the specific heat electronic (γ)
and phononic (β) terms (Fig. 5.12). The dashed line represents the least-squares fit
to the normal state data which yields:

118 Chapter 5
0 5 10 15 20 25
0.4
0.5 C=γT+βT3
Tl0.63V6S8
γ = 447 mJ/(mol K2)β = 1.9 mJ/(mol K4)
C/T
(J/(m
ol K
2 ))
T2 (K2)
Figure 5.12: C/T as function of T 2. A linear fit (dashed line) in the normal stateyields the γ = 447 mJ/(mol K2) and β = 1.9 mJ/(mol K4).
γ = 447 mJ/(mol K2),
β = 1.9 mJ/(mol K4).
The Debye temperature ΘD is given by:
ΘD = 3
√12π4nR
5β, (5.6)
where R is the general gas constant and n is the number of atoms per molecule. This
expression gives ΘD = 246 K, using n = 14.63 for Tl0.63V6S8 and our experimental
value of β.
The electron-phonon coupling constant, λ, can be evaluated using the McMillan
expression [201]:
Tc =ΘD
1.45exp
[− 1.04(1 + λ)
λ− µ∗(1 + 0.62λ)
], (5.7)

SC and CDW in TlxV6S8 119
where µ∗ denotes the Coulomb repulsion between electrons. An accurate value of µ∗
is difficult to obtain. For simple elements it might be determined from the isotope
shift. However, it was argued by McMillan that µ∗ ranges from µ∗ = 0.1 for nearly
free electron metals to µ∗ = 0.13 for transitional metals [201]. Using this latter value
in equation 5.7 with Tc = 3.39 K, and the experimental ΘD = 246 K we obtain
λ = 0.61. This is very close to the value of λ = 0.61 estimated for the metallic V
[201].
The Sommerfeld coefficient γ is related to the electronic density of states at the
Fermi-level N(EF ) by:
γ =2
3π2k2
B(1 + λ)NAN(EF ). (5.8)
This gives N(EF ) = 5.9× 10²⁰ states/(J molecule).
Table 5.2: Thermodynamic properties obtained from the specific heat measurementsfor Tl0.63V6S8.
Tc (K) 3.39
∆CγTc
0.08
γ ( mJ/(mol K2) ) 447
β ( mJ/(mol K4) ) 1.9
ΘD (K) 246
λ 0.61
N(EF ) (states/J molecule) 5.9× 10²⁰
〈a2〉 0.24
∆0
kBTc1.14
Little is known about the symmetry of the gap. However, the low-dimensional
structure and the anisotropic gap found in the related compounds Nb3S4 [202] and
Nb3Se4 [200] suggest that the gap might be anisotropic in TlxV6S8 as well. When
the symmetry of the energy gap is reduced, the thermal selection allows, at low-T ,
that the states corresponding to the regions on the Fermi-surface with a smaller gap

120 Chapter 5
to contribute to the electronic specific heat. The effect of the anisotropy on the
thermodynamic properties of superconductors has been analyzed by J. R. Clem [203]
who has suggested the following modifications to the BCS predictions:
∆0
kBTc
= 1.764
(1− 3
2〈a2〉
), (5.9)
∆C
γTc
= 1.426(1− 4〈a2〉
), (5.10)
where ∆0 is the averaged energy gap at T = 0 K and the mean-squared anisotropy 〈a2〉
is the average over the whole Fermi-surface of the square of the energy gap deviation
from its average value. From equation 5.10 we obtain 〈a2〉 = 0.24, significantly higher
than 〈a2〉 = 0.07 for Nb3S4 [200], 〈a2〉 = 0.14 for Nb3Se4 [200] or 〈a2〉 = 0.04 for the
layered compound 2H-NbSe2 [204]. With increasing lattice anisotropy, the 〈a2〉 value
is enhanced. Therefore, the high value we found might be due to the pronounced
one dimensional character of the electronic structure of TlxV6S8. Replacing 〈a2〉 in
equation 5.9 we estimate an normalized average energy gap of
∆0
kBTc
= 1.14 (5.11)
for Tl0.63V6S8, smaller than the 1.76 value expected for a BCS superconductor. The
results obtained from the low temperature specific heat measurements for Tl0.63V6S8
are summarized in the Table 5.2. Our results suggest that this compound is a highly
anisotropic and weak coupling superconductor.

SC and CDW in TlxV6S8 121
5.2.3 Influence of pressure on the charge-density wave insta-
bility and on the superconductivity
It is of great importance to determine in which way the superconductivity and the
charge-density wave instability interfere with each other. Pressure, in general, has
an important effect on the CDW state being an ideal tool to explore the interplay
between the two ground states. In the following we will concentrate on the study
of resistivity under hydrostatic pressure for the Tl0.63V6S8 compound which displays
both, CDW and complete SC. The results obtained for x = 0.15 and x = 0.47 under
pressure are only mentioned briefly.
Upon applying hydrostatic pressure, the size of the CDW anomaly is gradually
reduced together with a decrease of Tl and Th (Fig. 5.13). The hysteretic behavior in
0 50 100 150 200 250 3000
0.2
0.4
0.6
0.8
1.0 0 GPa 1.04 GPa 1.15 GPa 1.26 GPa 1.75 GPa 1.97 GPa
Tl0.63V6S8
ρ/ρ 3
00Κ
T (K)
50 100 150
0.5
0.6
0.7
ρ/ρ 3
00Κ
T (K)
Figure 5.13: Temperature dependence of the normalized resistivity at different pres-sures for Tl0.63V6S8. The size of the CDW anomaly as well as the transition temper-ature decreases with increasing pressure and is finally completely suppressed.

122 Chapter 5
0 50 100 150 200 250 300
0.5
1.0
100 150 200
0.70
0.75
0.80
Tl0.15V6S8
0 GPa 0.3 GPa 0.7 GPa 1.0 GPa 1.9 GPa
ρ/ρ 30
0K
T (K)
ρ/ρ 30
0K
T (K)
0 50 100 150 200 250 300
0.4
0.8
1.2 Tl0.47V6S8
ρ/ρ 30
0
T (K)
p= 0 GPa p= 1.1 GPa p= 1.4 GPa p= 1.9 GPa
Figure 5.14: Temperature dependence of the normalized resistivity at different pres-sures for TlxV6S8 (top: x = 0.15; bottom: x = 0.47). The size as well as the transi-tion temperature decreases with increasing p and is finally completely suppressed forx = 0.15.

SC and CDW in TlxV6S8 123
resistivity is maintained up to p = 1.26 GPa. Above this pressure, which corresponds
to a Tl = 95 K, any signature of the anomaly upon cooling down is difficult to
be resolved unambiguously. However, the anomaly is still visible in the warming
up measurements where the CDW formation can be followed up to p = 1.71 GPa
corresponding to Th = 67 K. For even higher p, no anomaly is found anymore, leading
us to the conclusion that the CDW phase transition is suddenly suppressed at elevated
p. We estimate a critical pressure for the vanishing of the CDW state of about
pc = (1.85± 0.12) GPa.
A similar suppression of the CDW transition temperature is observed also for
x = 0.15 and x = 0.47 (Fig. 5.14). For x = 0.15 the estimated critical pressure
is pc = (1.7 ± 0.2) GPa, while for the x = 0.47 sample the CDW transition is not
suppressed up to p = 1.9 GPa, the highest pressure achieved in the employed pressure
cell.
Only the onset of the superconductivity is observed for x = 0.15 and its tem-
perature is only slightly decreasing with pressure. For x = 0.47 no signature of
superconductivity is observed up to p = 1.9 GPa . The absolute values of the resis-
tivity in the low-T range are strongly influenced by the CDW transition temperature
for both x = 0.15 and x = 0.47.
Zero resistivity is observed for the x = 0.63 sample at all pressures (Fig. 5.15).
Upon increasing p, the superconducting transition is moved to lower temperatures
from Tc = 3.05 K at atmospheric pressure down to Tc = 1.09 K at the maximum
achieved pressure p = 2.5 GPa. Here, Tc is defined as the temperature where ρ(T )
drops to zero. The transition width (∆Tc ≈ 0.4) remains unaffected by pressure. A
slight decrease with p can be observed for the resistivity value in the normal state,
ρ0, immediately above the SC transition. Moreover, an additional tiny anomaly, not
present at ambient pressure, starts to be visible around T = 4.5 K, already under a low
pressure of p = 0.18 GPa. The temperature where this anomaly occurs decreases then
slowly with increasing p (inset Fig. 5.15). The temperature of the anomaly does not
correspond to any of the superconducting phase transitions at atmospheric pressure
in elemental Tl (Tc = 2.3 K [205]) or V (Tc = 5.3 K [206, 207]). In addition, no

124 Chapter 5
0 1 2 30
0.1
0.2
2 4 60.14
0.16
0.18Tl0.63V6S8
0.18 GPa 0.73 GPa 1.04 GPa 1.15 GPa 1.26 GPa 1.81 GPa 2.08 GPa 2.52 GPa
pρ/ρ 30
0K
T (K)
ρ/ρ 30
0K
T (K)
Figure 5.15: The low-T normalized resistivity showing the superconducting transitionin Tl0.63V6S8 at different pressures. Inset: a small anomaly above T = Tc, depictedby the arrow is visible under pressure
trace of magnetic order has been revealed by susceptibility measurements at ambient
pressure. The nature of this feature remains to be investigated in future studies.
The pressure dependence of Tc, Tl and Th are depicted for the Tl0.63V6S8 sample
in the phase diagram shown in Fig. 5.16. Tl and Th are decreasing linearly at low p
with an initial slope of
∂Tl
∂p≈ ∂Th
∂p= −44 K/GPa. (5.12)
The superconducting transition temperature first decreases suddenly from ambient
pressure to p = 0.18 GPa and then, at higher pressures, is further reduced linearly
with a slope∂Tc
∂p= −0.6 K/GPa. (5.13)
Remarkably, the complete suppression of the CDW instability at the estimated
critical pressure pc = (1.85±0.12) GPa leads to an enhancement of Tc of approximately

SC and CDW in TlxV6S8 125
0.0 0.5 1.0 1.5 2.0 2.5 3.00
50
100
150
Tl0.63V6S8
SC
CDW
20 x Tc
Tl
ThT
(K)
p(GPa)
1.0 1.5 2.0 2.51.0
1.5
2.0 Th
Tc
CDW
SC
T(K
)
p(GPa)
Figure 5.16: Phase diagram for Tl0.63V6S8. The CDW instability is completely sup-pressed at a critical pressure pc = (1.85±0.12) GPa and concomitantly Tc is enhanced(inset). The dashed lines are guides for the eye.
Tc|p=1.97 GPa − Tc|p=1.81 GPa ≈ 120 mK (inset Fig. 5.16). This is an indication that
the relation between CDW and SC gap is antagonistic. However, pressure is strongly
detrimental to both of the anomalies therefore the enhancement of Tc at p ≈ pc due
to the increase in the density of states is relatively small.
Above p = 2 GPa, Tc starts to decrease again, at an accelerated pace:
∂Tc
∂p= −0.8 K/GPa. (5.14)
A linear extrapolation of Tc(p) would yield, as zero T interception, a critical pressure of
about pSCc = 3.9 GPa. However, most likely the SC will be suppressed at significantly
lower pressures (|∂Tc
∂p| shows already an increasing tendency), as suggested by the
dashed line in Fig. 5.16.
The enhancement of the resistivity at Tl and Th results from the decrease of the

126 Chapter 5
0 0.5 1.0 1.5 2.00
0.02
0.04
0 0.5 1.0 1.5 2.00
0.1
0.2
0.3
Tl0.63V6S8
α
p (GPa)
Tl0.47V6S8
α
Figure 5.17: α(p) dependence for Tl0.63V6S8 and Tl0.47V6S8 samples. For bothcompounds, α(p) is almost constant at low pressure but decreases abruptly abovep ≈ 0.9 GPa.
carrier density as the CDW gap opens at the Fermi-level. The size of the relative
resistivity increase can be defined as:
α =ρ
CDW− ρn
ρCDW
=σn − σ
CDW
σCDW
, (5.15)
where ρCDW
is the resistivity value on top of the CDW anomaly while ρn is the
resistivity value expected at the transition temperature in the absence of the CDW
formation. ρn is determined by extrapolating the high-T ρ(T ) curve down to the
CDW transition temperature. σCDW
and σn are the conductivities corresponding to
ρCDW
and ρn, respectively. In a metal the conductivity is in general given by
σ ∼ N(EF )e2vF τ, (5.16)
where N(EF ) is the density of states at the Fermi-level and vF and τ are the Fermi
velocity and the relaxation time of the conduction electrons, respectively.

SC and CDW in TlxV6S8 127
If we assume that the opening of the CDW gap reduces N(EF ) without changing
vF and τ the relation 5.15 can be rewritten as:
α =Nn − (Nn −∆N)
Nn
=∆N
Nn
, (5.17)
where Nn is the density of states at the Fermi-surface in the absence of the CDW
instability and ∆N denotes its reduction after the gap has been opened. Therefore
the fractional increase in the resistance, α, would give information regarding the size
of the gapped area of the Fermi-surface [208, 209].
The pressure dependences of α for x = 0.63 and x = 0.47 are shown in Fig. 5.17.
α is almost pressure independent for both compounds up to p ≈ 0.9 GPa, but de-
creases abruptly above this pressure. The effect of the inter-chain coupling (η) on the
CDW transition temperature has been studied theoretically within the mean-field ap-
proximation by Horovitz et al. [55, 210]. They showed that for a given electron-phonon
coupling constant, λ, TCDW
/TF is almost independent of the inter-chain coupling for
η below a critical value ηc. Nevertheless, above ηc, TCDW
/TF is suddenly reduced
to zero due to a collapse of the nesting of the Fermi-surface. Within this scenario
the drastic reduction of α only above p ≈ 0.9 GPa might be a consequence of the
inter-chain coupling constant exceeding ηc and thereby rapidly suppressing the CDW
gap. A similar pressure dependence of α(p) has been reported for NbSe3 [211, 212]
and explained within the frame of the theory elaborated by Horovitz et al. [55, 210].
The CDW transition temperature depends also on the electron-phonon coupling
constant:
TCDW
= 5.43 TF exp
(−1
λ
)[210] (5.18)
where TF is the Fermi temperature. The pressure hardening of the bare phonon
spectrum tends to decrease the electron-phonon coupling and, therefore, renders the
lattice distortion less favorable energetically, resulting in a lowering of TCDW
as sug-
gested by equation 5.18.

128 Chapter 5
5.3 Conclusions
The high temperature anomaly observed in the metallic TlxV6S8 has been attributed
to a charge-density wave instability [184]. Its true CDW nature is corroborated by
band structure calculations which reveal nesting conditions [187]. To the best of
our knowledge the first-order character of the high temperature anomaly in TlxV6S8
suggested in Ref. [184, 186] is confirmed for the first time by the observation of a
hysteresis in our resistivity and susceptibility measurements.
Moreover, we report on the first specific heat evidence of the existence of the
CDW (Tl0.47V6S8 and Tl0.63V6S8) and SC transitions (Tl0.63V6S8) in the TlxV6S8
family. A clear hysteresis is as well observed at the high temperature transition in
the specific heat data.
We observed a strong corespondence of the physical properties of TlxV6S8 on
the Tl concentration x. Each sample showed a clear CDW anomaly which is strongly
enhanced at half Tl filling, x = 0.47. This is also the only composition for which no
signature of superconductivity is observed. The specific heat probing the SC phase
in Tl0.63V6S8 suggests that this compound is a highly anisotropic, weak coupling
superconductor.
A first-ever study of resistivity under pressure revealed a rapid suppression of
TCDW
upon increasing p for all samples investigated. For x = 0.63 also the evolution
of the SC transition with p was followed by resistivity. Pressure is detrimental also
to the SC phase as Tc is reduced with increasing p. Nevertheless, as the CDW gap
is closed at the critical pressure pc, the increase in the density of stated leads to
a clear enhancement of Tc suggesting that SC and CDW compete for parts of the
Fermi-surface.
Future systematic studies, on single crystals of TlxV6S8 under pressure in mag-
netic field will shed more light on the physical properties in this already very inter-
esting, quasi one-dimensional class of materials.

Chapter 6
Conclusions
In the present work we explored the FFLO state in CeCoIn5, the effect of uniaxial
stress on the superconducting order parameter symmetry of the cubic UBe13 and
the interplay between superconductivity and a charge-density wave instability in the
low-dimensional metal TlxV6S8.
We have studied the pressure evolution of the superconducting B − T phase
diagram of CeCoIn5 by specific heat measurements. The superconducting transition
temperature is enhanced from Tc = 2.24 K at atmospheric pressure to Tc = 2.58 K
at the maximum pressure achieved, p = 1.34 GPa. The significant anisotropy in the
system present already at ambient pressure, is further enhanced upon increasing p.
For a magnetic field B ‖ (a, b), the upper critical field rises from Bc2(0)|0 GPa = 11.6 T
to Bc2(0)|1.34 GPa = 14.3 T, while for B ‖ c, Bc2(0) is reduced from Bc2(0)|0 GPa =
4.9 T to Bc2(0)|1.34 GPa = 4.2 T. It is important to remark that in the B ‖ c case
upon applying pressure the upper critical field is suppressed while simultaneously Tc
is enhanced; this behavior remains a challenge to understand.
The prerequisites required for the realization of the FFLO state satisfied at
ambient pressure in CeCoIn5 are met under pressure as well: the system remains
in the clean-limit, with `tr/ξ0 even increasing under pressure and the Maki param-
eter α stays well above the minimum required value for the formation of the FFLO
state. The first-order character of the SC phase transition at high magnetic fields for
Tc < T0 is maintained also under pressure. This underlines the fact that the Pauli
paramagnetism remains the main pair-breaking mechanism. T0 is steadily increasing
129

130 Chapter 6
upon applying pressure from T0(0 GPa) = 0.875 K to T0(1.34 GPa) = 1.170 K.
Furthermore, for all investigated pressures, the FFLO anomaly can be followed
as function of magnetic field. With increasing p, the FFLO region in the phase di-
agram expands to higher temperatures and higher fields indicating that the FFLO
state becomes more robust upon reducing the antiferromagnetic fluctuations, as ex-
pected in the frame of the AFM-fluctuations based model proposed in [47]. Our result
provides the first evidence of the existence of this state away from the influence of
the strong magnetic fluctuations, clearly suggesting its true FFLO nature.
We have analyzed the Bc2(T ) data of CeCoIn5, at different pressures, within
the microscopic model developed in Ref. [45, 46] which includes:
a) the layered structure ;
b) dx2−y2 symmetry for the SC order parameter;
c) the Gruenberg-Gunther ansatz.
This model gives an excellent description of the experimental Bc2(T ) curves for both
field orientations. Pronounced changes above p = 0.45 GPa are observed for both
g-factor and the Fermi velocity in the basal plane (a, b).
In the heavy-fermion superconductor UBe13 the uniaxial stress along the crys-
tallographic [100] direction reduces the lattice symmetry from cubic to tetragonal.
For both ”L”- and ”H”-type single crystals the superconducting transition temper-
ature as function of uniaxial stress was probed by AC specific heat measurements.
In both cases Tc is found to be reduced continuously upon increasing the uniaxial
deformation. The superconducting anomaly becomes broader only at the top and a
tiny feature, suggesting a splitting of Tc, is induced at high pressures in both types of
samples. This anomaly is more clearly visible in the ”H”-type sample where higher
pressures were achieved. However, the effect is very small (≈ 0.01 K/GPa) com-
pared to the theoretical estimation (≈ 0.5 K/GPa). Despite these observation, no
unambiguous double structure could be detected in the ”L”-type sample within our

Conclusions 131
measurement. Also the tiny splitting of Tc in the ”H”-type crystal has to be regarded
with caution; a pressure anisotropy effect, though improbable for the given sample
geometry, cannot be completely ruled out. A lack of splitting could imply that:
a) the induced strain is still too small;
b) the order parameter is single component rather than multi-component;
c) depending on the details of the free energy, fourth-order cross-terms may pin
the order parameter at the higher temperature phase transition [11, 12], pre-
venting the other one even for a multi-component order parameter.
The metallic, quasi-1D compound TxV6S8 displays both superconductivity and
a high-T anomaly ascribed to the formation of a charge-density wave [184]. The
CDW nature of this anomaly is corroborated by band structure calculations [187].
We studied the interplay between these two ground states in this compound employ-
ing resistivity (at both, ambient and high pressure), specific heat and susceptibility
measurements. To our knowledge the first-order character of the high temperature
anomaly in TlxV6S8 suggested in Ref. [184, 186] is confirmed for the first time by the
observation of a hysteresis in our resistivity and susceptibility measurements.
In addition, we observed for the first time in this compound the CDW and SC
transition in specific heat measurements. Also here the CDW transition displays a
clear thermal hysteresis. We observed a clear dependence of the physical properties of
TlxV6S8 on the Tl concentration x. The CDW anomaly is present in all investigated
samples being strongly enhanced at half Tl filling, x = 0.47. This is also the only
composition for which no signature of superconductivity is observed. The specific
heat results regarding the SC phase in Tl0.63V6S8 suggest that this compound is a
highly anisotropic, weak coupling superconductor.
A first-time resistivity study under pressure revealed a rapid suppression of
TCDW
upon increasing p for all concentrations investigated (x = 0.15, x = 0.47 and
x = 0.63). Also the pressure evolution of the SC transition was followed by resistivity

132 Chapter 6
measurements for x = 0.63. Pressure is detrimental also to the superconductivity as
the SC transition temperature, Tc, is reduced with increasing p. Nevertheless, as the
CDW gap is closed at the critical pressure pc, the increase in the density of states
leads to a clear enhancement of Tc suggesting that SC and CDW compete for the
same parts of the Fermi-surface.

Appendix:
AC specific heat under uniaxial stress in CeCoIn5
We measured the AC specific heat under uniaxial stress on high quality single
crystals of CeCoIn5. The crystals grow in a plate-like geometry with the small side
along the crystallographic c-axis. The typical sample thickness is only 0.1 mm to
0.3 mm. Therefore, the samples easily brake under uniaxial stress applied in the
(a, b)-plane. In order to prepare a mechanically stable setup we embedded the sample
in a soft epoxy after attaching, on both of its large faces, silver foils used for the
thermal contacts to the heater and thermometer, respectively. Under pressure the
epoxy is deformed plastically and we assumed that all the force applied is kept by
the sample. Therefore, the estimated maximum uniaxial pressure applied along the
a-axis is about pa = 0.7 GPa. The results obtained are depicted in Fig. 6.1.
The superconducting transition Tc is gradually moved to higher temperatures
upon increasing pressure with an initial slope
∂Tc
∂pa
∣∣∣∣pa=0 GPa
= (0.305± 0.010) K/GPa. (6.1)
Tc seems to approach a broad maximum around pa = 0.7 GPa, the highest
pressure achieved. The relative jump in the specific heat is decreasing drastically
under a small uniaxial stress and tends to saturate above pa ≥ 0.3 GPa.

134 Appendix
0.0 0.1 0.2 0.3 0.4 0.5 0.6 0.7
2.24
2.26
2.28
2.30
2.32
1.8 2.1 2.4
0.8
1.0
1.2
1.4
CeCoIn5T
c(K)
pa (GPa)
pa
C/C
2.5K
T (K)
0.0 0.1 0.2 0.30.2
0.4
0.6
0.8
1.0CeCoIn5
(C
s-Cn)| p a /
(Cs-C
n)| 0 G
Pa
pa(GPa)
Figure 6.1: Upper panel: Tc(pa). Inset, upper panel: Temperature dependence of
the specific heat normalized to C(2.5K) at different pressures. Lower panel: Pressure
dependence of the normalized specific heat jump.

Bibliography
[1] C. Petrovic, P. G. Pagliuso, M. F. Hundley, R. Movshovich, J. L. Sarrao, J. D.
Thompson, Z. Fisk, and P. Monthoux, J. Phys.: Condens. Matter 13, L337
(2001).
[2] J. D. Thompson, M. Nicklas, A. Bianchi, R. Movshovich, A. Llobet, W. Bao,
A. Malinowski, M. F. Hundley, N. O. Moreno, P. G. Pagliuso, J. L. Sar-
rao, S. Nakatsuji, Z. Fisk, R. Borth, E. Lengyel, N. Oeschler, G. Sparn, and
F. Steglich, Physica B 329-333, 446 (2003).
[3] A. Bianchi, R. Movshovich, C. Capan, P. G. Pagliuso, and J. L. Sarrao, Phys.
Rev. Lett. 91, 187004 (2003).
[4] H. A. Radovan, N. A. Fortune, T. P. Murphy, S. T. Hannahs, E. C. Palm, S. W.
Tozer, and D. Hall, Nature 425, 51 (2003).
[5] P. Fulde and R. A. Ferell, Phys. Rev. 135, A550 (1964).
[6] A. I. Larkin and Y. N. Ovchinnikov, Pis’ma Zh. Eksp. Teor. Fiz. 47, 1136
(1964), [Sov. Phys. JETP 20, 762 (1965)].
[7] R. Casalbuoni and G. Nardulli, Rev. Mod. Phys. 76, 263 (2004).
[8] B. Golding, D. J. Bishop, B. Batlogg, W. H. Haemmerle, Z. Fisk, J. L. Smith,
and H. R. Ott, Phys. Rev. Lett. 55, 2479 (1985).
[9] V. Muller, D. Maurer, E. W. Scheidt, C. Roth, K. L. Bucher, and H. E. Bommel,
Solid State Commun. 57, 319 (1986).
135

136 Bibliography
[10] M. Sigrist and K. Ueda, Rev. Mod. Phys. 63, 239 (1991).
[11] M. Sigrist, R. Joynt, and T. M. Rice, Europhys. Lett. 3, 629 (1987).
[12] M. Sigrist, R. Joynt, and T. M. Rice, Phys. Rev. B 36, 5186 (1987).
[13] A. M. Clogston, Phys. Rev. Lett. 6, 9 (1962).
[14] B. S. Chandrasekhar, Appl. Phys. Lett. 1, 7 (1962).
[15] G. Sarma, J. Phys. Chem. Solids 24, 1029 (1963).
[16] K. Maki and T. Tsuneto, Prog. Theo. Phys. 31, 945 (1964).
[17] H. Suhl, Low Temperature Physics, Les Houches, Gordon and Breach Publish-
ers, Inc., New York, page 235 (1961).
[18] J. Goldstone, Nouvo Cimento 19, 154 (1961).
[19] J. Goldstone, A. Salam, and S. Weinberg, Phys. Rev 127, 965 (1962).
[20] M. Tachiki, S. Takahashi, P. Gegenwart, M. Weiden, M. Lang, C. Geibel,
F. Steglich, R. Modler, C. Paulsen, and Y. Onuki, Z. Phys. B 100, 369 (1996).
[21] L. G. Aslamazov, Pis’ma Zh. Eksp. Teor. Fiz. 55, 1477 (1968), [Sov. Phys.
JETP 28, 773 (1969)].
[22] H. Burkhardt and D. Rainer, Ann. Phys. 3, 181 (1994).
[23] H. Shimahara, J. Phys. Soc. Jpn. 67, 736 (1998).
[24] R. Combescot and C. Mora, Eur. Phys. J. B 44, 189 (2005).
[25] S. Matsuo, S. Higashitani, Y. Nagato, and K. Nagai, J. Phys. Soc. Jpn. 67, 280
(1998).
[26] M. Houzet, Y. Meurdesoif, O. Coste, and A. I. Buzdin, Physica C 316, 89
(1999).

137
[27] R. Combescot and C. Mora, Eur. Phys. J. B 28, 397 (2002).
[28] R. Combescot and C. Mora, Europhys. Lett. 68, 79 (2004).
[29] C. Mora and R. Combescot, Phys. Rev. B 71, 214504 (2005).
[30] R. Combescot and C. Mora, Phys. Rev. B 71, 144517 (2005).
[31] M. Houzet and A. Buzdin, Phys. Rev. B 63, 184521 (2001).
[32] D. F. Agterberg and K. Yang, J. Phys.: Condens. Matter 13, 9259 (2001).
[33] N. R. Werthamer, E. Helfand, and P. Hohenberg, Phys. Rev. 147, 295 (1966).
[34] K. Maki, Phys. Rev. 148, 362 (1966).
[35] G. Sarma and D. Saint-James, Proceedings of the Conference on the Physics
of Type II Superconductivity, Western Reserve University (1964).
[36] L. W. Gruenberg and L. Gunther, Phys. Rev. Lett. 16, 996 (1966).
[37] K. Maki, Physics 1, 127 (1964).
[38] R. R. Hake, Appl. Phys. Lett. 10, 189 (1967).
[39] K. Yang and S. L. Sondhi, Phys. Rev. B 57, 8566 (1998).
[40] H. Shimahara, Phys. Rev. B 50, 12760 (1994).
[41] For a review, see: K. Maki in Superconductivity II edited by R. D. Parks,
Marcel Dekker, New York, (1969).
[42] K. Gloos, R. Modler, H. Schimanski, C. D. Bredl, C. Geibel, F. Steglich, A. I.
Buzdin, N. Sato, and T. Komatsubara, Phys. Rev. Lett. 70, 501 (1993).
[43] M. A. Baranovn, M. Yu. Kagan, and Yu. Kagan, Pis’ma Zh. Eksp. Teor. Fiz.
64, 273 (1996), [JETP Lett. 64, 301 (1996)].
[44] R. Combescot, Europhys. Lett. 55, 150 (2001).

138 Bibliography
[45] H. Won and K. Maki, Europhys. Lett. 24, 452 (1996).
[46] H. Won, K. Maki, S. Haas, N. Oeschler, F. Weickert, and P. Gegenwart, Phys.
Rev. B 69, 180504(R) (2004).
[47] H. Adachi and R. Ikeda, Phys. Rev. B 68, 184510 (2003).
[48] R. E. Peierls, Quantum Theory of Solids, Oxford University, New York/London,
(1955).
[49] G. Gruner, Rev. Mod. Phys. 60, 1129 (1988).
[50] G. Gruner, Density Waves in Solids, Addison-Wesley, (1994).
[51] M. J. Rice and S. Strassler, Solid State Commun. 13, 1389 (1973).
[52] H. Frohlich, Proc. Roy. Soc. London Ser. A 223, 296 (1954).
[53] J. Solyom, Adv. Phys. 28, 201 (1979).
[54] P. A. Lee, T. M. Rice, and P. W. Anderson, Phys. Rev. Lett. 31, 462 (1973).
[55] B. Horovitz, H. Gutfreund, and M. Weger, Phys. Rev. B 12, 3174 (1975).
[56] W. L. McMillan, Phys. Rev. B 16, 643 (1977).
[57] C. M. Varma and A. L. Simons, Phys. Rev. Lett. 51, 138 (1983).
[58] T. M. Rice and G. K. Scott, Phys. Rev. Lett. 35, 120 (1975).
[59] I. R. Walker, Rev. Sci. Instrum. 70, 3402 (1999).
[60] A. Eiling and J. S. Schilling, J. Phys. F: Metal Phys. 11, 623 (1981).
[61] S. Asgari, E. El-Danaf, S. R. Kalidindi, and R. D. Doherty, Met. Mat. Trans.
A 28A, 1781 (1997).
[62] S. Asgari, E. El-Danaf, E. Shaji, S. R. Kalidindi, and R. D. Doherty, Acta
mater. 46, 5795 (1998).

139
[63] E. M. Shaji, S. R. Kalidindi, and R. D. Doherty, Mat. Sci. Eng. A272, 371
(1999).
[64] E. M. Shaji, S. R. Kalidindi, R. D. Doherty, and A. S. Sedmak, Mat. Sci. Eng.
A340, 163 (2003).
[65] B. Wand, Dissertation, Technische Hochschule Darmstadt, unpublished (1993).
[66] P. F. Sullivan and G. Seidel, Phys. Rev. 173, 679 (1968).
[67] Y. M. Kalychak, V. I. Zaremba, V. M. Baranyak, V. A. Bruskov, and P. Y.
Zavalii, Russ. Metall. 1, 213 (1989).
[68] R. Settai, H. Shishido, S. I. Y. Murakawa, M. Nakashima, D. Aoki, Y. Haga,
H. Harima, and Y. Onuki, J. Phys.: Condens. Matter 13, L627 (2001).
[69] C. Petrovic, R. Movshovich, M. Jaime, P. G. Pagliuso, M. F. Hundley, J. L.
Sarrao, Z. Fisk, and J. D. Thompson, Europhys. Lett. 53, 354 (2001).
[70] R. A. Fisher, F. Bouquet, N. E. Phillips, M. F. Hundley, P. G. Pagliuso, J. L.
Sarrao, Z. Fisk, and J. D. Thompson, Phys. Rev. B 65, 224509 (2002).
[71] V. S. Zapf, E. J. Freeman, E. D. Bauer, J. Petricka, C. Sirvent, N. A. Frederick,
R. P. Dickey, and M. B. Maple, Phys. Rev. B 65, 014506 (2001).
[72] P. G. Pagliuso, C. Petrovic, R. Movshovich, D. Hall, M. F. Hundley, J. L.
Sarrao, J. D. Thompson, and Z. Fisk, Phys. Rev. B 64, 100503 (2001).
[73] H. Shishido, R. Settai, D. Aoki, S. Ikeda, H. Nakawaki, N. Nakamura, T. Iizuka,
Y. Inada, K. Sugiyama, T. Takeuchi, K. Kindo, T. C. Kobayashi, Y. Haga,
H. Harima, Y. Aoki, T. Namiki, H. Sato, and Y. Onuki, J. Phys. Soc. Jpn. 71,
162 (2002).
[74] D. Hall, E. C. Palm, T. P. Murphy, S. W. Tozer, Z. Fisk, U. Alver, R. G.
Goodrich, J. L. Sarrao, P. G. Pagliuso, and T. Ebihara, Phys. Rev. B 64,
212508 (2001).

140 Bibliography
[75] T. Maehira, T. Hotta, K. Ueda, and A. Hasegawa, J. Phys. Soc. Jpn. 72, 854
(2003).
[76] M. A. Tanatar, J. Paglione, S. Nakatsuji, D. G. Hawthorn, E. Boaknin, R. W.
Hill, F. Ronning, M. Sutherland, L. Taillefer, C. Petrovic, P. C. Canfield, and
Z. Fisk, Phys. Rev. Lett. 95, 067002 (2005).
[77] S. Nakatsuji, D. Pines, and Z. Fisk, Phys. Rev. Lett. 92, 016401 (2004).
[78] N. J. Curro, B. Simovic, P. C. Hammel, P. G. Pagliuso, J. L. Sarrao, J. D.
Thompson, and G. B. Martins, Phys. Rev. B 64, 180514 (2001).
[79] R. Movshovich, M. Jaime, J. D. Thompson, C. Petrovic, Z. Fisk, P. G. Pagliuso,
and J. L. Sarrao, Phys. Rev. Lett. 86, 5152 (2001).
[80] F. A. Fisher, S. Kim, B. F. Woodfield, N. E. Phillips, L. Taillefer, K. Hasselbach,
J. Flouquet, A. L. Giorgi, and J. L. Smith, Phys. Rev. Lett. 62, 1411 (1989).
[81] K. A. Moler, D. J. Baar, J. S. Urbach, R. Liang, W. N. Hardy, and A. Kapit-
ulnik, Phys. Rev. Lett. 73, 2744 (1994).
[82] N. Momono and M. Ido, Physica C 264, 311 (1996).
[83] R. Movshovich, A. Bianchi, M. Jaime, M. F. Hundley, J. D. Thompson,
N. Curro, P. C. Hammel, Z. Fisk, P. G. Pagliuso, and J. L. Sarrao, Physica B
312-313, 7 (2002).
[84] Y. Kohori, Y. Yamato, Y. Iwamoto, T. Kohara, E. D. Bauer, M. B. Maple, and
J. L. Sarrao, Phys. Rev. B 64, 134526 (2001).
[85] Y. Kitaoka, K. Ueda, T. Kohara, K. Asayama, Y. Onuki, and T. Komatsubara,
J. Magn. Magn. Mater. 52, 341 (1985).
[86] D. E. MacLaughlin, C. Tien, W. G. Clark, M. D. Lan, Z. Fisk, J. L. Smith, and
H. R. Ott, Phys. Rev. Lett. 53, 1833 (1984).
141
[87] Y. Kohori, T. Kohara, H. Shibai, Y. Oda, Y. Kitaoka, and K. Asayama, J.
Phys. Soc. Jpn. 57, 395 (1988).
[88] K. Matsuda, Y. Kohori, and T. Kohara, Phys. Rev. B 55, 15223 (1997).
[89] K. Matsuda, Y. Kohori, and T. Kohara, J. Phys. Soc. Jpn. 65, 679 (1996).
[90] K. Izawa, H. Yamaguchi, Y. Matsuda, H. Shishido, R. Settai, and Y. Onuki,
Phys. Rev. Lett. 87, 057002 (2001).
[91] E. E. M. Chia, D. J. V. Harlingen, M. B. Salamon, B. D. Yanoff, I. Bonalde,
and J. L. Sarrao, Phys. Rev B 67, 014527 (2003).
[92] S. Ozcan, D. M. Broun, B. Morgan, R. K. W. Haselwimmer, J. L. Sarrao,
S. Kamal, C. P. Bidinosti, P. J. Turner, M. Raudsepp, and J. R. Waldram,
Europhys. Lett. 62, 412 (2003).
[93] R. J. Ormeno, A. Sibley, C. E. Gough, S. Sebastian, and I. R. Fisher, Phys.
Rev. Lett. 88, 047005 (2002).
[94] W. Higemoto, A. Koda, R. Kadano, Y. Kawasaki, Y. Haga, D. Aoki, R. Settai,
H. Shishido, and Y. Onuki, J. Phys. Soc. Jpn. 71, 1023 (2002).
[95] T. Mito, S. Kawasaki, G. -q. Zheng, Y. Kawasaki, K. Ishida, Y. Kitaoka,
D. Aoki, Y. Haga, and Y. Onuki, Phys. Rev. B 63, 220507(R) (2001).
[96] K. Maki, G. Yang, and H. Won, Physica C 341-348, 1647 (2000).
[97] H. Aubin, K. Behnia, M. Ribault, R. Gagnon, and L. Taillefer, Phys. Rev. Lett.
78, 2624 (1997).
[98] H. Aoki, T. Sakakibara, H. Shishido, R. Settai, Y. Onuki, P. Miranovic, and
K. Machida, J. Phys.: Condens. Matter 16, L13 (2004).
[99] M. R. Eskildsen, C. D. Dewhurst, B. W. Hoogenboom, C. Petrovic, and P. C.
Canfield, Phys. Rev. Lett. 90, 187001 (2003).

142 Bibliography
[100] M. J. Graf, S.-K. Yip, J. A. Sauls, and D. Rainer, Phys. Rev. B 53, 15147
(1996).
[101] A. Bianchi, R. Movshovich, N. Oeschler, P. Gegenwart, F. Steglich, J. D.
Thompson, P. G. Pagliuso, and J. L. Sarrao, Phys. Rev. Lett. 89, 137002
(2002).
[102] T. Tayama, A. Harita, T. Sakakibara, Y. Haga, H. Shishido, R. Settai, and
Y. Onuki, Phys. Rev. B 65, 18050(R) (2002).
[103] T. Takeuchi, H. Shishido, S. Ikeda, R. Settai, Y. Haga, and Y. Onuki, J. Phys.:
Condens. Matter 14, L261 (2002).
[104] N. Oeschler, P. Gegenwart, M. Lang, R. Movshovich, J. L. Sarrao, J. D. Thomp-
son, and F. Steglich, Phys. Rev. Lett. 91, 076402 (2003).
[105] C. Capan, A. Bianchi, R. Movshovich, A. D. Christianson, A. Malinowski, M. F.
Hundley, A. Lacerda, P. G. Pagliuso, and J. L. Sarrao, Phys. Rev. B 70, 134513
(2004).
[106] C. Martin, C. C. Agosta, S. W. Tozer, H. A. Radovan, E. C. Palm, T. P.
Murphy, and J. L. Sarrao, Phys. Rev. B 71, 020503(R) (2005).
[107] T. Watanabe, Y. Kasahara, K. Izawa, T. Sakakibara, Y. Matsuda, C. J. van der
Beek, T. Hanaguri, H. Shishido, R. Settai, and Y. Onuki, Phys. Rev. B 70,
020506(R) (2004).
[108] K. Kakuyanagi, M. Saitoh, K. Kumagai, S. Takashima, M. Nohara, H. Takagi,
and Y. Matsuda, Phys. Rev. Lett. 94, 047602 (2005).
[109] J. Paglione, M. A. Tanatar, D. Hawthorn, E. Boaknin, F. Ronning, R. W. Hill,
M. Sutherland, L. Taillefer, C. Petrovic, and P. Canfield, cond-mat/0405157
(2004).
[110] J. S. Kim, J. Alwood, G. R. Stewart, J. L. Sarrao, and J. D. Thompson, Phys.
Rev. B 64, 134524 (2001).

143
[111] V. A. Sidorov, M. Nicklas, P. G. Pagliuso, J. L. Sarrao, Y. Bang, A. V. Balatsky,
and J. D. Thompson, Phys. Rev. Lett. 89, 157004 (2002).
[112] G. -q. Zheng, K. Tanabe, T. Mito, S. Kawasaki, Y. Kitaoka, D. Aoki, Y. Haga,
and Y. Onuki, Phys. Rev. Lett. 86, 4664 (2001).
[113] T. Muramatsu, N. Tateiwa, T. C. Kobayashi, K. Shimizu, K. Amaya, D. Aoki,
H. Shishido, Y. Haga, and Y. Onuki, J. Phys. Soc. Jpn. 70, 3362 (2001).
[114] A. Bianchi, R. Movshovich, I. Vekhter, P. Pagliuso, and J. L. Sarrao, Phys.
Rev. Lett. 91, 257001 (2003).
[115] S. Nakatsuji, S. Yeo, L. Balicas, Z. Fisk, P. Schlottmann, P. G. Pagliuso, N. O.
Moreno, J. L. Sarrao, and J. D. Thompson, Phys. Rev. Lett. 89, 106402 (2002).
[116] T. Moriya and K. Ueda, Solid State Commun. 15, 169 (1974).
[117] A. Ishigaki and T. Moriya, J. Phys. Soc. Jpn. 65, 3402 (1996).
[118] H. Hegger, C. Petrovic, E. G. Moshopoulou, M. F. Hundley, J. L. Sarrao,
Z. Fisk, and J. D. Thompson, Phys. Rev. Lett. 84, 4986 (2000).
[119] M. Nicklas, R. Borth, E. Lengyel, P. G. Pagliuso, J. L. Sarrao, V. A. Sidorov,
G. Sparn, F. Steglich, and J. D. Thompson, J. Phys.: Condens. Matter 13,
L905 (2001).
[120] E. Lengyel, R. Borth, P. G. Pagliuso, J. L. Sarrao, G. Sparn, F. Steglich, and
J. D. Thompson, High Pres. Res. 22, 185 (2002).
[121] H. Shishido, T. Ueda, S. Hashimoto, T. Kubo, R. Settai, H. Harima, and
Y. Onuki, J. Phys.: Condens. Matter 15, L499 (2003).
[122] M. Yashima, S. Kawasaki, Y. Kawasaki, G. -q. Zheng, Y. Kitaoka, H. Shishido,
R. Settai, Y. Haga, and Y. Onuki, J. Phys. Soc. Jpn. 73, 2073 (2004).
[123] G. Sparn, R. Borth, E. Lengyel, P. G. Pagliuso, J. L. Sarrao, F. Steglich, and
J. D. Thompson, Physica B 312-313, 138 (2002).
144 Bibliography
[124] G. Knebel, M.-A. Measson, B. Salce, D. Aoki, D. Braithwaite, J. P. Brison, and
J. Flouquet, J. Phys.: Condens. Matter 16, 8905 (2004).
[125] H. Won, S. Haas, K. Maki, D. Parker, B. Dora, and A. Virosztek, Phys. Stat.
Sol. , in press.
[126] R. S. Kumar, A. L. Cornelius, and J. L. Sarrao, Phys. Rev. B 70, 214526
(2004).
[127] T. Tayama, Y. Namai, T. Sakakibara, M. Hedo, Y. Uwatoko, H. Shishido,
R. Settai, and Y. Onuki, J. Phys. Soc. Jpn. 74, 1115 (2005).
[128] E. Helfand and N. Werthamer, Phys. Rev. 147, 288 (1966).
[129] T. P. Orlando, E. J. McNiff Jr., S. Foner, and M. R. Beasley, Phys. Rev. B 19,
4545 (1979).
[130] C. F. Miclea, M. Nicklas, D. Parker, K. Maki, J. L. Sarrao, J. D. Thompson,
G. Sparn, and F. Steglich, Phys. Rev. Lett. 96, 117001 (2006).
[131] H. Won and K. Maki, Phys. Rev. B 49, 1397 (1994).
[132] K. Maki, AIP Conf. Proc. 438, 83 (1998).
[133] R. Ikeda, private communication.
[134] P. Villars and L. D. Calvert, Pearsons Handbook of Crystallographic Data
for Intermetallic Phases, The American Society for Metals, Metals Park Oh.
(1985).
[135] H. R. Ott, H. Rudigier, Z. Fisk, and J. L. Smith, Phys. Rev. Lett. 50, 1595
(1983).
[136] G. Landgren, Y. Jugnet, J. F. Morar, A. J. Arko, Z. Fisk, J. L. Smith, H. R.
Ott, and B. Reihl, Phys. Rev. B 29, 493 (1984).
[137] M. C. Aronson, J. D. Thompson, J. L. Smith, Z. Fisk, and M. W. McElfresh,
Phys. Rev. Lett. 63, 2311 (1989).

145
[138] D. L. Cox, Phys. Rev. Lett. 59, 1240 (1987).
[139] D. L. Cox, Physica B 186-188, 312 (1993).
[140] H. R. Ott, Progress in Low Temp. Phys. XI, Elsevier Science Publishers, page
215 (1987).
[141] M. B. Maple, J. W. Chen, S. E. Lambert, Z. Fisk, J. L. Smith, H. R. Ott, J. S.
Brooks, and M. J. Naughton, Phys. Rev. Lett. 54, 477 (1985).
[142] R. Felten, F. Steglich, G. Weber, H. Rietschel, F. Gompf, B. Renker, and
J. Beuers, Europhys. Lett. 2, 323 (1986).
[143] E. A. Knetsch, G. J. Nieuwenhuys, J. A. Mydosh, R. H. Heffner, and J. L.
Smith, Physica B 186-188, 251 (1993).
[144] F. Kromer, R. Helfrich, M. Lang, F. Steglich, C. Langhammer, A. Bach,
T. Michels, J. S. Kim, and G. R. Stewart, Phys. Rev. Lett. 81, 4476 (1998).
[145] F. Kromer, M. Lang, N. Oeschler, P. Hinze, C. Langhammer, F. Steglich, J. S.
Kim, and G. R. Stewart, Phys. Rev. B 62, 12477 (2000).
[146] R. Helfrich, Dissertation, TU Darmstadt, unpublished (1996).
[147] J. D. Thompson, J. Magn. Magn. Mater. 63-64, 358 (1987).
[148] J. A. Olsen, R. A. Fisher, N. E. Phillips, G. R. Stewart, and A. L. Giorgi, Bull.
Am. Phys. Soc. 31, 648 (1986).
[149] N. E. Phillips, R. A. Fisher, J. Flouquet, A. L. Giorgi, J. A. Olsen, and G. R.
Stewart, J. Magn. Magn. Mat. 62-63, 172 (1987).
[150] F. Steglich, P. Gegenwart, R. Helfrich, C. Langhammer, P. Hellmann, L. Donn-
evert, C. Geibel, M. Lang, G. Sparn, W. Assmus, G. R. Stewart, and A. Ochiai,
Z. Phys. B 103, 235 (1997).
[151] T. Moriya and T. Takimoto, J. Phys. Soc. Jpn. 64, 960 (1995).

146 Bibliography
[152] N. Oeschler, F. Kromer, T. Tayama, K. Tenya, P. Gegenwart, G. Sparn,
F. Steglich, M. Lang, and G. R. Stewart, Acta Phys. Pol. B. 34, 255 (2003).
[153] D. L. Cox and M. Jarrell, J. Phys.: Condens. Matter 8, 9825 (1996).
[154] D. L. Cox, Physica B 223-224, 453 (1996).
[155] H. R. Ott, H. Rudigier, Z. Fisk, and J. L. Smith, in Moment Formation in
Solids, Proceedings of a NATO Advanced Study Institute, edited by W. J. L.
Buyers, Plenum, New York, page 305 (1984).
[156] B. Renker, F. Gompf, W. Reichardt, H. Rietschel, J. B. Suck, and J. Balers,
Phys. Rev. B 32, 1859 (1985).
[157] H. R. Ott and Z. Fisk, in Handbook of Physics and Chemistry of the Actinides,
edited by A. J. Freeman and G. H. Lander, Elsevier, Amsterdam, page 85
(1987).
[158] F. Steglich, J. Aarts, C. D. Bredl, W. Lieke, D. Meschede, W. Franz, and
H. Schafer, Phys. Rev. Lett. 43, 1892 (1979).
[159] C. Walti, Dissertation, Swiss Federal Institute of Technology Zurich, unpub-
lished (2000).
[160] C. Langhammer, R. Helfrich, A. Bach, F. Kromer, M. Lang, T. Michels,
M. Deppe, F. Steglich, and G. R. Stewart, J. Magn. Magn. Mater. 177-181,
443 (1998).
[161] H. R. Ott, H. Rudigier, T. M. Rice, K. Ueda, Z. Fisk, and J. L. Smith, Phys.
Rev. Lett. 52, 1915 (1984).
[162] C. Walti, H. R. Ott, Z. Fisk, and J. L. Smith, Phys. Rev. Lett. 84, 5616 (2000).
[163] F. Gross, B. S. Chandrasekhar, D. Einzel, K. Andres, P. J. Hirschfeld, H. R.
Ott, J. Beuers, Z. Fisk, and J. L. Smith, Z. Phys. B: Condens Matter 64, 175
(1986).

147
[164] D. Einzel, P. J. Hirschfeld, F. Gross, B. S. Chandrasekhar, K. Andres, H. R.
Ott, J. Beuers, Z. Fisk, and J. L. Smith, Phys, Rev. Lett. 56, 2513 (1986).
[165] L. Glemot, J. P. Brison, J. Flouquet, A. I. Buzdin, I. Sheikin, D. Jaccard,
C. Thessieu, and F. Thomas, Phys. Rev. Lett. 82, 169 (1999).
[166] U. Rauchschwalbe, U. Ahlheim, F. Steglich, D. Rainer, and J. J. M. Franse, Z.
Phys. B 60, 379 (1985).
[167] U. Rauchschwalbe, U. Ahlheim, C. D. Bredl, H. M. Mayer, and F. Steglich, J.
Magn. Magn. Mater. 63-64, 447 (1987).
[168] K. Ueda and T. M. Rice, Phys. Rev. B 31, 7114 (1985).
[169] E. I. Blount, Phys. Rev. B 32, 2935 (1985).
[170] R. Joynt and T. M. Rice, Phys. Rev. B 32, 6074 (1985).
[171] C. F. Miclea, F. M. Grosche, J. Sichelschmidt, G. R. Stewart, G. Sparn, and
F. Steglich, Physica B 312-313, 97 (2002).
[172] P. H. P. Reinders, B. Wand, F. Steglich, G. Fraunberger, G. R. Stewart, and
G. Adrian, Europhys. Lett. 25, 619 (1994).
[173] N. E. Alekseevskii, A. V. Mitin, A. S. Rudenko, and A. A. Sorokin, Pis’ma Zh.
Eksp. Teor. Fiz. 43, 533 (1986), [JETP Lett. H3, 690 (1986)].
[174] R. H. Friend and D. Jerome, J. Phys. 12, 1441 (1979).
[175] L. P. Gorkov, Usp. Fiz. Nauk 144, 381 (1984).
[176] A. I. Buzdin and L. N. Bulaevskii, Usp. Fiz. Nauk 144, 415 (1984).
[177] K. Machida, Appl. Phys. 35, 193 (1984).
[178] C. A. Balseiro and L. M. Falicov, Phys. Rev. B 20, 4457 (1979).
[179] M. Kitaoka, IBM J. Res. Dev. 33, 356 (1989).

148 Bibliography
[180] A. A. Gorbatsevich, V. P. Elesin, and Y. V. Kopaev, Phys. Lett. A 125, 149
(1987).
[181] M. Ichimura, M. Fujita, and K. Nakao, Phys. Rev. B 43, 175 (1991).
[182] Y. V. Kopaev, Trudy Fiz. Inst. Akad. Nauk SSSR 86, 3 (1975).
[183] M. Vlasse and L. Fournes, Mater. Res. Bull. 11, 1527 (1976).
[184] T. Ohtani, Y. Miyoshi, Y. Fujii, T. Koyakumaru, T. Kusano, and K. Minami,
Solid State Commun. 120, 95 (2001).
[185] W. Bensch, J. Abart, and E. Amberger, Solid State Commun. 58, 631 (1986).
[186] R. Schlogl and W. Bensch, J. Less-Common Met. 132, 155 (1987).
[187] R. Rao, D. Gaitone, A. Garg, B. K. Godwal, and H. D. Hochheimer, to be
published.
[188] T. Sekine, Y. Kiuchi, E. Matsuura, K. Uchinokura, and R. Yoshizaki, Phys.
Rev. B 36, 3153 (1987).
[189] T. Ohtani, Y. Yokota, and H. Sawada, Jpn. J. Appl. Phys. 38, L142 (1999).
[190] W. Bensch, J. Koy, and W. Biberacher, Solid State Commun. 93, 261 (1995).
[191] Y. Fujii, T. Koyakumaru, T. Ohtani, Y. Miyoshi, S. Sunagawa, and M. Sugino,
Solid State Commun. 121, 165 (2002).
[192] See, for example, C. Kittel, Introduction to Solid State Physics 5-th edition,
Wiley, New York, (1976).
[193] A. M. Gabovich, A. I. Voitenko, and M. Ausloos, Phys. Rep. 367, 583 (2002).
[194] A. M. Gabovich, D. P. Moiseev, and A. S. Shpigel, J. Phys. 15, L569 (1982).
[195] A. M. Gabovich, D. P. Moiseev, and A. S. Shpigel, Pis’ma Zh. Z Eksp. Teor.
Fiz. 83, 1383 (1982), [Sov. Phys. JETP 56, 795 (1982)].

149
[196] C. E. Methfessel, A. R. Stewart, B. T. Matthias, and C. K. N. Patel, Proc.
Natl. Acad. Sci. USA 77, 6307 (1980).
[197] A. M. Gabovich, D. P. Moiseev, L. V. Prokopovich, S. K. Uvarova, and V. E.
Yachmenev, Pis’ma Zh. Z Eksp. Teor. Fiz. 86, 1727 (1984), [Sov. Phys. JETP
59, 1006 (1984)].
[198] M. Sato, H. Fujishita, and S. Hoshino, J. Phys. 16, L417 (1983).
[199] J. M. Heintz, M. Drillon, R. Kuentzler, Y. Dossmann, J. P. Kappler,
O. Durmeyer, and F. Gautier, Z. Phys. B 76, 303 (1989).
[200] H. Okamoto, H. Taniguti, and Y. Ishihara, Phys. Rev. B 53, 384 (1996).
[201] W. L. McMillan, Phys. Rev. 167, 331 (1968).
[202] H. Okamoto and Y. Ishihara, Phys. Rev. B 48, 3927 (1993).
[203] J. R. Clem, Ann. Phys. N. Y. 40, 268 (1966).
[204] N. Kobayashi, K. Noto, and Y. Muto, J. Low Temp. Phys. 27, 217 (1977).
[205] B. J. C. van der Hoeven Jr. and P. H. Keesom, Phys. Rev. 135, A631 (1964).
[206] B. W. Roberts, Progress in Cryogenics, Heywood and Co. Ltd., London, (1964).
[207] F. Heininger, E. Bucher, and J. Muller, Phys. Kondens. Mater. 5, 243 (1966).
[208] G. Bilbro and W. L. McMillan, Phys. Rev. B 14, 1887 (1976).
[209] W. W. Fuller, P. M. Chaikin, and N. P. Ong, Phys. Rev. B 24, 1887 (1981).
[210] B. Horovitz, H. Gutfreund, and M. Weger, Phys. Rev. B 9, 1246 (1975).
[211] M. Ido, Y. Okayama, T. Ijiri, and Y. Okajima, J. Phys. Soc. Jpn. 59, 1341
(1990).
[212] M. Nunez, J. M. Mignot, and D. Castello, Europhys. Lett. 18, 53 (1992).


151
ACKNOWLEDGMENTS
I owe my gratitude to all the people who have made this thesis possible.
First and foremost I would like to express my gratitude to Prof. Frank Steglich
whom I have known as an outstanding physicist. I thank him for his constant support
and guidance during the last years.
I would particularly like to thank Dr. Michael Nicklas for his constant help
and support. Without his amazing efficiency in solving a great variety of issues,
from science to organizational problems, this thesis would still have been a distant
achievement. He has always made himself available for help and advice and there has
never been an occasion when I have knocked on his door and he has not given me
time.
Special thanks I owe to Dr. Gunter Sparn for his guidance and constant help
from the beginning of my work in Dresden. It was him who introduced me to the
field of high pressure physics.
I want to express my sincere gratitude to Dr. Michael Nicklas and Edit Lengyel
for their thorough reading and corrections to my thesis. Without their help I would
have, most likely, missed the deadline for submitting my thesis. Furthermore I want
to thank Prof. Hans Dieter Hochheimer, Prof. Ana Celia Mota, Dr. Peter Thalmeier
and Prof. Manfred Sigrist for proof-reading parts of this work and for their valu-
able comments. For stimulating discussion and a fruitful collaboration regarding the

152 Acknowledgments
phenomena described in Chapter 3, I want to thank Prof. Kazumi Maki and David
Parker. Additionally my gratitude goes to Prof. Ryusuke Ikeda and Prof. Joe D.
Thompson for valuable discussions.
I am in debt to Dr. Tomasz Cichorek, Dr. Teodora Radu, Dr. Yoshifumi
Tokiwa and Franziska Weickert for allowing me to use their cryostats and for their
help during some of my measurements.
Special thanks go to Dr. Malte Grosche for guidance in the beginning of my
work in Dresden.
For supplying the compounds investigated in this work I am glad to thank Dr.
John L. Sarrao, Prof. Gregory R. Stewart and Prof. Hans Dieter Hochheimer.
As all of my experimental physicists colleagues, at points of my work I ran into
technical problems with pumps failures and broken gauges. As all of them I have to
thank to Robert Borth and Dr. Thomas Luhmann for technical assistance. For the
drawings of the pressure cells I like to thank Christoph Klausnitzer, our Autodesk
expert.
For machining the miniaturized specific heat and the resistivity pressure cells I
acknowledge Ralf Koban and Ion Cheroi, respectively.
The working environment at Max Planck Institute has been made enjoyable by
my colleagues, starting with my office mates, Edit Lengyel, Huiqiu Yuan, Constantze
Lamprecht and continuing with Dr. Teodora Radu, Dr. Takeshi Nakanishi, Dr.
Michael Nicklas, Dr. Stefan Mederle, Monica Leonte, Adriana Sanchez and Julia
Ferstl. My flatmates in the famous Chemnitzer Str. 59C, Dr. Niels Oeschler, Gabriel
Dionicio and Dr. Ivica Zerec, made my staying in Dresden pleasant.

153
I owe my deepest thanks to my family, my wife, my brother and my parents
who have always stood by me. Words cannot express the gratitude I owe them.
It is impossible to remember all, and I apologize to those I have inadvertently
left out.
Finally, the financial support from the Max-Planck Society and DFG (SFB463)
is acknowledged.

Author’s declaration
I declare that the work described in this dissertation was carried out in accordance
with the regulations of the Dresden University of Technology. No part of this work
has been submitted previously for a degree or other qualification at this or any other
university. The research reported herein is original, except where specific reference
is acknowledged to the work of others. All the research was carried out under the
supervision of Prof. Frank Steglich at the Max Planck Institute for Chemical Physics
of Solids between January 2000 and December 2005.
Corneliu F. Miclea
Dresden, Germany
December 23rd, 2005

Versicherung
Hiermit versichere ich, dass ich die vorliegende Arbeit ohne unzulassige Hilfe Dritter
und ohne Benutzung anderer als der angegebenen Hilfsmittel angefertigt habe; die
aus fremden Quellen direkt oder indirekt ubernommenen Gedanken sind als solche
kenntlich gemacht. Die Arbeit wurde bisher weder im Inland noch im Ausland in
gleicher oder ahnlicher Form einer anderen Prufungsbehorde vorgelegt.
Die vorliegende Dissertation wurde unter der Betreuung von Prof. Dr. Frank Steglich
am Max-Planck-Institut fur Chemische Physik fester Stoffe in Dresden im Zeitraum
von Januar 2000 bis Dezember 2005 angefertigt. Ich erkenne die Promotionsordnung
an.
Corneliu F. Miclea
Dresden, Deutschland
23. Dezember, 2005