
Calculating the Inrush Current of Superconducting Transformers
19
energies Article Calculating the Inrush Current of Superconducting Transformers Grzegorz Komarzyniec Citation: Komarzyniec, G. Calculating the Inrush Current of Superconducting Transformers. Energies 2021, 14, 6714. https:// doi.org/10.3390/en14206714 Academic Editor: Pawel Rozga Received: 3 September 2021 Accepted: 13 October 2021 Published: 15 October 2021 Publisher’s Note: MDPI stays neutral with regard to jurisdictional claims in published maps and institutional affil- iations. Copyright: © 2021 by the author. Licensee MDPI, Basel, Switzerland. This article is an open access article distributed under the terms and conditions of the Creative Commons Attribution (CC BY) license (https:// creativecommons.org/licenses/by/ 4.0/). Faculty of Engineering and Computer Science, Lublin University of Technology, Nadbystrzycka 38A, 20-618 Lublin, Poland; [email protected] Abstract: Under certain circumstances, after connecting a superconducting transformer to the power network, a high value current may flow through its windings. This current can exceed the critical value of the superconductor many times and cause the windings to lose their superconductive state. Loss of superconductive state of the windings may result in thermal interruption of their continuity as a result of conduction of a current of very high density. The mathematical relationships used to calculate the inrush current of conventional transformers do not work well for the calculation of superconducting transformers. This is due to the properties of superconducting materials used in the windings, first of all to the stepwise changes of the windings’ resistance when exiting the superconducting state and when returning to this state. The article presents the mathematical dependencies allowing to calculate the pulse waveforms of the inrush current of these transformers are derived. Basic electrical circuit sizes are used in the calculations, making the calculations quick and easy. Using the formulas, calculations of the inrush current of 8.5 kVA and 13.5 kVA superconducting transformers. The results were verified with the results of the inrush current measurements, achieving good compliance. Keywords: inrush current; superconductivity; transformer 1. Introduction A high value current may flow through the transformer windings not only at short circuit or overload, but under certain circumstances even after the transformer has been connected to the mains. The current at the switching on of an unloaded transformer can reach a value of up to 20 times higher than the rated current [1,2]. The time of the inrush current fade can, in the case of large power transformers, reach several thousand periods of supply voltage. Conventional transformers, i.e., with copper or aluminum windings, are elements of the power system with a relatively low failure rate. The maintenance of superconducting transformers (HTS transformer) in a faultless state is hampered by the tendency of their windings to easily emerge from the superconductive state. The inrush current of a high value and long decay time may not only make it difficult to connect the superconducting transformer to the mains, but also leads to thermal damage of its windings. Therefore, it is important to counteract the effects of this current [1,3,4]. This requires learning about the mechanism for the development of the inrush current in superconducting transformers, which are different from those in conventional transformers, as well as for the capturing of this phenomenon by mathematical relationships. This will allow the methods of limiting the inrush current of conventional transformers, which are still being developed [5–8], to be transferred to superconducting transformers. The inrush current of conventional transformers is a relatively well-recognised phe- nomenon, both through theoretical analysis and experimental research on real transform- ers [9–12]. Specht and Holcomb [13–15] in 1951 and 1961 gave relationships for the inrush current of conventional transformers that are still used in calculations today [16]. Formu- las to approximate the shape of the inrush current are proposed in [17,18]. Transformer Energies 2021, 14, 6714. https://doi.org/10.3390/en14206714 https://www.mdpi.com/journal/energies
-
Upload
khangminh22 -
Category
Documents
-
view
5 -
download
0
Transcript of Calculating the Inrush Current of Superconducting Transformers

energies
Article
Calculating the Inrush Current of SuperconductingTransformers
Grzegorz Komarzyniec
Citation: Komarzyniec, G.
Calculating the Inrush Current of
Superconducting Transformers.
Energies 2021, 14, 6714. https://
doi.org/10.3390/en14206714
Academic Editor: Pawel Rozga
Received: 3 September 2021
Accepted: 13 October 2021
Published: 15 October 2021
Publisher’s Note: MDPI stays neutral
with regard to jurisdictional claims in
published maps and institutional affil-
iations.
Copyright: © 2021 by the author.
Licensee MDPI, Basel, Switzerland.
This article is an open access article
distributed under the terms and
conditions of the Creative Commons
Attribution (CC BY) license (https://
creativecommons.org/licenses/by/
4.0/).
Faculty of Engineering and Computer Science, Lublin University of Technology, Nadbystrzycka 38A,20-618 Lublin, Poland; [email protected]
Abstract: Under certain circumstances, after connecting a superconducting transformer to the powernetwork, a high value current may flow through its windings. This current can exceed the criticalvalue of the superconductor many times and cause the windings to lose their superconductive state.Loss of superconductive state of the windings may result in thermal interruption of their continuityas a result of conduction of a current of very high density. The mathematical relationships usedto calculate the inrush current of conventional transformers do not work well for the calculationof superconducting transformers. This is due to the properties of superconducting materials usedin the windings, first of all to the stepwise changes of the windings’ resistance when exiting thesuperconducting state and when returning to this state. The article presents the mathematicaldependencies allowing to calculate the pulse waveforms of the inrush current of these transformersare derived. Basic electrical circuit sizes are used in the calculations, making the calculations quick andeasy. Using the formulas, calculations of the inrush current of 8.5 kVA and 13.5 kVA superconductingtransformers. The results were verified with the results of the inrush current measurements, achievinggood compliance.
Keywords: inrush current; superconductivity; transformer
1. Introduction
A high value current may flow through the transformer windings not only at shortcircuit or overload, but under certain circumstances even after the transformer has beenconnected to the mains. The current at the switching on of an unloaded transformer canreach a value of up to 20 times higher than the rated current [1,2]. The time of the inrushcurrent fade can, in the case of large power transformers, reach several thousand periodsof supply voltage.
Conventional transformers, i.e., with copper or aluminum windings, are elements ofthe power system with a relatively low failure rate. The maintenance of superconductingtransformers (HTS transformer) in a faultless state is hampered by the tendency of theirwindings to easily emerge from the superconductive state. The inrush current of a highvalue and long decay time may not only make it difficult to connect the superconductingtransformer to the mains, but also leads to thermal damage of its windings. Therefore, it isimportant to counteract the effects of this current [1,3,4]. This requires learning about themechanism for the development of the inrush current in superconducting transformers,which are different from those in conventional transformers, as well as for the capturing ofthis phenomenon by mathematical relationships. This will allow the methods of limitingthe inrush current of conventional transformers, which are still being developed [5–8], tobe transferred to superconducting transformers.
The inrush current of conventional transformers is a relatively well-recognised phe-nomenon, both through theoretical analysis and experimental research on real transform-ers [9–12]. Specht and Holcomb [13–15] in 1951 and 1961 gave relationships for the inrushcurrent of conventional transformers that are still used in calculations today [16]. Formu-las to approximate the shape of the inrush current are proposed in [17,18]. Transformer
Energies 2021, 14, 6714. https://doi.org/10.3390/en14206714 https://www.mdpi.com/journal/energies

Energies 2021, 14, 6714 2 of 19
models during inrush current are presented in [19–25]. Some of these models are based onelectromagnetic-circuit analysis [21,25]. These models need to have transformer detail datawhich may be difficult to obtain. The B-H curve of the transformer core plays an importantrole in the turn-on current analysis. Analytical equations using the B-H curve to model theturn-on current are given in papers [17,18,20,22]. The magnitude of the first cycle inrushcurrent is important for transformer design and protection. Therefore, analytical formulasto estimate the peak of the inrush current during the first cycle as a function of switchingangle are presented in [26–29]. Due to the importance of the inrush current envelope fortransformer and system protection, analytical formulas to estimate the inrush current enve-lope are presented in [13,14,30]. These formulas require some detailed data like detailedcore dimensions, in addition to the electrical parameters and magnetic core characteristics.
The literature on the inrush current of superconducting transformers is relativelyscarce and concentrates mainly on its waveforms obtained experimentally for existingtransformers [31–33]. Meanwhile, calculation methods used in calculating the inrushcurrent of conventional transformers do not work well in calculating this current for super-conducting transformers, mainly because of the different parameters and characteristicsof the superconducting wires with respect to conventional winding wires. This paperproposes a solution to this problem.
The mathematical descriptions proposed in the presented literature does not take intoaccount dynamic changes of the windings’ resistance, which leads to incorrect calculationsfor superconducting transformers. This article proposes a solution to this problem andderives mathematical relationships describing the course of the inrush current of supercon-ducting transformers. Due to the limited amount of data concerning the inrush currentphenomenon of superconducting transformers, the given dependencies were verified onthe designed and built by the author of the paper transformers of this type.
2. Superconducting Transformer
Superconducting transformers differ from conventional ones mainly in the materialfrom which their superconducting windings are made [34–36]. The use of superconductingwinding materials determines the remaining differences in the construction of both typesof transformers [37–39].
The diagram of an HTS transformer in the idle state (Figure 1) does not differ sig-nificantly from that of a conventional transformer, with the difference that resistance Rrepresenting power losses in the high-temperature superconducting primary winding(HTS winding) of the HTS transformer is nonlinear as a function of changes in currentI, magnetic field strength H and temperature T. The nonlinearity of this resistance hasa significant impact on the inrush current of the transformer. In the superconductivestate of the winding, resistance R is equal to zero. This resistance increases rapidly, inapproximately 10−12 s, when the critical parameters of the superconductor are exceeded,when the winding goes to the resistive state.
Energies 2021, 14, 6714 3 of 19
Figure 1. Scheme of a single-phase HTS transformer in the idle state.
Critical current Ic, critical temperature Tc and critical magnetic field strength Hc de-termine the critical area of the superconducting winding (Figure 2) [40,41]. The real crit-ical parameters Tcr, Hcr, Icr of the superconducting winding have lower values and de-termine the location of the superconductor’s working point (Pcr) on the critical surface. Maintaining the superconductivity of the winding is only possible when the temperature, magnetic field strength and current strength are simultaneously lower than the real crit-ical values, i.e., when the superconductor’s working point (Pw) is located under a critical surface and is determined by Tw, Hw, Iw.
Figure 2. Critical surface of a superconductor.
Due to the high critical values of the magnetic field strength of modern supercon-ducting materials, its influence on the course of the inrush current was omitted from the considerations. The impact of temperature changes is considered indirectly by assuming lower critical current values of the superconductor with its temperature increase. This approach allowed to simplify the transition characteristics of the HTS transformer’s winding to the function of two variables R = f(I), as shown in Figure 3.
Figure 1. Scheme of a single-phase HTS transformer in the idle state.

Energies 2021, 14, 6714 3 of 19
Critical current Ic, critical temperature Tc and critical magnetic field strength Hcdetermine the critical area of the superconducting winding (Figure 2) [40,41]. The realcritical parameters Tcr, Hcr, Icr of the superconducting winding have lower values anddetermine the location of the superconductor’s working point (Pcr) on the critical surface.Maintaining the superconductivity of the winding is only possible when the temperature,magnetic field strength and current strength are simultaneously lower than the real criticalvalues, i.e., when the superconductor’s working point (Pw) is located under a criticalsurface and is determined by Tw, Hw, Iw.
Energies 2021, 14, 6714 3 of 19
Figure 1. Scheme of a single-phase HTS transformer in the idle state.
Critical current Ic, critical temperature Tc and critical magnetic field strength Hc de-termine the critical area of the superconducting winding (Figure 2) [40,41]. The real crit-ical parameters Tcr, Hcr, Icr of the superconducting winding have lower values and de-termine the location of the superconductor’s working point (Pcr) on the critical surface. Maintaining the superconductivity of the winding is only possible when the temperature, magnetic field strength and current strength are simultaneously lower than the real crit-ical values, i.e., when the superconductor’s working point (Pw) is located under a critical surface and is determined by Tw, Hw, Iw.
Figure 2. Critical surface of a superconductor.
Due to the high critical values of the magnetic field strength of modern supercon-ducting materials, its influence on the course of the inrush current was omitted from the considerations. The impact of temperature changes is considered indirectly by assuming lower critical current values of the superconductor with its temperature increase. This approach allowed to simplify the transition characteristics of the HTS transformer’s winding to the function of two variables R = f(I), as shown in Figure 3.
Figure 2. Critical surface of a superconductor.
Due to the high critical values of the magnetic field strength of modern supercon-ducting materials, its influence on the course of the inrush current was omitted from theconsiderations. The impact of temperature changes is considered indirectly by assuminglower critical current values of the superconductor with its temperature increase. This ap-proach allowed to simplify the transition characteristics of the HTS transformer’s windingto the function of two variables R = f (I), as shown in Figure 3.
Energies 2021, 14, 6714 4 of 19
Figure 3. Simplified transition characteristics of a superconductor.
3. Stream in the Transformer Core after Switching on Knowing the time course of the flux, after switching on the transformer, it is possible
to determine the time course of the inrush current from the magnetisation characteristic Φ = f(I) [42,43].
Initially, the connection of an unloaded single-phase transformer (Figure 1) to a si-nusoidal source (Figure 4) will be considered. The constant resistance R is assumed for the entire duration of the inrush current. The impedance of the power grid and the im-pedance of the power source are ignored.
Figure 4. Course of the voltage supplying the transformer.
The course of the inrush current is influenced by the shape of the magnetisation curve in the saturation area of the transformer core [44,45]. Figure 5 shows a simplified shape of the magnetisation curve adopted for the calculation [15,46,47].
The circuitry in Figure 1 is described by the equations [18]:
1edtdiLRie ++= (1)
FeFeiRdtdi
Le == μμ1
(2)
Figure 3. Simplified transition characteristics of a superconductor.
3. Stream in the Transformer Core after Switching on
Knowing the time course of the flux, after switching on the transformer, it is possibleto determine the time course of the inrush current from the magnetisation characteristicΦ = f (I) [42,43].

Energies 2021, 14, 6714 4 of 19
Initially, the connection of an unloaded single-phase transformer (Figure 1) to asinusoidal source (Figure 4) will be considered. The constant resistance R is assumedfor the entire duration of the inrush current. The impedance of the power grid and theimpedance of the power source are ignored.
Energies 2021, 14, 6714 4 of 19
Figure 3. Simplified transition characteristics of a superconductor.
3. Stream in the Transformer Core after Switching on Knowing the time course of the flux, after switching on the transformer, it is possible
to determine the time course of the inrush current from the magnetisation characteristic Φ = f(I) [42,43].
Initially, the connection of an unloaded single-phase transformer (Figure 1) to a si-nusoidal source (Figure 4) will be considered. The constant resistance R is assumed for the entire duration of the inrush current. The impedance of the power grid and the im-pedance of the power source are ignored.
Figure 4. Course of the voltage supplying the transformer.
The course of the inrush current is influenced by the shape of the magnetisation curve in the saturation area of the transformer core [44,45]. Figure 5 shows a simplified shape of the magnetisation curve adopted for the calculation [15,46,47].
The circuitry in Figure 1 is described by the equations [18]:
1edtdiLRie ++= (1)
FeFeiRdtdi
Le == μμ1
(2)
Figure 4. Course of the voltage supplying the transformer.
The course of the inrush current is influenced by the shape of the magnetisation curvein the saturation area of the transformer core [44,45]. Figure 5 shows a simplified shape ofthe magnetisation curve adopted for the calculation [15,46,47].
Energies 2021, 14, 6714 5 of 19
Figure 5. Simplified shape of the magnetisation curve.
Assuming that the transformer is switched on at the angle −π (Figure 4) the basic equation of the transformer operation can be written as:
( )dtdΦz
LRNΦtE +=+− αωsin2 (3)
After the integration of Equation (3), the expression for flux is obtained:
( ) tXR
m etΦω
δαωϕ−
+−+−= Asin (4)
where A is the integration constant determined from the initial conditions. After the transformer has been connected to the power network, the value of the
excitation current at the first moment must be equal to zero. However, there is a residual magnetism flux Φr (φ = Φr dla ωt = −π) and therefore the constant A is:
( ) ππδαπ X
R
rXR
m eΦeΦ−−
++−−= sinA (5)
Ultimately, the flux equation has a form:
( ) ( ) ( )
( )tXR
r
tXR
mm
Φ
ΦtΦωπ
ωπδαπδαωϕ
+−
+−
+
+−−−+−=
e
esinsin (6)
where the angle of the phase shift δ is:
RX1-tg=δ (7)
Equation (6) contains two components—fixed: ( )δαωϕ −+−= tΦmf sin (8)
and disturbing:
( ) ( ) ( )tXR
r
tXR
md ΦΦωπωπ
δαπϕ+−+−
++−−= eesin (9)
From relation (6) it follows that the magnetic flux φ reaches its highest peak moment after switching on the transformer. This value depends on the phase of the supply volt-age e and the value of the residual magnetism flux Φr at the moment of switching on the transformer and the value of the ratio R/X of the electrical circuit [48].
Let us assume that we are omitting the resistance of the primary winding and the active component to cover iron losses (R = 0 i RFe = ∞) and the flux in the transformer core is delayed to the voltage by an angle π/2 (Figure 4). The inrush current will not appear when the transformer is switched on when the voltage e reaches its maximum value and there is no residual magnetism flux in the transformer core (Φr = 0).
Figure 5. Simplified shape of the magnetisation curve.
The circuitry in Figure 1 is described by the equations [18]:
e = Ri + Ldidt
+ e1 (1)
e1 = Lµdiµdt
= RFeiFe (2)
Assuming that the transformer is switched on at the angle −π (Figure 4) the basicequation of the transformer operation can be written as:
−√
2E sin(ωt + α) = NΦRL+ z
dΦ
dt(3)

Energies 2021, 14, 6714 5 of 19
After the integration of Equation (3), the expression for flux is obtained:
ϕ = −Φm sin(ωt + α− δ) + Ae−RX ωt (4)
where A is the integration constant determined from the initial conditions.After the transformer has been connected to the power network, the value of the
excitation current at the first moment must be equal to zero. However, there is a residualmagnetism flux Φr (ϕ = Φr dla ωt = −π) and therefore the constant A is:
A = −Φm sin(π − α + δ)e−RX π + Φre−
RX π (5)
Ultimately, the flux equation has a form:
Φ = −Φm sin(ωt + α− δ)−Φm sin(π − α + δ)e−RX (π+ωt)
+Φre−RX (π+ωt)
(6)
where the angle of the phase shift δ is:
δ = tg−1 XR
(7)
Equation (6) contains two components—fixed:
ϕ f = −Φm sin(ωt + α− δ) (8)
and disturbing:
ϕd = −Φm sin(π − α + δ)eRX (π+ωt) + Φre−
RX (π+ωt) (9)
From relation (6) it follows that the magnetic flux ϕ reaches its highest peak momentafter switching on the transformer. This value depends on the phase of the supply voltagee and the value of the residual magnetism flux Φr at the moment of switching on thetransformer and the value of the ratio R/X of the electrical circuit [48].
Let us assume that we are omitting the resistance of the primary winding and theactive component to cover iron losses (R = 0 i RFe = ∞) and the flux in the transformer coreis delayed to the voltage by an angle π/2 (Figure 4). The inrush current will not appearwhen the transformer is switched on when the voltage e reaches its maximum value andthere is no residual magnetism flux in the transformer core (Φr = 0).
The least favourable conditions for switching on the transformer occur when the sup-ply voltage e passes through zero. Because at the moment of switching on the transformerthe flux in the core must be equal to zero (if the residual magnetism flux is omitted, i.e.,Φr = 0), a one-way flux component must occur. This component, when added to the courseof a fixed flux, causes the peak value of the flux to double:
ΦM = 2Φm (10)
As can be seen from relation (6), the residual magnetism flux Φr has a significantinfluence on the course of the flux ϕ. Expression (6) reaches its highest value:
ΦM = 2Φm + Φr (11)
Such a high flux value leads to saturation of the transformer core, at which the peakvalue of the inrush current reaches significant values.
From Equation (6) it appears that the reaction X is a measure of circuit inertia. Resis-tance R is responsible for damping the unidirectional component of the disturbing flux,

Energies 2021, 14, 6714 6 of 19
and thus reducing the peak value of the inrush current and shortening its duration [16].The value of the flux is reduced by the value expressed in the equation:
∆Φ =1z
∫ t
−π/ωRidt (12)
If the resistance is omitted in the circuit from Figure 1 (R = 0), then the attenuationof the one-way flux component does not occur and the flux has an undamped coursedescribed by the relation:
ϕ = Φm + Φm cos ωt + Φr (13)
Therefore, the inrush current is also undamped.
4. Inrush Current of Superconducting Transformer
The inrush current, similar to the magnetic flux described by Equation (6), has twocomponents: fixed and transient. The fixed component is the periodically alternatingcurrent drawn by the transformer to excite the flux in the core and cover the power lossesin the transformer in its steady state. This current is between 1 and 10% of the rated current,so it will be omitted from consideration. The disruptive component of the inrush current isa unidirectional current impulse that appears when the transformer core is saturated andthis component will be taken into account.
The resistance R of the equivalent circuit diagram of the HTS transformer (Figure 1)depends on the state of the primary superconductor winding. We assume that the tran-sition characteristics of the superconducting windings are as shown in Figure 3. For thecalculations it has been assumed that the resistance R in the superconductive state hasa value greater than zero. Such an approach allows for taking into account the residualresistance of the superconductor, connection resistances, current bushings resistances andthe power network resistance. It is assumed that when the transformer is switched on, itswindings are in a superconductive state. It is assumed that the temperature of the windingsdoes not exceed the critical temperature and the effect of the magnetic field strength isignored for the duration of the inrush current.
In the saturation state of the core, the scheme of an HTS transformer in the idle state(Figure 1) is simplified to a serial connection of the resistance of the primary winding Rand the inductance of that winding L, as shown in Figure 6 [14,15].
Energies 2021, 14, 6714 7 of 19
Figure 6. Replacement diagram of HTS transformer at core saturation.
The unidirectional current appears when the momentary value of the flux ϕ exceeds the value of the saturation flux of the core Φn, which takes place for ωt = −θ (Figure 7). By converting Equation (13), including ωt = −θ and ϕ = Φn, a formula is obtained for the angle at which the unidirectional current pulse appears:
m
rms
ΦΦΦΦ −−= −1cosθ (15)
In Figure 7, the transformer is switched on when the voltage e passes through the zero value, i.e., for angle −π. The primary winding of the HTS transformer is in the su-perconductive state and its resistance is close to zero (R = R0). The flux reaches the satu-ration value of the transformer core Φs for the angle −θ. At this point, a unidirectional current pulse i appears. The increasing current pulse reaches the value of critical current of the primary winding i = Ic for the angle −θc. At this point, the primary winding of the transformer passes to the resistive state and its resistance increases to R = Rm. The falling unidirectional current pulse reaches the critical current at which the primary winding of the transformer returns to the superconductive state i = Icw for angle δcw. For the δ angle, the transformer core comes out of saturation and the unidirectional current i disappears. As a result of the two changes in the state of the circuit from Figure 6, the unidirectional current pulse i is described by three different equations: (1) for the value of i from −θ to −θc, (2) for the value of ic from −θc to δcw and (3) for the value of icw from δcw to δ.
Figure 7. Voltage, flux, current and resistance of a superconducting winding.
Under initial conditions, for ωt = −θ, the unidirectional current must have a value equal to zero. By substituting i = 0 and ωt = −θ for Equation (14), the formula for the uni-directional component of the inrush current is obtained:
Figure 6. Replacement diagram of HTS transformer at core saturation.
When the W switch is closed at t = 0, the circuit from Figure 6 is described by the equation:
e = −√
2E sin ωt = Ri + Ldidt
(14)
The unidirectional current appears when the momentary value of the flux Φ exceedsthe value of the saturation flux of the core Φn, which takes place for ωt = −θ (Figure 7).

Energies 2021, 14, 6714 7 of 19
By converting Equation (13), including ωt = −θ and ϕ = Φn, a formula is obtained for theangle at which the unidirectional current pulse appears:
θ = cos−1 Φs −Φm −Φr
Φm(15)
Energies 2021, 14, 6714 7 of 19
Figure 6. Replacement diagram of HTS transformer at core saturation.
The unidirectional current appears when the momentary value of the flux ϕ exceeds the value of the saturation flux of the core Φn, which takes place for ωt = −θ (Figure 7). By converting Equation (13), including ωt = −θ and ϕ = Φn, a formula is obtained for the angle at which the unidirectional current pulse appears:
m
rms
ΦΦΦΦ −−= −1cosθ (15)
In Figure 7, the transformer is switched on when the voltage e passes through the zero value, i.e., for angle −π. The primary winding of the HTS transformer is in the su-perconductive state and its resistance is close to zero (R = R0). The flux reaches the satu-ration value of the transformer core Φs for the angle −θ. At this point, a unidirectional current pulse i appears. The increasing current pulse reaches the value of critical current of the primary winding i = Ic for the angle −θc. At this point, the primary winding of the transformer passes to the resistive state and its resistance increases to R = Rm. The falling unidirectional current pulse reaches the critical current at which the primary winding of the transformer returns to the superconductive state i = Icw for angle δcw. For the δ angle, the transformer core comes out of saturation and the unidirectional current i disappears. As a result of the two changes in the state of the circuit from Figure 6, the unidirectional current pulse i is described by three different equations: (1) for the value of i from −θ to −θc, (2) for the value of ic from −θc to δcw and (3) for the value of icw from δcw to δ.
Figure 7. Voltage, flux, current and resistance of a superconducting winding.
Under initial conditions, for ωt = −θ, the unidirectional current must have a value equal to zero. By substituting i = 0 and ωt = −θ for Equation (14), the formula for the uni-directional component of the inrush current is obtained:
Figure 7. Voltage, flux, current and resistance of a superconducting winding.
In Figure 7, the transformer is switched on when the voltage e passes through thezero value, i.e., for angle −π. The primary winding of the HTS transformer is in thesuperconductive state and its resistance is close to zero (R = R0). The flux reaches thesaturation value of the transformer core Φs for the angle −θ. At this point, a unidirectionalcurrent pulse i appears. The increasing current pulse reaches the value of critical currentof the primary winding i = Ic for the angle −θc. At this point, the primary winding of thetransformer passes to the resistive state and its resistance increases to R = Rm. The fallingunidirectional current pulse reaches the critical current at which the primary winding ofthe transformer returns to the superconductive state i = Icw for angle δcw. For the δ angle,the transformer core comes out of saturation and the unidirectional current i disappears.As a result of the two changes in the state of the circuit from Figure 6, the unidirectionalcurrent pulse i is described by three different equations: (1) for the value of i from −θ to−θc, (2) for the value of ic from −θc to δcw and (3) for the value of icw from δcw to δ.
Under initial conditions, for ωt = −θ, the unidirectional current must have a valueequal to zero. By substituting i = 0 and ωt = −θ for Equation (14), the formula for theunidirectional component of the inrush current is obtained:
i = −√
2EXZ2
RX sin ωt− cos ωt+(
RX sin θ + cos θ
)e−
RX (ωt+θ)
(16)
where:X = ωL (17)
andZ =
√R2 + X2 (18)
If the HTS transformer winding does not come out of the superconduction state, theunidirectional current pulse over its entire duration can be described by Equation (16).

Energies 2021, 14, 6714 8 of 19
By converting Equation (16) under boundary conditions ωt = δ and i = 0, the formula isobtained for the angle δ at which the unidirectional current disappears:
δ = tg−1 eRX γ − R
X sin γ− cos γ
RX e
RX γ + sin γ− R
X cos γ(19)
Now let us assume that the primary winding of the HTS transformer comes out of thesuperconducting state for angle −θc, as shown in Figure 7. At that point, Equation (16) isno longer correct. Assuming the boundary conditions i = Ic and ωt = −θc and introducingthem into Equation (16), the formula for angle θc is obtained:
θc = tg−1 IcZ2√
2EXA + B (20)
where parameter A is a given dependence:
A =e
RX τc(
sin τc − RX cos τc +
RX e
RX τc)
cos(θ − τc)(21)
and B is:
B =RX sin τc + cos τc − e
RX τc
sin τc − RX cos τc +
RX e
RX τc
(22)
By solving the general Equation (14) of the circuit from Figure 6, for the initial condi-tions i = Ic and ωt = −θc, the equation for the unidirectional current is obtained after theHTS transformer winding has passed to the resistive state:
ic = −√
2EXZ2
RX sin ωt− cos ωt+(
RX sin θc + cos θc
)e−
RX (ωt+θc)
+Ice−
RX (ωt+θc)
(23)
Equation (23) is valid as long as the primary winding of the HTS transformer is in theresistive state and for the longest time until the current pulse disappears.
Let us now assume that the primary winding of the HTS transformer returns to thesuperconductive state for angle δcw, as shown in Figure 7. The angle δcw is determined bysubstituting ic = Icw and ωt = δcw for Equation (23) and after transformations, the formulais obtained:
δcw = tg−1(
Ic − IcweRX γcw
) Z2√
2EXG + H (24)
where parameter G is a given dependence:
G =1(
RX e
RX γcw − R
X cos γcw + sin γcw
)cos(γcw − θc)
(25)
and H is:
H =e
RX γcw − R
X sin γcw − cos γcwRX e
RX γcw − R
X cos γcw + sin γcw(26)

Energies 2021, 14, 6714 9 of 19
By solving the general Equation (14) of the circuit from Figure 6, for the initial con-ditions i = Icw and ωt = δcw, the formula for the unidirectional current is obtained afterrecovering the state of superconductivity of the transformer winding:
icw = −√
2EXZ2
RX sin ωt− cos ωt−(
RX sin δcw − cos δcw
)e−
RX (ωt−δcw)
+Icwe−
RX (ωt−δcw)
(27)
For the δ angle (Figure 7) the unidirectional current pulse fades. The angle δ isdetermined by substituting icw = 0 and ωt = δ for formula (27) and after transformations,the relation is obtained:
δ = tg−1 IcwZ2√
2EXK + M (28)
where parameter K is a given dependence:
K =1(
RX e
RX αcw − R
X cos αcw + sin αcw
)cos(αcw + δcw)
(29)
and M is:
M =e
RX αcw − R
X sin αcw − cos αcwRX e
RX αcw − R
X cos αcw + sin αcw(30)
A block diagram of the algorithm for calculating the turn-on current using the givenformulas is shown in Figure 8.

Energies 2021, 14, 6714 10 of 19Energies 2021, 14, 6714 10 of 19
Figure 8. Block diagram of the calculation method. Figure 8. Block diagram of the calculation method.
Energies 2021, 14, 6714 11 of 19
5. Experimental Verification of Calculations
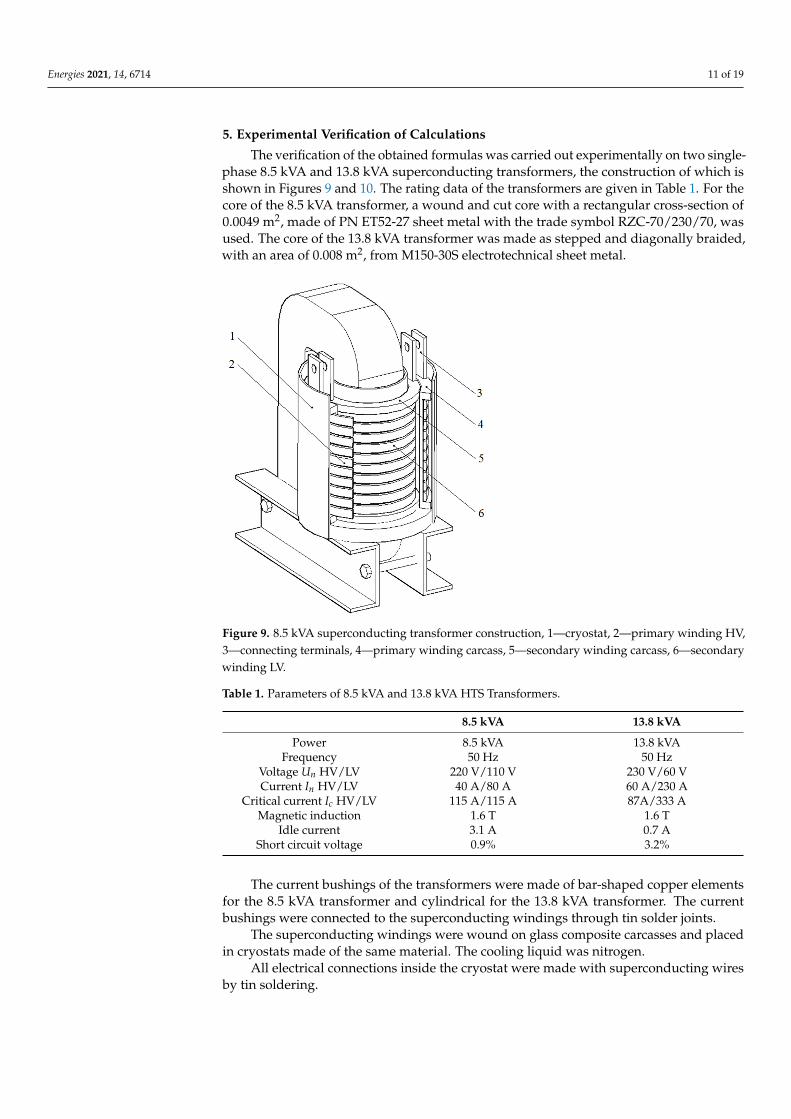
The verification of the obtained formulas was carried out experimentally on two single-phase 8.5 kVA and 13.8 kVA superconducting transformers, the construction of which isshown in Figures 9 and 10. The rating data of the transformers are given in Table 1. For thecore of the 8.5 kVA transformer, a wound and cut core with a rectangular cross-section of0.0049 m2, made of PN ET52-27 sheet metal with the trade symbol RZC-70/230/70, wasused. The core of the 13.8 kVA transformer was made as stepped and diagonally braided,with an area of 0.008 m2, from M150-30S electrotechnical sheet metal.
Energies 2021, 14, 6714 11 of 19
5. Experimental Verification of Calculations The verification of the obtained formulas was carried out experimentally on two
single-phase 8.5 kVA and 13.8 kVA superconducting transformers, the construction of which is shown in Figures 9 and 10. The rating data of the transformers are given in Table 1. For the core of the 8.5 kVA transformer, a wound and cut core with a rectangular cross-section of 0.0049 m2, made of PN ET52-27 sheet metal with the trade symbol RZC-70/230/70, was used. The core of the 13.8 kVA transformer was made as stepped and diagonally braided, with an area of 0.008 m2, from M150-30S electrotechnical sheet metal.
The current bushings of the transformers were made of bar-shaped copper elements for the 8.5 kVA transformer and cylindrical for the 13.8 kVA transformer. The current bushings were connected to the superconducting windings through tin solder joints.
Table 1. Parameters of 8.5 kVA and 13.8 kVA HTS Transformers.
8.5 kVA 13.8 kVA Power 8.5 kVA 13.8 kVA
Frequency 50 Hz 50 Hz Voltage Un HV/LV 220 V/110 V 230 V/60 V Current In HV/LV 40 A/80 A 60 A/230 A
Critical current Ic HV/LV 115 A/115 A 87A/333 A Magnetic induction 1.6 T 1.6 T
Idle current 3.1 A 0.7 A Short circuit voltage 0.9% 3.2%
Figure 9. 8.5 kVA superconducting transformer construction, 1—cryostat, 2—primary winding HV, 3—connecting terminals, 4—primary winding carcass, 5—secondary winding carcass, 6—secondary winding LV.
Figure 9. 8.5 kVA superconducting transformer construction, 1—cryostat, 2—primary winding HV,3—connecting terminals, 4—primary winding carcass, 5—secondary winding carcass, 6—secondarywinding LV.
Table 1. Parameters of 8.5 kVA and 13.8 kVA HTS Transformers.
8.5 kVA 13.8 kVA
Power 8.5 kVA 13.8 kVAFrequency 50 Hz 50 Hz
Voltage Un HV/LV 220 V/110 V 230 V/60 VCurrent In HV/LV 40 A/80 A 60 A/230 A
Critical current Ic HV/LV 115 A/115 A 87A/333 AMagnetic induction 1.6 T 1.6 T
Idle current 3.1 A 0.7 AShort circuit voltage 0.9% 3.2%
The current bushings of the transformers were made of bar-shaped copper elementsfor the 8.5 kVA transformer and cylindrical for the 13.8 kVA transformer. The currentbushings were connected to the superconducting windings through tin solder joints.
The superconducting windings were wound on glass composite carcasses and placedin cryostats made of the same material. The cooling liquid was nitrogen.
All electrical connections inside the cryostat were made with superconducting wiresby tin soldering.

Energies 2021, 14, 6714 12 of 19Energies 2021, 14, 6714 12 of 19
Figure 10. Construction of a 13.8 kVA superconducting transformer, 1—cryostat, 2—primary winding carcass, 3—primary winding HV, 4—current bushings, 5—secondary winding carcass, 6—secondary winding LV, 7—channels cooling.
The superconducting windings were wound on glass composite carcasses and placed in cryostats made of the same material. The cooling liquid was nitrogen.
All electrical connections inside the cryostat were made with superconducting wires by tin soldering.
The primary winding of the 8.5 kVA transformer uses the SCS4050 superconducting tape (SuperPower Inc., Glenville, WV, USA) with a minimum critical current of 115 A, at 77 K and in its own field. For the primary winding of the 13.8 kVA transformer, the SCS4050-AP type tape with a minimum critical current of 87 A. The secondary winding of the 8.5 kVA transformer is made of SCS4050 tape and the 13.8 kVA transformer is made of SCS12050-AP tape with a minimum critical current of 333 A, at 77 K and in its own field. The parameters of the transformer windings used in the measurements are listed in Table 2. The SCS tapes have a layered structure consisting of a 1.6 μm thick (RE)BCO type superconductor and several layers of resistive materials (Figure 11). The total thickness of the SCS4050 tape is 0.1 mm and the width is 4 mm. The SCS12050-AP differs in width of 12 mm. The winding resistances of the two transformers for different states of operation are given in Table 2.
Figure 11. Structure of SCS tape made by SuperPower Inc.: 1—copper, 2—silver, 3—(Re)BCO, 4—Buffer zone, 5—Hastelloy, 6—silver, 7—copper.
Figure 10. Construction of a 13.8 kVA superconducting transformer, 1—cryostat, 2—primary windingcarcass, 3—primary winding HV, 4—current bushings, 5—secondary winding carcass, 6—secondarywinding LV, 7—channels cooling.
The primary winding of the 8.5 kVA transformer uses the SCS4050 superconductingtape (SuperPower Inc., Glenville, WV, USA) with a minimum critical current of 115 A,at 77 K and in its own field. For the primary winding of the 13.8 kVA transformer, theSCS4050-AP type tape with a minimum critical current of 87 A. The secondary winding ofthe 8.5 kVA transformer is made of SCS4050 tape and the 13.8 kVA transformer is madeof SCS12050-AP tape with a minimum critical current of 333 A, at 77 K and in its ownfield. The parameters of the transformer windings used in the measurements are listed inTable 2. The SCS tapes have a layered structure consisting of a 1.6 µm thick (RE)BCO typesuperconductor and several layers of resistive materials (Figure 11). The total thickness ofthe SCS4050 tape is 0.1 mm and the width is 4 mm. The SCS12050-AP differs in width of12 mm. The winding resistances of the two transformers for different states of operationare given in Table 2.
Table 2. Winding parameters.
8.5 kVA 13.8 kVA
Resistance of windings HV/LV (293 K) 6.36 Ω/3.1 Ω
2.9 Ω/0.57 Ω
Resistance of windings HV/LV (77 K) 0.055 aΩ/0.027 aΩ
0.0466 aΩ/0.0097 aΩ
Resistance of the HV/LV winding aftertransition to a resistive state (77 K)
27 µΩ/13 µΩ
23 µΩ/5 µΩ
Winding inductance HV/LV 1.7 mH/0.4 mH
290 µH/18 µH
Winding cross-sectional area HV 0.0138 m2 0.0244 m2
Length of the winding wires HV/LV 55 m/27 m
68 m/28 m

Energies 2021, 14, 6714 13 of 19
Energies 2021, 14, 6714 12 of 19
Figure 10. Construction of a 13.8 kVA superconducting transformer, 1—cryostat, 2—primary winding carcass, 3—primary winding HV, 4—current bushings, 5—secondary winding carcass, 6—secondary winding LV, 7—channels cooling.
The superconducting windings were wound on glass composite carcasses and placed in cryostats made of the same material. The cooling liquid was nitrogen.
All electrical connections inside the cryostat were made with superconducting wires by tin soldering.
The primary winding of the 8.5 kVA transformer uses the SCS4050 superconducting tape (SuperPower Inc., Glenville, WV, USA) with a minimum critical current of 115 A, at 77 K and in its own field. For the primary winding of the 13.8 kVA transformer, the SCS4050-AP type tape with a minimum critical current of 87 A. The secondary winding of the 8.5 kVA transformer is made of SCS4050 tape and the 13.8 kVA transformer is made of SCS12050-AP tape with a minimum critical current of 333 A, at 77 K and in its own field. The parameters of the transformer windings used in the measurements are listed in Table 2. The SCS tapes have a layered structure consisting of a 1.6 μm thick (RE)BCO type superconductor and several layers of resistive materials (Figure 11). The total thickness of the SCS4050 tape is 0.1 mm and the width is 4 mm. The SCS12050-AP differs in width of 12 mm. The winding resistances of the two transformers for different states of operation are given in Table 2.
Figure 11. Structure of SCS tape made by SuperPower Inc.: 1—copper, 2—silver, 3—(Re)BCO, 4—Buffer zone, 5—Hastelloy, 6—silver, 7—copper.
Figure 11. Structure of SCS tape made by SuperPower Inc.: 1—copper, 2—silver, 3—(Re)BCO,4—Buffer zone, 5—Hastelloy, 6—silver, 7—copper.
The transformers are described in more detail in the articles [49,50]. The data neededfor the calculations were obtained from the inrush current measurements described inthe article [51]. The measurement system in which the inrush current was measured isshown in Figures 12 and 13 shows the electrical circuit diagram. The current waveformwas recorded indirectly by measuring the voltage drop across the shunt. The power circuitparameters are given in Table 3. The resistance of the shunt was 1 mΩ a class of accuracy0.5. The electrical connections were made with copper wires with a conductor diameter of6 mm and a total length of 3 m. The resistance of the power cables was 11 mΩ, while theinductance is negligibly small. The power source was a 230 V/0 ÷ 230 V autotransformerwith a power output of 23.4 kVA. The resistance of the power source was 1.5 Ω and itsimpedance was 128 mH. Power on the HTS transformer was performed when the automaticswitching system detected the grid voltage passing through zero. The switching circuitwas an electronic circuit of our own design. Simultaneously, the data acquisition systemusing the NI DAQ PCI-6280 card and a PC with an application written in the LabVIEWenvironment was started.
Energies 2021, 14, 6714 13 of 19
Table 2. Winding parameters.
8.5 kVA 13.8 kVA
Resistance of windings HV/LV (293 K) 6.36 Ω/ 3.1 Ω
2.9 Ω/ 0.57 Ω
Resistance of windings HV/LV (77 K) 0.055 aΩ/ 0.027 aΩ
0.0466 aΩ/ 0.0097 aΩ
Resistance of the HV/LV winding after transition to a resistive state (77 K)
27 μΩ/ 13 μΩ
23 μΩ/ 5 μΩ
Winding inductance HV/LV 1.7 mH/ 0.4 mH
290 μH/ 18 μH
Winding cross-sectional area HV 0.0138 m2 0.0244 m2
Length of the winding wires HV/LV 55 m/ 27 m
68 m/ 28 m
The transformers are described in more detail in the articles [49,50]. The data needed for the calculations were obtained from the inrush current measurements described in the article [51]. The measurement system in which the inrush current was measured is shown in Figures 12 and 13 shows the electrical circuit diagram. The current waveform was recorded indirectly by measuring the voltage drop across the shunt. The power cir-cuit parameters are given in Table 3. The resistance of the shunt was 1 mΩ a class of ac-curacy 0.5. The electrical connections were made with copper wires with a conductor diameter of 6 mm and a total length of 3 m. The resistance of the power cables was 11 mΩ, while the inductance is negligibly small. The power source was a 230 V/0 ÷ 230 V autotransformer with a power output of 23.4 kVA. The resistance of the power source was 1.5 Ω and its impedance was 128 mH. Power on the HTS transformer was performed when the automatic switching system detected the grid voltage passing through zero. The switching circuit was an electronic circuit of our own design. Simultaneously, the data acquisition system using the NI DAQ PCI-6280 card and a PC with an application written in the LabVIEW environment was started.
Figure 12. Measuring system.
Figure 13. Electrical circuit diagram.
Figure 12. Measuring system.
Energies 2021, 14, 6714 13 of 19
Table 2. Winding parameters.
8.5 kVA 13.8 kVA
Resistance of windings HV/LV (293 K) 6.36 Ω/ 3.1 Ω
2.9 Ω/ 0.57 Ω
Resistance of windings HV/LV (77 K) 0.055 aΩ/ 0.027 aΩ
0.0466 aΩ/ 0.0097 aΩ
Resistance of the HV/LV winding after transition to a resistive state (77 K)
27 μΩ/ 13 μΩ
23 μΩ/ 5 μΩ
Winding inductance HV/LV 1.7 mH/ 0.4 mH
290 μH/ 18 μH
Winding cross-sectional area HV 0.0138 m2 0.0244 m2
Length of the winding wires HV/LV 55 m/ 27 m
68 m/ 28 m
The transformers are described in more detail in the articles [49,50]. The data needed for the calculations were obtained from the inrush current measurements described in the article [51]. The measurement system in which the inrush current was measured is shown in Figures 12 and 13 shows the electrical circuit diagram. The current waveform was recorded indirectly by measuring the voltage drop across the shunt. The power cir-cuit parameters are given in Table 3. The resistance of the shunt was 1 mΩ a class of ac-curacy 0.5. The electrical connections were made with copper wires with a conductor diameter of 6 mm and a total length of 3 m. The resistance of the power cables was 11 mΩ, while the inductance is negligibly small. The power source was a 230 V/0 ÷ 230 V autotransformer with a power output of 23.4 kVA. The resistance of the power source was 1.5 Ω and its impedance was 128 mH. Power on the HTS transformer was performed when the automatic switching system detected the grid voltage passing through zero. The switching circuit was an electronic circuit of our own design. Simultaneously, the data acquisition system using the NI DAQ PCI-6280 card and a PC with an application written in the LabVIEW environment was started.
Figure 12. Measuring system.
Figure 13. Electrical circuit diagram. Figure 13. Electrical circuit diagram.

Energies 2021, 14, 6714 14 of 19
Table 3. Electrical circuit parameters.
Power Source Supply Line Shunt Transformer
LZ RZ EZ fZ LL RL Rb8.5 kVA 13.8 kVA
RFe Xµ RFe Xµ
128 mH 1.5 Ω 230 V 50 Hz 0 11 mΩ 1 mΩ 960 Ω 71 Ω 1104 Ω 224 Ω
Comparisons of the first inrush current pulses shown in Figures 14 and 15 show thediscrepancies in the waveforms of the measured and calculated pulses.
Energies 2021, 14, 6714 14 of 19
Table 3. Electrical circuit parameters.
Power Source Supply Line Shunt Transformer 8.5 kVA 13.8 kVA
LZ RZ EZ fZ LL RL Rb RFe Xμ RFe Xμ
128 mH 1.5 Ω 230 V 50 Hz 0 11 mΩ 1 mΩ 960 Ω 71 Ω 1104 Ω 224 Ω
Comparisons of the first inrush current pulses shown in Figures 14 and 15 show the discrepancies in the waveforms of the measured and calculated pulses.
For the 8.5 kVA HTS transformer, the calculated unidirectional current impulse starts approximately 14 degrees earlier and ends approximately 17 degrees after the current pulse obtained from the measurements. The offset between the pulse peaks is approximately 9 degrees. The maximum measured current is 178 A and the calculated current is 178.2 A.
With the HTS 13.8 kVA transformer, the length of both pulses is similar. However, there is a delay, an impulse calculated relative to the measured one, of approximately 18 degrees at the base and 30 degrees at the top. The maximum measured current is 257.2 A and the calculated current is 260.7 A.
Figure 14. First impulse of the inrush current of the 8.5 kVA HTS transformer, measured and cal-culated.
Figure 15. First impulse of inrush current of the 13.8 kVA HTS transformer measured and calculated.
Figure 14. First impulse of the inrush current of the 8.5 kVA HTS transformer, measured and calculated.
Energies 2021, 14, 6714 14 of 19
Table 3. Electrical circuit parameters.
Power Source Supply Line Shunt Transformer 8.5 kVA 13.8 kVA
LZ RZ EZ fZ LL RL Rb RFe Xμ RFe Xμ
128 mH 1.5 Ω 230 V 50 Hz 0 11 mΩ 1 mΩ 960 Ω 71 Ω 1104 Ω 224 Ω
Comparisons of the first inrush current pulses shown in Figures 14 and 15 show the discrepancies in the waveforms of the measured and calculated pulses.
For the 8.5 kVA HTS transformer, the calculated unidirectional current impulse starts approximately 14 degrees earlier and ends approximately 17 degrees after the current pulse obtained from the measurements. The offset between the pulse peaks is approximately 9 degrees. The maximum measured current is 178 A and the calculated current is 178.2 A.
With the HTS 13.8 kVA transformer, the length of both pulses is similar. However, there is a delay, an impulse calculated relative to the measured one, of approximately 18 degrees at the base and 30 degrees at the top. The maximum measured current is 257.2 A and the calculated current is 260.7 A.
Figure 14. First impulse of the inrush current of the 8.5 kVA HTS transformer, measured and cal-culated.
Figure 15. First impulse of inrush current of the 13.8 kVA HTS transformer measured and calculated. Figure 15. First impulse of inrush current of the 13.8 kVA HTS transformer measured and calculated.
For the 8.5 kVA HTS transformer, the calculated unidirectional current impulse startsapproximately 14 degrees earlier and ends approximately 17 degrees after the current pulseobtained from the measurements. The offset between the pulse peaks is approximately9 degrees. The maximum measured current is 178 A and the calculated current is 178.2 A.
With the HTS 13.8 kVA transformer, the length of both pulses is similar. However,there is a delay, an impulse calculated relative to the measured one, of approximately18 degrees at the base and 30 degrees at the top. The maximum measured current is 257.2 Aand the calculated current is 260.7 A.
The time for which the 8.5 kVA transformer winding is in the resistive state is 3.6 msfor the results obtained from the measurements and 4.4 ms for the results obtained from

Energies 2021, 14, 6714 15 of 19
the calculations. In the case of a 13.8 kVA transformer, the time for which the primarywinding is in the resistive state is 5.5 ms for the results obtained from the measurementsand 6.3 ms for the results obtained from the calculations.
Figures 16 and 17 compare the first five inrush current pulses of both transformers.Table 4 shows a comparison of the measured and calculated maximum values of the firstfour inrush current pulses of the discussed transformers. Table 5 shows the duration ofthe first four current pulses for the transformers and Table 6 shows the durations of theinterruptions without current between the individual inrush current pulses.
Energies 2021, 14, 6714 15 of 19
The time for which the 8.5 kVA transformer winding is in the resistive state is 3.6 ms for the results obtained from the measurements and 4.4 ms for the results obtained from the calculations. In the case of a 13.8 kVA transformer, the time for which the primary winding is in the resistive state is 5.5 ms for the results obtained from the measurements and 6.3 ms for the results obtained from the calculations.
Figures 16 and 17 compare the first five inrush current pulses of both transformers. Table 4 shows a comparison of the measured and calculated maximum values of the first four inrush current pulses of the discussed transformers. Table 5 shows the duration of the first four current pulses for the transformers and Table 6 shows the durations of the interruptions without current between the individual inrush current pulses.
Figure 16. Five consecutive impulses of inrush current of 8.5 kVA HTS transformer, measured and calculated.
Figure 17. Five consecutive 13.8 kVA HTS transformer inrush current pulses, measured and cal-culated.
Figure 16. Five consecutive impulses of inrush current of 8.5 kVA HTS transformer, measuredand calculated.
Energies 2021, 14, 6714 15 of 19
The time for which the 8.5 kVA transformer winding is in the resistive state is 3.6 ms for the results obtained from the measurements and 4.4 ms for the results obtained from the calculations. In the case of a 13.8 kVA transformer, the time for which the primary winding is in the resistive state is 5.5 ms for the results obtained from the measurements and 6.3 ms for the results obtained from the calculations.
Figures 16 and 17 compare the first five inrush current pulses of both transformers. Table 4 shows a comparison of the measured and calculated maximum values of the first four inrush current pulses of the discussed transformers. Table 5 shows the duration of the first four current pulses for the transformers and Table 6 shows the durations of the interruptions without current between the individual inrush current pulses.
Figure 16. Five consecutive impulses of inrush current of 8.5 kVA HTS transformer, measured and calculated.
Figure 17. Five consecutive 13.8 kVA HTS transformer inrush current pulses, measured and cal-culated.
Figure 17. Five consecutive 13.8 kVA HTS transformer inrush current pulses, measured and calculated.

Energies 2021, 14, 6714 16 of 19
Table 4. Comparison of the maximum value of the inrush current pulses.
Pulse no. 1 2 3 4
8.5 kVAI (A) (Measurement) 178 81.8 51.9 36.3I (A) (Calculations) 178.2 79.3 50.2 36.1
δ, % (Error) −0.1 3.2 3.4 0.6
13.8 kVAI (A) (Measurement) 257.3 80.7 56.8 45.96I (A) (Calculations) 260.7 87.4 57.0 41.0
δ, % (Error) −1.3 −7.7 −0.4 12.1
Table 5. Comparison of the duration of inrush current pulses.
Pulse no. 1 2 3 4
8.5 kVAγ, (Measurement) 117.6 77 62,1 56.8γ, (Calculations) 148 92.4 73.4 62
δ, % (Error) −20.5 −16.7 −15.4 −8.4
13.8 kVAγ, (Measurement) 156.5 88.2 80.7 76.5γ, (Calculations) 144.6 81.1 73.8 69.8
δ, % (Error) 8.2 8.8 9.3 9.6
Table 6. Comparison of the duration of the out-of-current interruptions between current pulses.
Pulse no. 1–2 2–3 3–4 4–5
8.5 kVAε, (Measurement) 272.9 291.9 297.2 313.9ε, (Calculations) 247.6 278.2 292.8 302.4
δ, % (Error) 10.2 4.9 1.5 3.8
13.8 kVAε, (Measurement) 255.3 80.2 56.5 45.2ε, (Calculations) 260.7 78 58.9 49.2
δ, % (Error) −2.1 2.8 −4.1 −8.1
6. Conclusions
The proposed method allows the calculation of the inrush current parameters forsuperconducting transformers with the knowledge of basic electrical quantities (resistance,inductance, voltage) using relatively simple mathematical formulas. These formulas canbe easily used in one’s own computer programs for calculating the inrush current of bothnewly designed and existing transformers. Based on the formulas given, not only themaximum value of the inrush current can be estimated, but also the maximum value of allsubsequent impulses of this current. It can be estimated by how much the inrush currentof the individual pulses exceeds the critical value for the superconductor from which thetransformer windings are made. It can also be estimated for how long this individualpulses overshoot will last, and thus how long the superconducting windings will be in aresistive state. The resistive state of superconducting windings should be treated as a statethreatening to break the continuity of windings as a result of their thermal damage.
Verification of the results obtained from the calculations with the results obtainedfrom the measurements was carried out only for two superconducting transformers of8.5 kVA and 13.8 kVA. Although good compliance of the inrush current waveforms hasbeen achieved, there is no confirmation of equally good compliance for more transformers,especially for medium and high-power transformers.
Differences in measured and calculated current pulses cannot be overlooked. Thesimplified shape of the magnetisation curve used in the calculations (Figure 5) translatesinto differences in the basis of the calculated and actual current pulses. These differences areexacerbated by the omission in the calculations of the steady-state component of the turn-oncurrent, which is in fact the idle current of the transformer. The disadvantage of this methodis the lack of consideration of changes in resistance of the transformer winding as a functionof temperature changes of the superconductor resulting from the Joule-Lenz phenomenon.

Energies 2021, 14, 6714 17 of 19
This is visible in the symmetry of the calculated impulse of the inrush current, which hasthe same course of ascending and descending slope, differing from the real course, inwhich the time of current loss is longer than the time of ascending (Figures 14 and 15). Thedifferences between the turn-on current obtained from the measurements and simulationsare also caused by the simplified transition characteristics of the superconductor adoptedfor the calculations.
The present considerations should make us aware of the differences in the inrushcurrent of conventional and superconducting transformers. The calculation of the in-rush current of a superconducting transformer from the formulae valid for conventionaltransformers must lead to large differences between the measured and calculated values.
Funding: This research received no external funding.
Institutional Review Board Statement: Not applicable.
Informed Consent Statement: Not applicable.
Data Availability Statement: Not applicable.
Conflicts of Interest: The authors declare no conflict of interest.
Nomenclature
A Winding cross-sectional area,Ak Iron cross sectional area of column core,Bm Maximum induction at normal transformer operation,Br Residual magnetism induction,Bs Saturation induction,e Circuit supply voltage,e1 Voltage induced in the transformer winding by the main flux,E Effective value of the circuit supply voltage,HM magnetic field strength after switching on the transformer,i Current in the circuit,iµ Reactive component of the transformer’s no load current,IFe Active component of the transformer’s idle current,Ic Critical current of the transformer’s primary winding,Icw Current at which the winding regains its superconductive state,L Inductance in the circuit when the transformer core is saturated,Lµ Inductance of the magnetisation branch of the transformer diagram,R Resistance of the circuit,RFe Resistance of the magnetisation branch of the transformer diagram,t Time,X Circuit reactance,N Number of primary windings of the transformer,Z Circuit impedance,α Voltage phase angle,δ Angle of phase shift between flow and voltage,ϕ Magnetic flux,ϕf Fixed magnetic flux component,ϕd Magnetic flux disturbing component,Φ Effective value of the flux,Φm Maximum flux in the core,ΦM Peak value of the flux,Φr Residual magnetism flux,Φs Saturation flux of the transformer core,ω Pulse

Energies 2021, 14, 6714 18 of 19
References1. Steurer, M.; Frohlich, K. The Impact of Inrush Current on the mechanical stress on high voltage power transformer coils. IEEE
Trans. Power Deliv. 2002, 17, 155–160. [CrossRef]2. Prikler, L.; Bánfai, G.; Bán, G.; Becker, P. Reducing the magnetizing inrush current by means of controlled energization and
de-energization of large power transformers. Electr. Power Syst. Res. 2006, 76, 642–649. [CrossRef]3. Turner, R.A.; Smith, K.S. Transformer Inrush Current. IEEE Ind. Appl. Mag. 2010, 16, 14–19. [CrossRef]4. Kasztenny, B. Impact of Transformer Inrush Current on Sensitive Protection Functions. In Proceedings of the IEEE/PES
Transmission and Distribution Conference and Exhibition, Dallas, TX, USA, 21–24 May 2006. [CrossRef]5. Oliveira, A.R.J.C.; Apolonio, R.; Bronzeado, H.S. A Controlled Switching Methodology for Transformer Inrush Current Elimina-
tion: Theory and Experimental Validation. In Proceedings of the 11th International Conference on Electrical Power Quality andUtilisation, Lisbon, Portugal, 17–19 October 2011; pp. 1–6. [CrossRef]
6. Chiesa, N.; Hoidalen, H.K. Novel approach for reducing transformer inrush currents: Laboratory measurements, analyticalinterpretation and simulation studies. IEEE Trans. Power Deliv. 2010, 25, 2609–2616. [CrossRef]
7. Abdulsalam, S.G.; Xu, W. A sequential phase energization method for transformer inrush current reduction—Transient perfor-mance and practical considerations. IEEE Trans. Power Deliv. 2007, 22, 208–216. [CrossRef]
8. Taylor, D.I.; Law, J.D.; Johnson, B.K.; Fischer, N. Single-phase transformer inrush current reduction using prefluxing. IEEE Trans.Power Deliv. 2012, 27, 245–253. [CrossRef]
9. Persson, M.; Baig, W.; Thiringer, T. Measurements and modelling of threeand five-limb transformer behaviour during largevoltage and frequency disturbances. IET Gener. Transm. Distrib. 2016, 10, 334–340. [CrossRef]
10. Rico, J.J.; Acha, E.; Madrigal, M. The study of inrush current phenomenon using operational matrices. IEEE Trans. Power Deliv.2001, 16, 231–237. [CrossRef]
11. Adly, A. Computation of inrush current forces on transformer windings. IEEE Trans. Magn. 2001, 37, 2855–2857. [CrossRef]12. Wu, Q.; Jazebi, S.; Leon, D.F. Parameter estimation of three-phase transformer models for low-frequency transient studies from
terminal measurements. IEEE Trans. Magn. 2017, 53, 710–718. [CrossRef]13. Specht, T.R. Transformer magnetizing inrush current. Trans. Am. Inst. Electr. Eng. 1951, 70, 323–328. [CrossRef]14. Holcomb, J.E. Distribution transformer magnetizing inrush current. Trans. Am. Inst. Electr. Eng. Part III Power Appar. Syst. 1961,
80, 697–702. [CrossRef]15. Specht, T.R. Transformer Inrush and Rectifier Transient Currents. IEEE Trans. Power Appar. Syst. 1969, PAS-88, 269–276. [CrossRef]16. Jamali, M.; Mirzaie, M.; Asghar Gholamian, S. Calculation and Analysis of Transformer Inrush Current Based on Parameters of
Transformer and Operating Conditions. Electron. Electr. Eng. 2011, 109, 17–20. [CrossRef]17. Yacamini, R.; Abu-Nasser, A. Numerical calculation of inrush current in single-phase transformers. IEEE Proc. B Electr. Power Appl.
1981, 128, 327–328. [CrossRef]18. Vanti, M.G.; Bertoli, S.L.; Cabrai, S.H.L.; Gerent, A.G.; Kuo-Peng, P. Semianalytic solution for a simple model of inrush currents in
transformers. IEEE Trans. Magn. 2008, 44, 1270–1273. [CrossRef]19. Chen, X.; Venkata, S.S. A three-phase three-winding core-type transformer model for low-frequency transient studies. IEEE Power
Eng. Rev. 1997, 17, 85–86. [CrossRef]20. Chen, S.D.; Lin, R.L.; Cheng, C.K. Magnetizing inrush model of transformers based on structure parameters. IEEE Trans.
Power Deliv. 2005, 20, 1947–1954. [CrossRef]21. Chiesa, N.; Hidalen, H.K.; Mork, B.A. Transformer model for inrush current calculations: Simulations, measurements and
sensitivity analysis. IEEE Trans. Power Deliv. 2010, 25, 2599–2608. [CrossRef]22. Faiz, J.; Saffari, S. Inrush current modeling in a single-phase transformer. IEEE Trans. Magn. 2010, 46, 578–581. [CrossRef]23. Abdulsalam, S.G.; Xu, W.; Neves, W.; Liu, X. Estimation of transformer saturation characteristics from inrush current waveforms.
IEEE Trans. Power Deliv. 2006, 21, 170–177. [CrossRef]24. Naghizadeh, R.A.; Vahidi, B.; Hosseinian, S.H. Modelling of inrush current in transformers using inverse Jiles–Atherton hysteresis
model with a neuroshuffled frog-leaping algorithm approach. IET Electr. Power Appl. 2012, 6, 727–728. [CrossRef]25. Liu, J.; Dinavahi, V. Detailed magnetic equivalent circuit based real-time nonlinear power transformer model on FPGA for
electromagnetic transient studies. IEEE Trans. Ind. Electron. 2016, 63, 1191–1202. [CrossRef]26. Wang, Y.; Abdulsalam, S.G.; Xu, W. Analytical formula to estimate the maximum inrush current. IEEE Trans. Power Deliv. 2008,
23, 1266–1268. [CrossRef]27. Jazebi, S.; de Leon, F.; Wu, N. Enhanced analytical method for the calculation of the maximum inrush currents of single-phase
power transformers. IEEE Trans. Power Deliv. 2015, 30, 2590–2599. [CrossRef]28. Zirka, S.E.; Moroz, Y.I.; Arturi, C.M.; Chiesa, N.; Hoidalen, H.K. Topology-correct reversible transformer model. IEEE Trans.
Power Deliv. 2012, 27, 2037–2045. [CrossRef]29. Girgis, R.S.; Tenyenuis, E.G. Characteristics of inrush current of present designs of power transformers. IEEE Power Eng. Soc.
Gen. Meet. 2007, 12, 1–6. [CrossRef]30. Bertagnolli, G. Short-Circuit Duty of Power Transformers: The ABB Approach; ABB Trasformatori: Golinelli, Formigine, 1996.31. Nishimiya, S.; Ishigohka, T.; Ninomiya, A.; Arai, K. Quench Characteristic of Superconducting Transformer by Inrush Current.
IEEE Trans. Appl. Supercond. 2007, 17, 1931–1934. [CrossRef]
Energies 2021, 14, 6714 19 of 19
32. Meinert, M.; Binder, A. Active damping of inrush and DC-currents for high temperature Superconducting (HTS)-transformers onrail vehicles. IEEE Trans. Appl. Supercond. 2005, 15, 1851–1854. [CrossRef]
33. Abdul Rahman, M.A.; Lie, T.T.; Prasad, K. The Effects of Short-Circuit and Inrush Currents on HTS Transformer Windings. IEEETrans. Appl. Supercond. 2012, 22, 5500108. [CrossRef]
34. Kalsi, S.S. Applications of High Temperature Superconductors to Electric Power Equipment; Wiley-IEEE Press: Piscataway, NJ, USA, 2011.[CrossRef]
35. Xie, Y.; Marchevsky, M.; Zhang, X.; Lenseth, K.; Chen, Y.; Xiong, X.; Qiao, Y.; Rar, A.; Gogia, B.; Schmidt, R.; et al. Second-generation HTS conductor design and engineering for electrical power applications. IEEE Trans. Appl. Supercond. 2009,19, 3009–3013. [CrossRef]
36. Rupich, M.W.; Li, X.; Sathyamurthy, S.; Thieme, C.L.H.; DeMoranville, K.; Gannon, J.; Fleshler, S. Second Generation WireDevelopment at AMSC. IEEE Trans. Appl. Supercond. 2013, 23, 6601205. [CrossRef]
37. Nagasawa, T.; Yamaguchi, M.; Fukui, S.; Yamamoto, M. Design requirements of a high temperature superconducting transformer.Phys. C Supercond. 2002, 372–376, 1715–1718. [CrossRef]
38. Berger, A.; Cherevatskiy, S.; Noe, M.; Leibfried, T. Comparison of the efficiency of superconducting and conventional transformers.J. Phys. Conf. Ser. 2010, 234, 032004. [CrossRef]
39. Chang, H.; Choi, Y.S.; Sciver, S.W.; Baldwin, T.L. Cryogenic cooling temperature of HTS transformers for compactness andefficiency. IEEE Trans. Appl. Supercond. 2003, 13, 2298–2301. [CrossRef]
40. Wilson, M.N. Superconducting Magnets; Oxford University Press: New York, NY, USA, 1990.41. Lei, H.; Wang, K.; Hu, R.; Ryu, H.; Abeykoon, M.; Bozin, E.S.; Petrovic, C. Iron chalcogenide superconductors at high magnetic
fields. Sci. Technol. Adv. Mater. 2012, 13, 054305. [CrossRef]42. Yahiou, A.; Bayadi, A. Transformer core modeling for magnetizing inrush current investigation. Semantic Scholar. Mater. Sci.
2015, 1, 077–088.43. Yonezawa, R.; Noda, T.; Suzuki, N.; Nagashima, H.; Nomiyama, F.; Yamaguchi, N.; Honma, H.; Kitamura, S. Development
of a transformer magnetizing circuit model for inrush current and residual flux calculations. IEEE Trans. Power Energy 2014,134, 749–758. [CrossRef]
44. Vahidi, B.; Bank Tavakoli, M.R.; Gharehpetian, G.B.; Hosseinian, S.H. An Algorithm for Evaluating Inrush Current in TransformersUsing Jiles-Atherton Theory of Ferromagnetic Hysteresis. In Proceedings of the TENCON 2006—2006 IEEE Region 10 Conference,Hong Kong, China, 14–17 November 2006. [CrossRef]
45. Sima, W.; Liu, Y.; Sun, P.; Zhou, Y.; Peng, D.; Yang, M. The Effect of Different Core Materials on Transformer Inrush Currents. InProceedings of the IEEE International Magnetic Conference (INTERMAG), Singapore, 23–27 April 2018. [CrossRef]
46. Taillefer, P.; Poutrain, L.; Sanchez, J. Limiting Voltage Dips & Inrush Currents When Energizing Power Transformers ControlledSwitching of Gang Operated Switches—Theory and Case Study. In Proceedings of the 2018 IEEE/PES Transmission andDistribution Conference and Exposition (T & D), Denver, CO, USA, 16–19 April 2018. [CrossRef]
47. Huang, Z.; Jia, Z.; Li, Z. Research on Transformer Saturation Characteristics of Electric Locomotive Based on Flux—CurrentLoop Model. In Proceedings of the 2019 9th International Conference on Power and Energy Systems (ICPES), Perth, Australia,10–12 December 2019. [CrossRef]
48. Sonnemann, W.K.; Wagner, C.L.; Rockefeller, G.D. Magnetizing Inrush Phenomena in Transformer Banks. Trans. Am. Inst. Electr.Eng. Part III Power Appar. Syst. 1958, 77, 884–892. [CrossRef]
49. Wojtasiewicz, G.; Janowski, T.; Kozak, S.; Kozak, J.; Majka, M.; Kondratowicz-Kucewicz, B. Tests and Performance Analysis of 2GHTS Transformer. IEEE Trans. Appl. Supercond. 2013, 23, 5500505. [CrossRef]
50. Komarzyniec, G. 14 kVA superconducting transformer with (RE)BCO windings. In Proceedings of the 2017 InternationalConference on Electromagnetic Devices and Processes in Environment Protection with Seminar Applications of Superconductors(ELMECO & AoS), Nałeczów, Poland, 3–6 December 2017. [CrossRef]
51. Wojtasiewicz, G.; Komarzyniec, G.; Janowski, T.; Kozak, S.; Kozak, J.; Majka, M.; Kondratowicz-Kucewicz, B. Inrush Current ofSuperconducting Transformer. IEEE Trans. Appl. Supercond. 2013, 23, 5500304. [CrossRef]