Development and validation of the predicted heat strain model

Inverse correlation between the incidences of autoimmune diseaseand infection predicted by a model of T cell mediated tolerance
Kalet Leona,b, Jose Faroa*, Agustin Lageb, Jorge Carneiroa
aEstudos Avancados, Instituto Gulbenkian de Ciencia, Apartado 14, 2781-901 Oeiras, PortugalbCentro de Inmunologıa Molecular, Habana, Cuba
Received 4 June 2003; revised 11 October 2003; accepted 13 October 2003
Abstract
The contribution of pathogenic infections to the etiology of autoimmune diseases remains one of the outstanding problems inimmunology. According to the classical concept of antigen mimicry, a direct correlation between the incidence of autoimmunity andinfections would be expected. This view is supported by a few examples of autoimmune disorders, which are documented as beingcaused by infection with particular pathogens. In contrast, there are several experimental animal models where infection appears toprevent the onset of autoimmunity. Moreover, some epidemiological studies suggest an inverse correlation between the incidence ofautoimmunity and infections in human populations. Here we propose a solution to this puzzle based on a theoretical model oftolerance driven by regulatory T cells. The concepts here developed delineate the conditions predicting an inverse correlationbetween the incidence of autoimmunity and exposition to common infections, and those in which antigen mimicry and inflammationof target organs have a role in the etiology of specific autoimmune disorders.� 2003 Elsevier Ltd. All rights reserved.
1. Introduction
The increasing incidence of autoimmune and allergicdiseases in wealthy countries with occidental style oflife has been a clear and worrying trend in the last50 years [1–3]. Possible causes for that trend range fromchanges in food and sedentary habits, to environmentalchemical contamination, to stress due to faster rhythmof daily life. However, it is difficult to quantify properlythose factors, and hence how much they contribute tothat trend cannot be easily estimated for correlationpurposes in populations with different incidences ofautoimmunity.
More recently, a different view has emerged thatrelates the incidence of autoimmune diseases to therelative cleanliness of the immediate environment [4,5].Although there is no solid rationale for this view, it issupported by two independent lines of evidence. On theone hand, there are several epidemiological reports of a
north/south gradient for the incidence of autoimmunediseases in normal resident [6–9] and immigrating [10,11]human populations, which is inversely correlated withthe prevalence of some infectious diseases [5]. On theother hand, there are several experimental animalmodels where the onset of autoimmune syndromes isprevented by particular infections [12–14] or by rearingautoimmune-prone animal strains in conventional con-ditions instead of specific pathogen free or germ freeconditions [15,16]. As a whole, these observations hintedat a “hygiene” hypothesis [17] according to whichcommon infections may have a role in preventingautoimmunity.
Interestingly, the hygiene hypothesis seems to contra-dict the canonical view of autoimmunity as caused bythe cross-reactivity of a microbial antigen and somehost-antigen in the course of infection (antigenicmimicry [18]) or as a consequence of pathogen-inducedinflammation at the target organs [19,20]. These latterhypotheses would naturally predict a direct correlationbetween the incidence of autoimmunity and infections.Epidemiological studies have suggested such an associ-ation for some specific autoimmune diseases [6] and,
* Corresponding author. Tel.: +351-214-464-513; fax:+351-214-407-973
E-mail address: [email protected] (J. Faro).
Journal of Autoimmunity 22 (2004) 31–42
www.elsevier.com/locate/issn/08968411
0896-8411/04/$ - see front matter � 2003 Elsevier Ltd. All rights reserved.doi:10.1016/j.jaut.2003.10.002

further, antigenic mimicry has been documented in a fewof these cases—notably, streptococcal miocarditis [21],Lyme arthritis [22], rheumatoid arthritis [23]. A deeperanalysis revealed, however, that it is far from wellestablished in most autoimmune disorders [24,25].Nevertheless, the canonical view is also supported bydifferent animal models in which specific, pathologicautoimmune responses are triggered by experimentalinfections or proinflammatory adjuvants (reviewed [26]);or in which spontaneous [27] or iatrogenic [28,29]autoimmune syndromes are favored by commensal orinfectious microorganisms.
The apparent paradox that infection may be causingand preventing autoimmune diseases demands a deeperunderstanding of the mechanisms mediating naturaltolerance to host-antigens. Natural tolerance has beenproposed to involve a continuous and active process,because clonal deletion in primary lymphoid organs isrelatively inefficient in purging the lymphocyte reper-toire of self-reactivities [30]. A paradigm of the basis forthis active and continuous tolerance activity that isgaining rapidly a prominent status is that of regulatoryT cells [31], and specifically CD4+CD25+ T cells [32].These regulatory T cells are naturally generated in thethymus in a manner strictly dependent on major histo-compatibility complex (MHC)-Class II expression bycortical thymic epithelial cells [33], and they suppress theactivity of other potentially pathogenic auto-reactiveT cells both in vivo and in vitro [34,35]. Recently, wehave developed a mathematical model to assess the roleof these regulatory cells in natural tolerance [36–38]. Inthe present study, the etiology of autoimmunity pre-dicted by this model is explored. The results show that aview of natural tolerance based on regulatory T cells canprovide a simple rationale for an inverse correlationbetween the incidence of autoimmunity and infections,yet accounting also for the potential role of antigenmimicry in the etiology of some particular autoimmunedisorders.
2. The model and its basic properties
Our model considers the dynamics of three mutuallyinteracting cell populations [36]: (a) antigen presentingcells (APCs) displaying MHC-self-peptide complexes atthe membrane; (b) proinflammatory autoreactive T cells(P) that can potentially provoke autoimmunity; and (c)regulatory autoreactive T cells (R), which suppressproinflammatory T cells. See Appendix A for a math-ematical formulation. Three basic assumptions are madein this formulation. First, interactions between P and Rcells require the formation of multicellular conjugateswith APCs (Fig. 1). Second, the R cells inhibit theproliferation of P cells at the APC surface and do notproliferate when stimulated with APCs alone (Fig. 1,
panel A). This is in agreement with many experimentalobservations (reviewed in [32]) and has been justifiedelsewhere [36,37]. Third, the population of R cells ex-pands by P-cell dependent cell proliferation as suggestedby recent experimental data [39,40]. Finally, immunityand tolerance are interpreted, respectively, as the com-petitive exclusion of R cells by the expansion of P cellpopulation and the coexistence of both R and Pcell populations at equilibrium.
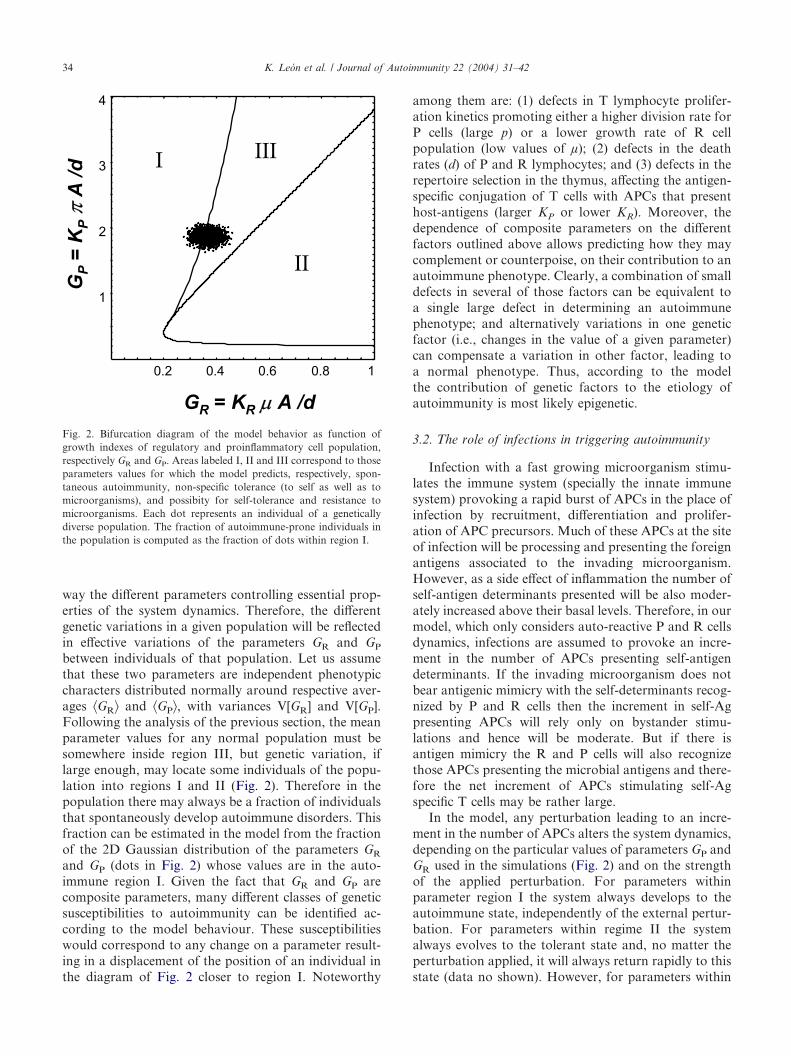
It has previously been shown that the particulardynamical behavior set into play in this model is deter-mined by two key composite parameters, GR=KR µ A/dand GP=KP � A/d, which represent the effective “growthindexes” of R and P cell populations respectively [36].These growth indexes are directly proportional to thenumber of APCs (A), to the strength of the conjugationbetween the APCs and the T cells (respectively KR andKP for regulatory and proinflammatory cells), and to themaximal growth rates of the R and P cells (respectivelyµ and �). They are inversely proportional to the deathrate of T cells (d). These two parameters define threeregions in the parameter space according to the resultingdynamic behavior (Fig. 2). For parameter values inregion I the system evolves always to an equilibriumstate in which there are no R cells, irrespective of theinitial proportion of P and R cells. Therefore, in thisparameter region autoimmunity will always emergespontaneously in the system. Parameter region II ischaracterized by an equilibrium state in which thepopulation of R cells controls the expansion of the P cellpopulation, independently of the initial proportion of Pand R cells. Here a stable tolerant state is alwaysobtained in the system. Therefore, in this parameterregime autoimmunity could not emerge in the system.Finally, in parameter region III the system is bi-stable,meaning that either the state in which no R cells arepresent (autoimmune disease) or the state in which Pand R cells coexist in stable balance (tolerance) can bereached depending on the initial proportions of P and Rcells. In this parameter regime the system can developinto a stable tolerant state. Although autoimmunity maybe induced in this state upon appropriate perturbations,healthy immune systems necessarily operate on thebi-stable regime of region III [36]. This is the onlycondition compatible with the observations that healthyanimals have significant numbers of both R and P cells,and that the incidence of autoimmune pathology ortolerance can be modulated in recipients adoptivelyreconstituted with different proportions of P and R cells.Furthermore, when many P and R cell sub-populationsdiffering in their antigen specificities were considered[38], only parameter values within region III lead totolerance to host-antigens while retaining the capacity tomount specific immune responses to infectious agents.In summary, inside region III a trade off betweentwo opposite selecting forces determines the optimal
K. Leon et al. / Journal of Autoimmunity 22 (2004) 31–4232

relationships between model parameters. On one hand,there is the need to minimize the risk of autoimmunity,which requires being as far as possible from region I.But, on the other hand, there is the need to minimize thesusceptibility to infections, therefore to maximize thesystem’s reactivity, which implies being as close aspossible to the interface with region I. Thus, in thistheoretical framework as in those proposed by others[41,42], the risk of autoimmunity is the price that mustbe paid for assuring immune responses to pathogens.
We have also studied a model variant in which theinteraction between P and R cells promotes the growthof regulatory populations by an R-dependent conver-sion of P cells to the regulatory phenotype [36]. Thisconversion of P cells was originally proposed by Qin etal. [43] and more recently brought into attention bystudies of human regulatory T cells [44,45]. The model
presented here and the variant with conversion of P cellsdisplay the same qualititative behaviour. Further, thesame behaviour was also recovered in computer simu-lations of many different clones of both P and R cells(for a description of this kind of simulations see [38])being in this sense rather generic.
3. Results
3.1. Genetics of autoimmunity
Autoimmunity could result from genetic defects, andindeed genetic associations have been largely observed inthe etiology of autoimmune disorders. In the model,genetic factors should affect in a combined and effective
Fig. 1. Illustration of the model of T cell mediated tolerance. A, Basic processes and interactions involving regulatory cells, proinflammatory cellsand APCs. B, A fast and large increment in the number of APCs “dilutes” the interactions between regulatory and proinflammatory cells, and leadsto the onset of autoimmunity. C, A slow stepwise increase in the numbers of APCs allows the adaptation of the regulatory cell population size, andreenforces tolerance.
K. Leon et al. / Journal of Autoimmunity 22 (2004) 31–42 33
way the different parameters controlling essential prop-erties of the system dynamics. Therefore, the differentgenetic variations in a given population will be reflectedin effective variations of the parameters GR and GP
between individuals of that population. Let us assumethat these two parameters are independent phenotypiccharacters distributed normally around respective aver-ages ^GR& and ^GP&, with variances V[GR] and V[GP].Following the analysis of the previous section, the meanparameter values for any normal population must besomewhere inside region III, but genetic variation, iflarge enough, may locate some individuals of the popu-lation into regions I and II (Fig. 2). Therefore in thepopulation there may always be a fraction of individualsthat spontaneously develop autoimmune disorders. Thisfraction can be estimated in the model from the fractionof the 2D Gaussian distribution of the parameters GR
and GP (dots in Fig. 2) whose values are in the auto-immune region I. Given the fact that GR and GP arecomposite parameters, many different classes of geneticsusceptibilities to autoimmunity can be identified ac-cording to the model behaviour. These susceptibilitieswould correspond to any change on a parameter result-ing in a displacement of the position of an individual inthe diagram of Fig. 2 closer to region I. Noteworthy
among them are: (1) defects in T lymphocyte prolifer-ation kinetics promoting either a higher division rate forP cells (large p) or a lower growth rate of R cellpopulation (low values of µ); (2) defects in the deathrates (d) of P and R lymphocytes; and (3) defects in therepertoire selection in the thymus, affecting the antigen-specific conjugation of T cells with APCs that presenthost-antigens (larger KP or lower KR). Moreover, thedependence of composite parameters on the differentfactors outlined above allows predicting how they maycomplement or counterpoise, on their contribution to anautoimmune phenotype. Clearly, a combination of smalldefects in several of those factors can be equivalent toa single large defect in determining an autoimmunephenotype; and alternatively variations in one geneticfactor (i.e., changes in the value of a given parameter)can compensate a variation in other factor, leading toa normal phenotype. Thus, according to the modelthe contribution of genetic factors to the etiology ofautoimmunity is most likely epigenetic.
3.2. The role of infections in triggering autoimmunity
Infection with a fast growing microorganism stimu-lates the immune system (specially the innate immunesystem) provoking a rapid burst of APCs in the place ofinfection by recruitment, differentiation and prolifer-ation of APC precursors. Much of these APCs at the siteof infection will be processing and presenting the foreignantigens associated to the invading microorganism.However, as a side effect of inflammation the number ofself-antigen determinants presented will be also moder-ately increased above their basal levels. Therefore, in ourmodel, which only considers auto-reactive P and R cellsdynamics, infections are assumed to provoke an incre-ment in the number of APCs presenting self-antigendeterminants. If the invading microorganism does notbear antigenic mimicry with the self-determinants recog-nized by P and R cells then the increment in self-Agpresenting APCs will rely only on bystander stimu-lations and hence will be moderate. But if there isantigen mimicry the R and P cells will also recognizethose APCs presenting the microbial antigens and there-fore the net increment of APCs stimulating self-Agspecific T cells may be rather large.
In the model, any perturbation leading to an incre-ment in the number of APCs alters the system dynamics,depending on the particular values of parameters GP andGR used in the simulations (Fig. 2) and on the strengthof the applied perturbation. For parameters withinparameter region I the system always develops to theautoimmune state, independently of the external pertur-bation. For parameters within regime II the systemalways evolves to the tolerant state and, no matter theperturbation applied, it will always return rapidly to thisstate (data no shown). However, for parameters within
Fig. 2. Bifurcation diagram of the model behavior as function ofgrowth indexes of regulatory and proinflammatory cell population,respectively GR and GP. Areas labeled I, II and III correspond to thoseparameters values for which the model predicts, respectively, spon-taneous autoimmunity, non-specific tolerance (to self as well as tomicroorganisms), and possibity for self-tolerance and resistance tomicroorganisms. Each dot represents an individual of a geneticallydiverse population. The fraction of autoimmune-prone individuals inthe population is computed as the fraction of dots within region I.
K. Leon et al. / Journal of Autoimmunity 22 (2004) 31–4234
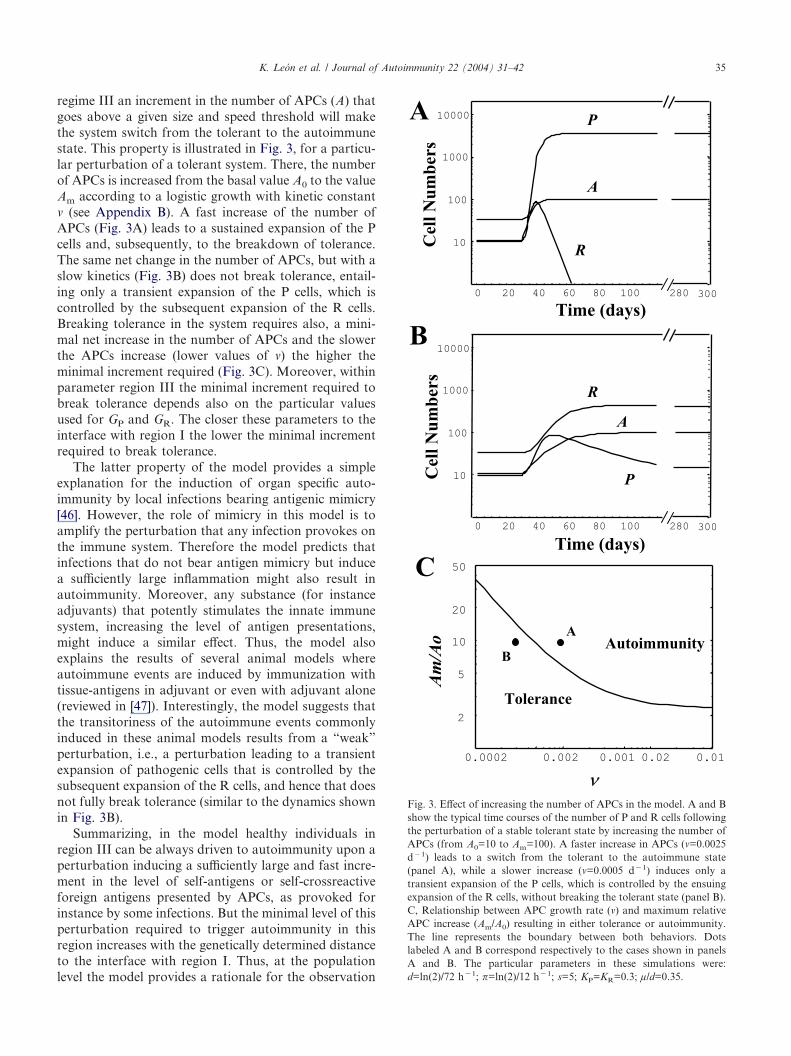
regime III an increment in the number of APCs (A) thatgoes above a given size and speed threshold will makethe system switch from the tolerant to the autoimmunestate. This property is illustrated in Fig. 3, for a particu-lar perturbation of a tolerant system. There, the numberof APCs is increased from the basal value A0 to the valueAm according to a logistic growth with kinetic constant� (see Appendix B). A fast increase of the number ofAPCs (Fig. 3A) leads to a sustained expansion of the Pcells and, subsequently, to the breakdown of tolerance.The same net change in the number of APCs, but with aslow kinetics (Fig. 3B) does not break tolerance, entail-ing only a transient expansion of the P cells, which iscontrolled by the subsequent expansion of the R cells.Breaking tolerance in the system requires also, a mini-mal net increase in the number of APCs and the slowerthe APCs increase (lower values of �) the higher theminimal increment required (Fig. 3C). Moreover, withinparameter region III the minimal increment required tobreak tolerance depends also on the particular valuesused for GP and GR. The closer these parameters to theinterface with region I the lower the minimal incrementrequired to break tolerance.
The latter property of the model provides a simpleexplanation for the induction of organ specific auto-immunity by local infections bearing antigenic mimicry[46]. However, the role of mimicry in this model is toamplify the perturbation that any infection provokes onthe immune system. Therefore the model predicts thatinfections that do not bear antigen mimicry but inducea sufficiently large inflammation might also result inautoimmunity. Moreover, any substance (for instanceadjuvants) that potently stimulates the innate immunesystem, increasing the level of antigen presentations,might induce a similar effect. Thus, the model alsoexplains the results of several animal models whereautoimmune events are induced by immunization withtissue-antigens in adjuvant or even with adjuvant alone(reviewed in [47]). Interestingly, the model suggests thatthe transitoriness of the autoimmune events commonlyinduced in these animal models results from a “weak”perturbation, i.e., a perturbation leading to a transientexpansion of pathogenic cells that is controlled by thesubsequent expansion of the R cells, and hence that doesnot fully break tolerance (similar to the dynamics shownin Fig. 3B).
Summarizing, in the model healthy individuals inregion III can be always driven to autoimmunity upon aperturbation inducing a sufficiently large and fast incre-ment in the level of self-antigens or self-crossreactiveforeign antigens presented by APCs, as provoked forinstance by some infections. But the minimal level of thisperturbation required to trigger autoimmunity in thisregion increases with the genetically determined distanceto the interface with region I. Thus, at the populationlevel the model provides a rationale for the observation
Fig. 3. Effect of increasing the number of APCs in the model. A and Bshow the typical time courses of the number of P and R cells followingthe perturbation of a stable tolerant state by increasing the number ofAPCs (from A0=10 to Am=100). A faster increase in APCs (�=0.0025d�1) leads to a switch from the tolerant to the autoimmune state(panel A), while a slower increase (�=0.0005 d�1) induces only atransient expansion of the P cells, which is controlled by the ensuingexpansion of the R cells, without breaking the tolerant state (panel B).C, Relationship between APC growth rate (�) and maximum relativeAPC increase (Am/A0) resulting in either tolerance or autoimmunity.The line represents the boundary between both behaviors. Dotslabeled A and B correspond respectively to the cases shown in panelsA and B. The particular parameters in these simulations were:d=ln(2)/72 h�1; �=ln(2)/12 h�1; s=5; KP=KR=0.3; µ/d=0.35.
K. Leon et al. / Journal of Autoimmunity 22 (2004) 31–42 35

that some infections can induce autoimmunity and thatthere are genetic factors rendering individuals more orless susceptible to such induction of autoimmunity.
3.3. Effect of common infections on autoimmunity
Infections that provoke autoimmunity are rare. Com-mon bacteria and viruses usually stimulate immuneactivity without provoking autoimmunity, perhaps dueto the absence of antigenic mimicry or because they donot induce a sufficiently large or fast inflammation.However, the frequent exposition of an organism toinfections may have important effects on the basalbehavior of its immune system. To model those effects,the particular ways by which infections may affect thebasal immune system activity to self-antigens have to bespecified. Two biologically reasonable scenarios areanalyzed in what follows, pinpointing the conditionsunder which an inverse correlation between the inci-dence of infections and the incidence of autoimmunity ispredicted by the model.
In the first scenario, following the reasoning in theprevious section, frequent sub-clinic infections with dif-ferent microorganisms are assumed to stimulate moder-ately the host’s innate immune system, each contributingindirectly to the enhancement of self-antigen presen-tation. Therefore, individuals developing and living inan environment with a higher incidence of infections willhave a higher mean level of presentation of host-antigens. However, either because such increment inself-antigen presentation occurs by small increments(Fig. 1C), resembling the process simulated in Fig. 3b, orbecause it takes place during self-tolerance induction inthe perinatal period, it will not directly cause autoimmu-nity. Moreover, as will be demonstrated below, it willlead to the opposite effect, reinforcing the tolerant stateof the individual. This scenario can be modeled, in asimple way, assuming that the average number of APCspresenting host-antigens per individual (A) has a geneti-cally determined basal level (A0) and increases propor-tionally to the incidence of infections, I, in thepopulation (see item A in Appendix C). This implies thatthe values of GR and GP will depend on the incidence ofinfections. Thus, in the model, the same individual (orindividuals with identical genetic make up) developing inenvironments characterized by different incidence ofinfections will be located at different positions of theparametric space of Fig. 2. More specifically, the pointthat represents a given individual lies in the straight linecrossing the zero and the basal position of that individ-ual (G0
R, G0P) i.e., its position in the absence of infection
(see Appendix C). The particular position depends onthe actual value of A. The higher the incidence ofinfections, the higher the value of A and the farther thispoint will depart from its basal position (G0
R, G0P)
toward higher values of GR and GP. Consequently, the
assumed 2D-Gaussian distribution of parameters GR
and GP in a host population will be located deeper intothe parameter region III for higher values of the inci-dence of infections index I (see Fig. 4A). Therefore, thefrequency of autoimmune individuals will be lower thanexpected were that population living in the absence ofinfections. In other words, assuming that frequent, sub-clinic infections result in a stepwise increase in thenumber of APCs presenting host antigens, the modelpredicts an inverse correlation between the incidence ofautoimmunity and the incidence of infections (Fig. 4B).
The second scenario assumes that, during an infec-tion, the specific response to the invading microorgan-ism induces a bystander expansion of autoreactive Rand P populations. This bystander effect would follow,for instance, an intense release of cytokines or co-presentation of host and pathogen antigens by the sameAPC in inflammation foci. Different infections may haveeven or biased side-effects on P and R populations, assuggested by the observation that different microorgan-isms can target different classes of specific T cellsindirectly via the APCs [48,49] (or even directly [50])perhaps due to their expression of specific molecularpatterns recognized by the innate immune system [51].Net effects of bystander stimulation by subclinic infec-tions can be incorporated in the model by assuming thatthey result in a fractional increase of the growth indexesof P and R cell populations that is proportional tothe incidence of infections (see item B Appendix C).Proportionality constants �P and �R for the respectivegrowth rates of pathogenic and regulatory cells allow foraccommodating generically different microorganism-dependent biases. A ratio �P/�R equal to unity corre-sponds to an unbiased stimulation of autoreactive P andR cells; when this ratio is lower than 1 there is apreferential stimulation of regulatory cells; and when itis greater than 1 there is a preferential stimulation ofpathogenic cell types. Under these assumptions, thepoint representing in the parametric space of Fig. 2 anindividual living in an environment with incidence ofinfections I will lay in a straight line that pass through itsbasal position in the absence of infections (G0
R, G0P),
and whose slope is given by (�P/�R)�(G0P, G0
R) (seeAppendix C). The higher the value of I the farther theposition of the individual will depart form its basalposition toward higher values of GP and GR. Conse-quently the ratio �P/�R controls the position of thepopulation in the parametric space (Fig. 4C) as afunction of the incidence of infections I in the immediateenvironment and therefore control the relation to theincidence of autoimmunity in the population. For �P/�R=1 the model always predicts an inverse correlationbetween the incidences of autoimmune diseases andcommon infections (Fig. 4D). For higher values of �P/�R
the model predicts a biphasic behavior, meaning thatthere is an inverse correlation for high incidence of
K. Leon et al. / Journal of Autoimmunity 22 (2004) 31–4236
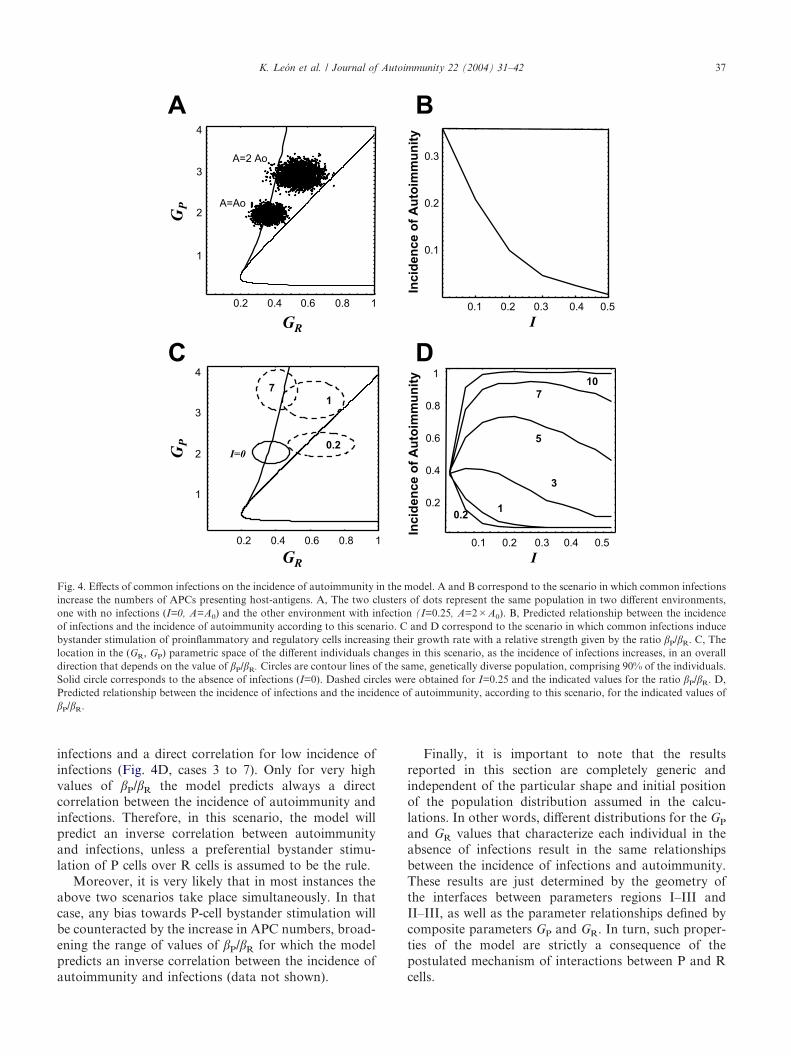
infections and a direct correlation for low incidence ofinfections (Fig. 4D, cases 3 to 7). Only for very highvalues of �P/�R the model predicts always a directcorrelation between the incidence of autoimmunity andinfections. Therefore, in this scenario, the model willpredict an inverse correlation between autoimmunityand infections, unless a preferential bystander stimu-lation of P cells over R cells is assumed to be the rule.
Moreover, it is very likely that in most instances theabove two scenarios take place simultaneously. In thatcase, any bias towards P-cell bystander stimulation willbe counteracted by the increase in APC numbers, broad-ening the range of values of �P/�R for which the modelpredicts an inverse correlation between the incidence ofautoimmunity and infections (data not shown).
Finally, it is important to note that the resultsreported in this section are completely generic andindependent of the particular shape and initial positionof the population distribution assumed in the calcu-lations. In other words, different distributions for the GP
and GR values that characterize each individual in theabsence of infections result in the same relationshipsbetween the incidence of infections and autoimmunity.These results are just determined by the geometry ofthe interfaces between parameters regions I–III andII–III, as well as the parameter relationships defined bycomposite parameters GP and GR. In turn, such proper-ties of the model are strictly a consequence of thepostulated mechanism of interactions between P and Rcells.
Fig. 4. Effects of common infections on the incidence of autoimmunity in the model. A and B correspond to the scenario in which common infectionsincrease the numbers of APCs presenting host-antigens. A, The two clusters of dots represent the same population in two different environments,one with no infections (I=0, A=A0) and the other environment with infection (I=0.25, A=2�A0). B, Predicted relationship between the incidenceof infections and the incidence of autoimmunity according to this scenario. C and D correspond to the scenario in which common infections inducebystander stimulation of proinflammatory and regulatory cells increasing their growth rate with a relative strength given by the ratio �P/�R. C, Thelocation in the (GR, GP) parametric space of the different individuals changes in this scenario, as the incidence of infections increases, in an overalldirection that depends on the value of �P/�R. Circles are contour lines of the same, genetically diverse population, comprising 90% of the individuals.Solid circle corresponds to the absence of infections (I=0). Dashed circles were obtained for I=0.25 and the indicated values for the ratio �P/�R. D,Predicted relationship between the incidence of infections and the incidence of autoimmunity, according to this scenario, for the indicated values of�P/�R.
K. Leon et al. / Journal of Autoimmunity 22 (2004) 31–42 37
4. Discussion
We have analyzed here a model of T cell mediatedtolerance, previously developed for individual hosts, inthe more general context of the genetic/epidemiologicaldomain at a population level. This provided a newtheoretical way to approach the paradoxical obser-vations that infections may elicit specific autoimmunediseases under some circumstances but that the averagemicrobial load may protect (non-specifically) againstautoimmune pathologies. Our present analysis suggestsa solution to this puzzle, which resides in the waymicroorganisms engage the individual hosts and alterthe parameters determining the dynamics of regulatoryand proinflammatory autoreactive cells. Particularly, weshow that infections bearing significant antigenic mim-icry could induce autoimmunity if they entail acuteinflammation, which substantially increases the anti-genic presentation of the determinant involved in themimicry. But if common infections lead to small in-creases in presentation of self-antigen determinants orlead to a similar bystander expansion of the regulatoryand pathogenic T cells, then frequent infections wouldprevent autoimmunity. Therefore, the theoretical frame-work explored here predicts a direct correlation betweenthe incidence of some specific autoimmune disorders andsome particular infections, and an inverse correlationbetween the incidence of most autoimmune disordersand the incidence of common infections.
These opposing consequences of host-microbial rela-tionships stem in the model from the non-linearity of themechanism underlying tolerance. Particularly relevantare the postulates that suppression of proinflammatorycells by regulatory cells requires direct interactions whileconjugated on the same APC (or more generically, whileactivated in the same inflammation-dependent niche),and that regulatory T cell populations depend on pro-inflammatory cells to grow. We notice that the secondpostulate is necessary but not sufficient because it willpredict the protective effect of infections on auto-immunity but fails to explain how acute infections andinflammation could trigger autoimmunity. The latterproperty requires that a fast increase in the number ofAPCs and/or size of inflammation-dependent niches [52]will decrease the inhibitory interactions between regu-latory cells and proinflammatory cells. Analysis of asuppression model in which the APC conveys a regu-latory signal from the regulatory cell to the proinflam-matory cell (as suggested in [53–55]) indicates that alsoin this case a fast increase in APCs can trigger auto-immunity (our unpublished results). However, inmodels of suppression where activated regulatory cellsnon-specifically suppress proinflammatory cells (asproposed in [56]) is more difficult to envisage howacute infections could trigger autoimmunity (ourunpublished results).
So far we have been concerned on how an acuteinfection could trigger an autoimmune disease and wehave neglected the question on whether the disease willbe transient or chronic. Our model predicts that if theinfection is rapidly resolved and the normal numbers ofAPCs are suddenly restored then tolerance will bereestablished. However, if the infection is only slowlycontrolled and the APCs return to their baseline num-bers in a slow pace then autoimmunity could becomechronic. For a detailed analysis of the conditions forreestablishment of tolerance upon a transient infectioncausing autoimmunity the reader is referred to [38]. Herewe have also assumed that the dynamics of autoreactiveT cell populations would be affected by responses toinfectious agents but have neglected how the regulationof autoreactivity could affect immune responses. Thisis a fundamental issue that was partially addressedelsewhere [38] and which we are developing further.
The growth and persistance of regulatory cell popu-lations are strictly dependent on proinflammatory cellsin our model. This postulate is grounded on boththeoretical results [36,37] and in vitro observations[39,40] and it is compatible with the observation thatCD4+CD25+ T cells expand in adoptive transfers [57]since this subset is most likely not pure in regulatorycells and contains also non-regulatory CD4+CD25+activated T cells. However, recent reports indicate thatupon microbial activation dendritic cells can produceIL-2 [58,59], which is a resource for regulatory T cells[60,61]. How would such extra growth resource changeour model? We can anticipate that if the source wererelatively small it will hardly change the model behav-iour. However, if the source were very large then it couldsubvert the balance between regulatory and proinflam-matory cells. The latter scenario is unlikely in normalconditions but it might appear in pathologic situationswith genetic or infectious basis, which could result ingeneralized immunodepression.
Our analysis makes some predictions that could bestudied experimentally, providing thus a test for thetheoretical framework proposed here. In this sense, themost striking proposal of our model is that a sufficientlylarge enhancement in self-antigen presentation (incre-ment in the number of APCs in the simplest case) wouldinduce or prevent autoimmunity when conducted re-spectively with a fast or slow kinetics. This predictioncan be tested experimentally, using animal models thatspontaneously develop some particular autoimmune dis-ease, but in which the disease incidence is graded. Forinstance, inoculating NOD mice with APCs from thespleen of non-treated NOD mice, using different dosesand time dependent schedules in this treatment, andchecking the frequency of animals that develop diabetes.Our model predicts that treatments including a largeinoculum with those APCs would accelerate the onset ofdiabetes; but those treatments including several inocula
K. Leon et al. / Journal of Autoimmunity 22 (2004) 31–4238

with relatively small amounts of APCs would delay orprevent the development of the disease. Furthermore, inorder to test whether or not an expansion of regulatoryT cells is involved in the observed outcome, the aboveexperimental setting could be complemented by adop-tively transferring different T-cell populations from theanimal groups receiving different APC treatments, intoimmuno-deficient (lacking T cells) NOD mice.
The genome of host populations may be adapted tocommon microorganisms present in the population’susual environment by selection of alleles that compen-sate phenotypically the effects of microbial load andoptimize the trade-off between defensive immunity andtolerance. Populations adapted to different environ-ments would be expected to have genomes differing intheir contribution to parameters GP and GR. Thus, thebasal, genetically determined values of GP and GR maybe lower in populations adapted to environments withhigh infection prevalence and diversity than in popu-lations living in environments with low infectionprevalence or diversity. Recent immigrants from the firstpopulation would be more prone to autoimmunity in the“cleaner” environment of the second population. It istempting to relate this scenario to the documentedobservation that the incidence of autoimmune patholo-gies is higher in immigrants of African or Afro-Caribbean origin in the United Kingdom than in theresident population [62]. Notwithstanding its potentialinterest, this hypothesis raises more questions than an-swers. For instance, what is the rate of adaptation ofpopulations by negative selection on autoimmune indi-viduals? Significant reduction of infection prevalence inWestern Europe has taken place in the last century,raising the question on whether the rate of adaptation ofresident populations is enough to justify the differencesobserved between the prevalence of autoimmunity inresidents vs. immigrants. An alternative explanation isthat recent emigrants are faced to an entirely new groupof microorganisms that trigger in them strong immuneresponses to self-crossreactive antigens, which accordingto our model would trigger autoimmunity.
Finally, genetic studies of autoimmune diseases typi-cally implicate tens of candidate loci in a complex causalpathway [63–68]. Assigning a causal role to disease-associated genes is necessary to understand their effectsand to design therapeutic approaches. This assignmentrequires the previous identification of a correspondingphenotypic trait. However, the association techniquesare essentially silent in this respect. Our mechanisticmodel could have operational value in this task, since itidentifies not only a few traits as being a priori the mostlikely candidates, but also the operational/mechanisticconditions that associate them to disease propensity orprotection. For example, genes involved in lymphocyteproliferation or survival are obvious candidates. Fur-thermore, those alleles that increase lymphocyte growth
indexes (GP and GR) are good candidates for diseaseprotection, while those decreasing growth are candidatesfor disease-propensity.
Acknowledgements
The authors would like to dedicate this work to thememory of the late Professor Mario Arala-Chaves. Theyalso would like to thank their colleagues at the IGC,namely, Carlos Ferreira, John Stewart, Dan Holmberg,Werner Haas, and Antonio Coutinho for many discus-sions that are at the origin of this work. This work wassupported by Ministerio da Ciencia e da Tecnologia,Portugal (grants Praxis/P/BIA/10094/1998 and POCTI/MGI/46477/2002). JC and JF were supported by Fun-dacao para a Ciencia e Tecnologia-Program Praxis XXI(fellowships BPD/11789/97 and BCC/18972/98, respect-ively). KL was partially financed by the FundacaoCalouste Gulbenkian.
Appendix A. A model of the dynamics and interactionsof T cells involved in natural tolerance
We model the dynamics of proinflammatory P cellsand regulatory R cells that recognize a homogeneouspopulation of APCs. Interactions between P and Rcells require formation of multicellular conjugates withAPCs, and each APC contains s independent sites forcell conjugation (Fig. 1). It is assumed, on the onehand, that a single R cell at the surface of a givenAPC inhibits the activation and proliferation of everyP cell that interact with this APC. On the other handthe interaction between P and R cells promotes thegrowth of the regulatory population by a P-dependentproliferation of R cells. The equations describing themodel are:
dP
dt��
i�1
s
��i�Ai,0(Pc,Rc)�d�Pf (1a)
dR
dt��
i�1
s
�j�1
s�i
��i�j�Ai,j(Pc,Rc)�d�Rf (1b)
where:P, R Total number of P cells and R cells at any
given instant tAi,j( ) Number of multicellular conjugates contain-
ing an APC conjugated to i P cells and j Rcells
A Total number of APCsPc, Rc Number of P and R cells conjugated with
APCs
K. Leon et al. / Journal of Autoimmunity 22 (2004) 31–42 39

Pf, Rf Number of free P and R cells, given byRf=R�Rc and Pf=P�Pc
S Maximum number of T cells that can conju-gate simultaneously with an APC
D Death rate of P and R cells� Proliferation rate of P cellsµ P-cell dependent growth rate of the regu-
latory populationThe number of multicellular conjugates of a given typeare obtained, following our previous study [36], as theproduct of two hypergeometric functions (Hyp):
Aij(Pc,Rc)�A�Hyp�i�j,(Pc�Rc),s A,s��Hyp�i,Pc,(Pc
�Rc),i�j� (2)
Hyp(N,N0,M,L)�SN0
N DSM�N0
L�N DYSM
L D (3)
and the number of conjugated P and R cells are obtainedrespectively as:
Pc�F�KP
1�F�KPP, Rc�
F�KR
1�F�KRR (4)
where KP and KR are the conjugation constants of Pand R cells with the APC respectively; and F is thetotal number of free APC sites, that is obtained bynumerically solving the following equation:
F�s�A�F�KP
1�F�KPP�
F�KR
1�F�KRP (5)
Note that, in order to obtain Eq. (4) and Eq. (5), theT-cell/APC-site conjugation and de-conjugation pro-cesses are assumed to be fast compared to cell pro-liferation, differentiation and death. This allows taking aquasi-steady state approximation for those quantities.
The behavior of this model can be best described interms of two composite parameters GR and GP [36],which are defined by: GR�KR���A/d and GP�KP���
A/d, and represent respectively the growth indexes of Rand P cells in the system.
Appendix B. Increasing the number of APCs accordingto a logistic growth kinetics
In some simulations (see text) the number of APCs ischanged over time according to a logistic growthkinetics given by the formula:
A(t)�A0�Am
A0�(Am�A0) e���Am�t (6)
Where:A0 The initial number of APCs
Am The maximal value attained by the number ofAPC
� The kinetics constant, controlling the velocityof the increment in the APCs number
Nevertheless the results reported in this paper are quali-tatively independent of the particular equation describ-ing the growth kinetics of the APCs (data not shown).They only depend on the rate of growing of the APCsnumbers as discussed on Fig. 3.
Appendix C. Modeling the effect of common infectionson T cell mediated tolerance
There are two non-mutually exclusive scenarios bywhich common infections could affect the parametersin the model of T cell mediated tolerance described inAppendix A:
(A) According to the first scenario the averagenumber of APCs, A, in each individual would beproportional to I, the incidence of infections in thepopulation:
A�A0���I
where A0 is the basal, genetically determined numberof APCs and � is a proportionality constant.
To understand the effect of this postulatedrelationship on the model behavior we substitute A inthe definitions of GP and GR given in Appendix A.This results in the following dependencies of GP andGR on the value of I:
GP�KP���A0/d�(KP��/d)���I
GR�KR���A0/d�(KR��/d)���I
Combining these relations to eliminate I we get thefollowing relationship between GP and GR:
GP�(KP��/KR��)�G�(GP0/GR
0 )�G
This equation shows that in this scenario, for anyvalue of I, the point representing an individual in theparameter’s space (GR, GP) always lies in a straightline that intercepts the zero point and the individual’sbasal position (G0
R, G0P), i.e., for I=0.
(B) According to the second scenario, duringresponses to common infections there is somebystander stimulation of the growth of autoreactiveregulatory and proinflammatory cell populations. Tokeep it simple, we assume that this bystanderstimulation leads in each individual to an increase ofthe basal average growth rates of P and R cells that isproportional to I:
K. Leon et al. / Journal of Autoimmunity 22 (2004) 31–4240

���0��1��P�I
and
���0��1��R�I
where �0 and µ0 are the basal, genetically determinedproliferation rates of P and R, respectively (or theproliferation rate of P cells and the differentiation rateof R cells; both ways give equivalent results) and �P
and �R are the respective proportionality constants.As in the previous case, to understand the effect of
these relationships on the model behavior wesubstitute them in the definitions of GP and GR. Thisresults in the following dependencies of GP and GR onthe value of I:
GP�KP��0�A/d�(KP��0�A/d)��P�I
GR�KR��0�A/d�(KR��0�A/d)��R�I
Combining these relations to eliminate I we get thefollowing relationship between GP and GR:
GP�GP0�(1��P/�R)�(GP
0/GR0 )�(�P/�R)�GR
This equation shows that in this scenario, for anyvalue of I, the point representing an individual in theparameter’s space (GR, GP) lies in the straight line thatintercepts is basal value (G0
R, G0P) and has slope given
by (G0P, G0
R)#(�P/�R).Finally, in both scenarios the tolerant or
autoimmune-prone status of individuals being exposedto a given environmental level of infection is recordedaccording to the region, within the (GR, GP)parameter’s space, in which their characterizing pointsare located.
References
[1] ISAAC-Steering-Committee. Worldwide variation in prevalenceof symptoms of asthma, allergic rhinoconjunctivitis, and atopiceczema: ISAAC. The International Study of Asthma and Aller-gies in Childhood (ISAAC) Steering Committee. Lancet 1998;351:1225–32.
[2] Onkamo P, Vaananen S, Karvonen M, Tuomilehto J. Worldwideincrease in incidence of Type I diabetes—the analysis of the dataon published incidence trends. Diabetologia 1999;42:1395–403.
[3] Poser S, Stickel B, Krtsch U, Burckhardt D, Nordman B.Increasing incidence of multiple sclerosis in South Lower Saxony,Germany. Neuroepidemiology 1989;8:207–13.
[4] Folkerts G, Walzl G, Openshaw PJ. Do common childhoodinfections ‘teach’ the immune system not to be allergic?. ImmunolToday 2000;21:118–20.
[5] Bach JF. Protective role of infections and vaccinations on auto-immune diseases. J Autoimmun 2001;16:347–53.
[6] Kurtzke JF. MS epidemiology world wide. One view of currentstatus. Acta Neurol Scand 1995;161(Suppl):23–33.
[7] Bach JF. Predictive medicine in autoimmune diseases: from theidentification of genetic predisposition and environmentalinfluence to precocious immunotherapy. Clin ImmunolImmunopathol 1994;72:156–61.
[8] Bauer HJ. Multiple sclerosis in Europe. J Neurol 1987;234:195–206.
[9] Group EAS. Variation and trends in incidence of childhooddiabetes in Europe. EURODIAB ACE Study Group. Lancet2000;355:873–6.
[10] Gale CR, Martyn CN. Migrant studies in multiple sclerosis. ProgNeurobiol 1995;47:425–48.
[11] Bodansky HJ, Staines A, Stephenson C, Haigh D, Cartwright R.Evidence for an environmental effect in the aetiology of insulindependent diabetes in a transmigratory population. Br Med J1992;304:1020–2.
[12] Oldstone MB, Dixon FJ. Inhibition of antibodies to nuclearantigen and to DNA in New Zealand mice infected with lactatedehydrogenase virus. Science 1972;175:784–6.
[13] Yagi H, Matsumoto M, Kishimoto Y, Makino S, Harada M.Possible mechanism of the preventive effect of BCG againstdiabetes mellitus in NOD mouse. II. Suppression of pathogenesisby macrophage transfer from BCG-vaccinated mice. CellImmunol 1991;138:142–9.
[14] Martins TC, Aguas AP. Changes in B and T lymphocytesassociated with mycobacteria-induced protection of NOD micefrom diabetes. J Autoimmun 1996;9:501–7.
[15] Ohsugi T, Kurosawa T. Increased incidence of diabetes mellitus inspecific pathogen-eliminated offspring produced by embryo trans-fer in NOD mice with low incidence of the disease. Lab Anim Sci1994;44:386–8.
[16] Crisa L, Mordes JP, Rossini AA. Autoimmune diabetes mellitusin the BB rat. Diabetes Metab Res Rev 1992;8:4–37.
[17] Strachan DP. Hay fever, hygiene, and household size. Br Med J1989;299:1259–60.
[18] Fujinami RS, Oldstone MB. Amino acid homology between theencephalitogenic site of myelin basic protein and virus: mechan-ism for autoimmunity. Science 1985;230:1043–5.
[19] Horwitz MS, Bradley LM, Harbertson J, Krahl T, Lee J,Sarvetnick N. Diabetes induced by Coxsackie virus: initiation bybystander damage and not molecular mimicry. Nat Med 1998;4:781–5.
[20] Miller SD, Vanderlugt CL, Begolka WS, Pao W, Yauch RL,Neville KL et al. Persistent infection with Theiler’s virus leads toCNS autoimmunity via epitope spreading. Nat Med 1997;3:1133–6.
[21] Fairweather D, Kaya Z, Shellam GR, Lawson CM, Rose NR.From infection to autoimmunity. J Autoimmun 2001;16:175–86.
[22] Steere AC, Gross D, Meyer AL, Huber BT. Autoimmune mech-anisms in antibiotic treatment-resistant lyme arthritis. J Auto-immun 2001;16:263–8.
[23] Ebringer A, Khalafpour S, Wilson C. Rheumatoid arthritis andProteus: a possible aetiological association. Rheumatol Int 1989;9:223–8.
[24] McCulloch J, Lydyard PM, Rook GA. Rheumatoid arthritis:how well do the theories fit the evidence?. Clin Exp Immunol1993;92:1–6.
[25] Benoist C, Mathis D. Autoimmunity provoked by infection: howgood is the case for T cell epitope mimicry?. Nat Immunol 2001;2:797–801.
[26] Panoutsakopoulou V, Cantor H. On the relationship betweenviral infection and autoimmunity. J Autoimmun 2001;16:341–5.
[27] Lafaille JJ, Nagashima K, Katsuki M, Tonegawa S. High inci-dence of spontaneous autoimmune encephalomyelitis in immuno-deficient anti-myelin basic protein T cell receptor transgenic mice.Cell 1994;78:399–408.
[28] Cahill RJ, Foltz CJ, Fox JG, Dangler CA, Powrie F, Schauer DB.Inflammatory bowel disease: an immunity-mediated condition
K. Leon et al. / Journal of Autoimmunity 22 (2004) 31–42 41
triggered by bacterial infection with Helicobacter hepaticus. In-fect Immun 1997;65:3126–31.
[29] Hori S, Carvalho TL, Demengeot J. CD25+CD4+ regulatory Tcells suppress CD4+ T cell-mediated pulmonary hyperinflam-mation driven by Pneumocystis carinii in immunodeficient mice.Eur J Immunol 2002;32:1282–91.
[30] Mason D. A very high level of crossreactivity is an essentialfeature of the T-cell receptor. Immunol Today 1998;19:395–404.
[31] Shevach EM. Regulatory T cells in autoimmmunity*. Annu RevImmunol 2000;18:423–49.
[32] Sakaguchi S, Sakaguchi N, Shimizu J, Yamazaki S, Sakihama T,Itoh M et al. Immunologic tolerance maintained by CD25+CD4+ regulatory T cells: their common role in controllingautoimmunity, tumor immunity, and transplantation tolerance.Immunol Rev 2001;182:18–32.
[33] Bensinger SJ, Bandeira A, Jordan MS, Caton AJ, Laufer TM.Major histocompatibility complex class II-positive cortical epi-thelium mediates the selection of CD4(+)25(+) immunoregulatoryT cells. J Exp Med 2001;194:427–38.
[34] Piccirillo CA, Shevach EM. Cutting edge: control of CD8+ T cellactivation by CD4+CD25+ immunoregulatory cells. J Immunol2001;167:1137–40.
[35] Itoh M, Takahashi T, Sakaguchi N, Kuniyasu Y, Shimizu J,Otsuka F et al. Thymus and autoimmunity: production ofCD25+CD4+ naturally anergic and suppressive T cells as a keyfunction of the thymus in maintaining immunologic self-tolerance. J Immunol 1999;162:5317–26.
[36] Leon K, Perez R, Lage A, Carneiro J. Modelling T-cell-mediatedsuppression dependent on interactions in multicellular conjugates.J Theor Biol 2000;207:231–54.
[37] Leon K, Perez R, Lage A, Carneiro J. Three-cell interactions in Tcell-mediated suppression? A mathematical analysis of its quan-titative implications. J Immunol 2001;166:5356–65.
[38] Leon K, Lage A, Carneiro J. J Theor Biol 2003;225:107–26.[39] Oliveira V, Leon K, Caramalho I, Hori S, Haury M, Demengeot
J, Carneiro J. Target CD4+CD25� T cells promote the growthof regulatory CD4+CD25+ T cells in vitro, 2003, submitted forpublication.
[40] Leon K. PhD Dissertation 2002 University of Porto, Porto,156pp.
[41] De Boer RJ, Perelson AS. How diverse should the immune systembe?. Proc R Soc Lond B Biol Sci 1993;252:171–5.
[42] Langman RE, Cohn M. The E-T (elephant-tadpole) paradoxnecessitates the concept of a unit of B-cell function: theprotection. Mol Immunol 1987;24:675–97.
[43] Qin S, Cobbold SP, Pope H, Elliott J, Kioussis D, Davies J et al.“Infectious” transplantation tolerance. Science 1993;259:974–7.
[44] Dieckmann D, Bruett CH, Ploettner H, Lutz MB, Schuler G.Human CD4(+)CD25(+) regulatory, contact-dependent T cellsinduce interleukin 1-producing, contact-independent type 1-likeregulatory T cells. J Exp Med 2002;196:247–53.
[45] Jonuleit H, Schmitt E, Kakirman H, Stassen M, Knop J, EnkAH. Infectious tolerance: human CD25(+) regulatory T cellsconvey suppressor activity to conventional CD4(+) T helper cells.J Exp Med 2002;196:255–60.
[46] Oleszak EL, Kuzmak J, Good RA, Platsoucas CD. Immunologyof Theiler’s murine encephalomyelitis virus infection. ImmunolRes 1995;14:13–33.
[47] Cohen IR. Regulation of autoimmune disease physiological andtherapeutic. Immunol Rev 1986;94:5–21.
[48] Pulendran B, Kumar P, Cutler CW, Mohamadzadeh M, VanDyke T, Banchereau J. Lipopolysaccharides from distinct patho-
gens induce different classes of immune responses in vivo. JImmunol 2001;167:5067–76.
[49] Pasare C, Medzhitov R. Toll pathway-dependent blockade ofCD4+CD25+ T cell-mediated suppression by dendritic cells.Science 2003;299:1033–6.
[50] Caramalho I, Lopes-Carvalho T, Ostler D, Zelenay S, Haury M,Demengeot J. Regulatory T cells selectively express toll-likereceptors and are activated by lipopolysaccharide. J Exp Med2003;197:403–11.
[51] O’Neill LA. Toll-like receptor signal transduction and the tailor-ing of innate immunity: a role for Mal?. Trends Immunol 2002;23:296–300.
[52] Carneiro J, Stewart J, Coutinho A, Coutinho G. The ontogenyof class-regulation of CD4+ T lymphocyte populations. IntImmunol 1995;7:1265–77.
[53] Taams LS, Boot EP, van Eden W, Wauben MH. ‘Anergic’ T cellsmodulate the T-cell activating capacity of antigen-presenting cells[In Process Citation]. J Autoimmun 2000;14:335–41.
[54] Vendetti S, Chai JG, Dyson J, Simpson E, Lombardi G, LechlerR. Anergic T cells inhibit the antigen-presenting function ofdendritic cells. J Immunol 2000;165:1175–81.
[55] Cederbom L, Hall H, Ivars F. CD4+CD25+ regulatory T cellsdown-regulate co-stimulatory molecules on antigen-presentingcells. Eur J Immunol 2000;30:1538–43.
[56] Thornton AM, Shevach EM. Suppressor effector function ofCD4+CD25+ immunoregulatory T cells is antigen nonspecific.J Immunol 2000;164:183–90.
[57] Annacker O, Pimenta-Araujo R, Burlen-Defranoux O, BandeiraA. On the ontogeny and physiology of regulatory T cells. Immu-nol Rev 2001;182:5–17.
[58] Granucci F, Feau S, Angeli V, Trottein F, Ricciardi-Castagnoli P.Early IL-2 production by mouse dendritic cells is the result ofmicrobial-induced priming. J Immunol 2003;170:5075–81.
[59] Granucci F, Vizzardelli C, Pavelka N, Feau S, Persico M, Virzi Eet al. Inducible IL-2 production by dendritic cells revealed byglobal gene expression analysis. Nat Immunol 2001;2:882–8.
[60] Furtado GC, Curotto de Lafaille MA, Kutchukhidze N, LafailleJJ. Interleukin 2 signaling is required for CD4(+) regulatory T cellfunction. J Exp Med 2002;196:851–7.
[61] Takahashi T, Kuniyasu Y, Toda M, Sakaguchi N, Itoh M, IwataM et al. Immunologic self-tolerance maintained by CD25+CD4+naturally anergic and suppressive T cells: induction of auto-immune disease by breaking their anergic/suppressive state. IntImmunol 1998;10:1969–80.
[62] Molokhia M, McKeigue PM, Cuadrado M, Hughes G. Systemiclupus erythematosus in migrants from west Africa compared withAfro-Caribbean people in the UK. Lancet 2001;357:1414–5.
[63] Cordell HJ, Todd JA. Multifactorial inheritance in type 1diabetes. Trends Genet 1995;11:499–504.
[64] Dyment DA, Sadovnick AD, Ebers GC, Sadnovich AD. Geneticsof multiple sclerosis. Hum Mol Genet 1997;6:1693–8.
[65] Harley JB, Moser KL, Gaffney PM, Behrens TW. The genetics ofhuman systemic lupus erythematosus. Curr Opin Immunol 1998;10:690–6.
[66] Todd JA. Genetic analysis of type 1 diabetes using whole genomeapproaches. Proc Natl Acad Sci U S A 1995;92:8560–5.
[67] Stewart J. Towards the genetic analysis of mulfactorial diseases:the estimation of allele frequency and epistasis. Hum Hered 2002;54:118–31.
[68] Vyse TJ, Kotzin BL. Genetic susceptibility to systemic lupuserythematosus. Annu Rev Immunol 1998;16:261–92.
K. Leon et al. / Journal of Autoimmunity 22 (2004) 31–4242
Copyright © 2022 FDOKUMEN