
Validation of predicted exponential concentration profiles of chemicals in soils
7
Validation of predicted exponential concentration profiles of chemicals in soils Anne Hollander a, * , Iris Baijens a , Ad Ragas a , Mark Huijbregts a , Dik van de Meent a,b a Department of Environmental Science, Radboud University Nijmegen, Toernooiveld 1, P.O. Box 9010, 6500 GL Nijmegen, The Netherlands b National Institute of Public Health and the Environment, Laboratory for Ecological Risk Assessment, P.O. Box 1, 3720 BA Bilthoven, The Netherlands Received 26 May 2006; received in revised form 21 August 2006; accepted 2 September 2006 Multimedia mass model predictions will improve when taking into account depth dependent soil concentrations. Abstract Multimedia mass balance models assume well-mixed homogeneous compartments. Particularly for soils, this does not correspond to reality, which results in potentially large uncertainties in estimates of transport fluxes from soils. A theoretically expected exponential decrease model of chemical concentrations with depth has been proposed, but hardly tested against empirical data. In this paper, we explored the correspondence between theoretically predicted soil concentration profiles and 84 field measured profiles. In most cases, chemical concentrations in soils appear to decline exponentially with depth, and values for the chemical specific soil penetration depth (d p ) are predicted within one order of magnitude. Over all, the reliability of multimedia models will improve when they account for depth-dependent soil concentrations, so we recommend to take into account the described theoretical exponential decrease model of chemical concentrations with depth in chemical fate studies. In this model the d p -values should estimated be either based on local conditions or on a fixed d p -value, which we recommend to be 10 cm for chemicals with a log K ow > 3. Ó 2006 Elsevier Ltd. All rights reserved. Keywords: Soil concentration profiles; Multimedia fate model; Advective soil transport; Diffusive soil transport; Bioturbation 1. Introduction After emission to the environment, chemicals may spread among all environmental compartments. As they can pose se- rious risks to human health and the environment, it is impor- tant to get insights in the behavior of those chemicals. Multimedia fate models are tools often used for predicting the fate of chemicals in the environment (Cowan et al., 1995; Mackay, 1991; Wania and Mackay, 1999). In this type of model the study area is represented by a number of homo- geneous compartments, each representing a specific part of the environment (i.e. atmosphere, water, soil, sediment, biota). The concentration of a chemical in a certain compartment can be calculated by solving a set of mass balance equations that describe processes like emissions, degradations and inter-compartment transfer. The use of a single mass balance equation per environmen- tal compartment implies that concentration differences within one compartment are neglected. Particularly for the soil com- partment, this assumption often does not correspond with actual field situations. As a consequence of neglecting depth-dependent concentration differences in soils, substance flows that relate to specific depths, such as volatilization and leaching, are expected to be misestimated in standard multi- media mass balance models (Hollander et al., 2004). Since the transport of chemicals towards the soil surface, either by direct emissions or by atmospheric deposition, is * Corresponding author. Tel.: þ31 243652923; fax: þ31 243653030. E-mail addresses: [email protected] (A. Hollander), a.ragas@ science.ru.nl (A. Ragas), [email protected] (M. Huijbregts), [email protected] (D. van de Meent). 0269-7491/$ - see front matter Ó 2006 Elsevier Ltd. All rights reserved. doi:10.1016/j.envpol.2006.09.018 Environmental Pollution 147 (2007) 757e763 www.elsevier.com/locate/envpol
Transcript of Validation of predicted exponential concentration profiles of chemicals in soils
Environmental Pollution 147 (2007) 757e763www.elsevier.com/locate/envpol
Validation of predicted exponential concentration profiles ofchemicals in soils
Anne Hollander a,*, Iris Baijens a, Ad Ragas a, Mark Huijbregts a, Dik van de Meent a,b
a Department of Environmental Science, Radboud University Nijmegen, Toernooiveld 1, P.O. Box 9010, 6500 GL Nijmegen, The Netherlandsb National Institute of Public Health and the Environment, Laboratory for Ecological Risk Assessment,
P.O. Box 1, 3720 BA Bilthoven, The Netherlands
Received 26 May 2006; received in revised form 21 August 2006; accepted 2 September 2006
Multimedia mass model predictions will improve when taking into account depth dependent soil concentrations.
Abstract
Multimedia mass balance models assume well-mixed homogeneous compartments. Particularly for soils, this does not correspond to reality,which results in potentially large uncertainties in estimates of transport fluxes from soils. A theoretically expected exponential decrease model ofchemical concentrations with depth has been proposed, but hardly tested against empirical data. In this paper, we explored the correspondencebetween theoretically predicted soil concentration profiles and 84 field measured profiles. In most cases, chemical concentrations in soils appearto decline exponentially with depth, and values for the chemical specific soil penetration depth (dp) are predicted within one order of magnitude.Over all, the reliability of multimedia models will improve when they account for depth-dependent soil concentrations, so we recommend to takeinto account the described theoretical exponential decrease model of chemical concentrations with depth in chemical fate studies. In this modelthe dp-values should estimated be either based on local conditions or on a fixed dp-value, which we recommend to be 10 cm for chemicals witha log Kow> 3.� 2006 Elsevier Ltd. All rights reserved.
Keywords: Soil concentration profiles; Multimedia fate model; Advective soil transport; Diffusive soil transport; Bioturbation
1. Introduction
After emission to the environment, chemicals may spreadamong all environmental compartments. As they can pose se-rious risks to human health and the environment, it is impor-tant to get insights in the behavior of those chemicals.Multimedia fate models are tools often used for predictingthe fate of chemicals in the environment (Cowan et al.,1995; Mackay, 1991; Wania and Mackay, 1999). In this typeof model the study area is represented by a number of homo-geneous compartments, each representing a specific part of the
* Corresponding author. Tel.: þ31 243652923; fax: þ31 243653030.
E-mail addresses: [email protected] (A. Hollander), a.ragas@
science.ru.nl (A. Ragas), [email protected] (M. Huijbregts),
[email protected] (D. van de Meent).
0269-7491/$ - see front matter � 2006 Elsevier Ltd. All rights reserved.
doi:10.1016/j.envpol.2006.09.018
environment (i.e. atmosphere, water, soil, sediment, biota).The concentration of a chemical in a certain compartmentcan be calculated by solving a set of mass balance equationsthat describe processes like emissions, degradations andinter-compartment transfer.
The use of a single mass balance equation per environmen-tal compartment implies that concentration differences withinone compartment are neglected. Particularly for the soil com-partment, this assumption often does not correspond withactual field situations. As a consequence of neglectingdepth-dependent concentration differences in soils, substanceflows that relate to specific depths, such as volatilization andleaching, are expected to be misestimated in standard multi-media mass balance models (Hollander et al., 2004).
Since the transport of chemicals towards the soil surface,either by direct emissions or by atmospheric deposition, is

758 A. Hollander et al. / Environmental Pollution 147 (2007) 757e763
an important aspect of multimedia fate models, and since theyare the most static of all environmental compartments, it is ex-pected that chemical concentrations in soils usually declinewith depth. This situation is displayed schematically inFig. 1. Some multimedia fate models adapt to this situationby introducing layered soils, e.g. the CalTOX model containsa ‘ground surface soil layer’, a ‘root-zone soil layer’ and a ‘va-dose zone soil layer’ compartment (McKone, 1993). The ad-vantages of a layered soil compartmentation are thatdifferent concentrations can be calculated for each layer, andthat layer-specific soil conditions can be taken into account.However, within each layer still homogeneous conditionsand concentrations are assumed. Besides, introducing morecompartments in the model will increase model complexity,which for simple screenings of chemical behavior and rankingpurposes of relative chemical risks may be undesirable (Cahilland Mackay, 2003).
McKone and Bennett (2003) applied the steady-state solu-tion of the general transport equation1 to describe the theoret-ically expected change of concentrations in soil with depth,based on the physicalechemical properties of the compoundand on the environmental circumstances. Assuming steady-state conditions, a fixed concentration boundary conditionand uniform soil properties to depth z, this vertical gradientof concentration c in a certain soil layer is described by theequation,
cðzÞ ¼ c0e�z=dp ; with dp ¼veþ
ffiffiffiffiffiffiffiffiffiffiffiffiffiffiffiffiffiffiffiv2
e þ 4kDe
p2k
ð1Þ
Dep
th
Concentration
Application
Advectivetransport
Diffusivetransport
Degradation
HighLow
0
zmax
Fig. 1. Schematic representation of an exponential soil concentration profile
and the processes taking place in the soil.
1 Solution for t¼N, c(0)¼ c0 of vc=vt þ vevc=vz� Dev2c=vz2 þ kc ¼ 0
with c0 being the chemical concentration at the top of the soillayer and dp being the characteristic soil penetration depth; ve
describes the effective advection velocity (m s�1), De theeffective diffusion coefficient (m2 s�1), and k stands for thedegradation rate constant of the compound in a soil (s�1). Hol-lander et al. (2004) implemented this equation in SimpleBox3.0 in order to yield better estimates of mass flows occurringfrom the soil compartments to the air, water and groundwatercompartments.
Implementation of this theory can also be useful for othermultimedia fate models and even for totally different modelingpurposes, like vadose zone pesticide transport modeling (e.g.Chu and Marino, 2004) or local scale plant uptake models (Pa-terson and Mackay, 1994; Smith and Jones, 2000) to calculatesubstance flows correctly. However, in order to be a valuablemodeling tool, the theoretically predicted soil concentrationprofiles should correspond with actual field situations. The ob-jective of this study is to explore to which extent theoreticallypredicted steady-state soil concentration profiles correspond tosoil concentration profiles measured in the field. To this end,literature data on depth-dependent soil concentrations werecollected. It was first investigated to what extent the measuredsoil concentration profiles show an exponential decline withdepth. Secondly, we investigated to what extent the measuredsoil concentration profiles fit to the theoretical exponentialfunctions under comparable environmental conditions.Steady-state situations are regarded, on which the theory orig-inally applies, as well as non steady-state situations. By re-garding steady-state as well as non steady-state situations,we tested the validity of the steady-state theory.
2. Methods
2.1. Measured soil concentration profiles
Literature data were collected on measured soil concentration profiles of
several organic compounds. Eighty four soil concentration profiles were col-
lected from 17 locations and nine literature sources (Atanassova and Brummer,
2004; Azevedo et al., 2000; Cousins et al., 1999; Gocht et al., 2001; Landry
et al., 2005; Rotard et al., 1994; Van Hees et al., 2005; Vikelsøe et al.,
2002; Wilcke et al., 1996). The locations of the measurement sites and the
compounds considered are given in Appendix 1 of the Supporting Information.
In that table, also the parameter values on environmental conditions required
for predicting soil penetration depths according to Eq. (1) are listed for the dif-
ferent sites, which are the rain rate, the environmental temperature, and the av-
erage organic carbon content of the soil. When no information about the
organic carbon content was given in the literature, an average value of 2%
was assumed, which is the default value in SimpleBox 3.0 (Den Hollander
and Van de Meent, 2004). Finally, Appendix 1 lists the land use type present
at the measurements sites, which provides information about the level of dis-
turbance of the soil profiles.
2.2. Classification of sites
The theory applied by McKone and Bennett (2003) was originally devel-
oped for steady-state soil conditions. It assumes a uniform emission of chem-
icals, a homogeneous soil profile and a constant rain rate. Unfortunately,
hardly any validation data were available measured under such conditions,
so we were compelled to include data measured in situations that did not fully
fulfill the requirements of steady-state conditions to obtain a substantial data-
set. The total dataset was split into a group of profiles measured under
759A. Hollander et al. / Environmental Pollution 147 (2007) 757e763
(approximate) steady-state conditions, on which the theory originally applies,
and a group of profiles measured in non steady-state situations, to explore the
general applicability of the modeling theory. Of all measurement sites, it was
evaluated if they conformed to steady-state conditions using the following cri-
teria: (1) The soil profiles are fully undisturbed, so no agricultural activities
take place. (2) Emissions or atmospheric depositions are more or less constant
in time, so there is no variation in application intensity throughout a year (as is
often the case for pesticides), and no abrupt change in industrial activities in
the area has occurred. (3) The soil is approximately homogeneous in texture
and organic carbon content. For this we assumed that both sand/silt/clay con-
tent and organic carbon content of the soils may show no larger difference than
10 volumetric percents throughout the profile. Table 1 shows to what extent the
different measurement sites conform to these three criteria, and which profiles
were labeled as steady-state soil concentration profiles.
2.3. Chemical properties
Input data on chemical characteristics required in the model are listed in
Appendix 2 of the Supporting Information. Degradation rate constants were
mainly derived from Howard et al. (1991). Of these data the geometric
mean between the minimum and maximum value of the given half-lives was
taken as input. In case of lacking data on degradation rate constants in air,
soil and water, the estimation methods as proposed by Struijs and Van den
Berg (1995) were used. This was the case for benzo(e)pyrene and total-
PCB. In case of lacking measurement data on Koc, this value was derived
from the Kow, following Karickhoff (1981). This was the case for citrate,
oxalate, indeno(1,2,3-c,d)pyrene, total-PCB and perylene.
2.4. Fitting measured and calculated concentration profiles
From all measured concentration profiles, those were selected that show
a decline of chemical concentration with depth, since the theory of Eq. (1)
does not suit in those situations where no declining chemical concentration
with depth was measured. This was the case for four of the 84 measured pro-
files. For each of the measurement locations showing a declining chemical
concentration with depth, a soil concentration profile was calculated following
the theory described in Eq. (1), in order to fit the predicted profile to the mea-
sured data points. Values for ve and De were calculated as sums of advections
and diffusions in the gas phase, water phase and solid phase of the soil, assum-
ing thermodynamic equilibrium. The procedure described by McLachlan et al.
(2002) was applied, using their parameterization. Next, the environmental con-
ditions given in Appendix 1 and the physicalechemical characteristics of the
compounds of Appendix 2 were used to calculate the characteristic soil pene-
tration depth (dp) in each situation. The values for c0 could not be calculated
directly, because for none of the measurement sites emission data were avail-
able (and in some cases neither concentration values; in those cases the con-
centration was expressed as the fraction of the amount of chemical that was
emitted). In order to enable a quantitative comparison between the calculated
and the measured profiles, though, fits were made through the data points using
an exponential vertical least square fitting procedure with the restriction of
a fixed dp. The natural logarithm of the measured concentration values was
taken, and Eq. (1) was rewritten as:
ln
�cðzÞc0
�¼� z
dp
ð2Þ
Following a standard vertical least square fitting procedure, the slope of the
fit is given by �1=dp and the intercept ln c0 by:
ln c0 ¼ ln cðzÞ þ 1
dp
� z ð3Þ
Filling in the values for c0 and dp in the original Eq. (1), for each depth of
the soil (z), the concentration c(z) was calculated. This procedure is further de-
scribed as the ‘theoretical model’.
A second fitting procedure was performed to check to what extent the der-
ivations of the theoretical fits to the measured data was caused by setting fixed
dp-values, which might not correspond to the field situations, and to what ex-
tent the measured data points simply do or do not fit to an exponential func-
tion. A standard (empirical) regression procedure was performed on the ln
values of the measured concentrations to examine the fit of the measured
soil concentrations to an exponential profile. This means that both c0 and dp
were optimized to obtain a minimum sum of squares. This procedure is further
described as the ‘regression model’. Subsequently, a standard F-test was
Table 1
Compliance of the soil concentration profiles with steady-state criteria
Profile # Country Location Criterion 1
(No agriculture)
Criterion 2
(Constant emission)
Criterion 3
(Homogeneous profile)
Steady-state?
1e4 Sweden Nyanget, Heden þ þ � No
5 Sweden Hasslov þ þ � No
6e17 Germany Hessisches Ried � þ þ No
18e32 Germany Bonn � � þ No
33e34 UK Park Grass þ þ þ Yes
35e36 UK Broadbalk þ þ þ Yes
37e38 UK Glengsaugh þ þ � No
39e40 UK Hartwood þ þ � No
41 France Burgundy � � þ No
42 France Burgundy � � þ No
43 France Burgundy � � þ No
44 France Burgundy � � þ No
45 France Burgundy � � þ No
46 France Burgundy � � þ No
47 France Burgundy � � þ No
48 Slovakia Ziar þ þ � No
49 Slovakia Ziar þ þ � No
50 Slovakia Ziar þ þ � No
51e58 Portugal Sorraia Valley � � þ No
59e60 Portugal Sorraia Valley � � þ No
61e63 Germany Starnberg þ þ þ Yes
64e66 Germany Schauinsland � þ þ No
67e75 Denmark Ejby þ þ þ Yes
76e84 Denmark Sundbylille � � þ No
760 A. Hollander et al. / Environmental Pollution 147 (2007) 757e763
performed on the predictions of both fitting models to assess if one of the
models yields significantly better predictions than the other.
Using both methods, fits were made for all measurement locations and the
calculated concentration values were plotted against the measured concentra-
tions. Uncertainty factors (k) of the fitted profiles were also calculated. The un-
certainty factor k is defined such that 95% of the measured values are within
a factor k from the median theoretical estimate (Slob, 1994), and it is based on
the standard error between the calculated and measured concentration values
(Huijbregts et al., 2005).
3. Results and discussion
For the 80 soil profiles that show a declining concentrationwith depth, the theoretically expected soil penetration depths(dp) and the values for c0 following from the two exponentialfitting procedures are given in Appendix 3 of the SupportingInformation.
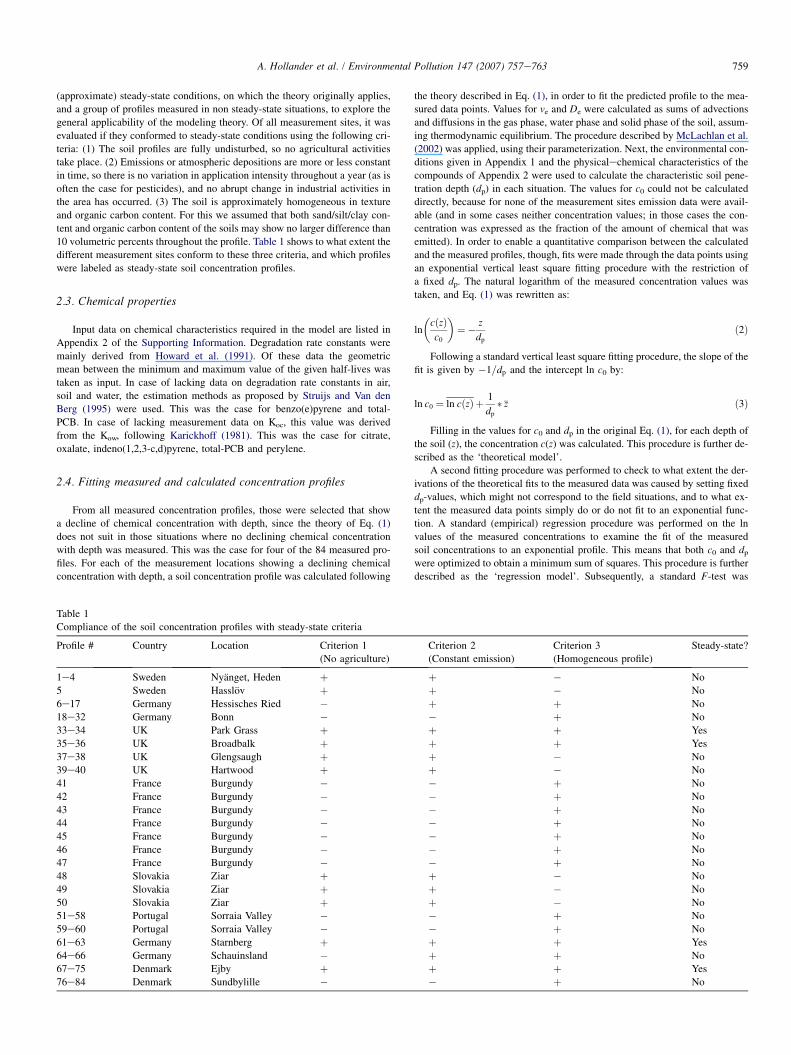
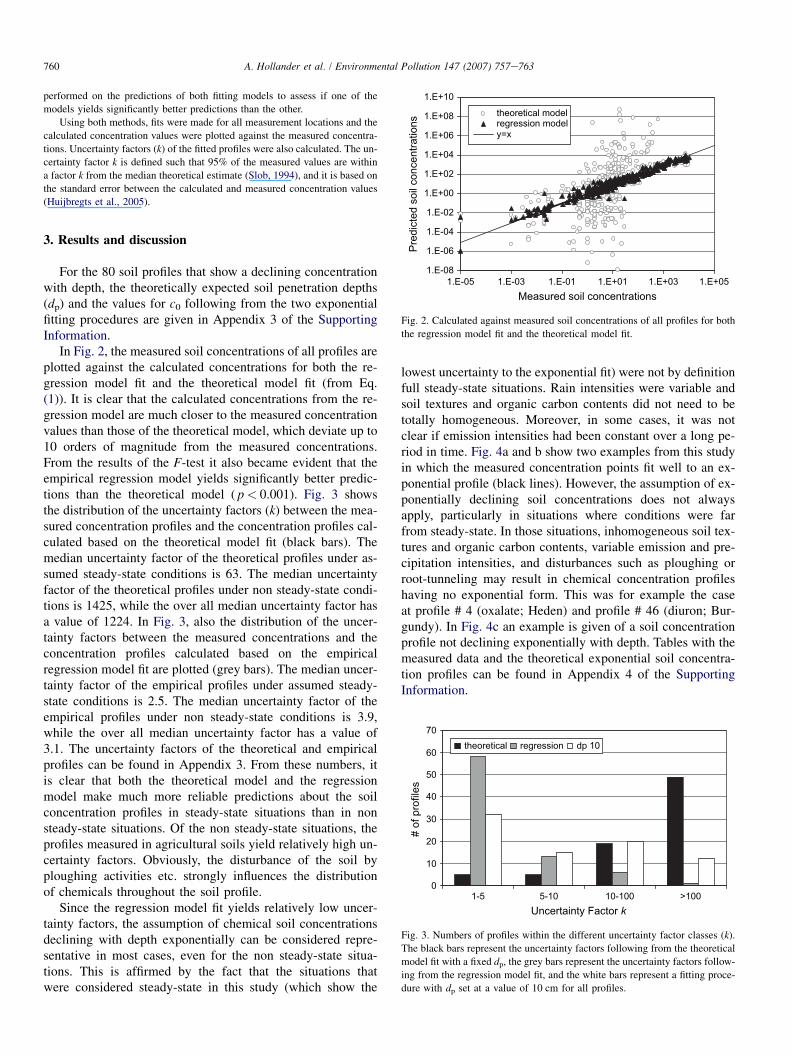
In Fig. 2, the measured soil concentrations of all profiles areplotted against the calculated concentrations for both the re-gression model fit and the theoretical model fit (from Eq.(1)). It is clear that the calculated concentrations from the re-gression model are much closer to the measured concentrationvalues than those of the theoretical model, which deviate up to10 orders of magnitude from the measured concentrations.From the results of the F-test it also became evident that theempirical regression model yields significantly better predic-tions than the theoretical model ( p< 0.001). Fig. 3 showsthe distribution of the uncertainty factors (k) between the mea-sured concentration profiles and the concentration profiles cal-culated based on the theoretical model fit (black bars). Themedian uncertainty factor of the theoretical profiles under as-sumed steady-state conditions is 63. The median uncertaintyfactor of the theoretical profiles under non steady-state condi-tions is 1425, while the over all median uncertainty factor hasa value of 1224. In Fig. 3, also the distribution of the uncer-tainty factors between the measured concentrations and theconcentration profiles calculated based on the empiricalregression model fit are plotted (grey bars). The median uncer-tainty factor of the empirical profiles under assumed steady-state conditions is 2.5. The median uncertainty factor of theempirical profiles under non steady-state conditions is 3.9,while the over all median uncertainty factor has a value of3.1. The uncertainty factors of the theoretical and empiricalprofiles can be found in Appendix 3. From these numbers, itis clear that both the theoretical model and the regressionmodel make much more reliable predictions about the soilconcentration profiles in steady-state situations than in nonsteady-state situations. Of the non steady-state situations, theprofiles measured in agricultural soils yield relatively high un-certainty factors. Obviously, the disturbance of the soil byploughing activities etc. strongly influences the distributionof chemicals throughout the soil profile.
Since the regression model fit yields relatively low uncer-tainty factors, the assumption of chemical soil concentrationsdeclining with depth exponentially can be considered repre-sentative in most cases, even for the non steady-state situa-tions. This is affirmed by the fact that the situations thatwere considered steady-state in this study (which show the
lowest uncertainty to the exponential fit) were not by definitionfull steady-state situations. Rain intensities were variable andsoil textures and organic carbon contents did not need to betotally homogeneous. Moreover, in some cases, it was notclear if emission intensities had been constant over a long pe-riod in time. Fig. 4a and b show two examples from this studyin which the measured concentration points fit well to an ex-ponential profile (black lines). However, the assumption of ex-ponentially declining soil concentrations does not alwaysapply, particularly in situations where conditions were farfrom steady-state. In those situations, inhomogeneous soil tex-tures and organic carbon contents, variable emission and pre-cipitation intensities, and disturbances such as ploughing orroot-tunneling may result in chemical concentration profileshaving no exponential form. This was for example the caseat profile # 4 (oxalate; Heden) and profile # 46 (diuron; Bur-gundy). In Fig. 4c an example is given of a soil concentrationprofile not declining exponentially with depth. Tables with themeasured data and the theoretical exponential soil concentra-tion profiles can be found in Appendix 4 of the SupportingInformation.
1.E-08
1.E-06
1.E-04
1.E-02
1.E+00
1.E+02
1.E+04
1.E+06
1.E+08
1.E+10
1.E-05 1.E-03 1.E-01 1.E+01 1.E+03 1.E+05Measured soil concentrations
Pred
icte
d so
il co
ncen
tratio
ns
theoretical modelregression modely=x
Fig. 2. Calculated against measured soil concentrations of all profiles for both
the regression model fit and the theoretical model fit.
0
10
20
30
40
50
60
70
1-5 5-10 10-100 >100Uncertainty Factor k
# of
pro
files
theoretical regression dp 10
Fig. 3. Numbers of profiles within the different uncertainty factor classes (k).
The black bars represent the uncertainty factors following from the theoretical
model fit with a fixed dp, the grey bars represent the uncertainty factors follow-
ing from the regression model fit, and the white bars represent a fitting proce-
dure with dp set at a value of 10 cm for all profiles.

761A. Hollander et al. / Environmental Pollution 147 (2007) 757e763
a b
c
#33 United Kingdom, Park Grass
Total-PAH
0200
400600800
1000120014001600
0 5 10 15 20Depth (cm)
Con
cent
ratio
n (n
g.g-1
)
#71 Denmark, Ejby
Benzo(k)fluoranthe
0
5
10
15
20
0 10 20 30 40 50Depth (cm)
Con
cent
ratio
n (n
g.g-1
)
#2 Sweden, Nyanget
Oxalate
0.0
1.0
2.0
3.0
4.0
5.0
6.0
7.0
0 10 20 30Depth (cm)
Con
cent
ratio
n (1
0-6 M
)
Exponential fit with a fixed dp
Exponential fit without a fixed dp
Measured concentration
Fig. 4. Examples of measured soil concentration data with theoretical fits. The grey lines represent the theoretical exponential fits with a fixed dp, the black lines
represent empirical fits without a fixed dp. Numbers of the graphs resemble with the location numbers in Appendix 1.
The uncertainty in the theoretical profiles calculated fromEq. (1) can thus be explained only for a small part by the di-vergence from exponential profiles. The fact that the uncer-tainty factors of the exponential functions with a fixed dp
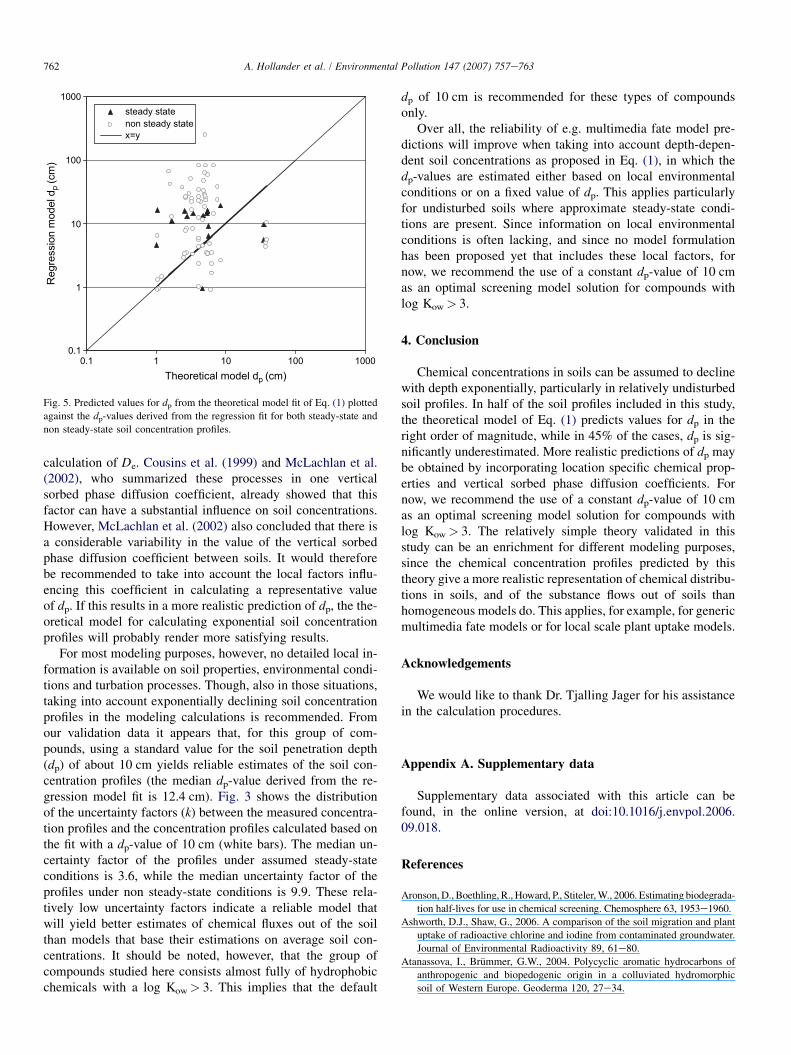
(theoretical model) are much higher than those without a fixeddp (regression model) shows that the predicted values of dp donot always correspond to reality. In the theoretical model, thepredicted value of dp is often too low, which results in an over-estimation of the values for c0. This was the case in 45% of thecases. On average, the value of dp for these profiles was under-estimated by a factor of 11. It appeared that no relationshipsexist of the divergence between measured and predicted dp-values with different physicalechemical properties of thestudied compounds, or with land use or other environmentalparameters. In Fig. 4a an example is given of an exponentialfit with a fixed dp in which the predicted dp appears to be inthe correct range (grey line). Fig. 4b shows an example ofa fit in which the exponential fit without a fixed dp is good(black line), but where the restriction of a theoretically esti-mated dp results in a high c0 and a soil profile not correspond-ing to reality (grey line). In Fig. 5, all predicted values for dp
from the theoretical model of Eq. (1) are plotted against thedp-values derived from the regression model fit. This figureshows that more than 90% of the theoretically predicted dp-values are within a range of 0e10 cm, while the range ofdp-values derived from the regression model fit is much larger.Obviously, the theoretical model is not capable of describingthe total actual variation in dp-values under different
environmental conditions and for different compound types.Besides, most theoretically predicted dp-values are lowerthan the dp-values from the regression fit. The consequenceof underestimating the value for dp and thus overestimatingthe value for c0 is that substance flows from the soil surfacetowards the air and the surface water are predicted unrealisti-cally high.
One possible cause of unrealistic predictions of dp is the un-certainty in the physicalechemical properties of the com-pounds studied. Particularly, degradation rate constants, forwhich the model is rather sensitive, are often highly uncertain(Aronson et al., 2006; Hertwich et al., 1999). Second, the as-sumption of constant coefficients for degradation, diffusionand advection throughout the soil profile may not correspondto reality, especially in situations where inhomogeneous soilprofiles are apparent. Particularly for compounds with a longhalf-life in soils, degradation rates may be relatively high inthe top soil layer with regard to deeper soil regions. Neglectingthese differences can lead to relatively high concentration pre-dictions in the upper part of the soil. Third, we neglect the pro-cess of chemicals in groundwater migrating upward into theoverlying soils. For certain chemicals and environmental sys-tems, this process can have a significant influence on the soilconcentrations (e.g. Ashworth and Shaw, 2006). Similarly, till-age activities on agricultural soils are not incorporated in theestimated of De. Finally, a parameter leading to biased predic-tions of dp is the factor representing bioturbation, cryoturba-tion and erosion into cracks, which is incorporated in the
762 A. Hollander et al. / Environmental Pollution 147 (2007) 757e763
calculation of De. Cousins et al. (1999) and McLachlan et al.(2002), who summarized these processes in one verticalsorbed phase diffusion coefficient, already showed that thisfactor can have a substantial influence on soil concentrations.However, McLachlan et al. (2002) also concluded that there isa considerable variability in the value of the vertical sorbedphase diffusion coefficient between soils. It would thereforebe recommended to take into account the local factors influ-encing this coefficient in calculating a representative valueof dp. If this results in a more realistic prediction of dp, the the-oretical model for calculating exponential soil concentrationprofiles will probably render more satisfying results.
For most modeling purposes, however, no detailed local in-formation is available on soil properties, environmental condi-tions and turbation processes. Though, also in those situations,taking into account exponentially declining soil concentrationprofiles in the modeling calculations is recommended. Fromour validation data it appears that, for this group of com-pounds, using a standard value for the soil penetration depth(dp) of about 10 cm yields reliable estimates of the soil con-centration profiles (the median dp-value derived from the re-gression model fit is 12.4 cm). Fig. 3 shows the distributionof the uncertainty factors (k) between the measured concentra-tion profiles and the concentration profiles calculated based onthe fit with a dp-value of 10 cm (white bars). The median un-certainty factor of the profiles under assumed steady-stateconditions is 3.6, while the median uncertainty factor of theprofiles under non steady-state conditions is 9.9. These rela-tively low uncertainty factors indicate a reliable model thatwill yield better estimates of chemical fluxes out of the soilthan models that base their estimations on average soil con-centrations. It should be noted, however, that the group ofcompounds studied here consists almost fully of hydrophobicchemicals with a log Kow> 3. This implies that the default
0.1
1
10
100
1000
0.1 1 10 100 1000Theoretical model dp (cm)
Reg
ress
ion
mod
el d
p (c
m)
steady statenon steady statex=y
Fig. 5. Predicted values for dp from the theoretical model fit of Eq. (1) plotted
against the dp-values derived from the regression fit for both steady-state and
non steady-state soil concentration profiles.
dp of 10 cm is recommended for these types of compoundsonly.
Over all, the reliability of e.g. multimedia fate model pre-dictions will improve when taking into account depth-depen-dent soil concentrations as proposed in Eq. (1), in which thedp-values are estimated either based on local environmentalconditions or on a fixed value of dp. This applies particularlyfor undisturbed soils where approximate steady-state condi-tions are present. Since information on local environmentalconditions is often lacking, and since no model formulationhas been proposed yet that includes these local factors, fornow, we recommend the use of a constant dp-value of 10 cmas an optimal screening model solution for compounds withlog Kow> 3.
4. Conclusion
Chemical concentrations in soils can be assumed to declinewith depth exponentially, particularly in relatively undisturbedsoil profiles. In half of the soil profiles included in this study,the theoretical model of Eq. (1) predicts values for dp in theright order of magnitude, while in 45% of the cases, dp is sig-nificantly underestimated. More realistic predictions of dp maybe obtained by incorporating location specific chemical prop-erties and vertical sorbed phase diffusion coefficients. Fornow, we recommend the use of a constant dp-value of 10 cmas an optimal screening model solution for compounds withlog Kow> 3. The relatively simple theory validated in thisstudy can be an enrichment for different modeling purposes,since the chemical concentration profiles predicted by thistheory give a more realistic representation of chemical distribu-tions in soils, and of the substance flows out of soils thanhomogeneous models do. This applies, for example, for genericmultimedia fate models or for local scale plant uptake models.
Acknowledgements
We would like to thank Dr. Tjalling Jager for his assistancein the calculation procedures.
Appendix A. Supplementary data
Supplementary data associated with this article can befound, in the online version, at doi:10.1016/j.envpol.2006.09.018.
References
Aronson, D., Boethling, R., Howard, P., Stiteler, W., 2006. Estimating biodegrada-
tion half-lives for use in chemical screening. Chemosphere 63, 1953e1960.
Ashworth, D.J., Shaw, G., 2006. A comparison of the soil migration and plant
uptake of radioactive chlorine and iodine from contaminated groundwater.
Journal of Environmental Radioactivity 89, 61e80.
Atanassova, I., Brummer, G.W., 2004. Polycyclic aromatic hydrocarbons of
anthropogenic and biopedogenic origin in a colluviated hydromorphic
soil of Western Europe. Geoderma 120, 27e34.
763A. Hollander et al. / Environmental Pollution 147 (2007) 757e763
Azevedo, A.S., Kanwar, R.S., Pereira, L.S., 2000. Atrazine transport in irri-
gated heavy- and course-textured soils. Part I: field studies. Journal of
Agricultural Engineering Research 76, 165e174.
Cahill, T.M., Mackay, D., 2003. Complexity in multimedia mass balance models:
when are simple models adequate and when are more complex models nec-
essary? Environmental Toxicology and Chemistry 22, 1404e1412.
Chu, X., Marino, M.A., 2004. Semidiscrete pesticide transport modeling and
application. Journal of Hydrology 285, 19e40.
Cousins, I.T., Gevao, B., Jones, K.C., 1999. Measuring and modelling the ver-
tical distribution of semi-volatile organic compounds in soils. I: PCB and
PAH soil core data. Chemosphere 39, 2507e2518.
Cowan, C.E., Mackay, D., Feijtel, T., Van de Meent, D., Di Guardo, A.,
Davies, J., Mackay, N., 1995. The Multimedia Fate Model: A Vital Tool
for Predicting the Fate of Chemicals. SETAC Press, Pensacola.
Den Hollander, H., Van de Meent, D., 2004. SimpleBox 3.0: Multimedia Mass
Balance Model for Evaluating the Fate of Chemicals in the Environment.
National Institute for Public Health and the Environment, Bilthoven.
Report no. 601200003.
Gocht, T., Moldenhauer, K.M., Puttmann, W., 2001. Historical record of poly-
cyclic aromatic hydrocarbons (PAH) and heavy metals in floodplain sedi-
ments from the Rhine River (Hessisches Ried, Germany). Applied
Geochemistry 16, 1707e1721.
Hertwich, E.G., McKone, T.E., Pease, W.S., 1999. Parameter uncertainty and
variability in evaluative fate and exposure models. Risk Analysis 19,
1193e1204.
Hollander, A., Hessels, L., De Voogt, P., Van de Meent, D., 2004. Implemen-
tation of depth-dependent soil concentrations in multimedia mass balance
models. SAR and QSAR in Environmental Research 15, 457e468.
Howard, P.H., Boethling, R.S., Jarvis, W.F., Meylan, W.M., Michalenko, E.M.,
1991. Handbook of Environmental Degradation Rates. Lewis Publishers,
Michigan.
Huijbregts, M.A.J., Geelen, L.M.J., Hertwich, E.G., McKone, T.E., Van de
Meent, D., 2005. A comparison between the multimedia fate and exposure
models CalTox and uniform system for evaluation of substances adapted
for life-cycle assessment based on the population intake fraction. Environ-
mental Toxicology and Chemistry 24, 486e493.
Karickhoff, S.W., 1981. Semi empirical estimation of sorption of hydro-
phobic pollutants on natural water sediments. Water Research 13,
241e248.
Landry, D., Dousset, S., Andreux, F., 2005. Leaching of oryzalin and diuron
through undisturbed vineyard soil columns under outdoor conditions.
Chemosphere 62, 1736e1747.
Mackay, D., 1991. Multimedia Fate Models, the Fugacity Approach. Lewis
Publishers, Chelsea.
McKone, T.E., 1993. CalTOX: A Multimedia Total-exposure Model for Haz-
ardous-wastes Sites. Part II: Multimedia Transport and Transformation
Model. Lawrence Livermore National Laboratory, Department of Toxic
Substances Control, Livermore. Report no. UCRL-CR-111456PtI.
McKone, T.E., Bennett, D.H., 2003. Chemical-specific representation of aire
soil exchange and soil penetration in regional multimedia models. Environ-
mental Science and Technology 35, 142e148.
McLachlan, M.S., Czub, G., Wania, F., 2002. The influence of vertical sorbed
phase transport on the fate of organic chemicals in surface soils. Environ-
mental Science and Technology 36, 4860e4867.
Paterson, S., Mackay, D., 1994. A model of organic uptake by plants from soil
and the atmosphere. Environmental Science and Technology 28, 2259e
2266.
Rotard, W., Christmann, W., Knoth, W., 1994. Background levels of PCDD/F
in soils of Germany. Chemosphere 29, 2193e2200.
Slob, W., 1994. Uncertainty analysis in multiplicative models. Risk Analysis
14, 571e576.
Smith, K.E.C., Jones, K.C., 2000. Particles and vegetation: implications for the
transfer of particle-bound organic contaminants to vegetation. Science of
the Total Environment 246, 207e236.
Struijs, J., Van den Berg, R., 1995. Standardized biodegradability tests: extrap-
olation to aerobic environments. Water Research 29, 255e262.
Van Hees, P.A.W., Jones, D.L., Nyberg, L., Holmstrom, S.J.M., Godbold, D.L.,
Lindstrom, U.S., 2005. Modelling low molecular weight organic acid
dynamics in forest soils. Soil Biology and Biochemistry 37, 517e531.
Vikelsøe, J., Johansen, E., Thomsen, M., Carlsen, L., 2002. Persistent Organic
Pollutants in Soil, Sludge and Sediment: A Multianalytical Field Study of
Selected Organic Chlorinated and Brominated Compounds. National Envi-
ronmental Research Institute Denmark, Roskilde. Report no. 402.
Wania, F., Mackay, D., 1999. The evolution of mass balance models of persis-
tent organic pollutant fate in the environment. Environmental Pollution
100, 223e240.
Wilcke, W., Zech, W., Kobza, J., 1996. PAH-pools in soils along a PAH-depo-
sition gradient. Environmental Pollution 92, 307e313.