Toral and exponential stabilization for homotopy spherical spaceforms
Upload
khangminh22Category
view
4download
0
Unit 2Linear and ExponentialRelationships
Lesson 10 Rational Exponents 70
Lesson 11 Functions 76
Lesson 12 Key Features of Functions 82
Lesson 13 Average Rate of Change 92
Lesson 14 Graphing Functions 100
Lesson 15 QJ Solving Systems of Linear Equations 108
Lesson 16 QJ Using Functions to Solve Equations 116
Lesson 17 LJJ Graphing Inequalities 124
Lesson 18 Translating Functions 134
Lesson 19 Reflecting Functions 144
Lesson 20 Stretching and Shrinking Functions 150
Lesson 21 Eid Functions in Context 160
Lesson 22 Qj Arithmetic Sequences 166
Lesson 23 G3 Geometric Sequences 172
Unit 2 Review 178
Unit 2 Performance Task 182
69

Rational Exponents
An exponential expression includes a base raised to an exponent, orpower. The properties of exponents can help you simplify many exponential expressionsand solve equations involving exponents. Some of those properties are listed below.
Product of powers:
Power of a product:
Power of a power:
Power of zero:
Quotient of powers:
Power of a quotient:
Negative powers:
(ab)m = amb
a -" = - a n d - - an for all a * 0
An exponential expression can be evaluated for any rational exponent. Until now, you haveworked primarily with integer powers, but sometimes you may need to simplify or evaluate anexponential expression for other powers. The properties of exponents can help you rewriteexpressions with fractional exponents in a more familiar form.
You know that 2 • -^ = 1, 3 =3, and \'9 = 3. By applying the substitution property of equality
and the power of a power property, you can find an equivalent form of a fractional exponent.
3' = 3 Substitute 2 • for 1.
Apply the power of a power property.
Evaluate inside the parentheses. Substitute V^for 3.
Raising a number to the power j is equivalent to taking its square root.
In general, an exponential expression with a fractional exponent involves a root. Inconverting between the exponential and radical forms, the base becomes the radicand, thedenominator of the fraction becomes the index of the root, and the numerator of the fractionbecomes an integer exponent for the expression.
A base a with exponent „ is the same as the nth root of the number a.
an = Vo
rn .A base o with exponent jj- is the same as the nth root of the number a raised to the mth power.
a" = ('Vo)m = 'Vo'
70 Unit 2: Linear and Exponential Relationships

ConnectSimplify the expression
v'X ,h x2.
Rewrite each radical expression usingexponents.
In the expression \fx, the unwritten indexi
is 2, so Vx = x2.
In the expression 3vx, the index is 3,
so 3Vx = x1.
6r~sIn the expression "\ , the index is 6 and6fT -the exponent is 5, so \ = x6.
Now, rewrite the expression withradicals.
no
1 1x z - x j
Simplify the numerator of the fraction,
Use the product of powers property tomultiply the terms.
x2i
x5
1 4- '
X 2 " 3
5
XG
Now, rewrite the expression.
x2 - x 3 J vG 3jr yv -
c2 = — + x2
x"
Simplify the fraction.
Notice that the numerator anddenominator of the fraction are identical.Any fraction with the same numerator anddenominator is equal to 1.
vl 1 1
^ 4- x2 = 1 + x7
Simplify.I ild l
5 s
„Rewrite the exponential expression asa radical.
3
To rewrite the expression x2 as a radical,the base, x, will be the radicand, thenumerator of the fraction, 3, will be anexponent, and the denominator, 2, will bethe index of the radical.
^ 1 + x^ - 1 + (Vx)3
Since the expression has a rationalexponent that is an improper fraction,it can be written in another way.
x2 = x1 ' 2 - (
1 + x1 = 1 + xVx
Lesson 10: Rational Exponents 71

Use a table to graph the equation y = 4*. Then, use the graph to confirm values of y for
fractional values of x.
Make a table of values.
Make a table of values with fractionalvalues of x.
y — *i
y=4* = (22)*=2< = V2-1.414
y = 43 = 4^-1,587
y = 4^ = V4 - 2
i/=:45 = (V4)3 = 23 = 8
y
1.414
1.587
2
8
Graph the equation on your graphing
calculator and use the TRACE or TABLE
function to confirm your answers. Are
your calculations for x = and x =
more or less accurate than those on
the calculator?
Graph the equation using the valuesfrom the table.
Compare the values in the table tothe graph.
According to the equation, when x = ^ and
x - 3, y is close to 1 . The graph passes
near 1 for these values of x.
When x = y = 2. The graph has a y-value
of 2 halfway between the x-values of 0and 1.
When x - 2- y ~ 8. The graph has a y-value
of 8 halfway between the x-values of 1and 2,
^ The values of the equation for fractionalvalues of x match the graph above.
72 Unit 2: Linearand Exponential Relationships

EXAMPLE B - I—Solve the equation 32 = 9V3 for x.
Write all terms as exponential expressions with the same base.
The left side of the equation has a base of 3, so rewrite the expression 9^3 as an exponentialexpression with a base of 3.
9V3.202 nr3 • V3
3 2 I >5
Substitutes for9.
Rewrite the radical as an exponential expression.
Use the product of powers property.
Find a common denominator and add.
Solve the equation.
Substitute the expression you found above for the right side of the equation.
3! = 9V3 Substitute 3^ for 9^/3 .x_ 5
32 = 3? Since the bases are equal, set the exponents equal to each other.
x 5 Multiply both sides of the equation by 2.
- 5
The solution to the equation is x - 5.
Solve the equation 64y — 16fory.
Lesson 10: Rational Exponents 73

PracticeRewrite each radical expression as an exponential expression with a rational exponent.
1. 2. 3. Vx
REMEMBER The index of the radical becomesthe denominator of the fractional exponent.
Rewrite each exponential expression as a radical expression.
4. 5' 5. 12- 6. y5
Simplify each expression by using the properties of exponents.
7. (16*)-(16*) 8.27-
2T9-
: REMEMBER To multiply
; exponential expressions with thei same base, add the exponents.
Choose the best answer.
5
10. Which is equivalent to x3?
A. x
B x'
C.
D. x Vx
.12,11. Which is equivalent to V27n ?
A. 3n2
B. nV3
C. n2V3"
D. V3/?
74 Unit 2: Linear and Exponential Relationships

Simplify each expression.
12. (x^ + ( ^ 3
13. g_\Va
14.\b
15. 7(\32c15'
Solve each equation.
16. 2y-V8 17. 3V3 = 3' 18. 125* = 5
19. JlifiVMjliiWi* Write the expression V32 in three different but equivalent ways.
20. fiinna;* Write each expression as a power of 2 with a rational exponent.
2V2:
V4:_
1.2'
Using the exponents, order the terms from least to greatest.
Lesson 10: Rational Exponents 75

Functions
A relation is a set of ordered pairs of the form (x, y). The equation y = x + 4describes a relation. It relates the value of y to the value of x. A relation can be representedas an equation, a graph, a table, a mapping diagram, or a list of ordered pairs.
A function is a special kind of relation in which each input, the first value in the ordered pair,is mapped to one and only one output, the second value in the ordered pair.
This relation is not a function:(1,6), (3 8), (3, 9)
\The input 3 is assigned to two different outputs.
This relation is a function:(1,6), (3, 8), (5, 10)t t t
Each input is assigned to only one output.
The set of all possible inputs for a function is called the function'sdomain. The set of all possible outputs for a function is called itsrange. The domain and range are sets that consist of values calledelements. Look at the function shown in the mapping diagram.The domain for that function is the numbers -4, -3, -2, -1, and 0,or the set (-4, -3, -2, -1, 0}. The range is {-5, -4, -3,2}.
Input Output
H-
0
-J _
n--^
u
o
* *"A function can be written as an equation using function notation. Inthe equation f(x) = 2* + 1, the notation f(x) is read as "fofx." It takes theplace of y and stands for the output of the function for the input x. So, when x = 2, f(x) becomesf(2), and f(2) = 22 + 1 = 5. This means that the function/includes the ordered pair (2, 5).
This same function can be represented by a graph. By replacing f(x) with y, the equation canbe graphed on thexy-coordinate plane. The set of all the points on that graph is the function.
Most often, a function is named by the letter fand has input x, but a function can be named byalmost any letter or symbol. For example, a function might be named g(x) or o(x). A function inanother situation might be named h(t), so that the variable representing the input is t.
76 Unit 2: Linear and Exponential Relationships

-t ConnectDoes this graph represent a function?
Perform the vertical line test by drawinga vertical line through the graph atx = 5.
Determine if the graph representsa function.
If any vertical line drawn through a graphpasses through more than one point, thegraph does not represent a function. The
- >- vertical line passes through two points:(5, 3) and (5, - 3). This means that theinput value of 5 maps to two differentoutputs, 3 and - 3, so the graph does notshow a function.
^ The graph does not pass the vertical linetest. It does not represent a function.
tresent a function? x -2 -i :f(x) -24 i -2-i '•I\I *-4 *>2
0
-2
I I !1 2 3
_oJ- 9_ -a
Look at the input values in the table.
No input, or x-value, appears in thetable more than once, so each inputcorresponds to only one output.
^ This means that the table representsa function.
Construct a mapping diagram by usingthe elements in the table. How can amapping diagram help you determine ifthe relation is a function?
Lesson 11: Functions 77

A function in which the input variable is an exponent is an exponential function.
f!» Evaluate the exponential function h(t) - 31 + 1 for t = 4.EXAMPLE
Substitute 4 for t in the equation.
Evaluating a function means finding theoutput for a given input. In this case, theinput is 4, so find the value of h(4).
h(t) - 3' + 1
h{4) = 34 + 1
Perform the calculations to findthe output.
- 3 + 1
-81+1
h(4) - 82
A function in which the input variable is raised to the first power is a linear function.
l^ilflia^s* The linear function g(x) = 3x + 4 has the domain {-2, -1,0, 1, 2}. Find the range of g(x)
Create a table of values to find all theelements in the range.
In order to find the elements of the range,evaluate the function for each value inthe domain.
x g(x) = 3x + 4 g (x)
-2 g(-2) - 3(-2) + 4= -2 -2
-1 g(--i) = 3(-l) + 4 = 1 i
0 g(0) = 3(0) + 4 - 4 4
1 gO) = 3(1) + 4 - 7 7
2 g(2) = 3(2) + 4 - 10 10
The function P(t) = 10 • 2'can be usedto represent the population of bacteriain a Petri dish after t hours. What are thevalues of P(0) and P{4)? What do thesevalues represent?
Collect the values of g(x) into a set.
The values of g(x) are -2,1,4, 7, and 10.
The range of g(x) is (-2,1, 4, 7,10}.
78 Unit 2: Linear and Exponential Relationships

Look at the table. What values of a would make f(x) a
function? What values of a would indicate that f(x) is not a function?*-1
3
o
6
f(x)
-1.5
6
14
17
Review the definition of a function.
Recall that a function is a relation in whichevery input, orx-value, maps to only oneoutput, or f(x)-value.
So, if the table represents a function,nox-valuecan map to more than onef(x)-value.
Find possible values for a.
If a = —1, 3, or 6, an x-value would map tomore than one f{x)-value. For example, ifa = — 1, the x-value -1 would map to both-1.5 and 14. This means that the relationwould no longer be a function.
For any real number values of o other than— 1,3, and 6, every x-value would map toonly one f(x)-value.
^ The relation f(x) is not a function wheno is equal to -1, 3, or 6. The relation is afunction when the value of a is any realnumber except -1, 3, and 6.
EXAMPLE Find the value of the function g(x) = 5x3whenx = 8.
Substitute the value of x into thefunction.
g(x) = 5x5
g(8) = 5 - 8 ^
Write two ordered pairs, each withthe same y-coordinate. Could thesetwo ordered pairs belong to the samefunction?
2Evaluate the function.
Rewrite the rational exponent as a root.
Since the denominator is 3, that will be the
index of the radicand.
5 • 8J
g(8) = 5 • V8
9(8) = 5 - 2
K 9(8) = 10.
Rewrite the exponentas a radical.
Lesson 11: Functions 79

PracticeDetermine whether each relation is a function.
1. Input Output
+ n i
-»- 1R
2.
REMEMBER In a function,each input maps to onlyone output,
Evaluate the function for the given value of x.
4. f(x) = lOx^forx- 27 5.
3.
Does a vertical linepass through morethan one point?
= 7rforx = 81
Write true or false for each statement. If false, rewrite the statement so it is true.
6. The range of a function is the set of all of its inputs.
7. To graph the function f(x) = x + 2, you can draw the graph ofy - x + 2 because the graph of fisthe graph of the equation y = f (x).
Choose the best answer.
8. Which value could not be substituted fora if the table represents a function?
24
A. 1
C. -1
a
1
2
4
4
: -i iB. 0
D. -3
9. The function f(x) = 2x3 has the domain{0, 1, 4, 9}. Which of the following is therange of the function?
A. {2,2,16,54}
B. {0,2,16,54}
C. {0,2,8,162}
D. {2,2,16,27}
80 Unit 2: Linearand Exponential Relationships

Evaluate the functions for the inputs given. Show your work in the tables.
10.
11. x
0
1 f(D -
2 . f(2) =
3 f(3) =
4 ! f{4) =
f(x) = 10* + 5 f(x)
Solve.
12. A ball dropped onto a hard floor from a height of 16 inches bounces back up to -= its previous
heighten each successive bounce. The function h(b) = 16 • (^ can be used to represent this
situation. To what height, in inches, will the ball rise on its third bounce? {Hint: Evaluate/ 1 \h(b) = 16 • bd for b = 3.) Show your work.
EVALUAT The total charge for a babysitting job that lasts t hours can be represented by thefunction c(t) = 2 + 9t. Evaluate this function for the domain {1, 2, 3}. Show your work and brieflyexplain what each pair of values means in this problem situation.
14. gill w ii 3' |f you switch the domain and range of a function, will the relation that resultssometimes be a function? Will it always be a function? Give examples to justify your answer.
Lesson 11: Functions 81

Key Features of Functions
Intercepts and End Behavior
UNDERSTAN The graphs and tables of functions contain various key features. These keyfeatures are often important for understanding functions and using them to solve problems.
The x-intercept of a function is the point (a, 0) at which the graph intersects the x-axis.The y-intercept is the point (0, b) at which the graph intersects the y-axis. In the graph of[(x) = 3X - 3 shown, the x-intercept is (1, 0) and the y-intercept is (0, -2).
fM
I
0.
12
0
6
^—y-intercept
^—x-intercept
f(x) approachesas x approaches
yapproaches x| as x appro dies
_i—i.
j asy nptoe
You can locate the x-intercept in a table by finding the row whose y-value is 0.The y-intercept is in the row whose x-value is 0.
Functions can also be described in terms of theirend behavior. In the graph of f(x) = 3* - 3, look atthe arrows on each end of the graph. The arrow onthe right end of the curve shows that as x increases,y also continuously increases. Since the value ofy is continuously increasing, this function has nomaximum value. The arrow on the left end of thecurve shows that as x decreases (becomes morenegative), yapproaches but never reaches - 3.This line that the graph approaches but nevertouches is called the asymptote of the function.Since the graph asymptotically approaches the liney = -3 but never intersects it, the function has nominimum value.
If enough values are listed in a table, you canestimate end behavior based on the values of f(x).Starting from the top of the second column andmoving down, notice that the value of f(x) getslarger and larger. Starting from the bottom of thecolumn and moving up, notice that f(x) gets smaller(more negative) but never passes —3.
x f(x)
-3 *- 97
~T 1-2
-1
0
1
2
3
—9 —29
-2-
-2
o
f(x) decreases
f(x) increasesg I without bound
24 r82 Unit 2: Linear and Exponential Relationships
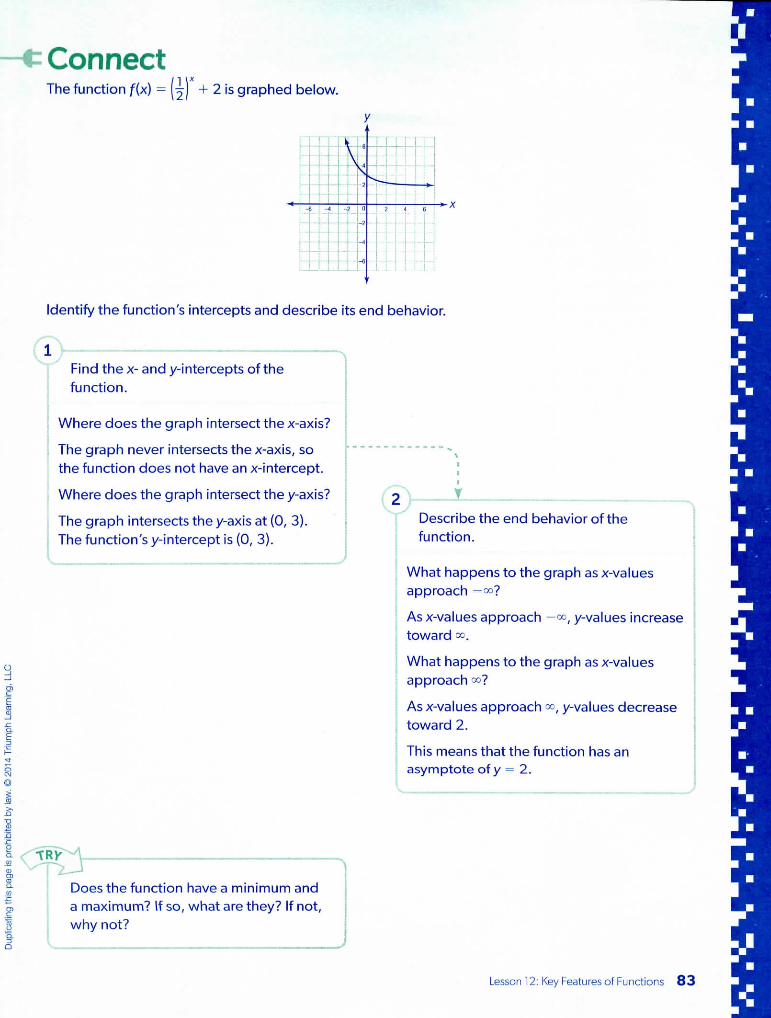
ConnectThe function f(x) = + 2 is graphed below.
Identify the function's intercepts and describe its end behavior.
Find thex-andy-intercepts of thefunction.
Where does the graph intersect the x-axis?
The graph never intersects the x-axis, sothe function does not have an x-intercept.
Where does the graph intersect the y-axis?
The graph intersects the y-axis at (0, 3).The function's y-intercept is (0, 3).
Describe the end behavior of thefunction.
What happens to the graph as x-valuesapproach —o°?
As x-values approach -«^,y-values increasetoward oo.
What happens to the graph as x-valuesapproach <*>?
As x-values approach o°, y-values decreasetoward 2.
This means that the function has anasymptote of y = 2.
Does the function have a minimum anda maximum? If so, what are they? If not,why not?
Lesson 12: Key Features of Functions 83

Intervals of Functions
'1* Remember that a function's domain is the set of all possible inputs. For afunction such as f(x) = 3* - 3, the domain is the interval on the x-axis on which the functionis defined, in which the graph exists. The range of a function is the interval on they-axiscontaining all possible outputs.
Interval notation can be used to represent an interval. In interval notation, the end values ofan interval are listed as a pair separated by a comma. A bracket beside a value means thatit is included in the interval, while a parenthesis means that it is not. For example, the domain[0, 5) is equivalent to 0 x < 5.
The domain can be broken up into smaller intervals that share a certain characteristic. Forexample, it can be useful to divide the domain into sections in which the value of f(x) ispositive and sections where it is negative.
Look again at a graph of the function f{x) = 3X - 3. Determinethe intervals where y is positive and where y is negative. Thevalue of y is negative when x < 1. The value of y is positivewhen x > 1. Using interval notation, y is negative on theinterval (-co, l)and positive on the interval ("], «=).
The domain can also be divided into sections where the value of f (x) is increasing from left toright and where it is decreasing from left to right.
Look at the graph. From left to right, the graph is alwayscurving upward. The value of y is always increasing as thevalue of x increases. This is true across the entire domain,from negative infinity (-=&) to positive infinity (<«). The functionis always increasing. In other words, the interval of increaseJ S ( — ocf oc).
Usually, these intervals can also be determined from tables bylooking at the values in the f(x) column.
84

ConnectThe graph below represents an exponential function f. The table below represents a linear function g.
y
*-x
X
_c
~~3
3
6
. 1} - 3x
2
1
; o-i-2
Compare and contrast functions f and g by using these key features: domain; range; intervals ofincrease and decrease; and positive and negative intervals.
Identify the domain and range.
The end behavior of the graph of fshowsthat it extends indefinitely both left andright. Thus, its domain is all real numbers,orthe interval
Since f has an asymptote of y = -l, itsrange isy > —1, orthe interval (- 1, =e).
The table for function g does not list allvalues of x or g(x), but it also does notgive evidence of any boundaries (such asan asymptote). Since g is a linear function,without other information, you mayassume that the domain and range are allreal numbers.
Compare positive intervals and negativeintervals for the functions.
The graph of /"intercepts the x-axis at(0, 0). The third row of values in the tableshows that g also has an x-intercept of(0, 0). The functions are always decreasing.
Functions fand g are both positive whenx < 0, on the interval ( — , 0), and negativewhen x > 0, on the interval (0, •*).
Compare the intervals of increaseand decrease.
The graph of f continuously curvesdownward. So, f is always decreasing.
The table for function g shows that asx-values increase, g(x)-values decrease,so g is also a decreasing function.
Both functions are decreasing across theirentire domains. The interval of decrease is(—cc ( so) for both functions.
Graph function g on the same grid as f.Compare and contrast the two graphs tocheck the answers on this page.
Lesson 12: Key Features of Functions 85

EXAMPLE The domain of a linear function is{-l < x^ 2}. The function hasanx-interceptat (1, 0)and a y-intercept at (0, -3). Graph the function. Then identify the maximum, minimum, range, andintervals of increase and decrease for the function.
Graph the function, paying attention tothe restricted domain.
Plot the intercepts. Draw a line through theintercepts, but do not extend it to the leftof —1 or to the right of 2 on thex-axis.
do
• i
- - J
:!.;-6
nainto>
i
.
e
- 1 *
-4
rest
2
-2 , 0
C
1
ed ,
domai: 'to
I f (
T 2
irX
I,
0)
-
((0.-3)
estri<2
3 ) -.. j.._.
-
te
...
d
'
Identify intervals of increase or decrease.
The line segment slants up from left toright, so the function is always increasing.
The value of y increases across the entiredomain. The function increases on theinterval {-1 <x<2}.
Describe the function's minimum,maximum, and range.
When the domain is restricted to{—1 < x < 2}, the lowest point on thegraph is at (-1, -6). Thus, the minimumy-value is —6.
The highest point on the graph is at (2, 3).Thus, the maximum y-value is 3.
The range is all values of y greater than orequal to the minimum, -6, and less thanor equal to the maximum, 3. This can berepresented as {—6 < y < 3}.
Identify intervals where the linearfunction graphed above is positive andwhere it is negative.
86 Unit 2: Linear and Exponential Relationships

A piano is being lowered from an apartment that is 18 feet above the sidewalk.The piano descends at a constant rate. The piano's elevation over time is represented by thelinear function graphed below. Identify and interpret the key features of the graph.
y Piano'sDescent
2018
O 16
E"c 10
LU
1 2 3 4 5 6 7
Time (in minutes)
Identify and interpret the domain.
The graph is shown to exist on the domain[0, 6], This domain contains the minutesover which the piano is being lowered.
Identify and interpret the intercepts.
They-intercept, (0,18), represents thepiano's initial elevation of 18 feet.
Thex-intercept, (6, 0), shows that it takes6 minutes for the piano to reach thesidewalk, at an elevation of 0 feet.
Identify and interpret intervals of increaseand decrease.
The function is decreasing for the entiredomain. This means that the piano'selevation is always decreasing.
The function has no interval of increase. Thismakes sense because the piano is alwaysbeing lowered and never being raised.
What is the range for this function? Whatdoes it represent in the problem?
Lesson 12; Key Features of Functions 87

PracticeRewrite each domain in interval notation.
1. {5<x<100} 2. {x 3. {all real numbers}
REMEMBER A bracket means include the value,and a parenthesis means exclude the value.
For each graph, determine whether the function is increasing or decreasing. Identify theinterval of increase or decrease.
4. 5.
oDoes the graph curve (or slant)upward or downward?
Identify the intercepts of the given function.
6. y
x-intercept:
y-intercept:
7.
x-intercept:
y-intercept:
88 Unit 2: Linear and Exponential Relationships

Identify the intercepts of the given function
8.x
f(x>
24 -12
-8 -6
0 12 24
-2 0
9.
x-intercept:
y-intercept:
X
g(j
x-int
y-int)
_2 _!
r) -9.99 -9.9 1
^rrppt-
^rcent:
0 1 2,
-9 0 90
Fill in each blank with an appropriate word or words.
10. A point at which a graph crosses the y-axis is a(n)
11. Afunction's is a line that the graph of the function approaches butnever intersects.
12. The of a function describes how its f(x)-values change as x approachespositive infinity or negative infinity.
13. The greatest y-value on the graph of a function is the function's
Choose the best answer.
14. Which statement about this function isnot true?
15. The table below shows some orderedpairs for an exponential function.
Jl
1_
0
12
3
rw56
0
5
35
215
A. Its domain is {—4 < x < 6}.
B. Its range is {-1 < y < 4}.
C. It has a y-intercept at (0, 2).
D. It has a maximum of 6.
Which statement about this function is
not true?
A. Its x-intercept is the same as its
y-intercept.
B. It is positive on the interval (0, cc).
C. It is increasing on the interval(-M,OO).
D. As x approaches —°°, f(x)
approaches^.
Lessonl2: Key Features of Functions 89

Describe the end behavior of each function.
16. r 17.
Use the graph and table below for questions 18-20. The graph represents exponentialfunction f. The table represents some ordered pairs for linear function g.
2 . ' 6
X
-10
1
2T
3
g(x)-8
-4
0
4
8
18. Compare and contrast the intercepts of the functions.
19. Compare the increasing and decreasing intervals of the functions.
20. Compare the intervals on which the functions are positive and those on which they are negative.
90 Unit 2: Linear and Exponential Relationships

For each graph, describe the intervals where the function is positive and where it is negative.
21. y 22. y
Solve.
INTERPRET, A cylinder contains 20 milliliters of water. Thewater begins to leak out as represented by the linear functiongraphed on the right. Identify the intercepts and interpretwhat they mean in this situation.
--> 22e 20$> 18j= 16
i;;.S 10
£
24. The cost of a taxi ride includes a $3 fee plus $2 for eachmile traveled. So, a 1-mile ride costs $5 and a 2-mile ride costs$7. Create a graph to represent this linear function. Identify thedomain for your graph and explain why you chose it.
Volume ofWater in Cylinder
0)
T3
cnoo
1 2 3 4 5 6
Time {in seconds)
}:
1413
109
87
54321
0
, Cost of TaxiRide
i . i
i ': '• i i
. .
i i i! . . !
i '
1 2 3 4 5 6
™
• •'
Miles Traveled
Lesson 12: Key Features of Functions 91

Average Rate of Change
Finding Average Rate of Change
UNDERSTAN|i* Rates allow us to relate quantities measured in different units. For example,the table and graph below show a linear function that compares the number of hours acashier works to his total earnings, in dollars.
Cashier's Earnings
Time in hours, x Earnings in $, y
0 02 154 30
•ocC/Jo>c'c'—CDill
Cashier'sEarnings
0 1 2 3 4 5 6 7
Time Worked (in hours)
The cashier's earnings change, depending on the number of hours he works. His pay rate isan example of a rate of change. A rate of change shows how one quantity changes relativeto another quantity. To calculate the average rate of change between two ordered pairs (x, y,and (x2/ y2), use this formula:
change in y y2 - y,average rate of change = -r :— ~ x . „change mx *j xi
For the function describing the cashier's earnings, choose two ordered pairs, such as (2,15)and (4, 30).
30-15 15 -. r^average rate of change = 4 - 2 = ~2~ = 7-5®
In this case, the rate of change compares dollars earned to hours worked. So, the cashier'srate of pay is $7.50 per hour.
92 Unit 2: Linear and Exponential Relationships

ConnectA basketball championship begins with 64 teams. Every time ateam wins a game, it goes on to the next round. Once a team loses agame, it is eliminated from competition and does not play any moregames. The number of teams in each round of the championship is afunction of the round. That function is represented on the graph to theright. Compare the rate of change between rounds 1 and 2 to the rateof change between rounds 2 and 3.
y BasketballChampionship
Calculate the average rate of changebetween rounds 1 and 2.
Find the rate of change from (1, 64) to(2, 32).
1 2 3 4 5 6
Round
32 teams per round32 - 64 322-1 1
Between rounds 1 and 2, the number ofteams decreases at a rate of 32 teamsper round.
Calculate the average rate of changebetween rounds 2 and 3.
Find the rate of change from (2, 32) to(3,16).
16 16 teams per round
3
16 - 32 _3 - 2 1
Between rounds 2 and 3, the number ofteams decreases at a rate of 16 teamsper round.
Compare the rates of change.
The rate of change between rounds1 and 2 is different than it is betweenrounds 2 and 3. The rate betweenrounds 2 and 3 is half what it wasbetween rounds 1 and 2. Choose a pair of points on the graph
below and find the average rate ofchange between them. Compare yourresult with those of other students. Didthey use the same two points?
Lesson 13: Average Rate of Change 93

UNDERSTAN
Comparing Average Rates of Change
t* The table below represents the linear function f(x) = 2x + 1. Notice that asx-values increase by 1, f(x)-values increase by a constant amount, 2. In other words, thefunction grows by an equal amount, 2, in each unit interval.
X
f(x)
0
1
13
2
5
3
7
4
9
5
11
A linear function has a constant rate of change. Its average rate of change is the same nomatter what interval you are observing. The constant rate of change of a linear functionis its slope.
An exponential function has a graph that is a curve. An exponential growth function is alwaysincreasing, while an exponential decay function is always decreasing. The table belowrepresents an exponential growth function.
+ 1
X
f(x)
0
1
1
2
Notice that as each x-value increases by 1, each f(x)-value is multiplied by 2. The value of thefunction, f (x), does not grow by constant amounts over equal intervals, so it does not have aconstant rate of change. However, f (x) does grow by the same factor over equal intervals.This function increases by a factor of 2, or doubles, over each unit interval.
The value of an exponential function grows by equal factors over equal intervals. If the factorby which the function changes is greater than 1, then the function represents exponentialgrowth. If the factor is less than 1, then the function represents exponential decay.
The average rates of change for an exponential function grow by the same factor as thevalues of the function. For the table above, the average rate of change doubled over eachunit interval.
x 0
f (X) ; 1
~1 ! 2
2 4
3
8
.4 5
16 32
94 Unit 2: Linear and Exponential Relationships

ConnectFind and describe the average rate of changefor four consecutive pairs of values in the table.What type of function is this?
x -3 -2 -1 0I j !
f(x) 64 16 4 1
1Determine the average rate of change forconsecutive pairs of values (x, f(x)).
Be sure that the intervals are the samebetween each pair of points. The differencebetween each pair of x-values in the table is1 unit, so the intervals are the same.
between (16-64
_o _ t — \ \
3, 64} and-48
2,16):
148
between (-2,16) and (-1,4):4-16 -12
1 - -12
between {-1, 4) and (0, 1):1 -4 -3
io-(-i)
between (0, 1) and (l, 4):
1 -0
Why is it important to keep the intervalsbetween each pair of values (x, f(x)} thesame when comparing average ratesof change?
Compare the average rates of change inorder to classify the function.
The average rates of change for the first
four consecutive pairs of points are:
-48,-12,-3,-f.
These rates are different. The rate ofchange is not constant, so this is not alinear function.
The value of f(x) decreases by a commonfactor over each interval.
between {-3, 64) and (-2,16):_
64
between (-2,16) and (-1,4):
16
between (-1, 4) and (0,1):
between (0, l)and11-11 4
Since the values of f(x) change by an
equal factor over equal intervals and
that factor is 4, this is an example of an
exponential decay function.
Lesson 13: Average Rate of Change 95

Determine the average rate of change between several consecutive pairs of points forthe function f(x) = -3x+ 2. Describe how the function is changing and classify it.
Create a table of ordered pairs forthe function.
x f(x) = -3x
-2 ; f(-2) - -3(-2) +2
-1 • fl-1) == -3(-l) + 2-
0 , f{0) = -3(0) + 2 = 0 +
1 f(l) = -3(1) + 2 - -3
2 f(2) = -3(2) + 2 = ~6
2 f(x)
6 + 2 = 8 ' 8
3 + 2 - 5 ; 5,
2 = 2 ; 2;
+ 2 = -1 | -1 ;
2 = -4 • -4 :
Compare the average rates of change.
The average rates of change are all thesame, -3.
Since the rate of change is constant,f(x) = -3x + 2 must be a linear function.
^ The rate of change, or slope, is -3 for allpairs of values. The function is linear.
Determine the average rate of change forfour consecutive pairs of values (x, f(x)).
Be sure that the intervals are the samebetween each pair of points.
between {-2, 8) and (-1, 5):5 - 8
-1 -(-2)
between (-1, 5) and (0, 2):2-5 -3 ^
0-(- - 1 ) 1 "
between (0,2) and (1, -1):-1-2 -3 ~
1-0 1 J
between (1, -l)and(2, -4):
Does the equation y = —3x + 5 provideany clues about what the rate of changefor the linear function is? Explain.
96

EXAMPLE Compare the rates of change for f(x) = 10* and function g,which is represented in the table.
iCreate a table of values for f.
X
-10
1
2
3
f(-D
! f (0) -
ifd) =f(2) =
f(3) =
f(x
= 10
10°
10] =
102
103
= iox
-1 110
1
= 10
= 100
= 1,000
f(x)r
_ 101
10
100
1,000
Find the average rate of change for threeconsecutive points for function g.
between (0, 1) and (1, 8):
between (1,8) and (2, 64):64-8 56 ccT^T: T'
between (2, 64} and (3, 512):512-64 448
3 -2 1 -448
The rate of change of the function g is notconstant. Each average rate of change is8 times the previous average rate of change.
^ The average rates of change for functionfare growing more rapidly than theaverage rates of change for function g.
x
-1
0
1
2
3
9(x)]_8
1
8
64
512
Find the average rate of change for threeconsecutive intervals for function f.
between (0, l)and 0,10): yf^ - ~ = 9
between (1,10) and (2,100):
100-10 _ 90 _ nn
2-1 T :
between (2,100) and (3,1,000):
1,000-100 9003 - 2 1
900
The rate of change of the function fis notconstant. Each average rate of change is10 times the previous rate of change.
By what factor are the values of functionf{x) growing? Does the equation f(x) ~ 10X
help you determine that factor? How couldyou write an explicit expression for g(x)?
Lesson 13: Average Rate of Change 97

PracticeFill in the blanks by writing an operation sign and a number to show how the f (x)-values arechanging in each unit interval. Then classify each function as linear or exponential.
1.
X
f(x)
/ +1 >^-1 n\J
1 16
+ 1i
|.
V1
6
+ 1\/+1
i * i36
L_^_ L
3
216
+1314
1,296
2.
Over each interval, doesf(x) change by an equalamount or an equal factor?
Fill in the blanks with an appropriate word or phrase.
3. The average, . . change in y
between two ordered pairs (x, y) is the ratio „ .in x
4. In a linear function, the rate of change is also known as the
5. The average rate of change for a function is constant.
6. The average rate of change for an exponential function grows by equalper unit interval.
Use the graph for questions 7-10.
7. Determine the average rate of change between —Inland (0, 2)
8. Determine the average rate of change between (0, 2) and (1, 4).
9. Determine the average rate of change between (1, 4) and {2,10).
10. Write a sentence or two comparing the average rates of change you found. (If they vary,describe how they vary.)
98 Unit 2: Linear and Exponential Relationships

Use the information about function f (x), given as a table below, and function g(x) = 5" forquestions 11-14.
11. Using the table on the right, find the average rate of change for threeunit intervals for function f.
-10
12
fM14
1
4
16
12. Complete the table to find fourconsecutive ordered pairs for the functiong(x) = 5*.
,
13. Find the average rate of change for threeunit intervals for function g.
x
-1 g(-D =
0 g(0) =
1
2 g(2) =
14. Compare the changes in the values of functions f and g.
15. fJMisWsWa!* The graph shows how the total amount thata landscaper charges for a job changes depending onthe number of hours she works. Identify the slope of thegraph. Then interpret what this slope represents in thisproblem situation.
•o
0O)CD.nO"re*-<.o
110100908070GO5040302010
Cost ofLandscaping Jobs •m
•t
0 1 2 3 4
Length of Job (in hours)
Lesson 13: Average Rate of Change 99

_<sSi Graphing Functions
Graphing Linear Functions
UNDERSTAN The various representations of a function give different details about thefunction. An equation in function notation explains the rule for generating an output fromany given input. A table can list many, but usually not all, input/output pairs for the function.A graph is a visual representation of all the input/output pairs of the function.
The graph of a function is the graph ofy = f{x), soy takes on the value of the output. If youchoose any point (x, y) on the graph of a function, they-coordinate is the output of thefunction when the x-coordinate is the input. Every point on the graph is a solution to theequation y - f(x).
To understand the most about a function, it is often helpful to translate from one form toanother. By examining the equation of the function, you can often identify key features that willhelp you construct the graph of the function.
Examine the linear function represented symbolically as f(x) = ^x + 1. Its graph on the3xy-coordinate plane is y = f (x) or y = x + 1. The equation is in slope-intercept form,
3y = mx + b, where m represents the slope and b represents the y-intercept. For y = x + 1,3the slope or rate of change, m, is , and the y-intercept, b, is 1.
This is enough information to graph the function. The y-intercept of a linear equation3
y = mx + bisat(0, b). Fory = ^x + 1, the y-intercept is at (0,1). Plotting this point starts your
graph. Now you can use the slope to find another point on the graph. The slope is a rate of
change that tells how to move from one point on the graph to another. It is the ratio -r =—.change mx
Place your finger at the y-intercept and count 3 units up and 2 units to the right to find another
point, (2, 4). Draw a straight line through those points. Every point on the line is a solution for
y = fx + 1. So, (-4, -5), (-2, -2), (0,1), and (2, 4} are all solutions.
Sometimes, a linear equation will not be in slope-intercept form. In that case, you may needto put it in that form yourself before graphing it.
100 Unit2: Linear and Exponential Relationships

-«= ConnectGraph the linear equation 6x + 3y = 12 on a coordinate plane. Identify at least three ordered pairsthat are solutions for the equation.
Rewrite the equation in slope-interceptform and identify the y-intercept andthe slope.
6x+3y=12
3y= -6x+12
y= -2x + 4
Subtract 6x fromboth sides.
Divide bothsides by 3.
Draw a line through the points. Locate athird point on the line.
You can "eyeball" another point on yourline, or you can use the slope to find athird point.
^ The ordered pairs (0, 4), (1, 2), and (2, 0)are solutions for 6x + 3y = 12.
Plot the y-intercept and use the slope tofind a second point on the line.
After plotting (0, 4), count down 2 unitsand 1 unit to the right. Plot a point thereat (1,2).
y
2 uni s(0, 4) I
Use a graphing calculator to check yourwork. PressPress MiH;!!l.
. Enter Y, - -2X+4.
Does the graph on your calculator screenlook like the graph drawn on the left? Ifyou press f£ JJ M: d!l, do the data in thetable match the graph on the left?
Lesson 14: Graphing Functions 101

Graphing Exponential Functions
UNDERSTAN You can also use key features to help you graph an exponential function.A general exponential function has the form f(x) = a • bx + c, where a ^ 0, b > Oand fa =£ 1,and c is a real number.
Examine the exponential function f(x) = 3 • 2" - 4. In this function, o = 3, b = 2, andc = -4. To graph this function on the xy-coordinate plane, graph y = 3 • 2* — 4.
The simplest key feature to find from the graph is the horizontal asymptote. No matter whatinput x is entered, the term a • bxcan never equal 0, sof(x) can never equal c. So the liney = cis a horizontal asymptote. Thus, the given function has a horizontal asymptote at y - -4.
The parameter a tells where the graph lies in relation to the asymptote.
• If o > 0, then the graph lies entirely above the asymptote.
• If a < 0, then the graph lies entirely below the asymptote.
The y-intercept, (0, f(0)), of an exponential function is located at the point (0, o + c).
f (0) - a - b° + c
simplifies to
f (0) = a - l + c = a + c
since any number raised to the power of 0 is equal to 1.Fory = 3 -2" -4, the y-intercept is (0, -1).
The parameter b describes how to move from one point to another on the graph.
• If b > 1, the function curves away from the asymptote as x increases (as the graphmoves to the right).
• If 0 < b < 1, the function approaches the asymptote as x increases (as the graphmoves to the right).
For the example function, b — 2. This means the value of y will double (be multiplied by 2)as the graph moves 1 unit to the right. At x = 0 (the y-intercept), the graph is 3 units abovethe asymptote. Atx = 1, the graph will be twice as far from the asymptote, 6 units above it.Atx = 2, the graph will be twice that distance, or 12 units, above the asymptote.
102 Unit 2: Linear and Exponential Relationships

Connect/ 1 \
Use what you know about key features to graph f(x) = 3
Identify the parameters.
An exponential function has the form
f(x) = a - b* + c.
H V 1In y = 3hd , a = 3, b = , and c = 0.
Identify the y-intercept.
Any number raised to the power of
0 equals 1.
0,y = 3[i)° = 30)«:So, when x ,
The y-intercept will be at (0, 3).
y
y-intercepasympto e
How could you use the value of b to find
points to the left of the y-intercept?
»Identify the asymptote.
The asymptote is the line y = c, in this case,
y = 0, or the x-axis.
Use b as a factor to find additional pointson the graph.
Since b = , moving along the x-axis 1 unit
means dropping half the distance to the
asymptote. Since the y-intercept is 3 units
above the asymptote, the graph will be
1.5 units above the asymptote at x = 1
and 0.75 unit above it at x = 2.
Since 0 < b < 1, connect these points
with a smooth curve that approaches
the asymptote.
Lesson 14: Graphing Functions 103

EXAMPLE A Sean is at his grandmother's house, which is 60 miles from his home. He starts ridinghome at time f = 0. His distance from his home, d(t), after t hours can be modeled by the functiond(t) = 60 - 15t. Graph the function for the domain 0< t<4. Explain why the domain must berestricted in that way and what the maximum and minimum values mean in this situation.
Identify the type of function.
Is the function linear or exponential? Theequation d(t) = 60 - 15t has a variable, f,raised to the power of 1. So, the functionis linear.
Graph the function, choosing anappropriate scale and label for each axis.
Plot the y-intercept. According to theslope, another point is 15 units down and1 unit to the right, at (1, 45). Draw a linethrough those points.
d(t) Bike RideHome
1 2 3 4 5
Time (in hours)
The domain is restricted, so the graph isonly the part of the line between t = 0and t = 4.
Identify the slope and y-intercept fromthe equation.
The graph of the function is the graphof the equation d(t) = 60 - 15t,ord(t}= -15t+60, for all values oftbetween 0 and 4, inclusive. The slope, m,of the line is -15, and its y-intercept, (0, fa),is (0, 60).
Identify and interpret the maximumand minimum.
The maximum is 60. This is the farthestSean is from home during his ride. Theminimum is at 0. The point (4, 0) showsthat he was 0 miles from his home—or at home—after 4 hours of riding.That means it took him 4 hours to reachhis home.
Why is the graph a line segment insteadof an entire line? Do values outside thedomain make sense?
104 Unit 2: Linearand Exponential Relationships

EXAMPLE The equation f(x) = 3x + 1 represents a linear function f.The table of values on the right represents an exponential function g.
Graph functions f and g on the same coordinate plane. Then comparetheir properties.
X
-10
1
2
3
131
3
9
27
Graph the functions.
To plot f (x) = 3x + 1, notice that it isin slope-intercept form. So, plot they-intercept at (0,1) and then count 3 unitsup and 1 unit to the right. Draw a straightline through the points.
To graph function g, plot and connect thecoordinate pairs from the table.
Use the graphs to compare the functions.
Both functions have the same domain:the set of all real numbers.
Function f has a range that includes allreal numbers. Function g approachesbut never touches the x-axis (the liney = 0), so its range is y > 0.
Both functions have the same y-interceptat (0,1).
Both are increasing functions. However,shortly after x = 1, the graph of functiong starts to increase at a much more rapidrate than the graph of function f, whichcontinues to increase at a constant rate.Notice that around x - 1.5, the graphof function g overtakes the graph offunction f.
Will an exponential function alwaysovertake a linear function? Explainand give or sketch an example.
Lesson 14: Graphing Functions 105

PracticeCircle the ordered pairs that are solutions for the graphed function.
1.
(-2,3)
(0, -2)
0, -3)
REMEMBER Each pointon the graph is a solutionfor the equation.
Choose the best answer.
3. Which graph represents the function f(x) = 2(3X)?
A. r C
B. D.
0,2)
(2,1)
(4,0)
106 Unit 2: Linear and Exponential Relationships

Graph each function.
4. f(x) = -3x + 5 5.
"1-ill
6. COMPAR The graph of f(x) = 2 -F is shown on the coordinate\ I
plane. Graph g(x) = 2(5*) on the same coordinate plane. Thencompare the end behavior of the two functions.
7. f* * A hurricane is located off the coast when scientists begin tracking its distance fromland. Its distance from land, d(t), after t hours can be modeled by the function d(t) = 120 - 20t.Graph the function for the domain 0 s t < 6. Identify the maximum and minimum values.Explain what each represents in this situation.
d(t)
120110100
on3U
8070
60mou40302010
0
"
i j
._
<
:
_
£ ( ( t 1D
Lesson 14: Graphing Functions 107

Solving Systems of Linear Equations
A system of linear equations consists of two or more linear equations thatuse the same variables.UNDERSTAN
Recall that a linear equation in two variables generally has an infinite number of solutions: all ofthe(x, y) pairs that make the equation true. The solution to a system of equations is the pointor points that make both or all of the equations true. Typically, a system of linear equations hasone solution. If there is no coordinate pair that satisfies every equation in the system, then thesystem has no solution. When the equations have the same graph (because they are equivalentequations), the system has an infinite number of solutions: every (x, y) pair on that graph.
You can use graphs to approximate the solution to a system ofequations. To solve a system of equations graphically, graph eachequation on the same coordinate plane. The solution is the pointor points where the graphs of the equations intersect. Becausethose points are solutions to every equation in the system, theyare the solutions for the system. The system shown on the graphon the right has one solution: (3, 2).
UNDERSTAN One way to solve a system of equations algebraically is to use theelimination method. In this method, equations are added and subtracted in order toeliminate all but one variable. This results in an equation in one variable, which can besolved. The value for that variable is then used to solve for the other variables.
Knowing the properties of equality is crucial to understanding how the elimination methodworks. For example, one step involves multiplying both sides of an equation by a constantfactor. The multiplication property of equality assures that doing that will not change thesolution of that equation.
Another way to solve a system algebraically is the substitution method. In this method,a variable in one equation is replaced by an equivalent expression from another equation.This results in a new equation that has fewer variables. This can be repeated until only onevariable remains in the equation. The value of the variable can be found from that equationand then used to find the values of the other variables.
The substitution method is especially useful when a system of equations includes an equationwith an isolated variable, such as y = 3x + 7. If the system does not include an equation in thisform, you can take the necessary steps to isolate a variable in one of the system's equations.
108 Unit 2: Linear and Exponential Relationships

ConnectSolve the system of equations by graphing.
f y - 2 x - 6
\ x -2y =6
«
Write the equations in slope-intercept
form.
The first equation is already in
slope-intercept form.
Isolate y in the second equation.
x — 2y = 6
-2y= -x+ 6
y - jx ~ 3
Graph the second equation.
Plot a point at the y-intercept, (0, —3).
Then use the slope, -•/ to plot a second
point at (2, —2). Draw a line to connect
the points.
Graph the first equation.
Plot a point at the y-intercept, (0, —6).Then use the slope, 2, to plot a second
point at (1, —4). Draw a line to connectthe points.
V T
Find the solution.
To find the solution to the system, find thepoint where the lines intersect.
^ The point of intersection appears tobe {2,-2).
Substitute x = 2 and y = -2 into bothequations in the system and confirm that
true statements result.
Lesson 15: Solving Systems of Linear Equations 109

EXAMPLE I Solve the system by using the elimination method.
-3x-2y = -10
2x + y = 7
Choose which variable to eliminate.
Look at the coefficients of the y-terms. They-term in the first equation has a coefficientof—2, and the y-term in the secondequation has a coefficient of 1.
Use the multiplication property of equalityto multiply both sides of the secondequation by 2.
2(2x + y) = 2(7)
4x + 2y = 14
This new equation has the same set ofsolutions as 2x + y = 7, because they areequivalent equations.
Use the value of x to solve for y.
The substitution property of equality allowsyou to substitute 4 for x in the originalsecond equation in order to solve for y.
2x + y '-= 7
2(4} + y = 7 Substitute x - 4 intothe equation.
8 + y = 7 Simplify.
y = — 1 Subtract 8 from bothsides of the equation.
^ The solution to the system is the orderedpair (4, -1).
• 11 ^vm~f*i^m^^m*^m+~i^—* mi i i •• • , ....• n. .»,. ,. • , , , , . i
Combine equations to eliminateone variable.
The addition property of equality allowsyou to add equivalent values to both sidesof an equation. Add the new equation tothe first equation from the original systemto eliminate y.
-3x-2y= -10
+ 4x+2y= 14
x + 0 = 4
4
Substitute the x- and y-values of (4, -1)into both equations in the system andverify that the solution is correct.
110 Unit 2: Linear and Exponential Relationships

EXAMPLE B A system of equations and its graph are shown.
2y = 3
y = 2
Use elimination to find the solution to the system. Show that theelimination method produces a new and simpler system of equationswith the same solution as the original system.
1Replace the first equation in the system.
Multiply both sides of the second equationby -1, and then add the result to the firstequation.
x 4- 2y = 3+ -x- y= -2
Y= 1
Replace the first equation with thisequation to produce a new system.
fy= ll x + y = 2
Graph this new system,
y
The systems have the same solution, (1,1).
^ Combining one equation in a system witha multiple of another equation yields adifferent system of equations with thesame solution as the original system.
Replace the second equation in thenew system.
Multiply both sides of the new firstequation by -1, and then add the resultto the second equation.
x + y - 2
+ -y=-1
x - 1
Replace the second equation with thisequation to produce a new system.
Compare the original system of equationsto the final system of equations. In whichsystem is the answer more obvious?
Lesson 15: Solving Systems of Linear Equations 111

EXAMPLE Solve the system by using the substitution method.
'2y-3x=19
4y ~ -4
Isolate a variable in one equation.
In the second equation, the coefficient of
x is 1. So, the easiest course of action is tosolve the second equation for x. Subtract4y from both sides of the equation.
x + 4y = -4
x = -4 - 4y
Use the value of one variable to solve for
the other variable.
Apply the substitution property of equality
again. Substitute^ for y in one of the
equations and solve for x.
x + 4y = -4
Perform the substitution and solve forthe other variable.
The substitution property of equalityallows you to replace x with the expression
-4 - 4y in the first equation from the
system. Doing so allows you to solve fory.
2y-3x=19
2y-3(-4-4y) = 19
2y + 12
14y+ 12 = 19
14y=7
x + 2 = -4
x= -6
The solution to the system is - 6,
TRX
Solve the system by substitution.
13x + y - 9
112 Unit 2: Linear and Exponential Retationships

Problem Solving
Bonnie has a jewelry-making business. She rents a studio space for $400 per month, andeach necklace she makes costs her $15 in materials. She sells the necklaces for $55 each.How many necklaces must she sell in a month to make twice as much money as she spends?How much will she spend and how much will she make?
Write and solve a system of equations.
Let n be the number of necklaces that Bonnie makes and sells in a month.Let m be the amount of money Bonnie spends on the business that month.
Write an equation to represent the amount Bonnie spends for the month if she makes nnecklaces at her studio.
m = +
Write another equation showing that the amount she makes by selling n necklaces is twiceas much as she spends.
2m =
SOLVE
Solve the system by using substitution.The first equation has m isolated on the left side. So, substitute the expression on the rightside for m in the second equation.
2m- _
2(
Now, solve the resulting equation for n.
n =
Now, substitute the value of n into either of the original equations to find the value of m.
m —
2m =
Substitute the values of n and m into the original equations.
Do the substitutions result in true equations?
^ If Bonnie makes necklaces, she will spend $ and she will make $.
Lesson 15: Solving Systems of Linear Equations 113

PracticeDetermine if the given ordered pair is a solution to the given system.
1. f3x+ 7y= 12
,6x - y ~ -4
(-3,3)
2. • 2x - 7 - -y
,-5x4- 13 -
(2,3)
3. 2 X + 3^
(4, -6)
Choose the best answer.
4. A system of three equations is shown onthe graph below.
What is the solution to the system?
A. (2,-1)
B. (-2, -3)
C (0,3)
D, The system has no solution.
5. A baker rents space in a commercialkitchen for $210 per week. For each piehe bakes, he spends $4 on materials. Hecharges $7.50 per pie. The graph belowshows the baker's costs and revenues fora week in which he sells p pies.
m
400o' 300
3? 20°c° 100
D 20 40 60 80 100
Pies Sold
How many pies must he sell in a week inorder to break even?
A. 20
B. 40
C. 60
D. He will never break even.
Solve each system of equations by using the method suggested.
6. - 3x-5y = 13
,2x -y= -3
elimination
7.
114 Unit 2: Linear and Exponential Relationships

Solve.
8 Sanjit has a collection of quarters and
dimes worth $3.70. He has a total of19 coins. How many quarters and how
many dimes does Sanjit have?
9. Sonya opened a savings account with
$200 and deposits $10 each week. Brad
opened a savings account with $140 andcontributes $40 each week. After how
many weeks will Brad's account balancebe twice as much as Sonya's? What will
the balance be in each account then?
Solve each system of equations by graphing on the coordinate grid.
11.
Solution: Solution:
Answer the questions below.
12. tj! How many solutions does the following system of equations have? How do
you know?
Lesson 15: Solving Systems of Linear Equations 115

Using Functions to Solve Equations
UNDERSTAND Solving a one-variable equation means finding the value of the variablethat makes the equation true. So, solving 3x + 5 = -x - 3 means finding a value of x thatmakes the left side of the equation equal to the right side.
You can treat each side of the equation as a separate function and let the two functions forma system, like this:
f f(x) - 3x + 5
1 g(x) - -x - 3
The graph of function f is the graph of y = f(x). This graph shows all the solutions for f.
The graph of function g is the graph ofy = g(x). This graph shows all the solutions for g.
The point where these two graphs intersect is the point at which one input, x, produces thesame output for both functions. At this point f(x) = g(x], so the x-value for that point is thevalue of x that makes the equation 3x + 5 = — x — 3 true.
You can find this value of x by graphing f(x) = 3x + 5andg{x) = -x - 3 on the samecoordinate plane.
The graph of f (x} = 3x + 5 has a y-intercept at (0, 5) and a slope of 3.
The graph ofg(x) = -x - 3 has a y-intercept at (0, -3) and a slope of -1.
Graph and label the two functions. Then find their point of intersection.
The graphs of/"and g intersect at ( — 2, -1). The x-value of that ordered pair is — 2, so thesolution of 3x + 5 = — x — 3 isx = -2.
116 Unit 2: Linear and Exponential Relationships

ConnectSolve the following equation for x by making a system of functions and graphing.
4x + l = 2x+ 3,
Treat the expression on each side of theequation as a function.
Let f (x) = 4x + 1.
Letg(x) - 2x + 3.
Find the x-coordinates of any pointsof intersection.
The graphs intersect at (1, 5).
The x-coordinate of that ordered pair is 1.
fc- The solution isx = 1.
2Graph each function in the system on thesame coordinate plane.
The graph of f is the graph ofy = f(x),or y = 4x + 1. This graph is a line with ay-interceptat(0,1) and aslope of 4.
The graph of g is the graph ofy = g(x),ory = 2x + 3. This graph is a line with ay-intercept at (0, 3) and a slope of 2.
g(x) =
Solve 4x + 1 = 2x + 3 algebraicallyand compare the solution to the onefound above.
Lesson 16: Using Functions to Solve Equations 117

EXAMPLx - 1Use a graphing calculator to solve for x: 2 =4.
Treat the expression on each side of theequation as a function and form a system.
Letf(x)
Let g(x) 4.
Look at tables of values on yourcalculator to verify the point ofintersection.
Press m'J~>r'm si to view a table of valuesfor both graphs.
X
&••-101234
Vj.125.25.51248
Y2
4444444
X=-2
The tables show that when X is 3, Y] isequal to Y2 (both are equal to 4).
The solution is x = 3.
Graph the functions by using yourgraphing calculator and then find thepoint of intersection.
Press
For Y1 enter 2A{X - 1).
For Y2 enter 4.
Your screen should show the following:
The point of intersection appears to beatx = 3.
Using pencil and paper (not a calculator),complete the tables of values below forthese functions. Show all work. Use thetables to check that x = 3 is the solutionfor 2* ] = 4.
X
0
1
2o
4
f(x) = 2" fif(x) = 4
!h
\
118 Unit 2: Linearand Exponential Relationships

Problem Solving
Cara and Cami are twins. They came up with a math puzzie. Cara says she is (—2x + 3) years
old, and Cami says she is (-^x + 1) years old. What is the value of x? What are their ages?
Since Cara and Cami are twins, you can set their ages equal and solve for x.
-2x + 3 - -|x + l
Then evaluate one of the expressions (-2x + 3 or - x + 1)to determine their
SOLVE
Use graphing to solve for x.
Let f (x)
Let g(x)
Graph each function on the coordinate plane to the right.
The point of intersection is ( , ).
So, x = . The y-coordinate, , represents
the twins' .
CHECK
Substitute that value of x into the original problem to verifythat the two ages are the same and that the ages are the
ones you found.
-2x 3 - -fx
Is this value of x the solution to the equation?
t The value of x is Each girl is years old.
Lesson 16: Using Functions to Solve Equations 119

PracticeWrite a system of two functions, f and g, that could be graphed in order to solve thegiven equation.
1. 7x+ 11 = 8x- 1 2. fx + 12- 2x -4 3. 3f - 27
Assign each side toa function.
Solve each equation by using the given graph.
*r« X ' £ o .A
x —-
REMEMBER Look for the point of intersection.
6. x + 9 = |x + 1
g(x) = T
7.
X -—
120 Unit 2: Linear and Exponential Relationships

Solve each equation for x by using the given table.
8. -x 225 9. i.
Complete the tables to solve each equation for x. Show your work.
-2 f(-2)=
11. - x+5 -2x - l
x =
Lesson 16: Using Functions to Solve Equations 121

Define a system of two functions and graph them on the coordinate plane to solve for x.
12. x- 3 = -2x + 6 13. -x+ 2 = -3x-4
fix) - g(x) = fix) g(x) =
x =
14. 4x+ 5 = 0.5x- 2
fix) - g(x) -
rr
X -—
16.
f(x) = g(x) =
15.
X —
fix)
-I-"
• rr
_q:4 _ . j _
X =
17. [£) -3 = 2*-3
fix) - g(x) -
o-U-M-
122 Unit 2: Linear and Exponential Relationships

Choose the best answer. Use your graphing calculator to help you.
18. Lucia correctly used a graphing calculator to solve an equationfor x. Her screen is shown to the right. The solution was x = 2.
Which could be the equation she solved?
A.
B.
C.
-~x = 3x — 5
~x - 5 - 3x
19. Adler correctly used a graphing calculator to solve an equationfor x. His screen is shown to the right. The solution was x = -1.
Which could be the equation he solved?/ 1 \
A. lil -8- -1
B.
C. | | +8 = 4
1D. +8 = 8
20. Ling decided to sell cupcakes at the county fair. Heringredients cost her about 25 cents per cupcake. Renting a boothcosts $30 per day. She sells each cupcake for $1 . Ling's expensescan be modeled by the function c(x) = 0.25x + 30.00. Her incomecan be modeled by the function p(x) = 1 .OOx. How many cupcakesmust she sell to break even?
21. plIWUlA' is there a value of x that makes 2* - - 2 true? Rewritethe equation as a system of two functions and graph the system.Use your graph to justify your answer.
50
-10
30
20
10
10 20 30 40 50
Lesson 16: Using Functionsto Solve Equations 123

Graphing Inequalities
Graphing an Inequality
UNOERSTAN A linear inequality is similar to a linear equation. The difference is that, insteadof an equal sign, an inequality contains one of four inequality symbols: <, >, ^, or >.
It is important to note that a linear inequality is not a function. For example, for the linearinequality y > x, both 1 and 5 are possible values for y when x = 0. Since there are multipleoutputs {y-values) for one input (x-value), the linear inequality y > xis not a function.
You can, however, use the concept of a function to help you solve inequalities. If you replacethe inequality symbol in a linear inequality with an equal sign, you get a related equation.
y > 3x + 2 is a linear inequality.
y = 3x + 2 is its related linear equation.
Recall that you can think of y = 3x 4 2 as y = f(x) with f(x) = 3x + 2. Remember also that thesolutions to a linear function can be graphed as a line on the coordinate plane. The solutionto a linear inequality is a half-plane, the portion of the coordinate plane that lies on one sideof a line called the boundary. The boundary is the graph of the related linear equation for theinequality. All of the points in the half-plane are solutions to the inequality.
To graph a linear inequality in the coordinate plane, graph its related equation in order to findthe boundary line.
• If the symbol is < or >, draw a dashed line. Points on the boundary line are not solutions.
• If the symbol is -^ or >, draw a solid line. Points on the boundary line are solutions.
Then shade a region on one side of the boundary line. Put the inequality in slope-interceptform to determine where to shade.
• If the inequality has the form y< mx + b ory < mx + b, shade below the line.
• If the inequality has the form y > mx + fa ory > mx + b, shade above the line.
You can also find the correct region to shade by choosing a testpoint and substituting its x- and y-values into the inequality.If the result is a true number sentence, such as 2 > 0, thenshade the region that contains the test point. Otherwise,shade the other region.
The graph shows the inequality y < ^x + 4. The dashed boundaryline means that points on the line are not solutions of the inequality.Any point that lies below the line, in the shaded half-plane, is asolution of the inequality. The point (-3, -1) is a solution becauseit lies in the half-plane that shows all solutions to the inequality.The point (6, 8) is not a solution because it does not lie in the half-plane.
--'
.. -•. .
124 Unit 2: Linear and Exponential Relationships

ConnectGraph the inequality y > 2x - 5.
Find the line for the related equation.
To write the related equation, replace theinequality symbol ^ with an equal sign.The related equation is y — 2x — 5. Theliney = 2x - 5 passes through the points(0,-5)and(l, -3).
Determine whether the line is solidor dashed.
The inequality symbol is >. So, the line issolid. Points both on the line and in onehalf-plane are solutions of the inequality.
Determine which half-plane to shade.
The inequality is already in slope-interceptform. The inequality symbol is >. So,shade the half-plane above the line.
Graph the inequality on acoordinate plane.
-6
The point (-1, 1) is in the half-plane.Substitute these values of x and y into theinequality to confirm that this coordinatepair is a solution.
Lesson 17: Graphing Inequalities 125

Graphing a System I
UNDERSTAN The solution to a system of linear inequalities is also a portion of thecoordinate plane. It consists of the points that are solutions for every inequality in thesystem. This is the part of the coordinate plane where all of the shaded regions overlap.
In a system of two inequalities, the solution to the system is the intersection of the twohalf-planes that are solutions to the individual inequalities. All the points that lie in thatintersection are solutions for both inequalities.
The graph on the upper right shows the solutions tothe following system of inequalities:
y> -fx + 4
The point (2, -4) is not a solution to either inequality.
The point (-3, 0) is a solution to the first inequality,but not to the second inequality.
The point (5, -1) is a solution to the second inequality,
but not to the first inequality.
The point (1, 4) is a solution to both inequalities. It is asolution to the system.
In a system of more than two inequalities, the solution isthe intersection of all the half-planes that are solutions tothe individual inequalities.
The graph on the lower right shows the solutions tothe following system of inequalities:
y> -4
x< 5
, y<x
The graph shows that the point (1, -2) lies in thetriangular region where all three half-planes intersect,so it is a solution to the system.
!
-e
_
X
'
">
(l
.•
i
!
-
; i
/
6
*
2
f
-i
-6
•+
4
\
'd
~
:
•-
•~
•
>
4
2}
'
•
-/
6
.1.
i
r ,
<f
-I
..
ii
126 Unit 2: Linear and Exponential Relationships

ConnectGraph the solution for the following system of inequalities.
y < 3x — 3<.y< -2* + 1
Graph the first inequality.
The related equation, y = 3x - 3,is represented by the line through(0, -3} and (1,0).
Since the inequality symbol is <, use adashed line and shade below the line.
Identify the solution.
The darker region below both linesrepresents the solution set for thesystem of inequalities.
Graph the second inequality on the samecoordinate plane.
The related equation, y— —^x + 1, is
represented by the line through (0,1)and (2,0).
Since the inequality symbol is <, use adashed line and shade below the line.
y
1
*""£_—_*?•-s-t-r*.
*x
Is the point (4, —1) a solution to the
system of inequalities y < 3x - 3 and
Lesson 17: Graphing Inequalities 127

EXAMPLE Graph the solution to the following system of inequalities,
y > 2x + 3
-2y- 2 > -4x
Graph the first inequality.
The related equation, y = 2x + 3, isrepresented by the line through (0, 3)and (-1,1).
Since the inequality symbol is >, use asolid line and shade above the line.
Identify the solution.
The two lines are parallel, which meansthat they will never intersect.
^ The two regions have no pointsin common. Thus, the system ofinequalities has no solution.
Graph the second inequality on the samecoordinate plane.
Begin by solving the inequality for y.Remember to reverse the inequality signwhen dividing both sides by a negativenumber.
-2y- 2> -4x
-2y> -4x+ 2
y < 2x - 1
The line for the related equation,y - 2x- 1, passes through (0, ~l)and(1,1). Since the inequality symbol is <,use a solid line and shade below.
Can a system of inequalities whose graphconsists of parallel boundaries have asolution? If so, draw a graph to supportyour answer.
128 Unit 2: Linear and Exponential Relationships

Problem Solving
A jewelry maker is creating a line of bracelets and necklaces with a new type of chain. Thebracelets are 8 inches long, and the necklaces are 14 inches long. She has 280 inches ofchain. It takes her 4 hours to make a bracelet and 3 hours to make a necklace. She can workno more than 120 hours this month.
Write a system of inequalities to model the number of bracelets and the number of necklacesthat the jewelry maker can create this month. Then determine how many necklaces andbracelets she can produce.
Write a system of inequalities to describe the situation.
Let x be the number of bracelets and y be the number of necklaces she can make.
Since these are numbers of real objects, they cannot be negative numbers.
So, x and y
It takes 8 inches of chain to make a bracelet and 14 inches to make a necklace. The totalamount of chain used must be less than or equal to the total amount available, 280 inches.
So, .x + 280.
It takes 4 hours to make a bracelet and 3 hours to make a necklace. The total amount of timespent making the jewelry this month must be no more than 120 hours.
So, 4x+ 3y 120.
SOLVE
The boundary lines for this system of inequalities are graphedon the coordinate plane to the right. Shade the region thatrepresents the solution.
CHECK
The point (15, ) lies within the solution region. Show that
it satisfies all 4 inequalities.
8(15) + 14( 280 280
4(15} + 3( 120
Lesson 17; Graphing Inequalities 129

PracticeDetermine whether each point is a solution to the inequality graphed below.
4 ; . .. ^ ?: ; : ; .
1. (-3,-!) 2. (2, 0) 3. (6,4)
Points on a dashed boundary line are not included in a solutionset, Points on a solid boundary line are included in a solution set
m*
Determine whether each point is a solution to the system of inequalities graphed below.
4. 5,0) 5. (1, -4)
6. 7. (0,4}
REMEMBER A solution to a system of inequalitiesmust be a solution for each inequality in the system.
130 Unit 2: Linear and Exponential Relationships

Use the graph below to answer questions 8 and 9. Choose the best answer.
,
8. Which point is not part of the solution setfor this inequality?
A. (0,3)
B. (3, 3)
C. (4,0)
D. (-4,6)
9. Which inequality is represented bythe graph?
A. y>4x+3
B. y<--U + 3
C. y
D. v
Use the graph below to answer questions 10 and 11. Choose the best answer.
10. Which points are included in the solutionset for this system of inequalities?
A. Monly
B. MandN
C. M, N, and P
D. M and Q
11. Which system of inequalities isrepresented by this graph?
A. f y>2x + 2 C. f y>2x + 2
[y<-2x + 2 jy>-2x + 2
B. y>2x+ 2
y> -2x+ 2
D.
Lesson 17: Graphing Inequalities 131
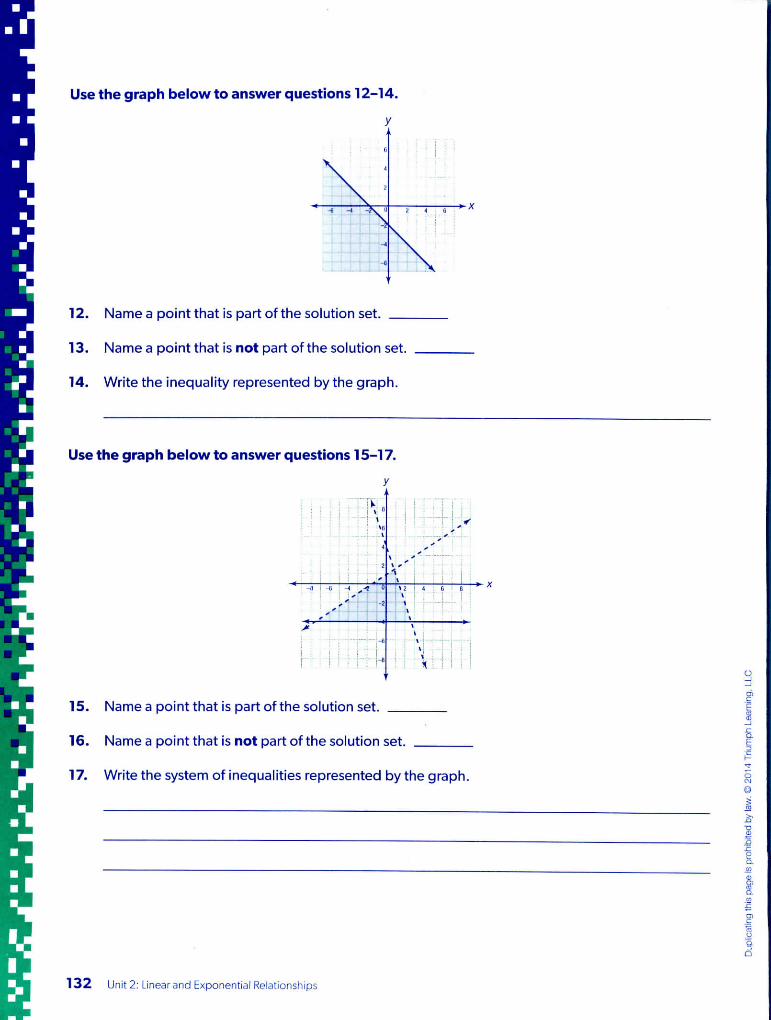
Use the graph below to answer questions 12-14.
-4 -X U
*
12. Name a point that is part of the solution set.
13. Name a point that is not part of the solution set.
14. Write the inequality represented by the graph.
•+-X
Use the graph below to answer questions 15-17.
15. Name a point that is part of the solution set.
16. Name a point that is not part of the solution set.
w
17. Write the system of inequalities represented by the graph.
132 Unit 2: Linear and Exponential Relationships

Graph each inequality.
18. y<|x-l 19. 6x-2y<
20. »|f['WF A farmer will plant corn and soy on his farm this year. He has a total of 25 acresavailable for planting. Each acreof corn costs $350 to plant, and each acre of soy costs$150 to plant. His costs must be no more than $5,250.
Let x be the number of acres of corn to be planted and lety be the numberof acresof soy to be
planted. Write a system of four inequalities to describe the situation. Then graph the system.
yCrops Planted
411
35
•5T 30
P »0 25CO
_c 20
0 I0
m 105
_ ... _.
5 10 15 20 25 30 35 40
Corn (in acres)
Lesson 17: Graphing Inequalities 133
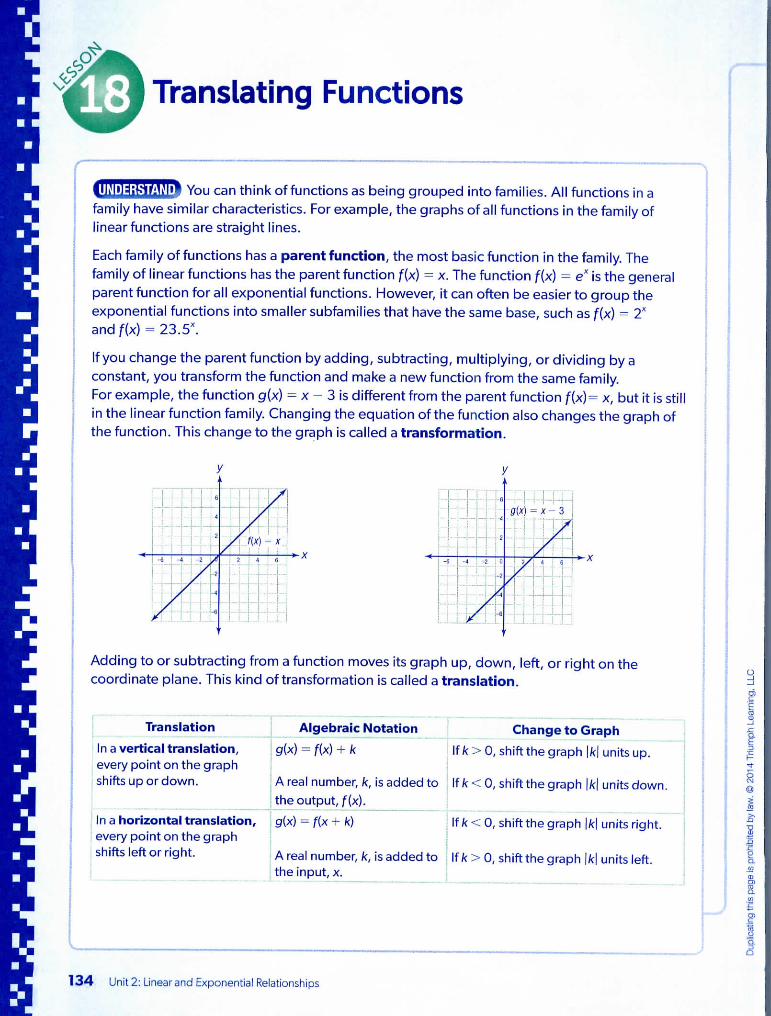
Translating Functions
UNDERSTAN[p You can think of functions as being grouped into families. All functions in afamily have similar characteristics. For example, the graphs of all functions in the family oflinear functions are straight lines.
Each family of functions has a parent function, the most basic function in the family. Thefamily of linear functions has the parent function f(x) = x. The function f(x) = ex is the generalparent function for all exponential functions. However, it can often be easier to group theexponential functions into smaller subfamilies that have the same base, such as f(x) = 2*andf(x} = 23.5*.
If you change the parent function by adding, subtracting, multiplying, or dividing by aconstant, you transform the function and make a new function from the same family.For example, the function g(x) = x - 3 is different from the parent function f(x) = x, but it is stillin the linear function family. Changing the equation of the function also changes the graph ofthe function. This change to the graph is called a transformation.
Adding to or subtracting from a function moves its graph up, down, left, or right on thecoordinate plane. This kind of transformation is called a translation.
Translation
In a vertical translation,every point on the graphshifts up or down.
Algebraic Notation
g(x) = f(x) + k
A real number, k, is added tothe output, f(x).
In a horizontal translation, g(x) = f(x + k)every point on the graphshifts left or right. | A real number, k, is added to
the input, x.
Change to Graph
If k>0, shift the graph \k\s up.
\fk< 0, shift thegraph \k\s down.
If k < 0, shift the graph \k\s right.
If k > 0, shift the graph \k\s left.
134 Unit 2: Linear and Exponential Relationships

ConnectThe exponential function f(x) = 3X is graphed on the coordinate plane below. Make a table of values forthe function g(x) = 3* + 2. Then graph function g on the same coordinate plane. Describe how functionf could be translated to form function g and how translating a function affects its size and shape.
f(K) = 3"
Create a table of values for g(x) = 3* + 2.
x g(x) - 3" + 2I
-2 g(-2) = 3-2 + 2 = 4
-1 g(-1) = 3"1 + 2 = +
19 199 9
7
0 1 g(0) = 3°+ 2 = 1 + 2 = 3 3
1 ;gO) = 3 ] + 2 = 3 + 2 = 5 5
2 ig(2}-32 + 2 = 9 + 2 = ll 11
Compare the graphs.
Each point on the graph of function g is2 units above its corresponding pointon function f. So, function g is the resultof a vertical translation of function f2 units up.
Since all we are doing is sliding the graphin the coordinate plane, the size andshape of the graph have not changed.
Plot the ordered pairs for function g andconnect them with a curve.
Since you were given the graph off(x) = 3X, could you have graphedg(x) = 3X + 2 without creating a tableof values first? Explain.
Lesson 18: Translating Functions 135

Let f(x) = 2x and define a function g such that g(x) ~ f(x + 3). Graph both functions, fand g, on the same coordinate plane. Compare the two graphs and identify how function f could betranslated to form function g.
Write function g in terms of x by usingfunctional notation.
For the function g, use the expression forf(x) and replace x with (x 4- 3).
g(x) = f(x + 3)
g(x) = 2{x + 3)
g(x) - 2x + 6
Graph function g.
The graph of g is the graph of the equationy = g(x) or y = 2x + 6. This equation hasa slope of 2 and a y-intercept at (0, 6).Graph the y-intercept, use the slope tofind another point, and draw a straight linethrough those points.
TRK
On the grid shown in Step 3 above,graph h(x) = f(x — 3). Describe howfunction f could be translated to formfunction h.
,Graph function f.
The graph of f is the graph of the equationy = f(x) or y = 2x. This equation has aslope of 2 and a y-intercept at {0, 0).Graph the y-intercept, use the slope tofind another point, and draw a straight linethrough those points.
Compare the graphs.
^ Each point on function g is 3 units tothe left of the corresponding point onfunction f.
This makes sense. When 3 is added to theinput, as it was in g(x) - f(x + 3), the resultis a translation of 3 units to the left.
Notice that both lines have the same slope,2. So, translating a line horizontally doesnot change its slope.
136

J M a » A linear function f is graphed below. On the same coordinate plane, graph the functiong(x) = f(x) - 5. Identify the transformation.
Describe the translation.
g(x) = f(x) - 5 is in the form g(x) = f(x) + k,where k = -5.
When a numerical value, k, is added to anoutput, f{x), the result is a vertical shift.
Since k is the negative number -5, shiftthe graph 5 units down.
The equations for functions f and g arenot given. Can you determine if theirslopes are the same? Explain how.
Graph the function g.
Shift two points on the graph offunction fdown 5 units. Then draw aline through them.
(0,1) is translated 5 units down to (0, —4).
(2, 0) is translated 5 units down to (2, -5).
*
The transformation is a vertical translation5 units down.
Lesson 18: Translating Functions 137

EXAMPLE The graph of f(x) = \j\s shown. Translate function f
to form the function n(x) = f(x - 4) + 2. Graph h and write its
explicit equation.
Describe the translation by using wordsand symbols.
Subtracting 4 from the input, x, indicates ahorizontal translation. Translate the graph4 units to the right.
Adding 2 to the output, f(x ~ 4), indicatesa vertical translation. Translate the graph2 units up.
Connect the points with a smooth curve.
Use a graphing calculator to check yourwork. Press
For Y,, enter (1/2)AX. For Y2, enter
(l/2)A(X-4) + 2. Press ESI SSB to
bring up a table of values. Press 25322 toview the graph.
Graph h.
Choose several points on the graph of fand translate each point 4 units to the rightand 2 units up.
Write an equation for h.
The translation involved subtracting 4 from
the input and adding 2 to that output. So,
subtract 4 from x, which is the exponent
in 2 j , and then add 2 to the resulting
expression.
2.
138 Unit 2: Linear and Exponential Relationships

Functions f and g are graphed on the right. Using functionnotation, write an equation describing g(x) in terms of f(x). Then use theequation given for f(x) to write an equation for g(x) in terms of x.
Identify how f could be translated toform g.
Choose a point on f, such as (0, 0).
If this point is translated 2 units to theright, it would cover point (2, 0), which ison the graph of g.
Verify that any point on f, if translated2 units to the right, has a correspondingpoint on g.
Write the function g(x) in terms of f(x).
To represent a horizontal translation of2 units to the right, add —2 to the input, x.
Sog(x) = f(x-2).
.
Write the function g(x) in terms of x.
To find an explicit expression for g(x),substitute {x - 2) for x in the expressionforf(x).
g(x) = f(x - 2)
g(x) = 3(x - 2)
^ g(x) = 3x - 6
Use a graphing calculator to check thatg(x) = 3x — 6 is the correct equation forfunction g.
Lesson 18: Translating Functions 139

PracticeUse words to describe how function f could be translated to form function g in one step.
1. y 2. y
How can (0,1) be translatedto cover (0, 2)?
Use words to describe a horizontal translation that would transform function f into function g.Then describe a vertical translation that would transform function f into function g.
3. 4.
horizontal translation:
vertical translation: _
horizontal translation:
vertical translation: _
REMEMBER Horizontal means left and right.Vertical means up and down.
Write true or foist? for each statement. If false, rewrite the statement to make it true.
5. A translation is a slide of a graph to a new location on the coordinate plane.
6. If g(x) = f(x) - k, then the graph off is translated k units down to form the graph of g.
7. lfg(x) = f(x - k), then the graph off is translated k units left to form the graph of g.
140 Unit 2: Linear and Exponential Relationships

Translate the graph of f according to the verbal description to form g and draw the graph for gon the same coordinate plane. Then write an equation for g(x) in terms of x.
8. Translate the graph off 5 units up to form g. 9. Translate the graph of f3 units to the rightto form g.
g(x) =
f(x) = 4
Choose the best answer. Use your graphing calculator to check your answer.
10. The graphing calculator screen belowshows the graph of f{x) - 1.5x and thegraph of g.
Which equation could represent g(x) interms of f(x)?
A. g(x) = f(x) + 6
B. g(x) = f(x)-6
C. g(x) = f(x+6)D. g(x) = 6f(x)
11. The graphing calculator screen belowshows the graph of f(x) » 2xand thegraph of g.
Which equation could represent g(x) interms of f(x)?
A. fif(x) = f(x + 3) + 3
B. g(x) = f(x-3) + 3
C. g(x) = f(x + 3) - 3
D. g(x) = f(x - 3) - 3
Lesson 18: Translating Functions 141

Write an explicit expression in terms of xfor each function g{x) described below.For questions 12-17, f(x) = 5X.
12. translation of f(x) 2 units up
g(x)
14. translation of f(x) 2 units left
g(x)
16. translation of f(x) 3 units rightand 3 units up
g(x) - _ _ __
13. translation of f(x) 2 units down
g(x) =
15. translation of f(x) 2 units right
g(x) =
17. translation of f(x) 3 units leftand 3 units down
g(x) =
Translate the graph of function fto form the translated function g described algebraically.Write an equation in terms of xto represent the translated image.
18.
!i )
19.
20. g(x) - f(x - 6) - 4 21. g(x)-f(x-4)-3
g(x) = g(x)
142 Unit 2: Linear and Exponential Relationships

Function f was translated to form function g according to the rule given. For each rule, identifythe value of k. Include the sign. Briefly explain how you know.
22. 23.
g(x) = f (x + k); k =
v X
Examine the following situations and respond in complete sentences.
24. ^ * Macy graphed f(x) = -4x and parallel line g.She believes that since the rule for the translation isg(x) = f(x 4- 1), the equation for g must beg(x) = —4x + 1.Explain why Macy's reasoning is flawed. Then identify thecorrect equation for g.
25. DESCRIBE. Zack used to charge only an hourly rate tomow lawns, as shown by the graph of function p. Because ofrising costs, he now charges a set fee for each job in additionto his hourly rate, as shown by the graph of function n.Use algebraic notation to describe how p could be translatedto form n. Use what you know about translations to explainhow the new costs differ from the old costs.
Charges forLawnmowing
2 4 6 ;
Length of Job(in hours)
Lesson 18: Translating Functions 143

Reflecting Functions
UNDERSTAN A reflection is a transformation that can flip the graph of a function over aline. That line is called the line of reflection. The new graph looks like a mirror image of theoriginal graph. The image after a reflection is the same size and shape as the original graph.
if gM = f(—x), the graph of g is the reflection of the graph of f across the y-axis.
Changing the sign of the input, x, reflects the graph over the y-axis. This means that the y-axisis the line of reflection in this transformation.
*- X
Compare the two lines. The point (4, 6) is found on the graph off. The corresponding point(-4, 6) is found on the graph of g. The point (-4, 6) is the reflection of (4, 6) across the y-axis.
If h(x) = -f(x), the graph of h is the reflection of the graph off across the x-axis.
Changing the sign of the output, f(x), reflects the graph over the x-axis. This means that thex-axis is the line of reflection in this transformation.
Compare the two lines. The point (4, 6) is found on the graph of f. The corresponding point(4, -6) is found on the graph of h. The point (4, -6) is the reflection of (4, 6) across the x-axis.
144 Unit 2: Linear and Exponential Relationships

ConnectThe graph of the exponential function f(x) = 3X is shown. On the samecoordinate plane, graph function g(x) = —f(x).
Compare the graphs and describe the reflection.
1Write the equation for g.
We know that f(x) = 3* and that thereflected image is equal to g(x) = ~f(x).
Substitute the expression for f(x) to find anexpression for g(x).
<?(x) =-f(x) =-(3*)
Graph g(x) and compare it to f{x)
Consider (1, 3) and {1, - 3). Each has thesame input, x, but the outputs haveopposite signs.
Also, notice that {1, 3} and {1, -3) are thesame distance from the x-axis but lie ondifferent sides of it.
This is true for every pair of correspondingpoints on the two functions.
^ The graph of g is the result of a reflectionof the graph of f across the x-axis.
Create a table of values for function g.
X
! g(-2)
g(-D~1
.0 flf(O) =
i g(D -
g(x) = -(3")
= -(3 2) = - -
_ _l9
= -0 ') - "I113
-(3°)= -(D =
-(3)= -(3) =
9(x)
2 19
)' ~3
j
-1 -1
-3 -3
2 g<2)=-(3 2 ) - - (9) -9
Use a graphing calculator to checkyour work.
Press . EnterY, = 3AX.
Enter Y 2 = -3AX.
Press EJ§ MsUdil to bring up a table ofvalues, and compare them.
Press ESE53- Compare the graphs to theones shown on the left.
Lesson 19: Reflecting Functions 145

EXAMPLE A A linear function fis graphed. On the same coordinateplane, graph function g such that g(x) = f(-x).
Compare the graphs and describe the reflection.
Determine how to graph g.
No explicit function was given for f, butthe graph of g can be found by using thegraph off.
The algebraic notation g(x) = f(-x) meansthat the opposite value of each input, x,will be used.
So, find points on the graph of f, changethe sign of eachx-value, and graph theresulting points.ICO'
Graph g and describe the reflection.
Plot the points that you found and draw astraight line through them to graph g.
Each point on f and its corresponding pointon g are the same distance from the y-axis,but they lie on different sides of it.
^ The graph of g is the result of a reflectionof facross the y-axis.
Find several points on the graph of g.
(-2, 3) is a point on f.
Find the opposite of the input (x-value) andkeep the same output (y-value).
(-2,3)-* (2, 3)So, (2, 3) is a point on g.
(2,1) is a point on f.So, (-2,1} is a point on g.
(6, -1) is a point on f.So, (—6, —1) is a point on g.
Identify key features, such as theintercepts and slopes, of functions f andg. How are the key features of fand itsreflected image similar? How are theydifferent?
146 Unit 2: Linear and Exponential Relationships
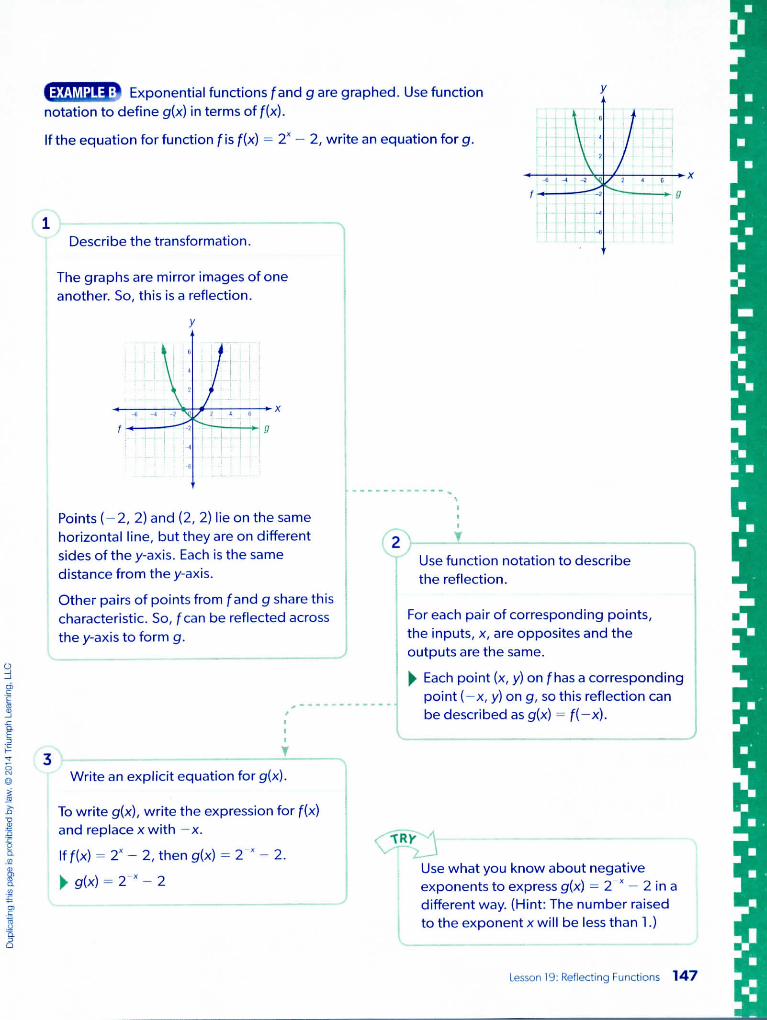
Exponential functions f and g are graphed. Use functionnotation to define g(x) in terms of f(x).
If the equation for function f is f(x) = 2* - 2, write an equation for g.
Describe the transformation.
The graphs are mirror images of oneanother. So, this is a reflection.
Points (-2, 2) and (2, 2) lie on the samehorizontal line, but they are on differentsides of they-axis. Each is the samedistance from the y-axis.
Other pairs of points from f and g share thischaracteristic. So, f can be reflected acrossthe y-axis to form g.
*- X
Use function notation to describethe reflection.
For each pair of corresponding points,the inputs, x, are opposites and theoutputs are the same.
^ Each point (x, y) on f has a correspondingpoint (-x, y) on g, so this reflection canbe described as g{x) = f{—x).
Write an explicit equation for g(x).
To write g(x), write the expression for f(x)and replace x with -x.
If f(x) = 2"-2, then g(x) = 2 x ~ 2.
> g(x) - 2- * - 2
TRX
Use what you know about negativeexponents to express g(x) = 2 - 2 in adifferent way. (Hint: The number raisedto the exponent x will be less than 1.)
Lesson 19: Reflecting Functions 147

PracticeDetermine if each pair of functions f and g are reflections of one another across the x-axis,reflections of one another across the y-axis, or neither.
1. 2. 3.
x
^J^Find pairs of corresponding points.Which changed: the input or the output?
Choose the best answer. Use your graphing calculator to check your answer.
4. The graphing calculator screen belowshows f(x) - 2* and its reflection g.Which could represent g(x)?
A. g(x) = 2*
B. g(x) = 2-x
C. g(x) = -{2*}
D. (x)--(2-x
5. The graphing calculator screen belowshows f(x) = - 3x - 4 and its reflection g.Which is not true of the functions?
A. g(x) = f(-x)
B. Function f was reflected across they-axis to form g.
C. Both f and g have the samey-intercept.
D. Both fand g have the same slope.
148 Unit 2: Linearand Exponential Relationships

Graph g. Then write an equation for g(x) in terms of x.
6. g(x) = f(-x) 7. g(x) = -f(x)
g(x)
Answer the following questions.
8. C ^ Maggie graphed functions f and g as shown. Maggiesays that g is the result of a reflection of f across the x-axis. Jay saysthat g is actually the result of a reflection of facross the y-axis. Whois correct? Justify your answer.
*- X
9. WjMrf^ A graph can be reflected across a point, such as the origin. If j(x) = — f(—x), then jis the reflection of facross the origin. How could you use two different reflections to produce thesame graph of7?
Lesson 19: Reflecting Functions 149

Stretching and Shrinking Functions
Vertical Stretches and Shrinks
Translations and reflections do not change the size of the graph beingUNDERSTAN
transformed, but stretches and shrinks do. After a stretch or a shrink, the new graph lookswider or narrower than the original graph.
Multiplying the output of a function, f(x), by a constant stretches or shrinks the graph in thevertical direction.
Forg(x) = kf(x) where |k| > 1, the graph of g is a vertical stretch of the graph off.A vertical stretch pulls the points on the graph away from thex-axis.
The graphs off and g above illustrate the vertical stretch g(x) = 2f{x). Notice how each point ong is twice as far from the x-axis as its corresponding point on f.
Forg(x) = kf(x) where 0 < |k| < 1, the graph of g is a vertical shrink of the graph off.A vertical shrink pushes the points of a graph toward thex-axis.
The graphs of f and g above illustrate the vertical shrink g(x) ~ f(x). Notice how each point ong is half as far from the x-axis as its corresponding point on f.
Notice that, after a vertical stretch or shrink, the new function always has the same x-interceptas the original function. This point cannot be shrunk toward or stretched away from the x-axisbecause it is on the x-axis.
150 Unit 2: Linear and Exponential Relationships

ConnectThe exponential function f(x) - 2* is graphed on the right. Graphg(x) - 4{2X) on the same coordinate plane. Is g the result of a verticalstretch or a vertical shrink of f ? by what factor?
Create a table of values for g.
X
-2
Compare the graphs and identify thetransformation.
The point (0,1) on the graph of f istransformed to (0, 4) on the graph of g.
The point (1, 2) is transformed to (1, 8).
The point (2, 4) is transformed to (2,16).
Notice that for each pair of points, theinput is the same, but the output is 4 timesas great.
The equation of g also shows that theoutput, f(x), was multiplied by 4.
^ The graph of g is the result of a verticalstretch of f by a factor of 4.
-10
12
g(-
9(0}
9(1)
9(2)
l) = 4(2~1)-4(2) = :
= 4(2°) = 4(1) = 4
- 4(2') = 4(2) = 8
= 4(22) = 4(4) = 16
I 2
4
8
16
Graph g.
Plot those ordered pairs (x, g(x)) on thecoordinate plane and connect them with asmooth curve.
On the coordinate plane above, graph
h(x) = \(2X}. Is this a vertical stretch or a
vertical shrink? by what factor?
Lesson 20: Stretching and Shrinking Functions 151

(Horizontal Stretches and Shrinks j-
UNDERSTAND Multiplying the input of a function, x, by a constant stretches or shrinks thegraph in the horizontal direction.
Forg(x) - f(kx) where \k\ 1, the graph of g is a horizontal shrink of the graph off.A horizontal shrink pushes the points of a graph toward the y-axis.
The graphs of f and g above illustrate the horizontal shrink g(x) = f (2x). Notice how each pointon g is half as far from the y-axis as its corresponding point on f.
For g(x) = f(kx) where 0 < |k| < 1, the graph of g is a horizontal stretch of the graph off.A horizontal stretch pulls the points of a graph away from the y-axis.
The graphs of fand g above illustrate the horizontal stretch g(x) ~ f k-x . Notice how eachpoint on g is twice as far from the y-axis as its corresponding point on f.
Notice that the factor of the stretch or shrink is the reciprocal of the constant. In the case of ahorizontal stretch or shrink, k is not the factor by which a graph is stretched or shrunk; is.
Notice that, after a horizontal stretch or shrink, the new function always has the samey-intercept as the original function. This point cannot be shrunk toward or stretched away fromthe y-axis because it is on the y-axis.
152 Unit 2: Linear and Exponential Relationships

—*: ConnectGraph the linear function f(x) = ^x + 2. Then graph its image, g, resulting from the transformationdescribed below.
g(x) = f(3x)
Is this an example of a horizontal stretch or shrink? by what factor?
Create a table of values for f.
X
-6
0
6
f(~6) =
f(0) = \) = \) = l
3j(-6) +
-3 + 2 ^
0) + 2 =
6) + 2 =
x + 2
2
0 + 2 = 2
3 + 2 = 5
f(x)
-1
2
5
Enter the equations for f and g into yourgraphing calculator, graph them, andcall up tables of values for them. Do thegraphs and tables match what appearson this page?
Use those points to graph the functions.
Write an equation and create a table ofvalues for g.
Since g(x) = f(3x), replace x with 3x to findthe equation forg.
g(x) - f{3x) = 5(3; 2 = 2.
X
0
2
ofjrt-tr+ay\*/ 2
g(-2) = |(-2) + 2
= -3 + 2 = -10
_,//~i^ ir\\ "> — A i n ig((J) — ((J) -tZ — (j + 2 — 2.JL
!
\) = f (2) + 2 = 3 + 2 = 5
0M
2
5
4Identify the transformation and the factor.
The points on the graph of g are closer tothe y-axis than their corresponding pointson the graph of f. A horizontal shrinkpushes a graph toward the y-axis.
For g(x) = f(3x), k = 3. So, the factor. 1 1I sk 'o r3-
^ Thegraph ofgisthe result of a
horizontal shrink of fby a factor of •-•
Lesson 20: Stretching and Shrinking Functions 153

EXAMPLE I Graph the linear functions f(x) - -4x - 3andg(x) = -2x- 3.
Use words to describe the transformation, including if it is a horizontal stretch or a horizontal shrink,and by what factor. Then write an equation for g(x) in terms of f(x).
Use what you know about slope-intercept form to graph each line.
Inf(x) = -4x - 3, the slope is -4 and they-intercept is (0, -3).
So, plot the point (0, -3). Then count 4 units down and 1 unitto the right and plot a second point, {1, - 7). Draw and label theline for f.
lng(x) = -2x - 3, the slope is -2 and they-intercept is (0, -3).
So, plot the point (0, —3). Then count 2 units down and 1 unitto the right and plot a second point, (1, -5). Draw and label theline for g.
Identify the transformation.
The points on the graph of g are fartherfrom the y-axis than their correspondingpoints on the graph of f. A horizontalstretch pulls a graph away from the y-axis.
Does a stretch or shrink of the graph of aline always change its slope? Explain.
« • Describe the transformation in words andas a function.
Compare the point (-1,1) onfto itscorresponding point (-2,1} on g. Thepoint on g is twice as far from the y-axis asthe point on f.
The transformation was a horizontalstretch by a factor of 2.
Since this transformation is horizontal,the stretch factor is equal to p and, infunction notation, k is multiplied by theinput, x.
k — ~K-
g(x) = f
154 Unit 2: Linear and Exponential Relationships

EXAMPLE The graph of function f was transformed to createthe graph of function g, as shown. Was f stretched or shrunk,horizontally or vertically, and by what factor? If f(x) - 4X + 8,what is the equation of g(x)?
Examine the key features to determinehow f was transformed.
As you move left on the graph of f, thevalues of f(x) get very close to 8. So, fappears to have an asymptote at y = 8.
Many points on the graph of g lie belowthat asymptote, so points from the graphof f must have been moved much closer tothe x-axis. Thus, g appears to be a verticalshrink of f.
Find the equation for g(x).
f 9
Identify the factor of the shrink.
In a vertical shrink, the output is multipliedby a factor, k. So, compare points.
A vertical shrink has the form g(x) = kf (x).
So, k = Tr-rfor allx./ w
The point (2, 24) on the graph of f wasshrunk to (2, 3) on the graph of g.
9(2) JL24
-:_jSuppose f(x) = 4" + 8 is shrunk
horizontally by a factor of -~ to form
function h. Will the equation of h be
h(x) - 4^x + 8 or h(x) = 48* + 8? Explain.
Lesson 20: Stretching and Shrinking Functions 155

PracticeClassify the graph of g as either a vertical stretch or a vertical shrink of the graph of f.
1. 2.
A vertical shrink draws pointscloser to the x-axis.
Classify the graph of g as either a horizontal stretch or a horizontal shrink of the graph of f.
3. 4.
*- x
o; *v Is g closer to or farther awayfrom the y-axis?
Fill in each blank with an appropriate word, phrase, or expression.
5. A horizontal pushes the points of a graph toward the y-axis.
6. A horizontal pulls the points of a graph away from the y-axis.
7. If g(x) = kf(x) and |k| > 1, then g is the result of a vertical stretch of g by a factor of _
8. Ifg(x) = f{kx)and \k\ then g is the result of a horizontal shrink of g by a factor of
156 Unit 2: Linearand Exponential Relationships

Graph each function g on the coordinate plane below it. Classify each graph of g aseither a vertical stretch or a vertical shrink of the graph off. Then identify the factor.
9. g{x) = 2x - 6 10.
transformation: vertical
factor:
transformation: vertical
factor: .
Graph each function g on the coordinate plane below it. Classify each graph of g aseither a horizontal stretch or a horizontal shrink of the graph of f. Then identify the factor.
11. g(x) = -5x
transformation: horizontal
factor:
12.
transformation: horizontal
factor:
Lesson 20: Stretching and Shrinking Functions 157

Match each verbal description of a translation of f (x) = 6X with the equation of its transformedimage by writing the correct letter next to each description.
13. vertical stretch by a factor of 8
14. vertical shrink by a factor of Q
15. horizontal stretch by a factor of 8
16. horizontal shrink by a factor of «••* o
A.
B.
C.
= 8(6J()
Graph each function g on the coordinate plane below it. Classify each graph of g as a stretch ora shrink of the graph of f, horizontal or vertical, and by what factor.
17. g(xHff(x)
f(x = 4* +
transformation:
factor:
•f-X
18.
transformation:
factor:
19.
transformation:
factor:
20. g(x) = f(2x)
transformation:
factor:
158 Unit 2: Linear and Exponential Relationships

Graph the functions described and provide the desired information about them.
21. Graph f(x) - 2x - 2 and its image, g, after a horizontal stretch by a factor of 4.Write equations for g(x) in terms of f(x) and in terms of x.
g(x) x -
-*-x
22. DISTINGUISH The graph of f(x) = 3x is shown. Graph g(x) = -^f(x). Then describe the two
transformations needed to create the image, g, from the graph off.
•V
-
Lesson 20: Stretching and Shrinking Functions 159

Functions in Context
People often use functions to model real-world relationships. These functions tell how one quantitychanges in relation to another quantity. Representations of these functions, such as tables, graphs, orequations, can be used to answer questions about the relationships or to make predictions.
EXAMPLE A The EZ Car Rental Company charges a set fee plus a daily rate to rent a car. It costs $90to rent an economy car for 1 day and $170 to rent the same car for 3 days. Write a function to modelthe cost of renting an economy car for x days.
Decide if this relationship is linear or exponential.
The relationship can be represented as:
(total charge) = {set fee) + (cost per day) X (number of days, x)
The variable, x, is multiplied by a constant rate, the cost per day. The set fee is then added tothat product.
Since the rate of change is constant, the function is linear.
Find the cost per day.
The cost per day is the slope of the linearfunction. Find two points and use the slopeformula to find the cost per day.
A 1-day rental costs $90. So, (1, 90) is asolution for this function.
A 3-day rental costs $170. So, (3,170) isalso a solution.
cost per day 170-903 -1 f = 40
Substitute 1 day and 3 days into yourmodel function to check that it outputs$90 and $170, respectively.
Find the set fee and write the function.
We can use an ordered pair, such as (1, 90),to determine the complete equation.
f(x) = (set fee) + 40x
40(1)
40
= (setfee)
90 = (set fee)
50 - (set fee)
The cost, f(x), in dollars of renting aneconomy car for x days can be modeledby the equation f (x) = 50 + 40x.
160 Unit 2: Linear and Exponential Relationships

EXAMPLE B Mr. Vega bought a new car for $20,000. He used a function to estimate how its valuewill depreciate, or decrease over time.
Age in Years, t 0 1
Value in Thousands of Dollars, v(t) 20 16
2 3 4
12.8 10.24 8.192
What type of function did Mr. Vega use to model this relationship? Describe the rate at which the cardepreciates. Write an equation for the function.
Test to see if the function is linear.
Examine the decrease in value from year to year.
1 year after purchase: v(0) - v(l) = 20 - 16 = 4, or $4,000
Between years 1 and 2: v(l) - v(2) = 16 - 12.8 = 3.2, or $3,200
Between years 2 and 3: v(2) - v(3) = 12.8 - 10.24 - 2.56, or $2,560
The rate of depreciation is not constant, so this model is not a linear function.
Test to see if the function is exponential.
Compare the value of the car insuccessive years.
v(\)1 year after purchase: -rrr = 90 =
Between years 1 and 2:
Between years 2 and 3:
v(2)v(Dv(3)
20
12.816
10.24v(2) 12.8
Each year, the value of the car is 0.8, or80%, of its value the previous year. Thismeans the car's value is decreasing ata constant percent rate. Functions thatdecrease at a constant percent rate areexponential functions.
-0.8
-0.8
3Determine an equation for the function.
The constant percent rate is 80%, or 0.8.This is the factor by which the previousyear is multiplied to get the next year.
v(l) = v(0)-0.8
v(2) - v(l) - 0.8 - MO) - 0.8) • 0.8= v(0)-(0.8)2
v(3) - v(2) • 0.8 - (v(0) • (0.8)2) - 0.8
You can see a pattern forming. For any yearx after purchase, the car's value is given by
v(x) = v(0)-(0.8)x.
Substitute v(0), the initial value, 20.
Make a graph to illustrate thedepreciation of the car over time.
Lesson 21: Functions in Context 161

EXAMPLE Leah opened a checking account and bought a certificate of deposit (CD) on the
same day. She deposits money into her checking account each month. The amount in her checking
account, C, can be modeled by C(t) = 50(12)t, or C(t) - GOOr., where t is the time in years since the
account was opened.
Leah's CD has a set annual interest rate, and the interest is compounded monthly. The amount in her/ 0 03 \'
CD can be modeled by the function A(t) = 800(1 + -jy- ] , where t is the time in years since she
deposited the money.
Interpret the parameters of functions C and A in this situation.
2Interpret the parameters of C(t).
The problem explains that t represents
time in years, and there are 12 months inT, ... 12 months ., ,
1 year. The quantity —yea?— x f years
gives a number of months.
Thus, the 50 likely represents the amount
deposited each month.$50 .., 12months
jDQOfttrr X year x t years = the money in
the checkingaccount at
time t
Interpret the parameters of A(t).
The equation for A, an exponential growth
function, shows an amount earning
compound interest. The formula for
calculating this amount, A, is
A = P(l + T))", where Pis the principal,
r is the annual interest rate, and n is
the number of times the interest is
compounded per year.
, 0.03So, inA(t) 12 , 800 is P, the
principal; 0.03 is r, the interest rate; and
12 isn, the number of times the interest
is compounded per year. This means that
Leah deposited $800 in a CD at 3% annual
interest, compounded monthly.
EXAMPLE Combine functions Cand A above to build a function that shows the total amount of
money Leah has in both accounts at any time, t.
Combine both functions by adding them to
form a new function, L
C(t)+A(t)
50(12)t+ 800 1 + 0.03 Y2t
12I2t-600M- 800(1.0025)
The total amount in both accounts after
f months is: L(t) =600t + 800(1.0025)'2'.
Leah always keeps $200 hidden at home,
which she calls her "emergency fund."Write a function for the total amount ofmoney Leah has in her checking account,CD, and emergency fund at any time t.
162 Unit 2: Linear and Exponential Relationships

Problem Solving
Abdul buys a bus card with a value of $30. Each time he takes a bus ride, $1.50 is deductedfrom his card. Write a function that can be used to model this situation. Then use thefunction to determine the value of the bus card after Abdul takes 4 rides.
Since the value decreases at a constant rate per ride, mode! this with a(n]function.
Write an equation and then use the equation to solve the problem.
SOLVE
The initial value of his card is $30. So, when he has taken 0 rides, there is $30 left on his
card. The point (0, ) is an ordered pair for this function. It is also the -intercept.
Each time Abdul takes a bus ride, $1.50 is deducted from his card.
So, the rate of change, or slope, is This rate should be negative because
Substituting form, the slope, and for fa, the y-intercept, gives the equation:
c(x) =
If Abdul takes 4 rides, the value of his card, in dollars, will be:
c(4) - (
CHECK
The initial value of the card is $30: c(0) = 30.
The value decreases by $1.50 each time he rides the bus.
After 1 ride, the value will be: c(l)-30.00-1.50- 28.50
After 2 rides, the value will be: c(2) -28.50 - 1.50 =
After 3 rides, the value will be: c(3) =
After 4 rides, the value will be: c(4) -
Is this the same value you found for c(4) when you used the equation?
^ This situation can be modeled by the equation c(x) —
After taking 4 rides, the value of Abdul's card will be$-
Lesson 21; Functions in Context 163

PracticeFor each situation, identify the type of function (linear or exponential) that could model it.Then write a function to model the relationship.
1. The highest possible grade for a report is100 points. Each day the report is late, theteacher deducts 10 points.
2. Sixteen teams are participating in atournament. Only the winning teams ineach round advance to the next round.
Days Late, x
StartingGrade, g(x)
0
100
1
90
2
80
3
70
4
60
function type:
g(x) =
Number ofRoundsCompleted, x
TeamsRemaining, f (x)
function type:
0
16
REMEMBER If the rate of change is constant,the function is linear.
3. As soon as a Web site went up, it received1 hit After one minute, it had received4 hits. The number of hits continued toquadruple each minute after that.
4. A cake decorator charges a $30 set fee foreach cake plus $20 for each color of icingrequired.
Colors of Icing n -> o c
Time SinceLaunch, i n 0 1 2minutes, x
Number of , . ,fiHits, h(x)
funrti<">n typ*3:
MY) =
Required, x3 4 CostofCakein
, , , * \W / W h?v 1 • V 1 w Vdollars, c(x)
64 256function typp-
c(x) =^
Choose the best answer.
5. A salesperson earns a weekly salary plusa commission on each appliance he sells.The function p(x) = 200 + O.OSx shows hisweekly earnings if x represents his weeklysales, in dollars. Which is also true?
A. His weekly salary is $205.
B. He earns $200 for each appliancehe sells.
C. He earns $0.05 for each appliancehe sells.
D. He earns a 5% commission for eachappliance he sells.
6. The equation A(t) = 900(0.85)' representsthe value of a motor scooter t years afterit was purchased. Which statement is alsotrue of this situation?
A. When new, the scooter cost $765.
B. When new, the scooter cost $900.
C. The scooter's value is decreasing ata rate of 85% each year.
D. The scooter's value is decreasing ata rate of 0.15% each year.
164 Unit 2: Linear and Exponential Relationships

_• t/j -; 10r1 o_ P
— roGO =±. C rt-' -D £• O -h JPh" W -. r" n " -T- &-£lo _ f D 5- g ^ *- 3- zT E3QJ -. -3 — n ro — ro 13
•< rl ^ — 3" '-•• w T3 It3t / ) t o Q J n Q J O C L c WCT "-1- — O £ O CD -;5, o 5' £ 3 ft -o g. S? 5 S 2 - £ S s S iroro^CO^^Cop3- i ? S o £ £ " 5f> n 5 -, °- -* 1. -• t/To *• Q. 5 &> -j- ^ <" L.8- a g-|ts ro :> *•?-D ^ rs 0 . ^ 0 - ^ n ^
* S - H S : g " S 8 a < 25 S sT =: 9 ?!. 8 0 ^ron^wro-^-^^• c -1 LO -T- ro w r* T3
in CL s: =- OJ [sj 3- QJn - r o c ^ i L c o f D ^c ro ft 5- ro" <£ CL ro*< l^ =±. ro n • Q) r+<" q O T 3 _ — 1 •< c>'— . ^ " ni — h ^^ l 'I* — . ^ UJ ^ — * 5^^ 3 o- 3- 3- fD g
ro c ro r*ro
to*
ifUl
oDNJ
~nc13n
o'D(/>
5"no3foX
^ff>Ln
=s c± ^ s-' 3~ cr o <%-i -J -=* _ fD O "~1'' *1S - ^ 0 5 ^ - g c n 3" ^" S- cr 3 o *jlJ5 ro. 1L o ri n n i3n i a - ^ ^ S ^ Uo 3- Z 3 O _. ^ ^D r - t - L n o_ 3 cr !=r. >,p- 3- a. " a) S 3 ?- < c ° ^ ^ ^ ^3- <. QJ cniwy- c: ro —a s- R- ° * "S 5 5'- 9 - § r : = S - o Q .fij C^ < W 0 L^|NJr+ O
a ? | - g 8 o ° 5^ c r ^ - S ^ - ^ ^ ^c ^ ^ g - f l - a T c L
^ O - f g c r O ^ J0 3 « O in' -* 3C T C Q - D - c - - r T 3
i s N - s ^ s *n w • 3; - 9> ro
8 § ft ' ^ f— . r-h1- -
o & - 3 Pcu S S c o3 ™ w ^• _t n <-t- ^J
:unction a to determine t
after 5 years.
3^roi-t-oS]QJ
3oc3
O
3o3fD*<wJro|.
3"QJ
roi-t-oroT3QJ*<
i(/i3-roroT1wO)><U5i-»-3"ro
1 -, crro 5-"S «^ c1
?lQJ oZ 3O <"QJ "O
w §
^ aS- oro g-ro o~-O cQJ —*< CLwr-H QJr^
IIIf? a< o'S =n>" Qto -
53"n'3"
1.
show the total amoun
!-»•
3
5 - 3 - 0^ C OJ
^ 3 "<^* r^ ^T
oo xi -o cr ^ C7" • QJ Q) — . (/)
^ Z 3. »
-i3-fDrr
q « S §3 -« =f 30 s^ ™ fTro" *< o~ 3-^- n> QJ QJ
m D 10-1 7Z~ "iJ
w n «cr S wro 3 QJ
? ff SfD ° DOi 3 33- n cft) Q. fiLS «. 3
QJ CL fD
^ ^ §•--• C/l!-*• ^~-
3" "Hi-t-—,
0) 3" QJro s-
0 -h roQ] C 5
p n g< ^< O w'3" 3 ^ft n 8a ct 3o ir+ 13- _ro c
T30
j C-) 3
g o g-c g CLro -=i- qw - 3
0 H
0 -o wp _o ,8 s^ ^3 flCL -— ' Sto ,--1 -
- D
0?
g^-= — 1
M IT
" ro: QJ
II; sT 3
fD fD —
^ iroCO
ro3I-T
tn
i_eni-t-
- • cr !±w ^ — * ^ -n O S3 - 3 3 - CT n c °ro o ro QJ -, ^ •*-i °- -T-I n n- T- Om fTi O r O -J ^45 JE. X r n rf X"1 it s' ^ s I« a- ro 6" SJ 5'?- o S S- fflro D- aj LO "< =•
S a - s - si- 1p § S "> ^ i< ft 2. S ^ 1
1 i 1 1 8 f&S| !il 1~L I, S- 3. 3 i5. ii ro 3 QJ JQ<t> yi 3 <' o £S R - 1 § 5= 0 0 ^ 0 tf.
1 ? s s » s(n ro T3 wy Ul H r* 3. x|O o 3- O < |0 8 ^ -o ft iO O ^ QJ fD OQJ -^ 3 < — '3 ° n Q. °Q. b c ro §i— OJ 3 "DS-1 — rt- ro T1o S ^ 3 ow - -• CL g-_ < 3 LO -*^ J> ^- -^-
ill i 5^* ^"SI.S'l it3 3^ r-t- 3 *"r* ro O Q- QJ
Z 3 3- ro ^w c ro ~" Q-3 3 -* 0 QJ
o I"S < SCL ro S o GJro o 3 SJ 5-^ 9, S 3 o
< w CT F7S £ £ 8^ D °
rr 3 =?
ff" 11-H 3^ 30 fD Q,ro

Arithmetic Sequences
UNDERSTAND A sequence is an arrangement of numbers or objects that follows a rule or apattern. Take a look at the Fibonacci sequence:
1,1,2,3,5,8,13,21,34,...
Each number in the sequence is called a term. The pattern of the Fibonacci sequence is thateach term is equal to the sum of the two previous terms. This rule is an example of usinga recursive process, because finding a term depends on knowing previous terms. Whendefining a recursive process, you must define at least one previous term.
The variable a is often used to stand for the terms in a sequence. The first term is a,, thesecond is a2, and so on. The nth term of the sequence is written an, where n can be anypositive integer. This notation is useful for writing the sequence's rule mathematically. Theequations below represent the rule for the Fibonacci sequence.
= 1 CL = 1 cr, = an -1 an - 2
UNOERSTAN In an arithmetic sequence, each term is found by adding a fixed number,called the common difference (d), to the previous term. The arithmetic sequence 3, 5, 7,9,11,13, ... has a common difference of 2.
9, ...
If you know any term in an arithmetic sequence, you can add the common difference to it tofind the next term. The following equation is a recursive definition of an arithmetic sequence.
o
You can derive an explicit equation to find any term in an arithmetic sequence, as long as youknow the first term.
o2 — a, + d
a3 - a2 + d = a} + d + d = a, + 2d
a4= a3 + d = a}+ 2d + d = a,+ 3d
Notice the pattern. To find a desired term, add the first term, a,, to a multiple of the commondifference, d. The coefficient of d is 1 less than the number of the desired term.
o. — a, (n -
166 Unit 2; Linear and Exponential Relationships

ConnectBelow are the first four terms in an arithmetic sequence.
25,22,19,16
Use a recursive process to find the next 3 terms in the sequence. Plot the first seven terms on acoordinate plane.
Find the common difference.
Solve the recursive equation for d.
j = a , + dn n I
Find the difference between successiveterms.
d=22 -25 = -3
d=19 - 22= -3
d=16-19 = -3
So, the recursive formula for an isa_ = a. 3.
Find the next three terms.
5 = a 4 -3 = 16-3 = 13
5 = a5- 3 -13 -3 -10
7 = a 6 - 3 = 10-3 = 7
The next three terms are 13,10, and 7.
Plot a point to represent each term inthe sequence.
Plot each point (n, an) for the firstseven terms.
.
2828;Mw201816U
I?
10o
642
0
(1,25)- V - - - 1
. ^(2,22)*• s
S lit 1 Kl# (1, 10]
~*v (5 13)*- '
* "+L$' ^)
: »
(7,7)
1 2 3 4 5 6 7 5
Based on the graph, what type ofrelationship exists between the n-valuesand the devalues? Use what you knowabout functions to help you explain therelationship.
Lesson 22: Arithmetic Sequences 167

I In a certain arithmetic sequence, each term is found by subtracting 4.5 from the previousterm. If the first term in the sequence is 10, what is the 9th term in the sequence?
Identify the values of a, and d.
You are told that the first term, a,, is 10.
The next term is found by subtracting 4.5,so the common difference, d, is -4.5.
Write an explicit formula to find a .
Substitute the values of a1 and d intothe formula.
Substitute 9 for n in the formula.Evaluate.
on = 14.5-4.5n
Qg - 14.5 - 4.5(9) - 14.5 - 40.5 = -26
t The 9th term in the sequence is -26.
an = 10-4.5n + 4.5
a = 14.5 -4.5n
Use a recursive process to find the 9thterm in the sequence. Which method-using a recursive process or using anexplicit formula—do you think is a betterchoice for solving this problem? Why?
168 Unit 2: Linear and Exponential Relationships

Problem Solving
Ami is training for a long-distance race. She ran for 30 minutes per day on three days thisweek. Each week she will increase her daily running time by 5 minutes. By the 6th week,for how many minutes will she run each day that she trains?
She increases her running time by the same number of minutes each week. So, this is anarithmetic sequence.
Write an explicit formula to represent the situation. Then find thesequence.
term in the
SOLVE
Her daily running time during the 1st week is 30 minutes,
She will increase her daily running time by 5 minutes each week, so d = _
Find a&, the number of minutes she will run each day during the 6th week.
30 + (
CHECK
Use a recursive process to check the answer.
Do you get the same value for a ?
By the sixth week, Ami will be running minutes each day that she trains.
Lesson 22: Arithmetic Sequences 169

PracticeDetermine if each sequence is an arithmetic sequence. If it is, identify the common difference.
1. 5, 3, 1, -1, -3, ... 2. 2, 2, 4, 6,10, ... 3. f, f, \ f, \,...
:" it) Is the same number added toeach term to get the next term?
Write a recursive process for each arithmetic sequence. Then use it to find the specified term,
4. 5,9,13,17,21, ... 5. 6. 10, 3,-4, -11,-18,.
REMEMBER In a recursive process,an is defined by using previous terms.
Write an explicit formula for the nth term and use it to find the specified term.
7. 11,15,19, 23, ... 8, 100, 88, 76, 64, ... 9. 1.2,1.8, 2.4, 3,...
Qn = - on = - °n = -
Qrt — — ——— —— dirt -—- .—.—- tJi12
Use the given information to find the specified term in each arithmetic sequence.
10. a, = 14, d = 6 11. a 1 -52 ,d=-5 12. a, - 0, d =
a. a15
Choose the best answer.
13. The formula an = 10 - 4n describes anarithmetic sequence. What are the firstfour terms in the sequence?
A. 6, 2,-2,-6
B. 6,2,0,-2
C. 10,6,2, -2
D. 14, 18,22,26
14. For an arithmetic sequence, a, - 21. Its
recursive formula is a -a , +11. Whichn n - I
explicit formula can be used to find the
nth term in the sequence?
A. an= 10-lln
B. on = 10 + lln
C. o( = 21 -lln
D. a = 21 + lln
12'
170 Unit 2: Linear and Exponential Relationships

Use the arithmetic sequence below for questions 15-17.
2,5,8,11,...
15. Write an explicit formula in terms of n to show how to find the nth term in this sequence.
16. Plot points (n, an) on the grid to represent the first six terms in the sequence.
0 1 2 3 4 5 6
What does the slope of the graph represent?
17. Think of this sequence as a function. What type of function is it? What are its domain and itsrange? Explain your thinking.
Use sequences to describe the situation.
18. Steve is buying a new tablet computer on layaway.He makes an initial payment of $50 and will increase thepayment each month as shown by the table. Write a recursiveformula and an explicit formula to describe this sequence.Explain how you determined the formulas.
Month (n)
1
2
-^
4
5
Payment in $
K)50
60
70
80
90
'
Lesson 22: Arithmetic Sequences 171

Geometric Sequences
in a geometric sequence, each pair of consecutive terms is related by acommon ratio, r.
To find a term in the sequence, multiply the previous term by the common ratio. The geometricsequence 1, 3, 9, 27, 81, ... has a common ratio of 3. Each term is multiplied by 3 in order toyield the next term.
81, .
If you know any term in a geometric sequence, you can multiply it by the common ratio to findthe next term. The following is a recursive definition of a geometric sequence:
o.
Suppose you wanted to find the 100th term in this sequence. As with arithmetic sequences,using the recursive definition would require a lot of steps. Fortunately, you can derive anexplicit equation to find any term in a geometric sequence, as long as you know the first term.Examine the formulas for the first few terms.
O-
a,
a
a
a-r-r a - r
a,
r = o1 • r • r = a,
a - r • r = a.
Notice the pattern. To find a desired term, multiply the first term, a,, by a power of thecommon ratio, r. The exponent of r is 1 less than the number of the desired term. Writtenmathematically, this is:
a, • r
172 Unit 2: Linear and Exponential Relationships

ConnectBelow are the first four terms in a geometric sequence.
1,2,4,8
Use a recursive process to find the next 3 terms in the sequence. Plot the first seven terms on acoordinate plane.
Find the common ratio.
Solve the recursive equation for r.
Find the quotient of successive terms.
2 ~—r =
So, the recursive formula for an is Find the next three terms.
o7 = a6 • 2 - 32 • 2 - 64
Plot a point to represent each term inthe sequence.
Plot each point (n, an) for the firstseven terms.
68
6056524844403632282420161284
-(7,64)i -('
- ri(
. . __ ....
. " - , --•- - - " - i
_; __ .
'/
---:-/X(5, 1
r
(2, 2) - * '
11
! . .• (6,32) •-
6)
_••--*•"'' • s
^ The next three terms are 16, 32, and 64.
Based on the graph, what type ofrelationship exists between the n-valuesand the c^-values? Use what you knowabout functions to help you explain therelationship.
Lesson 23: Geometric Sequences 173

EXAMPLE A geometric sequence has an initial value of 1,024, and each term in the sequence is halfof the previous term. Write an explicit formula to find any term in the sequence. Then use that formulato find the 9th term in the sequence.
Identify the values of a, and r.
You are told that the first term, a,, is 1,024.
The next term is found by halving the
previous term, or multiplying by , so the
common ratio, r, is -
Find the 9th term in the sequence.
2Write an explicit formula to find an.
Substitute the values of a1 and r intothe formula.
a = a • r
" '
This can be simplified by using the laws ofexponents.
a =1,024- .2
IVa =1,024
a, = 2,048 •
f (9) = 2,048 - = 2,048 = 4
The 9th term in the sequence is 4.
Use a recursive process to find the 9thterm. Compare this result to the answerabove to check your work.
1/4 Unit 2: Linear and Exponential Relationships

Problem Solving
Jenny started a chain letter by e-mail. She sent it to five of her friends and asked them toeach send it to five of their friends. Assume that no one breaks the chain and that no personreceives the e-mail twice. How many e-mails will be sent during the 6th generation?(Treat Jenny's e-mails as the 1st generation of the letter.)
Each person who receives the e-mail sends it to five friends.
Each of those people also sends it to five friends. So, the total number of e-mails sent in each
generation is times the number of e-mails sent in the previous generation.
So, a recursive process can be used to find the answer.
SOLVE
In the 1st generation, 5 e-mails were sent. So, a, - 5.
In the 2nd generation, 5 times as many e-mails will be sent, and so on.
2nd generation: a? = 5 • 5 =
3rd generation: a3 =
4th generation: a4 =
5th generation: O5 =
6th generation: a6 —
IT _-_
5 =
5-
5-
CHECK
The numbers of e-mails sent in each generation are the terms of a geometric sequence.So, check the answer by writing an explicit formula.
We know that a, = and the common ratio, r, is 5.
-on - a, • r
a = • (.
Use the formula to find o6.
a.
Did you get the same value for a6?
If the chain is not broken, then exactlysixth generation.
e-mails will be sent in the
Lesson 23: Geometric Sequences 175

PracticeDetermine if each sequence is a geometric sequence. If it is, identify the common ratio.
1. 5, 70, 15, 20, 25, . 2. 7, -14, 28, -56,112, . 3. 16, 24, 36, 54, 81,
REMEMBER A common ratio canbe positive or negative.
Write a recursive process for each geometric sequence. Then use it to find the specified term.
4. 1,6,36,216,...
a, =
1
64' 256' '"
a
or
6. 0,05,0.5,5,50,...
a, =
a
What number is multipliedby each term to get thenext term?
Write an explicit formula for the nth term and use it to find the specified term.
7. 3, 2, f , f ,... 8. 3, -9, 27, -81, ... 9. 12, 24, 48, 96, ...
CL CL =
Use the given information to find the specified term in each geometric sequence.
10. o, = 3, r - 20 11. o, - 5,000; r - 0.2 12. a, = 2, r - -4
o.
Choose the best answer.
13. The formula on ~ —10 • (3)"'1 describesa geometric sequence. Which recursiveformula also describes this sequence?
A. a, =l;0f] = o n _ 1 - - 30
R /i
c. Ol =D. a, -
); a = a -3n n - 1
o,-=o.-,-30
14. Which formula can be used to find the nthterm in the sequence below?
128,96,72,54,...
A.
B. fl.-128.dr
c-
a fl.-i28.(
176 Unit 2: Linear and Exponential Relationships

Use the geometric sequence below for questions 15-17.
80,40,20,10, ...
15. Write an explicit formula in terms of n to show how to find the nth term in this sequence.
16. Plot points {n, an) on the grid on the right to represent the firstsix terms in the sequence.
Find the average rate of change between each adjacent pairof points.
17. Think of this sequence as a function. What type of function is it?What are its domain and its range? Explain your thinking.
A petri dish contains 4 viruses. Each hour, the number of viruses increases, as shown inthe table. The population change can be modeled by a geometric sequence. Write a recursiveformula and an explicit formula that can model this sequence. Use the formulas to predict howmany viruses will be in the dish by the 7th hour.
Hour(n)
2. . .
3
4
5
PopulationK)
4.
12
36
108
324 ;
Lesson 23: Geometric Sequences 177

fc 2 Review
Determine whether each relation represented is a function or not. Write yes or no.
1. Inputx «
0 -
o _
Output—
7
2. Input
-3
-2\
OutputS N.
x64
-100k125
3. Input Output
Use the arithmetic sequence below for questions 4-6.
18,14,10,6,...
4. Write an explicit formula for the nth term. 5. What is the tenth term in this sequence?
6. Think of this sequence as a function. What type of function is it? What are its domain andits range?
..f
Graph each function. Then identify the x- and y-intercepts of each graph.
7. f(x)=~2x + 6 8. f(x) =
y
2 4 . e
-15 r -4 ; -2 • 0 2 i 4 : fi
x-intercept:
y-intercept:
x-intercept:
y-intercept:
178 Unit 2 Review

Fill in the blanks by writing an operation sign and a number to show how the y-values arechanging over each interval. Then classify the function as linear or exponential.
9.
x
y
Function type:
Write each expression in the requested form.
10. Vx2 in exponential form^j
11. (16a)^ in radical form
Use the graph and table below for questions 12 and 13. The graph represents an exponentialfunction f. The table lists several ordered pairs for a linear function g.
9(x) =
X
-1
0
1
2
3
5x-5
sKx)-10_ c
0
5
10
12. Compare the intervals for which the functions are positive and negative.
13. Compare and contrast the end behavior of the functions.
Solve each system of equations algebraically.
14. f x - 2y=ll
12x + 5y = 4
15. |2x- 5y = 40
-4x + 3 = -10
Unit 2 Review 179

r.
Graph g. Then write an explicit equation for g(x) in terms of x.
16. g(x) - f(x + 2) 17. g(x) = -f(x)
f(x) = -3*+ 3:
2 4 G a
g(x) g(x)
Choose the best answer.
18. Based on the graph on the right, which statement is not true?
A. Functions fand g have the same x-intercept.
B. The ordered pair (2,14) is a solution for f(x).
C. The ordered pair (2, 7} is a solution for g(x).
D. The value of f(x) begins to exceed g(x) during the intervalbetween x = 1 and x = 2.
Graph each inequality or system of inequalities. Shade the portion of the graph that representsthe solution set.
19. 2y -3x>4
180 Unit 2 Review

Rewrite each side of the equation as a function. Then graph the functions to solve for x.
21. 2x+6
g(x) =
X =-*x
Examine the following situations and respond in complete sentences.
22. With each swing of apendulum, the length of its swingbecomes less, as shown in the tablebelow. Write an explicit formula tomodel the length of the arc in terms ofthe number of the swing. Classify the listof arc lengths as either an arithmetic orgeometric sequence and explain howyou know.
23-
Number ofSwing (n)
1
Arc Length
30
27
24.3
21.87
19.683
The cost of usinn thpat an Internet cafe equals a settee plus acertain rate per minute. Four minutes ofInternet use cost $3, and eight minutes ofInternet use cost $4. On the grid, make agraph to represent this situation and writean equation to model the situation. Findthe slope of the graph and interpret itsmeaning in this situation.
oT3C
inoO
ex Cost ofInternet Use
0 1 2 3 4 5 6 7 8 9 1 0
Time (in minutes)
Unit 2 Review 181

Performance Task
TAKM? CARE OF BusinessWorking in parrs or individually, pretend you are starting your own business.
1. The item I will self is . The name of my new business is
2. Set a price per item that you will charge. Create a table, a graph, and an equation to show f, theamount you will collect if you sell up to 10 items. Represent the number of items as x.
x f(x) =
3
4
5
6
7
8
9
10
3. Explain how you determined the equation for f.
1
52
48
> 44
C 40
0 - ^ - 3 6
S « ?2o _. 28^ -g 24
§ c 20O *=• 16
E 12< 8
4
, Produe
i
:j
:t Sales
in
IE:; !
±
±!
I
0 1 2 3 4 5 6 7 8 9 1 0
Number Sold
x
4. Did you connect the points on the graph with a solid line? a dashed line? no line? Explain why.
The amount you collect from selling your product is not the same as the profit you earn fromselling your product.
5. Suppose that the amount of profit you earn is equal to-| of what you collect.
So, if each product costs $5, then your profit for selling 1 product is: $5 • ~ =
Using algebraic notation, represent this as a transformation: p(x) = f(x).
What type of transformation off does it represent? ____—__—______^_^__
6, Write an equation for p. Then graph it on the coordinate plane above, using a differentcolored pen or pencil than you used to draw the graph of f. Does this show the transformationyou expected?
182 Unit 2 Performance Task

Profits are important to you, but your customers are only concerned with how muchyour product will cost them. They want to pay as little as possible.
The graph below shows how much one of your competitors, Company G, charges for the sameproduct, including shipping.
y,
5248
>» 44
« 40f\ ^fi° tn db
J J5 32
|1 24§ c 20
O -T-, 1C"••. 1 D
E 12< 8
4
</
M
,--*
ro
-
«
i
•
d
1
i
Lit
1
/>
:tbai
f/'
i ]
^ ;
• - - - - - - •
.... ;_ ....
es
_.__:
~-
!— 1
1
— ]
i
0 1 2 3 4 5 6 7 8 9 1 0
Number Sold
7. Based on the graph, how much does Company G charge per product? Explain how you know.
8. Copy your original graph of function f from the previous page onto the graph above.Use a different color and label it f. After checking with your local shipper, you find that youwill need to charge customers 15 dollars to ship any items. Transform the graph effusing thisequation:
MX) = f(x) + 15
Identify the transformation:
Then write an explicit equation for h: h(x) =
Based on your graph, when would it be cheaper for Mr. Smith to order from Company G?When would it be cheaper to order from you? Would the price ever be the same from bothcompanies?
Unit 2 Performance Task 183

Grade 8 Algebra IGeometry &
Algebra II
Expressions & Equations
Understand connections betweenproportional relationships, lines,and linear equations.
Functions
Use functions to modelrelationships between quantities.
Statistics and Probability
Interpreting Categorical andQuantitative Data
Summarize, represent, andintepret data on a single count ormeasurement variable.
Summarize, represent, andintepret data on two categoricaland quantitative variables.
Interpret linear models.
Statistics and Probability
Investigate patterns ofassociations in bivariate data.
Functions
Interpreting Functions
Interpreting Categorical andQuantitative Data
Summarize, represent, andintepret data on a single count ormeasurement variable.
Making Inferences andJustifying Conclusions
Make inferences and justifyconclusions from sample surveys,experiments, and observationalstudies.
Conditional Probability andthe Rules of Probability
Understand independence andconditional probability and usethem to interpret data.
184
Copyright © 2022 FDOKUMEN