Experimental validation of 5 in-silico predicted glioma biomarkers
10
Experimental validation of 5 in-silico predicted glioma biomarkers Rheal A. Towner, Randy L. Jensen, Brian Vaillant, Howard Colman, Debra Saunders, Cory B. Giles, and Jonathan D. Wren Advanced Magnetic Resonance Center, Oklahoma Medical Research Foundation, Oklahoma City, Oklahoma (R.A.T., D.S.); Arthritis & Clinical Immunology, Oklahoma Medical Research Foundation, Oklahoma City, Oklahoma (C.B.G., J.D.W.); Department of Pathology, University of Oklahoma Health Sciences Center, Oklahoma City, Oklahoma (R.A.T.); Department of Biochemistry and Molecular Biology, University of Oklahoma Health Sciences Center, Oklahoma City, Oklahoma (J.D.W.); Department of Neurosurgery, Huntsman Cancer Institute, University of Utah, Salt Lake City, Utah (R.L.J., H.C.); Seton Brain and Spine Institute, Clinical Education Center, Austin, Texas (B.V.) Background. Glioblastoma multiforme (GBM) is a high- grade glioma with poor prognosis. Identification of new biomarkers specific to GBM could help in disease diagno- sis. We have developed and validated a bioinformatics method to predict proteins likely to be suitable as glioma biomarkers via a global microarray meta-analysis to identify uncharacterized genes consistently coex- pressed with known glioma-associated genes. Methods. A novel bioinformatics method was imple- mented called global microarray meta-analysis, using 16 000 microarray experiments to identify uncharacter- ized genes consistently coexpressed with known glioma- associated genes. These novel biomarkers were validated as proteins highly expressed in human gliomas varying in tumor grades using immunohistochemistry. Glioma gene databases were used to assess delineation of expression of these markers in varying glioma grades and subtypes of GBM. Results. We have identified 5 potential biomarkers— spondin1, Plexin-B2, SLIT3, fibulin-1, and LINGO1— that were validated as proteins highly expressed on the surface of human gliomas using immunohistochemistry. Expression of spondin1, Plexin-B2, and SLIT3 was signif- icantly higher (P , .01) in high-grade gliomas than in low-grade gliomas. These biomarkers were significant discriminators in grade IV gliomas compared with either grade III or II tumors and also distinguished between GBM subclasses. Conclusions. This study strongly suggests that this type of bioinformatics approach has high translational poten- tial to rapidly discern which poorly characterized proteins may be of clinical relevance. Keywords: biomarkers, gene databases, gliomas, glioblastoma multiforme, immunohistochemistry. A n important issue to be resolved with regard to ma- lignant gliomas is whether there are new relevant biomarkers that can help increase the specificity for the diagnosis of high- and low-grade gliomas. Forty percent of all primary central nervous system tumors are diagnosed as gliomas, of which glioblastoma multiforme (GBM) is the most malignant; the mean survival time is 15 months for patients diagnosed with GBM. 1 The ma- lignant nature of high-grade gliomas makes them one of the leading causes of cancer death. Information regarding tumor behavior, including cell proliferation (cellularity and mitotic activity), nuclear atypia, neovascularization, and the presence of necrosis and/or apoptotic regions, can be obtained from grading and identification criteria. 2 To classify tumors such as adult malignant gliomas and to assess prognosis, differences in molecular composition among tissue types, or “biomarkers,” can be used diag- nostically. 2 – 7 The most useful are markers that can guide clinical decisions and predict response to certain therapies. Recent biomarkers have been found from genome- wide surveys associating somatic mutations with risk of glioma development. The molecular biomarkers most commonly used to evaluate adult malignant gliomas from biopsies include 1p/19q codeletion, methylation of the O 6 -methylguanine-DNA methyltransferase gene promoter, alterations in the epidermal growth factor Corresponding Author: Rheal A. Towner, PhD, Director, Advanced Magnetic Resonance Center, Oklahoma Medical Research Foundation, 825 N.E. 13th Street, Oklahoma City, OK 73104 USA (Rheal-Towner@ omrf.org). Received October 18, 2012; accepted July 10, 2013. Neuro-Oncology 15(12):1625–1634, 2013. doi:10.1093/neuonc/not124 NEURO-ONCOLOGY Advance Access publication October 24, 2013 # The Author(s) 2013. Published by Oxford University Press on behalf of the Society for Neuro-Oncology. All rights reserved. For permissions, please e-mail: [email protected]. at University of Oklahoma on April 15, 2014 http://neuro-oncology.oxfordjournals.org/ Downloaded from
Transcript of Experimental validation of 5 in-silico predicted glioma biomarkers
Experimental validation of 5 in-silico predictedglioma biomarkers
Rheal A. Towner, Randy L. Jensen, Brian Vaillant, Howard Colman, Debra Saunders,Cory B. Giles, and Jonathan D. Wren
Advanced Magnetic Resonance Center, Oklahoma Medical Research Foundation, Oklahoma City, Oklahoma
(R.A.T., D.S.); Arthritis & Clinical Immunology, Oklahoma Medical Research Foundation, Oklahoma City,
Oklahoma (C.B.G., J.D.W.); Department of Pathology, University of Oklahoma Health Sciences Center,
OklahomaCity,Oklahoma(R.A.T.);Department ofBiochemistryandMolecular Biology,UniversityofOklahoma
Health Sciences Center, Oklahoma City, Oklahoma (J.D.W.); Department of Neurosurgery, Huntsman Cancer
Institute, University of Utah, Salt Lake City, Utah (R.L.J., H.C.); Seton Brain and Spine Institute, Clinical Education
Center, Austin, Texas (B.V.)
Background. Glioblastoma multiforme (GBM) is a high-grade glioma with poor prognosis. Identification of newbiomarkers specific to GBM could help in disease diagno-sis. We have developed and validated a bioinformaticsmethod to predict proteins likely to be suitable asglioma biomarkers via a global microarray meta-analysisto identify uncharacterized genes consistently coex-pressed with known glioma-associated genes.Methods. A novel bioinformatics method was imple-mented called global microarray meta-analysis, using�16 000microarrayexperiments to identify uncharacter-ized genes consistently coexpressed with known glioma-associated genes. These novel biomarkers were validatedas proteins highly expressed in human gliomas varying intumor grades using immunohistochemistry. Glioma genedatabases were used to assess delineation of expression ofthese markers in varying glioma grades and subtypes ofGBM.Results. We have identified 5 potential biomarkers—spondin1, Plexin-B2, SLIT3, fibulin-1, and LINGO1—that were validated as proteins highly expressed on thesurface of human gliomas using immunohistochemistry.Expression of spondin1, Plexin-B2, and SLIT3 was signif-icantly higher (P , .01) in high-grade gliomas than inlow-grade gliomas. These biomarkers were significantdiscriminators in grade IV gliomas compared witheither grade III or II tumors and also distinguishedbetween GBM subclasses.
Conclusions. This study strongly suggests that this typeof bioinformatics approach has high translational poten-tial to rapidlydiscernwhichpoorly characterizedproteinsmay be of clinical relevance.
Keywords: biomarkers, gene databases, gliomas,glioblastoma multiforme, immunohistochemistry.
An important issue to be resolved with regard to ma-lignant gliomas is whether there are new relevantbiomarkers that can help increase the specificity
for the diagnosis of high- and low-grade gliomas. Fortypercent of all primary central nervous system tumors arediagnosed as gliomas, of which glioblastoma multiforme(GBM) is the most malignant; the mean survival time is�15 months for patients diagnosed with GBM.1 The ma-lignant nature of high-grade gliomas makes them one ofthe leading causes of cancer death. Information regardingtumor behavior, including cell proliferation (cellularityand mitotic activity), nuclear atypia, neovascularization,and thepresenceofnecrosis and/orapoptotic regions, canbe obtained from grading and identification criteria.2 Toclassify tumors such as adult malignant gliomas and toassess prognosis, differences in molecular compositionamong tissue types, or “biomarkers,” can be used diag-nostically.2–7 The most useful are markers that canguide clinical decisions and predict response to certaintherapies.
Recent biomarkers have been found from genome-wide surveys associating somatic mutations with risk ofglioma development. The molecular biomarkers mostcommonly used to evaluate adult malignant gliomasfrom biopsies include 1p/19q codeletion, methylationof the O6-methylguanine-DNA methyltransferase genepromoter, alterations in the epidermal growth factor
Corresponding Author: Rheal A. Towner, PhD, Director, Advanced
Magnetic Resonance Center, Oklahoma Medical Research Foundation,
825 N.E. 13th Street, Oklahoma City, OK 73104 USA (Rheal-Towner@
omrf.org).
Received October 18, 2012; accepted July 10, 2013.
Neuro-Oncology 15(12):1625–1634, 2013.doi:10.1093/neuonc/not124 NEURO-ONCOLOGYAdvance Access publication October 24, 2013
#The Author(s) 2013. Published by Oxford University Press on behalf of the Society for Neuro-Oncology. All rightsreserved. For permissions, please e-mail: [email protected].
at University of O
klahoma on A
pril 15, 2014http://neuro-oncology.oxfordjournals.org/
Dow
nloaded from

receptor pathway, and isocitrate dehydrogenase 1 and 2gene mutations.2–8 Several proteomics-based approacheshave been used to find proteins unique to gliomas,9 butthese have been severely limited by issues of sample size,the ability to detect low-abundance proteins, and data re-producibility. It is also important to note that many ofthese studies have generated hundreds and even thou-sands of putative candidates, yetnot many have been eval-uated with subsequent validation and characterizationapproaches.
Our motivation was to identify novel glioma biomark-ers, in the hopes that they would be of value for clinical di-agnostics, prognostics, or therapeutics. An approach wepreviously developed that entails a global microarraymeta-analysis (GAMMA) of genes differentially ex-pressed across 3651 human 2-color microarray experi-ments was used to identify gene–gene coexpressionpatterns that were consistent and specific across heteroge-neous microarray experiments.10 The significance and re-producibility of the GAMMA predictions from the2-color array data have been corroborated by normaliza-tion11 and meta-analysis of 13 000 additional 1-colorhuman microarrays,12 as well as 700 RNA sequence ex-periments (unpublished observations). This “guilt by as-sociation” approach identifies gene sets that are likely tobe associated in biologically relevant ways such as pheno-type, disease, and genetic network. GAMMA has beenused successfully to identify the mitotic role of a formerlyuncharacterized gene called C13ORF3 (now Ska3),13
to detect a role in coagulation for C6ORF105 (nowandrogen-dependent tissue factor pathway inhibitor–regulating protein)14 and to identify olfactomedin 4 as anovel neutrophil subset marker associated with granulesecretion.15 Recently, we used GAMMA to identify thebiomarker ELTD1 (epidermal growth factor, latrophilin,and 7 transmembrane domain-containing 1 on chromo-some 1) as a putative glioma-associated marker with im-munohistochemistry (IHC) validation in human androdent gliomas and in vivo molecular-targeted MRI inrodent gliomas.16
With the GAMMA approach, genes are not analyzeddirectly,but the top20genesmostconsistentlycoexpressedwith them are analyzed for what they have in common inthe peer-reviewed literature using a large-scale computa-tional analysis.17,18 This way, even if a protein has noknown function, its function can be inferred. In this case,its role in gliomas can be inferred by its consistent patternsof coexpressions with other glioma-associated genes.Then, using the Human Protein Reference Database19
and other experimental sources on protein cellularlocalizations, we can screen this list of predicted glioma-associated proteins for those that are extracellular ormembrane bound. It is thought that extracellular ormembrane-bound proteins could be potential ideal thera-peutic targets and could be reached for in vivo targetedimagingwithfluorescence-labeled antibodies. After identi-fying putative glioma-associated markers, we used IHC toexperimentally validate their presence in human gliomas.For IHC, the novel biomarkers can be compared withtraditional IHC markers for human gliomas, includingvascular endothelial growth factor (VEGF), glucose
transporter–1 (GLUT-1), and hypoxia inducible factor–1a (HIF-1a). Expression of the novel biomarkers inhuman gliomas will be further evaluated from gene ex-pression databases to establish whether these biomarkersare differentially expressed in varying glioma grades andGBM subtypes.
Materials and Methods
Bioinformatics
Using bioinformatics methods developed in our group topair coexpression data with literature-based analysisof protein commonalities,10,17,18,20 we conducted aglobal meta-analysis of �16 000 microarray experiments(1- and 2-color) obtained from the database of theNational Center for Biotechnology Information GeneExpression Omnibus (NCBI GEO). For each humangene, the meta-analysis identified a set of 20 genes thatwere the most consistently and specifically coexpressedwith it across the heterogeneous conditions analyzed.Each gene, whether it had any published literature de-scribing its function or not, had its function inferred byanalysis of what these 20 coexpressed genes had incommon. This was done via an automated, large-scaleanalysis of the peer-reviewed literature17,20 to identifygenes that were consistently transcribed with establishedglioma-related genes but that have themselves neverbeen associated with gliomas in the literature. This cir-cumvents a problem inherent in the lists of expressedgenes derived by microarrays, which identify only thosegenes that are being actively transcribed at the time ofthe experiment without detecting proteins that arepresent but not actively transcribed. That is, GAMMAassociates genes that are frequently cotranscribed regard-less of the condition, and then if a statistically significantset of genes has been reported as glioma associated inthe literature, these associations need not be transcrip-tional to be identified by GAMMA (eg, they could befrom proteomics or genome-wide association studies).The enormous sample size of both microarray data andanalyzed abstracts enables us to screen out genes that donot pass a threshold of statistical significance. This associ-ative method works for glioma-derived literature-basedassociations as well as for searches on associated process-es (such as angiogenesis, apoptosis, and cell migration),helping to corroborateany putative roles in tumorigenesisthat we uncover. For each association, we calculatedmutual information (a measure of variable dependency)between literature terms to prioritize the strength of asso-ciation between each protein and a role in gliomas.18
Finally, we obtained increased confidence in the predic-tions because GAMMA also successfully predictedmany established glioma-related genes (eg, epidermalgrowth factor receptor, matrix metalloproteinase–2,glial fibrillary acidic protein, fibroblast growth factor 2).These identifications serve as positive controls forpredictive capacity.
Towner et al.: Bioinformatics-predicted biomarkers for gliomas
1626 NEURO-ONCOLOGY † D E C E M B E R 2 0 1 3
at University of O
klahoma on A
pril 15, 2014http://neuro-oncology.oxfordjournals.org/
Dow
nloaded from
Immunohistochemistry
The human tissue sample portion of the study was con-ducted in compliance with the University of UtahHealth Sciences Center Institutional Review Board. ForIHC analysis, tissue from 50 patients with high-gradegliomas (21 female, 29 male), including 40 GBM, 6 ana-plastic astrocytomas, and 4 anaplastic oligodendroglio-mas, was compared with tissue from 21 patients (10female, 11 male) with tumors classified as low-gradegliomas (11 benignoligodendrogliomas, 10 low-grade as-trocytomas). Antibodies (Abs) to spondin1, Plexin-B2,Slit homolog (SLIT3), fibulin-1, and leucine-rich repeatand immunoglobulin domain–containing Nogo receptorinteracting protein 1 (LINGO1) were available commer-cially (F-spondin Ab [S-17], Plexin-B2 Ab [I-16], SLIT3Ab [F-15], and fibulin-1 Ab [H-190] were all obtainedfrom Santa Cruz Biotechnology. LINGO1 [LRRN6A]-S596 [C-term] Ab was obtained from Abgent. Allhuman Abs were assessed and found to provide similarresults; dilutions were 1:500). A toluidine blue (0.1%)counterstain was used (15 sec). IHC was performedusing the Vectastain ABC Kit (Vector Laboratories).Negative controls were performed by replacing theprimary Ab with nonimmune serum. Slides were exam-ined using an Olympus BX41 microscope. Under 200×magnification (10 ocular × 20 objective), slides werescored by 2 investigators blinded to the specimen tumorgrade or patient information. A score of 0–4 was assignedbased on the percentage of cells stained in a given field:0 ¼ 0%–25%, 1 ¼ 25%–50%, 2 ¼ 50%–75%, 3 ¼75%–100%, and 4 ¼ 100%. In prior papers, we havedemonstrated that this method is very reproducible,with good interrater reliability (P ¼ .99, 95% confidenceinterval [CI] ¼ 0.99–1.00) and intrarater reliability (P ¼.96, 95% CI ¼ 0.92–0.99).21 Each investigator indepen-dently reviewed the slide at low power and at randomhigh-power fields when determining the IHC score.Positive expression was considered for scores of 2–4,whereas negative expression was considered for scoresof 0 and 1. Percent survival values for the GBM,anaplastic astrocytoma, and anaplastic oligodendro-glioma patients were 0.0%, 0.0%, and 50.0%, respec-tively. Percent survivals for benign oligodendroglioma
and low-grade astrocytoma patients were 27.3% and70.0%, respectively.
Gene Expression Analysis
For the glioblastoma expression microarray analysis, rawAffymetric .cel files and level 3 Agilent expression datawere downloaded from The Cancer Genome Atlas(TCGA)—529 and 594 GBM samples, respectively; datawere also retrieved from the Repository for MolecularBrain Neoplasia Data (REMBRANDT; 229 total astrocy-tomas,ofwhich125wereGBM)andErasmus (NCBIGEOSeries GSE16011; a total of 187 astrocytomas, of which159wereGBM),aswellasthecorrespondingclinicalanno-tations for each. The .cel files were then processed using Rand Bioconductor, in a custom computable documentformat file, with background correction, log transforma-tion, and quantile normalization performed using therobust multi-array algorithm implemented in R.
For mesenchymal and proneural gene signature defini-tion, we used a composite of signatures from the Phillipset al.22 and Verhaak et al.23 studies. For a given tumor,the metagene mesenchymal and proneural signaturescores were both calculated. Within a data set, the mesen-chymal and proneural metascores were z-scores correctedto allow comparison between the two. Tumors were thenassigned to one of the signatures based on the higher-expressing metagene.
Statistical Analyses
Statistical differences for IHC scoring and expressionstatistical differences were compared between groupsusing the Welch 2-sample t test (unpaired, 2-sided),with P , .05 considered to be significant.
Results
Bioinformatics
Using our GAMMA procedure, we identified membrane-bound proteins that had not yet been associated withgliomas but whose expression consistently correlated
Table 1. GAMMA-associated relationships of potential novel glioma biomarkers (highest GAMMA scores) with cancer growthcharacteristics and other cancers
Biomarker Functional Relationships Ref.
SLIT-13 Growth factor, angiogenesis/VEGF, cell proliferation, cell migration, extracellular matrix proteins,epigenetic (hypermethylation) inactivation of SLIT1–3 genes in human cancers, melanoma,breast cancer, ovarian cancer, colorectal cancer, gastric cancer
39,50,51
SPON1 (spondin1) Extracellular matrix protein, promotes cell attachment, cell adhesion, angiogenesis/VEGF, cell migration,cell growth; colorectal cancer, ovarian cancer
40–43
FBLN1 (fibulin-1) Extracellular matrix organization (proteins, components), integrin, basement membrane, TGFb, growthfactor, cell adhesion, cell proliferation, cell growth, cell migration, angiogenesis, matrixmetalloproteinases; overexpressed in other cancers, melanoma, breast cancer, hepatocellularcarcinoma, prostate cancer
45–49
PLXNB2 (Plexin-B2) Cell proliferation, angiogenesis, cell motility, TGFb, pro-inflammatory cytokines 52–56
LINGO1 Neurogenesis, brain development, epidermal growth factor receptor binding, astrocytes, glial cells 57–60
Towner et al.: Bioinformatics-predicted biomarkers for gliomas
NEURO-ONCOLOGY † D E C E M B E R 2 0 1 3 1627
at University of O
klahoma on A
pril 15, 2014http://neuro-oncology.oxfordjournals.org/
Dow
nloaded from
with genes reported to be associated with gliomas. Weidentified 195 putative candidate markers, all genes pre-dicted or known to be membrane bound and not appear-ing in any MedLine article that mentioned gliomas (orsynonymous terms). Of these 195, only 75 had commer-cial antibodies at the time of analysis that we could useto validate with IHC. Fibulin-1, LINGO1, spondin1,SLIT3, and Plexin-B2 were chosen from among this list of75 because they all had high scores. With this analysis setto stringent thresholds, we empirically observed that theFBLN1, LINGO1, SPON1, SLIT3, and PLXNB2 geneswere all found to be consistently transcribed with knownglioma-associated genes. Supplementary Figs S1–S5 showhow these genes are connected to other glioma-associatedgenes via protein–protein interactions (obtained fromthe Human Protein Reference Database).24 FBLN1isassociated with several extracellular matrix remodelinggenes (eg, collagen genes such as COL1A1/2, COL2A1,COL3A1, COL4A1/2/3, COL5A1, COL6A3, COL7A1,COL18A1; transforming growth factor [TGFb1];matrix metalloproteinases such as MMP2, MMP9, andMMP14) and other cell invasion- and migration-relatedgenes, such as CD44, which are characteristic of the inva-sive nature of GBM.25–28 SPON1 is also associated withgenes related to cell invasion or migration, such as variouscollagen genes, MMPs, CD44, and TGFb1; endothelialcells (integrin ITGB1/3), and epidermal growth factor re-ceptor, all found to be affected in GBM.25–30 PLXB2 isassociated with genes that regulate extracellular matrixremodeling (COL2A1, COL1A1/2, MMP1, TGFb1)and angiogenesis (VEGF-a and the integrin bindingprotein IGFBP3). LINGO1 is associated with tight junc-tion protein 1 (also known as zonula occludens 1), whichregulates membrane-type 1 MMP expression (involved intumor cell invasion).31 Supplementary Fig. S6 includesgene association data for ELTD1.16 Functional relation-ships for biomarkers are outlined in Table 1.
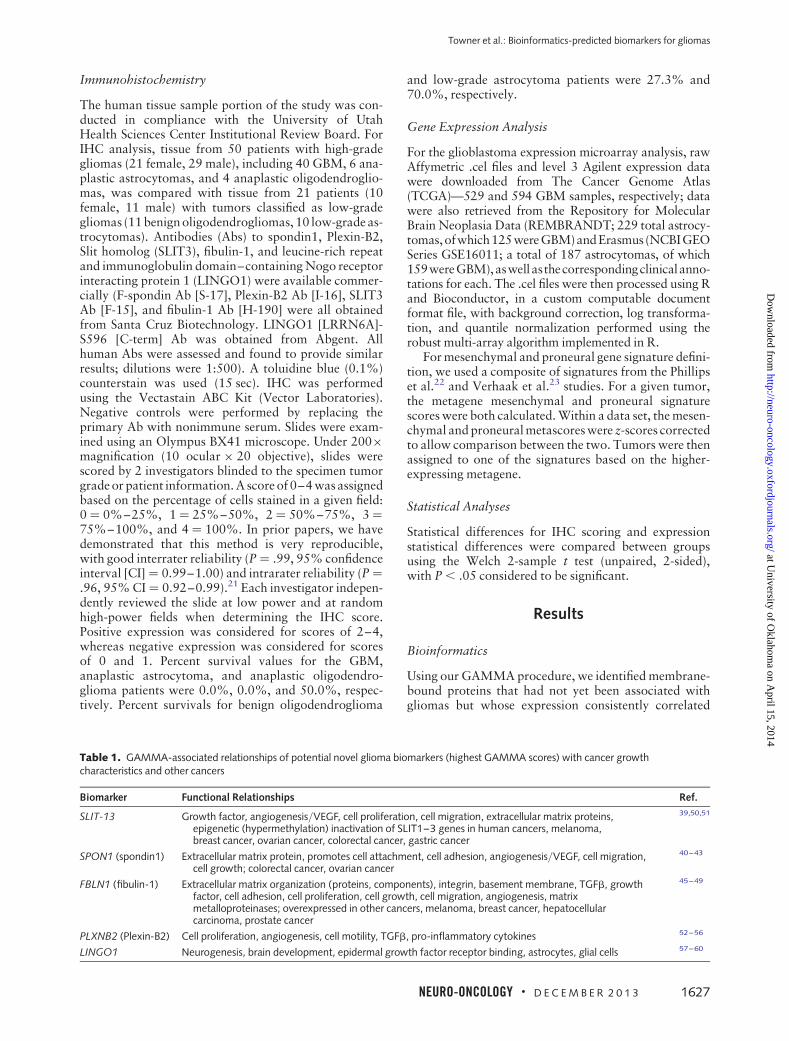
GAMMA-predicted associations and their scores arebased on a combination of (i) how many genes out ofthe top 20 coexpressed genes that were analyzed showedassociations with gliomas based on published reportsand (ii) their statistical significance based on randomnetwork simulations to estimate the probability that aset of equally frequent terms would associate withgliomas. Only proteins with P , .01 were selected aspotential candidates. A flow diagram of the GAMMA ap-proach is illustrated in Fig. 1. All predicted associationsfor these genes are given in Supplementary Tables S1–S5.
Immunohistochemistry
Fibulin-1, SLIT3, LINGO1, spondin1, and Plexin-B2 wereall found to be expressed in gliomas in general (Fig. 2).Fibulin-1 and LINGO1 were not found to have significantlyhigher expression (P . .05 for both) when comparing high-grade and low-grade gliomas, whereas all other biomarkers(traditional biomarkers including VEGF, HIF-1a, andGLUT-1 had P , .05, P , .05, and P , .01, respectively),including SLIT3 (P , .01), spondin1 (P , .001), andPlexin-B2 (P , .01), had significantly higher expression in
high-grade compared with low-grade gliomas (Fig. 2A).All 5 novel biomarkers compared well with VEGF,HIF-1a, or GLUT-1, although LINGO1 had a higheraverage IHC score in both high-grade and low-gradegliomas compared with traditional markers. In low-gradegliomas (low-grade astrocytomas and oligodendroglio-mas), LINGO1 had the highest IHC score, followed byfibulin-1. All of the novel biomarkers were ≥80% posi-tive in high-grade glioma patients, and fibulin-1, SLIT3,and LINGO1 were .70% positive in low-grade gliomapatients (Fig. 2B).
Fig. 1. The global microarray meta-analysis (GAMMA)
bioinformatics approach. (A) For all human genes, the first step is to
identify their coexpression trends. Previous experiments show that
genes positively correlated in their coexpression levels tend to be
related by function, phenotype, and disease relevance. For
example, for every experiment where 2 genes, alox5ap and itgb2,
are expressed, this is quantified by Pearson correlation; however,
not all genes have expression data. (B) For genes of unknown
function, the second step is to identify the 20 genes with the
strongest coexpression correlation. In this example, only 3 genes
are shown for simplicity. (C) The third step is to identify what the
coexpressed genes have in common. Text-mining software
(IRIDESCENT) is used to analyze what diseases, phenotypes,
chemicals, and other genes appear in the literature with each of the
coexpressed genes. These are the inferred associations for the
unknown gene. The set of coexpressed genes is searched for
reported commonalities in the peer-reviewed literature. After all of
the genes are analyzed, the list is shortened to include those with
certain characteristics. In this example, we include only those that
are inferred to be associated with gliomas, are plasma-membrane
bound, and have commercial antibodies available for validation
experiments to be conducted to establish whether these proteins
are differentially present in gliomas.
Towner et al.: Bioinformatics-predicted biomarkers for gliomas
1628 NEURO-ONCOLOGY † D E C E M B E R 2 0 1 3
at University of O
klahoma on A
pril 15, 2014http://neuro-oncology.oxfordjournals.org/
Dow
nloaded from

Figure 3 depicts representative IHC staining for VEGF,HIF-1a, GLUT-1, SLIT3, spondin1, Plexin-B2, fibulin-1,and LINGO1 in human high-grade and low-gradegliomas, indicating that high-grade gliomas had substan-tially higher levels of VEGF, HIF-1a, GLUT-1, SLIT3,spondin1, and Plexin-B2 compared with correspondinglow-grade gliomas. In addition to examples depictinglow levels in low-grade gliomas (Fig. 3, Gii and Hii),both fibulin-1 and LINGO1 had samples with highlevels of staining in low-grade gliomas (Fig. 3, Giii andHiii, respectively).
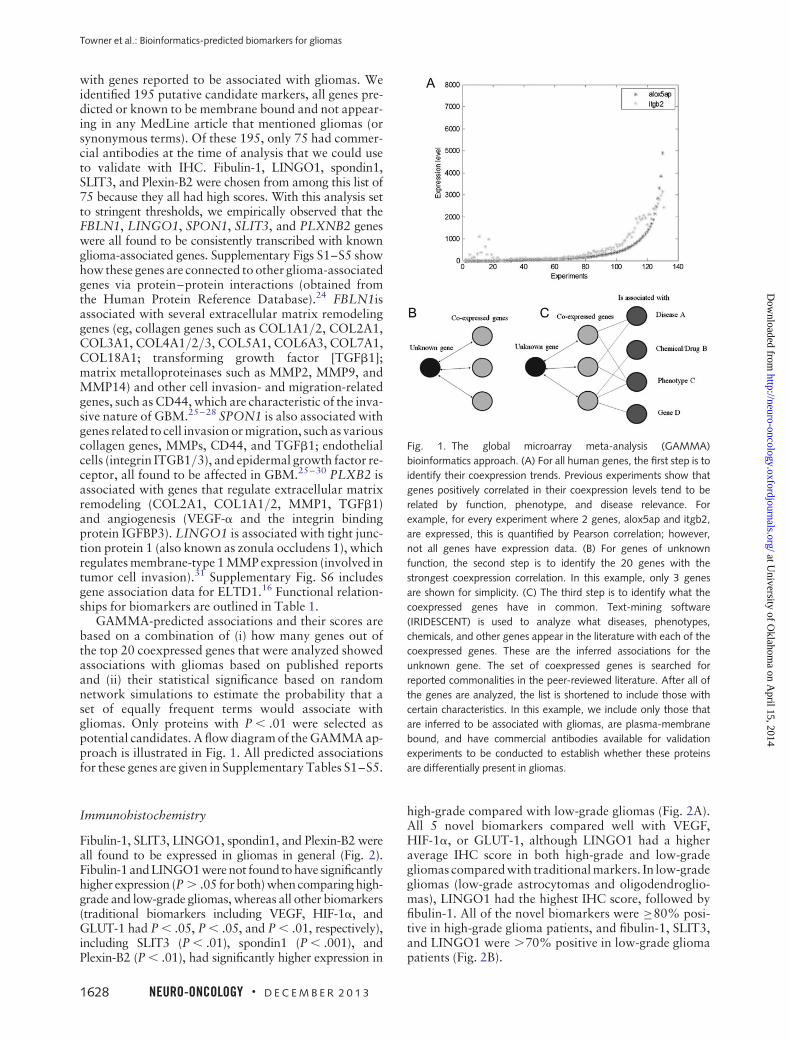
Figure 4 illustrates that gene expression levels offibulin-1, LINGO1, spondin1, and Plexin-B2 are all sig-nificantly different in grade III or grade IV gliomas com-pared with grade II gliomas. Gene expression data forSLIT3 was found to be poorly represented on theAffymetrix platforms and did not provide conclusive dif-ferences in tumor grades in the Agilent TCGA data. Bothfibulin-1 and Plexin-B2 were found to be expressed signifi-cantly more in grade IV gliomas than in grade II (P , .001and P , .0001, respectively) or grade III (P , .001 and
P , .05, respectively), whereas LINGO1 and spondin1were found to have significantly lower expression ingrade IV tumors than in grade II (P , .0001 for both) orgrade III (P , .01 and P , .001, respectively).
Figure5 shows howeach of the biomarkers can be usedto differentiate between mesenchymal and proneuralGBM subtypes, as measured in 4 gene expressiondatabases (TCGA Affymetrix platform, TCGA Agilentplatform, REMBRANDT, and Erasmus). Data for SLIT3were available only in the TCGA Agilent database,and LINGO1 data were not available in the TCGAAffymetrix database. In 3 gene databases, fibulin-1 expres-sion was found to be significantly higher (P , .01) in mes-enchymal GBM, whereas LINGO1 expression was foundto be significantly higher (P , .0001) in proneural GBM.Inall4databases, spondin1expressionwas found tobesig-nificantly higher (P , .05) in proneural GBM, whereasPlexin-B2 expression was found to be significantly higher(P , .0001) in mesenchymal GBM. SLIT3 expressionwas found to be significantly higher (P , .0001) in mesen-chymal GBM compared with proneural GBM.
Fig. 2. Spondin1, SLIT3, and Plexin-B2 levels are higher in high-grade (HG) gliomas compared with the levels in low-grade (LG) gliomas. (A)
Graph showing average IHC scores for biomarkers VEGF, HIF-1a, GLUT-1, fibulin-1, SLIT3, spondin1, LINGO1, or Plexin-B2 in high-grade
gliomas (50 patients: 21 female and 29 male) and low-grade gliomas (21 patients: 10 female and 11 male). Scores were obtained using the
following grading criteria—0: 0%; 1: 0– ,25%; 2: 25– ,50%; 3: 50– ,75%; 4: 75–100% detection of IHC stain. Significant differences in
marker levels between HG and LG were established when *P , .05, **P , .01, or ***P , .001. Actual P-values for each biomarker are:
.0161 for VEGF, .0227 for HIF-1a, .0013 for GLUT-1, .2081 for fibulin-1, .0069 for SLIT3, .2054 for LINGO1, .0004 for spondin1, and .0035
for Plexin-B2. (B) Graph showing the percentage of patients that expressed biomarkers stained by IHC in high-grade gliomas (50 patients)
and low-grade gliomas (21 patients). A negative expression (NE) result was attributed to IHC scores of 0 or 1. A positive expression (E) result
was attributed to IHC scores of 2–4.
Towner et al.: Bioinformatics-predicted biomarkers for gliomas
NEURO-ONCOLOGY † D E C E M B E R 2 0 1 3 1629
at University of O
klahoma on A
pril 15, 2014http://neuro-oncology.oxfordjournals.org/
Dow
nloaded from

Discussion
We found that each of the algorithmically predicted bio-markers was found in high levels within human gliomasin general, as assessed by IHC, and that some of the bio-markers, such as SLIT3, spondin1, and Plexin-B2, wereexpressed at significantly higher levels in high-grade
gliomas than in low-grade gliomas (Fig. 2A) and may beuseful diagnostic markers for high-grade gliomas(Fig. 3). Both fibulin-1 and LINGO1 were found to be pos-itively expressed inbothhigh-grade and low-grade gliomaswith high IHC scores (Fig. 2B), although they did notsignificantly discriminate between the grades, and these2 markers may serve as general glioma markers for all
Fig. 3. VEGF, HIF-1a, GLUT-1, SLIT3, spondin1, and Plexin-B2 levels are elevated in high-grade gliomas compared with low-grade gliomas. (A)
Representative IHC staining for VEGF in a GBM (Ai), an oligodendroglioma (Aii), and normal brain (Aiii). (B) Representative IHC staining for
HIF-1a in a GBM (Bi), a low-grade astrocytoma (LGA) (Bii), and normal brain (Biii). (C) Representative IHC staining for GLUT-1 in a GBM
(Ci), an oligodendroglioma (Cii), and normal brain (Ciii). (D) Representative IHC staining for SLIT3 in a GBM (Di), an LGA (Dii), and normal
brain (Diii). (E) Representative IHC staining for spondin1 in a GBM (Ei), an LGA (Eii), and normal brain (Eiii). (F) Representative IHC staining
for Plexin-B2 in a GBM (Fi), an oligodendroglioma (Fii), and normal brain (Fiii). (G) Representative IHC staining for fibulin-1 in a GBM (Gi), an
LGA (Gii, an example of low expression), an oligodendroglioma (Giii, an example of high expression), and normal brain (Giv). (H)
Representative IHC staining for LINGO in a GBM (Hi), 2 oligodendrogliomas (Hii, an example of low expression; and Hiii, an example of high
expression), and normal brain (Hiv). White arrow heads depict regions that highly stain for each biomarker. Magnification of all panels is 40×.
Towner et al.: Bioinformatics-predicted biomarkers for gliomas
1630 NEURO-ONCOLOGY † D E C E M B E R 2 0 1 3
at University of O
klahoma on A
pril 15, 2014http://neuro-oncology.oxfordjournals.org/
Dow
nloaded from
tumor grades. Examples of both high and low levels ofthese markers are depicted in Fig. 3. SLIT3, spondin1,and Plexin-B2 also all fare well in comparison with moretraditional IHC markers currently used to diagnoseGBM, in that the expression levels of these 3 biomarkerswere similar to those of currently investigated gliomamarkers, including VEGF, HIF-1a, and GLUT-1. HIF-1ahas been well documented to be an important diagnosticmarker for gliomas, and this marker can be targeted fortherapeutic intervention.32–38
From the gene expression results, we have also demon-strated that therewasa strong association with expressionoffibulin-1,LINGO1, spondin1,andPlexin-B2ingrade IVgliomas compared with either grade II or grade III gliomas(Fig. 4). Interestingly, both fibulin-1 and Plexin-B2 werefound to be more highly expressed in grade IV gliomas,whereas LINGO1 and spondin1 were found to be lessexpressed in grade IV tumors compared with eithergrade II or grade III gliomas. In addition, when welooked at the GBM tumor subtypes, it looked like therewas a significant increase with gene expression offibulin-1, Plexin-B2, and SLIT3 for the mesenchymalsubtype versus the proneural subtype, which was betterassociated with increased gene expression of LINGO1and spondin1 (Fig. 5). These findings were consistent in3 gene databases for fibulin-1, LINGO1, spondin1, andPlexin-B2. Unfortunately, SLIT3 gene data were usable inonly the TCGA Agilent database. It is reasonable to con-cludethatspondin1andPlexin-B2expressiondata inpartic-ular are both strong biomarkers of grade (also supported bytheIHCdata),withPlexin-B2increased inthemesenchymalsubtype and spondin1 elevated in the proneural subtype.
Noneof the5proteinshadbeendocumentedasdiscrim-inately present on the surface of glioma cells, althoughSLIT3wasfoundinapreviousstudytobehypermethylatedin glioma and colorectal cancer cell lines.39 Spondin1,SLIT3, and fibulin-1 also had previously reported
associations with different cancers. Spondin1 was previ-ously found to be overexpressed in ovarian/peritoneal car-cinomas,40–43 and SLIT3 was widely expressed in humanhepatocellular carcinomas.44 Fibulin-1 was associatedwith gastric,45 breast,46 colon,47 and prostate48 cancers,and its promoter hypermethylation was associated withtumor progression in human hepatocellular carcinomas.49
SLIT3 is a predominant ligand transcribed in the earlymouse heart and is expressed in the ventral wall of thelinear heart tube and subsequently in the chamber.50 TheSLIT3 gene at human chromosome 5q34-q35.1 is involvedin encoding large secreted proteins functioning as ligandsfor Roundabout (ROBO) receptors, and the SLIT-ROBOsignaling pathway is implicated in angiogenesis and endo-thelial cell migration.51
Neither Plexin-B2 nor LINGO1 has been previouslyassociated with cancer, although some function isknown for these genes. Plexins are a family of genes thatare expressed in several organ systems and have been im-plicated in cell movement and cell–cell interaction.52
Plexin-B2 has been reported to be associated with thenegative regulation of interleukin-12/interleukin-23p40in dendritic cells.52 Plexins are cell surface receptorswidely studied in the nervous system, where theymediate migration and morphogenesis through the Rhofamily of small GTPases.53 Plexin-B2 is highly expressedon cells of the innate immune system in the mouse, includ-ing macrophages and dendritic cells, and may serve as anegative regulator of basal cell motility.52 AlthoughPlexin-B2 has not been associated with cancers,Plexin-B1hasbeen reported tobe involvedasa tumor sup-pressor in melanoma cells,54 and Plexin-B in general is in-volved in invasive growth55 and angiogenesis.56 LINGO1has been found to be a potent regulator of neural stem cellmaturation to neurons, and inhibition of LINGO1 duringthe first days of neural stem cell differentiation results indecreased neuronal maturation.57,58 LINGO1 is a
Fig. 4. Increased expression of fibulin-1, LINGO1, spondin1, or Plexin-B2 biomarkers is associated with higher grade in gliomas in the
REMBRANDT gene expression database. Fibulin-1 and Plexin-B2 expressions were found to be significantly higher in grade IV gliomas, and
conversely LINGO1 and spondin1 expressions were significantly lower compared with grade II and grade III glioma data sets. Significant
differences between grades II and III or grades II and IV are shown for each marker. For statistical analysis, a Welch’s 2-sample t-test was used.
Towner et al.: Bioinformatics-predicted biomarkers for gliomas
NEURO-ONCOLOGY † D E C E M B E R 2 0 1 3 1631
at University of O
klahoma on A
pril 15, 2014http://neuro-oncology.oxfordjournals.org/
Dow
nloaded from
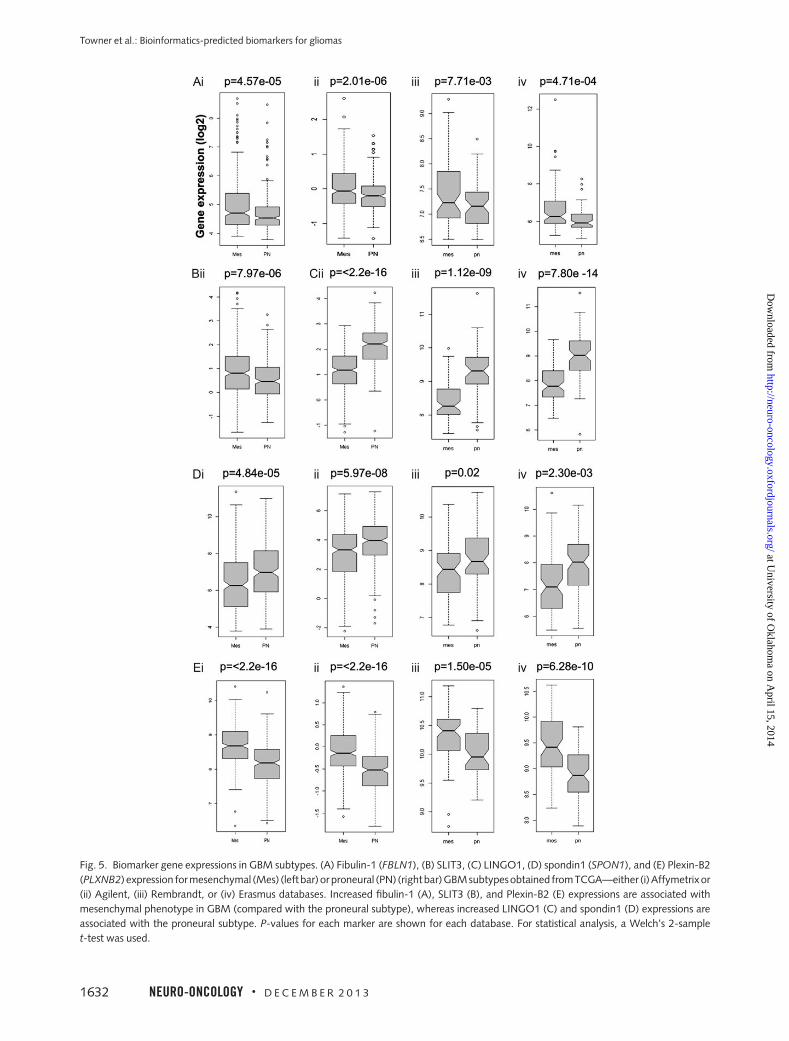
Fig. 5. Biomarker gene expressions in GBM subtypes. (A) Fibulin-1 (FBLN1), (B) SLIT3, (C) LINGO1, (D) spondin1 (SPON1), and (E) Plexin-B2
(PLXNB2) expression for mesenchymal (Mes) (left bar) or proneural (PN) (rightbar)GBMsubtypesobtained fromTCGA—either (i)Affymetrixor
(ii) Agilent, (iii) Rembrandt, or (iv) Erasmus databases. Increased fibulin-1 (A), SLIT3 (B), and Plexin-B2 (E) expressions are associated with
mesenchymal phenotype in GBM (compared with the proneural subtype), whereas increased LINGO1 (C) and spondin1 (D) expressions are
associated with the proneural subtype. P-values for each marker are shown for each database. For statistical analysis, a Welch’s 2-sample
t-test was used.
Towner et al.: Bioinformatics-predicted biomarkers for gliomas
1632 NEURO-ONCOLOGY † D E C E M B E R 2 0 1 3
at University of O
klahoma on A
pril 15, 2014http://neuro-oncology.oxfordjournals.org/
Dow
nloaded from
central nervous system transmembrane protein thatsimultaneously interacts with the Nogo-66 receptor andp75neurotrophin receptoror tumornecrosis factor recep-tor superfamily member 1 (TROY) on neurons to form areceptor complex responsible for myelin-mediatedneurite outgrowth inhibition59 and thus is a negative reg-ulator of myelination and repair of damaged axons.60
The results presented strongly suggest that the associat-ive transcriptional network analysis method used in thisstudy was able to accurately identify fibulin-1, LINGO1,spondin1, Plexin-B2, and SLIT3 as glioma-associated bio-markers. SLIT3, FBLN1, and SPON1 are predicted to in-fluence glioma progression by their role in the extracellularmatrix. SLIT3 has established associations with angiogen-esis and cell migration, and several genes with known rolesin extracellular matrix remodeling, such as SPARC andvascular-endothelial–cadherin, are predicted to be rele-vant to the SLIT3’ network. Fibulin-1 has predicted associ-ations with cell motility and invasion, and spondin1 isspecifically predicted to exert its influence via collagenmatrix attachments. PLXNB2, however, is predicted tobe more relevant to cell proliferation and to be relevantto the Wnt/b-catenin pathway. LINGO1 is probably themost neural-specific protein of the group and, based onthe IHC scores, appears to be increasingly important astumor grade increases. Each marker has either known or
predicted associations with different aspects of gliomatumor growth, and each marker or combination couldprovide valuable diagnostic information for gliomas.
Supplementary Material
Supplementary material is available online at Neuro-Oncology (http://neuro-oncology.oxfordjournals.org/).
Acknowledgments
WethankKristinKraus,MSc, foreditorial assistancewiththe paper.
Conflict of interest statement. None declared.
Funding
This work was supported by the Oklahoma MedicalResearch Foundation (OMRF) (to R.A.T.), theChapman Foundation (to J.D.W.), and NIH grants1P20GM103636 and 8P20GM103456-09 (to J.D.W.).
References
1. Central Brain Tumor Registry of the United States. CBTRUS Statistical
Report: Primary Brain and Central Nervous System Tumors Diagnosed
in the United States in 2004-2007. Hinsdale, IL: Author; 2011. http://
www.cbtrus.org/2011-NPCR-SEER/WEB-0407-Report-3-3-2011.pdf
Accessed 17 July, 2013.
2. Louis DN. Molecular pathology of malignant gliomas. Annu Rev Pathol.
2006;1:97–117.
3. The Cancer Genome Atlas (TCGA) Research Network. Comprehensive
genomic characterization defines human glioblastoma genes and core
pathways. Nature. 2008;455(7216):1061–1068.
4. Riemenschneider MJ, Jeuken JW, Wesseling P, Reifenberger G. Molecular
diagnostics of gliomas: state of the art. Acta Neuropathol. 2010;120(5):
567–584.
5. Jansen M, Yip S, Louis DN. Molecular pathology in adult gliomas:
diagnostic, prognostic, and predictive markers. Lancet Neurol. 2010;
9(7):717–726.
6. Colman H, Zhang L, Sulman EP, et al. A multigene predictor of outcome in
glioblastoma. Neuro Oncol. 2010;12(1):49–57.
7. Farias-Eisner G, Bank AM, Hwang BY, et al. Glioblastoma biomarkers from
bench to bedside: advances and challenges. Br J Neurosurg. 2012;26(2):
189–194.
8. Silber JR, Bobola MS, Blank A, Chamberlain MC. O(6)-methylguanine-
DNA methyltransferase in glioma therapy: promise and problems.
Biochim Biophys Acta. 2012;1826(1):71–82.
9. Niclou SP, Fack F, Rajcevic U. Glioma proteomics: status and perspectives.
J Proteomics. 2010;73(10):1823–1838.
10. Wren JD. A global meta-analysis of microarray expression data to predict
unknown gene functions and estimate the literature-data divide.
Bioinformatics. 2009;25(13):1694–1701.
11. Dozmorov MG, Wren JD. High-throughput processing and normalization
of one-color microarrays for transcriptional meta-analyses. BMC
Bioinformatics. 2011;12(Suppl 10):S2.
12. DozmorovMG,GilesCB,Wren JD.Predictinggeneontology fromaglobal
meta-analysis of 1-color microarray experiments. BMC Bioinformatics.
2011;12(Suppl 10):S14.
13. Daum JR, Wren JD, Daniel JJ, et al. Ska3 is required for spindle checkpoint
silencing and the maintenance of chromosome cohesion in mitosis. Curr
Biol. 2009;19(17):1467–1472.
14. LupuC,ZhuH,PopescuNI,WrenJD,LupuF.NovelproteinADTRPregulates
TFPI expression and function in human endothelial cells in normal conditions
and in response to androgen. Blood. 2011;118(16):4463–4471.
15. Clemmensen SN, Bohr CT, Rorvig S, et al. Olfactomedin 4 defines a
subset of human neutrophils. J Leukoc Biol. 2012;91(3):495–500.
16. Towner RA, Jensen RL, Colman H, et al. ELTD1, a potential new biomarker
for gliomas. Neurosurgery. 2013; In press.
17. Wren JD, Garner HR. Shared relationship analysis: ranking set cohesion
and commonalities within a literature-derived relationship network.
Bioinformatics. 2004;20(2):191–198.
18. Wren JD. Extending the mutual information measure to rank inferred
literature relationships. BMC Bioinformatics. 2004;5:145.
19. Goel R, Muthusamy B, Pandey A, Prasad TS. Human Protein Reference
Database and human proteinpedia as discovery resources for molecular
biotechnology. Mol Biotechnol. 2011;48(1):87–95.
20. Giles CB, Wren JD. Large-scale directional relationship extraction and
resolution. BMC Bioinformatics. 2008;9(Suppl 9):S11.
21. Jensen RL. Brain tumor hypoxia: tumorigenesis, angiogenesis, imaging,
pseudoprogression, and as a therapeutic target. J Neurooncol. 2009;
92(3):317–335.
Towner et al.: Bioinformatics-predicted biomarkers for gliomas
NEURO-ONCOLOGY † D E C E M B E R 2 0 1 3 1633
at University of O
klahoma on A
pril 15, 2014http://neuro-oncology.oxfordjournals.org/
Dow
nloaded from

22. Phillips HS, Kharbanda S, Chen R, et al. Molecular subclasses of
high-grade glioma predict prognosis, delineate a pattern of disease
progression, and resemble stages in neurogenesis. Cancer Cell.
2006;9(3):157–173.
23. Verhaak RG, Hoadley KA, Purdom E, et al. Integrated genomic analysis
identifies clinically relevant subtypes of glioblastoma characterized by
abnormalities in PDGFRA, IDH1, EGFR, and NF1. Cancer Cell.
2010;17(1):98–110.
24. Keshava Prasad TS, Goel R, Kandasamy K, et al. Human Protein Reference
Database—2009 update. Nucleic Acids Res. 2009;37(database
issue):D767–72.
25. Ulrich TA, de Juan Pardo EM, Kumar S. The mechanical regidity of the
extracellular matrix regulates the structure, motility, and proliferation of
glioma cells. Cancer Res. 2009;69(10):4167–74.
26. Veeravalli KK, Rao JS. MMP-9 and uPAR regulated glioma cell migration.
Cell Adh Migr. 2012;6(6):509–12.
27. Chetty C, Vanamala SK, Gondi CS, et al. MMP-9 induces CD44 cleavage
and CD44 mediated cell migration in glioblastoma xenograft cells.
Cell Signal. 2012;24(2):549–59.
28. Wick W, Platten M, Weller M. Glioma cell invasion: regulation of
metalloproteinase activity by TGF-b. J Neuro-Oncol. 2001;53:
177–185.
29. Fowler A, Thomson D, Giles K, et al. miR-124a is frequently down-
regulated in glioblastoma and is involved in migration and invasion.
Eur J Cancer. 2011;47(6):953–63.
30. Taylor TE, Furnari FB, Cavenee WK. Targeting EGFR for treatment of
glioblastoma: molecular basis to overcome resistance. Curr Cancer
Drug Targets. 2012;12(3):197–209.
31. Collen A, Hanemaaijer R, Lupu F, Quax PH, et al. Membrane-type matrix
metalloproteinase-mediated angiogenesis in a fibrin-collagen matrix.
Blood. 2003;101(5):1810–7.
32. Flynn JR, Wang L, Gillespie DL, et al. Hypoxia-regulated protein
expression, patient characteristics, and preoperative imaging as predictors
of survival in adults with glioblastoma multiforme. Cancer. 2008;113(5):
1032–1042.
33. Gillespie DL, Flynn JR, Ragel BT, et al. Silencing of HIF-1alpha by RNA
interference in human glioma cells in vitro and in vivo. Methods Mol
Biol. 2009;487:283–301.
34. Ragel BT, Couldwell WT, Gillespie DL, Jensen RL. Identification of
hypoxia-induced genes in a malignant glioma cell line (U-251) by
cDNA microarray analysis. Neurosurg Rev. 2007;30(3):181–187;
discussion 187.
35. Gillespie DL, Whang K, Ragel BT, Flynn JR, Kelly DA, Jensen RL. Silencing
of hypoxia inducible factor-1alpha by RNA interference attenuates
human glioma cell growth in vivo. Clin Cancer Res. 2007;13(8):
2441–2448.
36. Rong Y, Hu F, Huang R, et al. Early growth response gene-1 regulates
hypoxia-induced expression of tissue factor in glioblastoma multiforme
through hypoxia-inducible factor-1-independent mechanisms. Cancer
Res. 2006;66(14):7067–7074.
37. Jensen RL. Hypoxia in the tumorigenesis of gliomas and as a potential
target for therapeutic measures. Neurosurg Focus. 2006;20(4):E24.
38. Jensen RL, Ragel BT, Whang K, Gillespie D. Inhibition of hypoxia
inducible factor-1alpha (HIF-1alpha) decreases vascular endothelial
growth factor (VEGF) secretion and tumor growth in malignant gliomas.
J Neurooncol. 2006;78(3):233–247.
39. Dickinson RE, Dallol A, Bieche I, et al. Epigenetic inactivation of SLIT3
and SLIT1 genes in human cancers. Br J Cancer. 2004;91(12):
2071–2078.
40. Davidson B, Stavnes HT, Holth A, et al. Gene expression signatures
differentiate ovarian/peritoneal serous carcinoma from breast carcinoma
in effusions. J Cell Mol Med. 2011;15(3):535–544.
41. Gyorffy B, Dietel M, Fekete T, Lage H. A snapshot of microarray-
generated gene expression signatures associated with ovarian carcinoma.
Int J Gynecol Cancer. 2008;18(6):1215–1233.
42. Kobel M, Kalloger SE, Boyd N, et al. Ovarian carcinoma subtypes are
different diseases: implications for biomarker studies. PLoS Med.
2008;5(12):e232.
43. Pyle-Chenault RA, Stolk JA, Molesh DA, et al. VSGP/F-spondin: a new
ovarian cancer marker. Tumour Biol. 2005;26(5):245–257.
44. Lin ZY, Chuang WL. Genes responsible for the characteristics of primary
cultured invasive phenotype hepatocellular carcinoma cells. Biomed
Pharmacother. 2012;66(6):454–458.
45. Cheng YY, Jin H, Liu X, et al. Fibulin 1 is downregulated through
promoter hypermethylation in gastric cancer. Br J Cancer. 2008;99(12):
2083–2087.
46. Pupa SM, Argraves WS, Forti S, et al. Immunological and pathobiological
roles of fibulin-1 in breast cancer. Oncogene. 2004;23(12):2153–2160.
47. Wen Y, Giardina SF, Hamming D, et al. GROalpha is highly expressed in
adenocarcinoma of the colon and down-regulates fibulin-1. Clin Cancer
Res. 2006;12(20 Pt 1):5951–5959.
48. Wlazlinski A, Engers R, Hoffmann MJ, et al. Downregulation of several
fibulin genes in prostate cancer. Prostate. 2007;67(16):1770–1780.
49. Kanda M, Nomoto S, Okamura Y, et al. Promoter hypermethylation of
fibulin 1 gene is associated with tumor progression in hepatocellular
carcinoma. Mol Carcinog. 2011;50(8):571–579.
50. Medioni C, Bertrand N, Mesbah K, et al. Expression of Slit and Robo genes
in the developing mouse heart. Dev Dyn. 2010;239(12):3303–3311.
51. Katoh Y, Katoh M. Comparative genomics on SLIT1, SLIT2, and SLIT3
orthologs. Onco. Rep. 2005;14(5):1351–1355.
52. Holl EK, Roney KE, Allen IC, et al. Plexin-B2 and Plexin-D1 in dendritic
cells: expression and IL-12/IL-23p40 production. PLoS One. 2012;7(8):
e43333.
53. Roney KE, O’Connor BP, Wen H, et al. Plexin-B2 negatively regulates mac-
rophagemotility,Rac,andCdc42activation.PLoSOne.2011;6(9):e24795.
54. Argast GM, Croy CH, Couts KL, et al. Plexin B1 is repressed by oncogenic
B-Raf signaling and functions as a tumor suppressor in melanoma cells.
Oncogene. 2009;28(30):2697–2709.
55. Conrotto P, Corso S, Gamberini S, Comoglio PM, Giordano S. Interplay
between scatter factor receptors and B plexins controls invasive growth.
Oncogene. 2004;23(30):5131–5137.
56. Basile JR, Barac A, Zhu T, Guan KL, Gutkind JS. Class IV semaphorins
promote angiogenesis by stimulating Rho-initiated pathways through
plexin-B. Cancer Res. 2004;64(15):5212–5224.
57. ZhangZ,XuX,Zhang Y,Zhou J,YuZ,HeC.LINGO-1 interactswithWNK1
to regulate nogo-induced inhibition of neurite extension. J Biol Chem.
2009;284(23):15717–15728.
58. Loov C, Fernqvist M, Walmsley A, Marklund N, Erlandsson A.
Neutralization of LINGO-1 during in vitro differentiation of neural
stem cells results in proliferation of immature neurons. PLoS One.
2012;7(1):e29771.
59. Stein T, Walmsley AR. The leucine-rich repeats of LINGO-1 are not
required for self-interaction or interaction with the amyloid precursor
protein. Neurosci Lett. 2012;509(1):9–12.
60. Pepinsky RB, Shao Z, Ji B, et al. Exposure levels of anti-LINGO-1 Li81
antibody in the central nervous system and dose-efficacy relationships
in rat spinal cord remyelination models after systemic administration.
J Pharmacol Exp Ther. 2011;339(2):519–529.
Towner et al.: Bioinformatics-predicted biomarkers for gliomas
1634 NEURO-ONCOLOGY † D E C E M B E R 2 0 1 3
at University of O
klahoma on A
pril 15, 2014http://neuro-oncology.oxfordjournals.org/
Dow
nloaded from