Can Failure of Vascular Access for Hemodialysis be Predicted ...
130
University of Calgary PRISM: University of Calgary's Digital Repository Graduate Studies Legacy Theses 2008 Can Failure of Vascular Access for Hemodialysis be Predicted by the Initial Blood Flow Measurement? Monroy-Cuadros, Felix Mauricio Monroy-Cuadros, F. M. (2008). Can Failure of Vascular Access for Hemodialysis be Predicted by the Initial Blood Flow Measurement? (Unpublished master's thesis). University of Calgary, Calgary, AB. doi:10.11575/PRISM/23076 http://hdl.handle.net/1880/46851 master thesis University of Calgary graduate students retain copyright ownership and moral rights for their thesis. You may use this material in any way that is permitted by the Copyright Act or through licensing that has been assigned to the document. For uses that are not allowable under copyright legislation or licensing, you are required to seek permission. Downloaded from PRISM: https://prism.ucalgary.ca
-
Upload
khangminh22 -
Category
Documents
-
view
1 -
download
0
Transcript of Can Failure of Vascular Access for Hemodialysis be Predicted ...

University of Calgary
PRISM: University of Calgary's Digital Repository
Graduate Studies Legacy Theses
2008
Can Failure of Vascular Access for Hemodialysis be
Predicted by the Initial Blood Flow Measurement?
Monroy-Cuadros, Felix Mauricio
Monroy-Cuadros, F. M. (2008). Can Failure of Vascular Access for Hemodialysis be Predicted by
the Initial Blood Flow Measurement? (Unpublished master's thesis). University of Calgary,
Calgary, AB. doi:10.11575/PRISM/23076
http://hdl.handle.net/1880/46851
master thesis
University of Calgary graduate students retain copyright ownership and moral rights for their
thesis. You may use this material in any way that is permitted by the Copyright Act or through
licensing that has been assigned to the document. For uses that are not allowable under
copyright legislation or licensing, you are required to seek permission.
Downloaded from PRISM: https://prism.ucalgary.ca

UNIVERSITY OF CALGARY
Can Failure of Vascular Access for Hemodialysis be Predicted by the Initial Blood Flow
Measurement?
by
Felix Mauricio Monroy-Cuadros
A THESIS
SUBMITTED TO THE FACULTY OF GRADUATE STUDIES
IN PARTIAL FULFILMENT OF THE REQUIREMENTS FOR THE
DEGREE OF MASTER OF SCIENCE
Department of Community Health Sciences
CALGARY, ALBERTA
December, 2008
© Felix Mauricio Monroy-Cuadros
2008

The author of this thesis has granted the University of Calgary a non-exclusive license to reproduce and distribute copies of this thesis to users of the University of Calgary Archives. Copyright remains with the author. Theses and dissertations available in the University of Calgary Institutional Repository are solely for the purpose of private study and research. They may not be copied or reproduced, except as permitted by copyright laws, without written authority of the copyright owner. Any commercial use or publication is strictly prohibited. The original Partial Copyright License attesting to these terms and signed by the author of this thesis may be found in the original print version of the thesis, held by the University of Calgary Archives. The thesis approval page signed by the examining committee may also be found in the original print version of the thesis held in the University of Calgary Archives. Please contact the University of Calgary Archives for further information, E-mail: [email protected]: (403) 220-7271 Website: http://www.ucalgary.ca/archives/

ii
Abstract
Background: Clinical practice guidelines have supported vascular access surveillance
programmes on the premise that the natural history of the vascular access will be altered
by radiological or surgical interventions after vascular access dysfunction is detected. The
primary objective of this study was to determine if the initial intra-access blood flow
measurement predict the subsequent vascular access failure.
Methods: This was a retrospective study of all chronic hemodialysis patients followed by
the Southern Alberta Renal Program (SARP) from January 1, 2002 to June 30, 2005. All
patients had an initial intra-access blood flow measurement performed within two weeks
after initial cannulation and successful use of the access for hemodialysis. All vascular
access blood flow measurements were performed in a standardized fashion by using the
ultrasound dilution technique. Mixed models were used to explore the relationship
between initial blood flow and a group of independent variables, including age, sex,
underlying disease, comorbidities, type and location of the procedure and surgeon.
Results: Eight hundred thirty one arteriovenous fistulae and three hundred fifty nine
prosthetic grafts were available for evaluation. The primary failure was 10% for patients
with fistulae and 30% for patients with prosthetic grafts. Multivariable analysis found
that older age (>65 years OR 3.6, p < 0.001), history of diabetes (OR 2.3, p = 0.007),
history of smoking (OR 4.3, p < 0.001), the presence of forearm fistulas (OR 4.0, p <
0.001), and low initial intra-access blood flow (<500 ml/min, OR 29, p < 0.001) were
independently associated with vascular access failure in this cohort of patients. In patients
with AVG a multivariable model found older age (>65 years OR 3.2, p < 0.001), history

iii
of diabetes (OR 3.5, p < 0.001), history of peripheral vascular disease (OR 2.5, p <
0.005), and initial intra-access blood flow (< 650 ml/min, OR 31, p < 0.001) were
independently associated with vascular access failure.
Conclusion: This study produced findings to help identify a group of patients at high risk
of vascular access failure and for whom the current guidelines of access monitoring
(monthly) should be followed given the high incidence of vascular access failure.
However for the group of patients considered low risk these guidelines may be excessive.
Identification of this set of high risk patients provides valuable information for
physicians, patients and their families, and increased the efficacy of care in these high
risk patients. Knowledge of the long term outcomes following vascular access placement
in this high risk population has a great impact on health care. Also, health care system
cost may decrease if minimal surveillance is provided for patients in the low risk

iv
Acknowledgements
From the formative stages of this thesis, to the final draft, I owe an immense debt of
gratitude to my supervisor, Dr. Chip Doig. His sage advice, insightful criticisms, and
patient encouragement aided the writing of this thesis in innumerable ways. I would also
like to thank Linda Schenk who helped me with sorting the data, reviewing the patient
charts, and for editing support. Without her time and cooperation, this project would not
have been possible.
To my colleagues, and co-workers, thank you for their moral support, the words of
encouragement and the tremendous amount of goodwill. My spirits were sustained by
their sympathy in the most frustrating moments of this pilgrimage, and by their sharing of
my joy (relief?) whenever I completed a chapter.
Last but not least, thank you to Luisa Fernanda and Daniel for their support of my study.
Without the stability and security provided by their love and encouragement, this study
would not have been completed.
For her efforts and assistance, a special thanks to Deirdre Hennessy.
To each of the above, I extend my deepest appreciation.

v
Table of Contents
Abstract ............................................................................................................................... ii
Acknowledgements ............................................................................................................ iv
Table of Contents .................................................................................................................v
List of Tables .................................................................................................................... vii
List of Figures and Illustrations ....................................................................................... viii
List of Symbols, Abbreviations, and Nomenclature .......................................................... ix
CHAPTER ONE: THE RESEARCH PROBLEM ..............................................................1
1.1 Introduction ................................................................................................................1
1.2 Gaps in the Knowledge ..............................................................................................4
1.3 Purpose of the Study ..................................................................................................4
1.4 Research Question .....................................................................................................5
1.5 Significance of this Study ..........................................................................................5
CHAPTER TWO: LITERATURE REVIEW ......................................................................6
2.1 Definition and Etiology of Chronic Kidney Disease .................................................6
2.2 Physiopathology of CKD Progression .......................................................................8
2.3 Classification .............................................................................................................8
2.4 Prevalence of CKD ..................................................................................................10
2.5 Risk factor for progression of CKD to ESRD .........................................................10
2.5.1 Hypertension ....................................................................................................10
2.5.2 Diabetes mellitus .............................................................................................11
2.5.3 Cardiovascular disease ....................................................................................11
2.5.4 Hyperlipedimia ................................................................................................12
2.5.5 Smoking ...........................................................................................................12
2.5.6 Obesity .............................................................................................................12
2.5.7 Proteinuria/microalbuminuria ..........................................................................13
2.5.8 Family history ..................................................................................................13
2.6 Impact of Chronic Kidney Disease on Patient Survival ..........................................14
2.7 Causes of Death .......................................................................................................14
2.8 Treatment of Irreversible Renal Insufficiency .........................................................15
2.8.1 Peritoneal dialysis ............................................................................................15
2.8.2 Hemodialysis ...................................................................................................17
2.9 Vascular Access .......................................................................................................18
2.9.1 History of vascular access ...............................................................................18
2.9.2 Comparison of fistulae and grafts ....................................................................22
2.9.3 Determination of access maturity ....................................................................22
2.9.4 Patency/primary and secondary failure ...........................................................22
2.9.5 Complications of the vascular access ..............................................................23
2.10 Access Monitoring .................................................................................................29
2.11 Access Monitoring and Vascular Access Failure ..................................................32
CHAPTER THREE: METHODS ......................................................................................35
3.1 Study design ...........................................................................................................35

vi
3.2 Study population and sample .................................................................................35
3.2.1 Inclusion criteria ..............................................................................................36
3.2.2 Exclusion criteria .............................................................................................36
3.3 Data Collection ......................................................................................................37
3.4 Variables of Interest ...............................................................................................38
3.4.1 Outcome variable – Vascular access failure ....................................................38
3.4.2 Exposure variable – Initial IABF .....................................................................39
3.4.3 Socio-demographic variables ...........................................................................40
3.4.4 Clinical variables .............................................................................................40
3.4.5 Vascular access characteristics ........................................................................42
3.5 Data Analysis .........................................................................................................43
3.5.1 Initial data analysis ..........................................................................................43
3.5.2 Descriptive analysis .........................................................................................43
3.5.3 Hypothesis testing ............................................................................................44
3.6 Ethical Concerns ....................................................................................................46
CHAPTER FOUR: RESULTS ..........................................................................................47
4.1 AVFs ........................................................................................................................48
4.1.1 Vascular access failure ....................................................................................51
4.1.2 Relative risk for vascular access failure ..........................................................53
4.1.3 Stratified analysis ............................................................................................55
4.1.4 Multivariable modeling ...................................................................................57
4.1.5 Final model ......................................................................................................58
4.2 AVGs .......................................................................................................................61
4.2.1 Vascular access failure ....................................................................................62
4.2.2 Relative risk for vascular access failure ..........................................................65
4.2.3 Stratified analysis ............................................................................................67
4.2.4 Multivariable modeling ...................................................................................68
4.2.5 Final model ......................................................................................................69
CHAPTER FIVE: DISCUSSION ......................................................................................72
5.1 Initial IABF ..............................................................................................................72
5.2 Patient Characteristics ..............................................................................................73
5.2.1 Age ..................................................................................................................74
5.2.2 Gender .............................................................................................................75
5.2.3 Co-morbid illnesses .........................................................................................76
5.2.4 Smoking ...........................................................................................................77
5.3 Vascular Access Characteristics ..............................................................................77
5.4 Study Strengths ........................................................................................................78
5.5 Study Limitations .....................................................................................................80
5.6 Conclusions and Recommendations ........................................................................84
REFERENCES ..................................................................................................................87
APPENDIX 1: STUDY DEFINITIONS .........................................................................114
APPENDIX 2: ACCESS INFORMATION ABSTRACTION FORM ...........................118
vii
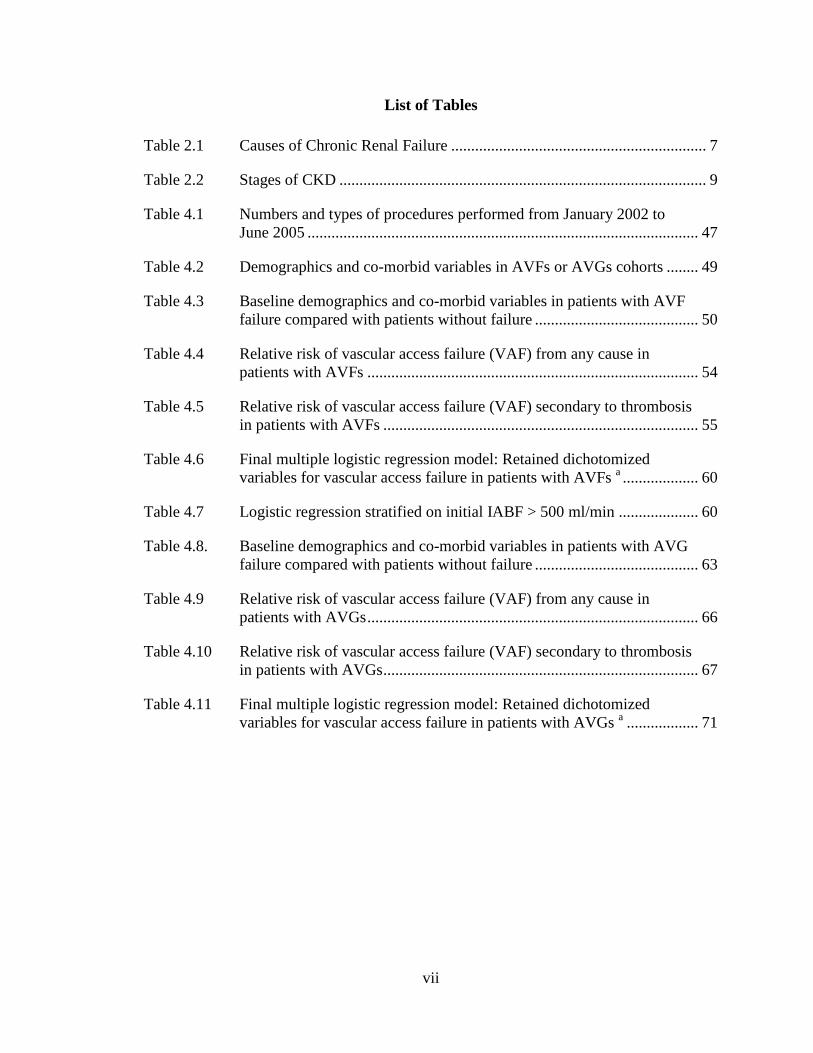
List of Tables
Table 2.1 Causes of Chronic Renal Failure ................................................................ 7
Table 2.2 Stages of CKD ............................................................................................ 9
Table 4.1 Numbers and types of procedures performed from January 2002 to
June 2005 .................................................................................................. 47
Table 4.2 Demographics and co-morbid variables in AVFs or AVGs cohorts ........ 49
Table 4.3 Baseline demographics and co-morbid variables in patients with AVF
failure compared with patients without failure ......................................... 50
Table 4.4 Relative risk of vascular access failure (VAF) from any cause in
patients with AVFs ................................................................................... 54
Table 4.5 Relative risk of vascular access failure (VAF) secondary to thrombosis
in patients with AVFs ............................................................................... 55
Table 4.6 Final multiple logistic regression model: Retained dichotomized
variables for vascular access failure in patients with AVFs a ................... 60
Table 4.7 Logistic regression stratified on initial IABF > 500 ml/min .................... 60
Table 4.8. Baseline demographics and co-morbid variables in patients with AVG
failure compared with patients without failure ......................................... 63
Table 4.9 Relative risk of vascular access failure (VAF) from any cause in
patients with AVGs ................................................................................... 66
Table 4.10 Relative risk of vascular access failure (VAF) secondary to thrombosis
in patients with AVGs ............................................................................... 67
Table 4.11 Final multiple logistic regression model: Retained dichotomized
variables for vascular access failure in patients with AVGs a .................. 71

viii
List of Figures and Illustrations
Fig. 2.1 Types of autogenous arteriovenous fistulas .............................................. 19
Fig. 2.2 Upperarm Loop graft ................................................................................ 20
Fig. 2.3 Transonic System Monitor Setup.............................................................. 31
Fig. 4.1 Age of patients with and without AVF failure.......................................... 52
Fig. 4.2 Initial IABF in patients with and without AVF failure ............................. 53
Fig. 4.3 Area under the Receiver Operating Characteristic Curve: Association
of vascular access failure and initial IABF for patients with AVFs ......... 58
Fig. 4.4 Age of patients with and without AVG failure ......................................... 64
Fig. 4.5 Initial IABF in patients with and without AVG failure ............................ 65
Fig. 4.6 Area under the Receiver Operating Characteristic Curve: Association
of vascular access failure and initial IABF for patients with AVGs ......... 70
ix
List of Symbols, Abbreviations, and Nomenclature
Symbol Definition
AVF arteriovenous fistula
AVG arteriovenous graft
CAPD continuous ambulatory peritoneal dialysis
CKD chronic kidney disease
CI confidence interval
ESRD end-stage renal disease
GFR glomerular filtration rate
IABF intra-access blood flow
NKF-DOQI National Kidney Foundation Dialysis Outcomes Quality Initiative
NKF-K/DOQI National Kidney Foundation Kidney Disease Outcomes Quality Initiative
OR odds ratio
PTFE polytetrafluoroethylene
RRT renal replacement therapy
SARP Southern Alberta Renal Program
SD standard deviation
VAF vascular access failure

1
CHAPTER ONE: THE RESEARCH PROBLEM
1.1 Introduction
Chronic kidney disease (CKD) is the degree of irreversible loss of renal function that is
incompatible with life. CKD is a worldwide public health problem with increasing
prevalence, poor outcomes and high costs [1, 2]. During the last two decades, the United
States Renal Data System has documented an epidemic of CKD in the United States, and
similar increases in CKD incidence have been reported for other industrialized and
developing countries [3-9]. The epidemic is illustrated by the United States population
from 219 per million in 1991 to 334 per million persons in 2000, an increase of 51 %
during the decade [10]. Individuals aged 75 years and older have experienced the greatest
increase in incidence (98% over the last decade), attributable in part to improved survival
of individuals with cardiovascular disease and diabetes mellitus and expanded access to
renal replacement therapy (RRT) for older patients [11-13]. CKD incidence rates during
the same period also increased among younger Americans by 1% for those aged less than
20 years, 27% for individuals 20 to 44 years, 47% for those 45 to 64 years, and 48% for
those 65 to 74 years [10].
In patients with ESRD, death will occur without RRT. Hemodialysis is the most common
form of continuous RRT. The most recent data from the Canadian Organ Replacement
Register show that over 5000 new patients began RRT in 2004. This corresponds to an
annual incidence of about 1.5 new cases per 10000 population, or 5 cases per 10000 km

2
of the total landmass [13]. In the Southern Alberta Renal Program (SARP), there were
590 patients (454 per million) receiving hemodialysis by the end of 2002. CKD and end-
stage renal disease (ESRD) result from a large number of diseases that are either systemic
and damage the kidney or are intrinsic to the kidney. The most common causes of ESRD
are diabetes (44% of patients in 2004), hypertension (30%), and glomerulonephritis
(12%).
Because hemodialysis involves extracorporeal passage of the blood through the dialysis
equipment for 3-5 hours several times weekly, a critical requirement is repetitive, reliable
access to the circulation [14-21]. Vascular access has been called the ―Achilles heel‖ of
hemodialysis [22], because construction of these accesses and the management of
subsequent complications can be time-consuming and frustrating for both surgeons and
patients and expensive for the health care system. Ideally, access to the circulation should
meet three criteria: 1) it should be suitable for repeated use, 2) it should allow for a blood
flow suitable to conduct modern high-efficiency dialysis, and 3) the complication rate
should be minimal. Currently there are three types of hemodialysis vascular access: 1)
native arteriovenous fistulas (AVFs) 2) arteriovenous grafts (AVGs) and 3) central
venous catheters [14-21]. AVFs and AVGs are preferred over catheters for permanent
vascular access. These vascular access devices do an excellent job performing the first
two functions, but do have a substantial complication rate [14-17].
Complications of hemodialysis vascular access have emerged as a major cause of patient
morbidity and major cost to the end-stage renal disease program. Health care

3
organizations planning for a capitated environment estimate as much as 25% of the total
cost of the ESRD program may actually be spent on the maintenance of vascular access
[23-25]. Thus, maintenance of access to the circulation has emerged not only as a major
cause of patient morbidity, but is one of the single largest expenses in the care of ESRD
Hemodialysis access failure and morbidity have been carefully evaluated. The clinical
practice guidelines of The National Kidney Foundation Dialysis Outcomes Quality
Initiative (NKF-DOQI) [19, 26] support vascular access blood flow monitoring on the
premise that the natural history of the access will be altered by radiological or surgical
intervention if access dysfunction is detected.
The rationale for surveillance is grounded in what has been termed the ―dysfunction
hypothesis‖, which states that stenosis causes access dysfunction and this dysfunction
reliably precedes and accurately predicts vascular access failure [27]. Therefore, if a
particular surveillance technique is to be successful at predicting access failure, several
assumptions of this dysfunction hypothesis must be true. Specifically, the measurements
must be reproducible, stenosis should progress slowly enough so that there is time to
intervene before failure, and other factors outside of stenosis, such as hypercoagulability,
should not abrogate or appreciably confound the surveillance technique’s prediction of
thrombosis. An ideal access monitoring test would predict nearly all patients who will
develop vascular access failure, with a low false positive result. Most monitoring
techniques that have been developed rely on detecting hemodynamic dysfunction, usually
a reduction in blood flow.

4
1.2 Gaps in the Knowledge
Although the intra-access blood flow (IABF) has been identified as a reliable indicator of
short-term thrombosis and failure risk [17, 22], whether the initial blood flow measured
after the first successful cannulation and use of the vascular access is predictive of failure
has not been reported.
1.3 Purpose of the Study
The main objectives of this study are:
To explore the association between vascular access failure and initial IABF in
patients receiving chronic RRT with AVFs.
To explore the association between vascular access failure and the initial IABF
in patients receiving chronic RRT with AVGs.
Secondary objectives are:
To determine patient characteristics associated with vascular access failure in
patients with AVFs and AVGs.
To determine vascular access characteristics associated with vascular access
failure in patients with AVFs and AVGs

5
1.4 Research Question
This study was guided by the following research questions:
1. Can failure of vascular access for hemodialysis be predicted by the initial
IABF measurement?
2. Can the measurement of baseline IABF predict the subsequent failure of
AVFs or AVGs?
1.5 Significance of this Study
If the initial blood flow can be used as a predictor of access failure, then at-risk patients
could be more closely monitored to allow for early detection of dysfunction and for rapid
intervention. As well, patients not in the high risk group could be monitored less often,
thus reducing medical costs and increasing patient quality of life.

6
CHAPTER TWO: LITERATURE REVIEW
A search of several bibliographic search engines, including MEDLINE, EMBASE,
CINAHL, and PUBMED from their inception dates, was performed in January 2008
using the OVID interface. The search was done using the following MESH terms: kidney
disease, dialysis, arteriovenous fistulae, arteriovenous grafts, vascular access, vascular
access failure and thrombosis and access monitoring with the limitation of requiring an
abstract. After the inspection of the abstracts, the articles written in either English or
Spanish that seemed most relevant were selected for a more thorough examination.
Recent review articles were used to identify relevant articles in the area of CKD, ESRD,
hemodialysis vascular access, access failure and IABF measurement and monitoring. The
reference list of relevant articles and reviews retrieved was scrutinized to identify
additional studies.
2.1 Definition and Etiology of Chronic Kidney Disease
CKD is defined by the presence of sustained abnormalities of renal function and may
terminate in ESRD [28]. CKD has two characteristics. First, there is chronicity because
the kidney damage of CKD is rarely repaired and loss of function persists, unlike the
course of acute kidney failure. Second, loss of kidney function generates even more
kidney damage so that CKD progressively worsens, even if the disorder that caused it
becomes inactive. CKD has an important clinical and societal consequence of reduced
quality of life and reduced life expectancy.
7
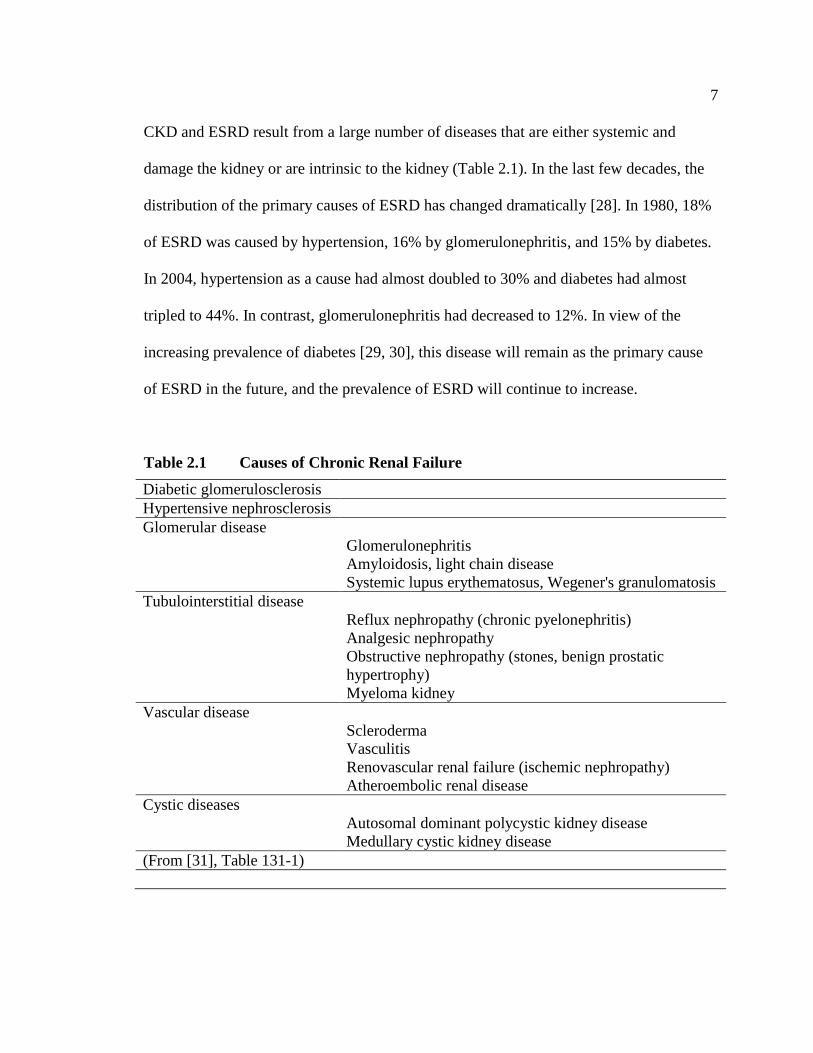
CKD and ESRD result from a large number of diseases that are either systemic and
damage the kidney or are intrinsic to the kidney (Table 2.1). In the last few decades, the
distribution of the primary causes of ESRD has changed dramatically [28]. In 1980, 18%
of ESRD was caused by hypertension, 16% by glomerulonephritis, and 15% by diabetes.
In 2004, hypertension as a cause had almost doubled to 30% and diabetes had almost
tripled to 44%. In contrast, glomerulonephritis had decreased to 12%. In view of the
increasing prevalence of diabetes [29, 30], this disease will remain as the primary cause
of ESRD in the future, and the prevalence of ESRD will continue to increase.
Table 2.1 Causes of Chronic Renal Failure
Diabetic glomerulosclerosis
Hypertensive nephrosclerosis
Glomerular disease
Glomerulonephritis
Amyloidosis, light chain disease
Systemic lupus erythematosus, Wegener's granulomatosis
Tubulointerstitial disease
Reflux nephropathy (chronic pyelonephritis)
Analgesic nephropathy
Obstructive nephropathy (stones, benign prostatic
hypertrophy)
Myeloma kidney
Vascular disease
Scleroderma
Vasculitis
Renovascular renal failure (ischemic nephropathy)
Atheroembolic renal disease
Cystic diseases
Autosomal dominant polycystic kidney disease
Medullary cystic kidney disease
(From [31], Table 131-1)

8
2.2 Physiopathology of CKD Progression
Despite the many diseases that can initiate kidney injury, three common pathways are
responsible for the progression of kidney disease [30]. First, as a consequence of the
initial kidney injury, the remaining nephrons compensate for the reduction in nephron
mass by increasing the single nephron filtration rate [30, 32-35]. Elevated glomerular
pressures drive this hyperfiltration. Glomerular hyperfiltration has initial adaptive effects
by maintaining the glomerular filtration rate (GFR), but may subsequently lead to
progressive glomerular injury and ultimately ESRD. Second, abnormal glomerular
permeability is common in glomerular disorders with proteinuria being the clinical
consequence. Evidence has accumulated that proteinuria might be a factor in causing
tubulointerstitial injury, which is a prime risk factor for subsequent progression in all
forms of glomerular diseases studied [30, 36]. Third, a direct consequence of the renal
injury is a syndrome characterized by hypertension, anemia, renal bone disease,
nutritional impairment, neuropathy, impaired quality of life, and reduced life expectancy.
At least some of these clinical consequences, such as hypertension, may further impair
renal function.
2.3 Classification
The National Kidney Foundation Kidney Disease Outcomes Quality Initiative (NKF-
K/DOQI) proposed a definition and classification scheme for CDK in 2002 [28] that has
since been widely adopted both within and outside of the United States and Canada [37-

9
41]. The NKF-K/DOQI guidelines define CKD on the basis of kidney damage and/or
reduced kidney function. Kidney damage may be confirmed through a variety of methods
including histologic evidence of kidney disease, abnormalities in the composition of
blood or urine, or abnormal findings on renal imaging. Reduced kidney function is
defined by a GFR below 60 ml/min/1.72 m2 body surface area for at least 3 months [28]
or by evidence of kidney damage with an abnormal GRF. A cutoff GFR of 60
ml/min/1.73 was selected because it represented a decrement of approximately half of
normal renal function and because its use avoided the classification of many older
individuals who may have a mild reduction in their GFR [42].
The NKF-K/DOQI classification defines five stages of CKD with increasing degree of
impaired kidney function (Table 2.2). At each stage, patients can benefit from measures
that delay or prevent the progressive loss of renal function, modification of medications
with renal clearance, avoidance of nephrotoxins, and reduction of cardiovascular risk
factors [43, 44]. Patients who advance to CKD stage 3 require increased attention to
control hypertension, anemia, renal bone disease, and nutrition. Recognition and early
referral of patients who advance to stage 4 and 5 is important for appropriate initiation of
RRT [43, 45-59].
Table 2.2 Stages of CKD
Stage Description GFR (mL/min/1.73m²)
1 Kidney damage with normal or increased GFR ≥ 90
2 Kidney damage with mild decreased GFR 60 - 89
3 Moderate decreased GFR 30 - 59
4 Severe decreased GRF 15 - 29
5 Kidney failure < 15 (or dialysis)
(From [31, 60, 61])

10
2.4 Prevalence of CKD
Using the NKF-K/DOQI schema, the estimated prevalence of each stage of CKD in the
United States is stage 1, 3.3% (5.9 million individuals); stage 2, 3% (5.3 million); stage 3,
4.3% (7.6 million); and stage 4, 0.2% (4 million) [60, 62-64]. Canadian prevalence rates
using this schema are not specifically available, but it is estimated that prevalence rates
are about 1/10th
of rates in the United States (based on the size of the national
populations). The prevalence of CKD increases with age and is higher among individuals
with hypertension and diabetes and may be associated with the presence of
cardiovascular disease.
2.5 Risk factor for progression of CKD to ESRD
There are a number of risk factors in patients with CKD that are considered to be a high
risk for developing ESRD: 1) patients with hypertension, 2) patients with diabetes
mellitus, 3) patients with cardiovascular disease, and 4) hyperlipidemia, 5) smoking, 6)
obesity, 7) proteinuria/microalbuminuria and 8) family members of incident ESRD
patients [65]. The first six risk factors may also be risk factors associated with vascular
access failure in patients on hemodialysis.
2.5.1 Hypertension
Hypertension is the second most common cause of ESRD in the United States and
Canada, accounting for 23% of incident ESRD patients between 1996 and 2000 [28].

11
Hypertension is also an important modifiable risk factor for progressive CKD, regardless
of the initial cause of kidney injury. Observational studies have established that patients
with hypertension are at high risk for progressive renal insufficiency, and this risk is not
unique to patients with malignant or accelerated hypertension [65-69]. Evidence from
clinical trials shows that blood pressure reduction reduces the rate of loss of renal
function and progression to renal failure, and this information has been incorporated into
clinical practice guidelines [70-78].
2.5.2 Diabetes mellitus
Diabetes mellitus is the most common cause of ESRD, accounting for nearly 45% of all
new cases of ESRD between 1996 and 2000 [28, 64] Diabetes as a cause of ESRD is
increasing at a 10% per year rate, and if sustained, the number of patients with diabetes-
caused ESRD will double within 7 years. Strict control of hyperglycemia reduces the rate
of loss of renal function and progression to renal failure among patients with both type 1
and type 2 diabetes mellitus [79-83].
2.5.3 Cardiovascular disease
Cardiovascular disease, being present at baseline in a Canadian cohort of patients in
different stages of CKD, increased the probability of progression to ESRD by 50% [84].
Patients undergoing coronary angiography, patients treated with percutaneous coronary
interventions and coronary artery bypass surgery, and participant in clinical trials of
atherosclerotic disease are at increased risk of CKD [84-101]. Patients with heart failure
have decreased kidney perfusion. Patients with atherosclerotic coronary artery disease

12
have a higher prevalence of renovascular atherosclerosis, and there is a correlation
between extent of atherosclerosis and degree of glomerular scaring [102, 103]. The
prevalence of glomerulosclerosis is higher in patients with moderate to severe
atherosclerosis (15%) compared with individuals with mild disease (8%).
2.5.4 Hyperlipidemia
Hyperlipidemia has been associated with a two-fold increase risk of developing CKD,
and may be associated with CKD progression [104-108]. Hyperlipidemia is also a risk
factor for cardiovascular disease. Lipid-lowering therapy may be directly renoprotective
or protective by modifying cardiovascular effects on renal function.
2.5.5 Smoking
Smoking is a risk factor for genitourinary disease, including cancer, proteinuria and CKD
[109, 110]. Patients with previous or current history of smoking have three-fold increased
risk of proteinuria [111, 112]. Recent observational studies have reported that smoking
cessation is associated with reduced risk of progressive renal injury [111, 113].
2.5.6 Obesity
The emergence of obesity as a growing public health problem has led to its investigation
as a risk factor for kidney disease. Obesity, defined as body mass index >30 kg/m2, is
associated with higher risk for the development of proteinuria and reduced kidney
function [114, 115]. Obesity also appears to predispose the development of focal

13
segmental glomerulosclerosis [116]. Several studies have suggested a benefit of weight
loss on preserving kidney function in obese patients [117-121].
2.5.7 Proteinuria/microalbuminuria
There is abundant evidence in support of a strong and independent association between
microalbuminuria and cardiovascular disease. The presence and degree of proteinuria are
strong risk factors for progressive kidney disease in both diabetic and non-diabetic kidney
disease patients [122-125]. Higher levels of urine protein excretion increase the risk of
progressive kidney disease by nearly six-fold for each 1 g/d higher protein excretion
[125].
2.5.8 Family history
Family history was first reported as a risk factor for ESRD by Ferguson et al. [126], who
noted that a family history of first-or second-degree relative with CKD was reported by
26% of prevalent ESRD patients compared to 11% of community controls. There are
several hereditary kidney diseases that follow specific inheritance patterns and are due to
single gene mutations. Although the majority of kidney diseases are not associated with
identifiable genetic defects, the presence of familial aggregation of kidney disease
suggests a multi-factorial etiology involving a genetic component with regard to
susceptibility [127-129]

14
2.6 Impact of Chronic Kidney Disease on Patient Survival
According to the United States Renal Data System report, once RRT is initiated, the
range of the expected remaining life span is 7 to 11 years (varies with race) for dialysis
patients aged 40 to 44, and 4 to 6 years for those 60 to 64 years of age [130, 131]. These
values are only slightly better than those for patients with lung cancer and are much
worse than in the general population (30 to 40 years for those aged 40 to 44, and 15 to 23
years for individuals aged 60 to 64).
It is well established that inadequate dialysis is a contributor to lower overall survival.
This has important implications because more intensive dialysis, particularly above a
certain threshold value, may improve survival.
2.7 Causes of Death
For patients undergoing dialysis cardiac causes combined account for 48% of all deaths.
Infection, cerebrovascular disease, and malignancy account for 15%, 6% and 4%
respectively [132-135]. The predominant cause of cardiac death was sudden death,
accounting for 39% of all deaths, followed by acute myocardial infarction (24%),
cardiomyopathy (10%), and atherosclerotic heart disease (9%). The high prevalence of
both coronary artery disease and left ventricular hypertrophy contributed to these cardiac
deaths.

15
Disruption of the skin barrier by the vascular access in hemodialysis patients and the
peritoneal catheter in peritoneal dialysis patients are factors which are partly responsible
for the high risk of death due to infection. Septicemia due to the vascular access and
peritonitis is responsible for 8% of the deaths [135]. In addition, there is evidence that
patients with ESRD have defects in cellular immunity, neutrophil function, and
complement activation.
2.8 Treatment of Irreversible Renal Insufficiency
Unlike other forms of end-stage organ failure, ESRD is unique in having three modalities
of therapy: 1) hemodialysis, 2) peritoneal dialysis, and 3) renal transplantation. Each
form of RRT has its unique risks and benefits. All three modalities of RRT have evolved
significantly over the last four decades. Although this thesis will focus on patients
receiving hemodialysis, for completeness, a short review of the other major modality of
dialysis is included.
2.8.1 Peritoneal dialysis
This procedure uses the patient’s own peritoneal membrane for removal of waste
products and fluid. During peritoneal dialysis, 2 to 3 L of dialysate solution, containing
electrolytes in physiologic concentrations and varying concentrations of glucose, is
instilled into the peritoneal cavity via a peritoneal catheter. After a specified dwell time,
varying between 3 and 6 hours per exchange, the fluid is drained and the process is
repeated. The removal of solute from the body depends on the development of a

16
concentration gradient between the blood and peritoneal fluid and occurs by diffusion
across the peritoneal membrane. Osmotic ultrafiltration is achieved by the addition of
increasing concentrations of glucose to the dialysate solution. The osmotic pressure
generated by the glucose draws water from the extra-cellular fluid and tissues into the
peritoneal fluid. More than 20% of patients with ESRD in the United States and more
than 50% in the United Kingdom are receiving continuous ambulatory peritoneal dialysis
(CAPD). CAPD offers a number of potential advantages: 1) there is no need for vascular
access, a major challenge in diabetic patients, young children, and patients with severe
vascular disease; 2) it can be performed without anticoagulation, decreasing the potential
risk of bleeding; 3) because it is a slow, continuous process, it avoids the marked
hemodynamic and osmotic shifts associated with hemodialysis; and 4) there are quality of
life advantages because of independence from hemodialysis machines.
Despite these advantages, there are disadvantages to CAPD, of which infection is the
most important and represents the most frequent cause for discontinuation of therapy.
Other complications include mechanical problems including catheter malfunction,
catheter migration, and abdominal hernias due to increased intra-abdominal pressure with
large volumes of dialysate. A number of metabolic complications may also occur,
including hyperglycemia and hypertriglyceridemia from high glucose loads, weight gain,
and protein loss.

17
2.8.2 Hemodialysis
Hemodialysis is the most common form of RRT used in the SARP for ESRD. Kolff first
employed hemodialysis in the late 1940s for the treatment of acute renal failure. The
development of vascular access by Scribner in the early 1960s enabled the use of
hemodialysis as an ongoing therapy for ESRD. However, it was not until 1973, when the
United States Congress recognized ESRD as a catastrophic illness and approved
Medicare funding for hemodialysis patients, that hemodialysis achieved widespread
availability. In the United States, more than 200,000 individuals are on hemodialysis, a
point of prevalence of 731 subjects per million population. Because hemodialysis
involves extracorporeal passage of the blood through the dialysis equipment for 3-5
hours, several times weekly, a critical requirement is repetitive, reliable access to the
circulation [20, 21, 136-140].
Vascular access has been called the ―Achilles heel‖ of hemodialysis [137, 141], because
construction of these accesses and the management of subsequent complications can be
time-consuming, frustrating for both surgeons and patients, and costly for the health care
system. Ideally, access to the circulation should meet three criteria: 1) it should be
suitable for repeated cannulation, 2) it should allow for a blood flow suitable to conduct
modern high-efficiency dialysis, and 3) the complication rate should be minimal.

18
2.9 Vascular Access
2.9.1 History of vascular access
―As we did not know at all how our first patient would react to the dialysis we started
with repeatedly dialyzing small proportions of blood. In the end we succeeded in keeping
the percentage of urea at the same level for 26 days, after that no serviceable veins were
available‖ [142]. The 29-year-old female patient suffering from malignant hypertension
died 1 week after her last dialysis treatment. This text fragment by Willem Kolff and co-
workers, published in 1944, was not only part of the first report of successful
hemodialysis treatment in humans, it also describe the crucial importance of an adequate
access to the blood circuit that is required for chronic hemodialysis.
It took another 16 years before Quinton and Scribner introduced the first permanent
vascular access: the Scribner shunt [143]. This device consisted of 2 Teflon tubes
connecting the patient to the dialyser; one tube was inserted into a suitable peripheral
artery and one into a suitable vein. After treatment, the circulatory access was kept open
by connecting the two tubes outside the body using a small U-shaped Silastic device over
a stainless steel plate. The major disadvantages of Scribner shunts were high thrombosis
rate and infection rates, resulting in a limited shunt and hence patient life span.
In 1966, Brescia and Cimino solved the blood access problem with a surgically created
AVF between the radial artery and a vein [144]. This new vascular access was able to
deliver flow rates of 250-300 mL/min for unlimited intervals. Results were satisfactory:

19
13 AVFs (87%) functioned without any complication and two failed before cannulation.
The patients were relatively young, and all but one had chronic glomerulonephritis as
primary diagnosis for renal failure [144]. Nowadays, the Brescia-Cimino (radio-cephalic)
AVF is still the preferred type of vascular access [139, 140]. Other common native
variations are brachio-cephalic, brachio-basilic, and perforating vein AVFs in the elbow
and upperarm [138, 140].
Fig. 2.1 Types of autogenous arteriovenous fistulas
(From [145], p. 344)
Due to inclusion of overweight and obese ESRD patients as well as ESRD patients with
insufficiently sized or stenotic vessels, AVF creation did not always result in a vascular

20
access with sufficient access blood flow for efficient hemodialysis treatment. Hence, the
AVG was introduced in order to create an artificial conduit for cannulation. Saphenous
vein grafts, bovine heterografts, homologous vein grafts and human umbilical vein grafts
have all been used for hemodialysis purposes in the past [146]. However, the expanded
polytetrafluoroethylene (PTFE) graft, introduced in 1973 [147], is the most widely used
graft today [146]. Alternative synthetic materials such as plasma tetrafluoroethylene or
polyurethane have not proven to be superior to PTFE [146]. The 2006 NKF-DOQI
working group recommended a graft either of synthetic or biological material [140]. The
graft can be straight or looped with a diameter ranges between 4 and 8 mm. Grafts can be
modified to be tapered [148], thin walled [149], and reinforced [150].
Fig. 2.2 Upperarm Loop graft
(Modified from [151])

21
Common graft locations are straight forearm (radial artery to cephalic vein), looped
forearm (brachial artery to cephalic vein), straight upper arm (brachial artery to axillary
vein), or looped upper arm (axillary artery to axillary vein). The 2006 NKF-DOQI
working group prefers a forearm loop graft, rather that a straight configuration [140]. Leg
grafts, looped chest grafts, axillary-axillary (necklace), and axillary-atrial grafts have also
been constructed [152]. In the 2005 Canadian and 2006 United States guidelines, the
recommended permanent vascular access are, in order of preference, the wrist (radio-
cephalic) fistula [139, 140], the elbow (brachio-cephalic) fistula, the transposed brachial-
basilic fistula [140], followed by forearm loop grafts, upper arm grafts or, if all upper arm
sites are exhausted, chest wall or leg grafts [140]. Use of long term central venous
catheters is discouraged.
Tunneled cuffed catheters are dual lumen catheters usually composed of silicone or
polyurethane composites. The composites are softer than polyurethane, but are stronger
than silicone. These catheters are most commonly placed in the internal jugular vein with
the tip in the right atrium, and then tunneled superficially to exit on the upper anterior
chest. Right-sided catheters malfunction less than left-sided catheters, and subclavian
catheters are avoided to prevent subclavian stenosis [140]. AVFs and AVGs are preferred
over catheters for permanent vascular access. Catheters are often used as temporary
access while awaiting surgical construction or modification of a fistula or graft, or as a
permanent access if surgical accesses are not possible.

22
2.9.2 Comparison of fistulae and grafts
Fistulae and grafts differ according to failure rates, determination of access maturity,
patency, complications, and peri-operative morbidity. Fistulas are preferred to grafts
because of higher long-term patency rates, and lower rate of complications [140].
2.9.3 Determination of access maturity
Although some fistulas mature within weeks, others require up to 6 months before they
provide reliable hemodialysis access. One empiric measure of maturity, the time to first
cannulation, appears to vary significantly by country, with nearly 30 days being the
median period for Japan and Italy, and almost 100 days for the United States and United
Kingdom [153-155]. Grafts can be cannulated for hemodialysis earlier than fistulas.
Grafts can usually be cannulated within weeks, and some centers have successfully
cannulated grafts within days of surgery [156].
2.9.4 Patency/primary and secondary failure
Fistulas are more likely than grafts to experience primary failure, defined as an access
that does not provide reliable hemodialysis. The primary failure rates of radio-cephalic,
brachio-cephalic, and brachio-basilic fistulas are approximately 24-35%, 9-12% and 29-
36%, respectively [153, 154]. The risk of primary failure is increased in wrist fistulae and
in patients who are older, obese, nonwhite, female, diabetic, and/or have peripheral
vascular or cardiovascular disease [153, 154].The primary failure rates are 0-13% and 0-
3% for forearm and upperarm grafts, respectively [157, 158]. The lower risk of primary

23
failure with grafts is offset by the increased risk of complications and secondary failure
over time.
Although native fistulas have a high rate of primary failure, their long-term patency is
superior because the risk of secondary failure is low. A radio-cephalic fistula that matures
may function for up to 20 years. The 5-year and 10–year cumulative patencies for radio-
cephalic fistulas are reported to be 53% and 45%, respectively [153, 159]. By
comparison, cumulative patency for PTFE grafts at one, two, and four years is
approximately 67%, 50% and 43%, respectively [160]. In general, PTFE forearm grafts
have lower cumulative patency than upper arm grafts.
2.9.5 Complications of the vascular access
Neither fistulas nor grafts are physiological. The vascular remodeling and adaptation to
high-flow conditions, as well as the effects of repeated cannulation, play a pivotal role in
causing complications such as thrombosis, aneurysm formation, infection, ischemic
changes, venous hypertension, neuropathy, and cardiovascular problems [136, 161].
Complications of hemodialysis vascular access have emerged as both a major cause of
patient morbidity and as a major cost to ESRD programs, the latter accounting for up to
25% of all hospital stays and up to 50% of the first year hemodialysis cost. In its latest
report, the United States Renal Data System estimated that the cost for access morbidity
approaches US$ 8000 per patient per year. Health care organizations planning for a
capitated environment estimate that as much as 25% of the total cost of the ESRD
program may actually be spent on the maintenance of vascular access. Problems with

24
vascular access are also a major contributor to inadequate hemodialysis [15, 16]. In an
analysis of North American dialysis patients in the year 2000, approximately 14% did not
receive adequate dialysis, mostly because of low flow rates from access dysfunction.
Inadequate dialysis leads to increased morbidity and mortality, decreased quality of life,
and increased healthcare costs, with extended dialysis times. Thus, maintenance of access
to the circulation has emerged as a major cause of patient morbidity, and as one of the
single largest expenses in the American and Canadian ESRD systems.
Chronic hemodialysis access complications include thrombosis, infection, aneurysm and
pseudo-aneurysm formation, distal ischemia, venous hypertension, heart failure, median
nerve injury, and seroma formation. Thrombosis, infection, and seromas appear to occur
more frequently with grafts than with fistulas.
Thrombosis is the most common complication of permanent vascular access, and when
not correctable, accounts for 80-85% of AV access loss. The Dialysis Outcomes and
Practice Patterns Study found that grafts are 3.8 times more likely to require a
thrombectomy and 3.0 times more likely to require access intervention than native fistula
[72]. The major predisposing factor for thrombosis is anatomic venous stenosis,
responsible for 80-85% of thromboses [20, 21]. Other causes of thrombosis include
arterial stenoses and non-anatomic problems, such as excessive post-dialysis fistula
compression, hypotension, increased hematocrit levels, hypovolemia, and
hypercoagulable states [18, 20, 21, 162, 163].

25
Vascular access stenosis is initiated by endothelial cell injury, which leads to the up-
regulation of adhesion molecules on the endothelial cell surface. Subsequent leukocyte
adherence to damaged and activated endothelium causes the release of chemotactic and
mitogenic factors for vascular smooth muscle cells, thereby enhancing smooth muscle
cell migration and proliferation [164-166].
Additional factors that contribute to the myointimal proliferation and fibromuscular
hyperplasia include shear stress generated by the turbulent blood flow [167, 168] and the
mismatch in elastic properties around the anastomosis, leading to excessive mechanical
stretch [169]. Activated platelets and inflammatory cells also secrete oxidants and other
toxins that directly injure the vessel wall [170].
In AVFs, about 50% of all stenoses leading to reduced flow are close to the AV
anastomosis along the first venous segment. This is probably caused by the
devascularization of the venous wall during dissection. More centrally located stenoses
are observed within cannulation areas or venous segments in the upper arm. In AVGs,
stenoses along the inflow tract and the graft itself are rarely seen. Predominantly,
stenoses are seen in the outflow tract, usually as graft-vein stenosis.
Treatment of venous stenosis is important clinically because it preserves the access sites
for future use. Treating vascular access thrombosis involves both removal of the
thrombotic material and correction of the underlying venous or, more rarely, arterial
stenosis. Performing a thrombectomy alone without correcting any underlying stenosis

26
will result in an inevitable recurrence within a short period of time. In native AVFs,
thrombectomy should be performed as early as possible, usually within days. Waiting for
revision often causes an appositional growth of the thrombus and a substantial loss of
venous capital. In AVGs, thrombectomy can be done successfully even after a couple of
months. However, an immediate procedure is preferred.
Infection accounts for approximately 20% of vascular access loss. The risk of infection
for grafts averages 10%, while the risk for transposed fistulas is 5%, and less than 2% for
non-transposed fistulas [158, 171-174]. The vascular access is the source of the majority
of bacteremia in hemodialysis patients. Staphylococcus aureus, and less commonly
Staphylococcus epidermidis, are the predominant pathogens [160, 175]. Predisposing
factors to infection include pseudoaneurysms or perifistular hematomas, often due to
inappropriate graft cannulation, severe pruritus over needle sites, the use of hemodialysis
fistulas for intravenous drug abuse, and manipulation of the access via secondary surgical
procedures [176]. Bacteremia frequently occurs during cannulation without actual fistula
infection. Infection occurring in native fistulas can usually be treated with intravenous
antibiotics and, if necessary, surgical drainage [140, 177]. Graft infection may require
complete excision to eradicate the infection, which results in loss of the access [178].
Aneurysms and pseudoaneurysms are relatively infrequent complications of vascular
access that usually result from repeated cannulation in the same area of the access. True
aneurysms and pseudoaneurysms occur in up to 5% and 3% of grafts and fistulas,
respectively. Pseudoaneurysms are a particular problem with PTFE grafts, occurring as

27
the graft material deteriorates with prolonged use. Initial fears that the current movement
toward daily hemodialysis would lead to accelerated graft loss have not been borne out
[177].
Placement of an AV access can result in distal hypoperfusion of the extremity in patients
with severe peripheral vascular disease due to shunting ("steal") of arterial blood flow
into the fistula. Symptomatic steal occurs in approximately 1-20% of patients receiving
an upper extremity access [179, 180]. Acute ischemic symptoms characterized by an
absent pulse or a cold extremity, warrant immediate surgical correction to prevent the
development of permanent injury. These severe complications may be more common
among diabetics and the elderly [177-181]. More commonly, less severe symptoms and
signs, such as paresthesias, and a sense of coolness with retained pulses, usually improve
over a period of weeks with the development of collateral blood flow. Careful, frequent
observations and an alert nursing staff are required in this setting. Hand ischemia from
steal may require intervention (e.g. distal revascularization interval ligation) or complete
ligation in severe cases.
Venous hypertension occurs in approximately 3% of fistulas and grafts [158, 159, 172,
182] and is usually related to central vein stenosis [173]. This can cause severe upper
limb edema, skin discoloration, access dysfunction, and peripheral ischemia with
resultant fingertip ulceration. In most cases, the underlying venous pathology follows
ipsilateral central venous catheter placement with consequent venous stenosis. While arm
swelling is common following access surgery, an underlying venous outflow problem

28
will be present in a quarter of cases if it persists beyond two weeks. Venous duplex
ultrasound is usually sensitive enough to demonstrate dilated central veins with possible
reversal of flow, although, in some cases, upper limb venography is required. Treatment
is aimed at correcting the underlying vascular problem, either via a percutaneous or direct
surgical approach.
Vascular access-related cardiac decompensation is a rare complication (<1%), even in
patients with underlying cardiac dysfunction [159, 179, 183]. Patients with an AVF do
not have higher rates of heart failure than patients with an AVG or catheter [184], but
they may experience an increase in preexisting left ventricular hypertrophy following the
creation of the fistula [185].
Median nerve dysfunction in long-term dialysis patients is most often due to local
amyloid deposition, leading to carpal tunnel syndrome. The vascular access also may
contribute to this problem in some cases via compression of the median nerve (due to the
extravasation of blood or fluid) or via ischemic injury by a vascular steal effect [181, 186,
187].
Ultra-filtration of plasma across a PTFE graft ("weeping syndrome") occurs occasionally,
forming a pocket of serous fluid that can become firm and gelatinous over time [188].
Seromas typically form at the arterial end of the graft where intraluminal pressure is
higher, although the same process can occur at the distal end if there is significant central
venous obstruction [189]. Seromas usually form slowly, beginning within 30 days after
29
implantation of the graft. However, a more acute presentation mimicking a hematoma has
been reported.
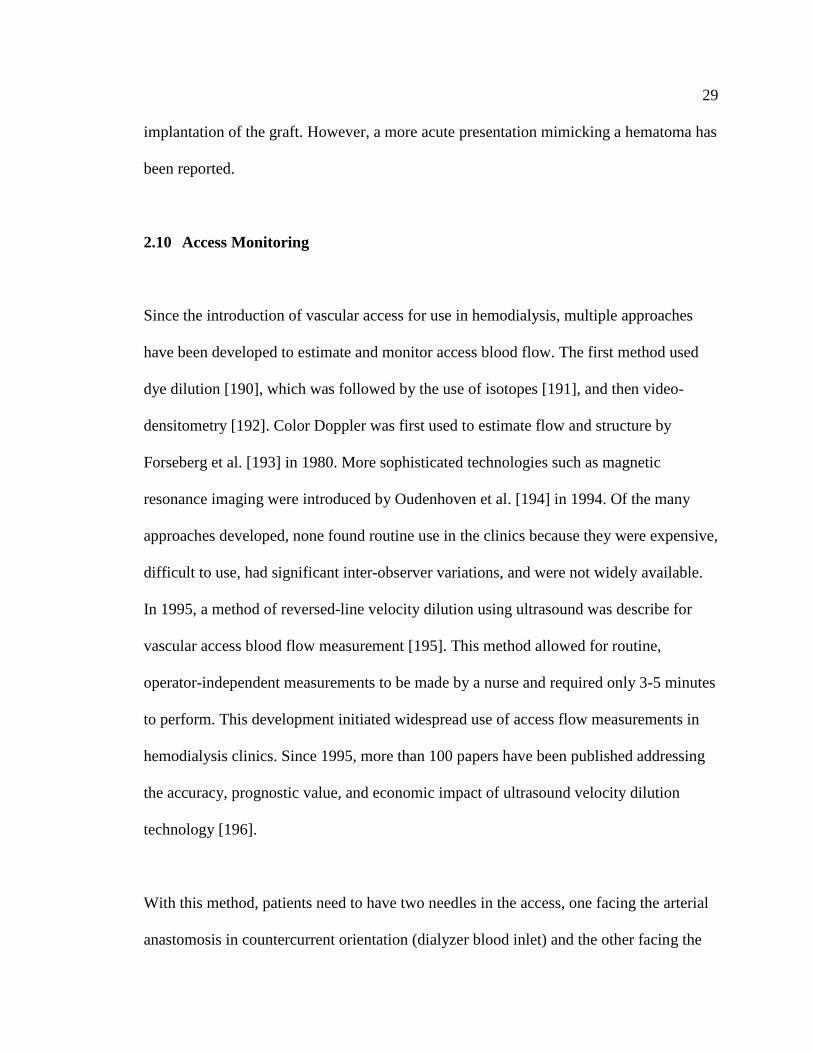
2.10 Access Monitoring
Since the introduction of vascular access for use in hemodialysis, multiple approaches
have been developed to estimate and monitor access blood flow. The first method used
dye dilution [190], which was followed by the use of isotopes [191], and then video-
densitometry [192]. Color Doppler was first used to estimate flow and structure by
Forseberg et al. [193] in 1980. More sophisticated technologies such as magnetic
resonance imaging were introduced by Oudenhoven et al. [194] in 1994. Of the many
approaches developed, none found routine use in the clinics because they were expensive,
difficult to use, had significant inter-observer variations, and were not widely available.
In 1995, a method of reversed-line velocity dilution using ultrasound was describe for
vascular access blood flow measurement [195]. This method allowed for routine,
operator-independent measurements to be made by a nurse and required only 3-5 minutes
to perform. This development initiated widespread use of access flow measurements in
hemodialysis clinics. Since 1995, more than 100 papers have been published addressing
the accuracy, prognostic value, and economic impact of ultrasound velocity dilution
technology [196].
With this method, patients need to have two needles in the access, one facing the arterial
anastomosis in countercurrent orientation (dialyzer blood inlet) and the other facing the

30
venous anastomosis. To measure the access flow rate, the dialyzer lines are reversed from
normal: the arterial inlet is downstream to the venous outlet, and the outlet then faces the
access stream (Fig. 2.1). The purpose of line reversal is to enable delivery of indicator
into the venous dialyzer outflow line upstream of the access, and then be able to sample
downstream of the access (after the indicator has mixed) in the withdrawal arterial line. A
flow sensor is clipped on the arterial line to measure the dialyzer flow rate and for
recording ultrasound dilution caused by saline injections. An additional identical flow
sensor is clipped on the venous line downstream from the place of the saline injection.
The indicator injected into the venous line can serve both to calibrate the sensor and to
measure access flow. To measure access blood flow, 10 mL of isotonic saline is injected
into the venous line. The indicator is mixed with the blood flowing in the access. The
fraction of the indicator detected by the sensor on the arterial line is determined by the
ratio between flows in the extracorporeal circuit and the access. Knowing the blood flow
rate in the extracorporeal circuit, the access flow rate can be calculated from this ratio
[197]. Flow determination consisted of three single measurements, which are averaged.
All measurements are done during a fixed dialyzer pump speed, usually 250 mL/min. The
ultrafiltration rate is usually turned off 3 minutes before the start of measurements. After
the flow-rate measurements are done, the dialyzer lines are reversed back to normal.

31
Fig. 2.3 Transonic System Monitor Setup
Transonic System HD01 Monitor Setup showing one ultrasound sensor applied to each
blood line. To measure access flow, a 10 mL bolus of normal saline is injected proximal
to or into the venous bubble trap (1) or normal saline is released from a saline bag into
the arterial line (2).
The most often used formula to calculate access flow utilizes the relationship between
access blood flow (Qa) and the access recirculation (R) introduced by line reversal [197]:
Qa = Qb ( 1/R-1)
Where Qb represents pump flow. Use of this formula assumes that delivery of pump flow
upstream of the access does not change the initial access inflow. Any technology that
32
measures recirculation can be used to measure access flow with the reversed-line position
[197]. All such technologies use formulas that are mathematically equivalent to the
previous equation.
Over the process of developing this techniques, it has become clear that there are many
factors that affect the accuracy of access flow measurement and may have clinical
implications: 1) the quality of mixing of indicator with access flow between the
introduction and recording sites; 2) second pass of the indicator through the
cardiopulmonary system; 3) distortion of initial access flow by line reversal, indicator
introduction, or indicator withdrawal; and 4) indicator loss.
2.11 Access Monitoring and Vascular Access Failure
The high cost of vascular access failure demands a closer look at strategies that may
prevent it occurring. Comparison of a variety of prospective monitoring tools indicates
that measurement of access blood flow may provide the best prediction of future access
failure [16, 17]. Current recommendations [22, 23] have supported such monitoring on
the premise that the natural history of the access will be altered by radiological or
surgical intervention if access dysfunction is detected. This facilitates the change from
emergent inpatient procedures to outpatient procedures, reduces total procedure rates and
the need for catheters. Recently, however, the effectiveness of access monitoring in
predicting future failure has become controversial. A meta-analysis and a prospective
trial demonstrate that access flow measurement was only approximately 80% sensitive
33
and 80% specific for identifying future access thrombosis. [197]. Others reported that
neither dynamic nor static venous pressures are predictive of access thrombosis [198,
199]. Thrombosis rates in access flow monitoring programs have been demonstrated to
be 0.1-0.3/patient-year in AVFs and 0.25-0.40/patient-year in AVGs. This compares to
baseline thrombosis rates of 0.25-0.40/patient-year in AVFs and 0.8-1.2/patient-year in
AVGs without monitoring [200-204]. For these reasons, NKF-DOQI continues to
recommend monthly access monitoring for all patients with vascular access.
Unfortunately, there are few randomized controlled trials from which to draw conclusions
about the benefit of surveillance with subsequent intervention to prevent thrombosis.
Also, there are no randomized controlled trials to date that compare a control group
receiving no monitoring with an intervention group that receives a particular method of
surveillance. As well, there may be many patient- and population-dependant variables
that influence access thrombosis and access blood flow. Finally, the duration of the
follow-up period for any surveillance technique will have a profound influence on the
predictive accuracy of monitoring.
The rationale for surveillance is grounded in what has been termed the ―dysfunction
hypothesis‖, which states that stenosis causes access dysfunction, and that this
dysfunction reliably precedes, and accurately predicts, thrombosis [27]. Therefore, if a
particular surveillance technique is to be able to predict vascular access thrombosis,
several assumptions of this dysfunction hypothesis must be true. Specifically, the
measurements must be reproducible, stenosis should progress slowly enough so that there
is time to intervene before thrombosis, and other factors outside of stenosis, such as

34
hypercoagulability, should not abrogate or appreciably confound the surveillance
technique’s prediction of thrombosis. An ideal access monitoring test would predict
nearly all patients who will experience thrombosis without falsely predicting thrombosis
in those who do not have access dysfunction. Most monitoring techniques that have been
developed rely on detecting hemodynamic dysfunction, usually a reduction in blood flow
that results from an access stenosis, rather than detecting the stenosis itself.
Observational studies suggest that monitoring and surveillance can lead to pre-emptive
and elective surgical and/or interventional revision of a dysfunctional AVF or AVG. For
example, it has been observed that if a moderate stenosis can be detected in a timely
fashion, then it can be widened by concentrating cannulations exactly to the venous
segment, resulting in relative dilation that can correct the underlying stenosis [205]. Other
studies have found that correction of hemodynamically significant graft stenosis with
angioplasty appears to substantially reduce the frequency of access thrombosis [206-209].
These results suggest that noninvasive surveillance methods can be used on an ongoing
basis to screen for hemodynamically significant stenosis, permitting timely referral for a
fistulogram. However, this has not been tested with rigorous clinical trials. Nevertheless,
the NKF guidelines, as well as many researchers and clinicians, have advocated access
surveillance as a means to improve patient care and reduce access-related costs.

35
CHAPTER THREE: METHODS
Sections 3.1 and 3.2 of this chapter describe the study design and the population studied
with the inclusion and exclusion criteria. The next sections focus on the data management
and analysis plan, and the final section discusses the ethical considerations for
implementation of this study. Appendix 1 gives definitions for terms used in this study.
3.1 Study design
The study was conducted using a retrospective cohort design. The cohort was all patients
in Southern Alberta with chronic renal disease receiving chronic RRT with a vascular
access created for dialysis between January 1, 2002 to June 30, 2005 that were follow by
SARP.
3.2 Study population and sample
Patients were recruited from SARP, which provides hemodialysis at facilities located
throughout southern Alberta. SARP manages between 600 and 700 hemodialysis patients.
Since 2002, SARP has used a multidisciplinary approach to vascular access management,
including a full-time vascular access coordinator, a nurse who is responsible for
Transonic monitoring, a group of interventional radiologists, several nephrologists, and
full-time dedicated vascular access surgeons. For a patient to be included in the study
sample, first and foremost their vascular access must have been considered mature. This

36
means that the surgery was successful, and the patient proceeded to have at least one
successful functional cannulation for the purposes of dialysis; this usually occurs in 95%
of both grafts and fistula. (The numerical value of 95% refers to the initial maturation of
the vascular access, not the primary patency. Primary patency of a vascular access is the
first failure at any time of an access from a starting point of its surgical creation including
those that fail prior to maturation.) Successful functional cannulation of a vascular access
is defined as affording an extracorporeal blood flow of at least 300 ml per minute, for at
least 3 hours. The reason for restricting the study sample as such was the concern that
interventions performed prior to the initial cannulation would change the biology of the
access. With this restriction of defining the study population, the study sample was
selected using the following inclusion and exclusion criteria.
3.2.1 Inclusion criteria
1. Patients 18 years of age or older.
2. All patients with a functioning and mature AVF or AVG created by a SARP
affiliated vascular surgeon.
3. Only upper extremity vascular accesses were considered.
4. First cannulation of the access and adequate dialysis achieved.
3.2.2 Exclusion criteria
1. Patients receiving peritoneal dialysis as their only method of RRT
2. A central line catheter as the method of vascular access.
3. Access located in any part of body other than the upper extremities.

37
4. Any intervention, either surgical or radiological, performed before initial intra-
access blood flow measurement.
5. First cannulation was attempted but adequate dialysis was not achieved.
3.3 Data Collection
Study data was collected from two electronic, in-house database systems: SARP and
ALTRAbase. SARP records demographic and clinical variables on all patients in
Southern Alberta with chronic renal disease receiving chronic RRT [210]. Data from the
SARP database is then linked to an electronic surgical record (ALTRAbase data system),
which captures data on all vascular access surgeries. Following each access surgery, the
responsible surgeon enters an electronic standardized record with the details of the
surgical procedures such as artery and vein used and whether it was a fistula or graft.
Other data recorded included a unique surgery number, patient identification number, the
date of the surgery, and the contemporary dialysis modality. Subsequently, the access
coordinator recorded IABF rates (described below) and complications including access
failure using a standardized instrument (Appendix 2).
A deterministic linkage process between the SARP and ALTRAbase database was
performed. Variables used for this linkage included the Alberta personal health number,
sex, date of birth, surname, and given name. Data was exported from the source databases
and linked using Microsoft Excel 2003 (Microsoft Corp., Redmond WA). As dialysis
services are exclusively provided by SARP, linkage was expected to be and was
complete. String variables were changed to numeric form. ―Yes‖ and ―No‖ categories

38
were coded as ―1‖ and ―0‖ respectively. Clinical variables from both databases were
collected on all sample participants. Demographics included age, sex, and race. The
etiology of renal insufficiency (diabetes, glomerulonephritis, ischemia/hypertension,
interstitial nephritis, polycystic kidney disease and unknown) were determined. Specific
co-morbidities included diabetes, hypertension, peripheral vascular disease, and smoking
(currently smoking or self-classified as a regular smoker within the past 5 years). This
clinical information was collected by the predialysis clinic nurses on all patients starting
dialysis to enable calculation of the Charlson comorbidity index [211], which has been
validated for use in the ESRD population [212].
3.4 Variables of Interest
Information was collected on the following categories of variables:
Outcome Variable
Exposure Variable
Independent Variables
3.4.1 Outcome variable – Vascular access failure
The primary outcome of interest was vascular access failure. Access failure was defined
as any event of thrombosis, the need for surgical or endovascular revision with
angioplasty, or the abandonment of the access site, whichever came first following initial
cannulation and achievement of adequate dialysis. Vascular access outcomes were
followed until the primary outcome occurred or for maximum of 6 months, following the

39
initial baseline blood flow measurement. The variable was dichotomized into ―Yes‖ and
―No‖ categories. ―Yes‖ indicated that the patient experience a vascular access failure;
―No‖ indicted that the patient did not experience a vascular failure during the time of the
study. All categorical variables were coded as ―1‖ (yes) and ―0‖ (no).
3.4.2 Exposure variable – Initial IABF
All patients had an initial IABF measurement performed within 2 weeks after initial
cannulation and successful use of the access for hemodialysis. All vascular access blood
flow measurements were performed in a standardized fashion using the ultrasound
dilution technique (HD01 Monitor, Transonic Systems, INC., Ithaca N.Y., USA). This
technique has been extensively validated both in vivo and in vitro [196]. The ultrasound
dilution technique was performed as follows: two ultrasonic sensors were attached to the
lines of the hemodialysis tubing, one to the arterial, and another to the venous line, 2-6
inches from the connection to the access cannulation needles. Blood recirculation was
checked while the blood lines were in the normal position. Then, the blood lines were
reversed and ultra-filtration was turned off. The blood pump flow was set at 300 mL/min.
A bolus of saline (10 mL) was released into the venous line, diluting the flow of blood in
the access and resulting in changes of sound velocity, measured by the transducers. The
Doppler shift in velocity was determined and then the vascular access blood flow
(mL/min) was calculated. All access flow measurements were done in the first hour of
the hemodialysis treatment as these results are reproducible and unaffected by changes in
cardiac output associated with ultra-filtration. Blood flow measurements were not
performed during periods of clinically significant hypotension (at the discretion of the
40
dialysis unit nurses). All access blood flow measurements were performed in duplicate
and subsequently averaged. If a measurement differed by more than 10%, a third
measurement was taken and the average of the measurements was calculated. After the
measurements were performed, the data were recorded and enter into the SARP database.
Based on previous research studies initial IABF was stratified in two categories: higher
than 500 ml/min and lower or equal than 500 ml/min for AVFs and higher than 650
ml/min and lower or equal than 650 ml/min for AVGs.
3.4.3 Socio-demographic variables
Demographics included age, sex and race. The variable age was considered at the time
the surgical procedure was performed. Based on previous research, age was stratified as
patients equal to or younger than 65 years, and those older than 65 years. Patients
included in the study were classified as either males or females; this variable was
changed to numeric form. ―Female‖ and Male‖ categories were code as ―0‖ and ―1‖
respectively. Race was classified in two categories: (1) Caucasian, (2) Other. In the other
category were included the following races: Chinese, South Asian, Black, Aboriginal
peoples of North America, West Indian, Filipino, South East Asian, Latin American,
Japanese and Korean.
3.4.4 Clinical variables
Clinical variables include both continuous and discrete variables were obtained from the
SARP and ALTRAbase databases. These clinical variables are defined as follows:

41
Time on dialysis: This was defined as the time since the patient start receiving
chronic replacement therapy until the first successful cannulation of the vascular
access was performed. For the purpose of the study, this continuous variable was
measured in days.
Successful access cannulation: Successful use of a vascular access is defined as
affording an extracorporeal blood flow of at least 300 ml per minute, for at least 3
hours, using an arterial and venous needles placed in the vascular access. This
continuous variable was measured in days from the surgery to first cannulation.
Diabetes mellitus: This is a chronic condition associated with abnormally high
levels of glucose (sugar) in the blood. The two types of diabetes are referred to as
insulin-dependent (type I) and non-insulin dependent (type II). Type I diabetes
results from a lack of adequate insulin secretion by the pancreas. Type II diabetes
(also known as adult-onset diabetes) is characterized by an insensitivity of the
tissues of the body to insulin secreted by the pancreas (insulin resistance). For the
purpose of the study, patients were classified as having or not the disease. No
stratification was done between patients with diabetes type I or type II diabetes.
Hypertension: High blood pressure is defined as a systolic blood pressure greater
than 140 mm Hg and/or diastolic blood pressure greater than 90 mm Hg.
Glomerulonephritis: This is a disease of the kidneys in which the glomeruli, the
tiny filters in the kidneys that help to clean the blood, become inflamed or
damaged. This allows protein and red blood cells to pass into the urine. If
glomerulonephritis does not respond to treatment, the glomeruli may slowly be
destroyed and the kidneys may lose their ability to clean the blood.

42
Interstitial nephritis: This is a form of nephritis affecting the interstitium of the
kidneys surrounding the tubules. This disease can be either acute, which means it
occurs suddenly or chronic, meaning it is ongoing and eventually ending in
kidney failure.
Polycystic kidney disease: This is a progressive, genetic disorder of the kidneys,
characterized by the presence of multiple cysts (hence, "polycystic") in both
kidneys. The disease can also damage the liver, pancreas, and rarely, the heart and
brain.
Peripheral vascular disease: Diseases of the vessels of the extremities such as
atherosclerosis, resulting in diminished circulation, pain (claudication), or a blood
clot.
Smoking: Subjects were defined as a current smoker or a non-smoker based on
self-reported current smoking status.
Anticoagulation: This refers to use of a group of medications that prevent blood
from clotting (ASA, Coumadin, Heparin).
3.4.5 Vascular access characteristics
The clinical characteristics of all vascular accesses were obtained from the ALTRAbase
database. The unique descriptors of the accesses included: 1) location (forearm, upper
arm, right or left, dominant or non-dominant), 2) type (native fistula or graft), 3) the
surgeon of record (A, B, C, D). The surgeon of record was made anonymous prior to data
extraction from the database.

43
3.5 Data Analysis
This section describes the data analysis employed in this study under the following
headings: initial data analysis, descriptive analysis, and analytical analysis. Analysis was
performed using Stata version 9.0 (Stata Corp, College Station, TX).
3.5.1 Initial data analysis
In this phase of the data analysis all abstracted data forms were reviewed prior to entry
into the study database in order to ensure consistency of application of study definitions
and diagnosis. The aim was to detect errors and out-of rage values. To avoid assessment
of multiple outcomes for a single patient, only the first access surgery associated with
vascular access failure was analyzed for patients with multiple access procedures. In the
event of missing data for a particular variable that was not available after review of the
SARP or ALTRAbase database, the data were not replaced.
3.5.2 Descriptive analysis
All variables were assessed for underlying distribution qualitatively using histograms or
box plots. Normally or near normally distributed variables were reported as means with
standard deviations (SD) and were compared using the appropriate Student’s t test.
Categorical data were reported as proportions and compared using the Chi-square Test.
Levels of significance were not adjusted for multiple testing, and two-side p-values of
<0.05 were considered statistically significant for all comparisons.
44
3.5.3 Hypothesis testing
The particular steps in this section were undertaken to address the objectives of the study
and are describe in the next three sub-sections.
The primary outcome of interest in the study was vascular access failure. The outcome
was stratified by type of vascular access (AVF or AVG). Differences in demographic or
clinical variables between those with, and without, vascular access failure were explored
using classical descriptive analysis (measures of central tendency and dispersion) and
compared using the appropriate parametric or non-parametric test for continuous
variables, or Chi-square test for proportions.
A univariate logistic analysis was performed on each of the independent variables to
identify variables associated with an increased risk of vascular access failure. Estimated
odds ratios (ORs) and corresponding 95% confidence intervals were computed.
Generally, the estimated ORs were considered significant at p-values less than 0.05. In a
few instances, however, variables were considered for further analysis in the absence of
significant p-value. This was the case for variables that have been shown in the literature
to be significant predictors of vascular access failure or if the 95% confidence interval
associated with the OR was very close to the null value (close to 1). The particular
variables that fit in this category are indicated in the relevant Results section.
Stratified analysis was performed to explore whether selected independent variables may
have been confounders or effect modifiers. This analysis was performed by exploring
whether the crude OR of the relationship between vascular access failure and initial IABF

45
was affected by stratification on the third independent variable. Estimated ORs in the
different strata of each variable were then compared to each other and to the estimated
crude odds ratio. Based on the results of the comparison, a judgment was made whether
that variable acted as a confounder, an effect modifier, or neither. The criteria used for
confounding were that the stratum specified ORs were similar but different from the
crude, while the criteria for effect of modification were that the stratum specific ORs
were different and different from the crude.
A multivariable analysis using logistic regression was performed to determine the
potential contribution of independent variables including age, sex, race, time on dialysis,
primary renal disease, co-morbidities (diabetes, hypertension, peripheral vascular disease,
smoking), access location (dominant or non-dominant extremity), type of procedure
(forearm fistula vs. upperarm fistula/ forearm loop graft vs. upperarm C-graft), surgeon
(identified as surgeon A, B, C, D), use of medications (aspirin, anticoagulants,
angiotensin-converting enzyme inhibitors), and initial IABF with the dependant variable
of vascular access failure. Multiple logistic regression allows the use of both discrete and
continuous independent variables in a regression model to simultaneously assess the
effects of each on a discrete dependant variable. Variables that were clinically relevant
with p < 0.25 were entered simultaneously into the initial model. Variables were removed
using a backward elimination process, leaving only variables with p < 0.05 in the final
model. First-order interactions were also assessed by testing the significance of the
product terms generated between various independent variables.

46
3.6 Ethical Concerns
This study involved the review of existing data from clinical and administrative
databases, and the review of patients’ medical records. Following the data linkage
between databases, the participants in the final study sample were assigned a unique
identifier, followed by removal of all patient specific identifiers. Data is presented in
aggregate only (minimum cell value of 5 participants), and therefore identification of
individuals by unique isolated outcomes should not be possible. Prior to data acquisition,
ethical review and approval was obtained from the Research Ethics Board of the
University of Calgary and the Calgary Health Region.

47
CHAPTER FOUR: RESULTS
This chapter provides information on the primary research question – the association
between vascular access failure and initial IABF measurement in patients with AVFs and
AVGs. Estimates are made of effect of modification or confounding of this association
due to various socio-demographic and clinical variables. In an effort to explore this
association further, logistic regression models were developed in the last part of the
chapter.
During the 42-month study period from January 2002 to June 2005, a total of 1510
vascular access procedures were performed at the Foothills Hospital in Calgary. The
numbers and types of procedures are shown in Table 4.1. Data from those patients whose
accesses matured properly (831 AVFs and 359 AVGs) are included for analysis.
Table 4.1 Numbers and types of procedures performed from January 2002 to
June 2005
Procedure Number Number maturing
(included in thesis)
AVF 867 831
AVG 379 359
Peritoneal dialysis catheter 264 Not included
Total 1510 1190
All patients included in the study were on renal replacement therapy at the time of the
first access cannulation. The majority of these patients had been on hemodialysis for a
period ranging from 6 to 18 months. Table 4.2 describes characteristics of the patient

48
sample including age, sex, ethnicity, months on dialysis, underlying disease, co-
morbidities, surgeon, location of access, and type of procedure for patients who received
these two types of vascular access. The mean (± SD) age of all participants was 69 ± 15
years (range: 20-97). The cohort consisted of approximately 58% men; 77% of patients
were Caucasian; and diabetes mellitus and hypertension were the most common
underlying cause of renal failure in 43% and 15% of the cases, respectively.
During the study period, death occurred in 64 out of the total cohort of 1510 patients: 25
with AVFs and 39 with AVGs. Data were included for those patients who reached the
primary outcome of vascular access failure before death (12 patients with AVFs and 30
patients with AVGs). Data were not included for those patients who died with a
functional access (13 with AVFs and 9 with AVGs).
4.1 AVFs
Seventy percent of the total vascular accesses placed were fistulas. Of these fistulas,
about 30% were radio-cephalic fistulas in the forearm and 70% were brachio-cephalic
fistulas in the upper arm. No brachio-basilic fistulas were placed during the study time.
The most common underlying disease causing renal insufficiency was diabetes, present in
43% of the cases. Other causes included hypertensive nephropathy (15%),
glomerulonephritis (12%), interstitial nephritis (4%), and polycystic kidney disease (4%).
In 22% of the patients, no definite etiological factor was identified (Table 4.2).
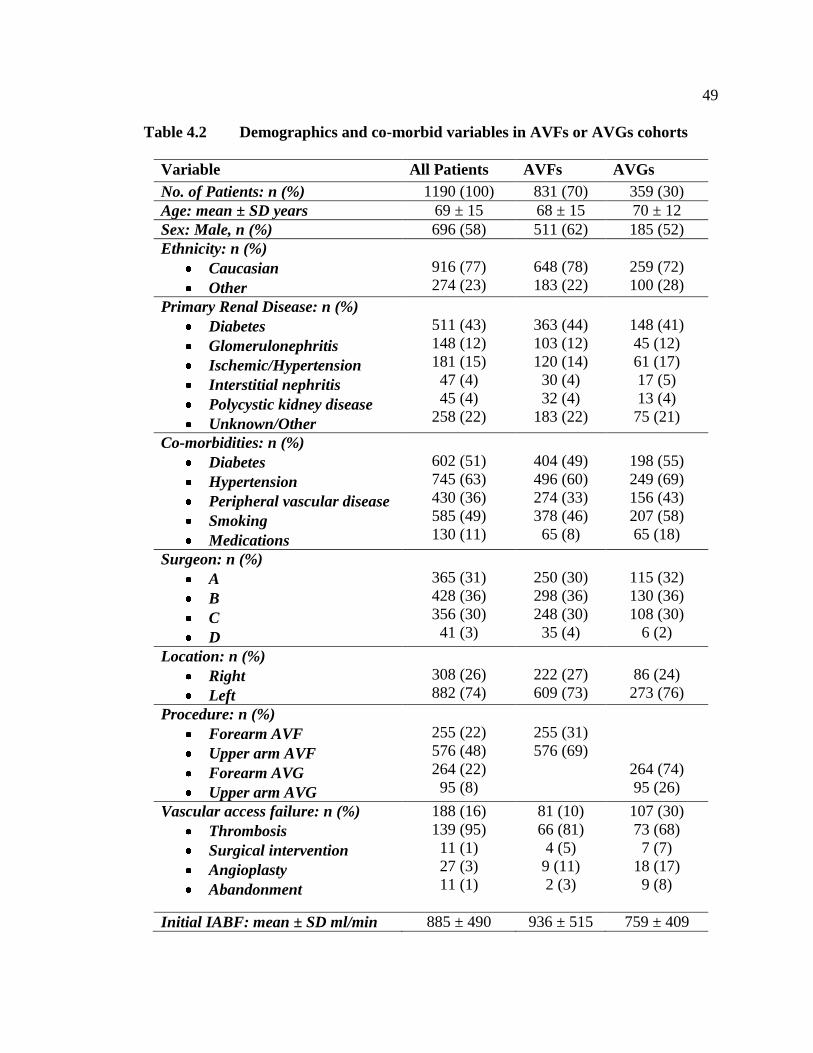
49
Table 4.2 Demographics and co-morbid variables in AVFs or AVGs cohorts
Variable All Patients AVFs AVGs
No. of Patients: n (%) 1190 (100) 831 (70) 359 (30)
Age: mean ± SD years 69 ± 15 68 ± 15 70 ± 12
Sex: Male, n (%) 696 (58) 511 (62) 185 (52)
Ethnicity: n (%)
Caucasian
Other
916 (77)
274 (23)
648 (78)
183 (22)
259 (72)
100 (28)
Primary Renal Disease: n (%)
Diabetes
Glomerulonephritis
Ischemic/Hypertension
Interstitial nephritis
Polycystic kidney disease
Unknown/Other
511 (43)
148 (12)
181 (15)
47 (4)
45 (4)
258 (22)
363 (44)
103 (12)
120 (14)
30 (4)
32 (4)
183 (22)
148 (41)
45 (12)
61 (17)
17 (5)
13 (4)
75 (21)
Co-morbidities: n (%)
Diabetes
Hypertension
Peripheral vascular disease
Smoking
Medications
602 (51)
745 (63)
430 (36)
585 (49)
130 (11)
404 (49)
496 (60)
274 (33)
378 (46)
65 (8)
198 (55)
249 (69)
156 (43)
207 (58)
65 (18)
Surgeon: n (%)
A
B
C
D
365 (31)
428 (36)
356 (30)
41 (3)
250 (30)
298 (36)
248 (30)
35 (4)
115 (32)
130 (36)
108 (30)
6 (2)
Location: n (%)
Right
Left
308 (26)
882 (74)
222 (27)
609 (73)
86 (24)
273 (76)
Procedure: n (%)
Forearm AVF
Upper arm AVF
Forearm AVG
Upper arm AVG
255 (22)
576 (48)
264 (22)
95 (8)
255 (31)
576 (69)
264 (74)
95 (26)
Vascular access failure: n (%)
Thrombosis
Surgical intervention
Angioplasty
Abandonment
188 (16)
139 (95)
11 (1)
27 (3)
11 (1)
81 (10)
66 (81)
4 (5)
9 (11)
2 (3)
107 (30)
73 (68)
7 (7)
18 (17)
9 (8)
Initial IABF: mean ± SD ml/min 885 ± 490 936 ± 515 759 ± 409

50
Table 4.3 Baseline demographics and co-morbid variables in patients with AVF
failure compared with patients without failure
Variable AVFs
without
failure
AVFs
with failure
All AVFs P Value
No. of Patients: n (%) 750 (90) 81 (10) 831 (100)
Age: mean ± SD 67 ± 15 72 ± 11 68 ± 15 0.0098 a
Gender: Male, n (%) 464 (62) 47 (58) 511 (62) 0.49 b
Ethnicity: n (%)
Caucasian
Other
550 (73)
220 (27)
53 (65)
28 (35)
604 (72)
227 (28)
0.3 b
Primary Renal Disease: n (%)
Diabetes
Glomerulonephritis
Ischemic/Hypertension
Interstitial nephritis
Polycystic kidney disease
Unknown/Other
331 (44)
91 (12)
109 (15)
29 (4)
26 (3)
164 (22)
32 (40)
12 (15)
11 (14)
1 (1)
6 (7)
19 (23)
363 (44)
103 (12)
120 (14)
30 (4)
32 (4)
183 (22)
0.4 b
Comorbidities: n (%)
Diabetes
Hypertension
Peripheral vascular
disease
Smoking
Medications
347 (46)
432 (58)
230 (31)
317 (42)
58 (8)
57 (70)
64 (79)
44 (54)
61 (75)
7 (9)
404 (49)
496 (60)
274 (33)
378 (45)
65 (8)
< 0.001 b
< 0.001 b
< 0.001 b
< 0.001 b
0.77 b
Surgeon: n (%)
A
B
C
D
221 (30)
269 (36)
227 (30)
33( 4)
29 (36)
29 (36)
21 (26)
2 (3)
250 (30)
298 (36)
248 (30)
35 (4)
0.6 b
Location: n (%)
Right
Left
203 (27)
547 (73)
19 (24)
62 (76)
222 (27)
609 (73)
0.48 b
Procedure: n (%)
Forearm AVF
Upper arm AVF
207 (28)
543 (72)
48 (59)
33 (41)
255 (31)
576 (69)
< 0.001 b
Initial IABF:
mean ± SD ml/min
992 ± 510
421 ± 138
936 ± 515
< 0.001 a
a P values for continuous variables are based on two sample test.
b P values for categorical variables are based Chi
2 test of two samples

51
4.1.1 Vascular access failure
The primary outcome of interest in the study was vascular access failure defined as any
event of thrombosis, the need for surgical or endovascular revision with angioplasty, or
the abandonment of the access site, whichever came first following initial cannulation
and achievement of adequate dialysis within 6 months following first use. Primary failure
of the AVF occurred in 81 (10%) of cases. Sixty-six patients (81%) had thrombosis as a
cause, 9 patients (11%) had radiological intervention with angioplasty, 4 patients (5%)
required surgery, and 2 patients (3%) had the vascular access abandoned (Table 4.2). The
median time from first cannulation to vascular access failure was 48 days (IQR: 12 – 95).
Baseline demographics and co-morbid variables of patients who developed vascular
access failure are compared to patients without AVF failure in Table 4.3.
Patients with access failure were significantly more likely to have a current co-morbid
diagnosis of diabetes, hypertension, peripheral vascular disease, or smoking.
Additionally, patients with primary failure of the vascular access fistula were
significantly older than those without AVF failure (Fig. 4.1), and were significantly more
likely to have a forearm fistula or an initial IABF of less than 500 ml/min (Fig. 4.2). No
differences in sex, ethnicity, underlying primary kidney disease, medications, surgeons,
or location of the access were demonstrated between those with, and without, AVF
failure (Table 4.3).

52
Fig. 4.1 Age of patients with and without AVF failure
20
40
60
80
10
0
Age
(ye
ars
)
0 = Non-failure 1 = Failure
Age in patients with and without AVF failure
0 1
Upper horizontal line of box, 75th percentile; lower horizontal line of box, 25th percentile;
horizontal bar within box, median; upper horizontal bar outside box, 90th percentile; lower
horizontal bar outside box, 10th percentile. Open circles (O) represent values more than 1.5 box-
lengths from 75th percentile (outliers). Asterisks (*) represent values more than 3 box-lengths
from 75th percentile (extremes).

53
Fig. 4.2 Initial IABF in patients with and without AVF failure
0
1,0
00
2,0
00
3,0
00
4,0
00
IAB
F (
ml/m
in)
0 = Non-failure 1 = Failure
IABF in patients with and without AVF failure
0 1
Upper horizontal line of box, 75th percentile; lower horizontal line of box, 25th percentile;
horizontal bar within box, median; upper horizontal bar outside box, 90th percentile; lower
horizontal bar outside box, 10th percentile. Open circles (O) represent values more than 1.5 box-
lengths from 75th percentile (outliers). Asterisks (*) represent values more than 3 box-lengths
from 75th percentile (extremes).
4.1.2 Relative risk for vascular access failure
Relative risk calculations of the patient characteristic variables showed that patients with
initial IABF less than 500 ml/min were 16 times more likely to experience vascular
access failure, smokers were 3.7 times more likely, those with forearm fistulas were 3.3
times more likely, and those older than 65, those with a history of diabetes, hypertension,
or peripheral vascular disease were about 2.5 times more likely to experience vascular

54
access failure from any cause as those without these characteristics (Table 4.4). The
relative risks based on sex, ethnicity, medications, or AVF location were not significant.
Table 4.4 Relative risk of vascular access failure (VAF) from any cause in
patients with AVFs
Variable No. with
characteristic:
% (ratio)
Incidence of
VAF among
patients with
characteristic:
% (ratio)
Incidence of
VAF among
patients
without
characteristic:
% (ratio)
Relative Risk:
(95% CI)
Age ≥ 65 64 (537/831) 12(66/537)) 5(15/294) 2.4 (1.4 to 4.1) a
Diabetes 49 (404/831) 14 (57/404) 5 (24/427) 2.5 (1.6 to 4.0) a
Hypertension 60 (496/831) 13 (64/496) 5 (17/335) 2.5 (1.5 to 4.3) a
Peripheral
vascular disease
33 (274/831) 16 (44/274) 7 (37/557) 2.4 (1.6 to 3.6) a
Smoking 46 (378/831) 16 (61/378) 4 (20/453) 3.7 (2.2 to 5.9) a
Procedure
(forearm)
31 (255/831) 19 (48/255) 6 (33/576) 3.3 (2.2 to 5.0) a
Initial IABF
(< 500 ml/min)
14 (116/831) 51 (59/116) 3 (22/715) 16 (11 to 26) a
a P<0.001; variables with no significant p value are not shown in table.
When relative risk was calculated for the subset of patients whose access failed as a result
of thrombosis, similar results were obtained as for those patients with vascular access
failure from any cause. Table 4.5 shows that showed that patients with initial IABF less
than 500 ml/min were over 19 times more likely to experience vascular access failure,
those older than 65 were 4.5 times more likely, smokers were 3.5 times more likely, those

55
with forearm fistulas were 3 times more likely, and those with a history of diabetes,
hypertension, or peripheral vascular disease were about 2.5 times more likely to
experience vascular access failure from thrombosis as those without these characteristics.
Table 4.5 Relative risk of vascular access failure (VAF) secondary to thrombosis
in patients with AVFs
Variable No. with
characteristic:
% (ratio)
Incidence of
VAF among
patients with
characteristic
% (ratio)
Incidence of
VAF among
patients
without
characteristic
% (ratio)
Relative Risk:
(95% CI)
Age ≥ 65 65 (530/816) 11 (59/530) 2 (7/286) 4.5 (2.1 to 9.8) a
Diabetes 49 (404/816) 14 (53/485) 4 (13/331) 2.8 (1.5 to 5.0) a
Hypertension 59 (485/816) 11 (53/485) 4 (13/331) 2.8 (1.5 to 5.0) a
Peripheral
vascular disease
32 (265/816) 13 (35/265) 5 (31/551) 2.3 (1.4 to 3.7) a
Smoking 41 (336/816) 15 (49/336) 4 (17/450) 3.5 (2.0 to 6.0) a
Procedure
(forearm)
30 (244/816) 15 (37/244) 5 (29/572) 3.0 (1.8 to 4.7) a
Initial IABF
(< 500 ml/min)
13 (106/816) 46 (49/106) 2 (17/710) 19 (11 to 32) a
a P<0.001; variables with no significant p value are not shown in table
4.1.3 Stratified analysis
The stratified analysis aimed to investigate whether the crude association between
vascular access failure and initial IABF measurement was confounded or modified by
selected socio-demographic and clinical variables. Confounding occurs when the
apparent association between a risk factor and an outcome is affected by the relationship
of a third variable to the risk factor and the outcome; the third variable is called a

56
confounder. For a variable to be a confounder, the variable must be independently
associated with the risk factor and outcome, but not be in the causal pathway between
risk factor and outcome. To assess for confounding, a series of models with and without
subsets of the potential confounders: age, sex, ethnicity, diabetes, hypertension,
peripheral vascular disease, history of smoking, medications, IABF, and type of
procedure were compared. The fully adjusted model containing all the variables listed
above is referred to by Kleinbaum and Klein [213] as the ―gold standard model‖, all
―reduced‖ models are compared to the ―gold standard model‖.
The estimated crude OR for the relationship between vascular access failure and initial
IABF in patients with AVFs was OR 32, (95% CI 18-49). The crude association between
the vascular access failure and the initial IABF remained unchanged after stratification on
each of the socio-demographic characteristics including age, sex, and ethnicity.
The association between vascular access failure and initial IABF was also assessed after
stratification by the following clinical variables: diabetes mellitus, hypertension,
peripheral vascular disease, smoking, medications, IABF, and type of surgical procedure.
With the exception of smoking, the stratum-specific estimates were similar to each other
and similar to the crude estimates OR. Only in the model of smoking (OR 42, 95% CI 21-
70), the fully adjusted estimates were different from those obtained from the reduced
model. The 95% CIs of the estimates for the reduced model were extremely wide and
therefore it is difficult to determine whether in fact smoking was a confounder. Because

57
of this difficulty the fully adjusted ―gold standard model‖ will be the final model of
choice.
4.1.4 Multivariable modeling
One objectives of this study was to construct a statistical model identifying factors that
are associated with vascular access failure in patients on hemodialysis with AVFs.
Addressing this objective, a stepwise logistic modeling procedure was employed in order
to produce a parsimonious model of factors that are associated with vascular access
failure. Modeling was also used to assess whether main effects of various independent
variables were confounded when a new variable was added to the model.
The stratified analysis did not indicate that any variable acted as a confounder or effect
modifier of the association between vascular access failure and initial IABF. The only
variables chosen for inclusion in the multivariable logistic regression analysis were those
found in the univariate analysis to be significantly correlated with vascular access failure.
Variables with a p value of <0.25 were selected for multiple regression modeling as
suggested by Hosmer and Lemeshow [214]. Variables that met those criteria were age (≥
65), presence of diabetes, hypertension, peripheral vascular disease, history of smoking,
having a forearm AVF, and having an initial IABF less than 500 ml/min. Sex was not
significant in this analysis (p = 0.5); however in previous research, being female has been
associated with a higher incidence of vascular access failure hypothesized due to smaller
vascular structures in women [215]. Therefore, sex was included in the multiple
regression model despite its lack of statistical significance.
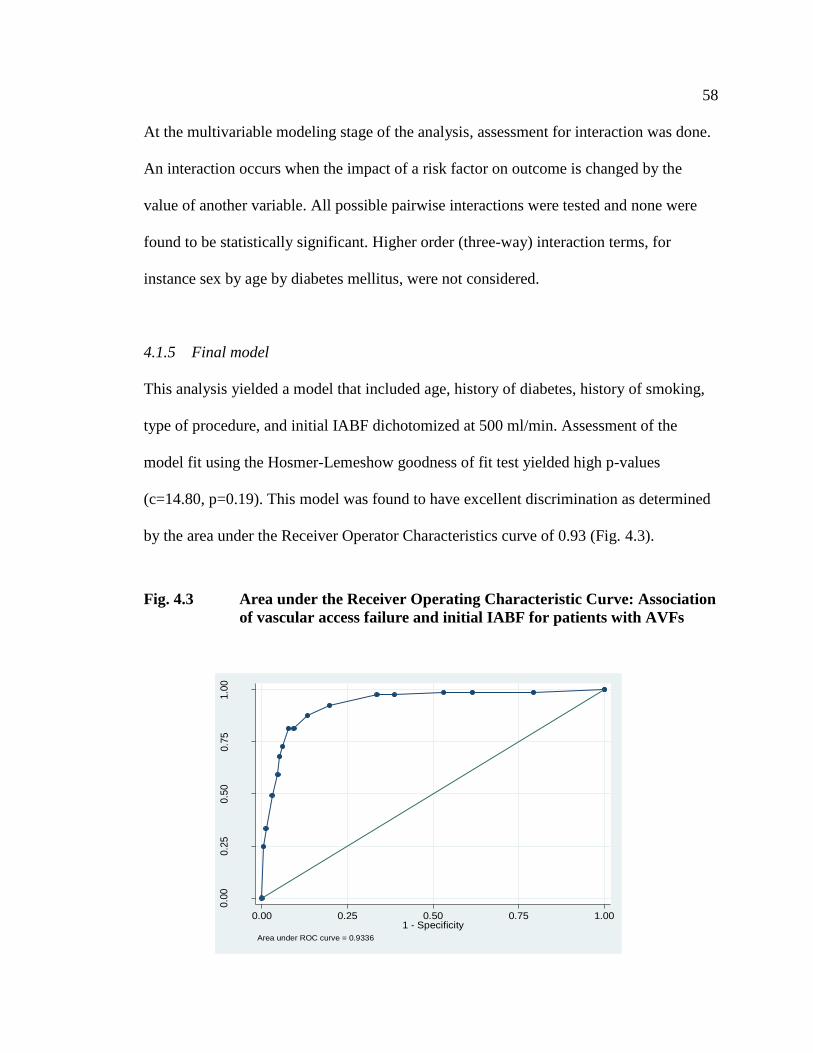
58
At the multivariable modeling stage of the analysis, assessment for interaction was done.
An interaction occurs when the impact of a risk factor on outcome is changed by the
value of another variable. All possible pairwise interactions were tested and none were
found to be statistically significant. Higher order (three-way) interaction terms, for
instance sex by age by diabetes mellitus, were not considered.
4.1.5 Final model
This analysis yielded a model that included age, history of diabetes, history of smoking,
type of procedure, and initial IABF dichotomized at 500 ml/min. Assessment of the
model fit using the Hosmer-Lemeshow goodness of fit test yielded high p-values
(c=14.80, p=0.19). This model was found to have excellent discrimination as determined
by the area under the Receiver Operator Characteristics curve of 0.93 (Fig. 4.3).
Fig. 4.3 Area under the Receiver Operating Characteristic Curve: Association
of vascular access failure and initial IABF for patients with AVFs
0.0
00.2
50.5
00.7
51.0
0
Sen
sitiv
ity
0.00 0.25 0.50 0.75 1.001 - Specificity
Area under ROC curve = 0.9336
59
The final regression model demonstrates that all selected variables remain statistically
significant (Table 4.6). The odds of experiencing vascular access failure occurred in those
patients with initial IABF of less than 500 ml/min (OR=29 and 95% CI 15-52), adjusting
for all other covariates. A history of smoking, being older than 65, having a forearm
fistula, and a history of diabetes produced ORs between 4.2 and 2.3 (Table 4.6), adjusting
for all the other covariates. The calculated coefficients allowed for the elaboration of a
regression equation to predict the occurrence of vascular access failure. The equation
may be applied using the variables selected according to the following regression
significance criteria:
Logit p = - 6.3 + [3.4 × IABF (ml/min)] + [1.3 × Age (<65 years = 0, ≥65 years
= 1)] + [0.9 × Diabetes (no = 0, yes = 1)] + [1.4 × Smoking (no = 0, yes = 1)] +
[1.4 × Procedure (upperarm fistula = 0, forearm fistula = 1)]
All variables are associated with an increase risk of vascular access failure. In our cohort,
the baseline probability of access failure was 0.2% (IABF >500 ml/min, younger than 65
years of age, non-smoker, no diabetes, and with upperarm fistula). The most significant
variable associated with an increase risk was an initial IABF lower than 500 ml/min.
From previous analysis, a patient with an initial IABF <500 ml/min with no other risk
factors had a probability of 16% risk of vascular access failure. A probability of failure of
16% is practically significant and suggest that all patients with an initial IABF less than
500 ml/min should have either and intervention or repeat monitoring. Individuals with
initial IABF >500 ml/min have an extremely low probability of subsequent access failure.

60
We decided to examine in this subgroup in an exploratory manner to determine if there
were any risk factors associated with an increased risk of failure: if so, this might suggest
an area of future study, or practically, a population of patients who might benefit from
repeat monitoring. The same steps used in the creation of the previous model were
applied for this second model, and yielded only smoking as important covariate (Table
4.7).
Logit p = - 6.0 + [2.6 × Smoking (no = 0, yes = 1)]
Table 4.6 Final multiple logistic regression model: Retained dichotomized
variables for vascular access failure in patients with AVFs a
Variable Coefficient OR 95 % Confidence
Interval
P value
IABF_500 b 3.4 29 15 – 52 < 0.001
Age_65 c 1.3 3.6 1.7 – 7.7 0.001
Diabetes 0.9 2.3 1.3 – 4.5 0.007
Smoking 1.4 4.3 2.2 – 8.3 < 0.001
Procedure 1.4 4.0 2.1 – 7.4 < 0.001
a Adjusted for age, diabetes, history of smoking and access type.
b Initial IABF dichotomized at 500 ml/min.
c Age dichotomized at 65 years.
Table 4.7 Logistic regression stratified on initial IABF > 500 ml/min
Variable Coefficient OR 95 % Confidence
Interval
P value
Smoking 2.6 13 3.1 – 56 0.001

61
The odds of experiencing vascular access failure were 13 times greater in smokers than
non-smokers. Stated another way, in our cohort, smokers with an initial IABF > 500
ml/min had a probability of subsequent access failure of 3.5%. The implication of this
result is that routine monitoring in patients with an initial IABF > 500 ml/min and no
other covariates should be questioned. There may be utility in monitoring patients with
initial IABF > 500 ml/min and history of smoking.
We did examine further multivariable models to examine if an outcome of thrombosis
was different than the other outcomes. The results of these models was similar to the
results from the classical analysis presented in Table 4.5, and is not presented here.
4.2 AVGs
Thirty percent of the total vascular accesses placed were prosthetic grafts. Of these grafts,
approximately 74% were forearm loop grafts and 26% were upperarm C-grafts. No tight
grafts were included on the study. The most common underlying disease causing renal
insufficiency was diabetes, present in 41% of the cases. Other causes included
hypertensive nephropathy (17%), glomerulonephritis (12%), interstitial nephritis (5%),
and polycystic kidney disease (4%). In 21% of the patients, no definite etiological factor
was identified (Table 4.2).
The primary outcome of interest in the study was vascular access failure defined as any
event of thrombosis, the need for surgical or endovascular revision with angioplasty, or

62
the abandonment of the access site, within 6 months following first use, whichever came
first following initial cannulation and achievement of adequate dialysis. Primary failure
of the AVG occurred in 107 (30%) of cases. Seventy-three patients (68%) had thrombosis
as a cause of the vascular access failure, 7 patients (7%) had surgery, 8 patients (18%)
had radiological intervention with angioplasty, and 9 patients (8%) had the vascular
access abandoned. The median time to vascular access failure was 61 days (IQR: 48 –
110). Baseline demographics and co-morbid variables of patients who developed vascular
access failure are compared to patients without AVG failure in Table 4.8.
4.2.1 Vascular access failure
Patients with access failure were significantly more likely to have a current co-morbid
diagnosis of diabetes, hypertension, peripheral vascular disease, or smoking.
Additionally, patients with primary failure of the vascular access grafts were significantly
older than those without AVG failure (Fig. 4.4) and were male or an initial IABF of less
than 650 ml/min (Fig. 4.5). No differences in ethnicity, underlying primary kidney
disease, medications, surgeons, or location of the access were demonstrated between
those with and without AVG failure (Table 4.8).

63
Table 4.8 Baseline demographics and co-morbid variables in patients with AVG
failure compared with patients without failure
Variables AVGs without
failure
AVGs with
failure
All AVGs P Value
No. of Patients: n (%) 252 (70) 107 (30) 359 (100)
Age: mean ± SD 68 ± 13 74 ± 8 70 (12) < 0.001a
Gender, Male n, (%) 121 (48) 64 (60) 185 (52) 0.027 b
Ethnicity, n (%)
Caucasian
Other
189 (75)
63 (25)
70 (65)
37 (35)
259 (72)
100 (28)
0.07 b
Primary Renal Disease: n (%)
Diabetes
Glomerulonephritis
Ischemic/Hypertension
Interstitial nephritis
Polycystic kidney disease
Unknown/Other
97 (39)
31 (12)
44 (18)
15 (6)
8 (3)
57 (23)
51 (48)
14 (13)
17 (16)
2 (1)
5 (5)
18 (17)
148 (41)
45 (13)
61 (17)
17 (5)
13 (3)
75 (21)
0.3 b
Comorbidities: n, (%)
Diabetes
Hypertension
Peripheral vascular
disease
Smoking
Medications
114 (45)
168 (67)
96 (38)
135 (54)
48 (19)
84 (79)
81 (76)
60 (56)
72 (67)
17 (16)
198 (55)
249 (69)
156 (43)
207 (58)
65 (18)
< 0.001
0.09
0.01
0.01
0.47
Surgeon: n (%)
A
B
C
D
78 (31)
91 (36)
78 (31)
5 (2)
37 (35)
39 (36)
30 (28)
1 (1)
115 (32)
130 (36)
108 (30)
6 (2)
0.8 b
Location: n (%)
Right
Left
51 (20)
201 (80)
35 (33)
72 (67)
86 (24 )
273 (76)
0.08 b
Procedure: n, (%)
Forearm AVG
Upperarm AVG
187 (74)
65 (26)
77 (72)
30 (28)
264 (74)
95 (26)
0.5 b
Initial IABF
mean ± SD ml/min
916 ± 388 421 ± 131 769 ± 402 0.000 a
a P values for continuous variables are based on two sample test
b P values for categorical variables are based Chi
2 test of two sample proportions

64
Fig. 4.4 Age of patients with and without AVG failure
40
60
80
10
012
0
IAB
F (
ml/m
in)
0 = Non-failure 1 = Failure
Age in patients with and without AVG failure
0 1
Upper horizontal line of box, 75th percentile; lower horizontal line of box, 25th
percentile; horizontal bar within box, median; upper horizontal bar outside box, 90th
percentile; lower horizontal bar outside box, 10th percentile. Open circles (O) represent
values more than 1.5 box-lengths from 75th percentile (outliers). Asterisks (*) represent
values more than 3 box-lengths from 75th percentile (extremes).

65
Fig. 4.5 Initial IABF in patients with and without AVG failure
0
1,0
00
2,0
00
3,0
00
IAB
F (
ml/m
in)
0 = Non-failure 1 = Failure
IABF in patients with and without AVG failure
0 1
Upper horizontal line of box, 75th percentile; lower horizontal line of box, 25th
percentile; horizontal bar within box, median; upper horizontal bar outside box, 90th
percentile; lower horizontal bar outside box, 10th percentile. Open circles (O) represent
values more than 1.5 box-lengths from 75th percentile (outliers). Asterisks (*) represent
values more than 3 box-lengths from 75th percentile (extremes).
4.2.2 Relative risk for vascular access failure
Relative risk calculations of the patient characteristic variables showed that patients with
initial IABF less than 650 ml/min were over 14 times more likely to experience vascular
access failure, those older than 65 years, those with a history of diabetes were 3 times
more likely, and those with a history of hypertension, or peripheral vascular disease or
smoking were about 1.5 times more likely to experience vascular access failure as those

66
without these characteristics (Table 4.9). The relative risks based on sex, ethnicity,
medications, or AVG location were not significant.
Table 4.9 Relative risk of vascular access failure (VAF) from any cause in
patients with AVGs
Variable No.(%) with
characteristic:
% (ratio)
Incidence of
VAF among
patients with
characteristic:
% (ratio)
Incidence of
VAF among
patients
without
characteristic:
% (ratio)
Relative Risk:
(95% CI)
Age > 65 72(257/359) 38 (97/257) 9 (10/102) 3.8 (2.1 to 7.1) a
Diabetes 55(198/359) 42 (84/198) 14 (23/161) 3.0 (2.0 to 4.5) a
Peripheral
vascular disease
43(156/359) 38 (60/156) 23 (47/203) 1.7 (1.2 to 2.3) a
Smoking 58(207/359) 35 (72/207) 23 (35/152) 1.5 (1.1 to 2.1) a
Initial IABF
(< 650 ml/min)
43(155/359) 63 (98/155) 5 (9/204) 14 (7.5 to 27) a
a P<0.001; variables with no significant p value are not shown in table.
When relative risk was calculated for the subset of patients whose access failed as a result
of thrombosis, similar results were obtained as for those patients with vascular access
failure from any cause. Table 4.9 shows that showed that patients with initial IABF less
than 650 ml/min were over 14 times more likely, those older than 65 were 3.8 times more
likely, those with history of diabetes were 3 times more likely, smokers were 1.5 times
more likely, and those with a history of peripheral vascular disease were about 1.7 times
more likely to experience vascular access failure from thrombosis as those without these
characteristics. (Table 4.10)

67
Table 4.10 Relative risk of vascular access failure (VAF) secondary to thrombosis
in patients with AVGs
Variable No. with
characteristic:
% (ratio)
Incidence of
VAF among
patients with
characteristic
% (ratio)
Incidence of
VAF among
patients
without
characteristic
% (ratio)
Relative Risk:
(95% CI)
Age ≥ 65 70 (238/338) 32 (78/238) 8 (8/100) 4.0 (2.0 to 8.1) a
Diabetes 53 (182/338) 137 (68/182) 11 (18/156) 3.2 (2.0 to 5.1) a
Peripheral
vascular disease
42 (144/338) 33 (48/144) 19 (38/194) 1.7 (1.2 to 2.4) a
Smoking 57 (191/338) 29 (56/191) 20 (30/147) 1.5 (1.2 to 2.4) a
Initial IABF
(< 500 ml/min)
40 (135/338) 57 (78/135) 4 (8/203) 15 (7.3 to 29) a
4.2.3 Stratified analysis
The stratified analysis aimed to investigate whether the crude association between
vascular access failure and initial IABF measurement was confounded or modified by
selected socio-demographic and clinical variables. Confounding occurs when the
apparent association between a risk factor and an outcome is affected by the relationship
of a third variable to the risk factor and the outcome; the third variable is called a
confounder. For a variable to be a confounder, the variable must be independently
associated with the risk factor and outcome, but not be in the causal pathway between
risk factor and outcome. To assess for confounding, a series of models with and without
subsets of the potential confounders: age, sex, ethnicity, diabetes, hypertension,
peripheral vascular disease, history of smoking, medications, IABF, and type of

68
procedure were compared. The fully adjusted model containing all the variables listed
above is referred to by Kleinbaum and Klein [213] as the ―gold standard model‖, all
―reduced‖ models are compared to the ―gold standard model‖.
The estimated crude OR for the relationship between vascular access failure and initial
IABF in patients with AVGs was OR 32, (95% CI 18-49). The crude association between
the vascular access failure and the initial IABF remained unchanged after stratification on
each of the socio-demographic (age, sex, and ethnicity) and clinical variables (diabetes
mellitus, hypertension, peripheral vascular disease, history of smoking, medication, initial
IABF, and type of surgical procedure).
4.2.4 Multivariable modeling
One objectives of this study was to construct a statistical model identifying factors that
are associated with vascular access failure in patients on hemodialysis with AVGs.
Addressing this objective, a stepwise logistic modeling procedure was employed in order
to produce a parsimonious model of factors that are associated with vascular access
failure. Modeling was also used to assess whether main effects of various independent
variables were confounded when a new variable was added to the model.
The stratified analysis did not indicate that any variable acted as a confounder or effect
modifier of the association between vascular access failure and initial IABF. The only
variables chosen for inclusion in the multivariable logistic regression analysis were those
found in the univariate analysis to be significantly correlated with vascular access failure.

69
Variables with a p value of <0.25 were selected for multiple regression modeling as
suggested by Hosmer and Lemeshow [214]. Variables that met those criteria were age (≥
65), presence of diabetes, hypertension, peripheral vascular disease, history of smoking,
having a forearm AVG, and having an initial IABF less than 650 ml/min. Sex was not
significant in this analysis (p = 0.5); however in previous research, being female has been
associated with a higher incidence of vascular access failure hypothesized due to smaller
vascular structures in women [215]. Therefore, sex was included in the multiple
regression model despite its lack of statistical significance.
At the multivariable modeling stage of the analysis, assessment for interaction was done.
An interaction occurs when the impact of a risk factor on outcome is changed by the
value of another variable. All possible pairwise interactions were tested and none were
found to be statistically significant. Higher order (three-way) interaction terms, for
instance sex by age by diabetes mellitus, were not considered.
4.2.5 Final model
This analysis yielded a model that includes age, history of diabetes, history of peripheral
vascular disease, and IABF dichotomized at 650 ml/min. Assessment of the model fit
using the Hosmer-Lemeshow goodness of fit test yielded exceptionally high p-values
(p=018). This model was found to have excellent discrimination as determined by the
area under the Receiver Operator Characteristics curve of 0.90 (Fig. 4.6)

70
Fig. 4.6 Area under the Receiver Operating Characteristic Curve: Association
of vascular access failure and initial IABF for patients with AVGs 0.0
00.2
50.5
00.7
51.0
0
Sen
sitiv
ity
0.00 0.25 0.50 0.75 1.001 - Specificity
Area under ROC curve = 0.9052
The final regression model demonstrates that all selected variables, remain statistically
significant (Table 4.11). The odds of experiencing vascular access failure occurred in
those patients with initial IABF of less than 650 ml/min (OR=31 and 95% CI 14-68),
adjusting for all other covariates. A history of diabetes, being older than 65, and a history
of peripheral vascular disease produced odds ratios between 3.5 and 2.5 (Table 4.11),
adjusting for all the other covariates. The calculated coefficients allowed for the
elaboration of a regression equation to predict the occurrence of vascular access failure.
The equation may be applied using the variables selected according to the following
regression significance criteria:

71
Logit p = - 5.1 + [3.4 × IABF (ml/min) (≥650 ml/min = 0, < 650 ml/min = 1)] +
[ 1.2 × Age (<65 years = 0, ≥65 years = 1)] + [1.3 × Diabetes (no = 0, yes = 1)]
+ [0.9 × Peripheral Vascular Disease (no = 0, yes = 1)] .
Table 4.11 Final multiple logistic regression model: Retained dichotomized
variables for vascular access failure in patients with AVGs a
Variable Coefficient OR 95 % Confidence
Interval
P value
IABF_650 b 3.4 31 14 - 68 < 0.001
Age_65 c 1.2 3.2 1.3 – 7.9 < 0.001
Diabetes 1.3 3.5 1.8 – 7.0 < 0.001
PVD 0.9 2.5 1.3 – 4.8 0.005
a Adjusted for age, diabetes, and peripheral vascular disease.
b Initial IABF dichotomized at 650 ml/min.
c Age dichotomized at 65 years.
We did examine further multivariable models to examine if an outcome of thrombosis
was different than the other outcomes. The results of these models was similar to the
results from the classical analysis presented in Table 4.10, and is not presented here.

72
CHAPTER FIVE: DISCUSSION
Among the greatest challenges facing physicians and other health care professionals who
care for patients with chronic renal failure is the preservation of vascular access for
hemodialysis. Vascular access failure is a cause of considerable morbidity, discomfort,
inconvenience and cost. Approximately 20-30% of all hospital admissions for patients
with ESRD are related to complications of vascular access for hemodialysis. In order to
decrease the incidence of vascular access failure and other access-related complications,
the NKF-DOQI guidelines recommend that all vascular accesses undergo regular
monitoring and measurement of the IABF for identification of dynamically significant
dysfunction. Although following these guidelines leads to the identification of access
dysfunction in both AVFs and AVGs, there remains considerable room for improvement
in surveillance. The main objective of this study was to explore the association between
vascular access failure and initial IABF in patients receiving chronic RRT with AVFs or
AVGs.
5.1 Initial IABF
It is clear from our data that the initial IABF is quite different between patients who
develop vascular access failure and those who do not, both for patients with AVFs or
AVGs. Patients who developed access failure had substantially lower IABF values than
patients without vascular failure.

73
In fact, our results show that AVF patients with initial IABF less than 500 mL/min, even
without any additional risk factors, have a 16 % risk of subsequent vascular access failure
and, therefore, should be routinely monitored.
5.2 Patient Characteristics
A secondary objective of this work was to determine patient characteristics associated
with vascular access failure in patients with AVFs and AVGs. In the group of patients
with AVFs, no difference was found between the proportion of those with and without
access failure when categorized by ethnicity, sex, underlying disease, hypertension,
peripheral vascular disease, use of medications, or surgeon. Therefore, these variables are
unlikely to explain the association observed between low initial IABF <500 ml/min) and
vascular access failure. Among these patients, a significant difference in time to access
failure was found between the specific subgroups, including patients older than 65 years,
patients with a history of diabetes, patients who smoke or with a history of smoking, and
patients with a fistula located in the forearm.
In the group of patients with AVGs, no difference was found between the proportion of
those with and without vascular access failure when categorized by ethnicity, sex,
underlying disease, hypertension, smoking, use of medication, surgeon, or type of
procedure. Therefore, these variables are unlikely to explain the association observed
between low initial IABF <650 ml/min and the presence of vascular access failure.
Among these patients, a significant difference in time to access failure was found

74
between the specific subgroups, including patients older than 65 years and patients with
history of diabetes or peripheral vascular disease. These patient characteristics are
discussed in more detail below.
5.2.1 Age
In Canada, the number of elderly people on hemodialysis continues to steadily increase.
For the past 30 years, treatment of elderly patients with chronic renal insufficiency with
hemodialysis has changed from being the exception (less than 10% of the patients older
than 65 years in 1997) to becoming one of the largest age group represented in dialysis
units (more than 49% of the prevalent patients on hemodialysis in 2001). This increase is
due to both greater survival of the dialysis patient within the last few decades and to the
increase in inclusion of elderly patients. The mean age at which dialysis commences has
now reached 64.7 years, and the overall age of the dialysis population has risen to 62.2
years [216].
In elderly people, systemic vascular diseases, especially cardiovascular and
cerebrovascular diseases, are common. As far as could be determined, while there is
much published material dealing with vascular access and other hemodialysis-associated
problems in general, there is little published work dealing with age as a risk factor for
vascular access failure or other hemodialysis associated problems. Some studies used 65
years of age as a cut-off point for the elderly group [217-219], while other studies
adopted 67 years of age [220], 70 years of age [221], or other ages. In the present study,
an age cut-off of 65 years was chosen based on the literature [217-219] and the clinical

75
experience of surgeons doing the procedures in the Calgary Health Region. In contrast to
previous studies [217, 222-224], in which there no significant difference was noticed
between patient age and risk of vascular access failure, our results indicated that for
patients undergoing vascular access creation, age was a risk factor for the vascular access
failure in patients older than 65 years of age in both the AVF and AVG groups. Windus
et al. [224] also found that older age predicted lower vascular access survival. This
suggests that patients who start hemodialysis therapy after 65 years of age need special
attention in order to maintain their vascular access patency, given the fact that the ORs
for access failure were significantly higher in this patient population compared with
patients under 65 years age.
5.2.2 Gender
The present study did not show a significant association between gender and the risk of
vascular access failure. These results were consistent after adjusting for age, presence of
diabetes mellitus, hypertension, history of peripheral vascular disease, smoking history
and type of procedure. An association of female gender with a greater risk for access-
related failure has been reported in two large studies [225, 226], although neither study
investigated the results by access type. Prischl et al.[227] found no significant differences
in access survival between 80 men and 43 women on hemodialysis therapy with a first
AVF. Aman et al.[228] found no gender differences in access failure or complication
rates in 91 patients with PTFE grafts. Feldman et al.[225] suggested that differences in
vessel diameter may account for the increased access-related morbidity experienced by
women in their study. In a report on surgical placement of AV fistulae. Reilly et al [229]

76
found that vein size was a significant predictor of subsequent fistula survival, although
gender was not. A more recent European study also found that small vessel size predicted
fistula failure in the first 3 months after surgery [230].
5.2.3 Co-morbid illnesses
Our study also evaluated the association of co-morbid illnesses with vascular access
failure. For both the AVF and AVG groups, there was a significant difference in vascular
access failure between patients with diabetes and those without, consistent with a
previous report [224].
The present study also confirms an earlier report [231] of a significant association
between a history of peripheral vascular disease and subsequent access failures in patients
with AVGs. This association is not surprising, because the condition of the native
vasculature is likely a determinant of the adequacy of any access created. The
pathophysiological characteristics of peripheral vascular disease and vascular access
complications may also be similar. It has been postulated that peripheral vascular disease
may compromise blood flow in the access, producing a greater risk for thrombosis [232].
In the present study, the association of peripheral vascular disease and access failure was
present only for patients with AVGs — patients in which the vascular anatomy did not
permit the construction of a native AVF. In the present study, the decision of placing a
fistula versus a graft was made directly by the surgeon intraoperatively.

77
5.2.4 Smoking
Smoking history has been examined in a few studies of vascular access morbidity, with
inconsistent results [223, 229, 233]. In the present study, current or previous smoking
was associated with an OR of 6 (95% CI, 3 to 12) for subsequent vascular access failure
in the AVF group of patients. Previous peripheral vascular damage in both former and
active smokers, leading to acute access thrombosis, may partially explain this
observation. In patients with initial IABF greater than 500 ml/min, smoking is associated
with an increase risk of vascular access failure of approximately 3.5%, suggesting that
these patients should have routine vascular access monitoring. The utility of routine
vascular access monitoring in patients with IABF greater than 500 ml/min and no history
of smoking should be questioned.
5.3 Vascular Access Characteristics
Another secondary objective of this work was to determine vascular access
characteristics associated with vascular access failure in patients with AVFs and AVGs.
Polytetrafluoroethylene (PTFE) dialysis grafts have decreased longevity compared with
native arteriovenous fistulas [217, 220, 221] and are more prone to recurrent stenosis,
thrombosis and infection [217]. Recognizing the superiority of fistulas over grafts, the
NKF-DOQI guidelines on vascular access recommend an aggressive approach to the
creation of fistulas. AVGs should be reserved for patients whose vascular anatomy does
not permit the construction of a native AVF. Of all vascular accesses evaluated in this

78
study, 831 (70 %) were AVFs, and 30% were AVGs. The AVF utilization in this study
(70 %) is higher than in the USA (32 %) and similar to that in Europe (74 %) [228, 234].
According to the Canadian Organ Replacement Registry the prevalence of AVFs and
AVGs in the Canadian population is 53% and 14% respectively, compared with our
cohort population that showed a significant number AVFs, superseding the goal of 50%
recommended in the NKF-DOQI guidelines. This high percentage of fistulae in the
Southern Alberta Renal Program reflects an aggressive division policy in terms of
vascular access placement.
5.4 Study Strengths
There is limited information in the literature on the relationship between initial IABF and
vascular access failure in patients with chronic renal failure receiving chronic
replacement therapy. To our knowledge, this is the largest study of patients with fistulas
and grafts in which initial IABF measurement was obtained for evaluation of its impact
on vascular access failure. In addition, baseline co-morbid and demographic data were
collected in a comprehensive, detailed, validated manner which enabled us to investigate
the effect of these variables on failure of vascular access, the outcome of interest.
The present study was a population-based retrospective cohort study of prospectively
collected patient data. This design reduced the impact of selection bias, because all
incident hemodialysis patients with a mature access(either AVF or AVG)—meaning at
least one successful functional cannulation for the purposes of dialysis affording an

79
extracorporeal blood flow of at least 300 ml per minute, for at least 3 hours—were
included in the study sample. Cohort studies sometimes lose subjects at follow-up, In this
study, 98% (1190) patients had complete follow-up and 2% (22) had incomplete follow-
up (their data were excluded). The patients that were excluded were only those that died
who had not reached the primary outcome i.e. it was less than 6 months, and their
vascular access had not failed. Patients who had a vascular access failure within the first
6 months, and then subsequently died, were included as they met the primary outcome
definition for the study. Patients excluded were so as the longevity of that access could
not be determined. Loss to follow-up bias can occur when there are differences in
completeness of follow-up between comparison groups. However, when comparing
baseline patients and access characteristics between those who were lost to follow-up and
those who completed the study, we found that the two groups were very similar. Patients
who were excluded likely suffered a cardiovascular event as their cause of death.
Cardiovascular events are the leading cause of death in patients with ESRD on dialysis. If
so, these patients may have had both diminished IABF (through impaired cardiac
performance) and would have had an increased risk of vascular access failure due to their
vascular disease. By excluding these patients, our results may have underestimated the
association of IABF with vascular access failure.
Patient data was abstracted electronically from two patient care databases, SARP and
ALTRA. Staff in the Department of Nephrology and Transplantation maintains these
databases, and data quality is assured by the staff. Thus, information bias, due to data
abstraction, or data entry is considered to be unlikely. Measurement bias can arise from

80
the choice of tools one uses to measure. In this study, measurement of the IABF
(exposure) was done in duplicate by trained nurses using the same technique, factors that
reduced the variability and therefore the measurement bias. Any misclassification of
baseline data was most likely of the non-differential variety, as the outcome was
unknown at the time of the collection. Similarly, differential misclassification of the
outcome was unlikely, as the exposure was unknown by the access nurses at the time the
outcome occurred. Thus, the misclassification of outcome or exposure was not likely to
be dependent on the exposure or outcome, respectively.
5.5 Study Limitations
In any study, it is important to assess whether the results cold have been influenced by
any sources of bias. Bias can be introduced through the measurement of information
(information bias), the methods used to identify and recruit subjects (selection bias), or
through confounding.
Regarding measurement bias, as databases were reviewed to collect the information on
the study variables, the accuracy of the results depends upon the quality of the
information recorded in these databases. These databases are maintained for
administrative and research purposes. The information on certain important variables
may not have been recorded or may have been recorded casually or incompletely. For
example, information on the amount smoked or number of years smoking could not be
collected, as this information was frequently missed or appeared incorrect. Similarly,

81
thrombolytic agents have been shown to extend the longevity of the access by reduction
of thrombosis, but we did not have information on the use of this therapy.
Selection bias is error due to systematic differences in characteristics between those who
are selected for a study and those who are not. A potential source of selection bias in the
study is the fact that patients who required angioplasty to correct an immature access or
failure before the first successful cannulation were not included in the study. The
rationale for exclusion was that this type of procedure changes the hemodynamics of the
vascular access, making it difficult to determine the real value of the initial intra-access
blood flow as a predictor of failure.
Our study definition of vascular access failure (primary outcome) was defined as any
event of thrombosis, the need for surgical or endovascular revision with angioplasty, or
the abandonment of the access site, whichever came first following initial cannulation
and achievement of adequate dialysis. Defining angioplasty as primary outcome may
have introduced another source of selection bias. This is because the guidelines of
vascular access surveillance recommend angiogram/angioplasty for vascular access with
intra-access blood flow less than 500 ml/min for AVFs and 650 ml/min for AVGs.
Patients with intra-access flows less than the numbers mentioned above would be more
likely to have an angiogram and detection of vascular access dysfunction to be treated
with angioplasty, thus satisfying the definition of primary outcome used in this study. On
the other hand, patients with intra-access blood flow greater than the guideline numbers
would be unlikely to be sent for angiography, and the presence of potential

82
arterial/venous stenosis as a cause of the vascular access dysfunction may not be
diagnosed. Therefore, guidelines and clinical practice during the interval that patients
were recruited, might have affected the use of radiological tests to evaluate for the
presence of stenosis, and resulted in differential use of angioplasty. This effect may have
been a systematic differential effect between groups: being higher in the cohort with low
access flow, and present in both strata (AVF’s and AVG’s).
Another potential threat to the internal validity of this study is the inability to measure all
confounding variables. Although the data collected from the two databases were very rich
and generally of high quality, there is a possibility that some variables that confound the
relationships we tried to explore may not have been included. For example, a stenosis or
abnormalities of the central veins, secondary to previous jugular or subclavian catheters
prior to the creation of a permanent access in the extremities, could have an impact on the
risk of vascular access. Likewise, thrombolytic agents, have been shown to extend the
longevity of the access by reduction of thrombosis, but we did not have access to data on
this use of this therapy.
Using the cut-off values of 65 years of age and IABF at 500 ml/min and 650 ml/min for
AVF and AVG respectively may lead to a loss of information and consequently obscure
associations that may be present in the data. Further analysis of the data could include an
exploratory analysis of the data with both age and IABF examined as continuous
variables.

83
Another limitation of the study is the short time to follow-up: only 6 months. It is well
known that many vascular access failures can occur after this time frame. Early vascular
access failure is more common in AVFs than AVGs and is due in part to adventitial
bands, a traumatized vein, twisted veins, and veins with proximal stenosis or sclerosis
from previous phlebitis or venipunctures. The primary patency of a surgically created
vascular access—the initial failure of any access, whether it has matured or not (i.e. been
successfully cannulated and used for dialysis), starting from the operative procedure—is
approximately 60%. As many as 30% of newly placed AVFs will fail within the first
three months of initial successful cannulation. On the other hand, if the AVF continues to
be functional beyond this point, it has lower long-term complications and failure rates
than any other alternative long term vascular access. AVGs have a lower incidence of
early vascular access failure than AVFs because they are anastomosed to more proximal
vessels in the forearm; the incidence of failure may increase after 6 months. However, it
is the practical experience of the local surgical group, that identifying failure within a 6
month time period is clinically important.
Finally, when generalizing the study results to other hemodialysis populations, it is
important to take into account the eligibility criteria of the study. The population of
interest was chronic hemodialysis patients within the Southern Alberta Renal Program,
and a primary criterion for study eligibility was that the patient had a vascular access
(AVF/AVG) with first cannulation of the access and adequate dialysis achieved.
Therefore the results of this study may be generalized to chronic hemodialysis patients

84
with similar characteristics undergoing similar treatment in other health regions in
Canada.
5.6 Conclusions and Recommendations
Vascular access failure remains a cause of frequent and costly morbidity in patients
receiving chronic hemodialysis. Investigation of determinants of vascular access failure
in both AVF and AVG patients will have direct implications for patient care. First, it will
allow us to potentially identify subgroups of patients at higher risk of vascular access
failure and to consider modifying our surveillance of fistulas and grafts accordingly.
Given that there is a subgroup of patients at higher risk, efforts need to be directed toward
to finding ways for early prediction and prevention of vascular access failure in this
population. Second, increased surveillance of high risk patients may identify a greater
number of patients that can under go fistula/graft rescue therapy with balloon angioplasty
to prevent total fistula/graft failure. Third, a modification of surveillance systems
according to risk group, may result in cost savings for the health care system.
This study produced findings to help identify a group of patients at high risk of vascular
access failure and for whom the current guidelines of access monitoring (monthly) should
be followed given the high incidence of vascular access failure. The results demonstrated
that the initial IABF was indeed a powerful predictor of vascular access failure.
Additionally, the study identified other risk factors in patients with AVFs (age ≥65 years,
history of diabetes and smoking, and the presence of forearm arteriovenous fistula) and in

85
patients with AVGs (age ≥65 years, history of diabetes, and peripheral vascular disease).
Thus, to improve patency rates, the focus should be on this high-risk group of patients.
However for the group of patients considered low risk, the guidelines of monthly
monitoring may be excessive. Also, health care system cost may decrease if minimal
surveillance is provided for patients in the low risk group.
The findings of our study suggest that for many hemodialysis patients (diabetics, or
patients older than 65 years), the likelihood of vascular access failure is high, and that
they will very likely require a second dialysis access procedure. Miller et al [235]
reported similar results. Thus, in these subsets of patients, it might be reasonable to
construct the initial fistula in the upper arm rather than the forearm, despite the NKF-
DOQI guidelines recommend creating a forearm fistula in preference to an upper arm
fistula. Such a strategy would maximize the probability that the first fistula constructed
would be usable for dialysis. This would not only improve outcomes but would also
decrease cost.
Current guidelines aimed to prevent vascular access failure are resource intensive, and
based on ongoing surveillance of all patients with early intervention in those with
evidence of vascular access dysfunction. The results of our study offer novel findings
and a more directive approach to surveillance techniques. Specifically we have identified
a set of clinical risk factors and vascular access characteristics that identify hemodialysis
patients with low initial intra-access blood flow most at risk of developing vascular
access failure. These clinical risk factors can be used to guide a more directive approach

86
and development of a vascular access screening protocol. Further work is required to
confirm these initial findings, and to translate this work into meaningful clinical practice.
Here are 2 examples of projects which are reasonable extensions of our results, and work
which would reasonably follow our initial results. The first project might be to examine
the utility of an intensive ongoing screening program with versus an initial measurement
of IABF only in patients with no other identified risk factors. If the results of our research
are correct, we would hypothesize that patients with normal initial IABF and no other
risk factors would have a very low probably of vascular access failure, and therefore, no
regular monitoring is required. Therefore, normal clinical practice would dictate that all
patients will have an initial IABF measurement. In patients with normal IABF and no
other risk factors, we could randomize them into 2 groups: an ongoing intensive
monitoring program, and no monitoring, with an outcome of vascular access failure (at 6
months, 1 year, et cetera). If our hypothesis was correct, there might be a significant cost-
savings to no longer monitoring patients who are at low risk, freeing up nurses for either
more intensive monitoring of patients at high risk, or for other tasks. An example of a
second project might be to target patients at higher risk for vascular access failure, with a
modifiable risk factor: for example, smoking. A reasonable research study might be to
randomize patients to a smoking cessation program—stratified by IABF measurement—
to see if such a program either affects subsequent changes in IABF and also changes the
subsequent probability of vascular access failure. In summary, our results are suggestive
of further research which might assist in modifying vascular access monitoring methods,
identifying treatment interventions which might modify the risk of vascular access
failure, and examine the most cost-effective method of delivering this technology.
87
REFERENCES
1. Collins, A.J., et al., Excerpts from the United States Renal Data System 2004
annual data report: atlas of end-stage renal disease in the United States. Am. J.
Kidney Dis., 2005. 45(1 Suppl 1): p. A5-7.
2. Collins, A.J., End-stage renal disease. Are we ready for an emerging epidemic?
Postgrad. Med., 2000. 108(1): p. 13-5.
3. Eknoyan, G., et al., The national epidemic of chronic kidney disease. What we
know and what we can do. Postgrad. Med., 2001. 110(3): p. 23-9: quiz 8.
4. Lee, G., End-stage renal disease in the Asian-Pacific region. Semin. Nephrol.,
2003. 23(1): p. 107-14.
5. Stengel, B., et al., Trends in the incidence of renal replacement therapy for end-
stage renal disease in Europe, 1990-1999. Nephrol. Dial. Transplant., 2003.
18(9): p. 1824-33.
6. Sakhuja, V. and K. Sud, End-stage renal disease in India and Pakistan: burden of
disease and management issues. Kidney Int. Suppl., 2003. 63(S83): p. S115-8.
7. Barsoum, R.S., Overview: end-stage renal disease in the developing world. Artif.
Organs, 2002. 26(9): p. 737-46.
8. Kher, V., End-stage renal disease in developing countries. Kidney Int., 2002.
62(1): p. 350-62.
9. U.S. Renal Data System, USRDS 2002 Annual Data Report: Atlas of End-Stage
Renal Disease in the United States. 2002, Bethesda, MD: National Institutes of
Health, National Institute of Diabetes and Digestive and Kidney Diseases.

88
10. Rosansky, S.J. and K. Jackson, Rate of change of end-stage renal disease
treatment incidence 1978-1987--has there been selection? J. Am. Soc. Nephrol.,
1992. 2(10): p. 1502-6.
11. Moulton, L.H., et al., Patterns of low incidence of treated end-stage renal disease
among the elderly. Am. J. Kidney Dis., 1992. 20(1): p. 55-62.
12. Russell, A., et al., Increasing incidence of end-stage renal disease in Wisconsin:
an unintended consequence of increased survival? WMJ, 2001. 100(6): p. 35-8.
13. Tonelli, M., et al., Association between proximity to the attending nephrologist
and mortality among patients receiving hemodialysis. CMAJ, 2007. 177(9): p.
1039-44.
14. U.S. Renal Data System, USRDS 2001 Annual Data Report: Atlas of End-Stage
Renal Disease in the United States. 2001, Bethesda, MD: National Institutes of
Health, National Institute of Diabetes and Digestive and Kidney Diseases.
15. The economic cost of ESRD, vascular access procedures, and Medicare spending
for alternative modalities of treatment. USRDS. United States Renal Data System.
Am. J. Kidney Dis., 1997. 30(2 Suppl 1): p. S160-77.
16. Feldman, H.I., S. Kobrin, and A. Wasserstein, Hemodialysis vascular access
morbidity. J. Am. Soc. Nephrol., 1996. 7(4): p. 523-35.
17. Lazarus, J.M., et al., Contribution of vascular access-related disease to morbidity
of hemodialysis, in Vascular Access for Hemodialysis III, M.L. Henry and R.M.
Ferguson, Editors. 1993, Gore and Associates and Precept Press: Chicago. p. 23-
42.

89
18. Schwab, S.J., et al., Vascular access for hemodialysis. Kidney Int., 1999. 55(5): p.
2078-90.
19. NKF-DOQI clinical practice guidelines for vascular access. National Kidney
Foundation-Dialysis Outcomes Quality Initiative. Am. J. Kidney Dis., 1997. 30(4
Suppl 3): p. S150-91.
20. Fan, P.Y. and S.J. Schwab, Vascular access: concepts for the 1990s. J. Am. Soc.
Nephrol., 1992. 3(1): p. 1-11.
21. Windus, D.W., Permanent vascular access: a nephrologist's view. Am. J. Kidney
Dis., 1993. 21(5): p. 457-71.
22. Ascher, E., et al., Changes in the practice of angioaccess surgery: impact of
dialysis outcome and quality initiative recommendations. J. Vasc. Surg., 2000.
31(1 Pt 1): p. 84-92.
23. Bosch, J.P. and B.A. Walters, Quality assurance and continuous quality
improvement in the management of vascular access. Contrib. Nephrol.,
2002(137): p. 60-9.
24. Collins, A.J., et al., United States Renal Data System assessment of the impact of
the National Kidney Foundation-Dialysis Outcomes Quality Initiative guidelines.
Am. J. Kidney Dis., 2002. 39(4): p. 784-95.
25. van Andringa de Kempenaer, T., P. ten Have, and J. Oskam, Improving quality of
vascular access care for hemodialysis patients. Jt. Comm. J. Qual. Saf., 2003.
29(4): p. 191-8.
26. III. NKF-K/DOQI Clinical Practice Guidelines for Vascular Access: update 2000.
Am. J. Kidney Dis., 2001. 37(1 Suppl 1): p. S137-81.

90
27. Paulson, W.D., Blood flow surveillance of hemodialysis grafts and the dysfunction
hypothesis. Semin. Dial., 2001. 14(3): p. 175-80.
28. K/DOQI clinical practice guidelines for chronic kidney disease: evaluation,
classification, and stratification. Am. J. Kidney Dis., 2002. 39(2 Suppl 1): p. S1-
266.
29. Weiner, D.E., Causes and consequences of chronic kidney disease: implications
for managed health care. J. Manag. Care Pharm., 2007. 13(3 Suppl): p. S1-9.
30. Remuzzi, G. and T. Bertani, Pathophysiology of progressive nephropathies. N.
Engl. J. Med., 1998. 339(20): p. 1448-56.
31. Goldman, L. and D. Ausiello, eds. Cecil Medicine. 23rd Edition ed. 2008,
Saunders Elsevier: Philadelphia.
32. Hostetter, T.H., et al., Hyperfiltration in remnant nephrons: a potentially adverse
response to renal ablation. J. Am. Soc. Nephrol., 2001. 12(6): p. 1315-25.
33. Brenner, B.M., T.W. Meyer, and T.H. Hostetter, Dietary protein intake and the
progressive nature of kidney disease: the role of hemodynamically mediated
glomerular injury in the pathogenesis of progressive glomerular sclerosis in
aging, renal ablation, and intrinsic renal disease. N. Engl. J. Med., 1982.
307(11): p. 652-9.
34. Brenner, B.M. and H.S. Mackenzie, Nephron mass as a risk factor for
progression of renal disease. Kidney Int. Suppl., 1997. 52(S63): p. S124-7.
35. Nath, K.A., The tubulointerstitium in progressive renal disease. Kidney Int.,
1998. 54(3): p. 992-4.

91
36. Keane, W.F., Proteinuria: its clinical importance and role in progressive renal
disease. Am. J. Kidney Dis, 2000. 35(4 Suppl 1): p. S97-105.
37. Levey, A.S., et al., National Kidney Foundation practice guidelines for chronic
kidney disease: evaluation, classification, and stratification. Ann. Intern. Med.,
2003. 139(2): p. 137-47.
38. Levey, A.S., et al., Definition and classification of chronic kidney disease: a
position statement from Kidney Disease: Improving Global Outcomes (KDIGO).
Kidney Int., 2005. 67(6): p. 2089-100.
39. Chadban, S.J. and F.L. Ierino, Welcome to the era of CKD and the eGFR. Med. J.
Aust., 2005. 183(3): p. 117-8.
40. Snyder, S. and B. Pendergraph, Detection and evaluation of chronic kidney
disease. Am. Fam. Physician, 2005. 72(9): p. 1723-32.
41. MacGregor, M.S., D.E. Boag, and A. Innes, Chronic kidney disease: evolving
strategies for detection and management of impaired renal function. QJM, 2006.
99(6): p. 365-75.
42. Hoang, K., et al., Determinants of glomerular hypofiltration in aging humans.
Kidney Int., 2003. 64(4): p. 1417-24.
43. Pereira, B.J., Optimization of pre-ESRD care: the key to improved dialysis
outcomes. Kidney Int., 2000. 57(1): p. 351-65.
44. Giatras, I., J. Lau, and A.S. Levey, Effect of angiotensin-converting enzyme
inhibitors on the progression of nondiabetic renal disease: a meta-analysis of
randomized trials. Angiotensin-Converting-Enzyme Inhibition and Progressive
Renal Disease Study Group. Ann. Intern. Med., 1997. 127(5): p. 337-45.

92
45. Astor, B.C., et al., Timing of nephrologist referral and arteriovenous access use:
the CHOICE Study. Am. J. Kidney Dis., 2001. 38(3): p. 494-501.
46. Goransson, L.G. and H. Bergrem, Consequences of late referral of patients with
end-stage renal disease. J. Intern. Med., 2001. 250(2): p. 154-9.
47. Jungers, P., Late referral: loss of chance for the patient, loss of money for society.
Nephrol. Dial. Transplant., 2002. 17(3): p. 371-5.
48. Kinchen, K.S., et al., The timing of specialist evaluation in chronic kidney disease
and mortality. Ann. Intern. Med., 2002. 137(6): p. 479-86.
49. Kessler, M., et al., Impact of nephrology referral on early and midterm outcomes
in ESRD: EPidemiologie de l'Insuffisance REnale chronique terminale en
Lorraine (EPIREL): results of a 2-year, prospective, community-based study. Am.
J. Kidney Dis., 2003. 42(3): p. 474-85.
50. St Peter, W.L., et al., Chronic kidney disease: issues and establishing programs
and clinics for improved patient outcomes. Am. J. Kidney Dis., 2003. 41(5): p.
903-24.
51. Roubicek, C., et al., Timing of nephrology referral: influence on mortality and
morbidity. Am. J. Kidney Dis., 2000. 36(1): p. 35-41.
52. Arora, P., et al., Prevalence, predictors, and consequences of late nephrology
referral at a tertiary care center. J. Am. Soc. Nephrol., 1999. 10(6): p. 1281-6.
53. Lameire, N. and W. Van Biesen, The pattern of referral of patients with end-stage
renal disease to the nephrologist--a European survey. Nephrol. Dial. Transplant.,
1999. 14 Suppl 6: p. 16-23.

93
54. Schmidt, R.J., et al., Early referral and its impact on emergent first dialyses,
health care costs, and outcome. Am. J. Kidney Dis., 1998. 32(2): p. 278-83.
55. Korevaar, J.C., et al., When to initiate dialysis: effect of proposed US guidelines
on survival. Lancet, 2001. 358(9287): p. 1046-50.
56. Korevaar, J.C., et al., Evaluation of DOQI guidelines: early start of dialysis
treatment is not associated with better health-related quality of life. National
Kidney Foundation-Dialysis Outcomes Quality Initiative. Am. J. Kidney Dis.,
2002. 39(1): p. 108-15.
57. Ellis, P.A., et al., Late referral of end-stage renal failure. QJM, 1998. 91(11): p.
727-32.
58. Ifudu, O., et al., Delayed referral of black, Hispanic, and older patients with
chronic renal failure. Am. J. Kidney Dis., 1999. 33(4): p. 728-33.
59. Sekkarie, M., M. Cosma, and D. Mendelssohn, Nonreferral and nonacceptance to
dialysis by primary care physicians and nephrologists in Canada and the United
States. Am. J. Kidney Dis., 2001. 38(1): p. 36-41.
60. Coresh, J., et al., Prevalence of chronic kidney disease and decreased kidney
function in the adult US population: Third National Health and Nutrition
Examination Survey. Am. J. Kidney Dis., 2003. 41(1): p. 1-12.
61. Coresh, J., et al., Prevalence of chronic kidney disease in the United States.
JAMA, 2007. 298(17): p. 2038-47.
62. Coresh, J., et al., Chronic kidney disease awareness, prevalence, and trends
among U.S. adults, 1999 to 2000. J. Am. Soc. Nephrol., 2005. 16(1): p. 180-8.

94
63. Obrador, G.T., B.J. Pereira, and A.T. Kausz, Chronic kidney disease in the United
States: an underrecognized problem. Semin. Nephrol., 2002. 22(6): p. 441-8.
64. U.S. Renal Data System, USRDS 2003 Annual Data Report: Atlas of End Stage
Renal Disease in the United States 2004, Bethesda, MD: National Institutes of
Health, National Institute of Diabetes and Digestive and Kidney Diseases.
65. Haroun, M.K., et al., Risk factors for chronic kidney disease: a prospective study
of 23,534 men and women in Washington County, Maryland. J. Am. Soc.
Nephrol., 2003. 14(11): p. 2934-41.
66. Pascual, J.M., et al., Long-term impact of systolic blood pressure and glycemia on
the development of microalbuminuria in essential hypertension. Hypertension,
2005. 45(6): p. 1125-30.
67. Klag, M.J., et al., Blood pressure and end-stage renal disease in men. N. Engl. J.
Med., 1996. 334(1): p. 13-8.
68. Hsu, C.Y., et al., Elevated blood pressure and risk of end-stage renal disease in
subjects without baseline kidney disease. Arch. Intern. Med., 2005. 165(8): p.
923-8.
69. Tozawa, M., et al., Blood pressure predicts risk of developing end-stage renal
disease in men and women. Hypertension, 2003. 41(6): p. 1341-5.
70. National High Blood Pressure Education Program Working Group report on
hypertension in diabetes. Hypertension, 1994. 23(2): p. 145-58; discussion 159-
60.
71. Hunsicker, L.G., et al., Predictors of the progression of renal disease in the
Modification of Diet in Renal Disease Study. Kidney Int., 1997. 51(6): p. 1908-19.

95
72. Young, E.W., et al., Hemodialysis vascular access preferences and outcomes in
the Dialysis Outcomes and Practice Patterns Study (DOPPS). Kidney Int., 2002.
61(6): p. 2266-71.
73. Vupputuri, S., et al., Effect of blood pressure on early decline in kidney function
among hypertensive men. Hypertension, 2003. 42(6): p. 1144-9.
74. Ramirez, S.P., et al., Risk factors for proteinuria in a large, multiracial, southeast
Asian population. J. Am. Soc. Nephrol., 2002. 13(7): p. 1907-17.
75. Perry, H.M., Jr., et al., Early predictors of 15-year end-stage renal disease in
hypertensive patients. Hypertension, 1995. 25(4 Pt 1): p. 587-94.
76. Bakris, G.L., et al., Preserving renal function in adults with hypertension and
diabetes: a consensus approach. National Kidney Foundation Hypertension and
Diabetes Executive Committees Working Group. Am. J. Kidney Dis., 2000. 36(3):
p. 646-61.
77. 1995 update of the working group reports on chronic renal failure and
renovascular hypertension. National High Blood Pressure Education Program
Working Group. Arch. Intern. Med., 1996. 156(17): p. 1938-47.
78. Chobanian, A.V., et al., Seventh report of the Joint National Committee on
Prevention, Detection, Evaluation, and Treatment of High Blood Pressure.
Hypertension, 2003. 42(6): p. 1206-52.
79. Ohkubo, Y., et al., Intensive insulin therapy prevents the progression of diabetic
microvascular complications in Japanese patients with non-insulin-dependent
diabetes mellitus: a randomized prospective 6-year study. Diabetes Res. Clin.
Pract., 1995. 28(2): p. 103-17.

96
80. Abraira, C., et al., Veterans Affairs Cooperative Study on glycemic control and
complications in type II diabetes (VA CSDM). Results of the feasibility trial.
Veterans Affairs Cooperative Study in Type II Diabetes. Diabetes Care, 1995.
18(8): p. 1113-23.
81. Kawamori, R. and T. Kamada, Determination of the glycemic threshold for the
regression or prevention of diabetic microangiopathies, and the insulin injection
regimen to establish strict glycemic control in NIDDM. Jpn. J. Med., 1991. 30(6):
p. 618-21.
82. The Diabetes Control and Complications Trial Research Group. The effect of
intensive treatment of diabetes on the development and progression of long-term
complications in insulin-dependant diabetes mellitus. N. Engl. J. Med., 1993. 329:
p. 977-86.
83. The Diabetes Control and Complications (DCCT) Research Group. The effect of
intensive treatment of diabetes on the development and progression of diabetic
nephropathy in the Diabetes Control and Complications Trial. Kidney Int., 1995.
47: p. 1703-20.
84. Levin, A., et al., Cardiovascular disease in patients with chronic kidney disease:
getting to the heart of the matter. Am. J. Kidney Dis., 2001. 38(6): p. 1398-407.
85. Shlipak, M.G., et al., Cardiovascular disease risk status in elderly persons with
renal insufficiency. Kidney Int., 2002. 62(3): p. 997-1004.
86. Buller, C.E., et al., The profile of cardiac patients with renal artery stenosis. J.
Am. Coll. Cardiol., 2004. 43(9): p. 1606-13.

97
87. Matts, J.P., et al., Serum creatinine as an independent predictor of coronary heart
disease mortality in normotensive survivors of myocardial infarction. POSCH
Group. J. Fam. Pract., 1993. 36(5): p. 497-503.
88. Anderson, R.J., et al., Renal failure predisposes patients to adverse outcome after
coronary artery bypass surgery. VA Cooperative Study #5. Kidney Int., 1999.
55(3): p. 1057-62.
89. Rubenstein, M.H., et al., Are patients with renal failure good candidates for
percutaneous coronary revascularization in the new device era? Circulation,
2000. 102(24): p. 2966-72.
90. Szczech, L.A., et al., Differential survival after coronary revascularization
procedures among patients with renal insufficiency. Kidney Int., 2001. 60(1): p.
292-9.
91. Szczech, L.A., et al., Outcomes of patients with chronic renal insufficiency in the
bypass angioplasty revascularization investigation. Circulation, 2002. 105(19): p.
2253-8.
92. Mann, J.F., et al., Renal insufficiency as a predictor of cardiovascular outcomes
and the impact of ramipril: the HOPE randomized trial. Ann. Intern. Med., 2001.
134(8): p. 629-36.
93. McCullough, P.A., et al., Risks associated with renal dysfunction in patients in the
coronary care unit. J. Am. Coll. Cardiol., 2000. 36(3): p. 679-84.
94. Wright, R.S., et al., Acute myocardial infarction and renal dysfunction: a high-
risk combination. Ann. Intern. Med., 2002. 137(7): p. 563-70.

98
95. Shlipak, M.G., et al., Association of renal insufficiency with treatment and
outcomes after myocardial infarction in elderly patients. Ann. Intern. Med., 2002.
137(7): p. 555-62.
96. Reis, S.E., et al., Mild renal insufficiency is associated with angiographic
coronary artery disease in women. Circulation, 2002. 105(24): p. 2826-9.
97. Best, P.J., et al., The impact of renal insufficiency on clinical outcomes in patients
undergoing percutaneous coronary interventions. J. Am. Coll. Cardiol., 2002.
39(7): p. 1113-9.
98. Walsh, C.R., et al., Elevated serum creatinine is associated with 1-year mortality
after acute myocardial infarction. Am. Heart J., 2002. 144(6): p. 1003-11.
99. Al Suwaidi, J., et al., Prognostic implications of abnormalities in renal function in
patients with acute coronary syndromes. Circulation, 2002. 106(8): p. 974-80.
100. Januzzi, J.L., Jr., et al., Benefits and safety of tirofiban among acute coronary
syndrome patients with mild to moderate renal insufficiency: results from the
Platelet Receptor Inhibition in Ischemic Syndrome Management in Patients
Limited by Unstable Signs and Symptoms (PRISM-PLUS) trial. Circulation, 2002.
105(20): p. 2361-6.
101. Wison, S., et al., Renal function and risk stratification in acute coronary
syndromes. Am. J. Cardiol., 2003. 91(9): p. 1051-4.
102. Smith, S.M., W.E. Hoy, and L. Cobb, Low incidence of glomerulosclerosis in
normal kidneys. Arch. Pathol. Lab. Med., 1989. 113(11): p. 1253-5.

99
103. Jorgensen, L., et al., The relationship between atherosclerosis of the thoracic
aorta and renal scarring in an autopsy material. Acta Pathol. Microbiol.
Immunol. Scand. [A], 1985. 93(5): p. 251-5.
104. Cases, A. and E. Coll, Dyslipidemia and the progression of renal disease in
chronic renal failure patients. Kidney Int. Suppl., 2005(99): p. S87-93.
105. Hsu, C.Y., et al., Diabetes, hemoglobin A(1c), cholesterol, and the risk of
moderate chronic renal insufficiency in an ambulatory population. Am. J. Kidney
Dis., 2000. 36(2): p. 272-81.
106. Moorhead, J.F., et al., Lipid nephrotoxicity in chronic progressive glomerular and
tubulo-interstitial disease. Lancet, 1982. 2(8311): p. 1309-11.
107. Brouhard, B.H., et al., Lipoprotein abnormalities in the progression of renal
disease. Cleve. Clin. J. Med., 1990. 57(7): p. 599-604.
108. Fried, L.F., T.J. Orchard, and B.L. Kasiske, Effect of lipid reduction on the
progression of renal disease: a meta-analysis. Kidney Int., 2001. 59(1): p. 260-9.
109. Orth, S.R., et al., Smoking as a risk factor for end-stage renal failure in men with
primary renal disease. Kidney Int., 1998. 54(3): p. 926-31.
110. Chuahirun, T., et al., Cigarette smoking exacerbates and its cessation ameliorates
renal injury in type 2 diabetes. Am. J. Med. Sci., 2004. 327(2): p. 57-67.
111. Halimi, J.M., et al., Effects of current smoking and smoking discontinuation on
renal function and proteinuria in the general population. Kidney Int., 2000.
58(3): p. 1285-92.

100
112. Briganti, E.M., et al., Smoking is associated with renal impairment and
proteinuria in the normal population: the AusDiab kidney study. Australian
Diabetes, Obesity and Lifestyle Study. Am. J. Kidney Dis., 2002. 40(4): p. 704-12.
113. Schiffl, H., S.M. Lang, and R. Fischer, Stopping smoking slows accelerated
progression of renal failure in primary renal disease. J. Nephrol., 2002. 15(3): p.
270-4.
114. Praga, M., et al., Influence of obesity on the appearance of proteinuria and renal
insufficiency after unilateral nephrectomy. Kidney Int., 2000. 58(5): p. 2111-8.
115. Bonnet, F., et al., Excessive body weight as a new independent risk factor for
clinical and pathological progression in primary IgA nephritis. Am. J. Kidney
Dis., 2001. 37(4): p. 720-7.
116. Kambham, N., et al., Obesity-related glomerulopathy: an emerging epidemic.
Kidney Int., 2001. 59(4): p. 1498-509.
117. Hsu, C.Y., et al., Body mass index and risk for end-stage renal disease. Ann.
Intern. Med., 2006. 144(1): p. 21-8.
118. Chagnac, A., et al., The effects of weight loss on renal function in patients with
severe obesity. J. Am. Soc. Nephrol., 2003. 14(6): p. 1480-6.
119. Stengel, B., et al., Lifestyle factors, obesity and the risk of chronic kidney disease.
Epidemiology, 2003. 14(4): p. 479-87.
120. Vupputuri, S. and D.P. Sandler, Lifestyle risk factors and chronic kidney disease.
Ann. Epidemiol., 2003. 13(10): p. 712-20.

101
121. Mitsnefes, M.M., P. Khoury, and P.T. McEnery, Body mass index and allograft
function in pediatric renal transplantation. Pediatr. Nephrol., 2002. 17(7): p. 535-
9.
122. Pinto-Sietsma, S.J., et al., Urinary albumin excretion is associated with renal
functional abnormalities in a nondiabetic population. J. Am. Soc. Nephrol., 2000.
11(10): p. 1882-8.
123. Peterson, J.C., et al., Blood pressure control, proteinuria, and the progression of
renal disease. The Modification of Diet in Renal Disease Study. Ann. Intern.
Med., 1995. 123(10): p. 754-62.
124. Lea, J., et al., The relationship between magnitude of proteinuria reduction and
risk of end-stage renal disease: results of the African American study of kidney
disease and hypertension. Arch. Intern. Med., 2005. 165(8): p. 947-53.
125. Ruggenenti, P., et al., Urinary protein excretion rate is the best independent
predictor of ESRF in non-diabetic proteinuric chronic nephropathies. "Gruppo
Italiano di Studi Epidemiologici in Nefrologia" (GISEN). Kidney Int., 1998.
53(5): p. 1209-16.
126. Ferguson, R., C.E. Grim, and T.J. Opgenorth, A familial risk of chronic renal
failure among blacks on dialysis? J. Clin. Epidemiol., 1988. 41(12): p. 1189-96.
127. Fox, C.S., et al., Predictors of new-onset kidney disease in a community-based
population. JAMA, 2004. 291(7): p. 844-50.
128. Spray, B.J., et al., Familial risk, age at onset, and cause of end-stage renal
disease in white Americans. J. Am. Soc. Nephrol., 1995. 5(10): p. 1806-10.

102
129. Lei, H.H., et al., Familial aggregation of renal disease in a population-based
case-control study. J. Am. Soc. Nephrol., 1998. 9(7): p. 1270-6.
130. U.S Renal Data System, USRDS 2005 Annual Data Report: Atlas of End Stage
Renal Disease in the United States, National Institutes of Health, National
Institute of Diabetes and Digestive and Kidney Diseases, Bethesda, MD. Am. J.
Kidney Dis., 2006. 47(Suppl. 1: S1).
131. Chertow, G.M., et al., Vintage, nutritional status, and survival in hemodialysis
patients. Kidney Int., 2000. 57(3): p. 1176-81.
132. Bloembergen, W.E., et al., Causes of death in dialysis patients: racial and gender
differences. J. Am. Soc. Nephrol., 1994. 5(5): p. 1231-42.
133. Cohen, L.M., et al., Dialysis discontinuation. A 'good' death? Arch. Intern. Med.,
1995. 155(1): p. 42-7.
134. Wallen, M.D., et al., An analysis of cardiac mortality in patients with new-onset
end-stage renal disease in New York State. Clin. Nephrol., 2001. 55(2): p. 101-8.
135. O'Seaghdha, C.M. and R.N. Foley, Septicemia, access, cardiovascular disease,
and death in dialysis patients. Perit. Dial. Int., 2005. 25(6): p. 534-40.
136. Feldman, H.I., et al., Hemodialysis vascular access morbidity in the United States.
Kidney Int., 1993. 43(5): p. 1091-6.
137. Rodriguez, J.A., et al., The function of permanent vascular access. Nephrol. Dial.
Transplant., 2000. 15(3): p. 402-8.
138. Chin, A.I., et al., Intra-access blood flow in patients with newly created upper-
arm arteriovenous native fistulae for hemodialysis access. Am. J. Kidney Dis.,
2004. 44(5): p. 850-8.

103
139. National Kidney Foundation: Dialysis Outcome Quality Initiative. NKF-DOQI
clinical practice guidelines for vascular access. Am. J. Kidney Dis., 1997. 30
(suppl.): p. S150-S191.
140. Clinical practice guidelines for vascular access. Am. J. Kidney Dis., 2006. 48
Suppl 1: p. S248-73.
141. Hakim, R. and J. Himmelfarb, Hemodialysis access failure: a call to action.
Kidney Int., 1998. 54(4): p. 1029-40.
142. Kolff, W.J., Artificial organs; your future is assured. Int J Artif Organs, 1978.
1(1): p. 1.
143. Quinton, W., D. Dillard, and B.H. Scribner, Cannulation of blood vessels for
prolonged hemodialysis. Trans. Am. Soc. Artif. Intern. Organs, 1960. 6: p. 104-
13.
144. Brescia, M.J., et al., Chronic hemodialysis using venipuncture and a surgically
created arteriovenous fistula. N. Engl. J. Med., 1966. 275(20): p. 1089-92.
145. Pereira, B.J., M. Sayegh, and P. Blake, eds. Chronic Kidney Disease, Dialysis,
and Transplantation. 2nd ed. 2005, Elsevier Saunders: Philadelphia.
146. Hurt, A.V., et al., Bovine carotid artery heterografts versus
polytetrafluoroethylene grafts. A prospective, randomized study. Am. J. Surg.,
1983. 146(6): p. 844-7.
147. Volder, J.G., R.L. Kirkham, and W.J. Kolff, A-V shunts created in new ways.
Trans Am Soc Artif Intern Organs, 1973. 19: p. 38-42.
148. Hurlbert, S.N., et al., Long-term patency rates, complications and cost-
effectiveness of polytetrafluoroethylene (PTFE) grafts for hemodialysis access: a

104
prospective study that compares Impra versus Gore-tex grafts. Cardiovasc. Surg.,
1998. 6(6): p. 652-6.
149. Lenz, B.J., et al., A three-year follow-up on standard versus thin wall ePTFE
grafts for hemodialysis. J. Vasc. Surg., 1998. 28(3): p. 464-70; discussion 470.
150. Schuman, E.S., et al., Reinforced versus nonreinforced polytetrafluoroethylene
grafts for hemodialysis access. Am. J. Surg., 1997. 173(5): p. 407-10.
151. Kapoian, T., et al., Dialysis access and recirculation, in Dialysis as Treatment of
End-Stage Renal Disease, W.L. Henrich, Editor. 1999, Current Medicine &
Blackwell Science: Philadelphia. p. Volume 5.
152. Miller, C.D., et al., Comparison of arteriovenous grafts in the thigh and upper
extremities in hemodialysis patients. J. Am. Soc. Nephrol., 2003. 14(11): p. 2942-
7.
153. Rayner, H.C., et al., Creation, cannulation and survival of arteriovenous fistulae:
data from the Dialysis Outcomes and Practice Patterns Study. Kidney Int., 2003.
63(1): p. 323-30.
154. Brunori, G., et al., Fistula maturation: doesn't time matter at all? Nephrol. Dial.
Transplant., 2005. 20(4): p. 684-7.
155. Saran, R., R.L. Pisoni, and E.W. Young, Timing of first cannulation of
arteriovenous fistula: are we waiting too long? Nephrol. Dial. Transplant., 2005.
20(4): p. 688-90.
156. Sottiurai, V.S., et al., Comparative results of early and delayed cannulation of
arteriovenous graft in haemodialysis. Eur. J. Vasc. Endovasc. Surg., 1997. 13(2):
p. 139-41.

105
157. Kaufman, J.L., et al., A prospective comparison of two expanded
polytetrafluoroethylene grafts for linear forearm hemodialysis access: does the
manufacturer matter? J. Am. Coll. Surg., 1997. 185(1): p. 74-9.
158. Polo, J.R., et al., Long-term follow-up of 6-8 mm brachioaxillary
polytetrafluorethylene grafts for hemodialysis. Artif. Organs, 1995. 19(11): p.
1181-4.
159. Bonalumi, U., et al., Nine years' experience with end-to-end arteriovenous fistula
at the 'anatomical snuffbox' for maintenance haemodialysis. Br. J. Surg., 1982.
69(8): p. 486-8.
160. Munda, R., et al., Polytetrafluoroethylene graft survival in hemodialysis. JAMA,
1983. 249(2): p. 219-22.
161. Konner, K., B. Nonnast-Daniel, and E. Ritz, The arteriovenous fistula. J. Am.
Soc. Nephrol., 2003. 14(6): p. 1669-80.
162. Besarab, A., et al., The effects of normal as compared with low hematocrit values
in patients with cardiac disease who are receiving hemodialysis and epoetin. N.
Engl. J. Med., 1998. 339(9): p. 584-90.
163. Asif, A., et al., Inflow stenosis in arteriovenous fistulas and grafts: a multicenter,
prospective study. Kidney Int., 2005. 67(5): p. 1986-92.
164. Swedberg, S.H., et al., Intimal fibromuscular hyperplasia at the venous
anastomosis of PTFE grafts in hemodialysis patients. Clinical,
immunocytochemical, light and electron microscopic assessment. Circulation,
1989. 80(6): p. 1726-36.

106
165. Rekhter, M., et al., Cell proliferation in human arteriovenous fistulas used for
hemodialysis. Arterioscler. Thromb., 1993. 13(4): p. 609-17.
166. Stracke, S., et al., Increased expression of TGF-beta1 and IGF-I in inflammatory
stenotic lesions of hemodialysis fistulas. Kidney Int., 2002. 61(3): p. 1011-9.
167. Sterpetti, A.V., et al., Modulation of arterial smooth muscle cell growth by
haemodynamic forces. Eur. J. Vasc. Surg., 1992. 6(1): p. 16-20.
168. Hsieh, H.J., N.Q. Li, and J.A. Frangos, Shear stress increases endothelial
platelet-derived growth factor mRNA levels. Am. J. Physiol., 1991. 260(2 Pt 2): p.
H642-6.
169. Hofstra, L., et al., Mismatch in elastic properties around anastomoses of
interposition grafts for hemodialysis access. J. Am. Soc. Nephrol., 1994. 5(5): p.
1243-50.
170. Himmelfarb, J., Pharmacologic prevention of vascular access stenosis. Curr.
Opin. Nephrol. Hypertens., 1999. 8(5): p. 569-72.
171. Dunlop, M.G., J.Y. Mackinlay, and A.M. Jenkins, Vascular access: experience
with the brachiocephalic fistula. Ann. R. Coll. Surg. Engl., 1986. 68(4): p. 203-6.
172. Bender, M.H., C.M. Bruyninckx, and P.G. Gerlag, The brachiocephalic elbow
fistula: a useful alternative angioaccess for permanent hemodialysis. J. Vasc.
Surg., 1994. 20(5): p. 808-13.
173. Hodges, T.C., et al., Longitudinal comparison of dialysis access methods: risk
factors for failure. J. Vasc. Surg., 1997. 26(6): p. 1009-19.
107
174. Coburn, M.C. and W.I. Carney, Jr., Comparison of basilic vein and
polytetrafluoroethylene for brachial arteriovenous fistula. J. Vasc. Surg., 1994.
20(6): p. 896-902; discussion 903-4.
175. Bhat, D.J., et al., Management of sepsis involving expanded
polytetrafluoroethylene grafts for hemodialysis access. Surgery, 1980. 87(4): p.
445-50.
176. Anderson, J.E., A.S. Chang, and M.P. Anstadt, Polytetrafluoroethylene
hemoaccess site infections. ASAIO J., 2000. 46(6): p. S18-21.
177. Quintaliani, G., et al., Survival of vascular access during daily and three times a
week hemodialysis. Clin. Nephrol., 2000. 53(5): p. 372-7.
178. Bosman, P.J., et al., A comparison between PTFE and denatured homologous
vein grafts for haemodialysis access: a prospective randomised multicentre trial.
The SMASH Study Group. Study of Graft Materials in Access for Haemodialysis.
Eur. J. Vasc. Endovasc. Surg., 1998. 16(2): p. 126-32.
179. Papasavas, P.K., et al., Prediction of arteriovenous access steal syndrome
utilizing digital pressure measurements. Vasc. Endovascular Surg., 2003. 37(3):
p. 179-84.
180. Tordoir, J.H., R. Dammers, and F.M. van der Sande, Upper extremity ischemia
and hemodialysis vascular access. Eur. J. Vasc. Endovasc. Surg., 2004. 27(1): p.
1-5.
181. Miles, A.M., Vascular steal syndrome and ischaemic monomelic neuropathy: two
variants of upper limb ischaemia after haemodialysis vascular access surgery.
Nephrol. Dial. Transplant., 1999. 14(2): p. 297-300.

108
182. Reilly, D.T., R.F. Wood, and P.R. Bell, Prospective study of dialysis fistulas:
problem patients and their treatment. Br. J. Surg., 1982. 69(9): p. 549-53.
183. Murphy, G.J., et al., Long-term results of arteriovenous fistulas using transposed
autologous basilic vein. Br. J. Surg., 2000. 87(6): p. 819-23.
184. Abbott, K.C., F.C. Trespalacios, and L.Y. Agodoa, Arteriovenous fistula use and
heart disease in long-term elderly hemodialysis patients: analysis of United States
Renal Data System Dialysis Morbidity and Mortality Wave II. J. Nephrol., 2003.
16(6): p. 822-30.
185. Ori, Y., et al., The contribution of an arteriovenous access for hemodialysis to left
ventricular hypertrophy. Am. J. Kidney Dis., 2002. 40(4): p. 745-52.
186. Reyal, Y., et al., Neurological complications from brachial arteriovenous fistulae.
Nephrol. Dial. Transplant., 2004. 19(7): p. 1923-4.
187. Gilbert, M.S., et al., Carpal tunnel syndrome in patients who are receiving long-
term renal hemodialysis. J. Bone Joint Surg. Am., 1988. 70(8): p. 1145-53.
188. Fivez, F., et al., Pseudotumor formation in polytetrafluoroethylene-dialysis
fistulae. Am. J. Kidney Dis., 1986. 8(6): p. 459-61.
189. Eid, A. and S. Lyass, Acute perigraft seroma simulating anastomotic bleeding of
a PTFE graft applied as an arteriovenous shunt for hemodialysis. Ann. Vasc.
Surg., 1996. 10(3): p. 290-1.
190. Lindstedt, E., Use of arterio-venous shunts (external and internal) for
haemodialysis, in Proceedings of the 4th International Congress on Nephrology,
Stockholm 1969. 1970, Karger: Basel. p. 188-197.

109
191. Kaye, M., P. Lemaitre, and S. O'Regan, A new technique for measuring blood
flow in polytetrafluorethylene grafts for hemodialysis. Clin. Nephrol., 1977. 8(6):
p. 533-4.
192. Lantz, B.M., et al., Determination of blood flow through arteriovenous fistulae
and shunts. Acta Radiol. Diagn. (Stockh), 1979. 20(5): p. 727-36.
193. Forsberg, L., et al., Quantitative flow estimations of arteriovenous fistulas with
Doppler and dye-dilution techniques. Acta Radiol. Diagn. (Stockh), 1980. 21(4):
p. 465-8.
194. Oudenhoven, L.F., et al., Magnetic resonance, a new method for measuring blood
flow in hemodialysis fistulae. Kidney Int., 1994. 45(3): p. 884-9.
195. Krivitski, N.M., Theory and validation of access flow measurement by dilution
technique during hemodialysis. Kidney Int., 1995. 48(1): p. 244-50.
196. Krivitski, N.M., Access flow measurement during surveillance and percutaneous
transluminal angioplasty intervention. Semin. Dial., 2003. 16(4): p. 304-8.
197. Krivitski, N.M., Theory and validation of access flow measurement by dilution
technique during hemodialysis. Kidney Int, 1995. 48(1): p. 244-50.
198. Moist, L.M., et al., Regular monitoring of access flow compared with monitoring
of venous pressure fails to improve graft survival. J Am Soc Nephrol, 2003.
14(10): p. 2645-53.
199. Paulson, W.D., Access monitoring does not really improve outcomes. Blood Purif,
2005. 23(1): p. 50-6.
200. McGill, R.L., et al., AV fistula rates: changing the culture of vascular access. J
Vasc Access, 2005. 6(1): p. 13-7.

110
201. Pisoni, R.L., et al., Vascular access use and outcomes in the U.S., Europe, and
Japan: results from the Dialysis Outcomes and Practice Patterns Study. Nephrol
News Issues, 2003. 17(6): p. 38-43, 47.
202. Schwab, S.J., et al., Hemodialysis arteriovenous access: detection of stenosis and
response to treatment by vascular access blood flow. Kidney Int, 2001. 59(1): p.
358-62.
203. Smits, J.H., et al., Graft surveillance: venous pressure, access flow, or the
combination? Kidney Int, 2001. 59(4): p. 1551-8.
204. Sands, J.J., et al., Intervention based on monthly monitoring decreases
hemodialysis access thrombosis. Asaio J, 1999. 45(3): p. 147-50.
205. Kronung, G., Plastic deformation of Cimino fistula by repeated puncture. Dial.
Transplant., 1984. 13: p. 635-638.
206. Allon, M., et al., A multidisciplinary approach to hemodialysis access:
prospective evaluation. Kidney Int, 1998. 53(2): p. 473-9.
207. Schwab, S.J., et al., Prevention of hemodialysis fistula thrombosis. Early
detection of venous stenoses. Kidney Int, 1989. 36(4): p. 707-11.
208. Sands, J.J. and C.L. Miranda, Prolongation of hemodialysis access survival with
elective revision. Clin Nephrol, 1995. 44(5): p. 329-33.
209. Besarab, A., et al., Utility of intra-access pressure monitoring in detecting and
correcting venous outlet stenoses prior to thrombosis. Kidney Int, 1995. 47(5): p.
1364-73.

111
210. Manns, B.J., et al., The Southern Alberta Renal Program database: a prototype
for patient management and research initiatives. Clin Invest Med, 2001. 24(4): p.
164-70.
211. Charlson, M.E., et al., A new method of classifying prognostic comorbidity in
longitudinal studies: development and validation. J Chronic Dis, 1987. 40(5): p.
373-83.
212. Hemmelgarn, B.R., et al., Adapting the Charlson Comorbidity Index for use in
patients with ESRD. Am J Kidney Dis, 2003. 42(1): p. 125-32.
213. Kleinbaum, D.G. and M. Klein, Logistic Regression: A Self-Learning Text. 2nd
ed. 2002, New York: Springer.
214. Hosmer, D.W. and S. Lemeshow, Applied Logistic Regression. 2nd ed. 2000:
Wiley.
215. Miller, C.D., M.L. Robbin, and M. Allon, Gender differences in outcomes of
arteriovenous fistulas in hemodialysis patients. Kidney Int, 2003. 63(1): p. 346-
52.
216. Nakai, S., et al., An overview of regular dialysis treatment in Japan (as of 31
December 2004). Ther Apher Dial, 2006. 10(6): p. 476-97.
217. Miller, P.E., et al., Natural history of arteriovenous grafts in hemodialysis
patients. Am J Kidney Dis, 2000. 36(1): p. 68-74.
218. Lin, S.L., et al., Effects of age and diabetes on blood flow rate and primary
outcome of newly created hemodialysis arteriovenous fistulas. Am J Nephrol,
1998. 18(2): p. 96-100.

112
219. Ridao-Cano, N., et al., Vascular access for dialysis in the elderly. Blood Purif,
2002. 20(6): p. 563-8.
220. Xue, J.L., et al., The association of initial hemodialysis access type with mortality
outcomes in elderly Medicare ESRD patients. Am J Kidney Dis, 2003. 42(5): p.
1013-9.
221. Staramos, D.N., et al., Patency of autologous and prosthetic arteriovenous fistulas
in elderly patients. Eur J Surg, 2000. 166(10): p. 777-81.
222. Hodges, T.C., et al., Longitudinal comparison of dialysis access methods: risk
factors for failure. J Vasc Surg, 1997. 26(6): p. 1009-19.
223. Churchill, D.N., et al., Canadian Hemodialysis Morbidity Study. Am J Kidney
Dis, 1992. 19(3): p. 214-34.
224. Windus, D.W., M.D. Jendrisak, and J.A. Delmez, Prosthetic fistula survival and
complications in hemodialysis patients: effects of diabetes and age. Am J Kidney
Dis, 1992. 19(5): p. 448-52.
225. Feldman, H.I., et al., Hemodialysis vascular access morbidity in the United States.
Kidney Int, 1993. 43(5): p. 1091-6.
226. Ifudu, O., et al., Correlates of vascular access and nonvascular access-related
hospitalizations in hemodialysis patients. Am J Nephrol, 1996. 16(2): p. 118-23.
227. Prischl, F.C., et al., Parameters of prognostic relevance to the patency of vascular
access in hemodialysis patients. J Am Soc Nephrol, 1995. 6(6): p. 1613-8.
228. Aman, L.C., N.W. Levin, and D.W. Smith, Hemodialysis access site morbidity.
Proc Clin Dial Transplant Forum, 1980. 10: p. 277-84.
113
229. Reilly, D.T., R.F. Wood, and P.R. Bell, Prospective study of dialysis fistulas:
problem patients and their treatment. Br J Surg, 1982. 69(9): p. 549-53.
230. Wong, V., et al., Factors associated with early failure of arteriovenous fistulae
for haemodialysis access. Eur J Vasc Endovasc Surg, 1996. 12(2): p. 207-13.
231. Woods, J.D., et al., Vascular access survival among incident hemodialysis
patients in the United States. Am J Kidney Dis, 1997. 30(1): p. 50-7.
232. Windus, D.W., Permanent vascular access: a nephrologist's view. Am J Kidney
Dis, 1993. 21(5): p. 457-71.
233. Wetzig, G.A., I.R. Gough, and C.M. Furnival, One hundred cases of
arteriovenous fistula for haemodialysis access: the effect of cigarette smoking on
patency. Aust N Z J Surg, 1985. 55(6): p. 551-4.
234. Mendelssohn, D.C., et al., Haemodialysis vascular access problems in Canada:
results from the Dialysis Outcomes and Practice Patterns Study (DOPPS II).
Nephrol Dial Transplant, 2006. 21(3): p. 721-8.
235. Miller, P.E., et al., Predictors of adequacy of arteriovenous fistulas in
hemodialysis patients. Kidney Int, 1999. 56(1): p. 275-80.

114
APPENDIX 1: STUDY DEFINITIONS
Access failure: Any event of thrombosis, the need for surgical revision, endovascular
intervention, or the abandonment of the access site, whichever came first.
Anticoagulation: A group of medications used to prevent blood from clotting. (ASA,
Coumadin, Heparin).
Diabetes mellitus: A chronic condition associated with abnormally high levels of
glucose (sugar) in the blood. Type I (insulin-dependent) diabetes results from a lack of
adequate insulin secretion by the pancreas. Type II diabetes (non-insulin-dependent
adult-onset diabetes) is characterized by an insensitivity of the tissues of the body to
insulin secreted by the pancreas (insulin resistance).
End-stage renal disease (ESRD): An irreversible state where kidney function is less
than 10-15% and renal replacement therapy (dialysis or transplantation) is required to
sustain life.
Fistula (AVF): A large vein that has been attached to a nearby artery. Because it carries
arterial blood under high pressure, its walls thicken (arterialize) and its lumen dilates to
accommodate the increased blood flow. This process takes several weeks before the vein
can have two needles inserted to provide an exit and return conduit for blood flow during
dialysis.

115
Glomerulonephritis: A disease of the kidneys in which the glomeruli, the tiny filters in
the kidneys that help to clean the blood, become inflamed or damaged. This allows
protein and red blood cells to pass into the urine. If glomerulonephritis does not respond
to treatment, the glomeruli may slowly be destroyed and the kidneys may lose their
ability to clean the blood.
Graft (AVG): A hollow cylindrical synthetic tube that the surgeon attaches between an
artery and a vein, and superficially places under the skin of the upper extremity. At the
start of each dialysis session, the hemodialysis nurse attaches the arterial needle to an
extracorporeal plastic tube through which the patient’s blood flows, passes through the
dialysis membrane, and then returns through another plastic tube to the patient via the
―venous‖ needle.
Hemodialysis: A form of dialysis that is performed in hospital, an outpatient dialysis
unit, or the patient’s home. It involves sitting in a chair for 3-4 hours while the patient’s
blood is circulated through tubing and through a special membrane for cleansing. The
patient’s blood circulates from a vein in the arm or neck, through a membrane, and back
to the vein repetitively during the course of dialysis session. The hemodialysis nurse has
to access the venous blood by placing two needles in an arm vein or arm graft.
Alternatively, the nurse accesses the internal jugular neck vein through a double lumen
plastic catheter previously placed by a doctor.

116
Hypertension: High blood pressure, defined as a systolic blood pressure greater than 140
mm Hg and/or diastolic blood pressure greater than 90 mm Hg.
Interstitial nephritis: A form of nephritis affecting the interstitium of the kidneys
surrounding the tubules. This disease can be either acute, which means it occurs
suddenly, or chronic, meaning it is ongoing and eventually ends in kidney failure.
Peripheral vascular disease: Diseases of the vessels of the extremities such as
atherosclerosis, resulting in diminished circulation, pain (claudication), or a blood clot.
Peritoneal dialysis: A form of dialysis that is accomplished by instilling a glucose
solution through a permanent tube (the placement requires a short surgery) into the
abdominal cavity and leaving the fluid in place for a period of 1 to 6 hours before it is
drained out. The drainage is immediately followed by instillation of fresh fluid. This
procedure is manually by the patient or automatically by a machine (usually in the
patient’s home) and needs to be repeated several times per day.
Polycystic kidney disease: A progressive, genetic disorder of the kidneys characterized
by the presence of multiple cysts (hence, ―polycystic‖) in both kidneys. The disease can
also damage the liver, pancreas, and rarely, the heart and brain.
Smoker: A person currently smoking or self-classified as a regular smoker within the
past 5 years.

117
Successful access cannulation: Successful use of a vascular access affording an
extracorporeal blood flow of at least 300 ml per minute for at least 3 hours, using an
arterial and venous needle placed in the vascular access.
Transplants: A kidney transplant is a treatment option for many people with ESRD.
With advances in transplantation and improved success rates, it is now widely considered
the best way of treating kidney failure. However, not all patients can have a transplant
and often an organ is not available. There are two types of kidney transplants: a living
donor transplant and a deceased donor transplant

118
APPENDIX 2: ACCESS INFORMATION ABSTRACTION FORM
1. Name (Last name, first name) __________________
2. Health Care Number ____________ Surgery number __________________
3. Age _____
4. Gender (Male) (Female)
5. Primary cause of chronic kidney disease
Diabetes Mellitus _____
Glomerulonephritis _____
Ischemia/HTN _____
Interstitial Nephritis _____
PKD _____
Unknown/Other _____
6. Comorbidities
Diabetes Mellitus (Y) (N)
Hypertension (Y) (N)
PVD (Y) (N)
Smoking (Y) (N)
Anticoagulation (Y) (N)
7. Access Creation Date __________________ (yy/mm/dd)
8. Surgeon
A _____
B _____
C _____
D _____
9. Type of Access AVF ____ AVG ____
10. Location of the access
AVF Forearm Fistula _____
AVF Upperarm Fistula _____
AVG Forearm loop graft _____
AVG Upperarm C-graft _____
11. AVF Access used
YES
NO (Access malfunction surgical/radiologic revision)
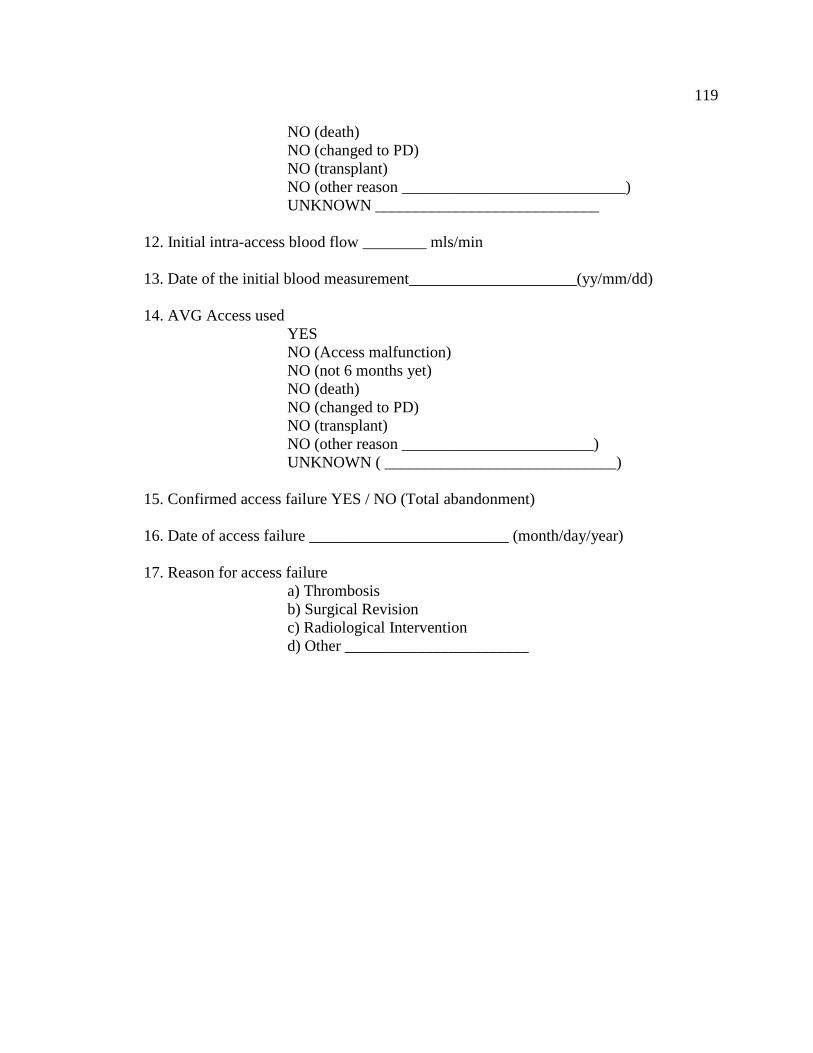
119
NO (death)
NO (changed to PD)
NO (transplant)
NO (other reason ____________________________)
UNKNOWN ____________________________
12. Initial intra-access blood flow ________ mls/min
13. Date of the initial blood measurement_____________________(yy/mm/dd)
14. AVG Access used
YES
NO (Access malfunction)
NO (not 6 months yet)
NO (death)
NO (changed to PD)
NO (transplant)
NO (other reason ________________________)
UNKNOWN ( _____________________________)
15. Confirmed access failure YES / NO (Total abandonment)
16. Date of access failure _________________________ (month/day/year)
17. Reason for access failure
a) Thrombosis
b) Surgical Revision
c) Radiological Intervention
d) Other _______________________