Development and validation of the predicted heat strain model
13
Ann. occup. Hyg., Vol. 45, No. 2, pp. 123–135, 2001 2001 British Occupational Hygiene Society Published by Elsevier Science Ltd. All rights reserved Printed in Great Britain. 0003–4878/01/$20.00 PII: S0003-4878(00)00030-2 Development and Validation of the Predicted Heat Strain Model J. MALCHAIRE²*, A. PIETTE², B. KAMPMANN‡, P. MEHNERT§, H. GEBHARDT, G. HAVENITH‡‡, E. DEN HARTOG¶, I. HOLMER²², K. PARSONS‡‡, G. ALFANO§§ and B. GRIEFAHN§ ²Unite´ Hygie `ne et Physiologie du Travail, Universite ´ Catholique de Louvain, Clos Chapelle-aux- Champs 3038, B-1200, Brussels, Belgium; ‡Institut fu ¨r Arbeitswissenschaften der Ruhrkohle Aktiengesellschaft, Hu ¨lshof 28, D-44369, Dortmund, Germany; §Institut fu ¨r Arbeitsphysiologie an der Universita ¨t Dortmund, Ardeystr. 67, D-44139, Dortmund, Germany; Institut fu ¨r Arbeitsmedizin, Sicherheitstechnik und Ergonomie, Corneliusstr. 31, D-42329, Wuppertal, Germany; ¶TNO Human Factors, Department of Work Environment, Thermal Physiology Group, Kampweg 5, P.O. Box 23, NL-3769 ZG, Soesterberg, The Netherlands; ²²National Institute of Working Life (NIWL), S-171 84, Solna, Sweden; ‡‡Human Thermal Environments Laboratory, Loughborough University, Ashby Road, Loughborough, Leicestershire, LE11 3TU, UK; §§DETEC c/o Fac. Ingegneria, Piazzale Tecchio 80, I-80125, Napoli, Italy Eight laboratories participated in a concerted research project on the assessment of hot work- ing conditions. The objectives were, among others, to co-ordinate the work of the main Euro- pean research teams in the field of thermal factors and to improve the methods available to assess the risks of heat disorders at the workplace, and in particular the “Required Sweat Rate” model as presented in International Standard ISO 7933 Standard (1989). The scientific bases of this standard were thoroughly reviewed and a revised model, called “Predicted Heat Strain” (PHS), was developed. This model was then used to predict the minute by minute sweat rates and rectal temperatures during 909 laboratory and field experiments collected from the partners. The Pearson correlation coefficients between observed and predicted values were equal to 0.76 and 0.66 for laboratory experiments and 0.74 and 0.59 for field experiments, respectively, for the sweat rates and the rectal temperatures. The change in sweat rate with time was predicted more accurately by the PHS model than by the required sweat rate model. This suggests that the PHS model would provide an improved basis upon which to determine allowable exposure times from the predicted heat strain in terms of dehydration and increased core temperature. 2001 British Occupational Hygiene Society. Published by Elsevier Science Ltd. All rights reserved Keywords: heat stress index; required sweat rate INTRODUCTION The ISO 7933 (1989) Standard, entitled Analytical Determination and Interpretation of Thermal stress using Calculation of the Required Sweat Rate was published for the first time in 1989. It was abundantly criticised and many papers were published comparing one version (not always specified) of the Required Received 21 January 2000; in final form 3 May 2000. *Author to whom correspondence should be addressed. Tel.: +32-2-764-32-29; fax: +32-2-764-39-54; e-mail: malchai- [email protected] 123 Sweat Rate index to sets of data (for example, Haslam and Parsons, 1987, 1994; Smolander et al., 1991; Kampmann and Piekarski, 2000). Although such comparisons were always limited to a particular set of data, definite limitations were shown concerning: O the prediction of the skin temperature; O the influence of the clothing on convective and evaporative heat exchanges; O the combined effect of clothing and movements; O the increase of core temperature linked to the activity; by guest on January 6, 2015 http://annhyg.oxfordjournals.org/ Downloaded from
Transcript of Development and validation of the predicted heat strain model

Ann. occup. Hyg., Vol. 45, No. 2, pp. 123–135, 2001 2001 British Occupational Hygiene Society
Published by Elsevier Science Ltd. All rights reservedPrinted in Great Britain.
0003–4878/01/$20.00PII: S0003-4878(00)00030-2
Development and Validation of the Predicted HeatStrain ModelJ. MALCHAIRE†*, A. PIETTE†, B. KAMPMANN‡, P. MEHNERT§,H. GEBHARDTÛ, G. HAVENITH‡‡, E. DEN HARTOG¶, I. HOLMER††,K. PARSONS‡‡, G. ALFANO§§ and B. GRIEFAHN§†Unite Hygiene et Physiologie du Travail,UniversiteCatholique de Louvain, Clos Chapelle-aux-Champs3038,B-1200,Brussels,Belgium;‡Institut fur Arbeitswissenschaften der RuhrkohleAktiengesellschaft,Hulshof 28, D-44369,Dortmund,Germany;§Institut fur Arbeitsphysiologie an derUniversitat Dortmund,Ardeystr. 67,D-44139,Dortmund,Germany;ÛInstitut fur Arbeitsmedizin,Sicherheitstechnik und Ergonomie,Corneliusstr. 31,D-42329,Wuppertal,Germany;¶TNO HumanFactors,Department of Work Environment,Thermal Physiology Group,Kampweg5, P.O. Box 23,NL-3769ZG, Soesterberg,The Netherlands;††National Institute of Working Life(NIWL), S-171 84,Solna,Sweden;‡‡Human Thermal Environments Laboratory, Loughborough University, Ashby Road,Loughborough,Leicestershire,LE11 3TU,UK; §§DETEC c/o Fac.Ingegneria,Piazzale Tecchio80,I-80125,Napoli, Italy
Eight laboratories participated in a concerted research project on the assessment of hot work-ing conditions. The objectives were, among others, to co-ordinate the work of the main Euro-pean research teams in the field of thermal factors and to improve the methods available toassess the risks of heat disorders at the workplace, and in particular the “Required SweatRate” model as presented in International Standard ISO 7933 Standard (1989). The scientificbases of this standard were thoroughly reviewed and a revised model, called “Predicted HeatStrain” (PHS), was developed. This model was then used to predict the minute by minutesweat rates and rectal temperatures during 909 laboratory and field experiments collectedfrom the partners. The Pearson correlation coefficients between observed and predictedvalues were equal to 0.76 and 0.66 for laboratory experiments and 0.74 and 0.59 for fieldexperiments, respectively, for the sweat rates and the rectal temperatures. The change insweat rate with time was predicted more accurately by the PHS model than by the requiredsweat rate model. This suggests that the PHS model would provide an improved basis uponwhich to determine allowable exposure times from the predicted heat strain in terms ofdehydration and increased core temperature. 2001 British Occupational Hygiene Society.Published by Elsevier Science Ltd. All rights reserved
Keywords: heat stress index; required sweat rate
INTRODUCTION
The ISO 7933 (1989) Standard, entitledAnalyticalDetermination and Interpretation of Thermal stressusing Calculation of the Required Sweat Ratewaspublished for the first time in 1989. It was abundantlycriticised and many papers were published comparingone version (not always specified) of the Required
Received 21 January 2000; in final form 3 May 2000.*Author to whom correspondence should be addressed. Tel.:+32-2-764-32-29; fax:+32-2-764-39-54; e-mail: [email protected]
123
Sweat Rate index to sets of data (for example, Haslamand Parsons, 1987, 1994; Smolanderet al., 1991;Kampmann and Piekarski, 2000).
Although such comparisons were always limited toa particular set of data, definite limitations wereshown concerning:
O the prediction of the skin temperature;O the influence of the clothing on convective and
evaporative heat exchanges;O the combined effect of clothing and movements;O the increase of core temperature linked to the
activity;
by guest on January 6, 2015http://annhyg.oxfordjournals.org/
Dow
nloaded from

124 J. Malchaireet al.
O the prediction of the maximum allowableexposure durations.
Considering these major limitations as well as the factthat this standard appeared to be little used in prac-tice, a joint research project between some of themain European research teams in the field of thermalfactors was started, with the support of the Euro-pean Union.
The specific objectives of the research projectwere:
1. To design and validate a strategy for the assess-ment of the stress related to hot working con-ditions, a strategy that can be used by practitionersin the field to determine maximum allowableexposure duration and to optimise the improve-ment of the working environment. The description,justification and validation of this strategy werepublished by Malchaireet al. (1999)
2. To improve the prediction of the heat exchangesbetween a clothed person and the environment,taking into consideration the characteristics of nor-mal and special clothing ensembles. The newalgorithms were described and validated by Hav-enith et al. (1999) and Holme´r et al. (1999).
3. To better define the criteria for the determinationof the maximum allowable exposure duration andin particular the inter-individual differences insweat rate, evaporation efficiency, water loss andincrease in core temperature. These criteria werereviewed by Malchaireet al. (2000).
4. To improve the validity of the expression for theprediction of the mean skin temperature: a newmodel was developed and validated by Mehnertetal. (2000).
5. To review systematically the algorithms used inthe ISO 7933 (1989) Standard, taking into con-sideration the results of the most recent investi-gations, concerning:5.1. The respiratory heat losses.5.2. The influence of protective clothing on radi-
ation exchanges.5.3. The prediction of the mean skin temperature.5.4. The exponential averaging for the skin tem-
perature and the sweat rate.5.5. The prediction of the mean body temperature.5.6. The distribution of heat storage in the body.5.7. The prediction of the rectal temperature.5.8. The evaporation efficiency.
Following the fundamental changes brought to thealgorithms and the prediction scheme, and in order toavoid any confusion with the previous versions of theRequired Sweat Rate index, it was decided to changethe name of the heat stress evaluation procedure tothe Predicted Heat Strain (PHS) model.
In the next section, this paper describes and justi-fies, based on the literature, the development of thePHS model. In the last section, this model will be
validated using a database of some 909 laboratory andfield experiments gathered by the different parti-cipants in the European joint research project.
DEVELOPMENT OF THE PHS MODEL
Respiratory evaporative (Eres) and convective (Cres)heat losses
Although quite limited in hot climates, these lossesare often of the same order of magnitude as convec-tive losses on the body surface. Furthermore, heatstorage is determined by the difference between therequired and predicted evaporation rates and the res-piratory losses become significant. An accurate pre-diction of these exchanges is therefore required.
Livingstone et al. (1994) reported data about therelationships between the metabolic rate (Min watts),the ventilation rate (Vin l. min21), the temperaturesof the expired air (tex in °C) and the inspired air (tinin °C), and the partial water vapour pressure of theinspired air (pa,in in kPa).
From these data, the following expressions canbe derived
V = 0.076·M (R = 0.992)
tex = 28.6 + 0.115·tin + 0.641·pa, in (R = 0.979).
The convective respiratory heat exchange is given by
Cres = cp·V·(tex2tin)
where cp is the specific heat of air (W min l.21
(°C)21).With the above expressions ofV andtex, the follow-
ing expression was derived (with bothCres and M inwatts or in W m22)
Cres = 1.52·1023·M·(28.6 + 0.641·pa, in20.885·tin)
For the evaporative heat loss (Eres), the expressionproposed by Varene (1986) was adopted
Eres = 1.27·1023M·(59.3 + 0.53·tin211.63·pa, in)
Influence of radiation on protective clothingConcerning the influence of the clothing character-
istics on convection and radiation (Havenithet al.,1999; Holmer et al., 1999) the model developed isvalid only if the clothing has “normal” reflectivecharacteristics.This has to be corrected when reflec-tive clothing is used (reflection coefficientFR), cover-ing the fractionAp of the body surface.
In this case, it is assumed that, for the fraction ofthe body surface uncovered by the reflective clothing(12Ap), the reflection coefficient is 0.93 and a correc-
by guest on January 6, 2015http://annhyg.oxfordjournals.org/
Dow
nloaded from

125Predicted heat strain model
tion factor FclR is introduced in the computation ofthe dynamic radiation coefficient
FclR = (12Ap)·0.93 +Ap·FR
Prediction of the mean skin temperature (tsk)Following the work reported by Mehnertet al.
(2000), the models for the prediction oftsk are
O for clothed subjects (Icl$0.6 clo):
tsk, clothed= 12.2 + 0.020·ta + 0.044·tr + 0.194·pa20.253·va + 0.00297·M+ 0.513·tre
O for nude subjects (Icl#0.2 clo):
tsk, nude= 7.2 + 0.064·ta + 0.061·tr + 0.198·pa20.348·va + 0.616·tre
For clothing insulation (Icl) between 0.2 and 0.6clo, a linear interpolation between both models isused
tsk = tsk, nude+ 2.5·(tsk, clothed2tsk, nude)·(Icl20.2)
Exponential averaging for the skin temperature and thesweat rate
By far the main limitation of the ISO 7933 Stan-dard is to assume that a steady state is reached instan-taneously. This makes it inappropriate for the predic-tion of responses to intermittent exposure.Furthermore, heat accumulation is assumed to remainthe same during the whole exposure, while it obvi-ously tends to 0, towards an equilibrium state in coretemperature. Modifications had to be brought to themodel so that it is possible to predict the sweat rateand the skin and rectal temperatures at any time, tak-ing into consideration all of the past exposure.
According to the results of the previous ECSCresearch programme (Malchaire, 1986), the skin tem-perature and the sweat rate tend to their equilibriumvalue as a first order system, according to the follow-ing expression
V(t) = V0 + DV·[12exp(2t/t)]
whereV(t) is the value at timet; V0 is the initial value;DV is the increase of parameterV in the new con-dition, (V0+DV) being therefore the new equilibriumvalue;t is time andt is the time constant (in minutes).
As shown by Malchaire (1991), for numericalapplications, this expression can be replaced by arecursive expression
Vi = Vi21·k + Vmax·(12k)
where Vi is the value at timei; Vi21 is the value attime (i21), Dt min before;Vmax is the target value(V0+DV) in the previous equation;t is the time con-stant (in minutes) andk is equal to exp(2Dt/t).
Malchaire (1991) has reported values of the timeconstants equal to 3 min for the skin temperature and10 min for the sweat rate.
Mean body temperatureConcerning mean body temperature, ISO 7933
implicitly assumes a skin–core weighting of 0.3–0.7regardless of the skin and core temperature. This iscontradictory to the literature and had to be revised.
Many papers have presented expressions to com-pute the “mean body temperature” (tb), as a functionof the rectal (tre) and the skin temperature (tsk) (Gaggeand Nishi, 1977; Ka¨hkonen, 1993; Stolwijk andHardy, 1966; Colinet al., 1971).
All take the form tb=a·tsk+(12a)·tre.Conditions for which these expressions were
derived are usually not fully documented. However,a consensus seems to exist concerning the fact thata=0.30 for vasoconstricted skin and 0.1 for vasodil-ated skin.
The paper by Colinet al. (1971) suggests that thiscoefficient is not simply a function of the vasodilat-ation status and the blood flow to the skin but varieswith the heat storage, and therefore, indirectly, withthe rectal temperature. Therefore it is assumed that
O a=0.3 for tre#36.8°CO a=0.1 for tre$39°CO a varies between 0.3 and 0.1 according to:a=0.320.09·(tre236.8).
Distribution of the heat storage in the bodyThe distribution of the heat storage between the
core and the skin layer had to be investigated in orderto be able to derive a valid estimate of the core tem-perature.
The core temperaturetco has to be derived from theheat dSstored during the last time interval taking intoaccount the increase in skin temperature (fromtsk0 totsk), the previous core temperaturetco0 and the pre-vious skin–core weightinga0.
As tsk and tco are different fromtsk0 and tco0, theskin–core weighting changes. On the other hand, theincrease in skin temperature during the last minuteconcerns directly the outer surface of the skin but pro-gressively the skin layer of thicknessa.
The proposed model assumes that, inside this skinlayer, the temperature varies linearly fromtsk0 to tco0
initially and from tsk to tco at the end of the minute.The core temperaturetco at timei can be calculated
from the following expression
by guest on January 6, 2015http://annhyg.oxfordjournals.org/
Dow
nloaded from

126 J. Malchaireet al.
tco =1
12a2
F dSi
cpWb
+ tco02tco02tsk0
2a02tsk
a2G
where cp is the specific heat of the body (Jkg21(°C)21) and Wb the body mass (kg);a and tco
have to be determined knowing thata varies as afunction of tco as indicated before. This may besolved iteratively.
Prediction of the rectal temperature (tre) from the meancore temperature
As rectal temperature remains, with heart rate, aphysiological parameter easy to record at the workplace, the modified model attempts to predict itdirectly.
The expressions developed above make it possibleto predict the mean skin (tsk) and core (tco) tempera-tures. This core temperature can itself be consideredto be the mean of the rectal temperature(characteristic of the muscle mass) and the oeso-phageal temperature (characteristic of the blood andinfluencing the hypothalamus).
The heat storage due to thermal imbalance duringa given unit of time results in an increase in rectaland oesophageal temperatures. According to Edwardset al. (1978), the rectal and oesophageal temperatures(toe) are linked by an expression such as
toe = a·tre + b·Dtre + c
whereDtre is the increase intre from one time intervalto the next.
The analysis of 10 cases from the database, forwhich both toe and tre were available, minute byminute, gave the following expression
toe = 1.31 + 0.962·tre + 7.03·Dtre
Assuming that the mean core temperaturetco dis-cussed previously is the average of the rectal and theoesophageal temperatures, this can be written
2·tco = 1.31 + 1.962·tre + 7.03·Dtre
or
2·tco = 1.31 + 1.962·tre0 + 9·(tre2tre0)
wheretre0 is the rectal temperature one minute beforeand thereforeDtre is given as (tre2tre0).
The rectal temperature is then given by
tre = tre0 +2tco21.962tre021.31
9
Evaporative efficiency of sweatingISO 7933 adopted an expression for the compu-
tation of the evaporative efficiency as a function ofskin wetness (w). The validity of this expression hadto be confirmed based on more recent publications.
Several expressions are reported in the literaturefor the prediction of the evaporative efficiency ofsweating (h) as a function of skin wetness (w) (Vogtet al., 1982; Givoni, 1976; Hettingeret al., 1985;Alber and Holme´r, 1994).
The comparison of these expressions shows that:
O The expression proposed by Vogtet al. (1982)leads to higher evaporative efficiencies for thesame skin wetness, that is, to a lower strain, interms of SWreq, than the other expressions.
O The expressions proposed by Hettingeret al.(1985) and Givoni (1976) provide about the sameresults. Both were derived from experiments withclothed subjects instead of nude subjects in thecase of the expression by Vogtet al. (1982).
O The predictions using the Hettingeret al. (1985)expression are also very close to the recent datafrom Alber and Holme´r (1994), who analysed dif-ferences in evaporative efficiencies betweenwomen and men.
The expression adopted in the current ISO 7933 Stan-dard can therefore be confirmed for the majority ofworkplaces, for required skin wetness smaller orequal to 1.This expression is
h = 12w2/2
Problems, however, occur under very humid con-ditions where the maximum evaporation rate (Emax)decreases with increasing humidity. As the evapor-ation efficiency is assumed to remain equal to 0.5when the wetness reaches 1, it results from the modelthat the predicted sweat rate decreases also withincreasing humidity. Therefore, a subject would sweatless in an extremely humid environment. This isclearly contradicted by the results of Zintl (1979) andKohler (1976).
Therefore, the sweating efficiency may not betaken equal to 0.5 regardless of the sweating, as soonas the skin surface is predicted to be completely wet.The skin being completely wet (w=1), it is reasonableto assume that the layer of water on the skin canincrease if the air humidity increases.
As shown by Candas (1980), the efficiency tendsto 0 on a cylinder if the layer of water increases.Therefore, the evaporation efficiency should be below0.5 and tend to 0 as a function of the skin wetness,which would take more the meaning of thickness ofthe water layer on the skin than of the equivalent frac-tion of the skin completely wetted.
Such a relationship can be described by
h = 12w2/2 for w#1
by guest on January 6, 2015http://annhyg.oxfordjournals.org/
Dow
nloaded from

127Predicted heat strain model
h = (22w)2/2 for 1,w#1.7
h = 0.05 forw>1.7
The predicted evaporation rate remains estimatedusingw (limited to wmax):
Ep = wEmax,
while the predicted sweat rate is a function ofh cal-culated above:
SWp = Ep/h.
Development of the Predicted Heat Strain (PHS) modelBased on these results, the Required Sweat Rate
index was revised concerning 14 aspects and renamedto the Predicted Heat Strain (PHS) model:
1. New formula to compute the respiratory evapor-ative and convective heat losses;2. Consideration of the reflective characteristics ofthe clothing;3. New algorithms for the prediction of the heatexchanges between a clothed person and theenvironment, taking into consideration the charac-teristics of normal and special clothing ensembles;4. Prediction of the mean skin temperature usingtwo expressions developed for nude and clothedsubjects, with interpolation forIcl between 0.2 and0.6 clo;5. Exponential averaging to compute minute byminute the skin temperature and the sweat rate;6. Skin–core weighting for the computation of themean body temperature;7. Computation of the core temperature consider-ing the distribution of heat storage in the body;8. Prediction of the rectal temperature from themean core temperature;9. Computation of the evaporation efficiency ofsweating as a function of the wetness, especiallyfor very humid conditions;
taking in account also the aspects discussed by Mal-chaire et al (2000):
10. Increase in core temperature associated withthe metabolic rate;11. Maximum wetness for non acclimatised sub-jects;12. Estimation of the maximum sweat rate fromthe metabolic rate, for acclimatised and nonacclimatised subjects;13. Rectal temperature limited to 38.0°C;14. Maximum water loss of 7.5% of body massfor an average subject.
VALIDATION OF THE PHS-MODEL
The databaseThe eight partners had the data from many labora-
tory and field experiments run in the past availableand most were used in the literature for different pur-poses. The data from 909 experiments (672 laboratoryand 237 field experiments) were gathered to a com-mon database. For each experiment, the minute byminute data were available for the primary parameters(ta, pa, tr, va, M, Icl) and for the physiological response(tre and SW). Subjects were acclimatised in 60% ofthe experiments.
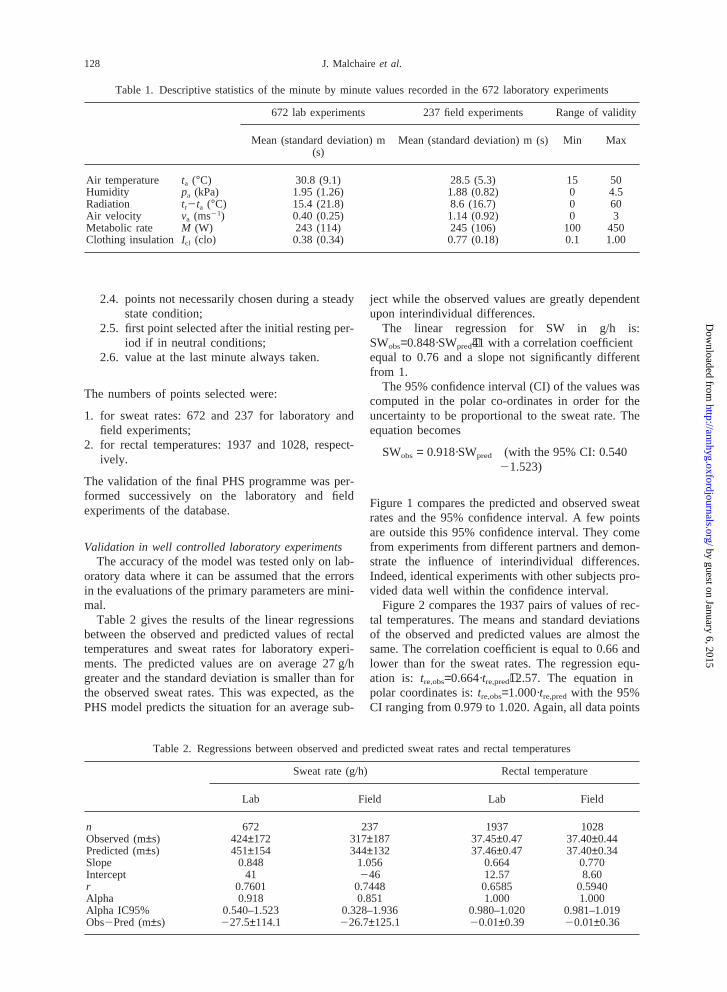
Table 1 gives the mean and standard deviation forthe six parameters recorded minute by minute in the672 laboratory experiments and in the 237 fieldexperiments. The ranges of values of air temperature(ta), humidity (pa), radiation (tr2ta), and metabolicrate (M) were similar for both sets of experiments.The range of air velocity (va) was smaller for the lab-oratory experiments (maximum value of 1 ms21
instead of 4 ms21 for the field experiments). Thirty-seven percent of the laboratory experiments (N=248),and 95% of the field experiments (N=225) concernedclothed workers (Icl value greater than 0.5 clo).
With the exception of the air velocities greater than1 ms21, it can be concluded that the set of laboratoryexperiments covered the range of conditions encoun-tered in the field.
The effect of air velocity on clothing insulation wasinvestigated with special experiments up to 3 ms21,and the validity of the algorithms for the computationof the convective and evaporative heat exchanges wasshown to extend up to 3 ms21 (Havenithet al., 1999;Holmer et al., 1999). The range of validity of the PHSmodel can therefore be considered as extending to airvelocity of 3 ms21. This corresponds to the 95% con-fidence upper limit for the field experiments. Fromthese 95% confidence intervals, it is concluded thatthe model can only be validated for the values ofparameters in the ranges indicated in Table 1. Theselimits do not appear to restrict severely the appli-cation of the PHS model in industrial situations. Parti-cular attention will, however, be exercised for fieldconditions with velocities greater than 1 ms21.
The PHS model makes it possible to predict minuteby minute sweat rate and rectal temperature. How-ever, these parameters were observed at discretemoments. In order to give to each experiment a stat-istical weight proportional to its duration, it wasdecided to select points using the following criteria:
1. for the sweat rate: only use the mean sweat rateover the whole experiment;
2. for the rectal temperature, selection of data pointsin each experiment according to:2.1. 1 point per hour;2.2. 30–45 min between two points;2.3. elimination of experiments wheretre was
greater than 38°C at the first minute;
by guest on January 6, 2015http://annhyg.oxfordjournals.org/
Dow
nloaded from
128 J. Malchaireet al.
Table 1. Descriptive statistics of the minute by minute values recorded in the 672 laboratory experiments
672 lab experiments 237 field experiments Range of validity
Mean (standard deviation) m Mean (standard deviation) m (s) Min Max(s)
Air temperature ta (°C) 30.8 (9.1) 28.5 (5.3) 15 50Humidity pa (kPa) 1.95 (1.26) 1.88 (0.82) 0 4.5Radiation tr2ta (°C) 15.4 (21.8) 8.6 (16.7) 0 60Air velocity va (ms21) 0.40 (0.25) 1.14 (0.92) 0 3Metabolic rate M (W) 243 (114) 245 (106) 100 450Clothing insulation Icl (clo) 0.38 (0.34) 0.77 (0.18) 0.1 1.00
2.4. points not necessarily chosen during a steadystate condition;
2.5. first point selected after the initial resting per-iod if in neutral conditions;
2.6. value at the last minute always taken.
The numbers of points selected were:
1. for sweat rates: 672 and 237 for laboratory andfield experiments;
2. for rectal temperatures: 1937 and 1028, respect-ively.
The validation of the final PHS programme was per-formed successively on the laboratory and fieldexperiments of the database.
Validation in well controlled laboratory experimentsThe accuracy of the model was tested only on lab-
oratory data where it can be assumed that the errorsin the evaluations of the primary parameters are mini-mal.
Table 2 gives the results of the linear regressionsbetween the observed and predicted values of rectaltemperatures and sweat rates for laboratory experi-ments. The predicted values are on average 27 g/hgreater and the standard deviation is smaller than forthe observed sweat rates. This was expected, as thePHS model predicts the situation for an average sub-
Table 2. Regressions between observed and predicted sweat rates and rectal temperatures
Sweat rate (g/h) Rectal temperature
Lab Field Lab Field
n 672 237 1937 1028Observed (m±s) 424±172 317±187 37.45±0.47 37.40±0.44Predicted (m±s) 451±154 344±132 37.46±0.47 37.40±0.34Slope 0.848 1.056 0.664 0.770Intercept 41 246 12.57 8.60r 0.7601 0.7448 0.6585 0.5940Alpha 0.918 0.851 1.000 1.000Alpha IC95% 0.540–1.523 0.328–1.936 0.980–1.020 0.981–1.019Obs2Pred (m±s) 227.5±114.1 226.7±125.1 20.01±0.39 20.01±0.36
ject while the observed values are greatly dependentupon interindividual differences.
The linear regression for SW in g/h is:SWobs=0.848·SWpred+41 with a correlation coefficientequal to 0.76 and a slope not significantly differentfrom 1.
The 95% confidence interval (CI) of the values wascomputed in the polar co-ordinates in order for theuncertainty to be proportional to the sweat rate. Theequation becomes
SWobs = 0.918·SWpred (with the 95% CI: 0.54021.523)
Figure 1 compares the predicted and observed sweatrates and the 95% confidence interval. A few pointsare outside this 95% confidence interval. They comefrom experiments from different partners and demon-strate the influence of interindividual differences.Indeed, identical experiments with other subjects pro-vided data well within the confidence interval.
Figure 2 compares the 1937 pairs of values of rec-tal temperatures. The means and standard deviationsof the observed and predicted values are almost thesame. The correlation coefficient is equal to 0.66 andlower than for the sweat rates. The regression equ-ation is: tre,obs=0.664·tre,pred+12.57. The equation inpolar coordinates is:tre,obs=1.000·tre,predwith the 95%CI ranging from 0.979 to 1.020. Again, all data points
by guest on January 6, 2015http://annhyg.oxfordjournals.org/
Dow
nloaded from

129Predicted heat strain model
Fig. 1. Observed and predicted sweat rates (with the 95% confidence interval) in the 672 laboratory experiments.
Fig. 2. Observed and predicted rectal temperatures (with the 95% confidence interval) in the 672 laboratory experiments.
outside the 95% confidence interval are due to interin-dividual differences.
Validation in field experimentsFigures 3 and 4 compare the observed and pre-
dicted values of sweat rates and rectal temperatures
Fig. 3. Observed and predicted sweat rates (with the 95% confidence interval) in the 237 field experiments.
for the 237 field experiments. Table 2 gives theresults of the linear regressions. The accuracy of theclimatic and physiological measurements being lowerfor experiments in the field, it appears logical that thecorrelations between observed and predicted valuesare lower and that the 95% confidence intervals arelarger. The linear regressions are
by guest on January 6, 2015http://annhyg.oxfordjournals.org/
Dow
nloaded from

130 J. Malchaireet al.
Fig. 4. Observed and predicted rectal temperatures (with the 95% confidence interval) in the 237 field experiments.
SWobs = 1.056·SWpred246, R = 0.74
tre, obs= 0.770·tre, pred+ 8.60 R = 0.59
The equations in polar coordinates are
SWobs = 0.851·SWpred (with the 95% CI: 0.32821.936)
tre, obs= 1.000·tre, pred (with the 95% CI: 0.98121.019)
COMPARISON BETWEEN THE PHS MODEL ANDTHE ISO 7933 STANDARD
The purpose of the comparison between theRequired Sweat Rate index as it is in the ISO 7933and the new PHS model is important to determinewhether this PHS model results in different and betterpredictions. Comparisons will be restricted to the pre-dicted sweat rates and the Duration Limit of Exposure(DLE) values, since ISO 7933 does not make it poss-ible to predict the rectal temperature. The DLE pre-dicted by the PHS model (DLEPHS: lowest of the twofor dehydration and heat storage) will be comparedto those predicted using ISO 7933 (DLEISO:“danger” level).
The comparison will be limited to unacclimatisedsubjects (maximum sweat rate: 250 W m22 accordingto ISO 7933).
ISO 7933 makes it possible to predict the sweatrate for constant climatic and working conditions. Incase of different consecutive exposure conditions, theinterpretation had to be done, first, for each sequenceseparately, and, later, globally for the whole set ofsequences. Therefore, the maximum (Emax) andrequired (Ereq) evaporation rates were computed foreach minute successively and averaged over the totalduration. The final interpretation was done from these
mean values to predict the ISO 7933 sweat rate(SWISO). This is strictly consistent with the standard,although extended to sequences of one-minute dur-ation.
When using this method of interpretation for ISO7933, the results of the linear regressions between theobserved and predicted sweat rates are
SWobs = 0.757·SWISO + 75, R = 0.74(for laboratory experiments)
SWobs = 0.663·SWISO + 52, R = 0.52(for field experiments)
When these results are compared to those reportedabove, it appears clearly that the PHS model givesbetter predictions, particularly for the field experi-ments, the correlation explaining 55% (r=0.75) of thetotal variance instead of 27% (r=0.52).
The improvements brought by the PHS model arenot totally reflected by these statistics. Figure 5 com-pares the evolutions of the SWISO and SWPHS sweatrates during a laboratory experiment involving differ-ent sequences of work and climatic conditions. In thisparticular case, the averages of the SWISO and SWPHS
min per min values over the entire experiment areabout the same. According to the regression analysisperformed above, both models would therefore beconsidered as equally valid. This is not the case obvi-ously when considering the evolution of the sweatrate during the experiment. The SWISO is assumed toincrease or decrease instantaneously as soon as asequence starts, while the SWPHS follows remarkablythe observed values.
COMPARISON OF THE EVOLUTION OF SW ANDDLE AS A FUNCTION OF PAIRS OF THE PRIMARYPARAMETERS FOR ISO 7933 AND THE PHS MODEL
The sweat rates were predicted by the two methodsfor 2-h exposures, in conditions with air temperatures
by guest on January 6, 2015http://annhyg.oxfordjournals.org/
Dow
nloaded from

131Predicted heat strain model
Fig. 5. Comparison between observed and predicted sweat rates using ISO 7933 and PHS in a laboratory experiment with threesequences of work and climate.
varying between 25 and 50°C and one of the otherparameters varying in the ranges indicated in Table3. The other parameters were kept at “normal” values(Table 3). Although the results depend upon these“normal” values, they will describe how the PHSmodel works and make possible the comparison withthe predictions using ISO 7933.
Figures 6–10 give the mean sweat rate, during thesecond hour of exposure.
The following remarks can be made.
Air temperature and humidity (Fig. 6)As the metabolic rate is equal to 290 watts in these
simulations, SWPHS reaches a maximum of 740 g/h.This will also be the case when the other parameters(tr2ta), va, Icl vary, except for the metabolic rate sincethe maximum sweat rate is estimated as a functionof M. SWISO shows some singularities in very humidconditions (35°C, pa>3 kPa), decreasing with anincrease in partial vapour pressure. This is clearlyerroneous, as mentioned previously. SWPHS does notshow this since the PHS model takes into accountthe decrease in evaporation efficiency for theoreticalwetness greater than 1.
Table 3. Range of variation and normal values of the cli-matic parameters during the simulations
Range Normal values
Humidity pa (kPa) 0.5–4.5 3Radiation (tr2ta) (°C) 0–60 0Air velocity va (ms21) 0–1 0.3Metabolic rateM (W) 100–450 290Clothing insulationIcl (clo) 0–1 0.5
Air temperature and radiant temperature (Fig. 7)SWISO and SWPHS are about the same when the
radiation load varies: the computation of the radiationexchange is the same in both models for non-reflec-tive clothing.
Air temperature and air velocity (Fig. 8)The maximum sweat rate is reached between 37
and 43°C when the velocity increases from 0 to 1ms21. The influence of the air velocity on SWPHS isgreater than on SWISO, due to the modificationsbrought to the algorithms for convection and evapor-ation.
Air temperature and metabolic rate (Fig. 9)The PHS model assumes that the maximum sweat
rate varies as a function of the metabolic rate, with alower limit of 250 W m22 and an upper limit of 400W m22.
SWISO and SWPHS are about the same when themetabolic rate varies, except for the maximum value,constant in ISO 7933 (250 W m22) and increasingwith M for PHS.
Air temperature and clothing insulation (Fig. 10)The maximum sweat rate is reached forta=35°C
for a clo value of 1 and forta=43°C for a nude person.Below these air temperatures, the sweat rate increaseslinearly with the clothing insulation. Clothing insu-lations equal to 0.8 and 1 clo lead to lower values ofSWISO. This is obviously not correct and disappearedfor SWPHSdue to the improved influence of the cloth-ing.
As mentioned already, these simulations weremade as a function of two parameters, the others
by guest on January 6, 2015http://annhyg.oxfordjournals.org/
Dow
nloaded from

132 J. Malchaireet al.
Fig. 6. Evolution of the sweat rate (mean value during the second hour of exposure) as a function of air temperature (ta) andhumidity (pa).
Fig. 7. Evolution of the sweat rate (mean value during the second hour of exposure) as a function of air temperature (ta) andradiation (tr2ta).
being held constant at “normal” values, and the quan-titative conclusions may not be generalised. It can,however, be concluded that the PHS model is givingmore realistic results than ISO 7933.
COMPARISON BETWEEN THE PHS MODEL ANDTHE WBGT INDEX
The DLE was computed in 3680 sets of conditionswith the primary parameters varying in the range indi-cated in Table 3. The clothing insulation was heldconstant to 0.6, as the WBGT index is supposed toapply strictly in this clothing condition. At the sametime, the WBGT and WBGTlimit were computed forthe same conditions according to ISO 7243 (1982),and using the algorithm developed by Malchaire
(1976). This WBGT limit was computed usingWBGTlimit=34.32M/35.5 (withM in W). Figure 11compares the DLEPHS with the differences(WBGT2WBGTlimit). A positive difference meansthat the work may not be performed continuously.
Most of the DLE lower than 4 h occur in conditionsfor which the WBGT difference is positive. In theseconditions, according to the WBGT index, work can-not be pursued continuously and 1 h work–rest regi-mens must be organised. The PHS indicates that,indeed, in many conditions, the DLEPHS is short.However, as an example, the following three con-ditions give the same WBGT difference, while,according to the PHS model, the DLE are respectively30, 236 and 425 min.
ta = 40°C RH = 20%
by guest on January 6, 2015http://annhyg.oxfordjournals.org/
Dow
nloaded from

133Predicted heat strain model
Fig. 8. Evolution of the sweat rate (mean value during the second hour of exposure) as a function of air temperature (ta) andair velocity (va).
Fig. 9. Evolution of the sweat rate (mean value during the second hour of exposure) as a function of air temperature (ta) andmetabolic rate (M).
tr = 40°C va = 1.0 ms21
M = 450 W Icl = 0.6 cloWBGT = 27.6 WBGTlimit = 21.6
ta = 25°C RH = 60%tr = 45°C va = 0 ms21
M = 350 W Icl = 0.6 cloWBGT = 30.4 WBGTlimit = 24.4
ta = 30°C RH = 80%tr = 60°C va = 1.5 ms21
M = 300 W Icl = 0.6 cloWBGT = 31.7 WBGTlimit = 25.8
In these three conditions, the PHS model predicts that
after 60 min, equilibrium rectal temperatures of 38.1,37.6 and 37.6°C, respectively, would be reached andthat, after 8 h, the total water losses would be about7, 6 and 5.2 l. These three conditions are thereforeindeed not equivalent, although the differences arelower than the DLE figures given above would sug-gest.
From this, the WBGT appears to play its role ofscreening method, suggesting that there might be athermal stress problem. The PHS model can then beused to determine whether there is indeed a heat stressproblem and to organise work accordingly.
Figure 11 shows that conditions exist when, on thecontrary, the WBGT does not exceed WBGTlimit,while, according to the PHS model, the work durationshould be limited. This is the case for instance in thecondition for which WBGT=19.6 and WBGTli-
by guest on January 6, 2015http://annhyg.oxfordjournals.org/
Dow
nloaded from

134 J. Malchaireet al.
Fig. 10. Evolution of the sweat rate (mean value during the second hour of exposure) as a function of air temperature (ta) andclothing insulation (Icl).
Fig. 11. Comparison between the duration limit of exposure estimated from PHS and the difference between the WBGT indexand the WBGT limit in 3680 sets of conditions.
mit=21.6: ta=20°C, tr=60°C, RH=20%, va=1 ms21,M=450 W, Icl=0.6. Actually, the PHS model predictsthat, in this condition, the rectal temperature reaches38°C after 53 min but levels at 38.03°C. The DLEfor dehydration is equal to 458 min and should beused. All the points in Fig. 11 with negative WBGTdifference and DLEPHS lower than 100 min do indeedcorrespond to such conditions and therefore shouldnot be interpreted as limitations of the PHS model.
CONCLUSIONS
The Required Sweat Rate prediction modeldescribed in ISO 7933 was revised in depth and new
algorithms were developed, based on the scientificliterature and some new researches, concerning theconvective and evaporative exchanges, the skin tem-perature, the skin–core heat distribution, the rectaltemperature and the evaporation efficiency.
The criteria for maximum sweat rate, maximumdehydration and maximum increase in core tempera-ture were revised in a companion paper. This led tothe development of a new model, called PredictedHeat Strain (PHS), which makes it possible to predictthe actual sweat rate and the rectal temperature foran average subject and to determine Durations Limitof Exposure (DLE) to protect 50% and 95% of theworking population.
by guest on January 6, 2015http://annhyg.oxfordjournals.org/
Dow
nloaded from

135Predicted heat strain model
This PHS model was validated by comparison withdata from 672 laboratory experiments conducted pre-viously by the different research partners. The modelproved to provide reasonably accurate predictions,taking into account the interindividual differences inthermophysiological response.
The results of the PHS model were also tested in237 field experiments: the prediction can be con-sidered to be satisfactory considering the fact that theaccuracy of the primary data is usually reduced insuch conditions.
Both for laboratory and field data, the predictionsare clearly more reliable than when using the ISO7933 Standard. The PHS model was also found todiscriminate more than the WBGT index in definingthe severity of the potential heat stress.
This PHS model will be proposed for the revisionof the ISO 7933 in the coming years.
Acknowledgements–The BIOMED II Programme of the Euro-pean Commission supported this work.
REFERENCES
Alber, B. and Holme´r, I. (1994) Sweating efficiency of unaccli-matized women and men working in hot, humid environ-ments InProceedings of the 6th International Conferenceon Environmental Ergonomics, Montebello, Canada, 25–30September, eds J. Frim, M. B. Ducharme and P. Tikuisis,pp. 24–25..
Candas, V. (1980) Influence de la mouillure cutane´e sur l’evo-lution du debit sudoral et des tempe´ratures corporelles chezl’homme. These presentee pour l’obtention du Doctoratd’Etat, mention Sciences, Universite´ L. Pasteur, Strasbourg,pp. 142
Colin, J., Timbal, J., Houdas, Y., Boutelier, C. and Guieu, J.(1971) Computation of mean body temperature from rectaland skin temperatures.Journal of Applied Physiology31(3),484–489.
Edwards, R. J., Belyavin, A. J. and Harrison, M. H. (1978)Core temperature measurement in man.Aviation, Space, andEnvironmental MedicineNovember, 1289–1294.
Gagge, A. P. and Nishi, Y. (1977) Heat exchange betweenhuman skin surface and thermal environment InHandbookof Physiology, pp. 69–92. (Chap. 5).
Givoni, B. (1976) Man, Climate and Architecture. AppliedScience Publishers, London.
Haslam, R. A. and Parsons, K. C. (1987) A comparison ofmodels for predicting human response to hot and coldenvironments.Ergonomics30, 1599–1614.
Haslam, R. A. and Parsons, K. C. (1994) Using computer-basedmodels for predicting human thermal responses to hot andcold environments.Ergonomics3, 399–416.
Havenith, G., Holme´r, I., den Hartog, E. A. and Parsons, K.C. (1999) Clothing evaporative heat resistance. Proposal forImproved Representation in Standards and Models.Annalsof Occupational Hygiene43(5), 339–346.
Hettinger, Th, Eissing, G., Hertting, R. and Steinhaus, I. (1985)Belastung und Beanspruchung durch das Tragen per-sonlicher Schutzausru¨stungen. BAU (Hrsg.), Forschungsbe-richt Nr. 392. Wirtschaftsverlag NW, Bremerhaven.
Holmer, I., Nilsson, H., Havenith, G. and Parsons, K. C. (1999)Clothing convective heat exchange. Proposal for Improved
Representation in Standards and Models.Annals of Occu-pational Hygiene43(5), 329–337.
ISO 7243 (1982)Hot Environments—Estimation of the HeatStress on Working Man, Based on the WBGT-Index (WetBulb Globe Temperature). International Organisation forStandardisation, Geneva.
ISO 7933 (1989)Hot Environments—Analytical Determinationand Interpretation of Thermal Stress Using Calculation ofRequired Sweat Rate. International Standard Organization,Geneva.
Kahkonen, E. (1993)Comparison and Error Analysis of Instru-mentation and Methods for Assessment of Neutral and HotEnvironment on the Basis of ISO Standards. Kuopio Univer-sity Publications, Kuopio, Finland.
Kampmann, B. and Piekarski, C. (2000) The evaluation ofworkplaces subject to heat stress: can ISO 7933 (1989)adequately describe heat strain in industrial workplaces?.Applied Ergonomics31, 59–72.
Kohler, E. (1976) Physiologische Reaktionen in Bereich derHitzetoleranzgrenze bei einer ruhenden Versuchsperson(Physiological reactions in resting test subjects at the limitof their heat tolerance.) Dissertation Universita¨t Tubingen.
Livingstone, S. D., Nolan, R. W., Cain, J. B. and Keefe, A. A.(1994) Effect of working in hot environments on respiratoryair temperatures.European Journal of Applied Physiology69, 98–101.
Malchaire, J. (1976) Evaluation of natural wet bulb and wetglobe thermometers.Annals of Occupational Hygiene19,251–258.
Malchaire, J. (1986)Validation des Indices de Contrainte Ther-mique pour la Pre´diction des Astreintes et des Dure´es Lim-ites d’Exposition. Rapport final de recherche CECA7247.22.01, Luxembourg
Malchaire, J. (1991) Predicted sweat rate in fluctuating thermalconditions. European Journal of Applied Physiology63,282–287.
Malchaire, J., Gebhardt, H. J. and Piette, A. (1999) Strategyfor evaluation and prevention of risk due to work in thermalenvironment.Annals of Occupational Hygiene43(5), 367–376.
Malchaire, J., Kampmann, B., Havenith, G., Mehnert, P. andGebhardt, H. J. (2000) Criteria for estimating acceptableexposure times in hot working environments: a review.Inter-national Archives of Occupational and EnvironmentalHealth, 73, 215–220.
Mehnert, P., Malchaire, J., Kampmann, B., Piette, A., Griefahn,B. and Gebhardt, H. J. (2000) Prediction of the average skintemperature in warm and hot environments.European Jour-nal of Applied Physiology, 82, 52–60.
Smolander, J., Ilmarinen, R. and Korhonen, O. (1991) Anevaluation of heat stress indices (ISO 7243, ISO/DIS 7933)in the prediction of heat strain in unacclimated men.Inter-national Archives of Occupational and EnvironmentalHealth 63, 39–41.
Stolwijk, J. A. and Hardy, J. D. (1966) Partitional calorimetricstudies of responses of men to thermal transients.Journal ofApplied Physiology21(3), 967–977.
Varene, P. (1986) Computation of respiratory heat exchanges.Journal of Applied Physiology61(4), 1586–1589.
Vogt, J. J., Candas, V. and Libert, J. P. (1982) Graphical deter-mination of heat tolerance limits.Ergonomics25(4), 285–294.
Zintl, W. (1979) Physiologische Reaktionen im Bereich derHitzetoleranzgrenze vor und nach Hitzeakklimation bei einerruhenden Versuchsperson (Physiological reactions in restingtest subjects at the limit of their heat tolerance before andafter acclimatization to heat.) Dissertation Universita¨t Tub-ingen.
by guest on January 6, 2015http://annhyg.oxfordjournals.org/
Dow
nloaded from