![ICND10S08A [Read-Only]](https://static.fdokumen.com/doc/165x107/6316f88cf68b807f880375d2/icnd10s08a-read-only.jpg)
Only Slight Impact of Predicted Replicative Capacity for Therapy Response Prediction
10
Only Slight Impact of Predicted Replicative Capacity for Therapy Response Prediction Hendrik Weisser 1 , Andre ´ Altmann 1 *, Saleta Sierra 2 , Francesca Incardona 3 , Daniel Struck 4 , Anders So ¨ nnerborg 5 , Rolf Kaiser 2 , Maurizio Zazzi 6 , Monika Tschochner 7 , Hauke Walter 7 , Thomas Lengauer 1 1 Computational Biology and Applied Algorithmics, Max Planck Institute for Informatics, Saarbru ¨ cken, Germany, 2 Institute of Virology, University of Cologne, Cologne, Germany, 3 Informa s.r.l., Rome, Italy, 4 Retrovirology Laboratory, CRP-Sante ´, Strassen, Luxembourg, 5 Department of Medicine, Division of Infectious Diseases, Karolinska Institute, Stockholm, Sweden, 6 Department of Molecular Biology, University of Siena, Siena, Italy, 7 Institute of Clinical and Molecular Virology, University of Erlangen, Erlangen, Germany Abstract Background: Replication capacity (RC) of specific HIV isolates is occasionally blamed for unexpected treatment responses. However, the role of viral RC in response to antiretroviral therapy is not yet fully understood. Materials and Methods: We developed a method for predicting RC from genotype using support vector machines (SVMs) trained on about 300 genotype-RC pairs. Next, we studied the impact of predicted viral RC (pRC) on the change of viral load (VL) and CD4 + T-cell count (CD4) during the course of therapy on about 3,000 treatment change episodes (TCEs) extracted from the EuResist integrated database. Specifically, linear regression models using either treatment activity scores (TAS), the drug combination, or pRC or any combination of these covariates were trained to predict change in VL and CD4, respectively. Results: The SVM models achieved a Spearman correlation (r) of 0.54 between measured RC and pRC. The prediction of change in VL (CD4) was best at 180 (360) days, reaching a correlation of r = 0.45 (r = 0.27). In general, pRC was inversely correlated to drug resistance at treatment start (on average r = 20.38). Inclusion of pRC in the linear regression models significantly improved prediction of virological response to treatment based either on the drug combination or on the TAS (t-test; p-values range from 0.0247 to 4 10 26 ) but not for the model using both TAS and drug combination. For predicting the change in CD4 the improvement derived from inclusion of pRC was not significant. Conclusion: Viral RC could be predicted from genotype with moderate accuracy and could slightly improve prediction of virological treatment response. However, the observed improvement could simply be a consequence of the significant correlation between pRC and drug resistance. Citation: Weisser H, Altmann A, Sierra S, Incardona F, Struck D, et al. (2010) Only Slight Impact of Predicted Replicative Capacity for Therapy Response Prediction. PLoS ONE 5(2): e9044. doi:10.1371/journal.pone.0009044 Editor: Olivier Schwartz, Institut Pasteur, France Received September 7, 2009; Accepted January 15, 2010; Published February 3, 2010 Copyright: ß 2010 Weisser et al. This is an open-access article distributed under the terms of the Creative Commons Attribution License, which permits unrestricted use, distribution, and reproduction in any medium, provided the original author and source are credited. Funding: The work at Max Planck Institute for Informatics was supported by the EuResist project (EU grant IST-2004-027173-STP). The funders had no role in study design, data collection and analysis, decision to publish, or preparation of the manuscript. Competing Interests: The authors have declared that no competing interests exist. * E-mail: [email protected] Introduction Modern therapy for patients infected with the human immunodeficiency virus type 1 (HIV-1) aims to reduce viral replication by blocking a number of targets. Viral entry can be blocked by either a fusion inhibitor binding to the viral gp41 protein or by a coreceptor antagonist that binds to the CCR5 coreceptor and therefore prevents the CCR5-using viruses from entering the host cell. Reverse transcriptase (RT) inhibitors are subdivided into two classes depending on their mechanism of action. Nucleoside reverse transcriptase inhibitors (NRTIs) are nucleoside analogs that block chain elongation after their incorporation into newly synthesized DNA. Non-nucleoside reverse transcriptase inhibitors (NNRTIs) bind to the viral RT and allosterically hinder DNA polymerization by impairing the mobility of particular RT domains [1]. Integrase inhibitors impede the transfer of the newly synthesized viral DNA into the host genome. Protease (PR) inhibitors (PIs) prevent the maturation of infectious particles by blocking cleavage of gag-pol polyproteins by the viral protease [2]. The extraordinary capability of HIV to escape from drug pressure by developing resistance mutations promotes the continuous development of new antiretroviral drugs. HIV RT lacks a proof-reading mechanism, resulting in the high mutation rate of HIV (3.4 N 10 25 mutations per base per cycle of replication [3]). The high error rate coupled with a short generation time leads to a rapid selection of resistance mutations reducing susceptibility to drugs, sometimes within days [4]. To maximally suppress viral replication and minimize the rapid emergence of drug resistance mutations, modern anti-HIV therapy combines several compounds from different drug classes for achieving different selective pressures and higher antiviral potency. This PLoS ONE | www.plosone.org 1 February 2010 | Volume 5 | Issue 2 | e9044
-
Upload
independent -
Category
Documents
-
view
1 -
download
0
Transcript of Only Slight Impact of Predicted Replicative Capacity for Therapy Response Prediction

Only Slight Impact of Predicted Replicative Capacity forTherapy Response PredictionHendrik Weisser1, Andre Altmann1*, Saleta Sierra2, Francesca Incardona3, Daniel Struck4, Anders
Sonnerborg5, Rolf Kaiser2, Maurizio Zazzi6, Monika Tschochner7, Hauke Walter7, Thomas Lengauer1
1 Computational Biology and Applied Algorithmics, Max Planck Institute for Informatics, Saarbrucken, Germany, 2 Institute of Virology, University of Cologne, Cologne,
Germany, 3 Informa s.r.l., Rome, Italy, 4 Retrovirology Laboratory, CRP-Sante, Strassen, Luxembourg, 5 Department of Medicine, Division of Infectious Diseases, Karolinska
Institute, Stockholm, Sweden, 6 Department of Molecular Biology, University of Siena, Siena, Italy, 7 Institute of Clinical and Molecular Virology, University of Erlangen,
Erlangen, Germany
Abstract
Background: Replication capacity (RC) of specific HIV isolates is occasionally blamed for unexpected treatment responses.However, the role of viral RC in response to antiretroviral therapy is not yet fully understood.
Materials and Methods: We developed a method for predicting RC from genotype using support vector machines (SVMs)trained on about 300 genotype-RC pairs. Next, we studied the impact of predicted viral RC (pRC) on the change of viral load(VL) and CD4+ T-cell count (CD4) during the course of therapy on about 3,000 treatment change episodes (TCEs) extractedfrom the EuResist integrated database. Specifically, linear regression models using either treatment activity scores (TAS), thedrug combination, or pRC or any combination of these covariates were trained to predict change in VL and CD4,respectively.
Results: The SVM models achieved a Spearman correlation (r) of 0.54 between measured RC and pRC. The prediction ofchange in VL (CD4) was best at 180 (360) days, reaching a correlation of r = 0.45 (r = 0.27). In general, pRC was inverselycorrelated to drug resistance at treatment start (on average r = 20.38). Inclusion of pRC in the linear regression modelssignificantly improved prediction of virological response to treatment based either on the drug combination or on the TAS(t-test; p-values range from 0.0247 to 4 1026) but not for the model using both TAS and drug combination. For predictingthe change in CD4 the improvement derived from inclusion of pRC was not significant.
Conclusion: Viral RC could be predicted from genotype with moderate accuracy and could slightly improve prediction ofvirological treatment response. However, the observed improvement could simply be a consequence of the significantcorrelation between pRC and drug resistance.
Citation: Weisser H, Altmann A, Sierra S, Incardona F, Struck D, et al. (2010) Only Slight Impact of Predicted Replicative Capacity for Therapy ResponsePrediction. PLoS ONE 5(2): e9044. doi:10.1371/journal.pone.0009044
Editor: Olivier Schwartz, Institut Pasteur, France
Received September 7, 2009; Accepted January 15, 2010; Published February 3, 2010
Copyright: � 2010 Weisser et al. This is an open-access article distributed under the terms of the Creative Commons Attribution License, which permitsunrestricted use, distribution, and reproduction in any medium, provided the original author and source are credited.
Funding: The work at Max Planck Institute for Informatics was supported by the EuResist project (EU grant IST-2004-027173-STP). The funders had no role instudy design, data collection and analysis, decision to publish, or preparation of the manuscript.
Competing Interests: The authors have declared that no competing interests exist.
* E-mail: [email protected]
Introduction
Modern therapy for patients infected with the human
immunodeficiency virus type 1 (HIV-1) aims to reduce viral
replication by blocking a number of targets. Viral entry can be
blocked by either a fusion inhibitor binding to the viral gp41
protein or by a coreceptor antagonist that binds to the CCR5
coreceptor and therefore prevents the CCR5-using viruses from
entering the host cell. Reverse transcriptase (RT) inhibitors are
subdivided into two classes depending on their mechanism of
action. Nucleoside reverse transcriptase inhibitors (NRTIs) are
nucleoside analogs that block chain elongation after their
incorporation into newly synthesized DNA. Non-nucleoside
reverse transcriptase inhibitors (NNRTIs) bind to the viral RT
and allosterically hinder DNA polymerization by impairing the
mobility of particular RT domains [1]. Integrase inhibitors impede
the transfer of the newly synthesized viral DNA into the host
genome. Protease (PR) inhibitors (PIs) prevent the maturation of
infectious particles by blocking cleavage of gag-pol polyproteins by
the viral protease [2].
The extraordinary capability of HIV to escape from drug
pressure by developing resistance mutations promotes the
continuous development of new antiretroviral drugs. HIV RT
lacks a proof-reading mechanism, resulting in the high mutation
rate of HIV (3.4 N 1025 mutations per base per cycle of replication
[3]). The high error rate coupled with a short generation time
leads to a rapid selection of resistance mutations reducing
susceptibility to drugs, sometimes within days [4]. To maximally
suppress viral replication and minimize the rapid emergence of
drug resistance mutations, modern anti-HIV therapy combines
several compounds from different drug classes for achieving
different selective pressures and higher antiviral potency. This
PLoS ONE | www.plosone.org 1 February 2010 | Volume 5 | Issue 2 | e9044
practice, called highly active antiretroviral therapy (HAART),
achieves a dramatic delay in disease progression to AIDS and
death [5].
However, after the introduction of HAART, the prevalence
of drug resistance in therapy-experienced – but also in therapy-
naıve – patients increased and raised the need for assessing the
viral susceptibility to each compound before administration [6,7].
Drug resistance can be determined functionally by recombinant
virus assays testing viral replication against every compound in vitro
[8–10]. However, obtaining the drug resistance phenotype is
labour- and cost-intensive. Thus, sequencing of the relevant
regions of the HIV genome for detecting drug resistance associated
mutations has become standard-of-care. In contrast to phenotypic
information, data resulting from genotyping is complex and hard
to interpret. Several tools have been developed for interpretation
of the genotype. Rules-based algorithms apply sets of rules, which
were handcrafted by experts to assess resistance against a single
compound [11,12]. Approaches based on bioinformatics methods
try to predict the fold-change in resistance from genotype [13,14].
Recent bioinformatics approaches go even further and predict in
vivo response to antiretroviral combination therapy [15,16].
Resistance mutations bear a clear advantage for the virus in the
presence of drugs. They alter the viral proteins in a way that they
remain functional even in the presence of the given drugs.
However, most of the resistance mutations lead to disadvantages
for the virus in the absence of drugs, as they are neither observed in
their natural, drug-free environment, nor usually after interruption
of therapy [17]. In other words, being able to replicate in the
presence of drugs comes at the cost of reduced function of the target
protein with respect to the wild type protein. Therefore, resistance
has an impact on viral fitness, which stands more generally for the
ability to yield progeny virus in a given environment, as compared
to a reference strain in the same environment [18]. A number of
resistance mutations are indeed termed compensatory or secondary
drug resistance mutations since they restore at least partially the
enzyme function possibly compromised by the true resistance
mutation(s). The efficacy of the viral replication machinery in drug
resistant strains thus depends on the interaction between impairing
and compensating effects and influences the velocity of viral
replication – captured by the term replicative capacity (RC). RC
determination has been faced in numerous ways and can be
assessed by counting the number of newly assembled infectious
viruses within a fixed amount of time. Strictly speaking, comparing
the RC of a clinical isolate to the RC of a laboratory reference
strain grown in the same (drug-free) environment is a measure of in
vitro fitness. Thus, some aspects of viral fitness can be measured in
vitro in terms of RC [19,20].
A low viral fitness is often held responsible for high CD4+ T-cell
counts despite the presence of a high viral load [21]. However,
although viral fitness is associated with response to antiretroviral
therapy [22], it has never been applied as an additional covariate
for inferring response to treatment with statistical methods. In this
work, statistical models for predicting RC from genotype based on
two datasets comprising genotype-RC pairs are described and
validated on clinical data. The focus of this work is the assessment
of the clinical relevance of predicted RC (pRC) in relation to
measures of treatment response (viral load and CD4+ T-cell
count).
Materials and Methods
Prediction of Replication Capacity from GenotypeBasis for this work were two datasets relating experimentally
determined HIV RC to PR and RT sequences. In both datasets,
RC was expressed as a percentage value relative to a wild-type
reference strain (pNL4-3; GenBank accession no. M19921).
The first dataset, termed Monogram, had been the subject of
study in previous works [23,24]. The dataset comprised 317 RC-
sequence pairs, and was kindly provided by one of the authors of
the work by Segal et al. [24]. RC was measured using a modified
version of the PhenoSense assay (Monogram Biosciences) [25].
Amino acid sequences from population-based sequencing were
given for positions 4 to 99 of the PR and positions 38 to 223 of the
RT. The genotypes did not contain ambiguities.
The second dataset comprised 253 RC-sequence pairs. Here,
RC was measured using a novel assay developed at the University
of Erlangen-Nurnberg. Genotypes were derived from patient
samples by population-based sequencing and occasionally contain
ambiguities. The whole PR sequence and the RT sequence up to
position 220 were used. This dataset is termed Erlangen.
For predicting viral RC from genotype, support vector
regression (SVR) models were trained on both experimental
datasets. SVR was selected because it is a powerful and well-
established technique that has worked well with biological
sequence data in previous studies, e.g. in a work by Beerenwinkel
et al. [13]. The associated computations were carried out with the
R programming language and environment [26], and in particular
the SVR implementation in package e1071 [27]. All subsequent
statistical analyses were also performed in R. The HIV raw
genotypic information in the training datasets was encoded as
numerical vectors for generating a suitable input to the SVR.
Every position in an amino acid sequence was replaced by a
sequence of 20 indicators. Each indicator corresponded to one of
the 20 possible amino acids (in a predefined order). An indicator
was set to 1 (0), if its associated amino acid was (not) present. In the
case of an ambiguity at a sequence position, the indicators for the
occurring amino acids are set to 1/n, with n being the number of
inferred amino acids. For a protein sequence of length m,
concatenating the indicator representations of the amino acids
along the sequence led to the full indicator vector of length 20m. In
the context of statistical modelling, every indicator constituted an
input feature (predictor) for the prediction method. Constant
features as well as each feature corresponding to the consensus
amino acid at a certain sequence position (usually the wild-type)
were removed from the indicator matrix of the training data, as
such features contain no additional information. For improving
robustness against outliers, the decadic logarithm of the RC
percentage was used as response for the regression models rather
than the RC percentage itself.
The number of predictor variables was further reduced by a
feature selection step to achieve maximal performance of the
regression models. Support vector regression with a linear kernel
was applied for estimating feature importance. First, to obtain
reasonably performing linear SVR models the cost parameter C
was optimized by cross-validation for both datasets. Feature
importance was defined as the standard score (z-score) of the
coefficients in the linear SVR model. To achieve a stable feature
ranking for each dataset, 100 linear SVR models from a 10610-
fold cross-validation were computed and the z-scores were
averaged. The final RC prediction models were SVR models
with polynomial kernels (of degree three) comprising only features
with an average z-score of 1.5 and above (about 7% of the total).
Leave-one-out cross-validation (LOOCV) was used for assessing
the performance of RC prediction. Briefly, LOOCV uses a single
observation from the dataset for validation and all remaining
samples for training the model. The process is repeated for all
observations from the dataset in order to obtain one prediction for
every sample. In addition, a 10610-fold cross-validation of the
Impact of Replication Capacity
PLoS ONE | www.plosone.org 2 February 2010 | Volume 5 | Issue 2 | e9044
Monogram model was performed. Prediction error variance (the
lower the better) and residual sum of squares (RSS) were
computed for comparing the model performance to those
previously published by Segal et al. [24] and Birkner et al. [23],
respectively.
Validation of Predicted RC on Clinical DataThe main focus of this work was the estimation of significance of
viral RC in the clinical context. However, in a pre-analysis the RC
prediction was validated on clinical data. More precisely, in order
to validate our model beyond the correlation of measured and
predicted values, pRC was challenged to confirm well-known
correlations of RC with drug resistance, number of treatment
lines, and treatment interruptions.
For addressing both issues, a set of clinical data in the form of
treatment change episodes (TCEs) was extracted from the EuResist
database [28]. This TCE dataset consisted of 2913 samples, each
corresponding to one antiretroviral therapy. For each sample,
information on the applied drug combination, the HIV genotype,
and viral load (VL) before onset of the treatment (baseline) were
included. For 2376 samples, baseline CD4+ T-cell counts were also
available. Moreover, follow-up measurements of viral load and
CD4+ T-cell count after 90 (630), 180 (645), 360 (660), 720
(690), and 1080 (6120) days were available for some samples
(Table 1).
As a first validation, the baseline sequences of the TCE dataset
were used to study the connection between RC and drug
resistance. The cumulative resistance score (CRS) characterizes HIV
strains with respect to resistance against all 17 compounds
as predicted by the geno2pheno system [13] (http://www.
geno2pheno.org). Precisely, the resistance against each drug,
regardless of the use in the ongoing treatment, was predicted from
genotype using geno2pheno. Subsequently, the resulting fold-
change values were compared to drug-specific cut-offs (already
applied in [29]), and a score of 1 (‘‘resistant’’ or ‘‘no activity’’), 0.5
(‘‘intermediate activity’’), or 0 (‘‘no resistance’’ or ‘‘full activity’’)
was assigned to each drug. Thus, higher scores indicated a higher
overall level of drug resistance. Furthermore, the relation between
resistance against single drugs and RC was studied by computing
the resistance against a drug with geno2pheno and using only the
sequence of the drug target for the RC prediction (the remaining
sequence positions were padded according to the wild-type strain
HXB2). Hence, by examining the association of resistance and
predicted RC values, an indication of the validity of an RC
prediction method could be gained.
In addition, 5475 genotypes from 3869 patients were extracted
from the EuResist database along with the number of therapies
prior to the date of genotyping. These genotypes were used to
investigate the relation between pRC and cumulative treatment
exposure. If multiple genotypes with the same number of previous
therapies were available for the same patient, only the earliest was
considered. CRS and pRC were correlated with the number of
previous treatments.
A last analysis was conceived to investigate the change of pRC
during treatment interruptions. The corresponding dataset
comprised a total of 162 HIV genotypes from 57 patients, some
of them previously included in [17]. The sequences were obtained
at or around (lower quartile: 2.5 days before, upper quartile: 2
days after) the end of a treatment and at up to four different points
during the therapy break. The baseline and the first follow-up
genotype – usually from about two months after the end of therapy
(median: 58 days, lower/upper quartile: 40/91 days) – were
available for every patient, but the number of missing cases
increased for each of the three later follow-ups.
Clinical Relevance of Predicted RCIn order to study the clinical relevance of pRC, a treatment
activity score (TAS) that summarized the activity of the ongoing
antiretroviral therapy (ART) was computed. The score is closely
related to the well-established genotypic and phenotypic
susceptibility scores (G/PSS) [30]. Precisely, for the TAS only
resistance against the compounds used in the regimen was
computed and compared to the drug-specific cut-offs (as opposed
to the CRS that considered all drugs regardless of their use in the
regimen). Moreover, boosting of PIs by RTV was taken into
account in this step, by using modified cut-offs for the PIs and
disregarding the score of RTV itself. In addition, the scale of the
measure was reversed compared to the CRS. Thus, the higher
the score, the higher is the expected efficacy of the applied drug
combination, and consequently, the lower the score, the stronger
the overall resistance of the viral population against the current
therapy.
The relevance of pRC for inferring a patient’s response to ART
was studied on the TCE dataset. In a first analysis, the TAS and
pRC were computed based on the baseline genotype. The
Spearman correlation between these measures and indicators of
disease progression (i.e. VL and CD4+ T-cell count) was computed
for the different time-points in the dataset. For further assessing
the effects of predicted RC on prediction of therapy outcome,
linear models for the prediction of changes in VL or CD4+ T-cell
count based on the following sets of input features were trained: (i)
Treatment activity expressed in terms of TAS. (ii) Resistance
against the applied drugs, as predicted from genotype by
geno2pheno. In place of the TAS, the raw predictions were used
and the values were not combined to a single score, but used
directly as inputs to the linear regression. Resistance values for
compounds not included in the treatment were set to zero. Hence,
the input vector comprised 17 real valued entries. (iii) The
combination of applied drugs, represented as a vector of 17 binary
indicators. Here no resistance was taken into account. (iv) The
applied drug combination (as in iii) complemented by the TAS (as
in (i)). Hence, the input vector comprised 17 binary and 1 real
valued entries. In addition, each of these sets of predictors was
supplemented by including both pRC features (predictions based
on the Erlangen and Monogram datasets, respectively). For every
time step in the TCE dataset and for each of the different feature
Table 1. Number of viral load and CD4+ T-cell count measurements at different points in time in the main clinical dataset.
time
measure baseline90 daysfollow-up
180 daysfollow-up
360 daysfollow-up
720 daysfollow-up
1080 daysfollow-up
viral load 2913 2031 2047 1457 675 333
CD4+ T-cell count 2376 1621 1613 1154 526 252
doi:10.1371/journal.pone.0009044.t001
Impact of Replication Capacity
PLoS ONE | www.plosone.org 3 February 2010 | Volume 5 | Issue 2 | e9044

sets, a 565-fold cross-validation scheme was applied to train and
to evaluate linear models for predicting the change in VL and
CD4+ T-cell count, respectively. Performance of the model was
assessed by computing the correlation between the real change in
VL (CD4+ T-cell count) and the change predicted by the model.
Results
Predictive Performance of RC ModelsComparison of the pRC values with the true in vitro
measurements resulted in Spearman correlations (r) of 0.546 for
the model based on Monogram data and r = 0.542 for the model
based on Erlangen data. Scatter plots of the LOOCV results are
shown in Figure 1. For comparison, the geno2pheno models for
the difficult to predict drugs stavudine (d4T) and zalcitabine (ddC)
yielded r = 0.586 and r = 0.596, respectively. Further measures of
prediction accuracy were computed for facilitating a comparison
of the performance of the SVM models to previously published
results. The prediction error variance (used by Segal et al. [24], the
lower the better) of RC percentages (non-logarithmized) predicted
by the polynomial SVR on the Monogram data is 444.1,
compared to 575.6 for the best random forest model reported
by Segal et al. Moreover, with a residual sum of squares (RSS) of
158.4, the cross-validated accuracy of the SVR prediction model
Figure 1. Leave-one-out cross-validation results for the Monogram data (left) and Erlangen data (right). Spearman correlations of trueand predicted RC values are r= 0.546 (Monogram) and r= 0.542 (Erlangen). For the Erlangen data, seven outliers with very high measured RC wouldappear further to the right side of the plot, but are not shown.doi:10.1371/journal.pone.0009044.g001
Table 2. Top ten mutations for each RC dataset according to weights derived from the initial linear SVR.
rank Monogram mutation influence Erlangen rank Erlangen mutation influence Monogram rank
1 RT M184V dec. 19 RT Q207E inc. 240
2 PR K43T dec. 568 PR V82A dec. 127
3 RT A158S dec. 126 RT Y181C inc. 150
4 PR Q92R dec. 401 RT T215Y dec. 18
5 PR I64L dec. 886 RT K20I inc. 49
6 PR K55R dec. 602 PR I13V dec. 132
7 PR E34K dec. 483 RT E122K inc. –
8 PR I47V dec. 366 RT L74V inc. 141
9 PR V32I dec. 131 RT S162C inc. 255
10 PR P39S dec. 141 RT T39E dec. 267
Along with a mutation, its influence on RC compared to the wild-type is listed – ‘‘dec.’’ for ‘‘decreasing’’, ‘‘inc.’’ for ‘‘increasing’’ – as well as its position in the featureranking of the other dataset. With the exception of RT A158S, PR I64L, PR P39S, RT Q207E, RT E122K, RT S162C, and RT T39E, all of theses mutations are known to beassociated with HIV drug resistance and/or fitness [20,31]. In total, the two feature rankings consist of 878 mutations from the Monogram dataset and 1018 mutationsfrom the Erlangen dataset; the difference is mainly due to the fact that fewer sequence positions are included in the Monogram genotypes. Note that the mutation RTE122K does not occur in the Monogram ranking. In the Monogram dataset, lysine (K) – not the wild-type glutamic acid (E) – is the consensus amino acid at position 122of the RT sequence, so that E122K was removed from the training dataset in the input coding phase. The clear dominance of RC-decreasing mutations in the Monogramdataset may be partly due to the stronger bias towards low-RC samples in this dataset (median measured RC of 38.45%, compared to 46.47% in the Erlangen dataset;see also Figure 1).doi:10.1371/journal.pone.0009044.t002
Impact of Replication Capacity
PLoS ONE | www.plosone.org 4 February 2010 | Volume 5 | Issue 2 | e9044

ranks between that of the two final deletion/substitution/addition
models presented by Birkner et al. (RSS of 148.3 and 178.7) [23].
Important MutationsBased on feature rankings derived from linear SVR models and
an averaged z-score threshold of 1.5, 61 mutations were selected as
significant features for each of the two RC datasets independently.
Table 2 lists the top ten mutations for each dataset. The feature
rankings derived from the two datasets differ widely. Only the
following nine mutations present significant features for both
datasets (sorted by significance): RT M184V, RT T215Y, PR
L90M, PR K20I, PR I72V, RT I202V, RT V118I, PR L33F, PR
L10I. For all of these mutations except for PR I72V and RT
I202V, a link to drug resistance or viral fitness has been reported
[20,31]. Leaving aside the substituted amino acids and considering
only mutated sequence positions, there are 22 common occur-
rences among the significant features of both datasets.
Validation of RC PredictionA graphical representation of the association of pRC and CRS
for the genotypes of the main clinical dataset is depicted in
Figure 2. The box plot shows the spread of the RC values for every
discrete value of CRS from four to seventeen (i.e. complete
resistance to all drugs). As expected, the correlation between
predicted RC and overall drug resistance of a viral strain was
clearly negative for both RC models. However, with r = 20.534
the correlation between the Monogram model and drug resistance
was more pronounced than the correlation of the Erlangen model
and CRS (r = 20.233).
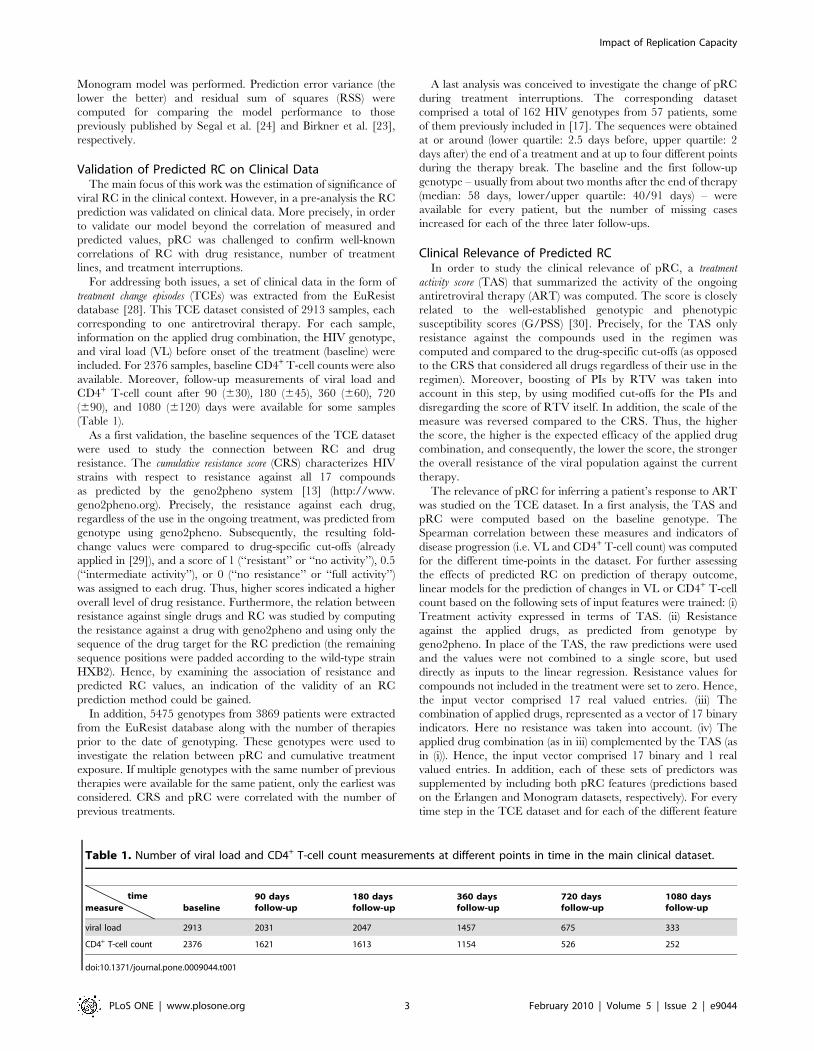
Figure 3 depicts the correlation of predicted RC and predicted
resistance against individual antiretroviral drugs. For almost all
compounds negative correlation coefficients, independent of the
dataset used to derive the RC prediction model, were observed.
Exceptions were the NNRTIs delavirdine (DLV), nevirapine
(NFV), and efavirenz (EFV), which exhibited correlations slightly
Figure 2. Association between predicted RC and cumulative resistance score. The underlying clinical dataset and the computation ofresistance scores are described in the Methods section. For each discrete value of the score, the distribution of viral RC as predicted from thecorresponding genotypes by a model based on Monogram data (top box plot) and Erlangen data (bottom box plot) is shown. The overall Spearmancorrelation of RC and resistance was 20.534 for Monogram and 20.233 for Erlangen RC predictions.doi:10.1371/journal.pone.0009044.g002
Impact of Replication Capacity
PLoS ONE | www.plosone.org 5 February 2010 | Volume 5 | Issue 2 | e9044
above zero if RC was predicted with the Erlangen model. Besides,
there existed a difference with respect to the RC prediction model
and the drug classes. For protease inhibitors, correlation
coefficients of resistance and RC were consistently lower for the
Erlangen model than for the Monogram model, and the inverse
was true for reverse transcriptase inhibitors.
Figure 4 displays the distribution of pRC and CRS for different
numbers of previous treatments. Patients with 20 or more
treatments formed a single group. The largest group of patients
were the therapy-naıve patients. CRS showed a strong positive
correlation with the number of previous therapies (r = 0.560) and,
as expected, the pRC was negatively correlated with the extent of
treatment exposure (r = 20.336 for the Monogram model and
r = 20.231 for the Erlangen model). Although the correlations
were not as pronounced as the one observed between CRS and
treatment experience, the distribution of pRC in the naıve patients
and the patients with e.g. 9 previous treatments was significantly
different according to a t-test (p-value of ,2.2 N 10216 and 1.699 N
1029 for the Monogram and Erlangen model, respectively).
For HIV genotypes obtained during treatment interruptions,
the models clearly tended to predict RC values that increased over
time (i.e. difference between first and second measure compared to
difference between first and last measure increased), as shown in
Figure 5. According to a paired t-test, the distribution of the
baseline measurement and first (n = 56) [last (n = 30)] measurement
during the therapy break were significantly different for the
Monogram and Erlangen model with p-values of 0.02919
[0.01402] and 0.00962 [0.02000], receptively.
Clinical Relevance of Predicted RCFigure 6 summarizes the correlation between pRC or TAS and
VL (CD4+ T-cell count) at different time points. In general,
correlation coefficients were low. A positive (negative) correlation
between pRC and VL (CD4+ T-cell count) was observed only for
the baseline measurements. At 90 days after therapy start, the
direction of the correlation between pRC and VL was inversed.
The strongest negative correlation was observed at about one year
of treatment. From then on the strength of the correlation steadily
decreased. However, at all time points the VL showed equal or
stronger correlation to TAS than to pRC. For 90 days and later
correlation of pRC with CD4+ T-cell count was close to zero and
correlation of TAS and CD4+ T-cell count was slightly positive.
Figure 7 summarizes the results of a one-sided t-test testing
whether pRC was lower in patients succeeding a treatment than in
patients failing a treatment. Patients were grouped with respect to
the activity of the treatment and the time of the follow-up
measurement. Treatment success was defined by a decline of VL
below the limit of detection (i.e. 50 copies per ml) or increase of
CD4+ T-cells by 50% or more compared to the baseline
measurement. No group exceeded the 5% significance threshold.
The upper panel of Figure 8 shows the results of predicting the
change in VL between baseline and different time points during
treatment. The models using pRC values as additional features
performed better in general. However, the magnitude of
improvement was dependent on the base model. The most
pronounced improvements were observed for the base models
using predicted (raw) resistances and binary indicators for the drug
combination, respectively. For models that included TAS as a
predictor, improvements were only moderate. The model that
used binary drug indicators and pRC as predictors performed as
well as the one using TAS and pRC in the first year of treatment,
and afterwards even outperformed the TAS and pRC-based
model. In general, the best performance was achieved when
predicting the change in VL at 180 days, afterwards predictive
performance decreased for all models. Including pRC as an
additional feature improved the models for predicting VL change
at 180 days based on raw fold-resistance values, indicators for the
drug combination, or the TAS significantly (t-test; p-values
ranging from 0.0247 to 4 N 1026).
Prediction of change in CD4+ T-cell count achieved worse
performance than prediction of change in VL (lower panel in
Figure 8). The peak of predictive performance was reached at one
year of treatment. For later time points the predictive performance
ceased. Again, models using pRC as an additional predictor
achieved comparable or better performance at all time points. As
in the case of VL change prediction, the major improvement was
observed for the model that used only binary drug indicators.
However, none of the improvements of the 360 days models
reached statistical significance.
Discussion
Based on experimental data, viral RC could be predicted from
HIV genotypes with moderate accuracy. The prediction accuracy
of the SVM models compare well to previously published results.
Moreover, results on the clinical data showed that this accuracy
was sufficient to confirm some pre-existing notions about RC
Figure 3. Correlation coefficients of predicted RC and predict-ed resistance against different antiretroviral drugs. (PIs: NFV -nelfinavir, ATV - atazanavir, LPV - lopinavir, RTV - ritonavir, IDV -indinavir, APV - amprenavir, SQV - saquinavir; NRTIs: 3TC - lamivudine,ddI - didanosine, ABC - abacavir, ddC - zalcitabine, ZDV - zidovudine,TDF - tenofovir, d4T - stavudine; NNRTIs: DLV - delavirdine, NVP -nevirapine, EFV - efavirenz). For the HIV genotypes in the main clinicaldataset, drug resistances with geno2pheno, as well as RC values basedon the Monogram dataset and Erlangen dataset, respectively, werepredicted. In each case, two RC predictions were made: one using onlythe protease sequence of the sample, and one using only the reversetranscriptase sequence. (The remaining sequence positions werepadded according to the wild-type strain HXB2, in order to complywith our prediction models that were derived from experimental dataincorporating both PR and RT.) Spearman correlations between theprotease-based RC predictions and the predicted resistances againstthe different protease inhibitors, as well as between RT-based RCpredictions and resistance against the RT inhibitors were computed.The results are shown in the plot, with drugs ordered by increasingcorrelation according to RC predictions based on Erlangen data.doi:10.1371/journal.pone.0009044.g003
Impact of Replication Capacity
PLoS ONE | www.plosone.org 6 February 2010 | Volume 5 | Issue 2 | e9044

derived from actual data. Thus, in general it is possible to draw
meaningful conclusions about the clinical significance of RC based
on RC predictions made by the models discussed here. The
prediction step added a source of uncertainty to the approach,
which was certainly a drawback. However, it also allowed for
leveraging the wealth of treatment data for which genotypes, but
no RC measurements, are available.
The validation on clinical data showed an inverse relationship of
pRC to drug resistance against single drugs and to the CRS. Since
most mutations that confer resistance are linked to an impairment
of viral RC, this type of association was expected. The clear
separation of drug classes in Figure 3 for the Erlangen model could
be related to increased number of viruses with highly mutated PR
in the Erlangen data compared to the Monogram data, e.g. using
the mutation list from [31] 61% (25%) of the sequences in the
Erlangen dataset had at least one (five) protease mutations
compared to 28% (3%) in the Monogram dataset. Correlation
between overall treatment experience and RC was clearly
negative, i.e. RC decreased when the number of previous
treatments increased. In general, a change of therapy accompa-
nied by a viral genotype marks a failure of the previous treatment,
which in turn was caused by resistance against the applied drugs.
These results confirmed the assumption that drug resistance has a
negative impact on RC. Moreover, the observed increase of
predicted RC during treatment interruptions complied with the
established understanding of the implications of ‘‘drug holidays’’.
Figure 4. Relationship between drug resistance, predicted RC and treatment experience. Based on 5475 genotypes from the EuResistdatabase, the distribution of resistance scores and predicted viral RC for different numbers of previous therapies (completed before the date ofgenotyping) is shown. In the middle box plot, RC was predicted from a model trained on Monogram data; below, RC predictions are based onErlangen data. The overall Spearman correlation between the number of previous therapies and the resistance score is 0.560; for the number oftherapies and predicted RC, we obtain correlation coefficients of 20.336 (Monogram predictions) and 20.231 (Erlangen predictions).doi:10.1371/journal.pone.0009044.g004
Impact of Replication Capacity
PLoS ONE | www.plosone.org 7 February 2010 | Volume 5 | Issue 2 | e9044

Without the selective pressure exerted by antiretroviral medica-
tion, the HIV population will be overgrown by strains that are less
resistant but exhibit higher RC, because those strains have a fitness
advantage in the drug-free environment. Evolution during the
treatment interruption of a subset of viruses was previously
analyzed in detail, and re-emergence of wild-type variants (defined
as loss of all drug resistance mutations) was observed only in about
18% of the cases [17]. Hence, re-emergence of complete wild-type
variants is an unlikely explanation for the observed increase in
pRC. Altogether, these observations support the validity of our
RC prediction method.
When studying the relationship between pRC and markers of
treatment response, only the measurements at baseline confirmed
assumptions about the direction of the relation. Later measure-
ments showed a relation that was inverse to the initially expected
one. However, this makes sense considering that, as an
antiretroviral therapy begins to take effect, the activity of the
treatment becomes the main influence on the replication of the
virus population. In other words, under the impact of the
medication, viral fitness is determined mainly by resistance against
the applied drugs, rather than by the replication capacity. Since
drug resistance mutations were usually associated with a negative
influence on RC, as previous results showed, the initial
correlations between RC and the clinical markers could not be
observed at the follow-up points. Moreover, in patient groups
receiving equally active regimens, pRC was not lower in patients
with virologic or immunologic success than in patients experienc-
ing a treatment failure across all follow-up times and activity
classes. In addition, this result contradicts the general belief that
low viral fitness may occasionally help to maintain high levels of
CD4+ T-cells in the absence of an effective treatment.
The decrease of performance for models that predict change in
VL (CD4+ T-cell count) for time points after 180 (360) days might
be explained by the emergence of new mutations during the course
of therapy. Hence, the baseline HIV genotype (from which most
predictors are derived) ceased to determine the clinical response at
later points in time. This notion seems to be substantiated by the
fact that the decrease in predictive power was less (in the case of
VL) or none (in the case of CD4+ T-cell count) for predictions
based on the combination of applied drugs, which were
independent of the genotype. Moreover, it was surprising that
predicted resistances against the applied drugs were less indicative
of clinical outcomes than TAS, which was in fact a summary of the
resistances. However, the drug-specific cut-offs that were applied
for computing TAS were based on clinical knowledge not present
in the raw resistance values. Remarkably, the model based on TAS
(TAS and pRC) performed worse than (similar to) the model based
simply on drug indicators and pRC. Here pRC seems to
summarize the resistance information without the need of
providing clinically optimized cut-offs. Perhaps most important
for the core question of this work is the fact that the inclusion of
pRC features could indeed improve the prediction of clinical
response. The amount of improvement differed between model
formulations, but was quite consistent for different time steps.
However, for linear models that incorporated TAS as a predictor
the performance gain conferred by additional RC features was
negligible.
ConclusionPrevious results suggested that RC is significantly associated
with treatment outcome under certain conditions, even though it
is not predictive on its own [32]. The findings in this study
support these conclusions to some extent, but also clearly show
Figure 5. Changes in viral fitness during treatment interrup-tion. Models derived from the Monogram dataset (left side of the plot)and Erlangen dataset (right side) were used to predict the viral RCcorresponding to the genotypes in the treatment interruptions datasetdescribed in Materials and Methods. Shown in the plot are thedifferences between baseline RC and the first follow-up RC (n = 56) -corresponding to a genotype from about two months into the therapybreak -, as well as the differences between baseline RC and the lastfollow-up RC (n = 30; only if there was more than one follow-upmeasurement; typically from five to six months into the break).doi:10.1371/journal.pone.0009044.g005
Figure 6. Spearman correlations between clinical markers (top:viral load, bottom: CD4+ T-cell count) and potential predictorsof clinical response (predicted RC and TAS) at different pointsin time during therapy. Correlation coefficients were computed fromthe TCE dataset.doi:10.1371/journal.pone.0009044.g006
Impact of Replication Capacity
PLoS ONE | www.plosone.org 8 February 2010 | Volume 5 | Issue 2 | e9044

that pRC was rather uninformative if available information on
drug resistance and medication was fully utilized. Examples are
the linear models for predicting change in VL after 180 days of
treatment. The two pRC features in the model were statistically
highly significant (t-test yielding p-values of 1.81 N 1025 and
0.0011 for Monogram and Erlangen predictions, respectively),
but the resulting improvement in predictive performance,
compared to the model without pRC, was marginal. More
generally, the significance level of a predictor in the models
compared did not necessarily attest to the amount of gain in
prediction quality that might arise through the inclusion of this
predictor.
There is clearly some room for improvement of RC prediction
models, and the lack of large high-quality genotype-RC datasets
for training purposes was certainly a limiting factor of this study.
Existing prediction methods, like the one proposed here, could
benefit from datasets as large as those currently used for the related
problem of predicting HIV drug resistance from genotype, where
1,000 samples per drug are not uncommon [13,14]. However, it
remains doubtful if increased quality of RC predictions would
have led to different conclusions from these analyses about the
clinical significance of RC. After all, robust associations of pRC
with drug resistance, overall treatment experience, and treatment
interruptions were observed. Since RC and drug resistance are
highly correlated, and since the minor effect of RC on clinical
response pales in comparison to the dominant role of resistance,
there seems to be little benefit in considering RC as an additional
therapeutic indicator. Thus, the use of RC for treatment selection
in clinical practice may play only a minor role.
Acknowledgments
We thank Mark Segal for making the Monogram RC dataset available to
us. We also thank Melanie Balduin for providing the treatment
interruptions dataset.
Author Contributions
Conceived and designed the experiments: HW AA HW TL. Performed the
experiments: HW. Analyzed the data: HW. Contributed reagents/
materials/analysis tools: FI DS AS RK MZ MT HW. Wrote the paper:
HW AA SS MZ HW TL. Critically reviewed and approved the final
manuscript: AA HW SS FI DS AS RK MZ MT HW TL.
Figure 7. The figure depicts the p-values obtained from a one-sided t-test testing whether predicted RC is lower in patientssucceeding a treatment than in patients failing a treatment. Patients are grouped according to the predicted activity (TAS) of the regimen.Virologic success (left) was defined as reaching the limit of detection, i.e. 50 copies of HIV RNA per one ml blood. Immunologic success (right) wasdefined as an increase of CD4+ T-cells per one ml blood by 50% or more. Different symbols and colors are used to indicate different time-points ofthe follow-up measurement and different RC prediction models, respectively. The red horizontal dashed bar represents the 5% significancethreshold.doi:10.1371/journal.pone.0009044.g007
Figure 8. Performance of linear models for the prediction ofchanges in viral load (top) and CD4+ T-cell count (bottom).Based on the main clinical dataset, linear models were trained usingdifferent sets of input features: 1. predicted resistances against applieddrugs, 2. applied drug combination, 3. TAS, 4. drug combination andTAS. Also, for each of these variants, a model that includes twopredicted RC values (based on the Monogram and Erlangen datasets) asadditional features was considered. This setup allowed us to comparedifferent properties with respect to predictivity of clinical response andto assess the significance of RC in this context.doi:10.1371/journal.pone.0009044.g008
Impact of Replication Capacity
PLoS ONE | www.plosone.org 9 February 2010 | Volume 5 | Issue 2 | e9044
References
1. Esnouf R, Ren J, Ross C, Jones Y, Stammers D, et al. (1995) Mechanism of
inhibition of HIV-1 reverse transcriptase by non-nucleoside inhibitors. Nat
Struct Biol 2: 303–308.
2. Clercq ED (2009) Anti-HIV drugs: 25 compounds approved within 25 years
after the discovery of HIV. Int J Antimicrob Agents 33: 307–320.
3. Mansky LM, Temin HM (1995) Lower in vivo mutation rate of human
immunodeficiency virus type 1 than that predicted from the fidelity of purified
reverse transcriptase. J Virol 69: 5087–5094.
4. Tisdale M, Kemp SD, Parry NR, Larder BA (1993) Rapid in vitro selection of
human immunodeficiency virus type 1 resistant to 39-thiacytidine inhibitors due
to a mutation in the YMDD region of reverse transcriptase. Proc Natl Acad
Sci U S A 90: 5653–5656.
5. Palella FJ, Delaney KM, Moorman AC, Loveless MO, Fuhrer J, et al. (1998)
Declining morbidity and mortality among patients with advanced human
immunodeficiency virus infection. HIV outpatient study investigators.
N Engl J Med 338: 853–860.
6. Oette M, Kaiser R, Daumer M, Petch R, Fatkenheuer G, et al. (2006) Primary
HIV drug resistance and efficacy of first-line antiretroviral therapy guided by
resistance testing. J Acquir Immune Defic Syndr 41: 573–581.
7. Sagir A, Oette M, Kaiser R, Daumer M, Fatkenheuer G, et al. (2007) Trends of
prevalence of primary HIV drug resistance in Germany. J Antimicrob
Chemother 60: 843–848.
8. Walter H, Schmidt B, Korn K, Vandamme AM, Harrer T, et al. (1999) Rapid,
phenotypic HIV-1 drug sensitivity assay for protease and reverse transcriptase
inhibitors. J Clin Virol 13: 71–80.
9. Petropoulos CJ, Parkin NT, Limoli KL, Lie YS, Wrin T, et al. (2000) A novel
phenotypic drug susceptibility assay for human immunodeficiency virus type 1.
Antimicrob Agents Chemother 44: 920–928.
10. Hertogs K, de Bethune MP, Miller V, Ivens T, Schel P, et al. (1998) A rapid
method for simultaneous detection of phenotypic resistance to inhibitors of
protease and reverse transcriptase in recombinant human immunodeficiency
virus type 1 isolates from patients treated with antiretroviral drugs. Antimicrob
Agents Chemother 42: 269–276.
11. Laethem KV, Luca AD, Antinori A, Cingolani A, Perna CF, et al. (2002) A
genotypic drug resistance interpretation algorithm that significantly predicts
therapy response in HIV-1-infected patients. Antivir Ther 7: 123–129.
12. Rhee SY, Gonzales MJ, Kantor R, Betts BJ, Ravela J, et al. (2003) Human
immunodeficiency virus reverse transcriptase and protease sequence database.
Nucleic Acids Res 31: 298–303.
13. Beerenwinkel N, Daumer M, Oette M, Korn K, Hoffmann D, et al. (2003)
Geno2pheno: Estimating phenotypic drug resistance from HIV-1 genotypes.
Nucleic Acids Res 31: 3850–3855.
14. Vermeiren H, Craenenbroeck EV, Alen P, Bacheler L, Picchio G, et al. (2007)
Prediction of HIV-1 drug susceptibility phenotype from the viral genotype using
linear regression modeling. J Virol Methods 145: 47–55.
15. Larder B, Wang D, Revell A, Montaner J, Harrigan R, et al. (2007) The
development of artificial neural networks to predict virological response to
combination HIV therapy. Antivir Ther 12: 15–24.
16. Altmann A, Rosen-Zvi M, Prosperi M, Aharoni E, Neuvirth H, et al. (2008)
Comparison of classifier fusion methods for predicting response to anti HIV-1therapy. PLoS One 3: e3470.
17. Balduin M, Sierra S, Daumer MP, Rockstroh JK, Oette M, et al. (2005)Evolution of HIV resistance during treatment interruption in experienced
patients and after restarting a new therapy. J Clin Virol 34: 277–287.18. Nijhuis M, van Maarseveen NM, Boucher CAB (2009) Antiviral resistance and
impact on viral replication capacity: evolution of viruses under antiviral pressure
occurs in three phases. Handb Exp Pharmacol. pp 299–320.19. Quinones-Mateu ME, Arts EJ (2002) Fitness of drug resistant HIV-1:
methodology and clinical implications. Drug Resist Updat 5: 224–233.20. Dykes C, Demeter LM (2007) Clinical significance of human immunodeficiency
virus type 1 replication fitness. Clin Microbiol Rev 20: 550–578.
21. Perrin L, Telenti A (1998) HIV treatment failure: testing for HIV resistance inclinical practice. Science 280: 1871–1873.
22. Grant P, Taylor J, Cain P, Short W, Gallant J, et al. (2009) Maintaining reducedviral fitness and CD4 response in HIV-infected patients with viremia receiving a
boosted protease inhibitor. Clin Infect Dis 48: 680–682.
23. Birkner MD, Sinisi SE, van der Laan MJ (2005) Multiple testing and dataadaptive regression: an application to HIV-1 sequence data. Stat Appl Genet
Mol Biol 4: Article8.24. Segal MR, Barbour JD, Grant RM (2004) Relating HIV-1 sequence variation to
replication capacity via trees and forests. Stat Appl Genet Mol Biol 3: Article2;discussion article 7, article 9.
25. Deeks SG, Wrin T, Liegler T, Hoh R, Hayden M, et al. (2001) Virologic and
immunologic consequences of discontinuing combination antiretroviral-drugtherapy in HIV-infected patients with detectable viremia. N Engl J Med 344:
472–480.26. R Development Core Team (2007) R: A language and environment for
statistical computing. R Foundation for Statistical Computing, Vienna, Austria.
Available: http://www.R-project.org.27. Dimitriadou E, Hornik K, Leisch F, Meyer D, Weingessel A (2007) e1071: Misc
Functions of the Department of Statistics (e1071), TU Wien. R package version1.5-17.
28. Peres Y, Bergroth T, Denholm-Price J, Incardona F, Kaiser R, et al. (2007)EuResist: Integrating and exchanging European HIV data. Eur J Med Res. pp
11–12.
29. Altmann A, Beerenwinkel N, Sing T, Savenkov I, Daumer M, et al. (2007)Improved prediction of response to antiretroviral combination therapy using the
genetic barrier to drug resistance. Antivir Ther 12: 169–178.30. De Luca A, Cingolani A, Di Giambenedetto S, Trotta MP, Baldini F, et al.
(2003) Variable prediction of antiretroviral treatment outcome by different
systems for interpreting genotypic human immunodeficiency virus type 1 drugresistance. J Infect Dis 187: 1934–1943.
31. Shafer RW, Schapiro JM (2008) HIV-1 drug resistance mutations: an updatedframework for the second decade of HAART. AIDS Rev 10: 67–84.
32. De Luca A, Weidler J, Di Giambenedetto S, Coakley E, Cingolani A, et al.(2007) Association of HIV-1 replication capacity with treatment outcomes in
patients with virologic treatment failure. J Acquir Immune Defic Syndr 45:
411–417.
Impact of Replication Capacity
PLoS ONE | www.plosone.org 10 February 2010 | Volume 5 | Issue 2 | e9044
![New MPEG.ppt [Read-Only] - ITU](https://static.fdokumen.com/doc/165x107/631cc1f476d2a4450503afa7/new-mpegppt-read-only-itu.jpg)


![sequential.ppt [Read-Only]](https://static.fdokumen.com/doc/165x107/6319ca5fc51d6b41aa04902b/sequentialppt-read-only.jpg)