On-line Verification of Hemodialysis Water Quality - Lund ...
81
On-line Verification of Hemodialysis Water Quality Johan Andersson Elin Holmstr ¨ om 2016 MASTER ’ S T HESIS IN B IOMEDICAL E NGINEERING FACULTY OF E NGINEERING, LTH DEPARTMENT OF B IOMEDICAL E NGINEERING Supervisor: Per Augustsson
-
Upload
khangminh22 -
Category
Documents
-
view
0 -
download
0
Transcript of On-line Verification of Hemodialysis Water Quality - Lund ...

On-line Verification ofHemodialysis Water Quality
Johan AnderssonElin Holmstrom
2016
MASTER’S THESIS IN
BIOMEDICAL ENGINEERING
FACULTY OF ENGINEERING, LTHDEPARTMENT OF BIOMEDICAL ENGINEERING
Supervisor: Per Augustsson
Abstract
Renal diseases are an increasing problem worldwide and when kidneytransplantation is not possible, dialysis treatment is the solution. An in-creasing number of patients choose to perform their dialysis treatmentat home by implementing the dialysis machine and a water purificationsystem in current electric and water supply, so called home hemodial-ysis. The quality of the water used for the preparation of dialysis fluidis essential due to the very close contact with the patient’s blood. How-ever, today’s methods for verification of water quality are time consum-ing, non-frequently performed and costly.
The aims of this thesis were to investigate if an on-line, accurate andspecific method for water quality verification is possible, without lim-itations as sample preparation, expensive and massive apparatus andprofessional skills needed for monitoring.
Attention has been paid to the requirements and expectations of sucha device and an extensive literature study of potential techniques is pre-sented. Some promising examples are biosensor applications for de-tection of bacteria and endotoxins, micromachined total organic carbonanalyzers, amperometric chlorine analysers and flow cytometers.
Subsequent to this, an experimental investigation was performed to ex-amine whether bacterial detection by their autofluorescence can be per-formed using a FACSCanto II flow cytometer. On the basis of the exper-imental results, no such autofluorescence could be detected. However,the high speed technique of flow cytometry could be further refined toreplace the old fashioned conventional techniques for microbiologicalquantification.
Preface
This master thesis was accomplished as the final completion of theM.Sc. programme in Engineering Nanoscience at the Faculty of Engi-neering at Lund University. The work was performed at the Departmentof Biomedical Engineering in collaboration with the health care com-pany Baxter in Lund. The practical part of the thesis was done at theBiomedical Center.
The project started in February 2016 and was finished in October thesame year, covering 30 ECTS credits.
2
Acknowledgment
Firstly, we would like to express our sincere gratitude to our thesis su-pervisors Anders Wieslander at Baxter and Per Augustsson at the De-partment of Biomedical Engineering at Lund University, for their con-tinuous support, encouragement and advisement throughout the thesis.Both their vast knowledge and their engagement have helped us when-ever we encountered obstacles during the work and inspired us to newapproaches.
Beside our supervisors we would like to thank the helpful staff at Baxterand especially Bo Olde, Staffan Bergstrom, Thomas Hertz and HelenaJeppsson for sharing their expertise and guiding us through many prac-ticalities with motivating and always clever advices.
We would also like to thank Pelle Ohlsson, Maria Antfolk, Anke Ur-bansky and Cecilia Magnusson, since without their help and guidancethrough the flow cytometry measurements, the practical part of this the-sis would have been nothing but a grope in the dark. We are very grate-ful for the time and effort they have dedicated to help and supervise us.
Lastly, we would like to thank all the other persons who have helpedus during this thesis, such as the helpful and hospitable personnel at theBulltofta Water Plant, the Division of Clinical Microbiology and thedialysis clinic at SUS in Lund for giving us useful insights and at lastbut not least, Daniel Baldor for an inspiring and touching introductionto the dialysis treatment.
Johan AnderssonElin Holmstrom
3
Contents
1 Introduction 71.1 Disposition of the Report . . . . . . . . . . . . . . . . 71.2 Background . . . . . . . . . . . . . . . . . . . . . . . 7
1.2.1 Baxter . . . . . . . . . . . . . . . . . . . . . . 71.2.2 Kidney Functions and Renal Diseases . . . . . 81.2.3 Dialysis . . . . . . . . . . . . . . . . . . . . . 81.2.4 Hemodialysis . . . . . . . . . . . . . . . . . . 91.2.5 Home Hemodialysis . . . . . . . . . . . . . . 121.2.6 Water Quality . . . . . . . . . . . . . . . . . . 131.2.7 On-site Water Purification Systems . . . . . . 14
1.3 Aim and Motivation of the Thesis . . . . . . . . . . . 161.4 Disposition of the Work . . . . . . . . . . . . . . . . . 17
2 Requirements Analysis 182.1 Method . . . . . . . . . . . . . . . . . . . . . . . . . 18
2.1.1 Investigation of Regulatory Standardizations forDialysis Water Validation . . . . . . . . . . . 18
2.1.2 Investigation of Existing Methods for DialysisWater Validation . . . . . . . . . . . . . . . . 19
2.1.3 Survey on Methods for Water Validation at Home-hemodialysis Clinics . . . . . . . . . . . . . . 19
2.1.4 Study Visits . . . . . . . . . . . . . . . . . . . 192.1.5 International Aspects of HHD-possibilities and
Regulations on Drinking Water Quality . . . . 202.2 Analysis and gained knowledge . . . . . . . . . . . . 21
2.2.1 Investigation of Regulatory Standardizations forDialysis Water Validation . . . . . . . . . . . 21
2.2.2 Investigation of Existing Methods for DialysisWater Validation . . . . . . . . . . . . . . . . 23
4
2.2.3 Survey on Methods for Water Validation at Home-hemodialysis Clinics . . . . . . . . . . . . . . 25
2.2.4 Study Visits . . . . . . . . . . . . . . . . . . . 282.2.5 International Aspects of HHD-possibilities and
Regulations on Drinking Water Quality . . . . 292.3 Conclusions . . . . . . . . . . . . . . . . . . . . . . . 31
3 Literature Review and Investigation of Possible Techniques 333.1 Method . . . . . . . . . . . . . . . . . . . . . . . . . 333.2 Results . . . . . . . . . . . . . . . . . . . . . . . . . . 34
3.2.1 Methods for Microbial Analysis . . . . . . . . 343.2.2 Methods for Endotoxin Analysis . . . . . . . . 393.2.3 Methods for Chemical Analysis . . . . . . . . 40
3.3 Discussion and Conclusion . . . . . . . . . . . . . . . 43
4 Experimental Work 484.1 Choice of Analytical Method . . . . . . . . . . . . . . 484.2 Hypothesis . . . . . . . . . . . . . . . . . . . . . . . 494.3 Theory . . . . . . . . . . . . . . . . . . . . . . . . . . 50
4.3.1 Bacterial Autofluorescence . . . . . . . . . . . 504.3.2 Flow Cytometry . . . . . . . . . . . . . . . . 514.3.3 Bacterial Charachteristics . . . . . . . . . . . 53
4.4 Method . . . . . . . . . . . . . . . . . . . . . . . . . 544.4.1 Equipment . . . . . . . . . . . . . . . . . . . 544.4.2 Chemicals and Bacterial Cultures . . . . . . . 554.4.3 Experimental Processes . . . . . . . . . . . . 56
4.5 Results . . . . . . . . . . . . . . . . . . . . . . . . . . 604.5.1 Flow Cytometry Measurements - Autofluores-
cence . . . . . . . . . . . . . . . . . . . . . . 604.5.2 Flow Cytometry Measurements - Concentration
Determination . . . . . . . . . . . . . . . . . 624.5.3 Flow Cytometry Measurements - Comparison
Between Bacteria in Ultrapure Water and Iso-tonic Buffer . . . . . . . . . . . . . . . . . . . 64
4.5.4 Flow Cytometry Measurements - Viability . . . 654.6 Discussion . . . . . . . . . . . . . . . . . . . . . . . . 67
4.6.1 Preparation of Bacteria Suspensions . . . . . . 674.6.2 Autofluorescence . . . . . . . . . . . . . . . . 674.6.3 Concentration Determination . . . . . . . . . . 68
5

4.6.4 Comparison Between Bacteria in Ultrapure Wa-ter and Isotonic Buffer . . . . . . . . . . . . . 70
4.6.5 Viability . . . . . . . . . . . . . . . . . . . . . 704.7 Conclusion . . . . . . . . . . . . . . . . . . . . . . . 72
A The formulary sent to HHD-clinics 79
6

Chapter 1
Introduction
1.1 Disposition of the ReportThe report is divided into four different chapters due to the diversity ofthe parts of this thesis. The initial part will introduce the reader to theproject and motivate the defined objectives of the work. The secondchapter presents the study of the demands and regulations needed to befulfilled to accomplish the defined goals. This part merges into chap-ter three were a thorough literature review and investigation of possibletechniques are presented. Finally, the last chapter of this report de-scribes and demonstrates the experimental part of the project and con-cludes its results.
1.2 BackgroundThis project was done on behalf of Baxter Sverige, aiming to investi-gate a device or devices for water quality verification for dialysis appli-cations. This section will give the reader a brief background and basicknowledge of Baxter, the dialysis treatment and water quality.
1.2.1 BaxterBaxter Sverige is a part of Baxter International, a multipurpose healthcare company with main focus in treatment of hemophilia, immune dis-orders and kidney diseases. The company has its headquarter in Deer-field, outside Chicago in USA. It is present in over 100 countries world-wide and have about 50 000 employees globally. In 2013, Baxter ac-
7
quired Gambro AB, a Swedish company with global innovation andmanufacturing of in-center hemodialysis and acute renal care products.The facility located in Lund, where the work of this thesis has been car-ried out, is specialized in renal disease devices. This constitutes arounda third of Baxter’s market [1].
1.2.2 Kidney Functions and Renal DiseasesThe kidneys are vital organs responsible for the regulation of electrolytebalance, regulation of the acid-base balance and the removal of excessfluid and body waste products like urea and creatinine. This process isachieved through the production of urine, including an advanced com-bination of excretion and re-absorption. Additionally, the kidneys areimportant producers of several necessary hormones and enzymes suchas erythropoietin, EPO, and renin that regulate blood pressure and redblood cell production inter alia. A person with malfunctioning kidneysis not able to excrete urine. Fluid and poisonous waste products willaccumulate within the body resulting in uremia. Since the kidneys reg-ulate the uptake and elimination of several essential electrolytes likesodium, potassium, calcium and acetate ions, adjusted by the body’sneed, renal failure will cause electrolyte imbalance. This affects theheart and could cause arrythmia. Furthermore, the accumulation ofelectrolytes will retain fluid causing hypertension and an elevated riskof heart attacks and strokes. When the kidneys have lost 85 to 90 per-cent of their function the condition is life threatening and renal therapyis needed, either by kidney transplantation or dialysis [2].
1.2.3 DialysisThe dialysis is an essential treatment for patients with renal diseaseswho are unable to undergo or are waiting for a renal transplantation.The treatment aims to replace the function of a normal kidney by re-moval of waste products and excess fluid and maintenance of acid-basebalance and electrolyte levels. The general principle of dialysis is afluid exchange between the blood and a dialysis fluid across a semiper-meable membrane. The dialysis fluid, also called the dialysate, containsthe electrolytes and nutrients wanted in blood while the blood containswaste products and excess fluid. This difference in solute content cre-ates a concentration gradient and since solutes always migrate from
8
higher to lower concentration the result is a diffusion process. Elec-trolytes are accordingly taken up by the blood and excess fluid andwaste products are removed from the blood, all controlled by the com-position of the dialysis fluid. To regulate and amplify the fluid removala pressure gradient is applied between the two fluid compartments. Thiscan be conducted by applying a lower pressure in the dialysis fluid com-partment which will force fluid from the blood to migrate over the mem-brane into the dialysis fluid by a hydrostatic pressure gradient. It canalso be achieved by addition of an osmotic agent to the dialysis fluid,which draws fluid from the blood by the developed osmotic pressuregradient.
In general there are two types of dialysis treatment; hemodialysis andperitoneal dialysis. The main difference between these is the dialysissite. In hemodialysis the blood is diverted to an external machine wherethe filtration is performed, whereas in peritoneal dialysis the dialysisfluid is pumped into the peritoneal cavity in the abdomen and the peri-toneum serves as the membrane for fluid exchange.
1.2.4 HemodialysisIn hemodialysis blood is transferred in and out of the body througha previously created blood vessel, an arteriovenous fistula, which is avein and an artery connected by surgery to increase the blood flow. Thehigher flow facilitates the dialysis process and forms a thick blood ves-sel with high resistance to withstand repeated needle penetrations. Theprinciple of the fistula is illustrated in Figure 1.1.
When transferred into the dialysis apparatus the blood enters the di-alyzer, the artificial kidney composed by multiple thin capillaries ofsemipermeable membrane, where it encounters the dialysis fluid. Thedialysis fluid is conducted in opposite direction relative to the bloodflow in order to enhance the solute exchange by the raised concentra-tion gradient. The permeability and thickness of the membrane deter-mines the flux across the dialyzer. The membrane porosity selectivelypermits water and small molecules to pass but retains bigger moleculeslike blood cells and proteins. The porosity of the capillary membranesis visible in the scanning electron microscopy images in Figure 1.2.
9

Arteriovenous�stula
Artery
VeinBlood todialyzer
Blood from dialyzer
Figure 1.1: A sketch of a vein and an artery joint together forming anarteriovenous fistula with the in- and outlet of the dialysis connectionmarked.
Figure 1.2: Scanning electron microscopy-images of cross-sections ofa porous capillary in Baxter’s dialyzer Polyflux 210 H. Blood flowsinside the capillary that is surrounded with dialysate. Reproduced fromA. Hedayat et. al[3] under the Creative Commons Attribution License.
When the exchange is accomplished the blood is led back to the bodycirculation and the contaminated dialysis fluid is sent to drain.
Since the blood is in very close contact with the dialysis fluid duringthe treatment, high fluid standard is essential. The composition shouldresemble blood plasma and not contain any contaminants to avoid im-mune system triggering. Furthermore, electrolytes and nutrients likesodium, calcium, potassium and glucose are vital. A comparison be-tween typical concentration values of electrolytes and other substancesin blood serum and dialysis fluid is shown in Table 1.1.
10

Substance Concentration Gradient Concentrationin blood serum in dialysate
Na 140 mEq/L ←→ 140 mEq/LK 4.5 mEq/L −→ 2 mEq/LCl 100 mEq/L ←→ 100 mEq/LCO2/HCO3 24 mEq/L ←− 35 mEq/LMg 2.0 mg/dL −→ 1.2 mg/dLCa 2.4 mEq/L ←− 2.5 mEq/LCreatinine 5 mg/dL −→ –Blood Urea N 30 mg/dL −→ –Albumin 4 g/dL −→ –
Table 1.1: Typical concentrations of electrolytes and substances of in-terest in blood serum and dialysate together with the expected diffusiongradient. Concentrations in blood serum for dialysis patients can varymuch and are often considerably higher than stated above [4].
Not only is the chemical composition of the dialysate of great impor-tance for the performance and safety of the dialysis treatment. Severalphysical parameters need to be accurately controlled and monitored aswell as chemical composition, wherefore both the blood circuit and thefluid circuit contain many sensing elements. For each sensor that is apart of the regulation process an additional monitoring sensor is neces-sary for safety reasons at all controlling parts of the dialysis system. Anoverview of the hemodialysis process, containing both the fluid circuitand the blood circuit, is illustrated in Figure 1.3.
AB
pH
Blood leakage detector
Drain
DegaserPeristaltic
pump
Peristalticpump
Conductivitycell
Conductivitycell Temperature
regulation
Temperature regulation
pH-sensor
B-concentration A-concentrationDialyzer
Peristalticpump
Clamp
Clamp Drip chamber and
gas detector
Blood outlet
Blood inlet
Purifiedwater
Figure 1.3: The general process of hemodialysis containing the bloodcircuit and the fluid circuit.
11
A typical flow velocity of the dialysate during hemodialysis treatmentis around 500 ml/min, which means that over 100 liters of dialysate isused during a 4 hours treatment occasion. To avoid transport of thoselarge amounts of dialysate to the treatment place, purified tap water ismixed with concentrated dialysate in the beginning of the fluid circuit.Prior to that, the water is heated to around body temperature, not toohigh so that proteins in the blood denature and not too low as it causesdiscomfort for the patient. During the dialysate mixing process twoconcentrates are pumped into the water; the first, the A-concentrate,contains all electrolytes except from bicarbonate and the second, the B-concentrate, contains just bicarbonate. The concentration of the mixtureis measured with conductivity cells after both the addition of A- and B-concentrate, since the addition of a certain amount of electrolytes causesa known change in conductivity. Peristaltic pumps, sited before and af-ter the dialyzer, control the flow velocity in the fluidic circuit, whichtogether with pumps in the blood circuit regulates the pressure differ-ence over the dialyzer, called the transmembrane pressure (TMP). Thenegative pressure produces a removal of excess water from the bloodthrough ultrafiltration across the membrane.
Additional sensor elements in the fluid circuit are pH-sensors ahead ofthe dialyzer to give an extra assurance that the right dialysate mixtureis used. Furthermore blood leakage detectors, placed after the dialyzer,use infrared light to detect if any hemoglobin has leaked out through themembrane, which if so happens requires an immediate stop of the dialy-sis process. On the purified blood’s way back to the body it passes a dripchamber that evacuates any air introduced in the dialysis process. Also,an ultrasound gas detector is placed in connection to the drip chamberto ensure that no remaining gas enters the patients bloodstream. If thathappens it can cause the fatal state of aeroembolism.
1.2.5 Home HemodialysisHemodialysis is mostly preformed in-center at hospitals, but in somecases the treatment is also available in the patient’s home. When doneat home, the patients obtain higher freedom and control of their owntreatment, since schedule and dialysis time can be adjusted to the pa-
12
tient’s life and requests. Many patients experience higher life qualitysince there is no need for hospital visits several times a week and moretime can be spent at home with family and friends. However, homehemodialysis, hereafter abbreviated HHD, puts higher demands on thepatients and their relatives since they are in charge and responsible forthe preparation, running and caring of the dialysis machine [5].
In HHD, the dialysis machine is connected to existing electricity andwater supply. The water retrieved from the present water supplement isconducted to a purification system to achieve ultrapure water requiredfor the dialysis treatment. As previously described, electrolytes andbuffers are thereafter added to the purified water and transported to thedialyzer to purify the blood.
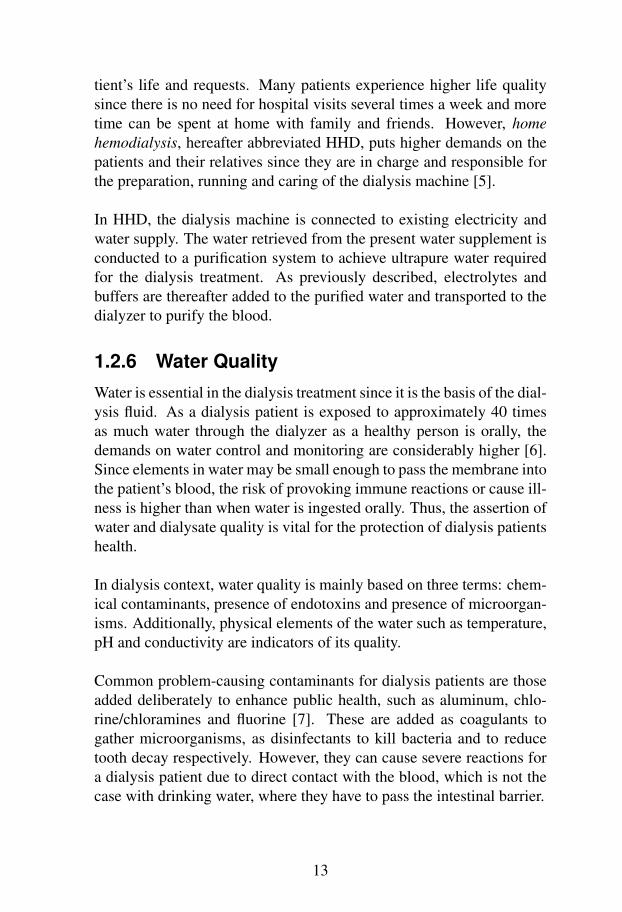
1.2.6 Water QualityWater is essential in the dialysis treatment since it is the basis of the dial-ysis fluid. As a dialysis patient is exposed to approximately 40 timesas much water through the dialyzer as a healthy person is orally, thedemands on water control and monitoring are considerably higher [6].Since elements in water may be small enough to pass the membrane intothe patient’s blood, the risk of provoking immune reactions or cause ill-ness is higher than when water is ingested orally. Thus, the assertion ofwater and dialysate quality is vital for the protection of dialysis patientshealth.
In dialysis context, water quality is mainly based on three terms: chem-ical contaminants, presence of endotoxins and presence of microorgan-isms. Additionally, physical elements of the water such as temperature,pH and conductivity are indicators of its quality.
Common problem-causing contaminants for dialysis patients are thoseadded deliberately to enhance public health, such as aluminum, chlo-rine/chloramines and fluorine [7]. These are added as coagulants togather microorganisms, as disinfectants to kill bacteria and to reducetooth decay respectively. However, they can cause severe reactions fora dialysis patient due to direct contact with the blood, which is not thecase with drinking water, where they have to pass the intestinal barrier.
13
Presence of chemical substances within the dialysis fluid can cause reac-tions like motor difficulties, seizures, nausea, hypotension and diarrhea.Each chemical can provoke a specific reaction, for which reason numer-ous parameters need to be analyzed. If not removed properly from thedialysis fluid aluminum, a toxic metal, can enter the blood directly andaccumulate within the body causing severe disorders like bone disease,microcytic anemia and encephalopathy [8]. Chlorine and chloramineshave effects on cellular proteins, causing denaturation and haemolyticanaemia [9] and flouride can cause disturbance in bone mineralizationleading to weak bones and bone pain.
Bacterial contamination of the dialysis fluid can provoke chronic in-flammation and bacteremia, presence of bacteria in the blood, leading tosepsis. The small endotoxins may pass through the dialyzer membraneor appear in close contact with the white blood cells to elicit pyrogenicreactions [10].
Particular requirements and defined limits depend on the fluid applica-tion. The incoming water, called the feed water should obey the restric-tions of drinking water quality and is controlled by the water suppliant.When treated and purified the water should fulfill the demands of dialy-sis water which is used for the preparation of the dialysate/dialysis fluidby adding electrolytes and buffer.
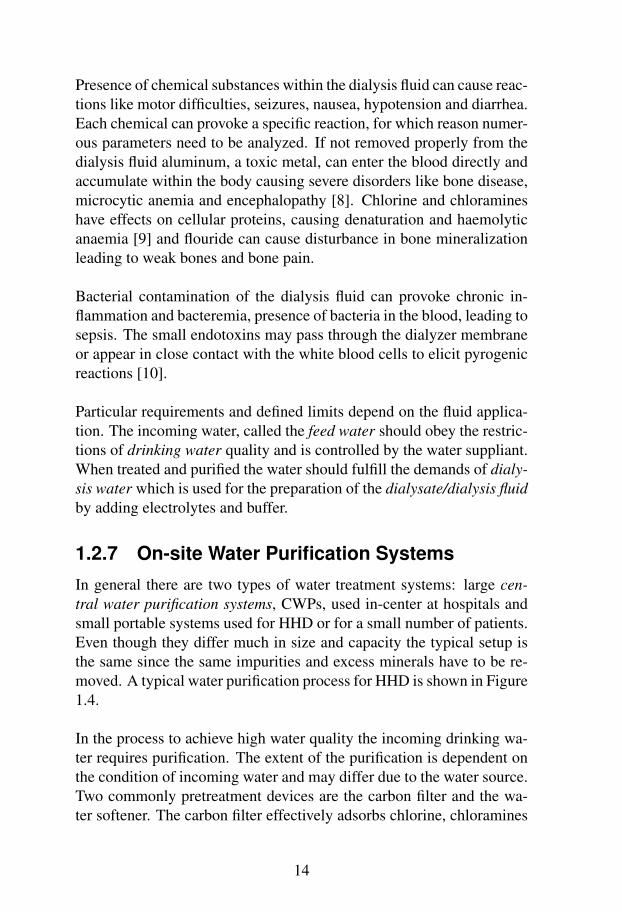
1.2.7 On-site Water Purification SystemsIn general there are two types of water treatment systems: large cen-tral water purification systems, CWPs, used in-center at hospitals andsmall portable systems used for HHD or for a small number of patients.Even though they differ much in size and capacity the typical setup isthe same since the same impurities and excess minerals have to be re-moved. A typical water purification process for HHD is shown in Figure1.4.
In the process to achieve high water quality the incoming drinking wa-ter requires purification. The extent of the purification is dependent onthe condition of incoming water and may differ due to the water source.Two commonly pretreatment devices are the carbon filter and the wa-ter softener. The carbon filter effectively adsorbs chlorine, chloramines
14
Carbon �lters Brine TankWatersoftener
Reverse osmosisunit
From tapTo dialysismachine
Drain
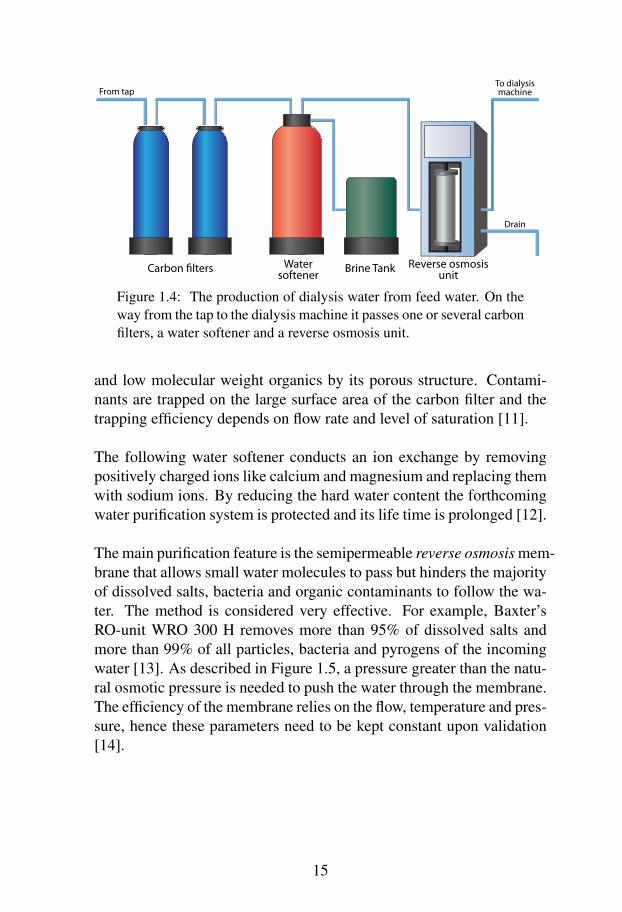
Figure 1.4: The production of dialysis water from feed water. On theway from the tap to the dialysis machine it passes one or several carbonfilters, a water softener and a reverse osmosis unit.
and low molecular weight organics by its porous structure. Contami-nants are trapped on the large surface area of the carbon filter and thetrapping efficiency depends on flow rate and level of saturation [11].
The following water softener conducts an ion exchange by removingpositively charged ions like calcium and magnesium and replacing themwith sodium ions. By reducing the hard water content the forthcomingwater purification system is protected and its life time is prolonged [12].
The main purification feature is the semipermeable reverse osmosis mem-brane that allows small water molecules to pass but hinders the majorityof dissolved salts, bacteria and organic contaminants to follow the wa-ter. The method is considered very effective. For example, Baxter’sRO-unit WRO 300 H removes more than 95% of dissolved salts andmore than 99% of all particles, bacteria and pyrogens of the incomingwater [13]. As described in Figure 1.5, a pressure greater than the natu-ral osmotic pressure is needed to push the water through the membrane.The efficiency of the membrane relies on the flow, temperature and pres-sure, hence these parameters need to be kept constant upon validation[14].
15

papo
Semipermeablemembrane
Osmotic flow Osmotic equilibrium Reverse osmosis
Figure 1.5: The principle of osmosis and reverse osmosis. When asemipermeable membrane separates two solutions with different con-centrations of electrolytes, the solvent will spontaneously flow towardsthe higher concentrated region. When the two solutions are equallyconcentrated or when an outer pressure prevents any further flow, anequilibrium is reached. In this case the height difference between thefluid pillars during equilibrium constitutes the osmotic pressure, po.Reverse osmosis occurs when a pressure, pa, higher than the osmoticpressure, is applied on the higher concentrated fluid. This will induce aflow in the opposite direction and increase the difference in concentra-tions which is the phenomenon that can be used for water purificationpurposes.
1.3 Aim and Motivation of the ThesisAs the background section indicates, the access to ultrapure water is ex-tremely important for a successful dialysis treatment. The purificationsystem helps to provide this but nevertheless the water quality has to beverified. This is an ongoing isssue, especially for the clinics offeringhome hemodialysis. Recurring sample-taking is necessary for each andevery patient and not only for the CWP as at the clinic, which currentlymakes HHD a more time-consuming treatment method.
On behalf of Baxter this thesis aims at attacking the problem by findingon-line solutions for the water quality verification. Moving the exten-sive laboratory work to the patient’s home could be a quicker, cheaperand safer way that would enable health care providers to give more kid-ney disease patients the care they need. This could also make HHD anavailable alternative for a larger group of renal patients.
16
The general objectives set up for this thesis in collaboration with Baxterwere:
1. to investigate and identify the customer needs and market ad-vantages with on-line verification of the water quality in homehemodialysis,
2. to survey the current available water quality verification methodsfrom a microbial, endotoxic and chemical perspective,
3. to construct a hypothesis with possible techniques that are appli-cable and integrable on dialysis equipment,
4. to implement and evaluate at least one of these techniques exper-imentally.
1.4 Disposition of the WorkIn order to accomplish the objectives stated in section 1.3 the work wasdivided into three parts (corresponding to chapter 2, 3 and 4):
The requirements analysis aims at fulfilling objective number 1 and todefine what demands and regulations there are on an on-line method forwater verification and what parameters that should be taken into accountwhen searching for new water analysis techniques.
Consequently, the analysis forms the basis for the literature review andinvestigation of possible techniques that was the main research task ofthis project. It was performed with the intention of accomplishing ob-jectives 2 and 3. The authors’ background in the field of technicalnanoscience with specializations in biomedicine should were helpfulwhen investigating, inter alia, the feasibility in miniaturization of exist-ing approaches.
Finally, the experimental work was performed as a proof of conceptfor one of the chosen techniques in accordance with objective number4.
The two authors contributed equally in the planning, performance andpresentation of this thesis and the work was mostly performed together.
17

Chapter 2
Requirements Analysis
This requirements analysis was performed as a first step towards un-derstanding the demands and expectations on an on-line dialysis waterquality verification system. The ambition was that it should give insightin what expectations not only the manufacturing company would haveon such a medicine technical product but also clinics, nurses, techni-cians, patients, relatives and regulatory authorities.
2.1 Method
2.1.1 Investigation of Regulatory Standardizationsfor Dialysis Water Validation
With the intention to minimize the risk of contaminants in the dialysiswater and the dialysis fluid, numerous organizations have set up stan-dards were they define and motivate concentration limits of contami-nants and with what methods this should be measured. During this stepof the requirements analysis a review and a comparison of some impor-tant standards and regulative documents were made.
Since almost every country has its own regulations for dialysis water thefocus was on the International Organization for Standardization’s stan-dard ISO:13959(2014); Water for Haemodialysis and Related Thera-pies [6], the Swedish Pharmaceuticals Standard, SLS:2016.0; Tillverkn-ing och hantering av hemodialysvatskor inom sjukvarden [14], the Eu-ropean Pharmacopoeia, Ph. Eur. 01/2009:1167; Haemodialysis Solu-tions, Concentrated, Water for Diluting [15] and the International Con-
18
ference on Harmonisation’s guideline, ICH:Q2(R1); Validation of Ana-lytical Procedures [16].
2.1.2 Investigation of Existing Methods for Dialy-sis Water Validation
In order to find improvement possibilities of water quality measure-ment, existing methods were investigated. These current methods, iden-tified in previously mentioned standards, were studied and interpretedby literature searching and study visits. Information about current meth-ods was also acquired by skillful personnel at Baxter.
2.1.3 Survey on Methods for Water Validation atHome-hemodialysis Clinics
In order to understand how the dialysis water quality verification is im-plemented and practiced by the HHD-clinics almost all of the Swedishdialysis clinics1 were contacted and asked whether they offered their pa-tients HHD-treatment. Those who answered that they did so were askedto fill in a formulary2 regarding their routines for quality verification oftheir HHD-patients purified dialysis water.
Since the routines at the clinics were expected to be diverse, the for-mulary offered only free text answers, wherefore the analysis of theinvestigation were always meant to be qualitative rather than quantita-tive and not to be evaluated statistically.
2.1.4 Study VisitsTo obtain a more empirical view on the prescribed circumstances withHHD, water purification and microbiological laboratory work, threestudy visits were carried out.
1The dialysis clinics contacted were those with contact information listed on theSwedish Renal Medicine Nurse Association’s homepage [17].
2The structure and content of the formulary are described in Appendix A.
19

The Dialysis Clinic at Skane University Hospital, Lund
At the clinics in the Alwall-building in Lund, patients can receive tra-ditional hemodialysis treatment but also be trained for the self-treatmentmethods peritoneal dialysis, home-hemodialysis and self-care hemodial-ysis [18]. The study visit contained interviews with a HHD patient anda tour to the different dialysis facilities in the building.
Bulltofta Water Plant, Malmo
The study visit to Bulltofta Water Plant was performed to gain knowl-edge about how the water is pre-treated before it reaches a HHD-patient’shouse or a dialysis clinic and also to see what analysis methods that areused in the laboratory for the drinking water quality verification.
The water plant is operated by the water and sewerage supplier VASYD and it treats and purifies water from the Grevie source, provid-ing approximately 15 % of Malmo’s drinking water [19].
The Division of Clinical Microbiology at the University Hos-pital of Skane, Lund
For the purpose of getting a hands-on experience of the current tech-niques used for microbial and endotoxin analysis, a study visit was car-ried out at the clinical microbiology laboratory at the university hospitalin Lund. The laboratory analyzes all of the water samples from the dial-ysis clinic.
2.1.5 International Aspects of HHD-possibilitiesand Regulations on Drinking Water Quality
Even though the survey and study visits were expected to give a betterinsight in the case of water for dialysis usage, they were limited to Swe-den, which only has a minimal fraction of the world’s patients underHHD treatment. Therefore, in order to get a more international per-spective on the case, an investigation was made on how prevalent HHDis globally and what conditions that are necessary to enable HHD treat-ment at any location. Information about this was obtained from statis-tical databases of several international dialysis organizations and fromorganizations and magazines reporting about global aspects of dialysis.
20
Especially, the report Guidelines for drinking-water quality from theWorld Health Organization, WHO [20] was taken into consideration.
2.2 Analysis and gained knowledge
2.2.1 Investigation of Regulatory Standardizationsfor Dialysis Water Validation
Standards for Manufacturing of Dialysis Water
The international standard ISO:13959(2014) influence the many localstandards that regulates dialysis water when setting the limitations.According to Baxter it is the dialysis water standard that the manufac-turers of equipment for dialysis firstly takes into consideration whendesigning for example water purification systems. The scope of thestandard includes the specification of ”...minimum requirements forwater to be used in haemodialysis and related therapies.” [6] and thetypes of liquids it regulates are ”...water to be used in the preparationof concentrates, dialysis fluids for haemodialysis, haemodiafiltrationand haemofiltration, and for the reprocessing of haemodialysers.”. Itcontains an important section with definitions followed by the two mainparts addressing dialysis water requirements and tests for compliancewith them after which it ends with a rationale for its development.
The Swedish equivalent standard, SLS:2016.0 is built up in a slightlydifferent way and contains two main parts. One part with guidelinesto a GMP, Good Manufacturing Practice, for the production of waterfor dialysis and one part of a more advisory character, which aims athelping the manufacturer to establish the GMP. The guidelines includea table of maximum allowed concentrations of several contaminants to-gether with a table of how often these levels shall be measured.
In addition to the large number of similarities between the two stan-dards there are some minor and major differences. As for example,they have some differences in their requirement specification and in theways they express them. Among them, the restriction of the concentra-tions of heavy metals, where ISO:13959(2014) has separate limits forindividual heavy metals but SLS:2016.0 specifies a limit for heavy met-als as a group. This can be considered as a bit unsuitable as the term
21
heavy metals often leads to ambiguity and thus, as a disadvantage withSLS:2016.0. Especially since it does not contain any rationale that mo-tivates the selection of limits, which the ISO standard does contain. Onthe other hand, ISO:13959(2014) only states the limits and suitable de-tection methods for the respective analysis but does not carry any adviceat which frequency the sample-taking and analysis should be performed,which is prescribed in SLS:2016.0.
Although both SLS:2016.0 and ISO:13959(2014) generally divides thequality control in terms of microbiological requirements and chemicalcontaminants, this report will hereafter separate the methods to fulfil themicrobiological requirements into detection of microbes and endotoxinsas the analysis methods are significantly different.
Pharmacopoeia
The monograph 01/2009:1167 Haemodialysis solutions, concentrated,water for dialysis of the European Pharmacopoeia consists of a set ofconventional, validated test methods for many chemical parameters.The application of these methods is legally binding when determiningthe quality of dialysis water. If any other method is to be used it mustbe validated.
Validation of Analysis Methods
As previously mentioned, an analysis method that is not a pharma-copoeia method should be validated in accordance with the Interna-tional Conference on Harmonization’s guideline, ICH:Q2(R1), Valida-tion of Analytical Procedures. It describes in its introduction that itrather ”...serves as a collection of terms, and their definition, and is notintended to provide direction on how to accomplish validation.” [16].The characteristics normally necessary to evaluate for an analytical pro-cedure that is meant to be testing for impurities, which is the most com-mon case in water quality verification, are:
– Accuracy
– Repeatability– Intermediate precision
– Specificity– Detection limit
22

– Quantitation limit– Linearity– Range
In addition to these, the robustness – which means the method’s ”...ca-pacity to remain unaffected by small, but deliberate variations in methodparameters...” – should be evaluated.
2.2.2 Investigation of Existing Methods for Dialy-sis Water Validation
Microbial analysis
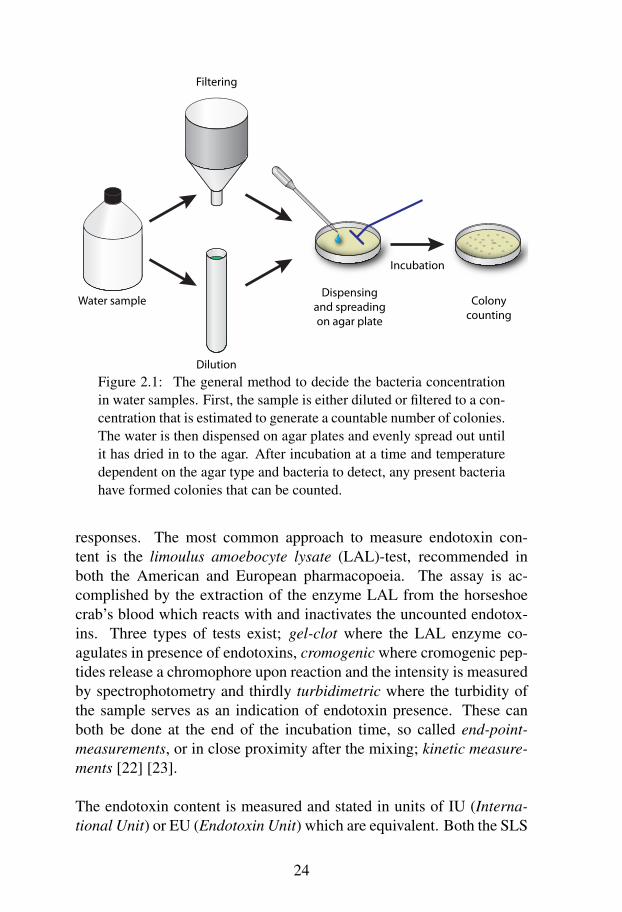
Routine microbial analysis is dominated by plate methods where thefluid to be analyzed is deposited in microbiological growth mediumand incubated to enhance individual microorganism to grow to a colonyforming unit. These methods are slow with several days waiting timeto acquire data and can furthermore underestimate the real number ofmicroorganisms since not all will grow to form a colony unit. The mainsteps in the method for determining bacteria concentration in water sam-ples are illustrated in Figure 2.1.
According to ISO:13959(2014), as well as SLS:2016.0, the minimumrequirement for water for dialysis is specified to 100 CFU/ml. Thestandards also recommend the agar plate counting as analysis method orother validated method with corresponding result [21] [6]. The outcomeof the microbiological cultivation method is the result of a combinationof nutrient media, incubation time and incubation temperature. Sincepoor cultivation conditions will underestimate the reality and favorablewill overrate the microbial content, the standards also specify the typeof agar plate accepted and the associated time and temperature. TheSLS:2016.0 recommends the usage of either R2A agar plates at 20◦Cfor 5-7 days or TSA agar plates at 30-35◦C for 3 days [14].
Endotoxin analysis
The endotoxin analysis is employed to detect and quantify the amountof endotoxins in the water sample. Bacterial endotoxins are lipopolysac-charides from the cell membrane in gramnegative bacteria, which incontact with the bloodstream they provoke intense pyrogenic immune
23
Water sampleDispensing
and spreading on agar plate
Colony counting
Dilution
Filtering
Incubation
Figure 2.1: The general method to decide the bacteria concentrationin water samples. First, the sample is either diluted or filtered to a con-centration that is estimated to generate a countable number of colonies.The water is then dispensed on agar plates and evenly spread out untilit has dried in to the agar. After incubation at a time and temperaturedependent on the agar type and bacteria to detect, any present bacteriahave formed colonies that can be counted.
responses. The most common approach to measure endotoxin con-tent is the limoulus amoebocyte lysate (LAL)-test, recommended inboth the American and European pharmacopoeia. The assay is ac-complished by the extraction of the enzyme LAL from the horseshoecrab’s blood which reacts with and inactivates the uncounted endotox-ins. Three types of tests exist; gel-clot where the LAL enzyme co-agulates in presence of endotoxins, cromogenic where cromogenic pep-tides release a chromophore upon reaction and the intensity is measuredby spectrophotometry and thirdly turbidimetric where the turbidity ofthe sample serves as an indication of endotoxin presence. These canboth be done at the end of the incubation time, so called end-point-measurements, or in close proximity after the mixing; kinetic measure-ments [22] [23].
The endotoxin content is measured and stated in units of IU (Interna-tional Unit) or EU (Endotoxin Unit) which are equivalent. Both the SLS
24
2016.0 and the ISO:13959(2014) stipulate a maximal content of 0.25IU/ml. Besides, SLS 2016.0 specifies quality controls twice a year.
Chemical analysis
For the chemical analysis it is harder to define one specific method sincedifferent analysis methods are available, depending on what compo-nent to analyze. For most analytes, different kinds of spectrometry orchromatography methods are recommended. For example, a commonlyused method, that is recommended in the ISO:13959(2014) for severalcontaminants, is the ICP-MS, Inductively Coupled Plasma Mass Spec-trometry. The method is performed by heating a carrier gas to induceplasma which in turn is used to ionize the sample. The created ions arethen separated depending on the mass-to-charge ratio and the elementalcomponents can be detected. The ICP-MS is rather advanced and theinstrument is both big and expensive, although very precise with highresolution and capability to detect most elements.
The conductivity of the water should be monitored continuously withan integrated conductivity meter placed after the reverse osmosis-unit.A registered difference in conductivity is used as an indicator of con-taminated water since higher conductivity is related to higher ion con-tent within the fluid. The dissolved ions originates from dissolved saltsand inorganic material. However, the monitoring is only a general indi-cation of water quality and the method is unable to distinguish betweendifferent types of contamination [24].
2.2.3 Survey on Methods for Water Validation atHome-hemodialysis Clinics
Coverage
Out of 66 contacted dialysis clinics, 39 replied and answered the firstquestion about whether they offered home hemodialysis or not to theirpatients. 16 clinics replied that they did so and out of them, 13 clinicsfilled in the formulary. Those 13 clinics reported to treat in total 121patients which is equal to 88% of Sweden’s 138 HHD-patients [25].
25
Sampling Frequency
The sampling frequency of the microbial detection and endotoxin test-ing varies between different clinics and ranges from once per month toonce per year. Some of the clinics also reports that they are initially tak-ing water samples more frequently until a good trend in water qualitycan be confirmed. However, a number of clinics do not satisfy the rec-ommended sampling frequency for microbial control of once per monthas stated in SLS:2016.0. All except one clinic followed the exhortationof two times per year as a minimum for endotoxin control. Even morenameworthy is the fact that only three out of thirteen clinics followthe recommendation of chemical control every second month. With-out mentioning why, it becomes clear that the more or less mandatorydocument SLS:2016.0 is not complied to the letter regarding samplingfrequency.
Sample-taking Routines
The answers upon the question ”Who performs the sample-taking?”varies to be either a technician, a nurse or the patient. All clinics ex-cept one reports that they have a protocol describing the routines for thesample-taking but despite this, the fact that some patients tap the waterthemselves might be considered as an increased risk of contaminationof the water.
After the water is tapped in the patients home, it is transported underwell-regulated circumstances to the clinic or to the place where the anal-ysis occurs. Most of the clinics send the water samples for analysis tointernal hospital laboratories except from the samples for chemical con-trol, that require more advanced equipment, where some clinics usesexternal analysis companies instead.
Costs
Since the microbial analysis mostly occurred at hospital laboratories,the cost for analysis is internally debited and therefore the actual priceis not visible for the clinic. Neither the personnel cost for travelling tothe patients and taking water samples is counted as a direct extra costand is therefore hardly estimated. Anyway, one clinic reports that onlythe analysis costs up to 800 SEK but that the material cost is negligible.
26
According to Region Skane’s price list a bacterial cultivation from wa-ter costs 200 SEK while the external analysis company Eurofins takes393 SEK [26][27]. Anyway, with the extensive sample-taking routinesin mind the costs for microbial analysis are expected to be considerablyhigher than these sums.
Even in the case of endotoxin tests the analysis cost amounts to 800 SEKpursuant to the questionnaire answers while Region Skane charges 283SEK and Eurofins charges 1200 SEK. Again, it is reasonable to presumethat the total cost will be substantially higher and that sample-taking forHHD is more expensive than for hemodialysis at clinic due to the ex-penditures that comes with housecalls.
As already mentioned, most clinics use external analysis companies forthe chemical analysis since it includes several analytes and needs moreexpensive and advanced equipment. This made the costs more visiblefor the clinics and those who uses Eurofins reported a cost per sampleof 1200 SEK excluding costs for sample-taking and shipping. Two clin-ics specifies chemical analysis costs of 35 respectively 39 SEK whichappears to be unreasonably low prices. Either, all of the recommendedparameters are not being measured or the actual costs are invisible forthe clinic staff.
Response time
As with the costs, the time it takes for the clinics to get results fromthe different tests varies a lot. Most clinics states that the response timefor the microbial tests and endotoxin tests is around one week while theresponse time for the chemical analysis ranges from a couple of hoursfor those who perform it internally up to 14 days for those who send itto an external analysis company.
The money and time consumed on all these controls together with thecomprehensive routines are probably the main reasons to why the ex-horted sample-taking frequency is not followed in many cases. Thismeans that it is apparently both time and money to save on having anon-line method for the water quality verification if it can be sufficientlyreliable and inexpensive.
27
2.2.4 Study VisitsAs been mentioned before, the study visits were conducted to learnmore about the different areas related to HHD treatment and rather thanresults, some of the gained knowledge is presented in this section.
The dialysis clinic at Skane University Hospital, Lund
As there are big risks associated to an improper dialysis treatment,HHD-patients are trained at the clinic during eight weeks before theycan start their treatment at home. The patients connected to the hospi-tal in Lund operates some of the cleaning processes themselves and arealso taught to perform the sample-taking for water quality analysis.
In Sweden, all parts of the HHD-treatment is free of charge for the pa-tient, who is also given economic compensation for the increased con-sumption of water and electricity together with higher costs for trans-port and waste management. Each treatment occasion with HHD costsapproximately 1200 SEK while the same cost for in-clinic treatment isaround 3000 - 3500 SEK. This difference comes from reduced person-nel and premises costs in HHD treatment.
An alternative method for the patients at the Alwall-clinic is night-timeHHD, which is considered to be very effective. Anyhow, for some pa-tients, the large impact on the body that dialysis causes together withnoise from the machine results in disturbance of their night’s rest.
There are shared opinions among patients and nurses whether automa-tion of the dialysis treatment is good or not. For many patients it meansbetter life quality to take control over their treatment and understandhow the different settings affect their health, while for others it is con-venient to not put so much effort in operating the dialysis machine thatalready is a big time-consumer in their lives [28].
Bulltofta Water Plant, Malmo
The water plant performs analyses of the outgoing drinking waterin compliance with the regulations from the Swedish National FoodAdministration[21]. In common with the regulations for dialysis waterthey are looking for the presence of microorganisms in general but in
28
contrast they also have to ensure that there are absolutely no coliformbacteria, Escherichia coli or actinomyces present in the water. Besidesthat, they are not checking for endotoxins at all, as it is not consideredas a risk if endotoxin containing water is consumed orally.
At Bulltofta Water Plant, four parameters are continuously mea-sured on-line; the water’s hardness, acidity, conductivity and chlorineexcess. All other parameters and contaminants are regularly analyzedat their own SWEDAC-accredited laboratory, where they also analyzeswater samples for others.
The Division of Clinical Microbiology at the University Hos-pital of Skane, Lund
When the water samples are transported from the patient’s home andarrives at the laboratory, it is first filtered through a 0.2 µm pore fil-ter, which is then placed on an agar plate. This step is performed sinceeventually present bacteria need to be enriched as the concentrations areexpected to be very low in the purified water. The whole procedure ofbacteria cultivation is done manually and so is even the analysis. Thelab assistant looks on the plate after a certain incubation time and makesa subjective evaluation on the number of colony forming units if thereis a visible microbial growth.
As well as microbial analysis, endotoxin tests are also performed inthe same laboratory with the Endosafe-MCSTM machine from CharlesRiver company. The lab assistant gave a rough cost of 100 SEK persample for the disposable cassette that is used.
2.2.5 International Aspects of HHD-possibilitiesand Regulations on Drinking Water Quality
International Distribution of Patients under HHD-treatment
The number of patients that are treated with hemodialysis in their homesvaries strongly between different countries and continents. The possi-bilities to receive HHD-treatment in a less developed country is signif-icantly lower since it demands high drinking-water quality. In addi-tion to that, the cost-effectiveness is lower in these countries for HHD-treatment in comparison to hemodialysis at clinics since the personnel
29

cost is often lower. Two factors that are often thought to affect the ratiobetween dialysis at home or at clinic are urbanization and populationdensity since clinic-visits are more circumstantial when a patient has along traveling distance to the clinic. However, a study from 2006 showsno such correlation [5].
A selection of the HHD statistics for some countries are shown in Table2.1.
Land Patients w. HHD p.m.i % of pat.USA [29] 8507 26.7 1.8Sweden [25], [30] 138 14.9 1.6Canada [31] 1042 29.6 2.5Australia & New Zealand [32] 1629 59.0 11.0Japan [33] 459 3.6 0.1
Table 2.1: The number of patients under HHD-treatment in total, per millioninhabitants and as percent of treated patients.
When having a look at the European Union, there is no available sum-mary for the union as a whole but the annual report [30] from ERA-EDTA (European Renal Association - European Dialysis and Trans-plant Association) contains two parts; one for countries that have pro-vided individual patient data and one for countries and regions that hasprovided aggregated patient data. All of the countries in the EuropeanUnion have not contributed with data, but of those who have, Wales(3.3%) and Denmark (3.0%) have the largest fractions of patients withHHD when considering the treatment methods in total. The countrythat treats the most patients with HHD is the United Kingdom (1168patients) if considered as one country, while many of the countries donot provide HHD as a treatment method for renal patients.
Drinking-water quality
Access to high-quality drinking water is the most essential conditionfor home hemodialysis. But as is widely known, the access and qual-ity of water is greatly different over the world and there is no globallyaccepted standardization made that regulates allowed levels of contam-inants in drinking-water. Some countries have compiled their own rec-ommendations while for example EU and USA have standards whichspecific directives must be abided by law [34][35]. For those countries
30

that lack standards, the World Health Organization, WHO has set upguidelines to support and be the basis of risk assessment strategies onthe occasion of water contamination. The 500 pages long report alsodescribes, in addition to requirements for maximum contaminant lev-els, procedures for monitoring and quality control [20].
Since the problem of drinking-water contamination is widespread andoften noticed, the regulation of drinking-water quality around the worldis more comprehensive and detailed than the one for water for dialysisand thus containing more measurement parameters. This despite thefact that the demands on the water quality is much higher for dialysisthan for drinking purposes. As for example in Sweden, the feedwaterfor hemodialysis must at least achieve drinking-water quality [14].
Therefore, if HHD-treatment should be possible in countries with insuf-ficient drinking-water quality an on-line system for verifying the qualityof the purified water is almost necessary since the risk for complicationsis considerably higher.
2.3 ConclusionsThe summarized conclusions of this requirements analysis with impor-tance for the objectives of this thesis are:
• A potential on-line method for control of microbial presence mustmeasure something else than Colony Forming Units since a bac-terium needs incubation time to divide into a visible colony ofmany bacteria. By obvious reasons, the incubation is incompat-ible with an on-line method. Therefore the microbial concentra-tion unit of an on-line method must either be able to translate toCFUs/ml or the set of regulations has to be changed.
• The conventional methods for determination of the endotoxin con-tent in water requires an addition of the LAL reagent which mightbe possible but not desirable at on-line measurements since it im-plicates handling of waste water. In addition to that, the kineticLAL-methods claim frequent calibration with known endotoxinlevels.
31

• A measuring method for verification of the water quality which isnot prescribed in the effective standard or a pharmacopoeia mustbe validated towards the conventional method in compliance withthe ICH guidelines.
• Many costs for the sample-taking and analysis in the health careappear to be unknown or underestimated. Likewise, some of theapproached clinics in the survey do not fulfill the demands ofSLS:2016.0 in terms of sample-taking frequency. A continuous,or at least frequently performed, on-line method would be suit-able to prevent under-sampling.
• There is both time and money to save with an adequate on-linemethod for water quality verification. Both transport and per-sonnel cost will be avoided or at least depressed through on linemeasurements. Despite this, the grand advantage will come fromsafety aspects since a good and stable water quality can be guar-anteed. It must not necessarily replace the conventional methodsbut could serve as a complement so that early warnings of highlevels of contaminants can be communicated.
32

Chapter 3
Literature Review andInvestigation of PossibleTechniques
3.1 MethodIn order to gain greater knowledge and comprehension to the previ-ous defined problem and to investigate possible technical solutions, anextensive literature study was done. The study was divided into threeparts; Microbial Analysis Methods, Endotoxin Analysis Methods andChemical Analysis Methods. Published material from article databases,web pages and patent databases were investigated and gathered in a listwith an abstract together with a short evaluation of their relevance, sci-entific rigor and quality.
When evaluating possible methods the following requirements from theRequirement Analysis were kept in mind:
1. On-line measurement - preferable without addition of reagentsand with results in real time
2. Detection limits within the specification interval
3. Specificity for selected analyte
4. Possibilities for development within this project
33
3.2 ResultsThe most relevant and potential technical solutions are presented anddescribed in each category.
3.2.1 Methods for Microbial AnalysisBiosensors
A biosensor is a type of detector used for quantification and identifi-cation of biological material. The sensor usually consist of two com-ponents; a biological affinity element and a complimentary detectionmethod. The biological recognition can be performed for example byantibodies, boronic acids, lectins or other elements that bind specificallyto particular segments of the intended microorganism.
For a biosensor to be relevant within this project, the biorecognitionelement must have the capability of non-specific affinity with all typesof bacteria and not just one species. Besides, a very low limit of detec-tion is necessary since the predefined bacteria concentration is consid-erably low. Furthermore, no sample processing nor addition of reagentsare desired, hence the binding needs to be exogenous as no bacterialdisruption or lysis are practicable. The binding component does oftenhave too high limit of detection as well as an incubation time for thebinding to occur. These problems make the methods complicated to usefor sensitive on-line applications.
When the specific binding is conducted at least one physicochemicalstate is changed, such as conductivity, mass or refractive index, whichconsequently can be detected and quantified by an appropriate detectionmethod. The sensitivity of the biosensor is due to both the affinity ele-ment and detection method [36].
The biosensor field is developing and becomes important in an increas-ing number of applications. Common detection techniques for bacteriaare the optical and the impedimetric methods, including surface plas-mon resonance and direct monitoring of impedance variations.
34
Biosensors - Recognition Element: Antibodies
Monoclonal antibodies are common recognition elements used in biosen-sors. The antibodies are immobilized on a substrate and when encoun-tering the corresponding antigen the formation of an antibody-antigen-complex occur [37]. A study done with antibodies immobilized onscreen printed electrodes of gold achieved a very low limit of detec-tion of 3.3 CFU/ml. However one hour of incubation was needed forthe antibody-bacteria binding to occur and the detection was selectivefor E. coli bacteria [38]. The main advantage of antibodies as recogni-tion elements is their selectivity, however within this project not onlyone, but all types of bacteria should be detected.
Biosensors - Recognition Element: Boronic Acids
To expand the detection span boronic acids, ligands which selectivelybind to diol-compounds, can be used. Since the bacteria cell wall con-tains diol groups attached to polysaccharides, the boronic acids canchemoselectively bind to these diols and hence detect and quantify thetotal amount of bacteria. Other saccharides, such as glucose or endo-toxins, can also bind to the boronic acids indicating that the water is notpurified enough, though from a different perspective than bacterial con-tent. In a study where boronic acids were used in combination with apotentiostatic step method the detection limit of 1.0 · 102 CFU/m1 wasobtained, though with an incubation time of 20 minutes [39].
Biosensors - Recognition Element: Lectins
Lectins are carbohydrate-binding proteins in plants and animals whichselectively can bind to saccharide components of the bacteria cell wall.Like boronic acids these are more general in their affinity with bacteriaand hence superior to antibodies in the detection of all bacteria types.Also, due to the small size of lectins, higher density of sensing elementscan be obtained on the substrate surface resulting in higher sensitivityand less non-specific adsorption. A lectin-based impedance biosensor isreported to achieve detection with concentration range of 1.8 to 1.8 ·107
CFU/ml [37]. The carbohydrate recognition conducted by lectins orboronic acids enable identification and detection of unexpected or novelbacteria. Also, they are more stable than antibodies and do not denatureupon temperature or pH variations [40].
35
Biosensors - Detection Method: Surface Plasmon Resonance
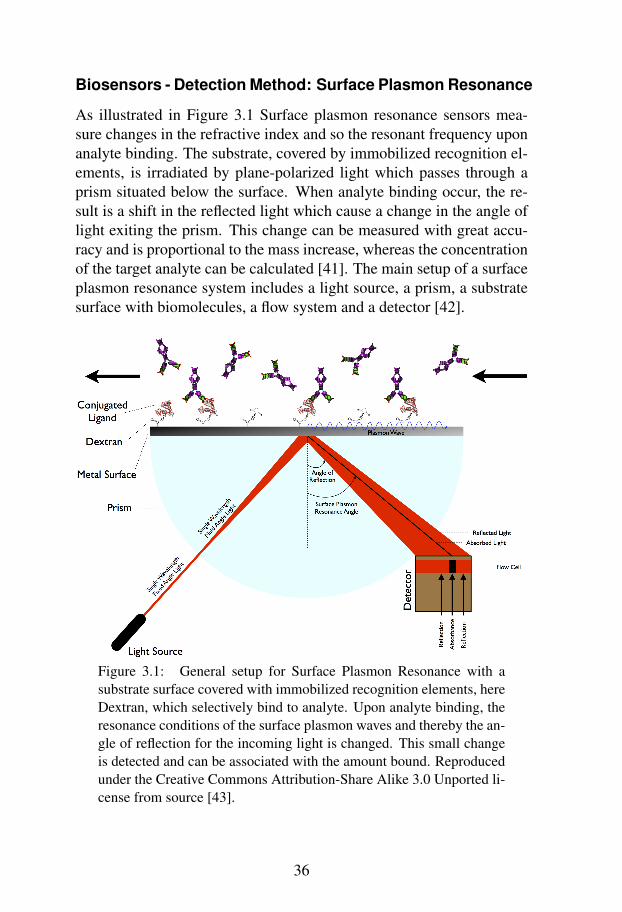
As illustrated in Figure 3.1 Surface plasmon resonance sensors mea-sure changes in the refractive index and so the resonant frequency uponanalyte binding. The substrate, covered by immobilized recognition el-ements, is irradiated by plane-polarized light which passes through aprism situated below the surface. When analyte binding occur, the re-sult is a shift in the reflected light which cause a change in the angle oflight exiting the prism. This change can be measured with great accu-racy and is proportional to the mass increase, whereas the concentrationof the target analyte can be calculated [41]. The main setup of a surfaceplasmon resonance system includes a light source, a prism, a substratesurface with biomolecules, a flow system and a detector [42].
Figure 3.1: General setup for Surface Plasmon Resonance with asubstrate surface covered with immobilized recognition elements, hereDextran, which selectively bind to analyte. Upon analyte binding, theresonance conditions of the surface plasmon waves and thereby the an-gle of reflection for the incoming light is changed. This small changeis detected and can be associated with the amount bound. Reproducedunder the Creative Commons Attribution-Share Alike 3.0 Unported li-cense from source [43].
36
Biosensors - Detection Method: Impedance Spectroscopy
When for example a bacterium binds to the recognition molecule onthe biosensor surface, the electrical properties of the surface changes.In (Electrochemical) Impedance Spectroscopy, this fact is used to de-termine the amount of bound bacteria by applying a sinusoidal voltagesignal, U(jω), with small amplitude to the electrode with immobilizedaffinity elements, while measuring the corresponding current, I(jω).The ratio between the voltage and current, the complex impedanceZ(jω),consists of a real and an imaginary part that depends on the resistanceand capacitance of the electrochemical cell. When alternating the fre-quency of the applied voltage, an impedance spectrum can be presentedfor example as a Nyquist plot with the resistance, Re(Z), and the reac-tance, Im(Z), on the axes [44].
Impedance spectroscopy can only be considered as a semi-continouslydetection method as an accurate characterization of the electrode sur-face requires recording of impedances over a broad range of frequen-cies. That often takes around 15-20 minutes.
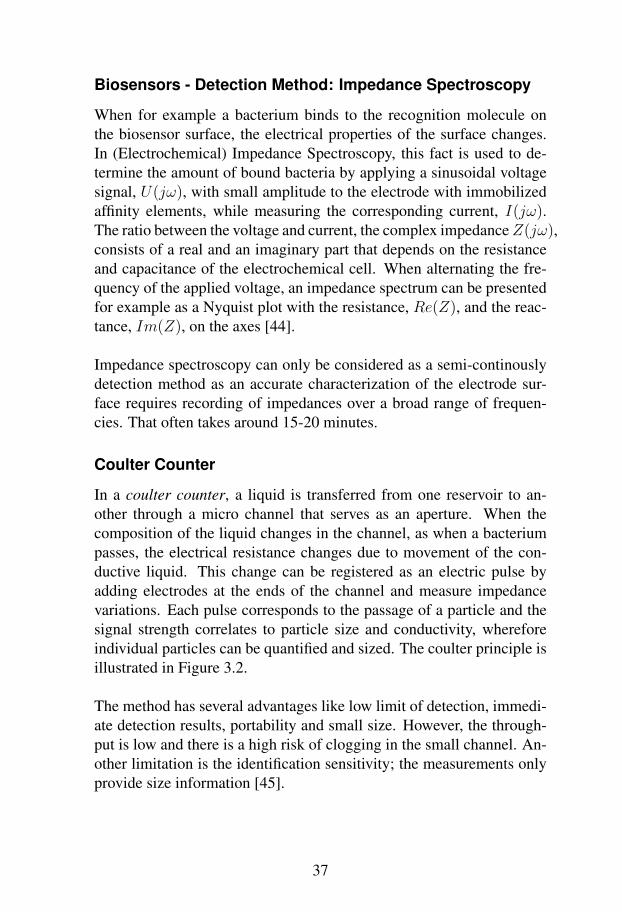
Coulter Counter
In a coulter counter, a liquid is transferred from one reservoir to an-other through a micro channel that serves as an aperture. When thecomposition of the liquid changes in the channel, as when a bacteriumpasses, the electrical resistance changes due to movement of the con-ductive liquid. This change can be registered as an electric pulse byadding electrodes at the ends of the channel and measure impedancevariations. Each pulse corresponds to the passage of a particle and thesignal strength correlates to particle size and conductivity, whereforeindividual particles can be quantified and sized. The coulter principle isillustrated in Figure 3.2.
The method has several advantages like low limit of detection, immedi-ate detection results, portability and small size. However, the through-put is low and there is a high risk of clogging in the small channel. An-other limitation is the identification sensitivity; the measurements onlyprovide size information [45].
37
-+
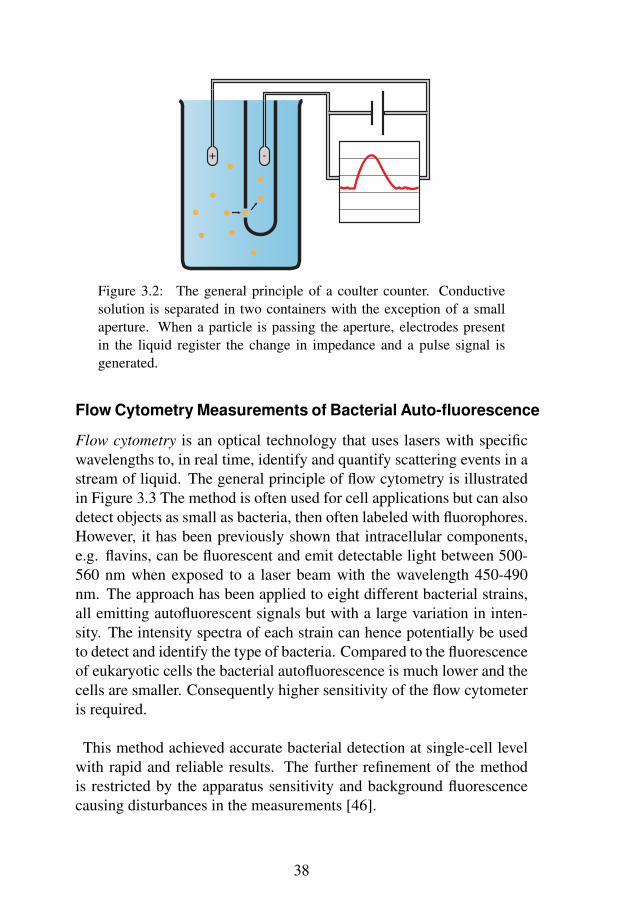
Figure 3.2: The general principle of a coulter counter. Conductivesolution is separated in two containers with the exception of a smallaperture. When a particle is passing the aperture, electrodes presentin the liquid register the change in impedance and a pulse signal isgenerated.
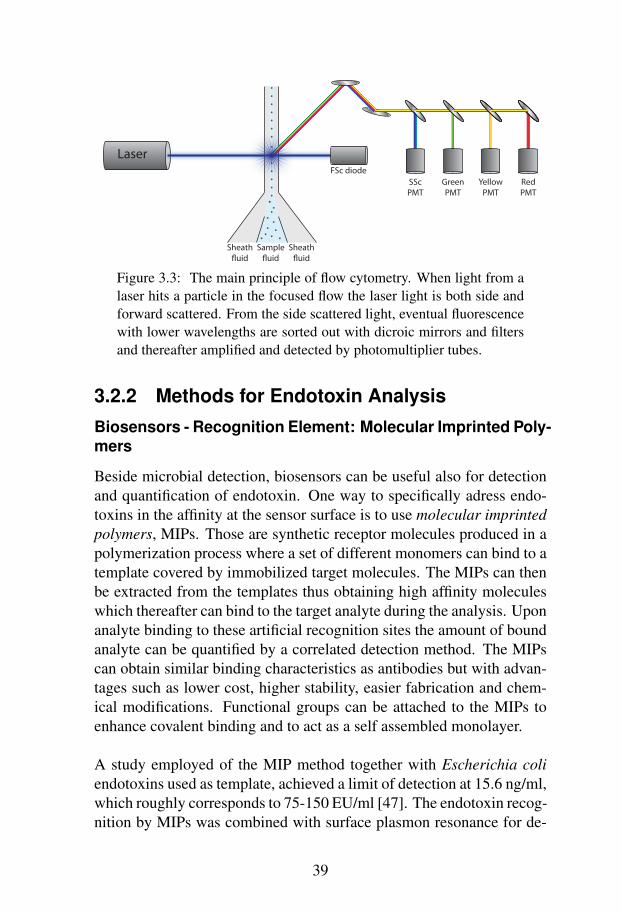
Flow Cytometry Measurements of Bacterial Auto-fluorescence
Flow cytometry is an optical technology that uses lasers with specificwavelengths to, in real time, identify and quantify scattering events in astream of liquid. The general principle of flow cytometry is illustratedin Figure 3.3 The method is often used for cell applications but can alsodetect objects as small as bacteria, then often labeled with fluorophores.However, it has been previously shown that intracellular components,e.g. flavins, can be fluorescent and emit detectable light between 500-560 nm when exposed to a laser beam with the wavelength 450-490nm. The approach has been applied to eight different bacterial strains,all emitting autofluorescent signals but with a large variation in inten-sity. The intensity spectra of each strain can hence potentially be usedto detect and identify the type of bacteria. Compared to the fluorescenceof eukaryotic cells the bacterial autofluorescence is much lower and thecells are smaller. Consequently higher sensitivity of the flow cytometeris required.
This method achieved accurate bacterial detection at single-cell levelwith rapid and reliable results. The further refinement of the methodis restricted by the apparatus sensitivity and background fluorescencecausing disturbances in the measurements [46].
38
LaserFSc diode
SScPMT
GreenPMT
YellowPMT
RedPMT
Sheath�uid
Sheath�uid
Sample�uid
Figure 3.3: The main principle of flow cytometry. When light from alaser hits a particle in the focused flow the laser light is both side andforward scattered. From the side scattered light, eventual fluorescencewith lower wavelengths are sorted out with dicroic mirrors and filtersand thereafter amplified and detected by photomultiplier tubes.
3.2.2 Methods for Endotoxin AnalysisBiosensors - Recognition Element: Molecular Imprinted Poly-mers
Beside microbial detection, biosensors can be useful also for detectionand quantification of endotoxin. One way to specifically adress endo-toxins in the affinity at the sensor surface is to use molecular imprintedpolymers, MIPs. Those are synthetic receptor molecules produced in apolymerization process where a set of different monomers can bind to atemplate covered by immobilized target molecules. The MIPs can thenbe extracted from the templates thus obtaining high affinity moleculeswhich thereafter can bind to the target analyte during the analysis. Uponanalyte binding to these artificial recognition sites the amount of boundanalyte can be quantified by a correlated detection method. The MIPscan obtain similar binding characteristics as antibodies but with advan-tages such as lower cost, higher stability, easier fabrication and chem-ical modifications. Functional groups can be attached to the MIPs toenhance covalent binding and to act as a self assembled monolayer.
A study employed of the MIP method together with Escherichia coliendotoxins used as template, achieved a limit of detection at 15.6 ng/ml,which roughly corresponds to 75-150 EU/ml [47]. The endotoxin recog-nition by MIPs was combined with surface plasmon resonance for de-
39
tection. The accomplished limit of detection was however rather high tomatch the requirements of endotoxin content in dialysis water, but sinceit was the lowest concentration tested one can not exclude the possibilityof an even lower limit of detection [48].
Biosensors - Recognition Element: Aptamers
Aptamers are short strands of peptides or oligonucleotides, such asRNA or single strand DNA, which can be produced synthetically to tar-get practically any molecule. The aptamers can be designed to mimicthe antibody binding to specific molecules with high affinity and selec-tivity. Like MIPs, aptamers may be linked to functional groups andcan form a self assembled monolayer on a gold electrode. The ap-tamers can substitute the usage of antibodies due to their several ad-vantages; higher stability, easier and more cost-effective production andnon-immunogenic behavior. An aptamer-based biosensor with impedancedetection reached a limit of detection of 1 pg/ml for endotoxin analysis.The method has high affinity for endotoxins, sufficiently low detectionlimit to be applied on RO-purified water, simple operation and low costproduction. However, no further information of incubation time is avail-able, thus it is unclear if implementable in an on-line monitoring system[49].
3.2.3 Methods for Chemical AnalysisTotal Organic Carbon-analyzers
In terms of water analysis, total organic carbon, TOC, refers to the to-tal amount of organic carbon in the water, which can be used as a non-specific estimation of water quality. It can be measured in laboratory byfor instance consumption of the oxidizing agent permanganate, MnO−
4 ,which is the method referred to in SLS:2016.0 [14]. However, there areinstruments on the market that can measure the amount of TOC con-tinuously in flowing water with very high precision. The principle theyuse is to detect a secondary parameter that is dependent on the amountof CO2 before and after a step of total oxidization of the carbon in thewater. One common technique to do this, used among others by theinternational company Merck Millipore in their MilliQ instruments isthrough conductivity measurements and oxidization by UV-light [50].When irradiating the water with UV-light, water molecules are con-
40
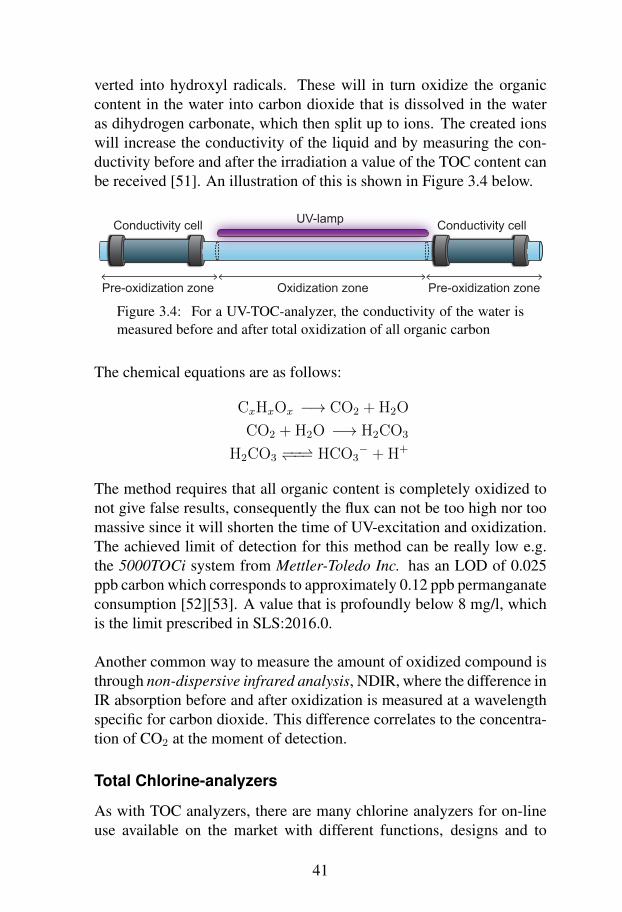
verted into hydroxyl radicals. These will in turn oxidize the organiccontent in the water into carbon dioxide that is dissolved in the wateras dihydrogen carbonate, which then split up to ions. The created ionswill increase the conductivity of the liquid and by measuring the con-ductivity before and after the irradiation a value of the TOC content canbe received [51]. An illustration of this is shown in Figure 3.4 below.
Pre-oxidization zone Pre-oxidization zoneOxidization zone
UV-lamp Conductivity cellConductivity cell
Figure 3.4: For a UV-TOC-analyzer, the conductivity of the water ismeasured before and after total oxidization of all organic carbon
The chemical equations are as follows:
CxHxOx −→ CO2 +H2O
CO2 +H2O −→ H2CO3
H2CO3 −−⇀↽−− HCO3− +H+
The method requires that all organic content is completely oxidized tonot give false results, consequently the flux can not be too high nor toomassive since it will shorten the time of UV-excitation and oxidization.The achieved limit of detection for this method can be really low e.g.the 5000TOCi system from Mettler-Toledo Inc. has an LOD of 0.025ppb carbon which corresponds to approximately 0.12 ppb permanganateconsumption [52][53]. A value that is profoundly below 8 mg/l, whichis the limit prescribed in SLS:2016.0.
Another common way to measure the amount of oxidized compound isthrough non-dispersive infrared analysis, NDIR, where the difference inIR absorption before and after oxidization is measured at a wavelengthspecific for carbon dioxide. This difference correlates to the concentra-tion of CO2 at the moment of detection.
Total Chlorine-analyzers
As with TOC analyzers, there are many chlorine analyzers for on-lineuse available on the market with different functions, designs and to
41
different costs. Among these, there are in general two types of chlo-rine monitors: DPD colorimetric analyzers and amperometric analyz-ers. The DPD colorimetric method requires titration of N,N-diethyl-p-phenylenediamine (DPD) that reacts with all free chlorine moleculesin the water and creates a colored product and thus the chlorine con-centration can be read as a color shift by photosensors. Amperometricmethods are reagent free and expected to require less maintenance. Inaddition to that, they are also expected to be relatively free from interfer-ence from other compounds than chlorine in comparison to colorimetricsensors.
The principle of amperometric analyzers is to apply a voltage over ananode and a cathode and measure the passing current. The size of thecurrent is dependent on the reduction of hypochlorous acid that takesplace at the cathode. Since free chlorine appears as either hypochlorousacid (HOCl) or hypochlorite ions (OCl−), with a pH-dependent distru-bution, the concentration can be determined if the pH is known. Thesensors can also be modified to register both free chlorine and com-bined chlorine, which results in total chlorine. As a commonly existingadditive for drinking water is chloramines, which are a type of com-bined chlorine. Not only the free chlorine but the total chlorine amountneeds to be detected in the case of water quality verification for dialysis[54].
One advantage with amperometric chlorine sensors is that the techniqueis rather easily miniaturized with moderately preserved detection limit.A micromachined free chlorine monitor with three electrode configu-ration showed a linear range of detection between 0.3 ppm to 1.6 ppmwhich indeed is three times higher than the dialysis water chlorine limitprescribed in SLS:2016.0 but which probably could be improved a lotif industrially produced [55]. Larger amperometric total chlorine ana-lyzers can have much lower limits of detection and detect chlorine con-centrations on the ppb level [56].
Flow-head for Miniaturized Chemical Sensors
To enable simultaneous monitoring of several chemical elements a de-sign of a multicomponent chemical analysis detector has been devel-oped. The device contains a set of selective chemical sensors which candetect a specific analyte on-line and without sample preparation. The
42

flow-head allows the implementation of ten different chemical sensors,hence up to ten distinctive elements can be measured simultaneously.The different sensor cells are placed in series with a common referenceelectrode in the center to maintain the same distance to each sensor.Therefore, results from potentiometric sensors are comparable due tothe equal measuring conditions. The design of sensor mounting allowsvarious types of sensors to be incorporated, e.g. ion selective electrodes,silicone solid state electrodes or optical sensors [57].
If placed in a flow configuration and incorporated with different sen-sors the device can be suitable for an on-line, real-time multiparametermeasurement. Ion selective electrodes, ISEs, can be purchased and easyintegrated within the flow-head system. The principle of an ISE is sim-ple and consist of an ion-selective membrane which selectively allowsthe passage of a specific ion-type. The ion flux creates a potential dif-ference across the membrane surface which can be converted into anelectrical or optical signal. The strength of the signal is proportional tothe ion content of the fluid and consequently, the ion concentration canbe monitored. ISEs are commonly used both in industry and in labo-ratory environment and are available for numerous analytes includingchlorine, fluoride, sodium, nitrate and ammonium [58].
3.3 Discussion and ConclusionBiosensors
Biosensors have big potential due to their label free, fast, sensitive andspecific measurements of bacterial and endotoxin content. Furthermore,several biorecognition elements and corresponding detection methodsare available, with studies done where low limits of detection were ob-tained. The biggest challenge with biosensors is anyhow the obtainmentof sufficiently low limit of detection to be used within dialysis applica-tions. In order to achieve this, a low flow velocity is necessary to en-hance the analysis sensitivity and enable binding of all bacteria or allendotoxins within the selected flow.
If it in the future is going to be possible to use biosensors in connec-tion to the dialysis system, it is essential to ensure that the recognitionbiomolecules are fully immobilized on the sensor surface and that no
43
undesired substances leaks out in the water stream that goes to the pa-tient. Consequently, it is essential to make routine controls of sensorperformance and coverage.
Coulter Counter
The coulter counter offers a simple and sensitive method with real-timeanalysis results. Single bacteria can be detected and identified withgreat accuracy but since the medium within this application is or at leastis supposed to be ultrapure, the conductivity is very low. Hence it can bedifficult to measure electrical variations within the fluid. On the otherhand due to the low concentration within the media other common prob-lems for coulter counters can be avoided; the risk of coincidence andclogging. The probability of two particles passing the sensing zone ofthe detector simultaneously is rather low. Thus, false double amplitudesignal and count loss are not likely.
Flow Cytometry
The available flow cytometers are often large and very expensive andtherefore not possibly placed in the patient’s home. However, even ifthe existing equipment often is very advanced with multi-purpose use,the principle is rather simple and does in theory not require too manycomponents. Therefore, if flow cytometry should be used for dialysiswater quality verification it definitely needs to be simplified and minia-turized. For example, existing flow cytometers use a buffert to hydro-dynamically focus the sample fluid so that particles line up. But if it isknown how big the excited volume is, the concentration could be calcu-lated anyway.
Furthermore, as reported in the flow cytometry study concerning bacte-rial autofluorescence [46], the flow velocity needs to be very slow, thusrequiring a stable control system.
TOC-Analyzers
As reported in section 3.2.3 the TOC-analyzers are already an existinghigh performance tool on the market for water quality measurements.However, organic carbon is not necessarily a dangerous compound initself and more to consider as an indicator of the water quality and the
44
performance of the purification system. As the WRO 300 H-unit fromBaxter already includes accurate conductivity monitoring, an integra-tion of a TOC analyzing by UV-oxidization and conductivity measuringwould not be a too large step to take.
Total Chlorine Analyzers
The chlorine content is almost a necessary parameter to measure on-line, or at least on-site, since it is a volatile and according to SLS:2016.0the determination of the total chlorine amount should be made withinone hour after the sample-taking. Therefore an amperometric total chlo-rine sensor would be suitable to prioritize if integrating sensor equip-ment for water quality analysis in home hemodialysis systems. Espe-cially since chlorine historically has been associated to severe compli-cations in hemodialysis [7]. As with TOC analyzers the technique isalready on the market, it just has to be produced to a lower cost andcustom-made to fit in dialysis context.
Flow-head Multiparameter Sensor
The flow-head multiparameter setup enables monitoring of several pa-rameters simultaneously but requires purchase of sensors and accord-ingly, implementation of these to the configuration. The method couldbe combined with easily produced screen printed electrodes but how-ever, the problem with finding enduring and long functioning electrodesremain.
Sensor Placement
In order to verify the quality of the dialysis water and nothing else, anysensor with this purpose must be placed somewhere after the reverseosmosis membrane and somewhere before the first manipulative step inthe dialysis circuit. This means that the sensors can be a part of eitherthe purification unit, the dialysis machine or placed as separate units onthe water pipe between these two. A benefit with an integration of thesensors in the dialysis machine is that it is a later step and any possiblecontamination on the water’s way from the purification unit will be de-tected, while the advantage with adding it to the purification would bethat these units are more often designed for HHD use specifically.
45
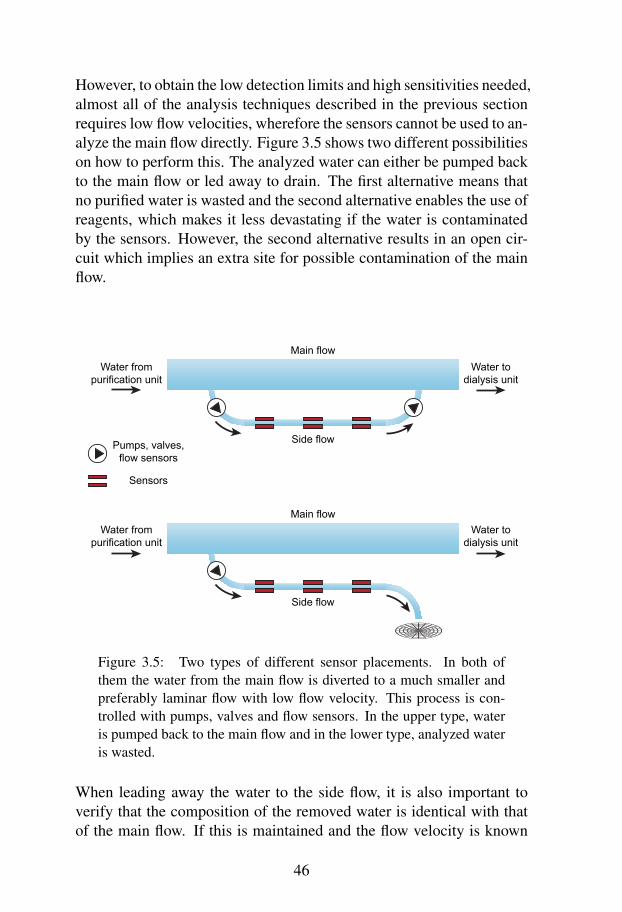
However, to obtain the low detection limits and high sensitivities needed,almost all of the analysis techniques described in the previous sectionrequires low flow velocities, wherefore the sensors cannot be used to an-alyze the main flow directly. Figure 3.5 shows two different possibilitieson how to perform this. The analyzed water can either be pumped backto the main flow or led away to drain. The first alternative means thatno purified water is wasted and the second alternative enables the use ofreagents, which makes it less devastating if the water is contaminatedby the sensors. However, the second alternative results in an open cir-cuit which implies an extra site for possible contamination of the mainflow.
Main flow
Main flow
Side flow
Side flow
Water from purification unit
Pumps, valves, flow sensors
Sensors
Water to dialysis unit
Water from purification unit
Water to dialysis unit
Figure 3.5: Two types of different sensor placements. In both ofthem the water from the main flow is diverted to a much smaller andpreferably laminar flow with low flow velocity. This process is con-trolled with pumps, valves and flow sensors. In the upper type, wateris pumped back to the main flow and in the lower type, analyzed wateris wasted.
When leading away the water to the side flow, it is also important toverify that the composition of the removed water is identical with thatof the main flow. If this is maintained and the flow velocity is known
46

with high accuracy, the concentrations in the sub-sampled side flow caneasily be calculated and thought to represent the concentrations of thetotal flow.
47

Chapter 4
Experimental Work
4.1 Choice of Analytical MethodSeveral aspects were considered when making the decision of whichtechnique to conduct in the following experimental work; fulfillmentof the requirements stated in chapter two, possibilities for developmentwithin this project, the time perspective and the interests of the authors.
Biosensors seemed like a suitable solution with high accuracy, on-linemonitoring capacity and relatively easy operation. However the timeand equipment needed to fabricate, develop and implement these typeof sensors together with the complexity of substrate attachment and sen-sitivity maximization made it improbable to fit within the boundaries ofthis thesis. One possibility would have been to use industrially manu-factured sensors, but no suitable were found.
As a matter of fact, any fabrication of microstructures would have beenpossible but too time-consuming to have enough remaining time toevaluate what have been fabricated. Therefore, construction of a uni-form micro channel without edges and roughness, needed for a sensi-tive coulter counter appeared unrealistic. Besides, the risk of cloggingand entrapment of contamination particles during the fabrication pro-cess is high and the process require ultrapure environment. These de-vice manufacturing complications were significant when choosing notto continue with the method due to the risk of not obtaining any results.However, the Department provided a regular size coulter counter, whichcould have been used for the tests but unfortunately it had been reported
48
to malfunction when used for bacteria counting. Ultimately, the coulterprinciple requires a conductive buffer for high sensitivity measurementsand does consequently not go very well with ultrapure water.
A continuation of both the total organic carbon and the total chlorineanalysis would involve the implementation and limitation testing of al-ready existing monitors. These devices are, however, rather expensiveand even if they could have been funded, the order times exceeded whatwas reasonable. However, it would be beneficial for Baxter to furtherinvestigate an implementation of these monitors to the existing WRO ina longer time perspective.
Finally, the choice fell on flow cytometry as a high quality cytometerwas available for experiments at the Department. Furthermore, fromthe specialization in nanobiomedicine the authors had already gainedsome knowledge and practice within flow cytometry and the associatedresult analysis. Beside these practical factors the method had promisingpotential to be further investigated and adjusted to the dialysis appli-cation. The limit of detection were sufficiently low, no reagents wereneeded, the approach could be conducted on-line in real time and thespecificity for bacteria could be investigated.
4.2 HypothesisAs a result of the conclusions in chapter 3, a hypothesis was constructedin order to be the basis of the experimental work:
”...to continuously detect bacteria in the preparation water for dialy-sis in concentrations below 100 CFU/ml with help of flow cytometrymeasurements detecting the bacterial autofluorescence.”
This hypothesis includes some requirements for the method. It shouldbe selective for bacteria, including different species and excluding othertypes of fluorescent particles. The found bacteria should be found inpreparation water for dialysis which means ultrapure water where theymight not survive for a longer time due to a hypotonic environment andabsence of nutrients. The method should also have a detection limit be-low 100 CFU/ml which makes it necessary to count only viable units.The bacteria should be discriminated by their autofluorescence as pri-
49

mary parameter.
4.3 Theory
4.3.1 Bacterial AutofluorescenceThe principle of autofluorescence is the natural emission of light whena molecule, without any dyes or markers added, is excited with radi-ation of suitable wavelength. The energy from the radiating photonsis absorbed and the molecule reaches an excited state with higher en-ergy. When returning to ground state the decrease in energy generatesan emission of photons with a specific wavelength, resulting in fluo-rescence. The released photons, the fluorescence, are always lower inenergy and hence have longer wavelength. The difference between theexcitation and emission wavelength depends upon the molecule.
Incident light Fluorescence
Internal conversion
Excited state energy levels
Ground state energy levels
Figure 4.1: Excitation of a fluorophore to a higher energy state throughradiation with a certain wavelength results in emission of fluorescentlight during the relaxation to the ground state.
Most cells contain intracellular components with autofluorescent behav-ior, these include aromatic amino acids, NADPH and flavins. These en-dogenous molecules with specific excitation and emission wavelengthscan be useful for biological detection and characterization. When il-luminated by the lasers within a flow cytometer they absorb some of
50
the radiation energy and dispose it by releasing photons. Flavins thatare important coenzymes in cellular metabolism have in their oxidizedform excitation and emission spectra at 450-490 and 500-560 nm re-spectively. Advantageously, the flavin emission spectra overlaps withthe commonly used fluorochrome FITC’s spectrum and their autofluo-rescence can hence be detected in the same wavelength interval.
Nevertheless, in microscopy and flow cytometry assays the autofluo-rescence are often considered as a problem due to an interference withcommonly used fluorescent labeled samples giving non-sensitive andblurry results. Consequently, the signals from autofluorescent moleculesare usually sorted away [46].
4.3.2 Flow CytometryThe flow cytometer is a diagnostic device for in vitro identification andenumeration of mainly biological material in suspension. Flow cytome-ters were originally designed for large eukaryotic cells, such as bloodcells, for medical analysis, diagnosis and research. Mostly when usedfor bacterial detection different fluorescent dyes or markers are used[59]. The apparatus consist of three main parts; a fluidic system, anoptical system and an electronic system to convert the signals.
The Fluidic System
Once placed into the cytometer the sample is pumped into the flow celland the suspended particles are hydrodynamically focused into a singlefile with help of a buffer, called the sheath fluid. The dimension of thesample stream can be controlled by adjusting the pressure differencesbetween the sheath fluid and the sample fluid. The particles in the sam-ple fluid are then passing the laser beams detachedly so that sensitivescattering and fluorescence signals can be generated.
The Optical System
At the laser interrogation point, the light is scattered in all directions.Both signals from the forward- and side-scattering are detected. Theforward-scattered light gives a measure of the particle size and the side-scattered light provides information of the granularity of the particle.Whereas the forward-scattered light move in the same direction as the
51
laser beam, the scattered light need to be directed by lenses throughbeam splitters and filters so that it reaches the photomultiplier tubes,PMTs, where it can be registered. Through division of the side-scatteredlight into wavelength intervals, any fluorescence of the particles can bedetected.
Generally, two types of filters can be used for the spectral division; longpass filters and band pass filters. The long pass filter transmits all lightwith wavelength longer than a certain number and either attenuates orreflects light with shorter wavelength. The band pass filter does insteadtransmit light only within a certain wavelength interval and reflects allother incident light. Through a very subtle placement and combinationof band pass and long pass filters, fluorescent light can be identifiedand separated for a number of common fluorophores in the visible lightspectrum.
The Electronic System
As mentioned above, a signal is generated when incident photons hit thePMTs and by adjusting the voltage of the tubes, very low signals can beamplified.
The registered signal pulse is thereafter transported to the electronicboard where the analog signal is converted to digital discrete data. Theanalog-digital-converter does this by sampling the signal in short timeintervals and assign each interval with a measured value.
These values are then adjusted in time to correspond to the correct spa-tial displacement of the excitation laser beams. Only when a pulse ex-ceed the preciously regulated threshold it is further processed by cal-culation of pulse height and area. The maximum digitized value corre-spond to the height whereas the pulse area is calculated by the sum ofall measurements within a time interval.
This sample data can be analyzed and provide all the information aboutparticle size, granularity and internal complexity. If several propertiesare detected simultaneously, information about every single particle canlater be used to divide the total amount of particles into several popula-tions and sub-populations with help of any proper software.
52
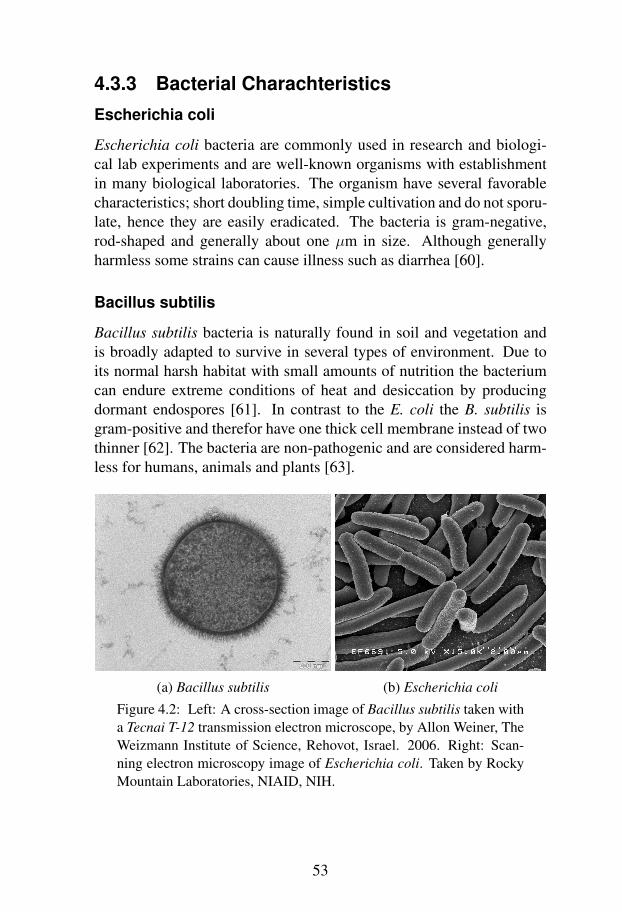
4.3.3 Bacterial CharachteristicsEscherichia coli
Escherichia coli bacteria are commonly used in research and biologi-cal lab experiments and are well-known organisms with establishmentin many biological laboratories. The organism have several favorablecharacteristics; short doubling time, simple cultivation and do not sporu-late, hence they are easily eradicated. The bacteria is gram-negative,rod-shaped and generally about one µm in size. Although generallyharmless some strains can cause illness such as diarrhea [60].
Bacillus subtilis
Bacillus subtilis bacteria is naturally found in soil and vegetation andis broadly adapted to survive in several types of environment. Due toits normal harsh habitat with small amounts of nutrition the bacteriumcan endure extreme conditions of heat and desiccation by producingdormant endospores [61]. In contrast to the E. coli the B. subtilis isgram-positive and therefor have one thick cell membrane instead of twothinner [62]. The bacteria are non-pathogenic and are considered harm-less for humans, animals and plants [63].
(a) Bacillus subtilis (b) Escherichia coli
Figure 4.2: Left: A cross-section image of Bacillus subtilis taken witha Tecnai T-12 transmission electron microscope, by Allon Weiner, TheWeizmann Institute of Science, Rehovot, Israel. 2006. Right: Scan-ning electron microscopy image of Escherichia coli. Taken by RockyMountain Laboratories, NIAID, NIH.
53
4.4 MethodIn order to investigate the possibilities to register and detect non-labeledbacteria by their autofluorescence, a testplan with several sub-experimentswas set up. Firstly, fluorescence labeled beads were analyzed to esti-mate the approximate size and find appropriate flow cytometer settings.Thereafter bacteria were stained and run in the flow cytometer to enablea comparison with unstained bacteria of the same strain. Two types ofbacteria were studied to confirm the hypothesis for more than one bacte-ria type. Different concentrations of the bacteria were analyzed aimingto detect very small amounts of bacteria as stated in the requirementanalysis. Also, a comparison of bacteria media was made to investigatethe difference between nutritionless ultrapure water and nutrient brothwhere the bacteria flourish. Additionally it was tested if it was pos-sible to discriminate live bacteria from dead with use of two separatefluorochromes.
4.4.1 EquipmentThe flow cytometer used within the experiments was the BD FAC-SCanto II. The apparatus can be configured with two or three laserswith the capacity to detect eight different colors together with forward-and side-scattering, giving detailed information about size, granularityand fluorescence of the sample.
The associated software, BD FACSDiva, counts the events in the flowand presents the results in graphical plots with eligible parameters onthe axis. With gating tools the user can find and identify different pop-ulations and compare the fluorescence strength. For small particles, asbacteria, the instrument settings are especially critical and the thresh-old level should be sufficient high to exclude background noise but lowenough to include the size of the bacteria. The signal amplification set-tings permit adjustment of bacteria population placement within the plotand to facilitate the threshold settings the population should be situatedin the center.
To analyze and gather the flow cytometer data the software packageFlowJo v.10 (from FlowJo LLC, Ashland, OR, USA) was used. Theprogram enables an easy procedure to collect and organize statistics by
54
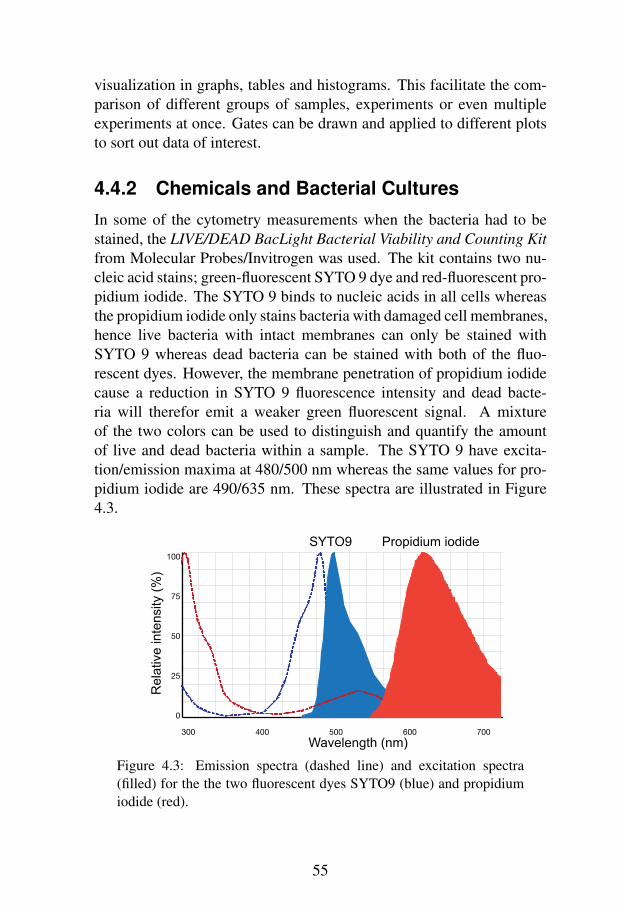
visualization in graphs, tables and histograms. This facilitate the com-parison of different groups of samples, experiments or even multipleexperiments at once. Gates can be drawn and applied to different plotsto sort out data of interest.
4.4.2 Chemicals and Bacterial CulturesIn some of the cytometry measurements when the bacteria had to bestained, the LIVE/DEAD BacLight Bacterial Viability and Counting Kitfrom Molecular Probes/Invitrogen was used. The kit contains two nu-cleic acid stains; green-fluorescent SYTO 9 dye and red-fluorescent pro-pidium iodide. The SYTO 9 binds to nucleic acids in all cells whereasthe propidium iodide only stains bacteria with damaged cell membranes,hence live bacteria with intact membranes can only be stained withSYTO 9 whereas dead bacteria can be stained with both of the fluo-rescent dyes. However, the membrane penetration of propidium iodidecause a reduction in SYTO 9 fluorescence intensity and dead bacte-ria will therefor emit a weaker green fluorescent signal. A mixtureof the two colors can be used to distinguish and quantify the amountof live and dead bacteria within a sample. The SYTO 9 have excita-tion/emission maxima at 480/500 nm whereas the same values for pro-pidium iodide are 490/635 nm. These spectra are illustrated in Figure4.3.
SYTO9 Propidium iodide
Wavelength (nm)
Figure 4.3: Emission spectra (dashed line) and excitation spectra(filled) for the the two fluorescent dyes SYTO9 (blue) and propidiumiodide (red).
55
Two different bacteria strains were provided and used to evaluate andvalidate the method. The Escherichia coli, E.coli DH5alfa, acquiredfrom the Department of Biomedical Engineering at Lund Universitywere genetically modified with a constructed plasmid to achieve ampi-cillin resistance. Due to its antibiotic resistance contamination by otherbacteria strains can be avoided by adding antibiotic to the samples. TheBacillus subtilis strain, CCUG 10779, from Culture Collection at Uni-versity of Goteborg was not genetically modified to resist antibiotics,wherefore several risk assessments were necessary prior to use. Bothbacteria strains can be considered non-pathogenic thus categorized inrisk class 1 [64].
4.4.3 Experimental ProcessesBacterial Growth
To cultivate bacteria in a laboratory, a growth medium containing pro-teins, salts and growth enhancers that will support the bacteria are needed.In this project lysogeny broth, LB, was prepared, followed by the bac-teria cultivation in the following steps:
1. LB-medium was prepared by mixing tryptone, yeast extract andNaCl in analytical grade milliQ water and later autoclaved.
2. Frozen bacteria were thawed and added to falcon tubes with LB-medium. Sterile pipette tips with filters were used during all ex-periments to avoid any contamination.
3. The tubes were incubated at 37◦C in oven for approximately 24h.The tube lids were not tightened of to enable air circulation andoxygen supply.
Successfully grown bacteria culture was seen as an increase in turbidity.Since both bacteria strains are facultative anaerobes they gathered to acertain extent at the surface, forming a thin layer. The B. subtilis due toits endosporic nature formed a considerably more dense layer of bacte-ria, making the suspension harder to dissolve and less homogeneous.
Washing and Staining of Bacteria
The bacteria staining processes followed two different protocols. Thefirst was provided by staff at BME and further refined to fit the measure-ments in this project. The general steps are listed below though varyingin recurrence and performance time:
56

1. Washing by centrifugation, removal of supernatant and resuspen-sion in filtered NaCl (9 g/l),
2. addition of dyes; SYTO9 and/or propidium iodide,3. incubation of samples at room temperature in a dark space,4. repetition of the washing procedure,5. dilution to the desired level with either MilliQ-water, NaCl (9
g/l) or PBS+BSA (phosphate buffered saline plus bovine serumalbumin),
6. dark and cool storage of the samples in refrigerator until analyzedin the flow cytometer to prevent bacterial growth or bleaching ofthe fluorophores.
The second protocol was the standard procedure for flow cytometryfrom the LIVE/DEAD BacLight staining kit manual and was used whenaccomplish the viability tests [65].
Flow Cytometry Measurements - General Settings
In the present study the settings of the FACSCanto II were alternatedand analyzed to find the most appropriate ones. However, some settingswere fixed for all measurements unless anything else stated.
The flow speed was set to the lowest possible,∼ 10 µl/min, to maximizeevent detection and measurement sensitivity. The actual flow speed issomewhat uncertain since the flow is pressure regulated which resultsin varying flow rates for varying densities. Since many measurementswere to be performed, the recording time was limited to 30 seconds.
Threshold limits were set on both scattering measurements, FSC (Forward-Scattering) and SSC (Side-scattering), to 200 to reduce signal noisesince data below this boundary will not be acquired. During the ex-periments the solutions were stored in dark and mostly in refrigerator,and sonication was performed immediately prior to analysis.
Flow Cytometry Measurements - Autofluorescence
In order to investigate if bacterial detection by their autofluorescence ispossible, unstained and stained bacteria of the same strain were com-pared. Firstly E. coli were stained with the previously described nucleicdye SYTO 9. To detect the fluorescence the FITC detector with a 530/30
57
band pass filter was used. The same detector was used for the unstainedbacteria since the autofluorescence of the flavins is more or less in thesame spectrum. Thereafter the same procedure was preformed with theB. subtilis. The population gate in forward- and side-scattering inten-sities for the bacteria was set after the stained bacteria since it couldeasily be detected through its fluorescence. The same gate were thenused for the subsequent experiments with unstained bacteria to studywhether any autofluorescence could be detected.
Flow Cytometry Measurements - Concentration Determina-tion
With the purpose to investigate how low concentrations the FACSCantoII could detect, an assay was set up to count the number of bacteriathrough forward- and side-scattering events.
Firstly, high concentrated bacteria suspensions of unstained B. subtilisand E. coli with visible turbidity were prepared and diluted in steps of1:10, until diluted 1:104. The high concentrations were used to simplifycharacterization of the registered events as bacteria through gating. Ifthe total count of a sample was not high enough to exceed the least-event-limit of the flow cytometer, no results were recorded. If so hap-pened, the recording time was increased to 60 or 120 seconds to enablegathering of data of these samples.
Concentration Determination of CFUs/ml on Agar Plates
A method of counting colony forming units grown on agar plates wascarried out to control the concentration of the analyzed samples as acomparison to the flow cytometry results. The TGEA Agar Plates wereacquired from Baxter together with instructions for bacteria handlingand the plate count procedure. The process was conducted in the fol-lowing steps:
1. Dilution of the bacteria solution until weak turbidity is reached,indicating a concentration of 105 - 106 CFU/ml,
2. repetition of the dilution in steps of 1:10 until reaching concen-tration of approximately 100 CFU/ml,
3. distribution of each dilution sample, ranging from 100 to 105 - 106
CFU/ml, on the agar plates until the surface of the plates are dry,
58
4. incubation at 37◦C for about 48 hours,5. counting of appeared colonies. The appearance and morphology
of the colonies should be similar for the same type of bacteria,hence a deviation in morphology indicates of a contamination.
.
Flow Cytometry Measurements - Comparison Between Bac-teria in Ultrapure Water and Isotonic Buffer
To investigate whether the solution media impacts the measurements ornot in terms of background fluorescence and impact of bacterial size, acomparison of nutritionless ultrapure water and isotonic buffer was con-ducted. The ultrapure water was conceived from a Milli-Q water systemwhile the isotonic buffer was prepared by filtration of NaCl in Milli-Qwater together with bovine serumalbumin. The same concentration ofbacteria was used for two different suspensions and later on run in theFACSCanto II.
Flow Cytometry Measurements - Viability
To quantitatively discriminate live and dead bacteria within a sample aviability assay was conducted. The instructions from the LIVE/DEADBacLight Bacterial Viability Kit with some modifications were followedin the subsequent steps for B. subtilis and E. coli independently:
1. The bacteria suspensions were washed as in the previous exper-iments and divided into to equal amounts in two separate tubes.Thereafter, 95 % analytical grade ethanol was added to one of thetubes and incubated for one hour, with the intention to kill thebacteria. The same volume of NaCl solution was added to thesecond tube to keep the bacteria alive.
2. Live and dead bacteria suspensions were mixed with the follow-ing ratios; 0:100, 20:80, 40:60, 60:40, 80:20 and 100:0, with atotal volume of 1 mL.
3. The two fluorescence dyes; SYTO 9 and propidium iodide, weremixed and added to all of the bacteria samples. The samples werethen incubated in dark for 15 minutes.
Since no 70% isopropyl alcohol (recommended in the manual) wasavailable, 95% ethanol was used instead.
59
During the flow cytometry, FITC (530/30 BP filter) and Per-CP (670LP filter) detectors were used to register the fluorescence from the twodyes, SYTO 9 and propidium iodide, respectively.
4.5 ResultsThe results from the flow cytometry measurements are presented ingraphic dot-plots. The acquired plots represent two parameters whereeach axis corresponds to the intensity of the selected parameter and eachdot in the plot represents one registered event, with scattered intensitieshigh enough to exceed the threshold values. In most cases logarithmicaxes are used to allow all dots to be visualized in the window.
4.5.1 Flow Cytometry Measurements - Autofluo-rescence
One example of many performed flow cytometry measurements, thatshould prove the relation between the fluorescence from stained bacteriaand the intrinsic fluorescence from unstained bacteria, is presented inFigure 4.4.
60
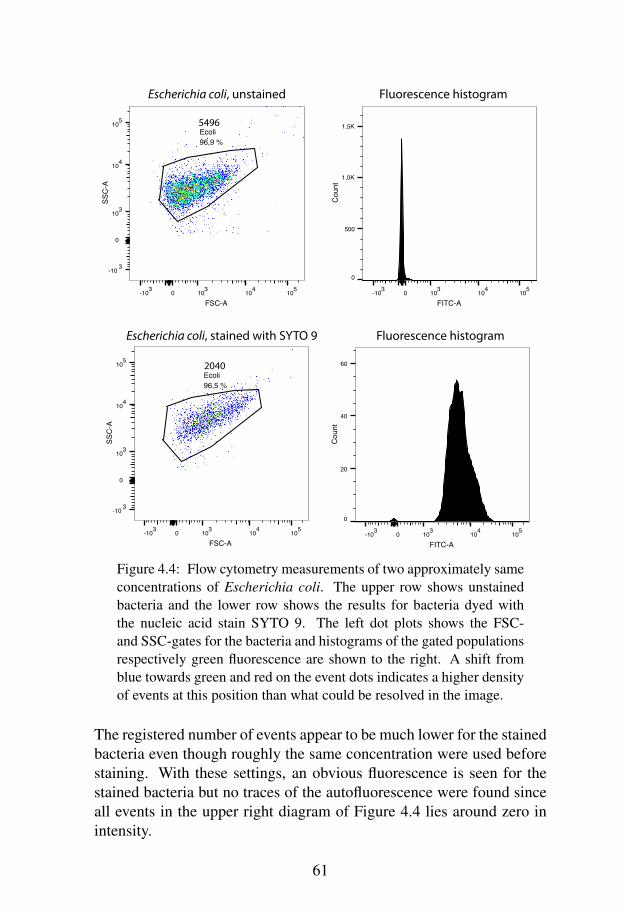
0-103 103 104 105
FITC-A
0
20
40
60
Cou
nt
Ecoli96,5 %
0-103 103 104 105
FSC-A
0
-10 3
103
104
105
SSC
-A
Ecoli96,9 %
0-103 103 104 105
FSC-A
0
-10 3
103
104
105
SSC
-A
0-103 103 104 105
FITC-A
0
500
1,0K
1,5K
Cou
nt
5496
2040
Escherichia coli, unstained
Escherichia coli, stained with SYTO 9 Fluorescence histogram
Fluorescence histogram
Figure 4.4: Flow cytometry measurements of two approximately sameconcentrations of Escherichia coli. The upper row shows unstainedbacteria and the lower row shows the results for bacteria dyed withthe nucleic acid stain SYTO 9. The left dot plots shows the FSC-and SSC-gates for the bacteria and histograms of the gated populationsrespectively green fluorescence are shown to the right. A shift fromblue towards green and red on the event dots indicates a higher densityof events at this position than what could be resolved in the image.
The registered number of events appear to be much lower for the stainedbacteria even though roughly the same concentration were used beforestaining. With these settings, an obvious fluorescence is seen for thestained bacteria but no traces of the autofluorescence were found sinceall events in the upper right diagram of Figure 4.4 lies around zero inintensity.
61
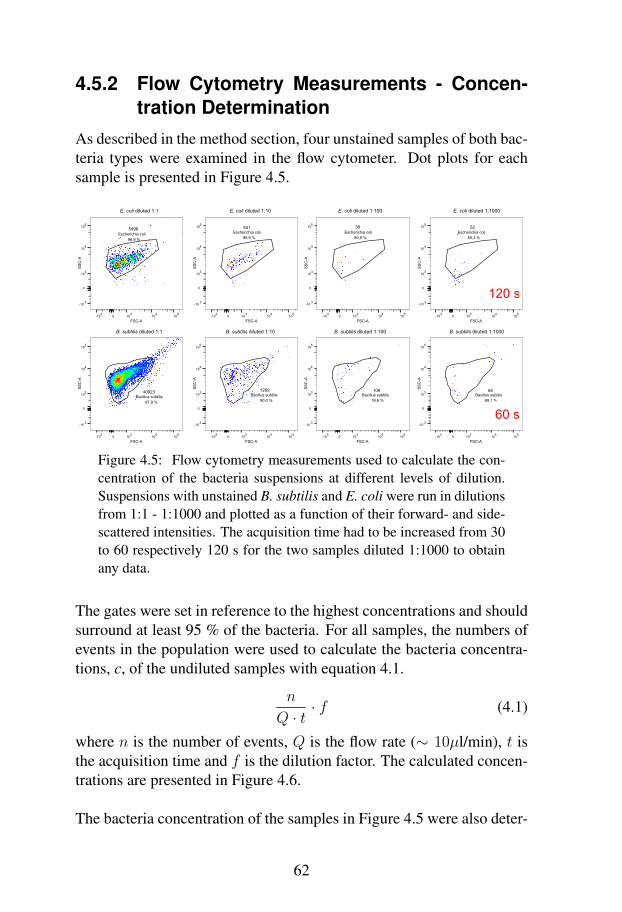
4.5.2 Flow Cytometry Measurements - Concen-tration Determination
As described in the method section, four unstained samples of both bac-teria types were examined in the flow cytometer. Dot plots for eachsample is presented in Figure 4.5.
Bacillus subtilis97,9 %
0-103 103 104 105
FSC-A
0
-10 3
103
104
105
SSC
-A
Bacillus subtilis90,0 %
0-103 103 104 105
FSC-A
0
-10 3
103
104
105
SSC
-A
Bacillus subtilis76,6 %
0-103 103 104 105
FSC-A
0
-10 3
103
104
105
SSC
-A
Bacillus subtilis69,1 %
0-103 103 104 105
FSC-A
0
-10 3
103
104
105
SSC
-A
Escherichia coli96,9 %
0-103 103 104 105
FSC-A
0
-10 3
103
104
105
SSC
-A
Escherichia coli95,9 %
0-103 103 104 105
FSC-A
0
-10 3
103
104
105
SSC
-A
Escherichia coli80,9 %
0-103 103 104 105
FSC-A
0
-10 3
103
104
105
SSC
-A
Escherichia coli55,3 %
0-103 103 104 105
FSC-A
0
-10 3
103
104
105
SSC
-A60 s
120 s
5496 541 38 52
40923 1269 108 65
E. coli diluted 1:1
B. subtilis diluted 1:1
E. coli diluted 1:10
B. subtilis diluted 1:10
E. coli diluted 1:100
B. subtilis diluted 1:100
E. coli diluted 1:1000
B. subtilis diluted 1:1000
Figure 4.5: Flow cytometry measurements used to calculate the con-centration of the bacteria suspensions at different levels of dilution.Suspensions with unstained B. subtilis and E. coli were run in dilutionsfrom 1:1 - 1:1000 and plotted as a function of their forward- and side-scattered intensities. The acquisition time had to be increased from 30to 60 respectively 120 s for the two samples diluted 1:1000 to obtainany data.
The gates were set in reference to the highest concentrations and shouldsurround at least 95 % of the bacteria. For all samples, the numbers ofevents in the population were used to calculate the bacteria concentra-tions, c, of the undiluted samples with equation 4.1.
n
Q · t· f (4.1)
where n is the number of events, Q is the flow rate (∼ 10µl/min), t isthe acquisition time and f is the dilution factor. The calculated concen-trations are presented in Figure 4.6.
The bacteria concentration of the samples in Figure 4.5 were also deter-
62

mined through standard plate counting. The number of colonies visibleon each plate is reported in table 4.1
E.coli (unstained) CFU/plate B.subtilis (unstained) CFU/plate1:1 >1000 1:1 >10001:10 >1000 1:10 >10001:100 >200 1:100 >2001:1000 54 1:1000 41
Table 4.1: The results from the concentration determination throughplate counting for the same suspensions as used in Figure 4.5. Thenumber of colony forming units grown on agar plates were counted forunstained bacteria, Escherichia coli and Bacillius subtilis, with fourdifferent dilutions.
From these counts the concentration of the undiluted sample (1:1) couldeasily be determined by division with the used volume and multiplica-tion with the dilution factor. Concentrations should be calculated fromplates with 30-300 CFUs and the best suited for this were the the onesdiluted 1:1000 for both bacteria types.
cE.c. =54
0.100 ml· 1000 = 5.4 · 105 CFU/ml
cB.s. =41
0.100 ml· 1000 = 4.1 · 105 CFU/ml
0
1
2
3
4
5
6
7
8
9x 10⁶
Measurement
Bact
eria
con
cent
ratio
n (u
nits
/ml)
1:1 1:10 1:100 1:1000 Plate counts0.5
1
1.5
2
2.5
3x 10⁶
Measurement
Bact
eria
con
cent
ratio
n (u
nits
/ml)
E. coli concentrations for undiluted suspensionsB.subtilis concentrations for undiluted suspensions
1:1 1:10 1:100 1:1000 Plate counts
Figure 4.6: A plot over the calculated concentrations of both bacteriathrough both flow cytometry and standard plate counting. Which mea-surement that was regarded for which concentration is marked on thex-axis.
63
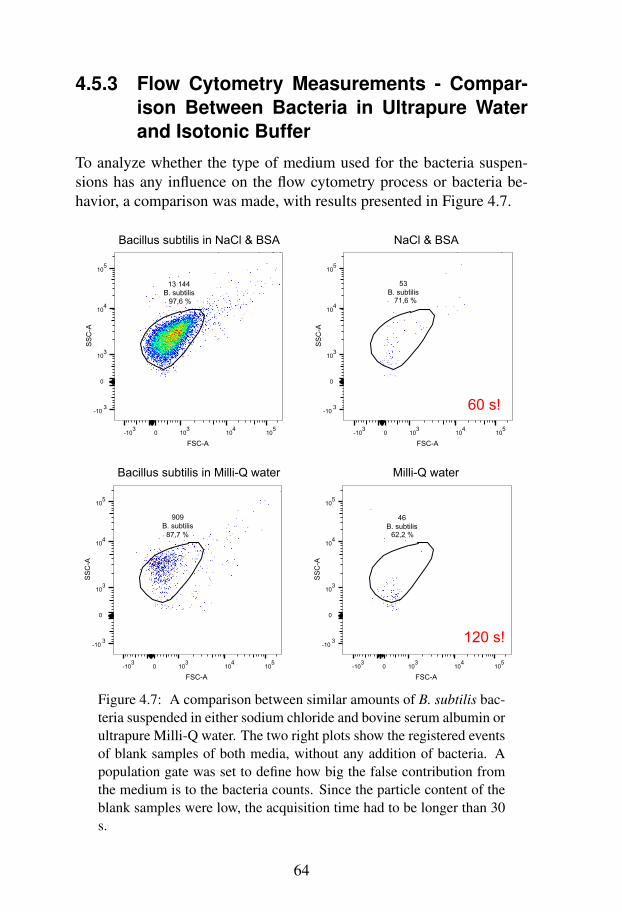
4.5.3 Flow Cytometry Measurements - Compar-ison Between Bacteria in Ultrapure Waterand Isotonic Buffer
To analyze whether the type of medium used for the bacteria suspen-sions has any influence on the flow cytometry process or bacteria be-havior, a comparison was made, with results presented in Figure 4.7.
13 144B. subtilis
97,6 %
0-103 103 104 105
FSC-A
0
-10 3
103
104
105
SSC
-A
53B. subtilis
71,6 %
0-103 103 104 105
FSC-A
0
-10 3
103
104
105
SSC
-A
909B. subtilis87,7 %
0-103 103 104 105
FSC-A
0
-10 3
103
104
105
SSC
-A
46B. subtilis
62,2 %
0-103 103 104 105
FSC-A
0
-10 3
103
104
105
SSC
-A
Bacillus subtilis in NaCl & BSA NaCl & BSA
Bacillus subtilis in Milli-Q water Milli-Q water
60 s!
120 s!
Figure 4.7: A comparison between similar amounts of B. subtilis bac-teria suspended in either sodium chloride and bovine serum albumin orultrapure Milli-Q water. The two right plots show the registered eventsof blank samples of both media, without any addition of bacteria. Apopulation gate was set to define how big the false contribution fromthe medium is to the bacteria counts. Since the particle content of theblank samples were low, the acquisition time had to be longer than 30s.
64
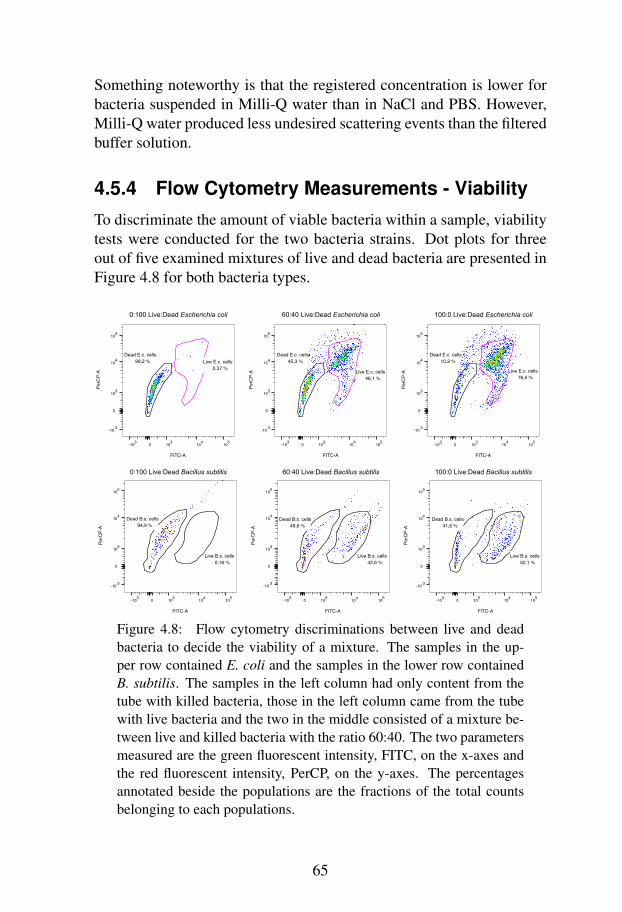
Something noteworthy is that the registered concentration is lower forbacteria suspended in Milli-Q water than in NaCl and PBS. However,Milli-Q water produced less undesired scattering events than the filteredbuffer solution.
4.5.4 Flow Cytometry Measurements - ViabilityTo discriminate the amount of viable bacteria within a sample, viabilitytests were conducted for the two bacteria strains. Dot plots for threeout of five examined mixtures of live and dead bacteria are presented inFigure 4.8 for both bacteria types.
Dead E.c. cells99,2 % Live E.c. cells
0,37 %
0-103 103 104 105
FITC-A
0
-10 3
103
104
105
PerC
P-A
Dead E.c. cells45,3 %
Live E.c. cells46,1 %
0-103 103 104 105
FITC-A
0
-10 3
103
104
105
PerC
P-A
Dead E.c. cells10,2 %
Live E.c. cells76,5 %
0-103 103 104 105
FITC-A
0
-10 3
103
104
105
PerC
P-A
Dead B.s. cells94,9 %
Live B.s. cells0,16 %
0-103 103 104 105
FITC-A
0
-10 3
103
104
105
PerC
P-A
Dead B.s. cells49,6 %
Live B.s. cells42,6 %
0-103 103 104 105
FITC-A
0
-10 3
103
104
105
PerC
P-A
Dead B.s. cells41,6 %
Live B.s. cells52,1 %
0-103 103 104 105
FITC-A
0
-10 3
103
104
105
PerC
P-A
0:100 Live:Dead Escherichia coli 60:40 Live:Dead Escherichia coli 100:0 Live:Dead Escherichia coli
0:100 Live:Dead Bacillus subtilis 60:40 Live:Dead Bacillus subtilis 100:0 Live:Dead Bacillus subtilis
Figure 4.8: Flow cytometry discriminations between live and deadbacteria to decide the viability of a mixture. The samples in the up-per row contained E. coli and the samples in the lower row containedB. subtilis. The samples in the left column had only content from thetube with killed bacteria, those in the left column came from the tubewith live bacteria and the two in the middle consisted of a mixture be-tween live and killed bacteria with the ratio 60:40. The two parametersmeasured are the green fluorescent intensity, FITC, on the x-axes andthe red fluorescent intensity, PerCP, on the y-axes. The percentagesannotated beside the populations are the fractions of the total countsbelonging to each populations.
65

The number of registered events in each population was then used to de-cide the proportion of live bacteria by dividing the numbers of events inthe live population with the sum of events in the both gates. All eventsthat lie outside the two gates are considered to be uncharacterized andare not included in the viability estimation.
The viability estimation is made through a comparison of the live pro-portions measured with flow cytometry and the intended fractions oflive cells of the mixing process. A graphical presentation of this com-parison can be viewed in Figure 4.9
0 0.1 0.2 0.3 0.4 0.5 0.6 0.7 0.8 0.9 10
0.1
0.2
0.3
0.4
0.5
0.6
0.7
0.8
0.9
1
Known fraction of live bacteria Known fraction of live bacteriaKnown fraction of live bacteria
Mea
sure
d fra
ctio
n of
live
bac
teria
Mea
sure
d fra
ctio
n of
live
bac
teria
0 0.1 0.2 0.3 0.4 0.5 0.6 0.7 0.8 0.9 10
0.1
0.2
0.3
0.4
0.5
0.6
0.7
0.8
0.9
1
Live/Dead discrimination of Escherichia coli Live/Dead discrimination of Bacillus subtilis
Figure 4.9: An estimation of the measured viabilities for E. coli re-spectively B. subtilis in relation to the known viability plotted as starsfor the five different fractions. ”Known” viability is in this case de-fined as the ratio between added amount of live bacteria suspensionand killed bacteria suspension. The filled line shows the least square fitof the points and when extrapolating it to the expected values (dashedline) an estimation of the amount of dead bacteria in the live suspen-sion is obtained. If evaluating the graphs above, these values are 11 %for E. coli and 43 % for B. subtilis.
With this data in mind, it is clear that the E. coli mixtures generateda more linear viability distribution curve than the B. subtilis mixtures.The measured live content of the initial bacteria suspensions were alsohigher for E. coli with 89 % compared to 57 % for B. subtilis.
66
4.6 Discussion
4.6.1 Preparation of Bacteria SuspensionsFor more predictable results, the initial concentration of bacteria sus-pension could have been estimated by measuring the optical density ofthe suspension with a spectrophotometer prior to preparation. Since thisequipment was not available to use in this project it was a bit uncertainif the adequate amount of stain was used for each sample.
Additionally, bacteria are living organisms that divide and increase innumber under the right conditions. This phenomenon makes it some-what harder to decide the concentration of bacteria in solution throughflow cytometry as it changes if a sample is stored in room temperatureor if it contains nutrients. It is not known how much influence this hadon the concentration measurements in this project but the aim was al-ways to reduce the effect by performing the measurements as soon aspossible after the sample preparation and if not possible, storing them ina refrigerator for a short time. For further measurements a bacteriostat-ica such as sodium azide, NaN3, can be used to prevent bacterial growthafter preparation, thus resulting in difficulties with plate counting com-parisons.
4.6.2 AutofluorescenceFrom the autofluorescence experiments one can conclude that detectionof bacteria by their autofluorescence is hardly executed with the FAC-SCanto II since the fluorescent intensity peak for the unstained samplesis found around zero, as displayed in Figure 4.4.
To succeed with the detection, it would be preferable with a muchlower flow rate and a more sensitive and accurate apparatus, like theone used in the previously cited study [46]. A lower flow rate increasesthe excitation time of each bacteria and would facilitate the detectionof the autofluorescence signal. Additionally, it would be favorable tocalibrate the PMT amplification of the autofluorescence signals withnon-fluorescent particles and particles with known fluorescence inten-sity. In this study, no such calibration was performed and adjustment ofthe PMT voltage was only done with respect to the strong fluorescentsignal from the stained samples. However, even with the current equip-
67
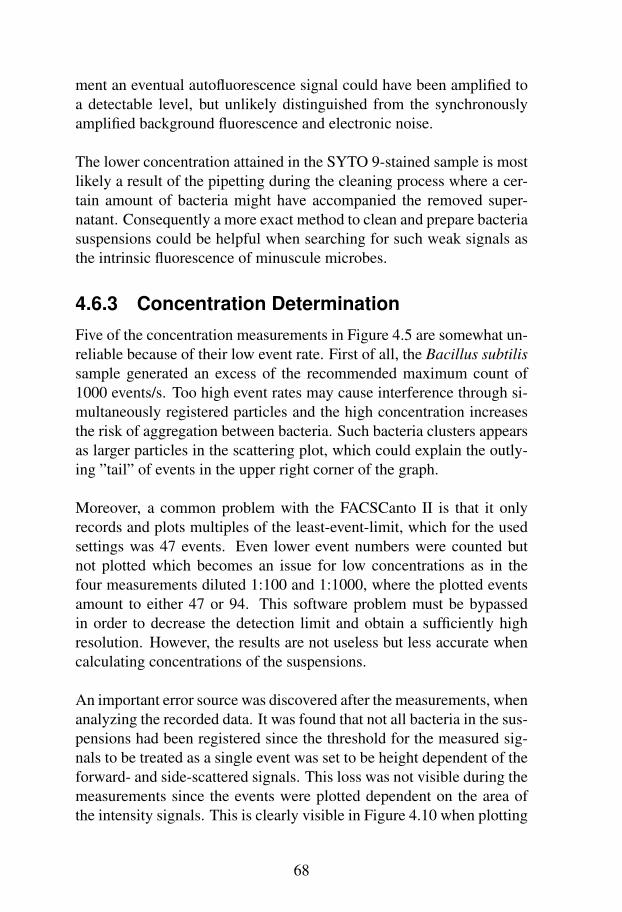
ment an eventual autofluorescence signal could have been amplified toa detectable level, but unlikely distinguished from the synchronouslyamplified background fluorescence and electronic noise.
The lower concentration attained in the SYTO 9-stained sample is mostlikely a result of the pipetting during the cleaning process where a cer-tain amount of bacteria might have accompanied the removed super-natant. Consequently a more exact method to clean and prepare bacteriasuspensions could be helpful when searching for such weak signals asthe intrinsic fluorescence of minuscule microbes.
4.6.3 Concentration DeterminationFive of the concentration measurements in Figure 4.5 are somewhat un-reliable because of their low event rate. First of all, the Bacillus subtilissample generated an excess of the recommended maximum count of1000 events/s. Too high event rates may cause interference through si-multaneously registered particles and the high concentration increasesthe risk of aggregation between bacteria. Such bacteria clusters appearsas larger particles in the scattering plot, which could explain the outly-ing ”tail” of events in the upper right corner of the graph.
Moreover, a common problem with the FACSCanto II is that it onlyrecords and plots multiples of the least-event-limit, which for the usedsettings was 47 events. Even lower event numbers were counted butnot plotted which becomes an issue for low concentrations as in thefour measurements diluted 1:100 and 1:1000, where the plotted eventsamount to either 47 or 94. This software problem must be bypassedin order to decrease the detection limit and obtain a sufficiently highresolution. However, the results are not useless but less accurate whencalculating concentrations of the suspensions.
An important error source was discovered after the measurements, whenanalyzing the recorded data. It was found that not all bacteria in the sus-pensions had been registered since the threshold for the measured sig-nals to be treated as a single event was set to be height dependent of theforward- and side-scattered signals. This loss was not visible during themeasurements since the events were plotted dependent on the area ofthe intensity signals. This is clearly visible in Figure 4.10 when plotting
68
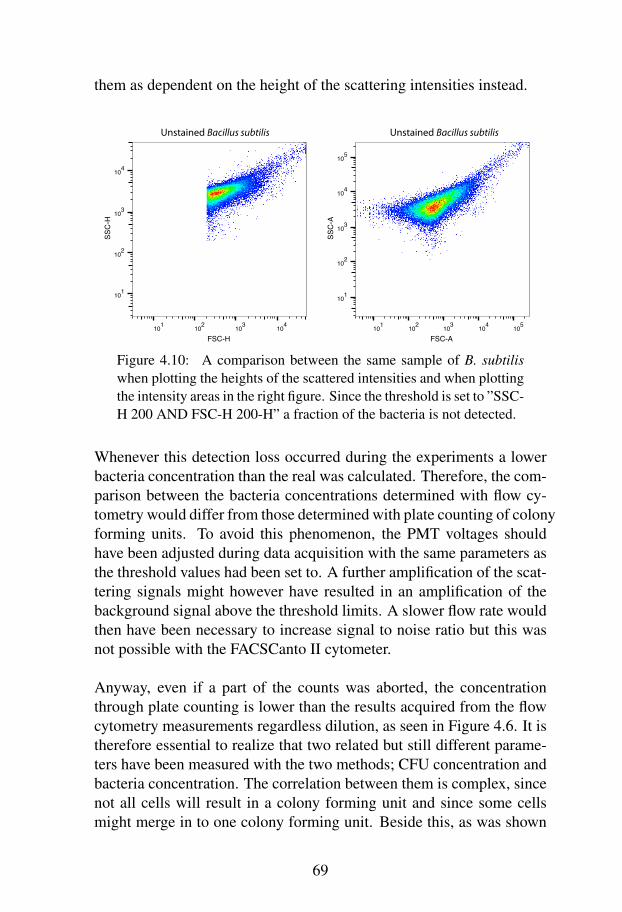
them as dependent on the height of the scattering intensities instead.
101 102 103 104
FSC-H
101
102
103
104
SSC
-H
101 102 103 104 105
FSC-A
101
102
103
104
105
SSC
-A
Unstained Bacillus subtilis Unstained Bacillus subtilis
Figure 4.10: A comparison between the same sample of B. subtiliswhen plotting the heights of the scattered intensities and when plottingthe intensity areas in the right figure. Since the threshold is set to ”SSC-H 200 AND FSC-H 200-H” a fraction of the bacteria is not detected.
Whenever this detection loss occurred during the experiments a lowerbacteria concentration than the real was calculated. Therefore, the com-parison between the bacteria concentrations determined with flow cy-tometry would differ from those determined with plate counting of colonyforming units. To avoid this phenomenon, the PMT voltages shouldhave been adjusted during data acquisition with the same parameters asthe threshold values had been set to. A further amplification of the scat-tering signals might however have resulted in an amplification of thebackground signal above the threshold limits. A slower flow rate wouldthen have been necessary to increase signal to noise ratio but this wasnot possible with the FACSCanto II cytometer.
Anyway, even if a part of the counts was aborted, the concentrationthrough plate counting is lower than the results acquired from the flowcytometry measurements regardless dilution, as seen in Figure 4.6. It istherefore essential to realize that two related but still different parame-ters have been measured with the two methods; CFU concentration andbacteria concentration. The correlation between them is complex, sincenot all cells will result in a colony forming unit and since some cellsmight merge in to one colony forming unit. Beside this, as was shown
69
in the viability measurements, the bacteria suspensions commonly con-tain a proportion of dead cells and only live cells can reproduce.
The fact that the percentage of events inside the gates, belonging to thebacteria population, decreases with lower concentrations indicates that acertain amount of noise is registered in each acquisition. The noise levelcould preferably be confirmed and taken into account through slightlylonger background measurements of the medium.
4.6.4 Comparison Between Bacteria in UltrapureWater and Isotonic Buffer
For some reason the bacteria concentration was significantly lower whensuspended in Milli-Q water than in NaCl and BSA. The difference ismost likely an effect of an improper cleaning process as already de-scribed in section 4.6.2. Less likely but still reasonable theories areeither that the hypotonicity of the Milli-Q water has increased the in-ternal osmotic pressure of the cells and caused lysis of a proportion ofthem or that the environment of the bacteria in NaCl and BSA containednutrients enough to allow cell division.
However, these are only guesses and more measurements with samemethod at different occasions must be performed to obtain any statisti-cal significance and to verify if the effect is reproduced.
If considering the two blank samples, they still generated particle countsboth inside and outside of the bacteria gate. It is always hard to saywithout further investigations if these background signals belong to ac-tual particle contamination of the medium or if it comes from electronicnoise. Nevertheless, the Milli-Q water claimed a lower background con-tent than the NaCl-BSA-solution and can therefore be considered purer.The Milli-Q water was thought to exemplify the WRO water for thedialysis application whereas the NaCl-BSA-solution was prepared tonourish the bacteria.
4.6.5 ViabilityTwo rather distinct populations could be identified for both bacteriaeven though a somewhat too high amount of events landed up in the
70
outlying and uncharacterized region. Since the gates were set manu-ally, this could have been prevented by including more events in theregions but that would probably have lead to inclusion of false counts tothe population in a higher extent. Thus, more explicit constrains wouldhave been useful when deciding the sizes and shapes of the populationgates.
According to the calculations, some dead bacteria were found also inthe live sample and B. subtilis had a larger part of dead bacteria, mostlikely due to issues during the cultivation. It should also be mentionedthat the straight line approximation to the live proportion values in Fig-ure 4.9 is not fitting especially well. Besides, determination of deadcontent in the live suspension through extrapolation of the 100 % livevalue of the fitted straight line to the theoretical value is not as accuratewhen the line is far from passing origo.
In contrast, the results from the E. coli measurements were both lin-ear and behaved to a greater extent as expected in the viability test. Thereason for this might be caused by the difference of the bacterial cellmembrane structure. The gram-positive B. subtilis have one thick cellmembrane whereas the gram-negative E. coli have two thinner mem-branes. This structural difference might affect the penetration level ofthe nucleic dyes resulting in variations in fluorescence between the twobacterial strains.
Since the dyes bind to the DNA within the bacterial cell, the emissionproperties change when both dyes are present due to displacement ofthe fluorescent molecules [66]. This occur for the dead bacteria withdamaged cell membrane and because of the presence of both dyes theSYTO 9 signal is somewhat reduced for the dead bacteria which can beseen as a lower FITC intensity for the killed bacteria in Figure 4.8.
Due to the absence of the appropriate propidium iodide filter the filterfor PerCP was used instead. This filter is not optimal for the propidiumiodide fluorescence even though the emission intervals overlap. As adirect consequence the intensity is lower than expected and it is diffi-cult to separate the contribution of the broad SYTO 9 emission fromthe PI emission in the detected red fluorescence. Especially since therewere problems with the used compensation protocol that should prevent
71
cross-signal of one dye into another dye’s channel. This is probably anexplanation to why the live cell populations appear to have not onlyhigher fluorescence in the FITC interval but also in the Per-CP intervaleven though it was not stained with any red fluorophore.
Also the usage of the word ”dead” demands careful deliberation in thiscontext. The propidium iodide dye stains bacteria cells with non-intactcell membrane which certainly is a sign of less viability of the organ-ism but does not assure that it can not recover or reproduce under anycircumstances.
4.7 ConclusionDuring this experimental part of the project, many lessons were learnedabout the possibilites but also the difficulties involved when using flowcytometry for bacteria detection and water quality analysis. The ex-tremely low detection limit needed for dialysis purposes puts the prob-lem in a needle-in-haystack position. Also, bacterial autofluorescencedetection require extremely fine-tuned equipment and it can be difficultto distinguish bacteria from similarly sized particles. On the other hand,no such objects should exist in the highly purified water, and the flowcytometer could work as a warning bell for issues with the purificationprocess that has lead to this existence.
However, flow cytometry as a method is superior to standard plate count-ing in the aspect of analysis time. Furthermore, additional informationabout size, populations and ratios can be acquired forming a technicalquantitative microbial analysis method.
Even if flow cytometry will not be used for on-line measurements inhome hemodialysis in the nearest future, it is a good challenger to pushdown the plate counting method from its pronounced hold of the throneof microbiological quantification methods. However, to be practicablefor routine analysis the method need to be fully automated, smaller,cheaper and more sensitive for bacteria application.
72

Bibliography
[1] Baxter International. (2015) About Baxter. Accessed date: 2016-06-30. [Online]. Available: http://www.baxter.com/inside-baxter/about/overview/corporate.page?
[2] National Kidney Foundation. (2015) ABOUT CHRONIC KIDNEY DISEASE.Accessed date: 2016-10-17. [Online]. Available: https://www.kidney.org/atoz/content/dialysisinfo
[3] A. Hedayat, J. Szpunar, N. A. P. K. Kumar, R. Peace, H. Elmoselhi, andA. Shoker, “Morphological Characterization of the Polyflux 210H HemodialysisFilter Pores,” International Journal of Nephrology, vol. 2012, 2012, Accesseddate: 2016-10-24. [Online]. Available: http://dx.doi.org/10.1155/2012/304135
[4] S. Ramin, “Hemodialysis: Diffusion and Ultrafiltration,” Austin J Nephrol Hy-pertens, vol. 1, no. 1010, 2014, Accessed date: 2016-10-24. [Online]. Available:http://austinpublishinggroup.org/nephrology/fulltext/ajnh-v1-id1010.php
[5] M. S. MacGregor, J. W. M. Agar, and C. R. Blagg, “Home haemodialy-sis—international trends and variation,” Nephrology Dialysis Transplantation,vol. 21, no. 7, pp. 1934–1945, 2006, Accessed date: 2016-10-24. [Online].Available: http://ndt.oxfordjournals.org/content/21/7/1934.abstract
[6] “ISO:13959, Water for Haemodialysis and Related Therapies,” International Or-ganization of Standardizations, Standard, 2014.
[7] H. Nicholas and A. W. Richard, “Contaminants in water used for hemodialysis,”Accessed date: 2016-10-24. [Online]. Available: http://www.uptodate.com/contents/contaminants-in-water-used-for-hemodialysis?source=related link
[8] “ALUMINIUM POISONING: DIALYSIS ENCEPHALOPATHY, OSTEOMA-LACIA, AND ANAEMIA,” The Lancet, vol. 322, no. 8340, pp. 29 – 34, 1983,Accessed date: 2016-10-24.
[9] R. Perez-Garcıa and P. Rodrıguez-Benıtez, “Chloramine, a sneaky contaminantof dialysate,” Nephrology Dialysis Transplantation, vol. 14, no. 11,pp. 2579–2582, 1999, Accessed date: 2016-10-24. [Online]. Available:http://ndt.oxfordjournals.org/content/14/11/2579.short
[10] Coulliette, Angela D. and Arduino, Matthew J., “Hemodialysis and WaterQuality,” Seminars in Dialysis, vol. 26, no. 4, pp. 427–438, 2013, Accesseddate: 2016-10-24. [Online]. Available: http://dx.doi.org/10.1111/sdi.12113
73
[11] U.S. Environmental Protection Agency (EPA). (2013) Granular ActivatedCarbon. Accessed date: 2016-10-17. [Online]. Available: https://iaspub.epa.gov/tdb/pages/treatment/treatmentOverview.do?treatmentProcessId=2074826383
[12] Encyclopedia Britannica . Water Softener. Accessed date: 2016-10-17. [Online].Available: https://global.britannica.com/technology/water-softener
[13] “WRO 300H,” Baxter, Tech. Rep., Accessed date: 2016-10-24. [Online]. Available: http://www.gambro.de/PageFiles/8137/HCEN2015WRO300H datablad-epslanguage=en.pdf
[14] “Svensk Lakemedelsstandard 2016.0; Tillverkning och hanteringav hemodialysvatskor och hemofiltrationsvatskor inom sjukvarden,”Lakemedelsverket, Standard, 2016.
[15] “European Pharmacopoeia 1167; Haemodialysis Solutions, Concentrated, Waterfor Diluting,” Council of Europe, Strasbourg, Standard, 2009.
[16] “Validation of Analytical Procedures: Text and Methodology Q2(R1),” Interna-tional Conference on Harmonisation, Standard, 2005.
[17] Svensk Njurmedicinsk Sjukskoterskeforening, “Kliniker,” Accessed date:2016-03-22. [Online]. Available: http://www.snsf.eu/kliniker/
[18] Skanes Universitetssjukhus. (2013) Vara mottagningar, Lund. https://www.skane.se/sv/Webbplatser/Skanes-universitetssjukhus/Organisation-A-O/Njur--och-transplantationskliniken/Avdelningar-och-mottagningar/Lund/.Accessed date: 2016-07-13.
[19] VA Syd. (2016) Malmos dricksvatten. Accessed date: 2016-07-13. [Online].Available: http://www.vasyd.se/Artiklar/Dricksvatten/Malmos-dricksvatten
[20] “Guidelines for Drinking-water Quality,” World Health Organization, Tech.Rep., 2011, accessed date: 2016-09-06. [Online]. Available: http://www.who.int/water sanitation health/dwq/guidelines/en/
[21] “Livsmedelsverkets foreskrifter om dricksvatten; SLVFS 2001:30,”Livsmedelsverket, Standard, 2015, accessed date: 2016-09-05.[Online]. Available: http://www.livsmedelsverket.se/om-oss/lagstiftning1/gallande-lagstiftning/slvfs-200130/
[22] Bioreliance, “Endotoxin testing (lal),” Accessed date: 2016-03-21. [Online].Available: http://www.bioreliance.com/us/services/biopharmaceutical-services/raw-material-testing/endotoxin-testing-%28lal%29
[23] “European Pharmacopoeia, 2.6.14. Bacterial endotoxins,” Council of EuropeanUnion, Tech. Rep., 2005.
[24] Radiometer Analytical. (2004) Conductivity Theory and Practice. Accesseddate: 2016-10-17. [Online]. Available: http://www.analytical-chemistry.uoc.gr/files/items/6/618/agwgimometria 2.pdf
[25] “Svenskt njurregisters arsrapport 2015,” Svenskt njurregister, Tech. Rep., 2015,s.8.
74
[26] Region Skane, “Medicinsk Service Prislista 2016,” accesseddate: 2016-03-21. [Online]. Available: http://vardgivare.skane.se/siteassets/2.-patientadministration/avgifter-och-prislistor/prislistor/labmedicin/rs---fillistning/klinisk-mikrobiologi-Accesseddate:2016-rs-v1.pdf
[27] Eurofins Environment Testing Sweden AB, “Prislista,” http://www.eurofins.se/dokument/miljo/analyskatalog.pdf, mars 2014.
[28] Baxter. (2015) Hembehandling. Accessed date: 2016-09-06. [Online].Available: http://www.baxter.se/patienter/hembehandling.html
[29] “2015 USRDS Annual Data Report Reference Table D.1,” United States RenalData System, Tech. Rep., Accessed date: 2016-10-24.
[30] ERA-EDTA Registry, “ERA-EDTA Registry Annual Report 2013,” AcademicMedical Center, Department of Medical Informatics, Amsterdam, The Nether-lands, Tech. Rep., 2015, Accessed date: 2016-10-24.
[31] “Canadian Organ Replacement Register Annual Report: Treatment of End-StageOrgan Failure in Canada, 2004 to 2013.” Canadian Institute for Health Informa-tion, Ottawa, ON, Tech. Rep., 2015, s. 40.
[32] ANZDATA Registry, “38th report,” Australia and New Zealand Dialysis andTransplant Registry, Adelaide, Australia, Tech. Rep., 2016. [Online]. Available:http://www.anzdata.org.au
[33] S. Nakai, Y. Watanabe, I. Masakane, A. Wada, T. Shoji, T. Hasegawa,H. Nakamoto, K. Yamagata, J. J. Kazama, N. Fujii, N. Itami, T. Shinoda,T. Shigematsu, S. Marubayashi, O. Morita, S. Hashimoto, K. Suzuki,N. Kimata, N. Hanafusa, K. Wakai, T. Hamano, S. Ogata, K. Tsuchida,M. Taniguchi, H. Nishi, K. Iseki, and Y. Tsubakihara, “Overview of RegularDialysis Treatment in Japan (as of 31 December 2011),” Therapeutic Apheresisand Dialysis, vol. 17, no. 6, pp. 567–611, 2013, Accessed date: 2016-10-24.[Online]. Available: http://dx.doi.org/10.1111/1744-9987.12147
[34] “COUNCIL DIRECTIVE 98/83/EC of 3 November 1998 on the quality of wa-ter intended for human consumption,” Council of European Union, Tech. Rep.,1998.
[35] “The National Primary Drinking Water Regulations,” United States Environ-mental Protection Agency, Tech. Rep., 2016, accessed date: 2016-08-31.[Online]. Available: https://www.epa.gov/ground-water-and-drinking-water/table-regulated-drinking-water-contaminants
[36] M. Z. Sauna Elwary, Anthony Turner, Principles of Bacterial Detection: Biosen-sors, Recognition Receptors and Microsystems. Springer, 2008.
[37] Z. Y. Wang, Yixian and Y. Ying, “New Trends in Impedimetric Biosensors forthe Detection of Foodborne Pathogenic Bacteria,” Sensors (Basel, Switzerland)12.3, p. 3449–3471, 2012, Accessed date: 2016-10-24.
[38] “Gold screen-printed-based impedimetric immunobiosensors for direct and sen-sitive Escherichia coli quantisation,” Biosensors and Bioelectronics, vol. 24,no. 11, pp. 3365 – 3371, 2009, Accessed date: 2016-10-24.
75

[39] R. Wannapob, P. Kanatharana, W. Limbut, A. Numnuam, P. Asawatr-eratanakul, C. Thammakhet, and P. Thavarungkul, “Affinity sensor using3-aminophenylboronic acid for bacteria detection ,” Biosensors and Bio-electronics, vol. 26, no. 2, pp. 357 – 364, 2010, Accessed date:2016-10-24. [Online]. Available: http://www.sciencedirect.com/science/article/pii/S0956566310005099
[40] Z. Shen, M. Huang, C. Xiao, Y. Zhang, X. Zeng, , and P. G. Wang,“Nonlabeled Quartz Crystal Microbalance Biosensor for Bacterial DetectionUsing Carbohydrate and Lectin Recognitions,” Analytical Chemistry, vol. 79,no. 6, pp. 2312–2319, 2007, Accessed date: 2016-10-24. [Online]. Available:http://dx.doi.org/10.1021/ac061986j
[41] A. Ahmed, J. V. Rushworth, N. A. Hirst, and P. A. Millner, “Biosensorsfor Whole-Cell Bacterial Detection,” Clinical Microbiology Reviews, vol. 27,no. 3, pp. 631–646, 2014, Accessed date: 2016-10-24. [Online]. Available:http://cmr.asm.org/content/27/3/631.abstract
[42] F. Ricci, G. Volpe, L. Micheli, and G. Palleschi, “A review on noveldevelopments and applications of immunosensors in food analysis ,” AnalyticaChimica Acta, vol. 605, no. 2, pp. 111 – 129, 2007, Accessed date:2016-10-24. [Online]. Available: http://www.sciencedirect.com/science/article/pii/S0003267007017886
[43] S. Sabban, “Development of an in vitro model system for studying theinteraction of Equus caballus IgE with its high-affinity Fc!RI receptor,” Ph.D.dissertation, the University of Sheffield, 2011, Accessed date: 2016-10-17.[Online]. Available: http://etheses.whiterose.ac.uk/2040/2/Sabban, Sari.pdf
[44] E. Katz and I. Willner, “Probing Biomolecular Interactions at Conductive andSemiconductive Surfaces by Impedance Spectroscopy: Routes to ImpedimetricImmunosensors, DNA-Sensors, and Enzyme Biosensors,” Electroanalysis,vol. 15, no. 11, pp. 913–947, 2003, Accessed date: 2016-10-24. [Online].Available: http://dx.doi.org/10.1002/elan.200390114
[45] T. Sun and H. Morgan, “Single-cell microfluidic impedance cytometry: areview,” Microfluidics and Nanofluidics, vol. 8, no. 4, pp. 423–443, 2010,Accessed date: 2016-10-24. [Online]. Available: http://dx.doi.org/10.1007/s10404-010-0580-9
[46] L. Yang, Y. Zhou, S. Zhu, T. Huang, L. Wu, and X. Yan, “Detection and Quantifi-cation of Bacterial Autofluorescence at the Single-Cell Level by a Laboratory-Built High-Sensitivity Flow Cytometer,” Analytical Chemistry, vol. 84, no. 3,pp. 1526–1532, 2012, Accessed date: 2016-10-24.
[47] Sigma-Aldrich. What is Endotoxin? Accessed date: 2016-09-16. [On-line]. Available: http://www.sigmaaldrich.com/life-science/stem-cell-biology/3d-stem-cell-culture/learning-center/what-is-endotoxin.html
[48] “In silico designed nanoMIP based optical sensor for endotoxins monitoring,”Biosensors and Bioelectronics, vol. 67, pp. 177 – 183, 2015, Accessed date:2016-10-24.
76

[49] W. Su, M. Lin, H. Lee, M. Cho, W.-S. Choe, and Y. Lee, “Determinationof endotoxin through an aptamer-based impedance biosensor,” Biosensorsand Bioelectronics, vol. 32, no. 1, pp. 32 – 36, 2012, Accessed date:2016-10-24. [Online]. Available: http://www.sciencedirect.com/science/article/pii/S0956566311007536
[50] Millipore Corporation. (1999) Measurement of Total Organic Car-bon in High-Purity Water. Accessed date: 2016-09-20. [On-line]. Available: http://www.johnmorris.com.au/files/files/Merck Millipore/Measurement of Total Organic Carbon in HighPurity Water.pdf
[51] M. T. C. Ross C Thomas, Eric D Cravens, “Microfluidic Systemfor Measurement of Total Organic Carbon,” Patent, 2002. [Online].Available: http://www.eltronresearch.com/licensed tech/Microfluidic systemfor measurement of t.pdf
[52] Mettler-Toledo Thornton Inc., “5000TOCi, Total Organic Carbon Sensor,”Bedford, USA, 2012, accessed date: 2016-09-20. [Online]. Available: http://us.mt.com/dam/MTPRO/PDF/DS/DS 5000TOCi Sensor en ML0145 Feb12.pdf
[53] The Dow Chemical Company. (2015) Dow Water and Process Solutions -Correlation between KMnO4, COD, BOD, DOC and TOC. Accessed date:2016-09-20. [Online]. Available: http://dowac.custhelp.com/app/answers/detail/a id/4219/∼/dow-water-and-process-solutions---correlation-between-kmno4,-cod,-bod,-doc-and
[54] L. McPherson, “Amperometric vs. colorimetric methods foron-line measurement of chlorine,” Water world, vol. 28,no. 8, 2012, accessed date: 2016-09-23. [Online]. Available:http://www.waterworld.com/articles/print/volume-28/issue-8/editorial-features/amperometric-vs-colorimetric-methods-for-on-line-measurement-of-chlorine.html
[55] A. Mehta, H. Shekhar, S. Hyun, S. Hong, and H. Cho, “A micromachinedelectrochemical sensor for free chlorine monitoring in drinking water,” WaterScience & Technology, vol. 53, no. 4-5, pp. 403–410, 2006, accesseddate: 2016-09-23. [Online]. Available: http://water21.korea.ac.kr/DATA/waterscienceandtechnology2006 sensor.pdf
[56] Hach. (2015) CLT10sc Total Chlorine Analyzer withsc200 Controller and Combination pH Sensor. Accesseddate: 2016-09-23. [Online]. Available: http://www.hach.com/clt10sc-total-chlorine-analyzer-with-sc200-controller-and-combination-ph-sensor/product-details?id=7640300515&callback=pf
[57] M. Chudy, A. Dybko, W. Wroblewski, and Z. Brzozka. (2000) MiniaturizedChemical Sensors in the Monitoring of Water. Accessed date: 2016-10-17. [Online]. Available: http://www.pg.gda.pl/chem/CEEAM/Dokumenty/CEEAM ksiazka/Chapters/chapter3.pdf
[58] Cole-Parmer. Ion Selective Electrodes. Accessed date: 2016-09-20. [Online].Available: http://www.coleparmer.com/Category/Ion Selective Electrodes/46700
77
[59] B. P. Tracy, S. M. Gaida, and E. T. Papoutsakis, “Flow cytometry forbacteria: enabling metabolic engineering, synthetic biology and the elucidationof complex phenotypes,” Current Opinion in Biotechnology, vol. 21, no. 1,pp. 85 – 99, 2010, Accessed date: 2016-10-24. [Online]. Available:http://www.sciencedirect.com/science/article/pii/S0958166910000224
[60] Comm Tech Lab, Michigan State University. (1999) The Well KnownMicrobe: E. coli. Accessed date: 2016-10-17. [Online]. Available:http://commtechlab.msu.edu/sites/dlc-me/zoo/zah0700.html
[61] A. M. Earl, R. Losick, and R. Kolter, “Ecology and genomics ofBacillus subtilis,” Trends in Microbiology, vol. 16, no. 6, pp. 269– 275, 2008, Accessed date: 2016-10-24. [Online]. Available: http://www.sciencedirect.com/science/article/pii/S0966842X08000887
[62] T. Gregersen, “Rapid method for distinction of gram-negative from gram-positive bacteria,” European journal of applied microbiology and biotechnology,vol. 5, no. 2, pp. 123–127, 1978, Accessed date: 2016-10-24. [Online].Available: http://dx.doi.org/10.1007/BF00498806
[63] US EPA, “FINAL RISK ASSESSMENT OF BACILLUS SUBTILIS,” 1997,Accessed date: 2016-10-24. [Online]. Available: https://www.epa.gov/sites/production/files/2015-09/documents/fra009.pdf
[64] Thermo Fischer Scientific Inc. LIVE/DEAD BacLight Viability and CountingKit, for flow cytometry. Accessed date: 2016-09-22. [Online]. Available:https://www.thermofisher.com/order/catalog/product/L34856
[65] LIVE/DEAD BacLight Bacterial Viability Kits, Molecular Probes, July 2004,Accessed date: 2016-10-17. [Online]. Available: https://tools.thermofisher.com/content/sfs/manuals/mp07007.pdf
[66] S. M. Stocks, “Mechanism and use of the commercially available viability stain,BacLight,” Cytometry Part A, vol. 61A, no. 2, pp. 189–195, 2004, Accesseddate: 2016-10-24. [Online]. Available: http://dx.doi.org/10.1002/cyto.a.20069
78
Appendix A
The formulary sent toHHD-clinics
The questionnaire consisted of five sections with the following ques-tions
1. General information
• Which clinic does it regard?• How many patients are under HHD-treatment at the clinic?
2. Microbial analysis, 3. Analysis of endotoxins and 4. Chem-ical analysis
The following questions were repeated in each of the three sections
• How are the samples taken, stored and transported?• With what frequency is the sample-taking normally performed?
Does the time between the occasions vary?• Does the clinic have any directions that dictates the routines for
the sample-taking?• Who is performing the sample-taking?• Where are the samples analyzed?• What analysis methods are used?• How long time does it take between sample-taking and test an-
swer? Does the time vary? Do you have any limits for the longestallowed response time?• What is the approximate cost per sample divided into sample
equipment, labor cost, transport cost and cost for the analysis?
79

5. Reflections
• Which part of the water quality verification process do you findmost troublesome or demanding?• Do you have any desires about any technical equipment that could
facilitate the process?
80