Signs From Above - Lund University Publications
119
Supervisor: Jens Hultman Examiner: Javier Cenamor Signs From Above A Quantitative Study on Semiotics and Cross-cultural Marketing by Agnes Nilsson Thomas McCahan May, 2018 Master’s Program in International Marketing and Brand Management
-
Upload
khangminh22 -
Category
Documents
-
view
0 -
download
0
Transcript of Signs From Above - Lund University Publications

Supervisor: Jens Hultman Examiner: Javier Cenamor
Signs From Above A Quantitative Study on Semiotics and Cross-cultural Marketing
by
Agnes Nilsson
Thomas McCahan
May, 2018
Master’s Program in International Marketing and Brand Management


i
Abstract
This thesis looks into cross-cultural in-store marketing and how, with the use of contemporary symbols, marketing messages can cross language barriers. In the context of cosmopolitan cities with large populations of international inhabitants, being able to market to all individuals regardless of linguistic abilities and cultural backgrounds is critical for firms to stay competitive. Simply replacing the local text in marketing messages with English can prove to neglect the local culture, therefore another strategy is necessary. With the utilization of an online questionnaire, this thesis produced empirical material from 702 respondents. The questionnaire tested individual’s comprehension of food category signs with Swedish text only versus signs with Swedish text and descriptive symbols. It further gathered data from international individuals living in Sweden about their perception of Swedish grocery stores and other complementary elements related to the research. The findings show that the addition of symbols greatly increased the understanding of the food category signs by individuals with a beginner level of Swedish understanding, but actually slightly decreased the understanding of the signs by advanced Swedish speakers. When this phenomenon was examined further, results pointing to the complexity of the symbols increasing comprehension were also found. Other findings suggest that the addition of these contemporary symbols can increase the comfort of international individuals with limited understanding of the local language, which in turn could lead to increased sales. These results gathered from a large amount of empirical data, allow for many possible directions for future research and also add to theory in the world of cross-cultural in-store marketing. Keywords: Marketing, In-store Marketing, Cross-cultural Marketing, Multilingual Marketing, Symbols, Icons, Semiotics, Contemporary Symbols, Emoji’s, Cosmopolitanism

ii
Acknowledgements
We would like to acknowledge the motivation and encouraged independence provided by our supervisor Jens Hultman. Thank you for the time and effort you spent guiding us through this
process.
_______________________ _______________________
Agnes Nilsson Thomas McCahan

iii
Table of Contents 1 Introduction .................................................................................................................. 1
1.1 Prologue ................................................................................................................. 11.2 Research Introduction ............................................................................................. 21.3 Background............................................................................................................. 31.4 Problematizing ........................................................................................................ 41.5 Knowledge Gap ...................................................................................................... 5
1.5.1 Contemporary Symbols in Store Marketing ..................................................... 51.5.2 Multilingual and Cross-Cultural In-Store Marketing ........................................ 51.5.3 The Future of Cross-Cultural Retail ................................................................. 6
1.6 Research Purpose .................................................................................................... 61.7 Expected Knowledge Contribution .......................................................................... 71.8 Thesis Outline ......................................................................................................... 7
2 Literature Review ......................................................................................................... 92.1 Globalization of the World Marketplace .................................................................. 92.2 In-Store Multilingual Marketing............................................................................ 10
2.2.1 In-Store Signage ............................................................................................ 112.3 Cross-Cultural Marketing ...................................................................................... 12
2.3.1 Cross-Culture Marketing: Consumer Perspective........................................... 142.3.2 Summary of Cultural Terms .......................................................................... 15
2.4 Semiotics .............................................................................................................. 162.4.1 Symbols in Marketing ................................................................................... 172.4.2 Semiotics in the Contemporary Society ......................................................... 172.4.3 Emoji’s ......................................................................................................... 18
2.5 The Bridge between Cross-Cultural Marketing and Semiotics ............................... 192.6 Hypotheses ........................................................................................................... 202.7 Literature Framework ........................................................................................... 22
3 Methodology ............................................................................................................... 233.1 Research Design ................................................................................................... 23
3.1.1 Research Purpose .......................................................................................... 233.1.2 Research Philosophy ..................................................................................... 233.1.3 Research Approach ....................................................................................... 243.1.4 Research Strategy .......................................................................................... 253.1.5 Mixed Methods ............................................................................................. 25

iv
3.2 Collection of Empirical Data ................................................................................. 263.3 First Strand: Focus Group ..................................................................................... 26
3.3.1 Quality of Qualitative Research ..................................................................... 273.4 Second Strand: Main Study ................................................................................... 28
3.4.1 Questionnaire Design and Procedure ............................................................. 293.4.2 Sampling Method .......................................................................................... 303.4.3 Pilot Study .................................................................................................... 313.4.4 Control Question ........................................................................................... 313.4.5 Questions Omitted ......................................................................................... 31
3.5 Craft of Analysis ................................................................................................... 323.5.1 Correlation .................................................................................................... 34
3.6 Quality of Research............................................................................................... 343.7 Ethical Reflections ................................................................................................ 36
4 Findings and Analysis ................................................................................................. 384.1 First Strand: Focus Group ..................................................................................... 38
4.1.1 Misconceptions of Marketing Messages for International Individuals ............ 384.2 Second Strand: Main Study ................................................................................... 39
4.2.1 Descriptive Statistics ..................................................................................... 394.2.2 Degree of Internationality in Sweden ............................................................. 41
4.3 Hypothesis Testing................................................................................................ 424.3.1 Section 1: Perceptions of Swedish Grocery Stores ......................................... 424.3.2 Section 2: Perception of Research.................................................................. 474.3.3 Section 3: Neglecting the Local Culture ........................................................ 504.3.4 Section 4: Test Section .................................................................................. 51
5 Discussion .................................................................................................................... 595.1 Objective 1 ........................................................................................................... 595.2 Objective 2 ........................................................................................................... 635.3 Objective 3 ........................................................................................................... 64
6 Conclusion ................................................................................................................... 656.1 Conclusion ............................................................................................................ 656.2 Limitations............................................................................................................ 656.3 Theoretical Contributions ...................................................................................... 666.4 Practical Contributions .......................................................................................... 676.5 Future Research .................................................................................................... 686.6 Epilogue ............................................................................................................... 70

v
References ........................................................................................................................... 71Appendix A ......................................................................................................................... 78Appendix B ......................................................................................................................... 80Appendix C ......................................................................................................................... 94

vi
List of Tables Table 2.1 Definitions of Cultural Concepts ........................................................................... 15Table 2.2 Summary of Hypotheses ....................................................................................... 21Table 3.1 Section Reference Table ....................................................................................... 33Table 3.2 Cronbach’s Alpha ................................................................................................. 35Table 4.1 Hypothesis 1 ......................................................................................................... 43Table 4.2 Hypothesis 2 ......................................................................................................... 44Table 4.3 Hypothesis 3 ........................................................................................................ 45Table 4.4 Hypothesis 4 ......................................................................................................... 46Table 4.5 Hypothesis 5 ......................................................................................................... 47Table 4.6 Hypothesis 6 ......................................................................................................... 48Table 4.7 Hypothesis 7 ......................................................................................................... 49Table 4.8 Hypothesis 8 ......................................................................................................... 50Table 4.9 Hypothesis 9 ......................................................................................................... 51Table 4.10 Hypothesis 10 ..................................................................................................... 52Table 4.11 Hypothesis 11 ..................................................................................................... 53Table 4.12 Hypothesis 12 ..................................................................................................... 54Table 4.13 Hypothesis 13 ..................................................................................................... 55Table 4.14 Hypothesis 14 ..................................................................................................... 55Table 4.15 Hypothesis 15 ..................................................................................................... 56

vii
List of Figures Figure 1.1 Knowledge Gap ..................................................................................................... 6Figure 1.2 Thesis Outline ....................................................................................................... 7Figure 2.1 Theoretical Framework ........................................................................................ 22Figure 3.1 Deductive Research Approach ............................................................................. 25Figure 4.1 Age of Respondents ............................................................................................. 40Figure 4.2 General Origin of the Respondents from the Questionnaire .................................. 41Figure 4.3 Sweden's Degree of Internationality According to the Questionnaire Respondents ............................................................................................................................................. 42


1
1 Introduction
1.1 Prologue
Once upon a time, a student from the United States named Louis decided to attend Lund University in Sweden, to earn his Master’s degree. This was his first time living abroad and first time visiting the country. Louis was not alone in this case, every year, the number of international students studying in Sweden increases (scb.se). From 2016 to 2017, 46,700 international students relocated to Sweden, 23,500 of which had never been in the country before and were thus, unfamiliar with both the culture and the language (scb.se). Lund University, located in the south of Sweden, during these years enrolled 3,290 international students, making it the most international university in Sweden (scb.se). Initially, Louis was overwhelmed with culture shock and found his first months in Sweden to be exciting, but also challenging. Though verbal communication was never a problem, due to Sweden's high English proficiency (Ec.europa.eu, 2018), navigating through this new foreign environment proved troublesome. The lion’s share of these predicaments arose from the retail environment, more precisely, Swedish grocery stores. Not only were the food products unfamiliar, but all packaging and signage within the store was written in Swedish. Louis found it difficult to find the items he wanted and felt uncomfortable in this alien landscape. One setting where Louis did not have these feelings of distress and hardship was while using public amenities. Road signs took no time to comprehend and understanding the fundamentals of public transportation was a breeze. There, Louis was able to rely on symbols to guide is way. These symbols gave Louis a sense of inclusion and he longed for this feeling in other aspects of his new life.

2
1.2 Research Introduction
The soul never thinks without a picture
- Aristotle
From 1974 to 2007, 64.3 million individuals migrated between the industrial countries of the world (World Trade Organization, 2008). The most recent wave of globalization began in the mid 1970’s and has continued throughout the 21st century (World Trade Organization, 2008). While the globalization rate is rapidly increasing, individuals as well as organizations are exposed to mixed cultures and encouraged to function in situations of heterogeneity (Solomon & Steyn, 2017). In addition, Guðmundsdóttir (2015, p.175) reflects that “globalization has led to a significant increase in cross-cultural interactions.” This new era of migration has led to an increased interest in products and services that are suited for people with different nationalities and cultural backgrounds, forcing marketing activities to become more international (Retnowati, 2016). Moreover, it has become more advanced to master the communication and informational marketing processes, which has led to a new paradigmatic shift on how to market products around the globe (Sharma & Kaur, 2018). A decision on whether to use a localized or globalized strategy for marketing activities depends, according to Sharma and Kaur (2018), on the products and the targeted market. The authors further dictate that firms in the business of fashion and beauty generally follow a more standardized, global strategy, whereas the household or food industries utilize a less standardized, local approach. In the recent decades, Europe has started to witness the development of a more cosmopolitan continent where citizenship is becoming decoupled from national bearings (Baban, 2013). The accelerated integration, as well as the increasing globalization has awoken an era of global economic and business assimilation that crosses national borders (Baban, 2013; Retnowati, 2016). According to Kuipers (2013) there are multiple visual changes apparent when individuals cross borders. Two such examples are citizen behavior as well as the languages used to communicate. Consequently, Kuipers (2013) asserts that marketing works differently in different countries since individuals are used to their specific national habitus. Habitus is explained as learned practices that have become natural and that are shared between individuals within a specific nation, further being a culturally-shaped second nature (Kuipers, 2013). Since the individual habitus are congealed history, absorbed into the body, it is shaped out of the society and consequently, shaped by the countries within which individuals have been raised and have lived. In the scope of the less standardized food retail industry, this thesis examines the difficulties in cross-cultural marketing and marketing across language barriers in a world that is becoming more cosmopolitan.

3
1.3 Background
A semiotic marketing approach is according to Bortun and Puracareais (2013) a construction of signs that creates meaning when interacted with. Specialized scholars in semiotics often refers to signs as "cultural symbols and as essential building blocks of language and communication" (Epure, Eisenstat & Dinu, 2014, p. 593). More specifically, a semiotic approach aim to understand the relationship between the interpretation of a sign and what the sign is intended to represent (Epure, Eisenstat & Dinu, 2014). Epure, Eisenstat and Dinu (2014) acknowledge that marketers gain a greater understanding and control over the communication process and consequently can communicate more effectively with target groups while using a semiotic approach. As a result, symbols can be used to make products go global (Piamonte, Abeysekera & Ohlsson, 2001). Before ancient civilization developed letters and words, pictures and drawings were used to record narratives and stories (ancient-symbols.com, n.d.). Along the way, some of these drawings and pictures became commonly used for certain expressions and from there, standard symbols were born (ancient-symbols.com, n.d.). Symbols have been used to communicate throughout time, across changes in culture and technology and have the ability to bypass languages (Zender & Cassedy, 2014). From navigation to informal indications, symbols are an essential part of everyday life that assists individuals in various ways (McDougall, Curry & de Bruijn, 1999). Symbols are heavily used in contemporary society due to the small amount of cognitive energy it takes to understand them compared to their word equivalent and their ability to effectively communicate a message across languages (McDougall, Curry & de Bruijn, 1999). This dynamic expansion of cross-cultural and multilingual marketing activities has led to more considerations of using visual imagery as a communication tool (Mikhailitchenko, Javalgi, Mikhailitchenko & Laroche, 2007). Symbols are commonly understood, which can enhance the comprehension of certain messages (Zender & Cassedy, 2014). However, along with new technology, the way individuals communicate is constantly evolving and new symbols have within the recent years become more popular (Alshenqeeti, 2016). The new phenomenon of emoji’s has given individuals the opportunity to show emotions and expressions through written text and is explained as a playful way of conveying certain emotions (Alshenqeeti, 2016). Nevertheless, Pappachan and Ziefle (2007) declare that if a marketer is aiming for a culturally fair interface design to be able to address more international users with different backgrounds, it is also important to integrate the knowledge of other cultures to achieve optimal intercultural acceptance among the audience.

4
1.4 Problematizing
Kuipers (2013) questions if it still is possible, in the 21st century, to conclude that people in the same country are somehow similar. With the new expansion of internationalization and expatriation, populations differ now more than ever and consist of individuals with different backgrounds and different life experiences. As a result, consumers have become accustomed to different kinds of marketing activities (Kuipers, 2013). A drive for more global marketing came with the development of international brands; therefore the use of imagery has been a field that has grown incrementally over the last decades (Mikhailitchenko et al. 2007). In consideration of globalization, migration and multicultural marketplaces; cross-cultural communication and consumer behavior has become a subject of more interest in the contemporary society (Kuipers, 2013). When looking into cross-cultural marketing attempts, researchers disagree on whether marketing can be standardized across cultures. The world is shifting toward a homo-cultural marketplace due to the globalization and the assumption that consumers have the same predisposition to be influenced by marketing attempts regardless of cultural belonging (Retnowati, 2016). This statement goes against the aforementioned proposition of Kuipers (2013) that refers to the fact that people from different setting and nations are accustomed to different marketing activities and have built up different habitus. Furthermore, Kuipers (2013) acknowledges that serious doubts about this view have surfaced during the last years whereas Retnowati (2016) suggests that marketing and advertisements are greatly influenced by the local culture. In the contemporary society where a growing amount of citizens are migrating across borders, marketing messages in-store may no longer have the same effect due to the complications in their level of understanding. Nevertheless, it is important not to neglect the local audience since they, according to Pappachan and Ziefle (2007), resonates on a deeper level with local marketing attempts. This view is strengthened by Aaker, Brumbaugh and Grier (2000) who support that consumers generally have a more positive approach to marketing and brands if it is possible for them to identify with marketing messages; a task that can be accomplished with the use of the local language. Nevertheless, language is a living organism and communication is constantly evolving due to the changes and adaptation of different social trends (Jesperson, 2013). Hence, the language communicated does not specifically need to be a spoken one, only understood by the locals. Instead, it could be accomplished with the use of imagery or symbols. Thus, a standpoint of this thesis is that marketing messages need to adapt a more international approach without neglecting the local audience. While prior research has been conducted on how retail stores can make marketing more understandable across cultural and language barriers, much of this research has made insufficient attempts to consider the local audience. Moreover, research in the store environment has failed to consider using contemporary symbols to make the messages more understandable across cultural and language barriers. Previous research has been conducted when marketers take products abroad (globalization), but has failed in many cases to

5
acknowledge consumers that are moving abroad and facing new cultures and marketing campaigns that might not be understood. In line with the aforementioned assumptions, there exists multiple literature streams that are restricted, some unexplored areas are: The use of contemporary symbols in a store environment and multilingual and cross-cultural in-store marketing. Together, these two areas could further lead to a more comprehensive understanding of the future of cross-cultural retail.
1.5 Knowledge Gap
1.5.1 Contemporary Symbols in Store Marketing
Symbols are used in food labels to communicate product information across languages (Prinsloo, Van der Merwe, Bosman, & Erasmus, 2012) cultures and ethnicities (Brewer-Doran, 2002). Previous studies on signage and in-store marketing have mainly been focused on the sales, recall, field observations, different qualitative approaches and visual attentions (Otterbring, Wästlund, Gustafsson & Shams, 2014). Studies in semiotics have also been conducted previously on labelling and perception of luxury goods. Consequently, there exist a knowledge gap in the research on how marketers can use up-to-date symbols like emoji’s in marketing approaches and how these symbols are understood by the audience. Another knowledge gap discovered exists between traffic signs, in store marketing and semiotics. Symbols are heavily used in traffic signs to increase their understanding by all drivers (McDougall, Curry & de Bruijn, 1999). There are many studies relating to the cross-cultural understanding of symbols used for traffic signs (Shinar, Dewar, Summala & Zakowska, 2010; Shinar & Vogelzang, 2013), but little research has been conducted with regards to the in-store environment. This thesis aims to suture these knowledge gaps by focusing on how contemporary symbols in a store environment can be used to make a message more understandable to all individuals not dependent on their cultural belongings or linguistic abilities. Hence, this study will take an additional direction and investigate how the implementation of contemporary symbols can add a layer to the multilingual and cross-cultural marketing messages in retail stores.
1.5.2 Multilingual and Cross-Cultural In-Store Marketing
While the area of cross-cultural in-store marketing has been explored by some scholars, for example in technology integration, research including multilingual additions and how to market beyond words is still relatively unexplored. By taking this research direction, a more fruitful understanding of how to communicate to international consumers in a local setting will be illustrated.

6
1.5.3 The Future of Cross-Cultural Retail
By combining the aforementioned unexplored areas of research, an outline on how the future of multilingual retail marketing could evolve will be depicted. This future of retail will aim at closing the divide between the locals and the cosmopolitans. Kuipers (2013) explains that several researchers have pointed to a growing divide between the locals and the internationals in cosmopolitan cities, which might be explained by their different ideas of cultural belonging.
Figure 1.1 Knowledge Gap
1.6 Research Purpose
The ambition of this thesis is to shed light on how symbols can be used in a store environment to make marketing messages more understandable across cultural and language barriers without neglecting the local audience. This area of research is relevant since it does not neglect the local audience, hence replacing the local language with an international one like English is not an appropriate alternative for this research. While the world is becoming more international is it paramount that marketers align their activities with the new society. This new development has currently been enacted on social media sites, like Facebook, where it is now possible to translate a text directly to the receivers own native language to make the message more understandable to multiple audiences. Nevertheless, while this approach is not possible in a physical environment, there are other tactics that can be employed to solve this potential problem. The purpose of this research is therefore to test if contemporary symbols can work as a means to translate various messages across both languages and cultures to make it more comprehensive to an international audience and consequently, create a better shopping experience for all. From there, the authors have developed three research objectives:
1. Identify how effective symbols are at increasing the multilingual and cross cultural understanding of marketing messages
2. Identify consumer perceptions of the utilization of symbols in an in-store environment 3. Identify other complementary elements contemporary symbols can add to the in-store
environment

7
These research objectives, in combination with the existing knowledge gap outlined above, has led to formulation of the research question:
Ø How can in-store marketing communications be improved for an international audience without neglecting the local consumers?
1.7 Expected Knowledge Contribution
According to Lwin, Stanaland and Williams (2010) more studies ought to look into what can be done by marketers rather than the practices that currently occur in the marketplace. Therefore, this thesis intends to discover how marketers, with a semiotic approach, can make marketing messages in a store environment more understandable across cultures and languages barriers and hence, provide a way to make marketing in a less standardized industry more global. Although many scholars have identified the use of symbols and their cross-cultural effectiveness in public environments such as transportation and navigation, little research has been conducted in their use in an in-store environment. The theoretical knowledge this thesis intends to contribute to, is how the use of contemporary symbols can make marketing messages more understandable across language barriers and cultures in such environments, providing a fruitful understanding of how retail stores can become more internationally accepted without neglecting the local audience. With this new dimension on how to cross cultural barriers, the authors of this thesis also wish to contribute to the practical understanding regarding whether or not contemporary symbols can add additional elements to an in-store environment.
1.8 Thesis Outline
This thesis is outlined into six main chapters:
Figure 1.2 Thesis Outline
The following chapter will introduce the reader to the existing literature relevant to the researched area and the chapter concludes with a presentation of the hypothesis developed in consideration to the aforementioned literature. In chapter three, the reader will be presented with a transparent description of the methods used to gather and analyze the empirical material. Chapter four presents the collected results from the empirical data with a brief analysis of the

8
outcome. In Chapter five, the empirical data will be linked to the academic theory that was previously presented and a deeper discussion of the links and findings will be illustrated. The final chapter declares the research conclusion and suggests some future research directions as well as theoretical and practical contributions this research has advanced.

9
2 Literature Review
This chapter will provide the reader with an overview of the four literature streams identified from previous research that falls under the umbrella of this thesis: Globalization of the World Marketplace, In-Store Multilingual Marketing, Cross-Cultural Marketing and Semiotics. It further acts as a guide to the hypotheses of the thesis and provides relevant information for the upcoming chapters. The Literature Review concludes with a Theoretical Framework explaining the relationship between the different themes.
2.1 Globalization of the World Marketplace
The global market is changing and the borders between countries and languages are fading, which as a result impacts the traditional market since the current one is constantly on the move (Popovici, 2011). However, Popovici (2011) explains that consumers generally are influenced by local tradition, thus cultures and communities have their distinct habits developed according to their needs. The author further explain that consumers with different cultures and lifestyles use different products and services, therefore studies on consumer behavior are not to be designed without noticing external influences such as society and social effects on the end receiver. As a result, there has emerged an increased need to create effective and cost efficient marketing to influence the target groups both domestically and globally (Alozie, 2010). A factor to take into consideration due to these circumstances is that cultural aspects of international marketing have become an increasingly vital subject to examine (Alozie, 2010; Al-Olayan & Karande 2000). On one hand, the world is becoming more homogenous since the distinction between marketplaces is fading; hence, the communication has become a world-encompassing practice (Lillis & Tian, 2009). On the other hand, the differences between cultures are far from extinguished (Lillis & Tian, 2009). This opens up for the fact that the global and international communication is a cross-cultural process that encourages the necessity for marketing managers to be knowledgeable about cultural differences; nationally, ethically and locally, to win in international markets (Lillis & Tian, 2009). The importance of international marketing and communication is growing as a result of globalization (Alozie, 2010). According to Popovici (2011) it is vital for firms to prepare for new, unknown obstacles that will come along with the new era. The author further explains that consequently, globalization will inevitably force firms to find new ways of attracting customers and meeting their demands. With this increasing competition for firms worldwide, the survival

10
of many organizations is dependent on their adaptability and ability to initiate an internationally focused organization (Katsikeas, 2018). As a result of the globalization, the interest in cosmopolitanism has increased drastically (Gulnaz, Olga & Kirill, 2017). Presently, it is common in European countries for individuals to frequently move to new location that can offer different experiences or better opportunities (Sevincer, Varnum & Kitayama, 2017). Therefore, a vessel able to communicate a message regardless of the recipient’s linguistic ability is of growing importance in the modern world. Sanderson, Derudder and Timberlake (2015) remark on the recent creation of “world cities;” as a result of migration, many large cities have become increasingly international. This is also true for cities with international universities, from the beginning of the 1990’s global higher education has grown immensely (Enders, 2004; Vidovich, 2002). According to Maude (2016) a major consequence of the new multi-cultural society is that communication problems may occur in educational institutions, workplaces and society in general. Nevertheless, according to Wang (2012) the adjustments to cultural differences for firms should not be the only goal. Another approach is to identify similarities between cultures and establish opportunities to modify the standard strategies within marketing communication (Wang, 2012). Complementary, Cleveland and Laroche (2007) remark that consumer research within international markets has mainly focused on the rise of the global consumer and the importance of understanding their similarities and differences. Therefore, the market competition calls for an increasing need of sophisticated marketing communication and advertising strategies (Lillis & Tian, 2009). Interrelated, is the fact that communication according to Lillis and Tian (2009) is one of the preeminent functions to accomplish in order to survive and succeed in international, competitive markets. The authors further state that if globalization is inevitable, so will be cross-culturalization.
2.2 In-Store Multilingual Marketing
Due to increasing globalization, the in-store marketing environment is beginning to stray from its monolinguist roots toward a more multilinguistic strategy. In print advertisement, images are habitually used to convey messages, but are usually accompanied with textual information. The text used in this fashion, normally in the native language, is where the message tends to fall short of understanding by non-native speakers (Garcia-Yeste, 2013). One remedy for this, that is becoming more prevalent, is the use of English text. Garcia-Yeste (2013) highlights the rise of English phrases used in Swedish print advertising. Here, it has two goals, to increase the multilingual understanding of the message as well as to attract attention from the audience (Garcia-Yeste, 2013). Garcia-Yeste (2013) concludes the study with the discovery of an actual small ratio of English versus Swedish text used in print advertisement and ties it to the preference of the native language in Sweden. Another reason to not neglect the local language is due to Aaker, Brumbaugh and Grier’s (2000) statement that consumers obtain a more positive experience of marketing activities if they are able to personally identify with the message.

11
Even in countries with strong monolinguist ideologies like the United States, some retail locations are beginning to take on a more global perspective (Hepford, 2017). As an example, the American hardware firm, Lowe’s Home Improvement, in 2005 began to introduce in-store signage as well as packaging written in both English and Spanish (Hepford, 2017). This was in response to the firms growing Hispanic customer base and helped to increase the cross-cultural understanding of their in-store marketing efforts (Hepford, 2017). To make this decision, Lowe’s performed in-house research that found 70-85% of purchasing decisions are made at the shelf where packaging and signage are critical tools (Hepford, 2017). Consequently, the author found that 70% of their Hispanic customers were dominantly Spanish speaking and hence, not able to understand current signs and labels. This strategy is an easy way to increase the bilingual understanding of marketing messages, but in a simple context where only two languages are considered. Moreover, cross-cultural research in communication proposes that the effectiveness of the marketing message is directly related to the choice of language (Noriega & Blair, 2008). Sweden is a highly bilingual country with 100% of the pupils learning English in primary school as well as highly multilingual, with 79% of students learning at least one more foreign language in upper secondary education (Ec.europa.eu, 2018). Noriega and Blair (2008) further refer to the fact that marketing messages should preferably be in the bilinguals or multilinguals first language because the message tends to be less complicated to process which makes it easier to recall and further provides more emotional attachment to the receiver.
2.2.1 In-Store Signage
In physical stores, signage plays a crucial role in influencing the shopping behaviors of the customer (Bitner, 1992). The denotation of a price reduction or the indication of a sales promotion has been found to drastically increase sales (Chevalier, 1975). Signage is not only significant for decision making, but is also heavily relied on for navigation within the stores. Sorensen (2009) discovered that as much as 80% of a customer’s time spent in a new store can be attributed to navigation. Otterbring et al. (2014) performed an eye tracking experiment on customers in supermarkets and discovered that both navigation and product information signage greatly influence the customers buying decisions. Chebat, Gélinas-Chebat and Therrien (2005) further explain that the individuals who are familiar with a store environment mostly rely on their long-term memory for navigation whereas individuals more unfamiliar with the store environment utilize external supplementary information. Nevertheless, this can potentially create further complications if individuals do not understand this information. In-store signage is considered a vital marketing tool that is paramount for creating impressions on the customers (Bitner, 1992). This goes hand in hand with the idea that customers often believe that displayed items are “great deals” and consequently can increase the average spending and create more unplanned purchases (Chevalier, 1975). Otterbring et al. (2014) found in their research that individuals who are familiar with the in-store environment also focus less attention on store signage and utilize the information later on in the search process, while

12
individuals less familiar with the in-store environment direct more attention to these signs or stimuli. In the article by McNair (2012), the author explains the event of being in a country where one has no connections to the language and the difficulties that are accompanied by it. In the beginning of the article, McNair (2012) explains the event of looking for something familiar in a grocery store and the troubles of navigation due to the fact that all the aisle markers are in a foreign language. Continuously throughout the article McNair (2012) describes different situations and how language can stop one from understanding even the simplest of things.
I stand in line at Albert, a Prague supermarket where I’ve just spent half an hour wandering the aisles looking for something familiar. Peanut butter. Thousand Island dressing. I cannot read the aisle markers that are, of course, in Czech. All I want, really, is water (voda), and maybe some apricots (meruňky), and some cheese (sỳr). Bread (chléb) (McNair, 2012, p. 442).
2.3 Cross-Cultural Marketing
Culture is a broad term with various academic disciplines and the concept is often pointed out to be ill-defined with both definitions concerning the values and practices of culture (McSweeney, 2013). Bryman and Bell (2015) explain cross-cultural research as the collection of data from two or more nations. According to de Mooij (2015) one complication in cross-cultural research is that researchers tend not to indicate which concept of culture they are referring to. Culture is explained by Wang (2012) as one of the preeminent factor that lies deeply rooted within every human being and that brings to bear a paramount influence on the human behavior. Hofstede refers to culture as “collective programming of the mind that distinguishes the members of one group or category of people from another” (Hofstede, 2001, p. 9). The definition of culture used in this thesis is that of Hofstede. The term “cross-cultural” was used in the 1990’s and was defined as “the overall processes in which individuals and their social groups with different cultures interact in time, keeping their habits and inherited traditions unaltered” (Popovici, 2011, p. 59). Today, the term is commonly used in marketing research essentially because the impact of culture in a multicultural world is understood, and consumption is now becoming more global (Popovici, 2011). A synonymous term used for cross-cultural marketing is glocalisation that is defined as “think globally, but act locally” (Popovici, 2011). As a result, it is more effective to design products adapted to different markets instead of standardizing product across the globe (Popovici, 2011). The strategies for cross-cultural marketing are a component of the marketing mix and should thus include cultural elements such as language, norms, religion, traditional values and education (Popovici, 2011; Wang, 2012).

13
In the contemporary society, the success of marketing activities is driven by the degree of cultural intelligence the marketer possesses (Wang, 2012). This is particularly true in international markets where cross-cultural perspectives are vital (Wang, 2012). Communication activities between individuals from the same culture are troublesome enough, ergo communication activities between individuals who speak different languages, have different values and different ways of thinking will be far more challenging (Wang, 2012). According to Wang (2012) cross-cultural communication within the field of marketing includes activities applicable for consumers who differ in at least one fundamental cultural element; this could be religion, language, societal norms, values, education or lifestyle. This aspect demands that firms be aware of the differences and further respects the distinction of cultures and marketplaces (Wang, 2012). For firms, it is paramount to recognize the right to different cultural ties as well as the right for the consumers to practice, maintain and identify with their own culture (Wang, 2012). Wang (2012) further suggests that being able to obtain the knowledge of different cultural environments is a benefit in order to be capable of matching the marketing activities with the consumer’s behaviors, preferences and product-use patterns. A first step in determining how to adequately manage and conduct marketing activities from a managerial point of view, both internationally and cross-culturally, is to be aware of the visible as well as invisible demonstrations of culture (Alozie, 2010). Hofstede (1983) states that culture as socialization is a convoluted and multifaceted construct that involves the beliefs, value systems, perceptions and learnings within a society as well as the processes of communication. According to Alozie (2010) there exist multiple frameworks that deal with the understandings of different cultural orientations in different societies around the globe. These are, to mention a few; the Hofstede's (1983) cultural dimensions theory that is a framework on cross-cultural communication, Hall and Hall's (1990) high and low context that deals with the degree of information surrounding an event, as well as Murdock's (1945) cultural universe, that is a pattern, element, trait or institution common to every individual culture worldwide. According to Maude (2016), cross-cultural sensitivity entails being considerate of cultural differences and points of view that are of importance to individuals of other cultures. Cultural sensitivity takes into account another perspective and adjusts behaviors depending on the situation (Maude, 2016). Holzmuller and Stöttinger (2001) refer to the vitality of possessing knowledge about both advertising techniques as well as emotional sensitivity in order to succeed and be appropriate in different cultural environments. The authors further state that this not only calls for cognitive skills in marketing activities but also non-cognitive abilities that deal with emotional aspects. International marketers will hence no longer survive with only understanding the domestic market; they also need to have the ability to adapt to both environmental as well as cultural changes (Holzmüller & Stöttinger, 2001). Therefore, utilizing culturally sensitive activities to avoid potential failure in global markets where the marketers cannot rely on personal experiences is paramount for a quality result (Holzmüller & Stöttinger, 2001). Cultural cues are according to Appiah and Liu (2009) defined as symbols, values, rituals, traditions and material objects valued by society and its member that are illustrated in

14
marketing. Different scholars distinguish between visual cultural cues, referring to the imagery, and verbal cultural cues, referring to the language, used in the marketing ads. This thesis will look at the visual cultural cues, more precisely symbols as cultural cues, to identify if these visual symbols can be used as a tool when dealing with cross-cultural marketing in cosmopolitan cities.
2.3.1 Cross-Culture Marketing: Consumer Perspective
Cultural identity, as being a part of the individual's lifestyle and education, is embedded within the individual as they cross borders and will consequently impact their behaviors and practices (Popovici, 2011). As a result of the economic and political changes in the 1990s, a new movement was introduced and individuals started to migrate between countries and cities (Popovici, 2011). These individuals bear their own cultural identity and background, with their own traditions of consumption and these new habitats should not be neglected by marketers (Popovici, 2011). As a result, firms must be aware of demographic changes and their impact on the market in order to enact the best marketing decisions (Popovici, 2011). Individuals also have their own frame-of-reference (ideas and belief that serve as a grounds for judgment) (Dictionary, n.d.) and experiences in which they internalize communication (Oosthuizen, 2004). If communication messages are outside of this context, they will either be misunderstood or perhaps not understood at all by the recipient (Oosthuizen, 2004). Often in the world of marketing, there is only one opportunity to convince a market (Oosthuizen, 2004). If the marketing attempts are not understood, this will limit the success of the marketers (Oosthuizen, 2004). Müller and Ivanova (2014) explain that different scholars suggest that marketers can express cultural closeness by having an intercultural accommodation through a relatively small psychological distance in the marketing communication. Further, de Mooij (2010) refers to the fact that being able to understand the local culture and adapt to the market can be valuable for marketers. de Mooij (2011) reveals that expressing cultural closeness through marketing localization is one possible way to appeal to consumers. Erez and Earley (1997) suggest that an adaptation that could be made to express cultural closeness is to give the consumers a feeling that the marketers share similar attitudes and values. While using this strategy, Watson and Wright (2000) acknowledge that consumers can better relate to products while getting a feeling of cultural closeness.

15
2.3.2 Summary of Cultural Terms
Table 2.1 Definitions of Cultural Concepts
Term Definition Relevance
Cross-Cultural “Social groups with different cultures interact in time, keeping their habits and inherited traditions unaltered” (Popovici,
2011, p. 59)
This thesis desires to identify how marketing activities can cross cultures.
Cross-Cultural Communication
Activities intended to communicate with consumers who differ in at least one
fundamental cultural aspect, this could be either religion, language, societal norms,
values, education or lifestyle (Wang, 2012)
This thesis desires to look at the cultural communication aspects of language.
Cultural Identity A part of the individual's lifestyle or feeling of belonging to a group (Popovici,
2011)
This thesis desires to look at cultural identity since it may affect the comfortableness of
consumers because international individuals differ from the local groups.
Frame-of-Reference
Ideas and belief that serve as grounds for judgment (Dictionary, n.d.)
This thesis desires to look at marketing messages since it has to be inside the
recipient’s frame-of reference for it to be understood. Different cultural belonging and language differences can thus be a problem
for marketers.
Cultural Closeness
Having an intercultural accommodation through a relatively small psychological
distance in the marketing communication (Müller & Ivanova, 2014)
This thesis desires to look at cultural closeness since it is hard to achieve with the
use of the local language in cosmopolitan cities where spoken language and cultural
belonging differs.
Cultural Sensitivity
Entails being sensitive to the cultural differences and points of view that are of
importance to individuals of other cultures (Maude, 2016)
This thesis desires to look at cultural sensitivity in the matter of marketing since
one of the aims is not to neglect any cultures, including the local one.
Cultural Cues The symbols, values, rituals, traditions and material objects valued by a specific society and its member that are illustrated
in marketing (Appiah & Liu, 2009)
This thesis desires to look at the visual cultural cues of symbols that can be applied
to cross-cultural marketing activities.

16
2.4 Semiotics
Semiotics is explained in Yakin and Totu’s (2014) article as the study and existence of signs in a societal life. It accounts for everything that can be seen or interpreted as a sign and the aforementioned definition is accepted by scholars and pioneers in the semiotic field. Yakin and Totu (2014) further explain that the word semiotics derives from the Greek word “semesion” that can be directly translated to the English word “sign.” Bryman and Bell (2015, p.570) refer to semiotics as “science of signs” and explains that it is an approach to the analysis of everyday symbols. Furthermore, the authors explain that a semiotic analysis “focuses on the way that messages are communicated as systems of cultural meaning” (Bryman & Bell, 2015 p.570). Bryman and Bell (2015) continue to dictate that semiotic theory suggests that the symbolic order of cultures are both constructed and interpreted through a system of different signs. Bryman and Bell (2015) explain that the sign itself creates the relationship between the signifier (in this thesis the signifier represents the words and symbols used in the signs) and the signified (the interpreted meaning of the signs). The link between the two concepts are arbitrary, meaning that the underlying message is dependent on convention that is held by the users of the sign about the concept in the mind that the material object is destined to represent (Bryman & Bell, 2015). Bryman and Bell (2015) state that the researchers role in a semiotic analysis is to discover the different rules that tie the users of the sign together and make them more understandable to the cultural world. In marketing, the semiotic analysis encourages the recognition as well as the individual interpretation of messages (Bryman & Bell, 2015). A semiotic marketing approach is according to Bortun and Puracareais (2013) a construction of signs that creates meaning when interacted with. This thesis will use the meaning of semiotics in a marketing approach to shed light upon new, relevant symbols in the contemporary society that expresses information to the receiver. Although symbols are far better understood across languages than written words, they can still be interpreted differently in the face of diversity (Zender & Cassedy, 2014). McDougall, Curry and Bruijn (1999) performed a study with the intent of compiling a list of symbols with subjective ratings for each. The authors identified the symbol characteristics of concreteness, visual complexity, meaningfulness, familiarity and semantic distance as a central concern for this research. The study found a large correlation between concreteness and meaningfulness indicating that symbols of real world concrete objects are the most easily understood even if encountered for the first time (McDougall, Curry & Bruijn, 1999).

17
2.4.1 Symbols in Marketing
Guido, Piper, Prete, Mileti and Trisolina (2017) point out that the most visual aspect in servicescapes is colors. Moreover, Lin (2004) refers to colors as a visual means that can be utilized to create differentiated environments and to help stimulate the customer’s emotions. Further, Lee, Noble and Biswas (2018) acknowledge colors as an aid to be able to attract customers and illustrate the firm. In the world of marketing, symbols can be used in a variety of ways. In package design, symbols are used to visually represent products and transmit messages to build interest (Epure, Eisenstat & Dinu, 2014). With over 50,000 products in today’s average supermarket, it is important for firms and brands to be easily recognizable (Thompson, 2003). The symbols used in a brands logo play a crucial role in enticing this brand recognition (Han, Nunes & Drèze, 2010). In print advertisement, symbols are used to direct the gaze of the target audience (Damaskinidis, Kourdis, Zantides & Sykioti, 2017). Symbols work to break up the textual information and allow the reader to gain a better understanding of the written message (Damaskinidis et al. 2017). In the world of online marketing, the emotional characteristics of symbols can be used to appeal to the masses (Vangelov, 2017). Millennials spend a large portion of their time online and extensively use new adaptations of symbols, such as emoji’s. Thus, companies like Mercedes, Dominos and Taco Bell have started using emoji’s in social media to add humor and entertainment to their marketing communications (Vangelov, 2017).
2.4.2 Semiotics in the Contemporary Society
Symbols are often communicated and relied upon when words fail (Zender & Cassedy, 2014). Symbols are common in public places such as airports, train stations and motorways (McDougall, Curry & de Bruijn, 1999). Perhaps the most common place to find symbols used as a means of cross-cultural communication are in traffic signs. It is paramount for the safety of all drivers on the road that everyone can understand the intended meaning of these signs (Shinar et al. 2010). Due to this fact, extensive studies have been undertaken to increase the multilingual understanding of traffic signs (Shinar et al. 2010). Shinar and Vogelzang (2013) performed one such study that produced results signifying the effectiveness of symbols over written text on traffic signs. In a more private setting, symbols are heavily used in computer operating systems and interfaces (Maguire, 1985). According to Maguire (1985), symbols, especially graphic ones, are ideal for interfaces since they use little space, are not dependent on language, but still convey large amounts of information. Symbols are used to facilitate the communication of functional information universally across languages and take less cognitive energy to understand than their word equivalent (McDougall, Curry & de Bruijn, 1999). Whether in transportation, navigation or through a digital context, symbols are undeniably present in everyday life.

18
Since language and communication is a response to attitudes and social changes, the use of it will consequently evolve due to the tools accessible to the users (Alshenqeeti, 2016). Considering the up rise in use of mobile devices in the recent decade, new concerns regarding the linguistic community have been introduced by traditionalists who referred to the assumption that language has transformed into short and terse communication cues (Alshenqeeti, 2016). Nevertheless, Alshenqeeti (2016) acknowledges a counter-argument of language and communication being presented in many different forms, emoji’s being one of them. The ability to communicate with supplemental visual attributes provides the opportunity to communicate emotions and feelings and hence, conveys richer meaning and more accurate connotations (Alshenqeeti, 2016).
2.4.3 Emoji’s
Since emoji’s are a response to constant development in language, an interesting phenomena in the use of emoji’s is the correlation between these new, and old symbols dating back more than 40,000 years (Alshenqeeti, 2016). Cave paintings tell stories with the use of pictures rather than words in the same fashion that Egyptian hieroglyphs record history (Alshenqeeti, 2016). Furthermore, this could explain the argument that emoji’s are an old language adapted to the new society (Alshenqeeti, 2016). Cuneiform, the earliest writing system, developed and used by the Sumerians, has been dated back to 3,000 B.C and consists of symbols carved into wet clay (Alshenqeeti, 2016). These images, used by early humans, created abstract ideas and told a story on how they lived, felt and thought (Alshenqeeti, 2016). The short history behind emoji’s started in Japan and was a means of expressing emotions in text that demonstrated playfulness in the message and a “visual nature of digital culture” (Alshenqeeti, 2016, p. 57). Since emoji’s were introduced, their library has developed and grown and now, an emoji exists for almost every expression. The spread of emoji’s was mainly caused by the commercial culture and teenage generation, which according to Alshenqeeti (2016) is one of the disputes preventing it from being accepted as a language form. Nevertheless, both tech giants Apple and Google have recognized the potential and value of emoji’s and in 2010 both firms played a part in the standardization of over 720 symbols (Lucas, 2016).
You can say anything as long as you put the right emoji next to it.
- Kanye West
The development of communication and language in the 21st century and the use of emoji’s has become a paramount area, a fact that was cemented when the Oxford English Dictionary in 2015 chose the “tears of joy”- emoji as the “Word of the Year” (Alshenqeeti, 2016). It can be argued that the use of emoji’s is opening new potential ways of innovative communication, expanding the linguistic abilities as well as the traditional writing by making communication more visual and creative (Danesi, 2016). Moreover, Alshenqeeti (2016) acknowledges that the

19
use of emoji’s could provide a different nuance and add more clarity to the message and refer to it being an expression of language creativity. Azuma (2012) explains that the spoken language is different from the written one in that it almost always is delivered in a specific voice and with the use of specific gestures that contribute to the expression of various emotions. In a written language, more specifically in the digital contemporary society, the author explains that these various ways of showing emotions or physical cues are not present. Azuma (2012) continues with the explanation that when emoji’s were introduced, this gap was closed by using a creative and visible approach that enabled the writer to express these feeling in an exciting way. Alshenqeeti (2016) refers to emoji’s as being universal by nature; hence, emoji’s can be used to cross language barriers. Azuma (2012) further explains that there exists a potential illustrative ability in the use of emoji’s since they can express universal emotions. Henceforth, throughout this thesis, the contemporary term “emoji’s” will be referred to as a part of the broader concept “symbols” since the researchers want to highlight the potential use of emoji’s in a broader spectrum.
2.5 The Bridge between Cross-Cultural Marketing and Semiotics
Symbols are language free and are thus considered appropriate and fair for inter-cultural usage (Pappachan & Ziefle, 2007). Zender and Cassedy (2014) performed a study on the understanding of 54 medical symbols in the United States versus rural Tanzania. There, the authors found that a large number of the symbols were misunderstood due to lack of medical knowledge in Tanzania. This introduced a new factor to the understanding of symbols. Markets must take into account the relevant knowledge of their target audience when designing symbols (Zender & Cassedy, 2014). Zender and Cassedy (2014) go on to relate how the access to technology also plays a role in an individual’s ability to understand a symbol. Kassam, Vaillancourt and Collins (2004) add that the education level of a target audience is another factor in the interpretation of symbols. Zender and Cassedy (2014) conclude their article with suggestions to increase the cross-cultural understanding of symbols. First, the authors suggest that the designers of the symbol should be certain that the target culture is familiar with the concepts of the intended message. Next, the authors suggest decision makers are aware of cultural metaphors and are sure that the symbols chosen do not rely on metaphors not present in the target culture. Finally, the authors advise against using learned signs not common to the target culture. Pappachan and Ziefle (2007) acknowledge that is it advantageous to find design principles in order to provide a distinct understanding of symbols that goes beyond cultural knowledges, contexts, stereotypes or language barriers. This is due to the fact that standardized designs are desirable in global markets and thus products have to be designed to fit individuals all around globe (Pappachan & Ziefle, 2007).

20
Similar to that language and how individual communication is evolving as a part of cultural, social, and generational variations; technology and the way individuals use it is changing as well (Alshenqeeti, 2016). The younger generation who has grown up in the digital world with an exponential use of mobile and digital communication is according to Alshenqeeti (2016) more inclined to accept changes in those areas. Furthermore, the author dictates that the use of symbols in written text messages is one of these changes. Additionally, Nishimura (2015) explains that generational differences may not be as strong as expected since older generations are becoming more exposed to technology both through work and leisure activities. Hence, Alshenqeeti (2016) highlights that visual language such as symbols can traverse both generations and culture.
2.6 Hypotheses
In Table 2.3; the reader will find the hypothesis that guides this thesis. These hypotheses were developed with support from previous finding in the related theoretical backdrop and will be tested by the researchers of this thesis with the empirical findings. The hypothesis are divided into four sections that do not follow the same pattern as the questionnaire but are organized and presented in this manner for the entirety of the thesis, with exception of the questionnaire design and procedure section of the Methodology chapter. Of the 16 hypothesis: The first derives from research conducted by Otterbring et al. (2014); hypothesis two stems from research by Hepford (2017) and is strengthened by research from Noriega & Blair (2008); hypothesis three and four derive from observational research conducted by McNair (2012). These four hypothesis make-up Section 1: Perceptions of Swedish Grocery Stores. Hypothesis five stems from research both from Alshenqeeti (2016) and Azuma (2012); hypothesis six derives from observational research conducted by McNair (2012); research from Alshenqeeti (2016) alone guides hypothesis seven. These three hypothesis make-up Section 2: Perception of Research, and aim at fulfilling the third research objective stated in Introduction chapter: Identify other complementary elements contemporary symbols can add to the in-store environment. Hypothesis eight and nine are developed from previous research done by Garcia-Yeste (2013) and is strengthened by Aaker, Brumbaugh and Grier’s (2000). These two hypothesis make-up Section 3: Neglecting the Local Culture, which test whether or not symbols are preferred in comparison to the English language which is related to the second objective stated in the Introduction chapter: Identify consumer perceptions of the utilization of symbols in an in-store environment.

21
Hypothesis 10-15 is included in Section 4: Test Section and aim to fulfill the theoretical gap included in objective one, stated in the Introduction chapter: Identify how effective symbols are at increasing the multilingual and cross cultural understanding of marketing messages. Hypothesis 16 was developed with regard to research done by Garcia, Badre and Stasko (1994) and was developed post-research when interesting findings were discovered.
Table 2.2 Summary of Hypotheses
Hypotheses Literature Support
H1. An individual’s ability to understand the local language has a significant impact on their noticing of food category signs.
Otterbring et al. (2014)
H2. An individual’s ability to understand the local language has a significant impact on their understanding of category signs.
Hepford (2017); Noriega & Blair (2008)
H3. An individual's ability to understand the local language has a significant impact on their feelings of comfort while in a foreign grocery
store.
McNair (2012)
H4. Individuals with a low level understanding of the local language would spend more money in foreign grocery stores if they felt more
comfortable.
McNair (2012)
H5. Adding a symbol next to the text in the local language will increase the multilingual understanding of food category signs.
Alshenqeeti (2016); Azuma (2012)
H6. Adding symbols next to the local language text on food category signs will increase the comfort of internationals.
McNair (2012)
H7. The use of colorful, contemporary symbols will draw more attention to category signs.
Alshenqeeti (2016)
H8. Replacing local language text with English text would neglect the local culture.
Garcia-Yeste (2013); Aaker, Brumbaugh and Grier’s (2000)
H9. Adding symbols next to the local language text would not neglect the local culture.
Garcia-Yeste (2013); Aaker, Brumbaugh and Grier’s (2000)
H10-15. Adding symbols next to local language text will increase the understanding of individuals with lower levels of local language
understanding.
McCahan and Nilsson (2018)
H16. Symbols with a higher level of complexity are better understood than less complex, simple symbols
Garcia, Badre and Stasko (1994)

22
2.7 Literature Framework
The literature framework proposes that the globalization of the world marketplace has resulted in more cities becoming cosmopolitan, which leads to an increased demand for international and cross-cultural marketing suited for individuals with different cultural and linguistic backgrounds. Furthermore, the authors of this thesis propose that the study of contemporary symbols, referred to as semiotics, can be utilized as a means to communicate cross-culturally, which works as a multilingual message to increase customer satisfaction and does not neglect the local audience of the host country. All this takes place within the context of an in-store retail environment and will give the reader a holistic view on the possibilities of using contemporary symbols in brick-and-mortar marketing.
Figure 2.1 Theoretical Framework
23
3 Methodology
The following chapter provides an overview of the methodology that was utilized to fulfill the purpose of this thesis. The overall outline of the research strategy will be explained containing detailed information on how the design of the study was carried out and implemented.
3.1 Research Design
3.1.1 Research Purpose
The purpose of this research is twofold; exposure and conclusive. On one side, the research aims to expose ways in-store marketing communications can be improved for an international audience without neglecting the local consumers. This allowed the researchers to search extensively for previous research with an aim at finding relevant theory that could help drive the research. On the other side, the research is conclusive since the researchers want to come to conclusions about how marketing messages can cross cultures and language barriers without neglecting the local audience.
3.1.2 Research Philosophy
Ontology is, according to Easterby-Smith, Thorpe and Jackson (2015) the philosophical assumption about the nature of reality and existence. This thesis is stimulated by the ontological view of internal realism, which falls under the umbrella that a truth exists but is obscure (Easterby-Smith, Thorpe and Jackson, 2015). This philosophical stance was inspired due to the fact that the researchers tested the empirical material to unfold a possible truth if contemporary symbols are used to increase the multilingual understanding of an audience. This study received 711 responses from individuals originating from all around the globe, which all together lead to the collection of data. Nevertheless, the data was gathered from a sample of the population and even if the facts are concrete, they cannot be accessed directly (Easterby-Smith, Thorpe & Jackson, 2015).
Epistemology is according to Easterby-Smith, Thorpe and Jackson (2015) the theory about knowledge that aid researchers to better understand ways of enquiring into the nature of the world. Positivism is the dominant epistemology when utilizing a questionnaire research method (Easterby-Smith, Thorpe and Jackson, 2015) which goes hand in hand with this thesis. Positivism acknowledges that verifiable patterns exist that are regular in organizational and

24
human behavior (Easterby-Smith, Thorpe & Jackson, 2015). These patterns are generally challenging to detect and even more challenging to explain, this due to the fact that there exist a number of different factors or variables that may contribute to the observed result (Easterby-Smith, Thorpe & Jackson, 2015). Nevertheless, questionnaire research often tends to cross sections with the use of extensive samples and thus permits various factors to be measured at the same time and hence, possible underlying relationships can be discovered and examined (Easterby-Smith, Thorpe & Jackson, 2015). Moreover, a positivistic standpoint often utilizes large surveys, mainly including numbers but in some cases words, and are testing theories, which contributes to this research. The ambition with utilizing this approach was to either test, generate or confirm theory (Easterby-Smith, Thorpe & Jackson, 2015).
3.1.3 Research Approach
The research approach is according to Bryman and Bell (2015) the relationship between research and theory. A researcher can either have a deductive approach, which aims to test existing theory, or an inductive approach, which does not rely on previous finding, but rather aims to generalize those (Bryman & Bell, 2015). As reported by Bryman and Bell (2015), a deductive approach is initiated with a comprehensive research of the theoretical fields of the selected areas. This is to acquire a deeper knowledge and position the research in affiliation to previous literature. This thesis was guided by existing theories gathered from articles and books in the field of cross-cultural marketing and semiotics, which was encompassed under the umbrella of a retail store environment. Due to the nature of this thesis and the relationship with existing literature, the theoretical contributions from scholars has helped to guide this research forward, hence this study adopts a deductive approach (Bryman & Bell, 2015). From the theoretical literature presented in chapter two, the researchers developed 16 hypotheses that, following the results of the quantitative questionnaire, were either rejected or confirmed by the researchers, leading to theory contribution. This type of research is in accordance with Patel and Davidsson’s (2011) view of a deductive-hypothesis work, where the research stems from theory that further helped to guide the hypothesis. In line with the nature of a deductive approach, the researchers of this thesis further tested the empirical data with the theoretical literature to determine whether or not the empirical findings were in accordance with existing theories. In addition to the questionnaire, the research is according to Bryman and Bell (2015) of causal design since the aim is to test independent variables against dependent variables. Some criteria were settled when deciding on the literature material used in this research: Firstly, the research had to be relevant and prominent for the aim of this topic as well for the industry in which the thesis resides. Secondly, the knowledge provided by previous research needed to give a holistic view of the areas that were researched. Finally, the research had to be peer reviewed and thus accepted by scholars. As a final step, the authors of this thesis revised the literature presented in chapter two.

25
Figure 3.1 Deductive Research Approach
3.1.4 Research Strategy
In consideration to this study’s nature and intended aim, an appropriate research method was to include both qualitative and quantitative research processes, with a focus set on the quantitative method and the use of the qualitative mainly as a preoperational study. This combined method, with a strong focus on the quantitative approach was chosen due to the fact that the purpose was to test if contemporary symbols can work as a means to translate various messages across both languages and cultures and make it more comprehensive to an international audience and consequently, create a better shopping experience for all. For this purpose, a quantitative method was considered the most relevant since the authors of this thesis desired to test variables to find a trustworthy way to translate these marketing messages. Moreover, the authors did not aim to explain a phenomenon but rather to expose and conclude truths about the ambitions of the research. The main study conducted was a questionnaire and it was utilized in order for the researchers to gain a deeper understanding of the research aim in order to answer the thesis research question and fulfill the objectives given. The data collected should also provide suitable information so that the researchers either could confirm or disconfirm the pre-formulated hypothesis. The aim of the online questionnaire was twofold: First, to test an international individual’s understanding of food category signs and if adding descriptive symbols to these signs would help to increase this understanding. Next, to gather additional information about the respondents shopping experiences in Swedish grocery stores and their thoughts of improvement. This method was considered valid since the authors of this thesis wanted to gain comprehensive insights on how effective symbols are at transferring messages across different culture.
Furthermore, the hope for this study is to embrace a high degree of reproducibility. This means that other researchers should be capable of repeating or reproducing this specific study with the use of a similar method, in this case; samples, questionnaire and process (May, 2013). This can be fulfilled by the authors of this thesis by presenting a detailed description of how the study was conducted with both strengths and weaknesses included. A high degree of transparency is hence the intention to safeguard the research against biased influences from the researchers’ values (Bryman & Bell, 2015).
3.1.5 Mixed Methods
A mixed method strategy is when the research combines both qualitative and a quantitative research within a single study (Bryman & Bell, 2015). When conducting research of this nature,

26
the study can either have an equal weight of both qualitative and quantitative strategies or an unequal weight and, making this determination a priority decision (Bryman & Bell, 2015). This research has a dominantly quantitative approach, the qualitative method was sequential. This is according to Bryman and Bell (2015) the most common way of conducting mixed method research and the author’s further state that the qualitative research often acts as preparation for the quantitative. This form of mixed method design is termed as exploratory sequential design and is often associated with a qualitative investigation that could generate information later used in the quantitative research (Bryman & Bell, 2015). Further, Bryman and Bell (2015) explain that mixed method design requires that the researchers first gather and analyze the qualitative findings, then sequentially gather and analyze the quantitative data. The authors extend this view with the explanation that the researchers should be able to explain or elaborate on the quantitative findings (Bryman & Bell, 2015). One strength of the mixed method research design is that the confidence in the findings of a quantitative study can be enhanced with the use of the accompanying method (Bryman & Bell, 2015). Nevertheless, the researchers must be meticulous when designing and conducting the research since poorly conducted, non-relevant research will provide suspect findings harming both the validity and reliability of the study regardless of how many research methods were selected (Bryman & Bell, 2015).
3.2 Collection of Empirical Data
This thesis includes only the collection of primary data. Easterby-Smith, Thorpe and Jackson (2015) declare that the use of primary data can lead to a greater confidence as well as new insights of the research. Primary data refers to the data collected by the researchers themselves in consideration of the aim of the study (Bryman & Bell, 2015). This thesis has gathered first-hand data from two different research methods with the intended aim to contribute to an extension of the knowledge in the field of cross-cultural marketing and semiotics in a store environment. The first empirical data was gathered from a focus group (First Strand: Focus Group), the main data was collected from a questionnaire sent out to target primarily international individuals living in Sweden (Second Strand: Main Study).
3.3 First Strand: Focus Group
The following sector will present the gathering of the qualitative data and explain how the finding was utilized to prepare for the main study. The qualitative data was collected from a focus group consisting of nine individuals from various countries around the globe. The researchers of the thesis initially conducted a qualitative focus group of international students from various countries around the globe to discuss their understanding and interpretation of Swedish marketing messages in general. This was done to expand the researcher’s knowledge and to gain better insight into how in-store communication can be
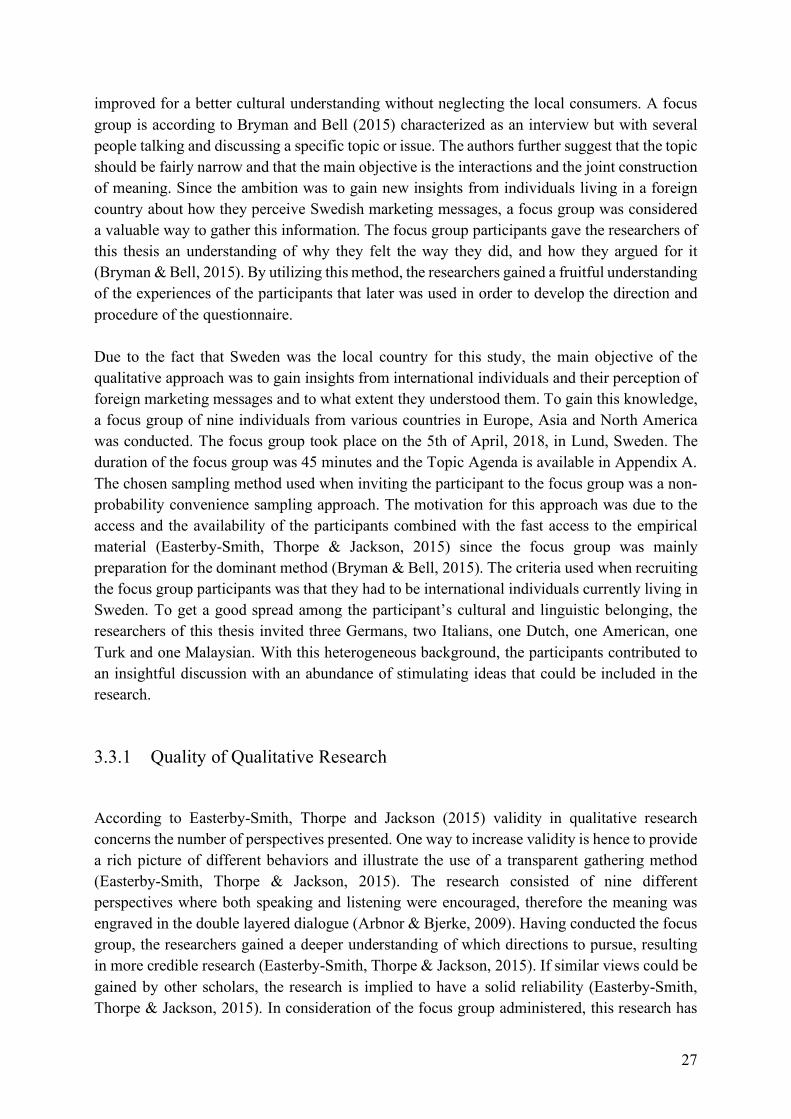
27
improved for a better cultural understanding without neglecting the local consumers. A focus group is according to Bryman and Bell (2015) characterized as an interview but with several people talking and discussing a specific topic or issue. The authors further suggest that the topic should be fairly narrow and that the main objective is the interactions and the joint construction of meaning. Since the ambition was to gain new insights from individuals living in a foreign country about how they perceive Swedish marketing messages, a focus group was considered a valuable way to gather this information. The focus group participants gave the researchers of this thesis an understanding of why they felt the way they did, and how they argued for it (Bryman & Bell, 2015). By utilizing this method, the researchers gained a fruitful understanding of the experiences of the participants that later was used in order to develop the direction and procedure of the questionnaire. Due to the fact that Sweden was the local country for this study, the main objective of the qualitative approach was to gain insights from international individuals and their perception of foreign marketing messages and to what extent they understood them. To gain this knowledge, a focus group of nine individuals from various countries in Europe, Asia and North America was conducted. The focus group took place on the 5th of April, 2018, in Lund, Sweden. The duration of the focus group was 45 minutes and the Topic Agenda is available in Appendix A. The chosen sampling method used when inviting the participant to the focus group was a non-probability convenience sampling approach. The motivation for this approach was due to the access and the availability of the participants combined with the fast access to the empirical material (Easterby-Smith, Thorpe & Jackson, 2015) since the focus group was mainly preparation for the dominant method (Bryman & Bell, 2015). The criteria used when recruiting the focus group participants was that they had to be international individuals currently living in Sweden. To get a good spread among the participant’s cultural and linguistic belonging, the researchers of this thesis invited three Germans, two Italians, one Dutch, one American, one Turk and one Malaysian. With this heterogeneous background, the participants contributed to an insightful discussion with an abundance of stimulating ideas that could be included in the research.
3.3.1 Quality of Qualitative Research
According to Easterby-Smith, Thorpe and Jackson (2015) validity in qualitative research concerns the number of perspectives presented. One way to increase validity is hence to provide a rich picture of different behaviors and illustrate the use of a transparent gathering method (Easterby-Smith, Thorpe & Jackson, 2015). The research consisted of nine different perspectives where both speaking and listening were encouraged, therefore the meaning was engraved in the double layered dialogue (Arbnor & Bjerke, 2009). Having conducted the focus group, the researchers gained a deeper understanding of which directions to pursue, resulting in more credible research (Easterby-Smith, Thorpe & Jackson, 2015). If similar views could be gained by other scholars, the research is implied to have a solid reliability (Easterby-Smith, Thorpe & Jackson, 2015). In consideration of the focus group administered, this research has

28
nine different views from participants originating from different parts of the world. This method delivers a largely heterogeneous participant group and hence strengthens the reliability. By explaining the steps in how the focus group was conducted and how the participants were recruited, the credibility and consequently the quality of the study was increased (Easterby-Smith, Thorpe & Jackson, 2015). Further, the risk of biases were reduced since the researchers of this thesis used a previously prepared Topic Agenda (See Appendix A) that was created and further corrected several times along the way. The researchers also audio-recorded the session which implied that they could listen to the ideas and proposals retrospectively and therefore be sure no important information was excluded (Easterby-Smith, Thorpe & Jackson, 2015).
3.4 Second Strand: Main Study
The largest contribution of this research, the main study, will be presented in this following section. First, an introduction to the questionnaire design and procedure will be elucidated, followed by the sampling process. Finally, the pilot study and control questions will be outlined. The main factor to take into consideration when designing the questionnaire was that it should be able to fulfill the purpose of the research and answer the research question. The preoperational data collection gave the research strength since it filled the gaps needed in order to provide a valid result. The purpose of this research was to test if contemporary symbols can work as a means to translate various messages across both languages and cultures to make it more comprehensible to an international audience. For this purpose, three objectives were forwarded and boiled down to the thesis research question. The first objective for this research aim stated “identify how effective symbols are at increasing the multilingual and cross cultural understanding of marketing messages,” for this objective, a test segment in the questionnaire was developed to observe and measure the effectiveness symbols have at traversing cultural and language boundaries. The second objective for the research stated “identify consumer perceptions of the utilization of symbols in an in-store environment,” for this objective, three hypothesis were developed and performed in the “Perception of Research” section in the findings and result. The third and last objective stated “identify other complementary elements contemporary symbols can add to the in-store environment,” for this objective the research measured factors such as comfort, monetary justifications and attention to signs to see whether or not these symbols contributed to additional aspects of the research. These three objectives were then analyzed and discussed in comparison to the test result and theory which contributed to answering the research question “how can in-store marketing communications be improved for an international audience without neglecting the local consumers?”

29
3.4.1 Questionnaire Design and Procedure
The questionnaire designed, consisted of five segments that will be outlined below: Segment 1 included four biographical questions: age, gender, country of origin and level of Swedish understood (beginner, intermediate, advanced). The results from this segment would help to build a profile of our sample group and allow for better analysis of the data collected in the following segments. Segment 2 consisted of pre-test questions. Here, respondents were asked about their previous experiences in Swedish grocery stores. The questions (See Appendix B, Section 2) in this segment were presented as statements and the respondents were asked to rank their agreement or disagreement on a five point Likert scale (1= strongly disagree, 5= strongly agree). The results from this segment were used to discover what international students believed could be improved within the in-store environment and when combined with the results from the final segment, allowed the researchers to gauge the perceived effectiveness of the proposed strategy. Segment 3 was the first of the two test segments, which was designed with regard to two previous studies: one performed by Shinar and Vogelzang (2013) on the comprehension of traffic signs with symbols versus text, the other by Shinar et al. (2010) on cross-cultural understanding of traffic signs. Here, respondents were presented with ten category signs as they currently appear in Swedish grocery stores with black Swedish text on a white background. Under each sign the respondents were asked to write in one to two English words what they believed the meaning of the sign to be. If the respondents did not know the answer they were asked to write N/A (no answer). The short answer responses from Segment 3 and 4 were scored using the same procedure as Shinar et al. (2010) and Shinar and Vogelzang (2013): completely correct (2 points), partially correct (1 point) (e.g. quiche instead of pie for question #8 or coriander instead of herbs for question #6), incorrect (0 points) (any answer that is completely unrelated to the sign content). The signs used in this segment (See Appendix B, Section 3) were chosen from the frozen food aisle in ICA Tuna, Lund, and ranged from Swedish words similar to their English equivalent, believed to be easily understood such as “soppa” (meaning soup) to more difficult Swedish words, far from their English translation such as “skaldjur” (meaning seafood). After advancing to Segment 4, respondents were asked not to revisit Segment 3. This would prevent respondents that responded N/A to a question in this segment from later changing it after visiting the next segment. Segment 4 used the same signs as the previous segment, but included the addition of colorful symbols similar to emoji’s, directly to the right of the Swedish text (See Appendix B, Section 4). The process for selecting these symbols was undertakes with regard to previous literature on semiotics and cross-cultural marketing. Zender and Cassedy (2014) wrote an article on symbol comprehension in different cultural contexts, which recommends that, for symbols to be understood across cultures, they must have a familiarity to all cultures involved and must avoid specific cultural metaphors. All symbols used in this study were of food products

30
common to the world and were simple enough to avoid any kind of metaphor. Pappachan and Ziefle (2007) noted the importance of a standardized design when testing the cross cultural understanding of signs. With respect to this, all symbols used in this study were chosen to be as consistent as possible (e.g. same amount of color and graphics). McDougall, Curry and Bruijn (1999) discovered a correlation between concreteness and meaningfulness, dictating that symbols representing real world concrete objects are more easily understood by all, thus the symbols chosen for this research all resemble food products that have a high degree of concreteness. Finally, Alshenqeeti (2016) explains that colorful symbols, like emoji’s, add a nuance to communication and allow for language creativity. With regard to this, all symbols chosen included colors in an attempt to draw more attention and add excitement to the signs. The procedure for this segment was the same as in the previous section, and the results from Segment 3 and 4 were used to analyze the change in respondents’ understanding of the signs. Segment 5 consisted of statements relating to the test segments three and four (See Appendix B, Section 5). Here, respondents were asked to rate their agreement or disagreement on a five point Likert scale (1= strongly disagree, 5= strongly agree). The results from this segment were used to gauge whether or not the respondents believed the strategy of this research would be effective, as well as capture more data about cultural sensitivity and possible implications.
3.4.2 Sampling Method
The target population for this study was the 1,877,050 international individuals currently living in Sweden (Statistikdatabasen, 2018). The sampling technique utilized was non-probability convenience sampling. Easterby-Smith Thorpe and Jackson (2015) clarify that in a non-probability sampling design, it is not possible to affirm the probability of the respondents being a member of the sampled population. Due to this fact, the authors acknowledge that it is difficult for the researchers, conducting a study of this kind, to be confident about the claims made and their applicability to the to a larger population than the one the sample is taken from. This limitation of the sampling approach will be considered by the authors of this thesis and carefully acknowledged in the discussion and conclusion chapters. Moreover, the convenience sampling approach is common in research due to the fact that the selected sample is easily accessible to the researchers (Easterby-Smith Thorpe & Jackson, 2015). A link to the questionnaire was posted on various Lund University Facebook groups consisting of international students as well as other Facebook groups consisting of internationals living in Sweden. Additionally, further responses were captured by visiting study locations around Lund University and prompting international students to participate in the study. If an individual agreed to participate in the questionnaire, a link was sent and the respondents could complete it in their own time. According to Easterby-Smith, Thorpe and Jackson (2015), collecting samples from social media sites such as Facebook could result in a greater sample of the younger generations by cause of their social network.

31
This strategy of gathering data was believed by the authors of this thesis to be a valid way of collecting empirical material since the aim was to get a good spread of international individuals. A group of people not included in the original target population was those of Swedish nativity or advanced speakers of the language. Nevertheless, some of these individuals were included, resulting in different groups that could be compared, consequently leading to a more expansive understanding of how symbols can be implemented in a store environment without neglecting the local consumers. Moreover, since the research specifically did not target these individuals, there exists a lack of representativeness in the research data which could affect the validity. The respondents identified themselves as either having “beginner,” “intermediate,” and “advanced” understanding of the Swedish language which produced groups that could be further compared against each other. Due to the fact that the group sizes were unequal, careful analysis techniques were used to offset this discrepancy of the sample sizes.
3.4.3 Pilot Study
Before sending the study out to the international respondents, the authors of this thesis send it to 32 individuals from different countries and with different knowledge levels of the Swedish language who gave feedback for further improvements. The pilot study was used as a means to ensure that the questionnaire was understood by the potential respondents and that the expressions and key concepts were explained in a comprehensive way to avoid biases. Such potential biases that could occur and disturb the results of the research can be avoided with the use of a pilot study (Bryman & Bell, 2015). The most valuable insights given from the pilot study was that several questions could be excluded since they did not give the researchers anything to analyze which further helped to make the survey more precise and in accordance to the purpose of the research. From the result of the pilot study, the authors of this thesis discovered that the question concerning the English proficiency was unnecessary due to the premise that most individuals living in Sweden understand simple words in English. Additional questions that were removed from the questionnaire were in the test segments regarding the words and symbols since those questions were regarded too close to the English language and hence, considered too simple and could disturb the result.
3.4.4 Control Question
The questionnaire included one control question, stating; “I have been to a grocery store in Sweden” and the aim with this question was to control whether or not the respondents had experience in a grocery store in Sweden. If the respondents had not visited a grocery store, their contribution to the research was considered biased due to lack of experience. In this segment, nine respondents answered “no” and these were excluded from the questionnaire, leaving 702 respondents to analyze.
3.4.5 Questions Omitted

32
The questionnaire originally consisted of 38 questions, 20 in the two test segments and 18 Likert scale statement questions (See Appendix B). No questions from the tests segments were omitted, but some questions from the other segments were deemed insignificant or redundant and therefore removed from the analysis. The first omitted question asked the respondents if they believed Lund is an international city. Since after the survey was opened up for public completion, it was decided to expand the target population to all international individuals living in Sweden not just those in Lund, it was found that some of the respondents were not familiar with Lund as a city and therefore could not answer the question with accuracy. Instead, the question posing “I believe Sweden is an international country” was used to gather appropriate data. The next omitted question posed the statement “I find it difficult to navigate through Swedish grocery stores.” It was deemed redundant with regard to the two questions preceding: “I notice the food category signs in Swedish grocery stores” and “I understand the food category signs in Swedish grocery stores.” The authors of this thesis believed that if a customer did not notice and could not understand food category signs then they would have trouble navigating through the store. The results supported this assumption; therefore the question was removed from the analysis. The next question omitted from the analysis stated “I believe the colorful symbols used in this survey would improve my shopping experience.” This question was removed because it produced the same results as the question directly succeeding it that stated, “I believe the colorful symbols used in this survey would draw my attention better to the category signs in Swedish grocery stores.” The question that stated “Adding appropriate symbols next to the Swedish text would help me to better navigate the store” was also removed due to the fact that the previous question relating to navigation was removed as well. Further, the question posing “Adding symbols next to Swedish text would make me feel more included” was removed due to another question relating to comfort receiving the same result. Comfort and inclusion could be considered synonymous and since the results were similar this question was deemed redundant. Finally, the last question omitted from the analysis asked whether or not the respondents believed replacing Swedish text with English text would be more effective then adding symbols. The question succeeding it asked if the respondents believed replacing Swedish text with English would neglect the local culture received a high degree of agreement and since part of the research question involved not neglecting the local culture, the aforementioned question was deemed irrelevant.
3.5 Craft of Analysis
For the analysis, the segments of the questionnaire will be presented as follows: Segment 2 of the questionnaire that included questions about the respondents’ perceptions of Swedish grocery stores will be presented as Section 1 of the analysis and also referred to as Section 1 for the remainder of the thesis. The first three questions of Segment 5 of the questionnaire that asked about respondents perceptions of the research will presented as Section 2 of the analysis and also referred to as Section 2 for the remainder of the thesis. The final two questions of Segment 5 of the questionnaire that presented questions about neglecting the local culture will be presented as Section 3 of the analysis and also referred to as Section 3 for the remainder of

33
the thesis. Segment 3 and 4, the test segments of the questionnaire will be referred to and presented as 4a and 4b of the analysis respectively. Section 4a presented signs with Swedish text only and Section 4b presented the same signs but with the addition of descriptive symbols.
Table 3.1 Section Reference Table
The analysis was conducted with the use of two statistical tools on SPSS. First, a one way analysis of variance (ANOVA) was used for all questions in the first (Perceptions of Swedish Grocery Stores) and second sections (Perceptions of Research) of the analysis. The ANOVA allows for the testing of mean differences between more than two treatment conditions (Burns & Burns, 2008). A one way ANOVA was selected for this analysis because it divides the independent variable (level of Swedish understanding) into its three categories (beginner, intermediate and advanced) and attempts to identify significant differences between these categories with regard to the dependent variable (questionnaire responses) (Burns & Burns, 2008). The purpose of ANOVA is to measure whether variances in the mean scores are actually significantly different or simply random sampling error variations (Burns & Burns, 2008). To further analyze the data and identify specifically where the variances occur, a post hoc test is needed (Burns & Burns, 2008). For this, the Bonferroni post hoc test will be used, due to the facts that there are only three comparisons to be made, and that the sample sizes of the categories within the independent variable (level of Swedish understanding) are not equal (Burns & Burns, 2008). This variation in group sizes could poses problems with regard to homogeneity of variances and weighted results, but since ANOVA is rather robust (Burns & Burns, 2008) and the analysis of the results predominantly controls for level of Swedish understanding, these problems are mitigated. For the two questions in Section 3, the ANOVA shows no significant differences in the means of the three levels of Swedish understanding. Therefore, a one sample T-test will be used to for Section 3. A one sample T-test is used to test if the sample mean differs from a set population mean (Burns & Burns, 2008). For this analysis, the population mean or test value will be set at 2.5, representing an indifferent level of agreeance to the statement. Any mean difference will represent the intensity of agreement or disagreement. Similar methods of analysis were used for the Sections 4a and 4b of the analysis. A one way ANOVA was used to analyze the data from the section as a whole. An average score was computed for all questions in Section 4a as well as Section 4b. First, the average results from Section 4a were loaded as the dependent variable and level of Swedish understanding was used

34
as the independent variable. This process was then repeated for Section 4b. Post hoc tests were then performed in the same fashion as in Sections 1 and 2 of the analysis. For further analysis, paired sample T-tests were performed. A paired T-test is used when testing for mean differences between two groups that are related in some way and hence, not independent of each other (Burns & Burns, 2008). The results from Section 4a and 4b are produced by the same respondents and the content of the two sections are very closely related. Therefore, this method of analysis is deemed valid for this research and the T-tests were performed in two capacities. First, the overall scores from Section 4a were compared to those of Section 4b. This was performed in four different manners with level of Swedish understanding controlled for (all levels, beginner, intermediate and advanced). Next, the same tests were conducted, but each individual question from Section 4a was compared to its mate from Section 4b.
3.5.1 Correlation
This thesis has chosen to accept a statistical significance level of p < 0.05 which means that there is a 5% risk that the result displays correlations in the sample that does not match with the population (Körner & Wahlgren, 2006). A significance level of p < 0.05 is exceedingly the one most commonly used in quantitative research (Körner & Wahlgren, 2006).
3.6 Quality of Research
When conducting this research, the authors were set to provide transparency about the research process as well as provide the reader with a high degree of reproducibility (Bryman & Bell, 2015; Easterby-Smith, Thorpe & Jackson, 2015). The researcher should according to Rosengren and Arvidsson (2002), be able to confirm that the outcome of the study is trustworthy. Moreover, Bell, Waters and Nilsson (2016) refer to the importance of being critical of the choice of research method and that being critical could strengthen the reliability regarding the chosen approach. Bryman and Bell (2015) define quantitative reliability as a way to measure the consistency of a concept, and this can be done with the use of three prominent factors; stability, internal reliability and inter-rater reliability. Further, Easterby-Smith, Thorpe and Jackson (2015) explain that reliability in a questionnaire design is paramount since it will assess whether the questionnaire could have the same result each time it is used, hence it lies as grounds for the approximations for the underlying concepts of interest. Moreover, it is according to Bryman and Bell (2015) of great importance in quantitative research to measure reliability since the measurements used should aim to be stable. According to the authors, internal reliability is whether the research is internally consistent and one way to test this is through a measurement called Cronbach’s Alpha. This measurement is the most common one to test the internal consistency and examines the average of the correlations in the combinations of split-halves that is determined (Heale & Twycross, 2015). In this test, the result is a number

35
between 0 and 1 and according to Heale and Twycross (2015), an acceptable score is around 0.7 and higher. When running the Cronbach’s Alpha test on the 20 questions in the test sections of the main study, the reliability scored 0.858 which is higher than 0.7 and thus proves that the test section is internally consistent.
Table 3.2 Cronbach’s Alpha
According to Bryman and Bell (2015), stability in quantitative research refers to whether or not a measure is stable over time. Moreover, stability shows if the results, gathered from a sample of respondents relating to the measure, does not fluctuate (Bryman & Bell, 2015). Bryman and Bell (2015) state that the most understandable way to test this is with the use of a test-retest method. To improve the stability of this research, several pre-tests were conducted when developing the questionnaire. The pre-tests were done both during the development and also with the use of a pilot study when the questionnaire was sent out to 32 respondents who later gave feedback. To ensure the stability of the present study, the authors of this thesis sent the questionnaire out to individuals with different generational and educational backgrounds. The issue of subjective decision-making by the researchers is the issue of inter-rater reliability (Bryman & Bell, 2015). There is a risk that research consisting of a considerable amount of subjective judgement will lack consistency in the decision making which impacts the inter-rater reliability (Bryman & Bell, 2015). This study involved a small amount of subjective decision making, for example when choosing which symbols to use in this experiment. Though these decisions were guided by literature they were chosen solely by the researchers and have the possibility of producing biased results. Furthermore, triangulation is a concept that applies when researchers are using two or more methods or sources of data in the study. Throughout this research, two different data collecting processes were utilized to gather the empirical material which enhanced the reliability. Mertens and Hesse-Biber (2012) explain that previously, many different scholars used the concept of triangulation as a justification for the use of a mixed method. Nevertheless, the author’s further state that the mix between qualitative and quantitative data can aim at illustrating a deeper and more complete understanding of a phenomenon studied. Triangulation is hence an excellent way to capture multiple dimensions of a research phenomenon. Bryman and Bell (2015) refer to validity as the device able to measure whether or not a concept really measures what it is intended to. The authors further suggest that there are various ways to measure validity but the most commonly used measure considers internal and external validity. Bryman and Bell (2015) explain the concept of internal validity as a match between

36
the theoretical ideas and the researcher’s observations. Trost and Hultåker (2012) illustrate the importance of being comprehensible and concrete in the questions since there is no allowance for follow-up questions or detailed answers in a questionnaire. This issue was taken into account and minimized due to the pilot study where the researchers gained understanding about how potential respondents interpreted the questions. Moreover, Bradburn, Sudman and Wansink (2004) explain that in questionnaires‚ as a tool for measurement, it is crucial to be aware that it does not actually measure the respondents’ definite behavior, but instead the experienced. Furthermore, the authors state that it is hard to make sure that the respondents are being authentic in their answers, but this risk was decreased due to the fact that the questionnaire used in this research did not contain any questions of an intimidating nature. The external validity is a measurement of the degree to which findings can be generalized (Bryman & Bell, 2015), and this can be in terms of people, situations, techniques of measurements and places (Calder, Phillips & Tybout, 1982). In terms of the external validity, the sample should be as close as possible to the population (Bryman & Bell, 2015). In this research, the gender differences (75% female respondents, 24% male and 1% other) might lower the external validity since this is not comparable to the real world population and hence lacks population validity. Moreover, the data collection process was limited to the respondents who had access to the online social media site Facebook or could be found in Lund, Sweden. The fact that the questionnaire was voluntary could also affect the external validity of the research (Johansson, 2010) since specific groups of individuals might reject or ignore the opportunity to answer a questionnaire. These sampling flaws could consequently lead to difficulties in the capabilities to generalize to the wider population, hence generalizations of the results or to other contexts should be done with caution.
3.7 Ethical Reflections
Reflecting on the ethical factors that might have influenced the research is crucial, according to Easterby-Smith, Thorpe and Jackson (2015). Hence, the authors of this thesis will reflect below on ten principles of ethical dilemmas that were established by Easterby-Smith, Thorpe and Jackson. The key principles of research ethics are according to Easterby-Smith, Thorpe and Jackson (2015); to ensure no harm for the respondents, respecting the respondents dignity, ensure that the respondents are fully informed, protect the privacy of the respondents, ensure confidentiality of the research data, protect and ensure that the respondents or organization remain anonymous, make sure not to avoid the deception of the research aim or research nature, declare the conflicts of interest, declare the affiliation and the funding of the research, remain honest and transparent throughout the research and in communication and avoid misleading or false reporting in the research. The participants of the focus group are presented with their country of origin, a decision the researchers took to present the members in a valid way. The participants of the focus group were asked both before and after the focus group if it was acceptable to use their answers in the thesis to which every respondent agreed. Due to the aim

37
of this research, the respondents in the questionnaire had to fill in their age, gender, country of origin and their level of Swedish understood. The researchers did not collect further information about the respondents and hence, their anonymity can be ensured since the respondents cannot be re-traced. Moreover, an ambition in this thesis was to deliver a transparent method to avoid misleading data interpretation that could result in false reporting, hence the procedure of how the empirical data was collected and analyzed was described in detail to the reader. No funding was collected in this research project so that the authors of this thesis were not tied to any specific demands or needs that had to be fulfilled, leading to an honest research reflected in the data. Except for the aforementioned facts, the awareness of these ethical principles has been taken into account and their protection guaranteed.

38
4 Findings and Analysis
This chapter presents the empirics that were collected and analyzed in accordance to the method presented in Chapter three (Methodology). The empirical data was analyzed using SPSS software and presented with regards to the hypothesis derived from the Literature Review.
4.1 First Strand: Focus Group
4.1.1 Misconceptions of Marketing Messages for International Individuals
The aim of the conducted focus group was to gain a better understanding of the marketing messages in Sweden that international students did not understand. Many ideas brought to light by the participants of the focus group were taken into consideration when developing the main research. A few of these statements are presented as follows:
I can understand sales, but other than that I have no idea what is going on
I spent three hours in ICA because it was such a struggle for me to find anything
They don’t make it clear where the products are located
I couldn’t understand packaging or signs around the store
I personally feel that anything would be better than how it is now
These statements from the participants in the focus group clearly illustrate that there is an absence in understanding for international individuals while shopping. When asked about product category signage in Swedish grocery stores, all of the focus group participants stated that they did not even know that there were category signs hanging above the aisles or the frozen food section. From this, the authors of this thesis made the primary assumption that it was due to a subconscious identification of the foreign language signs leading to a conscious disregard, and a secondary assumption that it may be due to the drab nature of the simple signs.
I don’t recognize signage here at all, but I do back at home

39
When asked why the participants believed they had failed to notice those signs, a participant answered:
Maybe it is because we know that we won’t understand so we don’t bother to look
Consequently, when asked what they believe would help them better notice and understand these signs one of the participants answered that adding symbols or pictures next to the Swedish words would help.
I think it might be easier to have the name in Swedish and then a picture next to it as well
Another participant said that if color was added it might draw more attention to the signs.
Colors are also a universal language Nevertheless, the participants understood the importance of not neglecting the local customers by completely replacing the native language to English. As stated by one participant:
I understand that we are guests here, but for business purposes they should make communication more understandable
These discoveries led to the design of the main study. In the form of an online questionnaire, the main study tested the multilingual understanding of adding symbols to the category signs above the frozen food section. As an addition to this, it was decided to use colored symbols similar to emoji’s in an attempt to draw more attention to the food category signs.
4.2 Second Strand: Main Study
4.2.1 Descriptive Statistics
The online questionnaire received a total amount of 711 respondents and was out for the public completion from the 20th of April to the 1st of May, 2018. Out of the 711 respondents, nine respondents had never been to a Swedish grocery store and were thus removed from the results, leaving 702 responses to analyze. The respondents age varied from 18-69 years old with an outlier of one 98 year old respondent (not included in graph). See Table 4.1:

40
Figure 4.1 Age of Respondents
The average age (mean value) of the respondents was calculated to be 30 years of age, while the median age of the respondents was calculated to be 26.5 years. According to Smith (2008) with support from Goyder (1986) and Moore and Tarnai (2002), younger individuals are more inclined to engage in a questionnaire. This claim is supported by the fact that the highest concentration of respondents was between 20-30 years old. The gender difference of the 702 respondents was divided into 525 female respondents (75%), 169 male respondents (24%) and 8 respondents referring to themselves as “other” (1%). The high amount of female responses could be a result of the gender balance in Swedish Universities since the questionnaire was largely distributed in this environment. According to uhr.se (2018) women have accounted for almost 65% of the applicants to Swedish universities for the past 11 years and during the last three years this number has increased further. Continuously, findings from uhr.se (2018) explain that the reason behind this trend is difficult to pinpoint, but one reason might be the labor market and that it has become easier for males to get a job in the physical labor industry without further education. Furthermore, according to Smith (2008), trends do exist in survey respondents. The author, with support from Curtin, Presser and Singer (2000), states that more educated and affluent individuals are more likely to respond to a survey and that women are also more inclined to engage in a survey than men. This can have some implications on the result since it could have a biased female perspective. Nevertheless, this does not affect the result intrinsically due to the fact that the gender differences are not compared further or believed to be of importance to this research. An amount of 70 various countries were represented in the survey and a further amount of 31 respondents filled out “other” as a country, meaning their native country was not an option

41
given out of the 102 countries included in the questionnaire. A summary of the general origin of the respondents is depicted in the figure 4.2:
Figure 4.2 General Origin of the Respondents from the Questionnaire
When completing the questionnaire, the respondents had to indicate their level of Swedish understanding. There, 381 respondents (55%) referred to themselves as “beginners”, 199 respondents (28%) as “intermediate” and 122 respondents (17%) as “advanced”. These groups have been compared against each other to identify the differences in understanding the signs for individuals with different abilities in the Swedish language.
4.2.2 Degree of Internationality in Sweden
When sampling respondents for the questionnaire, a focus was primarily set on international individuals living in Sweden. A large amount of respondents were recruited from Facebook groups of international individuals or expatriates living in the country. One question found in Segments 1 of the questionnaire stated “I believe Sweden is a highly international country” and the reason for asking this question was to find out whether the respondents believed themselves to be in an international country where research like this could be applicable. The respondents could rate their agreement or disagreement on a five point Likert scale (strongly disagree = 1, strongly agree = 5). The results show a high level of agreement to this question and are illustrated in Table 4.3:

42
Figure 4.3 Sweden's Degree of Internationality According to the Questionnaire Respondents
4.3 Hypothesis Testing
This segment will test the 16 hypotheses mentioned in Chapter two in a quantitative matter, resulting in an acceptance of either the null (Ho) or alternative hypothesis (Ha). The alternative hypothesis will act as a title for each point of analysis and the acceptance or rejection will conclude the individual hypothesis tests.
4.3.1 Section 1: Perceptions of Swedish Grocery Stores
Section 1 was composed of questions attempting to gain a better understanding of individual’s perceptions of Swedish grocery stores. Each question was presented in the form of a statement and the respondents were asked to rank their agreeance on a five point Likert scale (strongly disagree = 1, strongly agree = 5). The mean scores of each question for all 702 respondents are presented first. While these scores do accurately represent the respondents’ general beliefs of the posed questions, the data becomes more descriptive when level of Swedish understanding is controlled for. For more descriptive results, a one way ANOVA was performed with responses to the questions as the dependent variable and level of Swedish understanding as the independent variable. Results from the ANOVA indicate whether or not there is a significant difference in the mean scores of the three levels, but to further identify where these differences

43
occur, a Bonferroni post hoc test was performed. All tables from the SPSS analysis are presented in Appendix C.
Hypothesis 1a: An individual’s ability to understand the local language has a significant impact on their noticing of food category signs. Statement 1: I notice the food category signs while in Swedish grocery stores
Table 4.1 Hypothesis 1
The mean score for all 702 respondents indicated an overall high to mid-level of agreeance (x̄ = 3.558). The ANOVA produces an F statistic of 10.678 with an associated probability value of .000, which is below the significance level of .05, suggesting there is a significant mean difference between the groups. Post hoc results point to this difference predominantly occurring between beginner and intermediate Swedish speakers (M beginner 3.367 - M intermediate 3.804 = -.4366). This mean difference is proven significant with an associated probability of .000, which is below the significance level of .05. Therefore, the null hypothesis of equal means is rejected. The alternative hypothesis of ability to understand the local language significantly impacting an individual's noticing of food category signs is accepted. Findings from the previously held focus group indicated that many respondents did not notice these signs. This evidence led to the premise of the main study and results from this question further solidify this information. The results show that respondents with lower levels of Swedish understanding do not notice food category signs with the same prevalence as those with higher levels. This is most likely due to their subconscious disregard of information presented in a foreign language.

44
❌ Hypothesis 1o: Rejected ✅ Hypothesis 1a: Accepted
Hypothesis 2a: An individual’s ability to understand the local language has a significant impact on their understanding of category signs.
Statement 2: I understand the food category signs while in Swedish grocery stores
Table 4.2 Hypothesis 2
The mean score for all 702 respondents indicated an overall high to mid-level of agreeance (x̄ = 3.815). The ANOVA produces a large F statistic of 147.432 with an associated probability value of .000, which is below the significance level of .05, suggesting there is a significant mean difference between the groups. Post hoc results point to this difference predominantly occurring between beginner and advanced Swedish speakers (M beginner 3.231 - M advanced 4.73 = -1.4985). This mean difference is proven significant with an associated probability of .000, which is below the significance level of .05. Therefore, the null hypothesis of equal means is rejected. The alternative hypothesis of ability to understand the local language significantly impacting an individual's understanding of food category signs is accepted. The results from this question, pointing to a much higher understanding of food category as Swedish understanding levels increase, may be obvious, but is the basis of the research and when tied to the results from the test sections, adds validity.

45
❌ Hypothesis 2o: Rejected ✅ Hypothesis 2a: Accepted
Hypothesis 3a: An individual's ability to understand the local language has a significant impact on their feelings of comfort while in a foreign grocery store. Statement 3: I feel comfortable when in a Swedish grocery store
Table 4.3 Hypothesis 3
The mean score for all 702 respondents indicated an overall high level of comfort (x̄ = 4.138). But this comfort is not consistent across the three groups. The ANOVA produces an F statistic of 22.32 with an associated probability value of .000, which is below the significance level of .05, suggesting there is a significant mean difference between the groups. Post hoc results point to this difference predominantly occurring between beginner and advanced Swedish speakers (M beginner 3.937 - M advanced 4.451 = -.5138). This mean difference is proven significant with an associated probability of .000, which is far lower than the significance level of .05. Therefore, the null hypothesis of equal means is rejected. The alternative hypothesis of ability to understand the local language significantly impacting an individual's feelings of comfort while in Swedish grocery stores is accepted.
❌ Hypothesis 3o: Rejected ✅ Hypothesis 3a: Accepted

46
Hypothesis 4a: Individuals with a low level understanding of the local language would spend more money in foreign grocery stores if they felt more comfortable. Statement 4: If I felt more comfortable in a Swedish grocery store I would spend more money there
Table 4.4 Hypothesis 4
The mean score for all 702 respondents indicated an overall mid-level of agreeance (x̄ = 2.769). The ANOVA produces an F statistic of 5.028 with an associated probability value of .007, which is below the significance level of .05, suggesting there is a significant mean difference between the groups. Post hoc results point to this difference predominantly occurring between beginner and advanced Swedish speakers (M beginner 2.882 - M advanced 2.467 = .4147). This mean difference is proven significant with an associated probability of .005, which is below the significance level of .05. Therefore, the null hypothesis of equal means is rejected. The alternative hypothesis that individuals less capable of understanding the local language would spend more money in foreign grocery stores if they felt more comfortable is accepted. Here, the results show a positive mean difference meaning that the respondents tended to agree less with the statement as their level of Swedish understanding increased. This is an opposite trend to the previous question where respondents with higher levels of Swedish tended to agree more with that statement, but points to the same conclusion. Respondents with lower levels of Swedish understanding do not feel as comfortable and believe they would spend more money if their feeling of comfort were increased.

47
❌ Hypothesis 4o: Rejected ✅ Hypothesis 4a: Accepted
4.3.2 Section 2: Perception of Research
The questions that make up Section 2 were presented after the main test segments of the questionnaire and were composed of questions designed to gather information about the respondent’s perceptions of the proposed research. Each question was presented in the form of a statement and the respondents were asked to rank their agreeance on a five point Likert scale (strongly disagree = 1, strongly agree = 5). The mean scores of each question for all 702 respondents are presented first. While these scores do accurately represent the respondents’ general beliefs of the posed questions, the data becomes more descriptive when level of Swedish understanding is controlled for. For more descriptive results, a one way ANOVA was performed with responses to the questions as the dependent variable and level of Swedish understanding as the independent variable. Results from the ANOVA indicate whether or not there is a significant difference in the mean scores of the three levels, but to further identify where these differences occur, a Bonferroni post hoc test was performed. Hypothesis 5a: Adding a symbol next to the text in the local language will increase the multilingual understanding of food category signs. Statement 5: Adding appropriate symbols next to the Swedish text increases my understanding of the signs
Table 4.5 Hypothesis 5

48
The mean score for all 702 respondents indicated an overall high level of agreeance (x̄ = 4.218). The ANOVA produces a large F statistic of 109.886 with an associated probability value of .000, which is below the significance level of .05, suggesting there is a significant mean difference between the groups. Post hoc results point to this difference predominantly occurring between beginner and advanced Swedish speakers (M beginner 4.654 - M advanced 3.098 = 1.5552). This mean difference is proven significant with an associated probability of .000, which is below the significance level of .05. Therefore, the null hypothesis of equal means is rejected. The alternative hypothesis that adding symbols to food category signs will increase the understanding of internationals is accepted.
❌ Hypothesis 5o: Rejected ✅ Hypothesis 5a: Accepted
Hypothesis 6a: Adding symbols next to the local language text on food category signs will increase the comfort of internationals. Statement 6: Adding symbols next to the Swedish text of category signs would make me feel more comfortable in a Swedish grocery store
Table 4.6 Hypothesis 6
The mean score for all 702 respondents indicated an overall mid to high level of agreeance (x̄ = 3.584). The ANOVA produces an F statistic of 52.871 with an associated probability value of .000, which is below the significance level of .05, suggesting there is a significant mean difference between the groups. Post hoc results point to this difference predominantly occurring between beginner and advanced Swedish speakers (M beginner 3.976 - M advanced 2.73 = 1.2469).

49
This mean difference is proven significant with an associated probability of .000, which is below the significance level of .05. Therefore, the null hypothesis of equal means is rejected. The alternative hypothesis that adding symbols to food category signs will increase the comfort levels of internationals is accepted. A previous question in the pre-test section found that respondents with lower levels of Swedish understanding feel less comfortable while in Swedish grocery stores. The question directly following that found that if those individuals did feel more comfortable they would spend more money. The results from this question identify that the addition of symbols will make individuals with lower levels of Swedish understanding feel more comfortable while in Swedish grocery stores. Therefore, the conclusion can be drawn that the ambition of this research, adding symbols next to the Swedish text on the food category signs in Swedish grocery stores, will have a positive monetary impact.
❌ Hypothesis 6o: Rejected ✅ Hypothesis 6a: Accepted
Hypothesis 7a: The use of colorful, contemporary symbols will draw more attention to category signs. Statement 7: I believe the colorful symbols used in this survey would draw my attention better to the category signs in Swedish grocery stores
Table 4.7 Hypothesis 7

50
The ANOVA produces an F statistic of 35.373 with an associated probability value of .000 which is below the significance level of .05, suggesting there is a significant mean difference between the groups. Post hoc results point to this difference predominantly occurring between beginner and advanced Swedish speakers (M beginner 4.32 - M advanced 3.443 = .8776). This mean difference is proven significant with an associated probability of .000, which is below the significance level of .05. Therefore, the null hypothesis of equal means is rejected. These results suggest that individuals with lower levels of Swedish understanding do believe that the colorful symbols used in test Section 4b would draw their attention better compared to individuals with higher levels of Swedish understanding, but the mean score from all the respondents in the study also supports the hypothesis. All 702 respondents indicated a high level of agreement to this statement producing a mean score of 4.07. These results support the alternative hypothesis that adding colorful symbols to food category signs will better draw the attention of all customers.
❌ Hypothesis 7o: Rejected ✅ Hypothesis 7a: Accepted
4.3.3 Section 3: Neglecting the Local Culture
For the two questions in this section, the ANOVA showed no significant difference in the mean values between levels of Swedish understanding. Therefore, a One Sample T-test was performed for these questions with the responses as the test variable and 2.5 (indifferent level of agreeance) as the test value. Hypothesis 8a: Replacing local language text with English text would neglect the local culture. Statement 8: Replacing the Swedish text with English text would neglect the local culture
Table 4.8 Hypothesis 8
The mean score for all 702 respondents indicated an overall high level of agreeance (x̄ = 4.269). A large mean difference of 1.7692 shows the respondents intensity of agreement with this statement. The T value of 45.683 received an associated probability value of .000 which is below the significance level of .05, pointing to the significance of the difference between the

51
test value and the sample mean. Therefore, the null hypothesis of equal means is rejected. The alternative hypothesis that replacing local texts with English text would neglect the local culture is accepted.
❌ Hypothesis 8o: Rejected ✅ Hypothesis 8a: Accepted
Hypothesis 9a: Adding symbols next to the local language text would not neglect the local culture. Statement 9: Adding symbols next to the Swedish text would neglect the local culture
Table 4.9 Hypothesis 9
The mean score for all 702 respondents indicated an overall high level of disagreement (x̄ = 1.765). A mean difference of -.7350 shows the respondents moderate intensity of disagreement with this statement. The T value of -18.16 received an associated probability value of .000, which is below the significance level of .05, pointing to the significance of the difference between the test value and the sample mean. Therefore, the null hypothesis of equal means is rejected. The alternative hypothesis that adding symbols next to the local language text would not neglect the local culture is accepted.
❌ Hypothesis 9o: Rejected ✅ Hypothesis 9a: Accepted
4.3.4 Section 4: Test Section
This section presents the results from the two test sections. There, respondents wrote in short answers of what they believed the presented food category signs meant. Their answers were coded as follows: correct = 2, partially correct = 1, incorrect = 0. This provided interval data and was analyzed using ANOVA and paired sample T-tests. In the first of the main test sections, respondents were presented with ten food category signs comprised of Swedish text only.

52
Hypothesis 10a: An individual's ability to understand the local language has a significant impact on their understanding of the food category signs in Section 4a.
Table 4.10 Hypothesis 10
The ANOVA produces a large F statistic of 216.264 with an associated probability value of .000 which is below the significance level of .05, suggesting there is a significant mean difference between the groups. Post hoc results point to this difference predominantly occurring between beginner and advanced Swedish speakers (M beginner 1.2079 - M advanced 1.8607 = -.65278). This mean difference is proven significant with an associated probability of .000 which is below the significance level of .05. Therefore, the null hypothesis of equal means is rejected. The effect size (58.579/153.248 = .382) suggests that 38.2% of the variance in signage understanding for this section can be explained by the respondents’ understanding of Swedish. The alternative hypothesis that ability to understand the local language has a significant impact on the understanding of food category signs in Section 4a is accepted.
❌ Hypothesis 10o: Rejected ✅ Hypothesis 10a: Accepted
In the second of the main test sections, respondents were presented with ten food category signs comprised of Swedish text accompanied by a descriptive symbol.

53
Hypothesis 11a: An individual's ability to understand the local language has a significant impact on their understanding of the food category signs in Section 4b.
Table 4.11 Hypothesis 11
The ANOVA produces a very small F statistic of .027 with an associated probability value of .974 which is far higher than the significance level of .05, suggesting there is no significant mean difference between the groups. Post hoc results confirm this, showing no significant mean differences or apparent trends. Therefore, the null hypothesis is accepted. The effect size (.012/160.306 = .000) suggests that 0% of the variance in signage understanding for this section can be explained by the respondents understanding of Swedish. The hypothesis that ability to understand the local language has a significant impact on understanding of food category signs in Section 4b is rejected.
✅ Hypothesis 11o: Accepted ❌ Hypothesis 11a: Rejected
The results from the ANOVA show a large variance in the understanding of the food category signs in Section 4a with Swedish text only. This variance is due to the respondents’ ability to understand Swedish and while the results may seem like an insignificant contribution, when compared to those of Section 4b, they become more symbolic. In Section 4b where respondents were presented with the same food category signs but accompanied with descriptive symbols, the individual's ability to understand Swedish had no impact on their understanding of the signage. This suggests that the addition of symbols to food category signs can increase their multilingual understanding.

54
To illustrate the discrepancies of the two test sections further, a Paired Sample T-test was performed with four different control measures. First, Section 4a and 4b were compared with no consideration for the respondents’ level of Swedish understanding. Next, a filter was applied and the two sections were compared using only the results from the respondents with a beginner level of Swedish understanding. The same analysis was then performed for intermediate and advanced levels of understanding. Hypothesis 12a: For all respondents, the mean scores from Section 4a are significantly different than the mean scores from Section 4b.
Table 4.12 Hypothesis 12
The mean scores for all 702 respondents in Section 4a were smaller than in Section 4b resulting in a negative mean difference (M4a 1.4702 - M4b 1.7464 = -.27621), meaning that the respondents in Section 4b scored an average of 13.8% (.27621/2) higher than in Section 4a. The associated probability value is equal to .000 which is below the significance level of .05, proving that there is a significant difference in the mean values of the two sections. Therefore, the null hypothesis of equal means is rejected and the alternative hypothesis is accepted. These results show that, for all 702 respondents in the study, the addition of descriptive symbols next to the Swedish text increased the understanding of the food category signs by 13.8%.
❌ Hypothesis 12o: Rejected ✅ Hypothesis 12a: Accepted

55
Hypothesis 13a: For respondents with a beginner level of Swedish understanding, the mean scores from Section 4a are significantly different than the mean scores from Section 4b.
Table 4.13 Hypothesis 13
The mean scores for the 381 respondents with a beginner level of Swedish understanding in Section 4a were smaller than in Section 4b, resulting in a negative mean difference (M4a 1.2079 - M4b 1.7428 = -.53491) meaning that the respondents in Section 4b scored an average of 26.7% (.53491/2) higher than in Section 4a. The associated probability value is equal to .000 which is below the significance level of .05, suggesting that there is a significant difference in the mean values of the two sections. Therefore the null hypothesis of equal means is rejected and the alternative hypothesis is accepted. These results show that, for the 381 respondents in the study with a beginner level of Swedish understanding, the addition of descriptive symbols next to the Swedish text increased the understanding of the food category signs by 26.7%.
❌ Hypothesis 13o: Rejected ✅ Hypothesis 13a: Accepted
Hypothesis 14a: For respondents with an intermediate level of Swedish understanding, the mean scores from Section 4a are significantly different than the mean scores from Section 4b.
Table 4.14 Hypothesis 14
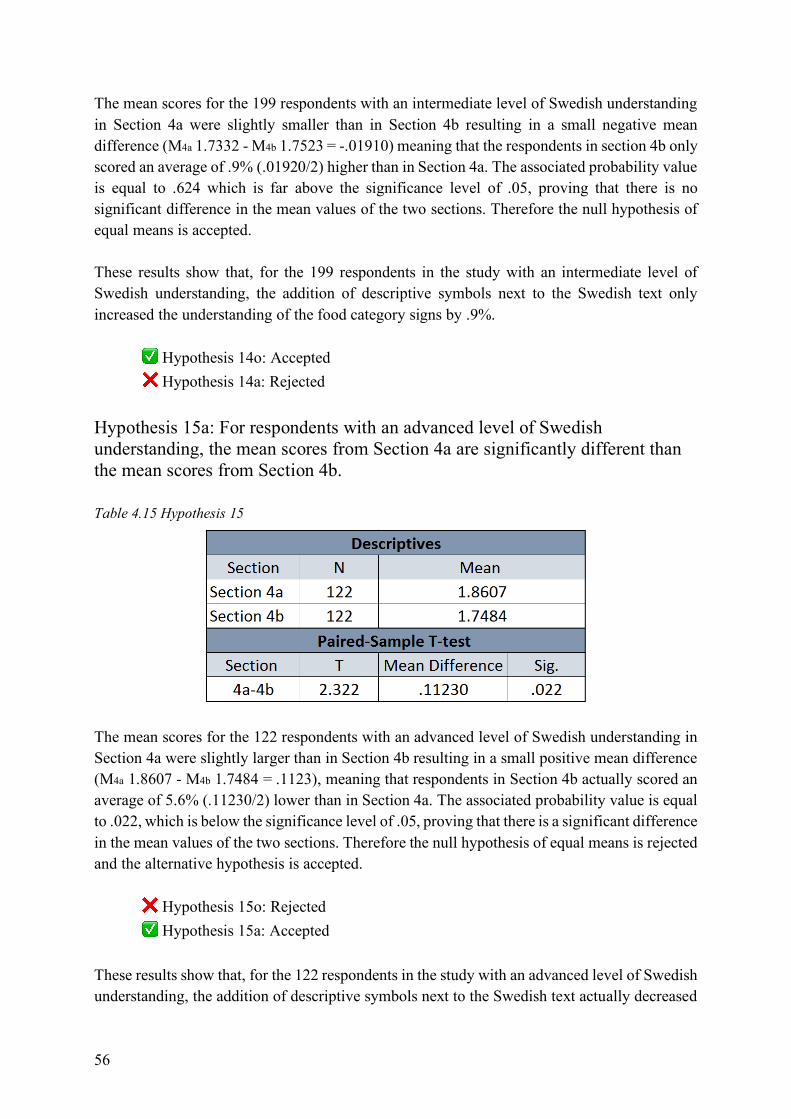
56
The mean scores for the 199 respondents with an intermediate level of Swedish understanding in Section 4a were slightly smaller than in Section 4b resulting in a small negative mean difference (M4a 1.7332 - M4b 1.7523 = -.01910) meaning that the respondents in section 4b only scored an average of .9% (.01920/2) higher than in Section 4a. The associated probability value is equal to .624 which is far above the significance level of .05, proving that there is no significant difference in the mean values of the two sections. Therefore the null hypothesis of equal means is accepted. These results show that, for the 199 respondents in the study with an intermediate level of Swedish understanding, the addition of descriptive symbols next to the Swedish text only increased the understanding of the food category signs by .9%.
✅ Hypothesis 14o: Accepted ❌ Hypothesis 14a: Rejected
Hypothesis 15a: For respondents with an advanced level of Swedish understanding, the mean scores from Section 4a are significantly different than the mean scores from Section 4b.
Table 4.15 Hypothesis 15
The mean scores for the 122 respondents with an advanced level of Swedish understanding in Section 4a were slightly larger than in Section 4b resulting in a small positive mean difference (M4a 1.8607 - M4b 1.7484 = .1123), meaning that respondents in Section 4b actually scored an average of 5.6% (.11230/2) lower than in Section 4a. The associated probability value is equal to .022, which is below the significance level of .05, proving that there is a significant difference in the mean values of the two sections. Therefore the null hypothesis of equal means is rejected and the alternative hypothesis is accepted.
❌ Hypothesis 15o: Rejected ✅ Hypothesis 15a: Accepted
These results show that, for the 122 respondents in the study with an advanced level of Swedish understanding, the addition of descriptive symbols next to the Swedish text actually decreased

57
their understanding of the food category signs by 5.6%. This could mean that the symbols confused the advanced Swedish speakers and may prove to be detrimental to the real world application of this research. Further analysis of this phenomenon will follow in the next chapter. Hypothesis 16a: Symbols with a higher level of complexity are better understood than less complex, simple symbols. To gain a better understanding of the effectiveness of the symbols used in this research, more Paired Sample T-tests were performed. These tests were compiled with the same respect to the level of Swedish understanding as the previous T-tests, but were expanded to compare the individual questions of each section rather than the sections as a whole. When the data is presented as a whole with all respondents of the study, some discrepancies can be identified. Eight out of the ten pairs received a negative mean difference, meaning that respondents understood the signs of those questions better in Section 4b than in 4a. Two pairs received a positive mean difference, meaning that respondents understood the signs in those questions better in Section 4a than in 4b. For beginner speakers, many pairs proved to greatly increase the understanding. Pair ten (seafood) received the largest mean difference of -1.156 meaning that the addition of a symbol resulted in a 57.8% (1.156/2) increase in understanding. Pair six (herbs) received a mean difference of -1.029 (51.5% increase in understanding). The mean difference for both pairs received an associated probability of .000, which is below the significance level of .05, meaning that the difference is significant. In contrast, pairs with smaller mean differences point to symbols that were less effective at increasing understanding. Pair number three (bread) received a positive mean difference (.026), meaning it actually decreased the understanding of beginner speakers by 1.3% and the mean difference for pair nine (chicken) was only -.018 (.9% increase in understanding). Pair seven’s (soup) mean difference was -.178 (8.9% increase in understanding). Pair number two (ice cream) received a mean difference of -.273, meaning it only increased the understanding by 13.6%. The mean difference for pair three and nine were deemed insignificant by their high associated probability values (.370, .538 respectively). Analysis of the respondents who understood an intermediate level of Swedish show many more instances of positive mean differences. In fact only three pairs (P1, P6 and P10) produced a negative mean difference. These results show that the addition of symbols does not help to increase the understanding of food category signs for intermediate Swedish speakers. For advanced speakers, many pairs proved to decrease understanding with the exception of two. Pair six (herbs) received the only negative mean difference (-.098), meaning it increased the understanding by 4.9%. Pair ten (seafood) received a mean difference of .000 meaning that this symbol neither increased nor decreased the understanding for advanced speakers. In contrast, many other pairs with positive mean differences point to symbols that were less effective at increasing understanding. Pair number two (ice cream) received a mean difference of .213 meaning it decreased the understanding of advanced speakers by 10.6%. Both pair three (bread)

58
and pair seven (soup) received a large mean difference (.164) meaning they actually decrease the understanding by 8.2%. The mean difference for pair nine (chicken) was .156 (7.8% decrease in understanding). Upon visual inspection, the symbols used for pairs six (herbs) and ten (seafood) could be considered to be more complex than the symbols chosen for pairs two (ice cream), three (bread), seven (soup) and nine (chicken). These results show that those symbols involving more complexity helped to increase the understanding of beginner speakers to a higher degree and did not decrease the understanding of advanced speakers. These results support the hypothesis that complexity adds to symbol comprehension.
❌ Hypothesis 16o: Rejected ✅ Hypothesis 16a: Accepted

59
5 Discussion
This chapter will guide the reader through the objectives presented in Chapter 1 (Introduction). The empirical material used in this chapter derives from the focus group and questionnaire and are discussed in combination with the previous theoretical knowledge presented to the reader in Chapter 2. (Literature Review).
5.1 Objective 1
Identify how effective symbols are at increasing the multilingual and cross cultural understanding of marketing messages A recent visit to ICA Kvantum at Tunavägen 39, Lund, Sweden revealed that all in-store food category signs are presented in Swedish text only. This is an example where marketing fails to reach across language barriers and cultural contexts. As signage plays a critical role in comprehension activities within stores, this thesis used intermediate and advanced Swedish speakers’ results as a benchmark and tested whether international individuals with little or no knowledge of the Swedish language have trouble understanding signs in a local grocery store and presents a solution to alleviate the problem. Perhaps the most suggestive findings related to the aspiration of this research are the results from the ANOVA where Section 4a and Section 4b were analyzed with the level of Swedish understanding controlled for. Those results showed largely significant mean differences between respondents with beginner, intermediate and advanced levels of Swedish understanding in Section 4a. The same test, except that Section 4b produced results with no significant mean differences between the three respondents groups. These figures suggest that, while an individual's ability to understand Swedish has a large impact on their understanding of the food category signs currently in use with only Swedish text, these discrepancies are effectively erased when descriptive symbols are introduced. This points to symbols being effective at increasing the multilingual understanding of in-store marketing messages. In Zender and Cassedy’s (2014) study their findings point to a multilingual capacity of symbols as long as cultural circumstances are accounted for. Pappachan and Ziefle (2007) describe symbols as language free and can be appropriately used for cross-cultural communication. From a large perspective, the findings of this thesis help to solidify these claims and pave the way for future research.

60
The paired sample T-tests examined the empirical data in more depth. Here, results from Section 4a and 4b are compared directly and interesting trends appear. From an overall perspective these results point to the same findings as those of the ANOVA, but at a closer look some data points to the contrary. Though the addition of symbols to the food category signs greatly helps to increase the understanding of beginner Swedish speakers, the effect of this aid is diminished for intermediate speakers and actually reversed for advanced speakers. The results showed that respondents with advanced levels of Swedish understanding scored lower in the section where Swedish text was accompanied by symbols. This is possibly due to the fact that the very symbols meant to increase understanding, actually confused advanced Swedish speakers who scored high in the previous section composed of signs with only Swedish text. This information was unexpected and could be grounds to dismiss the real world applicability of this research, but when put into perspective, the significance of the two findings are unequal. For beginner Swedish speakers the addition of symbols increased their understanding by 26.7%, a figure that far over shadows the small decrease in understanding of 5.6% by advanced speakers. Though these findings may point to an overall increased understanding of the signs, it must be noted that the majority of the customers in a Swedish grocery store do have an advanced level of Swedish understanding. Therefore, it is important to minimize the confusion symbols might add. Another reason possibly adding to this phenomenon of advanced Swedish speakers losing comprehension when symbols are added, is the fact that when symbols are added they could draw attention away from the text and could possibly cause respondents to disregard the text and make decisions based solely on the symbols. In their article on the comprehension of traffic with symbols versus with text, Shinar and Vogelzang (2013) state that symbols take less cognitive energy to process and are comprehended faster than words. From this, the assumption could be made that, in the test section of the questionnaire with symbols, respondents may have made their decisions primarily based on the symbols, which led to those individuals with an advanced understanding of Swedish scoring lower than on the previous section where the only decision making material was the written text. The fact that the symbols might have confused the advanced Swedish speaker may be due to the subjective nature of symbol selection process. The symbols used in this study were selected with regard to literature and may have not been chosen with correct accuracy. Another explanation could be the fact that the authors of this thesis did not test the symbols before putting them into the questionnaire and hence, were unfamiliar with how they could be received. Nevertheless, discovering and ranking symbols for their cultural understanding was not the aim of this research, rather the objective was to test if symbols could be used to cross cultures or language barriers. Cross-cultural marketing has become increasingly important in recent years (Alozie, 2010) and the ability to cross language barriers with communications will give any firm an edge in the international marketplace (Katsikeas, 2018). In their study on traffic signs with symbols versus with text, Shinar and Vogelzang (2013) found that signs with text are perceived correctly at a much higher rate, but this fact is only true for the local audience. The authors go on to state that

61
in the shirking world where these signs need to apply to drivers trained in different cultures and languages, traffic signage presented with symbols is now the norm in most countries. If symbols are familiar to an audience, they are an advantageous way to increase sign understanding across language barriers (Shinar & Vogelzang, 2013). Findings from this thesis confirm this fact. However, Shinar et al’s. (2010) study on the cross-cultural understanding of symbolic traffic signs found significant difference in traffic sign comprehension among drivers from different countries. The authors even found instances where individuals perceived signs to mean the opposite of their intended meaning. The findings from literature and the main study of this thesis suggest that symbols can play a crucial role in increasing the multilingual understanding of all types of communications and therefore may give a firm a competitive edge in cross-cultural marketing, but the selection of the symbols must be done with consideration to many criteria. Shinar et al. (2010) suggest criteria to consider when developing symbols for traffic signs such as, spatial compatibility, conceptual compatibility, physical representation, familiarity, and standardization. These suggestions mirror those of Zender and Cassedy (2014), Pappachan and Ziefle (2007) and McDougall, Curry and Bruijn (1999), which were used in the selection process for the symbols of the current research. Though these suggestions and criteria were tested and proven to be valuable, they were not specific to in-store marketing and may have proven to lack some aspects needed to cross into that realm. Further research is needed to discover criteria relevant for symbol creation meant for in-store marketing activities. The T-tests from the overall sections showed a small decrease in the understanding of the signs from Section 4a to Section 4b for advanced Swedish speakers. This means that the addition of the symbols decreased their understanding of the signs. This phenomenon can be viewed in more depth when the individual questions from both sections are compared. Though the results from the overall scores of the individual questions give a comprehensive illustration of the study, the discrepancy in the sample sizes of the participant groups with different levels of Swedish understanding may provide biased results. Therefore, controlling for Swedish understanding and comparing the groups may enable better analysis. The results from the respondents with a beginner and intermediate understanding of Swedish follow a trend of significant increases in sign comprehension when symbols are introduced for beginners and less so for intermediates. The scores from the advanced speakers can point to symbols that may have been selected improperly and the data provided by the beginner speakers can identify symbols more effective at accomplishing the intended task. For advanced speakers, many of the mean scores for Section 4a are very high and the corresponding scores for Section 4b decrease in all but two cases. The mean differences of these individual questions from these two sections show which symbols play the largest part in the misunderstanding of the signs. Pair two, the questions with the intended meaning of “ice cream” received a relatively large mean difference indicating that the symbol decreased the understanding of this sign by 10.6%. Additionally, this same pair received a comparatively low mean difference when controlling for beginner Swedish speakers. There, the symbol only increased the understanding of the sign by respondents with a beginner level of Swedish by 13.6%. Though this value may seem large

62
it is actually small when compared to the overall mean difference for beginners of 26.7% increase in understanding. The symbol for this sign was a cone with three scoops of ice cream. This symbol was chosen with regards to literature and in the subjective minds of the researchers, satisfied the criteria set forth by Zender and Cassedy (2014), Pappachan and Ziefle (2007), McDougall, Curry and Bruijn (1999) and Shinar et al. (2010). Though this symbol was chosen meticulously, it is evident that it fell short of its intended purpose. In contrast, pair number ten with the intended meaning of “seafood” was the only instance where the addition of the symbol neither increased nor decreased the understanding of the sign by the advanced speakers. There, the pair received a mean difference of .000 meaning that this symbol did not confuse the respondents who scored the same in both sections. Further strengthening this claim, pair ten received a largely significant mean difference when testing for beginner Swedish speakers. This large mean difference meant that the addition of the chosen symbol for seafood increased the comprehension of the sign by 57.8% for beginner Swedish speakers. This symbol was composed of many different types of seafood organized into a pile. These results point to this symbol being very effective. The major difference between the symbol used to represent “seafood” and that to illustrate “ice cream” is the complexity of the image. The symbol for “ice cream” is very minimalistic and simple whereas the “seafood” symbol has far more items and could be considered much more complex. In their article McDougall, Curry and Bruijn (1999) discuss the ongoing debate about symbol complexity and its correlation with concreteness. Some authors argue that detail should be removed from symbols to increase their understanding (Easterby, 1970; Rogers, 1988). McDougall, Curry and Bruijn (1999) conclude their article with findings that suggest complexity has no correlation with concreteness, meaning that simple symbols are more easily understood. Other researchers argue for the contrary, Garcia, Badre and Stasko (1994) found that symbols with more complexity were found to be more concrete and thus more understandable. The findings from the research performed for this thesis point to more complex symbols, like the one used to represent “seafood,” producing higher levels of understanding than less complex symbols like the one chosen for “ice cream.” This claim is further strengthened by pair number six. With a complexity level similar to that representing “seafood,” the symbol chosen for pair number six includes multiple items organized together, designed to represent “herbs.” For beginner speakers, pair six received the second highest mean difference, meaning that it increased understanding for those individuals by 51.5%. For advanced speakers this pair was the only one that received a negative mean difference, meaning that it did not confuse the respondents, it actually increased their understanding by 4.9%. Other symbols seem to follow this trend as well. The simple symbol of “bread,” received the only positive mean difference for beginner speakers, meaning that it decreased their understanding by 1.3%. For advanced speakers the same symbol decreased their understanding by 8.2%. The simple symbol for “chicken” decreased the understanding of advanced speakers by 7.8% and only increased understanding of beginners by .9%. The simple symbol for “soup” only increased the understanding of beginners by 8.9% and decreased the understanding of advanced speakers by 8.2%. These findings back those of Garcia, Badre and Stasko (1994) and introduce a marketing

63
perspective. Hence, a conclusion can be drawn that for symbols used in marketing, complexity helps to increase the understanding by all individuals.
5.2 Objective 2
Identify consumer perceptions of the utilization of symbols in an in-store environment Findings from the questionnaire indicated that individuals consider that replacing the local language text with English text would neglect the local consumer. This result was provided from individuals with beginner, intermediate and advanced understanding of the Swedish language. These results strengthen Garcia-Yeste’s (2013) point that the native language is of preference in a country even when the proficiency of English is high. Moreover, Noriega and Blair (2008) assert that the native language is favored in marketing since the marketing message becomes easier to process and recall and hence, provides more emotional attachment. Furthermore, Aaker, Brumbaugh and Grier (2000) remark that both local and international consumers receive a better experience of the marketing attempts when able to identify and understand the message. Nevertheless, in cosmopolitan cities where multiple languages are present, change is needed and marketing messages must be understood better by all cultures. A solution that has the ability to cross language barriers and does not neglect the local culture is the utilization of descriptive symbols complementing the text. The previously presented results of the main study show that symbols, if selected correctly, can greatly increase the multilingual understanding of marketing messages for internationals. Therefore, the purpose of this research satisfies the needs of both local and international customers and can provide for a better overall shopping experience. This distinctive solution to increasing the multilingual understanding of marketing messages that has been on the minds of the authors of this thesis from the beginning of the research is that replacing local language text with English text, although becoming popular in contemporary society, could have a negative effect on the local culture. Literature and results from this thesis backup this claim in the context of a very highly English-accepting culture. In order for this research to be expanded to other marketplaces around the globe, consideration of the local culture must be held to a higher degree.

64
5.3 Objective 3
Identify other complementary elements contemporary symbols can add to the in-store environment Results from the research goes hand in hand with the explanation given by Damaskinidis et al. (2017) that clarifies that symbols add to textual information and allow the reader to gain better understanding of the written message. An additional element is that the ability to understand the local language has an impact on the noticing of signage. This result implies that marketing messages may fall short of international potential customers since they do not award attention to them. This could provide troublesome impacts in cities where international individuals are growing. Another element that contemporary symbols can add to an in-store environment is their ability to draw attention to marketing messages. Results from the main study found that respondents believe the colorful symbols used in the study would better draw their attention to the food category signs. This is supported by Lin (2004) and Lee, Noble and Biswas (2018) who dictate that colors can help stimulate customers’ emotions and aid in attracting their gaze. Since the use of colorful, contemporary symbols could increase the attention given to in-store signage, the assumption could be made that colorful, contemporary symbols also add another level of excitement to the in-store environment, which not only improves the shopping experience for international customers but also increases the store experience for the local audience as well. Results for the questionnaire additionally found that individuals with lower levels of Swedish understanding felt less comfortable while in Swedish grocery stores than those with higher levels of Swedish understanding. Also found, was evidence that adding descriptive symbols to food category signs, a form of an in-store marketing message, would increase the comfort levels of those individuals. Adding these symbols decreases the distance between the international audience and the marketers and according to Erez and Earley (1997) creates a feeling of cultural closeness that also could be synonymously interpreted as comfort. Feeling a sense of belonging to a group also act as a means to increase the comfort level of international individuals, hence the complication of a different cultural identity can result in feelings of alienation. Increasing the comfort level is not only a problem faced by managers, vital for keeping customers, but also a competitive advantage since results indicate that these individuals believed they would spend more money if they did feel more comfortable, providing a monetary justification for the basis of this research. This is further solidified by Otterbring et al. (2014) whose study discovered that product information signage greatly influences the customers’ buying decisions. Though these results, due to the large sample size, are conclusive, they are subjectively based on the respondents’ beliefs’ and more research is needed to properly verify this fact and add numerical substance.

65
6 Conclusion
This final chapter will present the conclusions derived from the research in order to answer the research question and objectives and to accomplish the purpose of the research. This chapter will additionally give the reader theoretical and practical implications and suggestions for future research.
6.1 Conclusion
The reflection stemming from the knowledge gaps was developed into three objectives this research wished to fulfill; it was then additionally boiled down to create the thesis research question. The thesis research question is presented below and followed by an overall conclusion of this research:
How can in-store marketing communications be improved for an international audience without neglecting the local consumers?
If selected correctly, the addition of contemporary, descriptive symbols to in-store marketing messages can help to increase the understanding of international consumers without introducing practices that could neglect the local culture. Furthermore, colorful contemporary symbols can add the attention-drawing elements of excitement and emotion to the in-store environment. International individuals with a limited understanding of the Swedish language feel less comfortable in Swedish grocery stores than those with a higher proficiency and if a store were to increase the understanding of their in-store marketing messages, it would in turn boost the comfort levels of these individuals. This change would lead to that firm receiving a larger monetary contribution from their international customers and would give the company a competitive advantage in the marketplace.
6.2 Limitations
Limitations for this thesis include first and foremost that the results are rather obvious; nevertheless, a considerable amount of empirical data was provided which solidifies the result since the research proved to be relevant and up-to-date in today’s society. Furthermore, the location to utilize the results of this study is limited to cosmopolitan cities or places where there live an abundant amount of individuals unable to speak the local language. There also exist

66
limitations related to the sampling approach; the convenience sampling method could provide potentially biased results since the authors utilized an approach that may not be inclusive of the entire target population. Nevertheless, the population of this research is those with international nativity living in Sweden, and since the authors of this thesis used social media to send out the data gathering instrument, the result was a rather diverse group of individuals, from different countries, living in Swedish cities. Related, is the dilemma of the seriousness of the respondents due to the fact that the questionnaire was sent out online as well as the subjectiveness of the individual's understanding of the Swedish language, and the unknown factor of how long the respondents had been living in the country. These aspects could make the result biased since the individual’s understanding could be more extensive in grocery stores due to their familiarity with the environment. Related, is that it is quite easy to pick up words and navigate through stores given time to learn the associations, meaning there is little need for symbols since learning these words is an important part of cultural integration and this is what makes an individual comfortable. Moreover, another limitation is in regard to the symbol selection process since this was done subjectively by the authors and hence only uses theory for solidification and does not include practical applications.
6.3 Theoretical Contributions
The use of symbols as a tool for marketing activities is already frequently used in contexts where the comprehension needs to be consistent through both cultural as well as linguistic barriers (Zender & Cassedy, 2014). Symbols are considered valuable in international contexts since they are able to cross cultures and visually represent the intended meaning (Zender & Cassedy, 2014). The intended theoretical knowledge contribution of this thesis was to acknowledge if the use of symbols could make marketing messages more understandable across cultures and language boundaries without neglecting the local audience. Moreover, a more fruitful understanding of how marketers could communicate to international customers in a local setting as well as the ability to add elements to the multilingual and cross-cultural messages in a retail store was in need of illustration. Furthermore, a knowledge gap was introduced in the use of contemporary semiotics in a store environment and multilingual and cross-cultural in-store marketing that together was intended to lead to a more comprehensive understanding on the future of cross-cultural retail. The results from this thesis will contribute to and draw on the literature of Shinar and Vogelzang (2013) and by Shinar et al. (2010). Those authors performed research on traffic signs and the cross-cultural understanding of them. This thesis adds the perspective of the in-store marketing environment and proves that symbols can be used there to increase understanding as well. Further results gained from the research provided insights in how both an international audience as well as individuals with an advanced understanding of the local language, interpreted messages both with and without the use of symbols. The theoretical implications stemming from these results displayed an increased understanding of messages when a contemporary symbol was applied, which contributed to the effectiveness of the research. Furthermore, the

67
research illustrated that the use of the local language text, complemented with a displayed symbol of the text, does not affect the local audience negatively. The research contributes to an extension of the theory by Lin (2004) and Lee, Noble and Biswas (2018) who state that colors can be used to help stimulate consumers’ emotions and aid to attract their gaze. This research both supports their finding and complemented those by discovering that colorful, contemporary symbols also can act as a means to draw customers attention better. Moreover, Aaker, Brumbaugh and Grier’s (2000) stated that consumers obtain a more positive experience of marketing activities if they are able to personally identify with the message. However, the authors do not further justify how stores can contribute to a greater understanding for all individuals not depending on the language, which can act to make more individuals, for example in cosmopolitan cities, more personally involved with the marketing messages. This research supplements those finding by adding that symbols can be used to transverse messages which further can lead to more individual identifying with them. Furthermore, symbols do not neglect the local language but acts as a language on its own, thus understandable across nations and cultures. Finally, the research of this study contributes to the ongoing debate about the complexity of symbols and their correlation with concreteness. McDougall, Curry and Bruijn (1999) found that symbols are more easily understood when they include lower levels of complexity. Other authors back up this claim, stating that detail should be removed from symbols to increase comprehension (Easterby, 1970; Rogers, 1988). Garcia, Badre and Stasko (1994) dispute these findings, claiming complexity adds more context to symbols and therefore they become more understandable. The findings of this thesis support Garcia, Badre and Stasko (1994), where more complex symbols like those chosen for “seafood” and “herbs” greatly increased the understanding of all beginner Swedish speakers and did not decrease the understanding of advanced speakers.
6.4 Practical Contributions
Some of the practical implications stemming from this research conclude that in-store marketing can improve the understanding of messages for international individuals. These results are foremost paramount to be implemented in cosmopolitan cities where the understanding of the local language is lower and the population is more multilingual. The use of contemporary symbols is a profound way to present a marketing message since it does not neglect the local language. Furthermore, the use of contemporary symbols increases the feeling of comfort for an international audience, which consequently can act as a means to increase the money spent. These complementary elements justify the need for implementation of symbols in areas where the population of multilingual speakers is extensive.

68
From a managerial perspective, findings from this thesis contribute knowledge needed to make strategic marketing decisions. Now that firm executives have evidence that symbols do increase the multilingual understanding of in-store marketing messages, they are better prepared to make decisions about the implementation of these practices as well as decisions related to conducting further research. Moreover, results from this thesis can contribute to the practical experience McNair (2012) encountered while being in a foreign country, since it will help customers understand the aisle markers even if the text itself cannot be understood and no connections to the language can be found.
6.5 Future Research
The findings of this research confirmed a simple concept: Symbols can be used to increase the multilingual understanding of in-store marketing messages. This fact has already been proven in the world of transportation and the large amount of empirical data provided by this study now confirms that this concept is transferable to the in-store marketing environment. Though this study may not in itself provide a large contribution to the marketing world, it acts as a basis and a first step for research that has massive potential for international marketers and can be scaled to fit any marketplace.
Findings from the initial focus group uncovered other instances where marketing messages fail to reach an international audience. Perhaps the most common theme among the international participants of the focus group was their inability to understand what was in the food products they encountered in Swedish grocery stores. When asked about messages in retail stores that were unclear to them, the majority of the participants agreed that the contents of food products was not clear due to the fact that they were in Swedish. One participant went further to state her dietary restrictions did not allow her to consume gluten or lactose and she felt like it was difficult to find products that she could eat. Another participant declared that it was very hard for him to find the type of milk he desired. After finally finding a brand that suited his needs, he stated that he would never even try another brand even if it was cheaper and better quality, because it wasn’t worth the risk of buying the wrong product. It is currently common practice for manufacturers to include pictures on food packaging to indicate the main ingredients and food labels utilizing symbols to announce product attributes, but further research could provide more fruitful strategies. If manufacturers allocate resources to develop symbols and icons that can more accurately illustrate product contents they will gain a competitive edge in the international marketplace. Many participants in the focus group also found it difficult to understand the store’s product offerings. They comprehended indications of sales relatively well, but were unable to understand the terms of most product offerings (e.g. did they need to be a member? what products were included in these offers?). Research on symbols that could

69
help to explain these offers could increase their understanding and give the grocery stores in international cities a competitive advantage. From a larger perspective, perhaps the most substantial research can come from the creation of criteria that can be used to increase the cross-cultural understanding of symbols used in marketing. Copious amounts of literature exist on creating symbols for the transportation, medical and digital industries (e.g. Shinar et al. 2010; Zender & Cassedy, 2014; McDougall, Curry and Bruijn, 1999), but little research has been conducted for the field of marketing. Future research could also include more detailed descriptions on the local audience’s perceptions on the use of symbols in marketing and how far the use of them can go without disturbing the local language. Since the addition of symbols on category signs actually proved to decreased the understanding of the signs for the advanced levels of Swedish understanding, more research is necessary in order to examine the reason why this occurred and if it could affect the real world applicability in the use of signs.

70
6.6 Epilogue
Louis has now been living in Sweden for almost a year. He survived the purgatory that was the Swedish winter and is now enjoying the bountiful merriment provided by the few summer months Sweden offers. Due to the heavy workload of his studies and his general disinterest in taking Swedish classes, Louis has learned very little Swedish and is still considered to be at a beginner’s level. This foreign language illiteracy has proven not to be a problem because one of his local grocery stores just began to add colorful descriptive symbols to its food category signs, product labels, ingredient lists and product offerings. Now Louis strolls effortlessly through his newfound favorite grocery store with feelings of comfort and inclusion, knowing he will have no problem finding the exact products he desires. Louis is gluten intolerant and can easily identify gluten-free products by their distinctive symbols. He is also very particular about the type of milk he drinks and has recently discovered a new brand that is much tastier and less expensive than the one he had been buying for most of the year. Though Louis had not shopped at this store until about a month ago, he can find any product with ease because the food category signs now include fun, colorful symbols that not only draw all consumers’ attention more effectively, but also add more excitement to the store environment and accurately portrays where all items are located. Though this new store concept may not be good for his wallet because this newfound comfort causes him to spend more time discovering new products, Louis is very happy with this new design and now feels a sense of belonging in all aspects of his life abroad.

71
References Aaker, J.L., Brumbaugh, A.M., & Grier, S. (2000). Nontarget Markets and Viewer Distinctiveness: The Impact of Target Marketing on Advertising Attitudes, Journal of Consumer Psychology, vol. 9, no. 3, pp.127-140
Al-Olayan, F.S. & Karande, K. (2000). A Content Analysis of Magazine Advertisements from the United States and the Arab World, Journal Of Advertising, vol. 29, no. 3, pp.69-82
Alozie, E. (2010). Advertising and Culture: Semiotic Analysis of Dominant Symbols Found in Nigerian Mass Media Advertising, Journal Of Creative Communications, vol. 5, no, 1, pp.1-22
Alshenqeeti, H. (2016). Are Emojis Creating a New or Old Visual Language for New Generations? A Socio-semiotic Study, Advances in Language and Literary Studies, vol.7, no. 6, pp-56-69
Ancient Symbols (n.d.). Symbols Influence on History. Available Online:
https://www.ancient-symbols.com/symbols-influence-on-history.html [Accessed 13 April 2018]
Appiah, O. & Liu, Y. I. (2009). Reaching the Model Minority: Ethnic Differences in Responding to Culturally Embedded Targeted-and Non-Targeted Advertisements, Journal of Current Issues & Research in Advertising, vol. 31, no. 1, pp.27-41
Arbnor, I. & Bjerke, B. (2009). Methodology for creating business knowledge, London: Sage
Azuma, J. (2012). Graphic Emoticons as a Future Universal Symbolic Language, Approaches to Translation Studies, vol. 36, pp.61-84
Baban, F. (2013). Cosmopolitan Europe: Border Crossings and Transnationalism in Europe. Global Society, Journal Of Interdisciplinary International Relations, vol. 27, no. 2, pp.217-235
Bell, J., Waters, S. & Nilsson, B. (2016). Introduktion Till Forskningsmetodik. 5th edn, Lund: Studentlitteratur
Bitner, M.J. (1992). Servicescapes: The Impact of Physical Surroundings on Customers and Employees, Journal Of Marketing, vol. 56, no. 2, pp.57–71
Bortun, D., & Puracarea, V.L. (2013). Marketing and Semiotic Approach on Communication. Consequences on Knowledge of Target-Audiences, Journal of Medicine and Life, vol. 6, no. 1, pp.103-108
Bryman, A. & Bell, E. (2015). Business research methods 4th edn, New York: Oxford University Press
Brewer-Doran, K. (2002). Lessons Learned in Cross-Cultural Research of Chinese and North American Consumers, Journal of Business Research, vol. 55, no. 10, pp.823–829

72
Bradburn, N., Sudman, S. & Wansink, B. (2004). Asking Questions: The Definitive Guide to Questionnaire Design - For Market Research, Political Polls, and Social and Health Questionnaires, San Fransisco: Jossey-Bas
Burns, R. B. & Burns, R.A. (2008). Business Research Methods and Statistics Using SPSS, Cornwall: Padstow
Calder, B. J., Phillips, L. W. & Tybout, A. M. (1982). The Concept of External Validity, Journal of Consumer Research, vol.9, no.3, pp. 240–244
Chebat, J.C., Gélinas-Chebat, C. & Therrien, K. (2005). Lost in a Mall, the Effects of Gender, Familiarity with the Shopping Mall and the Shopping Values on Shoppers' Wayfinding Processes, Journal of Business Research, vol. 58, no. 11, pp.1590-1598
Chevalier, M. (1975). Increase in Sales due to In-Store Display, Journal of Marketing Research, vol. 12, no. 4, pp. 426-431
Curtin, R., Presser, S., & Singer, E. (2000). The Effects of Response Rate Changes on the Index of Consumer Sentiment, Public Opinion Quarterly, vol. 64, no. 4, pp.413–428
Cleveland, M., & Laroche, M. (2007). Acculturaton to the Global Consumer Culture: Scale Development and Research Paradigm. Journal Of Business Research, vol. 60, no. 3, pp.249-259
Damaskinidis, G., Kourdis, E., Zantides, E. & Sykioti, E. (2017). Eye-Tracking the Semiotic Effects of Layout on Viewing Print Advertisements, Public Journal of Semiotics, vol. 8, no. 1, pp. 46-66
Danesi, M., (2016). The Semiotics of Emoji, London: Bloomsbury Publishing
De Mooij, M. (2015). Cross-Cultural Research in International Marketing: Clearing up some of the Confusion, International Marketing Review, vol. 31, no. 6, pp.646-662
De Mooij, M. (2010). Global marketing and advertising: Understanding Cultural Paradoxes. Los Angeles: Sage Publication.
De Mooij, M. (2011). Consumer behavior and culture: Consequences for Global Marketing and Advertising 2nd edn, Sage Publications
Dictionary, f. (n.d.). Frame of reference Meaning in the Cambridge English Dictionary. Dictionary.cambridge.org. Available Online: https://dictionary.cambridge.org/dictionary/english/frame-of-reference [Accessed 25 April 2018].
Ec.europa.eu. (2018). [online] Available Online: http://ec.europa.eu/eurostat/statistics-explained/images/3/3f/Foreign_language_learning_in_the_European_Union_%28Data_from_2015%29_final.png [Accessed 25 April 2018].

73
Erez, M., & Earley, P. C. (1993). Culture, Self-Identity, and Work, New York: Oxford University Press.
Easterby, R. S. (1970). The Perception of Symbols for Machine Displays, Ergonomies, vol. 13, pp.149-158
Easterby-Smith, M., Thorpe, R. & Jackson, P. (2015). Management and Business Research 5th edn, London: Sage
Enders, J. (2004). Higher Education, Internationalisation, and the Nation-State: Recent Developments and Challenges to Governance Theory, Higher Education, vol. 47, no. 3, pp.361–382
Epure, M., Eisenstat, E. & Dinu, C. (2014). Semiotics and Persuasion in Marketing Communication, Linguistic and Philosophical Investigations, vol.13, pp.592–605
Guido, G., Piper, L., Prete, M. I., Mileti, A., & Trisolini, C. M. (2017). Effects of Blue Lighting in Ambient and Mobile Settings on the Intention to Buy Hedonic and Utilitarian Products, Psychology and Marketing, vol. 34, no. 2, pp.215-226
Guðmundsdóttir, S. (2015). Nordic Expatriates in the US: The Relationship Between Cultural Intelligence and Adjustment, International Journal of Intercultural Relations, vol. 47, pp.175-186.
Hall, E., & Hall, M.R. (1990). Understanding Cultural Differences. Yarmouth, ME: Intercultural Press
Han, Y.J., Nunes, J.C & Drèze, X. (2010). Signaling Status with Luxury Goods: The Role of Brand Prominence, Journal of Marketing, vol. 74, no. 4, pp.15–30
Heale, R. & Twycross, A. (2015). Validity and Reliability in Quantitative Studies, Evid Based Nurs, vol. 18, no. 3, pp.66-67
Hepford, E. (2017). Language for profit: Spanish–English Bilingualism in Lowe's Home Improvement, International Journal of Bilingual Education & Bilingualism, vol. 20, no. 6, pp.652-666
Hofstede, G. (2001), Culture’s Consequences, 2nd edn, Sage, Thousand Oaks, CA
Hofstede, G. (1983). National Cultures in Four Dimensions, A Research-based Theory of Cultural Differences among Nations, International Studies of Man and Organizations, vol. 13, no. 1-2, pp.46-74
Holzmüller, H. H. & Stöttinger, B. (2001). International Marketing Managers' Cultural Sensitivity: Relevance, Training Requirements and a Pragmatic Training Concept, International Business Review, vol. 10, no. 6, pp.597-614
Garcia, M., Badre, A. N., & Stasko, J. T. (1994). Development and Validation of Icons Varying in their Abstractness, Interacting with Computers, vol. 6, pp.191-211

74
Garcia-Yeste, M. (2013). The Presence and Roles of English in Swedish Print Advertising: An Exploratory Study, Nordic Journal of English Studies, vol. 12, no. 1, pp.65-85
Gulnaz K., G., Olga G., I., & Kirill N., G. (2017). Cosmopolitanism as a Concept and a Social Phenomenon, Tarih Kültür Ve Sanat Araştırmaları Dergisi, vol.6, no.5, pp.25-30
Goyder, J. (1986). Surveys on Surveys: Limitations and Potentials, Public Opinion Quarterly, vol. 50, pp.27-41
Jespersen, O. (2013). Language: Its Nature and Development. Oxon: Routledge
Johansson, B. (2010). Surveyundersökningar. I Ekström, M. & Larsson, L. (red). Metoder i kommunikationsvetenskap. Lund: Studentlitteratur
Kassam, R., Vaillancourt, L. & Collins, J. (2004). Pictographic Instructions for Medications: Do Different Cultures Interpret them Accurately?, International Journal of Pharmacy Practice, vol. 12, no. 4, pp.199-209
Katsikeas, C. S. (2018). Special Issue on the Future of International Marketing: Trends, Developments, and Directions, Journal of International Marketing, vol. 26, no. 1, pp.1-3
Kuipers, G. (2013). The Rise and Decline of National Habitus: Dutch Cycling Culture and the Shaping of National Similarity, European Journal Of Social Theory, vol. 16, no. 1, pp.17-35
Körner, S. & Wahlgren, L. (2006) Statistisk dataanalys; Studentlitteratur AB, Lund
Lee, N.Y., Noble, S. M., & Biswas, D. (2018), Hey Big Spender! A Golden (Color) Atmospheric Effect on Tipping Behavior, Journal of the Academy of Marketing Science,vol. 46, no. 2, pp.317-337
Lillis, M. P. & Tian, R. G. (2009). Cross-cultural Communication and Emotional Intelligence: Inferences from case studies of gender diverse groups, Marketing Intelligence & Planning, vol. 27, no. 3, pp.428-438
Lin, I. Y. (2004). Evaluating a Servicescape: The Effect of Cognition and Emotion, International Journal Of Hospitality Management, vol. 23, no. 2, pp.163-178
Lucas, G. (2016). The Story of Emoji, London: Prestel Publishing
Lwin, M. O., Stanaland, A. J., & Williams, J. D. (2010). American Symbolism in Intercultural Communication: An animosity/ethnocentrism perspective on intergroup relations and consumer attitudes. Journal of Communication, vol. 60, no. 3, pp.491-514
Maguire, M. C. (1985). A review of Human Factors Guidelines and Techniques for the Design of Graphical Human-computer Interfaces, Computers and Graphics, vol. 9, no. 3, pp.221-235
Maude, B., (2016) Managing Cross-Cultural Communication, 2nd edn, London: Palgrave
May, T. (2013). Samhällsvetenskaplig forskning. Lund: Studentlitteratur.

75
Mikhailitchenko, A., Javalgi, R., Mikhailitchenko, G. & Laroche, M. (2007) Cross-cultural Advertising Communication: Visual Imagery, Brand Familiarity, and Brand Recall, Journal of Business Research, vol. 62, no. 10, pp.931-938
McNair, A. (2012). Your comfortable shopping. Critical Arts: A South-North Journal Of Cultural & Media Studies, vol. 26, no. 3, pp.442-446
McDougall, S., Curry, M., & de Bruijn, O. (1999). Measuring Symbol and Icon Characteristics: Norms for Concreteness, Complexity, Meaningfulness, Familiarity, and Semantic Distance for 239 Symbols, A Journal of the Psychonomic Society, vol. 31, no. 3, pp.487–519
McSweeney, B. (2013), Fashion Founded on a Flaw. The Ecological Mono-Deterministic Fallacy of Hofstede, GLOBE, and followers, International Marketing Review, vol. 30, no. 5, pp.483-504
Mertens, D. M. & Hesse-Biber, S. (2012). Triangulation and Mixed Methods Research: Provocative positions, Journal of Mixed Methods Research, vol. 6, no, 2, pp.75-79
Murdock, G. (1945). The Common Denominator of Cultures. In Linton, R. (ed.), The Science of Man in the World Crisis (pp. 123–142). New York: Columbia University Press.
Müller, J., & Ivanova, Y. (2014). The Effects of Visual Cultural Cues in Advertising, Master thesis, Department of Marketing and Strategy, Stockholm University, Available Online: http://www.uppsatser.se/uppsats/6d73556c7b/ [Accessed 28 April 2018]
Nishimura, Y. (2015). A Sociolinguistic Analysis of Emoticon Usage in Japanese Blogs: Variation by Age, Gender, and Topic. In Selected Papers of Internet Research 16: The 16th Annual Meeting of the Association of Internet Researchers
Noriega, J., & Blair, E. (2008). Advertising to Bilinguals: Does the Language of Advertising Influence the Nature of Thoughts?, Journal Of Marketing, vol. 72, no. 5, pp.69-83
Oosthuizen, T. A. (2004). In Marketing across Cultures: Are You Enlightening the World or are You Speaking in Tongues?, Design Issues, vol. 21, no. 2, pp.61-72
Otterbring, T., Wästlund, E., Gustafsson, A., & Shams, P. (2014). Vision (im)possible? The effects of in-store signage on customers’ visual attention, Journal Of Retailing And Consumer Services, vol. 21, no. 5, pp.676-684
Pappachan, P. & Ziefle, M. (2007). Cultural Influences on the Comprehensibility of Icons in Mobile-Computer Interaction, Behaviour & Information Technology, vol. 27, no. 4, pp.331–337
Patel, R. & Davidsson, B. (2011). Forskningsmetodikens grunder - Att planera, genomföra och rapportera en undersökning, Lund: Studentlitteratur.
Popovici, S. (2011), What do we know about Cross-Cultural Marketing?, Bulletin of the Transilvania University of Braşov, vol. 4, no, 2, pp.57-64

76
Piamonte, D.P.T, Abeysekera, J.D.A & Ohlsson, K. (2001) Understanding Small Graphical Symbols: A Cross-Cultural Study, International Journal of Industrial Ergonomics, vol. 27, no. 6, pp.399–404
Prinsloo, N., Van der Merwe, D., Bosman, M., & Erasmus, A. (2012). A Critical Review of the Significance of Food Labelling During Consumer Decision Making, Journal of Family Ecology and Consumer Sciences, vol. 40, pp.83-98
Retnowati, Y. (2016). Challenges in Cross Cultural Advertising. Jurnal Humaniora, vol. 27, no. 3, pp.340-349
Rogers, Y. (1988). Pictorial Representations of Abstract Concepts in Relation to Human Computer Interaction, Unpublished doctoral dissertation thesis, University of Wales Swansea
Rosengren, K-E. & Arvidsson, P. (2002). Sociologisk Metodik. 5th edn, Malmö: Liber
Sanderson, M., Derudder, B. & Timberlake, M. (2015). Are World Cities also World Immigrant Cities? An International, Cross-City Analysis of Global Centrality and Immigration, International Journal of Comparative Sociology, vol. 56, no. 3-4, pp.173-197
Sevincer, A. T., Varnum, M. W. & Kitayama, S. (2017). The Culture of Cities: Measuring Perceived Cosmopolitanism, Journal Of Cross-Cultural Psychology, vol. 48 no. 7, pp.1052-1072
Shinar, D., Dewar, R. E., Summala, H. & Zakowska, L. (2010). Traffic Sign Symbol Comprehension: A Cross-Cultural Study, Ergonomics, vol. 46, no. 15, pp.1549-1565
Shinar, D. & Vogelzang, M. (2013). Comprehension of Traffic Signs with Symbolic Versus Text Displays, Transportation Research Part F: Psychology and Behavior, vol. 18, pp.72-82
Smith, W. G (2008). Does Gender Influence Online Survey Participation? A Record-Linkage Analysis of University Faculty Online Survey Response Behaviour, San José State University, Available Online: https://eric.ed.gov/contentdelivery/servlet/ERICServlet?accno=ED501717 [Accessed 27 April 2018].
Sorensen, H. (2009). Inside the Mind of the Shopper: The Science of Retailing. Prentice Hall: New Jersey
Thompson, S. (2003). Kellogg Raises Snack Ad Spending 20%, Advertising Age, vol. 74 no. 7, pp.3-36
Trost, J. & Hultåker, O. (2012). Enkätboken 4th edn, Lund: Studentlitteratur
Scb.se (2018), Higher Education International Mobility in Higher Education From a Swedish Perspective 2016/17, Available Online: http://www.scb.se/publication/31421[Accessed 14 April 2018]
77
Sevincer, A. T., Varnum, M. W., & Kitayama, S. (2017). The Culture of Cities: Measuring Perceived Cosmopolitanism. Journal Of Cross-Cultural Psychology, vol.48, no.7, pp.1052-1072
Sharma, R. R. & Kaur, B. (2018). Modeling the Elements and Effects of Global Viral Advertising Content: A Cross-Cultural Framework, Vision (09722629), vol. 22, no. 1, pp.1-10
Solomon, A. & Steyn, R. (2017). Cultural intelligence: Concepts and Definition Statements. South African Journal Of Business Management, vol.48, no, 2, pp.67-74.
Statistikdatabasen.se (2018). Swedish and Foreign-born Population by Region, Age and Sex. Year 2000-2017, Statistikdatabasen.se. Available Online: http://www.statistikdatabasen.scb.se/pxweb/en/ssd/START__BE__BE0101__BE0101E/InrUtrFoddaRegAlKon/table/tableViewLayout1/?rxid=ed4f6d58-4dff-4585-92cb-7f20844f1b64 [Accessed 22 May 2018].
Uhr.se. (2018). Available Online: https://www.uhr.se/globalassets/_uhr.se/publikationer/2018/antagning-till-hogre-utbildning-varterminen-2018.pdf [Accessed 7 May 2018].
Vangelov, N. (2017). Emoijis In Marketing Communications, Balkan Social Science Review, vol. 10, no. 10, pp.131-147
Vidovich, L. (2002). Quality Assurance in Australian Higher Education: Globalisation and ‘Steering at a Distance’, Higher Education, vol.43, no, 3, pp.391–408
Wang, H. (2012). New Perspective of Cross-Cultural Communications: Applications in China Marketing, Journal of Marketing Development and Competitiveness vol. 6, no, 5. pp.123-130
Watson, J. J. & Wright, K. (2000). Consumer Ethnocentrism and Attitudes Toward Domestic and Foreign Products, European Journal of Marketing, vol.34, no, 9-10, pp.1149-1166
World Trade Organization (2008). World Trade Report 2008 [pdf] Available at: https://www.wto.org/english/res_e/booksp_e/anrep_e/wtr08-2b_e.pdf [Accessed 24 April 2018]
Yakin, H. M., & Totu, A. (2014). The Semiotic Perspectives of Peirce and Saussure: A Brief Comparative Study, The International Conference on Communication and Media 2014 (i-COME'14) - Communication, Empowerment and Governance: The 21st Century Enigma, 4-8
Zender, M. & Cassedy, A. (2014). (Mis)understanding: Icon Comprehension in Different Cultural Contexts, Visible Language, vol. 48, no. 1, pp.68-95

78
Appendix A Topic Agenda for Focus Group
Location
• The Focus Group will be held in EC. 2:035, April 5th 2018 since this location is based in the university buildings where the premise is that people are gathering. We do not want people to travel too far since this could affect the participant numbers.
• We will have a Swedish Fika for the participants when they arrive.
Time
• Face-to-face: 45-60 minutes. Gives allowance for introduction and closing comments. We believe this amount of time is reasonable since it allows the participants to stay sharp as well as interesting in the discussion
Group
• Nine individuals from various countries: three Germans, two Italians, one Dutch, one American, one Turkish and one Malaysian
• Only one group needed since it is a preoperational study and the variance is high
Focus Group
• Introduction: 5 min. o Explain why we are doing this o Make everyone present themselves o Ask if it is okay to publish their answers in the thesis and maybe use their first name o State the rules (respect each other, one at a time, open discussion, all opinions are
of importance)
• Discussion: 30-40 min 1) As an international student in a foreign country, do you feel like marketing
messages are reaching you effectively? 2) What marketing messages do you understand and messages do you not understand? 3) When shopping in retail locations, is there anything you find frustrating? 4) When shopping in retail locations, are there any instances where you feel like it
would be easier if you spoke Swedish? 5) On you first trip to a supermarket in Sweden, what difficulties did you face? 6) On your first trip to a supermarket in Sweden, what marketing messages did you
understand? 7) Do you feel like you are able to understand food labels and ingredients?

79
8) Are you able to understand signage within Swedish supermarkets? 9) Do you feel like you can easily navigate through a Swedish supermarket? 10) What kind of improvement can you recommend to make the marketing message
more understandable to you? 11) Do you believe that symbols are a good way to cross cultures and make the
marketing multilingual? 12) Do you think these misunderstandings come from cultural or language differences? 13) How is marketing here different than in your home culture? 14) How could the marketing here be improved?
• Closuring and Summary: 5 min o Ask if there is any additional thoughts o Ask if it is acceptable for us to use their answers in our thesis o Thank the participants for coming and for a good discussion

80
Appendix B Segment 2.

81

82
Segment 3.

83

84

85

86
Segment 4.
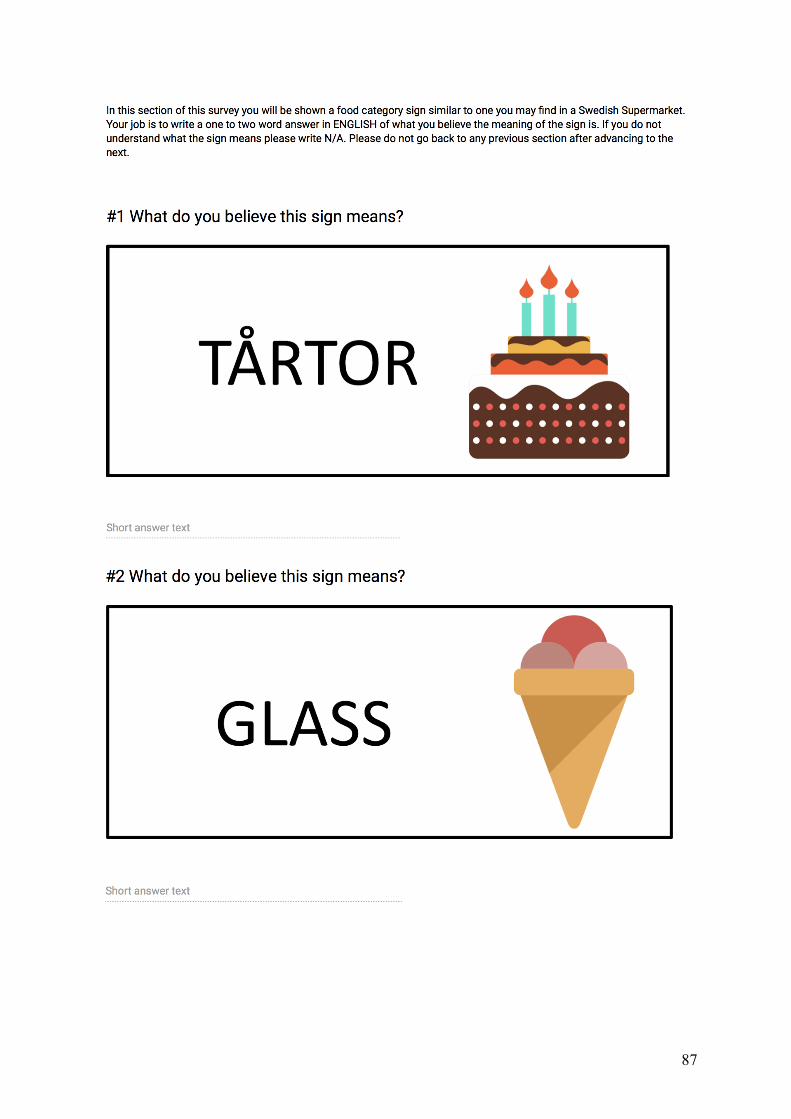
87

88

89

90

91

92
Segment 5.

93
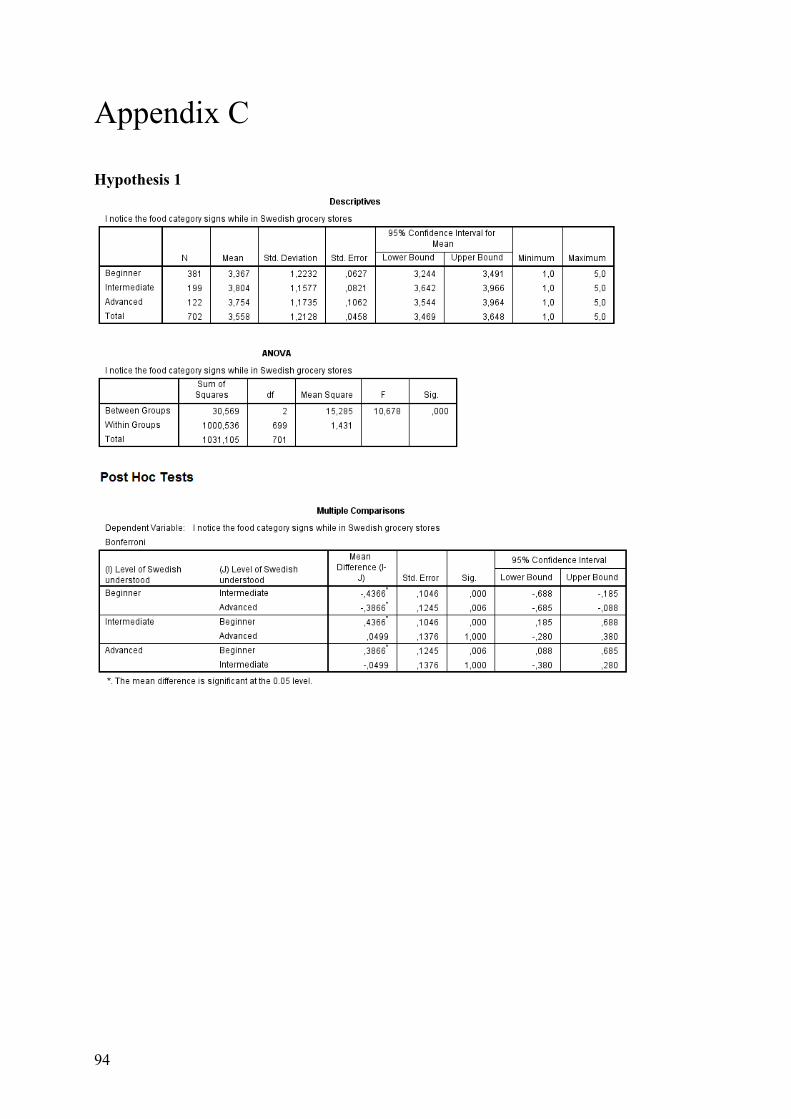
94
Appendix C Hypothesis 1

95
Hypothesis 2

96
Hypothesis 3

97
Hypothesis 4

98
Hypothesis 5

99
Hypothesis 6

100
Hypothesis 7

101
Hypothesis 8
Hypothesis 9

102
Hypothesis 10

103
Hypothesis 11

104
Hypothesis 12
Hypothesis 13

105
Hypothesis 14
Hypothesis 15

106
Hypothesis 16 Overall:

107
Beginner:

108
Intermediate:

109
Advanced: