
Acoustic Emission in Alarm Applications - Lund University Publications
Upload
khangminh22Category
view
1download
0
MasterofScienceThesisVT2016
DepartmentofMedicalRadiationPhysics,ClinicalSciences,Lund
LundUniversitywww.msf.lu.se
EvaluationofdifferencesinattenuationpatternformyocardialperfusionSPECTbetweenCZTandconventionalgamma
cameras
ElinMartinsson
SupervisionJennyOddstigandCeciliaHindorf,Lund

Abstract
The new CZT camera has a different technology compared to conventional scintillationgamma cameras. The CZT camera have pinholes instead of parallel hole collimators, astatic gantry instead of a rotating one and detection material made of a semiconductor in-stead of a scintillation crystal. The images arising from the CZT camera have a differencein appearance compared to the images produced by the conventional technique. The extentof the difference in the attenuation pattern has not yet been investigated. In this masterthesis the differences of the attenuation pattern between the CZT and conventional cameraused in myocardial perfusion SPECT (MPS) imaging were investigated by quantifying thesize, depth and distribution of the attenuation artifact.
Phantom and patient measurements were performed with a CZT camera (GE NM 530c)and a conventional gamma camera (GE Ventri). A cardiac phantom including a lung in-sert (Data Spectrum Corporation) was used in the phantom measurements. Twenty-twopatients underwent a 2-day stress-rest protocol (4MBq/kg, stress and rest) and were exam-ined with both cameras approximately 1.5 hours after administration of 99mTc-tetrofosmin.All images were corrected for attenuation by an externally acquired CT image. Recon-struction parameters recommended by the manufacturer were used. By using the softwareSegment v 2.0 the extent of the attenuation artifact for each camera was defined by a delin-eation in the ratio between the non-attenuation corrected (NAC) and attenuation corrected(AC) phantom images. The ratio image NAC/AC was used to quantify the depth, size anddistribution of the attenuation artifact, in both phantom and patients.
The result showed that the localization of the attenuation artifact was shifted counter-clockwise from the inferolateral wall to the lateral wall for the CZT camera compared toconventional cameras in both patient and phantom measurements. Based on the man-ual delineation of the attenuation artifact in the phantom ratio NAC/AC, the attenuationthresholds were 0.90 and 0.85 for the CZT and conventional cameras, respectively. Thesethreshold values were then applied on the ratio NAC/AC for the phantom and patient mea-surements to obtain the relative depth, size and distribution of the attenuation artifact. For
ii

the phantom the relative depth was 0.73 and 0.67 for CZT and Ventri, respectively. Forthe patients the depth difference was statistically significant (p<0.05), with values of 0.72and 0.68 CZT and Ventri, respectively. The relative size of the attenuation artifact waslarger for the CZT compared to the Ventri camera, 28 % and 19 % for phantom and 23% and 15 % for patients (p<0.05). There was a statistical difference between the cameraswith respect to the distribution of the attenuation artifact for both phantom and patients(p<0.05). The attenuation artifact was wider and counter clockwise shifted in the CZTcamera compared to the Ventri.
The depth, size and distribution of the attenuation artifacts were different when comparingthe CZT camera to the conventional gamma camera. This needs to be taken into consid-eration when evaluating perfusion images, so that perfusion reductions are not missed oroverestimated.
iii

Populärvetenskaplig sammanfattning
I dagsläget används två olika typer av kameror vid myokardscintigrafi-undersökningar,Kadmium-Zink-Tellurid (CZT)-kameran och den konventionella scintillationskameran. Kamerornabygger på två vitt skilda tekniker vilket innebär att bilderna som de producerar innehållervissa skillnader. Det är viktigt att läkarna som granskar bilderna är medvetna om att detförekommer skillnader i bilderna som uppkommit av kamerornas olikheter.
Vid en myokardscintigrafi undersökning studerar man hur blodförsörjningen till hjär-tat beter sig, vilket i förlängningen är ett mått på om hjärtat är friskt. Ett radioaktivtpreparat injiceras i patienten och fördelas i hjärtat. Strålningen som kommer från hjärtatkan detekteras av en kamera och man får fram en bild över fördelningen av det radioaktivapreparatet i hjärtat. Strålningen avtar då den passerar igenom vävnader. Hjärtat är enstor volym, strålningen som kommer från baksidan av hjärtat kommer ha dämpats mycketmer i förhållande till strålningen från framsidan av hjärtat då man har kameran framförkroppen. Det blir en stor skillnad på andelen strålning som detekteras från de olika delarnaav hjärtat och detta påverkar bilden. Denna effekt kallas attenuering. Det är möjligt attkorrigera bilden för attenuering genom att använda sig utav en karta över attenueringensom man kan beräkna från en CT, en röntgenbild.
I detta arbete fastställs det att det är en skillnad i hur attenueringen avbildas i de olikakamerorna. Attenueringen flyttas motsols i den nya kameran jämfört med den konven-tionella. Skillnaderna i attenuering mellan kamerorna beskrivs med hjälp utav tre relativamått: djup, storlek och utbredning. Med hjälp utav dessa mått kan skillnaderna mellankamerorna kvantifieras, detta utförs på fantommätningar och på 37 patientmätningar. Re-sultaten visar att det är en skillnad på hur attenuering avbildas i de två kamerorna. Medden modernare CZT-kameran täcker attenueringsartefakten en större del av bilden än medden konventionella tekniken. Attenueringen är dock inte lika djup som i den konventionellatekniken.
Att det är en skillnad i hur kamerorna avbildar attenueringen är en viktig slutsats somläkarna som granskar bilderna måste vara medvetna om när de diagnostiserar patientenutifrån dessa bilder.
iv

Table of Contents
1 List of abbreviations 2
2 Background 32.1 Gamma cameras . . . . . . . . . . . . . . . . . . . . . . . . . . . . . . . . . . 32.2 Myocardial Perfusion SPECT . . . . . . . . . . . . . . . . . . . . . . . . . . . 32.3 Attenuation correction . . . . . . . . . . . . . . . . . . . . . . . . . . . . . . . 42.4 Orientation . . . . . . . . . . . . . . . . . . . . . . . . . . . . . . . . . . . . . 52.5 Co-registration . . . . . . . . . . . . . . . . . . . . . . . . . . . . . . . . . . . 62.6 CZT camera . . . . . . . . . . . . . . . . . . . . . . . . . . . . . . . . . . . . 62.7 Ventri camera . . . . . . . . . . . . . . . . . . . . . . . . . . . . . . . . . . . 82.8 SPECT/CT camera . . . . . . . . . . . . . . . . . . . . . . . . . . . . . . . . 9
3 Aim 11
4 Material and methods 124.1 Phantom . . . . . . . . . . . . . . . . . . . . . . . . . . . . . . . . . . . . . . 12
4.1.1 Defect 144.2 Patient population . . . . . . . . . . . . . . . . . . . . . . . . . . . . . . . . . 144.3 Reconstruction and post processing of data . . . . . . . . . . . . . . . . . . . 154.4 Orientation . . . . . . . . . . . . . . . . . . . . . . . . . . . . . . . . . . . . . 174.5 Co-registration . . . . . . . . . . . . . . . . . . . . . . . . . . . . . . . . . . . 184.6 Attenuation correction on CZT . . . . . . . . . . . . . . . . . . . . . . . . . . 204.7 Differences in attenuation defects for CZT and conventional cameras . . . . . . 20
4.7.1 Depth 214.7.2 Size 214.7.3 Distribution 22
4.8 Statistics . . . . . . . . . . . . . . . . . . . . . . . . . . . . . . . . . . . . . . 22
5 Results 23
v

TABLE OF CONTENTS 1
5.1 Orientation . . . . . . . . . . . . . . . . . . . . . . . . . . . . . . . . . . . . . 235.2 Co-registration . . . . . . . . . . . . . . . . . . . . . . . . . . . . . . . . . . . 245.3 Attenuation correction on CZT . . . . . . . . . . . . . . . . . . . . . . . . . . 265.4 Differences in attenuation artifacts for CZT and conventional cameras . . . . . 27
5.4.1 Depth 305.4.2 Size 315.4.3 Distribution 32
5.5 Different positioning of defects for CZT and conventional cameras . . . . . . . 34
6 Discussion 35
7 Conclusion 38
8 Future Work 39
References 41

Chapter1List of abbreviations
AC Attenuation Correction
CZT Cadmium Zinc Telluride
CT Computer Tomography
LEHR Low Energy High Resolution
MPS Myocardial Perfusion scintigraphy
NAC No Attenuation Correction
NaI(Tl) Sodium Iodide
NM Nuclear Medicine
OSEM Order Subset Expectation Maximization
PCI Percutan Coronar Interventrion
SNR Signal to Noise Ratio
SPECT Single Photon Emission Computed Tomography
2

Chapter2Background
2.1 Gamma cameras
The new Cadmium Zinc Telluride (CZT) gamma camera (Discovery NM 530c, GE Health-care, Haifa, Israel) is a cardiac dedicated gamma camera that has a different technologycompared to the conventional NaI(Tl) scintillation cameras. The CZT camera has pin-holes instead of parallel-hole collimators, a static gantry instead of a rotating one and thedetection material is made of a semiconductor material instead of a scintillation crystal.The images arising from the CZT camera have a difference in appearance compared to theimages produced by the conventional technique [27] [5]. It is of importance that the physi-cians viewing the images from the different cameras know about the difference between theimages. The difference in appearance of the attenuation pattern in the images has not yetbeen studied.
2.2 Myocardial Perfusion SPECT
Myocardial perfusion scintigraphy (MPS) is a Nuclear Medicine (NM) examination that isused to detect, localize and assess the extent of ischemia or infarction of the myocardium inthe left ventricle of the heart by viewing the perfusion, i.e. blood supply, in the myocardium[38] [3] [29] [27]. The heart consists of two atriums and two ventricles, one of each in theleft and right part of the heart respectively. The oxygen-poor venous blood goes via theright atrium to the right ventricle where it is pumped out to the lungs. In the lungs a gasexchange takes place and the oxygenated blood is transferred via the left atrium to the leftventricle where the blood is pumped out to the whole body, which includes the coronaryarteries. Since the left ventricle has to pump the blood through a bigger cycle, than theright ventricle, the left ventricle myocardium is much thicker than the right. [4]
In MPS stress and rest images of the left ventricle are compared to diagnose heart diseasein patient. A MPS radio-tracer marked to a perfusion-marker is injected intra-venously [7].The uptake of the perfusion-marker in the tissues is related to the perfusion. The uptake
3

4 Background
of the perfusion-marker in the left ventricle is related to the perfusion in the myocardiumas well as the presence of living myocytes [7].
A common radio-tracer and perfusion-marker to use in MPS is 99mTc and tetrofosmin,respectively. 99mTc emits 140 keV gamma rays with a half value length in water of 4.5 cm[34]. This should be compared to the thickness of the heart, anterior wall to the inferiorwall, is approximately 6 cm [4]. Tetrofosmin binds to the myocytes. Approximately 1.2 %of the injected perfusion marker is distributed in the left ventricle [20].
2.3 Attenuation correction
In MPS images the perfusion defects and the attenuation artifact look alike; both will beimaged as an isotope reduction [10]. The perfusion can be distinguished from the atten-uation by either using prone imaging or by performing an attenuation correction with aComputer Tomography (CT) image [28].
In prone imaging the patient is imaged in both supine and prone position, the imagesare then compared. When laying in prone position, the heart will fall forward causing adifference in anatomy compared to the supine position, the attenuation artifact will appeardifferent [10]. By repositioning the patient, the artifacts from attenuation can be detected[40]. However prone imaging does not reduce breast attenuation or the attenuation fromunderarm fat pads [10] [28].
In attenuation correction with CT, the CT image is used to create an attenuation mapof the patient [30]. When applying the attenuation map the MPS image will be attenua-tion corrected, in the optimal case the isotope reduction will only be caused by perfusiondefects. Attenuation correction is used to compensate for the photons absorbed by theatoms in the patient from a combination of photoelectric effect and compton scatter effects[10].
In women more defects are located in the anterior wall compared to men, presumablya result from breast attenuation. The attenuation correction works better when correctinginferior wall defects compared to anterior wall defects. D.Malkerneker et al concludes thatattenuation correction with a CT and prone imaging is therefore more helpful in men thanwomen. [28]
Attenuation correction decreases the number of artifacts to a greater extent in compar-ison to prone imaging [28]. The recommendation by the European Association of NuclearMedicine and the American Society of Nuclear Medicine is that attenuation correction shallbe used for MPS [40] [18].

Background 5
The attenuation corrected images of the conventional gamma camera have got an improvedaccuracy of how the true perfusion uptake is imaged compared to the non-attenuation cor-rected images [10] [9] [30]. The main effect of the attenuation correction is seen in theinferior/inferior-septal wall region on a conventional camera using 99mTc [9] [31] [28]. Theattenuation in the inferior wall may be overcorrected when there is an intestinal uptake.The intestinal uptake will cause confounding imaging artifacts in the attenuation correctedimages [10]. The partial volume effect in conventional gamma camera images may also leadto artifacts in the attenuation corrected images, meaning that small changes in the isotopeconcentration may not be imaged since the imaging system has got a limited resolution [9].
C. J. Liu et al describe that the isotope reduction caused by attenuation is less in theCZT camera compared to the conventional camera in non-attenuation corrected images.They also describe that there is less breast attenuation in the CZT camera images com-pared to the images from the conventional camera. [27]
The tracer uptake of attenuation corrected CZT images strongly correlates with the at-tenuation corrected images from the conventional camera [39]. The clinical agreementbetween the attenuation correction of the CZT and conventional camera is excellent [19].F Caobelli et. al. has compared the results from attenuation corrected CZT images, withan externally acquired CT image, with the results from an invasive angiography. From thisarticle they conclude that attenuation correction for CZT camera is feasible and improvesdiagnostic accuracy mostly by improving specificity over non attenuation corrected images[6].
2.4 Orientation
Adjustment of orientation lines is performed on reconstructed MPS images. The aim is toposition the orientation lines in the standard oblique images as shown in Figure 2.1. Theaxis should always be oriented in the same way regardless of how the heart is angled inthe patient, to facilitate the reading of the images. The same position in the reconstructedimages correspond to the same part of the myocardium every single time. [5]
HLAVLA SA
Figure 2.1: The standard cardiac oblique images; VLA: Vertical Long Axis. HLA:Horizontal Long Axis. SA: Short Axis.

6 Background
2.5 Co-registration
When performing attenuation correction an attenuation map is produced from a co-registrationof NM and CT images. The co-registration is either performed with auto-match or manualmatch. In MPS attenuation correction the co-registration of the left ventricle of the NMimage should overlay the left ventricle in the CT image. If the co-registration is misaligned,i.e. the left ventricle of the NM and CT image does not overlay, the regional distribution ofthe isotope can be miss portrayed in the attenuation corrected image [12]. Kennedy, J. A.et al conclude that a misregistration in the dorsal/ventral axis affects the MPS attenuationcorrected image the most [26]. The same article concludes that the most significant changein the attenuation corrected image occurred when the left ventricle overlapped the lungtissue on the CT, which affected the lateral and anterior walls of the attenuation correctedimage [26].
Numerous articles highlight the importance of a correct co-registration [13] [36] [14]. Whennot viewing the co-registration performed the incidence of false positive results is 40 %. Theincidence of false positive results can be lowered by viewing every single co-registration. [15]
2.6 CZT camera
The CZT camera (Discovery NM 530c, GE Healthcare) is a cardiac dedicated gamma cam-era that is based on a relatively new technology, Figure 2.2. The camera combines rigidpinhole collimators with a detection material made of a semiconductor. The camera is op-erated at room temperature [33]. The CZT camera consists of 19 rigid pinhole collimatorsmade of tungsten [5]. The collimators are arranged in three rows; nine of the pinhole detec-tors are oriented perpendicular to the patient’s long axis whereas five are angulated abovethe patient’s long axis and five are angulated below the patient’s long axis [11]. The collima-tors makes up a spherical shaped field of view with a 19 cm diameter [5]. To avoid positionrelated artifacts in the image it is of importance that the patient’s heart is positioned closeto the center of the field of view [21]. When the patient has got a large torso it is not possi-ble to position the heart in the field of view. Patients where no adequate positioning can beensured should not be examined in the CZT camera, since the diagnostic image quality cannot be ensured when the heart is not positioned in the middle of the field of view volume [8].
To determine the origin of the gamma rays a collimator is needed. The collimator willonly allow photons from a determined direction to reach the detector. For the pinholecollimator the photons will be collimated through a small pinhole, Figure 2.3. The rela-tive distance between object and pinhole versus pinhole and the surface where the imageis projected determines the size of the projected object [2]. When the distance betweenthe pinhole and surface are greater than the object pinhole distance the object will bemagnified. The magnification of the projection suppresses information loss due to intrinsic

Background 7
camera blurring [2].
Figure 2.2: The CZT camera (Discovery NM 530c, GE Healthcare) [25]
Each pinhole collimator in the CZT camera possesses four detecting matrices [5]. Eachdetector matrix is 4 x 4 cm in size and consists of 32 x 32 pixel elements, each with a size of2.46 x 2.46 mm. The semiconducting detectors are made of cadmium-zinc-telluride (CZT)[5].
The incident photon will create an electron-hole pair in the CZT detector. The numberof electron-hole pairs created is proportional to the energy of the incident photon. An ex-ternal voltage is applied over the CZT detector, the electrons migrates to the positive anodeand the holes migrates to the negative cathode, inducing a charge that can be measured.In the conventional scintillation camera, the incident photon will interact with the scintil-lation crystal where it will deposit its energy, creating scintillation light. The scintillationlight is transferred to PM-tubes where the light interacts with the photocathode. Electronsare released from the photocathode and are amplified in the PM-tubes into a measurablesignal. However, there is electron and hole trapping in the semiconducting detection mate-rial meaning that not all electrons and holes created will be transferred to the electrodes.And due to diffusion the charges will be transferred laterally, meaning that a number ofanodes may register the same interaction. Because of the diffusion of the semiconductingdetector the energy pulse height spectrum is not comparable to the scintillation camerasenergy pulse height spectrum. [5] [11] [35]

8 Background
Figure 2.3: The principles of parallel and pinhole collimators [2]
The gantry of the CZT camera is rigid and the data is collected in all angles simultane-ously enabling shorter measurement time in comparison to the conventional gamma camera[5]. Another advantage of the CZT camera compared to the conventional gamma camerais the improved spatial, temporal and energy resolution [5] as shown in Table 2.1.
Table 2.1: Performance of the CZT, Ventri and SPECT/CT for 99mTc imaging.Values from the in house acceptance-test for the cameras. The performanceof conventional cameras was measured according to the NEMA standards withthe LEHR collimator [1]. Spatial resolution measured in the center of FOVwith 10 cm of scattering material. Energy resolution without using the parallelcollimators. System sensitivity measured in the center of FOV for the CZTcamera and at 10 cm distance for the conventional gamma cameras.
Performance CZT camera Ventri SPECT/CTSpatial Resolution FWHM [mm] 7.6 x and 5.0 y 7.75 8.65
Energy Resolution at 140 keV FWHM [%] 5.5 8.8 9.33System Sensitivity [cps/MBq] 496 177.4 142.6
2.7 Ventri camera
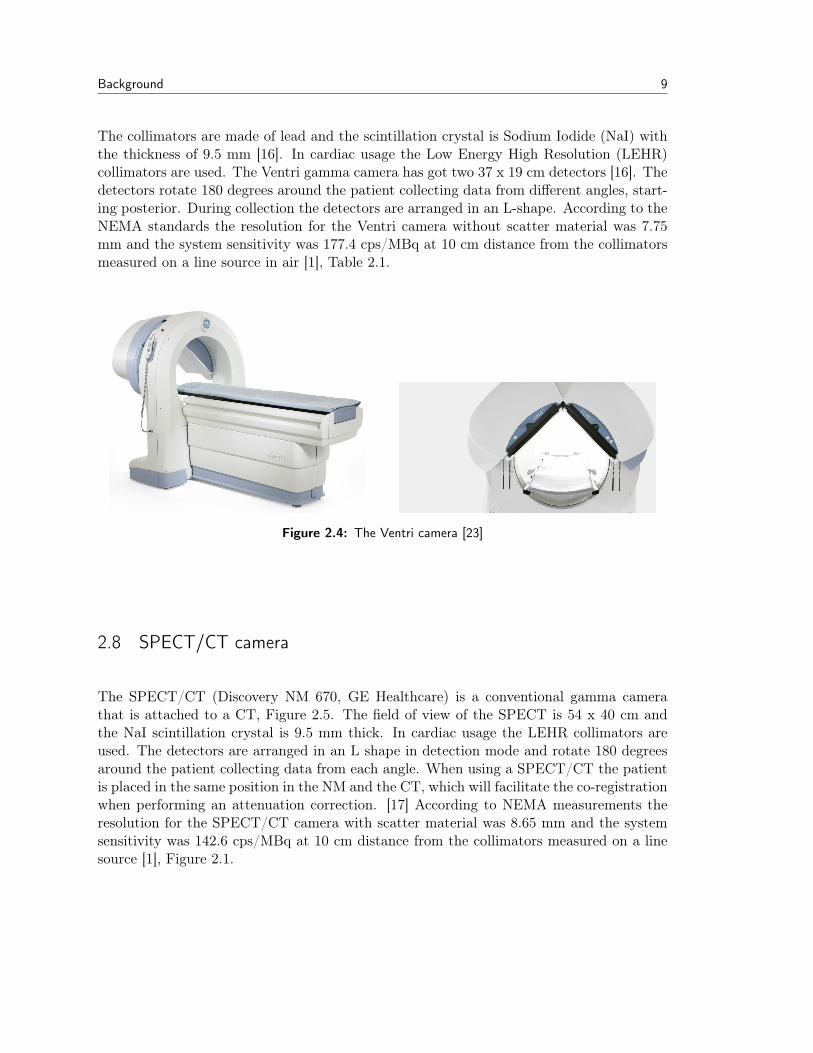
The Ventri (GE Healthcare) is a conventional gamma camera that is dedicated for cardiacusage, Figure 2.4. The Ventri camera consist of parallel hole collimators. The parallel-holecollimators consist of many holes where the photons will be collimated through, Figure 2.3.The sensitivity of the parallel-hole collimators is, within reasonable distance, independentof the distance between the object and collimator. When the object is not placed againstthe collimators the image resolution will be degraded significantly [2].
Background 9
The collimators are made of lead and the scintillation crystal is Sodium Iodide (NaI) withthe thickness of 9.5 mm [16]. In cardiac usage the Low Energy High Resolution (LEHR)collimators are used. The Ventri gamma camera has got two 37 x 19 cm detectors [16]. Thedetectors rotate 180 degrees around the patient collecting data from different angles, start-ing posterior. During collection the detectors are arranged in an L-shape. According to theNEMA standards the resolution for the Ventri camera without scatter material was 7.75mm and the system sensitivity was 177.4 cps/MBq at 10 cm distance from the collimatorsmeasured on a line source in air [1], Table 2.1.
Figure 2.4: The Ventri camera [23]
2.8 SPECT/CT camera
The SPECT/CT (Discovery NM 670, GE Healthcare) is a conventional gamma camerathat is attached to a CT, Figure 2.5. The field of view of the SPECT is 54 x 40 cm andthe NaI scintillation crystal is 9.5 mm thick. In cardiac usage the LEHR collimators areused. The detectors are arranged in an L shape in detection mode and rotate 180 degreesaround the patient collecting data from each angle. When using a SPECT/CT the patientis placed in the same position in the NM and the CT, which will facilitate the co-registrationwhen performing an attenuation correction. [17] According to NEMA measurements theresolution for the SPECT/CT camera with scatter material was 8.65 mm and the systemsensitivity was 142.6 cps/MBq at 10 cm distance from the collimators measured on a linesource [1], Figure 2.1.

10 Background
Figure 2.5: The SPECT/CT camera (Discovery NM 670, GE Healthcare)[24]

Chapter3Aim
It has not yet been properly investigated to what extent the attenuation pattern differsbetween the CZT and conventional gamma cameras. It is of importance to investigate thedifference of the attenuation pattern since not all cardiac cameras are equipped with a CT,attenuation correction is not usually performed in clinical routine.
The aim of this thesis is therefore to investigate the attenuation pattern of the CZT andconventional cameras regarding the relative isotope reduction, the size and the distribution.
11

Chapter4Material and methods
4.1 Phantom
Two phantoms were available: The Anthropomorphic Torso Model ECT/TOR/P (DataSpectrum Corporation) and the Elliptical Lung-Spine Body PhantomModel ECT/LUNG/P(Data Spectrum Corporation), Figure 4.1. The difference between the phantoms was thechest dimensions. The Anthropomorphic Torso Model ECT/TOR/P has got a humanshaped torso with a circumference of 128 cm, representing an overweight person. The El-liptical Lung-Spine Body Phantom Model ECT/LUNG/P has got an elliptical shape witha circumference of 75 cm representing an average person. To be used in the phantom mea-surement an adequate positioning of the phantom in the CZT camera had to be feasible [21].The heart insertions of the two phantoms were filled with a 99mTc solution and the phan-toms were thereafter measured in the CZT camera. However, the Anthropomorphic TorsoModel ECT/TOR/P was too large to obtain an adequate positioning, the heart was not inthe center field of view. The Elliptical Lung-Spine Body Phantom Model ECT/LUNG/Pwas therefore used in the phantom measurements.
A B
Figure 4.1: A: Anthropomorphic Torso Model ECT/TOR/P (Data Spectrum Cor-poration). B: Elliptical Lung-Spine Body Phantom Model ECT/LUNG/P(Data Spectrum Corporation). The cardiac insertion Cardiac Insertion withSolid/Fillable Model ECT/CAR/I (Data Spectrum Corporation) present inboth phantom A and B.
12

Material and methods 13
The phantom measurements were conducted with three different gamma cameras: theCZT, the Ventri and the SPECT/CT. In all phantom measurements the heart was filledwith a 99mTc solution. Three different phantom measurements set-ups were performed. Inthe first set-up the phantom contained air. In the second set-up the phantom was filledwith water. In the third set-up a spine and lung insertion was present as well as water. Thethree different set-ups were named air, water and lung, respectively. Measurements of allthree set-ups were conducted on the CZT and Ventri camera. The water and lung set-upswere performed at the SPECT/CT.
The heart insertion was filled with water and 99mTc, with the activity concentration rang-ing from 0.14 MBq/ml to 0.36 MBq/ml. The amount of activity and acquisition time wasselected so that the signal to noise ratio (SNR) in the images was not less than the SNRin patient images. Approximately 1.2 % of the injected perfusion marker is distributed inthe left ventricle [20]. There were at least twice as many counts in the phantom images incomparison to the patient images.
The phantom was positioned in a cradle and carefully positioned in the gamma cameraswith the help of an external laser beam to obtain a repeatable positioning.
The size of the pixel-elements in the reconstructed image of the CZT camera was 4 x 4mm and the slice thickness was 4 mm. The energy window width was 130 − 151 keV, theduration of the measurement ranged from 480 s to 960 s.
The size of the Ventri matrix for the projection data and the reconstructed image was64 x 64 pixel elements, each pixel with a size of 6.4 x 6.4 mm and with the slice thickness of1 pixel. The field of view of the camera was 409.6 x 409.6 mm. The energy window widthwas 126.5− 154.5 keV. In total 60 angles were collected over 180 degrees, 30 angles on eachcamera head. The duration of the measurement ranged from 25 s/angle to 40 s/angle.
The size of the SPECT/CT matrix for the projection data and the reconstructed image was64 x 64 pixel elements, each pixel with a size of 6.9 x 6.9 mm and with the slice thickness of1 pixel. The field of view of the camera was 441.8 x 441.8 mm. The energy window widthwas 126.5− 154.5 keV. In total 60 angles were collected over 180 degrees, 30 angles on eachcamera head. The duration of the measurement was 45 s/angle.
In connection to all phantom measurements a low dose CT was conducted with an ex-ternal CT. The tube voltage and current used were 100 kV and 20 mA, respectively. Thesize of the CT matrix was 512 x 512 pixel elements; each pixel element was a 1.37 x 1.37mm, with the slice thickness 1.37 mm.

14 Material and methods
4.1.1 Defect
A defect of the volume 2.12 cm3, 8 mm thick and 20 mm wide, was placed in the anteriorwall of the cardiac insertion, Figure 4.2. The lung set-up was used to perform measurementsof the defect at the CZT, Ventri and SPECT/CT camera.
Additional defect measurements were performed at the CZT and Ventri camera. The de-fects used were both 8 mm wide but had different volumes 2.12 cm3 and 0.82 cm3, namedlarge and small respectively. Measurements were performed when the defect was positionedin the anterior, septal, inferior and lateral wall.
Figure 4.2: The heart defect located in the anterior wall of the left ventricle of thecardiac insertion.
4.2 Patient population
The patients included in this study were all on the waiting-list to get an Percutan Coro-nar Intervention (PCI). The study was approved by the regional ethics committee andall patients gave their written informed consent to participate in the study. The patientsunderwent both stress, lying adenosine, and rest MPS with 99mTc-tetrofosmin and were im-aged on the CZT and the Ventri camera. All patients underwent CT on an external camera.
The total number of patients included in the study was 22 as grouped into 17 males and 5females. The average age of the patients included was 68 years, ranging from 59 to 87 years.

Material and methods 15
The BMI of the patients ranges from 21 to 35 kg/m2 and the average weight of the patientswas 85 kg. The total number of examinations used was 37, 19 stress examinations and 18rest examinations performed on both the CZT and Ventri camera. The injected activitywas calculated as 4 MBq/kg. The injected activity was in average 355 MBq ranging from188 MBq to 566 MBq for stress examination and in average 384 MBq for rest examinationranging from 286 MBq to 566 MBq. The time between injection and imaging was in average93 minutes ranging from 30 to 180 minutes. The effective dose to the patients was on theaverage 3.17 mSv and 2.73 mSv stress and rest, respectively [32].
The image acquisition parameters used were the same as for the phantom study. Thepatients underwent a 2-day protocol, stress and rest examinations were performed on sep-arate days. The stress and rest acquisition times for each patient measurement were 480 swith the CZT camera and 25 s/angle with the Ventri camera.
4.3 Reconstruction and post processing of data
The reconstruction parameters used were the same as applied in the clinic. The CZT cam-era images were reconstructed with a penalized maximum likelihood iterative reconstructionadapted to the 3D geometry of the CZT camera. Forty (40) and 50 iterations with GreenOSL regularization α 0.51 and 0.41 and Green OSL regularization β 0.3 and 0.2 were usedfor the non-gated stress and rest studies, respectively. The images were post-filtered witha Butterworth filter with a cut-off frequency of 0.37 and a power of 7.
The non-gated images from the Ventri and SPECT/CT cameras were reconstructed witha resolution recovery Ordered Subset Expectation Maximization (OSEM), consisting of 12iterations and 10 subsets. The images were post-filtered with a Butterworth filter with acut off frequency of 0.5 and power of 10.
All reconstruction parameters used followed the recommendations from the manufacturer.The images were reconstructed on a dedicated workstation (GE Healthcare Xeleris). Allimages were reconstructed in the standard axes (short axis, vertical long axis, horizontallongaxis) and polar maps of the left ventricle were created.
The data was analyzed in the segmentation program Segment v 2.0 [37]. The short axisimages of the left ventricle were segmented. The difference in the voxel size of the imagesproduced by the CZT and Ventri meant that a different number of slices was needed toencompass the left ventricle. The voxel size in the two cameras differed by a factor 1.6. AVentri image of twelve slices would cover the same area as a 20 slice CZT image, Figure4.3.

16 Material and methods
A B
Figure 4.3: A: The segmentation of the left ventricle in the CZT camera, 20 slices.B: The segmentation of the left ventricle in the Ventri camera, 12 slices. Theright upper corner shows the slices that are included in the segmentation ofthe left ventricle, the yellow lines.
2
1
34
5
6
7
8
910
11
12
Figure 4.4: The placement of the sectors when applying a 12 sector model seg-menting short axis left ventricle images. The apex is positioned in the middleof the circle and the base at the edge of the circle. The slices are distributedover the circle, each slice area in the circle represents the volume of the slice.
Each slice of the left ventricle was divided into 12 equal sized sectors, Figure 4.4. Theapex of the left ventricle was positioned in the middle of the segmentation circle and the
Material and methods 17
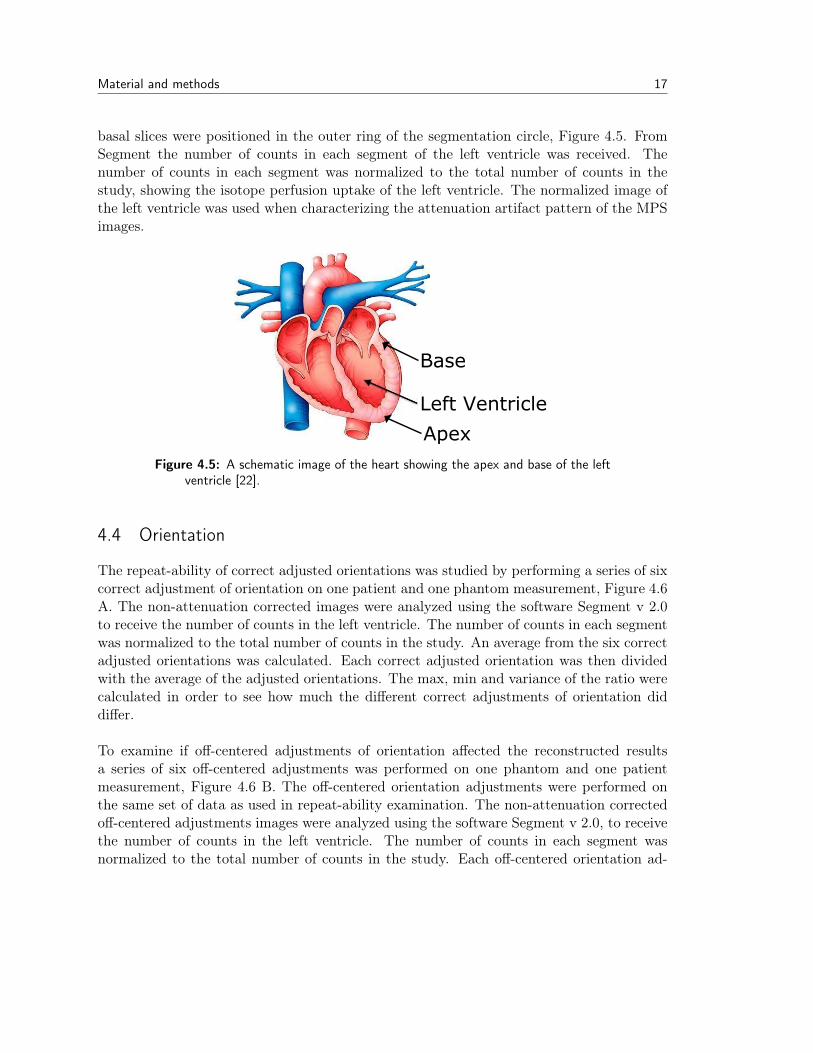
basal slices were positioned in the outer ring of the segmentation circle, Figure 4.5. FromSegment the number of counts in each segment of the left ventricle was received. Thenumber of counts in each segment was normalized to the total number of counts in thestudy, showing the isotope perfusion uptake of the left ventricle. The normalized image ofthe left ventricle was used when characterizing the attenuation artifact pattern of the MPSimages.
Left Ventricle
Apex
Base
Figure 4.5: A schematic image of the heart showing the apex and base of the leftventricle [22].
4.4 Orientation
The repeat-ability of correct adjusted orientations was studied by performing a series of sixcorrect adjustment of orientation on one patient and one phantom measurement, Figure 4.6A. The non-attenuation corrected images were analyzed using the software Segment v 2.0to receive the number of counts in the left ventricle. The number of counts in each segmentwas normalized to the total number of counts in the study. An average from the six correctadjusted orientations was calculated. Each correct adjusted orientation was then dividedwith the average of the adjusted orientations. The max, min and variance of the ratio werecalculated in order to see how much the different correct adjustments of orientation diddiffer.
To examine if off-centered adjustments of orientation affected the reconstructed resultsa series of six off-centered adjustments was performed on one phantom and one patientmeasurement, Figure 4.6 B. The off-centered orientation adjustments were performed onthe same set of data as used in repeat-ability examination. The non-attenuation correctedoff-centered adjustments images were analyzed using the software Segment v 2.0, to receivethe number of counts in the left ventricle. The number of counts in each segment wasnormalized to the total number of counts in the study. Each off-centered orientation ad-

18 Material and methods
justment was divided with the average of the corresponding accurately adjusted orientationmeasurement. The max, min and variance of the ratio were calculated.
A B
Figure 4.6: The adjustment of orientation lines on a Xeleris station. The adjust-ments are performed prior to the reconstruction. A) A correct adjustment oforientation. B) An off-centered adjustment of orientation.
4.5 Co-registration
The NM images and the CT images were collected at different occasions. A manual co-registration had to be performed. To investigate the importance of alignment in the co-registration, six correct co-registrations were reconstructed on both a phantom and a patientmeasurement, Figure 4.7. The attenuation corrected images were analyzed using the soft-ware Segment v 2.0 to receive the number of counts in the left ventricle. The number ofcounts in each segment was normalized to the total number of counts in the study. Anaverage from the six correct co-registrations was calculated. The result from each correctco-registration was divided by the average of all correct co-registrations, segment by seg-ment. The max, min and variance were calculated to investigate how much the differentcorrect co-registrations differed from each other.
Three misaligned co-registrations were performed on the same data as used in the previ-ous correct co-registration measurements. In the first co-registration, half the myocardiumwall overlapped the lung, Figure 4.8 B. In the second co-registration, half the myocardiumwall overlapped the soft tissue, Figure 4.8 C. In the third co-registration, a quarter of themyocardium overlapped the lung, Figure 4.8 D. The attenuation corrected images were an-alyzed using the software Segment v 2.0 to receive the number of counts in the left ventricle.The number of counts in each segment was normalized to the total number of counts in thestudy. Each misaligned co-registration was divided with the average of the correspondingcorrect co-registration. The max, min and variance of the ratio matrices were calculated toinvestigate how misaligned co-registrations affected the attenuation corrected images.

Material and methods 19
A
B
C
Figure 4.7: The co-registration window in Xeleris when performing attenuationcorrection on a patient measurement. A: The CT image. B: The NM image.C: A fusion of A and B showing how the co-registration will be performed.
B
C D
A
Figure 4.8: The red structure represents the NM image and it is overlaying theheart structure in the CT of a phantom measurement. A) A correct co-registration. B) A misaligned co-registration where half of the myocardiumwall overlap the lung tissue. C) A misaligned co-registration where half ofthe myocardium wall overlap the soft tissue. D) A misaligned co-registrationwhere a quarter of the myocardium wall overlaps the lung tissue.

20 Material and methods
4.6 Attenuation correction on CZT
To draw conclusions of the differences between the attenuation artifact pattern of the twogamma cameras the attenuation correction of the two cameras have to give an equal result.The attenuation corrected images were analyzed using the software Segment v 2.0 to receivethe number of counts in the left ventricle. The number of counts in each segment wasnormalized to the total number of counts in the study. The CZT image was then scaleddown from a 20 slice model to a 12 slice model. The attenuation corrected CZT imagewas divided with the attenuation corrected Ventri image CZTAC/VentriAC , segment bysegment. The average of the ratio was calculated and compared for all phantom and patientmeasurements.
4.7 Differences in attenuation defects for CZT and conventional cameras
To what extent the attenuation artifact pattern differed between the CZT and Ventri cam-eras was investigated by dividing the non-attenuation corrected image with the correspond-ing attenuation corrected image. The ratio obtained described the attenuation artifact.Each non attenuation corrected and attenuation corrected image was at first analyzed us-ing the software Segment v 2.0, to receive the number of counts in the left ventricle. Thenumber of counts in each segment was normalized to the total number of counts in thestudy. The analyzed non attenuation corrected (NAC) image was divided with the attenu-ation corrected image (AC), creating the ratio (NAC/AC) describing the attenuation.
The NAC/AC ratio of the phantom measurement with a defect for the three cameras wasused to define a threshold value of the attenuation artifact. The threshold chosen includedthe attenuation artifact but did not include segments containing the defect. Each gammacamera had its own individual threshold value.
All patient studies were analyzed with the same previous procedure. Each non attenu-ation corrected and attenuation corrected image was at first analyzed in Segment v 2.0, toreceive the number of counts in the left ventricle. The number of counts in each segmentwas normalized to the total number of counts in the study. The NAC image was dividedwith the AC image, creating a NAC/AC ratio describing the attenuation. The thresholdvalues derived from the phantom defect measurement were then applied on the patientratio images. The threshold was used to define which segments contained the attenuationartifact in the ratio NAC/AC in phantom and patient measurement, to study the depth,size and distribution of the attenuation artifact.

Material and methods 21
4.7.1 Depth
From the ratio NAC/AC with the applied threshold value for each gamma camera the depthof the attenuation artifact was calculated for each individual measurement, Equation 4.1.The depth describes the isotope reduction in the attenuation artifact in comparison to theaverage isotope concentration in the left ventricle. The segments that represent the averageconcentration have been derived from the phantom defect measurement. The top 30 % wasa substantial area of the left ventricle that did not contain the attenuation artifact or thedefect.
Depth =Average of the counts in the segments containing the attenuation artifactAverage of counts in the 30 % segments containing the highest counts
(4.1)
4.7.2 Size
From the ratio NAC/AC with the applied threshold value for each gamma camera the sizeof the attenuation artifact of each individual measurement was calculated, Equation 4.2.The size described the percentage of the image occupied by the attenuation artifact, Figure4.9.
Size =Number of segments containing the artifact
Number of segments in the image(4.2)
Figure 4.9: A image of the left ventricle showing the location of the attenuationartifact, red, and the placement of the sectors. The size of the attenuationartifacts are the red area divided with the image, Equation 4.2

22 Material and methods
4.7.3 Distribution
From the ratio NAC/AC with the applied threshold value for each camera the distributionof the attenuation artifact in each individual measurement was calculated, Equation 4.3.The distribution describes the percentage of the attenuation artifact in each sector, Figure4.10
Distribution =Number of segments containing the attenuation artifact in each sector
Number of segments in the image(4.3)
Figure 4.10: An image of the left ventricle showing the location of the attenuationartifact, red, and the placement of the sectors. The percentage of red area ineach sector divided with the number of segments in the image describes thedistribution of the attenuation artifact, Equation 4.3
4.8 Statistics
The paired students T-test with a two-tailed distribution was used to test if there was astatistical difference between the results arising from the different gamma cameras. Thedepth, size and distributions for each patient measurement were all statistical analyzed.The distribution of the phantom measurements was tested.

Chapter5Results
5.1 Orientation
The results from the adjustment of orientation showed a variance of 0.007 and 0.009 for thesix correct orientation adjusted ratio images for phantom and patient, respectively, Table5.1. The off-centered adjustment of orientation resulted in a variance of 0.028 and 0.020for the six off-centered phantom and patient, respectively, Table 5.2.
The variances of the correct adjusted orientations were smaller in comparison to the off-centered orientation adjustments for both phantom and patient. There was a greater de-viation in the max for the off-centered orientations in comparison to the correct adjustedorientations in phantom and patient.
Table 5.1: The max, min and variance of the deviation between the correct orienta-tion adjusted and the average of the correct adjusted images for the phantomand patient measurements on the CZT camera, using the lung set-up.
Phantom PatientMax Min Variance Max Min Variance1.29 0.78 0.007 1.14 0.92 0.0091.11 0.92 0.0006 1.09 0.89 0.0071.16 0.83 0.003 1.06 0.97 0.00011.17 0.80 0.003 1.40 0.93 0.00021.02 0.92 0.0002 1.07 0.88 0.00061.04 0.93 0.0003 1.10 0.91 0.0006
23

24 Results
Table 5.2: The max, min and variance of the deviation between the off-centeredorientation and the average of the correct orientation adjusted images forthe phantom and patient measurements on the CZT camera, using the lungset-up.
Phantom PatientMax Min Variance Max Min Variance1.89 0.52 0.028 1.38 0.60 0.0131.42 0.77 0.006 1.76 0.53 0.0201.71 0.33 0.027 1.31 0.76 0.0071.55 0.55 0.024 1.26 0.74 0.0051.65 0.74 0.013 1.37 0.80 0.0061.18 0.53 0.009 1.16 0.84 0.002
5.2 Co-registration
The results from the correct co-registration showed a variance of 0.008 and 0.012 for phan-tom measurements and 0.0035 and 0.0008 for patient measurements in the CZT and Ventricamera, respectively, Table 5.3.
Table 5.3: The max, min and variance of the deviation between the correct co-registration and the average of the correct co-registrations for the lung phan-tom and a patient measurement on the CZT and Ventri camera.
Phantom CZT Phantom Ventri Patient CZT Patient VentriMax Min Variance Max Min Variance Max Min Variance Max Min Variance1.36 0.79 0.0078 1.18 0.85 0.0036 1.13 0.72 0.0017 1.12 0.96 0.00081.10 0.94 0.0006 1.17 0.78 0.0053 1.17 0.94 0.0017 1.07 0.90 0.00041.17 0.82 0.0031 1.22 0.79 0.0049 1.08 0.91 0.0008 1.07 0.98 0.00011.10 0.78 0.0023 1.23 0.63 0.012 1.07 0.75 0.0035 1.06 0.87 0.00041.06 0.90 0.0004 1.07 0.95 0.0005 1.09 0.86 0.0018 1.03 0.82 0.00041.03 0.92 0.0004 1.18 0.89 0.0022 1.13 0.84 0.0014 1.08 0.94 0.0002
The greatest variance of the misaligned co-registration in patient showed when half ofthe myocardium wall overlapped the lung on both cameras, Table 5.4. The variances of thephantom measurements were not as conclusive as those of the patient measurements. Thepolar plots arising from the misaligned co-registrations shows an isotope reduction locatedin the left lateral wall when overlapping lung and in the right lateral wall when overlappingsoft tissue, Figure 5.1.

Results 25
Table 5.4: The max, min and variance of the deviation between the misalignedco-registrations and the average of the correct co-registrations for the lungphantom and patient measurements on the CZT and Ventri camera. B: Halfof the myocardium wall overlapping the lung tissue. C: Half of the myocardiumwall overlapping the soft tissue. D: A quarter of the myocardium wall over-lapping the lung tissue.
Phantom CZT Phantom Ventri Patient CZT Patient VentriMax Min Var. Max Min Var. Max Min Var. Max Min Var.
B) 1.23 0.84 0.0064 1.22 0.73 0.0094 1.77 0.76 0.034 1.21 0.90 0.0046C) 1.18 0.66 0.0089 1.17 0.84 0.0042 1.39 0.86 0.0060 1.096 0.86 0.0034D) 1.23 0.83 0.0034 1.13 0.84 0.0030 1.43 0.86 0.010 1.14 0.75 0.002
1 2
3 4
Figure 5.1: The polar plots of the attenuation corrected lung phantom measure-ments from the CZT camera. When positioning the co-registration differ-ently the isotope reduction will appear on different place. The extent ofmisregistration will affect the extent of the isotope reduction. A: A correctco-registration B: Half of the myocardium wall overlapping the lung in theco-registration. C: Half of the myocardium wall overlapping the soft tissue inthe co-registration. D: A quarter of the myocardium wall overlapping the lungin the co-registration.
26 Results
5.3 Attenuation correction on CZT
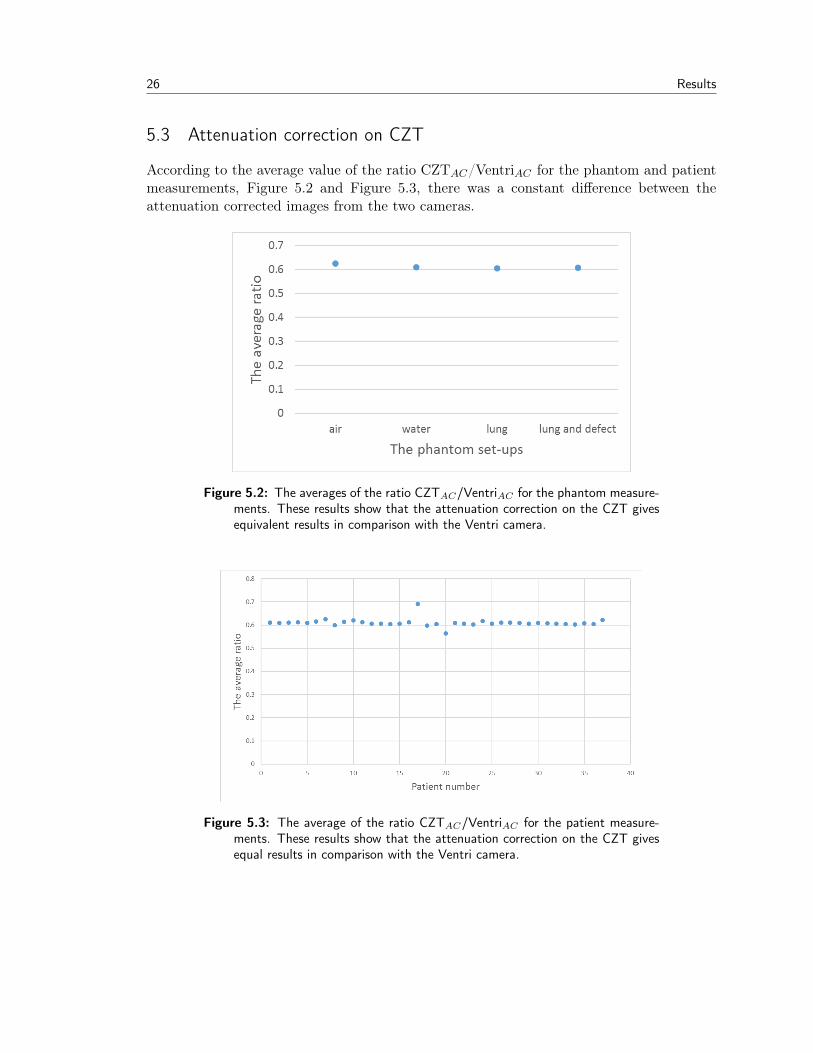
According to the average value of the ratio CZTAC/VentriAC for the phantom and patientmeasurements, Figure 5.2 and Figure 5.3, there was a constant difference between theattenuation corrected images from the two cameras.
Figure 5.2: The averages of the ratio CZTAC/VentriAC for the phantom measure-ments. These results show that the attenuation correction on the CZT givesequivalent results in comparison with the Ventri camera.
Figure 5.3: The average of the ratio CZTAC/VentriAC for the patient measure-ments. These results show that the attenuation correction on the CZT givesequal results in comparison with the Ventri camera.

Results 27
5.4 Differences in attenuation artifacts for CZT and conventional cameras
The results from the non-attenuation corrected images from the phantom measurements,show that the location of the attenuation artifact was shifted counter-clockwise from theinferolateral wall to the lateral wall for the CZT camera compared to conventional camera,Figure 5.4a and Figure 5.4b. The same shift was visible in the patient measurements, Figure5.5.
CZT Ventri SPECT/CT
NAC
AC
(a) The polar plots of the non-attenuation correctedNAC and attenuation corrected AC images.
CZT Ventri SPECT/CT
SA
HLA
VLA
AC NAC NAC NACAC AC
(b) The three projections SA, VLA and the HLA ofnon attenuation corrected NAC and attenua-tion corrected AC images.
Figure 5.4: The lung phantom set-up on the CZT, Ventri and SPECT/CT camera.The attenuation artifact was positioned differently on the different cameratechniques.

28 Results
CZT Ventri
NAC
AC
(a) The polar plots of patient number 15
CZT Ventri
NAC
AC
(b) The polar plots of patient number 21
CZT
Ventri
NAC
NAC
AC
AC
HLASA VLA
(c) The three projections SA, VLA and the HLAof patient number 15
CZT
Ventri
NAC
NAC
AC
AC
HLASA VLA
(d) The three projections SA, VLA and the HLAof patient number 21
Figure 5.5: The NAC and AC images for two patient measurements with the CZTand Ventri camera. The attenuation pattern for the patients behaves the sameway as for the phantom measurement. There is a difference in attenuation forthe different cameras
The images of the phantom with a defect in the anterior position confirms the resultsof a counter clockwise shifted attenuation artifact for the CZT camera. The defect waspositioned in the same location on the images from all three gamma cameras while theattenuation artifacts still were shifted for the CZT camera, Figure 5.6.

Results 29
CZT Ventri
A
B
SPECT/CT
Figure 5.6: The polar plot of non-attenuation corrected images for the lung phan-tom set-up in the CZT, Ventri and SPECT/CT camera. A: Without a heartdefect. B: With a heart defect.
From the NAC/AC ratio for the lung set-up phantom measurement with the defect, athreshold value of the attenuation artifacts was visually derived for each gamma camera,Table 5.5. The CZT camera has got a higher threshold, 0.90, in comparison to the Ventricamera, 0.85.
Table 5.5: The threshold values of the attenuation artifact for each gamma camera.The threshold values arising from a visual delineation of the artifact from theratio between non-attenuation corrected images and attenuation correctedimages for the lung defect phantom measurement.
CZT Ventri SPECT/CT0.90 0.85 0.86
The threshold value for each gamma camera was applied on the lung phantom mea-

30 Results
surements, delineating the attenuation area, Figure 5.7. The area corresponded to theattenuation artifact of each camera.
CZT Ventri SPECT/CT
NAC
Figure 5.7: The polar plot of non attenuation corrected images of the lung defectphantom set-up in the CZT, Ventri and SPECT/CT camera with a blackoutline of the attenuation artifact according to the threshold value.
5.4.1 Depth
The average of the relative depth for the phantom and patient measurements states that theattenuation artifact was deeper in the Ventri images 0.67 and 0.68 compared to the CZTimages 0.73 and 0.72, phantom and patient respectively, Table 5.6 and Figure 5.8. Thedepth described the imaged isotope reduction in the attenuation artifact in comparisonto the average isotope concentration in the left ventricle. There was a statistically sig-nificant difference between the artifact depth in CZT and Ventri (p<0.05) for the patientmeasurements.
Table 5.6: The relative depth of the attenuation artifact, Equation 4.1, for thephantom lung set-up and means of the patient measurements.
CZT Ventriphantom lung 0.73 0.67mean in patient 0.72 0.68

Results 31
Figure 5.8: The relative depth of the attenuation artifact, Equation 4.1, for eachpatient measurement. The attenuation artifact was statistically significantlydeeper in the Ventri camera compared to the CZT camera.
5.4.2 Size
The relative size of the attenuation artifact, that is, the percentage of the image containingthe attenuation, for the phantom measurements stated that the attenuation artifacts werelarger in the CZT images compared to the Ventri images, 28 % and 19 %, respectively.The patient measurements confirmed the results and was in average 23 % and 15 % forCZT and Ventri, respectively. There was a statistically significant difference in the patientmeasurements between the CZT and Ventri (p<0.05).
Table 5.7: The relative size of the attenuation artifact, Equation 4.2 for thephantom and patient measurements.
CZT Ventri SPECT/CTphantom lung 28 % 19 % 20 %mean patient 23 % 15 %

32 Results
Figure 5.9: The relative size of the attenuation artifact for the patient measure-ments. The difference between the CZT and Ventri cameras was staticallysignificant (p<0.05).
5.4.3 Distribution
The distribution of the attenuation artifact differed between the two cameras. The distri-bution described the localization of the attenuation artifact in the sectors. The attenuationartifacts in the CZT images were distributed over a broader range of sectors and slices com-pared to those in the Ventri images for both phantom and patient measurements, Figure5.10 and Figure 5.11. There was a statistically significant difference between the distribu-tion (p<0.05) of the attenuation artifacts between the CZT and Ventri images for both thephantom and patient measurements. There was also a statistically significant differencebetween the distribution of the CZT and SPECT/CT (p<0.05) images for the phantommeasurements, but there was not a statistically significant difference between the Ventriand the SPECT/CT (p>0.05).

Results 33
Figure 5.10: The distribution of the attenuation artifact over the sectors for thelung phantom measurements. The distribution for the Ventri and SPECT/CTwas similar (p>0.05). The CZT was distributed over a wider range of sectorsand over a wider range of the image compared to the conventional cameras(p<0.05).
Figure 5.11: The distribution of the attenuation artifact over the sectors in thepatient measurements. The difference between the cameras was statisticallysignificant (p<0.05).

34 Results
5.5 Different positioning of defects for CZT and conventional cameras
The results of the non-attenuation corrected images for the defect phantom measurementsshows there was a difference between the images from the two cameras CZT and Ventri,both when imaging the small and large defect, Figure 5.12 and Figure 5.13.
CZT
Ventri
Anterior Septal Inferior Lateral Blank
Figure 5.12: The non-attenuation corrected images of the large defect located infour different positions in the myocardium wall imaged on the two camerasCZT and Ventri and a blank measurement without the defect.
CZT
Ventri
CZT
Ventri
Anterior Septal Inferior Lateral Blank
Figure 5.13: The non-attenuation corrected images of the small defect located infour different positions in the myocardium wall imaged on the two camerasCZT and Ventri and a blank measurement without the defect.

Chapter6Discussion
The results, described in this thesis, shows that the attenuation artifact appears differentlyin the CZT camera compared to the conventional gamma cameras. The attenuation artifactwas shifted counter-clock wise from the inferolateral wall to the lateral wall for the CZTcamera. The CZT cameras attenuation artifact was also distributed over a larger part ofthe image and the artifact was not as deep as the conventional cameras attenuation artifact.
The shifted attenuation artifact was not a result of an incorrect positioning of the phan-tom. A cradle was used to ensure that the phantom was positioned in the same way forall phantom measurements and an external laser ensured a correct alignment between themeasurement of the different gamma cameras. The difference in attenuation distributionis not caused by variations in phantom positioning. The shift of the attenuation artifactwas present when the defect was located in the same position in the different cameras. Apossible reason for the shift of the attenuation artifact could be due to the difference inpositioning of the detectors for the cameras. The CZT camera has got detectors that areangled above and below the patient’s long axis in difference to the Ventri camera.
The adjustment of orientation was reproducible. The average of the variance betweenthe correct adjustment and the average of the correct adjustments was 0.0023 and 0.0005for phantom and patient, respectively. The max and min of the ratio in the off centeredorientation deviated more compared to the correct orientations.
Differences in the attenuation corrected image is not an effect of a poor co-registration.The results from the correct co-registration in both phantom and patient measurementshowed a reproducibility on the CZT and Ventri camera. The values of the max, min andvariance in the different studies were all similar. All image stacks were viewed in the co-registrations which will reduce the incidence of false positive in accordance to K.L. Gouldet al [15].
When the co-registrations were miss-registered a perfusion reduction was seen, Figure 5.1.When the co-registration overlapped the lung tissue the perfusion reduction was placed
35
36 Discussion
in the lateral wall and when the co-registration overlapped the soft tissuein the perfusionreduction was placed in septal wall. The extent of the perfusion reduction was dependenton the extent of the dislocation of the co-registration as well as the patient anatomy. Theseresults confirm the findings of J. A. Kennedy et al. that misaligned co-registrations overthe lung will cause an isotope reduction in the lateral wall [26].
The attenuation corrected images from the CZT and Ventri camera of the same objecthad to be alike. If so the NAC/AC ratio could be used to draw conclusions of the differencein attenuation artifact pattern between the two cameras. There was a constant difference inthe average of CZTAC/VentriAC ratio, for phantom and patient measurements. This con-firms the findings of J. D. van Dijk et al. and F. Caobelli et al. stating that the attenuationcorrection on the CZT camera is feasible [39] [6]. The results from this thesis showed thatfive of the 37 patient measurements deviated (the variance was more than 0.01). Whenlooked upon these patients either showed an intestinal uptake or a large chestwidth, twopreviously known sources of errors in attenuation correction [10][27].
The difference in the derived threshold values for the different gamma cameras emergedfrom the difference in resolution of the camera systems, Table 2.1. From Figure 5.7 it isclear that the threshold value chosen for each camera represents the area known as theattenuation artifact for the camera. However, the area that the threshold values define asthe attenuation artifact is larger than necessary. The threshold value derived may be toolarge.
The results from the calculation of the relative depth for the phantom measurement con-cludes that the attenuation artifact is deeper in the Ventri camera compared to the CZTcamera with deepts of 0.67 and 0.73 respectively. The mean of the patients correlates tothe phantom result 0.68 and 0.72 for the Ventri and CZT, respectively. The difference inattenuation depth between the cameras was statistically significant for the patient measure-ments. The results support the findings of C. J. Liu et al that there is less isotope reductionin the attenuation artifact for the CZT camera compared to the conventional cameras [27].The difference in depth for the two cameras could be because of the difference in resolutionof the cameras which will affect the spill in and spill out effect or because the images fromthe Ventri camera is post filtered too hard. It could also be a combination of the resolutionand post filter.
From the definition of the relative depth the denominator is the average of the countsin the top 30 % from the segmentation. The percentage chosen to represent the normaluptake was derived from the defect lung phantom measurement. The segments includedin the percentage were a number of segments that included a coherent area that was notlocated next to the position of the defect.

Discussion 37
The size of the attenuation artifact was larger for the CZT camera compared to the con-ventional cameras for the phantom measurement, 28 %, 19 % and 20 % for CZT, Ventriand SPECT/CT, respectively. The corresponding patient results concluded the same; theattenuation artifact was larger for the CZT camera 23 % compared to the Ventri 15 %, thedifference was statistically significant.
The distribution of the attenuation artifact was wider on the CZT compared to the Ventriand SPECT/CT for the phantom measurements, with a statistically significant difference.It was not possible to statistically differentiate the distribution of the attenuation artifactfor the Ventri from the SPECT/CT. The mean of the patient measurements showed a sta-tistical significant difference in the distribution of the attenuation artifact for phantom andpatient measurements. The artifact of the CZT was distributed over a wider range of slicesand sectors compared to the Ventri attenuation artifact. The difference in the distributioncould be because of the difference in system resolution for the gamma camera systems.
Due to the difference in resolution between the two gamma cameras CZT and Ventri thereis a difference in how the cameras image the same defect, Figure 5.12 and Figure 5.13. Theposition of the defect does not affect the image of the defect for the large defect. It is hardto draw conclusions of the images of the small defect since the defect is on the boarder ofbeing detectable.
To illustrate the cardiac risks and prognosis in MPS images quantitative perfusion scoresis derived. The polar plot of the left ventricle is normed to a normal database, to reduceattenuation artifacts, and the myocardium is divided into a 17 segment model were eachsegment is scored according to the tracer uptake in the segment. The normal database ishowever, based on MPS images from conventional gamma cameras. Since the attenuationpattern differs between the CZT camera and the conventional camera the quantitative per-fusion scores will not be accurate on CZT images.
The best alternative would be performing attenuation correction on all images, since theattenuation correction at the different gamma cameras gives equal results. To perform anattenuation correction in the clinic the gamma camera has to be equipped with a CT. Usingan externally acquired CT is both resource demanding on the other equipment as well asthe extra labour performing the reconstruction. There is also an uncertainty in positioning.However, few CZT cameras in the world are equipped with a CT. It is therefore necessaryto be aware of the differences in the attenuation pattern of the images produced from thedifferent gamma cameras, so that perfusion reductions are not missed or overestimated.

Chapter7Conclusion
When comparing the two MPS cameras, CZT and Ventri, a difference in the attenuationpattern could be seen. The images showed that the attenuation artifact was shifted counter-clock wise from the inferolateral wall to the lateral wall for the CZT camera compared tothe conventional cameras. This was not an effect of mispositioning, orientation or misalign-ment in the co-registration. But was possible an effect of the difference in system resolutionand the difference in the positioning of the detectors. The CZT camera views the heartperpendicular as well as with an angle above and below the patient’s long axis, in differenceto the conventional cameras only viewing the heart perpendicular to the patient’s long axis.
The attenuation did not appear in the same way for the different gamma cameras nei-ther in phantom or patient measurements. The relative depth, size and distribution diddiffer between the cameras. The attenuation artifact of the CZT camera was spread overa larger area, including a large number of sectors and slices. The attenuation artifact ofthe Ventri camera was located in a smaller part of the image and did not include as manysectors or slices, but it was deeper than the CZT cameras. The differences in appearance ofthe attenuation pattern arises from the difference in the detection technique of the cameras.
It is of importance that the physicians viewing the MPS images are aware of differencesin the images produced by the different cameras. If not considering these results whenevaluating MPS images perfusion reductions could be missed or overestimated.
38

Chapter8Future Work
Future work should do more measurements on different sizes of the heart defect in order toget a more rigid threshold value. This is of importance since all conclusions of the attenua-tion pattern behavior in this thesis is based on the threshold values derived from the defectphantom measurement. The derived threshold value should be projected on the images ofthe left ventricle at an early stage so that the derived threshold value corresponds with thelocation of the attenuation artifact.
The defect measurements in Figure 5.6, Figure 5.12 and Figure 5.13 showed that the defectwas imaged differently in the different gamma cameras. In future work defect measurementswith different locations of the defect in phantom and patient should be investigated to seeif the positioning of the defect affects the image. To perform this investigation a largerpatient material is required.
39

Acknowledgements
First of all I would like to express my greatest gratitude to my supervisors Jenny Oddstigand Cecilia Hindorf. The guidance you both have given me during this semester has beeninvaluable.
Thanks to all co-workers at the department of clinical physiology and nuclear medicineat the Skåne University Hospital in Lund for always making me feel welcome.
Special thanks to Christel Kullberg, Shanaz Akil and Berit Olsson, biomedical technicians,for your technical expertise and to Mikael Petersson for helping me with the phantommeasurements.
Elin Martinsson
40

References
[1] National Electrical Manufacturers Association. Performance measurement of GammaCameras. NEMA standards Publication NU 1-2007, 2007.
[2] F. Beekman and F. van der Have. The pinhole: gateway to ultra-high-resolution three-dimensional radionuclide imaging. Eur. J. Nucl. Med. Mol. Imaging, 34(2):151–161,Feb 2007.
[3] G. A. Beller. First annual Mario S. Verani, MD, Memorial lecture: clinical value ofmyocardial perfusion imaging in coronary artery disease. J Nucl Cardiol, 10(5):529–542, 2003.
[4] J.G. Betts, P. Desaix, J.E. Johnson, O. Korol, D. Kruse, B. Poe, J. Wise, M.D. Womble,K.A. Young, OpenStax College, et al. Anatomy and Physiology. ISBN 1-938168-13-5:787–846, 2013.
[5] M. Bocher, I. M. Blevis, L. Tsukerman, Y. Shrem, G. Kovalski, and L. Volokh. A fastcardiac gamma camera with dynamic SPECT capabilities: design, system validationand future potential. Eur. J. Nucl. Med. Mol. Imaging, 37(10):1887–1902, Oct 2010.
[6] F. Caobelli, M. Akin, J. T. Thackeray, T. Brunkhorst, J. Widder, G. Berding,I. Burchert, J. Bauersachs, and F. M. Bengel. Diagnostic accuracy of cadmium-zinc-telluride-based myocardial perfusion SPECT: impact of attenuation correction usinga co-registered external computed tomography. Eur Heart J Cardiovasc Imaging, Nov2015.
[7] Marcus Carlsson. Myokardscintigrafi. Inhouse compendium, Klinisk fysiologi och Nuk-learmedicin BFC Skånes Universitetssjukhus, Lund, 2012.
[8] M. Fiechter, C. Gebhard, T. A. Fuchs, J. R. Ghadri, J. Stehli, E. Kazakauskaite,B. A. Herzog, A. P. Pazhenkottil, O. Gaemperli, and P. A. Kaufmann. Cadmium-zinc-telluride myocardial perfusion imaging in obese patients. J. Nucl. Med., 53(9):1401–1406, Sep 2012.
41

42 References
[9] E. Fricke, H. Fricke, R. Weise, A. Kammeier, R. Hagedorn, N. Lotz, O. Lindner,D. Tschoepe, and W. Burchert. Attenuation correction of myocardial SPECT perfusionimages with low-dose CT: evaluation of the method by comparison with perfusion PET.J. Nucl. Med., 46(5):736–744, May 2005.
[10] E. V. Garcia. SPECT attenuation correction: an essential tool to realize nuclearcardiology’s manifest destiny. J Nucl Cardiol, 14(1):16–24, Jan 2007.
[11] E. V. Garcia, T. L. Faber, and F. P. Esteves. Cardiac dedicated ultrafast SPECTcameras: new designs and clinical implications. J. Nucl. Med., 52(2):210–217, Feb2011.
[12] S. Goetze, T. L. Brown, W. C. Lavely, Z. Zhang, and F. M. Bengel. Attenuationcorrection in myocardial perfusion SPECT/CT: effects of misregistration and value ofreregistration. J. Nucl. Med., 48(7):1090–1095, Jul 2007.
[13] S. Goetze and R. L. Wahl. Prevalence of misregistration between SPECT and CT forattenuation-corrected myocardial perfusion SPECT. J Nucl Cardiol, 14(2):200–206,Apr 2007.
[14] K. L. Gould, T. Pan, C. Loghin, N. P. Johnson, A. Guha, and S. Sdringola. Frequentdiagnostic errors in cardiac PET/CT due to misregistration of CT attenuation andemission PET images: a definitive analysis of causes, consequences, and corrections.J. Nucl. Med., 48(7):1112–1121, Jul 2007.
[15] K. L. Gould, T. Pan, C. Loghin, N. P. Johnson, A. Guha, and S. Sdringola. Frequentdiagnostic errors in cardiac PET/CT due to misregistration of CT attenuation andemission PET images: a definitive analysis of causes, consequences, and corrections.J. Nucl. Med., 48(7):1112–1121, Jul 2007.
[16] GE Healthcare. Ventri. Data sheet Direction 2405533-100, 2006.
[17] GE Healthcare. Discovery NM/CT 670. Data sheet DOC659203, 2009.
[18] G. V. Heller, J. Links, T. M. Bateman, J. A. Ziffer, E. Ficaro, M. C. Cohen, and R. C.Hendel. American Society of Nuclear Cardiology and Society of Nuclear Medicine jointposition statement: attenuation correction of myocardial perfusion SPECT scintigra-phy. J Nucl Cardiol, 11(2):229–230, 2004.
[19] B. A. Herzog, R. R. Buechel, L. Husmann, A. P. Pazhenkottil, I. A. Burger, M. Wol-frum, R. N. Nkoulou, I. Valenta, J. R. Ghadri, V. Treyer, and P. A. Kaufmann. Vali-dation of CT attenuation correction for high-speed myocardial perfusion imaging usinga novel cadmium-zinc-telluride detector technique. J. Nucl. Med., 51(10):1539–1544,Oct 2010.

References 43
[20] B. Higley, F. W. Smith, T. Smith, H. G. Gemmell, P. Das Gupta, D. V. Gvozdanovic,D. Graham, D. Hinge, J. Davidson, and A. Lahiri. Technetium-99m-1,2-bis[bis(2-ethoxyethyl) phosphino]ethane: human biodistribution, dosimetry and safety of a newmyocardial perfusion imaging agent. J. Nucl. Med., 34(1):30–38, Jan 1993.
[21] C. Hindorf, J. Oddstig, F. Hedeer, M. J. Hansson, J. Jogi, and H. Engblom. Impor-tance of correct patient positioning in myocardial perfusion SPECT when using a CZTcamera. J Nucl Cardiol, 21(4):695–702, Aug 2014.
[22] Image. Left Ventricle. Amazon, http : //s3.amazonaws.com/rapgenius/left_ventricle1352134655991.jpg.
[23] Image. Ventri. GE Healthcare, http : //www3.gehealthcare.com/en/products/categories/nuclear_medicine/cardiac_imaging/ventri.
[24] Image. Discovery NM 670. GE Healthcare, http ://www3.gehealthcare.com/en/products/categories/nuclear_medicine/spect_and_spect−ct/discovery_nm− ct_670.
[25] Image. Discovery NM 530c. Med Gadget, http ://www.medgadget.com/2009/03/ge_unveils_five_minute_nuclear_cardiac_scanner.html.
[26] J. A. Kennedy, O. Israel, and A. Frenkel. Directions and magnitudes of misregistrationof CT attenuation-corrected myocardial perfusion studies: incidence, impact on imagequality, and guidance for reregistration. J. Nucl. Med., 50(9):1471–1478, Sep 2009.
[27] C. J. Liu, J. S. Cheng, Y. C. Chen, Y. H. Huang, and R. F. Yen. A performancecomparison of novel cadmium-zinc-telluride camera and conventional SPECT/CT us-ing anthropomorphic torso phantom and water bags to simulate soft tissue and breastattenuation. Ann Nucl Med, 29(4):342–350, May 2015.
[28] D. Malkerneker, R. Brenner, W. H. Martin, U. K. Sampson, I. D. Feurer, M. W.Kronenberg, and D. Delbeke. CT-based attenuation correction versus prone imagingto decrease equivocal interpretations of rest/stress Tc-99m tetrofosmin SPECT MPI.J Nucl Cardiol, 14(3):314–323, 2007.
[29] C. Marcassa, J. J. Bax, F. Bengel, B. Hesse, C. L. Petersen, E. Reyes, and R. Under-wood. Clinical value, cost-effectiveness, and safety of myocardial perfusion scintigra-phy: a position statement. Eur. Heart J., 29(4):557–563, Feb 2008.
[30] Y. Masood, Y. H. Liu, G. Depuey, R. Taillefer, L. I. Araujo, S. Allen, D. Delbeke,F. Anstett, A. Peretz, M. J. Zito, V. Tsatkin, and F. J. Wackers. Clinical validationof SPECT attenuation correction using x-ray computed tomography-derived attenu-ation maps: multicenter clinical trial with angiographic correlation. J Nucl Cardiol,12(6):676–686, 2005.

44 References
[31] I. Matsunari, G. Boning, S. I. Ziegler, S. G. Nekolla, J. C. Stollfuss, I. Kosa, E. P.Ficaro, and M. Schwaiger. Attenuation-corrected 99mTc-tetrofosmin single-photonemission computed tomography in the detection of viable myocardium: comparisonwith positron emission tomography using 18F-fluorodeoxyglucose. J. Am. Coll. Car-diol., 32(4):927–935, Oct 1998.
[32] Strål Säkerhets Myndigheten. Doskatalog. http ://apps.stralsakerhetsmyndigheten.se/lpadoskatalog/submitsubstans.asp?substans =61.
[33] J. Oddstig, F. Hedeer, J. Jogi, M. Carlsson, C. Hindorf, and H. Engblom. Reducedadministered activity, reduced acquisition time, and preserved image quality for thenew CZT camera. J Nucl Cardiol, 20(1):38–44, Feb 2013.
[34] National Institute of Standards and Technology. Physical Measurement LaboratoryXCOM. http : //www.nist.gov/pml/data/xcom/, September 17, 2009.
[35] PH Pretorius, C Liu, Fang, M P, Peterson, and M Ljungberg. Monte Carlo Simulationsof the GE Discovery Alcyone CZT SPECT Systems . Trans.Nucl.Science, 62(3):832–839, 2015.
[36] M. Rajaram, A. K. Tahari, A. H. Lee, M. A. Lodge, B. Tsui, S. Nekolla, R. L. Wahl,F. M. Bengel, and P. E. Bravo. Cardiac PET/CT misregistration causes significantchanges in estimated myocardial blood flow. J. Nucl. Med., 54(1):50–54, Jan 2013.
[37] H. Soneson, H. Engblom, E. Hedstrom, F. Bouvier, P. Sorensson, J. Pernow, H. Arhe-den, and E. Heiberg. An automatic method for quantification of myocardium at riskfrom myocardial perfusion SPECT in patients with acute coronary occlusion. J NuclCardiol, 17(5):831–840, Oct 2010.
[38] S. R. Underwood, L. J. Shaw, C. Anagnostopoulos, M. Cerqueira, P. J. Ell, J. Flint,M. Harbinson, A. Kelion, A. Al Mohammad, and E. M. Prvulovich. Myocardial perfu-sion scintigraphy and cost effectiveness of diagnosis and management of coronary heartdisease. Heart, 90 Suppl 5:v34–36, Aug 2004.
[39] J. D. van Dijk, M. Mouden, J. P. Ottervanger, J. A. van Dalen, S. Knollema, C. H.Slump, and P. L. Jager. Value of attenuation correction in stress-only myocardialperfusion imaging using CZT-SPECT. J Nucl Cardiol, Jan 2016.
[40] H. J. Verberne, W. Acampa, C. Anagnostopoulos, J. Ballinger, F. Bengel, P. De Bondt,R. R. Buechel, A. Cuocolo, B. L. van Eck-Smit, A. Flotats, M. Hacker, C. Hindorf,P. A. Kaufmann, O. Lindner, M. Ljungberg, M. Lonsdale, A. Manrique, D. Minarik,A. J. Scholte, R. H. Slart, E. Tragardh, T. C. de Wit, and B. Hesse. EANM pro-cedural guidelines for radionuclide myocardial perfusion imaging with SPECT and

References 45
SPECT/CT: 2015 revision. Eur. J. Nucl. Med. Mol. Imaging, 42(12):1929–1940, Nov2015.
Copyright © 2022 FDOKUMEN