Acoustic Emission in Alarm Applications - Lund University Publications
74
Acoustic Emission in Alarm Applications Niclas Olsson and Niklas Isaksson Supervisors: Monica Almqvist, Electrical Measurements Lars Halling, Securitas Direct Examiner: Hans W. Persson, Electrical Measurements Department of Measurement Technology and Industrial Electrical Engineering Electrical Measurements, LTH Lund University
-
Upload
khangminh22 -
Category
Documents
-
view
4 -
download
0
Transcript of Acoustic Emission in Alarm Applications - Lund University Publications

Acoustic Emission in Alarm Applications
Niclas Olsson and Niklas Isaksson
Supervisors:Monica Almqvist, Electrical Measurements
Lars Halling, Securitas Direct
Examiner:Hans W. Persson, Electrical Measurements
Department of Measurement Technology and Industrial Electrical Engineering
Electrical Measurements, LTH
Lund University

Abstract
This thesis, issued by Securitas Direct, investigates the possibil-ity of using acoustic emission as a basis for an intrusion alarmapplication. Piezoelectric elements were used to detect and char-acterise fractures in glass, metal and wooden materials. As acomparative study, the functionality and possibilities of usingan existing glass break detector, GlassAlertTM, on wooden ma-terials were investigated. The work was performed on selectedspecimens of wood and glass in a laboratory environment. Theresults conclude that, possibly with some software modifications,GlassAlertTMcould be used as a reliable glass break detector buteven with hardware changes it could prove difficult detectingfractures in wood. It is on the other hand most possible to usethe piezoelectric element on different materials by implementingdifferent software in the detector structure. However, the workwith piezoelectric element should be further examined beforeconcluding that it can really be a product suited for the market.

Preface
A traditional intrusion alarm system usually involves magneticcontact and triggers an alarm when a door or window frame isopened, severing the magnetic connection. This method oftengives an intruder much time before security arrives.
Recently, specific transducers to detect glass break has gainedsome popularity, but by using the principle of a microphone andanalysing sound in its environment, they are associated withproblems concerning falsely triggered alarms. As a result, Se-curitas Direct, Europe’s leading supplier of security systems forbusinesses and home owners [1], wishes to examine a differentapproach involving acoustic emission.
During crack formation in materials, energy is released in theform of a mechanical wave. By detecting and analysing thesesignals it is desired to be able to trigger an alarm at the firstsign of breakage.
1

Contents
1 Introduction 7
2 Theory 102.1 Acoustics . . . . . . . . . . . . . . . . . . . . . . 10
2.1.1 Mechanical Waves . . . . . . . . . . . . . . 102.1.2 Reflection and Attenuation . . . . . . . . . 10
2.2 Piezoelectric Effect . . . . . . . . . . . . . . . . . 132.2.1 Ceramic Elements . . . . . . . . . . . . . . 132.2.2 Plastic Films . . . . . . . . . . . . . . . . 15
2.3 Sensor from Covial Device . . . . . . . . . . . . . 162.4 Acoustic Emission . . . . . . . . . . . . . . . . . . 17
2.4.1 Background . . . . . . . . . . . . . . . . . 182.4.2 Applications . . . . . . . . . . . . . . . . . 182.4.3 Typical AE Measurement . . . . . . . . . 20
3 Methods 213.1 Measurements and Measuring Set-up . . . . . . . 23
3.1.1 Wood . . . . . . . . . . . . . . . . . . . . 233.1.2 Glass . . . . . . . . . . . . . . . . . . . . . 233.1.3 GlassAlertTM . . . . . . . . . . . . . . . . 243.1.4 Metal . . . . . . . . . . . . . . . . . . . . 253.1.5 Noise . . . . . . . . . . . . . . . . . . . . . 26
3.2 Signal Processing . . . . . . . . . . . . . . . . . . 26
2
4 Results 284.1 Acquired Signals . . . . . . . . . . . . . . . . . . 28
4.1.1 Wood . . . . . . . . . . . . . . . . . . . . 284.1.2 Glass with GlassAlertTM . . . . . . . . . . 294.1.3 Glass with Piezoelectric Element . . . . . 294.1.4 Metal . . . . . . . . . . . . . . . . . . . . 304.1.5 Noise . . . . . . . . . . . . . . . . . . . . . 30
4.2 Detector Structure . . . . . . . . . . . . . . . . . 314.2.1 Wood Detector . . . . . . . . . . . . . . . 324.2.2 Glass Detector . . . . . . . . . . . . . . . 33
5 Discussion 355.1 Data Acquisition . . . . . . . . . . . . . . . . . . 355.2 Piezoelectric Element . . . . . . . . . . . . . . . . 365.3 GlassAlertTM . . . . . . . . . . . . . . . . . . . . 375.4 GlassAlertTMon Wood . . . . . . . . . . . . . . . 375.5 Glass . . . . . . . . . . . . . . . . . . . . . . . . . 385.6 Metal . . . . . . . . . . . . . . . . . . . . . . . . 38
6 Conclusions and Future Work 39
Bibliography 44
A Acquired Signals 48A.1 Oak . . . . . . . . . . . . . . . . . . . . . . . . . 49A.2 Pine . . . . . . . . . . . . . . . . . . . . . . . . . 54A.3 Glass . . . . . . . . . . . . . . . . . . . . . . . . . 59
A.3.1 Piezoelectric Element . . . . . . . . . . . . 59A.3.2 GlassAlertTM . . . . . . . . . . . . . . . . 63
A.4 Metal . . . . . . . . . . . . . . . . . . . . . . . . 67
B Flow Charts 70
3

List of Figures
2.1 An illustration of a longitudinal- and a shear-wave 112.2 Propagation directions in wood . . . . . . . . . . 122.3 The direct piezoelectric effect . . . . . . . . . . . 142.4 Polarisation process . . . . . . . . . . . . . . . . . 152.5 The GlassAlertTM . . . . . . . . . . . . . . . . . . 172.6 Application of AE in a train bridge monitoring
system . . . . . . . . . . . . . . . . . . . . . . . . 192.7 A typical AE measurement set-up . . . . . . . . . 20
3.1 Mounting of the sensor elements . . . . . . . . . . 223.2 Wood measurement illustrations . . . . . . . . . . 233.3 Glass measurement illustrations . . . . . . . . . . 243.4 The frequency response from the GlassAlertTM . . 253.5 Metal measurement illustrations . . . . . . . . . . 25
6.1 Current piezoelectric element mounting . . . . . . 416.2 Wrap-around piezoelectric element . . . . . . . . 41
A.1 Hand-knock Time Signal . . . . . . . . . . . . . . 49A.2 Hand-knock Power Spectrum . . . . . . . . . . . 49A.3 Tool-knock Time Signal . . . . . . . . . . . . . . 50A.4 Tool-knock Power Spectrum . . . . . . . . . . . . 50A.5 Keydrop Time Signal . . . . . . . . . . . . . . . . 50A.6 Keydrop Power Spectrum . . . . . . . . . . . . . 51A.7 Coin Snap Time Signal . . . . . . . . . . . . . . . 51A.8 Coin Snap Power Spectrum . . . . . . . . . . . . 51
4

A.9 Hammer Strike Time Signal . . . . . . . . . . . . 52A.10 Hammer Strike Power Spectrum . . . . . . . . . . 52A.11 Break Time Signal . . . . . . . . . . . . . . . . . 52A.12 Break Power Spectrum . . . . . . . . . . . . . . . 53A.13 Saw Time Signal . . . . . . . . . . . . . . . . . . 53A.14 Saw Power Spectrum . . . . . . . . . . . . . . . . 53A.15 Hand-knock Time Signal . . . . . . . . . . . . . . 54A.16 Hand-knock Power Spectrum . . . . . . . . . . . 54A.17 Tool-knock Time Signal . . . . . . . . . . . . . . 55A.18 Tool-knock Power Spectrum . . . . . . . . . . . . 55A.19 Keydrop Time Signal . . . . . . . . . . . . . . . . 55A.20 Keydrop Power Spectrum . . . . . . . . . . . . . 56A.21 Coin Snap Time Signal . . . . . . . . . . . . . . . 56A.22 Coin Snap Power Spectrum . . . . . . . . . . . . 56A.23 Hammer Strike Time Signal . . . . . . . . . . . . 57A.24 Hammer Strike Power Spectrum . . . . . . . . . . 57A.25 Break Time Signal . . . . . . . . . . . . . . . . . 57A.26 Break Power Spectrum . . . . . . . . . . . . . . . 58A.27 Saw Time Signal . . . . . . . . . . . . . . . . . . 58A.28 Saw Power Spectrum . . . . . . . . . . . . . . . . 58A.29 Tool-knock Time Signal . . . . . . . . . . . . . . 59A.30 Tool-knock Power Spectrum . . . . . . . . . . . . 59A.31 Keydrop Time Signal . . . . . . . . . . . . . . . . 60A.32 Keydrop Power Spectrum . . . . . . . . . . . . . 60A.33 Coin Snap Time Signal . . . . . . . . . . . . . . . 60A.34 Coin Snap Power Spectrum . . . . . . . . . . . . 61A.35 Glass Cutting Time Signal . . . . . . . . . . . . . 61A.36 Glass Cutting Power Spectrum . . . . . . . . . . 61A.37 Glass Breaking Time Signal . . . . . . . . . . . . 62A.38 Glass Breaking Power Spectrum . . . . . . . . . . 62A.39 Tool-knock Time Signal . . . . . . . . . . . . . . 63A.40 Tool-knock Power Spectrum . . . . . . . . . . . . 63A.41 Keydrop Time Signal . . . . . . . . . . . . . . . . 64
5

A.42 Keydrop Power Spectrum . . . . . . . . . . . . . 64A.43 Coin Snap Time Signal . . . . . . . . . . . . . . . 64A.44 Coin Snap Power Spectrum . . . . . . . . . . . . 65A.45 Glass Cutting Time Signal . . . . . . . . . . . . . 65A.46 Glass Cutting Power Spectrum . . . . . . . . . . 65A.47 Glass Breaking Time Signal . . . . . . . . . . . . 66A.48 Glass Breaking Power Spectrum . . . . . . . . . . 66A.49 Keydrop Time Signal . . . . . . . . . . . . . . . . 67A.50 Keydrop Power Spectrum . . . . . . . . . . . . . 67A.51 Hammer Strike Time Signal . . . . . . . . . . . . 68A.52 Hammer Strike Power Spectrum . . . . . . . . . . 68A.53 Coin Snap Time Signal . . . . . . . . . . . . . . . 68A.54 Coin Snap Power Spectrum . . . . . . . . . . . . 69A.55 Angle Grinder Time Signal . . . . . . . . . . . . . 69A.56 Angle Grinder Power Spectrum . . . . . . . . . . 69
B.1 Flow chart of the wood detector . . . . . . . . . . 71B.2 Flow chart of the glass detector . . . . . . . . . . 72
6

Chapter 1
Introduction
This report is a result of the master thesis issued by SecuritasDirect Sverige AB and performed during the summer and au-tumn of 2011. The report should make a good start for futurework on this subject, and may hopefully act as the base for alater actual product.
The original aim of this thesis was to determine if an exist-ing sensor designed for glass break detection could be mountedon door or window frames and used to detect fractures in woodand/or metal. However, this proved difficult due to the low out-put of the sensing element and high dampening effect of woodenmaterials compared to glass. Thus, the piezoelectric elementswere added as a complementary study, and the focus of the the-sis was somewhat changed.
The existing sensor in mind was the GlassAlertTMfrom a com-pany called Covial Device, and was developed during a coupleof years until certification by SP Technical Research Instituteof Sweden in 2007 [2]. This sensor uses a different construc-tion than similar products on the market, and claims it havesome benefits over the existing techniques. However it uses thesame phenomenon as several other techniques, namely AcousticEmission (AE). AE is the emergence of mechanical elastic wavesdue to fast, high energy deformation in a material, e.g. micro
7

cracks tied up with fractures. AE is also used in this thesis,where a wood and glass fracture detector was created using apiezoelectric ceramic element.
There are quite a few studies that have already been done inthe domain of acoustic emission. However, most of these do nothave the pretension to be able to distinguish acoustic emissionfrom acoustic noise in such an extent as in this application. Forexample, it is highly unwanted to trigger an alarm on non de-structive signals while the alarm is turned on, e.g. if there wouldbe someone knocking on the door, small objects that by mistakehits the door, keys jingling by the lock and similar. Thereforethis application is a more complex issue, and the standard waysof measuring AE could not always be applied.
However, if the interested reader would like to dig deeper onAE applications some work that has a connection to this fieldis presented. Starting out with quite large scale applications inbridges, most studies consider only the number of AE events,e.g. [3], [4]. There are also some studies done in small scalemonitoring systems, e.g. in the application of termite infestationdetection, where a different approach is used and a ratio for theresponse between two frequency intervals is calculated [5].
The work started out with the use of a piezoelectric ceramicas a sensor element, and the secondary goal, to construct an al-gorithm for determination and separation of fracture signals gotmore prioritised. The sensor from Covial Device was examinedlater in the project.
The report consists of several parts, where the first chapterafter this introduction is a gathering of the theory behind thework, and is supposed to give the reader an introduction to thesubjects discussed in the thesis, and how the method works inreal applications. The following chapter discusses the methodsused in this thesis and also what is measured and the equip-ment used. It also describes the algorithms used to determine
8

whether to classify a signal as an alarm signal or not. Afterthese describing chapters, the report will focus on the results,the acquired signals and how they are processed and why. Thediscussion chapter will cover problems during this thesis andcompare the GlassAlertTMwith use of a piezoelectric sensing el-ement. The last chapter will conclude the thesis work, and alsoaddress things that could be done in future work and if some-thing could be done differently.
9
Chapter 2
Theory
2.1 Acoustics
2.1.1 Mechanical Waves
When a force is applied to a material the atoms can be forced tovibrate around their equilibrium. Because atoms in a solid areelastically bound to one another this may affect neighbouringatoms and in turn create a mechanical wave. These mechanicalwaves can propagate through the medium in the form of a varietyof waves where some of the most commonly discussed wavesare called longitudinal- and shear-waves. As the name suggestslongitudinal waves oscillates in the longitudinal direction andthese oscillations are parallel to the propagation direction of thewave. The particles in a shear wave on the other hand oscillateperpendicular to the wave propagation. The movement of thewaves is illustrated in Fig. 2.1.
2.1.2 Reflection and Attenuation
The acoustic impedance of a medium affects how the mechanicalwave propagates through the object and can best be described asthe opposition to passage of sound waves, being the product of thedensity of a substance and the velocity of sound in it [6]. When
10

Figure 2.1: An illustration of a longitudinal- and a shear-wave [7]
a mechanical wave propagates through a medium, solid or liquid,and encounters a boundary to another medium with a mismatchin acoustic impedance, part of the energy will be reflected andsome transmitted. This is something to consider when choosingcoupling agent between the transducer and sample when study-ing AE. Irregularities in materials have a scattering effect on atravelling wave, where some of the energy is refracted, whichcauses a change in direction. This together with the dampeningeffect, energy losses associated with e.g. heat development, isdescribed as the attenuation of the material. The attenuationcan be expressed in relation to its attenuation coefficient and in-creases with frequency, meaning that higher frequencies will bemore efficiently attenuated [8]. Due to the large amount of ir-regularities found in wood, for example knots and growth rings,the attenuation is greater in a wooden material than e.g. glassor metal and attenuation between 30 dB/m up to 200 dB/m [9]can be recorded. This results in difficulties measuring AE on
11

large distances and the transducer should always, if possible, bekept close to the source of activity.
Growth rings in wood are formed by the uneven growth ratetrees undergo during the seasons. During spring and early sum-mer the growth rate increases, forming light coloured materialwith lower density [8] and thus lower acoustic impedance com-pared to the dark coloured, denser cell types, formed during theslower growth season in the late summer and fall. The wave ve-locity parallel to the grain, L direction in Fig. 2.2, can vary from4000 to 6000 m/s and up to 50% [9] lower when travelling per-pendicular to the grain formations. Because the wave velocityis connected with the acoustic impedance and consequently itsattenuation the dampening effect varies depending on propaga-tion direction. Most affected are the longitudinal waves, whichexperience the highest attenuation perpendicular to the grainwhile no significant change can be seen for the transverse waves[8].
Figure 2.2: Propagation directions in wood [9]
Glass and metal have a more organised structure and a loweramount of irregularities, meaning less scattering, and a higherdensity, which results in a lower attenuation. This leads to alarger response in the higher frequency regions than e.g. wood.
12

2.2 Piezoelectric Effect
The piezoelectric effect can be used for many purposes. Some ofthem are implementations of measurement devices for pressure,acceleration, strain and acoustic emission, where the last men-tioned is the application that is the subject of this thesis. Themain advantage of using piezoelectric elements for measuring isthat they have, depending on which dimensions the elementsare, a very broad linear bandwidth, usually stretching from DCto several GHz [10].
As a very brief introduction to the piezoelectric effect, it canbe said that a mechanical force that deforms a piezoelectric ele-ment gives rise to a proportional change in the charge over theelement. This is called the direct piezoelectric effect. There isalso a converse piezoelectric effect, which means that placing anelectrical field over the element makes the element deform pro-portional to the difference in electric potential. See Fig. 2.3 foran illustration of these effects. By using the direct effect it ispossible to translate a mechanical motion, such as a sound wave,into a voltage that can be detected, compared and processed byusing an oscilloscope, DAC-card (data acquisition card) or mi-cro controller. First to come is a section about the theory of thepiezoelectric materials.
2.2.1 Ceramic Elements
There are many materials that are expressing piezoelectric char-acteristics. However, not many of these materials have the suffi-cient level of piezoelectricity for practical use in technical appli-cations. The materials that show the most piezoelectric effectare crystals and certain ceramics. The material most often used,which is also used in the ceramic element during this thesis, is acompound named PZT, lead zirconate titanate. This compound
13

Figure 2.3: A deformation of the element gives rise to a voltage.
was developed in the 1950’s and has been used widely since [11].The main idea behind piezoelectricity is, as stated earlier,
that when a force is applied to the surface of the piezoelectricmaterial, a change in charge level rises across the material.
In order to make a piezoelectric ceramic element one wouldof course need a suitable material, for example a PZT material.Initially, the ceramic doesn’t have any overall polarisation, thedipoles are randomly organised in the material with no remark-able structure. A strong direct current electric field is appliedover the material, called the polarisation, which will cause thedipoles to be arranged in a certain pattern with positive endsfacing one direction and negative ends facing the opposite direc-tion. When the electric field is removed, the dipoles remain inbasically the same position as during the polarisation, and thatpolarisation becomes permanent. This process is illustrated inFig. 2.4
When a force, i.e. compression or tension, is applied alongthe same axis as the polarisation, the dipole moment changesand thus creates a measurable voltage [12].
Piezoelectric ceramics are available in many different shapes
14

Figure 2.4: Polarisation process. [12]
and configurations. The ceramic usually has one or more reso-nance frequencies, depending on the dimensions. This can be adrawback since the frequency response can differ between typesof ceramic elements and as a result of this the relative frequencyresponse should be treated with respect to the elements reso-nance frequency. However, if the intention is comparing signalsin a particular frequency region with just one sensor, as in thisthesis, this effect does not have any significance.
2.2.2 Plastic Films
Plastic films have been studied since the late 1960’s [13], butare not as widely used as piezoelectric ceramics. This was dueto the slow development of plastic materials, but in the lasttwenty years it has been advancing on the market. Though it isfunctioning the same way as a ceramic piezoelectric element, ithas several benefits over the more traditional alternative. One ofthese is lower acoustic impedance; it is in fact close to the acous-tic impedance of water and organic tissues [14]. This means thatsignals are more easily transferred when measuring on soft ma-terials like mentioned above, in water and human tissue. Other
15

benefits compared to ceramics are e.g. higher output voltage forthe same force, more durable to strong electric fields and hav-ing a linear response in broad areas, stretching from near DCto ca. 2 GHz [15]. There is although a few drawbacks, whichsometimes makes the ceramic a better candidate, including butnot limited to a poor performance as a transmitter, especiallyin lower frequencies, and it can also be more sensitive to elec-tromagnetic radiation i.e. noise [14].
2.3 Sensor from Covial Device
The glass break detector GlassAlertTM, shown in Fig. 2.5, waspart of the reason why this master thesis started. The sensor isa compact and neat product, suited for stand-alone use or witha central unit, also provided by Covial Device, which handlealarms and can monitor several GlassAlertTM’s simultaneously.The sensor is to be glued directly on the glass. It operateson the principle of acoustic emission, although with a differentapproach using a non-standard technique with an amorphousthin metal film reacting to a mechanical stress by creating amagnetic field. An amorphous material is defined as a materialwith lack of an ordered atomic structure, such as glass.
There is not much information available about the theorybehind the sensor as it is patented and not widely used in theindustry. Since the goal of the thesis was to find out if it waspossible to use the present sensor for different applications, notmuch time was spent on trying to find out more about its inter-nal design, as it was not needed.
16
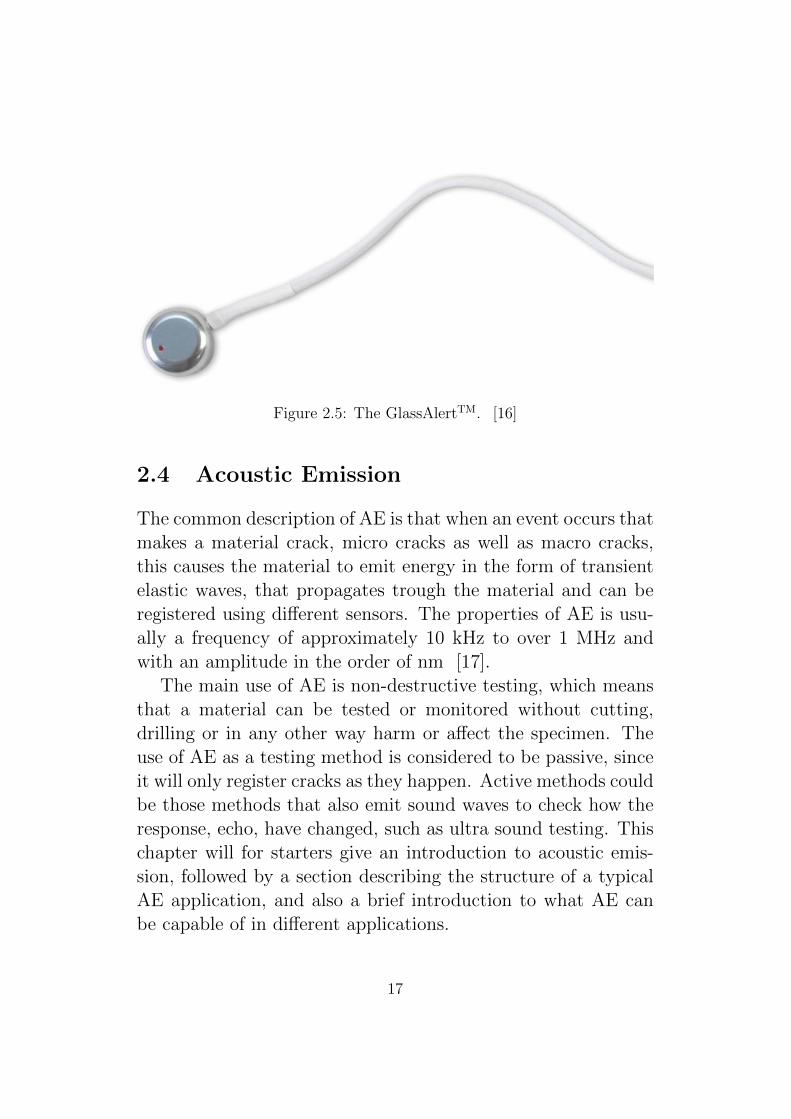
Figure 2.5: The GlassAlertTM. [16]
2.4 Acoustic Emission
The common description of AE is that when an event occurs thatmakes a material crack, micro cracks as well as macro cracks,this causes the material to emit energy in the form of transientelastic waves, that propagates trough the material and can beregistered using different sensors. The properties of AE is usu-ally a frequency of approximately 10 kHz to over 1 MHz andwith an amplitude in the order of nm [17].
The main use of AE is non-destructive testing, which meansthat a material can be tested or monitored without cutting,drilling or in any other way harm or affect the specimen. Theuse of AE as a testing method is considered to be passive, sinceit will only register cracks as they happen. Active methods couldbe those methods that also emit sound waves to check how theresponse, echo, have changed, such as ultra sound testing. Thischapter will for starters give an introduction to acoustic emis-sion, followed by a section describing the structure of a typicalAE application, and also a brief introduction to what AE canbe capable of in different applications.
17

2.4.1 Background
Although acoustic emission can appear a bit foreign to mostpeople, the phenomenon has been known for a very long time.Every time a crack is heard, acoustic emission is involved. Thissimple fact has been used by humans as well as animals to detectfor example if a tree is about to fall, a bridge about to collapse, orcraftsmanship techniques to decide if a clay pot was defective, orthe notice that tin ’cries’ when being plastically bent. All theseexamples are of the same origin, acoustic emission. AE can alsobe compared to seismology, although in a much smaller scale,where earthquakes give rise to elastic waves that can be feltfrom a very far distance. More scientific and modern approacheswith acoustic emission emerged in the 1930’s, but would notbe defined as AE until the 1950’s, with the work of J. Kaiser,and B.H. Schofield in 1961 [18]. Since then, the technique hasbeen developed and is now in practical use worldwide in manydifferent applications.
2.4.2 Applications
Due to the fact that more or less every material can carry me-chanical waves (in different levels of course), the AE method issuitable for any application where general material failure needsto be monitored. It can be in the range from monitoring verysmall specimens for material control, to large scale monitoring ofconcrete bridges for heavy traffic. There are also many compa-nies that are specialised in AE and have complete sensors readyfor measuring and monitoring. According to some of these com-panies, some of the most applied uses are:
• Material research [19]. Determining different materialsor specimens maximum load during different stresses or
18

strains, damage evolution after initial breakage and simi-lar.
• Detecting high pressure leaks in pipes, or monitoring flowin pipes for detection of unwanted contaminants [20].
• General monitoring of pressure vessels [21].
• Structural health monitoring, which according to VallenSysteme GmbH. is the only cost efficient method to monitorstructures 24 hours a day, 7 days a week. [22]. Fig. 2.6shows a good example of this use.
Figure 2.6: Application of AE in a train bridge monitoring system [23].
19

2.4.3 Typical AE Measurement
The typical AE monitoring/measuring system is built up of dif-ferent devices. Such a system is shown in Fig. 2.7. There aresome different sensors but in general, and almost always, a piezo-electric sensor is used. The signal from the sensor can be verylow, which means that some amplification is necessary. Some-times both a pre-amplifier and a higher gain amplifier is used.The pre-amplifier should be located near the sensing element toamplify the small signal before noise or other interference affectsthe signal. By using a pre-amplifier, the signal-to-noise ratio im-proves, meaning that the output of the main amplifier will becleaner. When a strong signal is achieved after the amplificationit will, if the aim is to examine the AE signal, be captured andstored, often with a DAC-card or an oscilloscope. The signalcan be transferred to a computer or micro controller, and maybe the subject to eventual signal processing algorithms, for ex-ample filtering or transforming into the frequency plane. Thesignal is then at last displayed.
Figure 2.7: A typical AE measurement set-up. [24]
20

Chapter 3
Methods
The focus in this thesis has been AE in wooden materials, de-tected with piezoelectric elements. As a comparative study, col-laboration with Covial Device and their glass break-detector,GlassAlertTM, were introduced and thus testing on glass wasexamined as well.
A piezoelectric ceramic, consisting of PZT and with a diam-eter of 12 mm, was mounted on the material. Some researchwas made to see if the market had an adhesive that matchedthe materials acoustic impedance, to maximise the transmissionof the sound wave. This is generally not something that gluemanufacturers test and specify in the data sheet, so the choicefell on a standard epoxy glue, Casco 2805, because it is supposedto be quite hard when it stiffens, gaining the most similaritieswith the specimen. There were several elements all attached tothe different materials, as shown in Fig. 3.1. Pictures of thedifferent measuring situations are shown in Fig. 3.2 and Fig. 3.3to illustrate how the measuring was performed. Testing onematerial at a time, the sensor was coupled via a standard oscil-loscope probe to a GaGe CompuScope CS1250 DAC-card andLabVIEW V.10 for processing and analysis. Because of the rel-atively small distances between the activity and transducer, noamplification that traditionally is needed in AE measurements,
21

had to be used. The oscilloscope software supplied from theGaGe DAC-card was modified, allowing storage of the wave-form for further analysis. The signals was stored in a length of100 ms and with a sample rate of 10 MHz, making sure it waspossible to study high frequencies. The amplitude measurementinterval varied between 5 volts in the glass measurements downto 2 volts in the more attenuated wood measurements.
The study consisted of in-depth analysis, searching for simi-larities and differences between the signals that were collected inthe database. An overview of the different test cases are shownin Table 3.1.
Figure 3.1: The mounting of the elements and sensor. The GlassAlertTM’sto the left, the piezoelectric ceramic and plastic film mounted on glass in themiddle, and on wood to the right.
Test case Applicable on: How: Why?Hand-knock Wood, glass Knocking with a hand Common signalKnock with tool Wood, glass Knocking with a metal tool Common signalHammer strike Wood, metal Striking with a hammer Ev. break-in attemptKeydrop All Dropping keys Common signalCoin snap All Snapping with coin Common testCut Glass Using a glass cutter Break-in attemptBend Metal Using a plier Break-in attemptCrush Glass Breaking with a plier Break-in attemptBreak Wood Using a crowbar Break-in attemptSaw Wood, metal Using a saw or angle grinder Break-in attempt
Table 3.1: An overview of the different test cases.
22

3.1 Measurements and Measuring Set-up
3.1.1 Wood
Due to the variety in structures and characteristics of wood, twomaterials, oak and pine were chosen to undergo testing. Bothmaterials are commonly used in doors and window frames but asoak is a more dense material than pine, some differences in signalpropagation were expected. For the actual breakage a chisel wasused as can be seen on the right in Fig. 3.2. Signals originatinga couple of centimetres and up to 2 m from the transducer wererecorded.
Figure 3.2: Some of the wood measurements. Keydrop to the left, hammerstrike in the middle, and break with a chisel to the right.
3.1.2 Glass
Similar to the wood testing a piezoelectric ceramic transducerwas mounted on the glass. Canola oil was first tried as an acous-tic couplant but due to the lack of casing and difficulties mount-ing the transducer, epoxy glue was chosen. There was howeverno other drawback with the canola oil, its acoustic propertieswas sufficient in these tests.
In accordance with the tests on wood, knocks with metaltools, keys dropped and snapping with a coin was chosen ascomparative signals. For the destructive signals a glasscutter
23

was used as well as a plier for actually breaking the glass. Someof these measurements are clarified in Fig. 3.3.
Figure 3.3: Some of the glass measurements. Coin snap to the left, the crushusing a plier in the middle, and glass cutting to the right.
3.1.3 GlassAlertTM
The GlassAlertTMsensor was mounted on the glass and wood inaccordance with Fig. 3.1 and canola oil was used as an acousticcouplant. As instructed the sensor was powered by 12 V DCfrom a standard power supply and a LED on the sensor indicatedif an alarm was triggered.
The casing was removed as shown to the left in Fig. 3.1 andprobes were mounted on soldered connection cables, with inten-tion to measure the analogue signal before filtering and amplifi-cation was introduced. This proved difficult because of the lowoutput from the active element, in the range of a few mV, andthus amplification was needed.
Simulations with LTspice, a SPICE (Simulation Program withIntegrated Circuit Emphasis) from Linear Technology, over theexisting circuit in the sensor revealed a small amount of filtra-tion in the lower frequencies, and a linear amplification of 112dB in the region 1 kHz to 400 kHz, usually associated with AE,shown in Fig. 3.4. Thus the signal was measured and analysedbefore it was passed on to the PIC-processor.
24

Figure 3.4: The frequency response from the GlassAlertTM. Amplification isdisplayed in green and the phase in red.
3.1.4 Metal
As a complimentary comparison, some measurements on metalwere also performed. A piezoelectric element was mounted withepoxy glue on a metal plate and similar tests as in glass andwood were performed and illustrated in Fig. 3.5. A plier wasused to bend the plate and an angle grinder to cut the metal.
Figure 3.5: Some of the metal measurements. Hammer strike to the left,bending using a plier in the middle, and cutting with an angle grinder to theright.
25

3.1.5 Noise
A small study was also made to see if there was any significantnoise that could interfere with the detected AE signal when mea-suring with the piezoelectric element. The measurements weremade with a piezoelectric element mounted on a pine material.A trigger was forced on the DAC-card, and the signal achievedwas analysed.
3.2 Signal Processing
To distinguish critical signals from other signals, i.e. signalsnot associated with fractures, different methods and algorithmswere used. They are listed and described briefly below, and amore comprehensive description can be seen in section 4.2.
When studying algorithms and software in different applica-tions it is evident that there is no general standard for process-ing and separating AE signals, but each system is developedand suited for its specific material and measurement situation.Some systems only rely on the frequency content [5] in the ac-quired signals and other study the time signal e.g. amplitude,pulse duration [25] or rise time [26], calculated as the dura-tion from passing a pre-set value to reaching its maximum peakamplitude.
Because of this our algorithms consider a combination ofmethods were both the time signal and frequency spectrum isanalysed.
In the power spectrum:
• Counting number of detected peaks.
• Calculating area
• Performing the above when different band-pass filters areapplied.
26

In the time signal:
• Calculating the mean value of a number of the largest peaks.
• Peak detection
• Performing the above when different band-pass filters areapplied.
The reason why these algorithms made it possible to distin-guish fractures from other signals are due to the difference inappearance and characteristics. All signals can be categorisedby certain parameters and this will be described more in detailin the Detector Structure section, 4.2.
27

Chapter 4
Results
The result of this thesis is mainly the constructed detector, andit was constructed after analysis of the signals acquired from themeasurements.
4.1 Acquired Signals
At least ten of each signal in all materials was recorded andanalysed thoroughly. The analysis showed that there were simi-larities and differences between the signals that made it possibleto distinguish them from each other. Below, the signals acquiredin different materials are discussed.
Due to the low output of the GlassAlertTMand the high damp-ening effect in wooden materials, these measurements were in-conclusive, and discussed further in the next chapter.
4.1.1 Wood
When studying the frequency spectrum, AE signals associatedwith crack formation generally have larger response in the higherregions. Crack formation in oak is associated with a strong fre-quency response from 25 kHz to ca 60 kHz, while in pine whichis a softer material and thus more efficient in dampening higherfrequencies, this corresponding region is instead seen from 15
28

kHz to 40-45 kHz. Exception can be made for some of the ’key-drops’ and all the coin snaps, and as a result two more distinc-tions were made. Responses associated with cracks also containa small, yet calculable, frequency response in the region 100-300 kHz for both pine and oak and a larger amount of detectedfrequencies compared to the coin snap. A flowchart of the algo-rithms used to detect crack formations can be seen in Fig. B.1.A few other test are also performed to introduce a threshold forallowed amplitudes and a study of the time-signal to faster de-tect clearly suspicious signals by counting the number of peaks.
4.1.2 Glass with GlassAlertTM
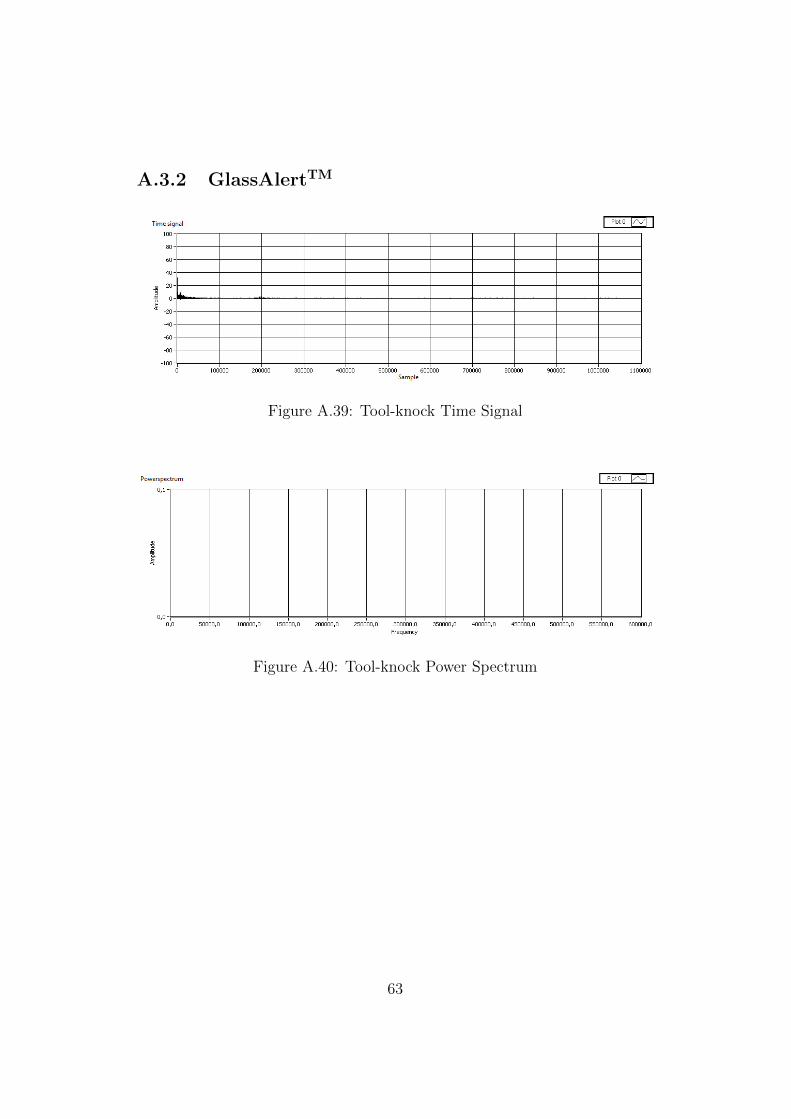
The same tests were performed on GlassAlertTMand results onthe tool-knock and keydrop can be shown in Appendix Fig. A.39to A.42. These tests triggered no alarm. Alarm was indicated,as expected, when actual destruction of the material was per-formed with a glasscutter and a plier, see Appendix Fig. A.45to A.48, but also during the coin snap, Appendix Fig. A.43 toA.44. The GlassAlertTMis supposed to withstand the coin snap[27] and thus this was categorised as false alarm. When perform-ing a fast fourier transform, FFT, on the acquired signal fromthe GlassAlertTMit clearly can be shown that destructive signalsgenerate a larger response at 350 kHz than tool-knock, key dropand coin snap. The GlassAlertTMis a tested and certified prod-uct on the market, however, in our test cases it was concludedthere had to be a problem in the software of the sensor.
4.1.3 Glass with Piezoelectric Element
The signals acquired in glass are displayed in Appendix Fig. A.29to A.38. As expected, and mentioned earlier, the signals ac-quired in glass had much higher frequency content than thecorresponding signals in wood. Also since the attenuation is
29

much lower, more details in the power spectrum could be ob-served, which led to the fact that the algorithm only analysesthe frequency domain.
The non destructive signals had large response up to ca. 50kHz, with exception for the coin snap that generally had signif-icant frequency content up to 160 kHz. This made it easy todistinguish suspected fractures, since the signals from the glasscutter had frequencies up to over 200 kHz, which was also thecase with the glass breakage although small and not easily seenin Appendix Fig. A.38. Some of the signals from snapping witha coin and dropping keys also had similarly high frequencies,but when filtering the signal 10 kHz to 500 kHz and using acombination of peak detection in the power spectrum and areacalculation between 150-500 kHz, they could be separated fromthe fractures. A flowchart showing the detector of glass fracturescan be seen in Appendix Fig. B.2.
4.1.4 Metal
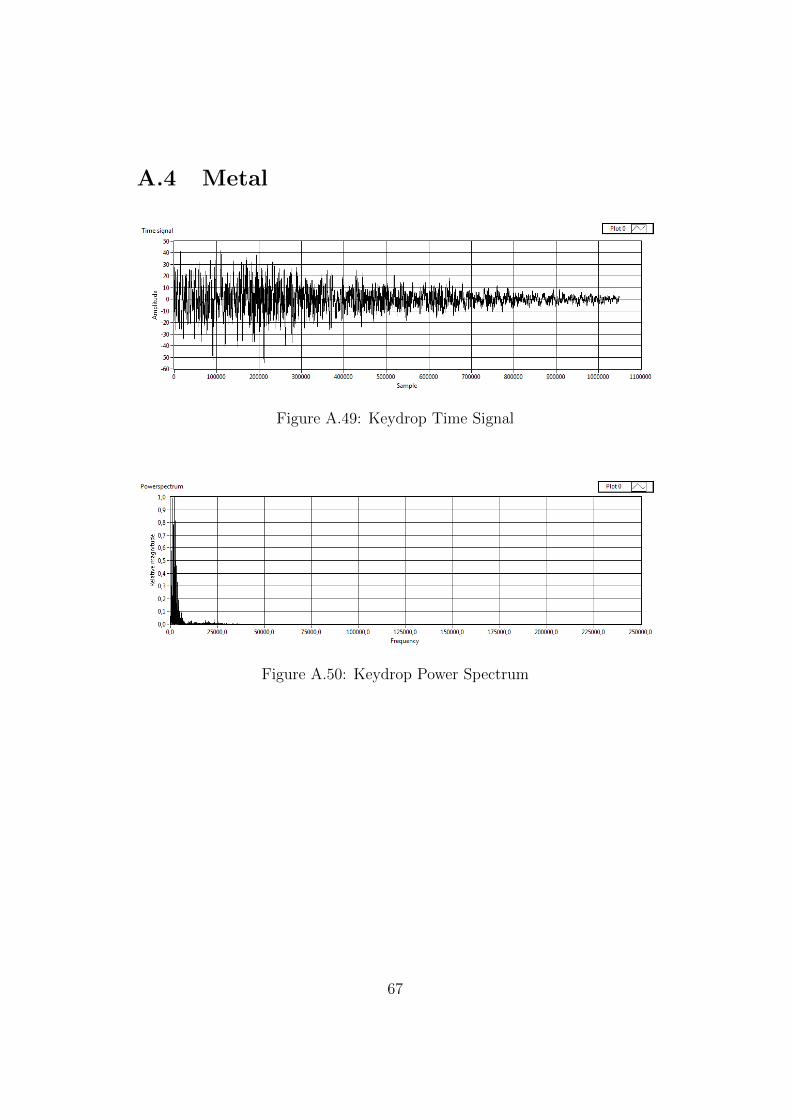
Because of the ductile structure, unlike the brittle glass andwood, no significant AE could be detected when bending theplate. However the use of an angle grinder resulted in a verylarge frequency response, compared to the non destructive testsas can be seen in Fig. A.49 to A.56.
4.1.5 Noise
The noise generally had a very low amplitude, up to 20 mV,which is lower than the detected AE signals. With no filtering,the only significant frequency was the 50 Hz from the powergrid. If an order fifteen bandpass-filter was applied, with cut-offfrequencies 100 Hz and 500 kHz, some dominating frequenciescould be seen in the lower frequency region, i.e. around 450Hz and 1.3 kHz. Since these frequencies had an insignificant
30

amplitude compared to the detected AE signals, the noise wasconcluded as minimal. However, disturbances could possibly bedetected in further studies, and considering electrical crosstalk,a casing in a future prototype is strongly advised.
4.2 Detector Structure
With the results obtained above, and by analysing the character-istics of the obtained signals it was possible to estimate differentparameters to define a fracture signal and construct a detectorwhich could be used for real time testing. Though its executiontime is not as fast as it could be due to unnecessary fast sam-ple rate, it shows a good accuracy. The detector was writtenin LabVIEW, and run on a personal computer, coupled witha DAC-card. The detector consists of different tests, designedto disregard non destructive signals and pass forward suspicioussignals that might be associated with fractures, for further anal-ysis. This way the largest number of non destructive signalswill be discarded in the detector, and if a fracture is detectedit will pass through all test before setting a LED to indicatealarm. The less ’alarm-like’ the signal is, the earlier it will bediscarded, making the detector avoid execution of unnecessarytests.
Since the signals in glass and wood differ, there are two dif-ferent structures in the detector and these are presented below.When there are filters applied, if nothing else is stated, a digitalband-pass filter of order fifteen, to make the cut-off frequen-cies steep is used. Flowcharts of the detectors can be seen inAppendix Fig. B.1 to Appendix Fig. B.2.
As the same program handles all the test cases, it starts withletting the user define what kind of material the current mea-surements are performed on. With respect to this, the softwaresets the variables used in the algorithms. The variables were
31

chosen with respect to the acquired data during this thesis, butcould easily be changed if needed.
Some detectors rely on the principle of counting number ofAE events detected [3], [4]. Using the detector described inthis section, depending on the application, a system could bedesigned to not trigger an alarm until a certain number of AEevents have occurred in a given timeframe. The signal recordedand analysed with these algorithms are 100 ms but, with theintroduction of a buffer memory, once the system is triggered alonger signal could be recorded and analyzed in intervals of 100ms.
4.2.1 Wood Detector
Although the tests are the same for all wooden materials, be-cause of the different characteristics of dense and softer wood,different parameters are set for oak and pine. A mean value fora number of the maximal peaks in the time signal is calculated.Even if a signal is not associated with a crack formation it mightbe desired to trigger an alarm if the amplitude is high, result-ing from e.g. a hammer strike or similar. This threshold couldbe changed or completely disregarded depending on the appli-cation. Fracture signals can in most cases be separated fromother disturbances, e.g. hand-knocks that probably is the mostcommon signal to be analysed in a door application, merely byconsidering the time signal. By analysing the time signal under30 kHz and calculating the number of peaks, most disturbancesare disregarded and some of the fractures are detected withoutperforming a more complex and time-consuming FFT. The sig-nal is disregarded and considered a non-fracture if the calculatednumber of peaks falls under the first threshold. If the numberof calculated peaks is more than the second threshold it is con-sidered a fracture and immediately triggers an alarm. If the
32

calculated peaks are greater than the first threshold but lowerthan the second it is considered a possible fracture and an FFTis performed with a band-pass filter in the range 300 Hz to 100kHz to further study the frequency content associated with AE.If the area of the frequency spectrum, in the range 20-100 kHz,and the number of detected frequencies are above the thresholdthe signal is considered a fracture. A flowchart over the test canbe seen in Appendix Fig. B.1
4.2.2 Glass Detector
A flowchart of the detector used in glass can be seen in Ap-pendix Fig. B.2. Due to the lower signal attenuation in glass,more details of the signals could be observed and this made itpossible to have fewer tests than in the wood detector. As inthe wood detector, the parameters are obtained from start, whenthe material is chosen.
There are some minor tests made in the first steps of thedetector to see if the signal is strong enough to possibly be asuspicious signal. This was added to disregard very small sig-nals obtained with scratching on the glass with different tools,making no actual harm to the material. However, these signalscharacteristics reminded of a suspicious signal except for its am-plitude. These minor tests are not illustrated in the flow chart,and are voluntary to include in the algorithm. It may be a bet-ter alternative to simply increase the trigger level, however thisproved difficult due to some limitations in the trigger setting ofthe GaGe DAC-card.
The signal is filtered with a band-pass filter with cut-off fre-quencies 100 Hz and 500 kHz. This is basically the whole signalcontent with exceptions of very high and low frequencies with nosignificance to the tests. Then a power spectrum is performed,and the area is calculated from 60 to 100 kHz. This is due to
33

the high frequency content obtained in glass material failure. Ifthe area calculated is below a specific threshold, the detectorindicates no alarm, but if the area is sufficient, it is treated asa suspicious signal and further testing is performed. Before thesecond test the signal is filtered with the same type of band-pass filter, but with the cut-off frequencies 10 to 500 kHz. Peakdetection is performed on the power spectrum to calculate thenumber of detected frequencies and if the number is below aspecific threshold, again no alarm is indicated. If the thresholdis exceeded, a final test is done to make sure it is really a frac-ture signal. The area of the power spectrum between 150 and500 kHz is calculated, and if the threshold for this is exceeded,alarm is indicated.
34

Chapter 5
Discussion
There were a few concerns that arose during this thesis, andtogether with their possible solutions they will be discussed inthis chapter.
5.1 Data Acquisition
The DAC-card and its software were not entirely easy to coop-erate with. Some time was spent just trying to understand howthe software oscilloscope worked, and how it could be modifiedto suit our purposes. Since there was not enough time to un-derstand all of its features, we often settled with good enoughproperties and attributes, and this was the case with the samplefrequency. The detector runs with a sample rate of 10 MHz, andthat makes the program execution time approximately ten timesslower than actually needed, since the highest frequency studiedis 500 kHz in the glass measurements. By following the NyquistTheorem [28], which is strongly advised, no higher samplingrate than 1 MHz is needed to detect the frequency content, andin the wood measurements no higher frequency than 300 kHzwas studied, lowering the minimum sample rate to 600 kHz.With the 10 MHz sample rate, the execution time was in worstcase scenario approximately fifteen seconds, and with a major
35

decrease to 1 MHz the execution time would theoretically dropto a maximum of two seconds, because there will be much lessdata to consider in the peak detector and FFT calculations.
5.2 Piezoelectric Element
The software used with the piezoelectric ceramic sensor couldpossibly be more optimised if some more time was spent ondevelopment. However, it is actually very flexible, since all thetests are depending on parameters to define if the signal is tobe considered as a fracture. This also means that the sensorssensitivity can be configured according to the application. Thisin turn means it could not just be used as a fracture sensor, butalso as a general sensor for detecting events.
A design consisting of the piezoelectric element also exhibitsone or more resonance frequencies, determined by the shape anddiameter, but not as dominant which makes it a more flexiblesystem, and able to study several regions in the frequency spec-trum. Because there is no need for amplification with a piezo-electric ceramic, considering short distances, the hardware de-sign could potentially be minimal. But unlike the GlassAlertTM,it would consist of more software, putting higher demands on thememory and processor of the micro controller. Since the focus ofthis thesis was not the sensing element itself, not very much ef-fort was made to characterise the piezoelectric ceramic in termsof resonance frequencies, frequency response, linearity and sim-ilar properties. Additional approaches could be made possibleby further analysis of these properties.
Most of the challenges in a piezoelectric sensor consist of itssoftware, but its broad bandwidth makes it possible to use thesame sensor on different materials simply by configuring thesoftware.
36

5.3 GlassAlertTM
GlassAlertTMis designed to work on glass and the sensing ele-ment clearly has a strong resonance frequency at 350 kHz, whichmakes it difficult to study frequencies in other areas. This couldpotentially be problematic if a source of disturbance or anothercase similar to the coin snap is discovered which is difficult toseparate from the destructive signals.
Since the software of the GlassAlertTMis not entirely known,we can not for sure tell how the acquired signal is processed, andAE separated from other signals. However it actually workedquite well when triggering real alarms, like breaking glass andonset with the glasscutter. The problem was snapping with acoin on the glass, which consistently triggered an alarm on ourtest rig.
5.4 GlassAlertTMon Wood
GlassAlertTMis designed to work on glass and the resonance fre-quency has to be altered to study AE associated with woodenmaterials. Because wooden materials differ in structure andproperties, which results in different frequencies associated withAE, it could prove difficult to study only one frequency region,connected with the resonance frequency of the sensor, to de-tect fractures in both dense and light wooden materials. If thiswould be the case, one might have to use different sensors ondifferent wooden materials, which would be both expensive andimpractical. Another aspect that has to be considered is theamplification. GlassAlertTMalready has a strong amplificationof 112 dB, and to study wood that is highly attenuated com-pared to glass, this amplification probably has to be increasedeven further. This creates challenges in the hardware, not toamplify unwanted signals and not to create additional distur-
37

bances.
5.5 Glass
According to this early investigation both the piezoelectric el-ement and GlassAlertTM, with some adjustments in software,can be used to detect glass fractures associated with an intru-sion. However, with the current software of the GlassAlertTM,the piezoelectric element with proper software would be a morereliable alternative.
5.6 Metal
In the quick tests performed on metal no significant AE couldbe detected when bending the metal plate. The piezoelectric el-ement could however possibly be used in situations where largerdestructive signals, like the electric grinder, is expected e.g. ona metal container.
38

Chapter 6
Conclusions and Future Work
The results achieved from this thesis suggest that it is indeedpossible to separate a destructive signal from other disturbances,with quite simple techniques. By using the piezoelectric ceramic,a very flexible sensor can be constructed which could possiblyeven be used on different materials. The ’difficulty’ in using thesame sensor on different materials is that the parameters neededfor determination of signal characteristics differ.
As mentioned earlier, a future prototype could have a muchdecreased sample rate, allowing for faster execution time. Also,some optimization of the code and algorithms could possibly bedone to increase the performance.
Due to the fact that GlassAlertTMis an already developedproduct this could, possibly with some modification of the soft-ware, be used as a reliable glass break application. Dependingon rules and regulations in an already certified product, it couldbe a quick and cost efficient solution to simply change the soft-ware of the GlassAlertTM, compared to the piezoelectric elementwhich require more testing in ’realistic’ environments such as onmounted doors and window frames. As a long term solution thepiezoelectric element could prove to be a more cost efficient sys-tem, using the same sensor on glass, wood and possibly metalonly by modifying the software.
39

Before the sensor with a piezoelectric ceramic could be con-sidered as an alternative there are some practical issues thatmust be taken care of. Since the ceramic used in this thesisis very simple, the connections are placed one on each side ofthe element. This makes it impractical to mount on the sur-face anywhere but the edge as displayed in Fig. 6.1. Howeverthere are elements that have the connectors ’wrapped around’the same side, hence called wrap-around piezoelectric element,which could be more practical. An illustration of this could beseen in Fig. 6.2. But since there will be a change of elements, thecharacteristics will change and thus the parameters have to bereconfigured, but the structure of the detector could probablybe kept.
Since the algorithm constructed with the piezoelectric sens-ing element would need more software to handle different signals,maybe a more advanced micro controller is needed than the sim-ple PIC controller used in the GlassAlertTM. Micro controllerssuch as the ARM have become quite powerful and have grownin popularity during recent years, due to low cost and very lowpower consumption. Although it is more advanced than thePIC, the ARM is considered to be the major processor archi-tecture in use today, making it cheap and well documented. [29]This altogether suggests that it probably will not be a problemimplementing the algorithms on a micro controller.
40

Figure 6.1: Piezoelectric element mounted on the edge of a specimen to theleft, and on the surface to the right. The later creates a distance betweenthe surfaces, which causes a poor contact.
Figure 6.2: A piezoelectric ceramic element with wrap-around connector,which allows for direct contact on one side of the element.
41

Acknowledgements
We have had a terrific time during this thesis and ithas been a great opportunity to make use of some ofour knowledge gained during our studies. We wishto express our gratitude to the following people, formaking our master thesis possible. First of all, oursupervisors, Professor Hans W. Persson and AssociateProfessor Monica Almqvist, both from the Departmentof Measurement Technology and Industrial ElectricalEngineering, MTIEE, at LTH as well as Lars Hallingat Securitas Direct Sverige AB. We would also like toaim a special thanks to Tomas Jansson at MTIEE forsupporting us with hardware and technical support,and Ola Hakansson for, amongst other things, coordi-nating and managing the communications with CovialDevice.
We also say thanks to all the people at SecuritasDirect for giving us a place to do our thesis, makingthis time enjoyable and providing us with general tipsand tricks regarding both work and life in general.
Thank you Lunds Glasmasteri for providing us withmaterials to destroy.
Further, special thanks to Filip Skarp for sharingyour knowledge in simulations with LTspice and thecrash course in hot air soldering.
Associate Professor Gunnar Lindstedt at IEA, LTH,for making us see the limitations in our thesis projectand not entering the vast jungle of micro controllers.
Martin Stridh at the Dept. of Electrical and Infor-mation Technology for interesting conversations in thefield of signal processing.
Dear John at GaGe Instruments Dynamic SignalsLLC, for interesting mail conversations.
42

And last, but not least, our families and friends forsupport and comfort during the course of this thesis.
43

Bibliography
[1] Securitas Direct Home Page, available online: http://www.securitas-direct.com, 2011-11-09.
[2] Test report for GlassAlertTM, available on-line: http://www.covialdevice.se/dbhires/
h1191313972-TestreportP701326B.pdf, 2011-11-02.
[3] M. Shigeishi, S. Colombo, K.J. Broughton, H. Rut-ledge, A.J. Batchelor, M.C. Forde, ’Acoustic emission toassess and monitor the integrity of bridges ’, available on-line: http://www.sciencedirect.com.ludwig.lub.lu.
se/science/article/pii/S0950061800000684, 2011-11-10.
[4] C. Melbourne and A. K. Tomor ’Application of AcousticEmission for Masonry Arch Bridges’, available online:http://onlinelibrary.wiley.com.ludwig.lub.lu.se/
doi/10.1111/j.1475-1305.2006.00274.x/pdf, 2011-11-10.
[5] H.L. Dunegan, ’Elimination of Extraneous Noise Sourcesfrom Acoustic Emission Based Termite DetectionInstrument by Use of Modal Ratios’ available on-line:http://www.deci.com/Eliminating%20Extaneous%20noise%20sources2.pdf, 2011-11-09.
44

[6] TheFreeDictionary, available online: http:
//medical-dictionary.thefreedictionary.com/
acoustic+impedance, 2011-11-02.
[7] NDT Resource Center, available online: http://www.
ndt-ed.org/EducationResources/CommunityCollege/
Ultrasonics/Physics/wavepropagation.htm, 2011-11-02.
[8] V. Bucur, “Acoustics of Wood” Springer-Verlag Berlin Hei-delberg New York, p. 96, 2006.
[9] C. Grosse, “Acoustic Emission Testing” Springer-VerlagBerlin Heidelberg New York, p. 312-314, 2002.
[10] G. Gautschi, “Piezoelectric Sensorics : Force, Strain, Pres-sure, Acceleration and Acoustic Emission Sensors, Materi-als and Amplifiers” Springer-Verlag Berlin Heidelberg NewYork, p. 2, 2002.
[11] Wikipedia, available online: http://en.wikipedia.org/
wiki/Lead_zirconate_titanate, 2011-10-26.
[12] ’Knowledge Center Piezoelectricity’, APC International,Ltd., available online: http://www.americanpiezo.com/
knowledge-center/piezo-theory/piezoelectricity.
html, 2011-10-26.
[13] G. Gautschi, “Piezoelectric Sensorics : Force, Strain, Pres-sure, Acceleration and Acoustic Emission Sensors, Materi-als and Amplifiers” Springer-Verlag Berlin Heidelberg NewYork, p. 50, 2002.
[14] ’Piezo Film Sensors Technical Manual’, MeasurementSpecialities, Inc., available online:http://www.meas-spec.com/downloads/Piezo_Technical_Manual.pdf, p.2,2011-10-26.
45

[15] ’Piezo Film Sensors Technical Manual’, MeasurementSpecialities, Inc., available online:http://www.meas-spec.com/downloads/Piezo_Technical_Manual.pdf, p.13,2011-10-26.
[16] GlassAlertTM, Covial Device, available online:http://www.covialdevice.se/produkter/527.php, 2011-11-09.
[17] G. Gautschi, “Piezoelectric Sensorics : Force, Strain, Pres-sure, Acceleration and Acoustic Emission Sensors, Mate-rials and Amplifiers” Springer-Verlag Berlin Heidelberg, p.11, 2008.
[18] C. Grosse, “Acoustic Emission Testing” Springer-VerlagBerlin Heidelberg New York, p. 199, 2002.
[19] Vallen Systeme GmbH, “About Acoustic Emis-sion”, available online: http://www.vallen.de/
about-acoustic-emission, 2011-10-28.
[20] AV Technology Ltd., “Acoustic Emission Sensors”, avail-able online: http://www.aesensors.co.uk/index.html,2011-10-28.
[21] AV Technology Ltd., “Machines talk and it pays to listen,Acoustic Emission Technology”, available online:http://www.aesensors.co.uk/PDF/AEarticlefinalpix.pdf,2011-10-28.
[22] Vallen Systeme GmbH, “Applications, Structure HealthMonitoring”, available online:http://www.vallen.de/applications, 2011-10-28.
[23] Wavesinsolids LLC, ’Research on Acoustic Emis-sion for Structural Health Monitoring’ available on-line:http://www.wins-ndt.com/acoustic_emission_research_and_development.php, 2011-11-09.
46

[24] Euro Physical Acoustics SA, ’Acoustic Emission Products’available online:http://www.epandt.com/us/produits_ea_us.html, 2011-11-09.
[25] S. Jakiela, L. Bratasz, R. Kozlowski, ’Acoustic emissionfor tracing fracture intensity in lime wood due to climaticvariations’ available online:http://www.cyf-kr.edu.pl/
~ncbratas/aboutus/PublikacjaSJ2_2008.pdf, 2011-11-09.
[26] C. Grosse, ’Acoustic Emission Testing’ Springer-VerlagBerlin Heidelberg New York, p. 43, 2002.
[27] Covial Device, “Bruksanvisning - GlassAlertTM”, avail-able online:http://www.covialdevice.se/dbhires/h1223985921-bruksanvisning.pdf, 2011-11-02.
[28] Wikipedia, available online: http://en.wikipedia.org/
wiki/Nyquist%E2%80%93Shannon_sampling_theorem,2011-11-03.
[29] Wikipedia, available online: http://en.wikipedia.org/
wiki/ARM_architecture, 2011-11-07.
47

Appendix A
Acquired Signals
Since too many signals were recorded to be displayed, this Ap-pendix shows one representative signal for each measurementand material. The first signals are from oak, with the piezoelec-tric ceramic, followed by signals from pine with the same sensor.After that is glass with the piezoelectric ceramic, followed byglass with the GlassAlertTMsensing element, and finally metalmeasurements with the piezoelectric ceramic. All signals arefiltered with a digital band-pass filter between 100 Hz and 500000 Hz, to show only the relevant frequency content. Please notethat the frequency scale of the power spectrum differ from woodto glass. This is due to the fact that glass have larger frequencyresponse in higher regions, and there is none or insignificantcontent outside the displayed region.
48

A.1 Oak
Figure A.1: Hand-knock Time Signal
Figure A.2: Hand-knock Power Spectrum
49

Figure A.3: Tool-knock Time Signal
Figure A.4: Tool-knock Power Spectrum
Figure A.5: Keydrop Time Signal
50

Figure A.6: Keydrop Power Spectrum
Figure A.7: Coin Snap Time Signal
Figure A.8: Coin Snap Power Spectrum
51

Figure A.9: Hammer Strike Time Signal
Figure A.10: Hammer Strike Power Spectrum
Figure A.11: Break Time Signal
52

Figure A.12: Break Power Spectrum
Figure A.13: Saw Time Signal
Figure A.14: Saw Power Spectrum
53

A.2 Pine
Figure A.15: Hand-knock Time Signal
Figure A.16: Hand-knock Power Spectrum
54

Figure A.17: Tool-knock Time Signal
Figure A.18: Tool-knock Power Spectrum
Figure A.19: Keydrop Time Signal
55
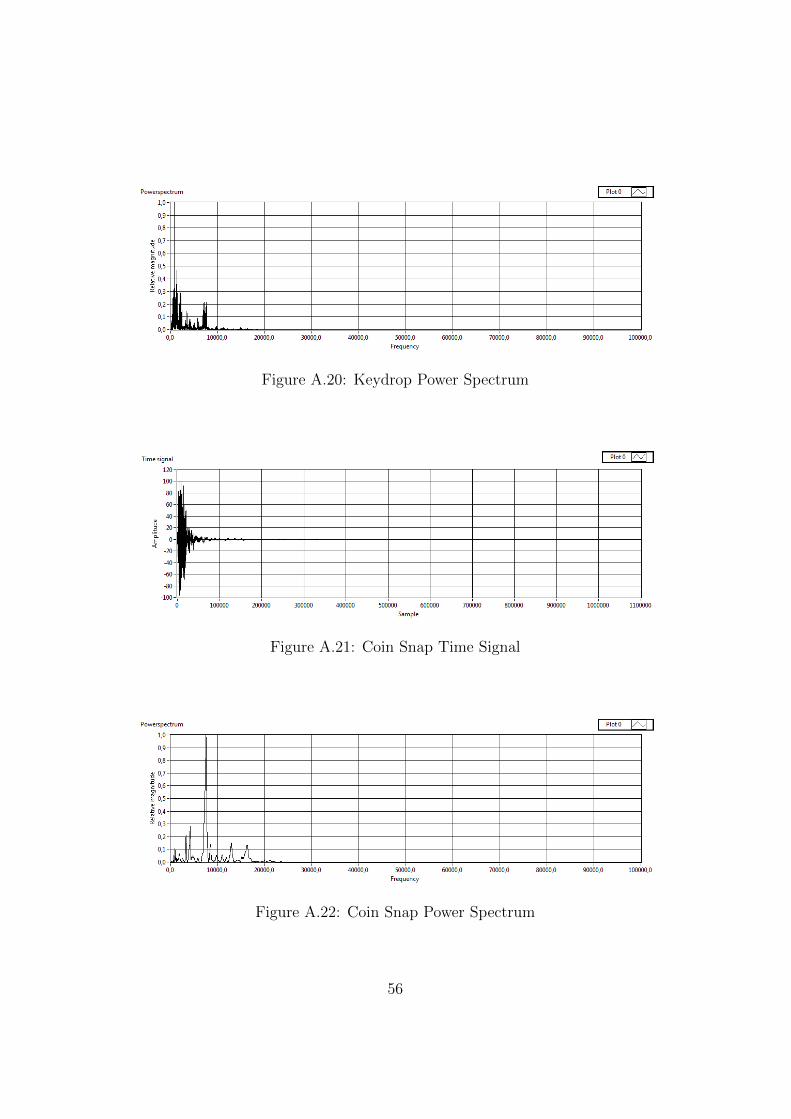
Figure A.20: Keydrop Power Spectrum
Figure A.21: Coin Snap Time Signal
Figure A.22: Coin Snap Power Spectrum
56

Figure A.23: Hammer Strike Time Signal
Figure A.24: Hammer Strike Power Spectrum
Figure A.25: Break Time Signal
57

Figure A.26: Break Power Spectrum
Figure A.27: Saw Time Signal
Figure A.28: Saw Power Spectrum
58

A.3 Glass
A.3.1 Piezoelectric Element
Please note, that for displaying purposes, the magnitude of thepower spectrums in this section is scaled 10:1.
Figure A.29: Tool-knock Time Signal
Figure A.30: Tool-knock Power Spectrum
59

Figure A.31: Keydrop Time Signal
Figure A.32: Keydrop Power Spectrum
Figure A.33: Coin Snap Time Signal
60

Figure A.34: Coin Snap Power Spectrum
Figure A.35: Glass Cutting Time Signal
Figure A.36: Glass Cutting Power Spectrum
61

Figure A.37: Glass Breaking Time Signal
Figure A.38: Glass Breaking Power Spectrum
62
A.3.2 GlassAlertTM
Figure A.39: Tool-knock Time Signal
Figure A.40: Tool-knock Power Spectrum
63

Figure A.41: Keydrop Time Signal
Figure A.42: Keydrop Power Spectrum
Figure A.43: Coin Snap Time Signal
64

Figure A.44: Coin Snap Power Spectrum
Figure A.45: Glass Cutting Time Signal
Figure A.46: Glass Cutting Power Spectrum
65

Figure A.47: Glass Breaking Time Signal
Figure A.48: Glass Breaking Power Spectrum
66
A.4 Metal
Figure A.49: Keydrop Time Signal
Figure A.50: Keydrop Power Spectrum
67

Figure A.51: Hammer Strike Time Signal
Figure A.52: Hammer Strike Power Spectrum
Figure A.53: Coin Snap Time Signal
68

Figure A.54: Coin Snap Power Spectrum
Figure A.55: Angle Grinder Time Signal
Figure A.56: Angle Grinder Power Spectrum
69

Appendix B
Flow Charts
70

Figure B.1: Flow chart of the wood detector
71

Figure B.2: Flow chart of the glass detector
72