
Planning for Supplier Base Reduction - Lund University ...
104
Department of Industrial Management and Logistics Division of Engineering Logistics Planning for Supplier Base Reduction - understanding Supplier Base Reduction’s role in purchasing A case study at Alfa Laval AB Authors Fabian Karlsson Sebastian Eriksson-Ritzén Supervisors Ala Pazirandeh Markus Ekendahl
-
Upload
khangminh22 -
Category
Documents
-
view
2 -
download
0
Transcript of Planning for Supplier Base Reduction - Lund University ...

Department of Industrial Management and Logistics Division of Engineering Logistics
Planning for Supplier Base Reduction
- understanding Supplier Base Reduction’s role in purchasing
A case study at Alfa Laval AB
Authors Fabian Karlsson Sebastian Eriksson-Ritzén
Supervisors Ala Pazirandeh Markus Ekendahl

ii

iii
Acknowledgements This thesis completed our Master of Science in Mechanical Engineering with specialization in Logistics and Supply Chain Management at the Faculty of Engineering, Lund University. We initiated this study by expressing a wish to write our master thesis within purchasing at Alfa Laval. We would like to thank Alfa Laval for providing us with an office at their site in Lund and all the information needed to complete this study. We would also like to especially thank all the global purchasers and people at Operations Development who have been very supportive and a great company, both socially and professionally. Finally we would like to address the supervisors for the thesis; Ala Pazirandeh and Markus Ekendahl. Ala has continuously provided us with great feedback on our report writing and has really helped us to improve the report structure of this study. Markus has provided us with his personal network within Alfa Laval and has with his knowledge and experience within purchasing been a great inspiration for our future careers. Lund, February 2011 Fabian Karlsson Sebastian Eriksson-Ritzén

iv
Abstract Title: Planning for Supplier Base Reduction - understanding Supplier
Base Reduction’s role in purchasing. A case study at Alfa Laval AB
Authors: Fabian Karlsson and Sebastian Eriksson-Ritzén Supervisors: Ala Pazirandeh, Department of Industrial Management and
Logistics, Lund University Markus Ekendahl, Alfa Laval AB Background: Today individual businesses do not compete as isolated entities,
but rather within supply chains. Lambert (2008) emphasizes the importance of relationship management in supply chain management which is also supported by Chen and Paulraj (2004) who argue that buyer-supplier relationships have a central part in supply chain management. Chen and Paulraj (2004) state that in the past companies commonly contracted with a large number of suppliers and that recently there has been a significant shift from the traditional adversarial buyer-seller relationships to the use of a limited number of qualified suppliers with deeper relationships. The shift when moving from a large number of suppliers to fewer is titled supplier base reduction. Supplier base reduction is one of five components in Chen and Paulraj‟s (2004) buyer-supplier concept. They conclude that supplier base reduction is a required element of contemporary supply chain management. This thesis concerns how supplier base reduction connects to other areas within the purchasing field and what issues companies needs to address when planning for a supplier base reduction initiative.
Purpose: The purpose of this thesis is to increase the understanding of a
successful supplier base reduction initiative and the activities that should be conducted prior to such a supplier base reduction initiative.
Research question: How to successfully plan a supplier base reduction initiative and
what aspects to consider when planning such an initiative? Method: In order to map the areas of purchasing that relate to supplier
base reduction and understand how these areas affect and are affected by supplier base reduction a system approach has been used. This has been combined with an abductive approach where purchasing literature has been studied and a conceptual model has been developed. This conceptual model has been used to analyze the conditions for supplier base reduction at the case company, Alfa Laval.
Conclusions: The conceptual model concludes that it is important to understand
why a company should initiate supplier base reduction and that there are activities that should be carried out before reducing the supplier base. The degree of purchasing centralization affects how difficult a supplier base reduction will be. A commodity

v
strategy and data on the spend and supplier performance should be in place before a supplier initiative.
Key words: Supplier base reduction, supplier base, supplier management,
supply chain management

vi
Contents
1 Introduction...................................................................................................................1
1.1 Background of the study .......................................................................................... 1
1.2 Purpose and research question .............................................................................. 3
1.3 Objectives................................................................................................................... 3
1.4 Scope of the study .................................................................................................... 3
1.5 Target audience ........................................................................................................ 3
1.6 Disposition of the thesis ........................................................................................... 4
2 Methodology .................................................................................................................7
2.1 Induction, deduction and abduction ....................................................................... 7
2.2 Methodological approach ........................................................................................ 8
2.3 Qualitative and quantitative research .................................................................. 11
2.4 Case study ............................................................................................................... 11
2.5 Data collection ......................................................................................................... 12
2.5.1 Primary data ..................................................................................................... 14
2.5.2 Secondary data ................................................................................................ 15
2.6 Validity and reliability .............................................................................................. 17
3 Theoretical framework ............................................................................................... 20
3.1 Purchasing organization ........................................................................................ 21
3.1.1 Centralized ........................................................................................................ 21
3.1.2 Decentralized ................................................................................................... 21
3.1.3 Degree of centralization/decentralization .................................................... 21
3.2 Purchasing collaboration concepts ...................................................................... 22
3.2.1 Pooling............................................................................................................... 22
3.2.2 Purchasing synergy ......................................................................................... 23
3.3 Supplier Relationship Management (SRM) ........................................................ 24
3.3.1 Supplier relationships ...................................................................................... 24
3.3.2 Purchasing portfolio......................................................................................... 25
3.3.3 Supplier selection and evaluation ................................................................. 28
3.4 Tools ......................................................................................................................... 30
3.4.1 Supplier base reduction approaches ............................................................ 30
3.4.2 Spend analysis ................................................................................................. 30
3.4.3 Total Cost of Ownership (TCO) ..................................................................... 32
3.5 Previous studies on SBR ....................................................................................... 32
3.5.1 Managing suppliers: when fewer can mean more ...................................... 32

vii
3.5.2 Supplier management in German manufacturing companies: an empirical investigation................................................................................................... 32
3.5.3 Supply base reduction within supply base reduction ................................. 33
3.5.4 The supply base reduction process: an empirical investigation ............... 33
3.5.5 Supply base rationalization: myth or reality?............................................... 33
3.5.6 Strategic cost management across boundaries of firms ........................... 34
3.5.7 Summary of the previous SBR studies ........................................................ 35
4 The conceptual model ................................................................................................ 37
4.1 Purchasing strategy ................................................................................................ 38
4.2 Degree of purchasing decentralization ................................................................ 38
4.3 Spend and supplier performance analysis .......................................................... 39
4.4 SBR approach ......................................................................................................... 39
4.5 Objectives and purposes with SBR ...................................................................... 40
4.6 Stakeholder mapping ............................................................................................. 40
4.7 Supplier evaluation ................................................................................................. 40
4.8 Performance measurement ................................................................................... 41
5 Empirical Data ............................................................................................................. 43
5.1 Alfa Laval – The case company ........................................................................... 43
5.2 Strategy .................................................................................................................... 46
5.2.1 ALPS .................................................................................................................. 47
5.3 Operations purchasing (OP) ................................................................................. 48
5.3.1 Role and responsibility .................................................................................... 48
5.3.2 Key performance indicators ........................................................................... 49
5.3.3 Availability of purchasing data ....................................................................... 49
5.3.4 Commodity strategy and risk ......................................................................... 49
5.3.5 Demands ........................................................................................................... 50
5.4 Product Groups ....................................................................................................... 50
5.4.1 Plate heat exchangers (PHE) ........................................................................ 50
5.4.2 Brazed Heat Exchangers (BHE) ................................................................... 53
5.4.3 High speed separators (HSS) ........................................................................ 54
5.5 Thoughts about SBR .............................................................................................. 57
5.5.1 OP ...................................................................................................................... 57
5.5.2 PHE .................................................................................................................... 58
5.5.3 BHE .................................................................................................................... 58
5.5.4 HSS .................................................................................................................... 59
6 Analysis of the case company, using the conceptual model .................................. 61

viii
6.1 Analysis of the case company .............................................................................. 61
6.1.1 Purchasing strategy......................................................................................... 61
Commodity strategy ...................................................................................................... 62
Needs and characteristics of BUs at a multiunit company ...................................... 64
6.1.2 Degree of purchasing decentralization......................................................... 65
Collaboration between purchasing functions ............................................................ 66
Forum for collaboration ................................................................................................. 67
6.1.3 Spend and supplier performance analysis .................................................. 67
6.1.4 SBR approach .................................................................................................. 68
Capturing BU needs and keeping a holistic view ..................................................... 69
Create organizations that are able to leverage from a SBR initiative ................... 69
Activities prior to the implementation .......................................................................... 70
Implementation of a SBR initiative: the case company ........................................... 70
6.1.5 Objectives and purposes with SBR .............................................................. 71
6.1.6 Stakeholder mapping ...................................................................................... 71
6.1.7 Supplier evaluation .......................................................................................... 72
6.1.8 Performance measurement ........................................................................... 72
6.2 Concluding remarks on the case company ........................................................ 73
6.3 Discussing the conceptual model ......................................................................... 75
7 Conclusions ................................................................................................................ 78
7.1 Meeting the objectives ........................................................................................... 78
7.2 Answering the research question ......................................................................... 78
7.3 Further research ...................................................................................................... 79
7.3.1 Further research for academia ..................................................................... 79
7.3.2 Further research for Alfa Laval ...................................................................... 79
7.4 Recommendations for Alfa Laval ......................................................................... 80
References .......................................................................................................................... 82
Appendices ............................................................................................................................I
Appendix I: Thoughts about SBR from sourcing meeting 2010-05-26 ........................ I
Appendix II: Interviewees and Interview guide (Swedish) ........................................... III

ix
List of figures
Figure 1: Chen‟s and Paulraj‟s research framework of SCM ......................................................... 1
Figure 2: Schematic figure describing sub supplier bases in Alfa Laval‟s supplier base .......... 2
Figure 3 Disposition of the thesis ........................................................................................... 4
Figure 4: Illustration of the abductive approach ............................................................................... 8
Figure 5: Relation between methodological approach, operative paradigm and the study are
................................................................................................................................................................. 9
Figure 6: System model for the investigated purchasing theory ................................................. 10
Figure 7: System model for the purchasing function at the case company ............................... 11
Figure 8: Illustration of how the main area can be narrowed down to the problem formulation
with the help of a first quick literature study. .................................................................................. 16
Figure 9: Organization of global sourcing: ways towards an optimal degree ............................ 22
Figure 10: Kraljic‟s purchasing portfolio matrix .............................................................................. 26
Figure 11: Questions to use when conducting a spend analysis and cost savings
opportunites ......................................................................................................................................... 31
Figure 12: A conceptual model connecting relevant purchasing functions with SBR .............. 37
Figure 13: Alfa Laval‟s three key technologies .............................................................................. 43
Figure 14: Highest level in the organizational chart ...................................................................... 44
Figure 15: each PG‟s percentage of total sales ............................................................................. 44
Figure 16: The geographical location of Alfa Laval‟s manufacturing units ................................ 45
Figure 17: Simplified illustration of the connection between functions within Alfa Laval ......... 46
Figure 18 Four earlier isolated concepts are now consolidated under ALPS ........................... 48
Figure 19: Quality assurance group ................................................................................................. 55
Figure 20: Suppliers with a low spend/supplier create a ”tail”. Each column in the diagram
represent the spend of a supplier. This is an example without “real” figures ............................ 58
Figure 21: How the commodity strategy must be derived from each PG‟s end products and
how the commodity strategy will support SBR ............................................................................... 64
Figure 22: Logic scheme of the SBR findings at the case company ......................................... 73
Figure 23: A conceptual model connecting relevant purchasing functions with SBR .............. 75

x
List of tables Table 1: The relations between Methods and certain conditions in research ........................... 13
Table 2: Key points for pooling ......................................................................................................... 23
Table 3: Factors that affect the two dimensions regarding appropriate supplier strategy ....... 27
Table 4: Factors that affect the two dimensions regarding current supplier relations.............. 28
Table 5: Summary of findings from the six case studies .............................................................. 35
Table 6: Summary of reasons for SBR ........................................................................................... 35
Table 7: HSS cost matrix for visualizing the quality costs ............................................................ 55

xi
Abbreviations BHE – Brazed Heat Exchanger BU – Business Units DOT – Delivery on Time HSS – High Speed Separation KPI – Key Performance Indicator LSU – Local Service Unit MRO – Maintenance, Repair and Operations OEM – Original Equipment Manufacturer OP – Operations Purchasing PADT – Purchasing Analysis Data Tool PC – Product Center PG – Product Group PHE – Plate Heat Exchanger PPV – Price per Variance R&D – Research and Development SBR – Supplier Base Reduction SRM – Supplier Relationship Management TCO – Total Cost of Ownership

xii

1
1 Introduction The introduction chapter will give a background to the study, motivating why the study is of
interest. The purpose and objectives will also be presented together with a discussion
regarding the scope of the study. Finally the target audience and an outline of the thesis
disposal will be presented.
1.1 Background of the study Today‟s competitive environment is driving markets to become more international and customer-oriented. When customers are demanding higher quality, wider range of products, shorter time to market and faster deliveries the producing companies are forced to keep up with these demands in order to survive (Simatupang and Sridharan, 2003; Duclos et al., 2003). Historically companies looked at their own production, trying to reduce cycle time and solving the tradeoffs between flexibility and efficiency in order to meet the new demands of more customization and shorter product life cycles (Duclos et al., 2003). In the 1990s companies started to look beyond the company boundaries on suppliers, suppliers‟ suppliers and customers to improve the customer and consumer value. This change, titled supply chain management, made companies move from managing just internally to manage across enterprises (Duclos et al., 2003). Today individual businesses do not compete as solely entities, but rather within supply chains. According to Lambert (2008) supply chains are not a chain of businesses, but a network of businesses and relationships and a successful supply chain management is focused on relationship management.
Chen and Paulraj (2004) did a thorough literature study which included over 400 articles related to supply chain management (SCM). The goal with the study was to develop theoretical constructs for supply chain management. They consolidated their relevant findings into a research framework which is depicted in figure 1.
Figure 1: Chen’s and Paulraj’s (2004, p. 121) research framework of SCM

2
Lambert (2008) emphasized the importance of relationship management and this is supported by Chen‟s and Paulraj‟s (2004) framework where buyer-supplier relationships have a central part. Supplier base reduction is one of five components in the “buyer-supplier box”. Chen and Paulraj (2004) state that in the past companies commonly contracted with a large number of suppliers and that recently there has been a significant shift from the traditional adversarial buyer-seller relationships to the use of a limited number of qualified suppliers with deeper relationships. They also conclude that supplier base reduction is a required element of contemporary supply chain management. Alfa Laval AB (referred to as Alfa Laval in this report) is a company that is looking to reduce its supplier base. Alfa Laval is a global company with manufacturing sites spread all over the world. The company has a product portfolio with a wide range of products that are based on different technologies. These technologies are heat transfer, separation and fluid handling. Alfa Laval has divided its product groups after product characteristic and manufacturing technique (for more details see section 5.1). Each manufacturing site has its own local purchasing. Consequently, unofficial sub supplier bases have been developed; each product group has its sub supplier base and each site within the product group has its own local supplier base, see figure 2. Alfa Laval created a global purchasing department in 2002 with the purpose to leverage buying power. As a result, the supplier base has been reduced since 2002 but there has not been any major projects focusing on strategically reducing the supplier base. Alfa Laval has estimated their supplier base to 2700 suppliers today, and 2200 of these are local (supplying only one manufacturing site). The large supplier base has caught Alfa Laval‟s attention and the company believes that there are benefits in reducing it.
Figure 2: Schematic figure describing sub supplier bases in Alfa Laval’s supplier base

3
1.2 Purpose and research question The purpose of this thesis is to increase the understanding of a successful supplier base reduction initiative and the activities that should be conducted prior to such a supplier base reduction initiative. This leads to the research question of this study: “How to successfully plan a supplier base reduction initiative and what aspects to consider when planning such an initiative?”
1.3 Objectives To be able to achieve the purpose the objectives of the study are:
To analyze the conditions for a supplier base reduction initiative and identify activities that should be conducted prior to a supplier base reduction initiative.
To develop a conceptual model that describes parts of purchasing that affect and are affected by supplier base reduction.
1.4 Scope of the study The focus of the study is not to develop a recipe for how to reduce the number of suppliers being used in a company, it is to elucidate the supplier base reduction concept and create an understanding of how it should be part of the overall purchasing strategy. The reason for this is that there are very limited studies that thoroughly investigate the connection between the supplier base reduction concept and other areas of purchasing. Due to the time limitation of the study the developed conceptual model will only be used to analyze one company. The fact that only one case study was conducted will affect the possibility to generalize the findings of the study and the conceptual model should not be seen as a ready to use product but as an inspiration for a company interested in reducing its supplier base. The case company is a global company that is active on many markets around the world with a wide range of products. Because of the size of the company and the time limit of the study, the case study does not include all product groups in the company (see chapter 5 for description of the case company and the product groups). Three products groups are included in the study; Plate heat exchangers (PHE), Brazed heat exchangers (BHE) and High speed separators (HSS). These product groups have been chosen since they are three of the largest (PHE and HSS are the largest and second largest product groups), together covering 47 % of the total turnover of Alfa Laval (Alfa Laval, 2010). They do also have distinct product and customer characteristic which capture the complexity Alfa Laval needs to work with regarding differing needs of product groups and manufacturing sites.
1.5 Target audience The target groups for this study are students and researchers within supply chain management. The readers of this report assume to have basic knowledge in the supply chain management field. Furthermore the report can also be of interest for employees at Alfa Laval interested in purchasing issues.

4
1.6 Disposition of the thesis
Figure 3 Disposition of the thesis
Figure 3 depicts the disposition of the thesis. A short description of each chapter is presented below. 1. Introduction This chapter will present the background of the thesis. The purpose, objectives and research question will also be presented. 2. Methodology In this chapter procedures and scientific methods used in this study will be described. Some general methodology theories will be presented with the purpose to set the used methods in a context. 3. Theoretical framework This chapter is the theoretical foundation for this study. The supplier base reduction concept will be presented together with other SBR related purchasing theories that have been identified in the initial SBR theory study and the exploratory interviews.

5
4. The conceptual model This chapter will present the conceptual model that has been developed by using the theoretical framework. It has also been influenced by the findings in the exploratory interviews. 5. Empirical data This chapter will present the case company, describing how it works with purchasing and supplier related matters. 6. Analysis of the case company, using the conceptual model This chapter will present the analysis of the empirical data. The analysis has been conducted using the conceptual model. The relevance of the findings is discussed in order to determine the relevance of the conceptual model. 7. Conclusions This chapter will return to the initial purpose of the study. A discussion on whether the purpose, objectives and research question have been fulfilled is presented. Suggestions on further research are presented and finally recommendations to the case company Alfa Laval are presented.

6

7
2 Methodology In this chapter procedures and scientific methods used in this study will be described. Some
general methodology theories will be presented with the purpose to set the used methods in
a context. Each section in this chapter starts with the method theory followed by a
clarification of what method has been used, why the method has been used and how it has
been used. In the end of the methodology chapter there is a discussion regarding the
reliability and validity of the study; how the different methods have or have not contributed to
strengthen the reliability and validity of the study.
Arbnor and Bjerke (1997) reason about creation of knowledge; how creators of knowledge are at first observers, thereafter describe and generalize what they have seen and what they are expecting in the future, and thirdly they make a prediction based on their theories which can be verified against facts. They go on explaining (Arbnor and Bjerke, 1997, p. 92):
“If a series of observations developed to verify certain predictions forces us to abandon a theory, we look for new and better theories. This is the fourth step of the old theory and the first step of a new one.”
2.1 Induction, deduction and abduction When creating knowledge there are different approaches to take and the logic between theories and empirics need to be clear. There are three approaches that are common to use when defining the research approach and the logic between theory and empirics. When the research has an inductive approach, the researcher begins with an observation and from the observation a theory is created (Arbnor and Bjerke, 1997). The fact that the research does not origins from a recognized theory does not mean that the research is unprejudiced, due to the researcher‟s preconceptions. The deductive approach starts with analyzing existing theory and a hypothesis is created based on the analyzed theory. The hypothesis is then tested empirically and is either verified or rejected. When the research starts in theory, objectivity assumes to be strengthened since the researcher can minimize the influence of his or hers preconceptions. However, there is a risk that the theory that is the base of the deductive approach becomes controlling (Patel and Davidson, 2003). The researcher might get caught on an idea in the previous theory that hinders him or her to take in other views on the some issue. One must remember that researchers often have different opinions on the same problem and that one single truth might not exist. This creates problem regarding to the objectivity of the study and can also limit the innovation of creating new theory. A third approach is abduction, which is a combination of deduction and induction. The logic behind this third approach is that most studies are neither a total inductive or deductive study, they are a combination of both (Kovács and Spenc, 2005). Abduction starts with a real life observation followed by theory, back to real life and finally the findings becomes new theory. However it is not entirely true that the starting point is in the real world, because the researcher starts with some prior theory knowledge and assumptions. Kovács and Spence (2005, p. 137) argues
“...abductive reasoning starts at the point at which an observation in the empirical research does not match these prior theories (see, for example, Dubois and Gadde, 2002; Kirkeby, 1990). In this case, the theoretical framework used prior to this otherwise falsifying (Popper, 1959) observation is not able to explain the anomaly of the observation itself (Andreewsky and Bourcier, 2000; Danermark, 2001). Therefore, a creative iterative process (Taylor et al., 2002; Wigblad, 2003) of “theory matching” or “systematic

8
combining” starts (Dubois and Gadde, 2002) in an attempt to find a new matching framework or to extend the theory used prior to this observation (Andreewsky and Bourcier, 2000). The empirical starting point with an anomaly in the observation should not lead to the notion that an abductive research process can only start out with a surprise.”
The illustration (Kovács and Spence, 2005) presented in figure 4 describes the abductive process.
Figure 4: Illustration of the abductive approach (Kovács and Spence, 2005, p. 139)
In this study an abductive approach was taken which followed Kovács and Spence (2005) illustration (see figure 4). The abductive approach was natural to take since the issues regarding how companies should prepare for a SBR initiative had no direct answers in the literature. After the first review of the SBR literature the primary areas of interest were identified. The next step was to conduct a broader literature study and identify the logic between different areas within the purchasing field and their connection to SBR. Parallel to the literature study exploratory interviews were conducted to identify additional relevant areas in the purchasing literature. The “model-approach” helped to structure the findings from the literature study and the conceptual model itself became the new theory, showing how the different areas in the purchasing literature are connected to SBR. In order to ensure the relevance of the created conceptual model it had to be tested in practice. The relevance of the conceptual model was then evaluated with the help of the findings in the case study. The leaps back and forth between theory and reality enabled a constant development of the model, ensuring that the connection to practice did not get lost. This working procedure with first identifying gaps in prior literature, then trying to fill these gaps with new theory by elaborating with prior theories and new empirical findings and finally test these new theories in practice is a clear abductive approach.
2.2 Methodological approach Every researcher has ultimate assumptions of the world that makes up a paradigm (Arbnor and Bjerke, 1997). A paradigm consists of a conception of reality, a conception of science, a scientific ideal and has an ethical and aesthetical aspect. The paradigm will impact the methodological approach chosen by the researcher. The methodological approach will then impact what is called the operative paradigm which consists of methodical procedure and methodics (see figure 5). The methodical procedure denotes how a researcher uses a given technique in a methodological approach (Arbnor and Bjerke, 1997). How the researcher incorporates these techniques into a study plan and how the study is conducted is what Arbnor and Bjerke (1997) call methodics.

9
Figure 5: Relation between methodological approach, operative paradigm and the study are. (After Arbnor
and Bjerke, 1997)
According to Arbnor and Bjerke (1997) there are three methodological approaches for business research; the analytical approach, the actors approach and the systems approach. In the analytical approach the relationship between cause and effect is essential. The reality is assumed to be the sum of individual parts. The goal of the approach is to describe objective reality as fully as possible. The actors approach assumes that there is no objective reality and that reality only exists as a social construction (the realities of interest to social science) and can never be independent of the observer. Arbnor and Bjerke (1997, p. 111) define a system as:”a set of components and the relations among them”. The whole differs from the sum of the parts is the fundamental assumption that the systems approach is based upon. This means that not only the individual part but also the relations between parts are considered. Through synergy will these relations have a plus or minus effect on the whole. The systems approach assumes that reality is objectively accessible (Arbnor and Bjerke, 1997). Since the systems approach follows the assumption that in reality the whole is always different from the sum of the parts, one system can never be exactly the same as another. To be able to use knowledge about similar systems analogies is a prerequisite of the study (Arbnor and Bjerke, 1997). There are two perspectives on how to describe a system; the structural perspective and the processual perspective. If the states of the real system are described static (a snapshoot of reality) the structural perspective is used. If on the other hand the flow of different components and relations are described over time the system is seen from a processual perspective. Many researchers/consultants/investigators are of the opinion that it is hard to distinguish between structures and processes in real systems (Arbnor and Bjerke, 1997). The systems approach can be used in many ways. A systems analysis means to describe the system and the internal and external factors that influence it. The purpose is not to change the system but to understand it. The system construction means to depict the real system and use it as a base for constructing a new system. The new system could be a development of another existing real system that has been depicted (Arbnor and Bjerke, 1997). To ensure validity when using the systems approach a common technique is to reflect the real system from as many angles as possible, be in the system as long and as often as possible and study as much secondary data as possible. For example when investigating the culture in an organization one could observe the organization from within, interview personnel in different hierarchical levels and study standard documents to ensure validity (Arbnor and Bjerke, 1997).

10
The major task in this study was to map the areas of purchasing that relate to SBR and understand how these areas affect and are affected by SBR. Thus, the system approach was considered as ideal for the study, because with the system approach the different areas could be mapped as well as their connection to the SBR. Two systems were considered; one in theory and one in practice. A system model for theory was developed by analyzing articles addressing supplier base reduction in specific (see figure 6) and then moving further to new identified areas in purchasing theory related to the supplier base reduction concept. By analyzing the relation between the identified areas and SBR a system model for the investigated purchasing theory was developed (illustrated in figure 6).
Figure 6: System model for the investigated purchasing theory
The first system model was used as point of reference when defining the second system model. The second system model was the purchasing function at the case company and its relations to the other functions at the case company (see figure 7). The R&D function was partly included in the system since purchasing theory states that there are gains in having a close collaboration between R&D and purchasing (Van Weele, 2005; Paulraj and Chen, 2004). The areas identified in theory were investigated in practice and new cause and effect-relations were identified. The mapping and analysis of the second system was conducted actively during the entire study, with the authors being located at Alfa Laval during the whole study and interacting with the personnel at Alfa Laval in their day to day business. The two system models together gave a holistic view of the cause and effect relations of the phenomenon.

11
Figure 7: System model for the purchasing function at the case company
2.3 Qualitative and quantitative research The nature of the study determines if a qualitative or a quantitative study is appropriate. In quantitative research the object of the study can be described and measured numerical (Björklund and Paulsson, 2003). The analysis of the data is often done after the data is collected (Patel and Davidson, 2003). A limitation of the quantitative study is that everything cannot be described numerically, e.g. the consequences of cultural differences in a buyer-supplier relation. Qualitative research is used when a deeper understanding in a specific topic or situation is needed (Björklund and Paulsson, 2003). In qualitative research the study of the phenomenon is more subjective, the reality should be interpreted rather than measured. The data gathering is consisting of interviews and observations, and the data can be interpreted during the data gathering. This gives for example the researcher a possibility to change the approach or order of the questions depending on reactions of the interviewee during an interview (Merriam, 1994).
2.4 Case study When encountering problem areas within research where why- and how-questions are needed to be asked in order to proceed in the work, and where the environment cannot be controlled, the research strategy case study is the preferred method to use (Yin, 2003). Like other research strategies the case study aims to investigate an empirical topic by using a predefined set of activities (Yin, 2003). The case study tends to have a set boundary like an industry, a company or a particular department within a company (Ellram, 1996). Below is a definition of what a case study is (Yin, 2003, p 13-14):

12
1. “A case study is an empirical inquiry that
Investigates a contemporary phenomenon within its real-life context, especially when
The boundaries between phenomenon and context are not clearly evident
2. The case study inquiry
Copes with the technically distinctive situation in which there will be many more variables of interest than data points, and as one result
Relies on multiple sources of evidence, with data needing to converge in a triangulating fashion, and as another result
Benefits from the prior development of theoretical propositions to guide data collection and analysis”
The development of a thorough theoretical framework in the design phase of a case study is essential. The researcher needs to have a “map” of what is being studied, which embodies theoretical propositions. The “map” will guide the researcher towards collecting the right data and also analyze it in an appropriate way (Yin, 2003). After the first quick scan in SBR literature the research question “How to successfully plan a supplier base reduction initiative and what aspects to consider when planning such an initiative?” was formulated. The problem was clearly of qualitative nature; the behavior of individuals, the organizational structure, internal and external processes and impact of culture were aspects that had to be investigated in order to answer the research question and they were all subjects that called for a qualitative approach with interviews and observations as primary sources of data. As mentioned the system approach was considered as the proper approach in order to capture the relations of the areas connected to SBR both in theory and in practice. The nature of the problem, the research question (that in great extent is derived from the nature of the problem) and the systems approach pointed towards using the case study as the proper research strategy. In consensus with Yin (2003) a thorough theoretical framework was developed in the design phase of the case study. This framework was later used to identify what data that should be collected at the case company. The literature procedure is described in detail in the data collection section 2.5. Two literature reviews were conducted, the first was done in order to narrow down the problem area (as figure 8 illustrates) and the second one to develop the conceptual model. The case study was used to capture empirical data and to test and develop the model further. The main method for capturing primary data was interviews which were complemented by observations that were continuously conducted during the study.
2.5 Data collection Arbnor and Bjerke (1997) describe, in their book Methodology for Creating Business Knowledge, different data collection techniques. The selection of appropriate techniques is dependent on which methodical approach has been taken (actors approach, system approach or analytical approach). This is due to the complexity of the environment, the active choice on how to look at the environment and that the type of result wanted is differing between approaches. Arbnor and Bjerke (1997) describe that there are two main categories of data collection techniques; using material previously collected (secondary data) and collecting new data (primary information). The techniques for primary data are (Arbor and

13
Bjerke, 1997); direct observations, interviews (including surveys/questionnaires) and experiments. They explain how to use specific data collection techniques in the system approach as follows (Arbnor and Bjerke, 1997, p. 228):
“Secondary material. Because the systems approach claims that it has to deal with a more complicated reality than the analytical approach, and that real systems are often relatively different from each other, secondary material concerning the environment of the real system being studied, and, above all, concerning other real systems, is used with great care. Secondary material within the real system being studied (minutes, statistics, documents, etc.), however, material that may very well reflect both the environment and other real systems, is used extensively (this source of information is also common in the two other approaches).”
They go on explaining that interviews are extensively used in the system approach, usually in the form of personal interviews and rarely by using elaborated questionnaires. The interviews are frequently combined with direct observation. Yin (2009) writes about the five major research methods; experiment, survey, archival, analysis, history and case study. He describes three conditions affecting the choice of methods; the type of research question, the extent of control an investigator has over actual behaviour events and the degree of focus on contemporary as opposed to historical events. The relation between the methods and the three conditions are described in table 1 (Yin, 2009, p. 8).
Table 1: The relations between Methods and certain conditions in research (Yin, 2009, p. 8)
Method Form of research question
Requires Control of Behavior Events?
Focuses on Contemporary Events?
Experiment how, why? yes yes
Survey who, what, where, how many, how much?
no yes
Archival Analysis
who, what, where, how many, how much?
no yes/no
History how, why? no no
Case Study how, why? no yes
Researchers (Arbnor and Bjerke, 1997; Yin, 2009) have different views on the hierarchical level and definition of the data collection methods/techniques. Yin (2009) for example has case study and survey at the same level and interviews subordinated to these methods. Arbnor and Bjerke (1997) have interviews at the same level as experiments and surveys subordinated to interviews. This is different ways to look at research and research methods. But regardless of which of these approaches one takes it is clear that it is the research question together with the environment of the study that determines the data needed and how it should be collected.

14
Data was collected from a combination of secondary and primary sources including literature review, desk studies, interviews, and observations. Each part of the data collection is further explained in details in sections 2.5.1 and 2.5.2. The data collection structure of the study is in line with the usage of the systems approach and the case study method. The first literature review was both used to create the conceptual model and to get in-depth knowledge of the subject in order to collect and analyze the proper data.
2.5.1 Primary data According to Arbnor and Bjerke (1997) there are four techniques to gather primary data:
Experiments
Interviews
Surveys
Direct observations When preparing for an interview one must decide an appropriate structure on the interview. There are degrees of structure, from fully structured where all the questions comes in a specific order and the interviewee answers with yes or no to unstructured interviews where the interview is more of a discussion around a certain topic (Merriam, 1994). According to Yin (2003) interviews is one of the most important sources when conducting case study research. Semi structured interviews is a useful tool for data collection in a qualitative case study (Yin, 2003). This is because when doing a qualitative case study the researcher wants to understand how the interviewee sees things, not to get him or her to see the world through the researcher‟s eyes. Semi structured interview is a way to steer the interview towards certain issues and at the same time give the interviewee room for his or hers associations (Merriam, 1994). In the primary data gathering phase four different sites were visited at the case company. The logic behind visiting these four sites has been partly geographical but mainly because they are all primary sites in each of their product group which makes them appropriate to be used as representative sites for each product group. Further these four sites covers the majority of the central global purchasing function in the case company which is the central function in this study. The usage of interviews in this study The study‟s qualitative nature and complex environment called for interviews as the main source for primary data. The main purpose of the interviews was to understand the structure of the purchasing organization, how the daily work in Alfa Laval‟s organization were affected by the supplier base and how it affected the supplier base. Alfa Laval‟s organization was hard to understand by just looking at the organization chart, therefore the interviews were useful to understand the communication between units and how their processes were connected. To get a first overview of Alfa Laval‟s concerns regarding SBR and their expectations of the study the first three interviews were conducted in an unstructured manner. The interviewee in these initial interviews was the contact person at Alfa Laval, a senior project manager at the Operations Development department working with purchasing. The rest of the interviews were conducted in a semi structured manner and were recorded (this was approved by each of the interviewee). The interviews became more structure as the study progressed, the reason for this were that in the beginning the main purpose of the interviews was to identify the interesting issues in the organization which called for a more unstructured manner. When these issues were identified the interviews became more structured in order to capture as many aspects as possible concerning the identified issues.

15
The literature study and the findings on Alfa Laval‟s intranet were analyzed with the purpose to identify areas to investigate empirically. Personnel at Alfa Laval‟s organization that could be of interest to interview on the subject were identified. With a semi structure interview the interviews were steered towards the areas of interest without controlling the interviewee‟s associations. By doing this the authors avoided to push the interviewee giving the answers they were “looking for”. After each interview the authors discussed what had been said and the recording was transcribed. The findings in the literature study and at Alfa Laval‟s intranet together with the person‟s profile (the interview guide was adapted to the person‟s specific position) was the base when the interview guide was written. Two types of questions were developed in the creation of the interview guides; generic questions that were used in all interviews and addressed questions that were formulated with a certain person or position in mind. With the generic questions different persons with different positions view on the same matter could be captured. By doing this the reliability was strengthen due to that the later analysis was based on multiple sources on each matter. With the addressed questions specific question could be formulated to capture a phenomenon that only a certain person could answer or that the interviewee had a position that made his or hers view on the matter especially interesting. The usage of observations in this study The authors were located at Alfa Laval‟s headquarter in Lund during the entire study. This gave the opportunity to make daily observations of the work within the organization. Examples of this are observing and participating in conversations during lunch, in the corridor and in the coffee room.
2.5.2 Secondary data Secondary data is often written material, e.g. books, articles, photographs and recordings, which has been produced in other purposes than the purpose in the actual study (Björklund and Paulsson, 2003). When analyzing secondary data it is important to have a critically approach and understand in what purpose the data has been created and under which circumstances (Patlel and Davidson, 2003). Reviewing previously written research within the subject of the study is referred to as a literature study (Björklund and Paulsson, 2003). Hart (1998, p1) argues why the literature study is important:
“Without it you will not acquire an understanding of your topic, of what has already been done on it, how it has been researched, and what the key issues are. In your written project you will be expected to show that you understand previous research on your topic. This amounts to showing that you have understood the main theories in the subject area and how they have been applied and developed, as well as the main criticisms that have been made of work on the topic.”
A quick literature study of the researched subject can help formulating the problem and the purpose of the study (Patel and Davidson, 2003). When over viewing the main area, smaller areas within the main area can be identified. The smaller areas, e.g. key factors and concepts, narrows down the scope of the study to the issues that are of actual interest. The areas of interest can successively be identified and the problem can be formulated connecting to the identified sub areas. These areas can later be used to categorize data and this helps to structure the data collection, making it easier to identify the important parts in each document (the process is illustrated in figure 8) (Patel and Davidson, 2003; Bell, 2005).

16
Figure 8: Illustration of how the main area can be narrowed down to the problem formulation with the help
of a first quick literature study.
Literature Study The overall purpose of the literature study was, accordingly to Hart (1998), to get a broad understanding of the subject and see what had been done previously. The quality of the literature has been secured by primarily using articles from peer reviewed journals and books. The purpose with the first small literature review was to get an overview of the SBR field and narrow it down in order to formulate the research question (according to figure 8). The first literature review was conducted by searching for published articles directly addressing the SBR concept. Areas concerning a SBR initiative were identified as well as gaps in previous research. “Within” the identified gap the research question was formulated and the identified areas were used as a reference point for the second, more comprehensive literature study. The second literature review included both published articles and books. The purpose was to get in-depth knowledge of the areas identified in the first literature review, analyze it and develop a conceptual model. Key-words found in the first literature review were used to structure the search and by following up references in the literature new relevant areas were identified. The observations and the exploratory interviews conducted at the case company were also used to find new tracks in the literature. The following key words were used in the literature search; supplier management, supplier base management, supplier auditing, supplier selection, leaner supply base, supplier base, supply base, vendor management, portfolio management, supplier portfolio management, supply portfolio management, supplier portfolio, decentralized purchasing, purchasing synergy, pooling, supplier relationship management, spend analysis, relationship management, total cost of ownership, supplier relationship, supplier strategy supplier location, supplier evaluation, purchasing strategy and sourcing strategy.

17
Desk Study (case company intranet) The case company‟s intranet was used to get an overview of the organizational structure and as a source for documents describing Alfa Laval‟s strategies, action plans and operations.
2.6 Validity and reliability When conducting research it is important to have a critical view on the design of the method in order to determine the validity and credibility of the findings (Bell, 2005). Validity, reliability and objectiveness are three measurements on the credibility of a research project (Björklund and Paulsson, 2003). There are two kinds of validity, internal validity and external validity. Internal validity describes if the researcher actually investigates the issues that were purposed to investigate e.g. if you measure the level of crimes in a neighborhood by looking at statistics from the police the internal validity can be low because there are likely a numerous of crimes that have not been reported (Merriam, 1994; Yin, 2003). External validity describes if findings in the study can be applicable in other cases, i.e. if it is possible to generalize the findings (Merriam, 1994; Yin, 2003). Reliability refers to the extent results can be repeated. A well motivated choice of method is a prerequisite for a high reliability (Merriam, 1994; Yin, 2003). The primary and overall effort to ensure validity and reliability of this study was to actively develop a rigorous research design with support in the methodology theory. Without a proper choice of research methods and describing the chosen methods the reliability is close to zero. If the study consist of random activities and these activities are not described anywhere it is obvious that it is impossible to repeat the result of the study. The connection between a rigorous design and the validity is not as clear. But it is not hard to be convinced that by having awareness of the methodology theories and make active choices among the available methods the research can be steered towards the desired objective in a structured way. By doing active choices, regarding used methods, it is more likely that the issues that are intended to be investigated also are the issues that will be investigated. This was accomplished by studying different methodologies in theory before choosing the proper methods. The study could then be executed in a structured way with active choices of methods along the way. To ensure internal validity the authors were located at Alfa Laval‟s headquarter, in the same hallway as the global purchasing function, during the entire study, thus getting a better understanding of the organization. Arbnor and Bjerke (1997) argues that describing the system from as many angles as possible, being in the system as often as possible and studying as much secondary data as possible contributes to a higher validity. Alfa Laval‟s purchasing function is the second system of the study (the empirical system) and the authors were situated in this system during the entire study and thereby contributing to the validity of the study (Arbnor and Bjerke, 1997). The findings in the literature study and on the case company‟s intranet led to the areas of interest in the data gathering. These areas were one of the two aspects when selecting interviewees and the other aspect was the interviewees‟ profiles. First it was clarified what information was desired and from whom it was appropriate to collect this information. Aspects that were considered when selecting the interviewees were; the position (geographical location, responsibilities, report line and work tasks), background (education and earlier positions) and what kind of projects the person is or has been involved in. These aspects were the base for the interviewee selection process. By doing this the interviews became a structured way to collect the desired data and by having a rigorous interviewee selection process it was ensured that the desired data actually could be collected from the interviewee and by this the validity was strengthen. The findings in interviews themselves also led to new issues that were of interest in the following interviews. The fact that people

18
have different agendas, depending on their stand on a SBR initiative, and can try to influence the authors was considered. Material found on the intranet was also used with great care. What is done in practice and documents describing processes and operations are often two different things, therefore findings on the intranet were never taken as truths. Three types of data collection techniques were used in the case study; interviews, observations and documents from the case company‟s intranet. When it was possible to collect data concerning the same issues with more than one of the three techniques, for example roles and responsibilities which can be found on the intranet (how it is supposed to be), with observation and interviews (how it is), the data was triangulated to increase the internal validity of the study. The external validity is hard to verify in a study with a single case. However the conceptual model was developed from previous theory and logical reasoning and was not subjected to the case company. The thorough review of previous findings regarding SBR initiatives partly compensates for the use of one case study. But to fully verify the external validity the conceptual model has to be tested repeatedly at different companies. Objectivity was considered throughout the entire report. During the literature study the authors were careful not to be biased looking for information that supported their initial thoughts on the subject. This was accomplished by the use of the keywords in the literature study. By identifying keywords in the SBR literature and using them in the second literature review, the authors forced themselves to look in to these specific matters. The objectivity was also considered when constructing the interview guides, avoiding formulating questions that reflected the authors view on the aspect. In the analysis phase the authors challenged their own conclusions, each of them had his view on the collected data. These different views were discussed and mutual conclusions were reached. This procedure is a type of triangulation where multiple researchers are involved to verify the results.

19

20
3 Theoretical framework The theoretical framework starts with an introduction to the supplier base reduction concept
followed by areas connected to supplier base reduction. In the end of this chapter earlier
empirical findings from previous case studies of supplier base reduction will be presented.
The theoretical framework will act as the foundation of the conceptual model presented in
chapter 4.
Supplier base reduction is a tool for supplier management. Ogden and Carter (2008, p.6) define SBR as: “..supply base reduction is defined as the process of and activities associated with reducing the number of suppliers that an organization utilizes or actively manages.” SBR is often viewed as a prerequisite for advanced sourcing strategies such as supplier development (Hahn et al., 1990; Hartley and Choi, 1996; Krause, 1997) and supplier integration in product development activities (Koufteros et al., 2007). The rationale behind this is that resources can be freed and reallocated to more effective usage when the number of suppliers is reduced (Ogden and Carter 2008). A reduced supplier base will also lead to the possibility to reward substantial business to a limited number of suppliers (Downlatshahi, 2000). By doing this price reductions can be achieved since prices can be negotiated based on economics of scale (Cousins, 1999). This is however a short-term approach which can backfire, if the supplier relations is not managed properly, when the supplier realizes he is the only one supplying a given product or service and starts pressuring the buying company (Cousins, 1999). By reducing their supplier base firms will be able to reduce their transaction costs since buying from fewer suppliers means less administration (Choi and Krause, 2006). But there are implications to focus on the transaction cost. Cousins (1999) claims that organizations, when focusing on administrative transaction cost, forget the managerial and strategic exposure costs. An example of managerial cost is the new purchasing competences (competence to manage closer buyer-supplier relationships) needed when handling a reduced supply base. The strategic exposure cost refers to the strategic problem whether to use single, dual or multiple sources. Cousins (1999), also concludes that Parker and Hartley (1997) as well as Cox (1997) agree on the fact that purchasing organizations need to know when to use either a competitive or collaborative strategy. It is clear that the decisions that are taken in a SBR project have to derive from the purchasing strategy and at the same time the purchasing strategy, as all functional strategies, must derive from the overall corporate strategy (Van Weele 2005). The purchasing strategy‟s subordinated strategies, e.g. supplier selection strategy and sourcing strategy, must in turn be derived from the purchasing strategy. By doing this the subordinated strategies will support the overall corporate strategy (Nolleta, Poncea and Campbellb, 2005). Since the supplier base has an immediate impact on purchasing and its subordinated functions, a SBR initiative will affect these areas as well as all other functions affected by the supplier performance (e.g. manufacturing and R&D). The logic in the theory chapter is that a SBR initiative concerns all the purchasing processes. The affected processes together with structure of the purchasing organization are described in order to thoroughly map the cause and effect between them and the SBR concept. Further some previous findings regarding SBR and tools to use in a SBR project are presented.

21
3.1 Purchasing organization How a company organizes their purchasing is highly dependent on the characteristics of the company and the characteristics of the products bought (Van Weele, 2005, Chen, 2004). How purchasing is organized will have a direct effect on how complex it is to capture synergy and avoid sub optimization. Since SBR implies an optimization of a company‟s supplier base and to capture synergy opportunities, the way purchasing is organized affects the complexity of a SBR initiative.
3.1.1 Centralized A company with a centralized purchasing structure consolidates the purchasing needs from all business units and handles it centrally. The strategic and tactical tasks like product specifications, supplier selection and contract negotiations are often conducted by the central purchasing department and the operational activities like daily call offs are handled by the business units (Van Weele, 2005). By having a centralized purchasing organization better conditions can be negotiated (by referring to the economics of scale for the supplier) (Matthijssens and Faes, 1996). Centralized purchasing will also support standardization efforts since decisions about what and where to buy are decided by one unit (Van Weele, 2005). Smart and Dudas (2007) compile a few examples of cases were firms have centralized parts or all of their purchasing and by that reducing their supply base; a centralization of MRO buy lead to a reduction of the supply base by 90 % for Ford Motor Co. (Anonymous, 1990), Motorola moved to centralized purchasing and reduced its supply base from 4200 to 1155 suppliers (Smock, 2003), Otis reduced its suppliers from 4600 to 2200 when centralizing their purchasing, the company was also able to standardize the purchasing processes at all 35 manufacturing plants (Avery, 2000).
3.1.2 Decentralized In a company with a decentralized purchasing structure every business unit is responsible for their own purchasing. A disadvantage of the decentralized purchasing structure is that different business units, even though they belong to the same company, might negotiate with the same supplier and arrive at different purchasing conditions (Van Weele, 2005). An advantage is the possibility to be close to the user and the local supplier market which can lead to shorter delivery times, better and faster service and goodwill to the local community (Matthijssens and Faes, 1996). A decentralized structure is the favorable choice for companies divided in business units where every business unit handles unique products (Van Weele 2005). However a common apprehension is that each business unit finds itself as unique with special needs, and cannot be subordinated to certain strategies. The reason for this is often politics, people fighting for power, and is not connected to problems with special needs (Nelson, Moody, Stegner and Jonathan, 2005).
3.1.3 Degree of centralization/decentralization The tactical and strategic tasks can in some organizations be conducted both central and by the business units. In these cases the central purchasing department can for example develop procedures and guidelines, collect and distribute business intelligence, solve coordination issues and handle the human resources management (HRM) of purchasing and supply (Van Weele, 2005). Arnold (1999) developed a global sourcing organization model with the purpose to act as a tool to guideline organizations in how to build their purchasing structure. The analysis starts with two matrixes, one that determines the degree of internationalization and one that determines the degree of centralization of the analyzed company. The two matrixes are then combined in a new matrix, see figure 9. By using case studies of German manufacturing companies Arnold (1999) then found three different models for how to organize purchasing; the outsourcing model, the coordination model and the central purchasing model, see figure 9. The outsourcing model handles the

22
case were the company is highly international but decentralized. To be able to source globally the procurement is “outsourced” between business units depending on their geographical location. When the company is both highly international and centralized a coordination model can be used, this implies that the business units buy by their own but they are also committed to participate in an international buying committee where purchasing can be coordinated to leverage synergies as economics of scale. The central purchasing model can be used when the company is highly centralized but not that internationalized. This model is built around a strong central purchasing department that handles at least supplier management and contracts.
Figure 9: Organization of global sourcing: ways towards an optimal degree (Arnold, 1999, p. 170)
3.2 Purchasing collaboration concepts As already concluded, the degree of purchasing decentralization will directly impact the complexity of a SBR initiative. A much decentralized purchasing organization will likely drive unique supplier bases for isolated sites, non-standardized processes and a wide range of bought components. To succeed with a SBR initiative it is crucial to take a company-wide grip and perspective to find opportunities for streamlining and to be able to take the correct decisions. This leads to the fact that collaboration between sites is a cornerstone if decentralized companies want to successfully reduce their supplier base. Pooling is the starting form of purchasing collaboration, succeed by the capturing of all purchasing synergy.
3.2.1 Pooling Van Weele (2005, p. 236) defines the concept of pooling as: “efforts aimed at combining common material requirements among two or more operating units with the objective to improve the bargain leverage of the company in order to reduce overall materials costs and/or to improve the services obtained from outside suppliers”. Smart and Dudas (2007)
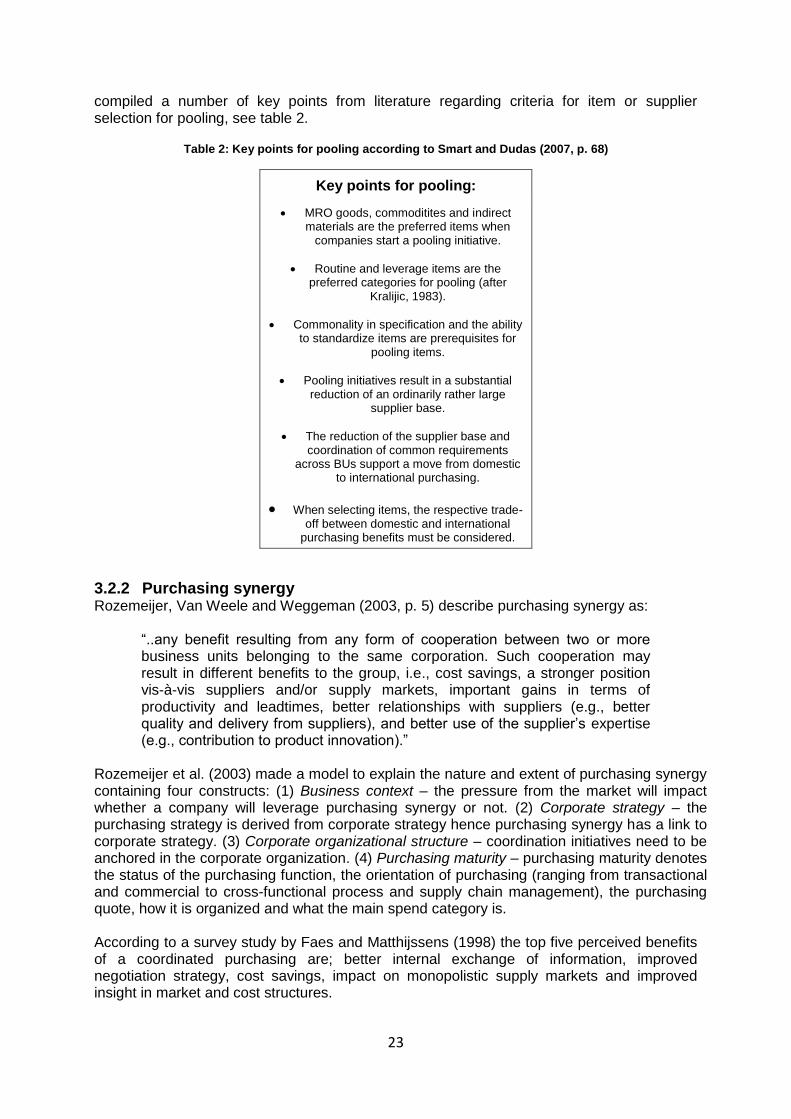
23
compiled a number of key points from literature regarding criteria for item or supplier selection for pooling, see table 2.
Table 2: Key points for pooling according to Smart and Dudas (2007, p. 68)
Key points for pooling:
MRO goods, commoditites and indirect materials are the preferred items when
companies start a pooling initiative.
Routine and leverage items are the preferred categories for pooling (after
Kralijic, 1983).
Commonality in specification and the ability to standardize items are prerequisites for
pooling items.
Pooling initiatives result in a substantial reduction of an ordinarily rather large
supplier base.
The reduction of the supplier base and coordination of common requirements
across BUs support a move from domestic to international purchasing.
When selecting items, the respective trade-off between domestic and international
purchasing benefits must be considered.
3.2.2 Purchasing synergy Rozemeijer, Van Weele and Weggeman (2003, p. 5) describe purchasing synergy as:
“..any benefit resulting from any form of cooperation between two or more business units belonging to the same corporation. Such cooperation may result in different benefits to the group, i.e., cost savings, a stronger position vis-à-vis suppliers and/or supply markets, important gains in terms of productivity and leadtimes, better relationships with suppliers (e.g., better quality and delivery from suppliers), and better use of the supplier‟s expertise (e.g., contribution to product innovation).”
Rozemeijer et al. (2003) made a model to explain the nature and extent of purchasing synergy containing four constructs: (1) Business context – the pressure from the market will impact whether a company will leverage purchasing synergy or not. (2) Corporate strategy – the purchasing strategy is derived from corporate strategy hence purchasing synergy has a link to corporate strategy. (3) Corporate organizational structure – coordination initiatives need to be anchored in the corporate organization. (4) Purchasing maturity – purchasing maturity denotes the status of the purchasing function, the orientation of purchasing (ranging from transactional and commercial to cross-functional process and supply chain management), the purchasing quote, how it is organized and what the main spend category is. According to a survey study by Faes and Matthijssens (1998) the top five perceived benefits of a coordinated purchasing are; better internal exchange of information, improved negotiation strategy, cost savings, impact on monopolistic supply markets and improved insight in market and cost structures.

24
Faes, Matthyssens and Vandenbemp (2000) studied 20 companies that had been involved in efforts capturing purchasing synergy. In their literature review preceding the empirical findings they conclude that global purchasing synergies can be divided into three categories; economies of information and learning – sharing all available information, economies of process – a common way of working to enable benchmarking and collaboration and economies of scale – pooling of volumes. One of the key points from the study was; coordination is built step by step, building confidence and supplier relations. Faes et al. (2000) recommend that a coordination project should be done step by step and that a coordination strategy is a gradual process. One important part is to find a “good example” early to facilitate the implementation, Faes et al. (2000, p. 549) state “Out of our analysis, we must conclude that choosing a first coordination project is a core issue for the corporate purchasing staff wanting to realize purchasing synergy”. This is also supported by Kotter (1996) in step six of his eight step framework for change which states that the organization should plan for short term gains and make them visible. To be able to succeed the responsible coordinators of a synergy project need to sell the concept and make advantages visible to the sites. Once on board the sites also need to stay motivated even though they might lose saying in their purchasing decisions. In the successful cases that Faes et al. (2000) studied this was done by involving the sites in negotiations and keeping them updated on market information. The importance of involving business management and local purchasing management is also supported by Rozemeijer et al. (2003). It is very important that no sites go by its own as this would undermine the effort to work as a united unit. Faes et al. (2000, p. 550) found that a strong “corporate identity” was stimulated by “(1) stimulating strong management support at headquarter and affiliate level for the coordination effort, (2) discussing openly negative consequences when somebody might want to go it alone, and (3) reacting immediately when this is the case”.
3.3 Supplier Relationship Management (SRM) SRM is about how to manage different kind of supplier relationships which include how to obtain new, how to evaluate and manage current and how to dissolute non-satisfactory buyer-supplier relationships (Moeller, Fassnacht and Klose, 2006). SBR is about choosing the right suppliers and to be able to do that it is import to know the strategic importance of the purchased product, the supplier market situation, relationship with current suppliers, the wanted relationship with suppliers and the performance of current suppliers.
3.3.1 Supplier relationships Relationships between actors in a supply chain, which imply both companies and the individuals working in them, can be characterized by three dimensions that comprise the substance of the relationships; Actor bonds, activity links and resource ties (Ford et al., 2001). The actor bonds are how firms are related to each other in a supply chain, ranging from supplier to customer. The activity links are the links between internal processes of two companies in a supply chain. Resources as design skills and production facilities will not create any value until they are activated through interaction with another company. The resource ties are the links that are created when resources from two companies interact (Ford et al., 2001). Cox et al. (2005) distinguish between two types of relationships, arms-length and collaborative. The arms-length relationship involves a low level of contact between the buyer and the supplier. Gains from the trade (additional value), in this type of relationship, for the

25
buying company are only created by the utility of the exchanged basic product or service and for the supplying company to what cost it can produce that product or service. The collaborative relationship is characterized by high levels of contact. In collaborative relationships, additional value is created by deploying non-fungible investments (investments that may not be refunded) by both parties (Cox et al., 2005). Additional value can be achieved in two ways in a collaborative buyer-supplier relationship; by altering the product to add extra value for the buyer (increased sales or lowered cost (Gadde and Snehota, 2000)) or for the supplier (reducing the cost of production for the supplier)(Cox et al., 2005). Gadde and Snehota (2000, p. 306) describe why it can be a problem to see a close relationship as a superior solution for making the most out of supplier relationships, they argue: “..the most critical element of supply strategy is a company‟s capacity to handle various types of supplier relationships.” Cox et al. (2005, p. 28) support this idea: “It is now being accepted that collaboration is not a cure-all for managers looking for new solutions to their old supply problems. Rather it is a technique that works well when selectively applied”. Gadde and Snehota (2000) argue that every supply management decision involve some sort of cost and are expected to yield a return. For arms-length relationships an investment can be the time it takes to scan the supply market looking for new suppliers, negotiate the contract and monitor compliance (Cox et al., 2005). The return will be a contract with better agreements. The cost and return of investments for collaborative relationships are mentioned above. Cox et al. (2005) added to the findings of Gadde and Snehota (2000) by introducing risk and power balance. Both the cost and the benefit side of a relationship involve risk, for example might time invested in searching the supply market yield no return and the cost reduction in a collaborative effort might end up much lower than original calculated. When looking at the cost and return of investment the power balance between the buying and the supplying firm needs to be taken in consideration. According to Cox et al. (2005, p. 32) the power balance will: “Power it is said, determines (a) which side assumes what proportion of the up-front risk in a relationship and (b) which side obtains the majority of the subsequent gains”. Supplier base reduction is about eliminating suppliers from the current supplier base. This implies the ending of buyer-supplier relationships with some suppliers. Giller and Matear (2001) describe such ending as a state where no resources are being transferred between actors. Alajoutsijärvi et al. (2000) propose two kinds of exits strategies, indirect and direct. The direct strategy denotes telling the supplier upfront about the exit. This usually initiates the dissolution stage where the resource ties between the companies are weakened when the news about the dissolution is communicated internally by the supplier‟s management (Halinen and Tähtinen, 2002). The indirect exit can be either a silent or a disguised exit (Alojoutsijärvi et al., 2000). The disguised exit mean hiding the real intentions and changing the relationship conditions in way that makes the supplier want to end the relationship. The silent exit is an exit where the ending of the relationship is not directly communicated by the buyer. This is often associated with some sort of major disagreement letting the actors have some sort of anticipation of the ending (Alojoutsijärvi et al., 2000).
3.3.2 Purchasing portfolio Purchasing portfolio models have in the last years been given a great deal of attention from the academic and business world (Dubois and Pedersen 2002). Van Weele (2005) argues that a purchasing portfolio model is preferred when creating a commodity strategy. The first comprehensive portfolio model for purchasing was created by Kraljic in 1983 (Gelderman and Van Weele 2005). Kraljics portfolio model is based upon two dimensions; financial impact of the purchase and supply risk. By the two dimensions the products are divided into four groups; routine products, leverage products, bottleneck products and

26
strategic products. Examples of factors that affect the supply risk are; number of suppliers on the market, cost of changing supplier and competitive structure on the supply market (van Wele, 2005). The portfolio model is illustrated in fig 10 (after Van Weele, 2005).
Figure 10: Kraljic’s purchasing portfolio matrix
Each type of group requires a certain approach towards the suppliers. Routine products require efficient processing, product standardization, order volume and inventory optimization. Leverage products allow the buying company to exploit its full purchasing power, for instance through tendering, target pricing and product substitution. Bottleneck items cause significant problems and risks which should be handled by volume insurance, vendor control, security of inventories and backup plans (Geldman and Van Weele, 2005). Strategic products require close buyer-supplier collaboration and the purchasing strategy is to maintain a strategic partnership (Myung and Drake, 2010). The power balance between the buyer and supplier plays an important role from the buying company perspective when deciding upon which approach towards the supplier it should take. An aggressive approach should be taken when having a favorable power position and a more gentle if the power position favors the supplier. Kraljic (1983, p113) gives the following example:
“On items where the company plays a dominant market role and suppliers' strength is rated medium or low, a reasonably aggressive strategy ("exploit") is indicated. Because the supply risk is slight, the company has a better chance of achieving a positive profit contribution through favorable pricing and contract agreements.”
Olsen and Ellram (1997) criticize the focus on the power balance between the buyer and the supplier in Kraljic‟s paper (1983). They argue that exploiting the market with the company‟s buying power is very dangerous with today‟s rapid changes of the market conditions. Olsen and Ellram (1997) suggest a three step approach in their portfolio model. In the first step the different purchases are categorized by the four categories from the Kraljic model. However the dimensions in fig 10 are renamed to difficulty of managing the purchase situation and strategic importance of the purchase. Table 3 depicts factors that influence the two dimensions.

27
Table 3: Factors that affect the two dimensions regarding appropriate supplier strategy (after Olsen and Elram, 1997, p. 104)
Factors Influencing the Strategic Importance of the Purchase
Factors Describing the Difficulty of Managing the Purchase Situation
Competence factors
The extent to which the purchase is part of the firm's core competencies
Purchase improves knowledge of buying organization
Purchase improved technological strength of buying organization
Product characteristics
Novelty
Complexity
Economic factors
Volume or dollar value of purchases
The extent to which the purchase is part of a final product with a great value added
The extent to which the purchase is part of a final product with a good profitability
Criticality of the purchase to get leverage with the supplier for other buys
Supply market characteristics
Suppliers' power
Suppliers' technical and commercial competence
Image factors
Supplier critical image/brand name
Potential environmental/safety concerns
Environmental characteristics
Risk
Uncertainty
In the second step the current supplier relations associated with the purchase is defined. This is done by describing the supplier relations by two dimensions; relative supplier attractiveness and strength of the relationship (Olsen and Ellram, 1997). Table 4 depicts factors that influence the two dimensions.

28
Table 4: Factors that affect the two dimensions regarding current supplier relations (after Olsen and Elram, 1997, p. 106-107)
Factors Influencing the Relative Supplier Attractiveness
Factors Describing the Strength of the Relationship
Financial and economic factors
The supplier's margins
The supplier's financial stability
The supplier's scale and experience
Barriers to the supplier's entry and exit
Slack
Economic factors
Volume or dollar value of purchases
Importance of the buyer to the supplier
Exit costs
Performance factors
Delivery
Quality
Price
Character of the exchange relationship
Types of exchange
Level and number of personal contacts
Number of other partners
Duration of the exchange relationship
Technological factors
The ability to cope with changes in technology
The types and depth of supplier's current and future technological
Cooperation between buyer and supplier
Cooperation in development
Technical cooperation
Integration of management
Capabilities
The supplier's current and future capacity utilization
The supplier's design capabilities
The supplier's speed in development
The supplier's patent protection
Distance between the buyer and the supplier
Social distance
Cultural distance
Technological distance
Time distance
Geographic distance
Organizational, cultural, and strategic factors
Influence on the company's network position
The internal and external integration of the supplier
The strategic fit between buyer and supplier
Management attitude/outlook for the future
Top management capability
Compatibility across levels and functions of buyer and supplier firm
General risk and uncertainty of dealing with the supplier
Feeling of trust in relation with the supplier
Other factors
Ability to cope with changes in the environment
Safety record of the supplier
In the last step the actual relations are compared with the desired or appropriate relation for each purchase and appropriate measures are planned (Olsen and Ellram, 1997). Olsen and Ellram (1997) emphasize that the factors differ in importance from company to company and suggest that in order to use the portfolio model, the decision makers in the company must agree on the relative importance of each factor.
3.3.3 Supplier selection and evaluation One of the purposes of supplier base reduction is to get a smaller more manageable supplier base including suppliers with the desired capabilities and performance levels. This means that a company has to choose which supplier to keep and which supplier to get rid of. To do

29
this the company must evaluate each supplier and compare them to each other to ensure that the supplier that supports the company‟s business best is chosen. Supplier selection is a complicated area that involves a lot of criteria and tradeoffs (Amid, Ghodsypor and O‟Brien, 2009). Dickson (1966) identified quality, cost and delivery performance as the three most important criteria for supplier selection. Ho, Xu and Dey (2010) conclude that these criteria are still valid and they are the three top ranked criteria for evaluating suppliers in the industry today. Technical out-put, e.g. quality, price/cost and delivery speed is according to Ting and Cho (2008) the traditional criteria to use when evaluating suppliers. They point out that recent research suggests that supplier selection should be based upon the supplier‟s global performance as the buyer-supplier relationship becomes closer and long term based, and the numbers of criteria used for supplier selection decisions increases.
“Global evaluations could range from total costs analysis (Roodhooft and Konings, 1996; Ellram, 1996; Tagaras and Lee, 1996; Bhutta and Huq, 2002) to the consideration of suppliers‟ capacity, their future manufacturing capability and/ or strategic partnerships (Chan and Kumar, 2007). It now becomes obvious that the supplier selection process should not only consider price, but also a wide range of factors such as quality, organization, culture and supplier capability in a longterm and strategic way.” (Ting and Cho, 2008, p. 118)
Van Weele (2005) is also emphasizing the importance of including the right aspects in a supplier selection decision. He concludes that the selection of a new supplier is a cross functional matter that ideally should include the following functions; purchasing, design, production and production planning. The geographic location of the supplier is a dimension that is pointed out as important in the supplier selection literature (Smith, 1999; Ng and Eric, 2010). Smith (1999) has created a framework for decision making regarding the geographic location of the supplier for each item. The framework consists of seven matrixes, in six of them two dimensions decides where the item is placed in each matrix. The six matrices are then combined to make the final placement in the seventh matrix “the decision matrix” where the two dimensions are local sourcing vs. global sourcing. The dimensions in the six first matrixes are (Smith, 1999):
“The specification matrix” – Specification vs. Rate of change of specification
“The process & quality matrix” – Risk of failure vs. Ease of correction/tolerance
“The technology matrix” – Level of product technology vs. rate of change of technology
“The logistics and availability matrix” – Product availability vs. Criticality and/or volatility of demand
“Critically and volatility of demand matrix” – Criticality vs. Volatility of demand
“The cost matrix” – Intrinsic product cost vs. Cost of delivery In brief, the model basically places an item in a global vs. local sourcing-matrix based on the nature of the communication (how likely it will be high frequent and what impact the communication will have on the final product) between the buyer and supplier. It does also include the market dimensions, both for the end product (uncertainty in demand for the item) and for the item (availability on the supplier market). The traditional aspects purchasing price vs. logistical cost are also included in the model.
Smith (1999) emphasizes that the importance of each criteria/dimension in his framework must be analyzed by the decision makers. This is also pointed out by many other researchers as an important aspect in the supplier selection process. The company must

30
consider the relative importance between the difference criteria (Liu and Hai, 2005; Schmitz and Platts, 2004; Nydick and Hill, 1992). This makes sense since companies need different capabilities depending on what market they are on and what order winners they have, which determine the requirements on the suppliers.
3.4 Tools Dependent of the characteristics of the supplier base, a company can choose different practical approaches when reducing the supplier base. To be able to understand the characteristics of the supplier base and find opportunities for reduction it is essential to conduct a spend analysis, the spend analysis can also be used as a tool for tracking the savings from the SBR initiative.
3.4.1 Supplier base reduction approaches Ogden and Carter (2008) reviewed the work of Womack, Jones and Roos (1991) and found three approaches for SBR, (1) systematic - bases the reduction on analysis and can be gradual or direct (elimination many suppliers at single point in time), (2) standardization – the reduction of parts count and (3) tiering – usage of the first tier suppliers as systems suppliers. The tiering approach was also supported by Cousins (1999) and Manoochehri (1984). Ogden and Carter (2008) studied (among other things) how these approaches were utilized when companies conducted reductions of their supplier base (for more information about their findings in the study see section 3.5). They found that most companies used the systematic approach (6 of 10 studied companies). Both direct and gradual elimination were used, one example of the gradual systematic approach was shown by a manufacturer of valve enclosures. The company used a system where they labeled the existing suppliers as green, yellow or red. The red suppliers were up for elimination in the near future, the yellow in a few years and the green were suppliers which the company wanted to drive more business towards. A pharmaceutical company used the standardization approach to reduce the suppliers of computers by standardize the computer platform used in the company. By having one platform the cost of open up new sites and the cost of support the users could be minimized. A university (for laboratory equipment) and a producer of computers (for repair and warranty) used the tiering approach since this was the only way that they could reduce their supplier base. The reason for this was that the purchasing departments of the companies lacked control of what was being purchased in the analyzed categories. Ogden and Cart (2008) found that the approaches are not mutually exclusive. For example the systematic and standardization approach both removed suppliers; the main difference was whether the standardization led to fewer suppliers (standardization) or fewer suppliers led to standardization (systematic).
3.4.2 Spend analysis Pandit and Marmanis (2008, p. 5) define spend analysis as:
“..the starting point of strategic sourcing and creates the foundation for spend visibility, compliance, and control. Spend analysis organizes procurement information via supplier hierarchies, commodity alignment, and spend amount, in order to:
Ascertain true category spend
Identify strategic sourcing opportunities through demand aggregation and supplier rationalization

31
Identify expense reduction through increased compliance-in the
form of vendor rebates, maverick spend, contract compliance, and budget variance”
To be able to organize the procurement information and to realize savings opportunities Pandit and Marmanis (2008, p. 5) list questions where the answers can be derived from the historical spend. They also list examples of cost savings opportunities, see figure 11.
Figure 11: Questions to use when conducting a spend analysis and cost savings opportunites (after
Pandit and Marmanis, 2008, p. 5)
Pandit and Marmanis (2008) argue that the spend analysis also can be used to track savings from cost reduction initiatives. This is done by integrating the spend analysis with the rest of the sourcing modules. Opportunities for savings are identified in the spend analysis module. These opportunities are then captured by the sourcing module where the negotiation with suppliers is conducted. Cost, risk and performance drivers from the supplier performance module are taken into consideration to capture the best value in the negotiation. The information from negotiated contracts is uploaded to the contract module. The compliance module uses the contract information to track compliance by analyzing spend, contracts and controls. In the final step the supplier performance module receives information from spend, sourcing and contracts and join the information to enable evaluation of suppliers. Compliance According to Pandit and Marmanis (2008) the single largest source of procurement cost savings is contract compliance. Different business units use different contracts with the same supplier, potential discounts are not captured and restrictions on delivery dates, penalties on late deliveries, product returns and warranties are rarely monitored and enforced.
32
3.4.3 Total Cost of Ownership (TCO) The fundamental thought behind TCO is to bind cost to their actual origin or driver. TCO can be compared to the activity-based-costing system with the difference that, instead of focusing on describing all costs, strives to describe/map all costs associate with the purchased product (Ellram, 1993). Ellram (1993) argues that the key benefit of implementing a TCO approach is the improved supplier selection decisions. The first step in adopting a TCO approach is to identify the cost data needed. Even though not all cost can be identified all available data can be of help in analyzing sourcing alternatives to make operations more efficient (Ellram 1993). Ellram (1995) lists two methods to determine the TCO; the cost-based and the value-based method. The cost-based method can directly be compared with the activity-based-costing system which implies that all cost elements can be traced separately. The value-based method uses performance data of the supplier and adds weight to each category. The total “score” given by the performance and the given weight in each category are then translated to a monetary value. A pro of the cost-based method is that it can be tailored to the actual decision and that it can help identify critical issues. A con is that it is time consuming and not cost beneficial for low value buys. The pros of the value-based method are the possibility to incorporate issues where cost cannot be determined and that it is easy to use for repetitive decisions. A con is that it needs much judgment in determine the weightings (Ellram, 1995). Dubois (2003) stresses the fact that a TCO model should not be general or static instead it should be procedural and situational, changing depending on the actual relationship analyzed rather than the product.
3.5 Previous studies on SBR In this section the findings of six documented case studies of companies that have reduced their supplier base are presented. The main findings are compiled in a table placed in the end of the section.
3.5.1 Managing suppliers: when fewer can mean more Goffin, Szwejczewski and New (1997) did four case studies at manufacturing companies chosen from the Best Factory Award database of UK manufacturing companies. Two of the studied companies were from the electronics industry and two from the process industry. All of the companies had a high percentage of bought-in materials purchased from suppliers. One of the findings was that a supplier base reduction initiative should not be carried out in isolation, instead it should be a part of a well thought plan for purchasing. It was also found that supplier performance is much based upon how the suppliers are treated. It is important to give the suppliers a full view of the business needs like the right information at the right time and clear specifications. It is also important to remove suppliers in a professional and ethnical correct manner. Finally Goffin et al. (1997) found that there can be drawbacks of soul sourcing. For example on commodities were multiple sources can be a protection against market fluctuations. To only have one source of supply will also increase the risk.
3.5.2 Supplier management in German manufacturing companies: an empirical investigation
Goffin, Szwejczewski and Lemke (2001) did a telephone survey on 34 companies derived from the Best Factory Awards data base of German manufacturing companies. The aim of the study was not to find best practice but to identify trends in supplier management of German manufacturing companies and compare this to UK companies. However they did find that not many companies had gained better supplier relations and communication from the SBR initiative. Only 27 % had improved their supplier relation and communication compared to that 53 % had lowered their administration costs and reduced prices. This gave the conclusion that improved communications and relations are a result from the company working with the suppliers rather than just a result from a reduced supplier base. They also

33
found that for the majority of the respondents the actual savings were perceived rather than factual (only 7 of 34 measured the savings). None of the respondents had examined the qualitative benefits.
3.5.3 Supply base reduction within supply base reduction Ogden (2003) studied a company in the US transportation industry. The product examined in the study was characterized by a highly fragmentized supply base, not leveraged volumes, no centralized purchasing process, big spend and opportunities for standardization. The company wanted to leverage the size of the company and the potential buying power to be able to realize savings and discounts through the consolidation and reduction of the number of suppliers used. The study proposes a six step supplier selection process to be used when conducting a reduction of the supply base. It includes: form the sourcing team, develop sourcing strategy, generate supplier portfolio, RFP process development, negotiate/select competitive suppliers(s), operational integration, benchmarking and improvements. Six critical success factors were also found: (1) Get top management support. (2) Hire the right people for the project. (3) Utilize cross-functional teams – get input from everyone involved so that they can buy into the outcome. (4) Understand the organization‟s needs, goals, objectives prior to making changes. (5) Get good/accurate information on the spend prior to making changes. (6) Pick the right suppliers.
3.5.4 The supply base reduction process: an empirical investigation Ogden and Carter (2008) conducted ten case studies on US companies that had conducted supplier base reduction; eight Fortune 500 companies, a large private university and a large government contractor. They found that the three major approaches derived from literature – systematic, standardization and tiering were also used in practice. By analyzing the findings a overarching supply base reduction process was created (to be used regardless of chosen approach) that includes six major steps; establish cross-functional teams, develop commodity sourcing strategy, identify potential suppliers, supplier selection process, implement changes, continuous improvements. There were also lessons to be learned from the studied companies:
Reducing the supplier base is not something that should be taken lightly since it requires a lot of time and resources from the organization (most of the studied projects took between 6 – 12 months).
It is important to seek buy in from potential stakeholders, like R&D, purchasers and manufacturing units, to be able to identify problems and enable a smooth implementation process. One way of doing this is to use cross functional teams.
Properly address the risks involved when reducing old suppliers, e.g. one supplier could have a critical impact on a certain manufacturing unit that is not seen on an aggregated level. This is of particular importance for manufacturing companies buying direct material.
See the process as continuous so that the supplier base will not get out of control again. Use lessons learned from previous reduction project (s), benchmarking and continuous improvements.
3.5.5 Supply base rationalization: myth or reality? Cousins (1999) used surveys in his study of 174 firms from different sectors of the UK industry. The surveys were followed up by ten personal interviews to verify the results. The study investigated both firms with a commercial approach to purchasing and firms with a strategic approach (71 % commercial 29 % strategic). The commercial firms were using the supplier base reduction approach as a one-off cost reduction exercise. Focus were on short term savings as increased supplier leverage and reduced packages work. None of the

34
commercial firms were able to quantify the transaction cost prior or after the supplier base reduction program even though all of the firms claimed that the program had been a success. The rationale was that a large supply base must drive higher transaction cost thus a leaner supply base would automatically result in lower cost but since none of the firms did quantify this potential saving the proof for an actual saving was nonexistent. The purpose with the initiative for the strategic focused purchasing organizations was to change the way they work involving supplier development and relationship management. The strategic firms did have a different approach to the transaction process compared to the commercial but none of the firms had considered the total cost of change, like managerial or strategic exposure costs. Looking at both groups 8 % of the companies reported that the total spend had increased, 46 % that it had not changed and 46 % that is had decreased. This means that 54 % of the firms expressed little or no benefit from the initiative. 92 % of the respondents did claim that they had reduced their transaction cost but none could prove it. Cousins (1999) found that the investigated firms looked at negotiating savings instead of focusing on streamlining the inter-organizational processes. This lead to a short term cost reduction but forced the firms into highly dependent, long-term relationships, without the knowledge of how to manage them. Later the prices rose again due to poorly managed relationships, and managers turned to multi sourcing again, and by that increasing their supply base. According to Cousins (1999) the way to success is two-folded: first firms need to achieve a focus on long term relationship development by using proper relationship development strategies. Second firms need to align their internal processes with a focus on the performance measurement of the internal supply process. In addition to this evaluation of the supplier need to be altered towards a dual relationship perspective. Finally the relations management competence by all parties involved in the relationship management needs to be developed.
3.5.6 Strategic cost management across boundaries of firms Dubois (2003) did a case study investigating the supplier base reduction initiative of a local service unit (LSU) in a subsidiary of a multinational company. The LSU were buying maintenance, repair and operations material supplying five business units situated in the same plant. One finding was that the total cost concept should be dealt with as procedural and situational. If a general model is set up this might prevent fruitful learning through interaction between buyer and supplier. In the case study the buyer-supplier cooperation was organized in teams representing the relationship witch lead to a continuous learning about joint cost drivers. When concluding this Dubois (2003, p. 374) argues that firms have problems with quantifying their cost structure:
“We argue, instead, that firms seldom know either their own cost structures in relation to the exchange with the various counterparts or how they affect their counterparts‟ costs. Therefore, finding ways to organise efforts to reduce costs across the boundaries of firms become crucial to realising the potential of high involvement relationships.“
Another finding was that the large supply base of the studied unit was a result of a large number of cost centers with managers only concerning their own purchasing needs not seeing the total cost.

35
3.5.7 Summary of the previous SBR studies In this section relevant findings in the previous SBR studies have been compiled and can be seen in table 5. Reasons for companies to implement SBR have also been summarized and can be seen in table 6. Table 5: Summary of findings from the six case studies
Table 6: Summary of reasons for SBR
Reasons for supplier base reduction Reference
Lowered transaction cost
Ogden (2003), Goffin et al. (1997), Cousins (1999)
Reduced prices
Ogden (2003), Cousins (1999)
Improved quality
Goffin et al. (1997)
Improved delivery performance
Goffin et al. (1997)
Improved relationship management and supplier development Cousins (1999), Dubois (2003)
Findings Reference
SBR should not be carried out in isolating instead it should be a part of a well thought plan or overarching purchasing strategy.
Goffin et al. (1997), Ogden and Carter (2008)
To be able to see the gains from the SBR initiative gains need to be measured, both quantitative and qualitative.
Goffin et al. (2001), Cousins (1999), Dubois (2003)
Gains like improved communication and supplier relations will not come as a result of the SBR initiative it selves but rather as outcomes from supplier management programs made possible by SBR.
Goffin et al. (2001)
It is important to manage the new conditions for buyer-supplier relationships that SBR implies.
Cousins (1999)
A well established supplier selection process developed based on the sourcing strategy is essential.
Ogden (2003), Ogden and Carter (2008)
It is important to know when to use soul, dual or multiple sourcing depending on the commodity and the risks associated with the supply of the particular commodity.
Goffin et al. (1997), Cousins (1999), Ogden and Carter (2008)
It is important to seek buy in from potential stakeholders to be able to identify problems and enable a smooth implementation process. It is also important to understand the organization‟s needs, goals and objectives prior to making changes.
Ogden (2003), Ogden and Carter (2008)
The reduction process needs to be seen as continuous so that the supplier base will not get out of control again. Lessons learned from the reduction project (s), benchmarking and continuous improvements can be used to achieve this. Ogden and Carter (2008)

36

37
4 The conceptual model The purpose of this chapter is to describe the conceptual model created based on the theory
presented in chapter 3.The model contains areas connected to SBR and their relationships.
Figure 12: A conceptual model connecting relevant purchasing functions with SBR
The purpose of the conceptual model (illustrated in figure 12) is to describe the parts of purchasing theory that affect and is affected by SBR. The model can be used as support for companies when evaluating the conditions for, and opportunities of, a SBR initiative. The model can also help companies indentify the connections between SBR and the organization and the purchasing strategy. The model was created by combining theoretical concepts and previous findings from case studies of companies that have reduced their supplier base. The model consists of eight areas with SBR as a bridge linking them together, creating a logical structure. An analysis conducted using the conceptual model should show the possible gains a company can get from SBR, how SBR will or will not support the purchasing strategy and factors that can facilitate or obstruct a SBR initiative. All this will be inputs to the planning of the implementation. As depicted in figure 12, the model starts with three areas purchasing strategy, degree of purchasing decentralization, and the spend analysis and supplier performance analysis. The area purchasing strategy describes the importance of identifying how SBR will support the purchasing strategy. The area degree of purchasing decentralization comprises how the organizational structure affects a SBR initiative. Spend analysis and supplier performance analysis stresses the importance of accurate data on the spend and supplier performance. These three areas must be taken into consideration when deciding the purpose and

38
objectives of the initiative and how to realize these. Company‟s approach to implement a SBR initiative together with the desired outputs will affect who the main stakeholders are, desired supplier capabilities and how the output of the SBR project should be measured. The objectives and purposes should pervade all the activities in the SBR to ensure that all involved parts strive towards the same goals. The conceptual model does not include the actual implementation of a SBR initiative. It should be used to identify activities that should be completed prior to a launch of a SBR program and to give guidelines in a potential implementation. In this chapter the expressions business unit (BU) and commodity are used. A business unit is here defined as a part of a company that has its own organization like for example a division or a factory. A commodity is here defined as a group of bought products with similar characteristics like for example metal sheets or bolts.
4.1 Purchasing strategy SBR should be seen as a subordinated purchasing strategy or as a brick in the purchasing strategy puzzle. SBR can be used both as a way to enable other strategies as e.g. supplier development and as a tool to achieve cost reduction (Cousins, 1999). It is important that SBR is not considered as an isolated “quick-fix” without a well-thought purpose that connects it to the other parts of the purchasing strategy (Goffin et al., 1997, Ogden and Carter, 2008). A strategic goal for purchasing can for example be to lower the total cost by increasing quality, SBR is then an enabler since the possibility to develop supplier quality increases with a reduced supplier base (Hahn et al., 1990; Hartley and Choi, 1996; Krause, 1997). If the strategic goal is to lower cost by lowering transaction cost and bundle purchasing volumes then SBR is a tool instead of an enabler. To be able to find the right place for SBR in the purchasing strategy a company needs to have well developed commodity strategies. According to Van Weele (2005) the usage of a portfolio model is the preferred way to create commodity strategies. The portfolio analysis will decide the minimum required number of suppliers for every commodity to ensure a steady supply. The portfolio approach implies the importance of having dynamic “goals for reduction” when planning SBR. One commodity might need more suppliers than another due to its impact on the finished product. In a multi-unit company the needs and strategic goals might differ depending on product and market characteristics. Thus it is important to analyze how SBR will or will not support each BU; a SBR initiative might only be suitable for some of the BUs in a company, then it should not be implemented in every BU just for the sake of it.
4.2 Degree of purchasing decentralization Decentralization drives more contact points with suppliers, more decision-makers and more contracts as well as counteracts standardization. Thus the degree of decentralization affects the complexity of SBR. It has been shown that a centralized purchasing organization structure will drive a reduction of the supplier base (Smart and Dudas, 2007). This implies that a decentralized purchasing structure will drive an expansion of the supplier base which will affect the progress of the supplier base after the reduction has been conducted. Another factor to consider is the purchasing maturity of the business units in the company. If the purchasing maturity is low characterized by a low functional status with a transactional and commercial approach, it will countervail collaboration and capturing of synergy which is essential for SBR.

39
To be able to succeed with initiatives that involve capturing purchasing synergy and collaboration between business units it is import to have some sort of forum for collaboration. Arnold (1999) gives in his global sourcing organization model an example of a forum; an international buying committee used to bundling the demands of business units.
4.3 Spend and supplier performance analysis To know where you want to be and how to get there you need to have a map telling you where you are right now. The spend is absolutely essential to reach any of the desired gains from a SBR initiative. It is important to establish visibility throughout the entire organization, between business units (if there are any), to gain a holistic view of the current situation. An analysis of the spend, mapping all bought commodities, where they are bought, how often and to what price, will help to stake out the way to attack the supplier base, to identify synergy opportunities and to “pick the right fruits”. To be able to consolidated volumes in a global company it is essential to know which suppliers who have the capability to support different sites in different parts of the world. What will be the result of changing from a local to a global supplier in terms of performance, support and buying power?
4.4 SBR approach The output from the purchasing strategy will together with the opportunities derived from the spend and supplier performance analysis give the possible gains of the SBR initiative. The output from the degree of purchasing decentralization will determine the organizational support for the desired gains. The commodity strategy should be developed by for example using a portfolio analysis prior to the analysis of a suitable supplier base reduction approach. If for example a strategic goal for a commodity is to improve quality by reducing the number of suppliers used and develop the remaining suppliers, patterns in the spend analysis should be analyzed to identify the SBR opportunities. Perhaps the commodity contains a variety of similar items that could be standardized to one or a few standard items. Or maybe the commodity only contains a small number of items but they are bought from many different suppliers by different business units, if the business units come together and decide upon one or two suppliers to use, the supplier base can be reduced. If a company has a decentralized purchasing organization the organization might not support a SBR initiative and it can become an obstacle. For example, collaboration between BUs might not be developed enough to decide upon one common supplier for a commodity, or the needs, in terms of for example lead times or price, might differ too much to share a common supplier. If it is just a matter of collaboration it can be fixed (with a cost that needs to be exceed by the possible gains) but if the needs are too inhomogeneous the business units might need individual supplier bases. However it is important to emphasize that the goal is to find resemblances rather than differences when looking for synergies. This to avoid that BUs unfounded consider themselves to be unique. If the degree of decentralization becomes an unsurpassable obstacle the organization can either facilitate purchasing synergy by for example create a forum for collaboration or choose to centralize the purchasing function (symbolized by the crosshatched arrow in figure 12). If the centralization by its own will not create a sufficient reduction of the supplier base a new analysis of the organization and how it will affect a SBR initiative needs to be conducted. Depending on the wanted gains and the opportunities, and the support from the organization, a company, or a chosen segment or part of a company, can use different approaches to reduce the supplier base. The approaches are: systematic - bases the reduction on analysis and can be gradual or direct (elimination many suppliers at single point in time), standardization – the reduction of parts count and tiering – usage of the first tier suppliers as systems suppliers (Ogden and Carter, 2008). The company can also chose to use a blend of different approaches. For one commodity standardization might be the most appropriate

40
choice and for another tiering. It is important that that the why, how and support are aligned in the chosen approach, if for example the purpose is to get closer collaboration with few suppliers to enable early involvement in new product development the tiering approach is inappropriate since it denotes paying for a lesser number of supplier relationships to handle. But if the purpose is to get closer collaboration to streamline the transaction process tiering might me the best choice.
4.5 Objectives and purposes with SBR It is essential to understand why the SBR initiative should be executed from the beginning and what the desired outcomes are. With the purchasing strategy, the degree of purchasing decentralization and the spend and supplier performance analysis desired and feasible objectives are defined. The connections to stakeholder mapping, supplier evaluation and performance measurement illustrate the importance to consider the objectives and purposes throughout the entire analysis. In order to get stakeholder buy-in the gains have to be communicated, in order to do the correct analysis when deciding on the criteria to choose suppliers it must be clear how the suppliers can support the objectives and finally Key Performance Indicators (KPI) that can indicate if the objectives are reached need to be defined.
4.6 Stakeholder mapping Stakeholder mapping serves three primary purposes; understand who in the organization that will be affected and how they will be affected by a SBR initiative, identify new competence requirements that a SBR initiative will imply and get stakeholder buy-in to create willingness and future compliance (Cousins, 1999; Ogden and Carter, 2008). When reducing the number of suppliers a company becomes more dependent on fewer suppliers, hence the company needs to have supplier relationship management competences to mitigate the risks this strategic exposure implies (Cousins, 1999). Depending on the chosen approach and the objectives, the stakeholders and the impact of the SBR initiative on the stakeholders will differ. Purchasing might lose the alternative to work with certain suppliers and the desire for closer buyer-supplier collaboration might require new competences in purchasing, R&D, manufacturing and at the supplier. Communicating the gains will support stakeholder buy-in, it will also enable the stakeholder to understand how their work will help in reaching the desired gains. The buy-in will ensure that people and the business units will support the work to reduce the supplier base and comply with the directives.
4.7 Supplier evaluation One part of SBR is of course deciding which suppliers to keep and which suppliers to remove from the supplier base. These decisions will be based on the criteria a company chooses to evaluate its suppliers on. These criteria‟s must be derived from the SBR objectives and the commodity strategy, it is also necessary to consider the relative importance of the criteria‟s. The relative importance of the criteria can differ between the commodities. The stakeholder‟s requirements on the suppliers will probably differ and it is important to capture these requirements when deciding on the criteria‟s relative importance. In this way selection of suppliers will support the different functions in the organization and buy-in from the different parts can be created when their opinions are included in the process. In order to succeed to reduce the number of suppliers it is usually necessary to increase the share of global suppliers (if the company is global). To do this one must first identify which commodities are appropriate to source global. Smith‟s (1999) portfolio model can be used as support when identifying the global vs. local issues regarding the geographic location of the supplier. It is important to consider the product characteristics, the nature of communication, the market characteristics (supplier market and end product market) and the purchasing

41
price vs. the logistic costs. Each commodity might have different targets regarding the desired buyer-supplier relation which should be decided by a commodity strategy. When choosing which suppliers to keep and which to remove, the current buyer-supplier relation should be compared to the desired. To do this the current relations with the supplier must be mapped. Olsen‟s and Ellram‟s (1997) criteria in table 3 and 4 could be a guide when mapping current relations, however each company must decide the relevance of each criteria in their case. All the presented issues should in the end be brought together to create a TCO analysis of the suppliers. Many of the aspects are hard to put a price on but the analyses presented can make it easier. For example when a desired relation and the current relations are determined it is clearer what impact each choice of supplier will have. If a close collaboration is desired the cost to over bridge that gap (between desired and actual relation) can be estimated. Or if the relation is closer than desired, which might mean that more resources are put in the relation than necessary, unnecessary cost can be identified. By having these pieces in place these aspects can be included in the TCO analysis.
4.8 Performance measurement To be able to track the gains from a SBR initiative they need to be measured. It is important to do after the project(s) are closed but equally important to do continuously during the implementation. One reason is to create momentum by visualize success in a sub-project or part of the main project, another reason is to be sure that the chosen path is the correct one. Since it is important to measure continuously “what to measure” need to be established before the project starts. “What to measure” has to be derived from the objectives and purposes with SBR; if for example the purpose with the initiative is to lower the transaction cost, the transaction cost has to be defined and how to capture it has to be decided. If the gains are to get better performance out of the suppliers by working closely with fewer, another set of KPIs are necessary. What gets measured gets done, which means that the KPIs need to reflect the wanted behavior from the organization. One way to track the progress, that is beneficial regardless of the gains, is to monitor the spend (Pandit and Marmanis, 2008). This reviles if the decisions about eliminating certain suppliers are complied by the organization and how the total spend of e.g. a commodity is affected. The savings can also be tracked with a TCO-model, where cost drivers for either bought items or suppliers are identified.

42

43
5 Empirical Data In this chapter the empirical data gathered at the case company Alfa Laval will be presented.
The chapter starts with a general description of the company followed by a description of its
central purchasing function. Thereafter some new strategy initiatives that Alfa Laval has
launched recently will be described and how these initiatives will affect the purchasing
function. The product groups section describes the three product groups this study is
focusing on; Plate Heat Exchangers, Brazed Heat Exchangers and High Speed Separation.
In the end of this chapter a compilation of thoughts on SBR from persons within Alfa Laval
will be presented.
The purpose with the data presented in the empirical data chapter is to get an overall understanding of Alfa Laval‟s business and a more detailed understanding of the parts this study has focused on. The overall organization is briefly described because it will enable the reader to place the focused functions and departments in a context. The Product Groups (PGs) included in this study are described both in terms of product characteristics and how certain functions and departments are working. By doing this the reader will get a picture of how the needs and organizational structure do or do not differ between the PGs. This will then be analyzed in the next chapter in order to understand how the different demands and organizational structure will affect and be affected by a SBR initiative.
5.1 Alfa Laval – The case company Alfa Laval was founded 1883 and is a global company that provides highly engineered products with large customer diversification. The company‟s headquarter is situated in Lund. In 2009 the company had an order intake of 2 028 M€ and its average number of employees was 11 400. Alfa Laval has three key technologies (see figure 13): Heat transfer – energy savings solutions for heating, cooling, ventilation, evaporation and condensation. Separation – separation of liquids from liquids, of particles from liquids and of liquids and of fluids and solids from gases. Fluid handling – safe transport and control of fluids (Alfa Laval, 2010).
Figure 13: Alfa Laval’s three key technologies
Alfa Laval has a complex organizational structure and it can best be described as a matrix organization. The highest level of the organization chart is presented in figure 14. Equipment Divisions and Process Technology Division are the two “legs” that Alfa Laval stands on. These divisions are customer related where each “leg” represent a main customer segments (Example of the equipment division is OEM to the car industry and example of the process

44
technology division is equipment to the food industry). These two divisions include sales, product management and product development (Alfa Laval, 2010).
Figure 14: Highest level in the organizational chart (Alfa Laval, 2010)
The two legs are further divided into ten more specific customer segments; Parts & Service, Life Science, Process Industry, Energy & Environment, Food Technology, Sanitary, OEM (Original equipment manufacturer), Fluid & Utility, marine & Diesel and Comfort & Refrigeration. The “regions box” represents the sales offices supporting both equipment and process technology (Alfa Laval, 2010).
Alfa Laval is also divided into eleven different product groups which are depicted in figure 15 together with the percentage of the total sales that each PG represent (notification: there are more than 11 PGs in figure 15 and the reason for this is that responsibility for some of the PGs has been consolidate under one person). The logic with the PG division is that products with similar characteristics and manufacturing techniques/equipment belong to the same PG.
Figure 15: each PG’s percentage of total sales (Alfa Laval, 2010)
Group management
RegionsEquipment
Division
Process Technology
DivisionOperations
Human resources
Communications
Corporate Development
Finance & Legal
PHE24%
BHE&FHE9%
WHE6%PVFT
10%HSS14%
DEC5%
AIR6%
HES2%
PARTS18%
DIST2%
FIL1%
OTH3%

45
Operations include all parts that are related to the manufacturing aspects of Alfa Laval. Figure 16 illustrates the geographical location of the 29 manufacturing sites and each of these manufacturing sites has its own local purchasing department (Alfa Laval, 2010). How the local purchasing works on the different sites varies, some of them are working on a tactical and strategic level and some of them are just working on an operative level (Interviewee 8, 2010).
Figure 16: The geographical location of Alfa Laval’s manufacturing sites
There is also a global purchasing function (Operations purchasing (OP)) under Operations. The global purchasing function is further described in section 5.3. Figure 17 gives a simplified overview of how the organization works and how the different functions are related (Interviewee 2, 2010). The PGs are divided by their product characteristics (e.g. HSS makes separators and PHE makes plate heat exchangers) and in each there are a number of manufacturing sites. Each manufacturing site has its own local purchasing who is responsible for material planning and call offs. In this study the local purchasing represents the needs for each manufacturing site (i.e. when discussing the local purchasing needs the sites manufacturing needs are included). Each PG has a sourcing manager (SM) who is responsible for coordinating the purchasing within the PG. All SMs except one have a shared role were they also are local purchasing manager. The SM role has not been specified in detail so it is up to the SM to decide what the role should include. The local purchasing manager reports to the local site manager and the SM report directly to the PG manager (Interviewee 2, 2010). OP is working across all the PGs and is divided into six commodity groups. Then ten customers segments (presented section 5.1) works across the PGs as well, e.g. a boat (marine and diesel segment) requires both a heat exchanger (PHE) and products from pumps and valves (P/V) (Alfa Laval, 2010).

46
Figure 17: Simplified illustration of the connection between functions within Alfa Laval (Sourcing Manager
(SM), Product Group (PG), Operations Purchasing (OP))
Alfa Laval has a function called product centers (PC). The PC‟s have two functions, one is the product management part and the other is the product development part. The PCs have the overall responsibility for product quality. The product centers are divided by PGs and lay under Equipment division and Process technology division in the organizational chart. Plate Heat Exchangers (PHE) and Brazed Heat Exchangers (BHE) have a common PC that goes under the Equipment division and High Speed Separation (HSS) has its own PC and it goes under the Process technology division (these are the three PGs that are included in this study) (Alfa Laval, 2010).
5.2 Strategy Alfa Laval‟s overall strategy is to optimize the performance of its customer‟s processes. This is done by offering customer tailored solutions that helps the customer to become more productive and competitive. Over the years the company has built a strong brand representing high quality products. An important part of Alfa Laval‟s strategy is to grow by acquisitions. The acquisition strategy aims to strengthen existing products, add key products and to complement existing business by strengthening geographical presence or adding new sales channels (Alfa Laval, 2010). These aims can be connected to the overall strategy as all of them allude to provide a broader range of solutions to the customer and to strengthen the brand (Alfa Laval, 2010). The overall strategy and its connection to the Operations strategy are not well communicated in the organization (Interviewee 2, 2010). When asked about the overall strategy of Alfa Laval few could give a straight answer. In April 2010 Operations launched a new strategy for the period 2010 – 2013. It has been decided that sourcing should be focused on in the new strategy period (Interviewee 2, 2010). The areas within sourcing that should be focused on are; creating a common global sourcing process, focus more on sourcing, having a proactive approach (“be one step ahead the suppliers”) and quality (Alfa Laval, 2010). The KPIs/objectives that sourcing will focus on are quality, Delivery on Time (DOT) and total cost (Alfa Laval, 2010). To be able to realize the focused areas, a “sourcing roadmap” was created by a cross functional team, consisted of people from manufacturing, PCs and purchasing, lead by the head of operations purchasing (Interviewee 9, 2010). After the roadmap had been created the management team of operations purchasing decided to initially focus on 6 of 42 total activities; (1) measuring and reporting, (2) adjustment and alignment of roles and responsibilities, (3) competence expectations and training, (4) supplier base reduction, (5) develop a routine for handling

47
signals from CSB1 and (6) handshake to business plan (Interviewee 2, 2010). These focus areas were later discussed in a sourcing meeting that was held in may 2010. The thoughts on the SBR-area that were captured during the meeting are compiled in appendix I (Interviewee 2, 2010). Two areas in the roadmap not mentioned above are goods receiving inspection and purchasing analysis data tool. These are projects that have already been started during 2009 and 2010. The goods receiving project aims at creating a uniform goods receiving process to be used globally throughout Alfa Laval. The purchasing analysis data tool (PADT) is a project that was started in the fall of 2009 (Interviewee 2, 2010). The background of the project is that Alfa Laval, due to a ambition to focus more on sourcing, realized the need of company-wide transparency regarding the purchasing spend and supplier performance (Interviewee 14, 2010). The 29 Manufacturing sites operate seven different ERP-systems, which means that the tool needs to be adjusted to fetch data from each individual system. The tool is built around a data warehouse where data is collected and updated every night with a web browser based user-interface displaying the data. When the tool is fully implemented the automatic procedure will capture around 80 % of the total spend. The rest will be manually reported to the data warehouse each month. This due to the technical difficulty and cost of capturing the spend from sites with peripheral ERP-systems (systems only used by one site). In December 2010 a pilot project was completed and a prototype was created. During 2011 the tool will be fully implemented on all manufacturing sites operated by the company (Interviewee 14, 2010). The project manager of PADT sees a few obstacles that could prohibit the success of the tool. The first is change management; the sites need to change their processes and start using the tool when it has been implemented. Another key factor is the quality of the data. Since the tool withdraws data from the ERP-systems it is important that the sites alter their processes to ensure that data is entered in a uniform way throughout the company. One type of data is how suppliers are labeled. During the implementation of the tool the sites will get one month to re-label their suppliers with a coding used globally by all sites. This is done to prevent suppliers to be registered more than one time if they supply more than one site. The project manager believes that top management support is essential to overcome the obstacles. The change of processes regarding how to use the tool or how sites will work with data quality after the tool has been implemented is not included in the scope of the project (interviewee 14, 2010).
5.2.1 ALPS During 2010 a new production system, Alfa Laval Production System (ALPS), was introduced and is suppose to work as an overall concept for all of Operations functions and processes. With ALPS Alfa Laval has consolidated four previously separated concepts; Alfa Laval Production Concept (ALPC) a concept with focus on standardized roles and processes for manufacturing, Alfa Laval Supply Chain (ALSC) a concept with focus on standardized roles and processes for administration, Lean Six Sigma and Supplier Development, into one, see figure 18 (Alfa Laval, 2010).
1 Cell status board (CSB) represents a physical board used by every production cell within operations. It displays
short term problems and daily updated KPIs. The CSBs are part of the Alfa Laval Production System (ALPS).

48
Figure 18 Four earlier isolated concepts are now consolidated under ALPS
5.3 Operations purchasing (OP) Operations purchasing (OP) was created in 2002 with the purpose to act as a global strategic function, capturing synergy by bundling purchasing volumes across the company (Interviewee 3, 2010; Interviewee 9, 2010). This was achieved by organizing the function after sub-groups of the supplier markets that Alfa Laval operated at that time (Interviewee 9, 2010). Six sub-groups were identified; metals (OP1), castings and forging (OP2), machining, forming and fabrications (OP3), electrical, instrumentation and flow items (OP4), seal, fasteners and transmission (OP5) and indirect material (OP6) (Interviewee 9, 2010). Under each commodity there are a number of global purchasers responsible of a part of that sub-area lead by a commodity chief. At the moment there are 18 global purchasers working at OP (Alfa Laval, 2010). When OP was created the company had around 3700 suppliers which have been reduced to around 2700 today. OP3; machining, forming and fabrications, has the largest supplier base with around 1170 suppliers (Interviewee 2, 2010). OP1; metals, has the least amount of suppliers with around 200 suppliers. This group buys standard commodities like different kinds of steel and therefore the group is ideal for bundling volumes (Interviewee 4, 2010). OP is geographically situated in Sweden: Tumba and Lund, and Denmark: Sörborg and Kolding (Alfa Laval, 2010).
5.3.1 Role and responsibility Alfa Laval has both local and global suppliers. The local suppliers only supply one production site and have relative low purchasing volumes. The global suppliers are connected to Alfa Laval by a key supplier agreement (KSA) and today 65-70 % of the total purchasing volume is covered by KSAs (Interviewee 9, 2010). The head of operations purchasing states that the commodity managers owns the supplier base connected to that commodity, both local and global suppliers (Interviewee 9, 2010). One commodity manager and the global purchasers interviewed states that they own the suppliers connected to KSAs and that the local site owns the local suppliers (Interviewee 8, 2010; Interviewee 3, 2010; Interviewee 2, 2010). OPs goal is to leverage the total buying power of the company and at the same time capturing the needs of each product group. How purchasers in OP work with different PGs differ between the commodity groups (Interviewee 2, 2010; Interviewee 3, 2010; Interviewee 8, 2010; Interviewee 1, 2010). Some are mainly focused on a single PG and some are focused on more than one PG. The purchasers who are working solely with one PG become closer to “every day issues” and operational problems (Interviewee 3, 2010; Interviewee 1, 2010). One mentioned reason for this is the geographical distance between the global purchaser and the main production site his/her suppliers serve. Another reason is the production sites he/she works with, since purchasing is organized in different ways, regarding strategic, tactical and operational activities, at different production sites (Interviewee 2, 2010; Interviewee 3, 2010; Interviewee 11, 2010). There is a general opinion in the company that OP‟s role and their responsibility is unclear (Interviewee 2, 2010; Interviewee 3, 2010; Interviewee 8, 2010; Interviewee 7, 2010;

49
Interviewee 4, 2010; Interviewee 1, 2010). One example of this is the lack of guidelines regarding escalation of problems. There are no guidelines when OP should be contacted when a problem occur which result in a long lead time before action is taken (Interviewee 4, 2010). How and when OP is contacted varies between factories; some solve all their problems themselves and other contact OP immediately (Interviewee 3, 2010). Savings are decided once a year at a handshake-meeting where OP meet with sourcing managers, local purchasers and product centers and discuss products, supplier performance and saving possibilities. At this meetings 15-20 savings projects are decided to be realized during the following year (Interviewee 8, 2010). The success of this process has differed between product groups; some are resilient towards OP and want to handle their purchasing and their suppliers by themselves and other are easy for OP to cooperate with. Even with product groups that are easy to cooperate with factors such as time (some parties did not have time to attend the meeting) has haltered the meeting some years. OP is much dependent on the cooperation with the factories and product groups when it comes to realizing savings since they have no “real” power regarding from whom the factories buys, in the end this is decided by the factory management (Interviewee 11, 2010; Interviewee 2, 2010).
5.3.2 Key performance indicators Historically the purchasing of Alfa Laval has been measured through six KPIs called star goals (Q1 2004 – Q2 2010). These were; (1) price trend (purchase price variance (PPV)), (2) delivery on time (DOT), (3) supplier quality, (4) lead time, (5) SBR and (6) payment terms. The goal for supplier base reduction was a 25 % reduction over three years (Alfa Laval, 2010). Every site was measured on these goals and the performances were aggregated to the main suppliers and OP (Interviewee 2, 2010). In reality the focus from OP were DOT and PPV with the main focus on PPV (Interviewee 2, 2010; Interviewee 3, 2010; Interviewee 1, 2010; Interviewee 4, 2010). OP has an annual cost saving target based on a deviation between a standard cost that is set in the start of the year and the actual cost measured in the end of the year (Interviewee 11, 2010). In the new strategy period starting 2010 the KPIs were cut down to three; total cost, DOT and quality (Alfa Laval, 2010). Since there has not been developed a way to capture a total cost of purchasing yet the PPV represent total cost (Interviewee 2, 2010).
5.3.3 Availability of purchasing data Purchasers in OP can get global information about their suppliers in different ways. The spend is consolidated in an excel file, called the master data file, manually by asking every site about their spend twice a year (Interviewee 2, 2010; Interviewee 3, 2010). It varies how much the excel file is used by global purchasers, some use it and other find it worthless due to the data quality (Interviewee 12, 2010; Interviewee 3, 2010). All purchase orders to suppliers are placed by local purchasers and since the excel file is only updated two times a year the global purchasers cannot monitor if decisions to for example change a supplier are complied by the local purchasers (Interviewee 11, 2010). The DOT is captured in different ways by OP; for some sites who operate a certain ERP-system there is a business intelligence tool and for the sites not using this system the DOT is either requested from the site or from the supplier (Interviewee 2, 2010; Interviewee 3, 2010; Interviewee 1, 2010). OP also got a global data base with all KSAs, and it is said that all local supplier agreements should be registered but not all factories have added their suppliers (Interviewee 4, 2010).
5.3.4 Commodity strategy and risk In 2009 there was an initiative to conduct a portfolio analysis in commodity group 3 (OP3) (Interviewee 11, 2010). The initiative started when OP3 developed a strategy for their group. The OP management group decided to roll out a portfolio model based on Kraljics matrix on all commodity groups and consultants were brought in (Interviewee 11, 2010). Two pilots were conducted but the project stalled due to a problem to decide if the segmentation would

50
be done from a component or a supplier perspective (Interviewee 11, 2010). Another problem was that much of the work was delegated to the sites that had no time to complete the work (Interviewee 11, 2010). Supply risks for a component are evaluated by the responsible purchaser in OP. How this evaluation is conducted differs between purchasers and there is no common process or strategy for evaluating risks (Interviewee 12, 2010; Interviewee 3, 2010). One global purchaser mentions that the factors he takes into consideration when evaluating risks are; how critical the component is for the final product, how fast a replacement supplier can be started and how reliable the supplier is (Interviewee 4, 2010). Another global purchaser states that he mitigate risks by ramping up the volumes bought to enable an early identification of problems when a new supplier is introduced (Interviewee 12, 2010).
5.3.5 Demands OP work with different demands from their internal customers (factories and product centers). These demands vary on different levels, for example how much support a factory needs to find a new supplier compared to another factory, or differing product characteristics of diverse product groups. For example are the HSS products more technically complex than the BHE and PHE products (Interviewee 11, 2010). Varying demands from different factories can also cause problems for OP when a supplier supplies more than one factory (Interviewee 11, 2010; Interviewee 9, 2010; Interviewee 8, 2010). This because the supplier then needs to adjust to these demands, handling different factories in different ways regarding for example certificates, pallet labeling and standard forms (Interviewee 11, 2010; Interviewee 9, 2010; Interviewee 8, 2010). One site realized the need of a “supplier handbook” that described the different demands they had on suppliers. Two other factories copied 80% of the “supplier handbook” and adapted it to their demands. This initiative caught OP‟s attention and it was decided that these three sites should develop a global “supplier handbook” for all sites (Interviewee 11, 2010).
5.4 Product Groups In this section the three PGs included in this study will be described in detail. The purpose is to create an understanding of the specific needs each of the PG has and how their product characteristics differ. The description of the PGs will show how they work with purchasing on a PG-level and site-level. Since PHE and BHE share PC only two PCs are included in this study.
5.4.1 Plate heat exchangers (PHE) The plate heat exchanger (PHE) product group is the largest product group in Alfa Laval. 2009 PHE constituted 23 % of the total turnover of the company and utilized 282 suppliers2. Plate heat exchangers are produced at nine manufacturing sites in Sweden, Italy, Russia, China, Brazil, South Korea, USA, Japan and India. The largest factory is situated in Lund at the same site as the Alfa Laval headquarters. PHE‟s product range offers both standardized products and design to order, customer specific, products (Alfa Laval, 2010). The manufacturing sites producing PHE do most of the value adding activities in-house, from pressing the channel plates and painting the frames to assembling the heat exchanger (Interviewee 15, 2010). Product center CHE PHE and BHE are included in the compact heat exchangers (CHE) product center. The product center has no dedicated quality organization; instead the quality work is carried out as a secondary activity by various people in the product center. For example is the test lab
2 Data based on the master file (see chapter 5.3.3 for information about the master file)
51
manager the lead quality coordinator 50 % of his time. The lead quality coordinator gathers and analyzes the corrective actions status of the unit, which in this case is the product center. The corrective action is the “solution” to a customer claim. Product development engineers become involved in claims if they get elected to be investigating person. An investigating person is responsible to come up with a corrective action for the claim. In this way the product development engineers work with quality as a part of their other activities (Interviewee 15, 2010). The number of suppliers a product developer has contact with (direct or through purchasers) varies depending on the component he or she is responsible for. The product development engineers working with PHE in product center CHE are divided in two groups. One of the groups designs the frames and the other the plates and gaskets. Since the frame part includes more components and more suppliers the developers responsible for the frame have more suppliers to keep contact with than the developers in the gaskets and plates team (Interviewee 3, 2010; Interviewee 15, 2010). The frame team consists of seven engineers each responsible for a group of components, for example is one engineer responsible for bolts (Interviewee 13, 2010). There are guidelines saying that the responsible engineer should establish a closer relationship with the suppliers for his or her components and all engineers should have at least one supplier visit per year (Interviewee 13, 2010). For cost reasons the engineers mostly visits Scandinavian suppliers. The manager of the frame group wants a closer collaboration with suppliers than they have today. The manager hopes that this can facilitate exchange of new ideas with the suppliers enabling the engineers to design better products to a lower cost (Interviewee 13, 2010). The product developers in the frame team work with purchasing in two types of projects, new product development (NPD) and engineering changes (Interviewee 13, 2010). In NPD projects there is always a representative from purchasing included in the project team. The purchaser‟s role is to evaluate the sourcing possibilities of new components, check design suggestions with suppliers and check that all local suppliers of each production site can support components to a new product (Interviewee 13, 2010). Engineering changes are smaller changes of an established design. The frame group has recently launched a new process for how engineering changes should be distributed to the production sites. Poor quality of the implementation of changes caused the redesign of the distribution process. Many changes were not implemented due to lack of time for the sites and miss communication between the sites and the developers. In the new process every change has an implementation plan which comprises for example how to handle the phase out of old components (Interviewee 13, 2010). When a new supplier is introduced purchasing rarely contact product development. This has historically not been demanded by product development who assumes that the documentation they provide should be followed. But the lack of communication regarding new supplier introductions has caused problems in the past. One example is when purchasing changed supplier on a protecting sheet (a component in a plate heat exchanger) without checking with product development. When the new supplier started to deliver the protection sheets a sign on the side of the sheet was missing. After some investigation it was shown that the documentation was not updated for the sheet. There had been an agreement between purchasing and the old supplier to add signs on the sheets without updating the drawing. The new supplier got the obsolete drawing without signs (Interviewee 13, 2010). Purchasing at the Lund site The Lund site is the main manufacturing site within the company. Plate heat exchangers are the main products manufactured at the site but also some brazed heat exchangers are produced here. The factory is divided in two component units and five supply units where the component units manufacture the components and the supply units assembly the heat exchangers. Purchasing is conducted locally by three different departments at the Lund
52
factory. The two component units, operations manufacturing component frames (OM-CF) and operations manufacturing component plates (OM-CP), perform the operational tasks like call offs and monitoring deliveries. A strategic function, operations manufacturing purchasing (OM-P), works with local agreements and handles escalated problems. OM-P is the window between the Lund site and OP. Two purchasers and one purchasing manager work at the OM-P and the commodities are divided between the purchasers (Interviewee 1, 2010; Interviewee 4, 2010). Historically the site has tended to focus on DOT which has caused disagreements with OP who have focused more on price (Interviewee 3, 2010; Interviewee 4, 2010; Interviewee 1, 2010; Interviewee 2, 2010). OP has sometimes negotiated a contract with a new supplier without anchoring the change completely with the factory, focusing on the better price but not on how it will impact the supply situation for the factory (Interviewee 3, 2010). Purchasing in general for PHE When the volumes rose in 2006 and 2007 the lead times increased and caused problems for the PHE factories. This made the sourcing manager of PHE to start working with a purchasing strategy for the product group. The main theme in the strategy is to have at least two suppliers for each component where the main volume goes to the supplier with the best total cost. At least one supplier should be regional (for example based in Europe if supplying the Lund site). The strategy stresses that every component, not site, should have two suppliers which means that sites can share suppliers. Along with developing the strategy the sourcing managers also mapped all suppliers for each component at all the nine sites and compiled the data. An analysis of the data enabled him to realize possible supply risks for individual components (Interviewee 1, 2010). Around half of the turnovers for the Lund site are contract orders which are customer specific, often high value, orders. Many of the components for these orders are order unique and have a long lead time so if one component has quality problems and need a replacement the entire order can be delayed. The contract orders often have punishment clauses which mean that one delayed order unique component can cause a lot of costs (Interviewee 1, 2010). There is a business intelligence tool called Operation BI, covering five of the nine manufacturing sites of PHE and approximately 90 % of the total volume. The tool shows the supplier performance of these five sites (Interviewee 14, 2010). Today there are no rules saying when to start a supplier development project. The projects are always reactive and are started when a supplier underperform in some way (Interviewee 4, 2010). The sourcing manager mentions the importance of doing supplier development projects with the right receiver. The supplier needs to be big enough to have a quality system but not too big otherwise cannot Alfa Laval have an impact on how the supplier works (Interviewee 1, 2010). It often costs more to change a supplier than develop an existing. Cost drivers for changing are for example tools, licenses, certification and testing (Interviewee 4, 2010). To coordinate the factories the sourcing manager and a global purchaser had telephone meetings with all the sites on a regular basis. But this procedure was too time consuming and were canceled (Interviewee 3, 2010). The demands on a supplier can vary a lot between sites within PHE. Examples of demands that can vary are documentation needed, pallet labeling and certificates (Interviewee 4, 2010).

53
5.4.2 Brazed Heat Exchangers (BHE) The brazed heat exchangers represent 9 % of Alfa Laval‟s total sales and are mainly OEM products. The Brazed heat exchangers are much like the heat exchangers in PHE with the difference that they are smaller and brazed together instead of screwed. There is no spare part market for BHE‟s products, when a product breaks it is replaced. The biggest different between BHE and PHE is that BHE‟s products are high volume products and their manufacturing setup are more of a line production set up. Some of BHE‟s customers are working a lot like the car industry with specific standards, certificates and quality systems and these requirements are passed on to BHE. There is a trend on BHE‟s market with demands on shorter lead times. BHE has four manufacturing sites and approximately 753 suppliers (Interviewee 16, 2010). Purchasing at the Ronneby site The Ronneby site is the main site for BHE and the sourcing manager for BHE is also the purchasing manager for the site. The sourcing manager‟s work consists mostly of sorting out problems and fixing non functioning processes at the Ronneby site. In addition to the sourcing manager, there are five people working with purchasing in Ronneby and three of them are working with material planning (Interviewee 16, 2010). The Ronneby site has had some problems with the DOT and when they started to look into the matter it was realized that it was the internal processes that were failing. The suppliers have realized this and are aware of that the site has had problems with for example reporting the right lead time. When BHE then complains about failing DOT the suppliers just answer that BHE‟s figures are incorrect (Interviewee 16, 2010). Purchasing in general for BHE In order to meet the high customer demands on quality and specific certificates, BHE has transferred these demands on to their suppliers. BHE prefers suppliers who have experience working with high volumes, OEM-customers and statistic process control. The SM explains that the communication with OP is difficult because even if they within the PG understands the customer‟s needs and what requirements this puts on their own suppliers it can be hard to explain this to a person outside the PG (Interviewee 16, 2010). BHE is planning to start develop an own purchasing strategy and a meeting is scheduled at the BHE site in Italy where strategic matters as number of suppliers for certain components and identifying strategic products, will be discussed. A global purchaser has been invited to this meeting and he has prior experience from working within the car industry and works close with BHE and is often consulted by the SM. The SM believes that strategic guidelines regarding these matters will facilitate the communication with OP. The SM thinks that OP has too much focus on price and that this can be devastating to the total cost. He believes that only the PG can evaluate what is best for the total cost (Interviewee 16, 2010). His goal is to work more strategic with purchasing within BHE. He has not been allocated the resources he wants so his plan is to utilize the global purchaser with experience from the car industry more and automate some of the material planning work and by doing that free resources to more strategic tasks. The SM emphasizes the need to fix all internal processes before looking external. He is currently working primarily with problems at the Ronneby site, developing new and redesigning non bad performing processes. He explains that there are not enough resources to develop new processes parallel on all the sites and that Ronneby will be used as a benchmark when later developing the other sites.
3 Data based on the master file (see chapter 5.3.3 for information about the master file)

54
5.4.3 High speed separators (HSS) The separators are the oldest part of Alfa Laval and the first separators were developed over a hundred years ago (Alfa Laval, 2010). Alfa Laval-HSS is today one of two major global players on the high speed separator market, but there are many strong players on the local markets (Interviewee 5, 2010). HSS represents 14 % of the total sales of Alfa Laval, has five manufacturing sites worldwide (Alfa Laval, 2010) and has approximate 500 suppliers4. HSSs products are characterized by their complexity with many different components and some of them are rotating with high speed. The products are mostly customer unique with non standard components produced in a crafting manner often by forging or casting by HSS‟s suppliers (Interviewee 7, 2010). Product center HSS Quality has a big part in how HSS‟s product center (PC) is organized. The PC has a quality process manager reporting directly to the head of the PC and a quality assurance group consisting of nine people. The background to the development of the quality assurance group was a quality meeting that was held in 2006. This meeting was the starting point for Alfa Laval‟s work with the “total productivity and quality management”-concept (TPQM). The activities that followed after the meeting led to that concern management decided (2008) that the PCs within Alfa Laval were responsible for the product quality. Before the meeting there was no ownership of the product quality in the organization, no cross-functional forums for collaboration and no transparency tools within HSS. There were examples where the same problem had been solved 15 times in 15 different ways. Without transparency no signals were sent to point out the issues that were causing the problems (because they were seen as 15 unique problems) (Interviewee 7, 2010). The quality assurance group can be described as a quality matrix with three main functions (see figure 19); Design support, PC quality functions and cross-functional forums. The design and support function they are responsible for keeping CAD- (computer aided design) and PDM- (product data management) tools updated and that they meet the requirements concerning traceability correctness and legal incapacitation (product safety and environment related regulations etc). The PC quality functions create visibility for the quality matters within HSS having investigating persons for quality follow ups, claims management, incident and accident analysis etc. In the top of the cross-functional forums part there is the Product quality board, which consists of people from R&D, OP, operations manufacturing, two segments and operations logistics. This is a decision making function that has authority to take cross functional decisions. The quality improvement teams have different focuses; one is dedicated to the factories, one has focus on the distribution centers (parts), one on the different departments at the PC and one has focus on the suppliers (Interviewee 7, 2010).
4 Data based on the master file (see section 5.3.3 for information about the master file)
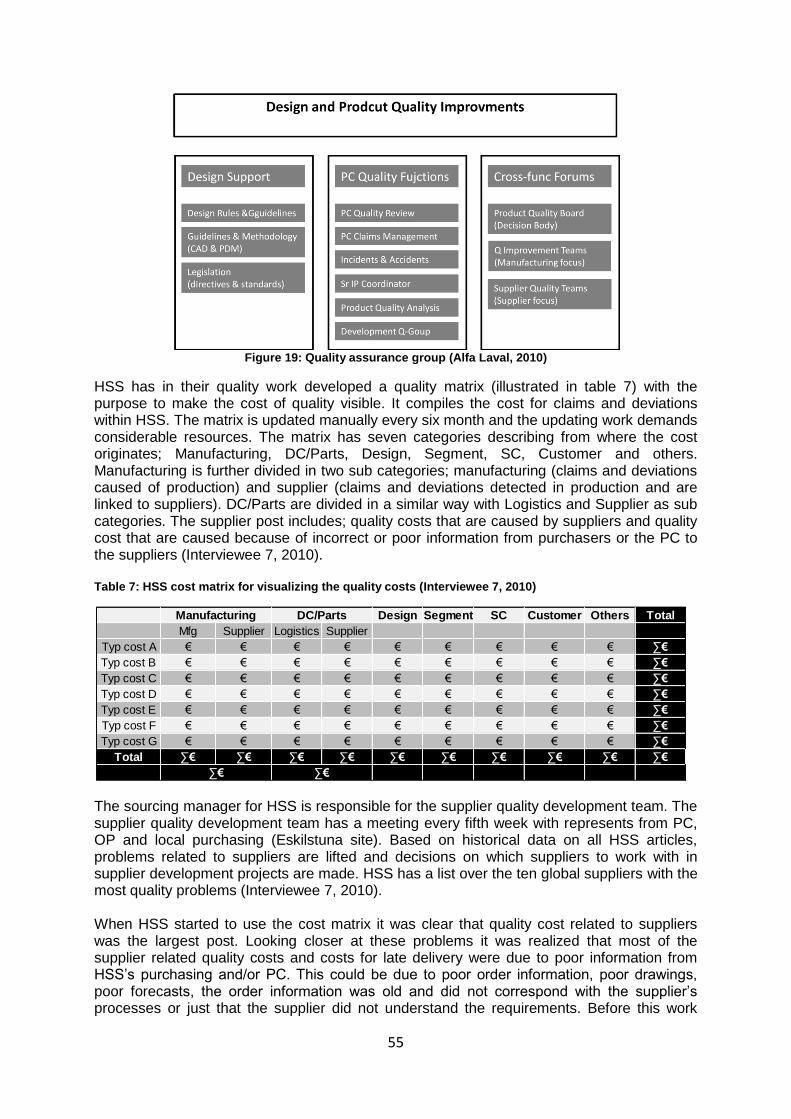
55
Figure 19: Quality assurance group (Alfa Laval, 2010)
HSS has in their quality work developed a quality matrix (illustrated in table 7) with the purpose to make the cost of quality visible. It compiles the cost for claims and deviations within HSS. The matrix is updated manually every six month and the updating work demands considerable resources. The matrix has seven categories describing from where the cost originates; Manufacturing, DC/Parts, Design, Segment, SC, Customer and others. Manufacturing is further divided in two sub categories; manufacturing (claims and deviations caused of production) and supplier (claims and deviations detected in production and are linked to suppliers). DC/Parts are divided in a similar way with Logistics and Supplier as sub categories. The supplier post includes; quality costs that are caused by suppliers and quality cost that are caused because of incorrect or poor information from purchasers or the PC to the suppliers (Interviewee 7, 2010). Table 7: HSS cost matrix for visualizing the quality costs (Interviewee 7, 2010)
The sourcing manager for HSS is responsible for the supplier quality development team. The supplier quality development team has a meeting every fifth week with represents from PC, OP and local purchasing (Eskilstuna site). Based on historical data on all HSS articles, problems related to suppliers are lifted and decisions on which suppliers to work with in supplier development projects are made. HSS has a list over the ten global suppliers with the most quality problems (Interviewee 7, 2010). When HSS started to use the cost matrix it was clear that quality cost related to suppliers was the largest post. Looking closer at these problems it was realized that most of the supplier related quality costs and costs for late delivery were due to poor information from HSS‟s purchasing and/or PC. This could be due to poor order information, poor drawings, poor forecasts, the order information was old and did not correspond with the supplier‟s processes or just that the supplier did not understand the requirements. Before this work
Design Segment SC Customer Others Total
Mfg Supplier Logistics Supplier
Typ cost A € € € € € € € € € ∑€
Typ cost B € € € € € € € € € ∑€
Typ cost C € € € € € € € € € ∑€
Typ cost D € € € € € € € € € ∑€
Typ cost E € € € € € € € € € ∑€
Typ cost F € € € € € € € € € ∑€
Typ cost G € € € € € € € € € ∑€
Total ∑€ ∑€ ∑€ ∑€ ∑€ ∑€ ∑€ ∑€ ∑€ ∑€
Manufacturing DC/Parts
∑€ ∑€

56
started the purchasers claimed that they did not have any deviations but the new way to work has created awareness of the problems and forces the purchases to deal with the problems. There are examples when a supplier received incorrect order information and due to this the supplier was not able to deliver correctly at first but learned to do it right by time. When HSS then switched supplier the knowledge was not transferred and the new supplier committed the same mistakes as the first supplier did (Interviewee 7, 2010). Purchasing function at the Eskilstuna site The Eskilstuna site is HSSs center for production and production technology. The site is responsible for producing medium and large size separators for food and industry applications. Furthermore Eskilstuna is manufacturing bowl kits (component in a separator) to other HSS-sites and spare parts (Alfa Laval, 2010). Eskilstuna‟s purchasing department consists of five local purchasers. The department is organized by commodities and each purchaser is dedicated to one or a few of the six commodities. The purchasers are responsible for contracting with local suppliers, call offs and fire fighting. The sourcing manager for HSS is situated in Eskilstuna (Interviewee 5, 2010). The site has recently completed an improvement work for its purchasing function. With the help of a consultant, new processes and four new or revised KPIs; availability (is the supply at place when the production of the order starts?), quality, delivery on time (DOT) and stock levels, were introduced (Interviewee 5, 2010). The Eskilstuna site has a quality function consisting of five people. One of the team members works 50% as a quality engineer towards purchasing. He‟s work consists of doing supplier audits and support the suppliers when they have quality problems (Interviewee 6, 2010). Purchasing in general for HSS The separators include parts rotating at a very high speed and a breakdown can have lethal consequences. This makes the quality aspect extra important for some of the components. Because of this the PC has classified some components as security components and for these purchasers are not allowed to switch supplier without involving the PC (Interviewee 7, 2010). There are no system support where the purchasers can get an overview over the total spend within HSS. If the purchasers want global data they have to request specific data from each site and then compile it. Due to data availability no “aggregated analysis” is carried out on a regular basis (Interviewee 5, 2010). There are no policies for how to handle supply risk regarding for example whether to use single, dual or multiple sourcing. However single sourcing is often the only option due to the characteristics of the bought components (low volumes and advanced production) (Interviewee 5, 2010). The sites requirements (type of pallet, height of the pallet, wrapping etc) towards the supplier are inhomogeneous. There are one example of an Indian supplier that delivers to multiple sites with different requirements and documents to write to every site (Interviewee 5, 2010). The sourcing manager of HSS sees a lot of benefits in having global suppliers and strives for making their local suppliers global. He thinks that having the support from OP is valuable because they have stronger impact on the suppliers and are competent to solve complex problems. He thinks that the cooperation between OP and local purchasers works well. The sourcing manager for HSS believes that the collaboration within the PG must be in place before collaboration between the PGs can be realized (Interviewee 5, 2010).

57
HSS has a supplier development team that works with HSS entire supplier base. They are working proactive by helping the suppliers in the upstart phase, discussing and explaining drawings and requirements. They also help suppliers with quality problems; supporting them to identify the root cause of problems and come with suggestions on how they can change their processes (Interviewee 10, 2010). HSS is working with technical delivery requirements (TDR). The TDR are sent to the suppliers describing certain functions that the bought product must have (for example the product must stand a certain shock test). When buying products by article numbers (standard shelf products, example electric motors that are bought annually for millions of €) TDR is not used and this has caused a lot of problems when suppliers have changed the functionality of the product and kept the article number. The PC is currently working with developing TDR for these products as well (Interviewee 7, 2010).
5.5 Thoughts about SBR
During the interviews people have been asked if they have any thoughts on SBR. These thoughts regarding a potential SBR initiative at Alfa Laval will be presented in this section. The thoughts are divided in four sections presenting the thoughts different parts of the organization have regarding SBR. The logic behind this is that each part has its own view on SBR.
5.5.1 OP There is a general consensus in OP about the importance of implementing SBR and that there are way too many suppliers today. But many see a problem in how to measure and prove the monetary benefits (Interviewee 3, 2010; Interviewee 11, 2010). One important factor is to become a more important customer for the supplier to get attention which will result in better service and quality (Interviewee 3, 2010; Interviewee 8, 2010; Interviewee 9, 2010). The head of purchasing argues that one can never influence and develop a supplier if there is no volume backing up and creating attention. He also believes that a reduction of the supplier base will lead to lower cost in form of better price agreements (Interviewee 9, 2010). One global purchaser mentions the importance to reduce the supplier base of the right products; “some products weigh too much and cannot be sourced globally since transport cost eats up the price advantage. SBR will not fit every bought component instead it should be evaluated case-by-case” (Interviewee 3, 2010). One commodity chief explains that Alfa Laval has a “tail” of suppliers which means that they have a lot of suppliers with a low spend/supplier, see figure 20. These suppliers deliver a large part of Alfa Laval‟s article numbers (the total spend for these suppliers are low but the number of active article numbers are high). The problem is that OP has little or no control of these suppliers since they are local and not handled by OP. As they have no control the chance of an under-performing supplier in this group increases (Interviewee 8, 2010).

58
Figure 20: Suppliers with a low spend/supplier create a ”tail”. Each column in the diagram represent the
spend of a supplier. This is an example without “real” figures
The head of purchasing and two commodity chiefs argues that Alfa Laval should not wait to reduce the supplier base. They mention that the visibility regarding the spend is low today but high enough to be able to start the reduction (Interviewee 9, 2010; Interviewee 8, 2010; Interviewee 11, 2010). In earlier supplier base reduction efforts conducted by OP1 the purchasers used the master file to identify factories with many suppliers. Then they contacted the factories to ask them which suppliers they could phase out and after that evaluated the result. One global purchaser states that he has no idea if the reduction was realized since there was no follow up (Interviewee 4, 2010).
5.5.2 PHE A strategic purchaser at the Lund site stresses the importance of showing the monetary benefits of reducing the supplier base if the initiative should be realized. He also argues that from a total cost point of view there are components that one should not be “lean” on regarding how many suppliers are utilized. The reason is that the supply risk outweighs the benefits from having a low number of suppliers for the component. He also mentioned the importance of clarify who owns what supplier in the organization (Interviewee 4, 2010).
The sourcing manager of PHE finds the lack of standardization regarding components in the different products a bigger problem than having many suppliers (Interviewee 1, 2010).
5.5.3 BHE The sourcing manager of BHE has experienced that OP is pointing at suppliers for BHE to remove but he argues that these suppliers are utilized for a reason. OP‟s role should be to challenge the PGs and ask them why certain suppliers are utilized, but it is up to the SM to choose which suppliers that should be removed (Interviewee 16, 2010). SBR is not a primary activity; it should be followed by other activities (Interviewee 16, 2010). The strategy describing how many suppliers that should be used and the demands on the suppliers should be decided by the PG (Interviewee 16, 2010).

59
5.5.4 HSS HSS‟s sourcing manager sees advantages to work close with suppliers due to the complexity and small volume of the bought products. To ensure quality HSS must work close with the suppliers in order to have an impact on the supplier (Interviewee 5, 2010). HSS‟s sourcing manager thinks that the SBR initiative should be carried out in projects within each PG (Interviewee 5, 2010). The quality people in HSS that are working with supplier issues in their day to day business all think that it is favorable to consolidate the volumes as a way to ensure the quality of the bought products. This because when HSS has considerable volume they have bigger impact on the suppliers and can come with suggestions on how the suppliers should change their processes in order to reach HSS‟s quality standards (Interviewee 7, 2010; Interviewee 6, 2010; Interviewee 10, 2010). Quality people see SBR as a way to reduce the number of speaking partners and build a closer relationship with the suppliers (Interviewee 7, 2010; Interviewee 6, 2010).

60

61
6 Analysis of the case company, using the conceptual model This chapter will give an analysis of the data gathered from the case company regarding
issues raised in the conceptual model. All areas in the model are included in the analysis.
The analysis is concluded in section 6.2 giving an overview of the findings of the case study.
In section 6.3 the practical relevance of the conceptual model is discussed.
6.1 Analysis of the case company This thesis analyzes the intentions with a SBR initiative and its place in the overall purchasing strategy at the case company. Further the analysis discusses how commodity strategies can support a SBR initiative at the company and how the needs of different BUs need to be considered and how it will affect the implementation of a SBR initiative. The purchasing organization structure has also been analyzed – how differentiation in processes and demands towards suppliers as well as unaligned goals can affect a successful implementation of SBR and possible gains received from it. In the section forum for collaboration a possible way to bridge these issues is presented. The possibilities to get a holistic view of the spend and data visibility at the case company has been analyzed in the section Spend and supplier performance analysis. Why Alfa Laval should reduce its supplier base, what activities should be conducted prior to a reduction and thoughts about an implementation of SBR are presented in SBR approach. Finally the areas (from the conceptual model) objectives and purposes with SBR, Stakeholder mapping, Supplier evaluation and Performance measurement are analyzed.
6.1.1 Purchasing strategy As suggested in the conceptual model, literature states that a company must be clear on how the SBR initiative will support the company‟s overall purchasing strategy. SBR should not be carried out as an isolated activity. It should be part of a well thought plan or overarching purchasing strategy (Ogden and Carter, 2008; Goffin et al., 1997). Goffin, Szwejczewski and New (1997), Goffin, Szwejczewski and Lemke (2001) and Cousins (1999) all argue that it is necessary to have a supplier relationship strategy adjacent to the SBR initiative, and that the supplier performance will not automatically be improved by just having fewer suppliers. One of the possible pitfalls with SBR is to believe that SBR itself will increase the purchasing power and improve supplier performance. The reason is that companies believe that increased buying power accomplished by bundling volumes alone will lead to increased purchasing power. But at the same time as a company increases its buying power achieved from higher volumes, it will also be exposed to new strategic risks due to increased dependence on fewer suppliers which can decrease the purchasing power of the buying company. Thus, the company must assure that it has the competences needed to manage this new condition for the supplier relations, otherwise the prices will rise and force the company to increase its supplier base (Cousin, 1999). Sourcing is a prioritized area in Alfa Laval‟s current company strategy. Hence, a sourcing road map has been created as a guideline for development of Alfa Laval‟s purchasing. The sourcing roadmap has been developed in a “brainstorming manner” and the connection between SBR and the 41 other recognized purchasing activities are not clear. One clear example is that the activity titled “develop a commodity strategy model” is a parallel activity to SBR. According to the developed conceptual model in this study, the commodity strategy is something that should be developed before initiating SBR. The consequences of not having a commodity strategy when initiating a SBR initiative will be analyzed in the next section. The meeting about sourcing held in may 2010 at Alfa Laval, focused on prioritized areas in the sourcing roadmap. Judging from the issues raised at that meeting regarding SBR (compiled in appendix l) there are several good thoughts about risks and issues concerning a SBR initiative and on how the SBR should be carried out. But there has not been any discussion on why SBR should be carried out and what the desired out puts are. Three of the global purchasers that were in the “sourcing roadmap team” have been interviewed and they

62
thought the logic behind SBR for Alfa Laval should be consolidation of volumes to fewer suppliers in order to increase the company‟s purchasing power. A general opinion from OP is that SBR is a tool to increase purchasing power and this purchasing power will allow Alfa Laval to get more attention from its suppliers mainly for price negotiation but also to be a prioritized customer. None of the advocates (OP) at Alfa Laval discuss how the new strategic exposure with increased dependent on fewer suppliers should be managed. This can lead to suppliers exploiting the increased dependency, and Alfa Laval to be forced to increase the number of suppliers again. More on how to resolve this issue will be discussed in section 6.1.4 and 6.1.6. Looking at the chronological placement of SBR in the sourcing road map at Alfa Laval and OP‟s arguments for SBR, it seems that there is no logical chain on how the SBR initiative will support the overall business. Alfa Laval‟s main argument for SBR is to increase purchasing power which will result in increased supplier performance, mainly price. With this approach Alfa Laval is risking to fall in one of the pitfalls described in theory, believing that SBR solely will improve the supplier performance. This will lead to Alfa Laval spending resources on reducing the supplier base without getting any pay back - since the supplier performance will not be improved solely by the SBR initiative. Alfa Laval‟s initiatives with a new purchasing strategy are intended to increase focus on proactive work with quality of inbound material - this is reflected in the developed sourcing roadmap with specific improvement activities and a new production system (ALPS) where supplier development is one of four included concepts. These strategic intentions should be the reason for SBR to be carried out and the role it should play in Alfa Laval‟s overall purchasing work. This does not mean that the potential benefit with increased purchasing power should be neglected. But that the SBR initiative must not be seen as an isolated action carried out with a single purpose to increase the purchasing power. It seems that there has not been any clear rationalism behind SBR‟s role in the overall purchasing strategy. This will further discussed in the section SBR approach.
Commodity strategy Ogden and Carter (2008) suggest that a commodity strategy should be in place before a SBR project. A developed commodity strategy will support the reduction of the supplier base since there will be guidelines for how many and what types of suppliers are desired for each bought component. SBR and developing a commodity strategy are two parallel activities in Alfa Laval‟s sourcing roadmap. This indicates that when the roadmap was created a developed commodity strategy was not seen as a necessity in order to initiate a SBR project. The fact that some purchasing managers thinks that Alfa Laval should begin with the SBR as soon as possible also indicates that a commodity strategy is not seen as a necessity to develop before the reduction of the supplier base. A commodity strategy will most likely be helpful for Alfa Laval if they want to reduce their supplier base. Alfa Laval has different PGs with different needs and the company has a central purchasing function working towards all the different PGs. A commodity strategy will give each PG guidelines on how many suppliers they should have on each product and what kind of suppliers that are desired. Having these things in place and comparing the desired number of suppliers with the actual number makes it is easy to identify where a reduction is possible. It will also help the global purchasers to understand the needs of each PG and each PG‟s bought components. A commodity strategy would support the global purchasers‟ decision making, to understand the most important issues for each PG and their products. A commodity strategy must be derived from the end product - the impact each bought product has on the end product is a vital input when developing a commodity strategy. A bolt

63
may have a critical function in a separator and this requires a certain supplier. The same bolt may have a non critical function in a heat exchanger, same item but requires different sourcing approaches. Alfa Laval‟s end products differ in their characteristics between the PGs and a commodity strategy should be developed for each PG and not for each commodity group that OP is divided by (see figure 21). Alternatively if some PGs have similar end product characteristics a common commodity strategy can be developed for these PGs. The PG‟s commodity strategies can be seen as one strategy derived from each of the PGs. The important thing to realize is that the function bought products have in the end product matters and has to be considered when developing the commodity strategy. It is important to manage the supplier relations in a proper way (right relation and right supplier for each bought component) in order to mitigate the strategic risks due to a fewer number of suppliers (e.g. higher dependency). At the case company it seems like that there is no consensus or guidelines for how Alfa Laval should manage their supplier relations or what should be prioritized when it comes to supplier performance and capabilities. This has caused disagreements between the sourcing managers and the global purchasers. The sourcing managers think that the global purchasers focus too much on leveraging the purchasing power in order to lower prices which can lead to supply disturbances (DOT and quality are inadequate). The sourcing managers believe that the global purchasers should focus more on quality and DOT. At the same time the global purchasers‟ opinion is that the sourcing managers do not have enough understanding of the cost aspects. This means that two of the main stakeholders, in a possible SBR initiative, do not agree on which supplier performance and capabilities are most important and they do not have the same view on how the supplier relations should be managed. This will obstruct the success of the SBR initiative. There will be disagreements regarding which suppliers to keep and which suppliers that should be removed and there will still be a lack of consensus on how the supplier relations should be managed. And as mentioned proper managed supplier relations are a key in order to leverage from the SBR initiative. Since the commodity strategy gives guidelines on the proper relation and supplier performance and capabilities for each bought component a developed commodity strategy will help OP and local purchasing to come to a consensus on these matters. This is one concrete example on how the commodity strategy can facilitate SBR. Figure 21 below depicts how the commodity strategy should be derived from each PG and how it can support a SBR initiative.

64
Figure 21: How the commodity strategy must be derived from each PG’s end products and how the commodity strategy will support SBR
Van Weele (2005) argues that a portfolio model is preferable when creating a commodity strategy. A portfolio model is probably especially suitable (for the commodity strategy) when having a decentralized or a semi decentralized purchasing organization. This because when having a decentralized purchasing organization changes and implementation of new concepts is more likely to be rejected by some of the BUs. Portfolio models are easy to understand and that will probably increase the chance of it being accepted by all BUs. Alfa Laval has a semi decentralized purchasing department with BUs claiming that their needs are not always considered. The company has already failed once, when trying to roll out a commodity strategy using the portfolio approach, due to that the organization thought that it was too much work to implement the model. Hence it is important to not have a too complex portfolio model. The complexity of the portfolio model refers to how many matrixes (2 dimensions for each matrix) and which and how many criteria each dimension is evaluated on. The models presented in section 3.3.2 have its pros and cons regarding complexity vs. sophistication. Kraljic‟s (1983) model is an easy to understand portfolio model and Olsen and Ellram‟s model (1997) capture the supplier relationship management aspects. Since the PG‟s have different needs and the different sites are spread around the world Smith‟s (1999) “geographical sourcing model” can help Alfa Laval analyze when it is possible to use global suppliers.
Needs and characteristics of BUs at a multiunit company Theory emphasizes that in a multi unit company the needs of each BU must be captured in order to understand how SBR should support each BU. In the case company, there are two hierarchical levels of BUs; the PGs with their needs derived from their product characteristics, and the sites with their needs derived from their manufacturing set up. It is clear that there is a distinct difference between the PGs‟ product
65
characteristics. This study only included three of Alfa Laval‟s PGs buts some obvious differences have been observed by only investigating these three PGs. HSS and BHE are quite contrary to one another in production set up. HSS production is “make to order”, often a single unit, uses small local suppliers who often work in a crafting manner and the end product consists of many details that are bought from suppliers and assembled by HSS. BHE has more of a line set up with high volumes, prefers suppliers that are used to work with high volumes and does the most value adding activities in house. PHE is a mix between HSS and BHE, characterized by that it is the PG with the largest volumes and has an end product very similar to BHE. Thus the most important supplier performance criterion differs between the PGs. For example is lead time more important for BHE than for HSS, quality is the most important criteria for HSS and the main focus for PHE is DOT. When having different BUs, especially when the BU‟s end product characteristics differ, one must understand how this affects the possible approaches to the SBR initiative. The different approaches can for example be if the reduction should be carried out in each BU separate or across BUs, i.e. the possibility to share suppliers across BUs. The PGs have different needs because of their product characteristics and this will probably limit the possibility to reduce the supplier base since it is not always appropriate to share suppliers between the PGs, even if they buy the same type of component (because one PG might need short lead time and one PG might need high quality with certain quality certificates). Different BUs can have different needs regarding to the need for a local supplier or technical capabilities of a supplier. This can drive local purchasing strategies that differ from each other and/or the corporate purchasing strategy. In Alfa Laval the PG PHE has developed its own purchasing strategy but not because it has certain needs. The strategy is quite general and could as well been BHE‟s strategy. BHE is also about to develop a purchasing strategy and this is probably not because of certain needs either but because a clear purchasing strategy is missing. The development of local purchasing strategies has probably not been driven by the different BU needs but by the lack of communicated purchasing strategies. In section 4.1 the importance to understand the logic with initiating SBR is emphasized. This logic must also be connected down to a BU level. Whether the overall purpose supports all or just a few of the BU must be analyzed. At the case company the HSS‟s PC has a quality organization that is trying to work pro active with supplier performance. The PC is tracing supplier related costs and has realized that a lot of the quality problems related to the suppliers are caused by Alfa Laval, both by purchasers and the PC. It sees the benefit in having less speaking partners and to work close with less suppliers. A SBR initiative would, with proper supplier relationship management, support HSS way to work. PHE and BHE are not working with supplier development in the same extent as HSS and their PC does not have any supplier-dedicated quality engineers. However top management has now decided that Alfa Laval (all PGs) is going to work more proactive with supplier development in the future. This should be one of the primary arguments for a SBR initiative. If Alfa Laval wants to invest in their suppliers, improving their performance, it is not hard to argue for that they should have a limited numbers of suppliers. They can spend their resources on fewer suppliers and there will be less supplier relations to manage.
6.1.2 Degree of purchasing decentralization As summarized in the developed conceptual model the degree of purchasing decentralization affects the complexity of a SBR initiative. This was found relevant in the case of Alfa Laval. The company has a semi-decentralized purchasing organization with a local purchasing department at each production site responsible for local purchasing activities and local suppliers, and the central department OP responsible for global suppliers (supplier that supplies more than one production site). There are no central guidelines for how the production sites should organize and execute their purchasing. This together with factors such as size of the site, the site‟s geographical location (distance to product group headquarters) and the history of the site (if it was founded or acquired by Alfa Laval), have

66
resulted in unique and diverse ways of working with purchasing. The lack of common processes and purchasing uniformity will obstruct global purchasing initiatives such as SBR since it needs to be tailored to fit every product group (and sites within the product group). It also makes it very hard to benchmark between production sites to share best practices (Faes et al., 2000). These issues affect SBR since it makes the implementation harder. It is not reasonable to suggest an implementation of common, totally uniform, purchasing processes just to facilitate a SBR initiative. But it is important to understand the differences between the purchasing practices at the sites in order to make necessary local adaptations when planning how to implement SBR. One issue that could affect the potential gains from a SBR initiative, which is probably caused by the degree of decentralization, is the differentiation in the demands that are placed on global suppliers. Different sites have different demands regarding for example labeling, pallets sizes and certificates. This forces the supplier to work with different production sites in different ways. The supplier will lose some economies of scale due to the need for individual solutions for individual production sites, thus loosing incentives to prioritize and engage closer collaboration with Alfa Laval. Common demands and common processes are linked together since the demands are a result of the processes that involves a supplier. In this thesis these processes are called inter-external processes. Examples are information sharing (for example new drawings and forecasts distributed in the same way by everyone in contact with a supplier), making of certificates and package design. One way to facilitate common internal-external processes and demands is a supplier handbook. Alfa Laval has begun the work to develop a supplier handbook. The fact that three sites, instead of a central department like OP, have got the task might lead to a supplier handbook built around their needs rather than the needs of all sites. Instead the handbook should be created centrally in order to get a holistic view. One alternative is to create one part that would be global for all sites and then have complementing parts for each PG in order to see to the demands in each PG. In the conceptual model it is suggested that a decentralized purchasing structure will drive an expansion of the supplier base. Alfa Laval‟s supplier base consists of 81 % local suppliers, probably driven by decentralization. At Alfa Laval all sites organize purchasing as they like, which is decided by the local purchasing manager and the SM of the product group the site belongs to. This leads to that the likelihood of these managers mainly focusing on local needs instead of total cost for the company might increase (Dubois, 2003). The focus on local needs can be one explanation to the high number of local suppliers (i.e. around 2200 of 2700). This is because local suppliers are easier to cooperate with due to the geographical and cultural proximity and thereby a more natural pick than a global supplier. If the production sites only worry about their own performance and have a local focus, the likelihood of choosing local supplier over international would increase. The sites have a history of focusing on supply over price when it comes to purchasing which also increases the likelihood of local suppliers. These tendencies to use local suppliers need to be addressed in order keep a low number of suppliers after a reduction of the supplier base.
Collaboration between purchasing functions In the conceptual model it is argued that collaboration and purchasing synergy will support a SBR initiative. The most important purchasing synergy to capture regarding SBR is to share suppliers between business units, since sharing suppliers results in a reduced total number of suppliers (if two sites share a supplier instead of having two local suppliers the total number of supplier utilized will decrease). At Alfa Laval OP‟s role has historically been to save money through better negotiated agreements. This mission has clashed with the sites goal to keep the factory running to avoid delays to the customer - since suppliers offering the lowest price are not always the most reliable. To find low prices OP often need to look globally and a global supplier usually
67
comes with a higher supply risk due to distances. In the end the supplier should support the factory, not OP. But the purchasing cost is also important and a large part of the total cost of product. OP and the PGs need to align their goals, both parts need to be measured and rewarded in the same way and share common goals. The absence of goal alignment will obstruct collaboration between OP and PGs. This will hinder sharing of suppliers between sites since this requires that the sharing is coordinated by OP. One way of aligning the groups is to create common commodity strategies which will act as guiding “maps” to be used in different decisions. It needs to be clear what role and responsibility each part will have in achieving the common goals. Another problem regarding the collaboration between OP and SMs is the ownership of the supplier base. Today it is unclear who “owns” the supplier base. Some in OP states that they own the entire supplier base, including the local suppliers, and other claim only ownership of the global suppliers. Two SMs state that they own the local suppliers and that OP own the global suppliers. OP and SM need to come to a consensus about the ownership. If the ownership is unclear it is unclear who is responsible for reducing the supplier base and to keep it reduced. If no one is “looking after” the supplier base it might expand out of control again after a reduction.
Forum for collaboration Reducing the supplier base is a cross functional matter (Ogden, 2003, Ogden and Carter, 2008). Not only do different purchasing departments need to cooperate, other functions as R&D needs to be included to guarantee success. According to the conceptual model created in this thesis one way to facilitate the cooperation between purchasing departments at different production sites is to create a forum for collaboration. In Alfa Lavals‟s case this could be OP. The problem is that the role of OP is unclear. OP was created to be a strategic function working to leverage Alfa Laval‟s buying power. But it was never defined exactly where the line between OP and local purchasing should go and how the interaction should look. OP has coordinated the needs from different production sites and provided global suppliers, but not facilitated cooperation between sites. OP‟s role has never been to “interfere” in the daily work of the sites. Its role has been to handle the global supplier base rather than the total supply for a factory. To coordinate the daily work and processes between the production sites of a PG the sourcing manager‟s role was introduced. The problem was that the role was not anchored and specified enough which resulted in different SMs working in different ways. This led to different relations between OP and SMs, where OP works more closely with some SMs than others. Since all SMs except one have a shared role where they also are local sourcing managers much of their time gets devoted to fire fighting and running the local purchasing department. Hence they often lack time to fully be able to coordinate the sites in the PG. One way to establish OP as a real forum for collaboration is to dedicate resources that will be responsible to coordinate purchasing in each PG. Today it is hard for the global purchasers in OP to get full insight in the needs of each PG since there are so many PGs and production sights to cover. Personnel dedicated to coordinate purchasing in each PG could get this insight. It is very important that these personnel work closely and try to implement common processes across PGs as well as within PGs. It is also very important that these personnel be a part of OP and act as a bridge between the commodity groups in OP and the PGs, where the collaboration limps today. PG-dedicated OP resources will be discussed further in the section SBR approach.
6.1.3 Spend and supplier performance analysis In the conceptual model it is emphasized that the spend is essential to reach any of the desired gains from a SBR initiative. It is important to get a holistic view of the current

68
situation and to create visibility throughout the organization. Alfa Laval‟s spend is consolidated in an Excel-file (the master file) which is updated twice a year. The file is manually updated with information sent from the production sites. Since the manual consolidation creates inaccuracy and infrequent updates it is a poor tool for the purchasers to use. The master-file does not give any information about supplier performance which makes it even less useful, especially when it comes to SBR. The only way to get information about supplier performance and updated spend data is to ask the local production sites which is time consuming. Thus it is hard to frequently monitor the compliance of decisions regarding keeping or eliminating suppliers. Some people at Alfa Laval argues that a SBR-initiative should be able to start in the near future since the information about the spend and supplier performance is available at the production sites (local knowledge and ERP-systems). But if doing so there might be a risk that the production sites become totally responsible since this local information can be hard to share. OP needs to cover a lot of sites and there exist no processes for information sharing today. If the production sites become responsible it could lead to sub optimization if the sites only tries to reach a set goal (reduce x number of suppliers), instead of reducing in a way that facilitate the capturing of purchasing synergy (share information, suppliers, best practice etc). If for example a site is completely responsible of reducing its supplier base it might remove local suppliers and replace them with a lesser number of other local suppliers. If instead the responsibility is shared OP will drive the use of global suppliers (i.e. suppliers shared between sites). The chance of creating this shared responsibility would increase if both parties had the same information. The purchasing analysis data tool (PADT) will enable anyone (with access) to get an updated holistic view of the entire spend of the company and the performance of the suppliers. It will also be a “map” to use as a reference when analyzing and discussing which suppliers to eliminate. The current master-file can also fill this function but an Excel-file has limitations. As mentioned above it is rarely updated, and there can also be different versions available - a local purchaser might have an own up-to-date file with the spend of the local site that might differ compared to the actual version of the master-file etc. A dedicated section for SBR in PADT would emphasize the importance of the initiative and make it easier to find the tool-set needed for SBR when using PADT. This section could for example include; the current number of suppliers utilized (within a specified time and spend frame), a list of suppliers not utilized in a year (or another time specification), a list of suppliers with a low amount of transactions or order rows and a list of bad performing suppliers. These reports should be available both on an aggregated level and on PG and production site level.
6.1.4 SBR approach SBR approach in the conceptual model symbolizes that the areas purchasing strategy, degree of purchasing organization and spend and supplier performance analysis must be analyzed together in order to capture all relevant issues when planning for a SBR initiative. These issues are how the SBR supports the overall business and that the logic must be connected to the BU level. How the organization supports a SBR initiative must be considered so the SBR is planned in a way that is compatible with the organizational structure. The spend and supplier performance analysis give opportunities to reduce. Alfa Laval‟s goal for purchasing is to increase the importance of it, work more pro active and increase the focus on quality. The theory states that SBR is a prerequisite for advanced sourcing strategies. This is probably true in Alfa Laval‟s case, a global company with 2700 suppliers and 2200 of them being local suppliers. Having that many suppliers will obstruct implementation and leverage from advanced sourcing strategies such as supplier

69
development. Supplier development has specifically been stated by Alfa Laval as an area to focus on in the near future and SBR can support a supplier development initiative because:
When reducing suppliers resources will be freed and more can be spent on each supplier.
A reduction of the supplier base will result in more shared/global suppliers and an improvement of a supplier who delivers to two sites will have double the effect compared if the supplier would have delivered to just one of the sites (assumed that the sites buy the same volume).
Focus on supplier development makes sense since Alfa Laval has a brand with high repute which makes focus on quality and pro active work essential. SBR will support the supplier development initiative and supplier development will lead to better quality. Better quality will contribute to maintain Alfa Laval‟s strong brand. Hence SBR can support Alfa Laval‟s business top-down.
Capturing BU needs and keeping a holistic view In order to capture the need of all BUs and get buy in into the SBR project, the BUs must be involved in the planning of the SBR. If there is a semi decentralized purchasing organization the BUs responsibility should be to capture the local needs and provide in-depth knowledge of the local supplier bases, and the central function should provide a holistic view and identify synergy opportunities. In order for the case company to capture the local needs of each site and at the same time keep a holistic view OP and local purchasing should be deeply involved in the SBR initiative. The responsibility must be clear between OP and local purchasing and there must be a consensus when it comes to ranking the supplier evaluation criteria and choosing how each supplier should be managed. These issues can be straightened or partly straightened by a commodity strategy that should be created prior to the implementation of SBR. As mentioned another effort possible to over bridge the barrier between OP and local purchasing is to dedicate OP resources to one or a few PGs. Hence there will be people working between today‟s local purchasing and OP which hopefully over bridge today‟s communication problems. Today it is hard for OP to understand the needs of all PG‟s and it can be hard for the PG to get the holistic view needed in order to reduce the supplier base proper. Looking in the organization today these dedicated recourses are needed to more than just SBR. There are indicators on that there exists a need to work on a more strategic level focusing in the “PG direction":
Local purchasing PHE has developed a local strategic department at the site in Lund.
Local purchasing BHE is trying to make some of their material planning processes more efficient in order to free local purchasing resources and relocate them to more strategic tasks.
There are also global purchasers today that are almost entirely dedicated to one PG.
Create organizations that are able to leverage from a SBR initiative If the purpose with SBR is to facilitate new purchasing strategies or concepts it must be ensured that the organization supports this intended strategy or concept. For example if the SBR is the first step towards working with early supplier involvement in new product development. The company must ensure that it has an organizational structure that supports the intended strategy/concept. If Alfa Laval wants to initiate SBR as a step in working more pro active with for example supplier development the company needs to create an organization that supports this approach. As already emphasized the supplier performance will not be improved solely by

70
SBR, Alfa Laval needs to develop a quality function that are dedicated externally (inbound quality). Of the three PGs included in this study it is only HSS who has a PC continuously working with supplier quality matters. PHE, BHE and OP are all requesting quality engineers that are dedicated to supplier- evaluation, selection and development and think that this is missing in the organization today. Today‟s organization will most likely obstruct leverage from a SBR project aiming at improving supplier performance.
Activities prior to the implementation The conceptual model states that a commodity strategy and data (spend and supplier performance) visibility should be in place before a SBR initiative. Without these the conditions for a successful SBR will be poor. Many of the global purchasers at Alfa Laval have expressed that the SBR initiative should be carried out immediately and a pre study on SBR will be started just after this master thesis has finished. They argue that the data visibility is low but good enough in order to start the reduction, and no one of the global purchasers have raised a commodity strategy as something that should be developed in order to support a SBR initiative. This can be an issue for companies, taking lightly on what they need to have in place before entering a SBR initiative and the consequences of this is a poorly implemented SBR. This study suggests that a commodity strategy and data visibility (spend and supplier performance) should be created prior to a SBR initiative. This is the recommendation for Alfa Laval as well, further they must map the competence gaps regarding to manage supplier relationships with new buyer-supplier condition where Alfa Laval is dependent on fewer suppliers. A finding in the case company was that supplier quality problems sometimes had been caused due to incorrect information from Alfa Laval‟s PC or purchasing. HSS who has started to measure the supplier quality costs has realized that the majority of the supplier quality costs are caused by incorrect information. This means that there are bad performing processes, both internal and internal-external, that are causing bad supplier performance. Thus there are a lot of potential in improving these bad performing processes in order to improve supplier performance. This is not something that needs to be done prior to an implementation of SBR for it to be successful. But to improve these processes seems like a “lower fruit to pick” than reducing the supplier base and develop it.
Implementation of a SBR initiative: the case company In this section thought and suggestions regarding the implementation of SBR at the case company are presented. Due to the limitations of the study (scope, time and data availability) it is difficult to evaluate the possibility to share suppliers between PGs. But by looking at the PGs included in this study it is obvious that their demands differ which will probably be an obstacle if it is decided to reduce suppliers by sharing between PGs. Instead it is probably possible to reduce the number of supplier significantly by sharing more suppliers within each PG due to the fact that 81 % of the suppliers are local. Thus, the recommendation is to run SBR projects in each PG. A SBR team should be created in order to transfer experiences and lessons learned from one SBR project to another (between PGs). A core team should exist consisting of people from OP and then have local purchasers and people from the PC connected to PG where the current SBR project is running, included in the team. If Alfa Laval decides to go for reduction of suppliers in one PG at the time the approach described as the systematic will be utilized. The red, yellow, green method described in section 3.4.1 can be used when going with the systematic approach. The tiering approach is useful for MRO products but most of these opportunities are already captured by OP‟s

71
commodity group 6 (MRO commodities). The impression from the interviews is that the standardization approach is something that has not been discussed much in the organization but is something that could have potential when it comes to reduce the numbers of suppliers. This lead has not been analyzed further in this study but it is clear that this approach will require closer collaboration between purchasing and PC than what is present today. Sharing suppliers between BUs will force the BUs to collaborate with each other in a greater extent and this will probably drive the BUs to develop common processes in order to have similar demands towards the shared suppliers. If the BUs start working to create common demands in order to share suppliers it will facilitate future sharing of suppliers and a snowball effect can be created. It can also facilitate sharing of best practices between BUs and implementation of changes on a global scale, thus it will facilitate economics of process (one of three categories of purchasing synergy (Faes et al., 2000)). This is something that should be discussed in Alfa Laval‟s situation, with a semi decentralized purchasing function with sites that have developed different purchasing procedures. The sites have not actively worked with common demands. The SBR initiative can be seen as an incentive to start developing uniformed demands towards the suppliers. The supplier handbook is a perfect approach to realize this and hopefully this can lead to the snowball effect described above.
6.1.5 Objectives and purposes with SBR The purpose with having objectives and purposes with SBR in the conceptual model is to highlight the importance of knowing why SBR should be implemented. It is important to always keep the overall purpose with the initiative in mind when decisions are taken during the planning and the implementation. The overall purpose with a SBR initiative for Alfa Laval should be improved supplier performance with an emphasis on the quality of inbound material. SBR can facilitate supplier development leading to increased supplier performance. Operative, numerical objectives need to be derived from hard data analyzing the opportunities for improvement. Since this has not been included in the study this type of objectives will not be included.
6.1.6 Stakeholder mapping The conceptual model suggests that stakeholder mapping should serve three primary purposes; identify potential stakeholders in a SBR initiative and analyze how they would affect and be affected by the initiative, get buy in from the stakeholders and identify competence gaps (Cousins, 1999; Ogden and Carter, 2008). At the case company potential stakeholders would be OP, local purchasing at the production sites and the PCs as they do all have connections with the suppliers. Reducing as proposed in this study, by sharing suppliers between production sites, would mean an increase in the total number of global suppliers. This would lead to more suppliers for OP to handle. If the work load would increase due to this increase in suppliers OP might need more resources. The local purchasers will probably lose some of their control over the supplier base when shifting from local to global suppliers. To ensure compliance regarding what suppliers to actually buy from it is important that local purchasers are involved in the reduction project. The local purchasers are also experts on the local needs and conditions which set the boundaries regarding what kind of suppliers can be utilized. Included in Alfa Laval‟s new strategy is to focus more on quality. One way to facilitate the work with quality and the development of suppliers is to reduce the number of suppliers operated by the company. The PCs are responsible for the product quality and in order to achieve a high product quality it is important to secure the quality of inbound material. Today the PCs work differently with suppliers and the development of suppliers, for example do HSS have a quality organization within its PC which no other PC has. The HSS PC is the only PC that works with supplier development. The effect a SBR initiative will have on the

72
PCs will differ if the supplier base is reduced without changing how the PCs work with quality. The HSS PC will be more affected and involved than the other PCs. Cousins (1999) argues that new competences are needed when reducing the supplier base to mitigate the increased risk of strategic exposure. During the interviews at the case company this issue was never raised. If the company are not aware of the competences needed to manage these new buyer-supplier conditions it will risk falling into the pitfall described by Cousins (1999). In Cousins‟ (1999) study it was shown that when the suppliers got aware of them being the only supplier for a commodity they raised the prices. This forced the studied companies to increase the number of utilized suppliers again to lower the prices. The case company needs to map if the competences to manage new supplier relations exist in the organization or if they need to be acquired to avoid this pitfall.
6.1.7 Supplier evaluation In the conceptual model it is suggested that the criteria a company chose to evaluate suppliers on (in a SBR initiative) need to be derived from the SBR objectives and the commodity strategy. At the case company, OP and local purchasing do not agree on how different supplier criteria should be prioritized. The importance of DOT, quality and price is today a source for disagreements. This has to be resolved before the implementation and when initiating SBR there will probably be more supplier criteria that have to be taken in to consideration. The development of commodity strategies could over bridge this disagreement since the parts needs to come to a consensus to be able to finish the strategies. The parts do also need to look at the objectives with the SBR initiative. If Alfa Laval is launching a SBR initiative with the intention to improve supplier development suppliers must be evaluated on more than supplier performance. The evaluation should for example include supplier capabilities and organizational aspects (example of supplier criteria can be seen in table 4 and 5). This because not all suppliers are recipient to supplier development or close buyer-supplier collaboration due to non supporting organization and/or none existing processes. Depending on how close a company wants to work with a certain supplier there will be different requirements regarding supplier capabilities and organizational structure.
6.1.8 Performance measurement The conceptual model suggests that the progress of a SBR initiative needs to be measured. This is important to be able to realize if the objectives with the initiative have been reached. It is also important to track the progress of the project to be able to follow the development of the project and the result each reduction gives. Cousins (1999) found that none of the companies in his study were able to prove any change in the transaction cost. This implies the complexity of measuring the transaction cost. This issue was also found at the case company. During interviews the importance of being able to prove the monetary benefits of a SBR initiative has been highlighted, but none could give any answer on how to do it. One way to get a hint of the development of the transaction cost is to use a TCO model, where the largest cost drivers for operating a supplier are measured for each analyzed supplier. Supplier performance as a result of a SBR initiative is easier to measure than the transaction cost. This thesis suggests that increased supplier performance should be the overall objective and purpose with a SBR initiative for the case company. The purchasing analysis data tool, currently in development at the case company, would be a good platform for the measurement. It would be able to follow how many suppliers that are utilized (a way to track the overall progress of the initiative), the DOT and the quality of inbound material. A KPI for SBR could be an increased impact of supplier development projects, where the number of supplier development projects is compared to the impact on the overall supplier performance. The rationale is that a fewer number of suppliers will create a larger impact from the supplier development projects since they can target a larger part of the total supplier

73
base and the total spend. This KPI is general and could be used by any company looking at reducing their supplier base with the intention to improve the work with supplier development.
6.2 Concluding remarks on the case company Figure 22 illustrates how different issues are connected, in relation to SBR, at the studied case company. These relations have been captured by concluding the issues highlighted in the analysis in section 6.1. The logic on how the different issues are connected will briefly be described.
Figure 22: Logic scheme of the SBR findings at the case company
KPIs and PADT are connected, PADT will support the measurement (provide data on the KPIs) and the KPIs must be input in the development of the PADT so it will capture the desired data. PADT will support SBR since it will provide the spend and supplier performance data, and the developed KPIs will enable tracking the progress of the SBR initiative. Creating common demands and common internal-external processes will facilitate coordination of PG‟s supplier bases and will support sites in sharing suppliers which direct will support SBR. Developing common demands will probably drive development of common internal-external processes and vice versa. A forum for collaboration will facilitate collaboration between sites and PGs and this will facilitate the development of common external-internal processes since this requires collaboration between sites. It will also facilitate the development of a commodity strategy since this requires that the sites, PGs and OP collaborates. The commodity strategy will support goal alignment and compliance (regarding the directions on the reduction), SBR and proper management of supplier relations since it will give direct guidelines on how many and what types of suppliers that should be utilized as well as desired supplier relationships for each bought component.

74
SBR will support supplier development since a lesser number of suppliers will imply that more resources can be spent on each individual supplier and an improvement project with a supplier will have increased effect on the bottom line. SBR will also increase the buying power since the volume bought of individual suppliers will be increased. Higher volumes to fewer suppliers do not per se mean increased purchasing power, without proper management of supplier relations the outcome can be the opposite. With proper management of supplier relations the SBR initiative can lead to reduced price and that the price will remain low. The crosshatched arrow represent that if the company is an important customer it will be prioritized by the supplier. If for example the supplier has capacity shortage and has to choose which customer to deliver to the most important customer will probably be chosen (increases the DOT to the chosen company). The reason that the arrow is crosshatched is that being an important customer can have positive effect on the supplier performance in some situations (not constantly). Fix bad performing processes is not linked to SBR but it highlights that there exist bad performing processes that have an impact on the supplier performance. Improving these bad performing processes will lead to improved supplier performance. The magnitude of this problem needs to be further investigated by the case company. Maintain a reduced number of suppliers is supported by goal alignment and compliance since it implies no maverick buying. Proper management of supplier relations indirect supports maintain a reduced number of suppliers since it ensures that the suppliers do not exploit the increased dependency SBR implies, which can force the company to increase the number of suppliers again. The connection between maintain a reduced number of suppliers and profit symbolizes that by maintaining the number of suppliers low the benefits of SBR can be kept in the long run.

75
6.3 Discussing the conceptual model
Figure 23: A conceptual model connecting relevant purchasing functions with SBR
The three main issues proposed by the conceptual model (depicted in figure 23) regarding purchasing strategy i.e. the connection to the overall strategy, commodity strategies and BUs needs were all found to be relevant at the case company. SBR had been raised as important, but no one had defined why the initiative should be carried out. The case company had not developed commodity strategies and did not see it as a necessity for SBR. The analysis shows that a lot of the identified obstacles to a SBR initiative (e.g. goal alignment) would be solved by a commodity strategy. Hence the suggestion to develop a commodity strategy before initiating SBR seems valid. The conceptual model suggests that the degree of decentralization will affect a SBR initiative. The analysis of the findings at the case company implies that the two most important issues regarding how the purchasing organization will or will not support a SBR initiative in a semi decentralized organization are; uniformity in demands and collaboration between BUs in order to facilitate the sharing of suppliers. Hence a contribution to the model could be; the importance of uniformity in demands and collaboration between BUs in a semi decentralized purchasing organization. This is probably valid in a completely decentralized purchasing organization as well. However these issues would probably not exist in a completely centralized purchasing function, hence the degree of decentralization does affect a SBR initiative. The analysis discusses how the limitations in data availability can affect a SBR initiative at the case company. The thoughts are general for example how data visibility would affect the sharing of responsibility and the benefits of having a common “map” to use when taking decisions. This could probably be true at any company with scattered stakeholders (e.g. OP
76
and local purchasing at the case company) thus making the ideas in the conceptual model relevant. A limitation in this study is that it did not include any “purchasing data” like spend and supplier performance. Without this data no analysis on hard data could be conducted and no examples of how a certain approach (e.g. tiering) would be appropriate for a commodity or component. Such an analysis would have helped to be able to test the suggestions in the conceptual model regarding “SBR approach”. Instead of looking at hard data the analysis discussed what activities should be completed before launching SBR by combining findings regarding purchasing strategy, the purchasing organization and data availability at the case company. The conclusion that commodity strategies, common demands and data availability need to be addressed before SBR are probably valid in all cases where companies with a semi decentralized purchasing organization are looking at initiating SBR. The analysis identified OP, local purchasing and the PCs as stakeholders to a SBR initiative and how they would be affected. Since no mapping of competences was included in this thesis no conclusions regarding a general need for acquiring new competences could be drawn. But it was highlighted that no one in the organization at the case company was talking about any need for new competences indicating a risk for the company to walk into a pitfall lifted by Cousins (1999) (to not consider the increased strategic exposure by having a lesser number of suppliers). This finding indicates that mapping the competences in the organization is important. Thus the conceptual model could be improved by changing “stakeholder mapping” to “stakeholder and competence mapping” highlighting the need to ensure that the organization has the right competences to handle a reduced supplier base. The importance of measuring the progress of a SBR initiative and be able to prove the gains is suggested by the conceptual model. This was also raised during interviews at the case company hence supporting that “performance measurement” is relevant to include in the conceptual model. The analysis of “performance measurement” discusses the complexity to measure changes in the transaction cost. A suggestion mentioned in the analysis is to use a TCO model, but since this thesis do not include any in-depth investigation of TCO and its possibilities regarding transaction cost no final conclusions can be drawn. A general conclusion regarding the relevance of the conceptual model is that all the issues it highlights need to be further investigated. For example to be able to “prove” the importance of having updated correct data available to every stakeholder an actual implementation of SBR needs to be studied. This thesis could be a guide to what to look for in such a study.

77

78
7 Conclusions
This chapter will connect back to the purpose and objectives of the thesis. Whether the
purpose and objectives have been met or not will be discussed. This will be followed by an
answer to the research question of the thesis and suggestions on further research. Finally
recommendations to the case company will be presented.
7.1 Meeting the objectives
The purpose of this thesis is to increase the understanding of a successful supplier base reduction initiative and the activities that should be conducted prior to such a supplier base reduction initiative. To fulfill this purpose two objectives for the thesis were set:
To analyze the conditions for a supplier base reduction initiative and identify activities that should be conducted prior to a supplier base reduction initiative.
To develop a conceptual model that describes parts of purchasing that affect and are affected by supplier base reduction.
These objectives are closely connected. To be able to analyze the conditions for SBR and identify activities that should be conducted prior to a SBR initiative a frame of reference was needed. Since the existing literature regarding SBR had focus on the actual implementation and not the preparation or planning a “new” frame of reference was needed. Hence the conceptual model was created. The intention with the conceptual model was to identify issues concerning a SBR initiative and describe how these issues are connected. It seems reasonable to argue that a model meeting the intentions for the conceptual model would contribute to increase the understanding of a successful supplier base reduction initiative and the activities that should be conducted prior to such a supplier base reduction initiative. By analyzing the case company using the conceptual model issues regarding SBR have been identified which had not been identified as issues critical to SBR by the case company. The final result was the logic scheme of SBR findings at the case company depicted in section 6.2. This scheme shows how different areas are connected at the case company and what activates that should be conducted prior to launching a SBR initiative. The intention with the conceptual model is therefore meet and it is a contribution to increasing the understanding of successful supplier base reduction. Hence the purpose of the thesis is fulfilled.
7.2 Answering the research question
The research question of this thesis is: “How to successfully plan a supplier base reduction initiative and what aspects to consider when planning such an initiative?” To be able to successfully plan a supplier base reduction initiative a company needs to understand the conditions for SBR at the company. To do this the company needs to identify the factors that will facilitate an initiative as well as factors that will obstruct it. The conceptual model was created to enable an analysis that will identify these factors. The model shows that it is important to understand why a SBR initiative should be launched, how it will support the overall purchasing strategy. The degree of purchasing decentralization will affect the complexity of the implementation and how the company can leverage from an initiative. If the company has a decentralized or semi decentralized purchasing organization it is especially important to have good collaboration between BUs to facilitate sharing of suppliers. It is also important to have uniform demands towards the supplier to be able leverage from having fewer suppliers. The model also shows the importance of having updated spend and supplier performance data, both to be able to identify opportunities for reduction and to be able to track the progress of the initiative.

79
The conceptual models shows that the reasons for SBR, the support from the organization and the data should be analyzed together to plan the actual doing. Different commodities might need different approaches and the approaches to choose from are the systematic approach, tiering and standardization. Dependent on the characteristics of the commodity and the supplier market the appropriate approach should be chosen. Dependent on the chosen approaches and the objectives and purposes with a SBR initiative, different stakeholders in the organization will be affected. These need to be identified, to create willingness and compliance as well as to be able to identify the need for acquiring new competences. How suppliers should be evaluated is affected by the overall objectives with the initiative and need to be agreed on by the different stakeholders. Finally it needs to be decided how the SBR initiative should be measured and evaluated.
7.3 Further research
The suggestions for further research are divided in two sections. The first section addresses the academia and the second the case company.
7.3.1 Further research for academia
To be able to generalize the findings of this thesis more companies need to be investigated. It would be interesting to study a company with a centralized purchasing organization looking at reducing the supplier base, and compare the results with the findings of this thesis. By doing so it would be possible to get a deeper understanding of how the degree of purchasing decentralization is connected to SBR. The analysis of this thesis touches upon the subject of keeping the supplier base reduced. But this need to be further investigated. In such a study it could be valuable to include an investigation about why companies get a high number of suppliers. If the reason for many suppliers can be found the company can avoid “going in the same trap again”, thus keeping a low number of suppliers. This thesis proposes that a high number of local suppliers due to a decentralized purchasing structure could be one explanation to a high total number of suppliers but no general conclusions have been able to be drawn. Cousins (1999) as well as Ogden (2003) and Goffin et al. (1997) found that one reason for reducing the supplier base was to lower the transaction cost. Cousins (1999) also found that none of the investigated companies could prove that the transaction cost had been lowered by the SBR initiative. This thought was also found at the case company, at the sourcing meeting in May 2010 one group proposed to put in a saving for each removed supplier (see Appendix I) but it is not mentioned anything about how to “prove” the saving. This thesis proposes that a TCO model could be used to capture the transaction cost, but the matter need further investigation. If the cost could be captured it would be a good input to decide the optimum number of suppliers for a company and to show the profit yielded from a SBR initiative.
7.3.2 Further research for Alfa Laval
In the analysis (6.1.4) it is highlighted that Alfa Laval has bad performing processes affecting the supplier performance. The company should further investigate the magnitude of this problem to realize how it affects the supplier performance. Alfa Laval has a lot of products which drive a high number of bought components and during interviews at the company the issue of standardization was raised. One way to reduce the supplier base is to standardize bought components (for more information see section 3.4.1). To be able to fully realize the potential of standardization component data need to be analyzed which was not included in this study. This could be valuable for the company to further investigate.
80
Alfa Laval needs to develop a process to keep the supplier base reduced. This thesis highlights the importance of clearing the ownership of the supplier base to facilitate this matter but official guidelines for approval of new suppliers etc. need to be created.
7.4 Recommendations for Alfa Laval This section summarizes the recommendations, for how Alfa Laval should prepare for a SBR initiative, concluded from the analysis in chapter 6.
See SBR as a part of working more pro active with purchasing. Increase supplier performance by facilitating supplier development should be the overall purpose with a SBR initiative (6.1.1 and 6.1.4).
Complete PADT before initiating SBR. Add a section in the tool dedicated to SBR (6.1.3 and 6.1.8).
Develop a commodity strategy before initiating SBR (6.1.1 and 6.1.4).
Ensure goal alignment between OP and local purchasing before initiating SBR (6.1.1, 6.1.2, 6.1.4 and 6.1.7).
Straighten out the ownership of the supplier base (6.1.2).
Develop the supplier handbook before initiating SBR in order to create common demands (6.1.2 and 6.1.4).
Facilitate collaboration and coordination between sites. For example by having dedicated OP resources working in the PG direction (6.1.2 and 6.1.4).
Implement SBR in one PG at the time. Use a dedicated core team in order to transfer knowledge between projects (6.1.4).
Ensure required competences needed to handle new conditions for the buyer-supplier relation (6.1.1 and 6.1.7).
Further investigate the magnitude of the problem with bad supplier performance as a result of bad performing processes (6.1.4).

81
82
References Literature Alajoutsijärvi, K., Möller, K. & Tähtinen, J. (2000). Beautiful exit: how to leave your business partner, European Journal of Marketing, vol. 34, no. 11, pp. 1270-1289. Arbnor, I. & Bjerke, B. (1997). Methodology for creating business knowledge (Second Edition). SAGE, Thousand Oaks, Calif. Amid, A. & Ghodsypour. S.H. O‟Brien, C. (2009). A weighted additive fuzzy multiobjective model for the supplier selection problem under price breaks in a supply chain, International Journal of Production Economics, vol. 121, no. 2, pp. 323-332. Anonymous. (1994). Ford whacks at supply base; centralizes MRO buy. Purchasing, vol. 177, no. 9, pp. 44-44. Arnold, U. (1999). Organization of global sourcing: ways towards an optimal degree of n - The Stars On the Horizon. European Journal of Purchasing & Supply Management, vol. 5, no. 3-4, pp. 167-174. Avery, S. (2000). Supply chain management at Otis reins in global spending. Purchasing, vol. 128, no. 9, pp. 52-59. Bell, J. (2005). Doing Your Research Project (Fourth Edition). Buckingham: Open Univerity Press. Björklund, M. & Paulsson, U. (2003). Semianrieboken - att skriva, presentera och opponera. Lund: Studentlitteratur. Chen, I, J. & Paulraj, A. (2004) Towards a theory of supply chain management: the constructs and measurements. Journal of Operations Management, vol. 22, no. 2, pp. 119-150. Choi, T.Y. & Krause, D.R. (2006), The supply base and its complexity: implications fortransaction costs, risks, responsiveness, and innovation. Journal of Operations Management, vol. 24, no. 5, pp. 637-52. Cousins, P.D. (1999). Supply base rationalisation: myth or reality? - Analysis and Antitrust Implications. European Journal of Purchasing and Supply Management, vol. 5, no. 3-4, pp. 143-155. Cox, A. (1997). Business Success: A Way of Thinking About Strategy, Critical Supply Chain Assets and Operational Best Practice, Boston, Earlsgate Press. Cox, A., Lonsdale, C., Watson, G. & Wu, Y. (2005). Supplier relationship management as an investment: evidence from a UK study. Journal of General Management, vol. 30, no. 4, pp. 27-42. Dickson, G, W. (1966). An Analysis Of Vendor Selection Systems And Decisions. Journal of Purchasing, 1966, vol. 2, no. 1, pp. 5-18. Dowlatshahi, S., (2000). Designer–buyer–supplier interface: theory vs. practice. International Journal of Production Economics, vol. 63, no. 2, pp. 111–130.

83
Dubois, A. (2003). Strategic cost management across boundaries of firms. Industrial Marketing Management, vol. 32, no. 5, pp. 365-374.
Dubois, A. & Pedersen, A.-C. (2002). Why relationships do not fit into purchasing portfolio models-a comparison between the portfolio and industrial network approaches. European Journal of Purchasing and Supply Management, vol. 8, no. 1, pp. 35-42 Ellram, L.M (1995). Total cost of ownership: An analysis approach for purchasing. International Journal of Physical Distribution & Logistic, vol. 25, no. 8, pp. 4-23. Ellram, L. M. (1996). The use of the case study method in logistics research. Journal of Business, vol. 17, no. 2, pp. 93-137. Ellram, L, M. & Perrott, S, S. (1993). Purchasing: The Cornerstone of the total Cost of ownership Concept. Journal of Business logistics, vol. 14, no. 1, pp. 163-185. Faes, W. & Matthijssens, P. (1998). Managing purchasing coordination: how to build an elective intra-company relationship. Proceedings of the 7th IPSERA Conference, London, pp. 204-215. Faes, W. & Matthijssens, P. (1996). Purchasing coordination in multiplant companies. Proceedings of the 12th IMP Conference. University of Karlsruhe, pp. 499-529. Ford, D., Gadde, L-E., Håkansson, H., Lundgren, A., Snehota, I., Turnbull, P. & Wilson, D. (2001). Managing Business Relationships, Chichester, Wiley. Gadde, L-E. & Snehota, I. (2000). Making the Most of Supplier Relationships. Industrial Marketing Management,vol. 29, no. 4, pp. 305-316. Gelderman, C.J. & Van Weele, A.J. (2005). Purchasing portfolio models: a critique and update. The Journal of Supply Chain Management, vol. 41, no. 3, pp.19-29. Giller, C. & Sheelagh, M. (2001). The Termination of Inter-Firm Relationships, Journal of Business & Industrial Marketing, vol. 16, no. 2, pp. 94-112. Goffin, K., New, C. & Szwejczewski, M. (1997). Managing suppliers: when fewer can mean more. International Journal of Physical Distribution & Logistics Management, vol. 27, no. 7, pp. 422-436. Goffin, K., Lemke, F. & Szwejczewski, M. (2001). Supplier management in German manufacturing companies – An empirical investigation. International Journal of Physical Distribution & Logistics Management, vol. 31, no. 5, 2001, pp. 354-373 Hahn, C.K., Watts, C.A. & Kim, K.Y. (1990). The supplier development program: a conceptual model. Journal of Purchasing & Materials Management, vol. 26, no. 3, pp. 2. Halinen, Aino & Jaana Thtinen (2002). A Process Theory of Relationship Ending, International Journal of Service Industry Management, vol. 13, no. 2, 163-80. Hart, C. (1998). Doing a literture review., Thousand Oaks, California, SAGE. Hartley, J.L. & Choi, T.Y. (1996). Supplier development: customers as a catalyst of process change. Business Horizons, vol. 39, no. 4, pp. 37-44.

84
Ho, W. Xu, X. & Dey, P, K. (2010). Multi-criteria decision making approaches for supplier evaluation and selection: A literature review. European Journal of Operational Research, vol. 202, no. 1, pp. 16-24. Kotter, J.P. (1996). Leading change. Boston, Harvard Business School Press. Koufteros, X.A., Cheng, T.C.E. & Lai, K. (2007). Black-box and gray-box supplier integration in product development: antecedents, consequences and the moderating role of firm size. Journal of Operations Management, vol. 25, no. 4, pp. 847. Kovács, G. & Spens, K, M. (2005) Abductive reasoning in logistics research. International Journal of Physical Distribution & Logistics Management, vol. 35, no. 2, pp. 132-144. Kraljic, P. (1983). Purchasing must become supply management. Harvard Business Review, vol. 61, no. 5, pp. 109-118. Krause, D.R. (1997). Supplier development: current practices and outcomes. International Journal of Purchasing & Materials Management, vol. 33, no. 2, pp. 12-19. Lambert, M, D. (2008). An executive summary of Supply chain management: processes partnerships, performance. Florida, Supply Chain Management Institute. Lee, D, M & Drake, P, R. (2010). A portfolio model for component purchasing strategy and the case study of two South Korean elevator manufacturers International Journal of Production Research, vol. 48, no. 22, pp. 6651–6682. Liu, F.H. Hai, H.L. (2005). The voting analytic hierarchy process method for selecting supplier. International Journal of Production Economics. Vol. 97, no. 3, pp. 308-317. Manoochehri, G.H. (1984). Suppliers and the just-in-time concept. Journal of Purchasing & Materials Management, vol. 20, no. 4, pp. 16. Meredith Smith, J. (1999). Item selection for global purchasing - results of an empirical investigation in the Czech Republic, Hungary, Romania, Ukraine and Germany. European Journal of Purchasing and Supply Management, vol. 5, no. 3-4, pp. 117-127. Merrian, S. (1994). Fallstudien som forskningsmetod. Lund, Studentlitteratur. Moeller, S., Fasnacht, M. & Klose, S. (2006). A Framework for Supplier Relatinship Management (SRM). Journal of Business-to-Business Marketing, vol. 13, no. 4, pp. 69-94. Nelson, D. Moody, P.E. Stegner. Jonathan, R. (2005). The 10 procurement pitfalls. Supply Chain Management Review, vol. 9, no. 3, pp. 38-46. Ng, E. (2010). Understanding B2B Supplier Selection Relationships: The Case of Taiwan Agribusinesses. Journal of Business-to-Business Marketing, vol. 17, no. 2, pp. 149-173. Nolleta, N. Poncea, S.& Campbellb, M. (2005). About „„strategy‟‟ and „„strategies‟‟ in supply management. Journal of Purchasing & Supply Management, vol. 11, no. 2-3, pp. 129-140. Nydick, R.L. & Hill, R.P. (1992). Using the Analytic Hierarchy Process to Structure the Supplier Selection Procedure. International Journal of Purchasing & Materials Management, vol. 28, no. 2, pp. 31-37.

85
Ogden, J. (2003). Supply Base Reduction Within Supply Base Reduction. PRACTIX, Good Practices in Purchasing and Supply Chain Management, vol. 6, no. 1, pp. 1-7. Ogden, J. & Carter, P. (2008). The supply base reduction process: an empirical investigation. The International Journal of Logistics Management, vol. 19, no. 1, pp. 5-28. Olsen, R.F. & Ellram, L.M. (1997). A portfolio approach to supplier relationships. Industrial Marketing Management, vol. 26, no. 2, pp. 101-113. Pandit, K., & Marmanis, H. (2008). Spend analysis: The window to strategic sourcing. Fort Lauderdale, J. Ross publishing. Park, Jo. Shin, K. Chang, T. & Park, Jin. (2010). An integrative framework for supplier relationship management. Industrial Management & Data, vol. 110, no. 4, pp. 295-515. Parker, D. & Hartley, K. (1997). The economics of partnership sourcing versus adversarial competition: a critique. European Journal of Purchasing and Supply Management, vol. 3, no. 2, pp. 115-125. Patel, R. & Davidson, B. (2003). Forskningsmetodikens grunder. Hungary: Erlanders Hungary Kft. Rozemeijer, F. (2000). How to manage corporate purchasing synergy in a decentralised company? Towards design rules for managing and organising purchasing synergy in decentralised companies - Building Competitive Power through Pro-active. Purchasing European Journal of Purchasing & Supply Management, vol. 6, no. 1 pp. 5-12. Rozemeijer, F. Van Weele, A & Weggeman, M. (2003). Creating Corporate Advantage through Purchasing: Toward a Contingency Model. Journal of Supply Chain Management: A Global Review of Purchasing & Supply vol. 39, no. 1, pp. 4-14. Smart, A. & Dudas, A. (2007). Developing a decision-making framework for implementing purchasing synergy: a case study. International Journal of Physical Distribution and Logistics Management, vol. 37 no. 1, pp. 64-89. Schmitz, J.; Platts, K.W. (2004). Supplier logistics performance measurement: Indications from a study in the automotive industry. International Journal of Production Economics, vol. 89, no. 2, pp. 231-243. Smith, J.M. (1999). Item selection for global purchasing. European Journal of Purchasing & Supply Management, vol. 5, no. 3-4, pp. 117-127. Smock, D. (2003). Motorola centralises purchasing. Electronic News, vol. 49, no. 15, pp. N.PAG-0. Ting, S. & Cho, D, I. (2008). An integrated approach for supplier selection and purchasing decisions. Supply Chain Management: An International Journal, vol. 13, no. 2, pp. 116-127. Van Weele, A, J. (2005). Purchasing & Supply Chain Management Analysis, Straten, Planning and Practice (Fourth Edition). London, Thomson. Womack, J.P., Jones, D.T. & Roos, D. (1991), The Machine that Changed the World: How Japan’s Secret Weapon in the Global Auto Wars will Revolutionize Western Industry, New York, HarperPerennia.

86
Yin, R. K. (2003). Case study research - design and methods (Third Edition). Sage Publications, Thousand Oaks, California. Yin, R. K. (2009). Case study research - design and methods (Fourth Edition). Sage Publications, Thousand Oaks, California.

87

I
Appendices
Appendix I: Thoughts about SBR from sourcing meeting 2010-05-26 Group A
• Attention from Management. – Attention from Operation Management – Create KPI/Scorecard
• Identify how many suppliers we actually have. – Process for monthly update of base parameters in system (LP resp) – Same caoding for same supplier (Parent GCM)
• How to reduce the suppliers we have. – Knowledge about the supplier base (Master Data project) – Product group purchasing strategy. Map where the sites are buying the items. – Identify what suppliers to phase out. Driven by sites, supported by OP. – Start with focus on suppliers that deliver only to one site – ”Low hanging fruits”. Non critical standard products
• Cost Benefit Analysis • Identify real cost for handling a supplier (QDC)
• The supplier reduction activities must support our Quality, DOT and total cost goals.
Group B
• How to reduce supplier base with 1200 suppliers – Put it on the agenda and made clear objectives for PG‟s – KSA‟s on 80% of suppliers and 50% of suppliers supply min. 2 sites. – Put in a saving on 5KEUR in OPSI for each supplier that is taken away – Not adding new suppliers in NPD and tech. development. (Audits, visits etc.)
• Use the same suppliers within the PG‟s • Goals for PG, country, region, families
– Should be included in the handshake process considering effects on PPV, DOT and Q
– To be followed up at PG and commodity reviews – Part of individual goals
• Tools: ALAS, Purchasing analyze tool (Masterfile). Instruction for how to phase out
suppliers • How secure that new suppliers are not added
– Control creation of new suppliers • Commodity or SM approval • Audit process (Approved supplier) • Min 10 KEURO to create a new supplier
– Involvement in Technical development of products at an early stage Group C
• Before we start to reduce we must shut off the valve • Make it more difficult to open up a new supplier
– Global Supplier Administrator (with exclusive right to open up a new supplier in the ERP systems)

II
– Supplier Approval Board analog to PAF – Open up fee for a new supplier, reward for a closed supplier – Product centers has to be involved – No dual sourcing except for special cases (good reason) – At integration of acquired companies – Faster reaction and phase out when a supplier underperform – Within 1 year from now, basic requirements shall be fulfilled for all suppliers to
be kept – Updated information in ALAS (AL contact person, supplier contact info, PRICE
LIST, agreement if any) – Full documentation (drawings etc) shall be in the control of AL for new
suppliers – Dedicated task force for supplier reduction – Senior members – Full time 1-2 years – A few dedicated sites/product families – Analogy – the SIR project some years ago

III
Appendix II: Interviewees and Interview guide (Swedish) Interviews Interviewee 1, Sourcing Manager, PHE, Alfa Laval AB, 2010-10-13 Interviewee 2, Project Manager, Operations Development, Alfa Laval AB, 2010-11-03 Interviewee 3, Global purchaser, OP, Alfa Laval AB, 2010-11-04 Interviewee 4, Strategic purchaser, PHE Lund, Alfa Laval AB, 2010-11-12 Interviewee 5, Sourcing Manager, HSS, Alfa Laval AB, 2010-11-15 Interviewee 6, Quality Engineer, HSS Eskilstuna, Alfa Laval AB, 2010-11-15 Interviewee 7, Quality Assurance Manager, PC-HSS, Alfa Laval AB, 2010-11-16 Interviewee 8, Commodity Manager, OP, Alfa Laval AB, 2010-11-16 Interviewee 9, Head of OP, OP, Alfa Laval AB, 2010-11-16 Interviewee 10, Quality Engineer PC-HSS, Alfa Laval AB, 2010-11-16 Interviewee 11, Commodity Manager, OP, Alfa Laval AB, 2010-11-25 Interviewee 12, Global purchaser, OP, Alfa Laval AB, 2010-11-26 Interviewee 13, Product development Manager, PC-CHE, Alfa Laval AB, 2010-11-30 Interviewee 14, Project Manager, Operations Development, Alfa Laval AB, 2010-12-02 Interviewee 15, Lead quality coordinator, PC-CHE, Alfa Laval AB, 2010-12-06 Interviewee 16, Sourcing Manager, BHE, Alfa Laval AB, 2010-12-09
Interview guide (Swedish) Purchasing strategy
Beskriv Alfa Lavals övergripande startegi
Beskrivs Alfa Lavals inköpsstrategi o Hur stödjer inköp och dess strategi företagets övergripande strategi? o Hur borde inköp stödja den övergripande strategin?
Skiljer sig inköpsstrategin för de olika produktgrupperna? o Hur skiljer den sig? o Vad är orsaken till att den skiljer sig? o Borde den skilja sig? o Finns det något värde i att jämföra performance mellan olika produktgrupper?
Skiljer sig inköpsstrategin för de olika sajterna? o Hur skiljer den sig? o Vad är orsaken till att den skiljer sig? o Borde den skilja sig?
Under vilka omständigheter tog SRM fram? o Vad/vem initierade framtagandet? o Vad var syftet? o Vilka var med?
Hur ser kopplingarna ut i SRM mellan de olika ”aktiviteterna”? o Vilket syfte har SBR i SRM? o Vad har SBR för roll i SRM i relation till de övriga ”aktiviteterna”?
Vad finns det för resurser att utveckla inköpet? o Personer, project osv. o Gällande interna processer, supplier development osv.
Vad anser du vara viktigast att utveckla inom inköpet (inkluderar leverantörer)?
Peka ut de punkterna som skulle ge Alfa Laval högst utväxling att arbeta med
Använder ni någon form av segmentering eller portföljmodell för era köpta produkter och/eller leverantörer?
Hur utvärderar ni de risker som finns relaterat till inköp?
Finns det några policys för olika inköpta produkter gällande hur risker ska hanteras? o Singel, dual and multiple?

IV
o Geografiskt läge?
Vad finns det för kostnader knutna till att byta leverantör? Degree of purchasing decentralization Globala inköpare
Beskriv din och globalt inköps roll? o Vilka delar i inköpsprocessen ansvarar ni för?
Vilka interna kunder har ni? o Vilka behov har era kunder? o Hur skiljer sig behoven mellan produktgrupperna? o Hur skiljer sig behoven mellan siterna? o Hur försäkrar man sig att dessa behov tillfredsställs?
Hur jobbar ni med de lokala inköparna? o Är det ert fönster mot fabriken? o Vilka andra kommunikationsvägar finns det?
Skiljer sig inköpsfunktionen och dess sätt att arbeta mellan PG?
Vilka andra funktioner jobbar ni med? o Hur ser detta samarbetet ut?
Hur mäter ni ert inköpsarbete?
Finns det något samarbete mellan produktgrupperna? o Hur ser detta samarbetet ut? o Vilken roll har OP i detta samarbete?
Finns det något samarbete mellan siterna? o Hur ser detta samarbetet ut? o Vilken roll har OP i detta samarbete?
Hur ser du på er leverantörsbas? o Har ni en leverantörsbas med globala leverantörer eller är det mer att ni har
subleverantörsbaser mot varje PG eller site?
Vilken roll skulle globalt respektive lokalt inköp ha i ett SBR-projekt? Lokala inköpare
Beskriv hur du och lokalt inköp arbetar? o Vilka delar i inköpsprocessen ansvarar ni för?
Vilka kunder har ni? o Vilka behov har era kunder? o Hur skiljer sig behoven mellan produktgrupperna? o Hur försäkrar man sig om att dessa behov tillfredsställs?
Hur jobbar ni med de globala inköparna? o Vilken roll har de globala inköpet för er?
Skiljer sig inköpsfunktionen och dess sätt att arbeta mellan PG?
Vilka andra funktioner jobbar ni med? o Hur ser detta samarbetet ut?
Hur mäter ni ert inköpsarbete?
Finns det något samarbete mellan produktgrupperna? o Hur ser detta samarbetet ut? o Vilken roll har OP i detta samarbete?
Finns det något samarbete mellan siterna? o Hur ser detta samarbetet ut? o Vilken roll har OP i detta samarbete?
Har er leverantörsbas någon specifik karakteristik?
Vilken roll skulle globalt respektive lokalt inköp ha i ett SBR-projekt?

V
Spend analysis and supplier performance
Vilken data finns tillgänglig? o Spend och supplier performance
Hur använder ni datan i ert arbete?
Vilka begränsningar finns det?
Vilken data skulle du vilja ha tillgång till som inte finns idag? Supplier evaluation
Hur ser supplier selection processen ut? o Vem väljer? o Hur ofta är det helt nya leverantörer och hur skiljer sig då processen? o Vilka kriterier väljs leverantörer på? o Används alltid samma kriterier och har de alltid samma viktning? o Om inte hur viktar man?
Finns det någon preferd supplier list? o Vad behöver man uppfylla för att hmna där?
Medellivslängd för en leverantörsrelation?
Har man aktivt valt hur nära samarbete man vill ha för varje produkt? o Om ja vad grundas besluten på?
Vilka typer av relationer finns det i dagsläget? o Hur ser fördelningen ut?
Role-PC Quality
Beskriv din roll och din organisation
Beskriv hur ni arbetar med inköp o När kontaktas de? o I vilka processer är de med? o Vad förväntar man sig/vill man ha ut av inköp? o Är ni internkund till inköp eller tvärt om? o Vilka krav ställer inköp på er? o Är ni inblandade i leverantörsaudits?
Hur arbetar ni med globalt respektive lokalt inköp?
Hur påverkar antalet leverantörer ert arbete?
Hur påverkar Alfa Lavals samarbete med specifika leverantörer ert arbete o Hur påverkas ni när AL fasar ut en leverantör?
Vid NPD, vilken tillgång finns det på information om tidigare designade komponenter och deras leverantörer för återanvändning?
När jobbarna ni med specifika sajter o Hur ser sammarbetet ut?
Hur jobbar man för att begränsa komponentfloran?
Hur mäter ni ert arbete? o Skulle det vara rimligt att mäta standardisering?
Finns det något samarbete mellan produktgrupperna? o Hur ser detta samarbete ut?
Hur får man information från leverantörsmarknaden gällande: o Olika typer av tillverkningsmetoder som kräver en viss design? o Standardkomponenter? o Något mer?