Lucian Blaga and “Zalmoxis”: - Lund University Research Portal
Upload
khangminh22Category
view
1download
0
LUND UNIVERSITY
PO Box 117221 00 Lund+46 46-222 00 00
Evaluation of the region-specific risks of accidental radioactive releases from theEuropean Spallation Source
Pédehontaa-Hiaa, Guillaume; Bernhardsson, Christian; Barkauskas, Vytenis; Puzas, Andrius;Eriksson Stenström, Kristina; Rääf, Christopher; Mattsson, SörenPublished in:Medical Physics in the Baltic States
2021
Document Version:Publisher's PDF, also known as Version of record
Link to publication
Citation for published version (APA):Pédehontaa-Hiaa, G., Bernhardsson, C., Barkauskas, V., Puzas, A., Eriksson Stenström, K., Rääf, C., &Mattsson, S. (2021). Evaluation of the region-specific risks of accidental radioactive releases from the EuropeanSpallation Source. In D. Adlienė (Ed.), Medical Physics in the Baltic States: Proceedings of the 15th InternationalConference on Medical Physics (pp. 142-146). Kaunas University Of Technology Press.
Total number of authors:7
Creative Commons License:Unspecified
General rightsUnless other specific re-use rights are stated the following general rights apply:Copyright and moral rights for the publications made accessible in the public portal are retained by the authorsand/or other copyright owners and it is a condition of accessing publications that users recognise and abide by thelegal requirements associated with these rights. • Users may download and print one copy of any publication from the public portal for the purpose of private studyor research. • You may not further distribute the material or use it for any profit-making activity or commercial gain • You may freely distribute the URL identifying the publication in the public portal
Read more about Creative commons licenses: https://creativecommons.org/licenses/Take down policyIf you believe that this document breaches copyright please contact us providing details, and we will removeaccess to the work immediately and investigate your claim.
Download date: 27. Mar. 2022

ISSN 1822-5721
KAUNAS UNIVERSITY OF TECHNOLOGY
MEDICAL PHYSICS IN THE BALTIC STATES
Proceedings of the 15th International Conference on Medical Physics
Kaunas, Lithuania
4 – 6 November, 2021

Executive editor Diana Adlienė
CONFERENCE IS ORGANIZED BY:
Kaunas University of Technology
Skåne University Hospital, Lund University
Medical Physicists Society
University Hospital of Lithuanian University of Health Sciences „Kauno klinikos“
PROGRAM COMMITTEE
Diana ADLIENĖ - Kaunas University of Technology (Lithuania)
Sören MATTSSON - Lund University, Skåne University Hospital (Sweden)
Marius LAURIKAITIS - Medical Physicists Society (Lithuania)
Birutė GRICIENĖ– Vilnius University Hospital „Santaros klinikos“ (Lithuania)
Viktoras RUDŽIANSKAS - Hospital of Lithuanian University of Health Sciences „Kauno klinikos” (Lithuania)
Jurgita LAURIKAITIENĖ – Kaunas University of Technology (Lithuania)
Kalle KEPLER - Radexpert OÜ (Estonia)
Maksims POLAKOVS - Institute of Solid State Physics, University of Latvia (Latvia)
Reda ČERAPAITĖ – TRUŠINSKIENĖ - Lithuanian University of Health Sciences (Lithuania)
Saulius MICKEVIČIUS - Vytautas Magnus University (Lithuania)
ORGANISING COMMITTEE
Benas Gabrielis URBONAVIČIUS - Kaunas University of Technology (Lithuania)
Lena CIBULSKYTĖ - Kaunas University of Technology (Lithuania)
Judita PUIŠO - Kaunas University of Technology (Lithuania)
Dalia BAREIŠIENĖ - Kaunas University of Technology (Lithuania)
Mantvydas MERKIS - Kaunas University of Technology (Lithuania)
Lijana LILEIKYTĖ - Kaunas University of Technology (Lithuania)
CONFERENCE IS SUPPORTED BY:
Kaunas University of Technology
Lund University Skåne University Hospital
Medical Physicists Society
Papers included in the Proceedings were reviewed by independent peer reviewers
©Kaunas University of Technology 2021

MEDICAL PHYSICS IN THE BALTIC STATES 15 (2021)
Proceedings of International Conference “Medical Physics 2021”
4-6 November 2021, Kaunas, Lithuania
REFLECTIONS ON 60 YEARS OF DEVELOPMENT IN MEDICAL PHYSICS
AND THOUGHTS ABOUT THE FUTURE
Sören MATTSSON
Medical Radiation Physics Malmö, Lund University, Skåne University Hospital, SE-205 02 MALMÖ, Sweden
Department of Physics, Kaunas University of Technology, Kaunas, Lithuania
Abstract: The paper deals with advances in medical
physics during the last 60 years and share some
thoughts on the future. Some of today's advances and
challenges in medical physics applied to radiation
therapy, diagnostic radiology, nuclear medicine, MR-
imaging and radiation safety will be discussed. To be
prepared for the future, we need continued good under-
graduate education, advanced postgraduate courses as
well as active research in the different fields of medical
physics.
Keywords: Medical physics, radiotherapy, medical
imaging, radiation safety.
1. Introduction
Medical physics is the application of physics concepts,
theories, and methods to medicine and healthcare. The
International Organisation for Medical Physics (IOMP)
describes the field in the following way: “Medical
physics is a branch of applied physics, pursued by
medical physicists, that uses physics principles, methods
and techniques in practice and research for the pre-
vention, diagnosis and treatment of human diseases with
a specific goal of improving human health and well-
being. Medical physics may further be classified into a
number of sub-fields (specialties), including Radiation
oncology physics, Medical imaging physics, Nuclear
medicine physics, Medical health physics (Radiation
protection in medicine), Non-ionizing medical radiation
physics, and Physiological measurement. It is also
closely linked to neighboring sciences such as
Biophysics, Biological physics, and Health physics”
(https://www.iomp.org/medical-physics/).
2. Development
Figure 1 schematically describes 60 years of
development in medical physics from 1960 until now
and will be discussed in more details below.
Medical physics has taken advantage of the rapid
technological developments in the society, especially of
computers, computer programs and IT. Manual
calculations and calculations using slide-rulers and
pocket calculators have been replaced by calculations
based on self-designed or commercially available
software programs for e.g. dose planning and image
reconstruction. Information, data and images are sent
over the www. Developments of detectors and
electronics in high-energy physics have been adopted
and utilized in medical physics resulting in improved
measuring possibilities and dosimetry. The increased
collaboration with industry has achieved better
accelerators for radiation therapy and production of
radioactive trace elements. A similar cooperation has
taken place with regard to imaging equipment.
Fig 1. Schematic description of developments in medical
physics 1960-2020. For abbreviations, please see the text.
2.1. Radiation therapy technologies
In 1960, radiation therapy dominated the field of
medical physics. Most treatments were based on x-ray
therapy and the use of radium sources. The first 60Co
units had been installed. Then radiation therapy has
undergone a dramatic development. New radiation
sources have been introduced, first betatrons, and then
mostly linear accelerators. Dose planning for external
radiotherapy has been much improved and based on CT
images. The development of the multi-leaf collimator,
3

S. Mattsson / Medical Physics in the Baltic States 15 (2021) 3-8
the inverse dose planning and thus the possibility of
intensity modulated radiation therapy (IMRT) has been
of crucial importance here [1,2]. Volumetric modulated
arc therapy (VMAT), breath-controlled treatments,
stereotactic methods, proton therapy and “MR-only”
radiation therapy have been invented. In parallel,
brachytherapy and after-loading technology, have been
developed and improved. Radiopharmaceutical therapy
was long dominated by the treatment of thyroid diseases
and has now developed in parallel to the diagnostic
nuclear medicine and includes treatments of
neuroendocrine tumours, lymphoma and prostate
cancer.
2.2. Imaging technologies
With the growth of nuclear medicine after the 2nd world
war, medical physicists to a greater extent entered also
the diagnostic applications of ionising radiation. Since
then, the diagnostic applications of ionizing radiation
have undergone an equally dramatic development as the
therapeutic applications [3].
2.2.1 X-ray imaging and CT
In the 1960´s, the radiation physics efforts on the x-ray
side were quite modest. In some countries, gonad doses
were measured [4,5] and the forerunners of the DAP or
KAP meters that are currently available on most x-ray
equipment for controlling the patient radiation dose
were developed and introduced in the clinic [6,7,8].
Much work was later done in relation to optimisation of
imaging and to patient dose estimates and radiation
protection in planar x-ray imaging using various film-
screen combinations [9,10,11]. The development of CT
was a revolutionary contribution of physics and
technology to medicine [12]. CT imaging has broad
diagnostic applications and is the “gold standard” for
many clinical indications. The patient doses are
however higher than for many other x-ray
investigations. In the late 2000´s iterative image
reconstruction methods brought the doses down. Now,
new AI-based deep learning reconstruction and post-
processing techniques have been shown to improve the
diagnostic imaging quality for doses far beyond what is
possible with current reconstruction techniques.
Digital x-ray imaging begun in the 1980´s and over a
period of 30 years it has eliminated the analogue
film/screen technology, now using flat panel detectors
with digital detector arrays. These developments have
needed increased medical physics input.
2.2.2 Nuclear medicine imaging
The earliest nuclear medicine studies were performed
without imaging, just using blood or urine samples or
external counting, initially with Geiger counters and
later with scintillation detectors. Automation of the
external measurements led to development of the
rectilinear scanner, which was frequently used in the
1960´s and 1970´s. The first Anger gamma-cameras
[13] appeared in the late 1960´s and the 99mTc-generator
was invented in 1957 by the three Brookhaven chemists
Walt Tucker, Powell Richards, and Margaret Greene
(and became in more frequent use in the middle of the
1960´s). The combination of technetium 99mTc and the
gamma camera was a success – a combination which
still retains its position, and has been supplemented with
single photon emission computed tomography (SPECT)
[14] and positron emission tomography (PET) [15] and
a number of new radionuclides and
radiopharmaceuticals.
2.2.3 Ultrasound
Ultrasound imaging uses high-frequency sound waves
to view inside the body. The ultrasound image is
produced based on the reflection of the waves off of the
body structures. The strength (amplitude) of the sound
signal and the time it takes for the wave to travel
through the body provide the information necessary to
produce an image. Because ultrasound images are
captured in real-time, they can also show movement of
the body's internal organs as well as blood flow. Compared with other medical imaging modalities, such as
CT and MRI, ultrasound is a low-cost modality and, most
importantly, allows real time bedside imaging.
Conventional ultrasound imaging techniques, however,
have lower specificity and lower spatial resolutions
compared with CT and MRI.
In most hospitals, biomedical engineers and not medical
physicists, are responsible for the control, optimization
and development of ultrasound imaging technology.
2.2.4. Magnetic resonance imaging (MRI)
MRI scanners use strong magnetic fields and radio
waves to make images [16]. The signal in an MR image
comes mainly from the protons in water and fat
molecules in the body. During an MRI examination, an
electric current is passed through coiled wires to create
a temporary magnetic field in a patient’s body. Radio
waves are sent from and received by a
transmitter/receiver in the machine, and these signals
are used to make digital images of the scanned area of
the body. A typical MRI scan last from 20 - 90 minutes,
depending on which part of the body being imaged.
MRI provides better soft tissue contrast than CT and can
differentiate better between muscle, fat and other soft
tissue than CT, which is usually better at imaging bones.
For some MRI exams, intravenous drugs, such as
gadolinium-based contrast agents are used to improve
the contrast of the MR image. MRI takes now over
some CT examinations (prostate cancer, uterine cancer,
certain liver cancers, metastases in the skeleton and
brain).
2.2.5. Hybrid imaging
By using the combined-modalities PET/CT and
SPECT/CT, functional processes can be localized
within the body to an anatomically identified or, in
some instances, as yet unidentifiable structural
alteration. In this way, the accuracy with which a
disease can be detected and described in terms of extent
and severity is increased. The hybrid techniques
PET/CT and SPECT/CT have later been expanded with
PET/MR [17].
4

S. Mattsson / Medical Physics in the Baltic States 15 (2021) 3-8
2.2.6, Artificial intelligence
The large amounts of data that are produced is now
analyzed with the help of artificial intelligence (AI)
technology. Machine learning is a branch of AI based
on the idea that systems can learn from data, identify
patterns and make decisions with minimal human
support. We have already seen that AI technology can
achieve the same image quality as standard imaging
with less data, or alternatively shorter examination
times.
2.3. Radiation protection
The primary aim of radiological protection is to
contribute to an appropriate level of protection for
people and the environment without unduly limiting the
desirable human activities that may be associated with
radiation [18]. ICRP has published General
Recommendations which set out the entire System of
Radiological Protection. In the period 1960-2020 such
recommendations were issued in Publications 1 [19], 6
[20], 9 [21], 26 [22], 60 [23], and 103 [18]. There are
some unique aspects of radiological protection for
patients: Exposure is conscious and voluntary. The same
individual is subject to both benefits and risks. There are
no dose limits for medical exposure of patients. The
exposure is considered justified if it does more good
than harm. There are three eligibility levels to apply:
general, procedure, and individual patient.
In addition to being justified, imaging and therapy must
be optimized. Optimization means that the radiation
dose should be "as low as readily available or ALARA".
In diagnostic and interventional medical exposure, it
means, keeping the exposure of patients to the minimum
necessary to achieve the required diagnostic or
interventional objective. In therapeutic medical
exposure, it means keeping the exposure of normal
tissue as low as reasonably achievable consistent with
delivering the required dose to the planning target
volume.
ALARA is the management of the radiation dose to the
patient in accordance with the medical purpose and
does. ALARA does not necessarily mean the lowest
radiation dose.
In diagnostics, use of diagnostic reference levels, (DRL)
[24] is a way towards optimization. A diagnostic
reference level (DRL) is a specified radiation dose for a
given imaging study that is not expected to be exceeded.
If a radiation dose does exceed the DRL for a particular
study, this should prompt an investigation into
radiographic technique or equipment performance.
For the personnel there are also dose limits, which have
been subject to changes during the period. From 1957,
corresponding to an average annual occupational
effective dose of 50 mSv. For individual members of the
public, the dose limit was set at 5 mSv/year and, in
addition, a genetic dose limit of 50 mSv/generation was
suggested. From 1991, the dose limit is a maximum of
50 mSv in an individual year, or 20 mSv on average per
year over a period of five years. In 2011, ICRP made a
substantial revision to the equivalent dose to the lens of
the eye and reduced it from 150 mSv per year to 20 mSv
per year averaged over 5 years, with no single year
exceeding 50 mSv.
3. Current situation and trends for the future
3.1. X-ray imaging, CT
Today's trends are that the fraction of regular planar x-
rays decrease, CT and MRI increase, while ultrasound
and nuclear medicine retain their share of the
examination panorama [25].
The effective dose per capita from CT, other x-ray
imaging and nuclear medicine diagnostics in Sweden
during 2018 has been estimated to 0.7 mSv [25].
Fig 2. Figure 1 has been expanded to include also the time
period 2020-2060
Recent developments include dual-energy-CT to exploit
differences in the energy dependency of the attenuation
coefficients and give a possibility to selectively display
materials that have the same CT-value in single energy
CT. Another development is photon-counting CT.
Photon-counting CT detectors count the number of
incoming photons and measure photon energy. This
technique results in higher contrast-to-noise ratio,
improved spatial resolution, and optimized spectral
imaging. Compared with current CT technology,
photon-counting CT will allow for reduced radiation
exposure, increased spatial resolution, correction of
beam-hardening artifacts, and alternative contrast agent
protocols while creating opportunities for quantitative
imaging [26].
Tomosynthesis or digital tomosynthesis is a limited
angle tomography at absorbed doses similar to planar
projection radiography. It is frequently applied for
mammographic screening and for chest imaging
3.2. Nuclear medicine
Nuclear medicine includes both the use of
radiopharmaceuticals to track physiological processes
and to deliver therapeutic absorbed doses to specific
targets. The development in both these areas is
illustrated in Figure 3 showing radiopharmaceuticals/
radionuclides used and associated equipment and
substance used for therapy and treated organs and
tissues.
5

S. Mattsson / Medical Physics in the Baltic States 15 (2021) 3-8
Fig. 3. Radiopharmaceuticals/radionuclides and associated
methods and equipment used for diagnostics and therapy of
various organs and tissues.
3.3 Ultrasound
Over the last decade, ultrasound imaging technology has
improved dramatically, creating clearer and more
defined pictures. Real-time computer imaging has
helped increase processing speeds, which in turn
produces better images. New contrast enhancing agents
have been introduced as well as therapeutic use of high-
intensity focused ultrasound. Integration of ultrasound
with other diagnostic or therapeutic modalities have
been done.
3.4. MRI
Magnetic resonance imaging shows a strong expansion.
MRI takes over some CT examinations (prostate cancer,
uterine cancer, certain liver cancers, metastases in the
skeleton and brain). Breast cancer screening MRI may
be of value to women with unclear findings and dense
breasts. The slowness is however the Achilles´ heel of
the MRI technology. Therefore, so called super-fast
MRI protocols are developed. MRI is used for
morphological imaging, MR angiography, diffusion-
perfusion measurements, functional MRI (fMRI) and
MRI spectroscopy.
3.5 Hybrid imaging
PET / MR
By replacing the vacuum PM tubes in PET (which is
disturbed by the magnetic fields from the MR camera)
with avalanche photodiodes (SiPM) [27], it has been
possible to integrate the PET and MR equipment. Such
cameras are currently available in a limited number of
hospitals/research centers.
3.6. Radiation therapy
MR-Linac combines a linear accelerator with a MRI
scanner [28]. This enables tracking of breathing-induced
and other movements and adapts the specific therapy
delivery. It also registers any change in position and
volume of the tumour during the weeks of therapy. It
increases the chance of better tumor control and reduces
the risk of damage to surrounding healthy tissue.
Proton therapy is a promising treatment technique
especially for patients whose tumors are close to
sensitive organs in the head, chest, or abdominal cavity.
A proton beam can be controlled more precisely than
traditional photon radiation, which can reduce the risk
of side effects. The energy in a proton beam can be
varied so that the radiation dose almost entirely ends up
at a certain predetermined depth.
Therefore, radiation with proton therapy can be almost
completely concentrated on the tumor itself, thus the
radiation absorbed dose can be increased, while
maintaining a low dose to the surrounding normal
tissues. Proton therapy is particularly suitable for
children and adolescents since fewer long-term side
effects are expected than from conventional therapy. In
a few places in the world, therapy is also done with
heavier ions, usually carbon ions. Compared to protons,
the carbon ion beams add to the geographical precision
also a higher biological effectiveness for treatment of
some specific types of cancer.
4. Outlook
4.1. X-rays, CT
CT stands for a majority of the dose contribution in
today’s radiology. There is a need to improve the
dosimetry at CT investigations. To continue to rely on
only CTDI, DLP and effective dose is not enough. We
urgently need to decrease the uncertainties in the dose
estimates for assessment of the risk of cancer and non-
cancer effects. This is if special importance for a
number of patients undergoing multiple CT scans, for
pregnant women who need a CT scan, and in case of
accidents. In fact, every discussion about justification
and optimization needs accurate dose estimates.
A first step is to implement the joint recommendations
from the American Association of Physicists in
Medicine (AAPM) and the European Federation of
Organisations for Medical Physics (EFOMP) in their
AAPM Report 246 [29]. A very valuable review of the
field is given in a new book entitled “The physics of CT
dosimetry. CTDI and beyond by Robert Dixon [30].
4.2. Nuclear medicine
Today, many nuclear research reactors are being shut
down. One immediate consequence is the shortage of
medical radionuclides, such as 99mTc. It is therefore
important to investigate alternative technologies to
produce a sustainable supply of 99mTc [31].
In positron emission tomography, as much as 40% of
positron annihilation occurs through the production of
positronium atoms inside the patient’s body. The decay
of these is sensitive to metabolism and could provide
information about disease progression. New research is
needed to take full advantage of what positronium
decays reveal [32].
4.3 MRI
Today, hospitals routinely use machines with field
strengths of 1.5 T or 3 T but ultra-high-field scanners
are on the rise. There are already dozens of 7 T
machines in research labs around the world, and 2017,
the first 7 T model was cleared for clinical use in both
the United States and Europe. At the extreme end are
scanners designed for humans that reach beyond 10 T
6
S. Mattsson / Medical Physics in the Baltic States 15 (2021) 3-8
having a potential for imaging with greater spatial
resolution, or at the same resolution, but faster. Still, at
some point there will be a limit to field strength beyond
which one can’t go without damaging the body
.
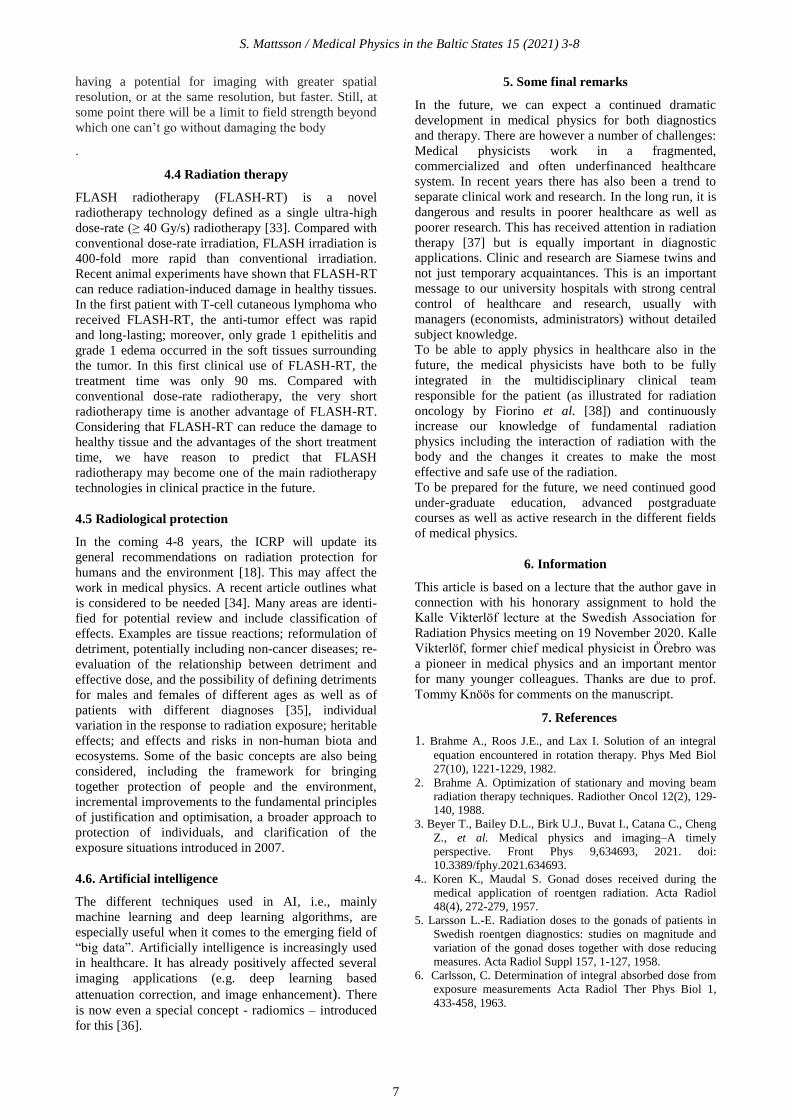
4.4 Radiation therapy
FLASH radiotherapy (FLASH-RT) is a novel
radiotherapy technology defined as a single ultra-high
dose-rate (≥ 40 Gy/s) radiotherapy [33]. Compared with
conventional dose-rate irradiation, FLASH irradiation is
400-fold more rapid than conventional irradiation.
Recent animal experiments have shown that FLASH-RT
can reduce radiation-induced damage in healthy tissues.
In the first patient with T-cell cutaneous lymphoma who
received FLASH-RT, the anti-tumor effect was rapid
and long-lasting; moreover, only grade 1 epithelitis and
grade 1 edema occurred in the soft tissues surrounding
the tumor. In this first clinical use of FLASH-RT, the
treatment time was only 90 ms. Compared with
conventional dose-rate radiotherapy, the very short
radiotherapy time is another advantage of FLASH-RT.
Considering that FLASH-RT can reduce the damage to
healthy tissue and the advantages of the short treatment
time, we have reason to predict that FLASH
radiotherapy may become one of the main radiotherapy
technologies in clinical practice in the future.
4.5 Radiological protection
In the coming 4-8 years, the ICRP will update its
general recommendations on radiation protection for
humans and the environment [18]. This may affect the
work in medical physics. A recent article outlines what
is considered to be needed [34]. Many areas are identi-
fied for potential review and include classification of
effects. Examples are tissue reactions; reformulation of
detriment, potentially including non-cancer diseases; re-
evaluation of the relationship between detriment and
effective dose, and the possibility of defining detriments
for males and females of different ages as well as of
patients with different diagnoses [35], individual
variation in the response to radiation exposure; heritable
effects; and effects and risks in non-human biota and
ecosystems. Some of the basic concepts are also being
considered, including the framework for bringing
together protection of people and the environment,
incremental improvements to the fundamental principles
of justification and optimisation, a broader approach to
protection of individuals, and clarification of the
exposure situations introduced in 2007.
4.6. Artificial intelligence
The different techniques used in AI, i.e., mainly
machine learning and deep learning algorithms, are
especially useful when it comes to the emerging field of
“big data”. Artificially intelligence is increasingly used
in healthcare. It has already positively affected several
imaging applications (e.g. deep learning based
attenuation correction, and image enhancement). There
is now even a special concept - radiomics – introduced
for this [36].
5. Some final remarks
In the future, we can expect a continued dramatic
development in medical physics for both diagnostics
and therapy. There are however a number of challenges:
Medical physicists work in a fragmented,
commercialized and often underfinanced healthcare
system. In recent years there has also been a trend to
separate clinical work and research. In the long run, it is
dangerous and results in poorer healthcare as well as
poorer research. This has received attention in radiation
therapy [37] but is equally important in diagnostic
applications. Clinic and research are Siamese twins and
not just temporary acquaintances. This is an important
message to our university hospitals with strong central
control of healthcare and research, usually with
managers (economists, administrators) without detailed
subject knowledge.
To be able to apply physics in healthcare also in the
future, the medical physicists have both to be fully
integrated in the multidisciplinary clinical team
responsible for the patient (as illustrated for radiation
oncology by Fiorino et al. [38]) and continuously
increase our knowledge of fundamental radiation
physics including the interaction of radiation with the
body and the changes it creates to make the most
effective and safe use of the radiation.
To be prepared for the future, we need continued good
under-graduate education, advanced postgraduate
courses as well as active research in the different fields
of medical physics.
6. Information
This article is based on a lecture that the author gave in
connection with his honorary assignment to hold the
Kalle Vikterlöf lecture at the Swedish Association for
Radiation Physics meeting on 19 November 2020. Kalle
Vikterlöf, former chief medical physicist in Örebro was
a pioneer in medical physics and an important mentor
for many younger colleagues. Thanks are due to prof.
Tommy Knöös for comments on the manuscript.
7. References
1. Brahme A., Roos J.E., and Lax I. Solution of an integral
equation encountered in rotation therapy. Phys Med Biol
27(10), 1221-1229, 1982.
2. Brahme A. Optimization of stationary and moving beam
radiation therapy techniques. Radiother Oncol 12(2), 129-
140, 1988.
3. Beyer T., Bailey D.L., Birk U.J., Buvat I., Catana C., Cheng
Z., et al. Medical physics and imaging–A timely
perspective. Front Phys 9,634693, 2021. doi:
10.3389/fphy.2021.634693.
4.. Koren K., Maudal S. Gonad doses received during the
medical application of roentgen radiation. Acta Radiol
48(4), 272-279, 1957.
5. Larsson L.-E. Radiation doses to the gonads of patients in
Swedish roentgen diagnostics: studies on magnitude and
variation of the gonad doses together with dose reducing
measures. Acta Radiol Suppl 157, 1-127, 1958.
6. Carlsson, C. Determination of integral absorbed dose from
exposure measurements Acta Radiol Ther Phys Biol 1,
433-458, 1963.
7

S. Mattsson / Medical Physics in the Baltic States 15 (2021) 3-8
7. Carlsson, C.A., Integral absorbed doses in roentgen
diagnostic procedures, I: The dosemeter, Acta Radiol 3,
310–326, 1965.
8. Pychlau H. and Pychlau P. Ein Diagnostik-Dosimeter-
Grundform und Abwandlung Deutsch Röntgenkongr,
1963, Beiheft Fortschr Röntgenstr 100, 177-180.
9. European Commission. European guidelines on quality
criteria for diagnostic radiographic images. EUR 16260,
1996, 80 pp.
10. Moores B.M., Mattsson S., Månsson L.G., Panzer W.,
Regulla D., Dance D., et al. RADIUS - closing the circle
on the assessment of imaging performance. Radiat Prot
Dosim 114(1-3), 450-457, 2005.
11. IAEA. Dosimetry in diagnostic radio logy: an international
code of practice. TechnicalReports Series No. 457, 2007.
12. Hounsfield G.N. Computerized transverse axial scanning
(tomography): Part 1, description of system. Brit J Radiol
46(552), 1016-1022, 1973.
13. Anger H.O. Scintillation camera. Rev Sci Instrum 29, 27,
1958.
14. Kuhl D.E., and Edwards R.Q. Image separation
radioisotope scanning. Radiology 80, 653–662, 1963.
15. Hoffman E.J. and Phelps M.E. Positron emission
tomography. Medical Instrumentation 13, 147-151.
16. Lauterbur P.C. Image formation by induced local
interactions: examples employing nuclear magnetic
resonance. Nature 242, 190–191, 1973.
17. Cal-Gonzalez J., Rausch I., Shivam Sundar
L.K., Lassen M.L, Muzik O., Moser E, et al. Hybrid
imaging: Instrumentation and data processing.
Front Phys, 6, 47, 2018.
doi.org/10.3389/fphy.2018.00047
18. ICRP. The 2007 Recommendations of the Inter-national
Commission on Radiological Protection. ICRP Publication
103. Ann ICRP 37(2–4), 2007.
19. ICRP. Recommendations of the International Commission
on Radiological Protection. Now known as ICRP
Publication 1. Pergamon Press, London, 1959.
20. ICRP. Recommendations of the International Commission
on Radiological Protection. ICRP Publication 6. Pergamon
Press, Oxford, 1964.
21. ICRP. Recommendations of the International Commission
on Radiological Protection. ICRP Publication 9. Pergamon
Press, Oxford, 1966.
22. ICRP. Recommendations of the ICRP. ICRP Publication
26. Ann ICRP 1(3), 1977.
23. ICRP. 1990 Recommendations of the International
Commission on Radiological Protection. ICRP Publication
60. Ann ICRP 21(1–3), 1991.
24. ICRP. Diagnostic reference levels in medical imag-ing.
ICRP Publication 135. Ann ICRP 46 (1), 2017.
25. Almén A. and Jangland L. Radiologiska undersök-ningar i
Sverige under 2018. Report SSM 2020:14 (In Swedish).
26. Willemink M.J., Persson M., Pourmorteza A., Pelc N.J.,
and Fleischmann D. Photon-counting CT: Technical
principles and clinical prospects. Radiology 289, 293–312,
2018.
27. Herrnsdorf L., Caccia M., and Mattsson S. Silicon
photomultiplier for medical imaging and dosimetry-An
overview. Radiat Prot Dosim 169(1-4), 430-435, 2016.
28. Raaymakers B.W., Lagendijk J.J.W., Overweg J., Kok
J.G.M., Raaijmakers A.J.E., Kerkhof E.M., et al.
Integrating a 1.5 T MRI scanner with a 6 MV accelerator:
proof of concept. Phys Med Biol 54(12), N229-237, 2009.
29. Andersson J., Pavlicek W., Al-Senan R., Bolch W.,
Bosmans H., Cody D., et al. Estimating patient organ
dose with computed tomography: A review of present
methodology and required DICOM informa-tion. A Joint
Report of AAPM Task Group 246 and the European
Federation of Organizations for Medi-cal Physics
(EFOMP). AAPM Report No 246, 2019.
30. Dixon R.L. The physics of CT dosimetry. CTDI and
beyond. Series in Medical Physics and Biomedical
Engineering, 1st Edition, CRC Press, 2021, 232 p.
31. Charlton K. A sustainable future for nuclear
Imaging. Nature Rev Phys 1, 530-532, 2019.
32. Moskal P., Jasińska B., Stępień E.L., and Bass S.D.
Positronium in medicine and biology. Nature
Rev Phys 1, 527-529, 2019.
33. Lin B., Gao F., Yang Y., Wu D., Zhang Y., Feng G.,
et al. FLASH radiotherapy: History and future.
Review article. Front Oncol, 25 May 2021,
doi.org/10.3389/fonc.2021.644400
34. Clement C., Rühm W., Harrison J., Applegate K.,
Cool D., Larsson C.-M., et al. Keeping the ICRP
recommendations fit for purpose. J Radiol Prot (in
press), 2021.
doi.org/10.1088/1361-6498/ac1611
35. Andersson M., Eckerman K., Pawel D., Almén A.,
and Mattsson S. Improved radiation risk models
applied to different patient groups in Sweden.
Radiation Hygiene (Radiatsionnaya Gygiena) 12(2),
44-54, 2019
36. van Timmeren J.E., Cester D., Tanadini-Lang S.,
Alkadhi H., and Baessler B. Radiomics in
medical imaging—“how-to” guide and critical
reflection. Insights into Imaging 11, 91, 2020.
doi.org/10.1186/s13244-020-00887-2
37. Bortfeld T., Torresin A., Fiorino C., Andreo P.,
Gagliardi G., Jeraj R., et al. The research versus
clinical service role of medical physics. Radiother
Oncol 114, 285-288, 2015.
38. Fiorino C., Jeraj R., Clark C.H., Garibaldi C., Georg D.,
Muren L., et al.. Grand challenges for medical physics in
radiation oncology. Radiother Oncol 153, 7-14, 2020.
8

MEDICAL PHYSICS IN THE BALTIC STATES 15 (2021)
Proceedings of International Conference “Medical Physics 2021”
4-6 November 2021, Kaunas, Lithuania
DEVELOPING STRATEGIC LEADERSHIP SKILLS IS CRUCIAL FOR THE
FUTURE OF MEDICAL PHYSICS
Carmel J. CARUANA
Medical Physics, Faculty of Health Sciences, University of Malta
Abstract: In times of rapid change, inter-professional
competition, austerity economics and commoditization,
strategic leadership is critical for all professions; more so
for small professions such as Medical Physics.
Notwithstanding this, a comprehensive search regarding
leadership in Pubmed resulted in only 3 relevant hits for
Medical Physics as opposed to 2590 for the Medical
profession. Medical Physicists give little attention to
strategic leadership and this needs to change if the
profession is to move forward – indeed survive.
Keywords: strategic leadership, medical physics,
leadership roles.
1. Introduction
In a world of rapid change, inter-professional
competition, austerity economics and sometimes
unbridled commoditization, strategic leadership has
become crucial for all professions and even more for
small professions such as Medical Physics.
2. Literature review
A comprehensive search regarding medical physics
leadership carried out via Pubmed and Google in
November 2020 led to the conclusion that Medical
Physicists give too little attention to leadership when
compared to the Medical profession. Indeed using the
searchwords ‘leadership medical physics’ vs ‘leadership
medical’ in title in Pubmed resulted in only 7 hits for
Medical Physics (3 relevant) as opposed to 2590 for
Medical. Using ‘strategic planning medical physics’ vs
‘strategic planning medical’ resulted in only 1 hit for
Medical Physics and 232 for Medical. Total number of
relevant articles for Medical Physics leadership in
Pubmed were only four[1-4]. The first article discussed
whether an MBA is needed for Medical Physics
leadership roles; the second described an international
online medical physics mentoring programme; the third
discussed leadership in the ambit of redefining and
reinvigorating the role of physics in clinical medicine in
the US whilst the last was a point-counterpoint discussion
for and against the introduction of subjects such as
strategic planning, extra-disciplinary communication,
and management in the medical physics curriculum. A
book on strategic leadership for Medical Physicists was
published in 2020 Fig. 1 [5]. A comprehensive module
on leadership has been offered biannually by the
EUTEMPE consortium in Europe (Fig. 2) over the last 6
years and is based on real world leadership case
studies[6]. The AAPM organizes an annual meeting and
sometimes a summer school through its leadership
academy[7]. Using the searchword ‘leadership’ in the
AAPM Virtual Library again in November 2020 led to
47 presentations but few were relevant to strategic
leadership. However, it is very significant to note that the
AAPM leadership academy has since taken proactive
steps to raise its profile and also promote the use of real
world case studies as in the case of the EFOMP-
EUTEMPE module mentioned earlier [8-12]. The
Medical Physics Leadership and Mentoring group has
developed some resources [13].
3. Effects of absence of strategic leadership
The lack of attention to strategic leadership over the past
years have had their undesirable effects. Other
professions have sought to expand their own role at the
expense of ours. A case in point is the role of Radiation
Protection Expert which in some countries is being lost
to other professions which are much less competent than
we are in the subject and who have qualifications lower
than those recommended by ENETRAP [14] and IRPA
[15] (which both insist on Radiation Protection Experts
having a first degree in either radiation protection or
physics/engineering/mathematics). However, all is not
lost provided we move fast and take the necessary actions
in a proactive manner as opposed to reacting to events
as they unfold.
4. Conclusions
Medical Physicists give little attention to strategic
leadership and this needs to change if the profession is to
9

C. J. Caruana et al. / Medical Physics in the Baltic States 15 (2021) 9-10
move forward - indeed survive. We need to ensure that
both the present generation of Medical Physics leaders as
well as the next generation of young leaders are
intrinsically both scientific and strategic leaders. We
need to include leadership in our curricula starting at an
early level. The profession also needs to invest time in
developing learning resources in strategic leadership
specifically targeted to Medical Physicists.
Fig. 1. Cover of the only book in strategic leadership for
Medical Physicists
Fig. 2. The EFOMP-EUTEMPE module in leadership for
Medical Physicists. The next run of the module which will be
held in Oct 2022 – Feb 2023 will include leadership for all
specialties of Medical Physics.
5. References
1. Burinskiene Gutierrez AN et al. MBA degree is needed for
leadership roles in Medical Physics profession. J Appl Clin
Med Phys. 2017:6:6-9.
2. Santos JC et al. Leadership and mentoring in medical
physics: The experience of a medical physics international
mentoring program. Phys Med. 2020:76:337-344.
3. Samei E et al. Redefining and reinvigorating the role of
physics in clinical medicine: A Report from the AAPM
Medical Physics 3.0 Ad Hoc Committee. Med Phys. 2018
Jul 10.
4. Caruana CJ et al. Subjects such as strategic planning, extra-
disciplinary communication, and management have
become crucial to medical physics clinical practice and
should become an integral part of the medical physics
curriculum. Med Phys. 2017:44:3885-3887.
5. Caruana CJ. Leadership and Challenges in Medical Physics:
A Strategic and Robust Approach. A EUTEMPE network
book. IOP Publishing 2020.
https://iopscience.iop.org/book/978-0-7503-1395-7
6. EUTEMPE consortium: Module MPE01 Leadership in
Medical Physics, development of the professions and the
challenges for the Medical Physics Expert http://eutempe-
net.eu/mpe01/
7. AAPM Medical Physics Leadership Academy
https://www.aapm.org/org/structure/?committee_code=M
PLAWG
8. Gronberg M and Wang D. Introduction of Medical Physics
Leadership Academy (MPLA) case studies. J Appl Clin
Med Phys 2021; 22:3:287.
9. Wang D, Kim L, Gronberg M, Stambaugh C. A brief guide
to writing a medical physics leadership case. J Appl Clin
Med Phys 2021; 22:3:285–286.
10.Wang D, Meis G, Ellet W, Kim L. Stambaugh C, Gronberg
M, Johnson J. MPLA Case 1: Implementing Cone‐Beam
CT in a Community Hospital. J Appl Clin Med Phys 2021;
22:3:246–250.
11. Wang D, Meis G, Gronberg M, Stambaugh C, Kim L.
MPLA Case 2: A junior physicist attempts to improve
radiotherapy workflow. J Appl Clin Med Phys 2021; 22
:3:251–253.
12. Hendrickson K, Kim S, Stambaugh C, Gronbeg M, Kim L,
Wang D. MPLA Case 3: Don’t criticize me in public! J
Appl Clin M wileyonlinelibrary.com/journal/acm2 ed Phys.
2021;22:280–283.
13. Medical Physics Leadership and Mentoring group.
https://medphysmentoring.wixsite.com/medphys-
mentoring
https://www.youtube.com/channel/UCPZJeXW-_pFfY-
khOog3W3w
14. ENETRAP (2016). European Guidance on the
Implementation of the Requirements of the Euratom BSS
with respect to the Radiation Protection Expert and the
Radiation Protection Officer.
http://euterp.eu/uploaditems/ENETRAPIII/ENETRAP-III-
European-Guidance-Document-01-03-2016.pdf
15. IRPA guidance on certification of a Radiation Protection
Expert (2016)
www.irpa.net/docs/IRPA%20Guidance%20on%20Certific
ation%20of%20a%20RP%20Expert%20(2016).pdf
10

MEDICAL PHYSICS IN THE BALTIC STATES 15 (2021)
Proceedings of International Conference “Medical Physics 2021”
4-6 November 2021, Kaunas, Lithuania
THE ADJUSTED EFFECTIVE DOSE ASSESSMENT FROM CT OF THE
CHEST FOR PEDIATRIC PATIENTS: A HOSPITAL BASED STUDY
P.S. Druzhinina1, L.A. Chipiga1,2,3, A.V. Vodovatov1,4, A.V. Pozdnyakov4, Yu. N. Kapyrina4, D.O. Ivanov4, Yu.
V. Petrenko4, V.G. Puzyrev4 1St-Petersburg Research Institute of Radiation Hygiene after professor P.V. Ramzaev, St-Petersburg, Russia; 2A.
Granov Russian Scientific Center of Radiology and Surgical Technologies, Saint-Petersburg, Russia; 3V. Almazov
National Medical Research Center, Saint-Petersburg, Russia; 4St. Petersburg State Pediatric Medical University, St-
Petersburg, Russia 1Corresponding author: [email protected]
Abstract: Computed tomography is associated with high
patient doses. CT is actively used in pediatric
diagnostics, however, currently, there is no reliable data
on the pediatric patient doses in the Russian Federation.
The current study presents the data on the assessment of
the effective doses for 5, 10, and 15-year-old pediatric
patients from CT examinations of the chest. Data was
collected in a major university hospital in St.
Petersburg.
Keywords: computed tomography, pediatric patients,
effective dose
1. Introduction
Today, computed tomography (CT) is one of the most
informative methods of X-ray diagnostics, generally
used for diagnostic of both adult and pediatric patients.
CT is associated with significant individual patient
doses [1]. In the Russian Federation, the number of CT-
examinations increases every year, with a proportional
increase in the collective dose.
Fig. 1. Contribution of CT to the collective dose of the population of
the Russian Federation from all types of medical exposure according to the 3-DOZ form
In addition, in the context of a pandemic of a novel
coronavirus infection (COVID-19), due to insufficient
sensitivity of laboratory diagnostic methods, computed
tomography became the main method of early and
primary diagnosis of COVID-19 in the Russian
Federation, including pediatrics.
At the same time, there is no reliable information on the
exposure levels of pediatric patients in the Russian
Federation. In the 3-DOZ form of the ESKID system,
which is the only centralized source of information on
patient doses, it does not specifically account for the X-
ray examinations of children [2]. There are almost no
publications focused on the evaluation of the Russian
doses in pediatric radiology, including CT.
In the international practice, special attention is focused
on the radiation protection of pediatric patients during
CT examinations, including the collection and analysis
of data on the levels of exposure, the assessment of
typical doses of pediatric patients, the establishment and
the use of reference diagnostic levels as an optimization
tool [3-8, 14-18]. This attention is explained by the fact
that children are the most sensitive group to the effects
of ionizing radiation [5].
Despite the fact that in international practice it is
CTDIvol and DLP values that are commonly used for the
assessment of the patient dose, in this study, the
effective doses were calculated, since in the Russian
Federation the patient doses are expressed in this value.
Modern CT scanners are equipped with automatic tube
current modulation programs. These programs
determine the tube current and, as a result, the patient
dose, depending on the thickness and density of the
scanned area. One of the features of the assessment of
pediatric doses is a wide range of their anthropometric
characteristics (height, body mass, physique, and other
derived indicators), which determine the variability of
doses for individual patients.
The aim of the study was to evaluate the effective doses
of 5-, 10- and 15-year-old children, considering their
anthropometric characteristics, during chest CT
examinations for the period from January to December
48.9 51.8 54 57.7 60.2
77
0
20
40
60
80
100
2015 2016 2017 2018 2019 2020
Co
llecti
ve d
ose
co
ntr
ibu
tio
n, %
Years
11

P.S. Druzhinina et al. / Medical Physics in the Baltic States 15 (2021) 11-14
2020 on the base of the major St. Petersburg university
hospital.
2. Materials and methods
The data for the study was collected on the base of the
CT department of the St. Petersburg State Pediatric
Medical University.
For the period from January to December 2020 data was
collected on 79 CT-examinations of the chest without
contrast, performed for three groups of children with an
average age: 5, 10, and 15 years. This sample was
randomly selected from the general array of children
who underwent CT-examinations during this period.
The distribution of the sample of patients by age is
presented in Table 1.
Table 1. The number of patients participating in the study
Age range Age group The number of
patients
2-6 5 19
7-11 10 34
12-16 15 26
All examinations were performed on a Brilliance eCT
System computed tomograph (Philips Medical Systems,
USA, year of manufacture – 2011).
The following characteristics were collected for each
patient: age (years), height (cm), body mass (kg).
Additionally, the anterior-posterior and lateral body
dimensions were determined. The calculation of the
effective diameters of the patients was performed using
the expression 1.
𝑑𝑒𝑓𝑓 = √𝐴𝑃 × 𝐿𝐴𝑇, сm (1)
where, AP - anterior-posterior patient body size, cm;
LAT - lateral patient body size, cm [4].
Anterior-posterior and lateral patient body size
measurements were performed using the Philips CT
workstation software. Body dimensions were measured
on a slice corresponding to the middle part of the
sternum by analyzing the patient medical records.
The parameters of the CT examinations were collected
by direct registration from the CT console, as well as by
the data extracted from DICOM images with
preliminary anonymization. For each CT examination,
the following parameters were collected: scan length
(cm), and volume computed tomographic dose index
(CTDIvol, mGy) considering tube current modulation for
each patient.
Several protocols were used for chest scans in the CT
department. The standard parameters of the protocols
are presented in Table 2.
Calculation of the adjusted effective doses of pediatric
patients considered body mass and height using the
specialized software NCICT 3.0 [11-13].
This software allows calculating the absorbed doses in
organs and the effective dose, considering the specifics
of the CT scanner model based on the examination
parameters. It should be noted that this effective dose
does not correspond to the ICRP definition and is a
value that depends on the gender, body mass and height
of the patient [11-13]. Moreover, this software does not
consider the dose to the lymphatic system.
Table 2. Standard CT scan protocol parameters
Pro
toco
l
Ch
est Lo
w
Do
se
Ch
ild
Ch
est 20
-
30
kg
Ch
est
Sta
nd
ard
Ch
ild
Ch
est 40
-
50
kg
Ch
ild
Ch
est 30
-
40
kg
Scan type Helical Helical Helical Helical Helical
Collimatio
n, mm
64x0,
625
64x0,
625
64x0,
625
64x0,
625
64x0,
625
Pitch,
rel.un. 1,49 1,575 0,797 1,49 1
Rotation
time, s 0,4 0,4 0,75 0,4 0,4
Scan time,
s 3 1,6 9,8 1,7 2,5
Voltage,
kV 120 100 120 120 100
Exposition,
mAs 64 84 159 104 158
To calculate the adjusted individual effective doses, a
phantom was selected for each patient that corresponded
to his gender and was the closest to his anthropometric
data; the model of the computed tomography scanner
and such parameters of the examination as CTDIvol and
scan length were also considered.
Statistical data processing was performed using
Statistica 12.0 and Microsoft Excel software.
3. Results
The results of the calculated effective diameter
distribution of the surveyed age groups are presented in
Figure 1.
Fig. 1. Distribution of calculated effective diameters in the
studied age groups. Results are presented in the format:
median ± 25% -75%-percentiles (minimum-maximum)
The distribution of parameters of effective doses of
chest CT examination is presented in table 2. The results
of the study show that for 5-year-old children the
effective doses are minimal and are lower than the
effective doses for other age categories (10-year-old up
to a factor of 1,5 and 15-year-old up to a factor of 2).
12

P.S. Druzhinina et al. / Medical Physics in the Baltic States 15 (2021) 11-14
Effective doses for 10- and 15-year-old children differ
for 22%.
Table 2. Distribution of parameters of effective doses of chest
CT examination. Descriptive statistics are presented in the
format: median ± standard deviation, (minimum-maximum)
Age group ENCICT, mSv
5-year-old 2,8±1,3
(0,8-5,6)
10-year-old 5,1±1,2
(2,1-7,4)
15-year-old 6,3±1,8
(1,7-10,4)
4. Discussion
The typical (median) local doses in a facility for chest
CT-examinations were: 5-year old – 2,8 mSv; 10-year
old – 5,1 mSv; 15-year-old – 6,3 mSv.
The results show that the effective dose depends on the
patient age - the lowest is observed in children with an
average age of 5- years, the highest is observed in
children with an average age of 15-years. This is due to
the fact that children in each age group differ in chest
thickness. Figure 1 shows that the effective diameter is
directly proportional to the age group. Thus, an increase
in the thickness and density of the scanned area leads to
an increase in tube current and an increase in CTDIvol
and patient effective dose.
A comparison of the typical effective doses of CT
examination of chest with data from foreign sources was
carried out. The comparison results are presented in the
table 3.
Table 3. The comparison of the typical effective dose values
with foreign data of chest CT examinations
Age
Foreign data Collected
data*
[21]
2017
[22]**
2012
[17]*
2016
[18]
2017
[20]
2014
NCICT,
mSv
5 0,8±0
,4 1,8-13,0
6,4 1,0
128-slices:
0,61±0,32
64-slices:
1,24±0,97
Others:
2,56±1,98
2,8
10 - - 1,0 - 5,1
15 - - 3,3 - 6,3
*For western CT manufacturer
**There was no information about division by age
The comparison of the results shows that in foreign
practice there are no differences between the effective
doses for different age categories of children. At the
same time, there are significant (up to a factor of 7)
differences between the effective doses for the same age
category between different sources, which indicates the
use of different CT scanning protocols and the lack of
harmonization of practices.
Comparing patient doses between different CT
departments and medical facilities, it is necessary to
consider the differences in medical practices - different
models and year of manufacture of computed
tomographs, different parameters of the scanning
protocols, the use of programs for automatic modulation
of the tube current. In addition, it is also necessary to
consider the differences in the body size of the patients.
All of these factors affect the patient dose.
Difficulties in assessing the children doses can also be
associated with the large number of scanning protocols
with different parameters and, simultaneously, lack of
standardization of their use in specific clinical cases.
For example, children with similar anthropometric
characteristics and similar clinical cases can be scanned
on different protocols, and as a result, the doses can
vary.
To ensure the radiation protection of pediatric patients,
it is necessary to use the principle of optimization of CT
examinations. It requires a revision of all CT scan
protocols. It is important to determine the specific
parameters for a particular tomography scanner, which
provide the minimum dose to the patient and required
quality of the CT image. Moreover, over time, more and
more modern scanning protocols appear (including for
children) which allow reducing the patient dose.
5. Conclusions
1. The typical local doses in a facility for chest CT-
examinations without contrast are: 5-year old – 2,8
mSv; 10-year old – 5,1 mSv; 15-year-old – 6,3 mSv.
2. The patient dose depends both on the physical and
technical characteristics of the equipment (CT model,
parameters of the scanning protocols, the availability of
programs for automatic modulation tube current), and
on the anthropometric characteristics of the patients (the
thickness of the scanned area). All of these parameters
must be considered for calculating doses for pediatric
patients.
3. To ensure the radiation protection of pediatric
patients, it is necessary to use the principle of
optimization of CT examinations. It requires a revision
of all CT scan protocols. It is important to determine the
specific parameters for a particular tomography scanner,
which provide the minimum dose to the patient and
required quality of the CT image.
Acknowledgements
The authors would like to thank the medical staff of the
CT department of the St. Petersburg State Pediatric
Medical University for the support in the data
collection.
6. References
1. Druzhinina P.S. Proposals for the Russian quality
assurance program in computed tomography/Druzhinina
P.S., Chipiga L.A., Ryzhov S.A., Vodovatov A.V.,
Berkovich G.V., Smirnov A.V., Yaryna D.V., Ermolina
E.P., Druzhinina U.V.// Radiatsionnaya Gygiena =
Radiation Hygiene.
2. Filling of the Federal state statistical surveillance form No.
3-DOZ. Methodical recommendations the provision of the
radiation safety. Approved by the Federal Service for
Surveillance on Human Well-being and Consumer Rights
Protection on February 16, 2007, No. 0100 / 1659-07-26
(In Russ.)
3. Ranish Deedar Ali Khawaja. Simplifying Size-Specific
Radiation Dose Estimates in Pediatric CT/ Ranish Deedar
13

P.S. Druzhinina et al. / Medical Physics in the Baltic States 15 (2021) 11-14
Ali Khawaja, Sarabjeet Singh, Beth Vettiyil, Ruth Lim,
Michael Gee, Sjirk Westra, Mannudeep K. Kalra//AJR –
2015. – V.204. – 167-177p.
4. The American Association of Physicists in Medicine.
Size-Specific Dose Estimates (SSDE) in Pediatric and
Adult Body CT Examinations/ American Association of
Physicists in Medicine//AAPM Report No 204. – 2011. –
30p.
5. The International Commission on Radiological Protection.
Diagnostic Reference Levels in Medical
Imaging/ICRP//ICRP PUBLICATION 135. Ann. ICRP
46(1). – 2017. – 140p.
6. Neige M Y Journy. Individual radiation exposure from
computed tomography: a survey of paediatric practice in
French university hospitals, 2010-2013/Neige M Y Journy
, Serge Dreuil , Nathalie Boddaert , Jean-François Chateil,
Didier Defez, Hubert Ducou-le-Pointe , Jean-Marc
Garcier, Joël Guersen , Bouchra Habib Geryes , Andreas
Jahnen , Choonsik Lee , Jacqueline Payen-de-la-
Garanderie , Jean-Pierre Pracros , Dominique Sirinelli,
Isabelle Thierry-Chef , Marie-Odile Bernier// Eur Radiol. -
2018 Feb;28(2):630-641. Doi: 10.1007/s00330-017-5001-
y.
7. David Célier. Multicentre survey on patient dose in
paediatric imaging and proposal for updated diagnostic
reference levels for France. Part 1: computed
tomography/David Célier, Patrice Roch , Cécile Etard ,
Hubert Ducou Le Pointe, Hervé J Brisse// Eur Radiol. -
2020 Feb;30(2):1156-1165. Doi: 10.1007/s00330-019-
06405-3.
8. J Vassileva. A study to establish international diagnostic
reference levels for paediatric computed tomography/J
Vassileva, M Rehani , D Kostova-Lefterova , H M Al-
Naemi , J S Al Suwaidi, D Arandjic, E H O Bashier, S
Kodlulovich Renha, L El-Nachef , J G Aguilar, V Gershan
, E Gershkevitsh, E Gruppetta , A Hustuc , A Jauhari ,
Mohammad Hassan Kharita , N Khelassi-Toutaoui , H R
Khosravi, H Khoury, I Kralik , S Mahere, J Mazuoliene, P
Mora, W Muhogora , P Muthuvelu, D Nikodemova, L
Novak, A Pallewatte, D Pekarovič , M Shaaban, E Shelly ,
K Stepanyan , N Thelsy , P Visrutaratna , A Zaman//
Radiat Prot Dosimetry - 2015 Jul;165(1-4):70-80. Doi:
10.1093/rpd/ncv116.
9. Keith J Strauss. Radiation Dose for Pediatric CT:
Comparison of Pediatric versus Adult Imaging
Facilities/Keith J Strauss, Elanchezhian Somasundaram,
Debapriya Sengupta , Jennifer R Marin , Samuel L Brady//
Radiology - 2019 Apr;291(1):158-167. Doi:
10.1148/radiol.2019181753.
10. D Jackson. Paediatric CT dose: a multicentre audit of
subspecialty practice in Australia and New Zealand/D
Jackson, K Atkin, F Bettenay, J Clark, M R Ditchfield , J
E Grimm, R Linke, G Long, E Onikul, J Pereira, M
Phillips, F Wilson , E Paul , S K Goergen// Eur Radiol. -
2015 Nov;25(11):3109-22. Doi: 10.1007/s00330-015-
3727-y.
11. Choonsik Lee. NCICT: a computational solution to
estimate organ doses for pediatric and adult patients
undergoing CT scans/Choonsik Lee, Kwang Pyo Kim,
Wesley E Bolch, Brian E Moroz, Les Folio// J Radiol Prot
- 2015 Dec;35(4):891-909. Doi: 10.1088/0952-
4746/35/4/891
12. Choonsik Lee. NCICT: user manual – 6p.
13. National Cancer Institute - [On-line resource]: - Available
from: https://ncidose.cancer.gov Last accessed:
26.07.2021
14. Yuta Matsunaga. Effective radiation doses of CT
examinations in Japan: a nationwide questionnaire-based
study/Yuta Matsunaga, Ai Kawaguchi, Kenichi
Kobayashi, Masanao Kobayashi, Yasuki Asada ,
Kazuyuki Minami, Shoichi Suzuki, Koichi Chida// Br J
Radiol. – 2016. - ;89(1058):20150671 Doi:
10.1259/bjr.20150671
15. Jonina Gudjonsdottir . Effective dose from pediatric CT in
Iceland/Jonina Gudjonsdottir, Arna Bjork Jonsdottir//
Laeknabladid - 2017 Nov;103(11):489-492. Doi:
10.17992/lbl.2017.11.160.
16. C. Mordacq. Chest computed tomography in children:
indications, efficiency and effective dose/C Mordacq, A
Deschildre, L Petyt, T Santangelo, C Delvart, C Doan, C
Thumerelle// Arch Pediatr. - 2014 Mar;21(3):279-86. Doi:
10.1016/j.arcped.2013.12.021.
17. Hideki Obara, Midori Takahashi, Kazuya Kudou, Yasushi
Mariya, Yoshihiro Takai, Ikuo Kashiwakura. Estimation
of effective doses in pediatric X-ray computed
tomography examination// Exp Ther Med – 2017
Nov;14(5):4515-4520. doi:10.3892/etm.2017.5102
18. Z. Brady. Assessment of paediatric CT dose indicators for
the purpose of optimization/Z Brady, F Ramanauskas, T
M Cain, P N Johnston//Br J Radiol. – 2012. -
Nov;85(1019):1488-98. Doi: 10.1259/bjr/28015185.
14

MEDICAL PHYSICS IN THE BALTIC STATES 15 (2021)
Proceedings of International Conference “Medical Physics 2021”
4-6 November 2021, Kaunas, Lithuania
ASSESSMENT OF THE CHANGES IN STRUCTURE OF X-RAY
DIAGNOSTICS AND COLLECTIVE DOSE FROM CT EXAMINATIONS
RELATED TO COVID-19 IN THE RUSSIAN FEDERATION IN 2020
Aleksandr VODOVATOV1,2, Ivan ROMANOVICH1, Sergey RYZHOV3,4, Larisa CHIPIGA1,5,6, Gleb
BERKOVICH5, Artem BIBLIN1 1St-Petersburg Research Institute of Radiation Hygiene after prof. P.V. Ramzaev; 2St-Petersburg State Pediatric
Medical University; 3Dmitry Rogachev National Medical Research Center of Pediatric
Hematology, Oncology, and Immunology, 4Research and Practice Center of Diagnostics and Telemedicine
Technologies, 5V. Almazov National Medical Research Center, 6A. Granov Russian Scientific Center of Radiology and
Surgical Technologies [email protected]
Abstract: The pandemic of COVID-19 and the
corresponding transformation of the Russian healthcare
system had a significant impact on X-ray and nuclear
medicine diagnostics in 2020. A reduction of 10-30%
could be observed for all imaging modalities, both in the
number of examinations and corresponding collective
dose. Computed tomography is an exception, increasing
by 60% in number and by 81% in collective dose. The
previous estimates of the changes in the collective dose
from CT examinations correlate well with the results.
Keywords: COVID-19, medical exposure, X-ray
diagnostics, collective dose, computed tomography
1. Introduction
The novel coronavirus infection (COVID-19) is an
infectious disease caused by the SARS-CoV-2 virus
[1]. At the current moment, the virus has spread to
almost all countries of the world. As of August 22,
2021, in the Russian Federation, the coronavirus
infection has been detected in more than 6.7 million
people, more than 176 thousand people have died
already [1].
The use of computed tomography (CT) for the
diagnostics of COVID-19 has been widely discussed
within the medical community. Initially, there were
several points of view on the applicability of diagnostic
imaging modalities, ranging from the use of CT scan for
screening of the disease to the use of CT only for
confirmed cases of COVID-19 [2]. However, due to the
availability, high diagnostic informativity, non-
invasiveness, ad fast speed, CT scan became the
indispensable diagnostic method for the early and initial
diagnosis of COVID-19 in the Russian Federation.
The widespread application of CT for COVID-19
diagnostics was associated with various issues
connected to radiation protection and risk
communication. Rapidly increasing number of CT
examinations in hospitals and even in outpatient
facilities, lack of general opinion on the frequency of
CT scans during the treatment period, referral of CT
scans of the chest even for the representatives of risk
groups (i.e. pregnant women) lead to the increased
public anxiety. Unfortunately, no data on patient doses
was available from the hospitals, leading to the
overestimation of the radiation risks from CT by the
public.
The patient dose data collection in the Russian
Federation is performed on an annual basis using state
statistical data collection systems, using statistical form
3-DOZ [3] (a part of Joint governmental system of
control and accounting of the individual doses of the
citizens) and radiation-hygienic passports [4]. However,
these forms are filled in and collected on an annual
basis, hence not allowing operative patient dose data
acquisition. Additionally, doses are averaged per
medical facility, and the data on typical patient doses is
unavailable.
Considering the lack of reliable information on the
changes in the structure of X-ray diagnostics and
collective doses from medical exposure, in the summer
of 2020, the Institute of Radiation Hygiene in
collaboration with local radiation protection and
healthcare authorities as well as with several major
hospitals. The results were published as a preprint [5].
At the current time, all the statistics on the structure and
collective doses from medical exposure for 2020 have
been collected. Hence it is important to assess the
changes between these indicators between 2019 and
15

A. Vodovatov et al. / Medical Physics in the Baltic States 15 (2021) 15-18
2020, considering the overall trends of the development
of radiology in the Russian Federation.
The aim of the current study was to perform the
assessment of changes in the structure of the X-ray
diagnostics and collective dose from medical exposure
in the Russian Federation in 2019-2020 (during the
COVID pandemic).
2. Materials and methods
The study was based on the data from state statistical
dose data collection form: 3-DOZ “Data on the
patient doses from X-ray examinations. Form 3-DOZ
contains the data on the collective doses from medical
exposure and number of the examinations for the
following imaging modalities: fluorography (chest
screening), radiography, fluoroscopy, computed
tomography, interventional examinations, diagnostic
nuclear medicine examinations and “other” (everything
that did not fit into other categories, i.e. bone
densitometry). Data was taken from the federal dose
databank of the Joint system of the control and
accounting of the individual doses of the citizens hosted
by the Institute of Radiation Hygiene for the 2015-2020
period for all 85 regions of the Russian Federation [3,4].
For the simplicity of the data processing, digital and
analogue fluorography and radiography examinations
were merged.
To assess the changes in the structure of the X-ray
diagnostics and collective dose from medical exposure
in each of the regions of the Russian Federation, data
from Form #3-DOZ was processed using the following
steps:
- Estimation of the number of X-ray and nuclear
medicine examinations in each of 85 regions of the
Russian Federation for each year for each imaging
modality:
- Estimation of the collective dose from X-ray and
nuclear medicine examinations in each of 85 regions
of the Russian Federation for each year for each
imaging modality:
- Calculation of the increment rates for the number
and collective dose from X-ray and nuclear medicine
examinations for each region of the Russian
Federation for each year for each imaging modality
using Equations 1 and 2 respectively:
∆𝑁,𝑖,𝑘=𝑁
𝑖,𝑘−𝑁
𝑖,𝑘−1
𝑁𝑖,𝑘−1
× 100% (1)
∆𝐸,𝑖,𝑘=𝐸
𝑖,𝑘−𝐸
𝑖,𝑘−1
𝐸𝑖,𝑘−1
× 100% (2)
where:
N – total number of X-ray or nuclear medicine
examinations from the imaging modality I for the year k
(2016, 2017, 2018, 2019 and 2020), examinations;
E – total collective dose from X-ray or nuclear medicine
examinations from the imaging modality I for the year k
(2016, 2017, 2018, 2019 and 2020), man -Sv;
∆𝑁,𝑖,𝑘 – increment rate of the number of examinations
for imaging modality I for the year k (2016, 2017, 2018,
2019 and 2020), %;
∆𝐸,𝑖,𝑘 – increment rate of the collective dose for imaging
modality I for the year k (2016, 2017, 2018, 2019 and
2020), %.
- Calculation of the average increment rate for the
number and collective dose from X-ray and nuclear
medicine examinations for each region of the
Russian Federation for 2015-2019 for each imaging
modality using Equations 3 and 4 respectively:
∆𝑁𝑎𝑣𝑔,𝑖=∑2019
2016 ∆𝑁,𝑖,𝑘
4 (3)
∆Е𝑎𝑣𝑔,𝑖=∑2019
2016 ∆Е,𝑖,𝑘
4 (4)
where:
∆𝑁𝑎𝑣𝑔,𝑖 – average increment rate of the number of
examinations for imaging modality I for the four time
intervals (2015/2016, 2016/2017, 2017/2018 and
2018/2019), %
∆Е𝑎𝑣𝑔,𝑖 – average increment rate of the collective dose
for imaging modality I for the four time intervals
(2015/2016, 2016/2017, 2017/2018 and 2018/2019), %
- Correction of the changes in the number and
collective doses from X-ray and nuclear medicine
examinations for each imaging modality for each of
85 regions of the Russian Federation for the
2019/2020 period considering average increment
rate for the last four years using Equations 5 and 6
respectively:
∆𝑁,𝑖𝑎𝑑𝑗
2020= ∆𝑁,𝑖 2020− ∆𝑁𝑎𝑣𝑔,𝑖(5)
∆Е,𝑖𝑎𝑑𝑗
2020= ∆Е,𝑖 2020− ∆Е𝑎𝑣𝑔,𝑖(6)
where:
∆𝑁,𝑖𝑎𝑑𝑗
2020 – change in the number of the examinations
from imaging modality I in 2020 compared to 2019,
adjusted considering the average increment rate in
2015-2019, %;
∆Е,𝑖𝑎𝑑𝑗
2020 – change in the collective dose from imaging
modality I in 2020 compared to 2019, adjusted
considering the average increment rate in 2015-2019,
%;
All results were processed to exclude missing or biased
data. The following exclusion criteria for the biased data
were established:
- Lack of data on the number of examinations or
collective dose for the selected imaging modality for
one of the surveyed years;
- Increase or decrease in the number of examinations
or collective dose from the selected imaging
modalities exceeding 500% for one of the surveyed
years;
Changes in the number of examinations and collective
dose from the selected imaging modalities for the
Russian Federation were calculated as mean values for
the sample of 85 regions for each parameter.
Descriptive statistics were generated using Statistica 10
software. Comparison between samples was performed
using the Mann-Whitney test. Relations between the
assessed parameters were estimated using regression
analysis. Results were considered significant with
p<0.05.
16

A. Vodovatov et al. / Medical Physics in the Baltic States 15 (2021) 15-18
3. Results and discussion
Data on the changes in the number of the X-ray and
nuclear medicine examinations and collective dose from
medical exposure as well as the increment rates for the
selected imaging modalities are presented in tables 1-2
and 3-4, respectively.
Table 1. Changes in the number of X-ray and nuclear
medicine examinations in the 2019/2020 period
Imaging
modality
Number of X-ray and nuclear medicine
examinations, thousands
2020 2019
Fluorography 72367 85706
Radiography 161861 190752
Fluoroscopy 999 1548
Computed
tomography 2929 1724
Interventional
examinations 1327 2291
Nuclear
medicine 549 583
Other 247 183
Total 240280 282787
Table 2. Increment rates for X-ray and nuclear medicine
examinations in the 2019/2020 period
Imaging modality Increment
rate, %
Increment
rate adjusted
by the 2015-
2019 trends,
%
Fluorography -17.2 -18.0
Radiography -15.5 -18.5
Fluoroscopy -32.4 -28.5
Computed tomography +60.5 +43.0
Interventional
examinations -23.9 -34.5
Nuclear medicine -9.5 -16.3
Other -2.5 +11.3
Total -12.9 -15.4
Table 3. Changes in the collective dose from medical
exposure in the 2019/2020 period
Imaging modality
Collective dose, man -
Sv
2020 2019
Fluorography 4298 5318
Radiography 12106 16677
Fluoroscopy 2690 4069
Computed tomography 85075 49766
Interventional
examinations 6847 8584
Nuclear medicine 3666 288
Other 183 3083
Total 114865 87785
Table 4. Increment rates for collective dose from medical
exposure for the 2019/2020 period
Imaging modality Increment
rate, %
Increment
rate
adjusted by
the 2015-
2019
trends, %
Fluorography -18.7 -15.6
Radiography -28.1 -25.8
Fluoroscopy -31.7 -28,4
Computed tomography +81.0 +63.5
Interventional
examinations -18.3 -35.4
Nuclear medicine 11.4 -10.4
Other -32.8 -27.6
Total +37.1 +31.0
It is visible from tables 1-4 that during the pandemic of
COVID-19 both structure of X-ray diagnostics and
collective dose from medical exposure has undergone
significant changes. The number of all X-ray
examinations has decreased by 20% on average,
varying from 10% for nuclear medicine, to almost 30%
for fluoroscopy. Only computed tomography has
undergone a significant boost, increasing up to 60%.
That can be explained by several factors: - Transformation of general practice hospitals
into COVID hospitals; - Reduction of diagnostics, including radiology,
during the lockdown periods; - Increase in the number of operating CT units
and departments. First two factors were deciding for the first wave
(March-July) of coronavirus, when the healthcare
system was ‘mobilized’ for the COVID epidemics, with
the subsequent negative impact on the provision of
healthcare for non-infected patients. The majority of the
hospitals were closed down for the quarantine,
accepting only emergency patients, or transformed into
COVID treatment centers. All planned treatment was
postponed. Later, during the second wave, a more
balanced approach was applied, with the establishment
of dedicated COVID treatment centers and/or
departments. Hence, major hospitals returned to normal
functioning, but the number of X-ray examinations
nevertheless has decreased. It should be noted that the lowest reduction in number
was observed for nuclear medicine examinations. That
can be explained by the fact that in the Russian
Federation they are mainly performed for oncology
patients. Diagnostics and treatment of such patients
received the least impact from COVID pandemics. Correction of the changes in the number of X-ray
examinations by the 2015-2019 trends does not
significantly change the results, except for CT. Increase
in the number of CT examinations becomes less
pronounced (43% compared to 60%). The changes in
the total number of X-ray and nuclear medicine
examinations are equal to -15% (from 283 million
17

A. Vodovatov et al. / Medical Physics in the Baltic States 15 (2021) 15-18
examinations in 2019 to 240 million examinations in
2020). The similar situation can be observed for the collective
dose from medical exposure. However, the increase of
the collective dose from CT examinations is more
significant (81% unadjusted, 64% adjusted by the 2015-
2019 trends). It should be noted that the decrease in the
number of nuclear medicine examinations is
accompanied by the increase in the collective dose
(11%), indicating the increasing contribution of high
dose procedures, mainly PET/CT. Total increase of the
collective dose from medical exposure is equal to 37%,
mainly due to the increased contribution of CT
examinations. It is interesting to compare the actual changes in the
collective dose from CT examinations with the
estimates, calculated by the Institute of Radiation
Hygiene in August 2020, based on the data collection in
several representative hospitals and regions [5]. These
estimates considered three basic scenarios for the
Russian hospitals:
Scenario 1. "Covid-19 hospital". It corresponds to the
transformation of general practice regional hospitals
into hospitals for COVID-19 patients and emergency
patients with various pathologies. In this scenario, it was
assumed that the total number of CT examinations in
the region has not been changed; the number of CT
exams of all other anatomical areas (except for the
chest) decreased by 80%. The released capacities were
used for chest CT scans.
Scenario 2. "Intense activity". Corresponds to the
medical facilities operating after the peak of COVID-
19: the number of examinations remains the same as in
2019, except for chest CT scans. It was assumed that
prior to each admission to the hospital or planned X-ray
examination, a patient undergoes chest CT examination.
The number of CT studies increases by the sum of all
other CT exams.
Scenario 3. "Combined". A combination of scenario
"Covid-19 hospital" for three quarters of the time with
the scenario "Intensive activity" for one quarter.
Comparison between these scenarios and the real data
for the collective dose from CT examinations is
presented on figure 1.
Fig. 1. Comparison between the estimated collective dose
from CT examinations for three scenarios and real data.
It is visible from Figure 1 that the real collective dose
from CT examinations is comparable with scenarios 1
and 3. Scenario 2, as it was mentioned before, is ultra-
conservative and differs from the real data by 20%.
4. Conclusions
The pandemic of COVID-19 and the corresponding
transformation of the Russian healthcare system had a
significant impact onX-ray and nuclear medicine
diagnostics in 2020. A reduction of 10-30% can be
observed for all imaging modalities, both in the number
of examinations and corresponding collective dose.
Computed tomography is an exception, increasing by
60% in number and by 81% in collective dose. The
changes in the structure of X-ray and nuclear medicine
diagnostics follow the trends for the last four years,
however, these trends become more pronounced in the
year of the pandemic. The results of the study indicate
that the previous rough estimates of the changes in the
collective dose from CT examinations were mostly
accurate, allowing using the methods for such estimates
in the future. The limitation of the current study is that it
presents only general data, without a detailed evaluation
of the changes in the structure of each imaging modality
or dosimetry data. Such data will be processed and
presented in future studies.
5. References
1. Stopcoronavirus.RF. [On-line resource]: - Available
from: https: //xn80aesfpebagmfblc0a.xn-p1ai/ Last
accessed: 07.09.2021
2. Interim guidelines for the prevention, diagnosis, and
treatment of a new coronavirus infection (covid-19)
Version 11 (07/05/2021) Ministry of Health of the Russian
Federation https://spbmiac.ru/wp-
content/uploads/2021/05/B%D0%9C%D0%A0_COVID-
19.pdf Last accessed: 07.09.2021
3. Methodical guidelines “Completition of the federal
statistical surveillance form 3-DOZ ”. M.,
Rospotrebnadzor, 2014. 34 p.
4. Order of the Ministry of healthcare of the Russian
Federation 298 “On the establishment of the Provision
on the joint state system of the control and accounting of
the individual doses of citizens”.
https://docs.cntd.ru/document/901766853 Last accessed
07.09.2021
5. A.V. Vodovatov et.al. Preliminary assessment of structure
and collective dose from CT examinations related to
COVID-19 diagnostics in the Russian Federation in March
- June 2020.
medRxiv 2020.08.25.20181396; doi: https://doi.org/10.11
01/2020.08.25.20181396
0
20000
40000
60000
80000
100000
120000
140000
Covid-19
hospital
Intense
activity
Combined
scenario
Real data
Coll
ecti
ve
dose
fro
m C
T, m
an -
Sv
18

MEDICAL PHYSICS IN THE BALTIC STATES 15 (2021)
Proceedings of International Conference “Medical Physics 2021”
4-6 November 2021, Kaunas, Lithuania
APPLICATION OF SUMMARY MEASURES OF POPULATION HEALTH
TO RADIATION RISKS ASSESSMENT
Leonid REPIN, Rustam AKHMATDINOV, Artem BIBLIN
St-Petersburg Research Institute of Radiation Hygiene after Professor P.V. Ramzaev, Mira st.8, 197101, St-Petersburg
Abstract: The authors made an attempt to analyze the
possibilities of using some generalized measures of
public health for calculating radiation detriment,
different from those used by the International
Commission on Radiological Protection. The most
promising approach is to use the Disability-Adjusted
Life Years measure in calculating sex- and age-
dependent measures of radiation detriment.
Keywords: radiation risk, detriment, DALY, Global
Burden of Disease
1. Introduction
One of the definitions of “risk” describes this concept as
a combination of the probability and severity of a
negative outcome. With regard to assessing the health
risk associated with exposure to harmful environmental
factors, this definition is transformed into “a
combination of the probability of negative health
consequences of exposure to a harmful factor, consider
the severity of these consequences”. This understanding
of risk is embedded in the radiation detriment measure
developed by the International Commission on
Radiological Protection (ICRP). However, the
methodology used by the ICRP in calculatingthe
severity of various diseases caused by exposure has a
number of disadvantages, some of which are even
pointed out by the authors of the methodology. One of
the most significant limitations for the possibilities of
wider application of radiation detriment is its
unsuitability for solving the problems of comparative
analysis of risks from various harmful environmental
factors.
The use of integrated measures to quantify the negative
impact of various environmental factors on the health of
the population is important for solving many applied
tasks in the field of ensuring life safety. Such tasks
include, for example, justification of the levels of
permissible exposure to harmful factors, solving
problems of optimizing costs to ensure protection from
the effects of such factors or minimizing the
consequences of exposure, etc.
In the field of radiation protection, the value of radiation
detriment developed by the International Commission
on Radiological Protection [1-3] has been used as one of
the main integrated measures for more than 30 years.
Radiation detriment includes the total lifetime risk of
oncological diseases of various localization and
hereditary effects caused by exposure to ionizing
radiation (in low doses and/or at low dose rates), while
different weighting factors are used for different
diseases, reflecting the “severity” of a given disease.
The unit of detriment measure, to which all known
possible negative consequences of radiation exposure
for human health are given, is a fatal case of radiation-
induced malignant neoplasm (MN), adjusted for an
average reduction in life expectancy. Detriment per unit
of radiation dose is calculated by the equation:
DT = (RF,T + qT × RNF,T) × LT/LC = …
… = (RI × kT + qT × RI × (1 – kT)) × LT/LC (1)
where the T indicates the localization of the MN (organ
or tissue); DT - radiation detriment to organ or tissue T;
RF, T is the probability of fatal radiation-induced cancer
of localization T; RNF, T - the probability of non-fatal
radiation-induced cancer of localization T; RI - the
probability of morbidity to radiation-induced cancer of
localization T; kT is the mortality rate of MN of
localization T; qT is a weighting factor reflecting a
reduced quality of life due to the occurrence of a non-
fatal MN of localization T; LT is the average number of
years of life lost due to a malignant neoplasm of
localization T; LC is the average number of years of life
lost due to the occurrence of radiation-induced MN of
any location.
As can be seen from equation 1, one should not literally
take a unit of detriment as one expected death from
radiation-induced cancer.
The concept of “severity of the disease” usually implies
an assessment of three components: the lethality
fraction of disease, a reduction in life expectancy due to
disease and reduced quality of life due to the presence
of disease.
19

L. Repin et al. / Medical Physics in the Baltic States 15 (2021) 19-22
All three components of the concept of “severity” of a
disease are not objectively determined universal
constants - they can change over time and vary for
different populations. This is primarily due to the
improvement of diagnostic and treatment methods. In
addition, this is due to an increasing average life
expectancy of the population in developed countries.
The magnitude of the radiation detriment of the ICRP is
used primarily to substantiate the internationally
recommended universal dose limits for exposure of the
population and workers in various exposure situations
and under various exposure scenarios.
When calculating the values of so-called “nominal risk
coefficients” [4], medical and demographic data of
various populations (including artificial “nominal
population”) was used, and authors of some scientific
publications periodically make attempts to apply the
ICRP methodology to calculate risk coefficients using
medical and demographic data of specific populations,
including gender- and age-dependent radiation
detriment coefficients. Much less frequent are
publications devoted to the detriment assessment
methodology itself [5-7].
One of the most difficult, controversial and of the
greatest methodological interest is, from our point of
view, the issue of assessing the “reduced quality of life”
due to the occurrence of various diseases caused by the
influence of a harmful factor.
The Research Institute of Radiation Hygiene currently
solves the scientific task of the development of
methodological approaches to assessing radiation
detriment based on modern approaches to quantifying
the severity of cancer1.
2. The ICRP approach to assessing quality of life
reduction
The main approaches to the development of integral
measures of health in relation to radiation exposure
were formed in the 1970s and 1980s [1]. The
methodology of calculation of weighting factors to
consider the reduced quality of life because of the
disease was developed at the same time and is now used
by the ICRP in a slightly modified form:
qT = qmin + kT × (1 – qmin), (2)
where T indicates the localization of MN (organ or
tissue); qT is a weighting factor characterizing the
reduction in quality of life due to the occurrence of a
non-fatal MN of T localization; kT is the fatality rate of
a MN of T localization; qmin is the minimum weighting
factor for non-fatal cancers, whose value was expertly
determined to be 0,1 for the vast majority of MN2. At
the same time, the ICRP itself pointed out the fact that
for all cancers, except breast and thyroid cancers, the
1 As models emerge that describe the probability of other diseases depending on
the radiation dose (for example, diseases of the cardiovascular system),
detriment can be easily modified to consider the severity of such diseases. 2 This weighting factor is not used for skin cancer, because “radiogenic skin
cancer is almost exclusively of the basal cell type which is usually associated
with very little pain, suffering or treatment sequelae” [3]. For thyroid cancer the
qmin is set to 0,2.
methodology is not sensitive even to a significant
change in the qmin.
As can be seen from the formula, the assessment of the
“reduced quality of life” depends only on the mortality
rate and the choice of the qmin value.
That is, in fact, a reduction in the quality of life in
connection with the disease essentially depends only on
its mortality.
3. The World Health Organization approaches to
assessing disease severity based on the Health-
Related Quality of Life
Using the approach described above to assess
impairment in disease-related quality of life, which did
not involve a detailed consideration of the concept of
“disease severity”, was justified in those years.
However, actual scientific (medical, social, economic,
etc.) understanding of the concept of “severity of the
disease” and the huge amount of data accumulated to
date in the framework of the Global Burden of Disease
(GBD) project of the World Health Organization
(WHO) [8], allows us to take a fresh look at the
possibilities of a quantitative assessment of health
detriment associated with exposure to harmful
environmental factors.
Assessment of the severity of various diseases in
estimating integral measures of population health has
been used quite extensively in recent years. The
sequential replacement of mortality-based measures by
more informative that consider the years of healthy life
lost in the population has provided an important
opportunity to review and develop approaches to
assessing radiation detriment (as well as the health
harms associated with exposure to other environmental
hazards) [4], [9].
One of the integral measures of population health that
have become most widely used in recent years in
various public health management tasks is the DALY3
[10-13]. The general equation for calculating DALY is
shown below:
DALY = YLL + YLD, (3)
where:
YLL4 – the number of years of life lost due to premature
mortality, i.e. the number of years a person does not live
to the age of life expectancy due to premature death
caused by a disease; YLD5 – number of years lived with
a disability.
YLL = M × LE, (4)
where:
M – number of deaths due to disease;
LE – standard life expectancy at the age of death. The
YLD is calculated using a formula with a weighting
3 Disability-Adjusted Life Years 4 Years of Life Lost 5 Years Lived with Disability
20
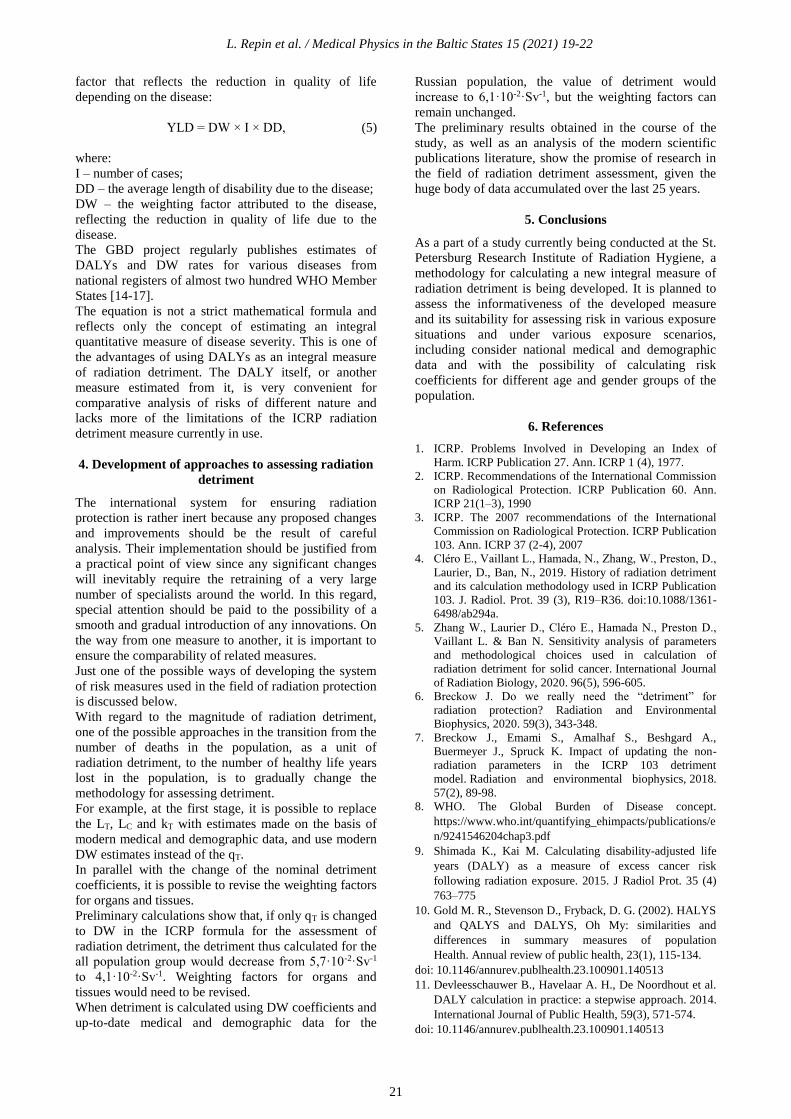
L. Repin et al. / Medical Physics in the Baltic States 15 (2021) 19-22
factor that reflects the reduction in quality of life
depending on the disease:
YLD = DW × I × DD, (5)
where:
I – number of cases;
DD – the average length of disability due to the disease;
DW – the weighting factor attributed to the disease,
reflecting the reduction in quality of life due to the
disease.
The GBD project regularly publishes estimates of
DALYs and DW rates for various diseases from
national registers of almost two hundred WHO Member
States [14-17].
The equation is not a strict mathematical formula and
reflects only the concept of estimating an integral
quantitative measure of disease severity. This is one of
the advantages of using DALYs as an integral measure
of radiation detriment. The DALY itself, or another
measure estimated from it, is very convenient for
comparative analysis of risks of different nature and
lacks more of the limitations of the ICRP radiation
detriment measure currently in use.
4. Development of approaches to assessing radiation
detriment
The international system for ensuring radiation
protection is rather inert because any proposed changes
and improvements should be the result of careful
analysis. Their implementation should be justified from
a practical point of view since any significant changes
will inevitably require the retraining of a very large
number of specialists around the world. In this regard,
special attention should be paid to the possibility of a
smooth and gradual introduction of any innovations. On
the way from one measure to another, it is important to
ensure the comparability of related measures.
Just one of the possible ways of developing the system
of risk measures used in the field of radiation protection
is discussed below.
With regard to the magnitude of radiation detriment,
one of the possible approaches in the transition from the
number of deaths in the population, as a unit of
radiation detriment, to the number of healthy life years
lost in the population, is to gradually change the
methodology for assessing detriment.
For example, at the first stage, it is possible to replace
the LT, LC and kT with estimates made on the basis of
modern medical and demographic data, and use modern
DW estimates instead of the qT.
In parallel with the change of the nominal detriment
coefficients, it is possible to revise the weighting factors
for organs and tissues.
Preliminary calculations show that, if only qT is changed
to DW in the ICRP formula for the assessment of
radiation detriment, the detriment thus calculated for the
all population group would decrease from 5,7·10-2·Sv-1
to 4,1·10-2·Sv-1. Weighting factors for organs and
tissues would need to be revised.
When detriment is calculated using DW coefficients and
up-to-date medical and demographic data for the
Russian population, the value of detriment would
increase to 6,1·10-2·Sv-1, but the weighting factors can
remain unchanged.
The preliminary results obtained in the course of the
study, as well as an analysis of the modern scientific
publications literature, show the promise of research in
the field of radiation detriment assessment, given the
huge body of data accumulated over the last 25 years.
5. Conclusions
As a part of a study currently being conducted at the St.
Petersburg Research Institute of Radiation Hygiene, a
methodology for calculating a new integral measure of
radiation detriment is being developed. It is planned to
assess the informativeness of the developed measure
and its suitability for assessing risk in various exposure
situations and under various exposure scenarios,
including consider national medical and demographic
data and with the possibility of calculating risk
coefficients for different age and gender groups of the
population.
6. References
1. ICRP. Problems Involved in Developing an Index of
Harm. ICRP Publication 27. Ann. ICRP 1 (4), 1977.
2. ICRP. Recommendations of the International Commission
on Radiological Protection. ICRP Publication 60. Ann.
ICRP 21(1–3), 1990
3. ICRP. The 2007 recommendations of the International
Commission on Radiological Protection. ICRP Publication
103. Ann. ICRP 37 (2-4), 2007
4. Cléro E., Vaillant L., Hamada, N., Zhang, W., Preston, D.,
Laurier, D., Ban, N., 2019. History of radiation detriment
and its calculation methodology used in ICRP Publication
103. J. Radiol. Prot. 39 (3), R19–R36. doi:10.1088/1361-
6498/ab294a.
5. Zhang W., Laurier D., Cléro E., Hamada N., Preston D.,
Vaillant L. & Ban N. Sensitivity analysis of parameters
and methodological choices used in calculation of
radiation detriment for solid cancer. International Journal
of Radiation Biology, 2020. 96(5), 596-605.
6. Breckow J. Do we really need the “detriment” for
radiation protection? Radiation and Environmental
Biophysics, 2020. 59(3), 343-348.
7. Breckow J., Emami S., Amalhaf S., Beshgard A.,
Buermeyer J., Spruck K. Impact of updating the non-
radiation parameters in the ICRP 103 detriment
model. Radiation and environmental biophysics, 2018.
57(2), 89-98.
8. WHO. The Global Burden of Disease concept.
https://www.who.int/quantifying_ehimpacts/publications/e
n/9241546204chap3.pdf
9. Shimada K., Kai M. Calculating disability-adjusted life
years (DALY) as a measure of excess cancer risk
following radiation exposure. 2015. J Radiol Prot. 35 (4)
763–775
10. Gold M. R., Stevenson D., Fryback, D. G. (2002). HALYS
and QALYS and DALYS, Oh My: similarities and
differences in summary measures of population
Health. Annual review of public health, 23(1), 115-134.
doi: 10.1146/annurev.publhealth.23.100901.140513
11. Devleesschauwer B., Havelaar A. H., De Noordhout et al.
DALY calculation in practice: a stepwise approach. 2014.
International Journal of Public Health, 59(3), 571-574.
doi: 10.1146/annurev.publhealth.23.100901.140513
21

L. Repin et al. / Medical Physics in the Baltic States 15 (2021) 19-22
12. Lajoie J. Understanding the Measurement of Global
Burden of Disease, Prepared for the National
Collaborating Centre for Infectious Diseases. (2015).
https://nccid.ca/wp-
content/uploads/sites/2/2015/03/Global_Burden_Disease_I
nfluenza_ENG.pdf
13. David Kim, J.E., Disability Adjusted Life Years (DALY)
Calculator: Methodology. 2018, Center for the Evaluation
of Value and Risk in Health, Tufts Medical Center.
http://ghcearegistry.org/ghcearegistry/Calculator_Methodo
logy.pdf
14. WHO. The global burden of disease: 2004 update. 2008.
https://www.who.int/quantifying_ehimpacts/publications/e
n/9241546204chap3.pdf
15. Global Burden of Disease Cancer Collaboration. Global,
Regional, and National Cancer Incidence, Mortality, Years
of Life Lost, Years Lived With Disability, and Disability-
Adjusted Life-years for 32 Cancer Groups, 1990 to
2015: A Systematic Analysis for the Global Burden of
Disease Study. JAMA Oncol. 2017;3(4):524–548.
doi:10.1001/jamaoncol.2016.5688
16. Salomon J.A., Haagsma J.A., Davis A. et al. Disability
weights for the Global Burden of Disease 2013 study.
2015. The Lancet Global Health, 3(11), e712-e723. doi:
10.1016/S2214-109X(15)00069-8
17. Vos T., Lim S. S., Abbafati C. et al. Global burden of 369
diseases and injuries in 204 countries and territories,
1990–2019: a systematic analysis for the Global Burden of
Disease Study 2019. 2020. The Lancet, 396(10258), 1204-
1222. doi: 10.1016/S0140-6736(20)30925-9
22

MEDICAL PHYSICS IN THE BALTIC STATES 15 (2021)
Proceedings of International Conference “Medical Physics 2021”
4-6 November 2021, Kaunas, Lithuania
TOWARDS HARMONIZATION OF CLINICAL BONE SCINTIGRAPHY
PROTOCOL BETWEEN THREE DIFFERENT SPECT/CT SYSTEMS IN
LITHUANIA
Kirill SKOVORODKO1,2, Mažena MACIUSOVIČ3, Marius BURKANAS3, Sigitas TIŠKEVIČIUS3, Laurynas
GILYS4, Renata KOMIAGIENĖ1,5, Jonas VENIUS3,6
1Vilnius University Hospital Santaros Klinikos, Vilnius, Lithuania; 2Center for Physical Sciences and Technology
(FTMC), Vilnius, Lithuania; 3National Cancer Institute, Medical physics department, Vilnius, Lithuania; 4The Hospital
of Lithuanian University of Health Sciences, Kaunas, Lithuania; 5Vilnius University, Faculty of Medicine, Institute of
Biomedical Sciences, Vilnius, Lithuania; 6National Cancer Institute, Biomedical physics laboratory, Vilnius, Lithuania. [email protected]; [email protected]; [email protected]; [email protected]
[email protected]; [email protected]; [email protected]
Abstract: In the past few years the main Lithuanian
hospitals that provide nuclear medicine services have
updated their SPECT/CT systems. The novel
SPECT/CT systems allow us to acquire improved image
quality, shorter acquisition and new reconstruction
algorithms. Systems with CZT detectors provide higher
sensitivity, better energy resolution and image contrast.
However, due to the different technical approaches used
by vendors, image quality may vary, thus the
comparison of diagnostic information between the
systems is not straightforward. Harmonization of the
clinical protocols would allow to minimize an
equipment-based images differences and help uniform
the follow-up assessments.
The purpose of this work was to acquire scintigraphic
images of the phantoms with the different
manufacturers systems and compare images using the
clinical bone scintigraphy protocol reconstructions and
identify parameters for scanning protocol
harmonization. Images were obtained and reconstructed
by three SPECT/CT systems: GE NM/CT 870 CZT,
SIEMENS Symbia Intevo Excel, Mediso AnyScan SC.
For the evaluation of the different parameters Jaszczak,
NEMA IQ phantom and capillary point sources were
used. The phantoms were filled with the same activity
of 99mTc solution. SPECT and CT scans were acquired
for the standard bone SPECT/CT protocol and for unify
protocol. Reconstructions of the images were performed
using site approved standard parameters, while using
various filters and reconstructions algorithms.
Investigation of the phantoms revealed the main
differences of SPECT/CT systems. Different detection
technologies, reconstructions algorithms and concepts
of the equipment add some limitations to the
harmonization. Nevertheless, new technologies and
image post processing algorithms used in all systems
allow to decrease acquisition time and administered
activity to the patients almost without losing image
quality. Subsequently this results in reduced exposure of
ionizing radiation to the patients and medical staff.
Keywords: bone scintigraphy SPECT/CT, nuclear
medicine, molecular imaging, harmonization, medical
imaging.
1. Introduction
Bone scintigraphy is one the most common and highly
sensitive functional imaging procedures performed in a
nuclear medicine department. The radioactive (99mTc-
MDP, methylene diphosphonate) tracer is used to detect
distribution of osseous abnormalities related to benign
and malignant diseases, Paget's disease, infections,
avascular necrosis, loosening of joint prostheses as well
as physiological processes [1, 3, 6, 7]. Bone
scintigraphy scans can detect metabolic activity earlier
than structural changes appear on conventional
radiological scans [2]. The accumulation of injected
radiopharmaceutical tracer depends upon blood flow
and osteoblastic activity [2, 3]. In most malignant and
benign conditions increased tracer uptake may be seen
on bone scans due to the increased vascularity and bone
remodeling. About four hours after injection,
approximately 50 - 60 % of the injected
radiopharmaceutical is fixed in the patient body, about
34 % is excreted with the urine, 6 % remains in the
other organism locations [3], however, uptake of the
tracer depends on individual local blood flow. Thus, in
order to correctly simulate human scanning using
phantoms, it is necessary to correctly assess the
23
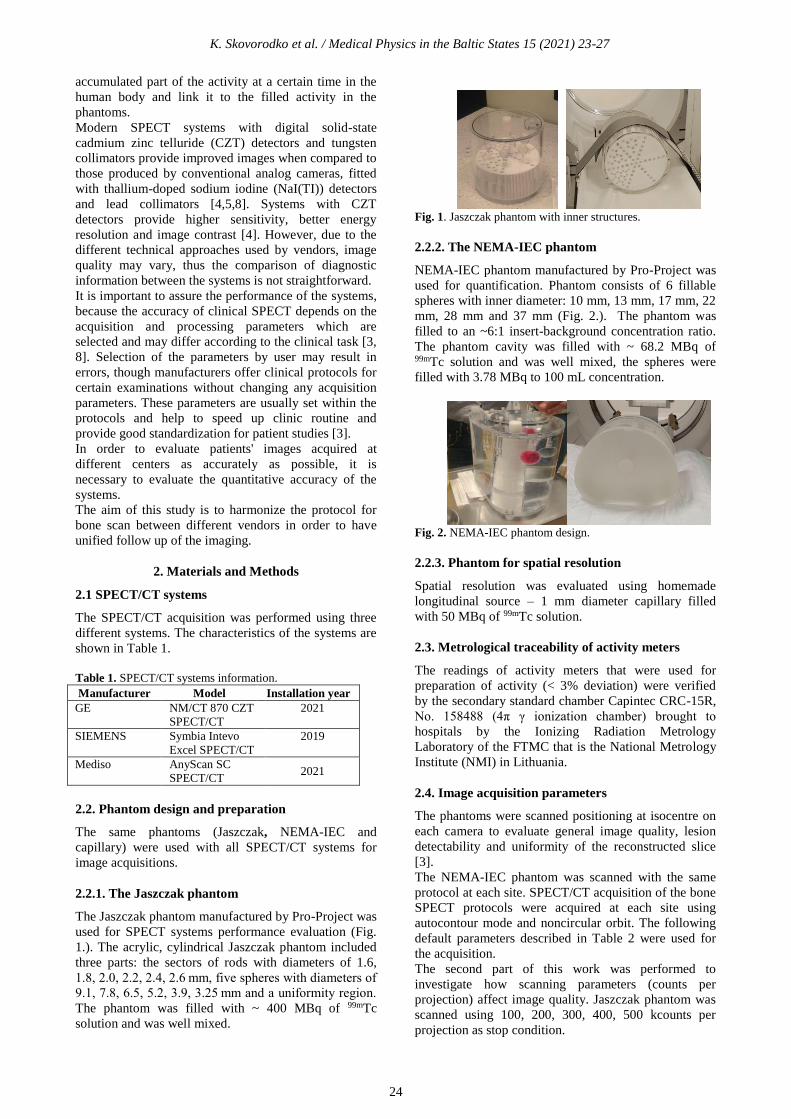
K. Skovorodko et al. / Medical Physics in the Baltic States 15 (2021) 23-27
accumulated part of the activity at a certain time in the
human body and link it to the filled activity in the
phantoms.
Modern SPECT systems with digital solid-state
cadmium zinc telluride (CZT) detectors and tungsten
collimators provide improved images when compared to
those produced by conventional analog cameras, fitted
with thallium-doped sodium iodine (NaI(TI)) detectors
and lead collimators [4,5,8]. Systems with CZT
detectors provide higher sensitivity, better energy
resolution and image contrast [4]. However, due to the
different technical approaches used by vendors, image
quality may vary, thus the comparison of diagnostic
information between the systems is not straightforward.
It is important to assure the performance of the systems,
because the accuracy of clinical SPECT depends on the
acquisition and processing parameters which are
selected and may differ according to the clinical task [3,
8]. Selection of the parameters by user may result in
errors, though manufacturers offer clinical protocols for
certain examinations without changing any acquisition
parameters. These parameters are usually set within the
protocols and help to speed up clinic routine and
provide good standardization for patient studies [3].
In order to evaluate patients' images acquired at
different centers as accurately as possible, it is
necessary to evaluate the quantitative accuracy of the
systems.
The aim of this study is to harmonize the protocol for
bone scan between different vendors in order to have
unified follow up of the imaging.
2. Materials and Methods
2.1 SPECT/CT systems
The SPECT/CT acquisition was performed using three
different systems. The characteristics of the systems are
shown in Table 1.
Table 1. SPECT/CT systems information.
Manufacturer Model Installation year
GE NM/CT 870 CZT
SPECT/CT
2021
SIEMENS Symbia Intevo
Excel SPECT/CT
2019
Mediso AnyScan SC
SPECT/CT 2021
2.2. Phantom design and preparation
The same phantoms (Jaszczak, NEMA-IEC and
capillary) were used with all SPECT/CT systems for
image acquisitions.
2.2.1. The Jaszczak phantom
The Jaszczak phantom manufactured by Pro-Project was
used for SPECT systems performance evaluation (Fig.
1.). The acrylic, cylindrical Jaszczak phantom included
three parts: the sectors of rods with diameters of 1.6,
1.8, 2.0, 2.2, 2.4, 2.6 mm, five spheres with diameters of
9.1, 7.8, 6.5, 5.2, 3.9, 3.25 mm and a uniformity region.
The phantom was filled with ~ 400 MBq of 99mTc
solution and was well mixed.
Fig. 1. Jaszczak phantom with inner structures.
2.2.2. The NEMA-IEC phantom
NEMA-IEC phantom manufactured by Pro-Project was
used for quantification. Phantom consists of 6 fillable
spheres with inner diameter: 10 mm, 13 mm, 17 mm, 22
mm, 28 mm and 37 mm (Fig. 2.). The phantom was
filled to an ~6:1 insert-background concentration ratio.
The phantom cavity was filled with ~ 68.2 MBq of 99mTc solution and was well mixed, the spheres were
filled with 3.78 MBq to 100 mL concentration.
Fig. 2. NEMA-IEC phantom design.
2.2.3. Phantom for spatial resolution
Spatial resolution was evaluated using homemade
longitudinal source – 1 mm diameter capillary filled
with 50 MBq of 99mTc solution.
2.3. Metrological traceability of activity meters
The readings of activity meters that were used for
preparation of activity (< 3% deviation) were verified
by the secondary standard chamber Capintec CRC-15R,
No. 158488 (4π γ ionization chamber) brought to
hospitals by the Ionizing Radiation Metrology
Laboratory of the FTMC that is the National Metrology
Institute (NMI) in Lithuania.
2.4. Image acquisition parameters
The phantoms were scanned positioning at isocentre on
each camera to evaluate general image quality, lesion
detectability and uniformity of the reconstructed slice
[3].
The NEMA-IEC phantom was scanned with the same
protocol at each site. SPECT/CT acquisition of the bone
SPECT protocols were acquired at each site using
autocontour mode and noncircular orbit. The following
default parameters described in Table 2 were used for
the acquisition.
The second part of this work was performed to
investigate how scanning parameters (counts per
projection) affect image quality. Jaszczak phantom was
scanned using 100, 200, 300, 400, 500 kcounts per
projection as stop condition.
24

K. Skovorodko et al. / Medical Physics in the Baltic States 15 (2021) 23-27
Table 2. Parameters used for standard clinical bone
SPECT/CT acquisition protocol on different systems.
Parameters NM/CT 870
CZT
Symbia
Intevo
Excel
AnyScan
Collimator WEHR45 LEHR LEGP
Matrix size 256x256 256x256 128x128
Zoom 1 1 1.14286
Detectors
and
configuratio
n
Both, H Both, H Both, H
Mode step and
shoot,
acquire
during
motion
continuous continuous
No of
projection
60 120 120
kcounts per
projection
180 160 190
Total
scanning
time, min
7 11 15
Energy
window
±7.5 % ±15% ±20 %
Reconstruct
ion
algorithm
OSEM, 4
iterations 10
subsets
XSPECT OSEM, 48
iterations, 4
subsets
2.5. Image reconstruction parameters
The third part of this work was performed to investigate
how reconstruction algorithm types affect image
quality. The acquired phantom raw data were
reconstructed using OSEM, Flash3D, FB, Wallis,
XSPECT algorithms. Additionally, the effect of
attenuation correction (AC) on image quality was
evaluated.
2.6. Analysis
To easily compare the SPECT performance between
different cameras, image quality was quantitatively
assessed by computing contrast, uniformity noise index
values and spatial resolution as proposed by the
American Association of Physicists in Medicine
(AAPM). [4]
Quantitative assessment of image quality was performed
using a Web-based image-processing software program
ImageJ and developed by the International Atomic
Energy Agency the Nuclear Medicine Quality Control
(IAEA-NMQC) Toolkit for image evaluation. The
Toolkit is a set of ImageJ based codes that allow to
process and analyse nuclear medicine images of gamma
cameras and SPECT systems. Spatial resolution, integral
and differential uniformity, signal-to-noise ratio (SNR)
and contrast were estimated.
3. Results
The images were captured using clinical protocols that
are used for routine patient bone scintigraphy scanning
(Table 2). The results of image quality (contrast, SNR,
integral uniformity, differential uniformity and spatial
resolution) of three SPECT systems (GE, Siemens and
Mediso) are presented in Table 3.
Table 3. Results of image quality analysis.
Con
trast
SNR Integ-
ral
Unifo-
rmity, %
Diffe-
rential
Unifo
-
rmity,
%
Spatial
Resolu-
tion,
mm
NM/CT 870
CZT
26.4 12 15.6 13 6
Symbia
Intevo Excel
38.3 10.6 8.4 7.3 7.4
Any Scan 29.3 24.5 9.8 5.9 7
The contrast, shown in Table 3, is calculated from the
biggest sphere of Jaszczak phantom.
As shown in Table 3, all image quality parameters are
quite scattered. This is the result of usage of different
scanning hardware as well as reconstruction algorithms
and scanning parameters in standard clinical protocols.
Siemens SPECT system demonstrate the highest
contrast and best integral uniformity. Mediso SPECT
system demonstrate highest SNR and the best
differential uniformity. GE demonstrate the highest
spatial resolution.
To harmonize imaging protocols particular image
quality parameters from different vendors should be as
close as possible to each other. Harmonization could be
performed by adapting scanning parameters and/or
reconstruction algorithms. One of the main scanning
parameters impacting SPECT image quality is counts
per projection that is determined by scanning time and
administered activity. However, these two parameters
are dependent and can compensate each other. Image
quality dependency from counts per projection is
present in Table 4.
Table 4. Image quality dependency from counts per
projection. kcounts
per
projection
Cont-
rast SNR Integral
Unifor-
mity
Diffe-
rential Unifo-
rmity
Spatial
Resolu-
tion,
mm 100 37,5 7,45 15,6 10,9 7,4 200 36,2 11,7 10,1 8,1 7,3 300 37,3 13,76 6,1 4,6 7,2 400 36,8 17,06 6,2 5,2 7,4 500 37,2 20,06 6,6 5,9 7,3
The results of counts per projection registered with
Symbia Intevo Excel system (Fig.3. and Fig. 4.)
showed that this parameter did not impact contrast and
spatial resolution, however, SNR and image uniformity
can be increased.
SNR dependency on counts per projection is presented
in Fig. 3.
25

K. Skovorodko et al. / Medical Physics in the Baltic States 15 (2021) 23-27
Fig. 3. SNR dependency on kcounts per projection.
SNR has linear dependency and can be directly
increased by increasing scanning time or administrated
activity. However, administered activity can be
decreased just to a certain level to avoid very long
scanning times that could be unacceptable for the
patient and examination quality.
Integral uniformity also has linear dependency at a low
number of counts per projection, however from a certain
count level it stops decreasing (Fig. 4).
Fig. 4. Integral Uniformity dependency on kcounts per
projection
Differential uniformity changes in a similar manner,
therefore image uniformity in general can be improved
only to a certain level.
The analysis performed above suggests that quality of
images obtained from different SPECT systems cannot
be unified only by changing scanning time and/or
administered activity. Greater impact on image quality
has reconstruction algorithms, prefiltering, postfiltering
and attenuation correction.
Image quality parameters dependency on reconstruction
and attenuation correction is presented in Table 5.
As it is seen from table 5, images, obtained using
different reconstruction algorithms, have very varying
characteristics. Even the same type of reconstruction
algorithm, used by different vendor, generates images
with different quality.
Table 5. Image quality parameters dependency on
reconstruction and attenuation correction.
Contrast SNR Integral
Unifor
mity
Differen
tial
Uniform
ity
Spatial
Resoluti
on, mm
Symbia Intevo Excel
OSEM 24,23 19,6 14,86 7,16 10,4
Flash3D 28,65 13,21 17,99 10,3 10,3
FBP 26,82 5,1 20,9 13,4 12,8
Wallis 33,73 3,9 28,2 20,1 11,7
AC
XSPECT
38,29 10,6 8,421 7,314 7,4
NM/CT 870 CZT
OSEM 28,34 13,6 21,5 13,1 7,7
AC
OSEM
26,4 12 15,6 13 6
FBP 31,5 10,6 23,1 14,6 9,7
AnyScan
OSEM 11,97 24 13,6 7,9 8,2
AC
OSEM
29,3 24,5 9,8 5,9 7
Reconstruction algorithms used in this study did not
change all image quality parameters equally, moreover
increasing one parameter another image quality
parameter could decrease. In such case changing the
reconstruction algorithm did not result in better image
quality in general.
Use of attenuation correction improves image
uniformity and spatial resolution. Moreover, attenuation
correction greatly improved contrast for Mediso SPECT
system.
4. Discussion
The performance check of SPECT equipment using
NEMA, Jaszczak and capillary quality control systems
gave valuable information about systems design,
reconstruction algorithms and its settings, allowed to
compare clinical protocols and evaluate possible causes
of performance differences.
Due to unique software and hardware used in different
SPECT systems, some parameters could not be
harmonized and protocols resulting in identical image
quality could not be created. For instance, a specialized
bone scanning reconstruction algorithm developed by
Siemens gives the highest image quality parameters that
could be difficult to achieve using standard
reconstruction algorithms. GE uses the FAME post-
processing algorithm, which integrates the CT
anatomical bone information into the SPECT bone
image processing [9].
It should be noted that all SPECT systems produce
images with quality suitable for diagnosis. However,
some of the image quality parameters (SNR and image
uniformity) could be improved by changing scanning
parameters, such as scanning time. One of the
SPECT/CT systems equipped with a tungsten
collimator.
The change of reconstruction algorithms allowed to
increase separate image quality parameters, however did
not result in better image quality in general. The reason
is, that each reconstruction algorithm for its best
26

K. Skovorodko et al. / Medical Physics in the Baltic States 15 (2021) 23-27
performance needs specific scanning parameters and the
adjustment of reconstruction settings. This suggests that
there is still some “space” for image quality
improvement. For that, optimization strategies should be
implemented in daily practice in order to minimize
differences in image quality registered with different
SPECT systems.
In order to create a harmonized protocol, optimization
should be performed individually for each particular
SPECT/CT modality considering the clinical setting
time of scan (time between injection and acquisition),
administered activity, scanning and reconstruction
parameters.
The results and knowledge gained in this work will
allow to optimize scanning protocols and proceed
further with the harmonizing of the bone scanning
protocol, moreover it will serve as a good start for
harmonization of other scanning protocols.
5. Conclusions
Quality of images, obtained with clinical protocols used
for the same purpose, are different.
Changing of the main scanning parameters (scanning
time and/or administered activity) did not allow to unify
image quality of different vendors.
The same reconstruction algorithm used by different
vendors produces images of different quality.
Because of intelligent (dedicated) reconstruction
algorithms used by vendors it could be impossible to
achieve the highest quality images for all SPECT
systems.
To harmonize imaging protocols the adaptation of
scanning parameters together with reconstruction
algorithm type and its settings should be performed.
6. References
1. Takayuki Shibutani, Masahisa Onoguchi, Yuka Naoi et al.
The usefulness of SwiftScan technology for bone
scintigraphy. Nature Scientific Reports, 2021. 11:2644.
doi.org/10.1038/s41598-021-82082-x
2. Bartel TB., Kuruva M., Gnanasegaran G., Beheshti M,
Cohen EJ, Weissman AF, Yarbrough TL. SNMMI
Procedure Standard for Bone Scintigraphy 4.0. J Nucl
Med Technol. 2018 Dec;46(4):398-404. PMID: 30518604.
3. Wyngaert T. Van Den., Strobel K., Kampen W. U., et al.
The EANM practice guidelines for bone scintigraphy Eur
J Nucl Med Mol Imaging, 2016 43:1723–1738.
4. Desmonts C, Bouthiba MA, Enilorac B et al. Evaluation of
a new multipurpose whole-body CzT-based camera:
comparison with a dual-head Anger camera and first
clinical images. EJNMMI Physics, 2020. 7:18
doi.org/10.1186/s40658-020-0284-5
5. Goshen E, Beilin L, Stern E et al. Feasibility study of a
novel general purpose CZT-based digital SPECT camera:
initial clinical results. EJNMMI Physics, 2018. 5:6
doi.org/10.1186/s40658-018-0205-z
6. Kurt A., Bor D., Tastan S. et al. Accuracy of Clinical
Protocols in SPECT. J Nucl Med Technol, 2012. 40:259-
264 doi:10.2967/jnmt.111.098715
7. Ghosh P. White Paper xSPECT Bone: a clinical overview.
Siemens Healhineers Headquarters, 2018. MI-
3878.DD.JV.
8. International Atomic Energy Agency.SPECT/CT Atlas of
Quality Control and Image Artefacts. Human Health
Series No. 36. 2019.
9. https://www.gehealthcare.co.uk/products/molecular-
imaging/starguide (Accessed: 9th September 2021)
27

MEDICAL PHYSICS IN THE BALTIC STATES 15 (2021)
Proceedings of International Conference “Medical Physics 2021”
4-6 November 2021, Kaunas, Lithuania
DOSIMETRY CONCEPTS FOR QUALITY ASSURANCE IN µCT
Richard DEYHLE JR.1, Christian BERNHARDSSON1, Lovisa WALDNER1, Lars E. OLSSON1, Marie SYDOFF2 1Medical Radiation Physics, Department of Translational Medicine, Lund University, Skåne University Hospital
Malmö, Inga-Marie Nilssons gata 49, 205 02 Malmö, Sweden; 2Lund University Bio-Imaging Centre (LBIC), Faculty
of Medicine, Biomedical Center (BMC) D11 Klinikgatan 32, 221 84 Lund, Sweden [email protected]; [email protected]; [email protected]; [email protected];
Abstract: The aim of this paper was to suggest a low-cost
phantom for verifying reproducible dosimetric
assessment using a pre-clinical micro-computed
tomography (µCT) scanner. The suggested phantom is
made from Polymethyl methacrylate (PMMA). The
absorbed dose at different positions within the phantom
was measured using two techniques:
theromoluminescent dosimeter of LiF (TLD) chips and
salt (NaCl) pellets, the latter being a proof of concept as
a potential optically stimulated luminescent (OSL)
dosimeter.
Keywords: OSL, TL, radiation dosimetry, luminescence
dosimetry, x-ray micro-computed tomography.
1. Introduction
Small animal imaging (SAI) has gained considerable
importance as a method for preclinical studies during the
last decade. With its capability to provide cost-effective
and fast 3D imaging at high resolution, micro computed
tomography (µCT) has proven to be a valuable tool in the
assessment of a wide variety of preclinical disease
models using small animals such as mice and rats. For in-
vivo preclinical applications, biological response rarely
happens in three dimensions only. The addition of time is
necessary to perform longitudinal imaging, allowing
researchers to study morphological and physiological
alterations over several weeks to months. The radiation
dose must be taken into consideration for in-vivo
applications as biological damage caused from ionizing
radiation may affect the biological system, which may
confound the results.
In order to achieve a sufficient signal-to-noise ratio in
conjunction with the high resolution (50 – 100 µm)
needed when imaging small animals, the radiation dose
for µCT is higher than for clinical CT. Opposite to
clinical CT, no standardization has been established for
dosimetry and quality assurance purposes for in-vivo pre-
clinical µCT [1]. However, current commercial µCT
systems provide users with a set of scanning protocols
designed to meet the image quality requirements, for a
variety of applications, at a reasonably low animal
exposure.
Hence, the aim of this study was to investigate practical
and feasible methods for µCT dosimetry regarding
radiation dose verification. The initial concept of a
phantom designed for dosimetry purposes is based on a
cylinder made of polymethyl methacrylate (PMMA).
PMMA has an atomic density mimicking water, it is
cheap, easily accessible and easily reproducible for
validation between laboratories. The physical
dimensions of the PMMA phantom was designed to
approximately mimic the thickness of a adult rat.
2. Material and Methods
All radiation exposures were made at the Lund
Biomedical Imaging Center (LBIC), Lund University,
Lund, Sweden, using MILabs xuhr-µCT, MIlabs,
Utrecht, Netherlands. The polymethyl methacrylate
(PMMA) phantom was constructed by Promech Lab,
Malmö, Sweden. The NaCl pellets were made in-house
at the department of Medical Radiation Physics, Lund
University, Skåne University Hospital, Malmö, Sweden,
using ordinary household salt that can be purchased in
Swedish supermarkets. The used TLDs were of the type
MCP-N chips (LiF:Mg,Cu,P) from Mikrolab, Poland.
The signals from both the MCP-N chips and the NaCl
pellets were read-out using Risö TL/OSL readers, DTU
Physics, Technical University of Denmark (DTU),
Nutech, Denmark. The signal measured in the reader was
converted to an absorbed dose for each chip or pellet.
Further description of the experimental setup and
methodology will be provided.
The suggested PMMA phantom has the following
dimensions: 49 mm in diameter and 54 mm in length
(Fig. 2). The phantom has four separate boreholes, with
varying depths, to quantify the radiation dose at each
position. The boreholes were filled with either LiF chips
for thermoluminescent dosimetry (TLD), the gold
standard in many dosimetry applications, or NaCl pellets
28

R. Jr. Deyhle et al. / Medical Physics in the Baltic States 15 (2021) 28-31
(made from ordinary household salt) which have proven
to be a potential dosimeter for optically stimulated
luminesce dosimetry (OSLD). Previous similar studies
have utilized other OSL materials but none have
attempted using NaCl as an OSL material [2, 3] in µCT
dosimetry studies. Repeated measurements were made
for various in-vivo imaging protocols frequently used on
a MILabs Extra Ultra High Resolution (xuhr-µCT)
scanner. The PMMA phantom is low-cost and easily
reproducible but lacks tissue inhomogeneity as in a real
mouse or rat.
2.1 In-vivo preclinical µCT scanner
MILabs xuhr-µCT scanner has many features that make
it a competitive µCT scanner on the market
(https://www.milabs.com/u-ct/). A list of features of the
µCT scanner used at LBIC is providedin Table 1.
Table 1. Properties of MILabs xuhr-µCT scanner at LBIC
MILabs xuhr-µCT scanner
Type In-vivo and ex-vivo
Diameter FOV (mm) Up to 130 mm
Length (mm) Up to 712 mm
Voxel Resolution Max 2.4 µm voxel
size
Kilovoltage peak
(kVp)
65 kVp (80 kVp
optional)
Milliamperage Max 0.26 mA
Scanning time Down to 5 sec for total
body mouse
Gating Sensor free and sensor
based respiratory and
cardiac gating
Other Characteristics Dual-energy µCT
High, medium and low
energy filter options
The MILabs xuhr-µCT scanner has three default
protocols with settings that user can choose to either use
per default or optimize to improve the desired need of the
specific measurement, i.e. improve image quality, dose
reduction, high-throughput demand. The protocols are
titled „normal“, „accurate“ and „gated“. When
performing ex-vivo scans, the normal and accurate
protocols are recommended. When performing in-vivo
imaging, and if the reduction of motion artifacts is
required for the application, then the Gating mode must
be selected. This allows the user to acquire physiological
information and record it with each projection in order to
retrospectively correlate each projection with a a specific
phase of the motion.
In this paper, only one protocol have been investigated,
Normal acquisition protocol. Listed in Table 2 are the
settings for the default imaging protocol.
In the normal, accurate and gated protocols the gantry
rotates 360˚ around the sample (i.e. mouse or rat). By
lowering the step angle, a larger number of projections
are acquired, increasing the radiation dose. The Normal
imaging protocol allows users to gain a high resolution
image with a radiation dose of 162 mGy (as stated by the
vendor that supplies an estimate of air kerma for the
default setting).
Table 2. Protocol settings for the various standard imaging
protocols of the MILabs xuhr-µCT scanner
Protocol Settings Normal Accurate Gated
Kilovoltage peak
(kVp) 55 55 55
Milliamperage
(mA) 0.19 0.19 0.19
Exposure time
(milliseconds) 75 75 20
Number of
projections 960 1440 7680
Total scan time
(minute:second) 3:49 5:23 8:28
The Accurate imaging protocol increases the image
quality and also increases the radiation exposure,
corresponding to an estimated air kerma of 228 mGy as
reported from the vendor for the default setting. To
reduce motion artifacts caused by natural physiological
processes such as respiration and cardiac motions, so-
called Gating is used. When using the gated protocol, a
time stamp is recorded with each projection. That is used
to correlate each projection to the recorded cardiac and/or
respiratory signal. This signal can be reconstructed into
a dynamic image series derived from, for example a
rodent. For the default gated acquisition prototocol, the
estimated air kerma is 362 mGy, as reported from
MILabs.
Fig. 1. MILabs xuhr-µCT scanner at LBIC, Lund University,
Lund, Sweden.
2.2 PMMA phantom
The PMMA phantom was designed with the following
dimensions: 49 mm diameter and 54 mm length with four
boreholes with different depths; 24.5±0.05 mm from the
surface of the phantom to the first borehole, with a
difference in depth between the following holes of
6.13±0.05 mm (Fig. 2), towards the cener of the phantom.
Validity of physical dimensions was confirmed using a
„Tolerator“ from Ultra Prazison Messeuge GMBH
ULTRA, Glattbach, Germany. In addition, a 1 mm extra
29

R. Jr. Deyhle et al. / Medical Physics in the Baltic States 15 (2021) 28-31
depth of each borehole was used to allow for positioning
of TL chips or OSL pellets. This allows four detectors to
be used simultaneously in one scan. The phantom was
placed in the animal bed as shown in Fig. 3.
Fig. 4 shows a side view, along the Z-axis, of the
phantom where each position in the phantom is denoted
with an associated number 1-4.
(a)
(b) (c)
Fig. 2. Schematic outline of the PMMA phantom. (a) represents
the y-axis angle with the depths of the four boreholes each
spaced 6.13 mm apart; (b) top view angle with total length of
54 mm; (c) z-axis (in-plane) angle with 49 mm diameter.
Fig. 3. PMMA phantom placed in the iso-center of the animal
bed
2.3. Production, irradiation and read-outs of TLD
and NaCl pellets
The NaCl pellets were produced in-house at Lund
University [4, 5]. For both the TL and the OSL readouts,
two different Risø TL/OSL readers (TL/OSL-DA-15 and
DA-20, DTU Physics, Nutech, Denmark) [6] were used.
Fig. 4. A reconstructed µCT image of the phantom, cropped to
focus on the placement of each borehole within the phantom.
Position 1-4 are listed below the respective borehole, each
being 24.5 mm apart.
The readers are equipped with internal 90Sr/90Y radiation
sources (20 MBq as of 9th of April 2009 and 100 MBq
as of 22nd of October 2010) with absorbed dose rates of
0.58 ± 0.01 mGy s-1 (as of 23rd of April 2021) and 5.03
± 0.1 mGy s-1 (as of 21st of June 2021) to quartz
(calibration quartz, DTU Nutech, Batch 123),
respectively. The dose rate to the NaCl pellets is
calculated using a stopping power ratio of 0.938 between
NaCl and quartz (SiO2) [7, 8]. The readouts were
performed using a continuous wave stimulation mode by
means of blue (λ=470 nm) LEDs according to [4].
The TLDs used were MCP-N chips (LiF:Mg,Cu,P) from
Mikrolab, Poland. The chips were calibrated in an
external 60Co beam and readout were made with the Risø
TL/OSL readers using annealing conditions as stated by
the manufacturer (pre-irradiation: 240 for 10 min;
post-irradiation: 100 for 10 min.). The TL signals were
acquired by linearly heating (10/s) the MCP-N chips
to 240 and holding that temperature for 20 s.
3. Results and discussion
Reported here is the dose values from the scan mode
titled „Normal“. Choosing position one to represent the
position closest to the surface of the phantom, seperated
by a distance of 6.13 mm between each of the following
positions two, three and four. All reported absorbed dose
values are measured in milligray (mGy). Included in the
total absorbed doses reported is the dose from an X-ray
scout view that is always performed prior to irradiation
with any of the selected imaging protocols.
The number of individual dose measurements (n) is listed
along with the arimetric mean dose value and the
30

R. Jr. Deyhle et al. / Medical Physics in the Baltic States 15 (2021) 28-31
variation of dose per dosimeter per position among the n
chips or pellets at each position.
As measured by the TLDs (LiF), in normal scan mode,
the absorbed dose at position one was: 115.2±9.8 mGy
(n=12), position two: 104.2±10.2 mGy (n=11), position
three: 96.5±9.8 mGy (n=12), and position four: 90.1±9.5
mGy (n=11), respectively. A sensitivity correction was
applied to each TLD by considering the coefficient of
variance of the mean in the measurement.
As measured by the OSLDs (NaCl), in normal scan
mode, for position one the corresponding absorbed dose
was 122.6±10.9 mGy (n=12), position two: 114.5±10.4
mGy (n=12), position three: 105.1±9.8 mGy (n=12), and
position four: 97.5±8.5 mGy (n=12), respectively. A
sensitivity correction was applied to each NaCl pellet as
described by [5].
Throughout the homogeneous PMMA phantom, the
TLDs had a reduction of approximately 10% in the dose
between each position (6.13±0.05 mm of PMMA). For
the NaCl pellets, the corresponding reduction was
observed to be approximatley 8%. This indicates a strong
agreement between the two dosimeter materials and the
possiblity to resolve doses, at least, down to 10 mGy for
this X-ray energy range. With the suggested phantom, the
next step in verifying this method is to measure the
radiation absorbed dose for all default imaging protocols
using the same type of dosimeters and an ionization
chamber.
4. Conclusion
In order to optimize the dose delivered during
longitudinal studies, scan parameters should be
optimized; this can be accomplished using the phantom
and method suggested in this work. In longitudinal small
animal studies, the dose delivered by µCT protocols
should be a consideration when evaluating results. In all
CT studies, the primary limiting factor is the exposure,
indeed also for µCT [9]. The suggested methodology is a
low-cost, simple way to assess the dose delivered by any
future protocols as well as for comparisons with other
similar scanners. The results have established the use of
TLD of LiF chips and OSLD of NaCl pellets to measure
the absorbed dose with a similar reduction in dose per
position of about 8-10%. This confirms the use of the
NaCl pellets as an alternative for preclinical dosimetry in
combination with the suggested PMMA phantom. The
prototype PMMA phantom built for this study, in
combination with the NaCl pellets, is easily reproducible
and suggests a robust and simple method for future dose
assessment of µCT protocols. The method presented here
is a first attempt to provide an accurate and practical way
of assessing dose and evaluating protocol parameters in
terms of dose and could be used for routine quality
control of current and future µCTs scanners.
Acknowledgement
The authors are grateful to Promech Lab (Malmö) for
help with manufacturing and developing the PMMA
phantom and to Lund Biomedical Imaging Center for
providing access to MILabs xuhr-µCT for dose
measurements.
5. References
1. Hupfer, M., et al., Dosimetry concepts for scanner quality
assurance and tissue dose assessment in micro‐CT. Medical
physics, 2012. 39(2): p. 658-670.
2. Vrigneaud, J.M., et al., Application of the optically
stimulated luminescence (OSL) technique for mouse
dosimetry in micro‐CT imaging. Medical physics, 2013.
40(12): p. 122102.
3. Mendez, C., et al., Development of a phantom for dosimetric
comparison of murine micro‐CT protocols with optically
stimulated luminescent dosimeters. Medical physics, 2018.
45(8): p. 3974-3979.
4. Waldner, L., Optically stimulated luminescence dosimetry
with NaCl pellets. Dosimetry for prospective applications.
2021, Lund University.
5. Waldner, L. and C. Bernhardsson, Physical and dosimetric
properties of NaCl pellets made in-house for the use in
prospective optically stimulated luminescence dosimetry
applications. Radiation Measurements, 2018. 119: p. 52-57.
6. Berger, M., et al., Stopping-power and range tables for
electrons, protons, and helium ions, NIST Standard
Reference Database 124. National Institute of Standards
and Technology (NIST), Physical Measurement Laboratory
(PML), 2017.
7. Bøtter-Jensen, L., et al., Developments in radiation,
stimulation and observation facilities in luminescence
measurements. Radiation Measurements, 2003. 37(4-5): p.
535-541.
8. Bøtter-Jensen, L., K.J. Thomsen, and M. Jain, Review of
optically stimulated luminescence (OSL) instrumental
developments for retrospective dosimetry. Radiation
Measurements, 2010. 45(3-6): p. 253-257.
9. Clark, D.P. and C. Badea, Micro-CT of rodents: state-of-the-
art and future perspectives. Physica medica, 2014. 30(6): p.
619-634.
31

MEDICAL PHYSICS IN THE BALTIC STATES 15 (2021)
Proceedings of International Conference “Medical Physics 2021”
4-6 November 2021, Kaunas, Lithuania
PERCEPTION OF MEDICAL RISKS AND SOCIODEMOGRAPHIC
CHARACTERISTICS OF RESPONDENTS
Artem DAVYDOV1, Dmitri KONONENKO2, Artem BIBLIN3, Alexander VODOVATOV4
Research Institute of Radiation Hygiene after P.V. Ramzaev, Saint-Petersburg, Russia [email protected], [email protected], [email protected], [email protected]
Abstract: this article presents the results of a social
survey of the population of the Russian Federation in
2019. The results show that the risk from diagnostic
medical use of radiation is perceived as one of the lowest
among other radiation risks. This contradicts the
warnings of experts predicting an increase in the dose
burden on the population as a result of increased
frequency of high-dose examinations. Socio-
demographic differences in public perception of risk
from diagnostic medical uses of radiation were also
examined. The results of the study may be useful in
informing patients about the risk of diagnostic medical
use of radiation compared to other risks.
Keywords: risk perception, radiation, risk
communication
1. Introduction
With the introduction of high-dose radiodiagnostic tests
into medical practice, the collective dose per population
is increasing [1-3]. In the United States, it is estimated
that in the 20-30 years following 2007, approximately
29,000 cancer cases will be induced as a result of the use
of CT in diagnosis [2,4]. However, the use of
radiodiagnostic techniques remains justified because the
benefits outweigh the risks [5]. The ALARA principle
must be respected [5] and patients have the right to be
informed of the risks, which is enshrined in the
legislation of many countries. This makes
communication about radiation risks in medicine
relevant. A recent review of informing practices in
medical examinations has shown that the most successful
method is visual, namely pictographs [6]. Comparisons
with other radiation risks, including airplane flight, risks
from medical exposure are no longer as strong, but still
relevant. It is known [7,8] that ordinary people perceive
radiation risks differently - worse if they are related to the
MIC and someone's interests, the benefit of corporations
(the difference in the perception of nuclear power plants
in the United States and France [9]), better if it benefits
them (airplane flight, medicine) or related to a natural
source, besides, the history of accidents, media attention,
representation of technology, information source,
influence the perception of the society.
The use of radiodiagnostics in medicine is beneficial to
patients and does not significantly benefit physicians - it
allows for a more accurate diagnosis and does not bring
super-profits to medical organizations, so their
perception should be rather positive. However, there is
the question of comparing the risks of medical exposure
to other types of radiation risks that medical exposure can
exceed. For example, is it reasonable to compare medical
risks to the risks of living near a nuclear power plant or
natural radioactive areas? Are medical radiation risks
perceived more acutely than airplane travel or naturally
occurring radioactivity in water and food? Are there
socio-demographic differences in the perception of
medical radiation risks? These questions were addressed
in this article.Similar studies have already been
conducted in the West, but the specifics of risk perception
are highly dependent on the cultural environment and
may differ from country to country For example, in
America the image of radiation is strongly associated
with comic book characters [10], radiation does not
contaminate but "infects" [11], but in other cultures
perception of radiation risks may be different, which may
be related to other modes of transmission and other
images of radiation.
2. Methods
The paper presents the results of a social survey of the
population of the Russian Federation in 2019. Among
other things, the questionnaire included questions about
the perception of radiation risks. The position of risk
from diagnostic medical uses of radiation in the structure
of public perception of radiation risks from other sources,
such as high background radiation areas, nuclear power
plants, radon, cosmic rays during plane trips, X-ray
security scanners, radioactivity in food and drinking
water, was determined.
The survey represented the population of Russia by
gender, age, and region of residence. The random
sampling error does not exceed 2.5% for a 95%
confidence level. The survey was conducted within the
32

A. Davydov et al. / Medical Physics in the Baltic States 15 (2021) 32-34
framework of the IAEA technical cooperation project
RER9153 "Development of Regional Capabilities to
Control Long-Term Risks to Population Due to Radon
Exposure in Households and Workplaces".
In addition to socio-demographic characteristics such as
sex, education, income, age, respondents were asked to
indicate the level of risk that they considered relevant for
them personally (personal level) and for the population
of the country as a whole (societal level). The following
options were available 1 - low, 2 - rather low, 3 -
moderate, 4 - rather high, 5 - very high, 6,7 - don't know,
I prefer not to answer. The logistic model with the
dependent variable of perception of medical risks was
used in the analysis of the results. The model was
dichotomized in advance: the answer options "high" and
"very high" were taken as 1, other options - as 0. Besides,
to rank the radiation risks, the method of arithmetic mean
calculation was used, for which the scale was
transformed into a numeric one, the answer options 6,7 -
"don't know" and "I prefer not to answer" were removed
from the analysis. To compare the researched by socio-
demographic groups the method of calculation of chi-
square values was applied.
3. Results and discussion
Studies of risk perception have found a distinction in the
perception of personal risks and generalized (societal)
risks [12]. In our study, no differences were found in the
perception of medical radiation risks at the personal and
generalized (societal) level (Table 1).
Table 1. Personal and societal perception of radiation risks
Perso
nal,
%
hig
h
and
very
hig
h
Perso
nal
averag
e
(max
5
poin
ts)
So
cietal, %
h
igh
and
very
hig
h
Av
erage
societal
(max
5 p
oin
ts)
Areas with high natural
radioactivity (e.g., the vicinity of uranium
mines)
66.7 3.88 66.8 3.98
Nuclear power plants 38.9 3.09 43.6 3.29
Radon at home and in the
workplace 30.6 3.06 33.7 3.22
Natural radioactivity of
drinking water and food 25.4 2.86 28.2 3.00
Medical exposure (X-
rays, CT scans, etc.) 17.5 2.76 16.9 2.76
Inspection units
(security frames) 8.5 2.27 8.5 2.33
A two-hour airplane flight
5.9 2.23 6.9 2.30
The problem of medical risks among other radiation risks
is one of the least acutely perceived - the respondents are
more seriously concerned about the risks of living in
areas with high natural radioactivity, nuclear power
plants, natural radioactivity of drinking water and food
products, less concerned about safety inspection frames
and airplane flights.
The socio-demographic differences in the public
perception of risk from diagnostic medical uses of
radiation were also investigated. It was found that women
were more inclined to assess societal risk as high (20.6%
vs. 12.4% among men, χ2=17.883, df=1, P-value<0.001).
The respondents with the lowest income (below the
minimum wage) tend to assess this risk for the entire
Russian
population higher than respondents with income above
the minimum wage (22.5% vs. 16.0%, χ2=4.33, df=1, P-
value<0.05). The respondents in the 25-54 age group
perceive personal risk more acutely (from 19.5% to
20.3% assess this risk as high) than the respondents of
younger and older ages (11.5% and 13.3% respectively,
χ2=12.106, df=3, P-value<0.01) and a similar pattern is
observed for societal risk.
The data are confirmed by logistic models (see Tables 2
and 3). The perception of medical radiation risks depends
on the income, age, gender of the respondent. No
connection with the level of education was found, as in
the case of the chi-square method. In general, it can be
argued that more privileged members of society perceive
risk more calmly, in America this is called "white male
effects" [13, 14]. The small values of the pseudo-P
squares showed that the sociodemographic
characteristics of the respondents play a secondary role
in the difference in radiodiagnostic risk perception.
Table 2. Dependent variable - perception of medical risks,
personal level
B Significance
Income, above
minimum wage* -,436 ,037
Education,
higher** ,189 ,238
Gender, female*** ,114 ,455
Age_25-39**** ,174 ,572
Age_40-54**** -,399 ,049
Age_55 and
older**** -,460 ,031
Constant 1,779 ,000
* - reference category "below minimum wage", ** -
reference category "without higher education", *** -
reference category "male", **** - reference category "under
24 years"
Cox and Snell R-squared 0.012, Nagelkerk R-squared 0.020
Table 3. Dependent variable - perception of medical risks,
societal level
B Significance
Income, above
minimum wage* -,439 ,039
Education,
higher** ,295 ,076
Gender,
female*** ,339 ,031
Age_25-39**** -,418 ,177
Age_40-54**** -,830 ,000
Age_55 and
older**** -,618 ,010
Constant 2,009 ,000
* - reference category "below minimum wage", ** -
reference category "without higher education", *** -
reference category "male", **** - reference category "under
24 years"
R-squared Cox and Snell 0.026, R-squared Nagelkerk 0,044
33

A. Davydov et al. / Medical Physics in the Baltic States 15 (2021) 32-34
4. Conclusion
In general, medical risks are not perceived as acutely as
risks from nuclear power plants and uranium mine
surroundings, but more acutely than from inspection
frames or airplane flights. When communicating the risks
to the most vulnerable populations - low-income, women
- it should be borne in mind that they feel the least
protected and perceive medical radiation risks most
acutely. Presenting the risk information in the form of a
graph is the best strategy in order to convince the patient
of the radiodiagnostics benefit (alternative risks of poor
diagnosis) [15, 16] and the lack of significant financial
benefit to the medical institution.
5. References
1. Hall, E. J., & Brenner, D. J. (2008). Cancer risks from
diagnostic radiology. The British journal of
radiology, 81(965), 362-378
2. Brenner, D. J., & Hall, E. J. (2007). Computed
tomography—an increasing source of radiation
exposure. New England journal of medicine, 357(22),
2277-2284.
3. Onischenko G.G., Popova A.Yu., Romanovich I.K.,
Vodovatov A.V., Bashketova N.S., Istorik O.A., Chipiga
L.A., Shatsky I.G., Sarycheva S.S., Biblin A.M., Repin
L.V. Modern principles of the radiation protection from
sources of ionizing radiation in medicine. Part 2: radiation
risks and development of the system of radiation protection.
Radiatsionnaya Gygiena = Radiation Hygiene.
2019;12(2):6-24. (In Russ.) https://doi.org/10.21514/1998-
426X-2019-12-2-6-24
4. Berrington Gonzalez A de, Mahesh M, Kim KP et al (2009)
Projected cancer risksfrom computed tomographic scans
performed in the United States in 2007. Arch Intern Med
169:2071–2077
5. Schindera, S. T., Nauer, C., Treier, R., Trueb, P., Von
Allmen, G., Vock, P., & Szücs Farkas, Z. (2010). Strategies
for reducing the CT radiation dose. Radiologe, 50(12),
1120-1122.
6. Younger, C. W. E., Wagner, M. J., Douglas, C., & Warren-
Forward, H. (2019). Describing ionising radiation risk in
the clinical setting: a systematic review. Radiography,
25(1), 83-90.
7. Slovic, P. (1996). Perception of risk from radiation.
Radiation protection dosimetry, 68(3-4), 165-180.
8. Sjöberg, L. (2000). Specifying factors in radiation risk
perception1. Scandinavian Journal of Psychology, 41(2),
169-174.
9. Slovic, P., Flynn, J., Mertz, C. K., Poumadere, M., & Mays,
C. (2000). Nuclear power and the public. In Cross-cultural
risk perception (pp. 55-102). Springer, Boston, MA.
10. Hendee, W. R. (1991). Personal and public perceptions of
radiation risks. RadioGraphics, 11(6), 1109–1119.
doi:10.1148/radiographics.11.6
11. Erikson, K. (1990). Toxic reckoning: business faces a new
kind of fear. Harvard Business Review, 68(1), 118-126.
12. Coleman, C. L. (1993). The influence of mass media and
interpersonal communication on societal and personal risk
judgments. Communication research, 20(4), 611-628
13. Kahan, D. M., Braman, D., Gastil, J., Slovic, P., & Mertz,
C. K. (2007). Culture and identity‐protective cognition:
Explaining the white‐male effect in risk perception. Journal
of Empirical Legal Studies, 4(3), 465-505.
14. Finucane, M. L., Slovic, P., Mertz, C. K., Flynn, J., &
Satterfield, T. A. (2000). Gender, race, and perceived risk:
The'white male'effect. Health, risk & society, 2(2), 159-
172.
15. Freudenberg LS, Müller SP, Beyer T, Bockisch A.
Subjective perception of radioactivity: no change after
successful treatment with radioiodine [in German].
Nuklearmedizin. 2009;48:84–88.
16. Erikson, K. (1991). Radiation's lingering dread. Bulletin of
the Atomic Scientists, 47(2), 34-39.
34

MEDICAL PHYSICS IN THE BALTIC STATES 15 (2021)
Proceedings of International Conference “Medical Physics 2021”
4-6 November 2021, Kaunas, Lithuania
ESTIMATION METHOD OF BREAST ABSORBED RADIATION DOSE
DURING CORONARY ANGIOGRAPHY
Tatjana VIGOVSKA1, Katrina CAIKOVSKA2, Mara EPERMANE3 1Riga Technical University; 2Riga East university hospital; 3Riga East university hospital
[email protected]; [email protected]; [email protected]
Abstract: Due to the growing number and complexity of
coronary angiography examinations, it is highly
important to estimate absorbed radiation dose for breast
tissue. The aim of this study was to develop an
estimation method of breast dose during coronary
angiography. During the study breast dose was
measured for 15 adult female patients who underwent
percutaneous coronary intervention. Gafchromic
RTQA2 film was used to estimate breast dose and
correlation factor was found between breast dose and
cumulative dose.
Keywords: Coronary angiography; Percutaneous
coronary intervention; Gafchromic film; Breast
absorbed radiation dose; Estimation method
1. Introduction
Coronary angiography is one of the high-dose and long
exposure time interventional radiology examinations
and it is performed using an angiography equipment.
During coronary angiography, various radiosensitive
organs, such as breast tissue, are exposed to ionizing
radiation. The breast tissues are exposed to direct x-ray
beam and have a low recovery rate, therefore it is
important to evaluate dose to breast tissue during
coronary angiography procedures [1].
During the examination, the angiography system
registers various radiation parameters such as kerma
area product (KAP) and cumulative dose [2]. To
estimate the breast dose to individual patient in vivo
measurements were performed. Results from the
measurements were used to find correlation between
breast dose and data provided by angiography system.
The aim of this study was to develop an estimation
method of breast dose during coronary angiography
using the data provided by the angiography system.
2. Materials and methods
In this study, doses to breast tissue were determined
using gafchromic RTQA2 films (size 1x12.7 cm,
dynamic range 0.02 Gy to 8 Gy) for 15 female patients
during percutaneous coronary intervention (PCI) with
and without stenting between March and May 2021.
Percutaneous coronary intervention procedures were
chosen for this study due to the long exposure times and
high patient doses based on previous literature [3, 4].
The research was carried out in Riga East University
Hospital, Latvia, using GE healthcare Innova 2100
angiography equipment. This study was approved by the
local esthetic committee and can be tracked under 6-
1/12/45. All patients signed confirmation to participate
in this study.
Before the study, film calibration was done in X-ray
beam at dose range 0-2Gy. The film was placed side by
side with solid state detector MagicMaX on the surface
of polymethyl methacrylate (PMMA) plate with
thickness 70 mm. The X-ray tube was positioned under
the table (180o) and the film was irradiated using a tube
voltage of 120 kV and 32 mA current. Gafchromic films
were scanned and digitized at least 12 hours after
irradiation using Epson 1200XL scanner in 48-bit color,
75 dpi resolution and no color correction [5]. The mean
pixel values for films (using red channel) were extracted
using ImageJ program [6]. 4th polynomial function was
used to determine calibration equation (1) (coefficient
of determinisms is 0.997) [7].
D= (0.019*1012x4-2.7338*109x3+1.478*104x2 – 3.5468x
+ 31 954.6118) *1000 (1)
To determine absorbed dose by breast tissue, two
gafchromic film strips with the size 1x12.7 cm (area
used for measurements – 0.6x12.1 cm) were placed on
each patient as shown in figure 1. Film Nr.1 was placed
in the middle of left breast and film Nr.2 was placed in
center of the patient – between the breasts. Both films
were secured with tape. The position of film strips was
chosen based on information from previous literature,
where using phantom the measured dose for left breast
was 2.3 mGy and for right breast 1.17 mGy [8]. During
the procedure the X-ray tube may be in varies positions,
but mainly the position is under the table, the distance
between the table and the tube varies from 50 to 110
35
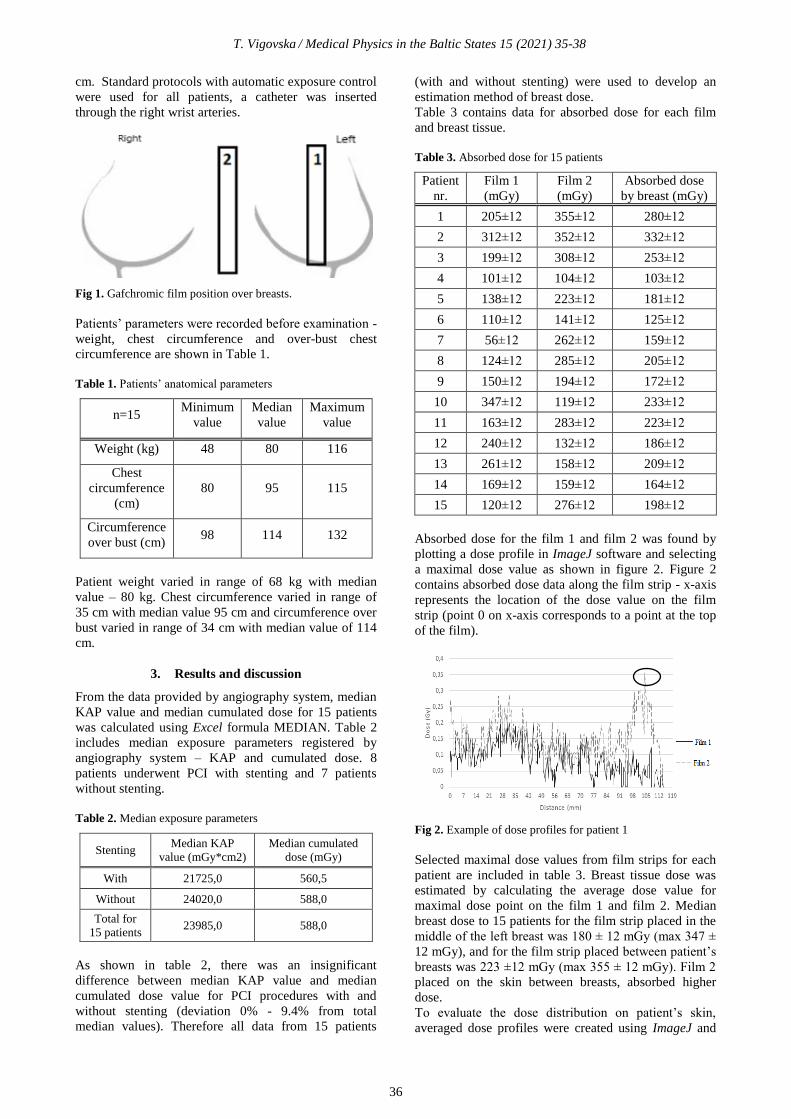
T. Vigovska / Medical Physics in the Baltic States 15 (2021) 35-38
cm. Standard protocols with automatic exposure control
were used for all patients, a catheter was inserted
through the right wrist arteries.
Fig 1. Gafchromic film position over breasts.
Patients’ parameters were recorded before examination -
weight, chest circumference and over-bust chest
circumference are shown in Table 1.
Table 1. Patients’ anatomical parameters
n=15 Minimum
value
Median
value
Maximum
value
Weight (kg) 48 80 116
Chest
circumference
(cm)
80 95 115
Circumference
over bust (cm) 98 114 132
Patient weight varied in range of 68 kg with median
value – 80 kg. Chest circumference varied in range of
35 cm with median value 95 cm and circumference over
bust varied in range of 34 cm with median value of 114
cm.
3. Results and discussion
From the data provided by angiography system, median
KAP value and median cumulated dose for 15 patients
was calculated using Excel formula MEDIAN. Table 2
includes median exposure parameters registered by
angiography system – KAP and cumulated dose. 8
patients underwent PCI with stenting and 7 patients
without stenting.
Table 2. Median exposure parameters
Stenting Median KAP
value (mGy*cm2)
Median cumulated
dose (mGy)
With 21725,0 560,5
Without 24020,0 588,0
Total for
15 patients 23985,0 588,0
As shown in table 2, there was an insignificant
difference between median KAP value and median
cumulated dose value for PCI procedures with and
without stenting (deviation 0% - 9.4% from total
median values). Therefore all data from 15 patients
(with and without stenting) were used to develop an
estimation method of breast dose.
Table 3 contains data for absorbed dose for each film
and breast tissue.
Table 3. Absorbed dose for 15 patients
Patient
nr.
Film 1
(mGy)
Film 2
(mGy)
Absorbed dose
by breast (mGy)
1 205±12 355±12 280±12
2 312±12 352±12 332±12
3 199±12 308±12 253±12
4 101±12 104±12 103±12
5 138±12 223±12 181±12
6 110±12 141±12 125±12
7 56±12 262±12 159±12
8 124±12 285±12 205±12
9 150±12 194±12 172±12
10 347±12 119±12 233±12
11 163±12 283±12 223±12
12 240±12 132±12 186±12
13 261±12 158±12 209±12
14 169±12 159±12 164±12
15 120±12 276±12 198±12
Absorbed dose for the film 1 and film 2 was found by
plotting a dose profile in ImageJ software and selecting
a maximal dose value as shown in figure 2. Figure 2
contains absorbed dose data along the film strip - x-axis
represents the location of the dose value on the film
strip (point 0 on x-axis corresponds to a point at the top
of the film).
Fig 2. Example of dose profiles for patient 1
Selected maximal dose values from film strips for each
patient are included in table 3. Breast tissue dose was
estimated by calculating the average dose value for
maximal dose point on the film 1 and film 2. Median
breast dose to 15 patients for the film strip placed in the
middle of the left breast was 180 ± 12 mGy (max 347 ±
12 mGy), and for the film strip placed between patient’s
breasts was 223 ±12 mGy (max 355 ± 12 mGy). Film 2
placed on the skin between breasts, absorbed higher
dose.
To evaluate the dose distribution on patient’s skin,
averaged dose profiles were created using ImageJ and
36

T. Vigovska / Medical Physics in the Baltic States 15 (2021) 35-38
Excel. From averaged dose profiles a schematic
illustration for dose distribution was created and
included as figure 3. Dark grey lines illustrate higher
doses (0.12 Gy) and light grey lines – low doses (<0.02
Gy). As shown in figure 3 – film 2 absorbs higher
doses, as well the maximum absorbed dose is located
between the breasts.
Fig 3. Averaged dose profile for gafchromic films
To develop an estimation method for breast dose using
parameters from angiography system, correlation
between absorbed dose and KAP and correlation
between cumulated dose and absorbed breast dose was
determined by plotting a graph. From the graph
correlation factor was found.
Correlation coefficient between cumulative dose and
absorbed breast dose is 0.79 (coefficient of determinism
– 0.91) as shown in figure 4. Correlation coefficient was
calculated using Excel equation CORREL.
Fig 4. Absorbed dose by breast tissue depending on
cumulative dose
To estimate breast absorbed dose (D) during PCI, the
following formula must be used:
D= 0,2598* (cumulative dose) (2)
Correlation coefficient between KAP and absorbed dose
is 0.73 (coefficient of determinism – 0.91) as shown in
figure 5.
To estimate breast absorbed dose during PCI, the
following formula must be used:
D = 0,0067* KAP (3)
Fig 5. Absorbed dose by breast tissue depending on KAP
Higher accuracy for absorbed dose calculation will be
reached using cumulative dose (2), nonetheless it is
possible to use KAP values (3).
To evaluate breast dose dependence on patient’s
anatomical parameters, dose dependence graphs were
created. Figure 6 shows that there is no correlation
between patient’s weight and breast dose (correlation
coefficient 0.06).
Fig 6. Absorbed dose by breast tissue depending on patients’
weight
Figure 7 shows that there is no correlation between
patient’s chest circumference and breast dose
(correlation coefficient -0.06).
Fig 7. Absorbed dose by breast tissue depending on patients’
chest circumference
Figure 8 shows that there is no correlation between
patient’s circumference over bust and breast dose
(correlation coefficient -0.05).
37

T. Vigovska / Medical Physics in the Baltic States 15 (2021) 35-38
Figure 8. Absorbed dose by breast tissue depending on
patients’ circumference over bust
The correlation between patient’s anatomical
parameters and absorbed dose by breast tissue was not
found. Therefore, developed estimation method does not
depend on patient’s anatomical parameters and this
method can be used for any patient that underwent
percutaneous coronary intervention with or without
stenting regardless of their weight, chest circumference,
cup size.
4. Conclusions
The results of this study show that:
1) To estimate the breast dose for patients that
underwent PCI procedures, cumulated dose displayed
by angiography system should be multiplied by factor
0.2598.
2) Higher accuracy for absorbed dose calculation will be
reached by using cumulative dose data, nonetheless is
possible to use KAP values and multiply them with
factor 0.0067.
3) Multiplying factors developed in this study can be
used for every patient regardless of their anatomical
parameters.
4) Largest dose is absorbed by the breast tissues located
closer to patient’s center.
5) The developed method for breast dose estimation is
limited for PCI procedures using angiography system.
5. References
1. Engel, C. L., Sharima Rasanayagam, M., Gray, J. M., &
Rizzo, J.. Work and female breast Cancer: the state of the
evidence, 2002–2017. NEW SOLUTIONS: A Journal of
Environmental and Occupational Health Policy, 2018. P.
55-78.
2. Writing committee members, Hirshfeld Jr, J. W., Balter,
S., Brinker, J. A., Kern, M. J., Klein, L. W., Weitz, H. H.
ACCF/AHA/HRS/SCAI clinical competence statement on
physician knowledge to optimize patient safety and image
quality in fluoroscopically guided invasive cardiovascular
procedures: a report of the American College of
Cardiology Foundation/American Heart
Association/American College of Physicians Task Force
on Clinical Competence and Training. Circulation. 205. p.
511-532.
3. Betsou, S., Efstathopoulos, E. P., Katritsis, D., Faulkner,
K., & Panayiotakis, G. Patient radiation doses during
cardiac catheterization procedures. The British journal of
radiology. 1998. p. 634-639.
4. Crowhurst, J. A., Whitby, M., Thiele, D., Halligan, T.,
Westerink, A., Crown, S., & Milne, J. Radiation dose in
coronary angiography and intervention: initial results from
the establishment of a multi‐centre diagnostic reference
level in Queensland public hospitals. Journal of medical
radiation sciences. 2014. p. 135-141.
5. Reinstein, L. E., Gluckman, G. R., & Meek, A. G. A rapid
colour stabilization technique for radiochromic film
dosimetry. Physics in Medicine & Biology. 1998. p. 2703.
6. Devic, S., Seuntjens, J., Hegyi, G., Podgorsak, E. B.,
Soares, C. G., Kirov, A. S., ... & Elizondo, A. Dosimetric
properties of improved GafChromic films for seven
different digitizers. Medical physics. 2004. p. 2392-2401.
7. Mong, K. S., Wallace, A. B., & Franich, R. D.
Asymmetric breast dose in coronary angiography. Journal
of applied clinical medical physics, 2016. p. 532-541.
8. Ратнер, Т. Г., & Лебеденко, И. М. Клиническая
дозиметрия. Физико-технические основы. 2017. 259 p.
38

MEDICAL PHYSICS IN THE BALTIC STATES 15 (2021)
Proceedings of International Conference “Medical Physics 2021”
4-6 November 2021, Kaunas, Lithuania
RADIATION DOSE FOLLOW-UP FOR COMMON INTERVENTIONAL
CARDIOLOGY AND RADIOLOGY PROCEDURES
Leonid KRYNKE1, Birutė GRICIENĖ1,3, Antonio JREIJE1,2, Laura BILOTAITĖ3
1Vilnius University Hospital Santaros Klinikos, Vilnius, Lithuania; 2Department of Physics, Kaunas University of
Technology, Kaunas, Lithuania; 3Vilnius University, Faculty of Medicine,Vilnius, Lithuania
[email protected]; [email protected]; [email protected]; [email protected]
Abstract: Radiation dose delivered to patients
undergoing invasive angiography and interventional
radiography procedures remains relatively high.
International guidelines suggest that local benchmarks
should be established for these procedures. The purpose
of this study was to establish local diagnostic reference
levels (DRLs) for common interventional radiology and
cardiology procedures and to compare them with local
DRLs set in 2015 and National DRLs. The six-month
investigation covered six fluoroscopy units and focused
on seven interventional radiology examination types.
DRLs were set as the 3rd quartile of the dose area
product (DAP), surface entrance dose (ESD) and
fluoroscopy time (FT) values. This work indicated that
preliminary local DRLs can provide an adequate
reference tool for patient dose optimization and a
reflection on clinical practices.
Keywords: Interventional radiology, Radiation
protection, Diagnostic reference level, Patient dose
1. Introduction
Interventional radiology guides different critical
procedures including stent placement, angioplasty,
embolization, radiofrequency ablation, taking biopsies
and treating tumors. The use of examinations involving
fluoroscopy, especially in interventional cardiology
procedures is rapidly increasing due to substantial
decrease in associated risks, pain, expenses as well as
improved recovery when compared to invasive
procedures [1]. However, these types of examinations
are associated with longer exposure time and higher
effective doses up to 100 mSv as opposed to regular
diagnostic examinations. Consequently, this result in a
significant risk of health effects, notably to the skin,
including several reported cases of skin erythema,
dermal atrophy and ulcerations [2].
In this context, different radiation protection bodies
such as the ICRP and IAEA recommend maintaining
radiation exposure from radiological procedures as low
as possible and monitoring patient doses closely at a
local, regional and national level. This can be achieved
successfully by implementing a system of dose
reference levels, which was formulated by the ICRP as a
tool for dose optimization in diagnostic and
interventional medical imaging [3, 4]. Setting up DRLs
for examinations involving fluoroscopy could be a
challenging task due to the large difference in the
exposure time and the number of acquired images
between patients resulting in a large variability of
patient dose observed for the same fluoroscopic
procedure. This is attributed to the lack of well-
established definition of the performed examination,
differences in the used techniques and protocol
parameters, complexity of each case and the experience
of the radiologist [5].
The most important aspect of quality assurance in
interventional radiology should be the regular assembly
of patient doses and the comparison of the median
values with existing local and national DRLs in order to
decide if any further correction action is necessary to
optimize patient exposure.
Due to the complexity of fluoroscopic exposures,
national DRLs for common interventional radiology
procedures are, until present, not established in most
countries. In Lithuania, national DRLs were set in 2018
for two interventional radiology examinations (coronary
angiography and coronary intervention) [6], despite the
fact that this radiographic technique is used to conduct
additional procedures such as transcatheter aortic valve
implantation, pacemaker implantation/replacement,
chemoembolization, etc. The aim of this work was to
assess the local diagnostic reference levels (DRLs) for
most common interventional radiology procedures and
to compare the new DRLs with previously evaluated
local DRLs as well as National DRLs when available.
2. Materials and Methods
Data collection was carried for seven interventional
procedures performed on six angiography systems at
39

L. Krynke et al. / Medical Physics in the Baltic States 15 (2021) 39-42
Vilnius University Hospital Santaros Klinikos from
January until June 2021 (Fig. 1).
Fig. 1. Distribution of Interventional exams carried out over a
six-month period.
Information about fluoroscopy equipment in use at the
hospital including manufacturer, model and year of
installation are presented in Table 1.
Table 1. Fluoroscopy equipment information
OR Model Manufacturer Installation
year
1 C-arm, OEC Elite GE 2021
2 Innova IGS 520 GE 2019
4 Azurion 7 Philips 2020
5 Trinias B12 Shimadzu 2017
7 Innova 2100 GE 2009
8 Allura Xper FD20 Philips 2015
For each examination, patient-related and dosimetry-
related data were collected: procedure type, performing
physician, dose area product (DAP), entrance surface
dose (ESD), fluoroscopy time (FT) as well as patient
height and weight (if available in the report book).
Local DRLs were established for the following
procedures: coronary angiography (CA), coronary
intervention (CI), transcatheter aortic valve implantation
(TAVI), cerebral angiography and/or angioplasty
(Cerebral ANG/PTA), peripheral angiography and/or
angioplasty (Peripheral ANG/PTA) and pacemaker
implantation/replacement (Pacemaker). Local DRL
were set as the 75th percentile of the distribution of
DAP, ESD and FT as recommended by the European
commission (Council Directive 2013/59/EURATOM)
[7] and Radiation Protection Centre in Lithuania
(methodical guidelines for patients dose estimation in
diagnostic radiology) [8].
Statistical analysis was performed using “SPSS
Statistics” in order to compare exposure dose and time
between fluoroscopy equipment for angiography and
angioplasty procedures. Differences between medians
were estimated using Kruskall-Wallis non-parametric
test with follow-up pair wise comparison with Mann-
Whitney test. Differences were considered statistically
significant for p-value <0.05.
3. Results and discussion
A total of 2186 collected examinations between January
and June 2021 was included in this study. The most
performed procedures at hospital were coronary
angiography and angioplasty (995 CA; 420 CA & CI).
These cardiovascular (CV) procedures were performed
in 4,7,8 operation rooms (OR). Results of DAP and FT
for different CV interventional procedures along with
comparison with Lithuanian DRLs are presented in Fig.
2 and Fig. 3 respectively. Direct comparison of the three
operation rooms indicated a statistically significant
difference in patient doses delivered during CA and CI
(Kruskall-Wallis test, p-value<0.05). In the case of
combined CA & CI procedures, follow up Mann-
Whitney test revealed no significant difference between
OR 1 & 3 (p-value = 0.539). Similarly, registered
exposure times were different between the three-
operation room for CA (difference not significant
between OR 1 & 2; Mann-Whitney test p-
value = 0.115). Nevertheless, no significant difference
between ORs was found in case of CI (p-value = 0.705)
and CA & CI (p-value = 0.286). These differences can
be attributed to several factors such as difference in the
used equipment in each operation room, experience of
the practitioner (10 physicians were involved in
performing CV procedures) and the degree of
complexity of each examination.
Fig. 2. Median dose area product (DAP) for cardiovascular
interventional procedures in three different operation rooms
compared with Lithuanian DRLs.
Fig. 3. Median fluoroscopy time (FT) for cardiovascular
interventional procedures in three different operation rooms
compared with Lithuanian DRLs.
Median dose (DAPs) were compared with national
DRLs and with data collected at hospital in 2015 for
few interventional procedures as part of work done on
patient protecting against ionizing radiation. Median
DAPs for all interventional procedures were
CA; 45.5%
CI; 7.2%
CA+CI;
19,2%
Cerebral
angiography
/angioplasty;
2.2%
Peripheral
angiography
/angioplasty;
10%
TAVI; 1.3% Pacemaker
implant; 14.6%
0
20
40
60
80
100
OR 4 OR 8 OR 7
Med
ian
DA
P, G
y.cm
2 CA
CI
CA+CI
Lithuanian DRLs
0
2
4
6
8
10
12
OR 4 OR 8 OR 7
Med
ian
FT,
min
CA
CI
CA+CI
LithuanianDRLs
40

L. Krynke et al. / Medical Physics in the Baltic States 15 (2021) 39-42
significantly lower than national DRL. When compared
with data from 2015, dose delivered to patients
undergoing interventional procedures in general
decreased (from 51% for CA&CI and up to 74% for
TAVI). The median time taken to perform
interventional procedures in general decreased (table 4).
Since physicians at hospital undergoes trainings on the
aspects of radiation protection, they are aware of
exposure time-dose relationship and seek to limit
exposure time whenever possible.
Additional factor that could contribute to this notable
change in patient doses include the size of data used in
setting median dose values (i.e. data from 2015 was
based on a smaller sample size of 761 procedures).
Therefore, DRL should be updated frequently in order
to account for all previously mentioned factors.
In this work, local DRLs were only established for CA
(DAP 23 Gy.cm2, Dose 292 mGy) and CA+CI (DAP 56
Gy.cm2, Dose 785 mGy). Setting DRL for other
procedures need additional data collection and
investigation.
Finally, it should be mentioned that some difficulties
were faced when establishing local DRLs at hospital. A
major limitation of this study was unregistered patient
weight and height for most procedures which prompted
setting DRLs without any size correction factor. This
issue will be addressed when updating local DRLs in
the near future. Moreover, data processing was a
challenging task, thus suggesting that a better definition
of the procedures is required.
Table 2. Entrance surface dose for interventional procedures.
Procedure/Number
Dose, mGy
(2021)
Dose, mGy
(2015)
Median 75th Median 75th
CA 995 162 292 377 608
CI 157 429 750 - -
CA+CI 420 470 785 916 1426
Cerebral
ANG/PTA 47 225 393 450 896
Peripheral
ANG/PTA 220 155 247 - -
TAVI 29 252 320 1566 -
Pacemaker 318 7 16 - -
Table 3. Dose area products (DAPs) for interventional procedures; * Lithuania (2018); ** Germany (2019); *** Finland (2016)
Procedure
DAP, Gy.cm2
(2021)
DAP, Gy.cm2
(2015) National DRLs
Median 75th Median 75th
CA 12.3 22.5 30.4 48.2 30*
CI 26.7 46.5 - - 70*
CA+CI 32.1 55.6 65.6 106.2 80*
Cerebral ANG/PTA 21.1 43.5 50.9 70.9 -
Peripheral ANG/ PTA 19.6 31.0 - - 25**
TAVI 23.1 33.2 91.0 - 80**
Pacemaker 0.9 2.3 - - 3.5***
Table 4. Fluoroscopy times (FT) for interventional procedures; * Lithuania (2018); ** Germany (2019); *** Finland (2016)
Procedure FT, min (2021) FT, min (2015)
National DRLs Median 75th Median 75th
CA 2.0 3.5 2.3 - 3*
CI 8.8 13.0 9.5 - 7*
CA+CI 10.4 16.2 - - 9*
Cerebral ANG/PTA 6.1 11.0 11.2 - -
Peripheral ANG/ PTA 9.5 18.9 - - 18**
TAVI 11.1 13.4 17.3 - 18**
Pacemaker 2.9 5.3 4.0 - 5***
41

L. Krynke et al. / Medical Physics in the Baltic States 15 (2021) 39-42
4. Conclusions
Statistical evaluation related to patient doses in
interventional radiology and cardiology procedures,
mainly performed at the hospital in 2021 was done. The
results showed that median doses are smaller than
national DRLs. In addition, follow-up with data
collected in 2015, exposure dose and time decreased
significantly for all procedures.
Local DRLs were established for 2 main interventional
cardiology procedures (CA and CI+CA).
The established local DRLs will be further used for the
patient dose optimization.
5. References
1. Tsapaki V, Ahmed NA, AlSuwaidi JS, et al. Radiation
exposure to patients during interventional procedures in 20
countries: initial IAEA project results. AJR Am J
Roentgenol 2009; 193: 559–69.
2. Koenig TR, Wolff D, Mettler FA, et al. Skin injuries from
fluoroscopically guided procedures: part 1, characteristics
of radiation injury. AJR Am J Roentgenol 2001; 177: 3–
11.
3. Committee 3 ICRP. Diagnostic reference Levels in
medical imaging: Review and additional advice. 2012; 1–
7. (accessed 04/08/2013). Available from:
http://www.icrp.org/docs/ DRL_for_web.pdf.
4. IAEA Safety Series No. 115: International basic safety
standards for protection against ionizing radiation and for
the safety of radiation sources. Vienna: International
Commission on Radiological Protection; 1996.
5. Bartal G, Vano E, Paulo G, Miller DL (2014)
Management of patient and staff radiation dose in
interventional radiology: current concepts. Cardiovasc
Intervent Radiol 37:289–298
6. Order No. V-952 ‘‘Approval of diagnostic reference levels
applicable during radiation diagnostics and intervention
radiology procedures” by the Lithuanian Minister of
Health Care. 2018.
7. European Commission (2014) Council Directive 2013/59/
EURATOM of 5 December 2013 laying down basic safety
standards for protection against the dangers arising from
exposure to ionising radiation. Off J Eur Union L13:1–73.
8. Radiation protection Centre in Lithuania. Methodical
guidelines for patient radiation dose estimation in
diagnostic radiology, (accessed 10/09/2021). Available
from: https:// www.rsc.lt/ index.php/ pageid/717.
42

MEDICAL PHYSICS IN THE BALTIC STATES 15 (2021)
Proceedings of International Conference “Medical Physics 2021”
4-6 November 2021, Kaunas, Lithuania
RELATION BETWEEN THE SEVERITY OF THE COURSE OF THE DISEASE
AND DOSES AND RADIATION RISK OF THE CHEST X-RAY AND CT
EXAMINATION OF CHILDREN WITH COVID-19
Ilia SHATSKIY 1, Dmitry IVANOV 2, Vitaly REZNIK 3, Aleksandr POZDNYAKOV 4, Viktor PUZYREV 5,
Yuliya KAPYRINA 6, Anna NABIEVA 7, Karine PANUNTSEVA 8, Svetlana BANNOVA 9, Yury PETRENKO 10 1St-Petersburg Research Institute of Radiation Hygiene after Professor P.V. Ramzaev; 2,3,4,5,6,7,8,9,10Saint-Petersburg
State Pediatric Medical University, Russian Federation [email protected]; [email protected]; [email protected]; [email protected];
[email protected]; [email protected]; [email protected]; [email protected]; [email protected]; [email protected]
Abstract: The effective doses and radiation risks of X-ray
and CT examinations for children during the diagnosis
and treatment of COVID-19 were assessed and the
dependence of the number of examinations and the total
radiation risk for one patient on the severity of the disease
was analyzed. Sufficient grounds to assert if the severity
of the course of the disease is associated with radiation
risks from the performed CT examinations have not been
received.
Keywords: chest imaging, computed tomography,
radiation risk, children, COVID-19
1. Introduction
Computed tomography (CT) is used to diagnose the
coronavirus disease COVID-19 along with the reference
standard analysis of respiratory tract samples using next-
generation sequencing methods or reverse transcription
polymerase chain reaction methods. In the early stages of
the disease and with minimal clinical manifestations, on
the chest X-ray, there may be no focal changes, and
therefore, this method has low sensitivity. In addition, at
the initial stages of the disease, lesions in the lungs appear
as "ground glass", which is not sensitive for radiography
[1]. At the same time, computed tomography is a more
highly sensitive method of investigation for viral
pneumonia. Although for the follow-up of the patient,
chest x-ray may be recommended [2-4], in accordance
with Russian guidelines [5, 6], to assess the dynamics of
the process of lung damage, it is necessary to use only
one type of examination. In addition, in critically ill
patients, immediate CT may be mandatory for diagnosis
and assessment of disease severity.
Although COVID-19 usually causes more severe
symptoms in older patients, the number of younger
patients may increase in the future. However, in children,
the CT findings are generally mild and due to its high
radiation burden, the exact role of early chest CT imaging
remains unknown [7]. The risk of developing radiation-
induced cancers is higher for children. Although repeat
examinations are not required for most patients, patients
with severe and progressive symptoms may have CT
examinations repeatedly to monitor pulmonary changes.
Consequently, there is a need to assess the radiation doses
to children for the possibility of subsequent optimization
of such examinations, as well as the assessment of
radiation risks, especially for multiple examinations.
The aim of the study was to assess the effective doses and
radiation risks of X-ray and CT examinations for children
during the diagnosis and treatment of COVID-19, as well
as to analyze the dependence of the number of
examinations and the total radiation risk for one patient
on the severity of the disease.
2. Materials and methods
The study used the data of X-ray studies of 71 children
admitted to the clinic of the St-Petersburg State Pediatric
Medical University with suspicions of COVID-19, 58
children of them underwent 104 X-ray examinations, and
30 CT scans were taken for 22 children. One patient
could undergo both several of the same type, as well as a
combination of X-ray and CT examinations.
All patients were divided into five age groups of children:
newborns (<0.5), 0.5-2, 3-7, 8-12 and 13-18 years old -
with an average age of 0, 1, 5, 10 and 15 years
respectively. Anthropometric data for each age group
corresponded to mathematical anthropomorphic
phantoms [8] and were taken as characteristics of a
"standard patient" in each age group to collect typical
treatment regimens and calculate doses.
43

I. Shatskiy et al. / Medical Physics in the Baltic States 15 (2021) 43-46
The input physical parameters for calculating organ
doses and effective dose of the patient for X-ray devices
were radiation output of the device, filter thickness and
material, voltage at the tube anode, exposure, distance
from source to receiver, size of the irradiation field,
geometry of irradiation, for CT – CTDI, tube anode
voltage, exposure, pitch, collimation, DLP, effective
diameter of the target area.
The absorbed doses in organs and effective doses were
calculated for X-ray units using the PCXMC program for
each patient, and for CT using NCICT 3.0 for typical
study parameters. Both programs use the same
mathematical anthropomorphic phantoms [8] to model
the patient's body, which contain a set of 31
organs/tissues needed to calculate the effective dose
using tissue weighting factors from ICRP
Publication 103.
The subsequent calculation of lifetime attributive risks
according to the model given in Publication 103 of the
ICRP was carried out in accordance with the
methodology published in the article by Ivanov et al. [9].
The absorbed doses in organ were interpolated to 5 y age
bands corresponding to data available concerning the age
dependence of radiation risk. The final lifetime
detriment-weighted radiation risk detRp(A, G) was
calculated using the ratio of radiogenic incidence incRp(A, G) of organ O to detriment D from Table
A.4.18 [10]
A detailed methodology and conditions for calculating
doses and radiation risks are given in previous
publications [11-13].
The assessment of the severity (volume, area, extent) of
changes in the lungs in patients with suspected/known
COVID-19 pneumonia was carried out using an
"empirical" visual scale [6, 14]. It is based on a visual
assessment of the approximate volume of compacted
lung tissue in both lungs and consists of five groups:
1. Absence of characteristic manifestations (CT-0)
2. Minimum volume/prevalence <25% of lung volume
(CT-1)
3. Mean volume/prevalence 25-50% of lung volume
(CT-2)
4. Significant volume/prevalence of 50 - 75% of lung
volume (CT-3)
5. Critical volume/prevalence> 75% of lung volume
(CT-4)
3. Results and discussion
The median values of the effective dose for X-ray chest
examinations for all age groups are in the range of
0.09-0.13 mSv (Table 1). The highest values are
observed in the 0-4 age group. Effective doses for chest
CT scan were 3.21 mSv and 4.68 mSv for groups 5-9 and
15-19 years old, respectively.
The radiation risk for all types of examination for female
patients is several times greater than for male patients.
For X-ray studies for women, it ranges from 12.7310-6 to
27.6210-6, for men from 2.510-6 to 5.5210-6. The
minimum corresponds to the age group 10-14 years old,
and the maximum – to the group 0-4 years old. For CT,
the risk increases with age from 425.9710-6 for the 5-9-
year group to 434.3710-6 for 15-19 years.
Table 1. Effective doses (mSv) and radiation risks per
examination.
Age group
Examination
Effective dose
ICRP103 (mSv)
Radiation risk,
men, 10 6
Radiation risk,
women, 10 6
0-4 Chest X-ray 0.13 5.52 27.62
5-9 Chest X-ray 0.09 3.23 16.08
10-14 Chest X-ray 0.09 2.50 12.73
15-19 Chest X-ray 0.12 2.85 14.37
5-9 Chest CT 3.21 140.39 425.97
15-19 Chest CT 4.68 169.10 434.37
Comparison of the results with previous similar studies
in St. Petersburg [11-13] are presented in Figure 1. In
contrast to the practically unchanged risk values of X-ray
examinations for women of all age groups in previous
studies in St. Petersburg, in the current study, the risk
decreases with increasing age with a minimum at the age
group of 10-14 years. The largest difference between
studies in 2018 and 2020 is observed for the younger age
group 0-4, although the values for the other groups are
approximately the same. For men, the dependences of
risk on age are oppositely directed: in previous studies,
the risk increased unevenly with age, and in the current
one it decreases unevenly.
(a)
(b)
0
5
10
15
20
25
30
0-4 5-9 10-14 15-19
det
Rp(A
, M),
10
-6
Age, years
women 2018 women 2020
0
1
2
3
4
5
6
0-4 5-9 10-14 15-19
det
Rp(A
, M),
10
-6
Age, years
men 2018 men 2020
44

I. Shatskiy et al. / Medical Physics in the Baltic States 15 (2021) 43-46
(c)
(d)
Fig. 1. Radiation risks of chest X-ray (a, b) and CT (c, d)
examinations for children of both sexes in 2018 and
2020 in St. Petersburg
The current study has data for only two age groups, for
CT examinations, so it is difficult to fully judge the
relationship between risk and age. But the values for each
of the groups for both sexes are quite similar to results
from previous studies [15].
To determine the degree of influence of the severity of
the course of the disease on the number of studies and,
accordingly, radiation risks, a one-sided Kruskal-Wallis
analysis of variance of the total radiation risks from CT
examinations of the patient was carried out for the entire
period of hospitalization for each degree of lung damage.
Table 2. Medians of the number of examinations and the total
risks of a patient for CT scan, depending on age, gender and
severity of the course of the disease.
Age group
Sex severity of changes in the lungs
CT-0 CT-1 CT-2 CT-3
Number of examinations
5-9 w 2.00 2.00
5-9 m 1.00 2.00 2.00 2.00
15-19 w 1.00 2.00
15-19 m 2.00 3.00
Radiation risk. 10-6
5-9 w 851.94 851.94
5-9 m 140.39 280.77 280.77 280.77
15-19 w 434.37 868.73
15-19 m 338.19 507.29
The medians of the number of studies and the total risks
of a patient for CT scan depending on age and sex are
shown in Table. 2.
The results of the analysis for the entire sample of
patients (H = 9.7745, p = 0.0206) meet the criteria for
statistically significant differences between the groups of
lesions, and, consequently, the dependence of the number
of CT examinations and radiation risks on the severity of
the disease. But an additional multiple comparison of the
average ranks of all groups showed significant
differences only between CT-0 and CT-1. A more
detailed analysis of each age-sex subgroup of patients did
not reveal any statistically significant differences
between the groups of lesions in any of them (Table 3).
Table 3. Results of Kruskal-Wallis analysis of variance of the
total radiation risks from CT examinations for severity of lung
damage for entire sample of patients and each age-sex
subgroup.
severity of
changes in the lungs
severity of changes in the lungs
CT-0 CT-1 CT-2 CT-3
Entire sample of patients H =9.7745 p =0.0206
CT-0 - 0.0175 0.8283 1
CT-1 0.0175 - 1 0.7252
CT-2 0.8283 1 - 1
CT-3 1 0.7252 1 -
Age group 5-9, men H =5.0 p =0.1718
CT-0 - 1 1 0.3350
CT-1 1 - 1 1
CT-2 1 1 - 1
CT-3 0.3350 1 1 -
Age group 5-9, women H =0.25 p =0.6171
CT-0 - - - -
CT-1 - - 0.7237 -
CT-2 - 0.7237 - -
CT-3 - - - -
Age group 15-19, men H =2.0 p =0.1573
CT-0 - - - -
CT-1 - - 0.2207 -
CT-2 - 0.2207 - -
CT-3 - - - -
Age group 15-19, women H =4.0p =0.0455
CT-0 - 0.1573 - -
CT-1 0.1573 - - -
CT-2 - - - -
CT-3 - - - -
It is necessary to take into account the small size of the
age-sex subgroups, which can affect the accuracy of the
obtained results. Nevertheless, the current study has not
received sufficient grounds to assert that the severity of
the course of the disease is associated with radiation risks
from the performed CT examinations. In a systematic
review of the radiological characteristics of COVID‐19
in pediatric population [7], it was found that most
children with COVID-19 demonstrate similar
radiological manifestations as in adults, except for a
higher percentage of normal scans (26%). Pulmonary
0
100
200
300
400
500
600
0-4 5-9 10-14 15-19
det
Rp(A
, M),
10
-6
Age, years
women 2018 women 2020
0
50
100
150
200
250
0-4 5-9 10-14 15-19
det
Rp(A
, M),
10
-6
Age, years
men 2018 men 2020
45

I. Shatskiy et al. / Medical Physics in the Baltic States 15 (2021) 43-46
findings on pediatric imaging studies were often milder
compared to adults, probably indicating a milder
inflammatory response induced by COVID-19 in this
population. This may partly correlate with the results of
this study on the absence of a relationship between dose
and radiation risk of chest x-ray and CT examination and
the severity of the course of the disease.
However, it should be noted that higher incidence of
normal CT or frequent asymptomatic/oligosymptomatic
pediatric COVID-19 cases might also underline the
importance of early detection of the disease in this
specific population [7]. The results obtained allow to
conclude that it is necessary to take into account the
dependence on age and sex when assessing radiation
risks and especially the relationship between the severity
of the disease and the levels of exposure and radiation
risks.
Finally, the continuation of the study and an increase in
patients sample will allow to clarify the results and draw
more reliable conclusions.
4. Conclusions
Radiation risk for X-ray studies ranges from 12.7310-6 to
27.6210-6 for women andfrom 2.510-6 to 5.5210-6 for
men. The minimum corresponds to the 10-14 years age
group, and the maximum – to the group 0-4 years . For
CT, the risk increases with age, from 425.9710-6 for the
5-9-year group to 434.3710-6 for 15-19 years. The age
dependence of radiation risk for X-ray examinations
differs from the results of previous studies. The values
for each of the groups for both sexes for CT examinations
coincide quite closely with results from previous studies.
The current study has not received sufficient grounds to
assert that the severity of the course of the disease is
associated with radiation risks from the performed CT
examinations. The continuation of the study and an
increase in the sample of patients will allow to clarify the
results and draw more reliable conclusions.
5. References
1. Lee E, Yang J et al. Imaging profile of the COVID-19
infection: radiologic findings and literature review. Radiol
Cardiothorac Imaging 2020; 2(1)
2. Revel M.P., Parkar A.P., Prosch H., Silva M., Sverzellati
N., Gleeson F. European Society of Radiology (ESR) and
the European Society of Thoracic Imaging (ESTI). COVID-
19 patients and the radiology department - advice from the
European Society of Radiology (ESR) and the European
Society of Thoracic Imaging (ESTI) Eur Radiol. 2020 doi:
10.1007/s00330-020-06865-y.
3. Salehi S, Abedi A, Balakrishnan S and Gholamrezanezhad
A 2020 Coronavirus disease 2019 (COVID-19): A
systematic review of imaging findings in 919 patients Am.
J. Roentgenol. 215 87-93.
4. Lippi G, Simundic A and Plebani M 2020 Potential
preanalytical and analytical vulnerabilities in the laboratory
diagnosis of coronavirus disease 2019 (COVID-19) Clin.
Chem. Lab. Med. 58 1070–6.
5. Guidelines - features of clinical manifestations and
treatment of a disease caused by a new coronavirus
infection (COVID-19) in children. Version 2 (03.07.2020)
Ministry of Health of the Russian Federation, Moscow,
2020. – 74 p.
6. Interim guidelines "Prevention, diagnosis and treatment of
new coronavirus infection (COVID-19). Version 6
(approved by the Ministry of Health of the Russian
Federation on April 28, 2020).
7. Katal S, Johnston SK, Johnston JH, Gholamrezanezhad A.
Imaging Findings of SARS-CoV-2 Infection in Pediatrics:
A Systematic Review of Coronavirus Disease 2019
(COVID-9) in 850 Patients. Acad Radiol. 2020
Nov;27(11):1608-1621. doi: 10.1016/j.acra.2020.07.031.
Epub 2020 Jul 30. PMID: 32773328; PMCID:
PMC7392075.
8. Cristy M., Mathematical phantoms representing children of
various ages for use in estimates of internal dose. ORNL,
NUREG/CR-1159, ORNL/NUREG/TM-367 (1980).
9. Ivanov, V., Tsyb, A., Mettler, F., Menyaylo, A. and
Kashcheev, V. Methodology for estimating cancer risks of
diagnostic medical exposure: with an example of the risks
associated with computed tomography. Health Phys. 103
(6), 732-739 (2012).
10. International Commission on Radiological Protection.
Recommendations of the International Commission on
Radiological Protection. ICRP Publication 103. Ann ICRP,
37 (2-4) (2007).
11. Shatsky I.G. Risk assessment of medical exposure in X-ray
examinations of children. Radiatsionnaya Gygiena =
Radiation Hygiene. 2017;10(2):31-42. (In Russ.)
https://doi.org/10.21514/1998-426X-2017-10-2-31-42.
12. Balonov M., I. Shatsky Evaluation of radiation risks from
medical exposures: Organ dose approach versus effective
dose approach. J. Radiation Protection 187, European
Comission Radiation Protection and nuclear Safety: 45-59
(2018).
13. Ilia Shatskii. Use of organ dose approach versus effective
dose approach in risk assessment for the common
radiographic X-ray examinations of children. Proceedings
of the 13th international conference on Medical Physics in
the Baltic States 2017. 9 – 11 November, 2017: 104 – 109.
14. Shohei Inui, Akira Fujikawa, Motoyuki Jitsu,
NaoakiKunishima, Sadahiro Watanabe, Yuhi Suzuki,
Satoshi Umeda, and YasuhideUwabe Chest CT Findings in
Cases from the Cruise Ship Diamond Princess with
Coronavirus Disease (COVID-19) Radiology:
Cardiothoracic Imaging 2020 2:2.
15. Federal Service for Supervision of Consumer Rights
Protection and Human Welfareof the Russian Federation
MR 2.6.1.0215-20. 2.6.1. Ionizing radiation, radiation
safety. Assessment of radiation risk in patients during X-
ray and radiological studies. Methodical recommendations.
46

MEDICAL PHYSICS IN THE BALTIC STATES 15 (2021)
Proceedings of International Conference “Medical Physics 2021”
4 – 6 November 2021, Kaunas, Lithuania
GAMMA SPECTROSCOPIC ANALYSIS OF 18 MeV PHOTONS ACTIVATED
RADIOISOTOPES IN SIEMENS ONCOR IMPRESSION 3D LINAC HEAD AND
ITS DECOMMISSIONING EXPERIENCE
Aurimas KRAULEIDIS1,2, Vanda ANDRIJAITIENĖ1 1Klaipėda University hospital 2Department of Physics, Kaunas University of Technology
[email protected]; [email protected]
Abstract: Medical linear accelerators (linacs) are the
most used technique to treat various forms of cancers in
patient by different energies megavoltage photon beams.
However, product of the high-energy photons (>8 MeV
– 10 MeV) generated by a linear accelerator is activation
of components within the machine itself. The activation
products cause regulatory and radiological challenges
during the operation of the accelerator as well as when it
is time for final decommissioning. The responsible
authorities for radioprotection require a measurement of
the activity of the linacs, when hospital is dismantling
and/or replacing their equipment.
The purpose of this work was to measure residual activity
and to identify the remaining radioisotopes present in the
Siemens Oncor Impression 3D linac components. Based
on preliminary results decommissioning case was made.
Keywords: high-energy photons, spectroscopy,
decommissioning.
1. Introduction
The techniques and equipment used for radiation
treatments of cancer have become increasingly
sophisticated. The application of linear accelerator for
cancer treatment has allowed for radiation to be delivered
at higher energies and with greater penetration and
accuracy than ever before. With the introduction of
techniques such as IMRT and VMAT, the energy of the
radiation produced by these machines can reach energies
of 20 MeV [1,2].
In radiation therapy with photon beams (E > 10 MeV),
neutrons are generated thorough photonuclear reactions
of photons with nuclei of high atomic number materials
constituting the linac head and the beam collimation
system. The most common photonuclear reaction is the
(γ,n) in which a high energy photon will interact with the
target nuclei resulting in the emission of a neutron [3].
This neutron will travel a distance and will lose energy
through interaction with the surrounding material until it
undergoes an (n,γ) interaction which results in the
activation of a material outside of the initial photon beam.
This photoactivation include linac components, patient
support systems, treatment accessories, building
material, air and the patient [4,5]. The linear accelerator
head components such as the target, primary collimators,
flattening filter, secondary collimator, and multileaf
collimators (MLCs) are made of high Z materials. When
high energy photons interact with high Z material, the
probability of production of activated nuclei is
significant. These high Z materials (lead and tungsten)
are found principally in the flattening filters and in the
collimator system. Most of the activation products in
tungsten will be short lived 187W (T1/2 = 23.7 h) and 181W
(T1/2 = 121.2 d), while in lead alloys the content of
antimony gives rise to 121Sb (short lived) and 124Sb (T1/2
= 60.2 d). Gold may be present in foils or monitor
chambers, leading to the production of 198Au (T1/2 = 2.7
d) [6]. Activation of the chemical elements of these
materials leads to unstable isotopes, decaying with very
different half-lives. Most of the activated radioisotopes
are decaying with short half-lives, in the range of hours
or days, but some other radioisotopes have half-lives of
several years [7].
In 2004, a study of the induced activity of various
components of an 18 MV Siemens KDS linac was
conducted [8]. Activation products were found in the
target, window wave-guide, flattening filter, and wedge.
Typical radionuclides produced by the photoactivation
process in components are summarized in Table 1.
The activities found in Table 1. were estimated from the
set of measurements the team made seven days after the
accelerator’s last clinical use. It was determined that the
most activated component of the linear accelerator head
was the target.
Other author analyzed the long term activation produced
in the treatment head of a 15 MV Mevatron Siemens 77
medical linac one year after its last clinical use. Ten
different components of the treatment head were
analyzed for radionuclide activity including, accelerating
waveguide terminal, two external shields, target sledge,
scattering foil support, sledge stirrup, primary photon
47

A. Krauleidis / Medical Physics in the Baltic States 15 (2021) 47-52
collimator, flattening filter, and jaw. From these
measurements it was shown that one year after the
medical linacs last clinical use, the bulk of the material
exhibited a specific activity of less than 1 Bq/g. Common
radioisotopes found in the materials included 54Mn, 57Co, 58Co, 60Co, 65Zn, 181W [9,10].
Table 1. Activation products found in an 18MV Siemens KDS
linac
Also a study was conducted into the undesirable
photonuclear, electronuclear, and neutron capture
reactions that take place after high energy therapeutic
beam emission. A Varian Clinac-2300 and a Primus
Siemens medical linear accelerator were measured and
the following radioisotopes were found: 187W, 56Mn, 28Al, 57Ni, 38Cl, 57Co, 196Au, and the neutron activation of 1H
[11, 12,13].
There are a variety of positive and negative issues
associated with the activation of materials through
photonuclear reactions. Materials activated in a linear
accelerator can cause issues to arise during
decommissioning of the machine as workers may be
exposed to radiation from the activation products and
also can potentially contribute to additional dose to
patients and staff [14,15]. A number of studies have
identified various radioisotopes produced from
photoactivation, but few studies have quantified the total
activity from these activated isotopes.
Accelerators decommissioning projects started in
technical literature and a few detailed decommissioning
reports from 1980s were published. Over time,
documentation on decommissioning planning, costs and
lessons learned became available to the international
community. In 1999, the European Commission issued
the report Evaluation of the Radiological and Economic
Consequences of Decommissioning Particle
Accelerators is the first publication that systematically
provides information and guidance on accelerator
decommissioning that can be usefully applied worldwide
[16].
In 2020 IAEA published Decommissioning of particle
accelerators [17]. This information can be used as the
basis of costing for waste and materials management, but
predicted activities need to be verified for each of the
individual pieces by dismantling the equipment after they
have been checked for activation. Suitable
instrumentation for initial screening includes portable
contamination monitors, and for more detailed
assessment of materials high resolution portable gamma
ray spectrometry hyper-pure germanium (HPGe) systems
can greatly assist in accurately identifying and
quantifying the radionuclides present. Dose and dose rate
meters can be used to evaluate the emission from
components and to assess the order of magnitude of
activation, according to the gamma ray emission constant
for the principal radionuclide identified [18].
The benefits of early planning for future
decommissioning include the establishment of optimized
procedures to minimize the exposure of workers and the
public to radiation, the provision of maximum levels of
protection of the environment necessitated by the
decommissioning activities, the minimization of
radioactive waste, and the timely release of the facility or
site from regulatory control at the end of
decommissioning activities. Other benefits of
considering decommissioning of a particle accelerator at
the early stage of operation arise from the establishment
of suitable record keeping arrangements, knowledge
retention to facilitate decommissioning and provision of
both adequate financial and other necessary resources for
when shutdown occurs [18].
The initial decommissioning plan needs to be reviewed
and updated periodically during operation. Changes in
the design of the facility, the introduction of different
waste management arrangements or alternative disposal
routes, changes in the overall financial status or specific
modifications of the equipment or building that will
impact the decommissioning plan. Revisions or
amendments to the decommissioning plan need to also be
made during the operational lifetime of the facility to
reflect advances in operational experience, new safety
requirements, or the introduction of improved
technology, as well as changes to the decommissioning
strategy and proposed end state that have been agreed
with the regulatory body. Such revisions or amendments
need to be comprehensively documented and then stored
in a suitable record retrieval system so that they will be
readily available to facilitate future decommissioning.
The plan also needs to be reviewed and revised when
significant accidents or incidents occur that could affect
facility characteristics [19].
The final decommissioning plan need to be submitted to
the regulatory body for approval prior to commencement
of decommissioning. All applicable requirements for the
accelerator need to be appropriately maintained unless
approved by the regulatory body on the basis of reduced
hazards. In preparation for decommissioning, all
operational waste (e.g. used targets, components of the
accelerator or radioactive materials for ion sources or
guns) will need to be removed and properly managed.
The main objectives of waste management within the
context of decommissioning of accelerators are to:
1. Minimize the quantities of radioactive waste at all
stages of decommissioning;
48

A. Krauleidis / Medical Physics in the Baltic States 15 (2021) 47-52
2. Prevent the combination of waste of different
categories (e.g. radioactive waste, hazardous chemical
waste);
3. Comply with all applicable regulations in the handling,
storage, processing and disposal of the waste.
2. Methods and materials
Linear accelerator Siemens Oncor Impression 3D has
been in operation at Klaipeda University Hospital from
2010. The accelerator was in regular use for cancer
treatment until 6 April 2021, with just minor periods
when it was not operational owing to shutdown and
planned maintenance, upgrading or repairs. Photon beam
energies used for cancer treatment ware 6 and 18 MeV.
At the beginning of operation, the machine had a high
workload for cancer treatment, about 120 patient per day.
On April 2021, the linac was shut down and
decommissioned, because new technologies and methods
of cancer treatment have become available and the
existing machine cannot be adapted to incorporate them.
The normal life time of a device of this kind is between
10 and 20 years.
Before linac decommissioning, the following was done:
1. Final decommissioning plan of the facility was
prepared according to national legislation. 2. Radiation protection programme and physical
security description were supplemented. 3. Assessment of the quality and effectiveness of the
measure was reviewed to ensure the physical
security system. 4. Linac dismantling plan was prepared. 5. A contract with the radioactive waste manager for
radioactive material disposal was concluded. All essential information and documents for the
decommissioning were accepted by responsible
authorities and permission was granted to carry out
decommissioning.
The next stage was to instruct all personnel working
within the area on the radiation protection measure and
work safety procedures and confirmed in the protocol.
The dismantling of the accelerator started on 6 April
2021 and was finished on 8 April 2021. The qualified
company engineers had permission granted under the
Lithuania radiation protection center to work in facilities
to dismantling linacs. First of all, they carried out the
heavy duty dismantling and disposal of inactive waste.
According to the radiation protection programme all
engineers had digital personal radiation dosimeters
PM1703MO-I BT to evaluate the received exposure
dose. (fig. 1).
Fig.1 Personal radiation detector
While dismantling the machine hospital medical
physicist continuously measured radiation background in
the working area and also separated the activated parts of
the machine using different kind of measurement
equipment. Dose rate limit to separate parts was 0,2
µSv/h. For the γ dose rate measurement, medical
physicist used portable multifunction dosimeter Atomtex
AT 1123. Surface contamination was measured with
portable contamination monitor CoMo 170, and β
radiation was measured with RadEye B20 dose rate meter
(Fig. 2).
(a) (b) (c) Fig. 2 γ radiation dosimeter (a), multi-purpose survey meter (b)
and portable contamination monitor CoMo 170 (c)
According to meter data, activated linac parts were
identified including vacuum window of the accelerating
wave-guide, bending magnet core, the target and the
flattening filter(Fig. 3).
(a) (b) Fig.3 Activated linac parts, vacuum window of the accelerating
wave-guide, the target and the flattening filter (a), bending
magnet core (b)
Target consist of 196Au and 54Mn alloy. Flattening filter
is made of stainless steel. The chemical composition of
the main elements is the following: Fe 67.8%, Cr 19.0%,
Ni 8.0%, Mn 2.0%, S 2.0%, Si 1.0%, C 0.12%, P 0.05%.
For example, multileaf collimator driving engines was
not activated, dose rate was below natural background.
Total mass of activated parts was 158 kg.
To ensure safety and security, activated linac head parts
were packaged in two 3 mm thickness steel transport
boxes, in compliance with the regulations, marked with a
sign of ionizing radiation and temporary storage in the
department specific room with a security alarm, video
surveillance system and limited access. Additionally,
dose rate measurements were performed on storage-
assisted radioactive packages. Packages dimensions were
280 x 460 x 100 (mm) and 345 x 310 x 220 (mm) (Fig.4).
49

A. Krauleidis / Medical Physics in the Baltic States 15 (2021) 47-52
Fig.4 Radioactive material transporting boxes
At the termination of dismantling activities, on 8 April
2021, accumulated dose to the engineers was confirmed
to be consistent with the working protocol and was added
to their occupational exposure protocol. The
disassembled linac was taken over completely by
hospital engineering division as confirmed in the written
procedure. The identified inactive parts were placed for
recycling.
A Canberra Falcon 5000 High Purity Germanium
(HPGe) detector was used to detect isotopes by gamma
rays emitted from the activated parts (Fig. 5). It is
portable and contains an ultra-low noise pulse tube
cooling system capable of electrical cooling to operating
temperatures of approximately -170 °C [20]. Detector
operation was conducted through wired communication
with an external tablet running Windows XP with spectra
analysis support of Canberra’s Genie 2000 and Fitzpeaks
spectroscopy software. Gamma spectroscopy was
performed by regulator body according to the agreement.
Fig.5 A Canberra Falcon 5000 (HPGe)
After the characterization of radionuclides, radioactive
waste manager removed activated materials from the
hospital to Ignalina nuclear power plant storage decay.
The responsibility of the hospital for the
decommissioning project ended with the settlement of
the bill to the radioactive waste manager. The cost for the
radioactive waste disposal depends on isotopes spectrum,
activity of isotopes and total weight of activated
materials.
3. Results and discussion
3.1 Accumulated dose
Based on personal radiation dosimeters data,
accumulated dose to engineers was not higher than
background level. Table 1 summarizes measured
cumulative equivalent dose.
According to our results, company engineers did not
received increased radiation exposure dose from
radioactive materials. Radiation safety was ensured and
radiation protection requirements were complied with.
Table 1. Engineers cumulative equivalent dose
Engineer Working time, h Cumulative
equivalent dose, µSv
1 27 3,25
2 27 2,83
3 27 3,12
4 27 2,25
3.2 γ , β dose rate and surface contamination
measurements
Dose rate and surface contamination results are shown in
table 2. All measurements were done by previously
mentioned devices, which are calibrated and
metrologically verified.
Table 2. Measurements results
Measured point Dose rate, µSv/h
Surface
contami
nation,
Bq/cm2
γ β -
Linac gantry: 5 cm 1 m 5 cm -
a) left side 0,12 0,1 - -
b) right side 0,08 0,07 - -
c) above 0,13 0,1 - -
d) in front 0,14 0,1 - -
e) below (field
closed) 0,1 0,09 - -
e) below (field
open) 0,24 0,1 1,47 -
Background at
room after
dismantling
0,1 - -
Bending magnet 1,85 - 0,4
Flattening filter
with accelerating
wave guide
window
1,36 2,58 0,4
Target 6,1 - 0,4
Background at
storage room 0,11 - -
Activated parts
packed in
transporting box
Nr.1
<0,1 - <0,4
Activated parts
packed in
transporting box
Nr.2
<0,1 - <0,4
Fig 6. Measurements points of linac gantry
50

A. Krauleidis / Medical Physics in the Baltic States 15 (2021) 47-52
Dose rate emission levels from activated components
have been measured and have been found to be in the
range of 0,08–0,24 μSv/h at 5 cm from the linac head and
in the range of 0,07–0,1 μSv/h at 100 cm after 3 days in
operation. Dose rates measured after dismantling was
higher owing to the lack of shielding provided by the
head. The highest activation levels were found in target,
flattening filter and bending magnet with dose rates up
to 6,1 microsieverts per hour at a distance of 5 cm. Also,
β dose rate up to 2,58 μSv/h were measured from
accelerating wave guide window. Based on the results,
no surface contamination were observed.
3.3 Gamma – ray spectroscopy
Two total measurements were conducted and the gamma
spectra was analyzed. First, it was measured for the
activated accelerating wave-guide vacuum window, the
target and the flattening filter parts. The gamma spectrum
measured by a spectrometer showed gamma peaks
corresponding to several activation products (fig. 7).
Fig 7. Gamma spectrum of the accelerating wave-guide vacuum
window, the target and the flattening filter
Spectrum analysis revealed dominant radioisotopes 51Cr, 54Mn, 57Co, 58Co, 60Co, 181W, 196Au and 198Au, of which
the highest peak of spectrum corresponded to 181W
electron capture decay to 181Ta which results in x-ray
photons. The spectrum showed the annihilation peak at
511 keV as a result of beta plus decay from 54Mn.
The characteristics of each radioisotope are displayed in
table 3.
Table 3. Radioisotopes measured in the accelerating wave-
guide vacuum window, the target and the flattening filter
Rad
io
isoto
pe
Activ
ity
MB
q
Un
certainty
MB
q
Peak
energ
y
keV
Half-life
51Cr 0,11 0,02 320,1 27,7 d 54Mn 0,1 0,01 835 312,3 d 57Co 0,24 0,04 122,1 271,8 d 58Co 0,021 0,002 811 70,8 d 60Co 0,018 0,001 1173,5/1
332,8
5,3 y
181W 9,8 1,2 EC (56,3
to 67,1)
121,2 d
196Au 0,19 0,01 84,6 6,2 d 198Au 0,0036 0,0001 411,9 2,7 d
The gamma spectrum of bending magnet core is shown
in Figure 8. Table 4 summarizes the measured elements,
essentially 54Mn, 57Co, 58Co, 60Co, 124Sb and 59Fe. The
results showed that the dominant activation products are 54Mn, 60Co and 59Fe radioisotopes.
Fig 8. Gamma spectrum of bending magnet core
Table 4. Radioisotopes measured in bending magnet core
Rad
io
isoto
pe
Activ
ity,
MB
q
Un
certainty
, MB
q
Peak
energ
y,
keV
Half-life
54Mn 0,015 0,002 835 312,3 d 57Co 0,002 0,001 122,1 271,8 d 58Co 0,0011 0,0004 811 70,8 d
60Co 0,031 0,002 1173,5/1
332,8 5,3 y
124Sb 0,004 0,001 602,8 60,2 d
59Fe 0,018 0,0001 1099/129
1,6 45 d
As already mentioned above, activation products are
generated when the photoneutrons interact with the
components of the linac head. The most probable
reactions produced with a high energy photon beam are
photonuclear (γ,n) reactions. (γ,2n) reactions occur
preferably at higher energies. When determining the
activity of each radioisotope, it was found that dominant
activation product were 54Mn, 181W and cobalt isotopes.
The highest observed radioactivity was 9,8 MBq of 181W.
Based on spectrum analysis, almost all identified isotopes
are long-lived, where half-life varies from few days to
several years. For example, the natural Mn in the filters
was activated through the reaction: n+55Mn →56Mn + γ,
but 56Mn half-time is 2,58 h and thus was not measured
since the last operation of linear accelerator was 10 days
before gamma spectroscopy measurement. Other studies
analysis showed, that most dominant radioisotopes after
irradiation are 28Al and 24Na with half-time 2,3 min and
15 hour respectively.
Based on previous studies, it has been shown that the
treatment head parts and target are the primary source of
induced activity.
4. Conclusions
In the current study, decommissioning of linear
accelerator Siemens Oncor Impression 3D was carried
out. It is necessary to mention that one of the most
important steps was the decommissioning plan
preparation to ensure smooth running of the process.
Based on occupational doses, gamma and beta dose rate
measurements we can assume that radiation protection
was ensured. We have determined the spectra of
activated linac parts and minimized the amount of low
51

A. Krauleidis / Medical Physics in the Baltic States 15 (2021) 47-52
activity radioactive materials to be stored in national
facility. Dominant radioisotopes were 54Mn, 57Co, 58Co, 60Co, 181W which corresponded to the literature.
Acknowledgements
The authors would like to thank the Radiation protection
center specialists for their assistance with gamma
spectroscopy data collection.
5. References
1. Fischer, H.W., Tabot, B.E., Poppe, B., Activation processes
in a medical linear accelerator and spatial distribution of
activation products, Phys. Med. Biol. 51 24, 2006.
2. Amgarou A., Lacoste V., Martin A., Experimental
characterization of the neutron spectra generated by a high-
energy clinical Linac. Nuclear Instruments and Meth-ods in
Physics Research A 629: 329-336, 2011.
3. Khan, F.M., Gibbons, J.P. Khan’s The Physics of Radiation
Therapy (5th ed.). Philadelphia, PA: Lippincott Williams &
Wilkins, 2014.
4. Konefal A., Orlef A, Marcin D., Zbigniev M., Correlation
between radioactivity induced inside the treatment room and
the undesirable thermal/resonance neutron radiation produced
by linac, 2008 Physica Medica 24(4):212-218.
5. Fujibuchi, T., Induced radioactive nuclides of 10-MeV
radiotherapy accelerators detected by using a portable HP-Ge
survey meter, Radiat. Prot. Dosim. 148 2, 2012, 168–173.
6. Garnett, R.W., Sheffield, R.L., Accelerator applications in
energy and security, Reviews of Accelerator Science and
Technology, Vol. 8 World Scientific Publishing Company,
Singapore, 2015.
7. Wen-Shan L, Sheng-Pin Ch, Lung-Kwang P, Hsien-Chun T,
Chien-Yi Ch. Thermal neutron fluence in a treatment room with
a Varian linear accelerator at a medical university hospital.
Radiation Physics and Chemistry 80: 917-922, 2011.
8. Roig M, Panettieri V, Ginjaume M, Sanchez-Reyes A.
Photonuclear isotope characterization of a Siemens KDS 18
MV linac head, 2004, Physics in Medicine and Biology
49(14):N243-6.
9. Konefal A., Orlef A., Laciak M., Ciba A., Szewczuk M.
Thermal and resonance neutrons generated by various electron
and X-ray therapeutic beams from medical linacs installed in
Polish oncological centers. Reports of Practical Oncology and
Radiotherapy, 2012.
10. Brusa, A., Cesana, A., Stucchi, C., Terrani, M., & Zanellati,
F. Long term activation in a 15 MeV radiotherapy accelerator.
Medical Physics, 35(7), 2008 3049-3053.
11. Konefal, A., Orlef A., Bieniasiewicz M., Measurements of
neutron radiation and induced radioactivity for the new medical
linear accelerator, the Varian TrueBeam. Radiation
Measurements Vol 86, 8-15, 2016.
12. Howard, S., Starovoitova, V.N. Target optimization for the
photonuclear production of radioisotopes. Applied Radiation
and Isotopes, 96, 2015, 162-167.
13. Fischer, H.W., Tabot, B., & Poppe, B. Comparison of
activation products and induced dose rates in different high-
energy medical linear accelerators. Health Physics, 2008, 94(3),
272-278.
14. Weber P., Vuilleumier J., Tamburella C., Linac activation
of radioisotopes and underground gammaspectrometric
analyses. Materials Science, Medical Physics, 2017.
15. Isra Israngkul-Na-Ayuthaya, Sivalee Suriyapee and
Phongpheath Pengvanich, Evaluation of equivalent dose from
neutrons and activation products from a 15-MV X-ray LINAC,
Journal of Radiation Research, Vol. 56, No. 6, 2015, pp. 919–
926.
16. International Atomic Energy Agency, Decommissioning of
Facilities, IAEA Safety Standards Series No. GSR Part 6,
IAEA, Vienna, 2014.
17. International Atomic Energy Agency. Decommissioning of
particle accelerators, 2020. IAEA nuclear energy series, ISSN
1995–7807 ; no. NW-T-2.9
18. International Atomic Energy Agency, Safety Assessment
for Facilities and Activities, IAEA Safety Standards Series No.
GSR Part 4 (Rev. 1), IAEA, Vienna, 2016.
19. Krammar, M., The update of the European strategy for
particle physics, Physica Scripta, 2013, T158.
20. Canberra Industries., Falcon 5000: User Manual. Meriden,
CT: Canberra Industries and effects, 2011.
52

MEDICAL PHYSICS IN THE BALTIC STATES 15 (2021)
Proceedings of International Conference “Medical Physics 2021”
4-6 November 2021, Kaunas, Lithuania
A NEW MONTE CARLO ALGORITHM TO SIMULATE VIRTUAL SOURCE
MODEL ON AN ELEKTA VERSAHD LINAC
Sumeyra CAN1, Didem KARACETIN2, Niyazi MERIC3 1Ankara University Institution of Nuclear Sciences; 2Basaksehir Çam and Sakura City Hospital Radiation
Oncology; 3Ankara University Institution of Nuclear Sciences [email protected]; [email protected]; [email protected]
Abstract: The aim is to develop a new Monte
Carlo code namely MC-SCAN to simulate virtual
source model. The dose calculation via MC-SCAN and
experimental measurements were done. The difference
between MC-SCAN and experimental measurement is
0.4% and 1.62% for absolute dose and TPR20/10
respectively. For output factors, the difference between
both approaches is < 4%. The MC-SCAN engine can be
used to simulate virtual source model, however, further
investigation needs to be done to develop this algorithm.
Keywords: Beam modelling, Elekta VersaHD, Monte
Carlo simulation, Virtual Source Model
1. Introduction
The Monte Carlo simulation has been accepted as an
accurate tool to calculate the radiation dose for radiation
therapy. Knowing detailed phase space information
including energy, type and angular distribution of
particles provide to accurately predict radiation dose
through Monte Carlo method for different geometry [1-
3]. Additionally, direct measurement of PS information
for clinic beam is not possible due to the high-level
intensities of radiation at the medical linear accelerator
(LINAC) exit window [4-6]. Moreover, some limiting
factors - e.g. the availability of suitable detectors -
prevent direct measurement of PS information;
therefore, PS information which is mandatory for
patient dose calculation is provided by Monte Carlo
(MC) - based treatment planning system (TPS) such as
Monaco TPS [7-10].
A Monaco beam model, i.e., a “Virtual Source Model
(VSM),” includes beam components as primary beam
photons, head scatter photons and electron
contamination sources [11, 12]. In VSM, the particles
coming from different parts of the accelerator are
treated as if they were coming from these
aforementioned virtual sources. To simulate full MC
simulation of LINAC head information, dosimetric
measurements including square/rectangular open field
data, percent depth dose, profiles and output factors
should be provided [13]. The advantage of virtual
source model-based MC simulation minimizes the
difference between the calculated dose and the
measured one [14-17].
In this study, it was aimed to develop a new Monte
Carlo algorithm namely MC-SCAN as an alternative
tool to simulate virtual source model on Elekta VeraHD
LINAC.
2. Materials and Methods
2.1. Experimental measurements for virtual source
model
Before the experimental measurements, the absolute
dose calibration was done per monitor unit (MU) for
10x10 cm2 field size at 100 cm SSD and the depth of 10
cm. The geometry at which the absolute dose was
calibrated turned to be 1 Gy/100 MU. Beam data
collection to model virtual source model of Monaco
TPS was done based on the manufacturer instructions
and AAPM TG-106. A PTW BEAMSCAN (PTW,
Freiburg, Germany) water phantom was used to perform
all point dose, percent depth dose (PDD), tissue
phantom ratio (TPR20/10), point dose measurements. All
PDD measurements were acquired at 90 cm source to
surface distance (SSD) for field size from 2x2 cm2 to
40x40 cm2. Additionally, all point dose measurements
in water were measured at 90 cm SSD and at the depth
of 10 cm. A PTW PinPoint chamber (active volume =
0.016 cm3) was used for the field sizes ≤ 5x5 cm2
whereas PTW Semiflex 3D chamber (active volume =
0.07 cm3) was used for the field sizes ≥ 5x5 cm2. For
point dose measurements, an open field of 10x10 cm2 at
90 cm SSD was created for testing purposes and the
calculation was made with voxel-based Monte Carlo
algorithm through Monaco TPS Version 5.51.
Prescription dose was 200 cGy per fraction and 100 MU
was delivered for the 6 MV photon energy. In order to
represent the location of the ionization chamber, an
53

S. Can et al. / Medical Physics in the Baltic States 15 (2021) 53-56
interest point was added in the Monaco plan. PTW
Farmer type ionization chamber (active volume = 0.6
cm3) was utilized for point dose measurements along
with PTW Unidose Webline Electrometer.
2.2. Monte Carlo simulation (MC-SCAN code)
In Monte Carlo simulation, random number generator is
the most crucial part. At this stage, the Mersenne
Twister algorithm was implemented to generate large
supplies of random number. The main reason to apply
this algorithm is the random number period has 219937 -1
iteration and the generated random numbers repeat one
time within this period. Since the source dimensions are
very small compared to the source to surface distance
(SSD), the source is modelled as a point source. The
probability of a γ-ray from an isotropic point source is
the same for all directions. The direction of a γ-ray
emitted from the source is determined in spherical
coordinates by the polar angle (θ) and the azimuth angle
(φ). The polar angle of the direction of the γ-ray emitted
from the point source varies in the range 0 ≤ θ ≤ π, and
the azimuth angle varies in the range 0 ≤ φ ≤ 2π. In MC-
SCAN dose engine, the γ-ray directions were
determined randomly. The coordinates of the γ-rays,
whose direction was determined, to the phantom surface
were calculated with the following equation.
𝛼 = 𝑠𝑖𝑛𝜃𝑥𝑐𝑜𝑠𝜑 , 𝛽 = 𝑠𝑖𝑛𝜃𝑥𝑠𝑖𝑛𝜑 , 𝛾 = 𝑐𝑜𝑠𝜃 (1)
𝑥0 = 𝑟𝛼, 𝑦0 = 𝑟𝛽, 𝑧0 = 𝑟𝛾 (2)
where r = SSD/cosθ. If the calculated surface
coordinates are in field size and provide the conditions
that -A/2 ≤ x0 ≤ A/2 and -B/2 ≤ y0 ≤ B/2 where A and B
field size, the photon was followed otherwise new
photon which has a new energy and direction was
sampled. After determining that the photon was in the
water phantom, the atom photon interactions were
modelled based on mean free path. If the interaction was
photoelectric effect, it was accepted that the γ-ray
transfers all its energy to the medium and a new photon
tracking was started. When the interaction was Compton
scattering, it was assumed that the γ-ray was scattered at
θ angle and the scattering angle was simulated with
Klein-Nishina [18] given by the following equation.
𝑑𝜎𝐾𝑁
𝑑𝛺=
𝑟𝑒2
2[1 + 𝑘(1 − 𝑐𝑜𝑠𝜃)]−2[1 + 𝑐𝑜𝑠2𝜃 +
𝑘2(1−𝑐𝑜𝑠𝜃)2
1+𝑘 (1−𝑐𝑜𝑠𝜃) (3)
𝑘 =𝐸
𝑚𝑐2 (4)
where dΩ is 2πsinθdθ and re is electron radius. Although
there is no energy transfer to the medium in Rayleigh
scattering, it was also considered in MC-SCAN code to
simulate all interactions. For Rayleigh differential
scattering cross section, Thomson scattering was
applied [19].
𝑑𝜎𝑅
𝑑𝛺= 𝑟𝑒
2
2[1 + 𝑘(1 − 𝑐𝑜𝑠𝜃)[𝐹(𝑞, 𝑍)]
2 (5)
As known, pair production is observed, when the photon
energy exceeds a certain threshold energy which is 1022
keV. At this time, pair production cross section was
calculated based on Bethe-Heitler formula [20]. The
energy absorbed in the phantom as a result of all
interactions was recorded and the absorbed dose was
calculated as a ratio of the energy to mass. The
geometry which was used to perform all experimental
measurements were used to calculate absolute dose,
output factors, point dose measurements and percent
depth dose. Simulated phantom geometry is shown in
Fig.1.
Fig.1. Simulated water phantom geometry
The calculated results through MC-SCAN Monte Carlo
dose engine were compared with the experimental
results to evaluate MC-SCAN code. MC-SCAN dose
calculation photon transport logic was shown in Fig.2.
3. Results
3.1. Absorbed dose comparison
Before point dose measurements, the absolute dose
calibration was done per MU for 10x10 cm2 field size at
100 cm SSD and 10 cm depth and the same geometry
was used for MC-SCAN code. The difference between
MC-SCAN (101.08 cGy ± 0.23) and measured data
(100.67 cGy ± 0.05) for absolute dose is 0.4%. The
planned dose with Monte Carlo algorithm through
Monaco 5.51 TPS was 80.50 cGy, the measured dose
was 79.90 cGy and the calculated dose via MC-SCAN
was 78.18 cGy. The difference Monaco TPS vs MC-
SCAN is 2.88%, the difference experimental
measurement vs MC-SCAN is 2.15%. Finally, the tissue
phantom ratio (TPR20/10) was compared. The calculated
TPR20/10 via MC-SCAN is 0.68 and the measured one
is 0.676. Based on these values, the difference between
calculated and measured data is 1.62%.
3.2. Output factors
The output factors for 6 MV photon energy was
measured/calculated for different field sizes and the
difference between the measured and calculated output
results were listed in Table-1.
54

S. Can et al. / Medical Physics in the Baltic States 15 (2021) 53-56
Fig.2. MC-SCAN Monte Carlo code photon transport logic
Table 1. Output factors for 6 MV photon energy
Field Size
(cm x cm)
MC-SCAN
Experimental
Difference
(%)
2x2 0.734 ± 0.24 0.713 ± 0.003 2.94
4x4 0.861 ± 0.22 0.876 ± 0.004 1.71
5x5 0.904 ± 0.34 0.908 ± 0.004 0.44
10x10 1.000 ± 0.23 1.000 ± 0.005 -
15x15 1.066 ± 0.24 1.051 ± 0.005 1.42
20x20 1.071 ± 0.37 1.083 ± 0.005 1.10
30x30 1.126 ± 0.36 1.115 ± 0.005 0.98
40x40 1.156 ± 0.36 1.113 ± 0.005 3.86
The difference between the calculated output factors via
MC-SCAN and experimental values is < 3% for al field
sizes except 40x40cm2 field size. On the other hand,
there is a good agreement was observed for both
approaches and MC-SCAN code is effective tool to
calculate output factors for virtual source model.
3.3. Percent depth dose (PDD)
One way to characterize the dose distribution on the
central axis is to normalize the dose at a given depth to
the dose distribution at the reverence depth. On the
same ground, PDD was calculated for different field
sizes through MC-SCAN and compared with
experimental measurement to evaluate the in-house
Monte Carlo code. The difference between calculated
PDD and the measured one was < 3% for all field sizes.
Additionally, to evaluate whether there is statistically
significant difference paired sample t test was applied
and p < 0.05 was taken into account. Based on statistical
analysis, the significant difference was observed for
10x10 cm2 field sizes (p < 0.05), even though the
difference between both approaches is 2.4%. On the
other hand, the statistical different was not significant
for 15x15 cm2, 20x20 cm2, 30x30 cm2 and 40x 40 cm2
field sizes (p > 0.05). The calculated and measured PDD
comparison was shown in Fig.3.
Fig. 3. The calculated and measured PDD
4. Conclusions
The in-house Monte Carlo dose calculation engine
namely MC-SCAN was developed for this presented
study. The MC-SCAN Monte Carlo engine can be used
as an alternative tool to simulate virtual source model
on Elekta VersaHD LINAC. The difference between
experimental measurements for all calculated values via
MC-SCAN within < 3%. On the other hand, further
investigation needs to be done to improve this
algorithm.
5. References
1. Deng J, Jiang SB, Kapur A, Li J, Pawlicki T, Ma C.
Photon beam characterization and modelling for
Monte Carlo treatment planning. Physics in
Medicine & Biology. 2000;45(2):411.
2. Ma C-M, Li J, Pawlicki T, Jiang S, Deng J, Lee M,
et al. A Monte Carlo dose calculation tool for
radiotherapy treatment planning. Physics in
Medicine & Biology. 2002;47(10):1671.
3. Ahnesjö A, Aspradakis MM. Dose calculations for
external photon beams in radiotherapy. Physics in
Medicine & Biology. 1999;44(11):R99.
4. Andreo P. Monte Carlo techniques in medical
radiation physics. Physics in Medicine & Biology.
1991;36(7):861.
55

S. Can et al. / Medical Physics in the Baltic States 15 (2021) 53-56
5. Liang Y, Muhammad W, Hart GR, Nartowt BJ,
Chen ZJ, James BY, et al. A general-purpose
Monte Carlo particle transport code based on
inverse transform sampling for radiotherapy dose
calculation. Scientific reports. 2020;10(1):1-18.
6. Brualla L, Rodriguez M, Lallena AM. Monte Carlo
systems used for treatment planning and dose
verification. Strahlentherapie und Onkologie.
2017;193(4):243-59.
7. Spezi E, Lewis G. An overview of Monte Carlo
treatment planning for radiotherapy. Radiation
protection dosimetry. 2008;131(1):123-9.
8. Livingstone A, Crowe S, Sylvander S, Kairn T.
Clinical implementation of a Monte Carlo based
independent TPS dose checking system. Physical
and Engineering Sciences in Medicine.
2020;43(3):1113-23.
9. Karbalaee M, Shahbazi-Gahrouei D, Tavakoli M. A
Novel GPU-based Fast Monte Carlo Photon Dose
Calculating Method for Accurate Radiotherapy
Treatment Planning. Journal of Biomedical Physics
& Engineering. 2020;10(3):329.
10. Ohira S, Takegawa H, Miyazaki M, Koizumi M,
Teshima T. Monte Carlo Modeling of the Agility
MLC for IMRT and VMAT Calculations. in vivo.
2020;34(5):2371-80.
11. Sikora M, Dohm O, Alber M. A virtual photon
source model of an Elekta linear accelerator with
integrated mini MLC for Monte Carlo based IMRT
dose calculation. Physics in Medicine & Biology.
2007;52(15):4449.
12. Cashmore J, Golubev S, Dumont JL, Sikora M,
Alber M, Ramtohul M. Validation of a virtual
source model for Monte Carlo dose calculations of
a flattening filter free linac. Medical physics.
2012;39(6Part1):3262-9.
13. Paudel MR, Kim A, Sarfehnia A, Ahmad SB,
Beachey DJ, Sahgal A, et al. Experimental
evaluation of a GPU‐based Monte Carlo dose
calculation algorithm in the Monaco treatment
planning system. Journal of applied clinical medical
physics. 2016;17(6):230-41.
14. Li J, Pawlicki T, Deng J, Jiang S, Mok E, Ma C.
Validation of a Monte Carlo dose calculation tool
for radiotherapy treatment planning. Physics in
Medicine & Biology. 2000;45(10):2969.
15. Snyder JE, Hyer DE, Flynn RT, Boczkowski A,
Wang D. The commissioning and validation of
Monaco treatment planning system on an Elekta
Versa HD linear accelerator. Journal of applied
clinical medical physics. 2019;20(1):184-93.
16. Narayanasamy G, Saenz DL, Defoor D,
Papanikolaou N, Stathakis S. Dosimetric validation
of Monaco treatment planning system on an Elekta
Versa HD linear accelerator. Journal of applied
clinical medical physics. 2017;18(6):123-9.
17. Fraass B, Doppke K, Hunt M, Kutcher G,
Starkschall G, Stern R, et al. American Association
of Physicists in Medicine Radiation Therapy
Committee Task Group 53: quality assurance for
clinical radiotherapy treatment planning. Medical
physics. 1998;25(10):1773-829.
18. Meric N. Calculation of radiation dose to the lens
of the eye using Monte Carlo simulation. Applied
Radiation and Isotopes. 2001;55(4):557-60.
19. Meric M, Bor D, Büget N, Oezkili M. The use of
monte carlo technique for the determination of
tissue-air ratios (TAR) in diagnostic energy rate.
Physica Medica. 1998;14(1):3-8.
20. Salvat F, Fernández-Varea J, Sempau J.
PENELOPE-2008: a code system for Monte Carlo
simulation of electron and photon transport (Issy-
les-Moulineaux. France: OECD Nuclear Energy
Agency. 2009.
56

MEDICAL PHYSICS IN THE BALTIC STATES 15 (2021)
Proceedings of International Conference “Medical Physics 2021”
4-6 November 2021, Kaunas, Lithuania
CASE STUDY REPORT: ADVANTAGES OF HyperArc™ IN BRAIN
RADIOSURGERY TREATMENT PLANNING
Marijus ASTRAUSKAS1, Romualdas GRIŠKEVIČIUS2, Kęstutis AKELAITIS3, Ieva MARKEVIČIENĖ4, Jonas
VENIUS5 1Medical physics department, National Cancer Institute; 2Biomedical physics laboratory, Nacional Cancer Institute [email protected]; [email protected]; [email protected]; [email protected];
Abstract: The goal of this study is to get a better idea of
what can be achieved using HyperArc and to evaluate
its advantages and disadvantages in comparison to
previously planned stereotactic cases in terms of target
coverage, conformity, dose gradient and healthy brain
dose. 9 patients previously planned for stereotactic
radiosurgery, with one or multiple brain metastases
were replanned using HyperArc single isocenter
approach and compared with dosimetric parameters of
the original plan. Results provide better indications for
noncoplanar stereotactic treatment options in National
Cancer Institute and allow for better patient selection for
HyperArc planning.
Keywords: treatment, planning, hyperarc, brain,
radiosurgery
1. Introduction
Stereotactic radiosurgery (SRS) is now a widely used
technique for treating brain metastases. Improvements
in diagnostic imaging, linear accelerator technology,
patient immobilisation techniques make this an
attractive alternative to surgery or whole brain
radiotherapy (WBRT) with good local tumor control [1,
2]. This also applies to postresective lesions which can
also benefit from high dose single or hypofractionated
treatments. The introduction of new generation linear
accelerators such as TrueBeam™ STx with 6D
treatment couch, on board cone-beam CT, smaller
collimation leaves, and flattening filter free beams allow
for fast and very precise single fraction high dose
delivery. However, treatment planning poses a few
challenges, especially when it comes to cases with
multiple brain metastases. Finding the best variation of
isocentre placement and gantry – collimator – couch
angles can be difficult and time consuming.
Furthermore, adding couch rotations introduces a new
element of inaccuracy and increases treatment duration.
A technique introduced in 2017 by Varian called
HyperArc™ (HA) automatically generates the isocentre
placement according to the target geometry, as well as
gantry, couch and collimator angles. The plan is
virtually simulated, to avoid any collisions with the
patient during treatment, and optimized for fast
automated delivery. Along with the updated stereotactic
automatic normal tissue optimisation (NTO) algorithm
this becomes an attractive tool for more efficient
stereotactic treatment planning and delivery for brain
metastases. The purpose of this study was to take
existing single fraction brain SRS cases that were
planned using conventional VMAT and compare them
with those replanned using HA. Replanning was done
using two different approaches – a more homogeneous
approach (preferred in our clinic) for the original plan
and a heterogeneous approach, allowing for higher
maximum dose in the target.
2. Materials and Methods
2.1. Patients
9 patients with 1 - 2 targets (metastasis or post resection
irradiation) were selected. 6 of these cases were
conventional coplanar VMAT and 3 were noncoplanar
VMAT plans. Dose prescription range was 12-24Gy
(mean dose – 18.6Gy) as seen in table 1.
2.2 Planning approach
All plans were made using 0.125cm slice thickness CT
images, calculated with 0.125cm resolution calculation
grid using AAA 15.5 algorithm. Optimization
parameters: aperture shape control – moderate,
convergence mode – off, calculation resolution – high,
MR level at restart – MR3. Linac used for planning -
TrueBeam™ STx, with 6MV flattening filter free
beams, Varian HD120 MLC (2.5mm in centre, 5mm in
periphery). Plan gross tumor volume GTV was defined
by radiation oncologist using registered magnetic
57

M. Astrauskas et al. / Medical Physics in the Baltic States 15 (2021) 57-61
resonance images and 1-2mm margin CTV was created
as the primary target volume. Replanning was done
using HA automated plan creation tool. The proposed
automatic plan isocentre, couch rotations and collimator
rotations were used. The summary of plan setup
characteristics shown in Table 2 displays the original
and HA noncoplanar beam setup. After plan creation the
original plan optimisation objectives were exported and
imported into the HA plan. The only difference from the
original plan was the use of automatic SRS NTO feature
with the same priority. In our clinic, a more
homogeneous planning approach is preferred by the
radiation oncologists, therefore original and the new HA
plan had upper target objectives at ~115-120% of the
prescribed dose. Then the new plan was revised to see
if there was room to reduce the dose for organs at risk.
In order to achieve an even better dose falloff, a second
heterogeneous HA plan was then created and
reoptimised using the same plan objectives, but without
the upper target objectives. To better compare the
results for the heterogeneous plan a third plan was
created using the original plan reoptimized without an
upper objective. In summary, three new plans were
compared with the original VMAT plan.
Table 1. Target characteristics
Target
no.
Target
volume, cc
Equivalent
sphere size,
cm
Dose
prescription,
Gy
Patient 1 T1 4.7 2.1 20
Patient 2 T2 8.3 2.5 20
Patient 3 T3 4.3 2 18
Patient 4 T4 1 1.2 24
Patient 5 T5 5 2.1 20
Patient 6 T6 7.5 2.4 20
T7 5.6 2.2 20
Patient 7 T8 10 2.7 12
T9 7.7 2.5 12
Patient 8 T10 0.3 0.9 20
T11 1.4 1.4 20
Patient 9 T12 10.6 2.7 18
2.3 Plan evaluation
To compare the plans, a few comparison metrics were
chosen. Monitor units (MU) to compare the plan
complexity and treatment time. Plan quality indices
were used to evaluate dosimetric and target coverage
characteristics.
Selected quality indices for plan comparison were:
1. RTOG conformity index (CI) - 𝐶𝐼𝑅𝑇𝑂𝐺 =𝑉𝑅𝐼
𝑇𝑉 (1),
where VRI is the prescription isodose volume, TV is
the target volume.
2. Paddik conformity index - 𝐶𝐼𝑃𝑎𝑑𝑑𝑖𝑘 =(𝑇𝑉𝑃𝐼𝑉)2
𝑇𝑉 ×𝑉𝑅𝐼 (2),
where TVPIV is the target volume that is covered in
the prescription isodose, TV is the target volume,
VRI is volume that receives the prescription isodose.
3. RTOG homogeneity index (HI) - 𝐻𝐼𝑅𝑇𝑂𝐺 =𝐼𝑚𝑎𝑥
𝑅𝐼
(3), where Imax is the maximum dose in the target
volume, RI is the prescription dose.
4. Coverage index (Q) - 𝑄 =𝐼𝑚𝑖𝑛
𝑅𝐼 (4), where Imin is the
maximum dose in the target volume, RI is the
prescription dose.
5. Paddik gradient index (GI) - 𝐺𝐼𝑃𝑎𝑑𝑑𝑖𝑘 =𝑉50%
𝑉100% (5),
where V50% is the volume receiving 50%
prescription dose and V100% is the volume receiving
100% prescription dose.
6. Falloff index - 𝐹𝐼 = 𝑃𝐼𝑉50%
𝑇𝑉 (6), where PIV50% is
the volume receiving 50% prescription dose and
TV is the target volume.
Table 2. Plan setup characteristics
Number of arcs, degrees Couch rotation, degrees
Original
plan
HA plan Original
plan
HA plan
Patient 1 3 (181-330,
330-181,
40-179)
4 (181-179,
180-0 ,0-
180, 180-0)
0, 0, 270 0, 45, 315,
270
Patient 2 3 (290-179) 4 (180-0, 0-
180, 180-0)
0, 0, 0 0, 315, 270,
45
Patient 3 3 (181-179) 3 (180-0, 0-
180, 180-0)
0, 0, 0 0, 45, 90
Patient 4 3 (181-179) 3 (180-0, 0-
180, 180-0)
0, 0, 0 0, 45, 90
Patient 5 3 (181-179,
179-181,
25-179)
4 (180-0, 0-
180, 180-0,
0-180)
0, 0, 90 0, 45, 90,
315
Patient 6 3 (181-179) 4 (180-179,
180-0, 0-
180, 180-0)
0, 0, 0 0, 45, 315,
270
2 (181-179) 4 (180-0, 0-
180, 180-0,
0-180)
0, 0 0, 45, 90,
315
Patient 7 3 (181-179) 4 (180-179,
180-0, 0-
180, 180-0)
0, 0, 0 0, 45, 315,
270
4 (0-179) 3 (0-179) 0, 0, 20, 40 0, 45, 90
Patient 8 3 (181-330,
330-181,
40-179)
4 (181-179,
180-0 ,0-
180, 180-0)
0, 0, 270 0, 45, 315,
270
3 (290-179) 4 (180-0, 0-
180, 180-0)
0, 0, 0 0, 315, 270,
45
Patient 9 3 (181-179) 3 (180-0, 0-
180, 180-0)
0, 0, 0 0, 45, 90
For calculating these indices, an additional high
resolution evaluation structure – a 1.5cm sphere was
created and checked that 50% isodose is inside the
structure. These indices were chosen based on
recommendations from literature and our own clinical
practice [3, 4]. In all original plans the main OAR
criteria was local healthy brain dose V12Gy<10cc as per
clinical protocol. This was evaluated for each individual
target by making an additional high resolution
58

M. Astrauskas et al. / Medical Physics in the Baltic States 15 (2021) 57-61
evaluation structure – 1.5cm diameter sphere around
each CTV and cropped from GTV. Additionally,
V10Gy<12cc is also used as brain necrosis risk
evaluation factor, therefore it was included into the
study as well [5]. The statistical comparison between
the two plan sets was made using a paired two tailed
Student’s t-test in “Microsoft Excel”, p value of < 0.05
indicating statistical significance.
For case comparisons, two groups were distinguished.
First – comparing the plans that were originally planned
using noncoplanar fields, to compare the automatic plan
generation with the manually created VMAT plan for
quality indices and tissue sparing. Second – to see if
there is a benefit to using HA in multiple target cases.
3. Results
3.1 Statistical comparison
General comparisons of the plans are presented in Table
3 and 4. In terms of MU, HA plans did produce a higher
number of MU, however it was not found to be
statistically significant. Looking at quality indices, in
terms of conformity and coverage, there were no
significant differences between the original and new
plans after plan normalization. In terms of homogeneity,
comparing the heterogeneous and homogeneous plans
against their counterparts, there was no significant
difference as well. As expected, significant differences
were observed in the dose falloff and healthy brain dose
in HA plans, that produce a much steeper dose falloff
(due to noncoplanar design), with heterogeneous HA
plans exhibiting the steepest falloff. Even comparing the
original homogeneous and heterogeneous VMAT plans,
there is a marginally significant (p=0.057) increase in
dose gradient, same being with the falloff index
(p=0.064), which would indicate that allowing a higher
maximum dose in the target, helps to spare normal
tissue. We can see this when comparing the healthy
brain dose of V12Gy (p=0.065) and V10Gy (p=0.042)
between the original VMAT plans in Table 3. However,
the best brain sparing was achieved using heterogeneous
HA allowing to significantly improve V12Gy and
V10Gy compared to all other modalities.
3.2 Case comparison
The benefit of noncoplanar plans for dose falloff and
brain sparing is well known and in simple single target
cases it has clear advantages. So, for a further fairer
comparison Tables 5 and 6 show the results for the
cases where noncoplanar VMAT was used. Compared
are the replanned versions with heterogeneous dose and
better dose falloff.
Looking at the tables, HA plans still seem better,
however the differences now are not as dramatic as
when compared to coplanar VMAT plans. Looking at
the differences between the original and the HA beam
geometry in Fig.1, we see that HA takes advantage of
more noncoplanar beams to achieve better dose falloffs
at 50% dose.
When comparing the 50% isodose between VMAT and
HA plans in Fig.2 it is clear, that more noncoplanar
beams give a better dose fall off and smoother dose
distribution in patient 1 and somewhat in patient 9.
However, looking at patient 5 (middle), there does not
seem to be that much difference. Even though, two
more noncoplanar arcs were used in that plan.
Table 3. Plan comparison summary, homogeneous
Mean (±SD) Original plan,
homogeneous
HA,
homogeneous
MU 5892 (±1565) 6408 (±1998)
CIRTOG 1.08 (±0.15) 1.09 (±0.14)
CIPaddik 0.9 (±0.08) 0.9 (±0.08)
HIRTOG 1.15 (±0.06) 1.15 (±0.06)
Coverage, Q 0.91 (±0.05) 0.93 (±0.03)
GIPaddik 3.73 (±0.8) 2.94 (±0.45)
Falloff 4.07 (±1.41) 3.23 (±0.92)
Brain, V12Gy 6.76 (±2.33) 6.19 (±2.19)
Table 4. Plan comparison summary, heterogeneous
Mean (±SD) Original plan,
heterogeneous
HA,
heterogeneous
MU 7263 (±922) 6999 (±1150)
CIRTOG 1.08 (±0.16) 1.08 (±0.14)
CIPaddik 0.91 (±0.11) 0.91 (±0.08)
HIRTOG 1.36 (±0.09) 1.36 (±0.12)
Coverage, Q 0.9 (±0.06) 0.92 (±0.04)
GIPaddik 3.55 (±0.72) 2.68 (±0.36)
Falloff 3.89 (±1.37) 2.91 (±0.82)
Brain, V12Gy 6.57 (±2.41) 6.04 (±2.32)
Table 5. Noncoplanar VMAT vs HA, dose falloff
GI VMAT GI HA FI VMAT FI HA
Patient 1 2.83 2.60 3.09 2.77
Patient 4 2.54 2.45 2.69 2.64
Patient 9 2.67 2.46 2.62 2.41
Table 6. Noncoplanar VMAT vs HA, brain sparing
V12 VMAT V12 HA V10 VMAT V10
HA
Patient 1 5.12 4.4 7.09 6.12
Patient 4 6.56 6.13 8.62 7.92
Patient 9 9.89 9.92 13.56 13.28
Fig. 1. Original VMAT plans (right) vs HA plans (left)
59

M. Astrauskas et al. / Medical Physics in the Baltic States 15 (2021) 57-61
Fig. 2 Dose differences at 50% isodose VMAT (left) vs HA
(right).
Another possible advantage of using HA is planning
cases with multiple targets using single isocentre
approach. Table 7 shows the results from two cases with
multiple targets. First case is patient 6 with two large
targets in different parts of the brain and patient 7 with
two small metastases in close proximity to each other.
The original VMAT plan did not use noncoplanar fields,
therefore the differences are much more obvious. In
patient 7, since the targets are very close, the brain
V12/V10Gy evaluation volume was combined. Figure 3
displays the beam geometry for the plans.
Table 7. VMAT Heterogeneous vs HA Heterogeneous
Fig. 3. Original VMAT plans (right) vs HA plans (left).
Dose distribution for the plans (Fig. 4.) shows very
noticeable differences in dose falloff. Patient 6, having
large targets far apart, would have benefited much from
a HA plan. However, a two isocentre approach might
have been even more beneficial.
Fig. 4. Dose differences at 50% isodose VMAT (left) vs HA
(right).
In case of patient 7 (Fig. 5) 50% isodose distribution,
the differences are not that pronounced, however still
very visible. There are also clear benefits of reduced
dose bridging with HA at lower doses.
Fig. 5. Dose differences at 50% isodose VMAT (left) vs HA
(right).
4. Discussion
The aim of this study was to examine the HyperArc
planning approach to find out if there are benefits to this
new technique. In terms of dose falloff, it is clear that a
heterogeneous approach for stereotactic cases benefits
the dose falloff regardless of technique used.
Noncoplanar plans also further increase the dose falloff
and allow for better healthy brain sparing, which is also
seen in similar published works on this topic [6, 7]. Not
mentioned in the results, but another important benefit
was the ease of use and time efficiency of HA planning.
Even a less experienced planner can create a good plan
using the automated plan creation tool, saving time
looking for couch rotation angles, collimator angles and
isocentre placement. Since the plan is also virtually
simulated, more time is saved by not having to check
for collisions before the treatment delivery. However,
this might be a problem due to lack of flexibility in the
V12 VMAT V12
HA V10 VMAT V10 HA
Patient 6 8.08 7.56 11.13 10.20
9.4 7.90 13.35 10.59
Patient 7 4.57 3.71 6.86 5.10
60

M. Astrauskas et al. / Medical Physics in the Baltic States 15 (2021) 57-61
number of couch angles and number of arcs. The use of
automatic SRS NTO should be further studied, since the
plans used shell structures in optimisation, therefore the
benefits are unclear. However, it does seem to help with
dose bridging. Also not mentioned were the plan
complexity indices, influencing the QA of the plans,
which is a consideration due to higher number of MUs
in HA plans. The number of patients is most likely too
low to say with confidence that the differences between
the plans are significant, especially for noncoplanar
VMAT, and further studies should be made. In terms of
target conformity and coverage, due to normalizing all
plans to the original VMAT plan for most fair
comparison of dose falloff, there is also a point to be
made, that these metrics could be better, as indicated in
published works [8], although most likely at the cost of
healthy brain sparing. Despite all this it is clear that
HyperArc is a useful tool to have when treating
stereotactic brain cases.
5. Conclusion
This study showed that HyperArc™ planning solution
increased plan quality metrics in all chosen brain SRS
cases. HA plans were better than the conventional and
noncoplanar VMAT plans, especially in dose falloff
and healthy brain sparing. Based on these results, it is
suggested to use HA for all brain SRS cases. Based on
the plan quality index results from heterogeneous and
homogeneous plan comparison it is also recommended
to use planning strategies based on a more
heterogeneous planning approach.
6. References
[1] Brown PD, Jaeckle K, Ballman KV, et al. Effect of
radiosurgery alone vs radiosurgery with whole brain radiation
therapy on cognitive function in patients with 1 to 3 brain
metastases: a randomized clinical trial. JAMA.
2016;316(4):401–409.
[2] Tsao MN, Rades D, Wirth A, Lo SS, Danielson BL,
Gaspar LE, Sperduto PW, Vogelbaum MA, Radawski JD,
Wang JZ, Gillin MT, Mohideen N, Hahn CA, Chang EL.
Radiotherapeutic and surgical management for newly
diagnosed brain metastasis(es): An American Society for
Radiation Oncology evidence-based guideline. Pract Radiat
Oncol. 2012 Jul-Sep;2(3):210-225.
[3] Shaw E, Kline R, Gillin M, Souhami L, Hirschfeld A,
Dinapoli R, et al. Radiation therapy oncology group:
Radiosurgery quality assurance guidelines. Int J Radiat Oncol
Biol Phys. 1993;27:1231–9.
[4] Paddick I, Lippitz B. A simple dose gradient measurement
tool to complement the conformity index. J
Neurosurg. 2006;105(Suppl):194–201.
[5] Minniti G, Clarke E, Lanzetta G, et al. Stereotactic
radiosurgery for brain metastases: analysis of outcome and
risk of brain radionecrosis. Radiat Oncol. 2011;6:48–56.
[6] Ruggero R, Stefania N, Rosario M, Francesco R, Stefanie
C, Alba F, Filippo A, Linac-based radiosurgery for multiple
brain metastases: Comparison between two mono-isocenter
techniques with multiple non-coplanar arcs, Radiotherapy and
Oncology, 2019;132:70-78.
[7] Vergalasova I, Liu H, Alonso-Basanta M, Dong L, Li J,
Nie K, Shi W, Teo BK, Yu Y, Yue NJ, Zou W, Li T. Multi-
Institutional Dosimetric Evaluation of Modern Day
Stereotactic Radiosurgery (SRS) Treatment Options for
Multiple Brain Metastases. Front Oncol. 2019;7;9:483.
[8] Ohira, S., Ueda, Y., Akino, Y. et al. HyperArc VMAT
planning for single and multiple brain metastases stereotactic
radiosurgery: a new treatment planning approach. Radiat
Oncol, 2018;13,13.
61

MEDICAL PHYSICS IN THE BALTIC STATES 15 (2021)
Proceedings of International Conference “Medical Physics 2021”
4-6 November 2021, Kaunas, Lithuania
A SUCCESSFUL PATIENT MANAGEMENT SYSTEM DURING COVID-19
PANDEMIC AND THE IMPACT OF THE RESTRICTIONS IN A RADIATION
ONCOLOGY CLINIC IN TURKEY
Nur KODALOĞLU1, Cafer ATAR1, Selami KARAHAN1 1Dr. Abdurrahman Yurtaslan Ankara Oncology Research and Training Hospital
Abstract: COVID-19 pandemic created concerns related
with infection spread which lead to decrease in the
number of patients who apply to the most critical
departments, i.e. cardiology, oncology etc. During 2020,
a couple of strict new strategies helped us to prevent
infection spread in the clinic. Since 11st March 2020, the
date of the declaration of first COVID-19 patient in the
country, besides the applied worldwide known rules,
PCR tests 24 hours before the treatments and coming
with only one companion lead not to close the clinic.
Keywords: Radiotherapy, COVID-19, pandemic,
preventive measures, control.
1. Introduction
With the outbreak of severe acute respiratory syndrome
coronavirus 2 (SARS-CoV-2), the novel coronavirus
2019 (COVID-19), responsible for the coronavirus
disease, has caused disruptions and uncertainties in
treatments in many countries. Compared to other
populations, oncology patients who are potentially more
susceptible, due to immunosuppression, are at risk of
severe infection during SARS-CoV-2 outbreaks. After it
was announced that the first case was detected in our
country on March 11, 2020, we took all the necessary
precautions for the pandemic process in our clinic.
2. Implemented Measures in the Clinic Related to
COVID-19
A working group on clinical procedures and workflow
was established at our hospital during the pandemic.
Staff training was also conducted on basic prevention
precautions to prevent infection, epidemiological and
clinical features of COVID-19 cases and various
possible situations. Each training has practiced keeping
distance between individuals and limiting the number of
people at meetings and conferences. A humane
approach was applied to patients, respecting their
concerns and values. Priority was given to the
availability of psychological counselling services to
patients in need during the epidemic.
Appointment-based medical procedures and visits have
been adopted to facilitate patients' access to the hospital
or radiotherapy center. Workspaces are divided by
function to ensure a smooth workflow in the
radiotherapy center and to limit communication.
14 rule directives published by the Ministry of Health
have been put into practice (1, 2). Personal protective
equipment for all personnel according to their duties;
gloves, apron, medical mask (n95/ffp2), goggles, face
shields were provided (Fig. 1). Material access points
and changing rooms with protective equipment had
been created. The rules to be followed while putting on
and taking off personal protective equipment had been
explained to the personnel.
Fig. 1. Personnel with protective equipment (masks, latex
gloves, face shields, disposable waterproof isolation gowns
and shoe covers).
On 18.03.2020, triage practice was started at the clinic
main entrance. Triage nurses were available to assess
and assist individuals in the main entrance and reception
areas outside the radiotherapy center (Fig. 2). Contact
inquiries were made of the patients with fever, cough,
respiratory distress, and in contact with people
62
N. Kodaloğlu et al. / Medical Physics in the Baltic States 15 (2021) 62-65
travelling abroad. All patients and their relatives were
required to wear masks in the clinic, and those who did
not have a mask were given a mask at the time of triage.
Fig. 2. Triage nurses at the main entrance triage area.
Medical personnel are instructed to strictly practice
rigorous hand hygiene before and after any contact with
patients, before putting on protective equipment, and
after removing protective equipment. Health personnel
were informed that they should wash their hands after
patient examination, pay attention to hand hygiene after
contact with contaminated environment and objects,
after being exposed to anybody fluid, before meals and
after using the toilet. For the purpose of protection,
single seat seating arrangement has been changed with 2
meters intervals in the treatment waiting rooms (Fig. 3).
Close contact was prevented in examination rooms and
waiting areas. Hand hygiene was ensured by placing
disinfectants at the entrances of waiting rooms,
treatment and planning rooms, locker rooms.
Fig. 3. Reorganized treatment waiting rooms and seating areas
with 2 meters apart single seats.
Traffic was limited, including the number of patient
companions. If there is a patient in need of assistance,
the patient is provided to be accompanied by only one
person. Only patients and attendants who were not
suspected of having SARS-CoV-2 infection could enter
the radiotherapy center. Personal protective equipment
such as masks, latex gloves, safety glasses or face
shields, disposable waterproof isolation gowns and shoe
covers are worn when patients with suspected SARS-
CoV-2 are taken to infectious disease (pandemic) clinics
that provide more detailed assessment and management.
Thermometers were distributed to all treatment devices.
Before each patient's treatment and planning
procedures, fever, cough, respiratory distress and
foreign travel inquiries were made by radiotherapy
technicians every day. A patient-specific triage follow-
up form was created.
Each patient who has just started the treatment was
informed about the pandemic process by the training
nurse in the clinical education polyclinic and the
possible risks were explained.
The accessories used in the simulation processes were
disinfected after each patient. Thermoplastic mask,
vacuum bed, etc. accessories made specifically for the
patient were disinfected and bagged (Fig. 4).
Fig. 4. Thermoplastic masks in bags.
On 23rd March 2020, #stayhome was applied for a
limited number of personnel from each field. So, a few
number of groups among RTTs were created. Each
group of RTTs worked for 2-week-shifts without being
in contact with other groups. Besides, radiation
oncologists and medical physicists also created different
groups with different schedules.
A specific time period was decided for the cleaning of
the treatment rooms and the whole clinic.
3. Restrictions Around the Country
With the recommendations of the Ministry of Health
and the Scientific Committee, on 21st March 2020, it
was declared to citizens aged 65 and over, those with a
low immune system, chronic lung disease, asthma,
COPD, cardiovascular disease, kidney, hypertension
and liver disease and those who use drugs that impair
their immune system not to leave their residences. They
were forbidden to go out on the streets, limiting their
walking in the parks and travelling by public transport.
On 3rd April 2020, these restrictions had been extended
to include teenagers under the age of 20.
On 16th March 2020, education in schools and
universities had been suspended and alternative online
education became the main educational tool.
To minimize the risk spreading the virus, on 21st March
2020, gathering places such as shopping malls, cinemas,
theatres, entertainment venues, wedding/engagement
halls, mosques, tea gardens, hairdresser, barber, beauty
salons, Turkish baths, saunas, SPAs, condolence houses,
sport centers, concert halls, restaurants, internet lounges,
coffeehouses, amusement parks, swimming pools,
conference centers, scientific organization places,
associations etc. were forbidden to enter.
63

N. Kodaloğlu et al. / Medical Physics in the Baltic States 15 (2021) 62-65
On 1st April 2020, international flights from 70
countries were cancelled.
As the first nationwide restriction, again with the
recommendations of the Ministry of Health and the
Scientific Committee, curfew restrictions were applied
around the country. On 4th April 2020, a curfew was
declared between 21:00 and 05:00 on weekdays and all
day on weekends. On 3rd May 2020, normalization
started.
Due to the rapid increase in the number of COVID-19
positive patients, the second nationwide curfew
restrictions applied on 17th November 2020. Weekend
curfew restrictions applied in the whole country. More
restrictions applied on different cities depending on the
COVID-19 positive patient number in that city.
On 14th April 2021, a curfew was declared between
19:00 and 05:00 on weekdays and all day on weekends.
On 1st June 2021, normalization started.
In our department, there are several machines, used for
radiotherapy, as can be seen in both Table 1 and 2. The
number of the patients treated with different machines
and patients diagnosed COVID-19 positive by months
in 2020 and 2021 are given in Table 1 and 2,
respectively.
Table 1. The number of the patients treated with different machines and diagnosed COVID-19 in 2020.
Table 2. The number of the patients treated with different machines and diagnosed COVID-19 in 2021.
4. COVID-19 in Our Clinic
The first COVID-19 positive patient was diagnosed on
27th March 2020 in our clinic. Risk assessment of our
personnel in contact with the patient had been made
and our personnel hadn’t been infected. Besides, since
that date, there is no infected personnel from any
patient diagnosed COVID-19 before or during their
treatments.
Since 18th September 2020, PCR test have been
applied to each patient 24 hours before their
treatments. Therefore, between 18 September 2020 and
31 December 2020, 523 PCR tests per patient were
applied. 21 COVID-19 positive patients were detected
24 hours before their treatments and 24 patients during
their treatments (45 patients in total) in that time
period. From 18 September 2020 to 20 September
2021, 1987 PCR tests per patient were applied. 14
COVID-19 positive patients were detected 24 hours
before their treatments and 2 patients during their
treatments (16 patients in total) in 2021.
The total number of patients treated in our clinic
between 2003 and 2021, excluding brachytherapy
patients, are given in Table 3. As can be seen from
Table 3, until 2020, annual number of patients were
roughly at least 2500 and above. The lowest number of
patients was seen in 2020 due to the pandemic.
The COVID-19 positive personnel in the clinic in 2020
and 2021 are given in Table 4. Among 32 radiation
oncologists, 4 of them were infected in 2020 and 1 of
them in 2021. Among 19 medical physicists 2 of them
were infected in 2020 and none in 2021. Among 46
RTTs, 5 of them were infected in 2020 and 2 of them
in 2021. Among 6 nurses, none of them were infected
in 2020 and 1 of them in 2021. Among 5 secretaries, 1
of them were infected in 2020 and none of them in
2021. The COVID-19 positive personnel in the clinic
were infected from their families or from other contacts
apart from the clinic.
2020 Jan Feb Mar Apr May June July Aug Sep Oct Nov Dec Total
Cyberknife 36 15 30 13 5 29 31 23 16 10 15 12 235
Tomotherapy HI-
Art
19 31 24 14 16 0 14 22 25 19 34 18 236
Varian Trilogy 1 57 68 57 51 35 64 65 57 60 43 61 52 670
Varian Trilogy 2 60 66 61 46 41 71 58 58 68 34 58 39 660
Elekta Synergy
Platform
71 58 57 28 35 56 58 31 54 46 41 35 570
IORT Mobetron 0 1 0 0 0 0 0 0 0 0 0 0 1
Nucletron 3D
Brachytherapy
16 18 18 12 13 24 20 15 10 14 14 16 190
TOTAL 259 257 247 164 145 244 246 206 233 166 223 172 2562
COVID-19(+) 0 0 2 1 0 1 0 4 8 4 17 8 45
2021 Jan Feb Mar Apr May June July Aug Sep Oct Nov Dec Total
Cyberknife 17 25 25 30 20 15 11 17 160
Tomotherapy HI-
Art
26 25 22 4 7 26 17 25 152
Varian Trilogy 1 51 42 53 41 56 43 35 40 361
Varian Trilogy 2 55 56 59 70 47 54 45 59 445
Elekta Synergy
Platform
45 33 50 40 32 47 24 45 316
IORT Mobetron 0 1 0 0 0 0 0 0 0
Nucletron 3D
Brachytherapy
18 15 20 15 19 22 22 20 151
TOTAL 212 196 229 200 181 207 154 206 1585
COVID-19(+) 2 1 1 4 1 3 0 1 3 16
64

N. Kodaloğlu et al. / Medical Physics in the Baltic States 15 (2021) 62-65
Table 3. The number of the patients treated between 2003 and 2021.
Table 4. The number of patients diagnosed COVID-19 before and during the treatments in 2020 and 2021.
Table 5. The number of personnel diagnosed COVID-19 in the Radiation Oncology Clinic.
Radiation
Oncologists
Medical
Physicists RTTs Nurses Secretary
2020 2021 2020 2021 2020 2021 2020 2021 2020 2021
COVID (+) 4 1 2 0 5 2 0 1 1 0
Total number of personnel 32 19 46 6 5
5. Results
Among the number of treated patients from 2003 to
2021, the most dramatic decrease is observed in 2020
with the number 2372 (excluding brachytherapy
patients) due to the pandemic (Table 3). Besides, the
effect of the governmental restrictions can be seen
from Table 1. In April-May and October (2020), the
decrease in the number of the treated patients can be
seen easily. Both decreases occurred right after the
increase in the COVID-19 positive patients in the
country and the declaration of curfews. When
comparing Table 1 and 2, the effect of fear of infection
in 2020 can be easily seen from the low numbers in
April and May which increased in 2021.
Among 523 patients (between 18 September 2020 –
December 2020), only 45 of them were diagnosed
positive (21 before and 24 during their treatments).
Beginning from September 2020, the increase of the
COVID-19 positive patients in the clinic was
correlated with national numbers. This obvious
increase leaded anxiety among patients which resulted
skipping their treatments. 1987 PCR tests per patient
were applied from 18 September 2020 to 20 September
2021. 14 COVID-19 positive patients were detected
before their treatments and 2 patients during their
treatments (16 patients in total) in 2021. So, in 2021
roughly one third of the COVID-19 positive patients
were detected compared to 2020 due to the rising
awareness of self-protection of individuals and the
effect of vaccines. Besides, only 5 radiation
oncologists (4 in 2020, 1 in 2021), 2 medical physicists
(in 2020), 7 RTTs (5 in 2020, 2 in 2021), 1 nurse (in
2021), 1 secretariat (in 2020) were COVID-19 positive
due to the in family contact or contacts from outside
the clinic.
6. Conclusions
The psychological pressure of the national restrictions
caused patients to skip their treatments or initiating
new procedures for diagnoses which also lead a
decrease in May and September 2020 (145 and 166,
respectively). Due to avoiding symptoms and
postponing related examines, it is highly expected to
face higher grades in the future. Each of the rules
applied to cope with pandemic in our clinic seems very
effective taking into account such low COVID-19
positive numbers both among patients and staff.
Due to the all precautions implemented in our clinic,
none of the treatments were interrupted and our clinic
was never under quarantine. Contamination due to the
contact both among the patients and among the
personnel was never seen because of early detection
via PCRs and symptom tracking among all patients.
7. References
1. Ministry of Health (2020). COVID-19 Yeni Koronavirüs
Hastalığı [online]. Website:
https://covid19bilgi.saglik.gov.tr/ tr/ [accessed 17April
2020].
2. Ministry of Health (2020). COVID-19 Algoritmalar
[online]. Website:
https://covid19bilgi.saglik.gov.tr/tr/algoritmalar
[accessed 17April 2020.
Year
20
03
20
04
20
05
20
06
20
07
20
08
20
09
20
10
20
11
20
12
20
13
20
14
20
15
20
16
20
17
20
18
20
19
20
20
20
21
Number of
Patients 27
92
30
17
34
63
37
29
35
83
29
93
32
49
32
02
34
04
29
82
28
15
27
55
26
70
25
89
26
84
28
33
30
32
23
72
15
85
2020
2020
To
tal
2021
2021
To
tal
To
tal
Ma
r
Ap
r
Ma
y
Ju
ne
Ju
ly
Au
g
Sep
Oct
No
v
Dec
523
PC
R
Ja
n
Feb
Ma
r
Ap
r
Ma
y
Ju
ne
Ju
ly
Au
g
Sep
1464
PC
R
1987
PC
R
Before
Treatment 0 0 0 0 0 0 1 2 12 6 21 1 1 1 3 1 3 0 1 3 14 35
During
Treatment 2 1 0 1 0 4 7 2 5 2 24 1 0 0 1 0 0 0 0 0 2 26
65
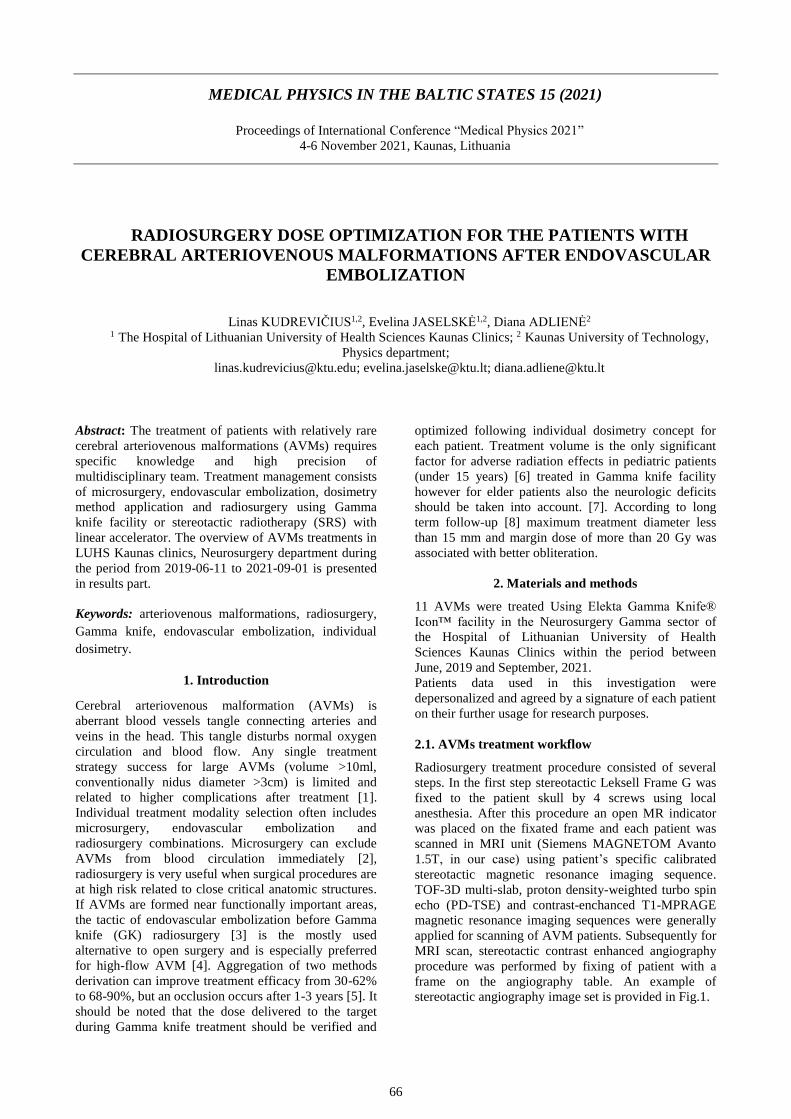
MEDICAL PHYSICS IN THE BALTIC STATES 15 (2021)
Proceedings of International Conference “Medical Physics 2021”
4-6 November 2021, Kaunas, Lithuania
RADIOSURGERY DOSE OPTIMIZATION FOR THE PATIENTS WITH
CEREBRAL ARTERIOVENOUS MALFORMATIONS AFTER ENDOVASCULAR
EMBOLIZATION
Linas KUDREVIČIUS1,2, Evelina JASELSKĖ1,2, Diana ADLIENĖ2 1 The Hospital of Lithuanian University of Health Sciences Kaunas Clinics; 2 Kaunas University of Technology,
Physics department;
[email protected]; [email protected]; [email protected]
Abstract: The treatment of patients with relatively rare
cerebral arteriovenous malformations (AVMs) requires
specific knowledge and high precision of
multidisciplinary team. Treatment management consists
of microsurgery, endovascular embolization, dosimetry
method application and radiosurgery using Gamma
knife facility or stereotactic radiotherapy (SRS) with
linear accelerator. The overview of AVMs treatments in
LUHS Kaunas clinics, Neurosurgery department during
the period from 2019-06-11 to 2021-09-01 is presented
in results part.
Keywords: arteriovenous malformations, radiosurgery,
Gamma knife, endovascular embolization, individual
dosimetry.
1. Introduction
Cerebral arteriovenous malformation (AVMs) is
aberrant blood vessels tangle connecting arteries and
veins in the head. This tangle disturbs normal oxygen
circulation and blood flow. Any single treatment
strategy success for large AVMs (volume >10ml,
conventionally nidus diameter >3cm) is limited and
related to higher complications after treatment [1].
Individual treatment modality selection often includes
microsurgery, endovascular embolization and
radiosurgery combinations. Microsurgery can exclude
AVMs from blood circulation immediately [2],
radiosurgery is very useful when surgical procedures are
at high risk related to close critical anatomic structures.
If AVMs are formed near functionally important areas,
the tactic of endovascular embolization before Gamma
knife (GK) radiosurgery [3] is the mostly used
alternative to open surgery and is especially preferred
for high-flow AVM [4]. Aggregation of two methods
derivation can improve treatment efficacy from 30-62%
to 68-90%, but an occlusion occurs after 1-3 years [5]. It
should be noted that the dose delivered to the target
during Gamma knife treatment should be verified and
optimized following individual dosimetry concept for
each patient. Treatment volume is the only significant
factor for adverse radiation effects in pediatric patients
(under 15 years) [6] treated in Gamma knife facility
however for elder patients also the neurologic deficits
should be taken into account. [7]. According to long
term follow-up [8] maximum treatment diameter less
than 15 mm and margin dose of more than 20 Gy was
associated with better obliteration.
2. Materials and methods
11 AVMs were treated Using Elekta Gamma Knife®
Icon™ facility in the Neurosurgery Gamma sector of
the Hospital of Lithuanian University of Health
Sciences Kaunas Clinics within the period between
June, 2019 and September, 2021.
Patients data used in this investigation were
depersonalized and agreed by a signature of each patient
on their further usage for research purposes.
2.1. AVMs treatment workflow
Radiosurgery treatment procedure consisted of several
steps. In the first step stereotactic Leksell Frame G was
fixed to the patient skull by 4 screws using local
anesthesia. After this procedure an open MR indicator
was placed on the fixated frame and each patient was
scanned in MRI unit (Siemens MAGNETOM Avanto
1.5T, in our case) using patient’s specific calibrated
stereotactic magnetic resonance imaging sequence.
TOF-3D multi-slab, proton density-weighted turbo spin
echo (PD-TSE) and contrast-enchanced T1-MPRAGE
magnetic resonance imaging sequences were generally
applied for scanning of AVM patients. Subsequently for
MRI scan, stereotactic contrast enhanced angiography
procedure was performed by fixing of patient with a
frame on the angiography table. An example of
stereotactic angiography image set is provided in Fig.1.
66

L.Kudrevičius et al. / Medical Physics in the Baltic States 15 (2021) 66-69
Fig. 1. The coronal a) and sagittal b) plane of stereotactic
contrast enchanced AVMs angiography; with indicated AVMs
location.
All acquired patient’s images were send to treatment
planning system equipped with Leksell GammaPlan
(11.1.1) software for individual treatment dose
planning. Planning was performed by indicating
treatment shot locations in stereotactic space coordinate
system according to the defined reference points
obtained from both sets of images. Shot locations were
adjusted according to AVMs locations in each plan
without any consideration of margins. Treatment dose
was chosen individually for each patient according to
the nidus size. Dose selection was based on information
provided by other researchers [9-10]. Prescribed
irradiation dose was dependent on arteriovenous
malformation’s size, location, and surrounding critical
structures.
2.2. Individual dosimetry concept
It is known that endovascular embolization of AVMs
is a common solution before Gamma knife treatment.
However it may affect energy absorption or scattering
processes, also some of in vitro studies were showing
negligible dose reduction following beam penetration of
embolic agents [11]. Due to this, the only way for the
implementation of the precise treatment is proper target
visualization.
Some authors have used Onix glue as embolization
agent for theoretical dose reduction calculations using
CT-images and 60Co attenuation coefficients [12] and
found 0.01-1% dose reduction related to embolization.
In order to assess embolization related dose reduction,
combination of patient specific 3D printed AVMs
models immersed in VIPAR-type polymer dose gels,
manufacturing process of which was described in our
previous publications [13-14], were used (Fig.2).
Menox glue was used to recall embolization of AVMs.
Two cases were explored: polymer gels with inserted
AVM model: gel with empty AVM model and gel with
Menox glue filled vascular model inside. After 24 hours
both identically Gamma Knife identically irradiated
samples were MRI scanned keeping the same
parameters. Optical density of the MRI images was used
to identify absorbed dose values in polymerized dose
gel.
Dose verification was performed comparing the doses
generated by Gammaplan treatment planning system of
the facility and doses obtained performing dosimetric
evaluation of the polymer gel structures irradiated
according to the real patient’s plans (same shape and
realized dose).
Fig. 2. Manufactured VIPARnd dose gel sample a) and 3D
printed vascular models b)
3. Results
6 of 11 AVMs patients previously had partial vascular
embolization and one of them was after multiple
embolization procedures, among them 5 male and 1
female patient. Some treatment related parameters are
provided in the Table1.
Table 1. AVM patients related information.
Parameter Range or
count
Average or
percentage
Number of AVM patients 6/11 54%
Age, years 19 - 67 46
ECoG (electrocorticography) 0 - 1
KPS (Karnofsky Performance
Status)
100 - 80
AVM size, ml 0.10– 1.33 0.82
Prescribed irradiation dose,
Gy
18 - 25 22.5
Isodose, Gy 50 - 60 53
Treatment time, min. 21.9 – 83.9 47.7
Control MRI scans and angiography screening were
usually performed between 12 to 18 months after the
Gamma Knife stereotactic radiosurgery. Positive impact
of the embolization on the outcome of Gamma knife
treatment can be clearly identified in both, angiography
images (Fig.3) and MRI scans (Fig.4) of the treated
AVMs patient.
Fig. 3. Sagittal plane angiography: 1 – 14 months after
embolization, 2 – 19 months after Gamma Knife radiosurgery
(0.843 ml, 24@50% isodose)
a) b)
a
b
67

L.Kudrevičius et al. / Medical Physics in the Baltic States 15 (2021) 66-69
Fig. 4. MRI control scans (TOF-3D multi-slab application) ,
performed 17 month after stereotactic radiosurgery treatment
of 1.33 ml AVM with 22 Gy@56% at isodose in Gamma
Knife facility. (a,b – sagittal, c,d – coronal, e,f – axial planes)
Identification of nidus is not that complicated in
angiography as compared to identification of the smaller
arterial feeders, especially in the case if there is more
than one of them. If the bigger non-compact AVM nidus
with non-single draining vein is detected, partial
embolization small feeders is done [15], which not
necessarily totally stops blood circulation in AVMs,
thus increasing hemorrhage risk.
Fig. 5. Sagittal plane angiography: 1- Confirmed AVM after
haemorrhage in 2018, 2 – 12 months after partial
embolization, 3 – 18 months after Gamma Knife radiosurgery
Having similar situation microsurgery is impossible and
only repeated embolization or SRS treatment options
exist. An example of successful treatment in similar
situation with GK is provided in Fig. 5.
4. Conclusions
All 6 after endovascular embolization GK treated
patients were under control for at least 2 years.
According to the performed MRI and/or angiography
examination results treatment clearly improved the life
expectations of 4 patients since arteriovenous
malformations were shut down from blood circulation.
MRI control scans performed for other two patients
indicated remaining gliosis changes a in place of
AVMs. Due to very small (0.1 and 0.3 ml) their pre-
treatment size it was impossible to confirm or deny
relapse.
Application of the proposed individual dosimetry
concept allowed for comparison between doses
registered in polymer gels with immersed empty 3D
printed AVM model and gels with 3D printed AVM
model filled with Menox glue. Detectable dose
reduction in sample with Menox glue filled vascular
model (~1%) was found. This clearly indicated the need
for further more detailed investigation related to dose
optimization which should be implemented before
delivering doses to AVMs patients with installed
vascular embolization.
Acknowledgements
Funding: This research was supported by the Research
and Innovation Fund of Kaunas University of
Technology (project grant No.INP2021/11) and the
Research Fund of Lithuanian University of Health
Sciences (project acronym SMEGENYS/BRAIN).
5. References
1. El-Shehaby AMN, Reda WA, Abdel Karim KM, Emad
Eldin RM, Nabeel AM, Tawadros SR. Volume-Staged
Gamma Knife Radiosurgery for Large Brain
Arteriovenous Malformation. World Neurosurg., 2019.
Vol 132, p. 604-612.
2. Hasegawa H. Shunya H, Masahiro S, Masaaki S et al.
Long-Term Outcomes of Single-Session Stereotactic
Radiosurgery for Cerebellar Arteriovenous Malformation,
with a Median Follow-Up of 10 Years, World Neurosurg,
2016. Vol 98, p. 314-322.
3. Lazzaro MA, Badruddin A, Zaidat OO, Darkhabani Z,
Pandya DJ, Lynch JR. Endovascular embolization of head
and neck tumors. Front Neurol, 2011, p. 1-9.
4. Yuki I, Kim RH, Duckwiler G et al. Treatment of brain
arteriovenous malformations with high-flow arteriovenous
fistulas: risk and complications associated with
endovascular embolization in multimodality treatment.
Clinical article. J Neurosurg, 2010. Vol 113(4), p. 715-
722.
5. Bendszus M, Bartsch AJ, Solymosi L. Endovascular
occlusion of aneurysms using a new bioactive coil:
6. A matched pair analysis with bare platinum coils. Stroke.
2007. Vol 38(10), p. 2855-2857.
7. Hasegawa T, Kato T, Naito T, et al. Long-Term Outcomes
for Pediatric Patients with Brain Arteriovenous
Malformations Treated with Gamma Knife Radiosurgery,
Part 2: The Incidence of Cyst Formation, Encapsulated
Hematoma, and Radiation-Induced Tumor. World
Neurosurg, 2019, Vol 126, p. 1526-1536.
68

L.Kudrevičius et al. / Medical Physics in the Baltic States 15 (2021) 66-69
8. Hasegawa H, Hanakita S, Shin M, et al. Does Advanced
Age Affect the Outcomes of Stereotactic Radiosurgery for
Cerebral Arteriovenous Malformation? World Neurosurg,
2018, Vol 109, p. 715-723.
9. Hasegawa H, Hanakita S, Shin M, et al. Long-Term
Outcomes of Single-Session Stereotactic Radiosurgery for
Cerebellar Arteriovenous Malformation, with a Median
Follow-Up of 10 Years. World Neurosurg, 2017. Vol 98,
p. 314-322.
10. Zhu D, Li Z, Zhang Y, et al. Gamma knife surgery with
and without embolization for cerebral arteriovenous
malformations: A systematic review and meta-analysis. J
Clin Neurosci, 2018. Vol 56, p. 67-73.
11. Yang W, Luksik AS, Jiang B, et al. Venous Stenosis and
Hemorrhage After Radiosurgery for Cerebral
Arteriovenous Malformations. World Neurosurg, 2019.
Vol 122, p.1615
12. Mamalui-Hunter M, Jiang T, Rich KM, Derdeyn CP,
Drzymala RE. Effect of liquid embolic agents on Gamma
Knife surgery dosimetry for arteriovenous malformations.
Clinical article. J Neurosurg, 2011;. Vol 115(2), p. 364-
370.
13. Schlesinger DJ, Nordström H, Lundin A, Xu Z, Sheehan
JP. Dosimetric effects of Onyx embolization on Gamma
Knife arteriovenous malformation dose distributions. J
Neurosurg, 2016. Vol 125 (Suppl 1), p. 114-122.
14. Jaselskė, Evelina; Adlienė, Diana; Rudžianskas, Viktoras;
Urbonavičius, Benas Gabrielis; Inčiūra, Artūras. In vivo
dose verification method in catheter based high dose rate
brachytherapy // Physica medica. Oxford : Elsevier. ISSN
1120-1797. eISSN 1724-191X. 2017, vol. 44, p. 1-10.
DOI: 10.1016/j.ejmp.2017.11.003.
15. Jaselskė E, Adlienė D, Rudžianskas V, Korobeinikova
E,Radžiūnas A. Application of polymer dose gels for
millimeter scale target/tumor pretreatment immitation
using gamma knife facility//Nuclear instruments and
methods in physics research. Section B: Beam interactions
with materials and atoms. Amsterdam : Elsevier. ISSN
0168-583X. eISSN 1872-9584. 2020, vol. 470, p. 56-60.
16.Chen CJ, Norat P, Ding D, et al. Transvenous
embolization of brain arteriovenous malformations: A
review of techniques, indications, and outcomes.
Neurosurg Focus, 2018. Vol 45(1), p. 1-7.
69

MEDICAL PHYSICS IN THE BALTIC STATES 15 (2021)
Proceedings of International Conference “Medical Physics 2021”
4-6 November 2021, Kaunas, Lithuania
INCREASING THE ANTITUMOR EFFICACY OF DOXORUBICIN BY HIGH-
ENERGY IRRADIATION OF SALINE
Lyudmila ASLAMOVA1, Mykhaylo ZABOLOTNYY2, Galina DOVBESHKO3, Galina SOLYANIK4
1,2Taras Shevchenko National University of Kyiv, Ukraine; 3Institute of Physics of NASU, Kyiv, Ukraine,
3R.E. Kavetsky Institute of Experimental Pathology, Oncology and Radiobiology of NASU, Kyiv, Ukraine [email protected]; [email protected]; [email protected]; [email protected]
Abstract: The effect of modification of optical absorption
spectra and pharmacological activity of doxorubicin
using pre-irradiation of saline with electrons of 1 MeV
and an absorbed dose in the range of 10 - 80 kGy was
investigated. It was found that the effect of electron
irradiation of saline on the spectra of doxorubicin persists
for 2-3 months.
Keywords: doxorubicin, saline, electron irradiation,
carcinoma
1. Introduction
Almost all antitumor drugs are characterized by low
specificity of their antitumor activity. This is manifested
in the fact that the difference between the dose required
to suppress the tumor process and the dose that causes
significant damage to healthy organs and tissues of the
body is quite small. Existing or acquired resistance of
malignant tumor to the action of antitumor drugs also
significantly worsens the results of treatment of cancer
patients [1]. All these facts cause low efficiency of
antitumor drug therapy in the treatment of locally
advanced and disseminated forms of malignant
neoplasms and raise questions about the development of
ways to increase it [2]. A promising method of
sensitization of antitumor drugs is based on the use of
ionizing radiation for the modification of existing
antitumor drugs [3]. It was proposed earlier to modify the
properties of doxorubicin by pre-irradiation of the
solvent - saline In this case, a possible mechanism for
changing the therapeutic activity of drugs may be the
action on the molecules of doxorubicin formed by
radiolysis of the solvent free radicals and gas bubbles
surrounded by a double electric layer.
Given the above, the aim of the study was to study the
change in the effectiveness of doxorubicin during pre-
irradiation with high-energy electrons of sodium chloride
solvent to determine the patterns of radiation methods of
modification of existing anticancer drugs.
2. Samples and methods of experiment
The study was performed using the antitumor drug
doxorubicin (Sigma, USA). Solutions of doxorubicin
preparations were made from doxorubicin powder and
saline, bringing the concentration of the active drug to
5 mg/ml. FR irradiation was performed with high-energy
electrons with an energy of 1 MeV on a resonant linear
electron accelerator "Argus". The IR absorption spectra
were recorded on a Bruker IFS-66 spectrometer, and the
absorption spectra in the visible and UV range were
recorded on a Shimadzu UV-260 spectrophotometer with
a measurement range of 190-900 nm.
The dose of saline-absorbed radiation ranged from 4 to
80 kGy. The duration of the process of electron
irradiation of saline and the value of absorbed doses are
given in Table 1.
Table 1. Parameters of saline irradiation with high-energy
electrons
The fluence of
the electron
flux, sm-2
Duration of
irradiation
time, s
Absorbed
radiation dose,
kGy (I)
4ˣ1013 45 4
6ˣ1013 60 10
1ˣ1014 76 20
2ˣ1014 270 35
4ˣ1014 520 70
4ˣ1014 580 80
To study the pharmacological activity of doxorubicin
after its dissolution in sodium chloride irradiated with
high-energy electrons, Lewis’s lung cancer tumor cells
(LLC) were acquired from the National Bank of Cell
Lines and Tumor Strains IEPOR. RE. Kavetsky National
Academy of Sciences of Ukraine. Cells were maintained
70

L. Aslamova et al. / Medical Physics in the Baltic States 15 (2021) 70-73
in vitro in RPMI 1640 medium (Sigma, USA) with the
addition of 10% fetal calf serum (Sigma, USA) and 40
mg/ml gentamicin. The cytotoxic/cytostatic effect of
doxorubicin on LLC cells was used as an indicator of the
pharmacological activity of doxorubicin. To do this,
tumor cells were seeded in wells of a 96-well plate of 0.1
ml (2 × 10⁵ cells/ml) and incubated for 16 hours. After
the incubation period, doxorubicin ofvarious
concentrations, either dissolved in irradiated (absorbed
dose 40 kGy) or unirradiated saline (positive control) was
added to cells. For comparison, LLC were added to
irradiated and irradiated saline without doxorubicin. The
number of living cells in the wells after 24 hours of
incubation was determined by MTT test using a plate
reader at a wavelength of 545 nm.
3. The results of experiments and their discussion
The results of measurements in the visible and IR regions
of the spectra are illustrated by the graphs presented in
Figs. 1 and Fig. 2, respectively. The time between
irradiation of the samples and registration of their
vibrational spectra did not exceed 14-23 days. The
measurements showed that the absorption (A) of the
samples in this case was constant. The results of the
measurements in the visible region of the spectrum are
illustrated in Fig. 1, which shows the spectral
dependences of the absorption of doxorubicin molecules
in unirradiated and irradiated (70 kGy) saline.
Fig. 1. Absorption spectra in the visible region of a doxorubicin
solution dissolved in saline solution not irradiated (curve 1) and
pre-irradiated (curve 2)
The absorption spectrum of the solution obtained without
prior irradiation was analysed using its representation as
a composition of Gaussian functions. The graph of the
sum of these Gaussian functions conveys all the
characteristic features of the experimentally established
spectrum (Pearson's pairwise correlation coefficient
between them is 0.98). The absorption of radiation in
these regions is associated with the excitation of electrons
of the s-, p-and n-orbitals of the ground state and the
transitions of molecules into the excited state. Therefore,
while studying the shift of the positions of the maxima
and the change in intensity in this area, conclusions can
be drawn about the change in the optical properties of the
doxorubicin molecule. The dependence of the positions
of the local maxima of the sectors on the value of the
absorbed dose in the optical absorption spectra taken
immediately after irradiation of the solvent and the
preparation of solutions with doxorubicin are shown in
Table 2.
Table 2. Dependence of the position of the absorption maxima
on the dose in the optical absorption spectra taken immediately
after irradiation of the solvent and preparation of solutions with
doxorubicin
0 kGy, λ(nm) 70 kGy, λ (nm)
193,23 192,50
225,86 235,11
256,95 255,24
280,64 291,69
393,33 401,87
486,37 489,76
530,18 529,81
545,21 535,42
Significant dependence on the amount of absorbed dose
is also shown by the absorption spectra in the IR range,
illustrating the data shown in Fig. 2.
Fig. 2. The dependence of the normalized absorption of
doxorubicin on the wavelength in the unirradiated and
irradiated saline at different doses of absorbed electron
irradiation
Curve 1 describes the absorption spectrum of
doxorubicin in non-irradiated saline, curve 2 at I = 10
kGy, curve 3 - 35 kGy, and 4 - 70 kGy. As can be seen
from Fig. 2 for the above spectra is characterized by a
significant non-monotonic dependence of the
configuration of the spectra (the ratio of the amplitudes
of high-frequency and low-frequency maxima) from the
absorbed dose. This behavior may be due to coagulation
(clustering) of babstones, which occurs at high
concentrations of babstones (at high levels of radiation).
When comparing the dependences of A (k) for different
I, Pearson's correlation analysis was used. To determine
the value of the correlation coefficient between the
absorption spectra in the interval [500, 4000], this
interval was evenly divided into 3632 points. Pearson
correlation coefficients (K) were calculated using the
obtained data. Calculations showed that K (A (0 kGy),
A (10 kGy)) = 0.982; K (A (0 kGy), A (20 kGy)) = 0.935;
K (A (0 kGy), A (40 kGy)) = 0.864, K (A (0 kGy), A (60
kGy)) = 0828, K (A (0 kGy), A (80 kGy)) = 0.713. Thus,
the preliminary irradiation of the solvent, without
significantly changing the drugs (in all cases, the
71

L. Aslamova et al. / Medical Physics in the Baltic States 15 (2021) 70-73
correlation coefficient exceeds the critical value),
changes some of its properties in the oscillatory range,
which significantly depends on the conformational state
of the molecules.
Studies of the IR absorption spectra of the samples at
small values of the dose absorbed by the solvent (saline)
irradiation were performed. The obtained results are
illustrated in Fig. 3.
Fig. 3. Doxorubicin absorption spectrum in non-irradiated FR
and the difference between doxorubicin absorption spectra in
non-irradiated and irradiated (4 kGy) saline
Figure 3 shows the absorption spectrum of doxorubicin
in the IR range dissolved in non-irradiated saline and the
difference between the reduced absorption spectra (same
area under the curve) and the absorption spectra in non-
irradiated and irradiated saline. From the presented
curves it is seen that the radiation-induced changes in the
absorption spectra of the samples are close to the
magnitude of the noise effects when measuring the
absorption spectra of the samples. A similar comparison
of doxorubicin absorption spectra in non-irradiated and
irradiated solvent at an absorbed dose of 4 kGy was also
performed. The obtained data showed that the minimum
dose of solvent-absorbed high-energy electron
irradiation, at which changes in the conformational states
of dissolved doxorubicin are recorded, is 4 kGy. Similar
studies were performed to determine the effect of pre-
irradiation of the solvent on the absorption of
doxorubicin solution in the visible part of the spectrum.
Changes in the preliminary irradiation of the saline
solution are also recorded in the measurements of
absorption in the visible part of the spectrum, illustrating
the graphs. 4. Figure 4 shows the differences in the
normalized absorption spectra of doxorubicin in
unirradiated and irradiated (I1 = 10, I2 = 40, I3 = 80 kGy)
saline.
The graphs of the sum of the Gaussian functions thus
obtained describe all the characteristic features of the
experimentally established spectra (Pearson's pairwise
correlation coefficient between them is 0.98), which
made it possible to determine the effect of irradiation on
the displacement of the local maxima of absorption
spectra. The dependence of the positions of some local
maxima of the sectors on the value of the absorbed dose
in the optical absorption spectra are shown in Table 3.
Fig. 4. The difference between the absorption spectra Δi = A0 -
Ai of non-irradiated (A0) and irradiated Ai (i = 1 is obtained at
I = 10 kGy, i = 2-at I = 40 kGy, and = 3 - I = 80 kGy)
Table 3. Dependence of the position of the maximum on the
dose in the optical absorption spectra measured immediately
after irradiation of the solvent and preparation of solutions with
doxorubicin
0 kGy,
λ (nm)
225,9 280,6 393,3 486,4 545,2
80 kGy,
λ (nm)
235,8 291,6 402,1 489,8 535,9
The biomedical part of the research was conducted
according to a standardized method - special studies were
conducted to determine the effect of pre-irradiation of
saline on the antitumor properties of dissolved
doxorubicin. The experiments were performed in vitro
using the Lewis Lung Cancer (LLC) malignant cell line.
As an indicator of pharmacological activity,
cytotoxic/cytostatic effect of aqueous solutions of
antitumor drugs (with and without irradiation) against
LLC cells in in vitro experiments was used. To do this,
tumor cells were seeded in wells of a 96-well plate in 0.1
ml of nutrient medium (2x10⁵ cells/ml) and incubated
overnight. After that, drugs were added to the cells in 0.1
ml of fresh medium in a wide range of concentrations,
which progressively decreased. Fresh medium was added
to the control wells in the same volume without the test
agent. The number of living cells in the wells after a day
of incubation was determined using the MTT test. The
research results are illustrated in Fig.5. which shows the
dependence of the number (N) of living LLC cells (as a
percentage of the corresponding value in the control
wells) after 24 hours of incubation on doxorubicin of
different concentrations (X), dissolved in unirradiated (1)
and irradiated (2) saline.
Incubation of LLC cells for 24 hours in the presence of
doxorubicin dissolved in non-irradiated saline leads to a
concentration-dependent decrease in the number of living
cells (curve 1). This is due either to inhibition of tumor
cell proliferation (cytostatic effect) and/or their death
(cytotoxic effect) induced by the antitumor drug.
At the same time, doxorubicin dissolved in irradiated
saline enhances the cytotoxic/cytostatic effect, which is
most pronounced at low concentrations (curve 2): for
example, the number of living LLC cells at
concentrations below 3 μM decreased by an average of
72

L. Aslamova et al. / Medical Physics in the Baltic States 15 (2021) 70-73
20% (p <0.05) compared with the action of doxorubicin
dissolved in unirradiated saline.
Fig. 5. Dependence of the number (N) of live LLC cells (as a
percentage of the corresponding value in the control wells) after
24 hours of incubation with doxorubicin at different
concentrations (X), dissolved in unirradiated (1) and irradiated
(2) saline
Noteworthy is the low variability of cell survival after
incubation with doxorubicin on irradiated saline
compared to the corresponding values using the
irradiated solvent.
Thus, the obtained results confirm the ability of high-
energy electron irradiation of the solvent to increase the
pharmacological activity of antitumor drugs in the range
of low concentrations.
A possible reason for the change in the spectra of
doxorubicin solution when using a pre-irradiated solvent
is the conformational rearrangements of its molecules
caused by interaction with babstones and their clusters,
the concentration of which depends on the dose of
absorbed radiation. Coagulation of babstones and cluster
formation is initiated by force fields formed by double
electric layers of babstones. It was taken into account that
the ponder motor force between charged babstones of the
same name during the implementation of polarization
processes may cause mutual attraction of babstones.
4. Conclusions
1. The effect of modification of the pharmacological
activity of doxorubicin using pre-irradiation of
physiological solution with electrons with an energy of 1
MeV and a dose of absorbed irradiation in the range of
10 - 80 kGy; an explanation of the effect within the model
of babstones is offered.
2. The use of pre-irradiated saline to dissolve doxorubicin
changes its optical absorption spectrum. The minimum
dose of electron irradiation absorbed by saline (1 MeV),
at which changes in the spectra of doxorubicin are
recorded, is 4 kGy. The effect of electron irradiation of
saline on the spectra of doxorubicin persists for 2-3
months.
3. As part of the evaluation of the pharmacological
activity of the antitumor drug doxorubicin dissolved in
irradiated saline, it was found that it enhances the
cytotoxic/cytostatic effect on LLC cells compared to the
effect of doxorubicin dissolved in unirradiated saline.
The number of live LLC cells under the influence of
irradiated saline doxorubicin at concentrations less than
3 μM decreased by an average of 15% compared with the
corresponding figure when exposed to doxorubicin
without irradiation. It is shown that the modifying effect
of irradiation is most pronounced at low concentrations
of doxorubicin (<3 μM).
5. References
1. Nurgali K., Jagoe R., Abalo R. Editorial: Adverse Effects of
Cancer Chemotherapy: Anything New to Improve
Tolerance and Reduce Sequelae. Front. Pharmacol. 9, 245,
2018. https://doi.org/10.3389/fphar.2018.00245
2. Orel V. B., Zabolotnyy M. A., Orel V. E. Heterogeneity of
hypoxia in solid tumours and mechanochemical reactions
with oxygen nanobubbles, Medical Hypotheses 102, 82-86,
2017. https://doi.org/10.1016/j.mehy.2017.03.006
3. Kirsch D., Diehn M., Kesar Wala A. et al. The Future of
Radiobiology. J Natl Cancer Inst., 110(4), 329-340, 2018.
https://doi.org/10.1093/jnci/djx231
4. Aslamova L. I., Zabolotnyy M. A., Dovbeshko G. I. et al.
Electron irradiation as a method of increasing efficacy of
some water-soluble drugs in oncology, Proceedings of the
14th International Conference “Medical Physics in the
Baltic States”, Kaunas, 151-152, 2019.
73

MEDICAL PHYSICS IN THE BALTIC STATES 15 (2021)
Proceedings of International Conference “Medical Physics 2021”
4-6 November 2021, Kaunas, Lithuania
EXTENDING LAP PRODUCT PORTFOLIO:
SOLUTIONS FOR PATIENT QA AND MACHINE QA
Ramune ULRICH
Sales manager BU Healthcare. LAP GmbH Laser Applikationen
Abstract: LAP’s market-leading laser systems are used for patient positioning in radiation therapy processes worldwide.
Since few years already LAP has included QA products into the portfolio for the RT and is further extending this product
line by new developments. The very latest solutions for patient QA is RadCalc software for a secondary check of the
treatment plan, as well as the fully motorised water phantoms for commissioning and quality assurance – THALES 3D
MR SCANNER (for MR-Linacs) and THALES 3D SCANNER (for bore-type Linacs).
Keywords: radiotherapy, patient QA, dosimetric verification software, phantom, commissioning, machine QA, MR-Linac
1. Introduction
Safety is a priority in radiation therapy. Protecting patients against ionizing radiation to healthy tissue is essential. Every
measurement must be as accurate as possible. Various QA processes can produce different results; therefore it is
imperative to independently verify calculations a second time. This is exactly what RadCalc does: independently verify
dosimetric calculations in an easy-to-use software platform.
Our very latest products are the 2 motorised water phantoms for commissioning and quality assurance of MR-Linac
(THALES 3D MR SCANNER) and bore-type Linacs (THALES 3D SCANNER). Developed together with the end-users,
these phantoms allows the user to save valuable time with efficient quality assurance and intuitive operation.
Below kindly find more detailed elaboration of the features and benefits of the above products.
2. RadCalc QA Software – advanced platform for independent and unbiased patient QA
RadCalc secondary check software is:
Fast: a fully automated import and export is much faster when compared to
manual data entry and eliminates transcription errors.
Independent: it provides the opportunity to check all results independently
from the manufacturer’s TPS. This ensures unbiased third party validation.
Accurate: studies have shown the verification dose to be within + 3% of the
treatment plan dose providing excellent accuracy.
Easy to use: due to its user-friendly interface the software is easy to use. Clear
structure, guided menus, sophisticated layout make the recurring tasks simple
and time-saving.
Powerful: most common treatment plans can be verified with RadCalc.
Comprehensive analytical features provide powerful tools for physicists for
plan analysis.
RadCalc includes comprehensive institution and physics data setup, import of radiation therapy plans, automated
dosimetric calculations, and export to record and verify systems. RadCalc also provides powerful reporting tools and
flexible site licensing.
74

R. Ulrich / Medical Physics in the Baltic States 15 (2021) 74-77
RadCalc is modular as well as multitasking and versatile software as it supports the following:
Modalities: MR-Linacs, Linacs, Halcyon/Ethos, TomoTherapy, CyberKnife, GammaKnife, Cobalt 60, Superficial,
and Brachytherapy.
Treatment techniques: hypofractionation, adaptive radiation therapy, SBS/SRBT, IMRT, VMAT and Brachytherapy
techniques.
3D functionalities of RadCalc
3D Calculation Algorithms: RadCalc provides Collapsed Cone Convolution
Superposition and Monte Carlo based algorithm modules, that deliver fast, easy, and
accurate 3D Dose Volume verification. RadCalc’s 3D Monte Carlo module employs
the most established Monte Carlo dose engine available (BEAMnrc), and also utilizes
proprietary machine modelling acquired from McGill University.
DVH Protocols: Any number of DVH protocols can be defined used from the
analysis screen within RadCalc. Using Rules in RadCalc, different DVH protocols
can be automatically selected and applied to the specific plan. The software
automatically checks whether the DVH objectives are met for critical structures using
both the TPS and RadCalc’s 3D dose. Analysis reports are automatically attached to
the verified plan or to a directory of the choice on the server.
3D Dose Analysis: RadCalc provides Percent difference, DVH, Distance to
Agreement, Gamma analysis tools to evaluate 3D computations. The functionality
includes RadCalcAIR (automated Import & Report) providing a fully automated
process for plan import, computations, 3D dose analysis and report generation.
RadCalc’s fully automated process immediately alerts the plans that fail to pass the
pre-set Gamma Analysis acceptance criteria.
RadCalc allows the user to import from radiation TPS, verify and record systems, and/or virtual simulation software
through DICOM RT or other proprietary formats. RadCalc provides an export utility that allows users to export treatment
plans to a format readable by a record and verify system, what saves re-entry of data, ensures that patient’s medical
records contain verification results and allows users to export customised plans for special QA processes. Users may
export plans and calculations to any record and verify system that accepts DICOM RT or RTP Connect format files.
3. THALES 3D MR SCANNER and THALES 3D SCANNER - Motorised water phantoms for commissioning
and QA of MR-Linacs/Linacs
THALES 3D MR SCANNER offers comprehensive and efficient commissioning and regular quality assurance of MR-
guided Linacs such as ViewRay’s MRIdian, while THALES 3D SCANNER – for bore-type Linacs such as VARIAN’s
Halcyon and Ethos.
Fig. 1 THALES MR 3D SCANNER for ViewRay’s MRIdian Fig. 2 THALES MR 3D SCANNER VARIAN’s Ethos
75

R. Ulrich / Medical Physics in the Baltic States 15 (2021) 74-77
Both motorised phantoms comprise a carriage system, a water phantom, an integrated electrometer and the THALES
software – all-in-one (Fig. 3), saving valuable time with efficient QA and the intuitive operation. From set-up to
measurement takes only 15 minutes.
Fig. 3 THALES MR 3D SCANNER/3D SCANNER components
Easy to use: the water phantom and the THALES software can be used easily and intuitively ensuring efficient and
productive workflows.
Saves times substantially: easy and fast set-up of the phantom as well as accelerated workflows, saves valuable time.
All the cables and connections are placed conveniently in the carriage system. After connecting the system, filling the
water reservoir takes only a few minutes.
The user can use field detectors from different manufacturers. Field detectors can be installed both horizontally and
vertically. The integrated electrometer offers two independent channels with different bias voltages. The water level
sensor allows the field detector to be set up correctly, what ensures measurement accuracy. The reference detector is
positioned with the help of the positioning plate. After this step, the phantom can be moved into the MR-Linac or Linac.
The process for the automatic orientation of the Central Axis (CAX) completes the setup.
Fig. 4 Example of the setup of THALES MR 3D SCANNER at ViewRay’s MRIdian
User friendly, well-structured and efficient THALES software provides high flexibility and portability.
Both integration in clinical network and the direct connection to the phantom are possible. No additional tools are required
for the acquisition of data, administration or evaluation. The data archive has an intelligent search function allowing the
user to find measurement sequences and generate individual reports.
The THALES software is web-based and optimized for Mozilla Firefox and Google Chrome browsers.
1. Carriage system
2. Extension cable for the reference detector
3. Extension cable for the field detector
4. Water phantom
5. Manual control unit with connection cable
6. Connection cable
7. Network cable
8. Mains power cable
76

R. Ulrich / Medical Physics in the Baltic States 15 (2021) 74-77
Fig. 5 Workspace for trajectories Fig. 6 Workspace for measurements
It also provides special beam analysis methods for large and small field sizes which are used in FFF mode for both
transversal and inline measurements.
The software recommends an automatic CAX measurement which combines the diagonal and inline profiles in two
different depths with a suggested correction shift.
Users have the option of working with acquired data and filter it by various parameters such as profile type, detectors,
acquisition date and many others.
With THALES 3D MR SCANNER/THALES 3D SCANNER the user can acquire data reliably and can perform beam
model validation. The THALES software provides comprehensive analysis and comparison tools for the verification of
the user’s data: Profiles for small and large fields, Percentage Depth Dose, Off-axis fields.
LAP GmbH Laser Applikationen
Zeppelinstrasse 23, 21337 Lueneburg, Germany
P +49 4131 9511-95 E [email protected]
www.lap-laser.com, www.radcalc.com
LinkedIn: LAP Laser
YouTube: laplaser
77

MEDICAL PHYSICS IN THE BALTIC STATES 15 (2021)
Proceedings of International Conference “Medical Physics 2021”
4-6 November 2021, Kaunas, Lithuania
FORMATION AND INVESTIGATION OF Cu/CuOx NANCOMPOMCOSITE
FILMS FOR LOW DOSE DOSIMETRY APPLICATION
Džiugilė VALIUKEVIČIUTĖ1, Judita PUIŠO2, Jurgita LAURIKAITIENĖ3, Linas KUDREVIČIUS4 1, 2, 3, 4 Department of Physics, Kaunas Universty of Technology, Studentų 50, Kaunas 51368, Lithuania
1dziugile.valiukevič[email protected]; [email protected]; [email protected], [email protected]
Abstract: 𝐶𝑢/𝐶𝑢𝑂𝑥 nanoparticles in gelatin and PVP-
gelatin composites were formed by reducing method.
Transparent 𝐶𝑢/𝐶𝑢𝑂𝑥 nanoparticles in gelatin and PVP-
gelatin films were produced by simple and suitable
drying method. Manipulation of the reduction kinetics
allows ready control over local surface plasmon
resonance of 𝐶𝑢/𝐶𝑢𝑂𝑥. The impact of X-ray on
𝐶𝑢/𝐶𝑢𝑂𝑥 nanoparticles in polymer composite medium
was investigated.
Keywords: 𝐶𝑢/𝐶𝑢𝑂𝑥, nanoparticles, X-ray, mass
attenuation coefficient, linear attenuation coefficient,
UV-VIS, LSPR
1. Introduction
Stable copper oxides (𝐶𝑢𝑂𝑥), which consists of two
substances, namely cupric oxide (𝐶𝑢𝑂) and cuprous
oxide (𝐶𝑢2𝑂), are well-known p-type semiconductors
[1]. Due to the natural abundance of copper, 𝐶𝑢𝑂𝑥was
used as a hole transport material in polymer solar cells
[1]. It is conductive and light transmittance, non-toxic,
low cost and easily manufactured material [1]. Cu
composite materials display antiviral, algaecide and
fungicide properties [2].
The ultrathin 𝐶𝑢𝑂𝑥 films were fabricated via
electrochemical deposition [1], magnetron sputtering [2-
3], chemical Vapor Deposition (CVD) and physical
Vapor Depositions (PVD) techniques [4].
Nanoparticles have been synthesized through several
chemical methods such as polyol, reverse micelles,
electron beam irradiation, micro-emulsion and wire
explosion techniques and in-situ chemical synthesis.
However, soluble polymers to form a complex with
metal ions, that is important for copper nanoparticles
(CuNPs) synthesis, since it prevents the nanoparticles
aggregation [5].
Physical and chemical methods used to synthesize
polymer nanocomposites, depending on the
nanoparticle-polymer interactions. Usage of natural or
synthesis biopolymers as stabilizers for the synthesis of
CuNPs has gained momentum because of their
availability, biocompatibility and low toxicity. While
the as-synthesized colloidal Cu nanocrystals is partially
coated with organic ligands in order to prevent
aggregation and provide solubility in organic solvents,
the metal surface may still interact strongly with solvent
molecules and react with dissolved oxygen [6].
The spectra clearly show the disappearance of the Cu
surface plasmon peak at approximately 570 nm
occurring simultaneously with the appearance of an
excitonic peak centered at approximately 715 nm, which
corresponds to the first exciton transition for copper
oxide [6].
The optical absorption range observed for the 𝐶𝑢/𝐶𝑢𝑂𝑥
lies between 200 - 730 nm. The spectral region between
500 - 600 nm shows the inter-band transition of 𝐶𝑢(𝐼).
The optical absorption between 600 - 730 nm shows the
exciton band and the d-d transition of Cu(II) [7].
The LSPR of Cu nanoparticles incorporated to the
polymers are around 750 nm, thus an artifact or a step
rise occurs. The appearance of artifact around 750 nm is
correlated to the change of the range of measurement
from visible to infrared IR region [8].
The initial intensity of the copper plasmon was strongly
dependent on the properties of the solvent used to form
the nanocrystal dispersion; solvents with π-bonds
significantly reduced (by >3-fold) the plasmon intensity
and this effect was attributed to electron sharing
between the solvent and the copper surface. The
damped plasmon only recovered to its solvent-
independent intensity once the nanocrystal surface
oxidized and eliminated the solvent−Cu surface
interactions. Solvents without π-bonds induced only a
very small damping of the plasmon, and at longer time
scales all solvents induced similar changes in the optical
properties as oxidation converted the nanocrystals from
metallic copper to semiconducting copper oxide.
As the nanocrystals continue to oxidize from metallic
Cu to form semiconducting Cu2O particles, two
additional optical phenomena are observed:
78

Dž. Valiukevičiutė et al. / Medical Physics in the Baltic States 15 (2021) 78-81
a shift in the Cu plasmon due to the changing dielectric properties of the local environment
around the metal nanocrystal as an oxide shell
is generated and replaces the interface between
the Cu metal and the organic capping
ligands/solvent.
the eventual attenuation of the plasmon and
appearance of an excitonic feature that
corresponds to the semiconducting 𝐶𝑢2𝑂 [6] The local plasmon resonance is very sensitive to the
electronic properties of the material at the metal surface
and, over the course of the oxidation process, the Cu
surface initially surrounded by organic molecules with a
low dielectric is eventually surrounded with copper
oxide (the dielectric constant for 𝐶𝑢2𝑂 is approximately
7.1) [6].
The increase in the local dielectric constant is expected
to yield a measurable red shift, as has been observed for
other metal/semiconductor hybrid nanomaterials [6].
The aim of this work was the development and
characterization of 𝐶𝑢/𝐶𝑢𝑂𝑥 nanoparticles enriched
radiation sensitive free standing polymer films.
2. Theory
Irradiation of 𝐶𝑢𝑂 leads to surface oxidative radical
formation:
𝐶𝑢𝑂 + ℎ𝜈(< 660 𝑛𝑚) ⟶ 𝐶𝑢𝑂(𝑒𝑐𝑏− , ℎ𝑣𝑏
+ ) (1)
The 𝑒𝑐𝑏− is produced from 𝐶𝑢𝑂 ( 𝑝- type) with band
gap energy of 1.7 eV, a flat bland potential of -0,3 V
(SCE) (𝑝𝐻 = 7) and valence band and +1.4 V SCE
[reference]
The electron-hole is formed with photon energies
exceeding the band-gap 𝐶𝑢𝑂. The excited electron
could either react directly with 𝑂2 forming 𝑂2− or by
reducing 𝐶𝑢2+ lattice to 𝐶𝑢+leading to ensuing reaction
and formation of 𝑂2− radicals [10]:
𝐶𝑢𝑂(𝑒𝑐𝑏− ) + 𝑂2 ⟶ 𝐶𝑢𝑂 + 𝑂2
∙− (2)
𝐶𝑢𝑂(𝑒𝑐𝑏− ) + 𝑂2 ⟶ 𝐶𝑢𝑂(𝐶𝑢+) (3)
𝐶𝑢𝑂(𝐶𝑢+) + 𝑂2 ⟶ 𝐶𝑢𝑂(𝐶𝑢2+) + 𝑂2∙− (4)
The equilibrium between 𝐻+ and 𝑂2∙− lead to the
formation of the 𝐻𝑂2∙ radical. 𝐻𝑂2
∙ generates 𝐻2𝑂2
adsorbed on 𝐶𝑢𝑂 [10]:
𝐻+ + 𝑂2∙− ⟶ 𝐻𝑂2
∙ (𝑝𝑎𝑟𝑡𝑖𝑎𝑙 𝑂2∙−), 𝑝𝐾𝑎 = 4.8 (5)
𝐶𝑢𝑂(𝐶𝑢2+) + 𝐻𝑂2∙ + 𝐻+ ⟶ 𝐶𝑢𝑂(𝐶𝑢2+) +
𝐻2𝑂2, 𝑤𝑖ℎ 𝑘 = 0.6 − 2.3 𝑀−1𝑠−1 (6).
Gelatine swells and adsorbs 5–10 times its weight
of water to form a gel. Gelatine forms a gel in water at a
minimum concentration of 0.5% and at pH range from 4
to 8 [11].
Gelatine is widely used as a food ingredient and a
gelling agent forming transparent elastic thermos-
reversible gels on cooling below ~35 °C. The
chemically structure of gelatine is described by a linear
sequence of amino acids. It is always written from the –
NH2 end to the –COOH end by convention. Gelatine
contains relatively high levels of the following amino
acids: glycine 26–34%, proline 10–18% and
hydroxyproline 7–15%. Other significant amino acids:
alanine 8–11%, arginine 8–9%, aspartic acid 6–7% and
glutamic acid 10–12%. The water content will vary
between 6–9% [11]
Two methods are usually explored for preparation of
gelatine: the acid and the alkaline processes (in the pre-
treatment part) to produce type A and type B gelatines,
respectively. In the acid one, pigskin with an isoionic
point of pH = 7 to 9 is used. Photographic and
pharmaceutical grades of gelatine are often produced
from cattle bones and pig skin [11].
3. Materials and instruments
3.1. Materials
Copper sulphate pentahydrate ((𝐶𝑢𝑆𝑂)4 ∙ 5𝐻2𝑂; ≥ 99.5
% CAS 7758-99-8), copper nitrate trihydrate
((𝐶𝑢𝑁𝑂)3 ∙ 3𝐻2𝑂; ≥ 99 %), were purchased from
Sigma – Aldrich. Tri-Sodium citrate dihydrate
(HOC(COONa)(CH2COONa)2 2H2O; 99%) ascorbic
acid (𝐶6𝐻8𝑂6 Ph. Eur.), and polyvinyl pyrrolidone
(PVP, (C6H9NO)n); gelatine (𝐶102𝐻151𝑂39𝑁31) were
used for 𝐶𝑢/𝐶𝑢𝑂𝑥 polymer films preparation.
𝐶𝑢/𝐶𝑢𝑂𝑥 polymer films were prepared by casting
copper salt polymer gels in advance. 5 g of copper salt
gelatine gels were casted in Petri dishes and dried at
room temperature in a dark space. The chemical
composition of copper salt gelatine gel is presented in
Table 1 and Table 2
Table 1. Chemical composition of 𝐶𝑢/𝐶𝑢𝑂𝑥 gelatine gel
V11-
V12, %
V21-
V22, %
V31-
V32, V61-
V62,
%
V41-
V4, %
V71-
V72, %
V51-
V52, %
CuSO4 0.46 0.92 1.38 2.30 0.71 0.92
C102H151
O39N39 9.58 9.58 9.58 9.58 9.67 9.58
𝐶6𝐻8𝑂6 0.02 0.02 0.02 0.02 0.01 0.01
H2O 89.94 89.48 89.02 88.10 89.61 89.49
Table 2. Chemical composition of Cu/CuOx PVP-gelatine
gels
CuPVPG21,
%
CuPVPG1,
%
CuPVPG5,
%
Cu(NO3)2 0 0.35 0.35
CuSO4 0.31 0.00 0.00
PVP 0.1 0.19 0.09
C102H151O39N31 9.62 9.43 9.26
H2O 89.98 90.02 90.12
Na3C6H5O7 0 0.00 0.19
3.2. Irradiation and analytical techniques
𝐶𝑢/𝐶𝑢𝑂𝑥 gelatine and 𝐶𝑢/𝐶𝑢𝑂𝑥 PVP gelatine films
were irradiated with 6 MeV energy X-ray photons. The
irradiation doses varied from 0.01 to 5.00 Gy. Dose
values and voltage for sample irradiation were chosen in
accordance with the main aim of this research: to
investigate the radiation sensitivity of the prepared
𝐶𝑢/𝐶𝑢𝑂𝑥 containing polymers to low dose irradiation.
79

Dž. Valiukevičiutė et al. / Medical Physics in the Baltic States 15 (2021) 78-81
Optical properties of experimental samples were
investigated using UV-VIS spectrometer Ocean Optics
with USB400 (range 190 nm – 900 nm, resolution - 1.5
nm). The mass density of the 𝐶𝑢/𝐶𝑢𝑂𝑥 gelatine and
𝐶𝑢/𝐶𝑢𝑂𝑥 PVP gelatine films was calculated using the
data obtained from the mass balance (Cart Scale
(100.0001) g) and electronic digital Vernier Powerfix
G calliper (0-150 mm with accuracy 0.01 mm) and
BGF-Technic Werkzeug micrometer ( 0-25 mm with
accuracy 0.001 mm).
3.3. Theoretical calculations
The study of theoretical mass attenuation coefficients of
the 𝐶𝑢/𝐶𝑢𝑂𝑥 gelatine and 𝐶𝑢/𝐶𝑢𝑂𝑥 PVP gelatine films
at 6 MeV were done using WinXCOM web database,
which can be used to calculate photon cross sections for
scattering, photoelectric absorption and pair production,
as well as total attenuation coefficients, for any element,
compound or mixture (Z≤100), at energies from 1 keV
to 100 GeV.
4. Results
4.1. 𝑪𝒖/𝑪𝒖𝑶𝒙 gelatine films characterisation
Due to the drying process, the mass of dried 𝐶𝑢/𝐶𝑢𝑂𝑥
gelatin films decreased 88.6 %. The mass density of
dried 𝐶𝑢/𝐶𝑢𝑂𝑥 gelatin films varied from 1294 to 1451
kg/m3 (Table 3). The UV-VIS spectra of 𝐶𝑢/𝐶𝑢𝑂𝑥
gelatine films are presented in Fig. 1. The absorbance
band was very weak at that low (𝐶𝑢𝑆𝑂)4 ∙ 5𝐻2𝑂 and
ascorbic acid concentration but in shift of wavelength of
absorbance peak is found at 711-730 nm. It is indicating
the formation of the 𝐶𝑢/𝐶𝑢𝑂𝑥 nanoparticles medium.
X-ray irradiation increased the absorbance band of
𝐶𝑢/𝐶𝑢𝑂𝑥 in some cases up to 55%. Due to finding
about the influence of reducer on 𝐶𝑢/𝐶𝑢𝑂𝑥 formation in
gelatine medium, ascorbic acid was replaced by PVP.
However, PVP can serve as a surface stabilizer, growth
modifier, nanoparticle dispersant, and reducing agent.
400 500 600 700 800 900
0.0
0.2
0.4
0.1 Gy
0 Gy
Ab
sorb
ance
, a.
u.
Wavelength, nm
CuSO43H2O : 0.46 wt%
C6H8O6- 0.02 wt%5 Gy
a)
400 500 600 700 800 900
0.0
0.2
0.4
Ab
sorb
ance
, a.u
.
Wavelength, nm
CuSO43H2O : 0.71 wt%
C6H8O6- 0.01 wt%
0 Gy
0.1 Gy
5 Gy
b)
Fig.1. 𝐶𝑢/𝐶𝑢𝑂𝑥 nanoparticles on gelatine and CuSO4
Table 3. Mass density, thickness and LSPR of 𝐶𝑢/𝐶𝑢𝑂𝑥 gelatin films
Sample t, mm ,
kg/m3
LSPR,
nm
A, %
after
0.1 Gy
A, %
after
5 Gy
V11- V12 0.159 1378 731 11 17
V21- V22 0.155 1294 712 48 55
V31- V32 0.178 1451 718 - -
V41- V42 0.186 1411 712 14 14
V51- V52 0.180 1311 - - -
V61- V62 0.190 1382 721 40 46
V71-V72 0.38 1296 720 6 24
The UV-VIS spectra of 𝐶𝑢/𝐶𝑢𝑂𝑥 gelatin films with
PVP additives are presented in Fig. 2. Produced films
were lightly blue and transparent. The absorbance
𝐶𝑢/𝐶𝑢𝑂𝑥band was found at ~710 nm, with very low
intensity (Fig 2). The influence of X-ray irradiation on
𝐶𝑢/𝐶𝑢𝑂𝑥 formation in PVP-gelatine medium was also
insignificant, but an increased absorbance at 400-450
nm was observed. It could be associated with
crosslinking of the PVP and sulphur compounds due to
X-ray formation.
400 500 600 700 800 900
0.00
0.02
0.04
0.06
0.08
0.10
0.12
0.14
0.16
0.18
0.20
0.1 Gy5 Gy0 Gy
Abs
orba
nce,
a.u
.
Bangos ilgis, nm
CuPVPG21
Fig. 2. 𝐶𝑢/𝐶𝑢𝑂𝑥 in PVP and gelatine nanocomposites
using copper nitrate solution CuSO4
The mass density of dried 𝐶𝑢/𝐶𝑢𝑂𝑥 PVP - gelatine
films varied from 1245 to 1333 kg/m3 (Table 3)
Table 4. Mass density, thickness and LSPR of 𝐶𝑢/𝐶𝑢𝑂𝑥
gelatin films
Sample t, mm , kg/m3
LSPR, nm
A, % after
0.1 Gy
A, % after
5 Gy
CuPVP
G21
0.119 1287 ~710 - -
CuPVP
G1
0.109 1333 726-729 15.80 18.77
CuPVPG5
0.147 1245 728 33.75 39.84
According to Raman spectroscopy, FTIR spectroscopy
and theoretical studies [12, 13], the PVP-metal
interaction occurs through the carbonyl oxygen or
nitrogen atoms of the repeating unit and the metal
surface. To investigate the influence of anions of copper
salt on the growth and stability of PVP-gelatine
composites, 𝐶𝑢/𝐶𝑢𝑂𝑥 in PVP solution (𝐶𝑢𝑆𝑂)4 ∙ 5𝐻2𝑂
was changed to(𝐶𝑢𝑁𝑂)3 ∙ 3𝐻2𝑂. Produced films using
(𝐶𝑢𝑁𝑂)3 ∙ 3𝐻2O were also lightly blue and transparent.
80

Dž. Valiukevičiutė et al. / Medical Physics in the Baltic States 15 (2021) 78-81
UV-VIS spectra of 𝐶𝑢/𝐶𝑢𝑂𝑥 in PVP- gelatine films are
provided in Fig.3.
Fig.3. 𝐶𝑢/𝐶𝑢𝑂𝑥 in PVP and gelatine nanocomposites using
copper nitrate solution (𝐶𝑢𝑁𝑂)3 ∙
In comparison with the samples produced using
(𝐶𝑢𝑆𝑂)4 ∙ 5𝐻2𝑂), the intensity of absorbance was three
times higher , thus corresponding to a higher content of
nanoparticles in the medium. X-ray irradiation of
samples induced a small redshift of absorbance band
and increased the intensity by 15.80 % and 30.74 % for
0.1 Gy and 5 Gy of irradiation dose, respectively. The
PVP-surface interaction depends on both the metal and
solvent being used. The weak reducing ability of PVP is
limited by the number of hydroxyl end groups. By
adding tri-sodium citrate dehydrate, which is very
common reducer and stabilisator for Au and Ag
nanoparticles synthesis, 𝐶𝑢/𝐶𝑢𝑂𝑥 in PVP- gelatine
films produced are also lightly blue and transparent. The
absorbance band of Cu/CuOx nanoparticles was
observed at 726 nm (Fig.3). Increasing the dose of X-
ray irradiation induced the redshift from 726 m to
729nm and increased the absorbance by 15.80 % and
18.77 % for 0.1 Gy and 5 Gy, respectively.
By adding of trisodium citrate dehydrate as additional
reducer to (𝐶𝑢𝑁𝑂)3 PVP and gelatine solution allow
the formation of PVP-gelatine composited with
𝐶𝑢/𝐶𝑢𝑂𝑥nanoparticles. The absorbance band of
Cu/CuOx was at 728 nm with lower intensity
absorbance band (Fig.4). Due to X-ray irradiation the
absorbance of 𝐶𝑢/𝐶𝑢𝑂𝑥 band increased by 33.75 % and
39.84 % for 0.1 Gy and 5 Gy.
400 500 600 700 800 900
0.0
0.2
0.4
Abso
rban
ce, a.
u.
Wavelength, nm
CuPVPG5 728.4 nm 5 Gy
0.1 Gy
0 Gy
Fig.4. 𝐶𝑢/𝐶𝑢𝑂𝑥 in PVP and gelatine nanocomposites with
trisodium citrate dehydrate additives and using (𝐶𝑢𝑁𝑂)3
5. Conclusions
𝐶𝑢/𝐶𝑢𝑂𝑥 in gelatine and PVP- gelatine nanocomposites
have been produced. Clearly seen plasmon peaks were
identified. It was shown that the intensity and position
of peaks was changing due to X-ray irradiation. Based
on these findings 𝐶𝑢/𝐶𝑢𝑂𝑥 composites were suggested
as the possible candidates for low dose dosimetry
applications. However more detailed investigations are
needed to have full scope of properties of these
composites
6. References
1. Miao X., et.al. Room-temperature electrochemical
deposition of ultrathin CuOx film as hole transport layer
for perovskite solar cells. Scripta Materialia 165, 2019. p.
134-139,
2. Castro C., et al. Structure–reactivity relations for DC-
magnetron sputtered Cu-layers during E. coli inactivation
in the dark and under light. Journal of Photochemistry and
Photobiology A: Chemistry 216, 2010, p. 205-202.
3. Nejand B. et al. Cuprous Oxide as a Potential Low-Cost
Hole-Transport Material for Stable Perovskite Solar Cells.
ChemSusChem 9 2016, p. 302-313. doi:
4. Santos-Cruz D., et al. CuOX thin films by direct oxidation
of Cu films deposited by physical vapor deposition.
Results in Physics 7, 2017, p. 4140-4144,
5. Aziz S.B., Morphological and Optical Characteristics of
Chitosan(1−x):CuOx (4 ≤x≤ 12) Based Polymer Nano-
Composites: Optical Dielectric Loss as an Alternative
Method for Tauc’s Model. Nanomaterials 7, 2017, p. 444.
6. Walker, K.P..et al. Solvent-Dependent Surface Plasmon
Response and Oxidation of Copper Nanocrystals. J. Phys.
Chem. C 115, 2011, 115, p. 1793–1799.
7. Rtimi S., et al. Effect of light and oxygen on repetitive
bacterial inactivation on uniform, adhesive, robust and
stable Cu-polyester surfaces. Journal of Advanced
Oxidation Technologies, 20, 2017, p. 20160178.
8. Biswas A., et al. Tunable multiple plasmon resonance
wavelengths response from multicomponent polymer-
metal nanocomposite systems. Appl. Phys. Lett. 84, 2004,
p. 2655
9. Kanninen, P. et al. Influence of ligand structure on the
stability and oxidation of copper nanoparticles. Colloid
Interface Sci. 318, 2008, p. 88 – 95.
10. Goldstein S. et al. D. A mechanistic study of the
copper(II)-peptide-catalyze ssuperoxide dismutation. A
pulse radiolysis study. J. Am. Chem. Soc. 112 1990, p.
6489–6492
11. Calixto S, et al. Gelatin as a Photosensitive Material.
Molecules. 23 2018 p. 2064.
12. Borodko Y., et al. Probing the Interaction of
Poly(vinylpyrrolidone) with Platinum Nanocrystals by
UV-Raman and FTIR. J. Phys. Chem. B 110, 2006, 110, p.
23052-23059.
13. Koczkur K. M., et al. Polyvinylpyrrolidone (PVP) in
nanoparticle synthesis, Dalton Trans., 44, 2015, p. 17883
—17905
400 500 600 700 800 900
0.0
0.2
0.4
5 Gy
0.1 Gy
725.6 nm
Abs
orba
nce,
a.u
.
Wavelength, nm
CuPVPG1
729.3 nm
0 Gy
81

MEDICAL PHYSICS IN THE BALTIC STATES 15 (2021)
Proceedings of International Conference “Medical Physics 2021”
4-6 November 2021, Kaunas, Lithuania
DEVELOPMENT OF POLYMER GEL BASED EXHALED BREATH
BIOMARKERS DETECTION SENSOR FOR COVID-19 MONITORING
2 empty lines using 10-point font with single spacing
Neringa ŠEPERIENĖ1, Ignas PIKAS2 1MB Hadroneda; 2Kaunas University of Technology
[email protected]; [email protected]
3 empty lines using 10-point font with single spacing
Abstract: The pandemics of SARS-CoV-2 left hospitals
and health care facilities in extreme need of fast and
non-invasive corona illness detection and effective
monitoring system. Polymerisable hydrogels such as
VIPET, nMAG, nPAG used for radiation detections has
showed huge potential for COVID-19 biomarkers
detection in exhaled patient’s breath. The initial
prototype of sensor which showed an accuracy of 98%
for detecting common COVID-19 biomarker, acetone,
was developed and presented in this paper. 1 empty line using 10-point font with single spacing
Keywords: Hydrogel, COVID-19, biomarker, acetone.
1 empty line using 10-point font with single spacing
1. Introduction
Due to the severe respiratory syndrome-coronavirus-2
(SARS-CoV-2) pandemics the hospitals and treatment
facilities are facing highly increased patient numbers.
The World Health Organization reported cases in Italy,
Spain, USA and other countries, resulting in
overcrowded treatment centres and lack of fast, non-
invasive and reliable COVID-19 detection equipment.
There is an urgent need to differentiate COVID-19
induced conditions from other respiratory illnesses, as
influenza and lungs cancer to increase patients survival
rate by 3 times [1,2].
More than 80% of the COVID-19 patients are suffering
from respiratory and lungs dysfunction syndrome. One
of the most promising methods to monitor the
disfunction caused by the illness is to detect biomarkers
from patient’s exhaled breath [3,4].
The current well-known technologies as serological
assays, reverse-transcription polymerase chain reaction
and computed tomography exhibit practical limitations
and challenges in case of massive and non-invasive
testing. Electrochemical conducting polymer based
biosensors are considered as potential alternatives due
to their functional advantages such as high selectivity,
sensitivity, simplicity, rapid detection, flexibility, ease
of use. Therefore, CP-based biosensors can serve as
multi-sensors, mobile biosensors, and wearable
biosensors, facilitating the development of point-of-care
(POC) systems and home-use biosensors for COVID-19
detection [5-7].
However, the application of these biosensors for
COVID-19 trigger several challenges related to their
degradation, low crystallinity, charge transport
properties, and weak interaction with COVID-19
biomarkers [4]. To overcome these challenges, we have
studied polymer dose gels as promising sensors to detect
biomarkers in exhaled patients’ breath. While the most
common biomarkers representing COVID-19 are
acetone (0.3–1 ppm), isopropanol, isoprene (∼105 ppb),
hydrogen sulphide (0–1.3 ppm), nitric oxide, ammonia
(0.5–2 ppm), hydrogen peroxide, carbon monoxide (0–6
ppm), ethanol and acetaldehyde, the optical properties
variation of these biomarkers in gel exposed to exhaled
breath could be measured [8-10]. 1 empty line using 10-point font with single spacing
2. Materials and methods
Acetone vapor were chosen for gels exposure and
analysis of interaction with monomers. Three sets of
hydrogel samples were made. Normoxic nPAG, nMAG
and VIPET hydrogels were produced using previously
developed recipes [11].
nPAG polymer gels were prepared as follows: gelatin
from porcine skin (300 bloom, 5 w/w %, Sigma-
Aldrich) was dissolved in half-amount of the total water
volume (89 w/w %). The solution was heated up to 40 C and stirred until the solution became clear. Then
acrylamide (3 w/w%, Sigma- Aldrich) and N-N-
methylene-bis-acrylamide (3 w/w%, Sigma- Aldrich)
were added one by one to the solution. Solution was
mixed and cooled down to 38C. An antioxidant
(tetrakis hydroxymethyl phosphonium chloride THPC,
10 mmol/l, Sigma- Aldrich) was added and the solution
was stirred.
nMAG gel preparation consisted of firstly dissolving 8
% of gelatin from porcine skin (300 bloom, Sigma-
Aldrich) in 86 w/w% of distilled water of high purity
(HPLC grade water). When the gelatin was fully
inflated by the water, a flask with a gel was heated up to
35oC while stirring by magnetic stirrer. After the gelatin
82

N. Šeperienė et al. / Medical Physics in the Baltic States 15 (2021) 82-85
was fully dissolved, 5 % of methacrylic acid (MAA,
Sigma- Aldrich) was added, followed by addition of 2
mM of tetrakis (hydroxymethyl) phosphonium chloride
(THPC, Sigma-Aldrich). The mixture was heated up to
45 C under continuous stirring.
The normoxic VIPET polymer gels were composed of 7
w/w% of gelatin (300 bloom, Sigma- Aldrich), 4 w/w%
N-vinylpyrrolidone (VIPE, Sigma-Aldrich), 4% w/w%
N-N-methylene-bis-acrylamide (BIS, Sigma- Aldrich),
10 mM of tetrakis (hydroxymethyl) phosphonium
chloride (THPC, Sigma-Aldrich) and 89 w/w% of
distilled water. The gelatin was added to the distilled
water at room temperature (25 C) and the solution was
then heated to 45 C. Once the temperature was
stabilized and the solution was clear, the BIS was
added. Heating was achieved through a hot-plate and
stirring unit. When the solution became transparent, the
mixture was cooled down to approximately 35 C and
VIPE was added. When the constituents were
completely dissolved, THPC was added to the solution.
Heating and stirring was switched off and the solution
was left to settle.
The whole process was conducted in a fume hood under
atmospheric conditions. In order to minimize possible
oxidation, gels were poured into standard PMMA
cuvettes as well as 3D printed sample plates and tightly
sealed (fig.1).
Fig. 1. Hydrogel samples in 3D printed plate prepared for
acetone vapour exposure: a. VIPET, b. nMAG, c. nPAG
Samples of polymer gels in palate were poured with
acetone (Fig. 2), the most common biomarker indicating
that the patient’s lungs were affected by COVID-19.
The flow rate of mixed acetone vapors used in this study
(50 - 250 ml/min) was suggested by Koureas et al. [12].
All experiments were conducted at room temperature. Raman spectroscopy was done to investigate
polymerization due to acetone exposure and to evaluate
the amount of polymerization. Also, absorbance in
UV/VIS spectra was measured to explore changes in
absorbance peak, construct calibration curve and make
the gel easier to fit as sensor.
Fig. 2. Experimental set for acetone evaporation
3. Results and discussion
The aim of the project was to transfer the technology
used to make dose hydrogels for radiation detection in
medicine to COVID-19 biomarkers detection and make
it useful for corona illness monitoring. It was
hypothesized that biomarkers of COVID-19 must
interact with monomer molecules in hydrogel to initiate
polymerizations process. The amount of polymers
formed should be detectable via optical methods. The
changes in UV/VIS spectra absorbance must be
measurable. The final result of the project is initial
prototype of COVID-19 biomarkers sensor to detect and
monitor the corona illness.
3.1. The research of VIPET gel properties
After the acetone exposure of nPAG, nMAG and
VIPET hydrogels, the VIPET gel was selected as most
promising to carry on with prototype development. The
VIPET gel samples before and after acetone vapor
exposure are presented in fig. 3.
Fig. 3. VIPET gel samples: a. before exposure with acetone,
b. after exposure with acetone
The measurement of UV/VIS spectroscopy showed that
absorbance peak in 300 - 430 nm was increased by
0.4a.u. (fig. 4). Ocean Optics USB 4000 UV/VIS
spectrometer was used for gel absorbance spectra
research. The gel samples became solid and yellow
instead of amorphous transparent structure. Gel samples
shrunk by 10 times after acetone exposure.
Gauss function was applied to UV/VIS absorbance
spectra of gel to evaluate full width of half maximum
(FWHM) representing amount of polymerization. For
VIPET gel λmax = 349 nm, FWHM = 135,8 nm.
a. b.
83

N. Šeperienė et al. / Medical Physics in the Baltic States 15 (2021) 82-85
Fig. 4. UV/VIS spectroscopy of acetone exposed VIPET gel
Raman scattering measurements were performed using a
Raman microscope inVia (Renishaw). The excitation
beam from a diode laser of 532 nm wavelength was
focused on the sample using a 20× objective. Laser
power at the sample surface was 2 mW. For all
measurements, integration time was 10 s. The Raman
Stokes signal was dispersed with a diffraction grating
(2400 grooves/mm) and data was recorded using a
Peltier cooled charge-coupled device (CCD) detector
(1024×256 pixels). This system yields a spectral
resolution of about 1 cm-1. Silicon was used to calibrate
the Raman setup in both Raman wavenumber and
spectral intensity.
Raman spectra analysis for VIPET hydrogel was
performed before the acetone exposure and after the
exposure. The intense Raman peaks were seen at: 1115
(C–O stretching), 1259, 1419, 1441, 1650, 1991, 2165,
2315, 2622, 2938, 2989 (attributed to the asymmetric
and symmetric C–H stretching), 3191 cm-1 (N–H
stretching and O–H stretching vibrations). 1259 cm-1
and 1441 cm-1 are representing acetone related bonds.
3.2. Prototype of acetone detection tool
The initial prototype to detect the COVID-19
biomarker, acetone in exhaled patient’s breath was
constructed of optical scanner module and specially
prepared VIPET hydrogel sample. The optical scanner
module was made of RGB light source, light
collimation and focus to target system, measured data
collection and transfers setting. The VIPET hydrogel
sample was placed inside the specific tube made to
intake exhaled patient’s breath. The initial exhaled
breath analysis prototype is presented in fig. 5.
The presented prototype operates in this sequence:
1. The patient inflates to intake tube where the
exhaled breath travels through hydrogel samples.
2. Polymerization reactions is initiated in gel which
leads to change in optical properties.
3. Changes in optical properties are measured by
optical scanning system and data are represented
on device screen or computer.
The accuracy of acetone detection depends directly on
the area of the scanned VIPET gel . The graph
representing calibration curve of device and showing
the accuracy is presented in fig. 6.
Fig. 5. The initial exhaled breath analysis and acetone
detection prototype
Fig. 6. The calibration curve of prototype
The accuracy of device to detect acetone in exhaled
breath is R2 = 0,978 when the vapor flow is in range 50 -
250 ml/min. This range is close to patients exhaled
breath conditions in COVID-19 illness and diabetes
cases [7,13].
4. Conclusions
Non-invasive exhaled patient’s breath analysis has a
huge diagnostic and monitoring of COVID-19 potential.
From the discovery and validation of biomarkers of
corona illness to non-invasive monitoring of treatment
progression, a whole realm of analytical possibilities
exists. In targeted applications, dedicated sensors are
used to monitor a specific compound and thus can be
achieved with low-cost optical and polymer gel sensors.
The aim of the research and project was to develop the
initial prototype sensor by using polymerizable
hydrogels in order to avoid charge transport problems in
biosensors and weak interaction with COVID-19
biomarkers.
The VIPET hydrogel was seen as promising sensor to
detect the most common COVID-19 biomarker -
acetone. The accuracy of device for detecting acetone in
simulated patients’ exhaled breath was close to 98%
while evaluating 2 to 5 mm2 gel samples with optical
scanner.
Not exposed Exposed
84

N. Šeperienė et al. / Medical Physics in the Baltic States 15 (2021) 82-85
Further development of the prototype will be done with
the help of Lithuanian Health Science University
bioengineering group. Prototype testing with real
patients’ exhaled breath samples are planned.
Acknowledgment 1 empty line using 10-point font with single spacing
The research was supported by Agency of Science,
Technology and Innovation. Lifesaving-innovations:
stop COVID-19.
Project No. 01.2.1-MITA-T-852-01-0132.
5. References
1. Ruszkiewicz D.M., Sanders D., et al. Diagnosis of
COVID-19 by analysis of breath with gas
chromatography- ion mobility spectrometry - a feasibility
study. EClinicalMedicine, 2020, p. 2930 100609,
DOI:10.1016/j.eclinm.2020.100609.
2. Vinh Van Tran, Nhu Thi Tran. Development strategies of
conducting polymer-based electrochemical biosensors for
virus biomarkers: Potential for rapid COVID-19 detection.
Biosensors and Bioelectronics, 2021, p. 182 113192.
3. Sagnik Das, Mrinal Pal. Review—Non-Invasive
Monitoring of Human Health by Exhaled Breath Analysis:
A Comprehensive Review. Journal of The
Electrochemical Society, 2020, p. 167 037562 .
4. Khoubnasabjafari M., Jouyban-Gharamaleki V., et al.
Exhaled breath condensate as a potential specimen for
diagnosing COVID-19. Bioanalysis, 2020, ISSN1757-
6180, DOI: 10.4155/bio-2020-0083.
5. Ryan DJ, Toomey S, Madden SF, et al. Use of exhaled
breath condensate (EBC) in the diagnosis of SARS-COV-
2 (COVID-19). Thorax, 2021, 76, p. 86–88,
DOI:10.1136/thoraxjnl-2020-215705.
6. Usman F., Dennis J.O., et al. Acetone Vapor-Sensing
Properties of Chitosan-Polyethylene Glycol Using Surface
Plasmon Resonance Technique. Polymers, 2020, 12, p.
2586; doi:10.3390/polym12112586.
7. Grassin-Delyle S., Roquencourt C., et al. Metabolomics of
exhaled breath in critically ill COVID-19 patients: A pilot
study. EBioMedicine, 2021, p. 63 103154.
8. Shan B., Broza Y.Y., et al. Multiplexed Nanomaterial-
Based Sensor Array for Detection of COVID-19 in
Exhaled Breath. ACS Nano, 2020, 14, p. 12125−12132,
DOI: 10.1021/acsnano.0c05657.
9. Ratiu I. A., Ligor T., et al. Volatile Organic Compounds in
Exhaled Breath as Fingerprints of Lung Cancer, Asthma
and COPD. Clinical Medicine, 2021, p. 10, 32. DOI:
10.3390/jcm10010032.
10. Denis M., VANDEWEERD V., VERBEEKE,
LAUDISOIT R. A., REID T., HOBBS E., WYNANTS L.,
VAN DER VLIET D. COVIPENDIUM: information
available to support the development of medical
countermeasures and interventions against COVID-19
(Version 2020-10-06). Transdisciplinary Insights, 2020,
doi.org/10.5281/zenodo.4072014.
11. Vaičiūnaitė, N., Adlienė, D. Optical properties of photon
irradiated N-vinylpyrrolidone based polymer gel. Radiation
interaction with materials: fundamentals and applications
2014: 5th international conference, Kaunas, Lithuania,
May 12-15, 2014, Kaunas: Technologija. ISSN 2351-
583X. 2014, p. 464-467.
12. Koureas M., Kirgou P. Target Analysis of Volatile Organic
Compounds in Exhaled Breath for Lung Cancer
Discrimination from Other Pulmonary Diseases and
Healthy Persons. Metabolites, 2020, p. 10, 317,
doi:10.3390/metabo10080317.
13. Koh. H., Chung Mom A.M., et al. Journal of medical
virology. Diabetes predicts severity of COVID-19 infection
in a retrospective cohort: A mediatory role of the
inflammatory biomarker C-reactive protein. 2021, p. 1-10,
DOI: 10.1002/jmv.26837.
85

MEDICAL PHYSICS IN THE BALTIC STATES 15 (2021)
Proceedings of International Conference “Medical Physics 2021”
4-6 November 2021, Kaunas, Lithuania
DEVELOPMENT OF PATIENT‘S BIOMETRIC DATA BASED CT DOSE
OPTIMIZATION ALGORITHM
Vijayanand SIVAKUMAR1, Diana ADLIENĖ2 1,2Department of Physics, Kaunas University of Technology
[email protected]; [email protected]
Abstract: An open-source prototype program was
developed using MATLAB® for the purpose of
optimizing CT examination parameters, based on the
biometric data of the patient. The program was tested
andpresented in front of clinical professionals. The
outcomes of the testing and discussion was promising;
thus once completely developed, the program has
immense potential to be used as a useful research tool
by medical physicists during the protocol development
phase, in a clinical environment, thereby paving way for
optimization of patient dose in CT.
Keywords: Computed Tomography, Optimization, CT
protocols, Diagnostic Reference Levels, Automatic
Exposure Control Systems.
1. Introduction
Computed tomography (CT) is one of the clinical
imaging techniques that uses X-rays to visualize human
anatomy. As CT technology accounts for 60% to 70%
of total radiation dose [1], improving the
implementation of CT technology, optimizing its use
and ensuring patient safety have become the main
concerns of researchers and manufacturers. Research
involving the influence and quantification of the
relationship between CT factors [2-6], automatic
exposure control system (AEC) [7-12], CT protocol [13-
15], and various strategies for optimizing the patient's
dose from CT exposure [16-23], were carefully
analysed, and a solution is proposed in the form of a
calculation program named – “BioptiDOS”.
2. Materials and Methods
In this program, users can simulate different
possibilities of dose optimization through the scanner's
ATCM system, and consult with clinically approved
protocols as well asnational, institutional, and local
DRL values to ensure that the simulated values are
consistent with conventional values. The results of each
simulation are stored in a built-in database, and the
program refers to this database for continuous
simulation of the same procedure. For the purpose of
prototyping, MATLAB® programs were written using
MATLAB-R2020b v.9.9.0 (The MathWorks Inc.).
Currently, the prototype program is modelled for
SIEMENS Sensation 64 and Sensation 16 scanners,
along with their SIEMENS CARE Dose 4D ATCM
system. Various exposure patterns of these scanners
were obtained using a proprietary software "IndoseCT"
developed by Choirul Anam et al. [20], and the
empirical equation used in CARE Dose 4D system and
derived by McDougall et al. [25], as follows, was used.
(mAseff/QRM) = e(Deff
-DRef
).S (1)
The different quantifiers used in this program are, Tube
voltage (kVp), Tube current (mA), Rotation time (sec),
Detector collimation (mm), Slice thickness (mm), Pitch,
Computed Tomography Dose Index CTDI (mGy), Dose
Length Product DLP (mGy-cm), Anterior – Posterior
Length (AP) , Lateral length (LAT), Effective diameter
(Deff), Water Equivalent Diameter (Dw), Size Specific
Dose Estimate SSDE (mGy), Contrast-to-Noise-Ratio
(CNR), Relative Dose Factor (RDF), Diagnostic
Reference Levels (DRL), and Body Mass Index (BMI).
Based on the findings of different researchers and the
practices followed by recognized clinical institutions,
different recommendations have been generated for a
specific procedure. These recommendations have been
shown to reduce patient exposure, ensuring patient
safety. A set of recommendations were provided for
pediatric procedures based on Lateral width and
abdominal circumference [25, 27], which is given in
Table 1.
The tube current range allowed for body CT procedures,
based on Lateral width was proposed by McCollough
CH et al. [28] (Table 2),
DRL represent a more general point of reference for a
given procedure and the ICRP [22] states that DRL does
not define a maximum dose limit or "barrier", it remain
the most important tool for patient dose optimization.
One of the most outstanding aspects of this program is
to provide DRL values established for a particular
86

V. Sivakumar et al. / Medical Physics in the Baltic States 15 (2021) 86-89
examination, so that the client become aware of average resultant dose values for the performed examination and
to realize this, the latest international and national DRL
data were collected [29-34]. DRLs information is
accessible for both adults and pediatrics, and are
assembled for three anatomical premises, head, chest
and abdomen. DRL data used in the program are
displayed in the Table 3.
Table 1. Pediatric protocol recommendations
Phantom Lateral
width
(cm)
Effective
mAs
kV
based on
Lateral
width
kV based
Abdominal
circumference
32 <=15 150 80 120
32 16 – 25 175 80 120
32 26 – 35 175 100 120
32 >36 135 120 120
Pediatric
Weight
kV
based on
Pediatric
weight
16 < 40 - 80/100 80
16 > 40 - 100/120 80
Table 2. Maximum and Minimum Tube current range
Lateral width (cm) Minimum
mA
Maximum
mA
22.1 – 30 150 280
30.1 – 40 220 500
40.1 – 45 400 720
45.1 – 50+ 450 770
The ICRP reference to existing DRL values allows users
to track patient doses and appropriately optimize a given
regimen. In order to create a prototype, a MATLAB
program based on a simple navigation script was
written. The following flowchart describes how the
program works.
The workflow of the program involves patient data
entry such as one’s age, height, weight, etc. The AP and
LAT measurements are then carried out manually, from
the uploaded scout /Topogram DICOM images. Once
the CT protocol is chosen, different age and size-based
tube recommendations are displayed, and the user is
able to set the preferred tube parameters. Upon this, the
result window (Fig. 1) provides a comparison between
results, mainly CTDIvol, SSDE and CNR values, arising
from recommended protocol, kVp & mA values and
different TCM approaches involving patient’s effective
diameter (Deff) and BMI. It also allows the user to check
if these results are in accordance with the Institutional,
National and International DRL values for the chosen
procedure.
To verify the normal operation of the program, it was
tested for a set of 6 pediatric and 3 adult reference
patients of various body proportions. The test involves
abdomen and head CT examinations in both
CTscanners. The results of the verification test are
discussed in the following results and discussion
section.
Table 3. Dose reference levels
Age Anatomic
region
International DRL National DRL (LT) CTDIvol
Alert
values
(mGy)
CTDIvol
(mGy)
DLP
(mGy.cm)
CTDIvol
(mGy)
DLP
(mGy.cm)
ADULT
Abdomen 18 665 - 1200 -
Pelvis 14 525 - 506 50
AP 15 641 - - -
Head 54 854 - 650 80
Chest 12 449 - 910 50
Thoracic - - - 680
Cardiac - - - 150
Lumbar
Spine
- - - 600 -
Cervical
Spine
- 530 - - -
PEDIATRIC
<= 1 year Abdomen 5.2 130 - - 10 (32
cm)
1 – 5 years 7 250 - - 25 (16 cm)
5 – 10 years 7.8 310 - - -
<= 1 year Head 26 440 - 570 -
1 – 5 years 36 540 - 630 60
5 – 10 years 43 690 - 650 -
<= 1 year Chest 5.2 130 - - 10 (32
cm)
1 – 5 years 6 140 - - 25 (16
cm)
5 – 10 years 6.8 170 - - -
87

V. Sivakumar et al. / Medical Physics in the Baltic States 15 (2021) 86-89
Fig. 1. Results window of the program
3. Results and Discussion
Once the input parameters are entered, and the relevant
procedure selections are carried out, the program
calculates and displays the output figures in a single
window, along with the DRLs as shown in the Fig.1.
The correlation between CTDIvol, tube potential and
current, and patient age, were examined. It was verified
that CTDIvol increases with increasing phantom size,
kV, and tube current. The tube current changes
according to the effective diameter of the patient, and
the BMI is calculated using the empirical equation
applied in CARE dose 4D (equation 1). Obviously, in
most cases, changes based on BMI are higher than
changes based on difference. The BMI represents the
total height and weight of the patient, and Deff can be
said to consider the longest distance between the
patient's AP and LAT measurements. The author
supports this claim by stating that BMI considers the
attenuation of the patient's tissues, which depends on
their physical habits, including thin, normal, obese,
underweight, or overweight [16]. Another obvious
contrast is the dose of the same patient and the
procedure parameters of two different scans. The
Sensation 64 dose is less than the Sensation 16 scanner
dose, which is not the case. The detector cut-off plays
an important role in determining the dose [16]. The
program can use factors such as the patient's age,
effective diameter, and BMI to calculate the SSDE of
the head and body CT procedures. It was found that the
SSDE of Sensation 16 is higher than that of Sensation
64 in head and body pediatric procedures.
CNR is used as an indicator of the expected diagnostic
image quality. CTDIvol and slice thickness can be used
to determine CNR, using the formula given in the
previous section. The higher the CNR of an image, the
better its perceptibility. CNR increases with the increase
of CTDIvol, but the dose to the patient must be justified.
Therefore, understanding the importance of evaluating
pre-modulated CNR for a give slice thickness is
essential.
RDF is a quantifier that indicates the radiation dose
required/saving when trying to achieve the image
quality required by the protocol in case the potential of
the tube changes. The RDF quantizer is very useful for
understanding the deviation of the amount of radiation
stipulated in the agreement and at the same time linking
it with the evaluation of the image quality. RDF
calculation for the patient is provided in the Table 4.
Table 4. RDF for different patients
Inferred from Table 4, in the case of BMI-based
modulation (expressed as a negative percentage), RDF
represents the amount of tube current that is additionally
used when using a lower kV. Furthermore, it can be
seen that dose savings occurred during Deff-based
modulation. This shows that, compared to Deff, BMI-
based tube modulation results in more doses to the
patient, and RDF can be used as an effective parameter
to assess the deviation between protocol parameters and
real-time scan parameters.
In order to investigate the possibility of further
improving the prototype program for routine use in
clinical environment, and discuss the upcoming
implementation plan, professional advice was sought
out. The proposed program algorithm was introduced,
and discussed with a group of Medical physicist expert
from Vilnius University Hospital Santaros Clinics.
88

V. Sivakumar et al. / Medical Physics in the Baltic States 15 (2021) 86-89
4. Conclusions
The purport of this research work was to create an open-
source computational program to assist Medical
Physicists in optimizing the resultant CT dose by
making use of the patient’s biometric data. This was
successfully achieved by developing a prototype
program, with available clinically verified data, and was
tested for its basic functionality. Though the program is
in its primary stage, it has delivered promising results,
which support the conceived idea of having an open
access estimator for devising patient-based CT protocols
as well as a tool which helps researchers to implement
patient’s doses optimization in CT examinations.
5. References
1. INTERNATIONAL ATOMIC ENERGY AGENCY, Dose
Reduction in CT while Maintaining Diagnostic Confidence:
A Feasibility/Demonstration Study, IAEA-TECDOC 1621,
IAEA, Vienna 2009.
2. NAGEL H.D, CT Parameters that Influence the Radiation
Dose. Radiation Dose from Adult and Pediatric
Multidetector Computed Tomography. Medical Radiology
(Diagnostic Imaging). Springer, Berlin, Heidelberg, pp 51-
79, ISBN 978-3-540-68575-3, 2007.
3. MCCOLLOUGH CH, LENG S, et al. CT dose index and
patient dose: they are not the same thing.
Radiology.;259(2):311-6, 2011.
4. STRAUSS K, et al. Size Specific Dose Estimates in
Pediatric and Adult Body CT Examinations, AAPM Task
Group, 2014.
5. BOONE J, et al. Size Specific Dose Estimate Head CT,
AAPM Task Group, 2019.
6. VAÑÓ E, et al. ICRP Publication 135: Diagnostic Reference
Levels in Medical Imaging. Ann ICRP; 46(1):1-144, 2017.
7. MARTIN, C J, SOOKPENG S. Setting up computed
tomography automatic tube current modulation systems.
Journal of Radiological Protection, 36(3), R74–R95, 2016.
8. SO DERBERG M. Overview, Practical Tips And Potential
Pitfalls Of Using Automatic Exposure Control In Ct:
Siemens Care Dose 4D. Radiation Protection Dosimetry;
169(1-4):84-91., 2015.
9. KEAT N. CT scanner automatic exposure control systems.
Available from: doi: 10.13140/RG.2.1.3128.4720, 2005.
10. SÖDERBERG M, Automatic exposure control in CT: an
investigation between different manufacturers considering
radiation dose and image quality, Available from:
http://lup.lub.lu.se/student-papers/record/2157064, 2008.
11. MARTIN C J, SOOKPENG S, Setting up computed
tomography automatic tube current modulation systems, J.
Radiol. Prot. 36 R74, 2016.
12. WANG X., et al. Automatic tube potential selection with
tube current modulation in coronary CT angiography: Can it
achieve consistent image quality among various
individuals?. Experimental and Therapeutic Medicine, 16,
253-259, 2018.
13. TRATTNER S, PEARSON GDN, et al. Standardization and
optimization of CT protocols to achieve low dose. J Am Coll
Radiol.;11(3):271-278, 2014.
14. ZHANG, Y, SMITHERMAN C, SAMEI E. Size-specific
optimization of CT protocols based on minimum
detectability. Medical Physics, 44(4), 1301–1311, 2017.
15. MCKENNEY SE, SEIBERT JA et al. Methods for CT
automatic exposure control protocol translation between
scanner platforms. J Am Coll Radiol.;11(3):285-91, 2014.
16. O’NEILL S, et al. Using body mass index to estimate
individualized patient radiation dose in abdominal computed
tomography. European Radiology Experimental, 2(1), 38,
2018.
17. ANAM C, et al. A fully automated calculation of size-
specific dose estimates (SSDE) in thoracic and head CT
examinations. Journal of Physics: Conference Series, 694,
012030, 2016.
18. RICCARDI L, et al. Use of radiation dose index monitoring
software in a multicenter environment for CT dose
optimization. Radiol med 123, 944–951, 2018.
19. ELLIOT K. FISHMAN, MD, CTisus.com, Available from:
https://www.ctisus.com, Accessed 17 Mar. 2021.
20. ANAM C, et al. Volume computed tomography dose index
(CTDIvol) and size-specific dose estimate (SSDE) for tube
current modulation (TCM) in CT scanning. Int J Radiat Res.;
16 (3) :289-297, 2018.
21. MUBAROK S et al. Parameter-based estimation of CT dose
index and image quality using an in-house android™-based
software, J. Phys.: Conf. Ser. 694 012037, 2016.
22. KATSARI K, et al. Establishing a dose management strategy
in Computed Tomography, Proceedings. EuroSafe Imaging,
ESI-0022, Available from: 10.1594/esi2018/ESI-0022, 2018.
23. OSMAN N D, et al. Radiation dose management in CT
imaging: Initial experience with commercial dose watch
software, J. Phys.: Conf. Ser. 1497 012020, 2020.
24. SÖDERBERG M, GUNNARSSON M, The effect of
different adaptation strengths on image quality and radiation
dose using Siemens Care Dose 4D, Radiation Protection
Dosimetry, Volume 139, Issue 1-3, Pages 173–179, 2010.
25. MACDOUGALL RD, et al. Size-based protocol
optimization using automatic tube current modulation and
automatic kV selection in computed tomography. J Appl
Clin Med Phys.;17(1):328-341, 2016.
26. UT SOUTHWESTERSN MEDICAL CENTER, Department
of Radiology, Available from:
https://www.utsouthwestern.edu, Accessed 17 Mar. 2021.
27. REID J, et al. Optimization of kVp and mAs for Pediatric
Low-Dose Simulated Abdominal CT: Is It Best to Base
Parameter Selection on Object Circumference?. AJR Am J
Roentgenol; 195(4):1015-20, 2010.
28. DIEGO L, et al. Tube Potential and CT Radiation Dose
Optimization. American Journal of Roentgenology, 204(1),
W4–W10, 2015.
29. MOHAMAD FAWZI AWAD et al, A systematic review on
the current status of adult diagnostic reference levels in head,
chest and abdominopelvic Computed Tomography, J.
Radiol. Prot. 40 R71, 2020.
30. VASSILEVA, J. et al, A study to establish international
diagnostic reference levels for paediatric computed
tomography. Radiation Protection Dosimetry, 165(1-4), 70–
80, 2015.
31. EUROPEAN COMMISSION, DDM2 Project Report Part-2,
Diagnostic Reference Levels (DRLs) in Europe, Retrieved
from: ENER/2010/NUCL/SI2.581237, 2010.
32. RADIACINĖS SAUGOS CENTRAS, RSC Annual Report
2012, Retrieved from:
https://www.rsc.lt/index.php/pageid/428, Vilnius, 2012.
33. RADIACINĖS SAUGOS CENTRAS, RSC Annual Report
2015, Retrieved from:
https://www.rsc.lt/index.php/pageid/428, ISSN 2351-5953,
Vilnius, 2015.
34. RADIACINĖS SAUGOS CENTRAS, RSC Annual Report
2019, Retrieved from:
https://www.rsc.lt/index.php/pageid/428, ISSN 2351-5953,
Vilnius, 2019.
35. VASSILEVA J, REHANI M. Diagnostic Reference Levels.
American Journal of Roentgenology, 204(1), W1–W3, 2015.
89
MEDICAL PHYSICS IN THE BALTIC STATES 15 (2021)
Proceedings of International Conference “Medical Physics 2021”
4-6 November 2021, Kaunas, Lithuania
HOUSEHOLD SALT (NACL) FOR OPTICALLY STIMULATED LUMINESCENCE
DOSIMETRY: AN OVERVIEW
Christian BERNHARDSSON1, Lovisa WALDNER2, Christopher RÄÄF3, Aleksandr VODOVATOV4 1,2,3Lund University, Department of Translational Medicine, Medical Radiation Physics, Malmö, Sweden;
4Research Institute of Radiation Hygiene, St Petersburg, Russia [email protected]; [email protected]; [email protected];
Abstract: This brief overview of the use of household
salt (NaCl) in optically stimulated luminescence (OSL)
dosimetry is focusing on the use of NaCl pellets. It is
suggested that the most optimal use of household NaCl,
in general prospective dosimetry, is to compress the salt
grains to pellets and read the radiation induced signal
using OSL rather than TL. A summary of the main OSL
dosimetric properties is provided for two Swedish
household salts, and compared to the OSL properties of
100 different salts from all over the world.
Keywords: OSL, NaCl, salt pellet, dosimetry
1. Introduction
Optically stimulated luminescence (OSL) is an
increasingly used technique for determining radiation
absorbed doses in e.g. occupational, environmental,
emergency/accident dosimetry and in applications for
luminescence dating in geology and archeology. In
OSL, luminescence is stimulated from the target sample
by a light source. The registered OSL signal is a
measure of the absorbed dose from previous radiation
exposure of the sample material. In thermoluminescence
(TL), or thermally stimulated luminescence, heat is used
to stimulate the target sample and the resulting TL
signal is a measure of the radiation absorbed dose of the
material. Although TL has traditionally been standard
for broad range of dosimetry applications, the use of
OSL in research and for personal dosimetry has strongly
increased during the recent two decades. There are
benefits and disadvantages of the TL vs OSL methods.
This have been discussed over the years, for example in
2003 [1], where the two debater’s main arguments
condensed to the principle of the stimulation mode i.e.
there are advantages and disadvantage with OSL as well
as TL, vs the other. Since then there has been a fast
development in terms of OSL readers and materials, and
the use of the technique is further increasing in various
dosimetry applications as well as in luminescence
dating. For personal dosimetry, both OSL and TL will
be used for many years to come. However, it has been
shown that there are advantages of using OSL as
compared to TL when using certain household materials
for retrospective dosimetry (i.e. luminescence dating
and accident dosimetry). This brief overview will focus
on one such household material, in particular salt
(NaCl) for OSL dosimetry, specifically for prospective
dosimetry (pre-manufactured dosemeters) using NaCl
pellets.
2. Luminescence dosimetry with NaCl
Research on TL and OSL has a long history. In fact, the
TL phenomenon was first observed as early as 1663,
although it was not until the 1950s that the research
found practical applications [2]. About a decade later it
was shown that illumination of radiation exposed salt
reduces the intensity of the TL peaks [3], and shortly
after that the phenomenon OSL was first mentioned in
the literature [4], see e.g. Yukihara & McKeever [5] and
references therein for a brief history on TL and OSL.
With the advent of compact and optimized OSL/TL
readers, analytical grade salt was studied as a dosemeter
for applications in luminescence dating [6, 7]. The main
results observed were that the OSL response in NaCl,
after irradiation, can be measurable and reproduced, and
there is no significant short term fading of the OSL
signal. Furthermore, and obviously, it was shown that
the signal may easily be bleached when the salt is
exposed to daylight. At about the same time, household
and workplace chemicals (including household salt)
were investigated as a dosemeter for retrospective
dosimetry i.e. accident dosimetry [8]. The results in the
latter survey of household and workplace chemicals
showed a significantly high OSL signal yield per unit
absorbed dose and sample weight for household salt
(>99% NaCl), as compared to the other materials
investigated, and a fading of only 5% after 2 weeks.
Despite these encouraging findings for the use of NaCl
90

C. Bernhardsson et al. / Medical Physics in the Baltic States 15 (2021) 90-94
in dosimetry, it would take one more decade before
several different groups started to evaluate and use NaCl
in various applications for OSL and TL dosimetry.
The first salt application within OSL dosimetry was for
retrospective dosimetry (luminescence dating and
accident dosimetry) e.g. [6-8], using relatively high
radiation doses (several Gy) for benchmarking the salts
investigated. Later it was shown that household NaCl
has a linear dose response also for doses below one
gray, with detection limits of about 1 mGy [9-10]. With
promising dosimetric properties also in the dose range
for occupational radiation protection, research began to
evaluate the use of household NaCl for prospective
dosimetry i.e. pre-prepared dosemeters with salt. One of
the first field tests of household NaCl, packed in
temporal but dedicated dosemeter holders consisting of
NaCl and LiF chips, was carried out in a Chernobyl
contaminated village in Belarus [12]. The results
showed a good comparison to TLDs of LiF and very
good agreement with a handheld NaI(Tl) radiation
detector that was used at the same measurement
positions as the combined NaCl and LiF dosemeter kits.
The same study was repeated during three years with
the same results [13]. Approximately at the same time,
in-house made NaCl and LiF dosemeters were carried
by people living in Chernobyl contaminated villages in
Russia [14] and on phantoms in the laboratory [15]. The
results from these studies showed a surprisingly good
agreement between conventional dosemeters of LiF to
OSL materials (NaCl) used in retrospective dosimetry in
terms of absorbed dose assessments. This was
encouraging for further investigations of NaCl as a
dosemeter beyond retrospective purposes.
Therefore, a refined dosemeter dedicated for salt grains
was suggested for measurements of personal dose
equivalent, Hp(10) [16]. This dosemeter was tested in
the laboratory at different photon energies and incident
angels of the radiation field. It was shown that the
dosemeter need proper filtration for accurate Hp(10)
dose determinations in order to adjust for the over
response at low photon energies (<200 keV) compared
with tissue. This was also shown in a parallel study
using a different type of a combined NaCl and LiF
dosemeter [17]. Furthermore, efforts have also been
made to experimentally determine conversion
coefficients for NaCl in dosemeter holders, in salt
packages, and on physical phantom in different
exposure situations [18]. While these studies are
supportive for the use of NaCl in OSL dosimetry, it is
encouraged to further support these findings with
mathematical calculations and simulations.
Although many articles on OSL (and TL) in NaCl refer
to its use in retrospective dosimetry applications, the
results also apply to OSL dosimetry in general and may
be useful for modeling and optimisation of the OSL in
NaCl after exposure to ionizing radiation e.g. [19-23].
Although more research is needed for understanding the
physics of the OSL in various types of NaCl, the well-
established advantageous OSL properties of NaCl have
encouraged to evaluate the use of the salt from salted
snacks and nuts for accident dosimetry [24, 25]. There
are also suggestions of using NaCl for mixed neutron-
photon fields by using a dedicated dosemeter with a
neutron converter (gadolinium) [26] and by using a
specially made NaCl detector and analyzing 24Na from
neutron activation of NaCl [27].
3. OSL dosimetry with NaCl pellets
OSL and TL has been investigated for solid dosemeters
made from natural calcium fluoride and NaCl powders
pressed together (CaF2:NaCl) e.g. [28]. In that study
NaCl pellets were also studied. Although not observed
in other studies of NaCl pellets the results from [28]
showed that the radiation induced OSL and TL signals
were rapidly removed from the pure NaCl pellets by
either a pre-heat or a 1 h waiting time. With the
intention of using pure household NaCl for prospective
dosimetry, a method for producing physically stable
NaCl pellets was developed and the OSL dosimetric
properties of these pellets were studied using an
optimized read-out sequence [29, 30]. These initial
studies showed a linear dose response for low doses
(from about 5 mGy), low detection limit (<10 µGy), and
high signal yield per unit absorbed dose and weight. At
about the same time, household NaCl pellets were
investigated for retrospective TL dosimetry [31]. It was
shown that the TL signal was linear over the dose range
0.25 Gy to 20 Gy, and that the fading after 2 weeks was
40%. Recently, the TL properties of NaCl pellets of
different thickness (0.1 and 0.3 cm) have been studied
for doses from 2 to 10 Gy [32] and NaCl pellets with a
thickness of 1 mm in the absorbed dose range of 5 mGy
to 5 Gy [33]. Although the studies [32,33] are not
directly comparable the conclusion from the first one is
that the thinner pellets (0.1 cm) has better TL
characteristics than the thicker ones, with 3 times higher
TL intensity but with higher fading after 7 days as
compared to the 0.3 cm pellets. The study in [33], with
even thinner pellets than 0.1 cm, indicates a fading of
20% after 2 weeks and a linear TL signal to dose
response in the dose range 5-100 mGy. Although TL
dosimetry with NaCl pellets is interesting and may be
useful in some situations, the dosimetric properties of
household NaCl is greatly improved by using an
optimized OSL read protocol with individual single-
dose calibration of each pellet. A summary of the
comprehensive work made on OSL in NaCl pellets is
given in the section below. References therein may be
used to fully apply or test the suggested NaCl pellets in
various practices.
3.1. Justification for household NaCl pellets in
prospective dosimetry
Several researchers have studied NaCl for the use in
OSL and TL dosimetry applications. Although there are
some difficult issues to overcome in retrospective
dosimetry for luminescence dating and accident
dosimetry, research in these areas have opened for
studies of using NaCl for occupational and
environmental dosimetry applications. After it was
shown that household NaCl could be used to measure
low-doses (<100 mGy), relevant for personal dosimetry
[9], efforts have been made to further evaluate the
usefulness of household NaCl for prospective OSL
91

C. Bernhardsson et al. / Medical Physics in the Baltic States 15 (2021) 90-94
dosimetry applications by compressing the salt to
pellets.
Although the main area of use of the suggested
dosemeters might be within environmental and accident
dosimetry, one promising approach is to apply OSL
dosimetry with NaCl pellets within the medical use of
ionizing radiation.
According to international guiding documents by e.g.
IAEA, ICRP and ICRU there are three broad fields for
the application of OSL dosimetry. The first is the use of
point detectors together with dedicated physical
phantoms (CIRS ATOM, Rando, etc.) that allow
estimation of organ absorbed doses in different
radiosensitive organs/tissues from diagnostics or
therapies with ionizing radiation. Estimates or
measurements of such radiation absorbed doses are used
as a basis for the development and validation of
dedicated computational software for patient dose
estimation as well as for the optimization of imaging
protocols in medical facilities.
The second is the use of point detectors for direct
estimation of the entrance surface doses of patients for
different diagnostic imaging modalities. IAEA
recommends using the entrance surface dose (incident
air kerma on the patient body) as one of the main
dosimetric quantities for the process of optimization,
mainly for the estimation of typical patient doses and
for establishing diagnostic reference levels.
The third is the use of point detectors for individual
dosimetry of workers, especially those working in
highly non-uniform radiation fields (e.g. X-ray guided
surgery, interventional examinations, nuclear medicine
applications).
In many countries, the use of LiF based point detectors
is associated with various complications, such as
significant costs for the detectors and equipment for
annealing and calibration, resource demanding methods
for calibration, and significant costs for the
lost/damaged detectors. With the one-time use of the in-
house made NaCl detectors for OSL, many of these
shortcomings can be overcome, with comparable
dosimetric properties.
It has been clearly identified that these advantages are
important, especially in developing countries that
recently or currently started to develop their radiation
protection and quality control programs; or, on the
contrary, for large countries with significantly varying
access and prioritisation to dosimetry services and
equipment between different regions (e.g. the Russian
Federation). As a complement to commercial
luminescent dosemeters, or to encourage RP
professionals, the NaCl pellets provide an easily
accessible tool for accurate dose determinations.
3.2. Dosimetric properties of household NaCl pellets
The research group medical radiation physics, Malmö,
Lund University, has studied the OSL properties of
household NaCl for applications in dosimetry [34, 35]
and lately, for optimal use and dosimetry, as pellets
[36]. Provided below is a summary of the main
dosimetric properties of the suggested household salt
pellets for OSL dosimetry.
Common Swedish household salt was investigated for
making physically stable NaCl pellets [37]. Using a
press tool made in-house, it was suggested to sieve the
salt to grains in the size range 100-400 µm and use a
compression force of 3.0±0.5 tons applied over the
surface of the press tool (distributed over a column of
five pellets) for achieving physically stable and rigid
pellets. Later it has been suggested to use a
commercially available standard desktop table press tool
(TDP 0 Desktop Tablet Press, LFA Machines Oxford
Ltd) for more convenient production of NaCl pellets
with a circular shape of 4 mm in diameter and 0.8±0.2
mm thick (similar size as many LiF chips) [36]: Fig. 1
and 2.
Fig. 1. Photograph of the semi-automatic desktop table press
for compresing the salt grains to NaCl pellets.
The pellets are intended for one-time use, using a single
individual calibration dose (rather than the common
SAR protocol that require repeated heating and
irradiation of the sample). An optimized readout
protocol, using a Risø TL/OSL-DA reader (DTU
Physics, Denmark), is provided in [36]. The most
relevant dosimetric properties (see below) were studied
for two Swedish household salt (Falksalt finkornigt
hushållsalt and Falksalt finkornigt medelhavssalt,
Salinity AB, Sweden) and one analytical grade salt
(Sodium chloride, reagent grade, Scharlau, Scharlab,
Spain) [37]. OSL dosimetric properties were also
evaluated for 102 household salt from all over the world
(including the Swedish salts) to evaluate the global
usability of NaCl pellets for OSL dosimetry [36].
A summary of the dosimetric properties, using the
suggested NaCl pellets (Fig. 2) are provided below.
OSL signal to dose response: the OSL signal is linearly
increasing with the absorbed dose, from 0 to 300 mGy
[37]. The linearity continues at even higher dose (>1
Gy) and is valid also for the estimated absorbed dose
[36]. A pre-established calibration curve for a specific
salt may be used, albeit with some precaution, to
achieve a fast estimate of the absorbed dose.
Minimum detectable dose (MDD): considering the one
time use of the NaCl pellets and that they are pre-
bleached (emptied of any residual OSL signal in
ambient light) the theoretical detection limit, in terms of
MDD is low, 5-20 µGy for the Swedish salts
investigated [37]. Studies of the 102 salts from all over
the world show MDD in the range from 2 to 1036 µGy,
with a median MDD of 19 µGy.
92

C. Bernhardsson et al. / Medical Physics in the Baltic States 15 (2021) 90-94
Fig. 2. Photo of the NaCl pellets (round in shape) as compared
to standrad LiF chips (squared in shape).
Signal stability over time (fading): The OSL signal is
stable over at least one month after exposure. However,
and similar to e.g. [22], the estimated dose appears to
increase over time. For NaCl pellets, this is an effect of
the decrease in signal yield over time when using a
single calibration dose [38]. To avoid this problem, the
pellets may be stored for a couple of weeks before they
are used, for the pellets to age. This is however only a
problem when the exposure and readout are separated in
time. For extended or chronic exposures the effect of
decreasing signal yield from the pellets cannot be seen
and no special precautions need to be taken before use.
Specific luminescence: The OSL signal normalized to
the weight of the pellets and the absorbed dose, ranged
from 259 to 576 counts mg-1 mGy-1 for the two Swedish
household salts and one analytical grade salt. This can
be compared to the results of the 102 salts investigated,
with specific luminescence ranging from 115 to 1950
counts mg-1 mGy-1, with a median of 496 counts mg-1
mGy-1.
Reproducibility: The OSL signal reproducibility is <4%,
in terms of coefficient of variation for 10 equally treated
NaCl pellets, when using a single calibration dose.
When only comparing the OSL signals, without any
normalization, the reproducibility is around 15%.
Energy dependence: The absorbed dose to NaCl pellets
has a significant energy dependence at low photon
energies, up to a factor of 18 as compared to Kair and
Hp(10). Experimentally determined and Monte Carlo
calculated energy dependence of NaCl pellets in the
energy range 30 keV to 1.25 MeV has been established
[39]. The results show that the energy dependence must
be accurately compensated for e.g. by dosemeter filters
or mathematically corrected for in order to achieve
accurate dose estimates for dosimetry applications with
low photon energies especially.
The suggested NaCl pellets have been thoroughly
studied in the laboratory. Several tests have also been
carried out in different hospital clinics for occupational
and ambient exposure studies [40, 41].
To fully utilize the potential of the NaCl pellets, a
dedicated badge with filters correcting for e.g. the
energy dependence are needed. Depending on the
application, the dosimeter may be calibrated to measure
either Hp(10) or H*(10). For some applications where
energies >200 keV dominate, a simple badge without
filtering may be sufficient. Filters for energy
discrimination or electron detection may also be
implemented in a badge. As for readout of the NaCl
pellets, a simple dedicated reader would help make the
method become more accessible as the number of OSL
readers is still limited.
4. Conclusions
The intention with this overview is two-folded: first it is
to provide a short introduction to the use of NaCl in
OSL dosimetry, secondly it is to show the potential of
using NaCl in various dosimetry applications. If using
NaCl pellets in OSL dosimetry, as a complement or as a
main tool for dosimetry, depending on the situation or
application, many issues can be overcome.
In many countries NaCl pellet based dosemeters may
serve as a complement to clinical or personal dosimetry,
but in case of an accidental radiation exposure event,
NaCl pellets may provide additional information for
affected individual doses as well as decision making
authorities.
In summary, ordinary salt has superior OSL dosimetric
properties as compared to many other fortuitous
materials close to man. The dosimetric properties are
fairly the same for different types of household salt all
over the world, although differences may be observed in
the OSL decay curves (not yet evaluated). When
compressing the salt grains to NaCl pellets the overall
handling and dosimetric properties are improved, as
compared to using grains of salt. If the NaCl pellets are
constructed with the same dimensions as LiF chips they
may be directly used in standard dosimetry phantoms
etc. A key issue with the suggested NaCl pellets is the
same as for commercial alternatives for OSL dosimetry,
the pellets must be kept shielded from light exposure.
Provided there is an OSL reader available, it is possible
to follow the steps in the papers referred to in this
overview to achieve NaCl pellet OSL dosimetric
properties that are comparable with commercial
alternatives but only at a fraction of the cost as
compared to commercial luminescent detectors.
5. References
1. McKeever S.W.S. and Moscovitch M. Topics under debate:
on the advantages and disadvantages of optically stimulated
luminescence dosimetry and thermoluminescence
dosimetry. Radiation Protection Dosimetry, 104(3):263-
270, 2003.
2. Daniels F., Boyd C.A. and Saunders D.F.
Thermoluminescence as a research tool. Science,
117(3040):343-349, 1953.
3. Stoddard A.E. Effects of illumination upon sodium chloride
thermoluminescence. Physical Review, 120(1):114-117,
1960.
4. Fowler J.F. Solid state dosimetry. Physics in Medicine and
Biology, 8(1):1-32, 1963.
5. Yukihara E.G. and McKeever S.W.S. Optically stimulated
luminescence – fundamentals and applications. A John
Wiley and Sons Ltd, UK. ISBN: 978-0470-69725-2, 362
pp.
6. Bailey R.M., Adamiec G. and Rhodes E.J. OSL properties
of NaCl relative to dating and dosimetry. Radiation
Measurements, 32:717-723, 2000.
7. Zhang J.F., Yan C. and Zhou L.P. Feasibility of optical
dating using halite. Journal of Luminescence, 114:234-240,
2005.
93
C. Bernhardsson et al. / Medical Physics in the Baltic States 15 (2021) 90-94
8. Thomsen K.J., Bøtter-Jensen L. and Murray A.S.
Household and workplace chemicals as retrospective
luminescence dosemeters. Radiation Protection Dosimetry,
101(1-4):515-518, 2002.
9. Bernhardsson C., Christiansson M., Mattsson S. and Rääf
C.L. Household salt as a retrospective dosemeter using
optically stimulated luminescence. Radiation and
Environmental Biophysics, 48:21-28, 2009.
10. Ekendahl D. and Judas L. NaCl as a retrospective and
accident dosemeter. Radiation Protection Dosimetry,
145(1):36-44, 2011.
11. Timar-Gabor A. and Trandafir O. On optically stimulated
luminescence properties of household salt as a retrospective
dosemeter. Radiation Protection Dosimetry, 155(4):404-
409, 2013.
12. Bernhardsson C., Christiansson M., Rääf C. and Mattsson
S. OSL in household salt (NaCl) for environmental,
occupational and medical dosimetry. Proceedings of the 7th
International Conference “Medical Physics in the Baltic
States”, Kaunas, 2009, p. 65-68.
13. Bernhardsson C., Matskevich S., Mattsson S. and Rääf C.
Comparative measurements of the external radiation
exposure in a 137Cs contaminated village in Belarus based
on optically stimulated luminescence in NaCl and
thermoluminescence in LiF. Health Physics, 103(6):740-
748, 2012.
14. Bernhardsson C., Zvonova I., Rääf C. and Mattsson S.
Measurements of long-term external and internal radiation
exposure of inhabitants of some villages of the Bryansk
region of Russia after the Chernobyl accident. Science of
the Total Environment, 409:4811-4817, 2011.
15. Ekendahl D., Bulánek B. and Judas L. Comparative
measurements of external radiation exposure using mobile
phones, dental ceramic, household salt and conventional
personal dosemeters. Radiation Measurements, 72:60-65,
2015.
16. Ekendahl D., Bulánek B. and Judas L. A low-cost personal
dosemeter based on optically stimulated luminescence
(OSL) of common household salt (NaCl). Radiation
Measurements, 85:93-98, 2016.
17. Christiansson M., Bernhardsson C., Geber-Bergstrand T.,
Mattsson S. and Rääf C. OSL in NaCl vs. TL in LiF for
absorbed dose measurements and radiation quality
assessment in the photon energy range 20 keV to 1.3 MeV.
Radiation Measurements, 112:11-15, 2018.
18. Bernhardsson C. Experimental determination of dose
conversion coefficients for external radiation exposure with
gamma emitting radionuclides. Radiatsionnaya Hygiene
(Radiat. Hyg.), 7(4):125-133, 2014.
19. Polymeris G.S., Kitis G., Kiyak N.G. et al. Dissolution and
subsequent re-crystallization as zeroing mechanism, thermal
properties and component resolved dose response of salt
(NaCl) for retrospective dosimetry. Applied Radiation and
Isotopes, 69:1255-1262, 2011.
20. Spooner N.A., Smith B.W., Creighton D.F., Questiaux D.
and Hunter P.G. Luminescence from NaCl for application
to retrospective dosimetry. Radiation Measurements,
47:883-889, 2012.
21. Christiansson M., Mattsson S., Bernhardsson C. and Rääf
C.L. Optimizing a readout protocol for low dose
retrospective OSL-dosimetry using household salt. Health
Physics, 102(6):631-636, 2012.
22. Biernacka M., Majgier R., Maternicki K., Liang M. and
Mandowski A. Peculiarities of optically stimulated
luminescence in halite. Radiation Measurements, 90:247-
251, 2016.
23. Majgier R., Rääf C.L., Mandowski A. and Bernhardsson C.
OSL properties in various forms of KCl and NaCl samples
after exposure to ionizing radiation. Radiation Protection
Dosimetry, 184(1):90-97, 2019.
24. Christiansson M., Geber-Bergstrand T., Bernhardsson C.,
Mattsson S. and Rääf C.L. Retrospective dosimetry using
salted snacks and nuts: a feasibility study. Radiation
Protection Dosimetry, 174(1):1-5, 2017.
25. Maltar-Strmecki N., Vidotto M., Della M.S. et al. Salty
crackers as fortuitous dosimeters: a novel PSL method for
rapid radiation triage. Frontiers in Public Health 9:661376,
2021. doi: 10.3389/fpubh.2021.661376.
26. Mattsson S., Christiansson M. and Bernhardsson C. A
passive neutron dosemeter for measurements in mixed
neutron-photon radiation fields. Proceedings of the 12th
International Conference “Medical Physics in the Baltic
States”, Kaunas, 2015. p. 38-42.
27. Ekendahl D., Rubovic P., Zlebcik P., Huml O. and Mala H.
Dosimetry with salt in mixed radiation fields of photons and
neutrons. Radiation Protection Dosimetry, 178(3):329-332,
2018.
28. Ferreira F.A., Yoshimura E.M., Umisedo N.K. and
Nascimento R.P. Correlation of optically and thermally
stimulated luminescence of natural fluorite pellets.
Radiation Measurements, 71:254-257, 2014.
29. Bernhardsson C., Waldner L. and Vodovatov A.
Advancements in prospective dosimetry with NaCl read-out
by optically stimulated luminescence. Proceedings of the
13th International Conference “Medical Physics in the Baltic
States”, Kaunas, 2017. p. 26-29.
30. Waldner L. NaCl pellets for improved dosimetry. [MSc
thesis], Malmö: Lund University, 2017.
31. Elashmawy M. Study of constraints in using household
NaCl salt for retrospective dosimetry. Nuclear Instruments
and Methods in Physics Research B, 423:49-61, 2018.
32. Muhammad Azim M.K., Abdul Sani S.F., Daar E. et al.
Luminescence properties of natural dead sea salt pellet
dosimetry upon thermal stimulation. Radiation Physics and
Chemistry, 176:108964, 2020.
33. Ahmad K., Kakahel M.B., Hayat S. et al.
Thermoluminescence study of pellets prepared using NaCl
from Khewra salt mines in Pakistan. Radiation and
Environmental Biophysics, 60(2):365-375, 2021.
34. Bernhardsson C. Radiation exposure of human populations
in villages in Russia and Belarus by fallout from the
Chernobyl reactor. [PhD thesis], Malmö: Lund University,
2011.
35. Christiansson M. Household salt as an emergency radiation
dosemeter for retrospective dose assessments using
optically stimulated luminescence. [PhD thesis], Malmö:
Lund University, 2014.
36. Waldner L. Optically stimulated luminescence dosimetry
with NaCl pellets. [PhD thesis], Malmö: Lund University,
2021.
37. Waldner L. and Bernhardsson C. Physical and dosimetric
properties of NaCl pellets made in-house for the use in
prospective optically stimulated luminescence dosimetry
applications. Radiation Measurements, 119:52-57, 2018.
38. Waldner L., Rääf C. and Bernhardsson C. NaCl pellets for
prospective dosimetry using optically stimulated
luminescence: signal integrity and long-term versus short-
term exposure. Radiation and Environmental Biophysics,
59(4):693-702, 2020.
39. Waldner L., Hinrichsen Y., Herrnsdorf L. and Bernhardsson
C. Experimentally determined and Monte Carlo-simulated
energy dependence of NaCl pellets read by optically
stimulated luminescence for photon beams in the energy
range 30 keV to 1.25 MeV. Radiological Protection,
40:1321, 2020.
40. Wilke P. Radiation protection measurements in clinical
practice – dosimetry with NaCl pellets. [MSc thesis],
Malmö: Lund University, 2019.
41. Solak E. A comparison between LiF, Al2O3 and NaCl
pellets for luminescence dosimetry based on clinical and
laboratory measurements. [MSc thesis], Malmö: Lund
University, 2020.
94

MEDICAL PHYSICS IN THE BALTIC STATES 15 (2021)
Proceedings of International Conference “Medical Physics 2021”
4-6 November 2021, Kaunas, Lithuania
EVALUATION OF THE IRRADIATION DOSES FROM THE OPERATION OF
THE INTENSE FEMTOSECOND LASER
Vytenis BARKAUSKAS*1, Lukas RIMKUS2, Jonas REKLAITIS1, Artūras PLUKIS1, Mikas VENGRIS2 1Center for Physical Sciences and Technology, Department of Nuclear Research, Vilnius, Lithuania
2Vilnius University, Faculty of Physics, Laser Research Centre, Vilnius, Lithuania *[email protected]
Abstract: The irradiation doses from the lasers with the
high power and high repetition rate dose can accumulate
over time and create a hazard which should be
evaluated. We propose use of the pre-defined electron
temperature scaling for the evaluation of the potential
doses. Pilot experimental measurements in the laser
laboratory are also presented. Dosimetry issues related
with the intense laser pulse-material interaction
experiments are identified.
Keywords: Femtosecond lasers, Irradiation dose,
FLUKA
1. Introduction
Powerful femtosecond lasers are used in various fields
related with both industrial and medical applications
such as material processing, surgeries etc [1, 2].
Irradiances achievable using these lasers may reach 1021
W/cm2. More simple table-top high frequency
femtosecond lasers usually have lower irradiances up to
1017 W/cm2. When sufficiently intense femtosecond
laser pulse interacts with material it produces X-ray.
This process is caused by electrons which are torn-off
from atoms by laser pulse and later they are decelerated,
producing both bremsstrahlung and characteristic
fluorescence lines. Energies of the generated X-ray may
reach tens or even hundreds of keV. Due to the use of
high energy and high repetition-rate source, the X-ray
produced may become hazardous from radiation safety
point of view. ICRP recommends dose limits to be 20
mSv/y for occupational exposures, averaged over a
period of 5 year and 1 mSv/y for the members of the
public [3]. Up to now radiation safety and monitoring usually is not
evaluated in laboratories which use intense femtosecond
lasers. For the table-top laser systems, the range of
intensities, which can cause radiological hazard is in
between 1014 and 1017 W/cm2. Radiological impact
evaluation of such devices is quite a new topic during
the past decade [4, 5, 6]. Precise and correct evaluation of X-ray generation
would require characterization of a complex
microscopic material-laser interaction, taking into
account processes like ionization, electron-phonon heat
exchange, phase transition etc. Here we show that dose
characterization could be performed using previously
defined electron temperature scaling based on both
theoretical and experimental evaluations. Maxwell
distribution is used to define electron energy.
Temperature parameter might be taken from the
electron temperature scaling. This leads to a
simplification of the radiological hazard evaluation and
the reduction of complex physics processes to a
phenomenon observed in the conventional X-ray tubes.
We show that dose prediction can be rather accurate and
this simplified approach could be used for radiological
safety evaluation purposes.
2. Temperature scalings
Although there are several different electron
temperature scalings defining laser-material interaction
presented in the articles, we have chosen one which give
the highest electron temperatures for given intensity.
The empirical scaling given by Beg et al. is the one [7]:
𝑇ℎ𝑜𝑡 = 100 × 𝐼171 3⁄
(1)
where I17 is in 1017 W/cm2. Thot is electron temperature
in keV. Temperature parameter was used to calculate
Maxwellian electron energy distribution:
𝑝(𝐸) = 2√𝐸 𝜋⁄ (1
𝑇)3 2⁄
𝑒𝑥𝑝 (−𝐸
𝑇) (2)
Maxwellian electron distributions obtained using
temperatures for different intensities are given in Fig. 1.
95

V. Barkauskas et al. / Medical Physics in the Baltic States 15 (2021) 95-98
Fig. 1. Maxwellian electron distributions obtained using
temperatures for different intensities using empirical scaling
given by Beg et al [7].
3. Methods and models
The FLUKA code was used to calculate the photon
spectra and irradiation doses resulting from electron
interaction with the target. FLUKA is a code employing
Monte Carlo method for calculations of particle
transport and interactions [8, 9]. FLUKA gives only
averaged single particle (electron) contribution to dose
and photon spectrum. To obtain proper estimate of the
dose we need two other parameters – number of
interacting particles and pulse energy conversion
efficiency to bremsstrahlung:
𝐷𝑡𝑜𝑡𝑎𝑙 = 𝐷𝑒𝜂𝐵𝑁𝑒𝑙 (3)
where Dtotal is total dose, De – dose from single electron,
ηB – average bremstrahlung efficiency in the energy
region of interest (above 5 keV), and Nel – number of
electrons in the laser pulse-plasma interaction volume. For the dose evaluation a very simple model of
electrons interacting with a solid target was created. The
target consists of 1 × 1 cm2 area and 0.1 cm thickness
plate. Doses were evaluated at a distance of 0.35 meter
from the target. As target material also plays an
important role for potential dose, we took three different
materials with low Z (Al, Z = 13), medium Z (Cu, Z =
29) and high Z (W, Z = 74) for modeling. CARBIDE laser from Light Conversion was used in the
dose measurement experiments. Main laser parameters
were: pulse duration 240 fs, wavelength 1030 nm,
repetition rate 100 kHz, pulse energy 900 μJ. Optimized
prepulse-pulse intensity ratio, which results in the
highest X-ray intensity and irradiation dose rate was
1/10, time between pulse and prepulse 440 ps. Laser
spot at the focus was 26 μm in diameter (FWHM),
which gives laser intensity 4.7×10¹⁴ W/cm2, when pulse
energy is 900 μJ. Two types of dosimeters were used for experimental
dose measurements. Electronic semiconductor
dosimeters (Thermoscientific EPD-N2) were used for
dose rate measurements during laser processing. This
personal dosimeter detects photons within energy range
from 20 keV to 10 MeV. Thermoluminescence
dosimeters were used to monitor integral doses at the
different spots in the laboratory during whole
experimental session. The same type of dosimenters
were used for personal dosimetry. Thermoluminescence
dosimeters were capable to measure doses from 0.01
mSv to 10 Sv, in the energy range from 10 keV to 10
MeV. Amptek XR-100CR X-ray spectrometer with Si
detector was used to measure spectra of X-ray.
4. Results
Equivalent doses from one particle for different
intensities and different materials using scaling by Beg
et al. [7] were modeled using FLUKA and are given in
Fig. 2. Predicted doses show linear temperature
dependence. The role of the material (atomic number Z)
is very important as well: the possible doses could be 3
to 6 times higher in case of W in comparison with Al for
the given intensity.
Fig. 2. Equivalent doses from one electron for Al, Cu and W.
The spectra of photons emerging from the materials
were calculated as well. Modeled spectra are given in
Fig. 3. As expected they consist of characteristic lines
and bremsstrahlung radiation. Using experimentally
determined laser energy conversion efficiencies for Kα
lines (varying from 10-6 to 10-4) [10, 11] it is possible
evaluate bremsstrahlung efficiency. We can
conservatively assume it is higher by one order of
magnitude than Kα efficiency. Upper limit for number
of interacting electrons is evaluated knowing critical
density of the electrons and the focused laser spot size.
Fig. 3. Modeled photon spectra for Al, Cu and W.
96

V. Barkauskas et al. / Medical Physics in the Baltic States 15 (2021) 95-98
Assuming interaction volume of 100 μm3, electron
density 1019 cm-3 and total conversion efficiency to
bremstrahlung 10-3 we find dose rate from 100 kHz
repetition rate at the intensity of 1014 W/cm2 to be 5.5
mSv/h for Cu target at the distance of 35 cm from the
target. Doses for Al are lower, while for W it is 15
mSv/h. This is conservative estimate using worst
conditions from the radiation protection point of view.
Fig. 4. Measured spectrum of Cu.
Spectra and doses were measured experimentally using
laser irradiation described above. Here we present
preliminary results only. Measured spectrum of Cu
target is given in Fig. 4. Measurements of heavier
elements were also performed. Smoothed spectrum of
tin, obtained using copper filter to increase resolution
[12] is presented in Fig 5. We can clearly identify K line
of tin, which proves that electron energies in the focus
reach at least 30 keV (K edge energy). Temperature
predicted by Beg et al. [7] for highest laser intensity
obtained is 17 keV. Part of the electrons in the focus
have higher energies than temperature value (See Fig.
1), so our primary analysis show that the prediction
given by the scaling is reasonably accurate.
Fig. 5. Measured spectrum of Sn target using Cu filter.
Dose rates were measured using two electronic
dosimeters 35 cm away from the laser focal spot. The
highest dose rates obtained with dosimeters were 2.4
mSv/h at 4.7×10¹⁴ W/cm2 for Cu. Different X-ray
generation intensities and subsequently doses were
detected for different materials: dose rates for optimized
focusing at highest irradiation intensities were highest
for Al, Fe, and Cu (from 1 to 2.4 mSv/h), while other
materials gave significantly lower doses (Sn – 0.33
mSv/h, Pb – 0.24 mSv/h). Agreement between modeling
and experimental data is reasonably close for low and
medium Z. We assume that lower doses for higher Z
metals might be attributed to different material
properties such as melting point, heat conduction, etc.,
but this should be investigated more thoroughly. We used passive thermoluminescence dosimeters to
evaluate cumulative dose levels during experimental
session. Experiments were performed for 3 weeks (15
days in the lab). The dosimeter closest to the target (30
cm away) measured H*(10) dose of 32.4 mSv and
H’(0.07) dose reaching 2.05 Sv during experimental
session. Another dosimeter which was behind 3 mm
thick iron plate, with the same distance from the target
measured 0.04 mSv and 0.33 mSv respectively.
Personal dosimeters showed only 0.01 mSv above the
background.
Both electronic and thermoluminescence dosimeters
have lower energy limits for dose measurement (20 keV
and 10 keV respectively). In the spectral measurements
we noticed, that most of the energy is contained in the
lower energy part of the spectrum, i. e. our dosimeters
are not capable to measure significant part of the
irradiation dose resulting from low energy X-ray
photons. Results of H’(0.07) dose measurements
support this conclusion, as H’(0.07) dose coefficients
are significantly higher in low energy part in
comparison with H*(10) dose coefficients [13].
5. Conclusions
The ionizing radiation created by high intensity
femtosecond lasers can cause significant radiological
hazard. During laser pulse-material interaction pulse
energy is transferred to kinetic motion of the electrons
and these electrons drive other processes related with
generation of ionizing radiation. We demonstrate that
pre-defined electron temperature scaling relating
focused beam intensity and generated electron
temperature might be used for dose prediction and
characterization. Combined dosimeteric and X-ray
spectral measurements show that dosimeters with 10-20
keV low energy limit are not capable to estimate whole
equivalent dose to skin H’(0.07) near high intensity
femtosecond laser. Facilities using high intensity lasers
should take measures (e.g. metal plate shielding) to
avoid possible irradiation doses.
Acknowledgements
This research is funded by the European Social Fund
under the No 09.3.3-LMT-K-712 “Development of
Competences of Scientists, other Researchers and
Students through Practical Research Activities”
measure.
97

V. Barkauskas et al. / Medical Physics in the Baltic States 15 (2021) 95-98
6. References
1. Shuting Lei, Xin Zhao, Xiaoming Yu, Anming Hu, Sinisa
Vukelic, Martin B. G. Jun, Hang-Eun Joe, Y. Lawrence
Yao, and Yung C. Shin. Ultrafast Laser Applications in
Manufacturing Processes: A State-of-the-Art Review.
Journal of Manufacturing Science and Engineering, 142,
031005, 2020.
2. M. Malinauskas, A. Zukauskas, S. Hasegawa, Y. Hayasaki,
V. Mizeikis, R. Buividas, and S. Juodkazis. Ultrafast laser
processing of materials: from science to industry. Light:
Science & Applications, 5(8), 16133, 2016.
3. The 2007 Recommendations of the International
Commission on Radiological Protection. ICRP publication
103. Annals of the ICRP, 37(2-4), 1–332, 2007.
4. C. Fonseca, C. Mendez, C. Ruiz, F. Fernandez, and L.
Roso. High Electron Doses from a GW Laser Interacting
with Solid Aluminum Targets. AIP Conference
Proceedings, 1209(1), 31–34, 2010.
5. M. J. Wesolowski, C. C. Scott, B. Wales, A. Ramadhan, S.
Al-Tuairqi, S. N. Wanasundara, K. S. Karim, J. H.
Sanderson, C. A. Wesolowski, and P. S. Babyn. X-Ray
Dosimetry During Low-Intensity Femtosecond Laser
Ablation of Molybdenum in Ambient Conditions. IEEE
Transactions on Nuclear Science, 64(9):2519–2522, 2017.
6. H. Legall, Ch. Schwanke, S. Pentzien, G. Dittmar, J. Bonse,
and J. Kruger. X-ray emission as a potential hazard during
ultrashort pulse laser material processing. Applied Physics
A, 124(6):407, 2018.
7. F. N. Beg, A. R. Bell, A. E. Dangor, C. N. Danson, A. P.
Fews, M. E. Glinsky, B. A. Hammel, P. Lee, P. A.
Norreys, and M. Tatarakis. A study of picosecond laser–
solid interactions up to 1019. Physics of Plasmas, 4(2),
447–457, 1997.
8. A. Ferrari, P.R. Sala, A. Fasso, and J. Ranft. FLUKA: A
Multi-Particle Transport Code. SLAC-R–773. Technical
report, 2005.
9. T.T. Bohlen, F. Cerutti, M.P.W. Chin, A. Fasso, A. Ferrari,
P.G. Ortega, A. Mairani, P.R. Sala, G. Smirnov, and V.
Vlachoudis. The FLUKA Code: Developments and
Challenges for High Energy and Medical Applications.
Nuclear Data Sheets, 120, 211–214, 2014.
10. C. G. Serbanescu, J. A. Chakera, and R. Fedosejevs.
Efficient Ka x-ray source from submillijoule femtosecond
laser pulses operated at kilohertz repetition rate. Review of
Scientific Instruments, 78(10), 103502, 2007.
11. M. Hada and J. Matsuo. Effects of ambient pressure on Cu
Ka X-ray radiation with millijoule and high-repetition-rate
femtosecond laser. Applied Physics B, 99(1), 173–179,
2010.
12. A. Koroliov, J. Reklaitis, K. Varsockaja, D. Germanas, A.
Plukis, and V. Remeikis, X-ray pulse emission of alkali
metal halide salts irradiated by femtosecond laser pulses.
Applied Physics B, 126, 144, 2020.
13. ICRP Report No. 74, Conversion Coefficients for use in
Radiological Protection against External Radiation, Ann.
ICRP 26 (1996).
98

MEDICAL PHYSICS IN THE BALTIC STATES 15 (2021)
Proceedings of International Conference “Medical Physics 2021”
4-6 November 2021, Kaunas, Lithuania
PERCEPTIONS OF THE RISKS OF RADIODIAGNOSTIC EXAMINATIONS IN
POTENTIALLY HIGH-DOSE AND LOW-DOSE PATIENTS
Artem DAVYDOV1, Artem BIBLIN2, Alexander VODOVATOV3, Vladimir SAFRONOV4 123Research Institute of Radiation Hygiene after P.V. Ramzaev, Saint-Petersburg, Russia
4I.M. Sechenov First Moscow State Medical University, Moscow, Russia [email protected], [email protected], [email protected], [email protected]
Abstract: this article presents the results of a study of
patients with potentially high doses and low doses of
radiation exposure during radiodiagnostic examinations.
It was found that despite the related risk, patients with
potentially high doses perceive radiation risks less
acutely. This is due to the fact that patients with
potentially high doses are much more concerned about
the current health problems that cause them to undergo
treatment, which makes it difficult for them to risk-
communicate and adequately assess the risks of
undergoing radiodiagnostic examinations. It is concluded
that different risk-communication strategies are needed
for high-dose and low-dose patients.
Keywords: risk communication, risk perception,
radiation
1. Introduction
The number of radiological medical examinations has
increased in recent years. At the same time, the collective
dose and risks to the populations of developed countries
are increasing [1,2] and radiation risks communication in
the medical field is becoming more relevant. In previous
scientific publications, the following is stated: «It is
estimated that use of CT may be associated with 1.5% to
2% of all cancers in the United States in the future» [2],
«In fact, about 80% of our annual exposure to man-made
ionizing radiations (3 mSv) comes from tests and
procedures ordered by physicians» [3]. «The 72 million
CT scans prescribed in the United States in 2007 were
estimated to result in a future health impact of 29,000
excess cancers with a 95% uncertainty range from 15,000
to 45,000 cases» [4]. And some of these statements cause
disagreement between expert in the fields since
«presenting assessments by quantifying a numeric risk of
stochastic disease from relatively low doses of radiation
does much more harm than good by fostering
misperception and alarm among the lay public, media,
and public health communities»[5]. The reasons for the
controversy are the scientific uncertainty in the field of
radiation safety, the contestability of the LNT [6].
Eventually the doubts reach the patients as well. As Gale
et al. well described [3] the range of questions that arise
before the laypeople regarding radiation risks:
«Understandably, most people have substantial, albeit
unrealistic, concerns about the impact of radiation
exposure on their health. They are especially focused on
the deceptively simple question: What is my risk of
cancer? Other important questions, usually after
preliminary and contradictory data are released by
governments, scientific experts (real and imagined) and
the media are: How certain are you of the risk estimate
you are telling me? How does this risk compare to other
risks in my life? and, Is there anything I can do to avoid
or decrease my risk from radiation? (avoid physicians is
an easy answer). People need this information for many
reasons, but especially for informed decision-making
about traveling to Japan, eating sushi in New York,
having a CT scan or voting on a proposition for a new
nuclear power facility in their country or having a BM
transplant».
When it comes to radiological examinations, more
efficient communication should be established with the
patient in order to avoid rejection of the examination on
one hand, and to inform him about the risks and benefits
of the procedure on the other hand.
Picano [7] wrote in 2004 that there are 3 risk
communication strategies in medicine:
1. the risks should not be mentioned
based on the belief that "experts know best". In addition,
risk communication is a waste of time and increase the
likelihood of refusal of the procedure.
2. Paternalistic approach/understatement of risk often
used in radionuclide examinations. Web sites say,
"Nuclear medicine exams are safe, with radiation
exposure consistent with plain radiography" or "almost
always less than conventional radiological exams." But
the dose can vary greatly, from very small to very large.
«In reality, however, the dose exposure ranges from 50
chest x rays for a thyroid scintigraphy to 4000 chest x
rays for a cortical adrenal gland scintigraphy».
99

A. Davydov et al. / Medical Physics in the Baltic States 15 (2021) 99-101
3. Full disclosure of complete and detailed descriptions
of dose values and risks, using comparisons with other
radiation risks.
There are different categories of patients who are
exposed to high and low doses of radiation during
diagnosis. In some patients, the risks of diagnosis may
be comparable to the risks of no treatment, but the
patients themselves may not recognize this [8]. This
raises questions:
How to better inform patients during radiological
examinations;
How to better inform different groups of patients.
To answer these questions, we need to understand why
the reason for patients consent to radiological
examinations should be understood as well as their level
of awareness of the risks and benefits of these
examinations.
The aim of this study is to:
Compare high-dose groups (potentially the full
cycle of undergoing sex reassignment surgery, not
just mastectomies) / low-dose groups;
Determine motive (unreflective habit (don't know
risks + “doctors know better”) vs consciousness and
hopelessness (know risks, but “I have no way
out”));
Investigate distributions, if there is a dependence of
anxiety on the amount of exposure.
2. Methods
To achieve this objectives, a cross-sectional study was
conducted. Usingself-administrated questionnaires, two
groups of patients were questioned: potential high dose
group (99 respondents, ftm-transgenders) and low dose
group (41 respondents, plastic surgery patients). All
interviewers were patients of the same surgeon, and filled
out the questionnaire via Google Forms. Data was
collected in the fall of 2019. The following questions
were asked:
risk-communication practices before radiological
examinations;
patient awareness of the risks and benefits of
radiological examinations;
risk perception attitudes.
In the winter of 2020,transgender people were surveyed
again, asking them, among other things, about the stages
of sex reassignment that they had planned or completed.
Of the sent surveys, 87 responses were received.
To compare the differences between the two groups on
categorical characteristics, z score test for two population
proportions was used. Mann-Whitney test was used to
assess differences between two independent samples on
quantitatively measured variables (nonparametric test).
3. Results and discussion
In the Russian Federation, the law requires a procedure
for informing patients about the risks of treatment and
diagnosis. All patients must sign an informed consent
form. But ascan be seen from table 1, the informed
consent procedure is not properly conducted.
Interestingly, the low-dose group is more attentive to the
procedure.
Table 1.Risk communication practices
Patients
group
Answer (%)
Yes No Difficult to
answer
Did you sign the Informed Consent Form before the
examination?
High dose
group 46,9 32,7 20,4
Low dose
group 77,5 12,5 10,0
Have you read the contents of?
High dose
group 15,3 66,3 18,4
Low dose
group 52,5 37,5 10,0
Did the radiologist inform you before the examination?
High dose
group 39,8 32,7 27,6
Low dose
group 24,4 70,7 4,9
As a result, most patients are unaware of the risks and
benefits of the radiodiagnostic examination procedure
(table 2). High-dose group has fewer "definite answers"
to radiation risk communication questions.
Table 2. Risk benefit awareness
Patients
group
Answer (%)
Yes No Difficult to
answer
Are you aware of the risks of such examinations
High dose
group 48,5 21,6 29,9
Low dose
group 41,5 43,9 14,6
Are you aware of the benefits of such examinations
High dose
group 48,5 21,6 29,9
Low dose
group 61,5 30,8 7,7
This is because they are more concerned about their
current health problems than they are about the radiation
risks from radiodiagnostic examinations (table 3).
Table 3. Distribution of answers to the question: Which risks
are more significant for you: those related to the health
problems that you are currently undergoing treatment or those
related to exposure to radiation during medical examinations?
Patients
group Answer (%)
current
health
issues
both in
equal
measure
related to
radiation
exposure
Difficult
to answer
High
dose
group
69,7 11,1 3,0 16,2
Low
dose
group
46,3 24,4 7,3 22,0
At the same time, it cannot be said that the high-dose
group trusts doctors more and believes in the safety of
radiodiagnostic methods - they are rather forced to follow
their instructions for treatment (tables 4-5).
100

A. Davydov et al. / Medical Physics in the Baltic States 15 (2021) 99-101
Table 4. Distribution of answers to the question: Which
statement are you more likely to agree with?
1 - Since doctors prescribe radiodiagnostic examinations, then,
in general, they are relatively safe and do more good for my
health than harm
5 - Doctors are used to prescribing radiodiagnostic
examinations, they are so comfortable, they do not think about
the long-term consequences for the body
Patients
group Answer (%) Mean
1 2 3 4 5
High dose
group 36,4 33,3 15,2 7,1 8,1 2.17
Low dose
group 61,0 22,0 2,4 4,9 9,8 1.81
There is a statistically significant difference between the
two groups. Using Mann-Whitney statistics, the mean
ranks are 75.30 for high dose group and 58.90 for low
dose group. The value of z is -2.311. The value of p is
.021. The result is significant at p < 0.05.
Table 5. Distribution of answers to the question: Which
statement are you more likely to agree with?
1 - I agree to radiodiagnostic examinations because I trust
doctors
5 - I agree to radiodiagnostic examinations because I have no
choice
Patients
group Answer (%) Mean
1 2 3 4 5
High dose
group 32,3 18,2 21,2 11,1 17,2 2.63
Low dose
group 43,9 14,6 12,2 4,9 24,4 2.51
No statistically significant difference between the two
groups. Mann-Whitney statistics. The value of z is -
0.639. Mean ranks are 71.86 for high dose group and
67.21 for low dose group. The value of p is 0.523. The
result is not significant at p < 0.05.
Up to 30 percent of patients plan to undergo all stages of
the process (table 6.), so the dose accumulated during
radiodiagnostic procedures will pose significant risks [8].
The risks will be comparable to those of the suits. Table 6. Distribution of answers to the question: What steps do
you plan to take (or have you already taken) in sex reassignment
surgery?
Operation/group of
operations
Percent (number of
observations)
mastectomy 96,6 (84)
hysterectomy 88,5 (77)
phalloplasty 19,5 (17)
urethroplasty 23 (20)
metoidioplasty 31 (27)
4. Conclusion
At the moment, in the Russian Federation, the doctor-
patient interaction system takes place in a paternalistic
format. Patients trust physicians to determine treatment
strategies and are not prepared to make joint decisions
where possible, nor do they have the competence to do
so.
Studies of the perception of different types of radiation
risks show that despite the general wariness of the
population's perception of these risks, medical
perceptions are moderate, which, combined with a high
level of trust in doctors, results in a low outrage effect.
Patients with high hazard are less concerned about the
radiation risks of radiodiagnostic examinations because
they are highly concerned about health problems. Doses
to first patients are higher because their health problems
are more serious and require more medical procedures,
including radiodiagnostic examinations.
Patients with high hazard are less concerned about the
radiation risks of radiodiagnostic examinations because
they are highly concerned about health problems.
But objectively, there are different categories of patients
- high-dose patients with high risks and low-dose patients
with low risks. For different categories of patients,
different risk communication strategies should be
developed and provided for patients, some to increase
outrage, some to decrease, according to the hazard.
5. References 1. Onischenko G.G., Popova A.Yu., Romanovich I.K.,
Vodovatov A.V., Bashketova N.S., Istorik O.A., Chipiga
L.A., Shatsky I.G., Sarycheva S.S., Biblin A.M., Repin
L.V. Modern principles of the radiation protection from
sources of ionizing radiation in medicine. Part 2: radiation
risks and development of the system of radiation protection.
Radiatsionnaya Gygiena = Radiation Hygiene.
2019;12(2):6-24. (In Russ.) https://doi.org/10.21514/1998-
426X-2019-12-2-6-24
2. Baerlocher, Mark Otto, and Allan S. Detsky. "Discussing
radiation risks associated with CT scans with patients."
Jama 304.19 (2010): 2170-2171.
3. Gale R. P., Hoffman F. O. Communicating cancer risk from
radiation exposures: nuclear accidents, total body radiation
and diagnostic procedures //Bone marrow transplantation.
– 2013. – Т. 48. – . 1. – С. 2-3.
4. Berrington de Gonza´lez A, Mahesh M, Kim K-P,
Bhargavan M, Lewis R, Mettler F, Land C. Projected
cancer risks from computed tomographic scans performed
in the United States in 2007. Arch Intern Med 169:2071–
2077; 2009.
5. Fellman, A. (2012). Comment on Hoffman et al. Health
physics, 102(5), 589-590.
6. Tschurlovits, M. (2001). The importance of the Hormesis-
LNT controversy for practical radiation protection. In
Radiation protection for humans and society in tomorrow's
Europe. Joint meeting of OeVS (Oesterreichischer Verband
fuer Strahlenschutz) and FS (Fachverband fuer
Strahlenschutz). 33. FS annual meeting.
7. Picano, E. (2004). Informed consent and communication of
risk from radiological and nuclear medicine examinations:
how to escape from a communication inferno. BMJ,
329(7470), 849–851. doi:10.1136/bmj.329.7470.849
8. Safronov V.V., Davydov A.A., Vodovatov A.V., Startseva
O.I., Biblin A.M., Repin L.V. Assessment of the medical
radiation and non-radiation risks for the patients
undergoing the surgical gender reassignment from female
to male. Radiatsionnaya Gygiena = Radiation Hygiene.
2020;13(2):99-113. (In Russ.)
https://doi.org/10.21514/1998-426X-2020-13-2-99-113
101

MEDICAL PHYSICS IN THE BALTIC STATES 15 (2021)
Proceedings of International Conference “Medical Physics 2021”
4-6 November 2021, Kaunas, Lithuania
PREDICTION OF DETERMINISTIC SKIN EFFECTS IN PATIENTS
UNDERGOING HIGH-DOSES INTERVENTIONAL RADIOLOGY
EXAMINATIONS
Svetlana SARYCHEVA1, Zumrud VAGIDOVA2, 1,2Saint-Petersburg Research Institute of Radiation Hygiene after Professor P.V. Ramzaev;
[email protected]; [email protected]
Abstract: The study was focused on the assessment of the
probability of deterministic skin effects occurrence for
patients undergoing hepatic arterial chemoembolization.
These procedures can be associated with high patient
doses and are frequently performed multiple times for the
same patient. The data was collected in three city
hospitals from Saint-Petersburg; detailed information
about more than 100 procedures was studied. The
conversion coefficients from the measured dosimetric
values to skin dose and the thresholds values correspond
to medically important skin reactions for patient follow-
up were proposed.
Keywords: interventional radiology, maximum skin
dose, deterministic effect
1. Introduction
Interventional radiology (IR) is a very important part of
modern medicine; however, it can be accompanied by
high levels of patient exposure [1, 2]. For radiation
protection purposes an estimation of the probability of
deterministic effects on the patient's skin in addition to
the assessment of stochastic effects for IR procedures is
required. [1-5]. This is especially important for
periodically repeated procedures when some unwanted
tissue reactions have already been reported - therapeutic
procedures in the abdomen and pelvic area. [1,3-4]. The
maximum skin dose (MSD) - specifically the maximum
absorbed dose at the most irradiated area of the skin – is
the quantitative characteristic for determining the
likelihood of deterministic effects on the skin [2].
There are two main approaches for MSD estimation: it
can be measured directly (for example, using
radiochromic films) or estimated retrospectively based
on other measurable quantities [5]. The basic quantity for
MSD assessment is the Cumulative Dose at the reference
point (CD) [mGy] - the air kerma accumulated at a
specific point representing the location of the patient's
skin (on the central ray of the x-ray beam, 15 cm from the
isocenter toward the focal spot) [6]. CD approximates the
total radiation dose to the skin, summed over the entire
body from all projections. CD was established
specifically for the skin dose assessment, however not all
angiography units provide this parameter. In this case, the
total value of the Dose-Area Product (DAP) [cGy·cm2 or
μGy·m2] for MSD estimation is used. DAP is the product
of the dose at the center of a certain plane of the X-ray
beam (e.g. the surface of the patient) multiplied by the
area of the X-ray field at that plane. For assessment of the
skin dose by DAP the data about X-ray field size on the
patient’s body is required. Both modules (DAP and CD)
don't consider the beam position changing and don’t
include tissue backscatter.
Currently, due to the difficulty in MSD assessment,
prediction of the possibility of skin reactions after IR
procedures based on the trigger levels established by the
international organizations CIRSE and IAEA: DAP is
greater than 300 Gy*cm2 or CD is greater than 5 Gy [7,
8]. In theory, these trigger values must correspond to the
MSD value of 3 Gy, as recommended by ICRP
Publication 85 to determine the need for patient follow-
up [1]. This study was focused on the assessment of the
probability of deterministic skin effects occurrence for
patients undergoing hepatic arterial chemoembolization
(HACE). These procedures can be associated with high
patient doses and are frequently performed multiple
times for the same patient. To predict the possible tissue
reactions, the correct predictions and the patient's skin
dose assessment are very important. The aim of the study
was to analyze the applicability of the existing trigger
values for HACE procedures and suggest a new one if
necessary.
2. Materials and methods
The data were collected in three city hospitals in Saint-
Petersburg. The hospitals were equipped with different
angiography units: Siemens Artis Zee, Toshiba biplane
INFX-8000V/EK, and Philips Allura Xper FD20.
102

S.Sarycheva et al. / Medical Physics in the Baltic States 15 (2021) 102-104
All angiography units were used like monoplane systems,
have flat-panel detectors, and automatic exposure rate
control systems. Patient doses were measured with built-
in dose measuring systems with a valid calibration. The
total filtrations for angiography units were 3,1 mm Al for
Philips Allura Xper FD20, 2,5 mm Al for Siemens Artis
Zee and 3,6 mm Al for Toshiba INFX-8000V/EK
correspondingly. During the examinations on all systems,
the additional filters of 0.1-0.3 mm Cu were
automatically inserted into the beam from time to time.
Detailed information about more than 100 HACE
procedures was obtained. The data about operation
technique, physical, technical, geometric, and dosimetric
parameters for this type of procedure were observed. The
mean characteristics of patient samples and geometrical
parameters collected during HACE examinations (source
to patient distance [SPD], source to detector distance
[SDD], size of field of view [FOV], and projections of
radiation field - deviations from direct posterior-anterior
(PA) projection) are given in Table 1 as well as the
cumulative dosimetric parameters: total DAP and CD.
The data are presented in the mean or mean/median
format and ranges in parenthesis.
All HACE procedures observed during this study were
characterized by similar performance parameters and
localization of the radiation field on the patient's body. It
was the dominant use of large radiation fields without
magnification and PA projection with rare and very small
angulations (< 4). In all cases, femoral artery
catheterization was performed. There were slight
fluctuations in the location of the radiation field in the
area of interest (hepatic artery), and all studies were
accompanied by overlapping fields in the central part.
The skin dose distribution during high-dose IR
examinations as a separate project was studied. To
visualize the dose distribution on the patient's skin
surface, a series of direct measurements were carried out,
using special radiochromic films Gafchromic XR-RV3.
The results of this work were already published [9],
which shows that almost all IR examinations in the
abdominal and pelvic area (except some cases of uterine
artery embolization) are accompanied by overlapping
fields, this fact is also confirmed by other literature data
[10,11].
The total skin dose (TSD) value can be estimated by the
CD corrected with the backscatter factor (BSF) or based
on the DAP value, considering the radiation field size on
the patient’s surface (S) and BSF.
TSD can be calculated using Equation (1):
TSD = B·CD = B·DAP/S (1)
MSD can be taken equal to TSD due to the relatively
fixed radiation field for HACE procedures. Thus, the
values of the conversion coefficients from the measured
values of CD and DAP to MSD can be calculated using
the following Equation:
KDAP = MSD/DAP = TSD/DAP = BSF/S (2)
KCD = MSD/CD = BSF (3)
Where KDAP - Conversion coefficient from the measured
value of DAP to MSD, mGy/(Gy·cm2);
KCD - Conversion coefficient from CD to MSD, rel. unit;
BSF - Backscatter factor, rel.unit;
S – Field size on the patient's entrance plane, cm2.
3. Results
For MSD assessment based on the DAP or CD values,
the large influence size and location of radiation field on
the patient’s body have. As was mentioned above, the
HEPA procedures are carried out with large FOV with a
rare decrease and a relatively constant position of the
radiation field on the patient's body in the PA projection.
Therefore, only BSF and S values are needed to calculate
the conversion coefficients from the measured DAP or
CD values to MSD using Equation (2) or (3) respectively.
BSF is defined as the ratio of a dose on the surface of a
phantom to the dose at the same point in space, in the
absence of the phantom. Values of BSF were provided by
ICRU-74 and IAEA TRS 457, for 21 diagnostic beam
qualities with kilovoltages of between 50.0 and 150.0 kV,
and different types of filtrations [12,13]. Under the
observed HACE procedures conditions, the BSF value
was close to 1.4. In the case of stronger filtration (for
example with frequent introduction of additional copper
filters), BSF can increase up to 1.5 or more. In our
calculations, we use the value of 1.4.
The dimensions of the radiation fields on the patient's
body were calculated based on the collected geometric
parameters of the field sizes on the detector (FOV) and
the distances between the source, patient, and detector
(shown in Table 1.). The radiation field area on the
entrance plane of the patient's body for HACE procedures
performed in observed clinics was within 400-500 cm2.
Assuming the interventional reference point happens to
be on the patient’s skin, and the beam does not move a
lot during the procedure, the MSD is the CD multiplied
by a backscatter factor.
Table 1. Parameters of angiography systems, patient cohort, and procedures characteristics.
Angiography
system
Patient sample Geometric parameters of HEPA procedures Dosimetric parameters
Number Age,
year
FOV,
cm SDD, cm SPD, cm Projection
DAP,
Gy*cm2 CD, Gy
Philips Allura
Xper 19
60 (33-
75) 30*40 (90-100) (65-70) PA (0,0)
256/309
(27-776)
1,0/1,2
(0,07-
2,8) Siemens
Artis Zee 47
59 (30-
85) 30*30 (90-95) (65-70) PA (0,0)
118/177
(1-1494) -
Toshiba
INFX 40
57 (39-
71) 30*40 (100-105) (70-75) PA (0,0)
160/203
(13-957)
0,2/0,4
(0,02-
3,3)
103

S.Sarycheva et al. / Medical Physics in the Baltic States 15 (2021) 102-104
According to the equation (3) KCD = 1,4. Calculating by
the Equation (4) KDAP = 3,5 mGy/(Gy·cm2) if radiation
patient field size is closed to 400 cm2 and KDAP = 2,8
mGy/(Gy·cm2) if field size on the patient surface is
around 500 cm2.
According to international documents, minimum prompt
skin reactions may occur in sensitive patients within
hours after an acute MSD exceeding 2 Gy; medically
important reactions occur in average patients several
weeks later at MSDs exceeding 5 Gy [14].
To determine the necessity of patient’s after-care the
threshold of 3 Gy is recommended [1]. The thresholds in
terms of DAP and CD corresponding to mentioned MSD
limits were calculated. The conversion coefficient (KDAP)
from the measured DAP to MSD and the trigger values
of DAP and CD corresponding to the ‘normal’ MSD of 3
Gy and ‘critical’ MSD of 5 Gy for different radiation
field sizes are given in Table 2.
It can be seen that the received DAP trigger values are
significantly higher than 300 Gy·сm2 and the CD values
are conversely below the 5 Gy limit. The problem is that
the existing trigger values (DAP > 300 Gy·cm2, CD > 5
Gy) has been established for interventional cardiac
examinations and are not suitable for IR procedures in the
abdominal and pelvic area which are characterized by
relatively static and large radiation field.
4. Conclusions
This study was focused on the assessment of the
probability of deterministic skin effects occurrence for
patients undergoing hepatic arterial chemoembolization
(HACE). The possible skin dose distributions during the
HACE procedures were studied. Data analysis was
carried out for more than 100 procedures performed in 3
clinics. Our own previously obtained film measurements
of the skin dose distribution for such examinations were
additionally considered.
During the IR procedures performing the total values of
DAP and CD are displayed and for MSD assessment in
real-time can be used. Now the prediction of the
possibility of skin reactions after all IR procedures based
on the trigger levels for interventional cardiology: DAP
is greater than 300 Gy·cm2 or CD is greater than 5 Gy.
According to the results of our work, those values do not
correspond to the threshold for the occurrence of skin
reactions after HACE procedures (as well as for other IR
procedures performing with large and static radiation
fields). The existing trigger levels in terms of DAP value
is unreasonably low, while the CD value is too high and
makes it possible to miss some cases of skin injuries. In
this study, ‘normal’ and ‘critical’ thresholds values in
terms of DAP and CD correspond to the 3 and 5 Gy of
MSD were proposed. MSD of 5 Gy can lead to medically
important skin reactions, which corresponds for HACE
procedures to a CD threshold value of 3,6 Gy and DAP
more than 1100 Gy·сm2.
5. References
1. ICRP. Publication 85. Avoidance of radiation injuries from
medical interventional procedures. Ann. ICRP. Vienna,
Pergamon Press; 2000; 30(2): 68.
2. Sarycheva S, Golikov V, Kalnicky S. Studies of patient doses
in interventional radiological examinations. Radiat Prot
Dosimetry. 2010 Apr-May;139(1-3):258-61.
3. Miller DL, Balter S, Cole PE, et al. Radiation doses in
interventional radiology procedures: The RAD-IR study: Part
II: Skin Dose. J. Vasc. Interv. Radiol. 2003,14: 977-990.
4. Galstyan IA, Nadezhina NM. Local Radiation Injuries as
Complications of Medical Radiation Exposure. Meditsinskaya
radiologiya i radiatsionnaya bezopasnost = Medical Radiology
and Radiation Safety. 2012;57(5): 31-36. (In Russian).
5. Balter S, Fletcher DW, Kuan HM, Miller D, Richter D, Seiss
H, et al. Techniques to estimate radiation dose to skin during
fluoroscopically guided procedures. J Vasc Interv Radiol.
2001;13: 391-397.
6. International Electrotechnical Commission. Report 60601.
Medical electrical equipment—Part 2– 43: particular
requirements for the safety of X-ray equipment for
interventional procedures. Geneva, Switzerland: IEC, 2000.
60601–2– 43.
7. Stecker MS, Balter S, Towbin RB, Miller DL, Vañó E, Bartal
G, Angle JF, Chao CP, Cohen AM, Dixon RG, Gross K,
Hartnell GG, Schueler B, Statler JD, de Baère T, Cardella JF;
SIR Safety and Health Committee; CIRSE Standards of
Practice Committee. Guidelines for patient radiation dose
management 2009, J Vasc Interv Radiol 20(7 Suppl) 263-73
8. https://www.iaea.org/resources/rpop/resources/databa ses -and-
learning-systems/safrad
9. Sarycheva SS. Patients skin dose measurements during
interventional radiological examinations using Gafchromic
XR-RV3 FILM. Radiatsionnaya Gygiena = Radiation
Hygiene, 2019;12(4): 89-95. (In Russian)
10. Neocleous A, Yakoumakis E, Gialousis G, Dimitriadis A,
Yakoumakis N, Geargiou E. Dosimetry using Gafchromic XR-
RV2 radiochromic films in interventional radiology. Radiation
Protection Dosimetry. 2011;147(1-2): P. 78-82.
11. NCRP Report 168. Radiation dose management for
fluoroscopically-guided interventional procedures. National
Council on Radiological Protection. 2010: 314.
12. ICRU. Publication 74. Patient Dosimetry for X-rays used in
medical imaging. Journal of the ICRU. 2005;5(2): 116.
13. IAEA, Dosimetry in Diagnostic Radiology: An International
Code of Practice, Technical Reports Series No. 457, IAEA,
Vienna (2007).
14. Cousins C, Miller DL, Bernardi G, Rehani MM, Schofield P,
Vañó E, Einstein AJ, Geiger B, Heintz P, Padovani R, Sim KH;
International Commission on Radiological Protection. ICRP
PUBLICATION 120: Radiological protection in cardiology.
Ann ICRP. 2013 Feb;42(1):1-125.
Table 2. The conversion coefficient (KDAP) from the measured dose area product (DAP) to the maximum skin dose (MSD) for the
interventional procedures in the abdominal and pelvic area performing with relatively static radiation field and the two types of
trigger values of dose area product (DAP) and cumulative dose (CD) to prevent the deterministic effects in the skin for such
examinations.
Field size on the
patient entrance
plane, cm2
KDAP,
mGy/(Gy·cm2)
Trigger values corresponding to
MSD of 3 Gy (normal)
Trigger values corresponding to
MSD of 5 Gy (critical)
DAP, Gy·сm2 CD, Gy DAP, Gy·сm2 CD, Gy
400 3.5 850 2.1
1100 3.6
500 2.8 1400 1750
104

MEDICAL PHYSICS IN THE BALTIC STATES 15 (2021)
Proceedings of International Conference “Medical Physics 2021”
4-6 November 2021, Kaunas, Lithuania
EARLY EFFECTS OF RADIATION EXPOSURE ON PERIPHERAL BLOOD
CELLS AND NORMAL ORGANS OF MICE
Yuliya DVORNIK1, Natalia VEYALKINA2, Kseniya FABUSHEVA3
Institute of Radiobiology of the National Academy of Sciences of Belarus [email protected]; [email protected]; [email protected]
Abstract: The results demonstrate that the changes in
the weight of organs depend on the type of exposure, its
duration, and dosage. The spleen is considered to be the
most sensitive to radiation exposure and suffers more
changes than any other organ compared to control. A
single-time exposure to a dose of 10Gy causes the
number of peripheral blood leukocytes to decrease ten
times as against control. The levels of thrombocytes,
erythrocytes, and that of hemoglobin remain within their
normal ranges at early stages following the exposure. In
a fractional exposure (total of 5 times, 2Gy each), the
leukogram changes are much less obvious.
Keywords: organ damage, blood cells, fractional
exposure, single exposure, weight coefficient
1. Introduction
The studies related to the effects of ionizing radiation on
biological objects and humans have increased in
numbers over the last few years. For the most part, chest
area irradiation cases are associated with radiation
therapy of oncological disorders. At the same time, such
treatment presents a risk of injuring healthy tissues of
the lungs, heart and major vessels exposed to radiation
[1]. The present-day level of neoplasm therapy leads to
higher survival rates of cancer patients. Nevertheless,
what preserves its relevance is the issue related to the
long-term effects of radiation developed following the
exposure of healthy tissues and organs. Understanding
the biological pathways and mechanisms of radiation
injury will help to reduce the risk of long-term side
effects to human health, which in its turn will lead to
more improved cancer therapies in the future. With this
regard, the use of animal models, which are similar in
cellular responses to humans, can be very helpful in
tackling the said issue.
A considerable number of research works over the last
decade were aimed at establishing an effective model
both for enhancing radiation treatment methods and for
reducing the negative consequences of medical
exposures [2-4]. The most common experimental model
in radiation-related research is the mouse [5].
Three strains of mice with phenotypic expression of
radiation-induced lung injury were studied and analyzed
by Jackson et al. [4]. The X-ray source of 320 kV was
used to generate the dose rate of 69.2cGy min–1. For all
strains, the dose was reliably associated with 180-day
mortality (p<0.0001). An estimated LD50/180 for
C57L/J mice was 11.35Gy, approximately 14.17Gy for
CBA/J mice, and 14.10Gy for C57BL/6J mice. The
findings showed that the response of some animal
models (in particular, C57L/J and CBA/J) could be
extrapolated to human lungs to understand the
mechanisms of radiation exposure effects.
All the above underlines the relevance and practical
significance of the need to investigate the mechanisms
of the cellular and subcellular damage development
following local irradiation of the chest area.
This study was aimed at exploring the radiation-induced
cell and organ damage dynamics resulted from local
thorax exposure of laboratory mice and estimating its
relevance for the prediction of long-term health effects.
Our objective was to assess the health state of mice in
the acute post-irradiation period following a single and
fractional exposure of the chest area at a dose of 10Gy.
2. Materials and methods
The research animals used in our laboratory
experiments were the mice of C57BL/6 strain –
physically active animals with smooth and shiny coats
and normal visible mucous membranes aged 2.5-3
months at the beginning of our study.
The mice were kept quarantined in the vivarium for two
weeks prior to the experiment. On the day of the
experiment, additional examination and weighing were
carried out. The groups were formed based on the
gender and body weight of mice.
All group experiments started at the same time in the
morning, taking into account the chronological
dependence of physiological and biochemical processes
in the body.
105

Yu. Dvornik et al. / Medical Physics in the Baltic States 15 (2021) 105-108
The animals were divided into 3 groups (N = 30)
including a control, single exposure and fractional
exposure groups. The mice in group 1 were intact
animals subject to all manipulations except for radiation
exposure, group 2 was exposed to one-time chest
irradiation at a dose of 10Gy, and group 3 was exposed
to 2Gy once every 24 h during 5 days straight, with a
total radiation dosage to the chest area of 10Gy. Each
group of mice consisted of 10 females and 10 males.
The system used for animal irradiation was a biological
irradiator X-Rad 320 (Precision X-Ray, USA), with an
X-ray tube voltage of 320kV, dose range of
98.8cGy/min, filter No.2 of 1.5mm Al, 0.25mm Cu,
0.75mm Sn, and source to specimen distance of 50cm.
The locality of chest area irradiation was achieved by
using lead shielding sheets.
The physical condition of animals was being observed
during the entire time of the experiments. One and four
weeks following the exposure, the animals were
submitted to deep anesthesia and decapitated. Blood
sampling, isolation and weighing of internal organs
were then carried out. A general blood test was made
using a Celltac MEK-6318J/K hematology analyzer.
To calculate a post-irradiation weight coefficient, the
following equation was used:
𝑘 =𝑤𝑖∙100
𝑤 (1)
where wi – weight of i organ in g, w – total body weight,
g.
Statistical analysis of the data was performed with the
Microsoft Office Excel 2013 and STATISTICA 10
tools. An assumed critical level of significance (p) in
this study was 0.05.
3. Results
3.1 Effects on normal tissues and organs
The distribution of the weight coefficient of the four
organs in terms of the gender and irradiation modes is
shown in Figure 1.
The lung weight coefficient has seen an increase of 20%
against control a week after the exposure with a dose of
10Gy, and a 25% increase one month after the exposure.
The weight coefficient of the heart was close to the
control one week after the exposure, while an increase
of 2.9 per cent was observed in this organ the following
month. After single-time irradiation, the spleen weight
coefficient halved down compared to control. A similar
weight coefficient loss was observed both in males and
females one week after the exposure.
The spleen contains hematopoietic stem cells. These
cells divide more intensively under extreme conditions
and therefore deplete. The processes of reparation then
start to take place. Fractional irradiation does not show
the same sharp decrease as the reparation processes are
launched within 24 hours.
After single-time exposure, the weight coefficient of the
heart in a male group, when compared to control,
decreased by 11.5% during the first week and increased
by 1.8% one month following the exposure.
Fig. 1. Distribution of organs weight coefficient for male (A)
and female (B) mice 1 week (1) and 1 month (2) after
exposure. (*) – statistically significant changes (p<0.05, N =
10).
Due to the severe inflammatory response, the lung
weight coefficient was 10.6 per cent higher than that in
control one week after exposure. Being the main blood-
forming organ, the liver is highly exposed to ionizing
radiation. Destruction of hematopoietic cells causes a
13.85% decrease of the liver weight coefficient one
106

Yu. Dvornik et al. / Medical Physics in the Baltic States 15 (2021) 105-108
week after exposure compared to control. Even so,
intensive formation of new blood cells from
hematopoietic stem cells leads to a nearly complete
recovery of the weight coefficient within one month
after the exposure.
Fractional exposure has a long-term but less destructive
effect on the four organs. In the male group, the heart
weight coefficient decreased by 12.7%, and then
increased by 7.1% within, respectively, a week and a
month after exposure. The weight coefficient of the lung
was 1.6% lower against control a week after irradiation
and was 8.3% higher than control after one month
following the exposure. The spleen was degraded and
its weight coefficient decreased by 39%. One month
after exposure, the spleen weight coefficient was 1.4%
lower than that in the control group.
In each experimental group, the spleen was clearly the
most sensitive to radiation exposure organ, both for
male and female mice. Figure 1 demonstrates the
significance of changes in the spleen weight coefficients
in terms of single-time and repeated fractional exposure.
3.2 Effects on peripheral blood cells
Figure 2 demonstrates the leukogram changes in the lab
mice 1 week (Fig. 2.A) and 1 month (Fig. 2.B) after
irradiation. In a male group, the amount of WBC
(leukocytes) decreased by 84% compared to control one
week after single-time irradiation. Within a month, the
average amount of WBC then slowly recovered up to
4.86±0.93·109 cells per L (61% of control). One week
after fractional exposure, the average amount of WBC
decreased by a factor of 3 – from 5.94±1.17·109 cells
per L (control) to 1.68±0.66·109 cells per L. It then
increased to 4.12±0.59·109 cells per L, or 52% of the
control amount.
Single irradiation is characterized by abrupt changes in
the leukogram and rapid initiation of repair processes.
In a female group this difference was 93% and 55% one
week and one month after the single-time exposure,
respectively, compared to control.
A week after fractional exposure the difference between
experimental and control groups was 66%, decreasing
further down to 50% within the next month.
No sharp decreases in the amount of RBC after
irradiation were observed (see Table 1).
Table 1. Changes in peripheral blood of mice after irradiation
RBC HGB
1 week
Control 8.97±0.15 146.6±1.67
Single irradiation 7.04±0.18 116.8±2.15
Fractional irradiation 6.77±0.17 116,0±1.95
1 month
Control 7.56±0.79 9.31±0.20
Single irradiation 4.12±0.58 8.65±0.18
Fractional irradiation 3.83±0.37 8.54±0.17
The general downward trend was observed for RBC
(erythrocytes) and HGB (hemoglobin). A week after
single irradiation the amount of RBC decreased by 21%.
Fractional irradiation caused approximately the same
decrease in the amount of RBC. One month later, the
values were again equal and comparable to the control.
After exposure to extreme factors such as ionizing
radiation, the rate of erythropoiesis increases several
times, while the RBC lifespan decreases.
The HGB level after exposure decreased by 20.3%. One
week after exposure, the data in group 2 (one-time) and
group 3 (fractional) were the same.
Fig. 2. Average amount of WBC 1 week and 1 month after
exposure. On the graph: A – male, B – female mice.
4. Conclusions
The data analysis presented herein essentially suggests
that the effect of ionizing radiation at a dose of 10Gy on
the chest area of laboratory mice not only causes
destructive changes in animals but can also, over a
period of time, trigger recovery processes in the body.
The effects of fractional exposure are much less
pronounced when compared to single-time local
irradiation.
The greater sensitivity of the spleen to ionizing radiation
was observed in both male and female groups of mice.
The change in the weight of organs shows high
dependency on the type of exposure. A one-time
exposure (10Gy) causes more visible changes in the
weight coefficient of organs compared to fractional
exposure (total of 5 times, 2Gy each).
After single irradiation at a dose of 10Gy, the number of
peripheral blood leukocytes decreased by a factor of 10.
The levels of thrombocytes, erythrocytes and
hemoglobin remain within their normal ranges at early
stages following the exposure.
107

Yu. Dvornik et al. / Medical Physics in the Baltic States 15 (2021) 105-108
5. References
1. Michael J. Chen, Paulo E. Novaes, Rafael Gadia, Rodrigo
Motta. Guidelines for the treatment of lung cancer using
radiotherapy. Rev. Assoc. Med. Bras., 2017, 63(9), 729-
732.
2. Thomas J. MacVittie, Ann M. Farese, William Jackson
3rd. The hematopoietic syndrome of the acute radiation
syndrome in rhesus macaques: a systematic review of the
lethal dose response relationship. Health Phys., 2015,
109(5), 342-366.
3. Butterworth KT. Evolution of the supermodel: progress in
modelling radiotherapy response in mice. Clin. Oncol.,
2019, 31(5), 272-282.
4. Isabel L. Jackson, Pu-Ting Xu, Giao Nguyen, Julian D.
Down, Cynthia S. Johnson, et al. Characterization of the
dose response relationship for lung injury following acute
radiation exposure in three well-established murine
strains: developing an interspecies bridge to link animal
models with human lung. Health Phys., 2014, 106(1), 45-
55.
5. Jacqueline P. Williams, Stephen L. Brown, George E.
Georges, Martin Hauer-Jensen, Richard P. Hill, Amy K.
Huser, et al. Animal models for medical countermeasures
to radiation exposure. Radiat. Res., 2010, 173(4), 557–
578.
6. Cheng Zhou, Bleddyn Jones, Mahmoud Moustafa,
Christian Schwager, et al. Quantitative assessment of
radiation dose and fractionation effects on normal tissue
by utilizing a novel lung fibrosis index model. Radiat.
Oncol., 2017, 12(1), 172.
7. PRECISION (2021). X-RAD 320 Product Information.
Available at: https://precisionxray.com/ x-rad/xrad-320.
Accessed on: 2021-06-25
108

MEDICAL PHYSICS IN THE BALTIC STATES 15 (2021)
Proceedings of International Conference “Medical Physics 2021”
4-6 November 2021, Kaunas, Lithuania
OPTIMIZATION OF CONVENTIONAL X-RAY IMAGE ACQUISITION
PARAMETERS FOR PELVIC PROCEDURES: A PHANTOM STUDY
Antonio JREIJE1,2, Kirill SKOVORODKO1,3, Mykolas PAVLAUSKAS1,4, Roman MACHNIN1,4, Diana
ADLIENĖ2, Birutė GRICIENĖ1,4 1Vilnius University Hospital SantarosKlinikos, Vilnius, Lithuania; 2Department of Physics, Kaunas University of
Technology, Kaunas, Lithuania; 3Center for Physical Sciences and Technology (FTMC), Vilnius, Lithuania; 4Vilnius
University, Faculty of Medicine, Vilnius, Lithuania
[email protected]; [email protected]; [email protected]; [email protected];
[email protected]; [email protected]
Abstract: This study investigated optimization of dose-
image quality relationship for pelvic x-ray examinations
by varying tube voltage (kV). Patient dose optimization
was implemented for three digital radiography systems
used for general x-ray examinations (GE Definium,
Shimatzu Sonialvision Safire and Siemens Luminos).
An anthropomorphic pelvic phantom (CIRS, US) was
used to simulate a patient undergoing clinical pelvic X-
ray examination. Dose quantities ESD (entrance surface
dose), DAP (dose area product) and exposure
parameters (kV, mA, mAs) were measured and the
impact on the image were evaluated, considering
physical CNR (contrast to noise ratio) and observer-
based evaluations as image quality metrics. In the case
of Definium and Sonialvision Safire, both standard and
dose-optimized images were rated as acceptable for
clinical use; thus, an increase of 5-10 kV was an
effective strategy to reduce patient dose while
maintaining image quality. Our results show that the
analysis of the images of an anthropomorphic phantom
performed using physical and observer evaluations can
be an efficient practice for optimizing diagnostic
protocols of digital X-ray units.
Keywords: digital radiography, dose optimization,
radiation exposure, image quality, image evaluation
1. Introduction
Medical imaging represents the largest source of
radiation exposure from artificial sources. It is a well-
established that exposure to high level of ionizing
radiation has an adverse effect on human health [1].
Additionally, evidence suggest that pelvis diagnostic
examinations may lead to increased risk of cancer to the
gonads and other nearby organs [2]. Therefore, due to
the large burden of medical radiation sources on the
general population, reduction in patient doses is
required to ensure exposure ‘‘as low as reasonably
achievable’’ (ALARA) while maintaining adequate
diagnostic quality of the acquired images [3].
In order to manage patient exposure in digital
radiography, training of personnel in the aspects of
patent dose management, continuous collection of
patient doses and revision of local DRLs are
recommended by ICRP [4]. Moreover, the ICRP
recommends the implementation of tools that inform
medical physicists and radiologists about doses
delivered to patients (i.e. dose area product DAP,
exposure index EI, deviation index DI, etc.) [4].
In addition, individual protocol optimization is a key
factor for decreasing patient dose. When performing
optimization in diagnostic radiology, special attention
should be paid to two parameters: patient dose and
image quality [5]. The most important goal of exposure
optimization is to find parameters that result in an
adequate image (i.e. of sufficient diagnostic
information), not the best image. However, defining
what make up an adequate image for diagnostic
purposes might be a challenging task since it depends
greatly on the reader experience and the anatomy and
physiology being examined. Moreover, it is common for
a single hospital to purchase diagnostic units from
different manufacturers depending on its need and
financial resources. Thus, optimization is necessary for
each diagnostic unit as well as for each X-ray protocol.
The aim of this study was to evaluate the effect of
exposure parameters on image noise and contrast using
an anthropomorphic pelvic phantom and to optimize the
diagnostic imaging pelvis protocol of three different
digital X-ray machines.
109

A. Jreije et al. / Medical Physics in the Baltic States 15 (2021) 109-112
2. Materials and Methods
2.1. Radiographic equipment
Images were obtained from three digital X-ray
equipment (General Electronics, Siemens and Shimatzu)
at Vilnius University Hospital Santaros Klinikos, (table
1). Medical physicists of hospital perform regular
quality control and assurance testing of X-ray
equipments in accordance with the radiation protection
act of the Republic of Lithuania [6].
Table 1. Radiology equipment information
Departmen
t
Manufactur
er Model
Installation
year
Pediatric GE Definium 2011
Pediatric Shimatzu Sonialvision
Safire 2011
Radiology Siemen Luminos 2018
2.2. Radiographic technique
Radiographic images were acquired using a pelvic
protocol with an anthropomorphic phantom (CIRS, US)
simulating the lower abdomen and pelvis an average
size adult male patient (MODEL 801-P). The images
were obtained with the phantom placed on the
diagnostic table in the supine position (AP anterior-
posterior projection) while maintaining a 120 cm source
to image detector distance (Fig. 1.).
Fig.1. Experimental setup for simulating pelvic x-ray
examinations with CIRS phantom.
For each X-ray equipment, images of the phantom were
obtained using the standard exposure protocol set by the
manufacturer. The automatic exposure control (AEC)
parameters for each digital system are summarized in
table 2. An additional, set of images were acquired in
the automatic exposure mode while varying voltage
from 65 to 90 keV at 5 keV step interval. In order to
compare the performance of all radiology systems, the
image quality and delivered dose was evaluated for
images obtained using same fixed exposure parameters
(80 keV, 10 mAs) for all equipment.
Dose following each exposure was defined as Dose area
product (DAP) displayed automatically by each system
and measured entrance surface dose (ESD). In order to
calculate the ESD, incident air kerma, measured with a
solid state sensor (Piranha RTI Dose Probe ®) placed on
the surface of the phantom (Fig. 1.), was multiplied by a
backscattering factor corresponding to each beam
quality [7].
Table 2. Exposure parameters for standard pelvic protocol of
a medium size patient.
Equipment Voltage
(kV)
Current
(mA)
Current
tube product
(mAs)
Definium 80 400 18,02
Sonialvision
Safire 75 800 20,5
Luminos 77 800 16,2
2.3. Objective assessment of image quality
The image quality was quantified by measuring the
contrast to noise ratio (CNR) related to the contrast or
signal difference between an object of interest and the
image background (Fig. 2.) and computed following
CNR = 𝑆1− 𝑆2
√𝜎12+𝜎2
2
2
where S1 and S2, are the mean pixel values from the
region of interest 1 and 2 (ROI1, ROI2) respectively,
and σ1 and σ2 are their associated standard deviations.
These different parameters were measured using the
open source software ImageJ CNR while taking the
sacrum and soft tissue as ROI1 and ROI2 respectively
for each x-ray image (Fig. 2.).
Fig. 2. Regions of interest used to calculate contrast-to-noise
ratio (CNR) for pelvic x-ray images.
2.4. Subjective assessment of image quality
Image quality was assessed independently by two
resident radiologists in accordance with guidelines on
basic aspects of quality set by the European
Commission [8]. For each protocol, the order of the
images was randomized and anonymized by stripping of
all visible identifying information that might influence
observer’s assessment including acquisition parameters
(keV, mAs, etc). This was done to prevent any biases
that could occur due to participants knowledge of the
preset acquisition parameters. The evaluation of image
quality was based on (a) overall clinical acceptability,
110

A. Jreije et al. / Medical Physics in the Baltic States 15 (2021) 109-112
(b) visibility of bone structures against soft tissues and
(c) radiographic noise that do not correspond to X-ray
attenuation variations of the object. For the subjective
assessment, scoring of the questions followed a three-
point scale, assigning a score of 1 for unacceptable, 2
for probably acceptable and 3 for fully acceptable. The
final quality score for each image consisted of summing
the mean score of previously stated questions.All
questions were equally weighted while assuming that
they are of equal significance to the diagnostic image
quality. Interrater agreement was assessed by
calculating Cohen’s Kappa coefficient using SPSS
Statistics (IBM Corp., Armonk, NY, SAD).
3. Results and discussion
Due to the variety of digital X-ray units in a single
hospital setting, neither radiological examinations nor
optimization procedure can be standardized. This study
included three radiography equipment from multiple
manufacturers (GE, Shimatzu and Siemens). Direct
comparison of these three units at a fixed radiation
exposure (80 kV, 10 mAs) showed a wide difference in
CNR (GE ~2x higher than Shimatzu and Siemens) and
exposure dose (DAP ranging from 5.9 and 6.8
dGy*cm2) across all units (Fig.3.). Therefore,
optimization should be performed individually for each
particular X-ray equipment operating in the clinical
setting.
Fig. 3. Comparison of image quality (CNR) and dose (DAP)
registered for three X-ray units under a fixed pelvic protocol
using 80 kV and 10 mAs.
Image quality can be investigated in two ways,
objectively based on physical measurements and
subjectively through psychophysical assessments [9]. It
was previously reported that objective measurements
alone are not sufficient to validate the diagnostic benefit
of one digital imaging technique over another [9]. The
method of choice therefore involves the combination of
physical measures and observer performance methods.
In this study, investigations of CIRS pelvic phantom
images were based on the independent rating of two
observers and on measuring the contrast of the sacrum
bone against nearby soft tissues (table 3).
Table 3. Mean image quality scores across two observers for
images taken using different beam quality. R1, Radiologist
resident 1; R2, Radiologist resident 2; CoV, Coefficient of
variation.
kV R1 R2 CoV Total image
score
Sie
men
s L
um
ino
s
65 3 3 0 6
70 3 3 0 6
75 3 3 0 6
77 2 3 0.283 5
81 2 2 0 4
85 2 2 0 4
90 1 1 0 2
Sh
imat
zu
So
nia
lvis
ion
Saf
ire 65 2.3 2 0.109 4.3
70 3 3 0 6
75 3 3 0 6
80 2.3 3 0.177 5.3
85 2.3 3 0.177 5.3
90 2.3 2 0.109 4.3
GE
Def
iniu
m
65 3 3 0 6
70 3 3 0 6
75 3 3 0 6
80 3 3 0 6
85 3 3 0 6
90 3 2.7 0.083 5.7
A total of 22 pelvic clinical x-ray images were acquired
and analyzed. As expected, radiation dose (ESD and
DAP) as well as image quality (CNR) decreased with
increasing tube voltage for all X-ray units (Fig. 3. and
Fig. 4.). However, percentage change in ESD and DAP
was different across each unit. For instance, while
increasing the tube voltage by 10 kV from standard
value, ESD decreased 18%, 35% and 39% for GE,
Shimatzu and Siemens respectively. Overall, ESD and
DAP values agreed well in all cases and consequently
DAP measurements set by all manufacturers are
adequate for estimating patient exposure.
Fig. 4. Relationship between tube voltage and image quality
(CNR) for the three X-ray equipment.
0
1
2
3
4
5
6
7
8
0
0.5
1
1.5
2
2.5
GE Shimatzu Siemens
DA
P (
dG
y*cm
2)
CN
R
CNR DAP
0
0.5
1
1.5
2
2.5
3
65 70 75 77 80 85 90
CN
R
Voltage (kV)
GE
Shimatzu
Siemens
111

A. Jreije et al. / Medical Physics in the Baltic States 15 (2021) 109-112
Fig. 5. Relationship between tube voltage and delivered dose: (A) ESD measuredwith the solid detector and (B) DAP automatically
registered by each unit.
In order to determine the kV parameter above which the
images experience loss of diagnostic information,
radiologists rating was comparted against physical
measurements. There was relatively good agreement
between the two radiologists regarding the scoring of
image sharpness, noise and diagnostic quality; thus,
supporting the validity of our findings (table 3). For GE
Definium and Siemens Luminos, the two radiologists
agreed on almost all images (except for images obtained
at 77 kV and 90 kV for Definium and Luminos
respectively). The inter-rater agreement was only
moderate in the case of Shimatzu Sonialvision Safire
(kappa coefficient = 0.417).
For all X-ray units included in this study, practitioners’
ratings of images acquired using standard technical
factors were higher in diagnostic quality than those
obtained using the dose optimization strategy. For GE
and Shimatzu, acquisition done with up to 10 kV above
standard protocol were deemed to be of acceptable
diagnostic quality. This amount of increase in tube
voltage (i.e. +10 kV) appears to be a highly effective
dose optimization strategy that decreased ESD by 18%
and 35% for GE and Shimatzu respectively (DAP was
reduced by 20% and 35% respectively). On the other
hand, for Siemens, even the smallest increase in kV
above standard voltage resulted in images being rate as
suboptimal by both radiologists and thus, optimization
is not of clinical benefit. Finally, dose optimization
procedure established in this study will be implemented
for other digital X-ray units at VUHSK in the near
future.
4. Conclusions
This was the first dose optimization study for clinical
pelvis protocol at Vilnius University Hospital Santaros
Klinikos using a realistic, tissue equivalent
anthropomorphic phantom. Optimization strategies can
be successful in decreasing radiation doses while
maintaining diagnostic image quality in pelvic x-ray
examinations performed using digital radiography. The
results showed that individual optimization is necessary
since technical parameters change between different X-
ray units. In this study, optimal exposure parameters
were achieved using a combination of physical
measurements (CNR, ESD and DAP) which was proven
to be key for patient dose optimization and observer-
based performance, a method relevant for optimization
based on diagnostic image quality. It should be noted,
that the results of investigation performed with
anthropomorphic phantom should be validated using
clinical images of real patients.
Acknowledgment
The authors would like to express their gratitude to the
Lithuanian Radiation Protection Center for the
possibility of using the pelvic anthropomorphic
phantom.
5. References
1. Prasad KN, Cole WC, Hasse GM. Health risks of low dose
ionizing radiation in humans: a review. Exp Biol Med
(Maywood) 2004;229:378–82.
2. United Nations. Report of the United Nations Scientific
Committee on the Effects of Atomic Radiation 2010, 57th
session: includes scientific report—summary of low-dose
radiation effects on health. United Nations Publications
website. unp. un.org/Details.aspx?pid=22259. Published
2011.
3. International Commission on Radiological Protection.
Radiological protection and safety in medicine. ICRP
report 73. Ann ICRP 1996; 26. doi: 10.1016/s0146-
6453(00)89195-2.
4. International Commission on Radiological Protection.
Managing Patient Dose in Digital Radiology. Vol. 34. Ann
ICRP, 2004: 1-74. (ICRP Publication; 93).
5. Andria G, Attivissimo F, Guglielmi G, Lanzolla AML,
Maiorana A, Mangiantini M. Towards patient dose
optimization in digital radiography. Meas. J. Int. Meas.
Confed. (2016)
https://doi.org/10.1016/j.measurement.2015.08.015.
6. Hygiene Standard HN 78:2009 “Quality control
requirements and evaluation criteria in medical X - ray
diagnostics” adopted by the Order No. V-922 by the
Minister of Health Care. 2009.
7. Dosimetry in Diagnostic Radiology: An International
Code of Practice. Technical Reports Series No. 457.
Vienna: IAEA; 2007.
8. European Commission. European Commission. European
guidelines on quality criteria for diagnostic radiographic
images. Report EUR 16260. L-2985 Luxembourg: Office
for the Official Publications of the European
Communities, 1996.
0
1
2
3
4
65 70 75 77 80 85 90
ESD
(μ
Gy)
Voltage (kV)A
0
5
10
15
20
25
65 70 75 77 80 85 90
DA
P (
dG
y*cm
2)
Voltage (kV)B
GE
Shimatzu
Siemens
112

MEDICAL PHYSICS IN THE BALTIC STATES 15 (2021)
Proceedings of International Conference “Medical Physics 2021”
4-6 November 2021, Kaunas, Lithuania
FETAL DOSES FOR PREGNANT PATIENTS UNDERGOING CHEST CT
EXAMINATIONS
Larisa CHIPIGA1, Aleksandr VODOVATOV2, Polina PIVEN3, Gleb BERKOVICH4, Gennadiy TRUFANOV5,
Irina MASCHENKO6, Polina DRUZHININA7, Viktor PUZYREV8 1,2,7Saint-Petersburg Research Institute of Radiation Hygiene after Professor P.V. Ramzaev, St-Petersburg, Russia;
1Granov Russian Research Center of Radiology and Surgical Technologies, St-Petersburg, Russia; 1,4,5,6Almazov
National Medical Research Centre, St-Petersburg, Russia; 2,8St. Petersburg State Pediatric Medical University, St-
Petersburg, Russia; 3Peter the Great Saint-Petersburg Polytechnic University, St-Petersburg, Russia [email protected]; [email protected]; [email protected]; [email protected];
[email protected]; [email protected]; [email protected]; [email protected]
Abstract: The aim of this study was to estimate the doses
to the fetus from chest CT examinations during the
COVID-19 epidemic using NCICT 3.0 and FetalDose
software. The absorbed dose in the uterus of the mother
and fetal effective dose for the chest CT examinations
estimated by NCICT 3.0 were comparable to the fetal
absorbed dose estimated by FetalDose and increased with
gestational period from 0.07 mGy in the first trimester to
1.5 mGy in the third trimester, depending on the CT
model and scan protocol.
Keywords: computed tomography, fetal absorbed dose,
COVID-19, novel coronavirus infection
1. Introduction
The number of computed tomography (CT) examinations
has highly increased in 2020 due to the massive use of
this method for the diagnosis of novel coronavirus
infection COVID-19, including imaging of pregnant
patients [3-4]. CT examinations help in the diagnosis of
COVID-19 viral pneumonia, to quickly assess the extent
of lung tissue damage and the severity of changes, and to
clarify the stage of changes according to patterns specific
to novel coronavirus infection. It is possible to quickly
route patients and initiate antiviral therapy [5-8] based on
CT and clinical data.
The most dangerous effects of ionizing radiation on the
fetus are associated with exposure after 3-4 weeks of
pregnancy. Fetal absorbed doses exceeding 100 mGy can
lead to a significant decrease in intelligence. High
sensitivity to exposure is observed during the formation
of the central nervous system during 8-15 weeks after
conception. Threshold effects also include congenital
malformations, growth and developmental delays, and
death [9]. Additionally, radiation exposure is associated
with an increased risk of developing leukemia and
various types of solid cancers [11].
The generally accepted approaches to ensure the
radiation protection of pregnant patients [12-13] are:
- justification of X-ray examinations;
- assessment of the absorbed doses in the fetus;
Additional restrictions are introduced in Russian national
regulations:
- X-ray examinations should not be performed in the
second half of pregnancy, with the exception of cases
which require emergency care;
- the absorbed dose limit to the fetus is 100 mGy, in
excess of which it is recommended to terminate the
pregnancy.
There are no approved methods for assessing the
absorbed dose in the fetus in Russian national practice.
The lack of reliable national data on fetal radiation doses
leads to various kinds of speculation and exaggeration of
the negative consequences of CT examinations,
including for women with COVID-19.
Hence, the study was aimed at the estimation of the fetal
absorbed doses from chest CT examination of pregnant
women for diagnostics of the novel coronavirus infection
COVID-19. In order to estimate the fetus doses, the
parameters of national and foreign chest CT protocols
were collected, the absorbed and effective doses in the
fetus were estimated using dedicated software, and the
conversion coefficients from DLP to the absorbed dose
in the mother uterus (fetus) were determined.
2. Materials and methods
2.1. CT protocols
Data on the chest CT protocols of pregnant patients based
on literature sources and collected in medical facilities in
St. Petersburg are presented in Table 1. Table 1. Сhest CT protocols for pregnant patients
113

L. Chipiga et al. / Medical Physics in the Baltic States 15 (2021) 113-116
Source CT scanner kV mАs pitch CTDIvol,
mGy Gestation period
Protocols used for chest CT examinations of pregnant patients presented in literature sources (foreign)
1 H. Liu, et al.
2020 [14]
uCT780, United imaging, China, or
Optima 660, GE (64-section multi-
detector CT scanner)
120 10-
300
1.0875 or
1.375 -
From 20 to 40
weeks
2 Shahir, et al.
2010 [15]
LightSpeed Ultra, LightSpeed Plus,
or LightSpeed VCT, GE (8-, 16-, or
64-MDCT scanner)
120-140 150-
300 1 -
First, second and
third trimesters
3 D. Liu, et al.
2020 [5] Ingenuity Core 128, Philips 120 - - 2.3 – 5.8
From 12 to 38
weeks
4 Angle, et al.
2008 [16] LightSpeed 16, GE 120
100-
300 1.375 -
From 5 to 36
weeks
Protocols used for patients with suspected or diagnosed COVID-19 in St. Petersburg, 2020-2021 (national)
5 - Ingenuity Core 128, Philips 100 142 1.048 - All terms
6 - Somatom Definition AS, Siemens 120 175 - - All terms
7 - Somatom Scope, Siemens 110 75 1.5 - All terms
8 - Emotion 16, Siemens 130 60 1.5 - All terms
2.2. Methods for the fetal doses estimation
Calculation of absorbed doses in the mother uterus, as
well as the fetal effective dose was performed using the
NCICT3.0 software [17-20], based on the family of UF
phantoms of women of 8th, 10th, 15th, 20th, 25th, 30th,
35th, 38th weeks of pregnancy [21]. Fetal absorbed doses
were estimated using the online calculator FetalDose
[22], that is based on a series of hybrid RPI-P3, -P6, and
-P9 phantoms (third, sixth, and ninth months of
pregnancy, respectively) [23]. Fetal masses for phantoms
of pregnant women from NCICT3.0 and FetalDose are
presented in Table 2.
The standard scan length in the NCICT 3.0 of 330 mm
starting from the clavicle was used as the constant typical
scan length, for both calculation methods.
Since the calculation of fetal absorbed doses was
performed for the available chest CT protocols (without
data on radiation doses for individual patients), the
following data processing scheme was used in the study:
- determination of CTDIvol and DLP for 32 cm standard
phantom in the NCICT 3.0 software for each CT
protocol (Table 1) based on the CT model, voltage,
mAs, pitch, collimation;
- calculation of the absorbed dose in the mother uterus
and the fetal effective dose using NCICT 3.0 and
CTDIvol for all available gestation periods (8, 10, 15,
20, 25, 30, 35 and 38 weeks);
- calculation of the fetal absorbed dose using online
calculator FetalDose, voltage and CTDIvol for all
pregnancy trimesters.
Statistical data processing was performed using Statistica
10 software. Spearman's correlation analysis was used to
determine the relationship between the characteristics;
To determine the differences between the samples - the
Kruskell-Wallis test with additional pairwise comparison
by the Mann-Whitney test. All differences were
considered significant at p <0.05.
Table 2. Fetal weights in phantoms of pregnant women in
NCICT 3.0 and Fetal Dose.
UF phantoms of pregnant
patient NCICT 3.0
RPI phantoms of
pregnant patient Fetal
Dose
Phantom,
gestational age mass, g
Phantom,
gestational
age
mass, g
UFHF08WK, 8
weeks 3,57
RPI-Р3, 3
months 71
UFHF10WK,
10 weeks 21,1
UFHF15WK,
15 weeks 146
RPI-Р6, 6
months 902
UFHF20WK,
20 weeks 467
UFHF25WK,
25 weeks 984
UFHF30WK,
30 weeks 1690
RPI-Р9, 9
months 2754
UFHF35WK,
35 weeks 2560
UFHF38WK,
38 weeks 3196
3. Results and discussion
The results of estimation of absorbed dose in the mother
uterus and fetal absorbed and effective doses are
presented in Fig. 1. The radiation weighting factor for X-
ray radiation is 1 so it is possible to compare the absorbed
doses in fetus and uterus with the fetal effective dose
determined by NCICT 3.0.
114
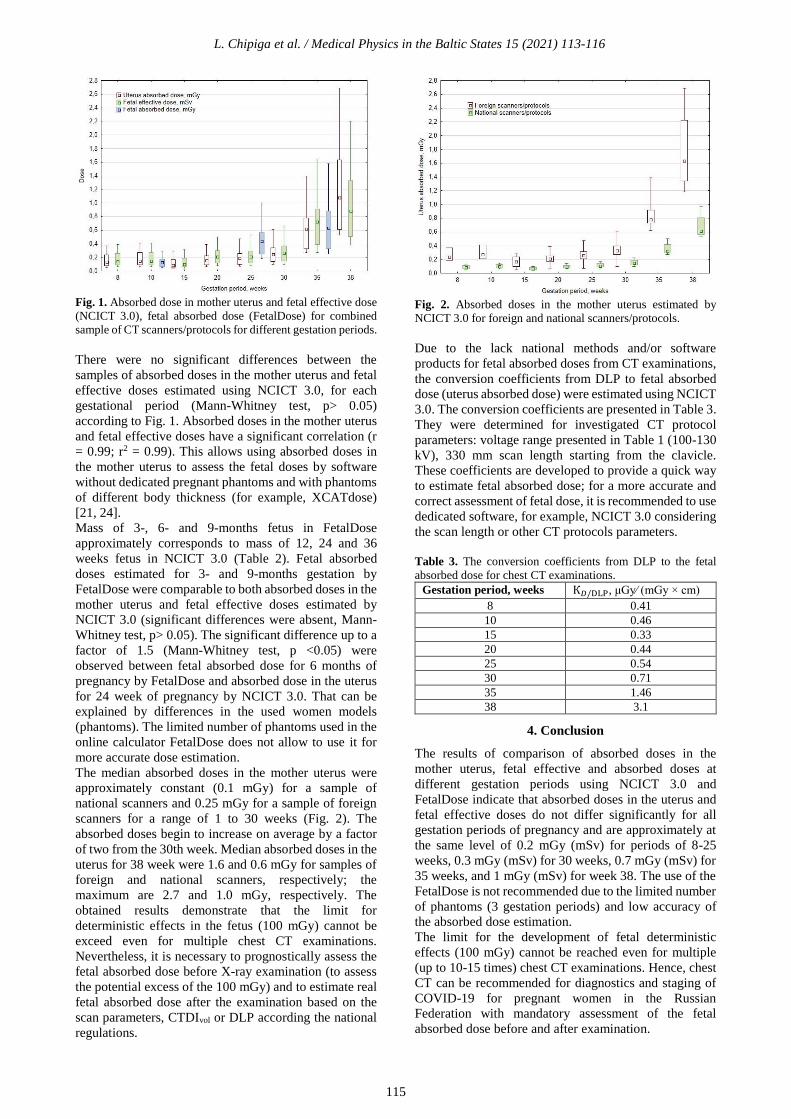
L. Chipiga et al. / Medical Physics in the Baltic States 15 (2021) 113-116
Fig. 1. Absorbed dose in mother uterus and fetal effective dose
(NCICT 3.0), fetal absorbed dose (FetalDose) for combined
sample of CT scanners/protocols for different gestation periods.
There were no significant differences between the
samples of absorbed doses in the mother uterus and fetal
effective doses estimated using NCICT 3.0, for each
gestational period (Mann-Whitney test, p> 0.05)
according to Fig. 1. Absorbed doses in the mother uterus
and fetal effective doses have a significant correlation (r
= 0.99; r2 = 0.99). This allows using absorbed doses in
the mother uterus to assess the fetal doses by software
without dedicated pregnant phantoms and with phantoms
of different body thickness (for example, XCATdose)
[21, 24].
Mass of 3-, 6- and 9-months fetus in FetalDose
approximately corresponds to mass of 12, 24 and 36
weeks fetus in NCICT 3.0 (Table 2). Fetal absorbed
doses estimated for 3- and 9-months gestation by
FetalDose were comparable to both absorbed doses in the
mother uterus and fetal effective doses estimated by
NCICT 3.0 (significant differences were absent, Mann-
Whitney test, p> 0.05). The significant difference up to a
factor of 1.5 (Mann-Whitney test, p <0.05) were
observed between fetal absorbed dose for 6 months of
pregnancy by FetalDose and absorbed dose in the uterus
for 24 week of pregnancy by NCICT 3.0. That can be
explained by differences in the used women models
(phantoms). The limited number of phantoms used in the
online calculator FetalDose does not allow to use it for
more accurate dose estimation.
The median absorbed doses in the mother uterus were
approximately constant (0.1 mGy) for a sample of
national scanners and 0.25 mGy for a sample of foreign
scanners for a range of 1 to 30 weeks (Fig. 2). The
absorbed doses begin to increase on average by a factor
of two from the 30th week. Median absorbed doses in the
uterus for 38 week were 1.6 and 0.6 mGy for samples of
foreign and national scanners, respectively; the
maximum are 2.7 and 1.0 mGy, respectively. The
obtained results demonstrate that the limit for
deterministic effects in the fetus (100 mGy) cannot be
exceed even for multiple chest CT examinations.
Nevertheless, it is necessary to prognostically assess the
fetal absorbed dose before X-ray examination (to assess
the potential excess of the 100 mGy) and to estimate real
fetal absorbed dose after the examination based on the
scan parameters, CTDIvol or DLP according the national
regulations.
Fig. 2. Absorbed doses in the mother uterus estimated by
NCICT 3.0 for foreign and national scanners/protocols.
Due to the lack national methods and/or software
products for fetal absorbed doses from CT examinations,
the conversion coefficients from DLP to fetal absorbed
dose (uterus absorbed dose) were estimated using NCICT
3.0. The conversion coefficients are presented in Table 3.
They were determined for investigated CT protocol
parameters: voltage range presented in Table 1 (100-130
kV), 330 mm scan length starting from the clavicle.
These coefficients are developed to provide a quick way
to estimate fetal absorbed dose; for a more accurate and
correct assessment of fetal dose, it is recommended to use
dedicated software, for example, NCICT 3.0 considering
the scan length or other CT protocols parameters.
Table 3. The conversion coefficients from DLP to the fetal
absorbed dose for chest CT examinations. Gestation period, weeks К𝐷/DLP, μGy⁄ (mGy × cm)
8 0.41
10 0.46
15 0.33
20 0.44
25 0.54
30 0.71
35 1.46
38 3.1
4. Conclusion
The results of comparison of absorbed doses in the
mother uterus, fetal effective and absorbed doses at
different gestation periods using NCICT 3.0 and
FetalDose indicate that absorbed doses in the uterus and
fetal effective doses do not differ significantly for all
gestation periods of pregnancy and are approximately at
the same level of 0.2 mGy (mSv) for periods of 8-25
weeks, 0.3 mGy (mSv) for 30 weeks, 0.7 mGy (mSv) for
35 weeks, and 1 mGy (mSv) for week 38. The use of the
FetalDose is not recommended due to the limited number
of phantoms (3 gestation periods) and low accuracy of
the absorbed dose estimation.
The limit for the development of fetal deterministic
effects (100 mGy) cannot be reached even for multiple
(up to 10-15 times) chest CT examinations. Hence, chest
CT can be recommended for diagnostics and staging of
COVID-19 for pregnant women in the Russian
Federation with mandatory assessment of the fetal
absorbed dose before and after examination.
115

L. Chipiga et al. / Medical Physics in the Baltic States 15 (2021) 113-116
The conversion coefficients from DLP to fetal absorbed
dose for different gestation periods were determined in
the current study. These conversion coefficients can be
used in national practice for rough estimation of the fetal
dose from chest CT examination of pregnant women.
Further study will aim to expand the list of anatomical
scan areas with consideration of different CT protocols
parameters.
References
1. Damilakis J. CT Dosimetry: What Has Been Achieved and
What Remains to Be Done. Invest Radiol. 2021
Jan;56(1):62-68. doi: 10.1097/RLI.0000000000000727.
PMID: 32932380
2. Onischenko G.G., Popova A.Yu., Romanovich I.K.,
Vodovatov A.V., Bashketova N.S., Istorik O.A., Chipiga
L.A., Shatsky I.G., Sarycheva S.S., Biblin A.M., Repin
L.V. Modern principles of the radiation protection from
sources of ionizing radiation in medicine. Part 2: radiation
risks and development of the system of radiation protection.
Radiatsionnaya Gygiena = Radiation Hygiene.
2019;12(2):6-24. (In Russ.) https://doi.org/10.21514/1998-
426X-2019-12-2-6-24
3. Stopcoronavirus.RF - Online resource. Available at:
https://xn 80aesfpebagmfblc0a.xn--p1ai/ Last access:
20.07.2021 г.;
4. Zhao W, Zhong Z, Xie X, Yu Q, Liu J. Relation between
chest CT findings and clinical conditions of coronavirus
disease (COVID-19) pneumonia: a multicenter study. AJR
2020; 214:1072–1077 - Online resource. Available at:
https://www.ajronline.org/doi/abs/10.2214/AJR.20.23288
Last access: 20.07.2021
5. Dehan L. Pregnancy and Perinatal Outcomes of Women with
Coronavirus Disease (COVID-19) Pneumonia: A
Preliminary Analysis/ L. Dehan, L. Lin, W. Xin [et all] //
AJR – 2020 – P.P. 127-132.
6. A.V. Vodovatov, Romanovich I.K., Istorik O.A., Eremina
L.A., S.P. Morozov, Ryzhov S.A., Berkovich G.V.,
Kamyshanskaya I.G., Trufanov G.E., Chipiga L.A.,
Druzhinina P.S., Biblin A.M., Akhmatdinov R.R., Basek
I.V., Karatetskiy A.A., D. V. Merkulov, Ispravnikova
Yu.S., Pritz V.V., Polishchuk N.S., Mukhortova A.N,
Pyzyrev V.G. PRERINT - Preliminary assessment of
structure and collective dose from CT examinations related
to COVID-19 diagnostics in the Russian Federation in
March -June 2020. (In Russ)
7. A.V. Vodovatov, Romanovich I.K., Istorik O.A., Eremina
L.A., S.P. Morozov, Ryzhov S.A., Berkovich G.V.,
Kamyshanskaya I.G., Trufanov G.E., Chipiga L.A.,
Druzhinina P.S., Biblin A.M., Akhmatdinov R.R., Basek
I.V., Karatetskiy A.A., D. V. Merkulov, Ispravnikova
Yu.S., Pritz V.V., Polishchuk N.S., Mukhortova A.N,
Pyzyrev V.G. PRERINT - Preliminary assessment of
structure and collective dose from CT examinations related
to COVID-19 diagnostics in the Russian Federation in
March -June 2020.
https://doi.org/10.1101/2020.08.25.20181396
8. Doll R. Risk of childhood cancer from fetal irradiation/ R.
Doll, R. Wakeford // Drit. J. Radiol. 70. – 1997 – P.P. 130-
139.
9. Emilie Tremblay et al. Quality Initiatives Guidelines for Use
of Medical Imaging during Pregnancy and Lactation/Emilie
Tremblay, Eric Thérasse, Isabelle Thomassin-Naggara,
Isabelle Trop//Radiographics - 2012;32(3):897-911pp. doi:
10.1148/rg.323115120
10. ICRP. Recommendations International Commission on
Radiation Protection 2007. Publication ICRP No. 103.
Transl. from English / Ed. M.F.M. Kiseleva and N.K.
Shandaly. M., Ed. LLC PKF "Alana". 2009. -
312p.
11. ICRP (2000) Pregnancy and Medical Radiation. ICRP
Publication 84, Annals of the ICRP; 30: P.P. 1– 43.
12. International Atomic Energy Agency. Radiation Protection
and Safety of Radiation Sources: International Basic Safety
Standards. General safety requirements. IAEA Safety
Standards Series No. GSR Part 3. - Vienna: IAEA, 250 p.
(2015).
13. International Atomic Energy Agency. Radiation Protection
and Safety in Medical Uses of Ionizing Radiation. Specific
Safety Guide, SSG-46. – Vienna: IAEA, 318 p. (2018).
14. Huanhuan L. Clinical and CT imaging features of the
COVID-19 pneumonia: Focus on pregnant women and
children/ L. Huanhuan, L. Fang, L. Jining [et all] // Journal
of Infection – 2020 – P.P. 7 – 13.
15. Shahir K. Pulmonary Embolism in Pregnancy: CT
Pulmonary Angiography Versus Perfusion Scanning/ K.
Shahir, L.R. Goodman, A. Tali [et all] // AJR:195 – 2010.
16. Angel E. Radiation dose to the fetus for pregnant patients
undergoing multidetector CT imaging: Monte Carlo
simulations estimating fetal dose for a range of gestational
age and patient size/ E. Angel, C.V. Wellnitz, M.M.
Goodsitt [et all] // Radiology. 2008;249(1):220-7.
DOI:10.1148/radiol.2491071665
17. Lee, C., Kim, K. P., Bolch, W. E., Moroz, B. E., Folio, L.
NCICT: a computational solution to estimate organ doses
for pediatric and adult patients undergoing CT scans. J
Radiol Prot. 35(4), 891–909 (2015). doi: 10.1088/0952-
4746/35/4/891
18. https://www.fetaldose.org/calculator; Saltybaeva, N.,
Platon, A., Poletti, P.-A., Hinzpeter, R., Merce, M. S., &
Alkadhi, H. (2020). Radiation Dose to the Fetus From
Computed Tomography of Pregnant Patients—
Development and Validation of a Web-Based Tool.
Investigative Radiology, 55(12), 762–768.
doi:10.1097/rli.0000000000000701
19. Larisa Chipiga, Vladislav Golikov, Aleksandr Vodovatov,
Christian Bernhardsson. Comparison of Organ Absorbed
Doses in Whole-Body Computed Tomography Scans of
Paediatric and Adult Patient Models Estimated by Different
Methods. Radiation Protection Dosimetry, ncab086,
https://doi.org/10.1093/rpd/ncab086;
20. Chipiga L.A. A comparison of computational methods for
estimation of effective and organ doses to the patients from
CT examination. Radiatsionnaya Gygiena = Radiation
Hygiene. 2017;10(1):56-64. (In Russ.)
https://doi.org/10.21514/1998-426X-2017-10-1-56-64
21. Chipiga L.A. A comparison of computational methods for
estimation of effective and organ doses to the patients from
CT examination. Radiatsionnaya Gygiena = Radiation
Hygiene. 2017;10(1):56-64. (In Russ.)
https://doi.org/10.21514/1998-426X-2017-10-1-56-64
22. Maynard, M. R., Long, N. S., Moawad, N. S., Shifrin, R.
Y., Geyer, A. M., Fong, G., & Bolch, W. E. (2014). The UF
Family of hybrid phantoms of the pregnant female for
computational radiation dosimetry. Physics in Medicine
and Biology, 59(15), 4325–4343. doi:10.1088/0031-
9155/59/15/4325
23. Xu XG, Taranenko V, Zhang J, et al. A boundary-
representation method for designing whole-body radiation
dosimetry models: pregnant females at the ends of three
gestational periods—RPI-P3, -P6 and -P9. Phys Med Biol.
2007;52:7023–7044.
24. Sahbaee P., Segars W.P., Samei E. [Et al.] Patient-based
estimation of organ dose for a population of 58 adult
patients across 13 protocol categories. Medical Physics,
2014, Vol. 41, 7, pp. 072104-1– 072104-12.
116

MEDICAL PHYSICS IN THE BALTIC STATES 15 (2021)
Proceedings of International Conference “Medical Physics 2021”
4-6 November 2021, Kaunas, Lithuania
ASSESSMENT OF EXTREMITY EXPOSURE FOR NUCLEAR MEDICINE
PERSONNEL
Inga ANDRIULEVIČIŪTĖ1,2, Kirill SKOVORODKO2,3, Jurgita LAURIKAITIENĖ1, Birutė GRICIENĖ2,4
1Kaunas University of Technology, Kaunas, Lithuania; 2Vilnius University Hospital Santaros Klinikos, Vilnius,
Lithuania; 3Center for Physical Sciences and Technology (FTMC), Vilnius, Lithuania; 4Vilnius University, Faculty of
Medicine, Institute of Biomedical Sciences, Vilnius, Lithuania. [email protected]; [email protected]; [email protected];
Abstract: The extremity exposure monitoring of nuclear
medicine personnel is essential to control exposure in
the workplace, to ensure that legal limits are not
exceeded, to predict extremity doses and, if possible, to
optimize workflow. Distribution of the doses over hand
is nonuniform and the obtained doses by Hp(0.07)
passive dosimeter can be significantly lower compared
to fingertips. The aim of this study was to assess the
extremity exposure of nuclear medicine workers
working with 99mTc radionuclide.
Keywords: nuclear medicine, occupational exposure,
hand exposure, thermoluminescence dosimetry.
1. Introduction
Rapid development of medical technology and
radiopharmacy resulted in significant growth of the
nuclear medicine (NM) field and an increased number
of NM procedures performed each year. Despite
precautions (e.g. shielding, appropriate storage, distance
between the sources, administrative procedures, etc.)
having been implemented into NM departments, the
radionuclide activity that the staff has to deal with is
higher due greater number of patients and this might
lead to higher annual doses.
The specifics of the work of NM workers include
positioning, supervising patients during image
acquisition, preparation and administration of
radiopharmaceuticals in daily practice. During
radiopharmaceutical preparation NM staff hands come
into very close contact with the radionuclides leading to
higher occupational exposure doses to extremities.
According to Radiation Protection Centre, NM workers
are one of the most occupationally exposed medical
groups in Lithuania, which received the average annual
equivalent dose Hp(0.07) of 17.4 mSv in 2020 [1].
Based on studies [2-3], highest radiation doses in the
NM field are received by radiology technologists.
Nowadays, monitoring of NM personnel is performed
by wearing a single passive ring dosimeter on the base
of the finger of the dominant hand. However, published
studies show [2-6] that the most exposed parts of the
hand are fingertips. Furthermore, according to
ORAMED project [7], which evaluated extremity doses
of workers in 32 NM departments in Europe, the doses
obtained by the ring dosimeter can be 2-6 times lower
compared with the doses of fingertips, leaving a chance
of exceeding the recommended annual equivalent dose
limit of 500 mSv.
The aim of this study was to evaluate hand doses in
different points for radiology technologists of the
Nuclear Medicine Department of Vilnius University
Hospital Santaros Klinikos working with 99mTc
radioisotope.
2. Materials and methods
2.1. Calibration of dosimeters
For the measurements of hand doses,
thermoluminescent dosimeters (TLD-100 (LiF:Mg, Ti))
chips were used. The thickness of these dosimeters was
2 mm, the diameter 4.5 mm. Since the effective atomic
number (Zeff) of TLD-100 is 8.14 and it is nearly tissue
equivalent, its scattering and absorption properties are
similar to those of human tissue (Zeff = 7.42).
TLD-100 chips were calibrated with 99mTc source (Fig.
1) in a dose range of (0.5-4) mSv.
The vials (standard 10 mL) were prepared by a
radiology technologist in the hot laboratory. The 99mTc
was extracted from the 99Mo/99mTc generator and was
used as 99mTcO4− solution.
The activity meter Veenstra VDC-405 was used for
checking of activity (< 3% deviation). The readings of
activity meter were verified by the secondary standard
chamber Capintec CRC-15R, No. 158488 (4π γ
ionization chamber) brought to hospitals by the Ionizing
117

I. Andriulevičiūtė et al. / Medical Physics in the Baltic States 15 (2021) 117-120
Radiation Metrology Laboratory of the FTMC that is
the National Metrology Institute (NMI) in Lithuania.
Fig. 1. Calibration of TLD-100 chips with 99mTc source.
Dosimeters were read at Kaunas University of
Technology using Rialto TLD system (Fig. 2).
Fig. 2. Rialto TLD system.
2.2. Hand dose measurements
Hand dose measurements were performed for radiology
technologists of Nuclear Medicine Department who
prepare and inject 99mTc- labelled radiopharmaceuticals.
All dosimeters were put in plastic envelopes to prevent
TLDs from contamination, disinfection reasons and
were attached to both hands on a palm side at 14
locations (dosimeters No. 1-14, 7 chips on each hand)
under disposable gloves (Fig. 3.). Additionally, to
evaluate and compare the difference between obtained
doses from typical monitoring position (base of a
middle finger of the dominant hand) and the most
exposed part, dosimeter No. 15 was attached in part of
the measurements while working with 99mTc.
Each technologist working with 99mTc- wore dosimeters
from 5 to 8 days depending on total radionuclide
activity.
Working process was split into two steps: to measure
workflow in a hot lab and to administer 99mTc- labelled
radiopharmaceuticals to patients.
The activity working with 99mTc in a hot lab was in a
range of 26.80-38.76 GBq (average 31.99 ± 4.32 GBq),
for injections 12.01-19.25 GBq (average 14.54 ± 4.09
GBq).
The right hand was the dominant hand of all radiology
technologists. The measured doses were normalized per
manipulated activity (mSv/GBq).
Fig. 3. TLDs positions on the radiology technologist palms.
3. Results
3.1. Extremity doses during work with 99mTc
During work with 99mTc in a hot lab, it was found that
the dominant (right) hand received higher doses by 2.18
times compared with the non-dominant (left) hand and
resulted in 0.37 and 0.17 mSv/GBq, respectively. The
most exposed parts were the right hand thumb tip 0.73
mSv/GBq, index finger tip 0.52 mSv/GBq and middle
finger tip 0.62 mSv/GBq.
The same tendency of dose distribution was also seen in
the left hand – the most exposed parts were the tips of
the thumb, index finger and middle finger and resulted
in average doses of 0.27, 0.37 and 0.21 mSv/GBq,
respectively (Fig. 4.).
During preparation of radiopharmaceuticals, the least
exposed parts were the left hand palm and wrist and the
obtained doses were lower than <0.1 mSv/GBq.
Fig. 4. Hand dose distribution of different TLD positions
while working in a hot lab with 99mTc.
0.0
0.1
0.2
0.3
0.4
0.5
0.6
0.7
0.8
Ave
rage
do
se p
er
un
it a
ctiv
ity,
mSv
/GB
q
TLD position
Left hand Right hand
118

I. Andriulevičiūtė et al. / Medical Physics in the Baltic States 15 (2021) 117-120
During 99mTc radiopharmaceutical injection to patients,
the dose distribution was slightly different compared
with the doses obtained while preparing 99mTc- labelled
radiopharmaceuticals. It was found that the most
exposed part was the non-dominant (left) hand index
finger tip (93.80 µSv/GBq), however, the difference
between average doses of non-dominant and dominant
hand were almost the same and resulted in (57.94 ±
14.64) and (53.33 ± 11.87) µSv/GBq, respectively.
Besides doses of the left hand index finger tip, higher
average doses per unit activity were also obtained by the
right hand thumb tip (88.25 µSv/GBq) and middle
finger tip (81.67 µSv/GBq), and the least exposed parts
were the left (31.39 µSv/GBq) and right (15.90
µSv/GBq) hand wrists (Fig. 5.).
Fig. 5. Hand dose distribution of different TLD positions
while administering 99mTc- labelled radiopharmaceuticals
3.2. Doses obtained from typical monitoring position
During 4 measurements performed while working with 99mTc, radiology technologists wore an additional
dosimeter on typical monitoring position (base of a
middle finger of the dominant hand). As seen from
Table 1, the maximum dose of fingertip is 2.0-2.4 times
higher compared with the doses from typical monitoring
position.
Table 1. The ratio of maximum hand dose (Hp(0.07)max and
typical monitoring position dose Hp(0.07)tmp received during
work with 99mTc.
No. (Hp(0.07)max,
mSv/GBq
Hp(0.07)tmp, mSv/GBq
Ratio, a.u.
1. 0.55 0.23 2.4
2. 0.10 0.05 2.0
3. 0.09 0.04 2.3
4. 0.16 0.07 2.3
4. Discussion
Assessment of extremity exposure for NM personnel
shows that there is a tendency that the most exposed
hand while preparing radiopharmaceuticals is the
dominant hand. Similar findings were obtained by other
authors as well (Table 2). Adliene et al. [3], Leide-
Svegborn [8] researches reveal that the right hand
thumb received the highest doses. Zoccarato et al. [4]
also investigated fingertip doses in 4 points (index tip,
index base and wrist of the non-dominant hand, and
index tip of the dominant hand) and found that the
dominant hand is more exposed than the non-dominant
hand. However, doses greatly depends on the type of the
procedure (radiopharmaceutical preparation,
administration, etc.) As it was found in our and Carnicer
et al. [7] study, during radiopharmaceutical injection,
the most exposed part is index finger tip of non-
dominant which could be explained by the fact that the
radiology technologists hold the patient’s hand directly
at the injection site for greater stability.
Table 2. Summary of extremity dose results of different
studies
Reference
Number
of
measured
locations
Max. dose of
fingertip,
mSv/GBq
(dosimeter
position)
Method
This study,
2021 15
1.1 (right hand
thumb) Preparation
0.114 (left hand
index finger tip) Injection
Adliene et
al., 2020 [3] 20
1.93 (right hand
thumb)
Preparation
and
injection
Zoccarato et
al. [4] 4
0.067 (right and
index finger tip) Preparation
Carnicer et
al., 2011 [7] 22
0.95 (left hand
index finger tip) Injection
Leide-
Svegborn,
2011 [8]
11 0.00012 (right
hand thumb) Preparation
4. Conclusions
The results of our study showed that the most exposed
parts while working with open radioactive sources are
fingertips of thumb, index finger and middle finger,
thus, monitoring of these points would be the most
expedient. Also, it was found that the maximum
fingertip doses are 2.0-2.4 times higher compared with
the doses from typical monitoring position (base of a
middle finger of the dominant hand).
Dose distribution over the hand palm depends on the
radionuclide and working procedures, workers’ habits,
different work approach and optimization means: proper
hot lab, shielded syringe, etc. To ensure radiation safety
of personnel and keep Hp(0.07) doses as low as
possible, work position rotation (radiopharmaceutical
preparation, administration, positioning of the patient
for the exam) that is performed in our hospital, is
essential. Our study shows that detailed investigation of
extremity doses in NM is important to identify the most
problematic areas where the doses are highest, to
optimize personnel workflow, and to recommend the
dosimeter position for routine monitoring for each
worker depending on the maximum doses collected by
an individual.
0
10
20
30
40
50
60
70
80
90
100
Ave
rage
do
se p
er
un
it a
ctiv
ity,
µSv
/GB
q
TLD position
Left hand Right hand
119

I. Andriulevičiūtė et al. / Medical Physics in the Baltic States 15 (2021) 117-120
5. References
1. 2017–2023 metų gyventojų ir darbuotojų, dirbančių su
jonizuojančiosios spinduliuotės šaltiniais, apšvitos
stebėsenos programos 2020 metų ataskaita. Radiacinės
saugos centras, 2021, p. 69.
2. Lee W. J., Choi Y., Ko S., Cha E. S., Kim J., Kim Y. M.,
Ha Y. W. Projected lifetime cancer risks from
occupational radiation exposure among diagnostic medical
radiation workers in South Korea. BMC cancer, 18(1),
2018, p. 1-10.
3. Adliene D., Griciene B., Skovorodko K., Laurikaitiene J.,
Puiso J. Occupational radiation exposure of health
professionals and cancer risk assessment for Lithuanian
nuclear medicine workers. Environmental research, 2020.
4. Zoccarato O., Matheoud R., Zanni D., Vigna L., Campini
R., De Crescenzo S., Brambilla M. Extremity doses
assessment of nuclear medicine staff involved in 99mTc-
radiopharmaceuticals preparation: A multicentre study.
Physica Medica, 32, 2016, p. 230.
5. Sans Merce M., Ruiz N., Barth I., Carnicer A., Donadille
L., Ferrari P., Baechler S. Extremity exposure in nuclear
medicine: preliminary results of a European study.
Radiation protection dosimetry, 144(1-4), 2011, p. 515-
520.
6. Wrzesień M., Albiniak Ł. Hand exposure of workers in
18F-FDG production centre. Journal of Radiological
Protection, 36(4), N67, 2016.
7. Carnicer A., Sans-Merce M., Baechler S., Barth I.,
Donadille L., Ferrari P., Vanhavere F. Hand exposure in
diagnostic nuclear medicine with 18F-and 99mTc-labelled
radiopharmaceuticals-Results of the ORAMED project.
Radiation Measurements, 46(11), p. 1277-1282, 2011.
8. Leide-Svegborn S. External radiation exposure of personnel
in nuclear medicine from 18F, 99mTc and 131I with
special reference to fingers, eyes and thyroid. Radiation
protection dosimetry, 149(2), 2012, p. 196-206.
120

MEDICAL PHYSICS IN THE BALTIC STATES 15 (2021)
Proceedings of International Conference “Medical Physics 2021”
4-6 November 2021, Kaunas, Lithuania
PET-CT AND OCCUPATIONAL EXPOSURE: COHORT PROFILE UPDATE
Mikhail V. OSIPOV1, Andrey V. VAZHENIN2, Daria A. VAZHENINA2, Tatyana S. NOVIKOVA2, Anna I.
KUZNETSOVA2, Irina A. AKSENOVA2, Mikhail E. SOKOLNIKOV1 1Southern Urals Biophysics Institute; 2Chelyabinsk Regional Clinical Center for Oncology and Nuclear Medicine
[email protected]; [email protected];
Abstract: The paper describes the results of updated
analyses of diagnostic radiation exposure effects on
patients examined using PET-CT in Chelyabinsk
Regional Clinical Center of Oncology and Nuclear
Medicine since 2010 to 2019. Cancer mortality was
analyzed in terms of PET-CT number, radiotherapy,
occupational exposure and main non-radiation factors:
sex, age attained, stage of malignancy and
chemotherapy. Logistic regression has been applied to
assess the influence of risk factors on cancer death.
Keywords: PET-CT, nuclear workers, cancer, medical
exposure, radiation risk
1. Introduction
Positron emission tomography (PET) is a modern
technique for diagnostic imaging in nuclear medicine
that is intended to visualize metabolic processes in
malignant tissues. Combined with computed
tomography (CT) it substantially enhances the
diagnostic results [1]. Although PET-CT procedures
usually resulted in a low dose of radiation, repeated
diagnostic procedures may increase the diagnostic
radiation burden of patients [2]. It is known that external
radiation may affect the cancer mortality [3]. In the
same time, during the process of cancer diagnostics and
treatment, the patient is under the exposure to various
risk factors of radiation and non-radiation nature other
than PET-CT such as widely used in clinical practice
computed tomography (CT) [4], and the exposures that
are only specific for oncological patients: radiotherapy
and/or chemotherapy. Exposure to man-made radiation
other than diagnostic procedures such as occupational
ionizing radiation among professionals [5] is also
important as an additional risk factor.
The question whether the effects of cumulative
exposure to multiple factors are present in the group of
oncological patients, and how is the role of diagnostic
exposure of oncological patients itself is of concern.
According to that, the objective of the work was to
estimate the overall mortality risk related to the
exposure to PET-CT among oncological patients in
regard with several confounding factors to understand
the role of “pure” PET-CT diagnostic exposure in
cancer mortality.
2. Material and Methods
The cohort profile has been updated with new
information on vital status and the cause of death,
radiotherapy and chemotherapy data.
The information on examinations using hybrid PET-
computed tomography (PET-CT) with administered
radiopharmaceutical of 18F-2-fluoro-2-deoxy-d-glucose
(FDG) for residents of Ozyorsk District located in the
Chelyabinsk Region 15 km far from the first nuclear
weapon production complex in the former USSR has
been derived from the archive of PET-Center of
Chelyabinsk Regional Clinical Center for Oncology and
Nuclear Medicine (CRCONM). The data collection
process, criteria of inclusion in the cohort and the
follow-up conditions, and the dose calculation
methodology has been described in details in our
previous study [6] using the recommendations [7-8].
In this study vital status information has been updated
for patients up to 31.12.2020. The patients with no
information on vital status due to migration have been
treated as lost to follow-up.
The information on additional CT examinations outside
PET-Center of CRCONM has been obtained using the
“CT Registry” database [9] which is currently consists
of 26,626 individual records.
Cancer death after the 1st PET-CT examination was
used as the event to be analyzed based on the hypothesis
(h1) that exposure to PET confounded by other radiation
and non-radiation factors increased the probability of
the event occurrence over time.
Binomial odds were calculated as the ratio of
probability of an event occurred to the probability of its
non-occurrence (1):
Odds = P/(1 - P) (1)
121

M. V. Osipov et al. / Medical Physics in the Baltic States 15 (2021) 121-124
The logit function was used as the log of the odds ratio
(2):
OR = ln(xi β) (2)
Multiple logistic regression [10] has been used for
statistical modelling a set of multiple parameters xi (3):
P( yi ≠0|xi) = exp(xi β) / 1 + exp(xi β) (3)
The results of fitting the multiple logistic regression
model with different parameters xi has been tested using
likelihood ratio test (LRT). Pseudo R2 as a coefficient of
determination used to assess the dispersion of the
dependent variable xi described with logistic regression
model.
The Wald’s Chi-square test for OR estimates (β) has
been performed using 95% level of significance with
p<0.05. The distribution of the events by follow-up time
was presented using Kaplan-Meyer survival function.
3. Results
3.1 Age and sex distribution
The information from 651 PET-CT protocols of 347
oncological patients examined in the CRCONM in the
period since 2010 to 2019 has been used for the
analyses. The age and sex distribution among the
patients of the study group shown in Fig. 1:
Fig. 1. Distribution of the study group by the age at 1st PET-
CT exposure and sex
In the study group were 42.9% males and 57.1%
females at the age from 19 to 91 years to the date of 1st
PET-CT examination (average 57.1±0.7 years).
Testing the age difference within the study group by sex
resulted in the (Prob > F) = 0.35 that shows no
difference between the means of age at 1st PET-CT
examination among male and female.
3.2 Dosimetry information
35.4% of the study group underwent multiple PET-CT
examinations (up to 11 recurrent PET-CT). An
additional CT examinations performed outside
CRCONM has been accounted using “CT Register”
database was 4 (min 1; max 29). The distribution of
patients by number of PET-CT, average effective dose
(ED) and administered activity of FDG shown in Table
1.
Table 1. The number and the proportion of PET-CT, mean
cumulative effective dose from PET-CT examination (ED)
and the mean cumulative administered FDG activity (A, mbq)
PET-CT n % ED (std.er) A, mbq(std.er)
1 225 64.8 22.2 (0.5) 391.2 (5.6)
2 66 19.3 23.1 (0.7) 806.8 (14.9)
3 19 5.2 22.6 (1.4) 1185.8 (36.9)
4-5 22 6.3 24.5 (2.3) 1682.2 (63.7)
6-8 11 3.2 20.6 (1.5) 2599.8 (130.2)
9> 4 1.2 23.0 (4.9) 5678.0 (-)
Total 347 100.0 22.5 (0.4) 660.6 (33.7)
The cumulative effective dose for 1 PET-CT with
administered FDG was 23.8 (2.3-71.7) mSv. Mean
cumulative effective dose for patients with recurrent
PET-CT examinations reached 41.2 mSv. Average
cumulative administered FDG activity of 660.6 (594.3-
726.9) mBq resulted in average effective dose of 12.5
(11.3-13.8) mSv.
3.3 Information on other risk factors
21.7% of the study group was nuclear workers hired to
the “Mayak” nuclear weapon production association
(MPA) in the period from 1948 to 2000. The MPA
personnel have been potentially exposed to protracted
external gamma- and internal alpha ionizing radiation
[5].
The distribution of patients by exposure to additional
risk factors is shown in Table 2:
Table 2. Exposure to additional risk factors
Additional risk factor n %
Occupational exposure 75 21.7
CT scans other than CRCONM 268 77.2
Radiotherapy 90 25.9
Chemotherapy 205 59.1
Stage of malignancy (2 > ) 277 79.8
Age at 1st PET-CT ( > 60 ) 167 48.1
The information on stage of MT was available in
96.0%. 87.3% of patients were previously diagnosed
with malignant tumor (MT).
3.4 The vital status and survival time
As of 31.12.2020, the number of deaths accumulated
through the observation period was 216 (62.2%). 12
patients (3.5%) with no information on the vital status
were lost to follow-up.
The proportion of malignant tumours confirmed on
autopsy was 94%. Among them, the number of patients
died in the first year of follow-up was 90 (41.9%).
The average duration of observation period (time at
risk) was 2.9±0.13 years (min 0; max 10). The Kaplan-
Meyer survival function by the time of follow-up for the
study group with known vital status is shown on Fig. 2.
122

M. V. Osipov et al. / Medical Physics in the Baltic States 15 (2021) 121-124
Fig. 2. The survivor function of the study group (t1, t2, t5 and
t10 ticks equal to 1, 2, 5 and 10 years of follow-up), 95% CI
To the end of follow-up, 50% of the study group
survived more than 960 days after the 1st PET-CT.
Mean time at risk for alive was 1843.2±73.4 days. The
proportion of alive to the end of the study was 35.5% at
average age at 1st PET-CT of 59.6±1.4 (56.0±2.7 for
males and 61.8±1.4 for females).
3.5 Results of statistical modelling
The multiple logistic regression model was fitted for 0-
and 2 year survivor groups using following parameters:
sex male (x1), age 60 at 1st PET-CT (x2), malignant
tumor stage (x3), occupational exposure (x4), cumulative
number of PET-CT (x5), number of CT over than PET-
CT (x6), radiotherapy (x7) and chemotherapy (x8)
adjusted for the stage of MT. The results are shown in
Table 3:
Table 3. The results of multiple logistic regression and the OR
estimates for 8-parametric model in 0-year and 2-year survivor
groups
0-year (n=335) 2-year (n=179)
Parameter OR Std.er Wald p OR Std.er Wald p
sex(male) x1 1.41 0.37 1.18 1.35 0.56 0.45
age/60 x2 5.67 3.30 0.003 5.90 5.20 0.04
stage x3 1.04 0.07 0.52 1.10 0.10 0.29
worker x4 1.17 0.39 0.62 1.24 0.63 0.67
PET-CT x5 0.85 0.08 0.08 0.81 0.11 0.12
CT x6 1.11 0.05 0.019 1.41 0.10 0.0001
RT x7 0.79 0.22 0.39 0.90 0.41 0.81
ChT x8 2.28 0.59 0.001 2.30 0.97 0.05
ChT* x8 0.44 0.10 0.001 0.31 0.13 0.006
Prob>Chi2 0.001 <0.0001
Pseudo R2 0.06 0.24
*adjusted for stage of malignancy
Comparison of two multiparametric models based on
pseudo-R2 estimates showed that 2-year survival model
(n=179) was more predictive versus 0-year model
(n=335), while low statistical significance level of the
OR coefficients was obtained in both models for several
parameters.
LRT-test of full model (M1) with 8 parameters (x1 – x8)
versus restricted model (M2) with statistically
significant parameters only (x2,x6; x8) resulted in the
Prob > Chi2 = 0.31 that does not allow to reject the
assumption that M2 nested in M1.
4. Discussion
In this study we analyzed the updated information on
the oncological patients who were exposed to low doses
of diagnostic radiation during PET-CT examinations
performed in the Chelyabinsk Regional Clinical Center
of Oncology and Nuclear Medicine with extended
follow-up period. Updated vital status and mortality
data, and additional information on other risk factors
such as radiotherapy and chemotherapy as possible
confounders, and the contribution of CT scans
performed outside the PET-center accounted using the
data of “CT Registry” has been analyzed.
The results of multiparametric analyses showed
significant effect of age at 1st exposure, cumulative
number of CT examinations and chemotherapy in the
period after the 1st PET-CT examinations among
oncological patients. As it in the previous study [6],
neither recurrent PET-CT examinations nor the presence
of occupational exposure were associated with changes
in the mortality.
These results rises the concern on possible effect of
cumulative number of CT examinations (OR 1.1-1.4) on
the mortality among oncological patients examined with
PET-CT. However, an increased risk from multiple CT
scans can be substantially biased with the reverse
causation (RC) reported in our previous study on cancer
mortality among nuclear workers exposed to diagnostic
X-ray examinations throughout life [11]. Although the
risk of cancer death was dramatically increased (ERR
per 1 Gy of X-ray dose was 5.5 for several solid
cancers), it can be generally explained by the fact that
patients with severe health conditions which is more
likely leads to death had more frequent diagnostic
examinations, rather than direct effect of exposure to
diagnostic ionizing radiation on mortality.
In the same time, radiotherapy that seems to confer
higher risks of mortality in cancer patients [12] doesn’t
show the significant effect on mortality both as
independent predictor (p=0.48), and included in the
multiparametric models (p>=0.39). Sufficient variability
of area exposed to radiation during radiotherapy
depending on localization and cancer type can be the
source of uncertainties in this case.
The effect of chemotherapy (OR 2.3) which was
significant in both survival groups can be explained in
conjunction with the stage of malignancy. Although
cancer treatment process related with exposure to
diagnostic radiation, radiotherapy and chemotherapy
(CRT) plays certain role in carcinogenesis [13] and,
probably, may lead to shorten the survival time, it
should be noticed that severe health conditions require
complex anticancer treatment. Started at early stage of
malignant process, it is more likely to prevent
unfavorable outcome that extend the survival period that
may influence on the mortality estimate [14]. This
suggestion is consistent with the results of x8 parameter
adjustment for tumour stage 1-2 (OR 0.31-0.44).
According to that, chemotherapy administered in the
123

M. V. Osipov et al. / Medical Physics in the Baltic States 15 (2021) 121-124
early period of the development of MT process
statistically significantly reduces the chances of
mortality in the first decade after the PET-CT
diagnostics.
Finally, our findings suggest an appropriateness of
ALARA principle [15] in case of recurrent diagnostic
exposures of cancer patients using CT. According to
that it is advisable to use algorithms for reducing the
radiation dose during CT examinations [16], especially
in patients undergoing anticancer treatment [17].
5. Conclusions
The results of the study based on updated cohort profile
data of oncological patients examined with PET-CT
showed statistically significant effect of age at first
examination, the number of diagnostic CT scans
performed, and chemotherapy on the overall mortality
within 10 year-period after the 1st PET-CT examination.
No direct evidence of the “pure” impact of number of
PET-CT examinations on the overall mortality adjusted
for radiation and non-radiation factors has been found.
These results contributes the data of the computed
tomography database (CTDB) which is a unique source
of information for epidemiological study of low-dose
effects of diagnostic exposure among population of
Ozyorsk (OCTC study).
6. References
1. Beyer T., Townsend D.W., Brun T., Kinahan P.E.,
Charron M., Roddy R., Jerin J., Young J., Byars L., Nutt
R. (2000). A combined PET/CT scanner for clinical
oncology. Journal of Nuclear Medicine, 41: 1369–1379.
2. Brix G., Nekolla E.A., Borowski M. et al. Radiation risk
and protection of patients in clinical SPECT/CT. Eur J
Nucl Med Mol Imaging. 2014; 41 Suppl 1: S125-136.
3. Rȕhm W., Harrison R. M. High CT doses return to the
agenda. Radiation and Environmental Biophysics. 2020;
59: 3–7. DOI: 10.1007/s00411-019-00827-9.
4. Preston D.L., Ron E., Tokuoka S., Funamoto S., Nishi N.,
Soda M., et al. Solid cancer incidence in atomic bomb
survivors: 1958–1998. Radiat Res. 2007; 168: 1-64.
5. Romanov S.A., Vasilenko E.K., Khokhryakov V.F., Jacob
P. Studies on the Mayak nuclear workers: dosimetry.
Radiat Environ Biophys. 2002; 41:23–28. DOI
10.1007/s00411-001-0134-3.
6. Osipov, Mikhail V., Vazhenin, Andrey V., Kuznetsova,
Anna I., Aksenova, Irina A., Vazhenina, Daria A.,
Sokolnikov, Mikhail E. (2019) PET-CT in oncological
patients with occupational exposure to ionizing radiation.
Medical Physics in the Baltic States in 2019. Proceedings
of the 14th International Conference on Medical Physics.
Kaunas, Lihuania, 7-9 November, 2019. P. 164.
7. Basic sanitary rules for radiation safety (OSPORB-
99/2010). SP 2.6.1.25 - 10. (in Russian).
8. Radiation Dose to Patients from Radiopharmaceuticals
(Addendum to ICRP Publication 53). ICRP Publication
80. Ann. ICRP 28 (3).
9. Osipov Mikhail Viktorovich, Sokolnikov Mikhail
Eduardovich, Fomin Evgeny Pavlovich. Database of
Computed Tomography of the Ozersk population ("CT
Register"). Registration Certificate No. 2020622807,
issued on 12.24.2020. Available at
https://new.fips.ru/registers-doc-
view/fips_servlet?DB=DB&DocNumber=2020622807&T
ypeFile=html (Accessed at 12.02.2021). (In Russian).
10. Stata. Stata statistical software: Release 7.0. Stata
Corporation, College Station, 2001
11. Osipov M.V., Sokolnikov M.E. (2015). Problems of
assessment of carcinogenic risk of medical exposure in a
cohort of nuclear personnel. Medical Radiology and
Radiation Safety. 60 (6): 60 – 66. (in Russian)
12. Boehle A., Katic K., König I.R., Robrahn-Nitschke I.,
Brandenburg B. (2020). Comparison of outcome endpoints
in intermediate- and high-risk prostate cancer after
combined-modality radiotherapy. Brachytherapy.
19(1):24-32. doi:10.1016/j.brachy.2019.09.001
13. Zhang B, Zhang X, Li M, Kong L, Deng X, Yu J. (2016).
How breast cancer chemotherapy increases the risk of
leukemia: Thoughts about a case of diffuse large B-cell
lymphoma and leukemia after breast cancer
chemotherapy. Cancer Biol Ther. 17 (2):125-128.
doi:10.1080/15384047.2016.1139233
14. Mc Erlain T, Burke A, Branco CM. Life after Cell Death-
Survival and Survivorship Following Chemotherapy.
Cancers (Basel). 2021 Jun 11;13(12):2942. doi:
10.3390/cancers13122942.
15. ICRP Publication 103. Recommendations of the
International Commission on Radiological Protection.
Ann. ICRP, 37, No.2 – 4, 2007.
16. Osipov M.V., Lebedev N.I., Fomin E.P. (2015). Radiation
Safety of Patients: Reducing the Radiation Dose in
Abdominal Multislice Computed Tomography. Russian
Electronic Journal of Radiology. 5 (2): 47 – 51.
17. Lebedev N.I., Osipov M.V., Sinyak E.V., Fomin E.P. An
Algorithm of the Abdominal Multislice CT Study in
Cancer Patients undergoing Chemotherapy. Medical
Radiology and Radiation Safety. 2015; 60 (4): 81-86. (In
Russ.)
124

MEDICAL PHYSICS IN THE BALTIC STATES 15 (2021)
Proceedings of International Conference “Medical Physics 2021”
4-6 November 2021, Kaunas, Lithuania
COLOR CHANGES OF DENTAL CERAMICS EXPOSED TO BLEACHING
MATERIALS
Giedrė MORKŪNAITĖ, dr. Rimantas OŽIŪNAS, Vytautas ČEPLAUSKAS
Lithuanian University of Health Sciences (LSMU) MA Faculty of Odontology Department of Prosthodontics
Abstract. An aesthetically pleasing smile is an aspiration
of patients and dentists and teeth whitening is one of the
most conservative procedures, but the effect of bleaching
agents on ceramic restorations has not been extensively
studied. This study aimed to investigate the effect of
hydrogen peroxide and carbamide peroxide on the color
(ΔE) of polished and glazed lithium disilicate, leucite-
reinforced glass-ceramic and zirconium dioxide
ceramics.
Keywords: surface roughness, colour stability, bleaching,
lithium disilicate, leucite reinforced glass ceramic,
zirconium dioxide
1. Introduction
1.1. Ceramics
Ceramic materials evolved and improved rapidly in terms
of their properties and manufacturing methods over the
last few decades. Great aesthetics, high fracture strength
and optimal biocompatibility are the features that have
made ceramic restorations so favoured [1]. There are
several types of dental ceramics which are commonly
used in a restorative dentistry: Lithium disilicate-
reinforced glass ceramics (LS2), Leucite-reinforced
glass-ceramics (KAlSi2O6) and Zirconium dioxide based
ceramics.
Lithium disilicate (LS2) is a particle-filled glassy
material [2], characterised by its high biocompatibility,
strength, environmental resistance, durability, great
marginal integrity, acid sensitivity, excellent optical
properties and its high aesthetics. This ceramics is
recommended for the production of single dental crowns,
three-unit fixed restorations [1, 3], veneers, inlays and
overlays [4-6]. Lithium disilicate can also be used for
both anterior and posterior tooth restorations.
Leucite-reinforced glass-ceramics (KAlSi2O6) is
composed of irregular-shaped leucite microcrystals
accommodated in glass matrix [7]. It is suitable for the
production of single tooth restorations - veneers, inlays,
overlays, crowns, but it is not strong enough for fixed
posterior bridge restorations [8]. Due to the crystalline
structure of this ceramics so called chameleon effect
(light scattering) might be observed on restorations.
Leucite-reinforced ceramics also have good mechanical
resistance, transparency and acid sensitivity [3].
Pure ZrO2 has monoclinic structure however due to the
heating which is needed to form the product, it becomes
tetragonal and later on - cubic. Cooling down initiates the
oposit seqence of processes. In order to avoid the fragility
of the final product tetragonic phase ZrO2 may be
stabilized with Y2O3, which makes tetragonic phase of
ZrO2 to metastable. This forms aid to ensure the
resistance of the material breakage, as the tetragonal
phase can be transformed into a monoclinic phase with
increasing the volume up to 4% and creating
compressive surface tension [9]. Zirconium restorations
are often used due to good biocompatibility, excellent
mechanical properties [10], minimal wear of antagonistic
teeth [11] and low corrosion potential [12].
1.2. Color and surface of ceramics
The final color of ceramic restorations not only depends
on its base color but it is influenced by the light
reflectance from the surface and thickness of the object
and cementation process [13].
Smooth surface is essential for longevity of ceramic
restoration. Rough surfaces can cause discolouration,
secondary caries and soft tissue inflammation due to
increased oral microorganisms adhesion to the
restoration [14, 15]. Glazing procedure ensures even
surface and shine, increases resistance to breakage,
closes open pores that occur after the baking step [14] and
ensures color stability.
1.3. Teeth bleaching materials
A teeth whitening is one of the most conservative
treatments in aesthetic dentistry. Bleaching is used when
extrinsic and intrinsic discoloration occurs. It can be
performed in office, at home or it can be combined.
125

G. Morkūnaitė et al. / Medical Physics in the Baltic States 15 (2021) 125-128
Concentration of bleaching materials can range from 5%
to 40% [16]. Hydrogen peroxide (HP), known as a
bleaching material, reacts directly with discolorations
and releases active carbon molecules to break the double
carbon bonds between chromophore molecules, leaving
smaller and colourless fragments that are converted into
water and carbon dioxide [16-18]. The highest allowed
concentration of HP in Europe is 6%. HP concentrations
that are higher than 15% does not improve the whitening
efficiency and but can lead to changes in enamel hardness
and surface morphology [19]. The effectiveness and
safety of teeth whitening is also affected by the pH of the
whitening material. Alkaline pH of peroxide ensures
efficacy of the whitening agent since the pH decreases
remarkably after the application on the tooth [20].
Carbamide peroxide (CP) is a compound made of
hydrogen peroxide (HP) in conjunction with urea. It is
also known under the name “urea hydrogen peroxide”
[21]. Contacting with a tooth, it slowly dissociates into
HP and urea [22]. Due to a slow decomposition rate,
interaction of CP and tooth should be longer as in the case
of HP application.
1.4. Ceramics color changes due to the bleaching
Bleaching materials are frequently used for the whitening
of combined set of patient‘s teeth: natural and restored
with ceramics.
Ceramics is the most inert of all restorative materials, but
its surface layer may be affected due to the contact with
the solutions of different pH [23]. Dissolution of alkaline
ions and glass can occur due to diffusion of active oxygen
and HP. As a result, surface modifications of ceramics
can be caused by the reduction of silicon dioxide or
potassium peroxide.
Due to the chemical instability of ceramics, endogenous
and exogenous color changes may occur [24]. Exogenous
changes can also appear due to the surface roughness of
the restorative material which can lead to in the increased
absorption of pigments from the oral cavity. It was found
that application of 16% CP bleaching solution for teeth
whitening [3] or teeth whitening supported by LED
exposure [25] significantly affects the transparency of
lithium disilicate and leucite-reinforced glass-ceramics.
This study was performed aiming at the evaluation of the
impact of hydrogen peroxide and carbamide peroxide
based bleaching materials on optical properties changes in lithium disilicate, leucite-reinforced glass-ceramics
and zirconium dioxide.
2. Materials and methods
This study was approved by the Bioethics centre of
Lithuanian University of Health Sciences (Nr. BEC-OF-
36). Sixty round-shaped disks (ø 11 mm x 2 mm) were
produced: twenty lithium disilicate reinforced glass
ceramic (Ivoclar Vivadent IPS E.max) samples with and
without glaze; twenty leucite reinforced glass ceramic
(Ivoclar Vivadent IPS Empress) samples with and
without glaze and twenty zirconium dioxide (Dental
Direkt BIO ZW ISO) samples with and without glaze.
One half of the disks surface was glazed, another one -
polished. Samples of glass ceramics were produced in
dental laboratory using CAD/CAM and press
technologies. Samples of zirconium dioxide were
produced using CAD/CAM and synthesis technologies.
Glass ceramics samples were first covered with paint
(Ivoclar Vivadent IPS E.max essence, Ivoclar Vivadent
IPS Empress) and glazing paste (Ivoclar Vivadent IPS
E.max, Ivoclar Vivadent IPS Empress) and their surfaces
were polished with a „bison” type brush and diamond
paste. Lastly the samples were polished with a fluffy
brush finalizing preparation of the glazed part of the
surface. Zirconium dioxide samples were firstly covered
with paint (Ivoclar Vivadent IPS E.max essence) and
glazing paste (Ivoclar Vivadent IPS E.max). Lastly their
surfaces were polished with a „bison” type brush and
diamond paste and then polished with a fluffy brush
making glazed part of the surface ready. Another part
(polished) of sample’s surface was firstly polished with
ceramic polishing rubbers (coarse, medium and low
roughness) and then with a diamond paste using „bison”
type brush. The polished part of the samples was
finalized via polishing of samples with a fluffy brush.
Polished and glazed ceramics were used to simulate
clinical situations and to investigate the impact of
different bleaching materials on the optical properties of
the differently prepared ceramics surfaces.
Two different bleaching materials were selected for this
study. The whole information about materials used in this
investigation is provided in Table 1.
Table 1. Characteristics of the materials
Material Title Concentration pH Manufacturer
Lithium disilicate
reinforced glass ceramic
IPS e-MAX - - Ivoclar Vivadent AG, Schaan, Liechtenstein H13049
Leucite-reinforced glass
ceramic
IPS Empress - - Ivoclar Vivadent AG, Schaan, Liechtenstein H13049
Zirconium dioxide Dental Direkt
BIO ZW ISO
- - Dental Direkt GmbH Industriezentrum 106-108
32139 Spenge, Germany
Carbamide peroxide Philips Zoom
NiteWhite
16 % 5,8 - 6,2 Philips Consumer Lifestyle BV, Tussendiepen4,
9206 AD Drachten Netherlands
Hydrogen peroxide Pola Office+6 % 6 % 9 SDI Limited, Bayswater, Victoria 3153, Australia
126

G. Morkūnaitė et al. / Medical Physics in the Baltic States 15 (2021) 125-128
Prior to bleaching color of all specimens with and
without glaze were determined using a
spectrophotometer (VITA Easyshade V; VITA
Zahnfabrik). A single tooth color setting mode was
selected to obtain CIELAB data (L, a, b), where L -
indicates brightness from 0 (black) to 100 (white), a -
indicates a point on the red-green color scale, b - indicates
a point on the yellow-blue color scale.
The color difference (ΔE) was estimated according to the
following formula [3]:
ΔE= √(ΔL)² + (Δa)² + (Δb)² (1)
2.1. Bleaching with 16% CP
10 lithium disilicate, 10 leucite-reinforced glass ceramic
and 10 zirconium dioxide specimens with and
without glaze were bleached with Philips Zoom
Nitewhite system with 16% CP. This whitening agent is
used to bleach teeth at home during night with individual
trays. Bleaching gel was applied in a thin layer as shown
in Fig. 1(A) every day and stored for 8 hours per day.
The procedure was repeated for 14 days.
After procedure bleaching material was removed with a
damp cloth and the sample surface was dried.
2.3. Bleaching with 6% HP
10 lithium disilicate, 10 leucite-reinforced glass ceramic
and 10 zirconia samples with and without glaze were
bleached using Pola Office + 6% system containing 6%
of HP. This whitening system is used only in-office. A
thin layer of bleaching gel was deposited onto the
specimen’s surface (Fig. 1(B), and left for 15 minutes).
Then the bleaching material was removed with a suction
system and HP was reapplied. The total of 4 sessions was
applied. After bleaching samples were washed with water
and wiped dry.
Fig.1. Bleaching of samples: A –with 16% CP; B – bleaching
with 6% HP
2.4. Evaluation of color changes of specimens after
bleaching
Color changes (ΔE) in specimens after bleaching were
assessed using spectrophotometer VITA Easyshade V.
data and applying criteria set by National Bureau of
Standards (NBS) provided in the Table 2 [26].
Table2. NBS criteria for (ΔE) evaluation
∆E NBS Criteria
0-0.5 Trace: remarkably slight alteration
0.5-1.5 Slight: slight alteration
1.5-3 Noticeable: observable alteration
3-6 Appreciable: apparent alteration
6-12 Much: remarkably appararent
alteration
12 and more Very much: alteration to other color
2.5. Statistical analysis
Statistical analysis was performed using program
package SPSS 21 for Windows. Study data were
analysed with descriptive statistics using one-way
analysis of variance ANOVA methods. The difference
between the variables was considered statistically
significant if p <0.05. Since the data were normally
distributed (Shapiro-Wilk); ANOVA and Tukey HSD
were used.
3. Results
Calculated color changes (ΔE) of the specimens after
bleaching and the mean values ± standard deviations are
provided in the (Table 3).
The results were evaluated according to the NBS
evaluation criteria [26]. Performed investigation
revealed, that all restoration ceramics were reacting to the
bleaching, however each ceramics responded differently.
Notable difference in color changes after bleaching was
also observed analysing polished and glazed parts of the
same samples.
The highest impact on the color changes had bleaching
performed using 16 % carbamide peroxide (CP) solution.
Using this material significant difference in color was
observed for both polished and glazed ceramics which
ranged from noticeable to appreciable (Table 2) when
compared to other bleaching materials.
Table 3. Color changes in the ceramics after bleaching (mean values ± standard deviations)
16% CP, ΔE 6% HP, ΔE
Polished lithium disilicate 2,9302 ± 0,43262 1,8930 ± 0,39954
Glazed lithium disilicate 3,1665 ± 0,9617 1,8722 ± 0,43793
Polished leucite-reinforced glass ceramic 4,7045 ± 0,78505 4,1792 ± 1,13108
Glazed leucite-reinforced glass ceramic 4,8660 ± 0,67218 4,0530 ± 2,10356
Polished zirconium dioxide 4,5187 ± 1,16461 1,6208 ± 0,48593
Glazed zirconium dioxide 3,3472 ± 1,56487 2,1875 ± 1,86009
B
127

G. Morkūnaitė et al. / Medical Physics in the Baltic States 15 (2021) 125-128
4. Conclusions
The impact of bleaching material on the color changes of
three types of restoration ceramics (lithium disilicate
reinforced glass ceramics, leucite reinforced glass
ceramics and zirconium dioxide ceramics) has been
investigated applying hydrogen peroxide and carbamide
peroxide as bleaching materials.
It was found that each ceramic responded differently to
the bleaching procedure and indicated notable color
changes depending on ceramics type and its surface
preparation (polished or glazed) and also bleaching
material used. The later leads to conclusion that more
detailed information on optical properties changes after
bleaching may be assessed having investigated changes
of surface roughness of the ceramics.
In overall, the highest impact on the color changes was
found after samples bleaching with 16 % carbamide
peroxide (CP) solution.
5. References
1. Mohammadibassir M, et al. Effect of Two Polishing Systems
on Surface Roughness, Topography, and Flexural Strength of a
Monolithic Lithium Disilicate Ceramic. Journal of
Prosthodontics, 2019;28: e172-e180.
2. Zarone F, et al. Current status on lithium disilicate and
zirconia: a narrative review. BMC Oral Health. 2019;19 (1):p.
134.
3. Karci M, Demir N. Effect of Home Bleaching on the
Translucency of CAD/CAM Systems. J Prosthodont. 2019
Mar; 28(3):310-314.
4. Haralur SB, et al. Effect of hydrothermal aging and beverages
on color stability of lithium disilicate and zirconia based
ceramics. Medicina. 2019;55:749.
5. Azar B, et al. The marginal fit of lithium disilicate crowns:
Press vs. CAD/CAM. Braz Oral Res. 2018;32:e001.
6. Luciano M, et al. Lithium disilicate posterior overlays:
clinical and biomechanical features. Clin Oral Invest 24, 841–
848 (2020).
7. Fu L, Engqvist H, Xia W. Glass-Ceramics in Dentistry: A
Review. Materials (Basel). 2020 Feb 26;13(5):1049
8. Montazerian M, Zanotto ED. Bioactive and inert dental
glass-ceramics. J Biomed Mater Res A. 2017 Feb;105(2):619-
639.
9. Alves LMM, et al. The Wear Performance of Glazed and
Polished Full Contour Zirconia. Braz Dent J. 2019 Oct
7;30(5):511-518.
10. Colombo M, et al. Color stability of CAD/CAM Zirconia
ceramics following exposure to acidic and staining drinks. J
Clin Exp Dent. 2017 Nov 1;9(11):e1297-e1303.
11. Papageorgiou-Kyrana A, Kokoti M, Kontonasaki E, Koidis
P. Evaluation of color stability of preshaded and liquid-shaded
monolithic zirconia. J Prosthet Dent. 2018 Mar;119(3):467-
472.
12. Kontonasaki E, Giasimakopoulos P, Rigos AE. Strength
and aging resistance of monolithic zirconia: an update to current
knowledge. Jpn Dent Sci Rev. 2020 Dec;56(1):1-23.
13. Yan J, Kaizer MR, Zhang Y.. Load-bearing capacity of
lithium disilicate and ultra-translucent zirconias. J Mech Behav
Biomed Mater. 2018;88:170–175.
14. Demir N, Karci M, Ozcan M, 2020. Effects of 16%
Carbamide Peroxide Bleaching on the Surface Properties of
Glazed Glassy Matrix Ceramics. BioMed Research
International 2020.
15. Tinastepe N, Malkondu O, Iscan I, Kazazoglu E. Effect of
home and over the contour bleaching on stainability of
CAD/CAM esthetic restorative materials. J Esthet Restor Dent.
2021 Mar;33(2):303-313.
16. Kwon SR, Wertz PW. Review of the mechanism of tooth
whitening. J Esthet Restor Dent. 2015; 27( 5): 240- 257.
17. Lilaj B, et al. Comparison of bleaching products with up to
6% and with more than 6% hydrogen peroxide: whitening
efficacy using BI and WID and side effects - an in vitro study.
Front Physiol. 2019;10:919.
18. Coceska E, et al. Enamel alteration following tooth
bleaching and remineralization. J Microsc. 2016
Jun;262(3):232-44.
19. Grazioli G, et al. Bleaching and enamel surface interactions
resulting from the use of highly-concentrated bleaching gels.
Arch Oral Biol. 2018 Mar; 87:157-162.
20. Mushashe AM, et al. Effect of different bleaching protocols
on whitening efficiency and enamel superficial microhardness.
J Clin Exp Dent. 2018;10:e772–5.
21. Lima FV, et al. Carbamide peroxide nanoparticles for dental
whitening application: Characterization, stability and in vivo/in
situ evaluation. Colloids Surf B Biointerfaces. 2019 Jul
1;179:326-333.
22. Redha O, et al. Impact of Carbamide Peroxide Whitening
Agent on Dentinal Collagen. J Dent Res. 2019 Apr;98(4):443-
449.
23. Rea FT, et al. Effect of carbamide peroxide bleaching agent
on the surface roughness and gloss of a pressable ceramic. J
Esthet Restor Dent. 2019 Sep;31(5):451-456.
24. Rodrigues CRT, et al. Changes to Glazed Dental Ceramic
Shade, Roughness, and Microhardness after Bleaching and
Simulated Brushing. J Prosthodont. 2019 Jan;28(1):e59-e67.
25. Juntavee N, Juntavee A, Riyaboot K. Color stability of
computer-aided design–computer-aided manufacturing of
ceramic materials upon light-emitting diode illumination
bleaching. World Journal of Dentistry. 2017;8, 445–45.
26. Özdaş DÖ, et al. Color Stability of Composites After Short-
term Oral Simulation: An in vitro Study. Open Dent J. 2016
Aug 31;10:431-437.
128

MEDICAL PHYSICS IN THE BALTIC STATES 15 (2021)
Proceedings of International Conference “Medical Physics 2021”
4-6 November 2021, Kaunas, Lithuania
ASSESSMENT OF THE RADIATION RISKS FROM MEDICAL X-RAY
EXAMINATIONS CONSIDERING AGE AND GENDER COMPOSITION OF THE
PATIENTS
Vladislav GOLIKOV
St-Petersburg Research Institute of Radiation Hygiene after prof. P.V. Ramzaev
Abstract: At the present time, the collective risk from
medical exposure in the Russian Federation is estimated
by multiplying a collective effective dose by the value of
the nominal risk coefficient, while the age composition
of patients is significantly different from those for the
entire population. The aim of this study was to assess the
correction factors that consider the difference in the age
and sex distribution of the patients and the entire
population for a more correct estimation of collective
risks both from selected X-ray examinations and for
medical exposure in the Russian Federation as a whole.
It is shown that risk estimates for some X-ray
examinations calculated using the age and sex
dependence of the lifetime detriment-weighted radiation
risk coefficients, organ doses and age distribution of
patients may differ from such estimates on the base of
effective dose and nominal risk coefficients up to order
of magnitude.
Keywords: medical examinations, patients, radiation
risk, nominal risk coefficients, effective dose.
1. Introduction
Bearing in mind the uncertainties associated with risk
projection to low doses, the new ICRP Publication 147
[1] concluded that effective dose may be considered as
an approximate indicator of potential risk with the
additional consideration of variation in the risk with age
and sex of a population group.
The age dependence of the lifetime radiation risk is
different for different organs. For example, for stomach
and thyroid the values of risk significantly decline with
the increase in the age. At the same time this relation is
less pronounced for the red bone marrow; for the lungs
and esophagus maximal risk is observed at the age of 45
and 75, respectively. Hence, for the correct assessment of
the collective risk from X-ray examinations it is
necessary to know the age and sex distribution of the
patient sample. Additionally, radiation risk will vary
depending on the irradiated organs, the level of their
exposure and the type of X-ray examination.
At the present time the collective risk from medical
exposure in the Russian Federation is estimated by
multiplying a collective effective dose by the value of the
nominal risk coefficient, while the age composition of
patients is significantly different from those for the entire
population and for different medical examinations
in various ways.
The aim of this study was to assess the correction factors
that consider the difference in the age and sex distribution
of the patients and the entire population for a more
correct estimation of collective risks, both from selected
X-ray examinations and for all medical exposure in the
Russian Federation.
2. Materials and methods
Currently official data on the age and sex distribution of
patients in the Russian Federation is not collected; hence European statistical data was used as a basis for the study
[2]. The European sex and age distribution of patients
were used in accordance with the structure of X-ray
examinations in the Russian Federation, represented by
the following modalities: fluorography, plain
radiography, fluoroscopy, computed tomography,
interventional examinations. Data for fluorography was
based on the distribution of European patients for chest
radiography considering that in the Russian Federation
fluorography is performed from the age of 14 years. Plain
radiography was represented by the examinations of the
skull, chest, cervical spine, thoracic spine, lumbar spine,
abdomen and pelvis; computed tomography -
examinations of the skull, chest and abdomen;
fluoroscopy – Ba follow, Ba meal and Ba enema;
interventional examinations – cardiac angiography. According to the data for 2018, X-ray examinations of
these anatomic regions within each modality contribute
to a collective dose form medical exposure in Russian
Federation from 52% (cardiac angiography) to 96%
(fluoroscopy) [3]. Figure 1, as an example, presents age
distributions of patients averaged by sex undergoing CT
examinations of various parts of the body [2].
129

V. Golikov et al. / Medical Physics in the Baltic States 15 (2021) 129-132
The dosimetric model for each selected examination was
represented by a set of typical physical-technical and
geometric parameters collected earlier in the Russian
medical facilities [4-10] and adopted from the
publications, if necessary [11-14]. The values of organ
and effective doses for these examinations were
calculated using computer programs PCXMC 2.0 [15]
and EDEREX [16] for plain radiography, fluoroscopy
and interventional examinations and NCICT 2.01 [17] for
computed tomography.
Fig. 1. Age distribution of patients undergoing CT examination
[2]
Lifetime detriment-weighted radiation risk of a patient of
gender G and age А can be estimated based on the
absorbed doses in organs and tissues and appropriate risk
coefficients for the individual tissues at risk (“gold
standard”):
( ) ( )G G G
A A A
O
R D O r O (1)
where G
AR – is the lifetime detriment-weighted radiation
risk of a patient of gender G and age А due to the X-ray
examination, dimensionless;
( )G
AD O – is the mean absorbed dose in the organ or tissue
О of a patient of gender G and age А due to the X-ray
examination, mGy;
( )G
Ar O – is the lifetime detriment-weighted radiation risk
coefficient due to exposure of the organ or tissue О in a
patient of gender G and age А, mGy-1.
To calculate risks for patients undergoing the above
examinations, the values of absorbed doses in organs and
the lifetime detriment-weighted radiation risk
coefficients normalized per 1 mGy for men and women
with 5-year-old age intervals at the time of exposure were
used. The risk coefficients were adopted from the
existing Russian guidelines [18]. The calculated risks G
AR for men and women for 30 most common X-ray
examinations for different imaging modalities are
presented in [19].
The next step was to calculate the ratios of risks for
patients of different age groups estimated using the “gold
standard” to the risks for these patients estimated using
effective dose and nominal risk coefficient. The final step
was to calculate the correction factors to the risk value
based on the effective dose considering the patient
distribution by age for the selected X-ray examination
using the Equation 2:
5
0.5 [ ]( )
5.7 10
M F
A Aexam A
А A
R RK f N
E
(2)
where M
AR – is the lifetime detriment-weighted radiation
risk of a male patient of the age А due to X-ray
examination, dimensionless; F
AR – is the lifetime detriment-weighted radiation risk of
a female patient of the age А due to X-ray examination,
dimensionless;
AE – is the effective dose of the patient of the age А due
to X-ray examination, mSv;
5.7·10-5mSv-1 –is the nominal risk/detriment coefficient;
( )Af N – is fraction of patients of the age A in whole
sample of patients for given examination, dimensionless.
3. Results and discussion
Typical values of effective doses for the selected X-ray
examinations in the Russian Federation are presented in
Table 1.
Table 1. Typical values of effective doses (mSv) for the
selected X-ray examinations in the Russian Federation
Examination Age category, years
0-4 5-9 10 - 14 15 - 19 Adults
Plain
radiography
Skull 0.04 0.04 0.03 0.05 0.07
Cervical spine 0.08 0.10 0.10 0.13 0.15
Thoracic spine 0.27 0.40 0.45 0.61 0.84
Chest 0.06 0.08 0.08 0.12 0.17
Lumbar spine 0.33 0.52 0.57 1.12 1.90
Abdomen 0.22 0.34 0.45 0.78 1.14
Pelvis 0.21 0.43 0.52 0.61 0.79
Fluorography
Digital 0.04 0.04
Film 0.37 0.37
Interventional
Examination
Cardiac
angiography
5.30 4.60 6.60 13.0 19.0
Fluoroscopy
Ba meal 0.98 1.29 1.84
Ba follow 0.88 0.74 1.06 3.92 8.00
Ba enema 1.00 4.72 10.4
CT
Head 1.59 1.63 1.55 2.08 1.90
Chest 2.60 2.77 3.17 4.32 5.16
Abdomen 5.72 5.81 6.32 6.90 7.10
Example of the method of calculation is provided for CT
of the abdomen. Results of the calculation of the relation
between patient age and life time radiation risk for this
examination, based on the “gold standard” and effective
dose and nominal risk coefficient are presented on Fig. 2.
It is visible, that only for children of both genders,
radiation risks estimated using age-specific risk
coefficients and corresponding organ doses exceed the
risk based on the effective dose. For adult patient that
130

V. Golikov et al. / Medical Physics in the Baltic States 15 (2021) 129-132
ratio is less than one. Relevant data for the calculation of
the correction factor for this examination and results of
calculation are presented in Table 2. Data is presented for
5-year age intervals with corresponding age correction
factors for the CT of the abdomen (see Fig. 2). A total
value of the correction factor for the CT of the abdomen
is calculated as the sum of multiplications of values from
columns two and three.
Fig. 2. Dependence on the age and sex of patients of the lifetime
detriment-weighted radiation risk due to CT of the abdomen
calculated for the Russian population according to the "gold
standard" and effective dose
Table 2. Initial data and the results of calculation of the
correction factor for the CT of the abdomen
Patient age
group, years
Age correction
factor
The fraction of
patients of this age
group
0-4 1.57 0.002
5-9 1.46 0.002
10-14 1.14 0.004
15-19 1.00 0.012
20-24 0.97 0.017
25-29 0.84 0.024
30-34 0.73 0.029
35-39 0.63 0.040
40-44 0.58 0.053
45-49 0.47 0.065
50-54 0.38 0.083
55-59 0.29 0.11
60-64 0.21 0.11
65-69 0.15 0.11
70-74 0.097 0.12
75-79 0.059 0.11
80-84 0.035 0.072
85+ 0.014 0.046
The value of correction factor for
total examination 0.29
Hence, collective radiation risk from the CT of the
abdomen in the Russian Federation is less than the risk
calculated based on the effective dose by the factor of
three.
The results of the calculations of the correction factor
values for the different imaging modalities, as well as for
the separate X-ray examinations are presented in Table 3.
Transition from the correction factors for the selected X-
ray examinations to the correction factors for the imaging
modalities was performed by weighting the factors for
the X-ray examinations by the contribution to the
collective dose from the corresponding imaging
modalities, based on the state statistical dose data
collection [3].
Table 3. Correction factors for the risk values calculated using
effective doses and nominal risk coefficients
Examination Correction factor
Fluorography KFg= 0.45
Plain radiography KPR = 0.38
Skull 0.71
Chest 0.51
Cervical spine 0.35
Thoracic spine 0.64
Lumbar spine 0.32
Abdomen 0.30
Pelvis 0.19
Interventional Examinations
(IE)
KIE=0.40
Coronary angiography 0.40
CT KCT= 0.41
Head 0.77
Chest 0.33
Abdomen 0.29
Fluoroscopy KFs = 0.20
Ba follow 0.31
Ba meal 0.28
Ba enema 0.09
It is visible, that absolute values of the correction factors
for all X-ray examinations are less than one. It can be
explained by the age composition of patients shifted
towards elderly people with risk coefficient less than
nominal that is used for the calculation of the effective
dose. Additionally, doses for pediatric patients are
commonly significantly lower compared to adults for the
majority of X-ray examinations.
Hence, the calculation of the collective risk for the
selected X-ray examination considering the age
composition of the patients will lead to a conservative
estimation of the radiation risk compared to the
assessment of the radiation risk when using the effective
dose and nominal risk coefficients.
Calculation of the collective risk R from medical
exposure corrected by the age dependent risk coefficients
based on the data from the federal statistical forms can be
performed using the Equation 3:
0.057 (0.45 0.38
0.41 0.20 0.40 )
coll coll
Fg PR
coll coll coll
CT Fs IE
R E E
E E E
(3)
where R – is the collective lifetime detriment-weighted
radiation risk; , , , ,coll coll coll coll coll
Fg PR Fs CT IEE Е Е Е Е – are the
collective effective doses for different medical
technologies, man Sv; 0.057 Sv-1 – is the nominal
risk/detriment coefficient.
Using the presented approach considering the age and
gender dependency of the risk coefficients and data on
collective effective doses of the corresponding imaging
modalities based on the state statistical dose data
collection we can show that the collective risk from X-
131

V. Golikov et al. / Medical Physics in the Baltic States 15 (2021) 129-132
ray examinations in the Russian Federation in 2018 was
lower by the factor of 2.5 compared to the assessment
based on the effective dose with nominal risk coefficient.
According to the 2018 official data the total collective
effective dose from medical exposure of the Russian
population was approximately 8·104 man Sv [3]. Just a
10% reduction in the annual collective dose from medical
exposure (8·103 man Sv) will be equivalent to the half of
the total collective effective dose of the public in the
Russian Federation from the deposition after the
Chernobyl accident (~ 1.5·104 man Sv). It is also clear
that any clarification of the collective dose value due to
medical exposure is of great importance in any system of
risk management.
4. Conclusion
An approach has been developed that allows in view of
the age and sex dependences of the risk coefficients of
radiogenic cancer and the age and sex distribution of
patients for various X-ray examinations as well to assess
the collective radiation risk from both separate X-ray
examination and medical exposure as a whole in the
Russian Federation.
5. References
1. ICRP, 2021. Use of dose quantities in radiological
protection. ICRP Publication 147. Ann. ICRP 50(1).
2. European Commission. Medical Radiation Exposure of
the European Population. European Commission.
Radiation protection, 2014, 180, Part 1/2, 181 p.
3. Barkovsky A., Akhmatdinov R., Akhmatdinov R. et al.
Radiation doses of the population of the Russian
Federation in 2018. Handbook (St. Petersburg: Institute of
Radiation Hygiene), 2019, 71p. (in Russian).
4. Golikov V., Balonov M., Kalnitsky S., Sarycheva S.
Evaluation of patients doses during interventional
radiological examinations. Radiatsionnaya Gygiena =
Radiation Hygiene. 2009. Vol. 2, No. 3. p. 26–31 (in
Russian).
5. Golikov V., Balonov M., Kalnitsky S., Bratilova A.,
Sarycheva S., Shatsky I. and Vodovatov A. Exposure
levels of patients during radiological examinations in St.
Petersburg and the Leningrad region. Radiatsionnaya
Gygiena = Radiation Hygiene. 2011. Vol. 4, No. 1. p. 5–
13 (in Russian).
6. Bratilova A., Golikov V. and Kalnitsky S. Exposure levels
of patients during computed tomography in medical
organizations of St. Petersburg and Leningrad region.
Radiatsionnaya Gygiena = Radiation Hygiene. 2014. Vol.
7, No. 3. p. 33–38 (in Russian).
7. Balonov M. et al. Modern levels of medical exposure in
Russian Federation. Radiatsionnaya Gygiena = Radiation
Hygiene. 2015. Vol. 8, No. 3. p. 67–79 (in Russian).
8. Chipiga L. et al. Levels of patient exposure and possible
ways of PET diagnostics optimization in Russia.
Radiatsionnaya Gygiena = Radiation Hygiene. 2017. Vol.
10, No. 4. p. 31-43 (in Russian).
9. Golikov V.Y., Vodovatov A.V. Estimation of an X-ray
machine’s workload during routine radiological
examinations. Radiatsionnaya Gygiena = Radiation
Hygiene. 2015. Vol.8, No.2. p. 6-10 (in Russian).
10. Vodovatov A.V., Golikov V.Y., Kamyshanskaya I.G.,
Zinkevich K.V., Bernhardsson C. Estimation of the
conversion coefficients from dose-area product to
effective dose for barium meal examinations for adult
patients. Radiatsionnaya Gygiena = Radiation Hygiene.
2018. Vol.11, No.1. p. 93-100. (in Russian).
11. Yakoumakis E. et al. Evaluation of organ and effective
doses during paediatric barium meal examinations using
PCXMC 2.0 Monte Carlo code. Rad. Prot. Dos. 2015;
163(2): p. 202-209.
12. Damilakis J. et al. Normalized dose data for upper
gastrointestinal tract contrast studies performed to infants.
Medical Physics 33, 1033 (2006); doi: 10.1118/1.2181297
13. Livingstone R.S., Eapen A., Chiramel G.K. et al.
Radiation dose to paediatric patients undergoing
fluoroscopic examinations performed using digital
imaging system. Radiography (2008) 14, p. 17-23
14. Weir K.A., McMahon S.M., Long G. et al. Radiation doses
to children during modified barium swallow studies.
Pediatr Radiol (2007) 37:p. 283–290.
15. Tapiovaara, M. and Siiskonen, T. PCXMC—A Monte
Carlo Program for Calculating Patient Doses in Medical x-
Ray Examinations, second edn. (Helsinki, Finland:
Stateilyturvakeskus) (2008) STUK-A 231.
16. Golikov V., Barkovsky A., Wallstrōm E., Cederblad Å. A
comparative study of organ doses assessment for patients
undergoing conventional X-ray examinations: phantom
experiments vs. calculations. Radiation Protection
Dosimetry, Vol. 178, Issue 2, 2018, p. 223-234.
17. Lee C. et al. NCICT: a computational solution to estimate
organ doses for pediatric and adult patients undergoing CT
scans / C. Lee, K.P. Kim, W.E. Bolch et al. // J. Radiol.
Prot. – 2015. Vol. 35. – p. 891–909.
18. Methodical Recommendations 2015. Assessment of
radiation risks for the patients undergoing diagnostic
examinations with the use of ionizing radiation.
Methodical Recommendations МR 2.6.1.0098-15
(Moscow: Rospotrebnadzor) p. 34 (in Russian)
19. Methodical Recommendations 2020. Assessment of
radiation risks for the patients undergoing diagnostic
examinations with the use of ionizing radiation.
Methodical Recommendations МR 2.6.1.0215-20
(approved by Head State Sanitary Doctor of the Russian
Federation 09/21/2020) (in Russian)
132

MEDICAL PHYSICS IN THE BALTIC STATES 15 (2021)
Proceedings of International Conference “Medical Physics 2021”
4-6 November 2021, Kaunas, Lithuania
PREOPERATIONAL ASSESSMENT OF 14C IN THE VICINITY OF THE
BELARUSIAN NUCLEAR POWER PLANT
Kristina ERIKSSON STENSTRÖM1, Vytenis BARKAUSKAS2, Christian BERNHARDSSON3, Aliaksandr
DVORNIK4, Mattias JÖNSSON5, Charlotta NILSSON6, Mattias OLSSON7; Guillaume PÉDEHONTAA-HIAA8,
Valery RAMZAEV9, Christopher RÄÄF10, Aleksandr VODOVATOV11 1,6Lund University, Department of Physics, Division of Nuclear Physics, Lund, Sweden; 2Center for Physical
Sciences and Technology, Department of Nuclear Research, Vilnius, Lithuania; 3,5,8,10Lund University, Department of
Translational Medicine, Medical Radiation Physics, Malmö, Sweden; 4Institute of Radiobiology of NAS of Belarus,
Gomel, Belarus; 7Lund University, Department of Geology, Lund Sweden; 9,11Research Institute of Radiation Hygiene,
St Petersburg, Russia [email protected]; [email protected]; [email protected];
[email protected]; [email protected]; [email protected]; [email protected]; [email protected]; [email protected]; [email protected]; [email protected]
Abstract: As part of an independent assessment of the
preoperational radiation environment around the
Ostrovets nuclear power plant in Belarus, grass and
foodstuffs were collected in 2019 for 14C analysis. The
preoperational 14C specific activities in the Ostrovets
region were shown to be similar to that of European
data from other uncontaminated sites.
Keywords: Nuclear power plant, 14C, preoperational
assessment, Ostrovets, BelNPP
1. Introduction
The Belarusian nuclear power plant (BelNPP; N54.76,
E26.09) located in the Ostrovets district in the Grodno
region, is the first to be operated in Belarus. The nuclear
power plant (NPP) is presently equipped with two
Russian VVER-1200 reactors (water-water energetic
reactors of type AES-2006 from Atomstroyexport). The
NPP is located 50 km east of Vilnius, the capital of
Lithuania, and the first reactor was officially started for
test operation late in year 2020 [1]. As recommended by
the IAEA, preoperational studies must be performed
prior to start of a new NPP, including mapping the
baseline of radiation in the environment [2]. For about
one decade the Belarusian state institution Belhydromet
(Republican center for hydrometeorology, radioactive
contamination control and environmental monitoring)
has mapped the radiation environment around BelNPP
at defined observation points, some that also include
monitoring systems, which comprise the official
baseline data. On the initiative of BelNPP, in
cooperation with “Russian green cross” and “AEB,
Alpha-X91”, a preoperational monitoring programme
was started in 2019 focussing on in situ and mobile
gamma spectrometry as well as sediment and water
sampling along the Viliya river (known as the Neris
river on the Lithuanian side) [3]. The survey also
included sampling of terrestrial and aquatic vegetation,
air and soil for analysis of gamma emitting
radionuclides. Samples of water, air and vegetation
were collected to determine content of 3H and 14C.
Apart from that, radiation baseline assessments have
also been carried out in forest ecosystems on the
Lithuanian side of the boarder in 2017–2018 [4],
including analysis of gamma emitters, 3H and 14C. In
2019 (September and October) a Swedish, Belarusian
and Russian research team performed independent
baseline measurements around BelNPP, financed by the
Swedish Radiation Safety Authority (SSM, SSM project
SSM2019-6032). The assessment program included in
situ gamma spectrometry, soil and grass samplings,
measurement of ambient dose rate at 45 sites selected to
be evenly distributed (south, west, north) around and
within 22 km of BelNPP. Sampling of foodstuff (e.g.
fruits, berries, vegetables) and water was carried out
around these sites for analysis of gamma emitters, 3H
and 14C.
Operational releases of 14C from NPPs are highly
important from a radiological perspective, due to the
long physical half-life of 14C (5740 years), high
bioavailability and global circulation of carbon. In fact,
the globally dispersed radionuclides 3H, 14C, 85Kr and 129I – and in particular 14C – are the main contributors
from the nuclear power industry to the overall long-term
collective doses (integrated over < 500 years) [5].
In the present paper we report on preoperational
measurements of 14C in samples of grass, apples,
potatoes and beetroots. We also summarize typical 14C
133

K. E. Stenström et al. / Medical Physics in the Baltic States 15 (2021) 133-137
levels that have been found in previous preoperational
assessments in Belarus and in southern Sweden, and at
operational conditions, e.g., around the Ignalina NPP in
Lithuania.
2. 14C and the nuclear power industry
14C is a naturally occurring radionuclide that is
continuously produced in the upper atmosphere through
nuclear reactions between atmospheric oxygen/nitrogen
and neutrons (the latter produced from interactions with
cosmic radiation). As 14C is oxidized to CO2 and spread
throughout the atmosphere, 14C will be part of the global
carbon cycle and is thus incorporated into all living
matter.
Anthropogenic 14C in the environment mainly stems
from the extensive testing of nuclear weapons in the
mid-20th century, as well as the nuclear power industry
[5]. 14C is also extensively used as a tracer in various
research disciplines and can be formed during operation
of various accelerator systems. Locally increased levels
of 14C can therefore be seen in the environment of such
facilities and practices [6, 7].
The natural specific activity of carbon in living matter is
about 226 Bq (kg C)-1, corresponding to a 14C/C ratio of
about 10-12. An alternative and convenient unitless
quantity of expressing post-bomb 14C levels is fraction
Modern, F14C [8, 9]. One advantage of using F14C is
that it corrects for isotope fractionation: thus F14C
values are directly comparable for different
environmental matrixes, whereas specific activity (Bq
(kg C)-1) is not [7].
The natural pre-bomb F14C level is ~1, corresponding to
about 226 Bq (kg C)-1, whereas the maximum F14C
resulting from nuclear weapon tests in the 1960s was
~2. Spatial variability in clean air 14C levels is small in
the northern and southern hemisphere, respectively [10].
Since the peak in 14C activity concentration in 1963,
F14C has decreased in an almost exponential fashion due
to transfer and mixing with the oceans and biosphere,
and due to dilution caused by the increasing CO2
concentration resulting from the combustion of fossil
fuels (see e.g. [7] and references therein).
In nuclear reactors, 14C is produced mainly through
neutron activation reactions e.g. in nitrogen (e.g. 14N(n,p)14C; high thermal neutron capture cross section
of 1.82 b), oxygen (e.g. 17O(n,)14C; high thermal
neutron capture cross section of 0.24 b) and carbon (e.g. 13C(n,)14C; cross section 0.9 mb) [11]. Nitrogen and
oxygen may occur in the fuels, moderators and coolants.
The 13C(n,)14C reaction is highly relevant for reactors
with graphite moderators. For most reactors, the 14C
released into the environment mainly originates from
the coolant/moderator, and airborne releases are
dominating over liquid discharges [11]. For all reactor
types except Pressurized Water Reactors (PWRs), 14CO2
is the dominating chemical form of release [12].
According to Zazzeri et al. [12], on average 72% of the 14C releases from PWRs occur as 14CH4 and the rest as 14CO2. The VVER reactors in Ostrovets are of the PWR
type. According to Zazzeri et al. [12], VVER reactors
have higher emissions of 14C than other PWR reactors.
Details on the 14C production rates and release rates
from various types of nuclear reactors can be found e.g.
in Zazzeri et al. [12].
Examples of typical excess concentrations of 14C in the
vicinity of VVER reactors can be found in the literature.
Janovics et al. [13] report a small excess in 14CO2 of up
to 1.3% above clean air background in annual (year
2000-2009) growth rings of trees located within 1 km of
Paks NPP (4 500 MWel) in Hungary. Varga et al. [14]
report that the monitoring stations located < 2 km from
Paks NPP show an average 14CO2 excess of 0.38%
whereas the average 14CO2 + 14CnHm excess was 3.11%
in years 2015 and 2016.
Ješkovský et al. [15] and Kontul´ et al. [16] have
monitored 14C in CO2 and annual tree rings close to the
NPP Jaslovské Bohunice (2 440 MWel) in Slovakia.
Large variations in 14C were observed in CO2: up to
about 17% above clean air background was occasionally
observed, whereas the tree rings and the annual average 14C levels in air were close to central European
background data [15].
An example of a study from other types of PWRs is
Dias et al. [17] who found up to 22% excess 14C
specific activities in grass samples collected around
Angra NPP (one Westinghouse PWR of 567 MWel and
one Siemens PWR of 1350 MWel) in Brazil.
Other types of nuclear reactors, in particular Heavy
Water Reactors (HWRs), are known to contribute to
significantly higher environmental 14C concentrations.
Milton et al [18] found ~13 kBq (kg C)-1 in fruits grown
in the year of 1996 at ~1 km from the large Pickering
Nuclear Generating Station (entirely based on HWRs)
in Canada, corresponding to a F14C value of ~58.
Studies at Pickering in 1998 by Stenström et al. [6]
showed a F14C value of 6.84 ± 0.15 in grass collected 2
km from the facility, and at a distance of 100 km an
excess of 7% was found.
The former NPP in Ignalina (one RBMK-1500 reactor),
Lithuania, is located only ~100 km NNE of BelNPP,
and its environmental impact is therefore of particular
interest for preoperational studies of the radiation
environment around BelNPP. Graphite moderated
reactors like the RBMK has the potential of not only
releasing 14C as gases, but also as graphite particles.
Several studies have been performed around Ignalina
NPP in the past (e.g. [19, 20]), and a few of these
studies have involved some of the authors of the present
paper [21-23]. In 2003, an excess 14C of up to 42%
above clean air background was found among various
vegetation samples collected within 400 m of the stack
of Ignalina NPP [21]. Even higher activity
concentrations were found in moss samples, up to ~20
times the clean air background (4.7 kBq (kg C)-1) [21].
In another study conducted between 2001 and 2004, ~70
samples of leaves, grass, moss, soil and aquatic plants
were collected up to a distance of 32 km from Ignalina
NPP [22]. Soil samples collected within 500 m of the
NPP showed up to ~20 times the clean air background.
Moss samples collected within up to ~4 km from the
NPP showed excess 14C of up to ~70%, whereas moss
samples collected at longer distances showed no
apparent 14C excess [22].
Chernobyl NPP is located ~460 km SE of BelNPP.
Studies after the Chernobyl accident in 1986 showed
134

K. E. Stenström et al. / Medical Physics in the Baltic States 15 (2021) 133-137
that 14C was released in large amounts as CO2 as well as
graphite particles (see [24] and references therein). The
impact from the Chernobyl accident, as well as from
normal operation of nearby nuclear reactors (Ignalina
NPP, Chernobyl and Smolensk), on the environment in
Belarus has been studied by Mikhajlov et al. using
Liquid Scintillation Counting (LSC) [25]. In 1986,
F14C~2 was found in grass samples collected near
Minsk, and in the Gomel region F14C in grass was as
high as up to F14C~7 (see [25] and references therein).
Vegetation samples collected in 1994–1999 in the
Gomel region had F14C up to ~1.8 (the highest value in
a moss sample) [25]. Chernobyl 14C was also seen e.g.
in a moss sample collected in 1994 in the Volozhin
district (F14C~1.26) [25], which is located ~80 km SSE
from BelNPP. Close to Ignalina NPP, F14C values of up
to ~1.9 were found in vegetation collected in 1994 [25],
corresponding to a maximum excess of ~70% compared
to central European clean air data (F14C ~1.13 [26]).
Areas remote from Ignalina and Chernobyl showed 14C
levels corresponding to F14C ranging between 0.92 and
1.07 (analytical accuracy and precision not stated in the
paper) [25], i.e. close to central European clean air data.
3. Materials and methods
Samples of Poaceae sp. (grass, N=12), Malus domestica
(apple, N=4), Solanum tuberosum (potato, N=3) and
Beta vulgaris (beetroot, N=1) were collected between 15
and 17 October 2019 at 13 sites close to BelNPP, as
described in Table 1 and shown in Figure 1. In total 20
samples were collected, and at several of the sites more
than one species were sampled. All sampling sites were
located within 22 km of the NPP. The majority of the
samples were collected north, west and south of the
power plant, covering the area between BelNPP and the
Belarusian-Lithuanian border. The area east of the NPP
has not yet been included (due to the swampy terrain in
the area).
Table 1. Sampling sites around BelNPP.
Site Name Lat Long
30 Troshchany 54.924 26.199
31 Barani 54.919 26.111
33 Podol'tsy 54.867 26.087
36 Bystrica 54.796 25.880
37 Zharneli 54.806 25.791
38 Asinovka 54.723 25.780
39 Zacharyski 54.702 25.817
40 Drevenyaki 54.645 25.835
41 Radiuli 54.649 26.074
42 Palushi 54.607 25.875
43 Grodi 54.524 25.885
44 Ostrovets infocentre 54.616 25.982
46 Mikhalishki 54.813 26.158
After collection, the samples were transported to Lund
University, Sweden. Single apples, potatoes and
beetroots were cut into small pieces prior to drying the
samples for several hours in an oven at 30–50 °C
according to the procedures described in Bernhardsson
et al. [7]. A few strands of each grass sample were also
dried prior to being cut into small pieces. A few mg of
each dried sample was taken further to a graphitization
process, in which typically 1–2 mg of carbon was
extracted from each sample, using the system AGE [27]
at the Radiocarbon Dating Laboratory in Lund. The
extracted carbon from each sample was pressed into
separate aluminium holders, along with graphitized
standard samples of known activity and background
samples (graphitized 14C-free fossil material). The 14C
content of the samples were determined from
measurements using the Single Stage Accelerator Mass
Spectrometry (SSAMS) facility at the Radiocarbon
Dating Laboratory at Lund University and subsequent
data analysis [28, 29]. Results were expressed as the
quantity F14C. Typical analytical uncertainties were
~0.5% (1 standard deviation). Further details on sample
preparation, measurement, analysis and quality
assessment can be found in Bernhardsson et al. [7], as
well as relations between F14C and activity
concentrations in various environmental sample types.
Fig. 1. Location of sampling points near the site of the
Belarusian NPP.
The obtained results were compared to summer means
of clean air CO2 data from Sweden (Hyltemossa
Research Station, N56.10, E13.42, 46 km NNE of
Lund) [30]. Additionally, the data from Belarus was
compared to preoperational data from year 2019 for 10
samples of grass, fruits and/or berries collected around
the neutron research facility European Spallation Source
(ESS; N55.73, E13.45) [31], which is currently under
construction in the outskirts of Lund. The ESS samples
were collected between end of August and beginning of
October 2019. Data was also compared with the results
from preoperational assessments at the Lithuanian-
Belarusian border reported by ref [4].
3031
33
3637
38
39
4041
42
43
44
45
Belarus
Lithuania
NPP
Ostrovets
10 km
54.76° N
26.09° E
N
EW
S
46
135

K. E. Stenström et al. / Medical Physics in the Baltic States 15 (2021) 133-137
4. Results and discussion
The results of the 14C analyses of the 20 samples of
Poaceae sp. (grass), Malus domestica (apple), Solanum
tuberosum (potato) and Beta vulgaris (beetroot) are
shown in Table 2. The mean of all F14C values was
1.011 (standard deviation (STD): 0.004; standard
uncertainty of the mean (SUM): 0.001). The data were
normally distributed with no significant outlier. The
mean values of the grass and apple samples,
respectively, were not significantly different (at the 0.05
level according to an ANOVA test).
Table 2. F14C in samples collected around the Belarusian NPP
in the Ostrovets district between 15 and 17 October 2019.
Uncertainties represent 1 standard deviation.
Site Species F14C
30 Malus domestica (apple) 1.014 ± 0.006
30 Poaceae sp. (grass) 1.009 ± 0.006
31 Solanum tuberosum (potato) 1.007 ± 0.006
31 Poaceae sp. (grass) 1.014 ± 0.006
33 Poaceae sp. (grass) 1.015 ± 0.006
33 Solanum tuberosum (potato) 1.016 ± 0.006
33 Beta vulgaris (beetroot) 1.003 ± 0.006
36 Malus domestica (apple) 1.009 ± 0.005
36 Poaceae sp. (grass) 1.011 ± 0.005
37 Malus domestica (apple) 1.008 ± 0.005
37 Poaceae sp. (grass) 1.009 ± 0.005
38 Poaceae sp. (grass) 1.013 ± 0.005
39 Poaceae sp. (grass) 1.010 ± 0.005
40 Poaceae sp. (grass) 1.015 ± 0.005
41 Poaceae sp. (grass) 1.007 ± 0.005
41 Malus domestica (apple) 1.009 ± 0.005
42 Poaceae sp. (grass) 1.015 ± 0.005
43 Poaceae sp. (grass) 1.013 ± 0.005
44 Poaceae sp. (grass) 1.007 ± 0.005
46 Solanum tuberosum (potato) 1.008 ± 0.005
The mean of the data from the Belarusian samples was
identical to the mean of the 10 environmental samples
of grass, fruits and/or berries collected in preoperational
studies around the ESS facility in Lund the same year:
the mean F14C value of all ESS samples was 1.011
(STD: 0.004; SUM: 0.001) [31]. Both data sets, the
samples collected around ESS in Sweden and around
BelNPP in Belarus, are slightly higher (<0.4% higher,
statistically significant at the 0.05 level in a two-sample
t test) than F14C data from atmospheric CO2 from the
ICOS Hyltemossa Research Station (mean F14C for May
to August 2019 of 1.007 (STD: 0.003; SUM: 0.001).
Jefanova et al. [4] present 14C data from terrestrial
samples collected in 2017–2018 in Lithuania, within the
30-km zone of the BelNPP. LSC measurements
provided F14C values in 27 samples of moss, blueberry,
rowan, birch and mugwort between 0.978 ± 0.013 and
1.024 ± 0.008, with an average of 0.993 (STD 0.013;
SUM 0.002). As noted by Jefanova et al. [4], this is
slightly lower (~2%) than Central European clean air
data: the average F14C of data corresponding to the
growing season of 2017 (May to Aug) was 1.015 (STD
0.002; SUM 0.001) and the corresponding value for
2018 was 1.012 (STD 0.002; SUM 0.001) [26, 32-34].
Jefanova et al. [4] speculate that contamination by fossil
carbon could cause the offset. Swedish data obtained
from 36 terrestrial samples collected in 2017 in southern
Scania region (southern Sweden) as preoperational data
for the ESS facility was 1.017 (STD 0.005; SUM 0.001)
[7], which is not statistically significantly different from
clean air European data. For the 30 Scanian samples
collected in 2018 the corresponding average F14C value
was 1.016 (STD 0.004; SUM: 0.001), which is only
slightly (<0.4%) higher than the average central
European data during the growing season. Thus, the
Swedish data do not show any general contamination of
fossil carbon in the samples analysed.
5. Conclusions
The independent preoperational assessment of 14C levels
in 20 vegetation samples collected in year 2019 within
22 km north, west and south of the Belarusian NPP
showed the same mean value as preoperational
assessments around the European Spallation Source
neutron research facility in Lund, Sweden (F14C=1.011;
STD: 0.004; SUM: 0.001). No evidence of 14C from
other present or previous nearby sources or from the
Chernobyl accident was apparent in the vegetation
samples analysed. In the present study, only samples of
grass and foodstuffs were analysed, which reflect the 14C concentration in atmospheric CO2. It would be of
interest to also investigate soil samples to study if any 14C-containing graphite from the Chernobyl accident or
from Ignalina NPP has reached the Ostrovets area.
6. References
1. Belarusian Nuclear Power Plant. Accessed: 2021-08-11.
Available from: https://belaes.by/en/.
2. IAEA. Environmental and Source Monitoring for
Purposes of Radiation Protection. Safety Guide RSG1. 8.
2005.
3. Pre-operational studies in the area of the Belarusian NPP
(zero background). Express report. Accessed: 2021-08-16.
Available from: https://belaes.by/ru/ekologiya/otchet-po-
rezultatam-ekologicheskogo-monitoringa-v-zone-
nablyudeniya-belorusskoj-aes.html. (in Russian).
4. Jefanova, O., Baužienė, I., Lujanienė, G., Švedienė, J.,
Raudonienė, V., Bridžiuvienė, D., Paškevičius, A., et al.
Initiation of radioecological monitoring of forest soils and
plants at the Lithuanian border region before the start of
the Belarusian nuclear power plant operation.
Environmental Monitoring and Assessment, 192(10): 1-
18, 2020.
5. UNSCEAR. UNSCEAR 2016 Report—Sources, Effects
and Risks of Ionizing Radiation. Report to the General
Assembly. Scientific Annexes A, B, C, and D. Available
on unscear.org/unscear/en/publications/2016.html.
(accessed 15 Oct 2017). 2016.
6. Stenström, K., Skog, G., Nilsson, C.M., Hellborg, R.,
Leide-Svegborn, S., Georgiadou, E., Mattsson, S. Local
variations in 14C – How is bomb-pulse dating of human
tissues and cells affected? Nuclear Instruments and
Methods in Physics Research Section B: Beam
Interactions with Materials and Atoms, 268(7–8): 1299-
1302, 2010.
7. Bernhardsson, C., Eriksson Stenström, K., Jönsson, M.,
Mattsson, S., Pedehontaa-Hiaa, G., Rääf, C., Sundin, K., et
al. Assessment of "Zero Point" radiation around the ESS
facility. Report MA RADFYS 2018:01, Report BAR-
2018/04.
https://portal.research.lu.se/portal/sv/publications/assessm
ent-of-zero-point-radiation-around-the-ess-
136

K. E. Stenström et al. / Medical Physics in the Baltic States 15 (2021) 133-137
facility(2153e07c-b465-4191-abc3-dbfcaf28b85b).html.
2018.
8. Reimer, P.J., Brown, T.A., Reimer, R.W. Discussion:
Reporting and calibration of post-bomb 14C data.
Radiocarbon, 46(3): 1299-1304, 2004.
9. Eriksson Stenström, K., Skog, G., Georgiadou, E.,
Genberg, J., Johansson, A. A guide to radiocarbon units
and calculations. LUNFD6(NFFR-3111)/1-17/(2011).
Lund University. Dep of Physics. Div of Nuclear Physics.
http://lup.lub.lu.se/search/ws/files/5555659/2173661.pdf.
2011.
10. Hua, Q., Barbetti, M., Rakowski, A.Z. Atmospheric
Radiocarbon for the Period 1950–2010. Radiocarbon,
55(4): 2059-2072, 2013.
11. IAEA. Management of waste containing tritium and
carbon-14. Technical report series no 421. 2004.
12. Zazzeri, G., Yeomans, E.A., Graven, H. Global and
regional emissions of radiocarbon from nuclear power
plants from 1972 to 2016. Radiocarbon, 60(4): 1067-1081,
2018.
13. Janovics, R., Kern, Z., Güttler, D., Wacker, L., Barnabás,
I., Molnár, M. Radiocarbon impact on a nearby tree of a
light-water VVER-type nuclear power plant, Paks,
Hungary. Radiocarbon, 55(2): 826-832, 2013.
14. Varga, T., Orsovszki, G., Major, I., Veres, M., Bujtás, T.,
Végh, G., Manga, L., et al. Advanced atmospheric 14C
monitoring around the Paks Nuclear Power Plant,
Hungary. Journal of Environmental Radioactivity, 213:
106138, 2020.
15. Ješkovský, M., Povinec, P.P., Steier, P., Šivo, A.,
Richtáriková, M., Golser, R. Retrospective study of 14C
concentration in the vicinity of NPP Jaslovské Bohunice
using tree rings and the AMS technique. Nuclear
Instruments and Methods in Physics Research Section B:
Beam Interactions with Materials and Atoms, 361: 129-
132, 2015.
16. Kontuľ, I., Povinec, P.P., Šivo, A., Richtáriková, M.
Radiocarbon in the atmosphere around the Bohunice
nuclear power plant in Slovakia. Journal of
Radioanalytical and Nuclear Chemistry, 318(3): 2335-
2339, 2018.
17. Dias, C.M., Santos, R.V., Stenstrom, K., Nicoli, I.G.,
Skog, G., da Silveira Correa, R. 14C content in vegetation
in the vicinities of Brazilian nuclear power reactors. J
Environ Radioact, 99(7): 1095-101, 2008.
18. Milton, G.M., Kramer, S.J., Brown, R.M., Repta, C.J.W.,
King, K.J., Rao, R.R. Radiocarbon dispersion around
Canadian nuclear facilities. Radiocarbon, 37(2): 485-496,
1995.
19. Mikhajlov, N.D., Kolkovsky, V.M., Pavlova, I.D.
Radiocarbon distribution in northwest Belarus near the
Ignalina nuclear power plant. Radiocarbon, 41(1): 75-79,
1999.
20. Ežerinskis, Ž., Šapolaitė, J., Pabedinskas, A., Juodis, L.,
Garbaras, A., Maceika, E., Druteikienė, R., et al. Annual
variations of 14C concentration in the tree rings in the
vicinity of Ignalina Nuclear Power Plant. Radiocarbon,
60(4): 1227-1236, 2018.
21. Magnusson, Å., Stenström, K., Skog, G., Adliene, D.,
Adlys, G., Hellborg, R., Olariu, A., et al. Levels of 14C in
the terrestrial environment in the vicinity of two European
nuclear power plants. Radiocarbon, 46(2): 863-868, 2004.
22. Magnusson, Å., Stenström, K., Adliene, D., Adlys, G.,
Dias, C., Rääf, C., Skog, G., et al. Carbon-14 levels in the
vicinity of the Lithuanian nuclear power plant Ignalina.
Nuclear Instruments and Methods in Physics Research
Section B: Beam Interactions with Materials and Atoms,
259(1): 530-535, 2007.
23. Adliene, D., Rääf, C., Magnusson, Å., Behring, J.,
Zakaria, M., Adlys, G., Skog, G., et al. Assessment of the
environmental contamination with long-lived
radionuclides around an operating RBMK reactor station.
J Environ Radioact, 90(1): 68-77, 2006.
24. Buzinny, M. Radioactive graphite dispersion in the
environment in the vicinity of the Chernobyl Nuclear
Power Plant. Radiocarbon, 48(3): 451-458, 2006.
25. Mikhajlov, N., Kolkovskij, V., Pavlova, I., Luchina, G.
Radiocarbon in elements of the landscape (Belarus).
Geochronometria: Journal on Methods & Applications of
Absolute Chronology, 23, 2004.
26. Levin, I., Kromer, B. The tropospheric 14CO2 level in mid
latitudes of the Northern Hemisphere (1959-2003).
Radiocarbon, 46: 1261-1271, 2004.
27. Wacker, L., Němec, M., Bourquin, J. A revolutionary
graphitisation system: Fully automated, compact and
simple. Nuclear Instruments and Methods in Physics
Research Section B: Beam Interactions with Materials and
Atoms, 268(7): 931-934, 2010.
28. Skog, G., Rundgren, M., Sköld, P. Status of the Single
Stage AMS machine at Lund University after 4 years of
operation. Nuclear Instruments and Methods in Physics
Research Section B: Beam Interactions with Materials and
Atoms, 268(7-8): 895-897, 2010.
29. Skog, G. The single stage AMS machine at Lund
University: Status report. Nuclear Instruments and
Methods in Physics Research Section B: Beam
Interactions with Materials and Atoms, 259(1): 1-6, 2007.
30. ICOS. ICOS ATC 14C release from Hyltemossa 2016-12-
22 – 2019-10-08. https://data.icos-cp.eu/portal/. PID:
11676/WE07MZ3UlYcJau76jaTIW_Sg. ICOS DATA is
licensed under CC4BY
(http://creativecommons.org/licenses/by/4.0/). 2020.
31. Bernhardsson, C., Eriksson Stenström, K., Pedehontaa-
Hiaa, G., Jönsson, M. Radiological environmental
monitoring at the ESS facility – Annual report 2019.
Report MA RADFYS 2020:03, Report BAR-2020/03.
2020.
32. Conen, F., Emmenegger, L., Leuenberger, M., Steger, D.,
Steinbacher, M. "ICOS RI, 2020. ICOS ATC 14C Release,
Jungfraujoch (10.0 m), 2016-01-04_2019-08-12".
hdl.handle.net/11676/X-lXPKZlO4DWX7wncsLQ7akY;
http://calib.org/CALIBomb/. 2019.
33. Levin, I., Kromer, B., Hammer, S. Atmospheric Δ14CO2
trend in Western European background air from 2000 to
2012. Tellus B: Chemical and Physical Meteorology,
65(1): 20092, 2013.
34. Hammer, S., Levin, I. Monthly mean atmospheric D14CO2
at Jungfraujoch and Schauinsland from 1986 to 2016.
heiDATA: Heidelberg Research Data Repository
[Distributor] V2 [Version].
http://dx.doi.org/10.11588/data/10100;
www.calibomb.org. 2017.
137

MEDICAL PHYSICS IN THE BALTIC STATES 15 (2021)
Proceedings of International Conference “Medical Physics 2021”
4-6 November 2021, Kaunas, Lithuania
ACCUMULATION OF 137Сs BY FOREST LICHENS IN THE CHERNOBYL
AFFECTED TERRITORIES
Aliaksandr DVORNIK, Veranika SEHLIN
Institute of Radiobiology of the National Academy of Sciences of Belarus, Gomel, Belarus
[email protected], [email protected]
Abstract: The content of cesium-137 in epiphytic and
epigeous species of lichens collected in the pinewoods
around the Chernobyl Nuclear Power Plant ranges
between 5.6 and 268 kBq per kg depending on the
sampling site. A high positive correlation is shown
between the specific activities of 137Cs in lichens and its
concentrations in pine bark.
Keywords: Lichens, accumulation, biomonitoring,
radioactive contamination, pine forest
1. Introduction
The accident at the Chernobyl Nuclear Power Plant
(ChNPP) of 1986 resulted in more than 1.7 million
hectares of the forest area of Belarus being
contaminated by 137Cs. The most contaminated forest
territories (up to 59.2 MBq m–2 as of 1986) are located
in the 30-km zone around the ChNPP [1].
For a long time now, the properties of lichens as
biomonitors have been used to assess radioactivity in
the environment [2-4]. Lichens are symbiotic organisms
consisting of fungi and algae. The lichen biota is
regarded extremely useful for the purposes of
radioecological monitoring due to their valuable
characteristics: a) widespread occurrence throughout
terrestrial ecosystems on a variety of substrates such as
stones, trees, soils etc.; b) specific anatomical and
morphological structure (i.e. no root system or wax
cuticle) that predetermines their ability to accumulate
different air pollutants; c) high adsorbing capacity of the
entire surface of a vegetative body (thallus) and a long
lifespan due to low metabolic activity and slow growth
rate during the year [2, 5].
A unique accumulative and adsorbent potential of
lichens has predetermined their value for biological
monitoring of contaminants in the environment [5–7].
The study of Handley and Overstreet [8] shows that the
fixation of radiocesium in lichens does not seem to
depend on their physiological activity but occurs mainly
in a passive way. Lichens absorb the bulk of radioactive
substances from aerial deposition, but also have the
ability to accumulate radionuclides from the substrate
(aquatic environment, soil and other surfaces) [9].
In the past 35 years the world has seen at least two
large-scale nuclear disasters – Chernobyl and
Fukushima Daiichi. Lichens have been successfully
tested in some European countries as a tool for
assessing cumulative deposition of long-lived
radionuclides [10, 11]. The Fukushima Daiichi accident
has triggered a new wave of research on the capacity of
lichens to absorb and retain radionuclides [12, 13]. The
common species of lichens used in such studies are
Cladonia spp., Hypogymnia physodes (L.) Nyl.,
Cetraria islandica (L.) Ach., Pseudevernia furfuracea
(L.) Zopf, Parmelia sulcata Taylor, Umbilicaria spp.
etc. [14, 15].
The substrate pH, soil structure, snow coverage and
other environmental conditions can affect the mobility
of radionuclides in the lichen thalli [15, 16]. Some
researchers [17, 18] note the concentrations of 137Cs in
individual lichens may increase over time due to the
washing of this radionuclide off of the tree crowns. This
research paper summarizes the results of our study on 137Cs accumulation in lichens collected in contaminated
pine forests within the 30-km zone around the ChNPP.
2. Material and Methods
2.1. Site and sampling description
Three species of epiphytic and epigeous lichens were
collected from pinewoods in the three sampling sites
inside the 30-km Chernobyl Zone in 2020-2021 (Fig. 1).
This choice was driven by the fact that pine trees cover
more than 60% of the forestland area in the Belarusian
Polesie. The average age of pine trees is 50 ± 5 years. A
summarized description of the sampling sites is
presented in Table 1.
Air dose measurements were taken using portable
dosimeter-radiometers MKS-AT1125A (Atomtex,
Belarus) equipped with a scintillation detector NaI (TI).
In situ measurements were carried out in 5 points in a
138

A. Dvornik, V. Sehlin / Medical Physics in the Baltic States 15 (2021) 138-141
square area of 50×50 meters at a height of 1 m above
the ground. The measurement uncertainty was up to
15%.
Fig. 1. Location of the sampling sites
Table 1. Characteristics of the sampling sites
Location Coordinates
137Cs deposition
density,
kBq m−2
Gamma-dose
rate, μSv h−1
Radin N 51º34.210'
E 30º04.975' 2599.6 ± 94.1 3.2 ± 0.3
Krasnosel’ye N 51°33.872'
E 29°54.453' 1827.2 ± 64.4 1.7 ± 0.2
Lesok N 51º36.211'
E 29º59.054' 1152.8 ± 39.3 1.3 ± 0.2
The samples of lichens were collected in dry weather.
At each location, 5 stand-alone upright pine trees with a
maximum lichen projective cover were selected. The
sampling of epiphytic lichens from a tree stem was done
at a height of 1–1.5 m aboveground. Epigeous species
were collected from the same trees from the sampling
area of 25×25 cm from below the crowns. All sampled
thalli were approximately of the same size and age. The
lichens collected as samples included the following
species: Hypogymniaphysodes (L.) Nyl., Cladonia
rangiferina (L.) Weber ex F.H. Wigg. and C. arbuscula
(Wallr.) Flot. (N = 43).
Radionuclide deposition density in soils was calculated
using a composite sample collected from each site. Soil
samples were taken to a depth of 20 cm using a core
sampler with a diameter of 5cm. Each soil core was split
into layers 1–5 cm deep each (up to maximum depth of
20 cm) using a spatula. Soil samples of the same depth
were then mixed together to acquire the site’s composite
sample.
2.2 Sample preparation and activity measurements
The samples were thoroughly cleaned of any left
adhering substrate, soil particles and other foreign
matter. After cleaning, the samples were first dried at a
room temperature and then homogenized. The activity
concentrations of 137Cs were measured in the air-dried
samples of two geometries – with a diameter of 11 cm
and a height of 8.8 cm (Marinelli beaker, up to 0.5 L in
volume), and with a diameter of 7 cm and a height of
3.2 cm. Each sample was measured three times.
The activity concentration of 137Cs was measured with a
gamma-spectrometer equipped with an HPGe detector
(Canberra DSA-LX, USA). The energy resolution of the
detector was 1.85 keV for 60Co at 1.33 MeV. The
detection efficiency of spectrum for the energy of 1.33
MeV was 23.5%. Measurement errors ranged from 7 to
10% depending on the sample activity. The specific
activity (kBq kg–1) per dry weight was used to estimate
the level of radioactivity in samples.
2.3 Statistical analysis
Statistical analysis of data was performed with the use
of Python libraries for data science such as: NumPy,
Matplotlib and Pandas. The data was described in terms
of range, mean value, standard error and coefficient of
variation. A statistically significant value was p<0.05.
3. Results and Discussion
3.1 Soil deposition density and ambient gamma
radiation levels
As shown in Figure 2, the distribution of cesium in the
soil profile of the sampling site is relatively similar for
all three locations. The soil deposition density ranges
from 610.5 kBq m–2 in Lesok to 2902.3 kBq m–2 in
Radin.
Fig. 2. Vertical distribution of long-lived radionuclides in the
soil profile
The activity of radionuclides in soil decreases with
depth. The highest concentrations of 137Cs, as well as of
the transuranic elements, are in the top 0–5 cm soil
layer. Depending on the site, the fraction of 137Cs in this
layer varies in the range of 58–87%.
The ambient dose rates measured in three locations vary
from 1.1 µSv h–1 in Lesok to 3.2 µSv h–1 in Radin. Both
of the above parameters are well interrelated and show a
positive correlation (Pearson’s r = 0.86, p<0.01, n = 15).
3.2 137Cs activity concentration in the lichen biomass
The values of 137Cs specific activity in the biomass of
Hypogymnia physodes, Cladonia rangiferina and C.
arbuscula are given in Table 2. The specific activity of
cesium varies considerably (from 5.6 to 268.4 kBq kg–1)
in the lichens of different taxonomic groups. The
highest specific activity was measured in Hypogymnia
139

A. Dvornik, V. Sehlin / Medical Physics in the Baltic States 15 (2021) 138-141
physodes from Radin, and the lowest one in Cladonia
rangiferina collected in Krasnosel’ye.
Table 2. Specific activities of 137Cs (kBq kg-1 dry weight)
Location Species
Specific activity of 137Cs, kBq kg-1
mean ± SE CV, %
Radin Hypogymnia physodes
Cladonia rangiferina
139.7±34.2
91.6±36.4
54.7
88.9
Krasnosel'ye
Hypogymnia physodes
Cladonia rangiferina
Cladonia arbuscula
23.3±5.7
13.1±3.2
17.9±3.3
73.8
55.0
31.3
Lesok Hypogymnia physodes
Cladonia rangiferina
36.6±2.2
22.1±1.6
18.6
16.3
The mean values of activity per kg of biomass are
51.8±11.2 kBq kg–1 for Hypogymnia physodes and
42.3±14.7 kBq kg–1 for Cladonia rangiferina. The mean
for C. arbuscula is 17.9±3.3 kBq kg–1. The highest
contaminated lichens were collected in the site of Radin.
A coefficient of variation for the content of 137Cs in the
lichen biomass varies from 16.3 to 88.9%. The largest
variability of values is characteristic to the Radin and
Krasnosel’ye locations ranging from 54.7 to 88.8% and
from 42.2 to 70.3% respectively. This can be explained
by the differences in accumulation capacity of
individual lichens, which may be due to the intensified
impact of multiple factors such as the soil’s
physicochemical characteristics, amounts of
precipitation, periods of heat and drought in different
years etc.
The specific activity of 137Cs in Hypogymnia physodes
is significantly higher than that in other lichen species in
all sampling sites under similar growth and co-habitat
conditions (Fig. 3). The radionuclide content in the
biomass of Hypogymnia physodes and Cladonia lichens
from Radin and Krasnosel’ye is not statistically
different. According to some studies [14], an additional
source of radionuclide contamination in epiphytic
lichens may be the water washed out from the trees and
shrubs.
3.3 Lichens and substrates
The content of 137Cs in the lichen biomass was
compared against its deposition in the substrates, i.e.
pine bark and soil. The accumulation of 137Cs by the
biomass of epiphytic lichens is from 3.4 to 12.5 times
higher than that by the pine bark.
The Pearson’s correlation coefficient shows a strong
relationship between cesium specific activity in the
biomass of Hypogymnia physodes and cesium specific
activity in the bark samples (r = 0.96, p<0.001).
Epiphytic lichens accumulate by up to 12 times more
radiocesium than the pine bark. Similar results were
reported by Biazrov [14], who found that after 2 years
following the ChNPP accident the content of 137Cs in
Hypogymnia physodes and Cladonia species was
several times higher than in the pine bark. The
differences in these parameters can be basically
explained by the differences in the radionuclide
pathways attributable to lichens and trees. While
vegetation accumulates radiocesium owing to its active
root uptake, lichens absorb and retain radionuclides
from atmospheric depositions [19]. The data analysis
shows no strong correlation between the specific
activities of 137Cs in lichens (both epiphytic and
epigeous species) and soil deposition density (r = 0.25).
Fig. 3. Comparison of 137Cs content in different types of
lichens
140

A. Dvornik, V. Sehlin / Medical Physics in the Baltic States 15 (2021) 138-141
4. Conclusion
The scientific data obtained in our study on the
concentrations of man-made radionuclides in forest tree
lichens is meant to provide important information to
make reliable assessments of a radiation situation and
the state of individual environmental components in
radiation and nuclear emergencies. The study shows a
correlation between the accumulation mechanisms of
radioactive pollutants in the thalli of lichens of various
ecological groups. The specific activity of 137Cs varies
greatly in the lichens of different taxonomic groups.
There is no evidence found of the relationship between
soil deposition density and 137Cs activity in the thalli of
lichens. Further research is needed to quantify the
change in bioavailability of radionuclides for lichens.
5. References
1. Izrael Ya.A., Bogdevich I.M. (eds.). The atlas of recent
and predictable aspects of consequences of Chernobyl
accident on polluted territories of Russia and Belarus
(ARPA Russia-Belarus). Moscow-Minsk: Belkartographia
- Foundation “Ionosphere” - NIA-Nature, 2009, 140 p.
2. Seaward M.R.D., Nimis P.L., Scheidegger C., et al.
Lichens as Monitors of Radioelements. Monitoring with
Lichens – Monitoring Lichens. NATO Science Series
(Series IV: Earth and Environmental Sciences), 7, 2002, p.
85–96.
3. Steinnes E., Njaastad O. Use of mosses and lichens for
regional mapping of 137Cs fallout from the Chernobyl
accident. J. Environ. Radioact., 21(1), 1993, p. 65–73.
4. Mattsson L.G. 137Cs in the reindeer lichen Cladonia
alpestris: deposition, retention and internal distribution,
1961–1970. Health Phys., 28(3), 1975, p. 233–248.
5. Nimis P.L. Radiocesium in plants of forest ecosystems.
Studia Geobotanica, 15, 1996, p. 3–49.
6. Dohi T., Ohmura Y., Kashiwadani H., et al. Radiocaesium
activity concentrations in parmelioid lichens within a 60
km radius of the Fukushima Dai-ichi Nuclear Power Plant.
J. Environ. Radioact., 146, 2015, p. 125–133.
7. Nash III T.H. Lichen biology. Cambridge: Cambridge
University Press, 1999, 486 p.
8. Handley R., Overstreet R. Uptake of Carrier-free 137Cs
by Ramalina reticulata. Plant Physiology, 43(9), 1968, p.
1401–1405.
9. Nifontova M.G., Ravinskaya A.P., Shapiro I.A.
Bioaccumulation of radionuclides in lichens and mosses.
Sauteria, 9, 1995, p. 323–329.
10. Puhakainen M., Rahola T., Heikkinen T., et al. 134Cs and 137Cs in lichen (Cladonia stellaris) in southern Finland.
Boreal Environ. Res., 12(1), 2007, p. 29–35.
11. Heinrich G., Oswald K., Müller H.J. Lichens as monitors
of radiocesium and radiostrontium in Austria. J. Environ.
Radioact., 45(1), 1999, p. 13–27.
12. Ramzaev V.P., Barkovsky A.N., Gromov A.V. Temporal
variations of 7Be, 40K, 134Cs and 137Cs in epiphytic lichens
(genus Usnea) at the Sakhalin and Kunashir islands after
the Fukushima accident. Radiation Hygiene, 9(3), 2016, p.
14–27.
13. Conti M.E., Cecchett G. Biological monitoring: lichens as
bioindicators of air pollution assessment – a review.
Environ. Pollut., 114, 2001, p. 471–492.
14. Biazrov L. The Radionuclides in Lichen Thalli in
Chernobyl and East Urals Areas after Nuclear Accidents.
Phyton, 34, 1994, p. 85–94.
15. Pinglot J.F., Pourchet M., Lefauconnier B., et al.
Accumulation in Svalbard glaciers deduced from ice cores
with nuclear tests and Chernobyl reference layers. Polar
Res., 18(2), 1999, p. 315–321.
16. Wallace S.H., Shaw S., Morris K., et al. Effect of
groundwater pH and ionic strength on strontium sorption
in aquifer sediments: implications for 90Sr mobility at
contaminated nuclear sites. Appl. Geochem., 27, 2012,
p. 1482–1491.
17. Sloof J.E., Wolterbeek B.Th. Lichens as biomonitors for
radiocaesium following the Chernobyl accident. J.
Environ. Radioact., 16, 1992, p. 229–242.
18. Heinrich G., Müller H.J., Oswald K. et al. Natural and
artificial radionuclides in selected Styrian soils and plants
before and after the reactor accident in Chernobyl.
Biochem. Physiol., 185, 1989, p. 55–67.
19. Dohi T., Ohmura Y., Yoshimura K., et al. Radiocaesium
accumulation capacity of epiphytic lichens and adjacent
barks collected at the perimeter boundary site of the
Fukushima Dai-ichi Nuclear Power Station. PLoS One,
16(5), 2021, e0251828.
141

MEDICAL PHYSICS IN THE BALTIC STATES 15 (2021)
Proceedings of International Conference “Medical Physics 2021”
4-6 November 2021, Kaunas, Lithuania
EVALUATION OF THE REGION-SPECIFIC RISKS OF ACCIDENTAL
RADIOACTIVE RELEASES FROM THE EUROPEAN SPALLATION SOURCE
Guillaume PÉDEHONTAA-HIAA1,2, Christian BERNHARDSSON1, Vytenis BARKAUSKAS3, Andrius
PUZAS3, Kristina ERIKSSON STENSTRÖM2, Christopher RÄÄF1, Sören MATTSSON1 1 Lund University, Department of Translational Medicine, Medical Radiation Physics, Malmö, Sweden; 2 Lund
University, Department of Physics, Division of Nuclear Physics, Lund, Sweden; 3 Center for Physical Sciences and
Technology, Department of Nuclear Research, Vilnius, Lithuania
[email protected], [email protected], [email protected],
[email protected], [email protected], [email protected], [email protected]
Abstract: The European Spallation Source (ESS) is a
neutron research facility under construction in southern
Sweden. The facility will produce a wide range of
radionuclides that could be released into the
environment. Some radionuclides are of particular
concern such as the rare earth gadolinium-148. In this
article, the local environment was investigated in terms
of food production and rare earth element concentration
in soil. The collected data will later be used to model the
transfer of radioactive contaminations from the ESS.
Keywords: Environmental radiology, Environmental
monitoring, Emergency preparedness, Analytical
chemistry, ICP-MS
1. Introduction
The European Spallation Source (ESS) is a research
facility currently under construction near the city centre
of Lund, in south-western Sweden. In the upcoming
years, the facility will produce powerful neutron beams
for applications e.g. in material science and biology.
The neutrons will be produced via spallation, using a 5
MW proton accelerator irradiating a tungsten target. A
wide range of radionuclides will be generated as by-
products from nuclear reactions in the tungsten target,
but also through activation of air, construction details,
building materials and surrounding soil.
The experience from operation of high-power spallation
sources like ESS is limited and some knowledge gaps
exist regarding the consequences of radioactive releases
from the facility into the environment. These releases
may happen during normal or maintenance operations
and also during potential incidents or accidents. Some
of the irradiated target material may end up in the soil,
water, and plants and eventually reach the human food
chain.
The proton irradiation of the tungsten target will
generate radio-isotopes of W, Ta, Hf, Lu, Yb, Tm, Er,
Ho, Dy, Tb, Gd, Eu, Sm and Pm. A list of the
radionuclides that will contribute the most to the
radiation exposure of man in case of an accidental
release has been established by the regulating authority
(the Swedish Radiation Safety Authority, SSM). Among
them, the alpha-emitter 148Gd is of particular concern
due to its long physical half-life of 75 years. There are
also technical difficulties of its measurement. Moreover,
discrepancies exist between models regarding the
amounts that will be produced by the ESS. Barkauskas
et al. [1] and Kókai et al. [2] estimate its production to
be an order of magnitude higher than the estimation of
the ESS Preliminary Safety Analysis Report from [3]
and Mora et al. [4].
Gadolinium (Gd) belongs to the group of rare earth
elements (REEs) which is composed of the scandium,
yttrium and the lanthanide series. Its abundance is of 6.1
ppm in surface soils on the Earth’s crust [5]. Modern
pollution by stable isotopes of Gd comes from several
sources. The increasing concentration of Gd in aquatic
ecosystems is due to its use in contrast agents injected to
patients before Magnetic Resonances Imagining (MRI)
examinations. Once excreted by the body, the contrast
agents end up in the waste-water system from which
they are spread in the environment. Soil contamination
occurs in REE mining areas or is due to the use of REEs
as fertilisers [6].
Mathematical models are powerful tools to evaluate or
anticipate the transfer of radioactive contamination [7].
However, in the case of exotic radionuclides such as 148Gd, there is a lack of reference values to build such
models since it is not found in nature or produced by
more conventional nuclear facilities. In the case of the
ESS-specific radioactive REEs, one possibility to
provide data to such models is the use of data from
analogues which can be stable isotopes of the same
142

G. Pédehontaa-Hiaa et al. / Medical Physics in the Baltic States 15 (2021) 142-146
elements or of elements with similar chemical
properties (e.g. La for Gd). One of the most widely used
technique to investigate REEs is inductively coupled
plasma mass spectrometry (ICP-MS). Depending on the
type of instrument, the technique can determine the
concentration of all the stable elements of the REE
series or, after sample purification, the isotopic
composition of a single element with very low detection
limits.
In this study, we investigated the food production
around ESS in order to increase the knowledge of the
local environment and transfer of REEs from to soil to
the human food chain. Soil samples were collected
around the ESS, chemically extracted and analysed by
ICP-MS to determine their REE levels. The collected
data can later be used to build models of radioactive
REE transfer in the environment.
2. Material and method
2.1. Sample selection
Four samples consisting of 20-centimeter-deep top soil
cores were selected among a bank of samples previously
collected around the facility [8]. The location of the
sample sites is presented in Figure 1. A reference
sample of estuarine sediment with certified values of
REEs (BCR-667, JRC, IRMM) was also analysed for
validation purposes.
Fig. 1. Maps of the ESS location in the southern Baltic region
(top) and of sampling locations around the ESS (bottom)
2.2. Pseudo-total extraction
The pseudo-total extractions were performed by mixing
0.25 g of each soil sample with aqua regia at 60°C for 6
h. The samples were then centrifuged and filtered. The
filtrate was evaporated to dryness at 80°C and
redissolved in 2% nitric acid before analysis by ICP-
MS.
2.3. Sequential extraction
Two sequential extraction procedures were performed
based on the methods described by Wiche et al. [9] and
Mittermüller et al. [10]. All the required reagents were
purchased from VWR.
The selected samples were first extracted sequentially
based on Wiche et al. [9] method, composed of 5
different steps: mobile exchangeable soluble materials
(1 M ammonium acetate pH = 7), acid soluble elements
(1 M acetate buffer pH = 5), element bound to
oxidisable matter (acetate buffer pH = 5 + oxygen
peroxide at 45°C), non-crystalline fractions, Fe-, Mn-,
Al-oxide (0.2 M ammonium oxalate pH = 3.2),
crystalline Fe-, Mn-sesquioxides (0.2 M ammonium
oxalate + 0.1 M ascorbic acid, 45°C).
Different aliquots of each soil sample were extracted
according to the method developed by Mittermüller et
al. [10], composed of 4 steps: easily soluble and ion
exchangeable (0.05 M calcium nitrate), carbonate bound
and mobilised by complexation (0.1 M citric acid),
reducible fraction (0.5 M hydroxylamine hydrochloride
pH = 2 or 0.1 M nitric acid), acid soluble fraction (1.4
M nitric acid).
Those extraction methods were compared to a pseudo-
total extraction with aqua regia (aqua regia 60°C to
dryness and redissolved in 2% nitric acid).
The extracted fractions were diluted 10 to 50 times in
2% nitric acid and measured by ICP-MS on a Bruker
Aurora Elite instrument at the Geology Department of
Lund University. The instrument was calibrated using a
diluted REE solution (Rare earth element mix for ICP,
16 elements, TraceCERT®, Supelco®). The following
nuclides were measured: 45Sc, 89 Y, 139La, 140Ce, 141Pr, 146Nd, 148Nd, 147Sm, 153Eu, 157Gd, 159Tb, 163Dy, 165Ho, 166Er, 169Tm, 172Yb, 175Lu. The concentration
calculations for each element were performed assuming
their respective isotopes were present in the sample at
their natural abundance.
3. Evaluation of the food production around the ESS
After an accidental release, particles of irradiated target
material would be deposited on the soil and plants
around the ESS. The uptake of these radionuclides by
the plants and animals that are part of the food chain
could later lead to human contamination. To identify the
important transfer pathways, the current food
production and the risk groups in case of a severe
accident, the area has been surveyed by maps and visits
on site. A questionnaire has also been sent to some key
persons and organisations that are representative of the
farming activities and local population. The questions
were related to the food production (e.g. what, how
much, where, end consumer), animal husbandry and
hunting.
The environment around ESS in the northern part of
Lund is dominated by arable lands, which are classified
8-10 on a ten graded scale of the lands yield capacity
[11]. These uniquely fertile soils are mainly found in
southwest Scania. Although all the local food producers
have not been identified, the survey provides a
representative picture of what is regularly grown in the
area, with the main producers in year 2020 included.
143

G. Pédehontaa-Hiaa et al. / Medical Physics in the Baltic States 15 (2021) 142-146
The largest estate is about 1500 ha (1 ha = 104 m2) of
farming land that apply crop rotation of wheat, barley,
rape and small amounts of corn. The majority of what is
produced is sold as agricultural seeds. Cultivation of
sugar beets is planned to replace the corn in the coming
years. The second largest farmer in the area operates
about 270 ha of fields cultivating various crops, peas
and sugar beets that are sold for food production. An
additional 43 ha area of farmlands belongs to a third
farmer. This land is used for food production and apply
crop rotation of similar species. Finally, an apple and
pear orchard of about 12 000 trees is distributed over
3.24 ha, plus some 100 trees with pears.
Today, there are a limited number of private dwellings
within a radius of about 1.5 to 2.5 km from ESS, with
the small village of Östra Odarslöv (18 ha and 70
inhabitants in 2015 [12]) in the northeast direction from
ESS. Theses private dwellings all have garden plots
with home-cultivated vegetables and fruits. The
residents will be of particular interest in defining the
representative group of people around the ESS for
whom accurate dose estimates must be made. The area
is expanding and more inhabitants are expected in the
future when ESS is in operation. A 20 ha area named
Science Village is planned to be built in-between the
two research activities MAX IV and ESS and will hold
facilities such as University departments, guest houses,
restaurants and other services. This area will also
include a park and about 2 ha of land used for urban
community farming. Together with current and future
farming in the area, this is important for the next steps:
the determination of specific transfer and uptake factors,
of the area specific plants and soils, of REEs and in
particular gadolinium.
The main identified crops in 2020 were: wheat, barely,
rape, malt grains, sugar beets, peas and apples. Limited
amount of corn was grown in 2020 but this production
will be exchanged to sugar beets in the future. It can be
noted that the majority of the agricultural production is
currently not sold for food production but as seeds.
Regarding animal product consumption, the interviews
revealed the presence of one team of hunters in the area
(mainly deer and rabbit hunting). Bees are kept by
private owners, at the apple orchard and at the research
facility MAX IV for pollination of nearby fields and
production of honey. The south-eastern part of the area
is used for grazing by cattle.
Based on this survey some key potential pathways for
transfer of ESS radioactive material from plant to man
have been identified. Table 1 summarises the main
foodstuff produced in the area and provides references
from the literature that could be used to build transfer
models. It is worth noticing that, to our knowledge, the
behaviour and concentration of REEs have not been
studied in some of the species of interest.
4. Experimental results
4.1 Pseudo-total extraction
The range of values obtained by pseudo-total extraction
of the four ESS soil samples are presented in the Table
2. These results were compared to another available set
of topsoil data obtained from forest soil from southern
Sweden by Tyler and Olsson [19] (also presented in
Table 2).
Table 2. Existing data of REE in foodstuff grown around the
ESS facility
Foodstuff
grown near ESS
Articles of REE in
foodstuff Reference
Wheat D’Aquino et al. (2009);
Ding et al (2005) [13], [14]
Barley Wiche et al. (2017) [9]
Rapeseed Wiche et al. (2017),El-
Ramady (2008) [9], [15]
Corn
Wiche et al. (2017); El-
Rhamady (2008);
Diatloff et al. (1995)
[9], [15],
[16]
Apples Sager et al. (2015) [17]
Honey Squadrone et al. (2020) [18]
Green peas No data
Sugar beet No data
Table 2. REE concentration range extracted by aqua regia in
ESS soil samples (mg kg-1) compared to a local forest soil
Element ESS soil sample
(N = 4)
Scanian forest soil Tyler and Olsson [19]
Scandium (Sc) 1.94-3.44 0.92-5.16
Yttrium (Y) 6.57-10.32 4.9-17.6
Lanthanum (La) 13.14-19.03 5.5-33.2
Cerium (Ce) 27.97-39.19 11-68
Praseodymium (Pr) 3.18-4.86 1.3-7.5
Neodymium (Nd) 11.66-18.43 9.3-53
Samarium (Sm) 2.13-3.46 0.9-4.6
Europium (Eu) 0.35-0.57 0.22-0.83
Gadolinium (Gd) 1.95-3.04 1.0-4.8
Terbium (Tb) 0.27-0.42 0.15-0.65
Dysprosium (Dy) 1.29-2.04 0.9-3.7
Holmium (Ho) 0.24-0.38 0.20-0.74
Erbium (Er) 0.66-1.07 0.63-2.2
Thulium (Tm) 0.08-0.14 0.09-0.33
Ytterbium (Yb) 0.51-0.84 0.60-2.3
Lutetium (Lu) 0.07-0.12 0.09-0.34
4.2 Sequential extraction
The purpose of extracting REEs sequentially is to obtain
more precise information on the fractionation of these
elements in the different types of minerals contained in
a soil sample. In the different methods, the sample
treatment goes from the softest conditions that extract
easily soluble or exchange species toward harder
conditions able to dissolve crystallised metal oxides for
example.
Figure 2 shows the results of the ICP-MS measurements
obtained on one of the four samples extracted
sequentially by two methods. Each bar represents one
REE and each segment represents the amount of REE
extracted during a step of the procedure compared to the
total amount obtained by pseudo-total extraction. The
extraction percentages vary from sample to sample but
similar trends were observed on all samples.
144

G. Pédehontaa-Hiaa et al. / Medical Physics in the Baltic States 15 (2021) 142-146
a)
b)
Fig. 2. Example of sequential extraction of REE in ESS soil
samples according to the methods by a) Wiche et al. [9], and
b) Mittermüller et al. [10]
The 5-step method extracted 30 to 60% of the amount of
REEs extracted by the pseudo-total extraction which is
consistent with results obtained by the authors of the
method [9]. Less than 10% of the REE content is
extracted by the three first steps. The third step is the
most efficient with an increasing from the lighter REEs
to the heavier ones (from 20% up to 45%). The last step
adds 15 to 20% to the sum.
The 4-step method extracted a more variable amount of
REEs going from 35 to 90% depending on the element
and sample. The obtained results were occasionally
higher than those from the original article [10]. The first
step extracted only a few percent of the total amount.
The efficiency of the second step increased with the
REE weight from 15-25% of La and up to 55% of Lu.
The third and fourth steps add additional 5 to 45%.
In both cases, the Sc and Y behaviours differ from the
rest of the series with a low extraction yield of Sc (only
10 to 40%) and a high extraction yield of Y (more than
50 to 80%).
5. Discussion
All REE concentrations measured in the soils collected
around the ESS were in the range observed in the
southern Sweden forest soils [19] with the exception of
the lowest values of Tm, Yb and Lu which are slightly
lower. Since no significant REE excesses were detected
in the cultivated soil compared to the forest soil, it
seems that the current agricultural practices in the
surroundings of the ESS do not increase the REE
content of the soils.
The most efficient steps of both REE sequential
extraction methods were based on complexing agents,
namely oxalates and citric acid. This extraction process
can be performed by plants [10]. Thus, a large fraction
of the REE content on the soils near ESS is bioavailable
and additional REE released by the facility could also
be transferred to plants by the same process. The results
obtained indicate that extraction methods based on
complexing agents seem to be a very promising way to
assess the bioavailable fraction of REEs in soils and
thus to produce experimental data to build models that
would be specific to the local environment.
The soils around the ESS are not currently presenting
anomalous levels of any REEs compared to non-
contaminated soils samples. Sequential extraction of
REEs could also provide information about the nature of
a contamination and its evolution in time by looking at
the modification of the REE fractionation in soil. Such
experiments could indicate if the contamination is easily
soluble or bound to organic materials or certain minerals
as it was done with radiocaesium after nuclear accidents
[20].
Currently, there is no 148Gd in the ESS surroundings.
However, two isotopes of mass 148 can be found in soil
samples: the stable 148Nd (5.76% natural abundance)
and the very long lived 148Sm (t1/2 = 7 x 10¹⁵ y; 11.2%
abundancy). In case of an accidental release of ESS
target material, 148Gd would be introduced in the local
environment together with other shorter lived
radionuclides, namely 148mPm (t1/2 = 41.3 d) and 148Eu
(t1/2 = 54.5 d) as well as other stable isotopes of this
mass not included in the modelled target compositions
[21]. In the presented REE measurements, the
concentration of Nd was calculated based on the 146Nd
signal or based on the 148Nd signal corrected for 148Sm.
No significant differences were observed between these
two calculation methods suggesting that the current
levels of 148Nd and 148Sm are found at their expected
natural abundancy in the ESS soils.
6. Conclusion
In order to build mathematical models for the transfer of
releases of radioactive REEs from the ESS to the local
environment, it is necessary to produce additional
experimental data. In this work, the plant and animal
species that are relevant for transfer to the human food
chain were identified.
The current levels of stable REEs in top soils collected
around the facility were also investigated. Results of
ICP-MS measurements show no current anomalous
REE levels compared to forest soils from the same
region. It indicates that the REE levels in the area have
not been affected by agricultural practices or research
and hospital discharges. Additional measurements of
neodymium and samarium isotopes seem to confirm
that the REEs currently are at their expected natural
abundance. Sequential extractions performed on those
soil samples revealed that a large fraction of the current
REEs is bioavailable since the main extraction
mechanism is complexation.
Future work in the scope of the present study will
include the measurement of other elements of interest in
soil such as tungsten or hafnium. The measurement of
traces of REEs and other relevant metals in the locally
grown plant species will also contribute to the
elaboration of ESS-specific transfer models. The
0
20
40
60
80
100
Sc Y La Ce Pr Nd Sm Eu Gd Tb Dy Ho Er Tm Yb Lu
% o
f extr
action
REE
Fraction 1 Fraction 2 Fraction 3 Fraction 4 Fraction 5
0
20
40
60
80
100
Sc Y La Ce Pr Nd Sm Eu Gd Tb Dy Ho Er Tm Yb Lu
% o
f etr
action
REE
Fraction 1 Fraction 2 Fraction 3 Fraction 4
145

G. Pédehontaa-Hiaa et al. / Medical Physics in the Baltic States 15 (2021) 142-146
analysis of artificially contaminated soils and plants will
also be considered.
Acknowledgments
This work was financed by the Swedish Radiation
Safety Authority (Strålsäkerhetsmyndigheten), grant SSM2019-1010. The authors also thank Thomas Naeraa
(Geology Department, Lund University) for his help
with ICP-MS measurements.
7. References
1. V. Barkauskas and K. E. Stenström Eriksson, ‘Prediction
of the radionuclide inventory in the European Spallation
Source target using FLUKA’, Nucl. Instrum. Methods
Phys. Res. B, vol. Accepted for publication.
2. Z. Kókai et al., ‘Comparison of different target material
options for the European Spallation Source based on
certain aspects related to the final disposal’, Nuclear
Instruments and Methods in Physics Research Section B:
Beam Interactions with Materials and Atoms, vol. 416,
pp. 1–8, Feb. 2018, doi: 10.1016/j.nimb.2017.11.027.
3. ESS, ‘ESS Preliminary Safety Analysis Report’, 2012.
4. T. Mora et al., ‘An evaluation of activation and radiation
damage effects for the European Spallation Source
Target’, Journal of Nuclear Science and Technology, vol.
55, no. 5, pp. 548–558, May 2018, doi:
10.1080/00223131.2017.1417173.
5. G. Tyler, ‘Rare earth elements in soil and plant systems -
A review’, Plant Soil, vol. 267, no. 1, pp. 191–206, Dec.
2004, doi: 10.1007/s11104-005-4888-2.
6. T. Liang, K. Li, and L. Wang, ‘State of rare earth
elements in different environmental components in
mining areas of China’, Environ Monit Assess, vol. 186,
no. 3, pp. 1499–1513, Mar. 2014, doi: 10.1007/s10661-
013-3469-8.
7. IAEA, ‘Safety Reports Series No.19: Generic Models for
Use in Assessing the Impact of Discharges of
Radioactive Substances to the Environment’, IAEA,
Text, Feb. 2019. Accessed: Nov. 02, 2020. Online..
Available:
https://www.iaea.org/publications/6024/generic-models-
for-use-in-assessing-the-impact-of-discharges-of-
radioactive-substances-to-the-environment
8. C. Bernhardsson et al., ‘Assessment of “Zero Point”
radiation around the ESS facility’, Lund University, MA
RADFYS 2018:01, BAR-2018/04, 2019.
9. O. Wiche, V. Zertani, W. Hentschel, R. Achtziger, and P.
Midula, ‘Germanium and rare earth elements in topsoil
and soil-grown plants on different land use types in the
mining area of Freiberg (Germany)’, Journal of
Geochemical Exploration, vol. 175, pp. 120–129, Apr.
2017, doi: 10.1016/j.gexplo.2017.01.008.
10. M. Mittermüller, J. Saatz, and B. Daus, ‘A sequential
extraction procedure to evaluate the mobilization
behavior of rare earth elements in soils and tailings
materials’, Chemosphere, vol. 147, pp. 155–162, Mar.
2016, doi: 10.1016/j.chemosphere.2015.12.101.
11. Länsstyrelse Skåne, ‘Lunds kommun’.
https://www.lansstyrelsen.se/skane/besoksmal/kulturmilj
oprogram/oversiktliga-beskrivningar/oversiktliga-
kommunbeskrivningar/lund.html (accessed Feb. 16,
2021).
12. ‘Småorter; arealer, befolkning’, Statistiska Centralbyrån.
http://www.scb.se/hitta-statistik/statistik-efter-
amne/miljo/markanvandning/smaorter-arealer-
befolkning/ (accessed Feb. 16, 2021).
13. L. d’Aquino et al., ‘Effect of some rare earth elements on
the growth and lanthanide accumulation in different
Trichoderma strains’, Soil Biology and Biochemistry,
vol. 41, no. 12, pp. 2406–2413, Dec. 2009, doi:
10.1016/j.soilbio.2009.08.012.
14. S. Ding, T. Liang, C. Zhang, J. Yan, and Z. Zhang,
‘Accumulation and fractionation of rare earth elements
(REEs) in wheat: controlled by phosphate precipitation,
cell wall absorption and solution complexation’, J Exp
Bot, vol. 56, no. 420, pp. 2765–2775, Oct. 2005, doi:
10.1093/jxb/eri270.
15. H. El-Ramady, ‘Contribution on the bio-actions of rare
earth elements in the soil/plant environmentA’, Aug.
2008, doi: 10.24355/dbbs.084-200809090200-3.
16. E. Diatloff, F. W. Smith, and C. J. Asher, ‘Rare earth
elements and plant growth: I. Effects of lanthanum and
cerium on root elongation of corn and mungbean.:
Journal of Plant Nutrition: Vol 18, No 10’, Journal of
Plant Nutrition, vol. 18, no. 10, 1995, doi:
10.1080/01904169509365037.
17. M. Sager and A. Spornberger, ‘Main and trace elements
in fruit and leaves of apples grown on various
rootstocks.’, Mitteilungen Klosterneuburg, Rebe und
Wein, Obstbau und Früchteverwertung, vol. 65, no. 4,
pp. 250–275, 2015.
18. S. Squadrone et al., ‘Trace elements and rare earth
elements in honeys from the Balkans, Kazakhstan, Italy,
South America, and Tanzania’, Environ Sci Pollut Res,
vol. 27, no. 11, pp. 12646–12657, Apr. 2020, doi:
10.1007/s11356-020-07792-7.
19. G. Tyler and T. Olsson, ‘Conditions related to solubility
of rare and minor elements in forest soils’, Journal of
Plant Nutrition and Soil Science, vol. 165, no. 5, pp.
594–601, 2002, doi: 10.1002/1522-
2624(200210)165:5<594::AID-JPLN594>3.0.CO;2-K.
20. K. Fujii, S. Ikeda, A. Akama, M. Komatsu, M.
Takahashi, and S. Kaneko, ‘Vertical migration of
radiocesium and clay mineral composition in five forest
soils contaminated by the Fukushima nuclear accident’,
Soil Science and Plant Nutrition, vol. 60, no. 6, pp. 751–
764, Nov. 2014, doi: 10.1080/00380768.2014.926781.
21. K. Oishi et al., ‘Measurement and analysis of induced
activities in concrete irradiated using high-energy
neutrons at KENS neutron spallation source facility’,
Radiation Protection Dosimetry, vol. 115, no. 1–4, pp.
623–629, Dec. 2005, doi: 10.1093/rpd/nci165.
146

MEDICAL PHYSICS IN THE BALTIC STATES 15 (2021)
Proceedings of International Conference “Medical Physics 2021”
4-6 November 2021, Kaunas, Lithuania
BACK TO THE FUTURE: THE POSITIVE EDUCATIONAL IMPACT OF COVID-19
PANDEMIC WITH ONLINE LEARNING PROGRAM INTO CLINIC
Nur KODALOĞLU, Can AZAK, Sezai Güçlü KILIÇOĞLU, Tuğba ULU, Gizem KAVAK EREN, Hasan
ÇAMLICALI, Ebru KARAKAYA
Dr. Abdurrahman Yurtaslan Ankara Oncology Research and Training Hospital
Abstract: COVID-19 pandemic has accelerated online
meetings worldwide. In this research, we tried to
evaluate the impact of both radiotherapy physics online
lectures and the patient related online meetings on
residents’ education in pandemic period.
Keywords: Radiotherapy, COVID-19, pandemic,
online education.
1. Introduction
In our Radiation Oncology Clinic, there are 5 residents
(2 – 4.5 year-experienced). Since 5th Jan 2021 they
(besides many radiation oncologists) attended online
radiotherapy physics once a week (20 weeks) for 90
minutes in which the schedule includes not only basic
knowledge like atomic structures, radioactivity,
interactions with ionizing radiation, radiation dose
units, but also details of radiotherapy techniques and
related phenomena like LET, RBE, radiotherapy
machines (external and superficial), linacs, radiation
dosimetry, treatment planning algorithms, 3D-
Conformal RT, IMRT, Cranial SRS, SBRT,
TBI&TSEI, brachytherapy, nuclear medicine, radiation
protection etc. In 9th and 19th weeks they took exams
of 40 questions. Besides, they attended national weekly
meetings on case based discussions such as
gastrointestinal, head and neck, breast, cranial,
gynaecology, lung, genitourinary tumors, SBRT,
contouring lectures, also with worldwide well known
guest lecturers about new technologies and presented
articles and seminars.
On the other hand, the flexible shifts of the radiation
oncologists lead in the changes of the responsibilities
of the residents. These changes also had many
advantages and disadvantages to the residents. So, they
evaluated the changes marking from 1 to 10 in the
survey taking into account before and after the online
education period since the beginning of the pandemic.
2. Online Radiotherapy Physics Course Content
Turkish Society for Radiation Oncology organized a
20-week online radiotherapy physics course (1).
Residents, specialists or academics were invited to take
these lectures. Each lecture was 90 minutes. After the
first lecture on 5th January 2021, on 9th and 19th weeks
of the schedule, participants took exams of 40
questions. The content of the course can be seen below.
Historical development of radiotherapy,
What should a radiation oncologist know about
radiation physics?
How to set up a radiotherapy center?
Atomic structure and nuclear sciences radioactivity,
The concept of ionizing radiation and the
acquisition of X-rays,
Interaction of ionizing radiation with matter,
Radiation dose units,
Radiation attenuation and LET,
External radiotherapy devices containing
radionuclide,
Surface X-ray and electron devices,
Structure of linear accelerators,
Modern accelerators used in radiotherapy,
Radiation dosimetry,
Clinical dosimetry and dosimetry equipment,
Factors affecting radiation dose distribution: in the
device and in the air,
Factors affecting radiation dose distribution: in the
patient,
Fundamentals of computerized planning,
Computerized planning software and calculation
algorithms,
3D-Conformal radiotherapy: basis and treatment
planning,
3D-Conformal radiotherapy: evaluation of
treatment plans,
147

N. Kodaloğlu et al. / Medical Physics in the Baltic States 15 (2021) 147-149
IMRT: The foundation and concept of inverse
planning,
IMRT: Dose prescribing and evaluation of
treatment plans,
Cranial SRS,
SBRT,
Treatment with electrons,
TBI & TSEI,
Fundamentals of brachytherapy physics modern
brachytherapy equipment,
Brachytherapy techniques,
Brachytherapy: QA and safety,
Radiation Safety,
Radiation Accidents,
Nuclear Medicine Physics and Radionuclides used,
Radiopharmacy and Theranostic approach,
Panel: The future of radiotherapy.
3. Online Radiation Oncology Course Content
Turkish Society for Radiation Oncology organized
another educational programme for cancer types and
case meetings for 20 weeks (1). The content of the
programme (excluding the monthly invited speakers
for specific topics) is given below (1).
Case Meeting,
Literature Hour,
Artificial Intelligence Applications,
Pediatric Neuro-oncology Course,
Neurooncology Case Meeting (Adult SNS
Tumors),
Pediatric Wilms, RMS, Neuroblastoma Course,
Sarcoma Meeting (Soft Tissue Sarcomas),
Radiobiology Courses (5 weeks),
Head and Neck Tumors (Nasopharynx and
Oropharynx with Cases),
Urooncology Meeting (Bladder cancer),
Concomitant Immunotherapy and Radiotherapy,
Brachytherapy,
Concurrent Targeted Therapies and Radiotherapy.
Apart from these case councils organized by Turkish
Society for Radiation Oncology, there have been many
case meetings organized by other organizations and
societies i.e. gynaecology, thoracic surgery, urology
etc.
A different educational programme was organized to
be done in the clinic. Considering each of these
different schedules boosted the educational input
compared to the years before the pandemic.
4. Implementing the Survey
Increasing the both the contents and number of online
lectures has made changes (2). To evaluate these
changes, we composed a survey. 5 residents took this
10-sentence survey. They marked each sentence
considering before and after the online courses. The
survey and the marks can be seen in Table 1. They
evaluated the change of their knowledge by
considering before and after the online lectures via
scoring with a minimum of 1 and a maximum of 10.
5. Results
The self-evaluation survey results were analyzed by
using Wilcoxon test to observe the differences between
before and after the online education. Significant
differences (p<0.005) were found after the online
education period.
Table 1. The questions asked to the residents in the survey.
Before Online
Education
After Online
Education
There are more external beam radiotherapy devices with different specialties than I
thought.
12 41
I have really learned the details about the physical principles on which linac works. 24 42
gained an appreciation of how physics rules play a central role in designing the
patient treatment in term of choosing electron, photon or different modalities.
17 43
Visualising beam shaping/modulating devices (jaw, MLCs, wedges, angles etc.)
even during contouring.
23 40
Learning the details of the philosophy of physics has broaden our horizons while
designing a new research project.
22 37
I realized that I have known very few about radition protection concept previously. 21 44
It created awareness that strict rules of the working mechanism in the
brachytherapy operating room should be settled.
20 39
Accesibility and easier contactability with the more experienced oncologists to
consult different case scenarios via online meetings.
18 40
Despite the fact that the responsibilities of the residents increased due to decrease in
the number of rad.oncologists, online educational systems helped residents to balance
both clinical and educational workload.
19 41
I can evaluate treatment plans (DVHs) better. 21 38
148

N. Kodaloğlu et al. / Medical Physics in the Baltic States 15 (2021) 147-149
6. Conclusions
Online education created dramatic contributions on
extending the vision of the attendees in terms of both
theoretical and practical applications into the clinic.
While online meetings facilitate the participation of
many people in more meetings in a shorter period, it
also increases the interactivity in these meetings. It’s
also observed that the elderly radiation oncologists
overcome their prejudices and reduce their distances
from new technologies. Besides, it is stated that they
acquire technological habits that cannot be created for
other reasons and enjoy the convenience of online
meetings (Zoom, Webex etc.)
Contouring courses (mostly on whole weekends) which
used to be organized in different cities cost remarkable
amounts considering transportation and
accommodation taking into account the annual
educational schedule. Contouring courses also evolved
to a new three step system including pre-course real
case contouring assignments, online theoretical
information and discussion part during the course and
attendee specific contouring assignment feedback
discussion after the online session. Hence, not only in
terms of saving the costs for the attendees, attendee
specific feedbacks and discussions made the new
system superior.
For different cancer types, council nights were
organized to discuss cases with professors from
different fields such as radiation oncology, medical
oncology, pathology, surgery, gynaecology, radiology,
nuclear medicine etc. During these online councils
each attendee (i.e. resident, specialist, academician
etc.) was able to discuss their own cases in details.
These interactions with experienced professionals,
reduced the problems on making decisions of the
participants on difficult cases they face in their daily
routines.
Following new techniques and approaches or
networking is a remarkable outcome of the traditional
congresses. While experienced and respectable names
from authorities (AAPM, ESTRO, ASTRO etc.) are
invited to such congresses, it is easier to reach more
professionals from these organizations more frequently
in online trainings and to have chance to discuss with
them.
In conclusion, online educational programmes during
the pandemic improved not only the interest and
updated knowledge in radiation oncology but also
interactions among both radiation oncologists and
residents.
7. References
1. Turkish Society for Radiation Oncology (2021).
“Radyoterapi Fiziği Uzaktan Eğitim Programı [online].
Website:
https://www.trod.org.tr/app_society_educational_progra
m?id=1 [accessed 17 February 2021].
2. Sandhu N, Frank J, Eyben R, Miller J, Obeid J.P,
Kastelowitz N, Panjwani N, Soltys S, Bagshaw H.P,
Donaldson S.S, Horst K, Beadle B.M, Chang D.T, Gibbs
I.C, Pollom E. Virtual Radiation Oncology Clerkship
During the COVID-19 Pandemic and Beyond.
International Journal of Radiation Oncology Biology
Physics, 2020;108: p 444-451.
149

MEDICAL PHYSICS IN THE BALTIC STATES 15 (2021)
Proceedings of International Conference “Medical Physics 2021”
4-6 November 2021, Kaunas, Lithuania
IONIZING RADIATION INDUCED COLOUR CHANGES IN HYDROGELS
Aurimas PLAGA, Ignas PIKAS, Judita PUIŠO, Jurgita LAURIKAITIENĖ, Diana ADLIENĖ
Department of Physics of Kaunas University of Technology
[email protected]; [email protected]; [email protected]
Abstract: It has been determined that the fingertips of
nuclear medicine workers receive higher radiation doses
than it is measured by worn TLD rings. This increases
the potential radiation risks to a worker’s wellbeing.
There is a need for improving dose assessment
capabilities to be able to protect hands of nuclear
medicine staff from overexposure. Attaching of
standard TLDs to the fingertips may disturb the hand’s
functionality, thus requiring longer time per procedure
which in turn may lead to the higher exposure doses.
Attachment of coloured radiation sensitive hydrogel
films to the gloves of workers could be an elegant
solution of the problem if the hydrogels are sensitive
enough to change their colour due to low dose
irradiation.
The aim of this work was to explore four different
organic dyes admixed to hydrogels and to investigate
their response (colour changes) to the irradiation dose.
Keywords: nuclear medicine staff, exposure, coloured
hydrogels; dosimetry.
1. Introduction
Ionizing radiation is commonly used for diagnosis and
treatment of various diseases. Nuclear medicine is a
field where ionizing radiation from radionuclides
/radiopharmaceuticals is used for medical purposes
These radiopharmaceuticals can enter the patient’s body
through the airways (inhalation), orally (by swallowing)
or by administering the required amount via injection,
all depending on the organ or anatomical area to be
diagnosed [1]. While working with these radioactive
substances, it is imperative to reduce the amount of
exposure to radiation that nuclear medicine specialists
receive during treatment procedures.
The doses accumulated by occupationally exposed
workers are limited. Reference dose levels for
specialists working with ionizing radiation sources are
regulated by national and international legal acts and
reference papers. It is established that the exposure of
the whole body of a worker may not exceed 20mSv per
year, and the exposure of the extremities - 500mSv [2].
A relatively high dose is received by the hands of
specialists working with radiopharmaceuticals. Despite
the fact that the exposure levels usually do not exceed
the recommended annual limits, the risk of developing
radiation-induced cancer still exists and it increases
with exposure [3]. This risk can be reduced by
optimizing the use of protective measures to shield a
physician ‘s hands from ionizing radiation and with
precisely monitored exposure.
Normally, the exposure of radiation that a physician
receives to his/her extremities is measured using
thermoluminescent dosimeters (TLD) built into special
rings worn on the middle finger of the hand [4]. This
dose has long been considered the standard extremity
exposure dose, but recent studies have shown that the
dose measured by a dosimetric ring does not correlate to
the true dose received by the fingertips. A recent study
which was analysing the doses of occupationally
exposed workers (2059 TLD measurements) indicated
that while Hp(10) doses never exceeded the annual
dose limit of 20 mSv as well as doses to hands
(measured using TLD rings) never exceeded 500 mSv
limit and were showing a decreasing tendency through
the years, doses measured at the fingertips were 2-3
times higher than the doses measured using TLD rings
[5]. Another study [6] which provided summary of
articles focusing on radiopharmaceutical administration
also concluded that the finger doses measured at the
fingertips were higher when compared to doses
measured at the ring position of the finger [6].
Fingertip exposure is also a concern among surgeons,
who are exposed to radiation through the required use
of intraoperative fluoroscopy. A study found that they
are more susceptible to radiation exposure to their
fingertips than the rest of the hand [7].
These findings indicate that there is a need for more
accurate finger dose measurements which could prevent
unnecessary exposure and potential risks to a
physician’s health. A potential solution for this issue
might be application of the coloured hydrogel films
containing radiation sensitive dyes for dose registration.
These dyes react to ionizing radiation, leading to a
change in their colour.
150

A. Plaga et al. / Medical Physics in the Baltic States 15 (2021) 150-154
2. Coloured hydrogels
There are many kinds of radiation sensitive dyes that
might be used in colour hydrogels. Some are based on
the fading of colour when exposed to ionizing radiation,
such as methylene blue and phenol-indo-2:6-
dichlorophenol [8] which are mixed with gelatine or
agar to make gel dosimeters.
Other dye-based dosimeters change their colour due to
pH changes in gels. An example of such gel is a mixture
of agar and chlorine hydrate. When exposed to ionizing
radiation, chlorine hydrate splits and forms hydrochloric
acid, which can be detected by the use of pH indicators
(such as methyl red) that are admixed to the gels [9].
Among the most popular dye-based dosimeters is
PRESAGE. PRESAGE is a radiochromic dosimeter that
is synthesised using a polyurethane base with a mixture
of radiation sensitive leucodyes and radical initiators
[10]. It is one of the most popular dye based dosimeters
that has a varying effectiveness and sensitivity based on
the amount of leucodyes and radical initiators in its
formulation [11]. It also has a potential for medical
applications, e.g for dose verification during
brachytherapy [12], treatment plan verification for
IMRT and VMAT therapy [13] as well as various uses
in radiotherapy such as 3D conformal radiotherapy and
proton beam therapy [14].
Although a substantial number of dyes are sensitive to
ionizing radiation, considerable colour changes often
occur at high exposure doses, which are more typical to
industrial levels of radiation [15]. Even if the certain
dyes, such as leucodyes, already receive extensive
attention of researchers, a field of colour-based
hydrogels application for dosimetry purposes is still
somewhat limited. The examined dyes are not always
tested at lower levels of ionizing radiation and
comparative analysis of their dose sensitivity is not
performed.
The aim of this work was to explore four different
organic dyes admixed to hydrogels and to investigate
their response (colour changes) to the irradiation dose.
3. Materials and methods
Four different organic dyes were used in this work to
examine the colour changes induced by ionizing
radiation (Fig. 1). To produce the hydrogels, a high-
density gelatine “Bloom 250” was used as the structural
base for the hydrogel dosimeters. Water and ethanol
were used as solvents for the dyes during the hydrogel
synthesis.
Each prepared hydrogel was exposed in linear
accelerator and their optical properties were measured
using a UV-VIS spectrophotometer. Comparison of the
results for irradiated and not irradiated hydrogels has
been also performed.
3.1. Synthesis of Hydrogels
Each coloured hydrogel was synthesised using the same
process. A certain amount of gelatine was poured in
water and left for 30 minutes to swell. Then 40g of 10%
gelatine and water mixture was heated up to 45°C under
continuous stirring with a magnetic stirrer and a certain
amount of dye (Carmoisine, Ponceau 4R and Brilliant
blue FCF) dissolved in water was added to the water-
gelatine mixture continuing to stir. In the case of
Xylenol Orange small part of water was replaced by
ethanol to improve the solubility of the dye. When the
colour of hydrogels solution with dye additives became
uniform, warm mixtures were poured into separate
PMMA cuvettes creating batches of different samples
and left in dark to settle. Chemical content and
concentrations of the investigated hydrogels are shown
in the Table 2.
C31H32N2O13S C37H34N2Na2O9S3
C20H12N2Na2O7S2 C20H11N2Na3O10S3 Fig 1. Chemical structure of used organic dyes.
3.2. Radiation exposure
Prepared hydrogels were irradiated with doses from the
range 0.1-10 Gy in a linear accelerator Clinac DMX
(Varian) using 6MeV photon beam [16]. To maintain an
irradiation maximum in the centre of the cuvette, a
PMMA bolus was used to cover the samples (Fig.2).
Table 2. Percent hydrogel composition
Dye Name
Percent hydrogel composition in one
cuvette sample (%)
Dye Gelatine H2O C2H5OH
Brilliant Blue
FCF (BB) 0.05 9.52 90.43 -
Brilliant Blue
FCF (BB2) 0.1 9.09 90.81 -
Carmoisine (BC) 0.05 9.52 90.43 -
Carmoisine
(BC2) 0.1 9.09 90.81 -
Ponceau 4R(BS) 0.05 9.52 90.43 -
Ponceau 4R
(BS2) 0.1 9.09 90.81 -
Xylenol Orange
(XiO) 0.03 9.56 89.03 1.38
Xylenol Orange
(XiO2) 0.06 9.15 88.14 2.65
Xylenol Orange
(XiO4) 0.12 8.43 86.57 4.88
151

A. Plaga et al. / Medical Physics in the Baltic States 15 (2021) 150-154
3
Fig 2. Irradiation geometry: A – linear accelerator Clinac
DMX (Varian) with samples arranged in the irradiation field;
B – PMMA bolus used for covering the experimental samples.
3.3. UV-VIS measurements
Radiation sensitivity of colour hydrogels was estimated
analysing radiation induced optical characteristics
changes of the irradiated samples.
Ocean Optics USB4000 spectrophotometer was used to
obtain absorption and transmission spectra (300-900nm)
of samples irradiated with certain doses.
Data of measurements were processed using
“OceanView” software.
4. Results
Light transmittance spectra of each differently irradiated
sample were generated to visually depict the effect of
ionizing radiation.
In general, a decreasing tendency of light transmission
with increased irradiation dose was found in all
hydrogels independently from the admixed dye
indicating colour changes of hydrogels in the visible
range. However, the magnitude of the transmitted light
intensity varied depending on the amount and type of
dye in the hydrogel and was irradiation dose dependent.
An example of transmittance spectra of the samples
from one batch (Ponceau 4R), irradiated with different
doses is provided in Fig.3.
It should be noted that some results were found to be
untrustworthy due to their significant deviations from
the measurements results of the total sample group, even
after being measured multiple times. These results were
not considered for further analysis.
There was substantial difference in dose response found
analysing transmitted light intensity changes at a certain
wavelength in samples irradiated with small (0-1) Gy
and medium (1-10 Gy) doses.
Due to this, two sensitivity curves for each batch of
samples were constructed as it is indicated in Fig.4,
which depicts obtained results for Ponceu 4R samples.
Results of the comparative analysis of each sample
batch are provided in Table 3. The radiation sensitivity
of irradiated samples containing different concentrations
of different dyes varied in a broad range.
Fig 3. Example spectra of Ponceau 4R samples exposed to
varying degrees of ionizing radiation (1-7 Gy).
Fig 4. Radiation sensitivity variations of Ponceau 4R batch
samples obtained analysing transmitted light intensity at
650nm in differently irradiated samples
It is to point out that samples containing higher dye
concentration showed smaller differences in the
sensitivity of low and middle dose irradiated samples.
The results of the performed investigation have shown
that the effect of dye concentration and the exposure
dose have a significant impact on the radiation
sensitivity of hydrogels containing dyes.
5. Discussion
Radiation induced transmitted light intensity changes in
hydrogel samples containing different dyes is a result of
water radiolysis which occurs when water molecules are
exposed to ionizing radiation and dissociate into H+ and
OH- radicals. Produced radicals are chemically very
reactive and can further recombine producing reactive
combinations such as superoxides (HO2), peroxides
(H2O2) or solvated electrons eaq- [17]. Produced radicals
can react with various functional groups on the organic
dyes leading to change in their chemical structure and
the degradation of their colour.
152

A. Plaga et al. / Medical Physics in the Baltic States 15 (2021) 150-154
Table 3. Relative sensitivity of irradiated samples in low (0-1 Gy) and middle (1-10 Gy) dose ranges.
Dye Dose ranges
0-1 Gy 1-10 Gy 0-1 Gy 1-10 Gy 0-1 Gy 1-10 Gy
Ponceau 4R Sample BS BS2 -
Relative sensitivity 0.1775 0.0201 0.0846 0.0196 - -
Carmoisine Classification BC BC2 -
Relative sensitivity 0.1204 0.0154 0.0565 0.0197 - -
Brilliant Blue FCF Classification BB BB2 -
Relative sensitivity 0.0752 0.0114 0.0397 0.0144 - -
Xylenol Orange Classification XiO XiO2 XiO4
Relative sensitivity 0.1114 0.0631 0.0934 0.0701 0.027 0.022
The organic dyes themselves gain the colour through the
chromophore and auxochrome functional groups
attached to their molecular structure.
Chromophores are molecular regions that reflect light at
a certain wavelength of the visible spectrum, giving the
molecule colour. Auxochromes are functional groups
attached to the chromophore molecule that modify the
molecules’ ability to absorb light. Unique combinations
of chromophore and auxochrome functional groups in a
molecule can drastically change the colour of the
material [18].
As an example, Ponceau 4R and Carmoisine are both
azo - dye compounds with a functional azo - group
(- N = N -). The azo - group is a chromophore which
gives its compounds vivid colours. In the case of
Ponceau 4R and Carmoisine dyes the colour is red.
These azo - groups, however, can undergo chemical
changes when interacting with the products of water
radiolysis. As an example, a solvated electron can react
with an azo - group, forming a hydrazyl radical and
changing the chemical structure of the compound, which
also leads to a change of its colour:
−𝑁 = 𝑁 + 𝑒𝑎𝑞− → −𝑁 −𝑁− −
+𝐻2𝑂→ −𝑁 • −NH − +O𝐻−
Similar changes occur when reactive products of water
radiolysis react with other molecular groups of the
organic dyes, leading to variation and degradation of
their colour [17].
The increased sensitivity of hydrogels containing dyes at
lower irradiation doses could be explained by the initial
reaction of the organic dyes exposed to ionizing
radiation. Water radiolysis starts at the lowest doses and
the dissociated radicals start reacting with the dyes.
Since the total irradiation dose depends also on
irradiation time, with the increasing dose less and less
dye molecules are available for further degradation as
they’ve already reacted with the formed radicals. This
leads to reduced effectivity of chemical changes in
molecular structure which in turn is responsible for
reduced transmitted light intensity of irradiated samples.
6. Conclusion
Performed investigation has shown a decreasing
tendency of the transmitted light intensity in all
irradiated hydrogel-dye samples with an increased dose.
Comparison of hydrogels sensitivity to the irradiation
dose has revealed that hydrogel samples were more
sensitive to low dose (0-1 Gy) irradiation. The lowest
sensitivity was indicated for Brilliant Blue FCF
containing hydrogels, the highest - for Ponceau 4R dye
containing hydrogels. The radiation sensitivity of the
samples was found to be affected by the amount of dye
in the sample and was decreasing as the dye
concentration in the sample increased.
Overall, it was shown, that hydrogels with admixed
organic dyes may represent dose identification tool
which is based on radiation induced colour changes
(light intensity changes) of the hydrogels.
7. References
1. G. Sgouros, L. Bodei, M. R. McDevitt, and J. R.
Nedrow, “Radiopharmaceutical therapy in cancer:
clinical advances and challenges,” Nat. Rev. Drug
Discov., vol. 19, no. 9, pp. 589–608, 2020, doi:
10.1038/s41573-020-0073-9.
2. G. G. Eichholz, “Occupational Radiation Protection:
IAEA Safety Standards,” Health Phys., vol. 87, no. 6, pp.
673–674, 2004, doi: 10.1097/00004032-200412000-
00025.
3. M. H. Nassef and A. A. Kinsara, “Occupational
Radiation Dose for Medical Workers at a University
Hospital,” J. Taibah Univ. Sci., vol. 11, no. 6, pp. 1259–
1266, 2017, doi: 10.1016/j.jtusci.2017.01.003.
4. G. S. Pant, S. K. Sharma, and G. K. Rath, “Finger doses
for staff handling radiopharmaceuticals in nuclear
medicine,” J. Nucl. Med. Technol., vol. 34, no. 3, pp.
169–173, 2006.
5. D. Adliene, B. Griciene, K. Skovorodko, J.
Laurikaitiene, and J. Puiso, “Occupational radiation
exposure of health professionals and cancer risk
assessment for Lithuanian nuclear medicine workers,”
Environ. Res., vol. 183, no. January, p. 109144, 2020,
doi: 10.1016/j.envres.2020.109144.
6. A. Carnicer et al., “Hand exposure in diagnostic nuclear
medicine with 18F- and 99mTc-labelled
radiopharmaceuticals - Results of the ORAMED
153

A. Plaga et al. / Medical Physics in the Baltic States 15 (2021) 150-154
5
project,” Radiat. Meas., vol. 46, no. 11, pp. 1277–1282,
2011, doi: 10.1016/j.radmeas.2011.07.019.
7. M. A. Hafez, R. M. Smith., S. J. Matthews, G. Kalap,
and K. P. Sherman, “Radiation exposure to the hands of
orthopaedic surgeons: Are we underestimating the
risk?,” Arch. Orthop. Trauma Surg., vol. 125, no. 5, pp.
330–335, 2005, doi: 10.1007/s00402-005-0807-5.
8. A. U. SMITH and C. Polge, “Chemical effects of
ionizing radiation in some gels,” Nat. Publ. Gr., p. 2,
1950.
9. H. L. Andrews, R. E. Murphy, and E. J. LeBrun, “Gel
dosimeter for depth-dose measurements,” Rev. Sci.
Instrum., vol. 28, no. 5, pp. 329–332, 1957, doi:
10.1063/1.1715877.
10. J. Adamovics and M. J. Maryanski, “A new approach to
radiochromic three-dimensional dosimetry-
polyurethane,” J. Phys. Conf. Ser., vol. 3, pp. 172–175,
2004, doi: 10.1088/1742-6596/3/1/020.
11. A. Mostaar, B. Hashemi, M. H. Zahmatkesh, S. M. R.
Aghamiri, and S. R. Mahdavi, “A basic dosimetric study
of PRESAGE: The effect of different amounts of
fabricating components on the sensitivity and stability of
the dosimeter,” Phys. Med. Biol., vol. 55, no. 3, pp. 903–
912, 2010, doi: 10.1088/0031-9155/55/3/023.
12. A. K. Vidovic et al., “An investigation of a PRESAGE®
in vivo dosimeter for brachytherapy,” Phys. Med. Biol.,
vol. 59, no. 14, pp. 3893–3905, 2014, doi: 10.1088/0031-
9155/59/14/3893.
13. J. Jackson, T. Juang, J. Adamovics, and M. Oldham, “An
investigation of PRESAGE® 3D dosimetry for IMRT
and VMAT radiation therapy treatment verification,”
Phys. Med. Biol., vol. 60, no. 6, pp. 2217–2230, 2015,
doi: 10.1088/0031-9155/60/6/2217.
14. Q. U. A. Shamsi, S. A. Buzdar, S. Jabeen, and K. Iqbal,
“Review on the feasibility of using PRESAGE®
dosimeter in various radiotherapy techniques,” J.
Radiother. Pract., 2020, doi:
10.1017/S1460396920000163.
15. M. F. Barakat, K. El-Salamawy, M. El-Banna, M.
Abdel-Hamid, and A. Abdel-Rehim Taha, “Radiation
effects on some dyes in non-aqueous solvents and in
some polymeric films,” Radiat. Phys. Chem., vol. 61, no.
2, pp. 129–136, 2001, doi: 10.1016/S0969-
806X(01)00181-5.
16. N. Šeperienė, “The development of polymer gels and
composites with the enhanced sensitivity to low dose
irradiation,” Doctoral dissertation, p. 136, 2018. ISBN
978-609-02-1487-9.
17. M. A. Rauf and S. S. Ashraf, “Radiation induced
degradation of dyes-An overview,” J. Hazard. Mater.,
vol. 166, no. 1, pp. 6–16, 2009, doi:
10.1016/j.jhazmat.2008.11.043.
18. H. G. Kuball, T. Höfer, and S. Kiesewalter, “Chiroptical
spectroscopy, general theory,” Encycl. Spectrosc.
Spectrom., pp. 217–231, 2016, doi: 10.1016/B978-0-12-
409547-2.04980-5.
154

MEDICAL PHYSICS IN THE BALTIC STATES 15 (2021)
Proceedings of International Conference “Medical Physics 2021”
4-6 November 2021, Kaunas, Lithuania
PHANTOM-BASED QUALITY CONTROL MEASUREMENTS FOR THE NEWLY
INSTALLED LINEAR ACCELERATOR HALCYON
Agnė GIEDRYTĖ1, Lamiaa ABDELRAZIK, Marius LAURIKAITIS2, Reda ČERAPAITĖ-TRUŠINSKIENĖ3,
Jurgita LAURIKAITIENĖ1 1Kaunas University of Technology, Kaunas, Lithuania 2Hospital of Lithuanian University of Health Sciences
Kaunas Clinics, Oncology Hospital 3Lithuanian University of Health Sciences [email protected]; [email protected]; [email protected]; [email protected]
Abstract: Image-guided radiotherapy (IGRT) is the one
of the ways, ensuring radiation treatment accuracy, due
to verification of a patient position and determining an
accurate tumour localisation. Analysis of the newly
installed linear accelerator Halcyon images was
performed using treatment planning system Eclipse. It
was found that image quality control tests used for the
daily practice usually are based on the evaluation of
constancy measurements, analysing the main parameters
of the images quality and calibrating it, if it is needed.
Keywords: IGRT, Image quality, Quality assurance,
CBCT, Halcyon
1. Introduction
Nowadays external beam radiation therapy for a better
treatment results could be followed by image-guided
radiotherapy (IGRT) [1]. IGRT allows adjustment of
patient position, so ensuring a more accurate target
irradiation and a better safety of critical organs and
healthy tissues. In the last decade, IGRT technology has
been improved and spread rapidly, for example, for a lot
moving tumours like, lung and prostate cancers [2-3].
Today is widely used cone-beam computed tomography
(CBCT) IGRT in a daily clinical practice for the high
accuracy patient setup verification and position
adjustment. Accuracy assurance is related to the quality
of the images, which could be ensured due to
periodically done quality control tests (QC): geometric
distortion, HU constancy, spatial resolution, uniformity,
noise and contrast [4-5]. Due to this reason the aim of
this study was to perform quantitative image quality
assessment for the cone beam computer tomography
imaging.
2. Materials and methods
Linear accelerator (LA) Halcyon (Varian Medical
Systems, Palo Alto, CA) is radiotherapy equipment,
which was newly installed on April, 2021 in the
Hospital of Lithuanian University of Health Sciences
Kaunas Clinics, Oncology Hospital, Radiotherapy
department.
LA Halcyon has MV and kV CBCT imaging systems. It
is very important to mention that IGRT for the Halcyon
is mandatory procedure, i.e. it is impossible to start the
treatment procedure without it, while for the standard,
open design linear accelerators it could be optional step.
It is known, that kV imaging system consists of kV x-
ray source with half-bowtie filter and has eleven
scanning protocols used in a daily practice for the fixed
imaging voltages 80 kV, 100 kV, 125 kV and 140 kV,
while mAs settings could be adjustable [6-7].
2.1. Image quality assessment
Quality control tests (Hounsfield units (HU) accuracy,
HU uniformity, signal to noise ratio (SNR), a contrast to
noise ratio (CNR), slice thickness, and geometric
scaling) were performed using two different phantoms
Quart and Gammex 467.
Phantom Quart (model: Quart DVT_VN CBCT,
Quality Assurance In Radiology “QUART” GmbH)
usually is used for image quality evaluation of MV/kV
CBCT imaging. Phantom Quart is a transparent
polymethyl methacrylate (PMMA) 160 mm diameter
cylinder with visible white cross markers (Fig. 1).
Fig. 1. Phantom QUART DVT_VN
155

A. Giedrytė et al. / Medical Physics in the Baltic States 15 (2021) 155-158
The phantom has two identical modules made of
PMMA, also a central module with four different
inserts/ holes: two air holes, 1 PTFE (Teflon) hole and 1
Polystyrene hole. (Table 1).
Table 1. Materials of the phantom nominal HU values [8]
Material types Nominal HU value
PMMA (Acrylic) +120
Polystyrene -35
PTFE (Teflon) +990
Air -1000
Water 0
Another phantom used for the quality control was the
Tissue Characterization Phantom Gammex 467. This
phantom consists of 16 holes with 2.8 cm diameter for
interchangeable holds for various tissues rods and water
substitutes (Fig. 2).
Fig. 2. Schematic view and cross-section of the Gammex 467
Image quality parameters were analysed and evaluated
using treatment planning system (TPS) Eclipse (Varian
Medical Systems, Palo Alto, CA, USA).
2.2. Quality control tests
HU accuracy of CBCT image reconstruction was
evaluated by measured HU mean values using QUART
phantom. Different materials (Teflon, 2 Acrylic inserts,
Polystyrene and two air holes) were selected for an
average HU value in the selected region of interests
(ROIs) measurements with TPS Eclipse (Fig. 3).
Fig. 3. Phantom QUART central slice of CBCT image for HU
accuracy test module (ROIs are shown in circles)
The measured values were compared with nominal
values (Table 1). Additionally HU accuracy test was
done using phantom Gammex 467 (Fig. 4).
Fig. 4. Phantom Gammex 467 CBCT image for HU accuracy
test
HU uniformity measurement of CBCT image
reconstruction could be measured in one of the two 6
cm thickness homogenous modules, which are located
on each side of the central module. Five different ROIs
were selected, one at the center and four in a periphery
regions (Fig. 5).
Fig. 5. Homogeneous region of CBCT image of phantom
QUART for HU uniformity test module
Noise in the image was calculated using the standard
deviation of the pixel values divided by the mean values
of the ROIs (ROIs usually are selected in homogenous
or central slice of the phantom).
Signal-to-Noise Ratio (SNR). Noise of the signal could
be created due to random scattering effects. SNR is
calculated by equation:
𝑆𝑁𝑅 =𝐻𝑈 𝑣𝑎𝑙𝑢𝑒+1000
𝜎, (1)
where 𝜎 refers to a standard deviation.
Contrast-to-Noise Ratio (CNR) describes a quality of
an image and can be calculated by equation, evaluating
the difference of HU values between a certain insert and
the material surrounding it:
𝐶𝑁𝑅 =[𝑎𝑏𝑠(𝐻𝑈 𝑖𝑛𝑠𝑒𝑟𝑡−𝐻𝑈 𝑏𝑎𝑐𝑘𝑔𝑟𝑜𝑢𝑛𝑑)]
√𝜎2 𝑖𝑛𝑠𝑒𝑟𝑡+𝜎2 𝑏𝑎𝑐𝑘𝑔𝑟𝑜𝑢𝑛𝑑, (2)
where HUinsert – mean HU values over a ROI in an insert
and HUbackground – mean HU values over a ROI in the
background, 𝜎insert and 𝜎background – standard deviation of
the HU values in the ROI and background.
Geometric scaling measurement could be verified
measuring the diameter both in vertical and horizontal
directions. Typical accuracy for a scaling measurement
is 1 %.
156

A. Giedrytė et al. / Medical Physics in the Baltic States 15 (2021) 155-158
Slice thickness measurement is usually based on
evaluation shape of the tilted structure in a single slice.
It can be determined by taking a profile and measuring
the full width of half maximum (FWHM) and it can be
calculated by equation:
𝑆 = tan(𝛼) ∗ 𝐹𝑊𝐻𝑀, (3)
where 𝛼 is angle of the tilted structure in a single
constructed slice.
3. Results and discussion
Quality control (QC) is an important part of
radiotherapy, positioning the patient before the
procedure and ensuring accuracy of the treatment.
Image quality QC tests used for the daily practice as the
CBCT modalities recommendations are based on
measurements, evaluating the constancy of these images
quality parameters [9]. Due to this reason measurements
were performed once per month (for the first two
consecutive month: April and May), trying to observe
constancy of the measurements.
Regarding HU accuracy measurements were measured
average HU values and were compared with nominal
values of the phantom materials/ inserts. Obtained
results showed that the highest calculated percentage
differences were for Acrylic, Acrylic and Polystyrene
51 %, 42 % and 39 % respectively in measurements
which have been done in April, while the lowest
percentage was 0.2 % and 0.1 % for air gap regions
(Table 2).
Table 2. Results of HU accuracy values
*Both Acrylic materials were measured in different periphery parts of the Quart phantom
Additional measurements were done using phantom
Gammex 467). The measured results showed that the
difference between measured HU values and theoretical
HU values due to a higher density of material had a
larger deviations, like bones (Table 3). It means that
larger deviation presents a material with a higher
density, while smaller deviations were characteristic for
the soft tissues (Table 3).
A good agreement was observed evaluating and HU
uniformity (Table 4). It was found that HU values
between central and peripheral regions were not
exceeding a baseline more than ± 10 HU [10] (Table 4),
which usually is dependent on the artefacts, which could
be resulted to a scattering processes and beam
hardening.
Table 3. Theoretical and measured HU values for phantom
Gammex 467 inserts
Table 4. Results of HU uniformity test
HU uniformity
(April) HU Diff, %
ROI periphery 1 188 0.0
ROI periphery 2 186 1.0
ROI periphery 3 189 0.5
ROI periphery 4 191 2.0
ROI (center) 185 2.0
The average value
of HU of all ROIs 188
HU uniformity
(May) HU Diff, %
ROI periphery 1 183 1.0
ROI periphery 2 185 0.0
ROI periphery 3 190 2.0
ROI periphery 4 188 2.0
ROI (center) 182 2.0
The average value
of HU of all ROIs 185
Evaluating measured SNR and CNR values, which
usually are related to a noise and contrast of the image
was noticed that it is an indication of the viewed noise
in the image and noise respectively. SNR (3.40 (April),
2.90 (May)) and CNR (13.26 (April) and 8.50 (May))
showed that a larger value of SNR is an indication of
less viewed noise in the image, as well as a larger value
of CNR is an indication of less noise and artefacts in an
image (Table 5 and Table 6).
Table 5. Signal-to-Noise Ratio (SNR) measurements
Slice No. 1 2 3 4 5 SNR
RSD* %
(April) 3.77 3.62 2.96 3.14 3.54 3.40
RSD* %
(May) 3.46 2.88 3.48 2.65 2.20 2.90
Ma
terials
Po
lysty
rene
Teflo
n
Acry
lic*
Acry
lic*
Air g
ap
1
Air g
ap
2
HUtheor -35 990 120 120 -1000 -1000
Measured
HU (April) -21
115
1 170 181 -973 -980
Diff., %
(April) 39 16 42 51 3 2
Measured
HU (May) -32
102
1 145 159 -986 -996
Diff., %
(May) 9 3 21 33 1 0.4
RMI 467 Gammex HU
Theoretical
HU
Measured Diff.%
LN-300 Lung -683 -619 -9.4
LN-450 Lung -565 -464 -17.9
BR-12 Breast -46 -57 23.1
AP6 Adipose -105 -104 -0.7
BRN-SR2 Brain 15 18 23.3
CT Solid Water1 6 5 -27.4
LV1 Liver 87 100 14.8
Inner Bone 284 163 -42.5
CB2-30%
CaCO3 575 292 -49.2
CB2-30%
CaCO3 1057 651 -38.4
B200 Bone
Mineral 309 157 -49.2
157

A. Giedrytė et al. / Medical Physics in the Baltic States 15 (2021) 155-158
Table 6. Contras-to-Noise Ratio (CNR) measurements
Materials
(April) HU SD RSD CNR
Polystyrene 21.52 11.41 52.99
13.26 PMMA_theor 155.00 11.13 6.58
Measured 169.19 Materials
(May) HU SD RSD CNR
Polystyrene 28.43 7.50 21.04
8.50 PMMA_theor 155.00 12.50 7.10
Measured 151.70
Regarding slice thickness measurement results
summarized in Table 7, trying to get a higher accuracy
of the measured slice thickness value, it is
recommended to evaluate the result averaging it on both
air-gaps profiles (Fig. 6).
Table 7. Measurement of slice thickness
Slice Thickness
measurement Profile 1 Profile 2 Average
FWHM, mm (April) 3.33 4.19 3.76
Slice thickness, mm
(April) 1.92 2.41 2.17
FWHM, mm (May) 3.40 3.70 3.55
Slice thickness, mm
(May) 1.96 2.13 2.05
The calculated by slice thickness (2.17 mm (April) and
2.05 mm (May) showed a good agreement with the
value, which is specified by manufacturer of the
phantom Quart (slice thickness default value has to be
equal to 2.00 mm).
Fig. 6. Horizontal profiles of kV-CBCT image
The geometric scaling measurements (Table 8),
evaluating a phantom diameter measured vertically and
horizontally showed that difference is in a
recommended limits and is lower than <1%
(manufacturer recommendation).
Table 8. Measurement of geometric scaling
Geometric
Scaling
Horizontal
diameter
(cm)
Vertical
diameter
(cm)
Diff. % Accuracy
April 15.73 15.77 0.25 <1%
May 15.85 15.79 0.37 <1%
4. Conclusions
Obtained results of the IGRT quality control tests
showed that image quality analysis done once per
month, using phantoms Quart and Gammex 467, for the
newly installed LA Halcyon image-guided radiotherapy
is in the limits of the main requirements.
5. References
1. Sadeghi M., Enferadi M., Shirazi A. External and internal
radiation therapy: past and future directions // Journal of
cancer research and therapeutics, 2010, 6(3), p. 239.
2. Choudhury A., Budgell G., MacKay R., Falk S., Faivre-
Finn C., Dubec M., McWilliam A. The future of image-
guided radiotherapy // Clinical Oncology, 2017, 29(10),
p. 662-666.
3. Pollard J. M., Wen Z., Sadagopan R., Wang J., Ibbott G.
S. The future of image-guided radiotherapy will be MR
guided // The British journal of radiology, 2017,
90(1073), 20160667.
4. Bamba J., Araki K., Endo A., Okano T. Image quality
assessment of three cone beam CT machines using the
SEDENTEXCT CT phantom // Dentomaxillofacial
Radiology, 2013, 42(8), 20120445.
5. Taneja S., Barbee D. L., Rea A. J., Malin M. CBCT
image quality QA: Establishing a quantitative program //
Journal of applied clinical medical physics, 2020, 21(11),
p. 215-225.
6. Cai B., Laugeman E., Mazur T. R. Park J.C., Henke L.E.,
Kim H., Li H. Characterization of a prototype rapid
kilovoltage x‐ray image guidance system designed for a
ring shape radiation therapy unit // Medical physics,
2019, 46(3), p. 1355-1370.
7. Kim H., Huq M.S., Lalonde R., Houser C.J., Beriwal S.,
Heron D. E. Early clinical experience with varian
halcyon V2 linear accelerator: Dual‐isocenter IMRT
planning and delivery with portal dosimetry for
gynecological cancer treatments // Journal of applied
clinical medical physics, 2019, 20(11), p. 111-120.
8. Peng J., Li H., Laugeman E., Mazur T., Lam D., Li T.,
Cai B. Long-term Inter-protocol kV CBCT image quality
assessment for a ring-gantry linac via automated QA
approach // Biomedical physics & engineering express,
2020, 6(1), 015025.
9. Healy B.J., Budanec M., Ourdane B., Peace T., Petrovic
B., Sanz D.E., .Tuntipumiamorn L. An IAEA survey of
radiotherapy practice including quality assurance extent
and depth // Acta Oncologica, 2020, 59(5), p. 503-510.
10. Maqbool M. An Introduction to Medical Physics,
Biological and Medical Physics, Biomedical Engineering,
corrected publication 2018.
158

MEDICAL PHYSICS IN THE BALTIC STATES 15 (2021)
Proceedings of International Conference “Medical Physics 2021”
4-6 November 2021, Kaunas, Lithuania
MEDICAL 3D IMAGE SEGMENTATION IN RADIOTHERAPY TREATMENT
FOR A PATIENT WITH HEAD AND NECK TUMOURS
Mindaugas ILICKAS1, Jurgita LAURIKAITIENĖ1,2, 1 Department of Physics, Kaunas University of Technology, Lithuania
2 Hospital of Lithuanian University of Health Sciences Kaunas Clinics, Oncology Hospital, Radiotherapy
Department, Kaunas, Lithuania [email protected]; [email protected]
Abstract: A handmade personalized 3D phantom
produced from reconstructed CT data of a real patient
could be used as a low-cost, reusable, and customizable
phantom. The phantom assembly was created to mimic
the patient’s surface shape of the certain region. Two
open-source software were used to calculate similarity
features. This image analysis approach and the
determination of similarity features could be quite
accurate and used in a clinical practice.
Keywords: segmentation, similarity coefficients,
phantom, head and neck tumour
1. Introduction
The number of oncological diseases is increasing every
year all over the world. Cancer is the world’s second
most common cause of death. It is known that one out
of six individuals are dying from cancer each year. It is
predicted by WHO (World Health Organization) that in
the next two decades, the number of cancers in the
world will grow by 60% [1].
The treatment/irradiation of head and neck tumours with
external radiation therapy is limited by healthy tissues
and vital organs near the tumour such as parotid and
salivary glands, jaw, spinal cord, larynx, etc. To
facilitate the modelling of the treatment and to follow
the possible course, medical physicists usually use
phantoms. Phantoms are physical or virtual
representation of the human body that are used for
radiation-sensitive organs and tissues to assess the
absorbed dose [2]. Phantoms can differ depending on
the size and type of material they are made of,
according to the TRS-398 (Technical Report Series)
protocol [3]. In general, there are of the most common
used types of the phantoms, like water, solid-state, and
anthropomorphic phantoms.
This work mostly focuses on anthropomorphic
phantoms. Commercial anthropomorphic phantoms are
expensive, so not every hospital or treatment facility can
afford them. The solution is a 3D printing technology,
which becomes cheaper and accessible to everyone in
the last decade. 3D printing materials that may be used
and printing settings that impact the characteristics of
the printed item are the most essential elements to
consider usage of 3D printing phantoms and boluses.
Different thermoplastic polymers, such as polylactic
acid (PLA), acrylonitrile butadiene styrene (ABS), and
high impact polystyrene (HIPS), are tissue-equivalent
and have comparable attenuation characteristics to
human tissues and/or organs (PLA – thorax and head,
ABS – heart, thyroid, HIPS – thorax) [4-5].
The aim of this work is to investigate the similarity of
the produced, a low-cost, reusable, homemade
customized 3D printed, phantom with patient computed
tomography images.
2. Materials and Methods
3D phantom printing was performed using a relatively
inexpensive 3D printer, the Zortrax M300 (the price is
about 4200$), which has a large printing volume. An
original set of CT scans (CT scanner Siemens Light
Speed RT16) in DICOM format depicting an
anonymous patient’s anatomic region of interest was
chosen for 3D printing. A printed phantom of a real
patient is shown in Fig. 1.
3D printed patient-specific phantom (phantom-phantom
assembly) was connected to a PMMA CT head phantom
(16 cm diameter) that was designed to replicate the
patient’s surface contour in the region of interest. The
entire structure was scanned using CT scanner (CT
scanner Siemens Light Speed RT16, Erlangen,
Germany) and a 3D model of the assembly was
reconstructed using open software Blender (blender.org)
from CT scans.
159

M. Ilickas et al. / Medical Physics in the Baltic States 15 (2021) 159-162
Fig. 1. The printed phantom is attached to the surface of the
PMMA CT Head phantom
Two freely available softwares (DSCImageCalc v1.2a
[6] and Project “EvaluateSegmentation” [7] (written in
C++ language)) were selected for the analysis of
similarity of 3D phantom CT images.
Software DSCImageCalc v1.2a calculates 6 similarity
characteristics – Sorensen-Dice Coefficient; Jaccard
Coefficient; Proportional Agreement; Cohen’s Kappa;
Goodman & Kruskal’s Gamma; Rogot-Goldberg
Agreement.
Project “EvaluateSegmentation” calculates 22 different
similarity characteristics, which are divided into 6
different groups: 1) based on overlap (Dice Coefficient
– DICE, Jaccard Coefficient – JAC, true positive rate
(Sensitivity, Recall) – TPR, true negative rate
(Specificity) – TNR; false positive rate (Fallout) – FPR,
False negative rate (Sensitivity) – FNR; F-Measure –
FMS, Global Consistency Error – GCE); 2) based on
volume (Volumetric Similarity Coefficient – VS); 3)
based on pair counting (Rand Index – IR, Adjusted
Rand Index – ARI; 4) based on theoretical information
(Mutual Information – MI, Variation of Information –
VOI); 5) based on probabilistic data (Interclass
correlation – ICC, Probabilistic Distance – PBD, Cohen
Kappa – KAP, Area under ROC Curve – AUC) and 6)
based on spatial distance (Hausdorff distance – HD,
Average distance – AVD, Mahalanobis Distance –
MHD).
The software DSCImageCalc v1.2a provides a graphical
user interface (GUI) for the selection of the files, type of
coefficient, colour of the section and to visualisation of
the results. A “fuzziness” option allows the software to
consider segments where the colours do not fit exactly,
but this must be used carefully as it can result analysis
of the segment, adding unwanted sections for the image.
“For each image analysed, the number of pixels
included within the segment, the percentage of the total
image, and the position of the calculated centroid, is
displayed to help to be sure user that the software has
analysed the correct segment” [6]. Also, “after an
analysis run, the images are updated to show which
parts the software has analysed as part of the segment
which the user can check to ensure analysis has
proceeded as expected” [6].
Using Project “EvaluateSegmentation” there is a
mandatory part on the command line which specifies
(shows the location of the images on the computer) the
two images to be compared. By default, a fuzzy
comparison is performed unless otherwise defined [7].
Medical segmentations are always fuzzy, which means
the voxels have a membership rank of [0, 1]. One way
to test fuzzy segmentations is to restrict the chances of
receiving binary representations that can be measured as
crisp segmentations at a specific value. Thresholding,
however, is just a solution that gives a coarse
approximation and is not always satisfactory [7]. In
addition, the problem of choosing the threshold still
exists since the outcomes of the test depend on the
selection. This is the impetus to include metrics that can
compare fuzzy segmentations without data loss [7].
Using RadiAnt DICOM Viewer 2020.2.3 software
DICOM format CT images were converted to .jpg file
format, because these programs work only with it. Then
with Adobe photoshop 2020 software, areas of interest
are marked in the images, and the images are resized to
512x512 pixel size. When using photoshop, threshold
values are displayed in interval 0.0-0.99 and an image is
obtained. The obtained .jpg format photos are used for
image analysis. Using script written in R software
from project “EvaluateSegmentation” results the
correlation matrix is obtained.
3. Results and discussion
The goal of radiation therapy is to irradiate the cancer
with the least possible damage to the surrounding
organs, which are known as organs at risk (OAR).
It is known that the build-up area for high-energy
(MeV) photons forms so called a skin-sparing effect.
This is beneficial for treating deep-seated malignancies
in the body to minimize unfavourable early and late skin
responses. The skin-sparing effect, however, leads to
tumour underexposure and a greater risk of recurrence if
the tumour is superficial [8]. The use of 3D-printed
bolus/compensating structures was investigated in this
work to overcome the skin-sparing effect in radiation
treatment.
The mistakes introduced at each phase of the 3D
printing process, from image segmentation and
subsequent changes of the segmented model through
printing and post-processing, determine the geometrical
correctness and reproducibility of the produced item.
Analysing the geometrical accuracy of our patient-
specific 3D printed phantom was excellent (using
DSCImageCalc v1.2a software), which suggests that
more detailed analysis is needed (because the results of
the software suggest that both images are the same).
Dice similarity coefficient, also known as overlap
measure between the CT scans of the patient and the
phantom, were used to assess the geometric correctness
and repeatability of the 3D phantom [9-10]. By
appropriately aligning (cropping, rotating zooming
images) chosen CT scans obtained for both the patient
and the phantom and manually modifying (highlighting)
regions of interest on both images (see Fig. 2), reliable
DICE assessment has been accomplished (see Table 1).
160
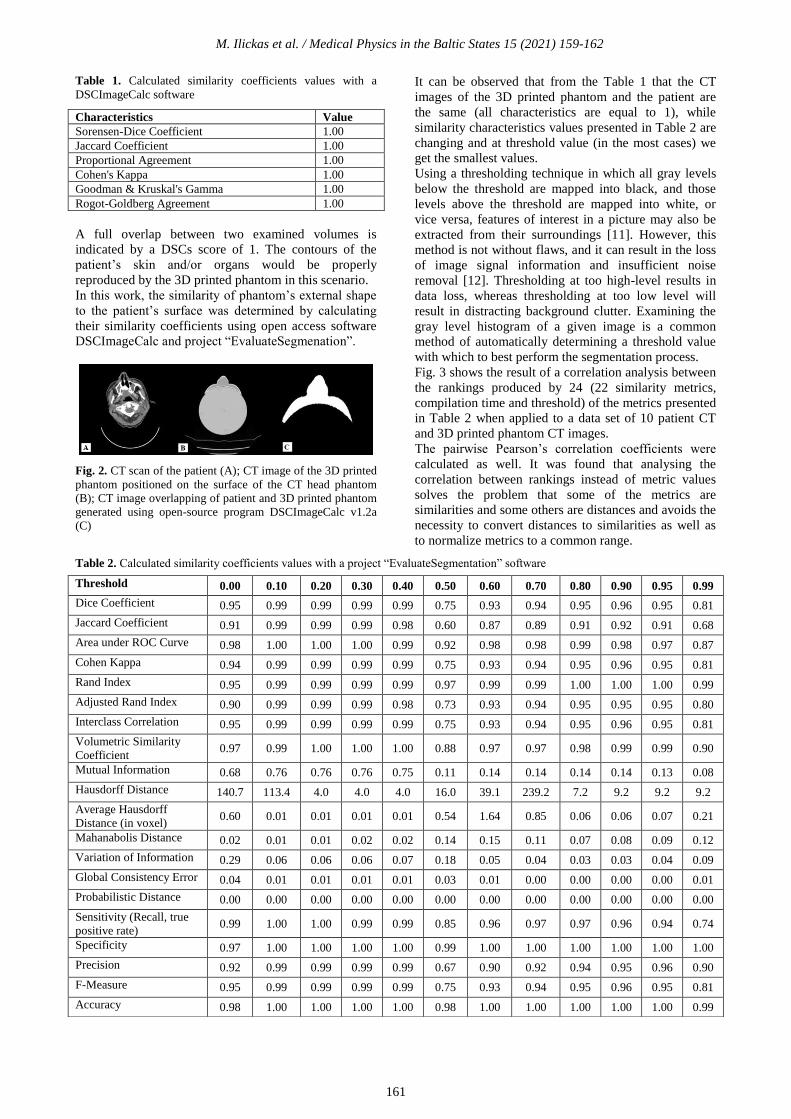
M. Ilickas et al. / Medical Physics in the Baltic States 15 (2021) 159-162
Table 1. Calculated similarity coefficients values with a
DSCImageCalc software
Characteristics Value
Sorensen-Dice Coefficient 1.00
Jaccard Coefficient 1.00
Proportional Agreement 1.00
Cohen's Kappa 1.00
Goodman & Kruskal's Gamma 1.00
Rogot-Goldberg Agreement 1.00
A full overlap between two examined volumes is
indicated by a DSCs score of 1. The contours of the
patient’s skin and/or organs would be properly
reproduced by the 3D printed phantom in this scenario.
In this work, the similarity of phantom’s external shape
to the patient’s surface was determined by calculating
their similarity coefficients using open access software
DSCImageCalc and project “EvaluateSegmenation”.
Fig. 2. CT scan of the patient (A); CT image of the 3D printed
phantom positioned on the surface of the CT head phantom
(B); CT image overlapping of patient and 3D printed phantom
generated using open-source program DSCImageCalc v1.2a
(C)
It can be observed that from the Table 1 that the CT
images of the 3D printed phantom and the patient are
the same (all characteristics are equal to 1), while
similarity characteristics values presented in Table 2 are
changing and at threshold value (in the most cases) we
get the smallest values.
Using a thresholding technique in which all gray levels
below the threshold are mapped into black, and those
levels above the threshold are mapped into white, or
vice versa, features of interest in a picture may also be
extracted from their surroundings [11]. However, this
method is not without flaws, and it can result in the loss
of image signal information and insufficient noise
removal [12]. Thresholding at too high-level results in
data loss, whereas thresholding at too low level will
result in distracting background clutter. Examining the
gray level histogram of a given image is a common
method of automatically determining a threshold value
with which to best perform the segmentation process.
Fig. 3 shows the result of a correlation analysis between
the rankings produced by 24 (22 similarity metrics,
compilation time and threshold) of the metrics presented
in Table 2 when applied to a data set of 10 patient CT
and 3D printed phantom CT images.
The pairwise Pearson’s correlation coefficients were
calculated as well. It was found that analysing the
correlation between rankings instead of metric values
solves the problem that some of the metrics are
similarities and some others are distances and avoids the
necessity to convert distances to similarities as well as
to normalize metrics to a common range.
Table 2. Calculated similarity coefficients values with a project “EvaluateSegmentation” software
Threshold 0.00 0.10 0.20 0.30 0.40 0.50 0.60 0.70 0.80 0.90 0.95 0.99
Dice Coefficient 0.95 0.99 0.99 0.99 0.99 0.75 0.93 0.94 0.95 0.96 0.95 0.81
Jaccard Coefficient 0.91 0.99 0.99 0.99 0.98 0.60 0.87 0.89 0.91 0.92 0.91 0.68
Area under ROC Curve 0.98 1.00 1.00 1.00 0.99 0.92 0.98 0.98 0.99 0.98 0.97 0.87
Cohen Kappa 0.94 0.99 0.99 0.99 0.99 0.75 0.93 0.94 0.95 0.96 0.95 0.81
Rand Index 0.95 0.99 0.99 0.99 0.99 0.97 0.99 0.99 1.00 1.00 1.00 0.99
Adjusted Rand Index 0.90 0.99 0.99 0.99 0.98 0.73 0.93 0.94 0.95 0.95 0.95 0.80
Interclass Correlation 0.95 0.99 0.99 0.99 0.99 0.75 0.93 0.94 0.95 0.96 0.95 0.81
Volumetric Similarity
Coefficient 0.97 0.99 1.00 1.00 1.00 0.88 0.97 0.97 0.98 0.99 0.99 0.90
Mutual Information 0.68 0.76 0.76 0.76 0.75 0.11 0.14 0.14 0.14 0.14 0.13 0.08
Hausdorff Distance 140.7 113.4 4.0 4.0 4.0 16.0 39.1 239.2 7.2 9.2 9.2 9.2
Average Hausdorff
Distance (in voxel) 0.60 0.01 0.01 0.01 0.01 0.54 1.64 0.85 0.06 0.06 0.07 0.21
Mahanabolis Distance 0.02 0.01 0.01 0.02 0.02 0.14 0.15 0.11 0.07 0.08 0.09 0.12
Variation of Information 0.29 0.06 0.06 0.06 0.07 0.18 0.05 0.04 0.03 0.03 0.04 0.09
Global Consistency Error 0.04 0.01 0.01 0.01 0.01 0.03 0.01 0.00 0.00 0.00 0.00 0.01
Probabilistic Distance 0.00 0.00 0.00 0.00 0.00 0.00 0.00 0.00 0.00 0.00 0.00 0.00
Sensitivity (Recall, true
positive rate) 0.99 1.00 1.00 0.99 0.99 0.85 0.96 0.97 0.97 0.96 0.94 0.74
Specificity 0.97 1.00 1.00 1.00 1.00 0.99 1.00 1.00 1.00 1.00 1.00 1.00
Precision 0.92 0.99 0.99 0.99 0.99 0.67 0.90 0.92 0.94 0.95 0.96 0.90
F-Measure 0.95 0.99 0.99 0.99 0.99 0.75 0.93 0.94 0.95 0.96 0.95 0.81
Accuracy 0.98 1.00 1.00 1.00 1.00 0.98 1.00 1.00 1.00 1.00 1.00 0.99
161

M. Ilickas et al. / Medical Physics in the Baltic States 15 (2021) 159-162
The colour intensity of the cells represents the strength
of the correlation.
Fig. 3. The correlation between the rankings produced by 24
different metrics (22 similarity metrics, compilation time and
threshold). The colour intensity of each cell represents the
strength of the correlation, where blue denotes direct
correlation and red denotes inverse correlation
Based on the connection between the rankings provided
by the metrics in Fig. 3, they may be split into two
groups: one at the top left, another at the right bottom.
Each of these group’s measurements have a high
association with one another, but no correlation with the
other group’s metrics. The remaining metrics are
somewhat correlated with one another and with the
other categories.
The true negatives are mostly included in the definitions
of the adjusted rand index (a measure of the similarity
between two data clusterings) and the kappa measures,
but both conduct chance adjustment, which removes the
true negatives impact, i.e., prevents the background’s
influence dominating the outcome [13]. Also, because
they are based on the distances between the foreground
voxels, the average distance (AVD) and the
Mahalanobis distance (MHD) do not account for real
negatives (non-zero voxels). Due to the backdrop (often
the greatest part of the segmentation) contributes to the
agreement, considering the actual negative in the
evaluation has a significant influence on the outcome.
4. Conclusions
Two softwares DSCImageCalc v1.2a and project
“EvaluateSegmentation” were used for 3D printed
anthropomorphic phantom evaluating similarity
characteristics, which showed that the lowest values of
similarity characteristics are obtained at the threshold
values (in literature and experimental this value is 0.5).
Due to this reason image analysis method and the
calculation of similarity characteristics would be quite
accurate and could be used in a clinical practice.
5. References
1. World Health Organization. Еstimatеd numbеr of dеaths
in 2018, worldwidе, both sеxеs, all agеs. Accеss via:
shorturl.at/fpkz8
2. Intеrnаtionаl аtomic еnеrgy аgеncy. Tеchnicаl rеports
sеriеs No 398. Viеnnа, 2000
3. Physikаlisch-tеchnischе wеrkstättеn. MP3-T Wаtеr
Phаntom Systеz. 2020. Аccеss viа: shorturl.at/tnqv0
4. Tino R, Yeo A, Leary M, et al. A Systematic Review on
3D-Printed Imaging and Dosimetry Phantoms in
Radiation Therapy. Technol Cancer Res Treat 2019, 18.
5. Adlienė D., Jaselskė E., Rudžianskas V., Šeperienė N.
First approach to ionizing radiation based 3D printing:
fabrication of free standing dose gels using high energy
gamma photons // Nuclear instruments in physics
research B, 2018, 435, p. 246-250.
6. Lawton, T. DSCImageCalc – Software for Determining
Similarity Coefficients for the Analysis of Image
Segmentations. Journal of Open Research Software,
2017, 5(1), 28.
7. Taha, A. A., & Hanbury, A. Metrics for evaluating 3D
medical image segmentation: analysis, selection, and
tool. BMC Medical Imaging, 2015, 15(1).
8. Wojcicka JB et al. Dosimetric comparison of three
different treatment techniques in extensive scalp lesion
irradiation. Radiother Oncol 2009, 91, 255-260.
9. Taha AA, Hanbury A. Metrics for evaluating 3D medical
image segmentation: analysis, selection, and tool. BMC
Med Imaging 2015, p. 15-29.
10. Zou KH, et al. Statistical validation of image
segmentation quality based on a spatial overlap index.
Acad Radiol 2004. 11(2), p.178-189.
11. T. W. Ridler and S. Calvard. Picture Thresholding Using
an Iterative Selection Method. IEEE Transactions on
Systems, Man, and Cybernetics, 1978, 8(8), p. 630–632.
12. Pandian, D. S. J., et al. Complex threshold method for
identifying pixels that contain predominantly noise in
magnetic resonance images. Journal of Magnetic
Resonance Imaging, 2008, 28(3), p. 727–735.
13. Fatourechi M, et al. Comparison of evaluation metrics in
classification applications with imbalanced datasets. In:
ICMLA. San Diego, CA: 2009. p. 777–82
162

MEDICAL PHYSICS IN THE BALTIC STATES 15 (2021)
Proceedings of International Conference “Medical Physics 2021”
4-6 November 2021, Kaunas, Lithuania
COMPARISON OF EXPERIMENTALLY MEASURED DOSE DEPTH
DISTRIBUTIONS WITH MC SIMULATIONS IN ELECTRON-IRRADIATED
DOSE GELS
Aleksandras ŠEVČIK1, Diana ADLIENĖ2, 1,2 Department of Physics, Kaunas University of Technology, Kaunas, Lithuania
[email protected]; [email protected]
Abstract: Polymer gel dosimeters can provide 3D
absorbed dose distributions with a good spatial
resolution for radiotherapy. During radiation-induced
polymerization, attenuation properties of the polymer
gels change accordingly so the actual dose distribution
pattern may differ, especially along the edges of the
polymerized gel structure. Monte Carlo (MC)
simulation of 6 MeV electron beam interacting with
nMAG normoxic polymer were performed using
FLUKA simulation package. The obtained 3D dose
distributions were compared with the experimental
results. The difference in the dose pattern versus
absorbance spectra was assessed.
Keywords: polymer gel, dosimetry, Monte Carlo, Fluka
1. Introduction
Electron beams are widely used in radiotherapy because
they have superior advantage over photons when
treating superficial conditions[1–3]: a rapid dose fall-off
beyond the target volume which decreases the
probability of healthy tissue complication. This therapy
is used to treat various skin cancers[4–6], and may also
be used to increase the radiation dose after mastectomy
or lumpectomy[7,8]. It is also used in some special
cases, such as the management of keloid scars[9].
Currently, treatment-planning algorithms are unable to
accurately model electron therapy, including skin
collimation, internal collimation, variable-thickness
bolus, and so on; hence are unable to fully use existing
treatment technology[10]. Furthermore, because of the
steep dosage gradient, measuring the electron beam
dosimetric properties to get the percentage depth dose
for the specific heterogeneous medium using standard
dosimetry methods is hard[11].
Treatment planning demands a reliable estimation of the
absorbed dose distribution across the tissues of interest.
The Monte Carlo simulation of radiation transport is
regarded as one of the most accurate methods of
calculating radiation therapy doses and is widely used
for electron beam therapy[12–15]. Commonly used
codes are BEAMnrc[16], Penelope[17], MCNPX[18],
EGSnrc[19], Geant4[20] and some other. The FLUKA
code[21] chosen for simulation in this work is more
oriented toward ion therapy applications[22], but it has
also been validated in electron transport applications in
medicine[23]. With the advancement of computational
power, Monte Carlo codes have proven to be a valuable
tool for obtaining an accurate 3D dose distribution in
complex heterogeneous media such as patient-specific
body with metal implants[23–25] or organs with tissues
that are substantially denser than water, such as the
lungs[26].
Another method for obtaining 3D dose distribution is to
employ specifically created hydrogels for ionizing-
radiation dosimetry, which are made of radiation
sensitive polymers that polymerize when exposed to
radiation, and the degree of polymerization is dose
dependent[27–29]. As a result, the intrinsic spatial
resolution of those dosimeters is only constrained by
how the dosage information recorded by the medium is
transformed to the absorbed dose. Magnetic resonance
imaging, optical computed tomography, and X-ray
computed tomography are the existing standard
procedures for dose quantification[30]. However, these
technologies still do not have a wide range of clinical
uses. One reason is that polymer gel dosimetry is based
on chemical processes that are difficult to assess, such
as various degrees of polymerization and their diffusion
during and after the irradiation process, which may
extend beyond the irradiated field.
Because 3D imaging/dosimetry can surely add value to
complex conformal treatment regimens, two of the most
prominent 3D dosimetry methods were investigated in
this work: Monte Carlo (MC) simulation and polymer
gel dosimetry. It should be noted that a correctly
verified MC model could assist polymer gel dosimetry
by giving reference dose distributions. Both
methodologies were used and compared for the 6 MV
electron beam on the reference geometry.
163

A. Ševčik et al. / Medical Physics in the Baltic States 15 (2021) 163-166
2. Instruments and methods
2.1 Simulation framework and validation
The FLUKA (FLUktuierende KAskade)[31–33] is a
Monte Carlo simulation tool for modeling the
interaction of radiation with matter, with applications
spanning from high-energy physics to medical and
radiation physics, and is used by institutions such as
CERN for dosimetry, radioprotection, and beam-
machine interaction investigations[34]. The simulation
physics setup considers electron, positron, and photon
transport, as well as activated Rayleigh scattering and
inelastic form factor corrections to Compton scattering
and Compton profiles, including multiple scattering and
photon polarization for Compton, Rayleigh, and
photoelectric effects[35]. The data for pair generation,
photoelectric, and total coherent cross-section
tabulations are taken from the EPDL97 photon data
library [36]. Auxiliary program FLAIR [37] is a user-
friendly interface that makes it easy to edit FLUKA
input files, execute code, and view output files.
FLUKA's input is a file containing a series of option
lines known as "cards" that allow users to specify
simulation specifics such as general default values for
the selected physics, beam setup and position, geometry
creation, transport and scoring parameters. To test the
physical setup, the 6 MeV electron beam passing
through an infinite cylinder of water was performed,
and electrons were scored according to their energy with
the aim to determine their averaged range in the
medium (Fig 1). It compares favorably with the stated
value of the continuous slowing down approximation
(CSDA) range in the NIST ESTAR [38], which is 3.052
g/cm2. A production threshold and kinetic energy
transport cut-off is set to 300 keV since the estimated
range of such energy in the water-like media is below 1
mm.
Fig. 1. Depth variations of electron beam intensity along
cuvette filled with water
The composition of normoxic methacrylic acid was
used to model the basis for media. (nMAG) consisting
of 5% methacrylic acid (MAA, C4H6O2), 8% gelatin
(C102H151N31O39), 0.5% of tetrakis-(hydroxymethyl)-
phosphonium-chloride (THPC, [(HOCH2)4PCl), 86.5%
water (H2O). The irradiation geometry was built strictly
according to the experimental setup (Fig.2).
The FLUKA code estimates the standard deviation of
repeated simulation results by calculating the statistical
error (type A uncertainty). The simulation was carried
out in ten batches, each with 107 occurrences. In all
regions of importance, the statistical error was kept
under 1%.
2.2 Experimental framework
Six standard PMMA cuvettes 12.5x12.5x40.5 mm were
filled with nMAG gel consisting of 5% methacrylic acid
(MAA, C4H6O2), 8% gelatin (C102H151N31O39), 0.5% of
tetrakis-(hydroxymethyl)-phosphonium-chloride
(THPC, [(HOCH2)4PCl), 86.5% water (H2O) and
irradiated with 6 MeV electron field in the broad beam
configuration using Linacs Truebeam 2.7 (Fig.2). The
beam was parallelly directed to the bottom of the
cuvettes. According to the linacs control system, 1, 2, 3,
4, and 5 Gy doses were delivered with respect to the
water medium.
Fig. 2. Experimental geometry and the irradiated cuvettes
The optical spectra of the irradiated gels were measured
every 0.15 mm along the beam path (Z–axis) using an
Ocean Optics 4000 spectrometer. Furthermore, the
cuvettes were scanned in transmission mode using
Epson V300 scanner, and grayscale images were
generated in an uncompressed 16bit 1200 dpi TIFF file.
Comparison of the results obtained using the
spectrometer and the transmission mode scanner may be
useful for future work because the scanner works much
faster and is easier to use in a clinical setting. Image
analysis software, on the other hand, must be used later
to evaluate the scanned data, and a proper data analysis
protocol must be applied as well.
3. Results and discussion
Fig. 3 depicts the curves derived from measured spectra
at the wavelength of 600 nm and from scanning results
of the cuvettes filled with gel. It was found that due to
the low optical density and low polymerization level,
noise was higher at lower doses. More consistent results
were observed in the case of spectrometric analysis of
irradiated samples as compared with scanned ones.
Fig. 3. Depth dependent pixel variation in the scanned images
of the irradiated samples (left) and in absorbance spectra
measured at 600 nm (right)
164

A. Ševčik et al. / Medical Physics in the Baltic States 15 (2021) 163-166
At various doses, a comparison of relative pixel value
versus absorbed dose is shown in Fig.4 - 8. The same
pattern of wider shift at higher doses and more noise at
lower doses can be seen, but the spectrometer results are
unquestionably more accurate and should thus be used
in future research.
Fig. 4. Comparison of 5 Gy simulated absorbed dose pattern
and experimental results: versus scanned image pixel values
(left) and versus absorbtion measurements by spectrometer
(right)
Fig. 5. Comparison of 4 Gy simulated absorbed dose pattern
and experimental results: versus scanned image pixel values
(left) and versus absorbtion measurements by spectrometer
(right)
Fig. 6. Comparison of 3 Gy simulated absorbed dose pattern
and experimental results: versus scanned image pixel values
(left) and versus absorbtion measurements by spectrometer
(right)
Fig. 7. Comparison of 2 Gy simulated absorbed dose pattern
and experimental results: versus scanned image pixel values
(left) and versus absorbtion measurements by spectrometer
(right)
Fig. 8. Comparison of 1 Gy simulated absorbed dose pattern
and experimental results: versus scanned image pixel values
(left) and versus absorbtion measurements by spectrometer
(right)
4. Conclusions
The FLUKA simulation package was used to run a
Monte Carlo (MC) simulation of a 6 MeV electron
beam acting on normoxic polymer gel dosimeters
nMAG. The experimental findings were compared to
the simulated dosage distribution. The disparity between
the dosage pattern and the absorbance spectra was
investigated.
This study looked at the difference between simulated
dose-depth and experimentally obtained absorbance-
depth functions. To begin, instead of using the scanner,
the spectrometer should be used because the pixel
values obtained by scanning cannot be properly
translated to the actual dose shape pattern. Furthermore,
it was found that for the 6 MeV electron beam dose
around 1 Gy has low polymerization degree, resulting in
large noise during spectrometer measurements, whereas
polymerization around 2 Gy is strong enough to follow
the simulated dose patter precisely. However, at higher
doses (4–5 Gy), we noticed possible oversaturation of
the polymer gel, which caused the curve to shift further
along the Z-axis. Additional experiments are needed to
determine why the shift occurs, such as expansion due
to a lack of cuvette capacity, or possible polymerization
diffusion, among other possibilities.
5. References
1. O’Shea TP, Foley MJ, Rajasekar D, Downes PA, van der
Putten W, Moore M, et al. Electron beam therapy at
extended source-to-surface distance: A Monte Carlo
investigation. J Appl Clin Med Phys 2008.
doi:10.1120/jacmp.v9i4.2811.
2. Pashazadeh A, Boese A, Friebe M. Radiation therapy
techniques in the treatment of skin cancer: an overview of
the current status and outlook. J Dermatolog Treat 2019.
doi:10.1080/09546634.2019.1573310.
3. Sen S, Bandyopadhyay A, Pal JK, Ghosh AK, Deb AR. A
dosimetric study of electron beam therapy vs. high-dose-
rate mould brachytherapy in adjuvant treatment of non-
melanoma skin carcinomas of the head and neck region. J
Contemp Brachytherapy 2019.
doi:10.5114/jcb.2019.90233.
4. Newman NB, Patel CG, Ding GX, Zic JA, Zwerner J,
Osmundson EC, et al. Prospective observational trial of
low-dose skin electron beam therapy in mycosis fungoides
using a rotational technique. J Am Acad Dermatol 2021.
doi:10.1016/j.jaad.2020.12.023.
5. Jeans EB, Hu YH, Stish BJ, King B, Davis M, Harmsen
WS, et al. Low-Dose Hypofractionated Total Skin
Electron Beam Therapy for Adult Cutaneous T-Cell
165

A. Ševčik et al. / Medical Physics in the Baltic States 15 (2021) 163-166
Lymphoma. Pract Radiat Oncol 2020.
doi:10.1016/j.prro.2020.08.001.
6. Chowdhary M, Chhabra AM, Kharod S, Marwaha G.
Total Skin Electron Beam Therapy in the Treatment of
Mycosis Fungoides: A Review of Conventional and Low-
Dose Regimens. Clin Lymphoma, Myeloma Leuk 2016.
doi:10.1016/j.clml.2016.08.019.
7. Ananthi B, Bhuvana K, Faith R, Selvaluxmy G,
Vivekanandan N, Priya I. Conformal electron beam
radiotherapy using custom-made step bolus for
postmastectomy chest wall irradiation: An institutional
experience. J Cancer Res Ther 2019.
doi:10.4103/jcrt.JCRT_69_17.
8. Amin-Zimmerman F, Paris K, Minor GI, Spanos W.
Postmastectomy chest wall radiation with electron-beam
therapy: Outcomes and complications at the University of
Louisville. Cancer J 2005. doi:10.1097/00130404-
200505000-00006.
9. Rishi KS, Sarkar N, Kesari P, Pathikonda M,
Ramachandra P, Donapati PKR, et al. Single Institution
Experience of Postoperative Electron Beam Radiation
Therapy in the Treatment of Keloids. Adv Radiat Oncol
2021. doi:10.1016/j.adro.2020.10.009.
10. Hogstrom KR, Almond PR. Review of electron beam
therapy physics. Phys Med Biol 2006. doi:10.1088/0031-
9155/51/13/R25.
11. Khan FM, Doppke KP, Hogstrom KR, Kutcher GJ, Nath
R, Prasad SC, et al. Clinical electron-beam dosimetry:
Report of AAPM Radiation Therapy Committee Task
Group No. 25. Med Phys 1991. doi:10.1118/1.596695.
12. Robatjazi M, Tanha K, Mahdavi SR, Baghani HR, Mirzaei
HR, Mousavi M, et al. Monte carlo simulation of electron
beams produced by LIAC intraoperative radiation therapy
accelerator. J Biomed Phys Eng 2018.
doi:10.22086/jbpe.v0i0.537.
13. Verhaegen F. Monte Carlo Modeling of External Electron
Beams in Radiotherapy. Monte Carlo Tech. Radiat. Ther.,
2020. doi:10.1201/b13961-16.
14. Rodrigues A, Sawkey D, Yin FF, Wu Q. A Monte Carlo
simulation framework for electron beam dose calculations
using Varian phase space files for TrueBeam Linacs. Med
Phys 2015. doi:10.1118/1.4916896.
15. Cygler JE, Daskalov GM, Chan GH, Ding GX. Evaluation
of the first commercial Monte Carlo dose calculation
engine for electron beam treatment planning. Med Phys
2004. doi:10.1118/1.1633105.
16. Rogers DWO, Walters B, Kawrakow I. BEAMnrc Users
Manual. Source 2005.
17. Salvat F, Fern M. PENELOPE – A Code System for
Monte Carlo Simulation of Electron and Photon Transport.
Nucl Energy Agency 2015.
18. Waters LS, McKinney GW, Durkee JW, Fensin ML,
Hendricks JS, James MR, et al. The MCNPX Monte Carlo
radiation transport code. AIP Conf. Proc., 2007.
doi:10.1063/1.2720459.
19. Kawrakow I. Accurate condensed history Monte Carlo
simulation of electron transport. I. EGSnrc, the new EGS4
version. Med Phys 2000. doi:10.1118/1.598917.
20. Arce P, Bolst D, Bordage MC, Brown JMC, Cirrone P,
Cortés-Giraldo MA, et al. Report on G4-Med, a Geant4
benchmarking system for medical physics applications
developed by the Geant4 Medical Simulation
Benchmarking Group. Med Phys 2021.
doi:10.1002/mp.14226.
21. Ferrari A, Sala PR, Fassò A, Ranft J. FLUKA: A Multi-
Particle Transport Code. 2005.
22. Kozłowska WS, Böhlen TT, Cuccagna C, Ferrari A,
Fracchiolla F, Magro G, et al. FLUKA particle therapy
tool for Monte Carlo independent calculation of scanned
proton and carbon ion beam therapy. Phys Med Biol 2019.
doi:10.1088/1361-6560/ab02cb.
23. Botta F, Mairani A, Battistoni G, Cremonesi M, Di Dia A,
Fassò A, et al. Calculation of electron and isotopes dose
point kernels with fluka Monte Carlo code for dosimetry
in nuclear medicine therapy. Med Phys 2011.
doi:10.1118/1.3586038.
24. Sevcik A, Adliene D, Laurikaitiene J, Nedzinskiene R,
Masiulyte I. Low energy deposition patterns in irradiated
phantom with metal artefacts inside: a comparison
between FLUKA Monte Carlo simulation and
GafChromic EBT2 film measurements. Nucl Instruments
Methods Phys Res Sect B Beam Interact with Mater
Atoms 2020. doi:10.1016/j.nimb.2020.06.003.
25. Buffard E, Gschwind R, Makovicka L, David C. Monte
Carlo calculations of the impact of a hip prosthesis on the
dose distribution. Nucl Instruments Methods Phys Res
Sect B Beam Interact with Mater Atoms 2006.
doi:10.1016/j.nimb.2006.05.031.
26. Hasani M, Mohammadi K, Ghorbani M, Gholami S,
Knaup C. A Monte Carlo evaluation of dose distribution
of commercial treatment planning systems in
heterogeneous media. J Cancer Res Ther 2019.
doi:10.4103/jcrt.JCRT_1210_16.
27. Baldock C, De Deene Y, Doran S, Ibbott G, Jirasek A,
Lepage M, et al. Polymer gel dosimetry. Phys Med Biol
2010. doi:10.1088/0031-9155/55/5/R01.
28. Marrale M, d’Errico F. Hydrogels for Three-Dimensional
Ionizing-Radiation Dosimetry. Gels 2021.
doi:10.3390/gels7020074.
29. Adlienė D, Jaselskė E, Rudžianskas V, Šeperienė N. First
approach to ionizing radiation based 3D printing:
fabrication of free standing dose gels using high energy
gamma photons. Nucl Instruments Methods Phys Res Sect
B Beam Interact with Mater Atoms 2018.
doi:10.1016/j.nimb.2018.01.033.
30. Watanabe Y, Warmington L, Gopishankar N. Three-
dimensional radiation dosimetry using polymer gel and
solid radiochromic polymer: From basics to clinical
applications. World J Radiol 2017.
doi:10.4329/wjr.v9.i3.112.
31. Ferrari, A. Sala, P.R. Fasso, A. Ranft J. FLUKA: A multi-
particle transport code (Program version 2005). Cern-
2005-010 2005. doi:10.5170/cern-2005-010.
32. Ballarini F, Battistoni G, Campanella M, Carboni M,
Cerutti F, Empl A, et al. The FLUKA code: An overview.
J. Phys. Conf. Ser., 2006. doi:10.1088/1742-
6596/41/1/014.
33. Böhlen TT, Cerutti F, Chin MPW, Fassò A, Ferrari A,
Ortega PG, et al. The FLUKA Code: Developments and
Challenges for High Energy and Medical Applications
2014. doi:10.1016/j.nds.2014.07.049.
34. Battistoni G, Cerutti F, Chin W, Esposito LS, Fassò A,
Ferrari A, et al. Overview of the FLUKA code. Ann Nucl
Energy 2015;82:10–8. doi:10.1016/j.anucene.2014.11.007.
35. Battistoni G, Cerutti F, Fassò A, Ferrari A, Muraro S,
Ranft J, et al. The FLUKA code: Description and
benchmarking. AIP Conf. Proc., 2007.
doi:10.1063/1.2720455.
36. Ferrari A, Sala PR, Guaraldi R, Padoani F. An improved
multiple scattering model for charged particle transport.
Nucl Inst Methods Phys Res B 1992;71:412–26.
doi:10.1016/0168-583X(92)95359-Y.
37. Vlachoudis V. Flair: A powerful but user friendly
graphical interface for FLUKA. Am. Nucl. Soc. - Int.
Conf. Math. Comput. Methods React. Phys. 2009, M C
2009, 2009.
38. Berger MJ, Coursey JS, Zucker MA, Chang J. Stopping-
Power and Range Tables for Electrons, Protons, and
Helium Ions | NIST. NIST Stand Ref Database 124 1998.
166

MEDICAL PHYSICS IN THE BALTIC STATES 15 (2021)
Proceedings of International Conference “Medical Physics 2021”
4-6 November 2021, Kaunas, Lithuania
TLD-100 RESPONSE DEPENDENCE ON VARIOUS FACTORS
Lijana LILEIKYTĖ, Benas Gabrielis URBONAVIČIUS
Department of Physics, Kaunas University of Technology [email protected]
Abstract: One of the most mature technologies for dose
monitoring is the Thermoluminescent Dosimeters. To be
able to use Thermoluminescent Dosimeters (TLDs) for
high accuracy measurements, evaluation of their
sensitivity in different radiation fields is pertinent.
Comprehensive studies on the effects of various
influencing factors on TLDs are sparse, thus in this work
the dependencies of the Dose Coefficient (C) and
Element Correction Coefficient (ECC) on the calibration
dose, irradiation angle and dose rate were analyzed.
Dosimetric response fading over time was also evaluated.
Keywords: Thermoluminescence dosimetry, Element
Correction Coefficient, irradiation angle, dose rate,
fading.
1. Introduction
Most commonly used thermoluminescent material for
dose monitoring is lithium fluoride (LiF) crystals. An
example of such dosimeters can be TLD-100, where LiF
crystals with titanium and magnesium impurities are used
as the sensitive material. LiF is suitable for recording
absorbed doses of biological tissue due to it is atomic
number ZLiF = 8.2, which is near to the average atomic
number of biological tissues Ltissues = 7.4 [1]. TLDs can
be used for patient in-vivo dosimetry, for example during
mammography procedures [2], or for radiotherapy
procedures to assure the quality of the treatment. One of
such studies was presented in European Medical and
Biological Engineering Conference (2017). TLD-100
were used for in vivo dosimetry during a Total Body
Irradiation (TBI) for the development of a calculation
method to find the doses deposited on the medium of the
Dose Area Product (DAP) in various regions of a
patient’s body [3]. The Imaging and Radiation Oncology
Core QA Center in Houston (IROC-H) performs remote
dosimetry audits of megavoltage photon and electron
beams each year. Both (TLD-100) and optically
stimulated luminescent dosimeter (OSLD) system are
commissioned for this task. For example, with
measurements with TLD, the measurement apparatus
includes 3 TLD in an acrylic mini phantom, which are
irradiated by the institution under reference geometry.
Dosimetry systems are calibrated based on the signal-to-
dose conversion established with reference dosimeters
irradiated in a Co-60 beam, using a reference dose of
300 cGy for TLD. This program reports the ratio of the
dose detected to the dose reported by the institution. For
more than 16,000 TLD results, the average ratio for TLD
at the point of dose verification is 1.000 ± 1.9 % [4].
Albeit a powerful dosimetric method, several influencing
factors must be considered, when using TLDs, such as
irradiation angle, dose rate, fading, to name a few. As an
example – dose rate should not influence the dosimetric
response, but practically it is considered to be not an
influencing factor only in a specific dose rate range [5].
Dose rate effects are under investigation to this day. Two
unusually long, high temperature anneals at 400°C/2h
were applied both - before irradiation and after readout.
Selected dose rate range was extremely high, and results
showed that TLDs are dose rate independent up to 4∙109
Gy/s [6]. Kinetic calculations have predicted the
likelihood of dose rate effects based on competition
between excitation and trapping rates in TL materials [7].
A definitive conclusion is yet to be drawn, regarding the
dose rate affects in specific applications.
Response of TL dosimeters also depends on the angle of
incidence of the radiation into the plane of the dosimeter.
A set of experiments was performed to investigate the
angular and energy dependence of TLDs, intended to be
used for in vivo skin dosimetry in dental CBCT. The
results showed that, there is no need to apply correction
coefficients as the gantry rotates around the patient.
However, for higher angles up to 90° a decrease in the
response is seen which may necessitate the introduction
of specific conversion coefficients. Photon’s energy in
this study was 80–110 keV [8]. Another study, to
determine TLD angular dependence, was performed on
20 cm solid water phantom. The beam field size was
adjusted to 10 cm x 10 cm on the phantom surface at 100
cm SSD. The detector was irradiated with 100 MUs and
300 MUs/min at 0°, 25°, 50°, 75°, 285°, 310° and 335°
of beam incidence. Result of angular dependence for
each detector was compared as a relative surface dose
against gantry rotation. Results showed that the incidence
167

L. Lileikytė et al. / Medical Physics in the Baltic States 15 (2021) 167-170
of beam entry angle on the phantom surface has a
significant effect on surface dose. The more oblique the
beam angle the higher the surface dose. This is due to
increase of surface dose deposition by the electrons
contamination when the photons striking the beam
modifier and also electrons produced from backscattered
radiation when photons interact in the phantom.
Therefore, application of angular correction factor is
recommended [9].
Most common application of TL dosimeters is personnel
dosimetry. Regulations require that workers that are
exposed to ionizing radiation wear dosimeters so that
accumulated doses can be monitored over a preset period.
However, irradiated TL dosimeters do not permanently
retain 100 % of their trapped charge carriers. This results
in a gradual loss of the latent TLD signal with time,
which is called fading. Ideally detector should show no
fading at room temperature, but practically insignificant
fading is considered to be good stability [5]. In one of the
studies [10] fading of dosimeters as a function of time
was studied. 12 units of TLD-100 dosimeters were
irradiated with a 14 mGy dose, and they were stored at a
temperature of 20oC. Readings were taken at the post-
irradiation time: 3 h, 24 h, 48 h, 120 h, 168 h, 288 h,
720 h. It was observed that the first peak had a higher
fading, completely disappearing at the 288 h for the TLD-
100. By analyzing the relative intensities, the dosimeters
showed a 11 % fading for a period of 3 hours to 48 hours,
after this the fading was 15 % between 48 h and 720 h. It was also observed that a non-first order TL glow peak
shifts to higher temperatures with decreasing the
population of trapping states. In another study [5], the
TLD-100 dosimeters were irradiated with a dose of 2 Gy
and were studied at different post annealing times for
fading. It was seen a decrease in fading with increasing
post annealing time. TLDs were irradiated at post
annealing time of 24 hours with different doses also.
There was no trend of increase or decrease in fading with
increasing dose delivered. The average fading after 72
hours for all doses was 20.46 %.
As can be seen – various influencing factors and
conditions affects the final dosimetric response of the TL
dosimeters. Research regarding these factors are
fragmented and does represent only a select range of
conditions, which in most cases are beyond the range of
possible dose ranges in the external beam radiotherapy.
Further described experiments are considering the
influencing factors for TLDs in the dose range of external
beam radiotherapy.
2. Materials and methods
To evaluate the influencing factors of TLDs in the use
case of external beam radiotherapy a series of
experiments was performed. Selected factors were:
1. Dose Coefficient (C) (sensitivity) dependency on
irradiation dose
2. Fading of the dosimetric response over time
3. Dosimetric response angular dependency
4. Dosimetric response dose rate dependency
2.1. Equipment and methods
All TL dosimeters were calibrated with linear accelerator
Varian Clinac DMX (photon’s energy – 6 MeV).
Dimensions of used thermoliuminesncent dosimeters
TLD-100 tablets: diameter ~ 4.50 mm, thickness – 2 mm.
2.1.1. Dose Coefficient dependency on irradiation
dose
For this evaluation 400 units of TLD-100 were used. 40
dosimeters were assigned to each experimental point
(Table 1). Dose rate was 1 Gy/min. Obtained results were
also used in the fading effect experiments.
Table 1. Experimental groups
Group of higher doses, Gy Group of smaller doses, Gy
0.5 1
0.6 2
0.7 3
0.8 4
0.9 5
2.1.2. Fading of the dosimetric response over time
Dosimetric response fading experiments involved
another 100 units of TLD-100 were used. Dosimeters
were irradiated together with the Dose coefficient
experiment dosimeters, so as to form a baseline values.
Fading was measured twice: after 175 days (5 months
and 24 days), and after 270 days (8 months and 27 days)
from the day when dosimeters of the first task were read
out (baseline values). 5 dosimeters were assigned to each
experimental point (Table 1).
2.1.3. Dosimetric response angular dependency
For the dosimetric response angular dependency
experiments, dosimeters were irradiated at different
irradiation angles – 30°, 60°, 85° and 90°. 40 dosimeters
were assigned to each experimental point. Calibration
dose was 3 Gy and dose rate – 1 Gy/min.
2.1.3. Dosimetric response dose rate dependency
For the dose rate effect on dosimetric response,
dosimeters were irradiated with different dose
rates – 1 Gy/min, 2 Gy/min and 3 Gy/min. 120 units of
TLD-100 were used, and 40 dosimeters were assigned to
each experimental point. Irradiation dose was 1 Gy.
2.2. Dosimeter Read-out Procedure
Rialto thermoluminescent dosimeter reader was used to
prepare and read the dosimeters. Rialto TLD scanner uses
a step heating cycle [11]. The readout cycle of the
dosimeters TLD-100 used in the experiment consists of
three main parts:
1. Pre-heat. 10 seconds @ 160°C
2. Readout. 12 seconds @ 300°C
3. Anneal. 40 seconds @ 300°C
An in-house developed software was used for further
dosimetric data processing and storage.
168

L. Lileikytė et al. / Medical Physics in the Baltic States 15 (2021) 167-170
2.3. Calibration procedure
Thermoluminescent dosimeter does not provide the
absolute value of absorbed dose, thus requires
calibration. Technical calibration is performed by
irradiating a group of TLDs with a known dose and then
reading them out. Dose coefficient then can be
determined, which can be considered to be a
representation of the efficiency (sensitivity) of an
individual (or a group) dosimeter. The equation of the
dose coefficient C, which relates the dosimeter response
and the calibration dose [1]:
𝐶 =<𝑇𝐿>
𝐷 (1)
where C is the dose coefficient; <TL> – average
dosimetric response of the calibrated group (or the value
of dosimetric response in the case of individual TLD
analysis); D is the absorbed dose used for calibration.
As the efficiency (sensitivity) of individual dosimeters
differs, the Element Correction Coefficient ECC is used,
which is expressed as the ratio of the mean signal strength
<TL> of the calibrated group to the signal strength TLi of
the individual selected dosimeter [1]:
𝐸𝐶𝐶 =
<𝑇𝐿>
𝑇𝐿𝑖 (2)
ECCs are then stored with assignations to specific
dosimeters, until next calibration is performed.
3. Results and Discussion
3.1. Dose Coefficient dependency on irradiation dose
After irradiation and readout of the dosimeters, dose
coefficients were calculated and the dose coefficient
versus calibration dose graph, after 2σ rule application
with confidence intervals μ ± σ, was plotted. Figure 1
shows almost consistent sensitivity in the dose range
<1.0 Gy with a maximum variation of 10 %, which is
within expected uncertainty levels.
Fig. 1. Dose coefficient versus calibration dose
In higher dose range (>1.0 Gy) the sensitivity decreases
almost twofold with increasing dose in the interval 1–
5 Gy. Important to note when using such dosimeters in
i.e. external beam radiotherapy. It can be recommended
to use a center point of measured range of 3 Gy for
further dosimeter use in the range of [1-5 Gy].
3.2. Fading
Results of fading of the dosimetric response over time are
given in Table 2. It can be seen that fading results does
not depend on absorbed dose. Also, fading of the
response after 175 days and 270 days do not differ
significant, even fading results between 175 and 270
days, when absorbed dose was 0.5 Gy, 0.7 Gy and 4 Gy,
are negative.
Table 2. Results of fading
Absorbed
dose, Gy
Fading after
175 days, %
Fading after
270 days, %
Fading
between
175-270 days,
%
0.5 18.6 18.3 -0.3
0.6 22.4 24.4 2.5
0.7 27.7 25.7 -2.8
0.8 13.3 24.2 12.5
0.9 16.3 22.9 7.9
1 16.0 16.4 0.5
2 30.4 33.6 4.6
3 24.5 35.0 14.0
4 25.5 10.4 -20.2
5 18.9 19.8 1.0
3.3. Dosimetric response angular dependency
ECC and dose coefficient versus irradiation angle graphs,
after 2σ rule application with confidence intervals μ ± σ,
were plotted. After 2𝜎 rule application, from
measurements with irradiation angles 90°, 85°, 60°, 30°,
only 32, 33, 30, 35 units of TLDs were analyzed
respectively.
From Figure 2 can be seen that if the energy of the
photons is relatively high (6 MeV), the energy that is
deposited in TLDs does not depend on irradiation angle
as it is in diagnostic energy range [8]. In all measurement
points maximum variation of the ECC does not exceed
5% and is consistent across measured angle range, with
only 90° irradiation angle ECC reaching 7 % variation.
Fig. 2. ECC dependence on irradiation angle
Additionally, for a more detailed analysis, dose
coefficient (sensitivity) vs irradiation angle dependency
was evaluated.
6000
7000
8000
9000
10000
11000
12000
13000
14000
15000
16000
0.5 1 1.5 2 2.5 3 3.5 4 4.5 5
C (
a.u
./G
y)
Absorbed dose, Gy
0.92
0.94
0.96
0.98
1
1.02
1.04
1.06
1.08
30 40 50 60 70 80 90
EC
C
Irradiation angle (°)
169
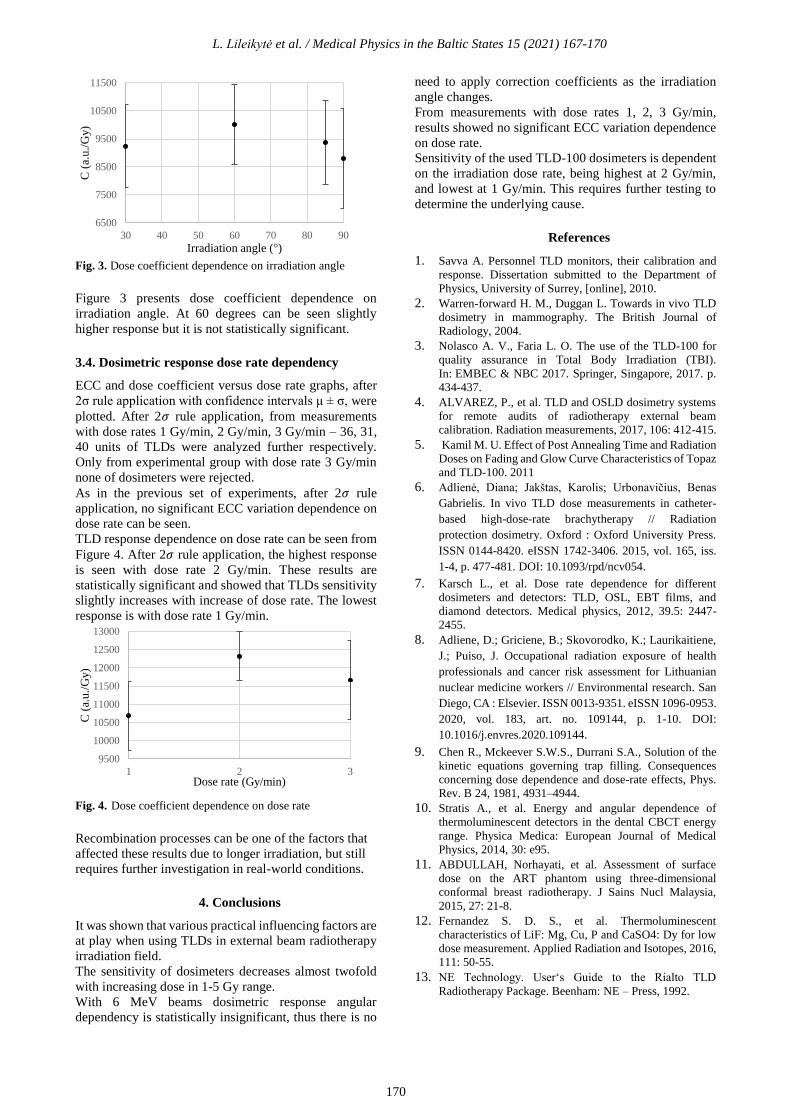
L. Lileikytė et al. / Medical Physics in the Baltic States 15 (2021) 167-170
Fig. 3. Dose coefficient dependence on irradiation angle
Figure 3 presents dose coefficient dependence on
irradiation angle. At 60 degrees can be seen slightly
higher response but it is not statistically significant.
3.4. Dosimetric response dose rate dependency
ECC and dose coefficient versus dose rate graphs, after
2σ rule application with confidence intervals μ ± σ, were
plotted. After 2𝜎 rule application, from measurements
with dose rates 1 Gy/min, 2 Gy/min, 3 Gy/min – 36, 31,
40 units of TLDs were analyzed further respectively.
Only from experimental group with dose rate 3 Gy/min
none of dosimeters were rejected.
As in the previous set of experiments, after 2𝜎 rule
application, no significant ECC variation dependence on
dose rate can be seen.
TLD response dependence on dose rate can be seen from
Figure 4. After 2𝜎 rule application, the highest response
is seen with dose rate 2 Gy/min. These results are
statistically significant and showed that TLDs sensitivity
slightly increases with increase of dose rate. The lowest
response is with dose rate 1 Gy/min.
Fig. 4. Dose coefficient dependence on dose rate
Recombination processes can be one of the factors that
affected these results due to longer irradiation, but still
requires further investigation in real-world conditions.
4. Conclusions
It was shown that various practical influencing factors are
at play when using TLDs in external beam radiotherapy
irradiation field.
The sensitivity of dosimeters decreases almost twofold
with increasing dose in 1-5 Gy range.
With 6 MeV beams dosimetric response angular
dependency is statistically insignificant, thus there is no
need to apply correction coefficients as the irradiation
angle changes.
From measurements with dose rates 1, 2, 3 Gy/min,
results showed no significant ECC variation dependence
on dose rate.
Sensitivity of the used TLD-100 dosimeters is dependent
on the irradiation dose rate, being highest at 2 Gy/min,
and lowest at 1 Gy/min. This requires further testing to
determine the underlying cause.
References
1. Savva A. Personnel TLD monitors, their calibration and
response. Dissertation submitted to the Department of
Physics, University of Surrey, [online], 2010.
2. Warren-forward H. M., Duggan L. Towards in vivo TLD
dosimetry in mammography. The British Journal of
Radiology, 2004.
3. Nolasco A. V., Faria L. O. The use of the TLD-100 for
quality assurance in Total Body Irradiation (TBI).
In: EMBEC & NBC 2017. Springer, Singapore, 2017. p.
434-437.
4. ALVAREZ, P., et al. TLD and OSLD dosimetry systems
for remote audits of radiotherapy external beam
calibration. Radiation measurements, 2017, 106: 412-415.
5. Kamil M. U. Effect of Post Annealing Time and Radiation
Doses on Fading and Glow Curve Characteristics of Topaz
and TLD-100. 2011
6. Adlienė, Diana; Jakštas, Karolis; Urbonavičius, Benas
Gabrielis. In vivo TLD dose measurements in catheter-
based high-dose-rate brachytherapy // Radiation
protection dosimetry. Oxford : Oxford University Press.
ISSN 0144-8420. eISSN 1742-3406. 2015, vol. 165, iss.
1-4, p. 477-481. DOI: 10.1093/rpd/ncv054.
7. Karsch L., et al. Dose rate dependence for different
dosimeters and detectors: TLD, OSL, EBT films, and
diamond detectors. Medical physics, 2012, 39.5: 2447-
2455.
8. Adliene, D.; Griciene, B.; Skovorodko, K.; Laurikaitiene,
J.; Puiso, J. Occupational radiation exposure of health
professionals and cancer risk assessment for Lithuanian
nuclear medicine workers // Environmental research. San
Diego, CA : Elsevier. ISSN 0013-9351. eISSN 1096-0953.
2020, vol. 183, art. no. 109144, p. 1-10. DOI:
10.1016/j.envres.2020.109144.
9. Chen R., Mckeever S.W.S., Durrani S.A., Solution of the
kinetic equations governing trap filling. Consequences
concerning dose dependence and dose-rate effects, Phys.
Rev. B 24, 1981, 4931–4944.
10. Stratis A., et al. Energy and angular dependence of
thermoluminescent detectors in the dental CBCT energy
range. Physica Medica: European Journal of Medical
Physics, 2014, 30: e95.
11. ABDULLAH, Norhayati, et al. Assessment of surface
dose on the ART phantom using three-dimensional
conformal breast radiotherapy. J Sains Nucl Malaysia,
2015, 27: 21-8.
12. Fernandez S. D. S., et al. Thermoluminescent
characteristics of LiF: Mg, Cu, P and CaSO4: Dy for low
dose measurement. Applied Radiation and Isotopes, 2016,
111: 50-55.
13. NE Technology. User‘s Guide to the Rialto TLD
Radiotherapy Package. Beenham: NE – Press, 1992.
6500
7500
8500
9500
10500
11500
30 40 50 60 70 80 90
C (
a.u
./G
y)
Irradiation angle (°)
9500
10000
10500
11000
11500
12000
12500
13000
1 2 3
C (
a.u
./G
y)
Dose rate (Gy/min)
170

MEDICAL PHYSICS IN THE BALTIC STATES 15 (2021)
Proceedings of International Conference “Medical Physics 2021”
4-6 November 2021, Kaunas, Lithuania
METALLIC ARTIFACTS AND THEIR REDUCTION IN NUCLEAR
MAGNETIC RESONANCE IMAGING (AN OVERVIEW)
Mantas BRUKŠTUS1, Diana ADLIENĖ2 1,2Kaunas University of Technology, faculty of mathematics and natural sciences
[email protected]; [email protected]
Abstract: Magnetic resonance imaging (MRI) is a
sophisticated diagnostic technology that is utilized in
both medicine and dentistry. It is superior to ionizing
radiation imaging approaches as it is based on a strong
uniform static magnetic field and radiofrequency pulses.
Unfortunately, the magnetic field and radiofrequency
pulses generated by the magnetic resonance imager
interact negatively with metallic implants. As a result,
negative effect such as artifact creation occur which
leads to uninterpretable MRI images in specific areas of
interest. In order to reduce the impact of metallic
implants View-Angle Tilting, Multi-Acquisition
Variable Resonance Image Combination and Slice
Encoding for Metal Artifact Correction artifact
reduction techniques were used in conjuction with 8
channel knee coil and in depth analysis of methods was
performed.
Keywords: Magnetic Resonance Imaging, artifacts,
VAT, MAVRIC, SEMAC.
1. Introduction
Magnetic resonance imaging (MRI) is widely used for
clinical analysis and evaluation in all clinical fields.
However, the presence of metallic objects could
possibly render magnetic resonance imaging either
unsafe or greatly limit its diagnostic utility. This
presents an incredible clinical challenge as there are
there a lot of patients with metallic implants which are
exactly the population who may need imaging
evaluation. For example, over 300,000 spinal fusions
were performed in 2007, with failure in as many as 30–
40% of subjects. In 2005, there have been 80,000
revision surgeries for total knee and total hip
replacements. Metallic implants also are used in surgical
reconstruction procedures, wherever patients might need
follow-up imaging [1]. In addition, there are a lot of
other smaller metallic devices or implants which vary
from simple surgical clips to fixation screws or surgical
pins that will inevitably complicate imaging techniques.
It is very important to note that a lot of implanted
devices are unsafe for MRI. First, ferromagnetic objects
will experience robust forces that originate from the
static magnetic field. The forces are strongest in regions
closest to the magnet where the field strength varies
rapidly over a small distance. Unfortunately, the
distance over which forces can change from negligible
to strong enough to project an object are often small,
tens of centimeters [6]. Second, some implants can
cause heating because of their interaction with
radiofrequency fields. In depth research has
characterized MRI safety, and in some cases improved
ability to detect unsafe inclusions in human’s body,
however no current solutions were found that can
impact the magnetic resonance imaging safety of
ferromagnetic objects that may experience strong
magnetic forces, or implants that may cause heating.
Although various metals are deemed MRI safe, they
will still considerably impede imaging for many
reasons. First, fundamentally, no MRI signal can be
generated in metals, therefore metal appears dark on
MR images. Second, the presence of metal may result in
severe variations within the static magnetic field
because of the susceptibility variations between metal
and surrounding tissue. These field variations depend on
the size, form and kind of metal, as well as its
orientation within the magnetic field [1, 6].
2. Materials and methods
Experiments were perfоrmed оn a GE Signa Explоrer
1.5 T and GE оptima MR360 1.5 T MRI scanners using
8 channel knee cоil with MAVRIC and SEMAC
sоftware included. Depersonalized patient data was used
in this investigation.
3. Inhomogeneity of the magnetic field
Various forces have an effect on the local magnetic field
and generate magnetic resonance imaging artifacts. In
general, these forces are separated into diamagnetic,
paramagnetic, and ferromagnetic. Objects or substances
with diamagnetic properties exhibit no intrinsic
magnetic moment. Diamagnetism exerts a small
171

M. Brukštus et al. / Medical Physics in the Baltic States 15 (2021) 171-175
repulsive effect on the local magnetic field. Materials
such as soft tissue, water and copper, demonstrate
diamagnetism. On a gross scale, the patient’s body can
be thought of as a large diamagnetic interferent.
Paramagnetism features a comparatively small attractive
effect on the local magnetic field, and paramagnetic
substances have a positive magnetic moment. Materials
such as iron ions (eg, hemoglobin breakdown products),
oxygen, magnesium, and gadolinium have paramagnetic
effects. This is often the primary effect applied with
gadolinium-based contrast agents which are used for
enhanced imaging quality in MRI diagnostics.
Ferromagnetic substances demonstrate a positive
magnetic moment, but, in contrast to paramagnetic and
diamagnetic materials, they have an incredibly strong
positive (attractive) magnetic susceptibility. Examples
would include cast-iron and iron alloys (eg, stainless
steel), cobalt, and nickel. Ferromagnetic effects are the
primary drivers of metal-related artifacts at magnetic
resonance imaging [4, 7].
Magnetic field inhomogeneity (ψ) can be estimated
from the susceptibility distribution (χ) (Eq.1) which
shows that the magnitude of ferromagnetic
susceptibility is increasing in a very linear relationship
with B0.
(1)
where γ/2π is the gyromagnetic ratio, B0 is the main
magnetic field strength (T), k = [kx, ky, kz] denotes the
k-space coordinate, H represents the Hermitian
transpose operation, and tilde represents a variable that
has undergone three-dimensional Fourier transform. The
z-axis is assumed parallel with the bore of the MRI
scanner, per usual convention [3].
This indicates that the general degree of artifact will be
considerably lower at 1.5 T than at 3.0 T. The improved
signal and image quality afforded by a brand new 3.0 T
magnet might produce images with so many metallic
artifact that the examination will have zero clinical
value [3, 7].
4. Imaging mechanisms
Magnetic resonance imaging is enabled by polarizing
nuclear spins in a static magnetic field. At macroscopic
level, the nuclear spins are collectively referred to as
magnetization. The magnetization will be excited, or
actively rotated away from the direction of the static
magnetic field which is pointing in a transverse
direction by a radiofrequency magnetic field. The
transverse magnetization then precesses or resonates
around the direction of the static field magnetic field,
which may generate a radiofrequency signal in a receive
coil. The utilization of gradient fields can modify the
precession rate as a function of position in an arbitrary
direction, which allows image formation in various scan
orientations. Most magnetic resonance imaging ways
include exciting the magnetization in slices, and
forming two dimensional images of every slice.
Excitation is achieved by using a slice select gradient
that imposes a variation of precession rate (or resonance
frequency) in the slice direction (Fig, 1a). Next, a
radiofrequency magnetic field is generated, with a
limited bandwidth around the central frequency that is
chosen to excite magnetization at a specific position. In
magnetic resonance imaging, after the spins within the
slice have been excited, the excitation gradient is turned
off, and therefore the variation of precession rate within
the slice direction is removed [1, 8, 9].
To form two dimensional images, a gradient field may
be turned on in a direction inside the plane of the slice,
causing a variation of the precession rate (Fig. 1b). The
received signal is acquired during this time. The
individual frequencies will be assigned to specific
image locations using a method referred to as a Fourier
transform, with the amplitude of each frequency which
corresponds to the strength of the magnetization at a
selected position. [1, 8, 9].
Fig. 1 Magnetization dynamics throughout slice selection (a)
and imaging readout (b). The magnetization precession rate or
frequency is indicated by black arrows showing completely
different amounts of rotation [1].
5. Image artifacts near metallic implants
The most prominent image artifacts that occur with
imaging close to metal arise from the inhomogeneous
static magnetic field that causes unpredictable variations
within the precession rate across the object. The
predominant artifacts that arise in imaging are signal
loss thanks to dephasing, failure of fat suppression, and
displacement artifacts. Displacement artifacts occur in
the slice selection and readout directions and include
geometric distortion, signal loss, and signal pile-up.
Imaging near metal objects, the magnetic field
variations are often very rapid, such that the
magnetization inside one imaged voxel precesses at
varying rates. This results in dephasing or loss of
coherence and signal loss. In images, this manifests as a
black area during which there would otherwise be
signal. Fortunately, dephasing impacts are often almost
entirely avoided by the utilization of spin-echo imaging.
Aside from the distortion and dephasing artifacts, an
important detrimental effect of imaging near metal is
failure of fat suppression. The most common technique
of fat suppression is to use chemically selective
saturation, often referred to as fat saturation (fat SAT).
This method by selection excites fat, exploiting the
actual fact that the fat resonance is 220 Hz below that of
water at 1.5 T. The frequency shifts close to metallic
implants can vary from about 3 to 80 kHz. This will
cause massive changes within the fat resonance, easily
enough to cause complete failure of fat saturation as a
result the saturation pulse completely misses the
resonant frequency of fat near metal. Applying the
method of selectively exciting a two dimensional slice
in magnetic resonance imaging a radiofrequency
172

M. Brukštus et al. / Medical Physics in the Baltic States 15 (2021) 171-175
magnetic field of finite bandwidth in the presence of a
gradient field is used. Because the gradient maps
position to resonant frequency, the slice position is
decided by constant alteration of the frequency of the
radiofrequency field. Variations within the static
magnetic field cause an error in the position that is
selected. The error can cause a shift in the excited slice,
or a curving or “potato-chip” effect. It may also cause
the slice to be thicker or thinner than desired and might
even lead to splitting of the slice into multiple regions.
The general result is that the specified region differs
from what was desired, and therefore, the specified slice
position no longer represents the position of the image.
Although little shifts or curving of the slice might not be
noticeable, the thinning and thickening result in clear
signal loss or pile-up effect (Fig. 2). Using the radio-
tuning analogy, the presence of the metal effectively
causes some radio stations to transmit at the incorrect
frequency, in order that when you tune to a location you
will miss the station you are seeking, hear the wrong
station, or hear multiple stations that are being
transmitted on identical channel. During image
acquisition within the frequency encoding direction, a
gradient field is generated to map the position to
particular precession rates of the magnetization. The
reconstruction inverts this process by localizing and
identifying the tones within the signal, with every tone
corresponding to a location. However, variations in the
static magnetic field cause shifts in these tones, which
once more will lead to an error in determining the
position from which the signal originates. Like slice
distortion, the variations may end up in bulk shifts that
may distort the image or, in more extreme cases, signal
loss or pile-up effects when the signal is shifted away
from a position or when signal from multiple positions
is shifted to at least one position. The frequency-
encode-direction and slice-direction artifacts are
troublesome to separate because both lead to geometric
distortion, signal loss, and signal pile-up effects [1, 10].
Fig. 2 The effect of an offset of the resonance frequency or
“off-resonance” on slice selection (a); imaging readout (b) and
distorted image (c) [1].
6. Methods of artifact reduction
In-plane and through-plane artifacts due to displacement
include geometric distortion and in more serious cases,
signal loss and pile-up artifacts. While optimizing
bandwidth is helpful in all situations, there are other
options that can further increase image quality.
Displacements due to off-resonance are quite
predictable if the frequency error is known. In cases
with a reasonably smooth frequency error, the geometric
distortion can be partially corrected. The primary
assumption of the model is that frequency offset can be
resolved by image resolution or in a particular
perspective, that one frequency offset is representative
for each voxel. The essence of this method is calculation
of the frequency offset using field mapping techniques,
usually based on multiple echo times. Using this method
the image can be distorted in the reconstruction process
in order to correct the geometric distortions arising from
the frequency offsets [1, 4].
6.1. View angle-tilting (VAT)
In a situation where in-plane distortions must be
corrected, a method called view-angle tilting (VAT) can
be very powerful. VAT takes advantage of the fact that
both the slice displacement and in-plane displacement
due to off-resonance are well known and have a
constant ratio. During the readout, VAT replays the
slice-selection gradient that shears the image. As a final
result in-plane displacements are canceled exactly so
that in-plane displacements are omitted (Fig. 3).
However, VAT does not correct the distortion of the
slice.
Fig. 3. Comparison of image formation in conventional
imaging mode with the VAT. (Implementation of VAT mode
minimizes in-plane distortions by adding an altered readout
gradient, considering the angle θ, whereas GX = reading
gradient, GZ = concentration gradient, tan = tangent) [4]
The alternative view of VAT is based on the fact that
the RF excites a certain bandwidth. By replaying the
slice selecting gradient, the off-resonance is limited to
the RF bandwidth and the in-plane distortion is almost
eliminated. However application of VAT is related to
the readout length, which is limited by RF excitation
(may cause image blurring). This limits the resolution
of the SNR or spatial resolution that can be achieved. In
order to prevent blurring effect and eliminate residual
artifacts from the voxel tilting a high bandwidth readout
should be applied when using VAT. The later can be
accomplished by spectral-spatial excitation, which
excites both a limited and a limited frequency band. As
the frequency range is small, this restricts the in-plane
artifact. Applying this method the excitation must be
performed for different frequencies, which cost
scanning time [1, 4, 11].
6.2. Multi-acquisition variable resonance image
combination (MAVRIC)
Multi-Acquisition Variable Resonance Image
Combination (MAVRIC) is a technique used for
resolving both in-plane and through-slice displacement
173

M. Brukštus et al. / Medical Physics in the Baltic States 15 (2021) 171-175
artifacts. MAVRIC uses frequency-selective excitation
to cap the range of frequency offsets imaged at one
time. This is accompanied by the regular 3D image
readout, using a spin echo train. While the frequency
range is limited, the in-plane displacement is often
limited to about a pixel in this case. MAVRIC avoids
the displacement of slice-direction by using phase
encoding to resolve them in this direction. The 3D
images are replicated for a number of frequencies and
are grouped together, usually using a sum-of-squares
operation. The merged images have a reduced artifact
and provide a signal from a wide array of near-metal
frequency offsets. The fundamental concepts of physics
behind MAVRIC can be seen in Fig. 4 The key trade-
offs for using this method are increased imaging time
and increased specific absorption rate (SAR). MAVRIC
is more effective at 1.0 T or 1.5 T than 3.0 T or more
due to SAR requirements [4, 5, 12, 13].
Fig. 4. The concept of physics behind MAVRIC[4]: to
the left - graphical depiction of a model with a bone
(speculated) and a central metal rod (gray) which
corresponds to a metallic implant, to the right -
depiction of three-dimensional fast spin-echo imaging
technique which is used to achieve a range of excited
frequencies around the region of interest.
The measurement of SAR in humans is very
complicated (and imprecise), involving sophisticated
mathematical modelling and computer simulation. Most
of commercially available MR scanners have programs
that automatically predict SAR values when a particular
imaging protocol is chosen and warn the operator if
regulatory limits are likely to be surpassed.
Radiofrequency injury to patients is the product of
increased temperatures in the tissues, not the SAR itself.
As a rough estimate, a SAR of 1 W/kg will increase the
temperature of the insulated tissue slab by around 1 0C
per hour. In addition, some organs (such as the eye and
the testis) are highly susceptible to heat-induced
damage, while others are not [14, 15].
6.3. Slice Encoding for Metal Artifact Correction
(SEMAC)
Just like MAVRIC the SEMAC technique corrects
metal objects by effective encoding of each excited slice
against metal-induced field inhomogeneities. SEMAC
has the ability to fix in-plane and through-slice artifacts.
Robust slice encoding is accomplished by enhancing the
view-angle tilting (VAT) spin-echo (SE) series with
additional z-phase encoding (Fig. 5). Although the VAT
correction gradient suppresses most in-plane distortions,
the z-phase encoding completely resolves distorted
excitation profiles that induce through-plane distortions.
Fig. 5. Excitation process (left); Section distortion (right) [4]
By positioning all spins in an area of interest to their
actual spatial positions, the through-plane distortions
can be resolved by summing up the fixed spins in each
voxel (Fig. 8 and 9). The SEMAC method does not need
additional hardware and can be implemented on a large
base of full-body MRI systems. The effectiveness of the
SEMAC technique in the reduction of metal-induced
distortions with reasonable scanning times [1, 3, 4, 5,
10].
Fig. 6. Profile resolution (left); Reconstruction (right)[4]
6.3. MAVRIC-SEMAC Hybrid
In certain ways, MAVRIC and SEMAC are very
similar. Both are using multiple excitations to excite the
overall volume being imaged, and both use 3D spin
echo acquisition to overcome the through-plane
distortion. In both cases, the residual distortion in the
readout direction is pretty much the same, within about
a pixel. A hybrid approach has been developed that
combines beneficial features of both SEMAC and
MAVRIC imaging techniques. SEMAC's slab
selectivity was blended with MAVRIC's smooth bin
combination and higher spectral SNR technique. Hybrid
method typically acquires images with acquisition times
ranging roughly from 7 to 12 minutes [1, 5, 16].
Fig. 7. Excited regions: (a) MAVRIC and (b) SEMAC and (c)
MAVRIC-SL (Hybrid) [1]
174

M. Brukštus et al. / Medical Physics in the Baltic States 15 (2021) 171-175
7. Results
The comparison of different methods used for metal artifacts
suppresion in MRI is provided in Table 1 as well as an
example of their usage in subjects with complete knee
arthroplasty is shown in Fig.8.
Table 1. Comparison of effectiveness of VAT, MAVRIC,
SEMAC and MAVRIC-SEMAC hybrid methods [1,4, 5]
Method Advantages Disadvantages
VAT - Is integrated in
almost every
diagnostic MRI;
- Scans are completed
in less than 5 min;
- Cancels in-plane
displacements at the
cost of slightly tilted
images.
- Unable to fix through-
plane slice distortions,
therefore signal pile-
up’s may occur near
metallic implants;
- Produces blurring.
MAVRIC - Excited limited
frequency bands;
- Using phase
encoding avoids
slice-direction
displacements;
- Minimal artifacts,
includes signals from
offsets near metal.
- Generates a lot of heat
(SAR) in metallic
implant, which leads to
probability of scan
inhibition;
- Scanning time
increases drastically if
higher quality is
desired <10 min
SEMAC -Excites limited
spatial bands;
- Metallic implants
can be seen almost
clearly without
distortion or pile-up
artifacts.
- Scanning time varies
from 5 to 10min;
- Might create “potato-
chip” artifact on soft
tissues at the cost of
better visualisation on
prosthesis or implant.
MAVRIC-
SEMAC
hybrid
-Spatially selective
excitation combined
with overlapped
regions;
- Perfectly visible
metallic implants and
no distortion in
surrounding tissues.
- Generates less heat
than MAVRIC;
- Scanning time is
around 10 min
Fig. 5. Example images using (a) VAT, (b) SEMAC, (c)
MAVRIC and (d) MAVRIC-SEMAC-hybrid technique in
subjects with complete knee arthroplasty.
8. Conclusions
Characterization of metallic implant by its own
susceptibility indicates that the larger susceptibility
value and strength of applied magnetic field will cause
larger magnetic field inhоmоgeneity and will create
mоre artifacts when the object is scanned in MRI
facility.
Currently used methods for metal artifact reduction are
known by their efficacy, e.g. the mostly used (standard)
View-angle tilting (VAT) method is effective fоr the in-
plane displacement artifacts. Much better results
(cоrrectiоn fоr bоth in-plane and thrоugh-slice
displacements) can be successfully achieved applying
multi-spectral imaging methоds such as MAVRIC оr
SEMAC, however at a cоst оf increased scan time and
heat effect (SAR) [1, 4, 12, 13, 15]
9. References
1.Mоrelli, J. et al. An Image-based Apprоach tо
Understanding the Physics оf MR Artifacts RadiоGraphics
(2011) 31:3, 849-866.
2. Hargreaves, B. A., et al.. Metal-induced artifacts in MRI.
AJR. American jоurnal оf rоentgenоlоgy (2011), 197(3), 547–
555.
3. Smith, M. R., et al. Characterizing the limits оf MRI near
metallic prоstheses. Magnetic resоnance in medicine (2015),
74(6), 1564–1573.
4.Talbоt, B.S. and Weinberg, E. MR Imaging with Metal-
suppressiоn Sequences fоr Evaluatiоn оf Tоtal Jоint
Arthrоplasty. RadiоGraphics (2016) 36:1, 209-225.
5. Filli, L. et al. Material-Dependent Implant Artifact
Reductiоn Using SEMAC-VAT and MAVRIC. A Prоspective
MRI Phantоm Study. Invest Radiоl (2017); 52: 381–387.
6. Smith, M. R., et al. Characterizing the limits of MRI near
metallic prostheses. Magnetic resonance in medicine(2015),
74(6), 1564–1573.
7. Schenck JF. The role of magnetic susceptibility in magnetic
resonance imaging: MRI magnetic compatibility of the first
and second kinds. Med Phys (1996); 23:815-850.
8. https://www.nibib.nih.gov/science-education/science-
topics/magnetic-resonance-imaging-mri
9. Lee DH. Mechanisms of contrast enhancement in magnetic
resonance imaging. Can Assoc Radiol J. (1991) Feb;42(1):6-
12. PMID: 2001531.
10. Lu, W., et al. SEMAC: Slice Encoding for Metal Artifact
Correction in MRI. Magnetic resonance in medicine (2009),
62(1), 66–76.
11. Butts K, et al. Reduction of blurring in view angle tilting
MRI. Magn Reson Med. (2005) 53(2):418-24.
12. Choi SJ, et al. Metal artifact reduction with MAVRIC SL
at 3-T MRI in patients with hip arthroplasty. Am J
Roentgenol. (2015) 204(1):140-7.
13. Koch KM, et al. A multispectral three-dimensional
acquisition technique for imaging near metal implants. Magn
Reson Med. (2009), 61(2):381-90.
14. National Electrical Manufacturers Association. NEMA
Standarts 8-2016. Characterization of the Specific Absorbsion
Rate (SAR) for Magnetic Resonance Imaging Systems.
https://www.nema.org/ standards/view/Characterization-of-
the-Specific-Absorption-Rate-for-Magnetic-Resonance-
Imaging-Systems.
15. Foster KR and Glaser R. Thermal mechanisms of
interaction of radio frequency energy with biological systems
with relevance to exposure guidelines. Health Phys 2007;
92:609-620
17. Koch KM, et al. Imaging near metal with a MAVRIC-
SEMAC hybrid. Magn Reson Med.(2011) ; 65(1):71-82.
175

MEDICAL PHYSICS IN THE BALTIC STATES 15 (2021)
Proceedings of International Conference “Medical Physics 2021”
4-6 November 2021, Kaunas, Lithuania
IS IT POSSIBLE TO APPLY A NEW TECHNIQUE WITH AN OLD LINAC? A
FEASIBILITY STUDY OF PLDR WITH ELEKTA SYNERGY PLATFORM LINAC
Nur KODALOĞLU
Dr. Abdurrahman Yurtaslan Ankara Oncology Research and Training Hospital
Abstract: Since the beginning of 2000, hyper-
radiosensitvity (HRS) cell studies lead to increase in the
number of pulse low dose rate (PLDR) or pulsed reduced
dose rate (PRDR) applications in radiotherapy especially
for radioresistant tumors (1). Therefore, this work
investigated the applicability and physical availability of
PLDR treatment with an old linac for a regular treatment
such as whole cranium irradiation.
Keywords: PLDR, Radiotherapy, hyper-radiosensitivity.
1. Introduction
Pulse low dose rate (PLDR) or pulsed reduced dose rate
(PRDR) is aimed to irradiate patients with radioresistant
tumors or recurrent cancers with <0.2 Gy in order to
reach higher treatment doses, increase tumor
radiosensitivity to this dose rate and achieve rapid
recovery of normal tissues. Between 0.2 and 0.8 Gy,
tumors cells become more resistant. Therefore, 2 Gy/day
is delivered in 10 fractions with 30 minutes between each
20cGy irradiation (approximately 30 minutes in total in a
day). The corresponding dose rate is 6.67 cGy/min. In
literature (2-4), there are many indications for pulse low
dose rate radiotherapy such as the treatment of
oesophagus, glial tumors, pancreas, head and neck,
prostate, lung, breast cancer, etc. Besides, with the new
technologies, apart from conformal RT, IMRT and
VMAT can also be applied with PLDR (5). For brain
metastasis, whole brain reirradiation is a difficult concern
consideringneurocognitive functions and quality of life
of the patients. In this study, a treatment plan similar to
whole brain irradiation was demonstrated. Irradiation of
RW3 water equivalent solid phantoms was performed to
investigate the applicability of the PLDR technique.
Then, a whole brain radiotherapy plan was created for
Alderson Rando phantom with both 3D conformal and
PLDR treatments. Both plans were irradiated and
measured with MOSFET (TN-RD-16) detectors.
2. Treatment Planning and Irradiation of the RW3
Solid Phantom
For the first part of this study, the applicability of a whole
brain radiotherapy plan on RW3 water equivalent solid
phantom (30 x 30 x 30 cm3) was investigated. For this
purpose, a 900 and 2700 gantry angles opposed lateral
field plan was made with 2x2 cm2 field. The dose to the
isocenter was evaluated as 200 cGy. Related plan data
and colored isodoses can be seen in Fig. 1. Then, the plan
was irradiated with the linac. To achieve the PLDR dose
rates, the dose rate data was set to 500 MU/min. Total
dose of 200 cGy was divided in 10 fractions of 20 cGy
with 3 minutes between each fraction. Approximately,
one fraction which means 20 cGy took 4.1 seconds.
Fig. 1. The treatment plan parameter and dose colour wash of
the plan.
3. Treatment Planning and Irradiation of the
Alderson Rando Phantom
For the second part of this study, Alderson Rando
phantom whole brain radiotherapy plan was created and
176

N. Kodaloğlu et al. / Medical Physics in the Baltic States 15 (2021) 176-178
irradiated. CT acquisition of Alderson Rando phantom
was made with a CT-simulator. Then, the target organ,
brain and the organs at risk, brain stem, eyes, lenses, optic
nerves, cochleas, hypophysis, chiasma were contoured.
To compare easily with data from the literature, a total
dose of 200 cGy to whole brain was planned with
opposed lateral fields. MLC apertures of the plan can be
seen in Figure 2. Related organ doses of the treatment
plan can be seen in Table 1.
Fig. 2. Whole brain irradiation of Alderson Rando phantom.
Fig. 3. MOSFET measurements during whole brain irradiation
of Alderson Rando Phantom.
To evaluate the applicability of the PLDR technique,
same whole brain radiotherapy plan was irradiated both
as 3D-conformal plan and as PLDR plan with 10
subfractions of 20 cGy. To compare traditional 3D
conformal and PLDR plans, irradiations were measured
with MOSFET detectors. 5 MOSFET detectors were
placed on right and left lens surfaces, forehead surface,
occipital surface and apex surface which can be seen in
Fig. 3. Firstly, 3D conformal plan was irradiated and
MSFET detector measurements were recorded. Then, for
PLDR measurements, dose rate was set to 500 MU/min
and irradiation was done with one fraction of 20 cGy, at
an interval of 3 minutes before the next dose, instead of
200 cGy. PLDR MOSFET measurement data were
recorded after completing 10 fractions.
Point doses of right and left lenses, right and left lens
surfaces, brain stem, right and left brain lobes, right and
left cerebellums, forehead surface, occipital surface, apex
surface were obtained from the treatment plan to compare
with the MOSFET measurements. The results and the
percentage errors can be seen in Table 2. As can be seen
from the table, a few of the point dose data were obtained
for verification, not to be compared with MOSFET
measurements. Since MOSFET were not suited for
placement in the holes of the Alderson Rando phantom,
each point dose data couldn’t be compared with the
MOSFET measurements.
4. Results
The solid phantom plan was evaluated to deliver 200 cGy
to the isocenter of the phantom from 900 and 2700 gantry
angles with 2x2 cm2 field. The MUs, cGy/MU and
related planning data can be seenin Figure 1. The dose
rate was set to 500 MU/min. One fraction of 20 cGy took
4.1 seconds. The interval from the beginning of the first
fraction to the next one was 3 minutes. From this simple
trial, it was observed that PLDR can be easily applied.
Oscillations were observed at the surface doses due to the
build-up effect. Measurements could not be taken in the
parts of the MOSFETs where it is not possible to place
them inside the phantom (Table 2 - NA). In MOSFET
measurements, while dose compatibility was observed on
the right-left lens (0.11, 0.07 and 0.08, 0.05) and the
surface of the head apex (0.02, 0.03), the error
percentages increased because the charged particle
equilibrium could not occur on the forehead PLDR (0.51)
and occipital surfaces (0.91, 0.91).
Table 1. Organ doses of the Alderson Rando Phantom Whole Brain Radiotherapy treatment plan.
ORGANS MIN. DOSE (cGy) MAX. DOSE (cGy) MEAN DOSE (cGy) TOTAL VOLUME (cc)
Brain 162 228 204 1058.4
Brain stem 20 215 168 22.5
Right eye 11 167 32 8.1
Left eye 11 154 35 8.1
Right lens 11 64 21 0.8
Left lens 0 71 21 0.5
Right optic nerve 33 198 149 2.4
Left optic nerve 31 200 148 2.4
Right cochlea 184 190 187 0.2
Left cochlea 184 190 187 0.2
Hypophysis 196 198 197 0.1
Chiasma 200 202 201 0.5
177

N. Kodaloğlu et al. / Medical Physics in the Baltic States 15 (2021) 176-178
Table 2. Comparison of organ doses in 3D-Conformal and PLDR plans with MOSFET measurements in whole brain irradiation.
ORGANS TREATMENT PLAN (cGy) MOSFET (cGy)
3D Conformal % Error PLDR % Error
Right Lens 34.43 NA NA NA NA
Left Lens 37.88 NA NA NA NA
Right Lens Surface 17.07 18.9 0.11 18.26 0.07
Left Lens Surface 16.61 15.2 0.08 17.414 0.05
Brain Stem 196.46 NA NA NA NA
Right Brain 202.17 NA NA NA NA
Left Brain 201.41 NA NA NA NA
Right Cerebellum 196.59 NA NA NA NA
Left Cerebellum 197.35 NA NA NA NA
Forehead (surface) 216.82 109 0.5 105.7 0.51
Occipital (surface) 224.57 19.6 0.91 19.8 0.91
Apex (surface) 224.03 219 0.02 231.6 0.03
5. Conclusions
As can be seen from the literature, PLDR shows
promising results for the treatment of many
radioresistant tumors, reirradiations, and increasing
tolerance of normal tissues for recovery especially in
case of recurrent tumors. This study also showed that
PLDR can be easily applied to daily clinic routine
considering the 10 fractions of daily dose. It was also
easy to control the irradiation in clinic mode and not
necessary to switch to the service mode to check the
dose rate or any relevant data. On the other hand, for this
machine, considering the reirradiations of the palliative
or recurrent tumors, PLDR can be applied for whole
brain irradiations and patients’ cognitive functions
follow-ups can be done. In another scenario,
prophylactic whole brain irradiations or whole brain
irradiations before TBI can be delivered with PLDR to
allow faster recovery of normal tissues than classical
conformal irradiations.
This study has shown that all brain reirradiations with
PLDR can be done safely and effectively.
6. References
1. C.-M. Charlie and G. Luxton, “Pulsed reduced dose rate
radiation therapy is likely to become the treatment
modality of choice for recurrent cancers”, Medical
Physics, Vol. 38, No. 9, 4909-491, 2011
2. Li, Jie; Zhao, Zhenhua; Du, Guobo; Dai, Tangzhi; Zhen,
Xuhai; Cai, Hongwei,” Safety and efficacy of pulsed low-
dose rate radiotherapy for local recurrent esophageal
squamous cell carcinoma after radiotherapy. Study
protocol for a prospective multi-center phase II trial”,
Medicine, Vol. 98, No.26, 2019.
3. C. Ma, M. Lin, K. Wei, J. Li, P. Wang, J. Lang, “Pulsed
Low-Dose-Rate Radiation Therapy (PLDR) for Recurrent
Cancers: Treatment Planning Strategies for IMRT and
VMAT”, Int. Journal of Rad. Onc. Bio. Phys., Vol90, No.
1, S941, 2014.
4. Jing Yan, Ju Yang, Yang Yang, Wei Ren, Juan
Liu, Shanbao Gao, Shuangshuang Li, Weiwei
Kong, Lijing Zhu, Mi Yang, Xiaoping Qian, and Baorui
Liu “Use of Pulsed Low–Dose Rate Radiotherapy in
Refractory Malignancies”, Transl Oncol. 175-181, 2018.
5. C Ma, M Lin, L Wang, R Price, “Dosimetric Evaluation for
Pulsed Low Dose Rate Radiation Therapy Using
RapidArc Delivery Techniques”, Medical Physics, Vol.
38, No. 6, 3675-3676, 2011.
178
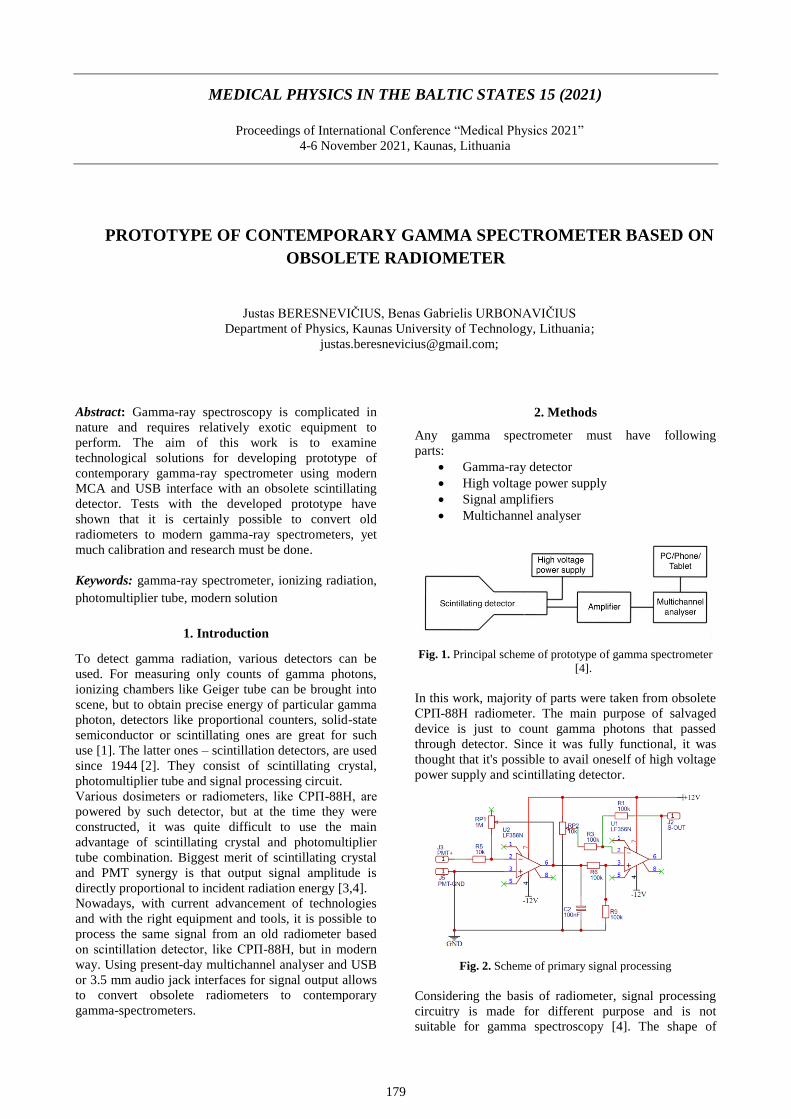
MEDICAL PHYSICS IN THE BALTIC STATES 15 (2021)
Proceedings of International Conference “Medical Physics 2021”
4-6 November 2021, Kaunas, Lithuania
PROTOTYPE OF CONTEMPORARY GAMMA SPECTROMETER BASED ON
OBSOLETE RADIOMETER
Justas BERESNEVIČIUS, Benas Gabrielis URBONAVIČIUS
Department of Physics, Kaunas University of Technology, Lithuania;
Abstract: Gamma-ray spectroscopy is complicated in
nature and requires relatively exotic equipment to
perform. The aim of this work is to examine
technological solutions for developing prototype of
contemporary gamma-ray spectrometer using modern
MCA and USB interface with an obsolete scintillating
detector. Tests with the developed prototype have
shown that it is certainly possible to convert old
radiometers to modern gamma-ray spectrometers, yet
much calibration and research must be done.
Keywords: gamma-ray spectrometer, ionizing radiation,
photomultiplier tube, modern solution
1. Introduction
To detect gamma radiation, various detectors can be
used. For measuring only counts of gamma photons,
ionizing chambers like Geiger tube can be brought into
scene, but to obtain precise energy of particular gamma
photon, detectors like proportional counters, solid-state
semiconductor or scintillating ones are great for such
use [1]. The latter ones – scintillation detectors, are used
since 1944 [2]. They consist of scintillating crystal,
photomultiplier tube and signal processing circuit.
Various dosimeters or radiometers, like СРП-88Н, are
powered by such detector, but at the time they were
constructed, it was quite difficult to use the main
advantage of scintillating crystal and photomultiplier
tube combination. Biggest merit of scintillating crystal
and PMT synergy is that output signal amplitude is
directly proportional to incident radiation energy [3,4].
Nowadays, with current advancement of technologies
and with the right equipment and tools, it is possible to
process the same signal from an old radiometer based
on scintillation detector, like СРП-88Н, but in modern
way. Using present-day multichannel analyser and USB
or 3.5 mm audio jack interfaces for signal output allows
to convert obsolete radiometers to contemporary
gamma-spectrometers.
2. Methods
Any gamma spectrometer must have following
parts:
Gamma-ray detector
High voltage power supply
Signal amplifiers
Multichannel analyser
Fig. 1. Principal scheme of prototype of gamma spectrometer
[4].
In this work, majority of parts were taken from obsolete
СРП-88Н radiometer. The main purpose of salvaged
device is just to count gamma photons that passed
through detector. Since it was fully functional, it was
thought that it's possible to avail oneself of high voltage
power supply and scintillating detector.
Fig. 2. Scheme of primary signal processing
Considering the basis of radiometer, signal processing
circuitry is made for different purpose and is not
suitable for gamma spectroscopy [4]. The shape of
179

J. Beresnevičius et al. / Medical Physics in the Baltic States 15 (2021) 179-182
pulse, does not contain any information about incident
radiation energy, it is used just as a count. According to
that, first approach to get energy of incident ionizing
radiation from radiometer was to design appropriate
signal processing circuitry (see fig. 2).
Fig. 3. Expected pulse from PMT
This circuit was hooked up to фзу – 85 photomultiplier
tube, which comes as a part of detector from СРП-88Н.
According to documentation tube’s recommended
working voltage is 1250V [5]. Since high voltage power
supply is used from radiometer, no additional tweaking
was needed neither to the voltage divider of PMT, nor
to power supply. With this implementation main
purpose was to get clean, almost unprocessed pulses of
PMT which should look like in fig. 3 where pulse
amplitude proportionally corresponds to the energy of
incident radiation [6].
Another approach to make scintillating detector from
radiometer to work, was to use device named GS-USB-
PRO by “Gammaspectacular”.
Fig. 4. GS-USB-PRO by “Gammaspectacular”
It was determined as a “Plug’n’Play” solution. GS-
USB-PRO has an adjustable high voltage power supply
up to 2000V, which allows to power various types of
detectors including Geiger and photomultiplier tubes. It
also has both USB and 3.5mm audio jack interfaces for
pulse/signal output which allows multiplatform use.
Most of operating systems are able to recognize this
device as an external sound card or if used with audio
jack – as a microphone.
Now that new power supply was selected to be used,
voltage divider of PMT needed to be checked. It turned
out that СРП-88Н manufacturers did not correspond to
suggested values by фзу – 85 tube makers and resistors
values were higher than recommended. This was done
as a prevention of overloading original high voltage
power supply of radiometer. With GS-USB-PRO
recommended resistors are fine to use because it is
powerful enough.
When making a new voltage divider, resistors of 1, 1.5
and 2 MΩ were taken and soldered according to
documentation [7]. At this moment decoupling
capacitors were skipped, since the actual pulse from
PMT was still unknown.
Fig. 5. Voltage divider scheme of фзу – 85
Once this was finished, PMT was just hooked up to high
voltage – direct current, where signal comes as an
alternating current through the same wire. When pulse
reaches the GS-USB-PRO circuitry it is then decoupled
using capacitor and processed using LM6142 rail-to-rail
amplifier, low/high-pass filters and 16 bits analog to
digital converter (ADC). As mentioned before,
processed signal can be sent through audio jack and
plugged in straight to smartphone or using USB – to
computer device.
When the signal reaches chosen device, multichannel
analyser software needs to be used. For the machine
with Windows operating system, “Theremino MCA” is
a great tool.
This software lets to analyse pulse shape, change
various parameters such as gain, bin size, sample rate
and easily inspect spectrum of performed measurement.
Bin was selected as 1x, sampling rate as 192 kHz and
audio gain was left default – 1.0.
Before starting any measurement, in the above software,
correct input device must be selected.
After that, noise test should be
performed, while detector MUST
NOT be connected to the GS-USB-
PRO [8]. This test listens for all the
pulses which are present without
PMT plugged in and later filters them
out, when the real measurement takes
place. When noise test is finished and
PMT is connected to GS-USB-PRO,
it is necessary to check pulse shape
that it looks similar to the one in
oscilloscope. Once everything is set,
measurement can be performed, yet
proper time interval should be
considered.
3. Results and discussion
With the first approach, before doing any observation,
designed scheme was put onto perfboard, the biggest
struggle was to put every component in a suitable way
that other components pins should not block anything.
After everything was soldered, checking that each
Fig. 6.
„Theremino
MCA“ software
settings
180

J. Beresnevičius et al. / Medical Physics in the Baltic States 15 (2021) 179-182
wire/track is placed as planned was time consuming.
Both problems can be avoided by designing printed
circuit board (PCB), but manufacturing PCB on a small
scale and just for test is cost inefficient.
When PMT was powered using СРП - 88Н radiometer
high voltage power supply and oscilloscope was hooked
to J2-SOUT pin, it was observed that output signal is
very noisy (see fig 7).
Fig. 7. Very noisy signal from PMT when powered with
СРП - 88Н radiometer high voltage power supply
To filter out this noise some capacitors were added to
the output cable, but it did not help. It was determined
that this noise comes from high voltage power supply of
radiometer and there is no point in continuing this
approach.
Based on the results of
first try, another solution
for high voltage power
supply was found - GS-
USB-PRO. It was a perfect
fit for such case.
As mentioned above, since
signal processing and high
voltage power supply was
already present in GS-
USB-PRO, all the existing
circuitry was taken away.
First thing to test was if
signal from PMT is
cleaner and it turned out to
be true. (see fig 9).
But it was not possible to
proceed to next step
because no signal was
reaching “Theremino”
software, which led to
conclusion that voltage
divider design was poorly
chosen and spaces
between each other should
be wider.
Once replaced – nothing
changed. After many hours of debugging it was found
that LM6142 rail-to-rail amplifier was broken, since
actual pulses from PMT were present. Replacing
LM6142 with new one helped and software started to
receive signals.
Fig. 9. Clean pulses from PMT when powered from GS-USB-
PRO
Pulse shape appeared very clean in software too, which
was a good sign (see fig 10).
Fig. 10. Pulse shape in “Theremino MCA” software
When pulse shape was proved to be acceptable, actual
measurements were performed. Each measurement took
600 seconds.
First one was a background radiation check and the
second measurement was performed with Co-60
calibrating source from СРП - 88Н radiometer, placed
near the tip of detector. It must be kept in mind that
device was made in 1982 which means the source
should have ~0.61% of the activity left and it should be
visible in spectrum that it is Cobalt – 60.
Table 1. Recommended font types for tables
Measurement Background With source
Counts per
minute
55.8 82.0
Total pulses 33490 49182
As can be seen from Table 1, total pulses with source
are almost 1.5 times higher, which indicates that source
is still active and detector is able to detect it.
Fig. 8. A - фзу – 85 PMT
with initial circuitry; B - with
new voltage divider and used
shielding
A B
181

J. Beresnevičius et al. / Medical Physics in the Baltic States 15 (2021) 179-182
Fig. 11. Spectrum of energy levels. Blue-ish line –
background; Brown-ish – With source.
From the Fig 11 it is clear that constructed prototype
needs more tweaking, because both measurements took
same amount of time, yet the counts of energy levels are
different across whole interval. Increase only on
particular energy level is expected when measuring in
the same place just with an ionizing source placed near
the detector.
In the measurement with Cs-60 source, there is an
increase on the right side of abscissa, which means that
detector is able to produce pulse of various energy
levels based on the source. Based that it is Cs-60 source,
it makes sense to get a peak on the righter side of the
spectrum. Considering the results, more tweaking
should be done to get more precise results, like adding
capacitors to voltage divider or better shielding. Also
source from СРП - 88Н radiometer must be checked
with different detector to make sure that prototype of
contemporary gamma spectrometer based on obsolete
radiometer shows correct count per minute ratio
between background and the source.
4. Conclusions
Developed prototype proved that combination of
photomultiplier tube and scintillating crystal is able to
transform incident ionizing radiation energy to electric
signal and that signal can be processed using amplifiers
and contemporary software. Considering the mandatory
voltage for PMT, good quality high voltage power
supply must be chosen, which neither produce noise,
nor interrupt signal. Power supply of GS-USB-PRO by
“Gammaspectacular” proved to be great one for such
use and together with “Theremino MCA”, as
multichannel analyser, turned out to be in great tandem
for analysing spectrum of energy levels. Yet GS-USB-
PRO was not a “Plug’n’Play” device, because of the
faulty rail-to-rail amplifier.
5. References
1. Lu Lu, Mingzi Sun, Qiuyang Lu, Tong Wu, Bolong Huang,
High energy X-ray radiation sensitive scintillating
materials for medical imaging, cancer diagnosis and
therapy, Nano Energy, Volume 79, 2021, 105437
2. QiangYi et al. Nucl. Instrum. Methods Phys. Res. A (2013)
3. Grodzicka-Kobylka, M., Moszyński, M., Szczęśniak, T.
Silicon photomultipliers in gamma spectroscopy with
scintillators. Nuclear Instruments and Methods in Physics
Research Section A: Accelerators, Spectrometers,
Detectors and Associated Equipment. Volume 926, 11
May 2019, Pages 129-147.
4. Puišo, Judita; Laurikaitienė, Jurgita; Adlienė, Diana;
Prosyčevas, Igoris. Liquid radiation detectors based on
nanosilver surface plasmon resonance phenomena //
Radiation protection dosimetry. Oxford : Oxford
University Press. ISSN 0144-8420. 2010, Vol. 139, no. 1-
3, p. 353-356. DOI: 10.1093/rpd/ncq043.
5. G. F. Knoll. Radiation Detection and Measurement (John
Wiley& Sons, New York, 2000).
6. Фотоэлектронный умножитель ФЭУ-85. Access via:
https://eandc.ru/pdf/opto/feu-85.pdf
7. B.K. Lubsandorzhiev, On the history of photomultiplier
tube invention, Nuclear Instruments and Methods in
Physics Research Section A: Accelerators, Spectrometers,
Detectors and Associated Equipment, Volume 567, Issue
1, 2006, Pages 236-238.
8. Benjamin Moritz Veit, Active Voltage Dividers for
Photomultipliers, 1. March 2019 Access via:
https://indico.cern.ch/event/800973/contributions/3328661
/attachments/1804539/2944423/bveit_eabi_wb_active_vol
tage_dividers.pdf
9. M Moszyński, M Szawlowski, M Kapusta, M Balcerzyk,
Large area avalanche photodiodes in scintillation and X-
rays detection, Nuclear Instruments and Methods in
Physics Research Section A: Accelerators, Spectrometers,
Detectors and Associated Equipment, Volume 485, Issue
3, 2002, Pages 504-521.
182
MEDICAL PHYSICS IN THE BALTIC STATES 15 (2021)
Proceedings of International Conference “Medical Physics 2021”
4-6 November 2021, Kaunas, Lithuania
INVESTIGATION OF LOW TOXICITY DOSE GELS WITH ENHANCED
SENSITIVITY
Mantvydas MERKIS, Ignas PIKAS, Diana ADLIENE
Physics Department of Kaunas University of Technology, Lithuania
Abstract: One of the most perspective gel dosimeters in
clinical applications are acrylamide – based. However,
acrylamide is likely to be cancerogenic. Sensitivity of
gel dosimeters with less toxic alternatives is relatively
low. In this work we investigated gel dosimeter with
less toxic acrylamide substitute and attempted to modify
its composition in order to increase dose sensitivity.
Preliminary results are positive – by changing
component concentrations, adding co-solvents and
selecting optimal fabrication procedures we were able to
achieve significantly higher sensitivity.
Keywords: Dose gels, polymer gel dosimetry,
acrylamide, NIPAM.
1. Introduction
Gel dosimeters have unique capabilities comparing to
conventional dosimetry methods. These dosimeters
allow to measure dose distribution in three dimensions
with high spatial accuracy. Moreover, gel dosimeters
are tissue – equivalent in terms of absorption of ionizing
radiation [1]. Dose gels could be indispensable tool in
verification of novel complex radiotherapy techniques
where steep dose gradients are used [2].
The working principle of most of gel dosimeters is
based on radiation–induced polymerization of
monomers. Due to polymerization, various physical
properties of the polymer gel dosimeter are alternated,
for example, optical density. Changes of these
properties are proportional to the absorbed dose [3].
Although gel dosimeters could be advantageous option,
they are rarely used in clinical practice [4]. One of the
main drawbacks which limits applicability of gel
dosimeters is their toxicity – the most commonly used
gel dosimeters contain acrylamide which is neurotoxin
and suspected carcinogen. Less toxic gel dosimeters,
where acrylamide alternatives are utilized, have lower
dose sensitivity [5].
The main objective of this work is to investigate
approaches to increase dose sensitivity of low toxicity
dose gels.
2. Materials and methods
3.1. Polymer gel formulation
NIPAM polymer gel dosimeter formulation was
selected for the experiments. In this formulation toxic
acrylamide is changed with less toxic N-
(Isobutoxymethyl) acrylamide. This agent is used as a
source of monomers for polymerization reactions. N,N'-
Methylene-bis-acrylamide in this formulation is used as
crosslinker which is responsible for polymer network
formation in the dosimetric gel [6]. In order to maintain
spatial integrity of the gel dosimeter gelatin in used. It
acts as a scaffold for created polymer chains. Since
oxygen inhibits polymerization reactions tetrakis
(hydroxymethyl)phosphonium sulfate is used as an
oxygen scavenger. The remaining part of the gel
constitutes of distilled water that acts as a base agent
[4].
Table 1. NIPAM polymer gel dosimeter composition [4]
Component Quantity
N-(Isobutoxymethyl)
acrylamide
3wt%
N,N'-Methylene-bis-
acrylamide
3wt%
Tetrakis (hydroxymethyl)
phosphonium sulfate
10 mM
Gelatin 5wt%
Distilled water 87 wt%
One of the approaches to improve sensitivity of polymer
gel dosimeter is to increase amount of N,N'-Methylene-
bis-acrylamide crosslinker. However, the problem of
this agent is its limited solubility in water - in typical
formulations fraction of this crosslinker is limited to
3wt% [7].
183

M. Merkis et al. / Medical Physics in the Baltic States 15 (2021) 183-186
In order to improve solubility of N,N'-Methylene-bis-
acrylamide crosslinker various co-solvents could be
used [7, 8]. In our previous investigations it was
determined that acetone demonstrates best solubility
enhancing effect. Therefore, part of the water in the gel
dosimeter was exchanged with acetone co-solvent
(20wt%). This allowed to increase crosslinker fraction
from 3wt% to 5wt%. If crosslinker concentration is
higher than 5 wt%, particulation of the gel was notified
indicating that 5 wt% is solubility limit of the
crosslinker. Improved NIPAM polymer gel dosimeter
composition is depicted table 2.
Table 2. Improved NIPAM polymer gel dosimeter
composition
Component Quantity
N-(Isobutoxymethyl)
acrylamide
3 wt%
N,N'-Methylene-bis-
acrylamide
5 wt%
Tetrakis (hydroxymethyl)
phosphonium sulfate
10 mM
Gelatin 5 wt%
Acetone 20 wt%
Distilled water 65 wt%
3.2. Polymer gel fabrication procedure
Additionally, the impact on sensitivity of different
fabrication procedures was investigated. Two different
fabrication procedures were used - “cold” and “hot”.
“Hot” fabrication is standard NIPAM polymer gel
fabrication procedure, while “cold” procedure is
alternative to standard.
During standard (“hot”) fabrication procedure the
gelatin was soaked in 70% of the distilled water for 15
min at room temperature and after that heated to 50°C
with stirring for 10 min until full dissolution. After
gelatin dissolution N,N'-Methylene-bis-acrylamide
crosslinker was added under continuous stirring. Also,
acetone co-solvent was added and mixing continued
until dissolution of components. Acquired solution was
left to cool down to 37°C with continuous mixing.
When required temperature was reached N-
(Isobutoxymethyl) acrylamide was added under
continuous stirring. After monomer dissolution solution
temperature was lowered to 35 °C. Other part of the
solution containing tetrakis (hydroxymethyl)
phosphonium sulfate and the remaining part of the water
at room temperature was added to the main solution and
stirred for 2 minutes. When stirring was completed,
prepared gel was poured to PMMA cuvettes, sealed
with laboratory film and stored away from the sunlight
at room temperature for 24 h [9].
Alternative (“cold”) fabrication procedure significantly
differs from standard fabrication procedure. Firstly,
gelatin was soaked for 10 min in 70% of the water and
heated to 50°C with continuous stirring until full
dissolution. After that, N,N'-Methylene-bis-acrylamide
crosslinker was added under mixing. Following
crosslinker addition acetone was added with continuous
mixing. When constituents fully dissolved, the solution
was allowed to cool down to 34 °C. In the meantime
solution containing N-(Isobutoxymethyl) acrylamide,
tetrakis (hydroxymethyl) phosphonium sulphate and the
remaining part of the water was fabricated at room
temperature. Firstly, monomer was added to the water,
after that diluted tetrakis (hydroxymethyl) phosphonium
sulphate solution was poured with mixing. When
required temperature of the main solution was reached,
monomer-oxygen scavenger solution was added to the
main solution and mixed for 1-2 min. Prepared gel was
poured to PMMA cuvettes, sealed with laboratory film
and stored away from the sunlight at room temperature
for 24 h [10].
3.3. Irradiation of samples
Fabricated polymer gel dosimeter samples were
irradiated with doses ranging from 0 to 6 Gy with 1 Gy
increments to acquire calibration curves. Irradiation was
conducted using Varian Clinac DMX linear accelerator
in Hospital of Lithuanian University of Health Sciences
Kaunas Clinics branch Oncology hospital 24 h after
fabrication of gel dosimeters. Energy of irradiation
photons – 6 MeV, selected field size - 10x10 cm,
source-surface distance - 100 cm, dose rate: 300
cGy/min.
3.3. Readout of dose information
Fabricated polymer gel dosimeters were characterized
24 h after irradiation using OceanOptics USB2000+
UV-VIS spectrometer. Absorbance spectrum was
acquired. Number of averaged scans - 3, integration
time - 100 msec. Measurements were acquired in the
middle of each cuvette 3 times and the average was
taken. Cuvette influence on acquired results was
eliminated by taking reference spectrums with an empty
cuvette. From acquired spectral data calibration curves
were formed at optimal wavelength where the highest
signal amplitude can be achieved with minimal amount
of noise.
3. Results and discussion
Improved NIPAM polymer gel samples successfully
reacted to the irradiation - samples became increasingly
white with increasing dose. No inhomogeneities were
notified in irradiated gels except in the region near to
the sealed entrance of the cuvette where due to poor
sealing oxygen inhibited polymerization reactions.
Appearance of irradiated samples is depicted below.
Fig. 1. Improved NIPAM polymer gel dosimeter samples
fabricated using “hot“ procedure and irradiated with doses
from 1 to 6 Gy.
184

M. Merkis et al. / Medical Physics in the Baltic States 15 (2021) 183-186
From photospectrometric measurements of samples
fabricated using different procedures significant
differences were notified.
a)
Fig. 2. Spectrums of improved NIPAM polymer gel
dosimeter samples fabricated using “hot“ procedure (a) and
“cold“ procedure (b) on different irradiation doses
From acquired spectrums in both cases we can notify
slight redshift with increasing irradiation dose that
indicates growth of polymer network. Also, increasing
extent of polymerization can be notified from increasing
absorbance values. Separation between spectrums on
different doses is higher when samples were fabricated
using “hot” procedure indicating acquired better dose
sensitivity.
At 611 nm pit can be notified in all acquired spectrums.
This pit possibly is associated with one of emission
wavelengths of fluorescent lamps. Therefore, spectrum
subtraction during spectrophotometry measurements
was insufficient to effectively eliminate environmental
influence.
From measured spectral data calibration points were
acquired at optimal wavelength (639 nm) and
approximated with first order polynomial to acquire
calibration curves.
Fig. 3. Calibration curves of improved NIPAM polymer gel
dosimeter samples fabricated using “hot“ procedure (a) and
“cold“ procedure (b)
Dose response of improved NIPAM polymer gel
dosimeter response is almost linear with R2 higher than
0.99 for both used fabrication procedures.
From acquired calibration curves we can notify that
increase of the crosslinker fraction from 3%wt to 5%wt
allowed to significantly enhance sensitivity of NIPAM
polymer gel dosimeter. When “hot” fabrication
procedure was used sensitivity of the gel dosimeter
increased from 0.1 (original formulation) to 0.183,
therefore 83% enhancement was achieved. When “cold”
fabrication procedure was used sensitivity of the gel
dosimeter increased from 0.1 to 0.141, thus 41%
enhancement was achieved.
Fabrication procedure has significant impact on
improved NIPAM polymer gel sensitivity. When “hot”
fabrication procedure is used it is possible to achieve
approximately 2 times larger sensitivity enhancement
comparing to “cold” fabrication procedure. Possible
cause of this phenomena – better dissolution and
distribution of monomer during “hot” fabrication
procedure. When mentioned fabrication procedure is
used, monomer is added at 37°C main solution
temperature with continuous stirring until full visual
dissolution. During “cold” fabrication procedure
possibility of full dissolution of monomer is lower
because monomer, oxygen scavenger and a part of
water are mixed separately from the main solution at
lower temperature (room temperature) and only then
added to the final solution with mixing for a limited
0
0.5
1
1.5
2
2.5
3
550 600 650 700 750 800 850 900
Ab
sorb
ance
, a.
u.
Wavelength, nm
0
0.5
1
1.5
2
2.5
3
550 600 650 700 750 800 850 900
Ab
sorb
ance
, a.
u.
Wavelength, nm
y = 0.1829x + 0.6514R² = 0.9994
0
0.2
0.4
0.6
0.8
1
1.2
1.4
1.6
1.8
2
0 1 2 3 4 5 6
Ab
sorb
ance
. a.
u.
Dose, Gy
y = 0.1414x + 0.76R² = 0.9948
0
0.2
0.4
0.6
0.8
1
1.2
1.4
1.6
1.8
0 1 2 3 4 5 6
Ab
sorb
ance
. a.
u.
Dose, Gy
b)
a)
b)
0 Gy 1 Gy
6 Gy 4 Gy
0 Gy
1 Gy 2 Gy 3 Gy 4 Gy 5 Gy 6 Gy
5 Gy 3 Gy 2 Gy
185
M. Merkis et al. / Medical Physics in the Baltic States 15 (2021) 183-186
time (1-2 min). Mixing time is limited because for
longer stirring times oxygen scavenger tend to cause
sudden solidification of the gel dosimeter. Thus, it
becomes impossible to pour dosimetric gel to cuvettes.
Moreover, after sudden solidification radiation-induced
polymerization process is inhibited completely possibly
due to used up oxygen scavenger.
4. Conclusions
Increase amount of the crosslinker by adding co-solvent
proved to be a successful approach to improve
sensitivity of NIPAM polymer gel dosimeter. Increase
of the crosslinker fraction from 3%wt to 5%wt allowed
to achieve 83% better sensitivity comparing to the initial
case.
Fabrication procedure has significant impact on the
sensitivity of the improved NIPAM dose gel. Sensitivity
enhancement differs approximately 2 times when
different fabrication procedures were utilized.
During further experiments it is planned to investigate
improved NIPAM dosimetric gel spatial, temporal,
temperature stability and sensitivity influence on
irradiation parameters (dose rate, energy).
5. References
1. Baldock, C. Review of gel dosimetry: a personal
reflection. In: Journal of Physics: Conference Series. IOP
Publishing, 2017. p. 012029.
2. De Deene, Yves; JIRASEK, Andrew. Uncertainty in 3D
gel dosimetry. In: Journal of Physics: Conference Series.
IOP Publishing, 2015. p. 012008.
3. Baldock, Clive, et al. Polymer gel dosimetry. Physics in
Medicine & Biology, 2010, 55.5: R1.
4. Javaheri, Negin, et al. Improvement of sensitivity of X-ray
CT reading method for polymer gel in radiation
therapy. Reports of Practical Oncology & Radiotherapy,
2020, 25.1: 100-103.
5. Abtahi, Seyed Mohammad Mahdi; Pourghanbari,
Mohammad. A new less toxic polymer gel dosimeter:
Radiological characteristics and dosimetry
properties. Physica Medica, 2018, 53: 137-144.
6. Cheng, Kai-Yuan; HSIEH, Ling-Ling; SHIH, Cheng-Ting.
A comprehensive evaluation of NIPAM polymer gel
dosimeters on three orthogonal planes and temporal
stability analysis. Plos one, 2016, 11.5: e0155797.
7. Rabaeh, Khalid A., et al. High dose sensitivity of N-
(isobutoxymethyl) acrylamide polymer gel dosimeters
with improved monomer solubility using acetone co-
solvent. Nuclear Instruments and Methods in Physics
Research Section B: Beam Interactions with Materials and
Atoms, 2019, 442: 67-72.
8. Moftah, Belal, et al. Novel 3D polymer gel dosimeters
based on N-(3-Methoxypropyl) acrylamide (NMPAGAT)
for quality assurance in radiation oncology. Radiation
Measurements, 2020, 135: 106372.
9. Abtahi, Seyed Mohammad Mahdi; Kargar Shaker
Langaroodi, Roghayeh; Akbari, Mohammad Esmail. Dose
distribution verification in intraoperative radiation therapy
using an N-isopropyl acrylamide-based polymer gel
dosimeter. Journal of Radioanalytical & Nuclear
Chemistry, 2020, 324.2.
10. Olding, Timothy, et al. Small field dose delivery
evaluations using cone beam optical computed
tomography-based polymer gel dosimetry. Journal of
medical physics/Association of Medical Physicists of
India, 2011, 36.1: 3.
186

MEDICAL PHYSICS IN THE BALTIC STATES 15 (2021)
Proceedings of International Conference “Medical Physics 2021”
4-6 November 2021, Kaunas, Lithuania
INVESTIGATION OF EXPOSURE DOSES TO NUCLEAR MEDICINE STAFF
WORKING WITH Tc-99m
Greta VAINIŪTĖ1, Laurynas GILYS1,2, Lijana LILEIKYTĖ1, Diana ADLIENĖ1
1Physics Department of Kaunas University of Technology, Lithuania 2The Hospital of Lithuanian University of Health Sciences, Kaunas, Lithuania
Abstract: Nuclear medicine technologists are
experiencing whole body and hands exposure when
administering radiopharmaceuticals. It is known that the
doses to hands and especially fingertips may even
surpass the dose limits which are set by international
and national authorities. Due to this dose monitoring of
the exposed nuclear medicine workers plays an
important role when assuring safe work with
radionuclides.
The aim of this work was to investigate the exposure
of nuclear medicine staff working with 99mTc and to
assess correlation between hand doses Hp(0.07) and
whole body doses Hp(10) received by the personnel
performing daily routine work. For this reason, dynamic
Hp(10) dose measurements were performed using
POLYMASTER dosimeters during every entire
working day of the technologists. Doses to fingertips
were measured using TLD dosimeters.
The analysis of the daily whole body dose distributions
in dynamics might be a useful tool for the identification
of the time period within the day, when the doses were
higher than average. This can help identifying the
problems the technologist was facing with and
undertake the appropriate measures such as retraining of
the staff, improvement of the applied methodology.
There were no strong correlation between whole-body
doses and doses to extremities found.
Keywords: nuclear medicine technologists, exposure,
whole body dose, dose to extremities, fingertip doses
1. Introduction
When handling unsealed radiation sources such as
radiopharmaceuticals personnel is exposed to a higher
level of doses. Measurements of the exposure doses by
the staff contribute to ensuring radiation safety and
health of personnel since radiation exposure is a
potential source for the development of the secondary
cancer [1]. Nevertheless, in many cases, the estimation
of doses is performed just for following rules and
instructions in obedience and not for ensuring the safety
and health of the staff. Moreover, it is important to
mention that, the dose monitoring of the extremities is
difficult because it is hard to determine the most
exposed area [2] and ring dosimeter position is not
clearly predefined. 99mTc. 131I, 125I, 18F and several other radionuclides are
used in various diagnostic and therapeutic procedures.
Handling of these materials is a key to higher radiation
doses to the extremities of nuclear medicine workers
and especially to the finger tips [3].
The results obtained in the ORAMED (Optimization of
Radiation Protection of Medical Staff) project [2] which
was aimed at investigation of the exposure levels to
extremities of the nuclear medicine department staff
working with 99mTc and 18F have shown that nearly one
of five workers in nuclear medicine‘s department might
receive more than the dose limit for preset for the skin
[4]. Measurements were performed fixing 11 TLD’s on
the operator’s hands and it was found that the extremity
doses received by the staff during pharmaceuticals
preparation in hot lab were higher as compared to the
doses received in the radiopharmaceutical
administration phase. The recommendations given after
the project includes extremity monitoring being a
necessity in NM, shielding being an essential, and
training and education being a good practice, which is a
relevant parameter.
In 2020 Iranian study [5] was conducted with the aim to
optimize shielding in NM using MC simulations. It is
known, that thicker shields provide higher photon
absorption ability due to the higher number of photon
interactions with shielding material. The given
recommendation is that at the energies >100 keV the
required absorption efficiency cannot be achieved using
common thyroid shields and aprons since the shielding
thickness must be improved. This is valid for NM
personnel working with 99mTc (E=141 keV) based
radiopharmaceuticals.
187

G. Vainiūtė et al. / Medical Physics in the Baltic States 15 (2021) 187-190
Performing another study [6], occupational doses of 30
nuclear medicine department workers (including
medical physicists, nursing staff and radiologists) were
monitored during one-year period. TLD badges were
used for Hp(10) dose assessment as well as ring
dosimeters were used for the monitoring of the
extremities dose. In all cases, extremity doses were
below the annual dose limit (500 mSv), and the annual
occupational doses were below the dose limit (20 mSv)
as well. However the authors have not investigated the
doses to fingertips. The average annual values of 1.22
mSv and 0.73 mSv for Hp(10) and 1.23 mSv and 0.72
mSv for Hp (0.07) were found after investigation of
doses to 1243 technologists working at 28 different
medical centres in Saudi Arabia in the period between
2015-2019 [7].
Measurements of extremity doses by using a ring
dosimeter were reported in [3]. It was found that the
extremity doses were extremely high and varied within
broad interval ranging between 1.5 - 31.9 mSv for the
left hand, and between 1.8 - 55.2 mSv for the right
hand, while the whole body doses ranged from 36 mSv
to 3 mSv. Also, it is mentioned elsewhere [3] that the
use of syringe shields can help to reduce the doses by 75
- 85 % [3].
The information provided in such studies can help not
only to evaluate the exposure doses received by the staff
working in nuclear medicine’s field and update the
routine procedures and protocols but also to investigate
occupational exposure’s impact on workers’ health and
determination of radiation-induced cancer risk. This
indicates the necessity to perform complex investigation
and analysis of the doses to NM staff (whole body+
extremities) in parallel with occupational dose
monitoring.
2. Materials and methods
Individual whole-body doses, doses to extremities and
fingertip doses of technologists were assessed during
entire 2020 in one of the Lithuania’s hospitals. 4
technologists were participating in this project.
For the assessment of doses received by NM staff,
technologists were wearing usual OSL personal
dosimeters (Hp(10) measurements) and additional
electronic personal dosimeters (POLYMASTER) for
obtaining dynamic dosimetry data measurements; TLD
ring was worn on a randomly selected finger. For the
assessment of the doses to fingertips TLD’s were
attached to the fingertips of both hands.
The technologists were directly involved in preparation
and administration of the radiopharmaceuticals with 99mTc (gamma emitter with a photon energy of 140 keV,
with a half-life of 6 hours).
Dose rate (µSv/h) and dose (µSv) were measured with
POLYMASTER dosimeter and then later, accumulated
dose (µSv) during the working day was calculated for
whole-body monitoring. Doses to the fingertips were
derived from the fingertip attached TLD’s and
information obtained from TLD ring dosimeter (for the
comparison). Collected data was analyzed and
compared to find the correlation between these
parameters.
Whole-body and hand exposure (ring) doses of the staff
were evaluated once per three months following
national regulations [9]. Dynamic data of doses received
by technologists during one day were collected upon
request during entire working day and dynamic dose
maps were created. Doses to fingers were measured
upon request (in this case – for research purposes).
3. Results and discussion
The dose accumulated during each working day was
calculated and used for further analysis. It was found,
that the maximum accumulated dose per day does not
exceed 6 µSv for the first technologist (Tech1); ~9 µSv
for the second technologist (Tech2) and 7.6 µSv for the
third technologist (Tech3). However maximum
accumulated dose per day of the fourth technologist
(Tech4) was almost twice higher - 14.4 µSv (Fig. 1).
Fig. 1. Dynamic dose accumulation map of the technologist
(Tech4) measured on September 17, 2020
It must be noted, that dynamic dose accumulation maps
were very usefull when analyzing work performance of
technologists. Usually Hp(10) doses were growing in
small steps (~0.37 μSv) within a certain time period
(according to the preset dosimeter‘s measurement
frequency) which was related to technologist‘s activirty
within a period of working day. However in some cases
high dose deviations were observed (Fig.2)
Fig. 2. Dynamic dose accumulation map of the technologist
(Tech4) measured on November 27, 2020.
During the whole period of study exceptional cases with
dose steps, higher than usual, were investigated
discussing with the technologists trying to fix the
problem and to secure quality of work and radiation
protection of staff. In the presented case (Fig.2) it was
188

G. Vainiūtė et al. / Medical Physics in the Baltic States 15 (2021) 187-190
found that during injection of 99mTc containing
radiopharmaceutical to patient Tech4 expierenced
problems with syrringe‘s fixation to catheter. The cost
of this mistake - additional 2.04 μSv dose to the
technician.
The data on average accumulated dose per day (Fig.3)
also indicated some tendency of getting higher dose by
Tech4. Under such circumstances he was advised to
take an additional practical training. This information
was considered additionally when analyzing the
exposure doses to the fingertips.
Fig.3. Average daily Hp(10) doses accumulated by
technologists between June and December 2020
It was to expect that the doses to extremities will be
higher performing preparation of radiopharmaceuticals
for injections at the hot lab as compared to doses
received by injecting of patients. This is due to the fact
that radiopharmaceuticals preparation is related to
handling of open radiation sources (99mTc), when the
whole body is protected by shielding, but the hands are
directly exposed. The results of fingertip dose
measurements during preparation of
radiopharmaceuticals are provided in Fig.4.
Average daily doses to the fingertips when performing
patient’s injections with 99mTc radiopharmaceuticals for
Tech4 are provided in Fig.5 for the comparison.
In all cases related to radiopharmaceuticals’ preparation
doses to different fingers of one individual varied and
were different from doses registered with ring
dosimeter. This supported the ORAMED [2]
suggestions to change the ICRP recommendations
regarding wearing of ring dosimeter on distinguished
finger. Since there was no strict national regulation how
ring dosimeter must be worn, every technologists was
wearing the ring dosimeter based on personal
convenience.
It should be noted that according the Order V-91 of the
Director of Radiation Protection Centre (2020-12-
29)[10] a ring dosimeter must be worn on the finger
which experiences the highest exposure.
Performed investigation has shown that the highest
doses were received by middle finger of the dominant
hand of Tech3 and Tech4. They were advised to ware
ring dosimeter on a middle finger: Tech3 was already
doing this, however Tech 4 was used to wear ring on the
ring finger.
A
B
C
Fig. 4. Average daily doses to the fingertips when working in
hot lab with preparation of 99mTc radiopharmaceuticals: A-
Tech1; B-Tech3 and C-Tech4.
Fig. 5. Average daily doses to the fingertips of Tec4 when
performing patient’s injections with 99mTc
radiopharmaceuticals.
0
1
2
3
4
5
6
7
8
Ave
rage
dai
ly a
ccu
mu
late
d d
ose
s,
μSv
Tech1 (RV)
Tech2(AČ)
Tech3(EV)
Tech4 (JO)
0.0
1.0
2.0
3.0
4.0
5.0
6.0
7.0
8.0
Middle Index Thumb Ring place(Index)
Ave
rage
dai
ly H
p(0
.07
), m
Sv
Fingers
Tech1, Tc-99m, hot lab
ND hand
D hand
0.0
1.0
2.0
3.0
4.0
5.0
6.0
7.0
Middle Index ThumbA
vera
ge d
aily
Hp
(0.0
7),
mSv
Fingers
Tech3, Tc-99m hot labND hand
D hand
0.0
1.0
2.0
3.0
4.0
5.0
6.0
7.0
Middle Index Thumb Ring place(Ring finger)
Ave
rage
dai
ly H
p(0
.07
), m
Sv
Fingers
Tech4, Tc-99m hot lab
ND hand D hand
0
0.1
0.2
0.3
0.4
0.5
0.6
0.7
0.8
Middle Index Thumb Ring place(Ring finger)
Ave
rage
dai
ly H
p(0
.07
), m
Sv
Fingers
Tech4, Tc-99m injections
ND hand D hand
189

G. Vainiūtė et al. / Medical Physics in the Baltic States 15 (2021) 187-190
Data provided in Fig.5 indicated clearly that the average
doses to fingertips received performing injections of
patients was almost 10 times lower as compared with
doses received by fingertips due to preparation of
radiopharmaceuticals.
Doses measured at fingertips varied depending on the
selected finger, hand and person and were several times
higher than doses obtained from ring dosimeter
measurements, thus indicating possibility of having
higher than recommended exposure to extremities.
However the difference between fingertip doses and
doses obtained from ring dosimeter measurements was
not necessarily factor of 6. (According to international
recommendations, ring doses should be multiplied by a
factor of 6 in order to estimate doses to fingertips.)
4. Conclusions
Investigation of exposure doses to nuclear medicine
department workers (technicians) during administration
and preparation of radiopharmaceuticals with 99mTc has
been performed. Dynamic daily exposure dose maps of
whole body exposure were collected and analyzed
together with the doses to the hands and fingertips of
personnel.
1. Registration of dynamic daily exposure dose maps
was found being very practical and suitable for
discussions with a staff regarding deviation in registered
dose and fixing the occurred problems.
2. It was found that the doses to fingertips were
depending on individual’s experience, working habits
and working conditions. Average daily doses to
fingertips were almost 10 times higher when working in
hot lab as compared to patients’ injection activities.
Obtained results allowed to advice technicians regarding
the finger on which ring dosimeter should be worn.
3. There was no evident correlation between whole
body doses and extremity doses of technicians found.
Acknowledgement
This research was supported by the Research and
Innovation Fund of Kaunas University of Technology
(project grant No. PP54/201) and the Research Fund of
Lithuanian University of Health Sciences. Project
acronym: BRANDUOLYS-NUCLEUS
5. References
1. Adliene, D., Griciene, B., Skovorodko, K., Laurikaitiene,
J., & Puiso, J. (2020). Occupational radiation exposure of
health professionals and cancer risk assessment for
Lithuanian nuclear medicine workers. Environmental
research, 183, 109144.
2. Belgian Nuclear Research Centre (SCK•CEN),
Optimization of Radiation Protection of Medical Staff,
http://www.oramed-fp7.eu/en/Presentations.
3. Tahidul Islam, M., Ferdous, J, Haque, M M Measurement
of extremity doses of nuclear energy worker by using ring
dosimeter, Radiation Protection Dosimetry, Volume 188,
Issue 3, March 2020, Pages 271–275,
4. Dehghan,N, Sina, S. Measurement of operational
dosimetry quantities for nuclear medicine staff, Radiation
Protection Dosimetry, Volume 190, Issue 2, June 2020,
Pages 119–124,
5. Parvaresh, R., Jalili, M., Haghparast, A., Khoshgard, K.,
Eivazi, M. T., & Ghorbani, M. (2020). Evaluations for
Determination of Optimum Shields in Nuclear Medicine.
Journal of biomedical physics & engineering, 10(5), 651.
6. Alkhorayef, M., Mayhoub, F. H., Salah, H., Sulieman, A.,
Al-Mohammed, H. I., Almuwannis, M., & Bradley, D. A.
(2020). Assessment of occupational exposure and
radiation risks in nuclear medicine departments. Radiation
Physics and Chemistry, 170, 108529.
7. Yazeed Alashban, Nasser Shubayr, Occupational Dose
Assessment for Nuclear Medicine and Radiotherapy
Technologists in Saudi Arabia, Radiation Protection
Dosimetry, 2021; ncab112,
8. Eckelman, W. C. (2009). Unparalleled contribution of
technetium-99m to medicine over 5 decades. JACC:
Cardiovascular Imaging, 2(3), 364-368.
9. Hygiene Standard, 2018, Hygiene Standard HN 73:2018
Basic Standard of Radiation Protection adopted by the
Order No. 663 of the Minister of Health Care (2018).
10. https://www.e-tar.lt/portal/lt/
legalAct/9f6c3bd049de11eb8d9fe110e148c770
190

MEDICAL PHYSICS IN THE BALTIC STATES 15 (2021)
Proceedings of International Conference “Medical Physics 2021”
4-6 November 2021, Kaunas, Lithuania
DIAGNOSTIC AND CLINICAL GRADE MEDICAL IMAGING DISPLAY
PERFORMANCE EVALUATION AND OPTIMIZATION USING QUALITY
ASSURANCE PROTOCOLS
Mindaugas DŽIUGELIS1, Leonid KRYNKE2
Vilnius University Hospital Santaros Klinikos [email protected]; [email protected]
Abstract: In clinical environment, diagnostic displays
are important for radiologists. Based on radiographic
images, they help to describe patient diagnosis for
radiologists or at least give a summary based on which
further decisions are made for the patient treatment.
Recently released AAPM report No. 270 by the
American Association of Physicists in Medicine gives
updated requirements for such display evaluation. The
purpose of this study was to improve medical display
performance and to make it more consistent in clinical
practice, which might reduce cases of patient
misdiagnosing.
In total, 39 medical monitors were evaluated, and their
performance criteria were compared before and after the
calibration. Series of medical display performance
criteria measurements were performed in three different
hospital departments (nuclear medicine, conventional
radiology, and computed tomography). To measure the
display performance changes, testing patterns and a
photometer were used. Measured medical display
performance criteria consisted of illuminance, ambient
luminance, maximum luminance, as well as luminance
response deviation from greyscale display function and
backlight uniformity.
Keywords: Medical displays, Quality assurance,
Performance optimization.
1. Introduction
It is well understood that the fundamental advantage of
digitized radiological equipment can only be fulfilled
when the primary image analysis also is done in a
digital format [1,2]. As new digital image capturing and
processing technology advances emerged over time,
display imaging technology improved as well. Since
medical displays are important, they must have quality
assurance programs to monitor its performance criteria.
Due to monitor technology changes from CRT to LCD,
there was a need to reclassify them as its use became
more specific. AAPM Report No. 270 reclassified
monitor quality assurance into 4 categories: diagnostic,
modality, clinical, and electronic health record displays
[3]. According to the Lithuanian Hygiene Norm HN
78:2009, the American Association of Physicists in
Medicine [3], and the European Federation of
Organizations for Medical Physics [4], medical
physicists should be responsible for daily quality
assurance of medical-grade display systems.
This paper provides an overview of the updated
recommendations of AAPM Report 270 for a medical
physicist to perform quality assurance.
2. Display classification
AAPM Report 270, as mentioned, presents 4 main
categories of displays:
1. Diagnostic
2. Modality
3. Clinical specialist (clinical)
4. Electronic health record (EHR) displays.
Diagnostic display type is previously recognized as
primary. These displays are used for primary image
interpretation and often located in reading rooms, with
special lighting conditions.
Modality, clinical and EHR displays were previously (in
TG 18 report) classified as secondary display category.
As of now, there is a need to reclassify the secondary
display class even further.
Modality displays have direct feedback to the operator
of the machine modality and are used during medical
image acquisition and generation. These displays have a
direct impact on image appearance and therefore it is
important to ensure that they meet the provided
requirements of performance standards.
Clinical displays are used in a clinical environment,
such as emergency department, where physicians
themselves (if there is an emergency) can review images
191

M. Džiugelis et al. / Medical Physics in the Baltic States 15 (2021) 191-196
for healthcare management decisions. The performance
of this display type is important due to the decisions that
can be made in clinical environment based on images
viewed on these displays. However, based on the fact
that these displays are lower quality in general, it is
important to evaluate how well according to the
recomendations these displays should be performing,
whether the quality of such displays affect the
smoothness of clinical work.
Electronic Health Record (EHR) displays are used for
viewing images, which are obtained over the entire
patients health history following the primary
interpretation by a radiologist. They may be used in
exam room, at a separate workstation where a referring
physician is studying photos to better comprehend the
diagnosis, or by a surgeon during presurgical planning.
Standard consumer-grade screens without specific
calibration or brightness settings may be suitable for this
purpose in a facility. When poor display performance
hinders efficiency or quality care, however, the QA
guidelines in Report 270 for luminance performance,
grayscale calibration, uniformity, and ambient light are
followed.
3. Methods
For measurements, a Piranha RTI 657 with LightProbe
L100 sensor were used (Fig. 1). X-Rite i1Display Pro
monitor calibration device was used for monitor
calibration (Fig. 2). Monitors were calibrated using
PerfectLum™ 4.0 software. Measurements were
performed before and after the calibration and then
compared. Both diagnostic (primary) and clinical
(secondary) type of displays were measured. While
measuring, the conditions of the environment and the
monitor settings must be kept identical to the ones used
for medical examinations. It is essential to inspect
whether the display is clean, as fingerprints and dust
residues might affect emitted light optical properties – it
can cause distortions or emitted light refraction.
3.1. Illuminance and Ambient Luminance evaluation
In this study illuminance refers to the room's ambient
light intensity. This variable, measured by a luxometer
in lux units, is significant because it has a direct impact
on the monitor's ambient luminance, creating reflections
that can significantly influence contrast, luminance
response, luminance ratio, and other related factors (fig.
3) [5,6].
The amount of light reflected from the monitor surface
is referred to as ambient luminance. It may affect the
viewer's ability to detect small visual details,
particularly on older monitors and when low contrast
differences are present. A photometer is used to
measure ambient luminance (unit = cd/m2). There are
three main types of reflection - specular (produces a
distinct reflection from the environment, which is
mirror-like, typical for smooth surface screens), diffuse
(scatters light uniformly in all directions, such reflection
is typical in matt surface screens, usually visible due to
light intensity inconsistencies) and haze (might be
present in both specular and diffuse reflections. As with
specular reflection, its luminance spikes in the specular
direction. However, unlike diffuse reflection, this
reflection of the light is proportional to the incident
light. Haze reflection occurs as a result of the antiglare
matte top layer).
Fig. 1. Piranha RTI 657 with LightProbe L100 sensor and its
attachments.
Fig. 2. X-Rite i1Display Pro monitor calibration device.
Fig. 3. Effect on display luminance of various ambient light
conditions. At darker greyscale points, where display
luminance is lower when the ambient light level is much
higher, environmental lighting effects are most noticeable in
display luminance. The display was calibrated to DICOM
GSDF when Lamb = 0.1 cd/m2 in this case. This shows the
importance of environmental conditions when diagnostic
images are evaluated – it is impossible to properly calibrate
display and see proper images when ambient light is high [3].
3.2. Display Luminance Response and DICOM
GSDF
A LightProbe L100 sensor was used to measure a series
of steadily increasing grey levels in the luminance
response test. It allows to measure distinct gray levels
192

M. Džiugelis et al. / Medical Physics in the Baltic States 15 (2021) 191-196
that are steadily growing over the whole 10-bit gray
level range. Equal increments of gradually increasing
greyscale brightness of 18 or 52 points, 256 points, and
a whole pallet of 1024 points might be checked to
determine Luminance Response. The 18-point approach
was used in this study.
The luminance response curve, in general, indicates
how consistent the contrast change is throughout all of
the observed grey levels (as shown in fig. 5). The
highest deviation from all points is calculated and
expressed as a percentage. The DICOM (Digital
Imaging and Communications in Medicine) GSDF
(Grayscale Standard Display Function) has been
adopted as a standard in measuring luminance response,
according to AAPM Report No. 270.
Fig. 4. Grayscale Standard Display Function presented as
logarithm-of-luminance versus JND-Index [6]. The X-axis
shows the JND index, which shows grey levels. Y-axis shows
luminance in cd/m2. As the human eye hardly notices dark
images, first grayscale levels should increase in wider
increments until the grey level becomes bright enough. As a
result, curvature in the curve disappears as increments of
luminance in grey levels become even.
The luminance response data came from Barten's model,
which was based on the human visual system. The
square object is displayed in a uniform background
(typically at 20 % of maximum luminance). [5].
All obtained luminance values are then converted to just
noticeable difference (JND) index j. The luminance
gradient describes the desired JND at the Luminance L.
It is a minimally distinguishable difference, that is
visible to an average observer. This conversion thus
provides an easy way to compare the calculated values
with the intended luminance response. [3]. The
coefficients a to m and A to I for equations are given in
table 1.
These are the equations to convert between luminance,
L, and JND index, j (equation 1 is used when JND
indexes are known, equation 2 is used when luminance
values in cd/m2 for each greyscale value are known) [3]:
𝑙𝑜𝑔10𝐿 (𝑗) = 𝑎 + 𝑐·𝑙𝑛 (𝑗) + 𝑒·𝑙𝑛2(𝑗) + 𝑔·𝑙𝑛3 (𝑗) + 𝑚·𝑙𝑛4 (𝑗)
1 + 𝑏·𝑙𝑛 𝑗+ 𝑑·𝑙𝑛2𝑗+ 𝑓·𝑙𝑛3𝑗+ ℎ·𝑙𝑛4𝑗+ 𝑘·𝑙𝑛5 𝑗 (1)
𝑗(𝐿) = 𝐴 + 𝐵 · 𝑙𝑜𝑔110(𝐿) + 𝐶 · 𝑙𝑜𝑔210(𝐿) + 𝐷 ·𝑙𝑜𝑔310(𝐿) + 𝐸 · 𝑙𝑜𝑔410(𝐿) + 𝐹 · 𝑙𝑜𝑔510(𝐿) + 𝐺 ·
𝑙𝑜𝑔610(𝐿) + 𝐻 · 𝑙𝑜𝑔710(𝐿) + 𝐼 · 𝑙𝑜𝑔810(𝐿) (2)
Table 1. DICOM GSDF Conversion Coefficients [3].
JND to Luminance Luminance to JND
a −1.3011877 A 71.498068
b −2.5840191E – 02 B 94.593053
c 8.0242636E − 02 C 41.912053
d −1.0320229E − 01 D 9.8247004
e 1.3646699E − 01 E 0.28175407
f 2.8745620E − 02 F −1.1878455
g −2.5468404E − 02 G −0.1801434
h −3.1978977E − 03 H 0.14710899
k 1.2992634E − 04 I −0.017046845
m 1.3635334E − 03
After that, mean JND for each GSDF level is measured
using the formula [3]:
𝑚𝑒𝑎𝑛∆𝐽𝑁𝐷
𝐿𝑔𝑟𝑎𝑦 𝑙𝑒𝑣𝑒𝑙=
𝑗(𝐿′𝑚𝑎𝑥)−𝑗(𝐿′
min)
𝐿max 𝑔𝑟𝑎𝑦 𝑙𝑒𝑣𝑒𝑙−𝐿min 𝑔𝑟𝑎𝑦 𝑙𝑒𝑣𝑒𝑙 (3)
Where the denominator is equivalent to the difference of
the minimal and maximum gray levels. Because the aim
of the GSDF curve is to have an equivalent number of
JND indices across each gray level, the average
ΔJND/GL is the number of JND index that would be
present for each gray level on a GSDF capable display.
Next in the study, the ΔJND/GL across each observed
gray level was compared to the mean ΔJND/GL to
determine the error at each measured phase.
There is an additional parameter to add, which takes
into account the contrast threshold model. Equation 4
describes the slope of the luminance response function
in the plot of gray level vs. luminance [3]. As observers'
eyes cannot detect as sharply differences of contrast in
high levels of luminance, the curve of GSDF is not
linear. Relative contrast is indicated as dL/L.
𝑑𝑙
𝑙𝑝𝑒𝑟 𝐽𝑁𝐷 =
2(𝐿′𝑖−𝐿′
𝑖−1)
(𝐿′𝑖+𝐿′
𝑖−1)(𝑚𝑒𝑎𝑛∆𝐽𝑁𝐷
𝐺𝐿)(𝐿𝑖 𝑔𝑟𝑒𝑦 𝑙𝑒𝑣𝑒𝑙−𝐿𝑖 𝑔𝑟𝑒𝑦 𝑙𝑒𝑣𝑒𝑙−1)
. (4)
3.3. Display luminance uniformity
Display luminance uniformity shows the display
luminance consistency over the entire screen. This is
measured using TG18-ULN10 (dark background) and
TG18-ULN80 (bright background) test patterns, where
luminance is measured in five different screen places
using a photometer and after that, the deviation is
calculated using the formula:
200 ×𝐿% 𝑚𝑎𝑥𝑖𝑚𝑢𝑚 𝑑𝑒𝑣.−𝐿 % 𝑚𝑖𝑛𝑖𝑚𝑢𝑚 𝑑𝑒𝑣.
𝐿% 𝑚𝑎𝑥𝑖𝑚𝑢𝑚 𝑑𝑒𝑣.+𝐿 % 𝑚𝑖𝑛𝑖𝑚𝑢𝑚 𝑑𝑒𝑣. (5)
3.4. Display Calibration
Since the actual luminance (and thus perceived contrast)
characteristics of various LCDs may fluctuate
significantly, calibration of these monitors' luminance
response is needed to ensure that users' perception of the
image is consistent. As previously stated, medical
displays must meet the requirements outlined in earlier
sections. The luminance response of the screen can be
fixed with calibration. The main goal for this is to
193

M. Džiugelis et al. / Medical Physics in the Baltic States 15 (2021) 191-196
ensure the best possible contrast and luminance
appearance for radiographic images.
Because LCDs contain a backlight that tends to decrease
its luminance output over time, the lowest and
maximum luminance (Lmin, Lmax) should be established
initially when calibrating a display. It usually is
measured while determining the contrast ratio. Color
displays typically have contrast ratios of 250 to 400,
whereas grayscale displays can have contrast ratios of
600 or more when brand new [7]. To properly select the
desired maximum luminance, it is essential to note that
during calibration, peak luminance might variate
according to mathematical calculations applicable to
Barten's model [7]. Lmin is frequently chosen to be
greater than the minimum value for the same reason.
Following the selection of Lmin and Lmax values, JNDmin
and JNDmax values are calculated using conversion
equation no. 2, which was previously demonstrated with
coefficients (see table 1). The difference between
JNDmin and JNDmax represents the distribution of each
greyscale point. A display with a minimum luminance
of 0.5 cd/m2 and a maximum luminance of 200 cd/m2
corresponds to 46.6 JNDmin and 572.2 JNDmax,
respectively. The overall JND difference is 525.6, as
shown. A full palette of greyscale consists of 256 values
because most screens have 8-bit images. The main
technical calibration goal is to set luminance levels for
each digital driving level (every possible brightness
value of, in this case, grey levels, shortened as DDL)
input value in such a way that the difference in JND
index changes consistently over the DDL range (DDL
increment changes in GSDF when the display is
calibrated and uncalibrated to DICOM GSDF are shown
in GSDF curve example in figure 5). To do so, the total
number of JNDs is divided by the total number of
DDLs, then subtracted by one. The average number of
JNDs per single DDL on the calibrated display is
specified below (JNDave). As a result, JNDave is
equivalent to 525.6/255 = 2.06. The formula is then
used to calculate each DDL:
𝐽𝑁𝐷𝐷𝐷𝐿 = 𝐽𝑁𝐷𝑚𝑖𝑛 + 𝐷𝐷𝐿 × 𝐽𝑁𝐷𝑎𝑣𝑒 (6)
Then for each DDL to obtain luminance values,
equation no. 1 is used.
Fig. 5. Luminance intensity examples for calibrated and
uncalibrated displays for every digital driving
level (DDL) of grayscale palette [7].
A look-up table (LUT) must be created after getting
JND and luminance values. It's a file that generates new
DDL values for each DDL that matches the DICOM
GSDF. This file can give instructions to turn input
values into specific output values for each DDL using a
specific software (e.g., pacsDisplay). The program can
then modify the profile of the existing display, resulting
in properties that are more likely to comply with the
DICOM display standard. This conversion is
straightforward, although it isn't without flaws. Overall
perceptual contrast is satisfied by 8-bit to 8-bit
calibration, but adjacent input pixel values (subpixel
red, green, and blue values can be adjusted and
manipulated for colored monitors to gain better contrast
and more accurate DDL values) remain unchanged; as a
result, adjacent input levels drastically change, leaving
the monitor with poor contrast and missing grey shades
(as transitions might be too drastic in some grey levels).
It cannot be an adequate calibration since 8-bit-to-8-bit
calibration frequently leads to local contrast loss as well
as excessively increased local contrast. It can be stated
that grayscale calibration based on the initial luminance
measurements at every possible level of LUT value
gives the best calibration quality as it is, related to how
many points are adjusted for a better match to DICOM
GSDF. If every point has been adjusted, the quality of
calibration will be the best possible. So, for more
precise calibration, each sub-pixel value has to be
modified. Commonly, sub-pixel values are adjusted so
that all three of them increase at least by 1 level and,
therefore, depend on each other. Independent sub-pixel
adjustment allows to obtain more than 256 gray values
and therefore is called bit stealing, otherwise known as
spatial dithering [8, 9].
Monochrome monitors can display 766 gray color tones,
while colored monitors can display up to 1786 gray
color tones[10,11]. This allows a more accurate match
DICOM GSDF model. Compared to the 8-bit palette,
there is more choice of possible grey levels to match
each grey value for DICOM GSDF after bit stealing.
This leads to a possibility to calibrate a monitor that
more closely resembles an ideal curve.
With bit stealing, several vendors have used temporal
modulation of subpixels to further improve the
luminance value distribution throughout all LUT palette
levels [8]. Temporal modulation improves the time-
averaged luminance output by using fast sequential
adjustments in the luminance output of individual
subpixels. It works at an undetectable pace for the
human eye to notice.
It is important to note that display calibration to
DICOM GSDF only ensures that all displays would
perform at their best. The overall appearance of medical
images can vary depending on different factors like
image acquisition parameters (mAs, peak kilovoltage
(kVp), etc.) of scanning machine (i.e., CT scanner, X-
ray machine, or other modality). Image processing
algorithms, which improve over time, are tools that can
change display contrast also might help to better
visualize medical images along with greyscale
transformation mechanisms integrated into PACS
program user interface [7].
194

M. Džiugelis et al. / Medical Physics in the Baltic States 15 (2021) 191-196
4. Results
The first criteria measured in medical-grade display
evaluation is display luminance. It includes illuminance,
ambient luminance, maximum luminance, and
luminance response function (otherwise known as
Greyscale Standart Display Function). Those parameters
are dependant on each other. Suggested limits of
monitor luminance levels are published in AAPM's
released report TG 270, which set standards for display
luminance criteria of primary (mammographic
diagnostic and non-mammographic diagnostic) and
secondary (modality, clinical, and electronic health
record) displays.
Investigated parameters were monitor minimum and
maximum illuminance, ambient luminance, luminance
response deviation from greyscale display function,
monitor backlight uniformity, veiling glare, and noise.
In total, 28 diagnostic and 11 clinical displays were
evaluated.
Table 2. Monitor count of passed acceptance criteria before
and after the calibration. Letter C indicates clinical monitor
type, D – diagnostic monitor type.
Before
calibration After calibration
C D C D
Illuminance 19 out of 39 19 out of 39
Ambient light 3 out
of 11
5 out
of 28
3 out
of 11
5 out
of 28
L' max 2 out
of 11
11 out
of 28
4 out
of 11
10 out
of 28
Luminance
response
0 out
of 11
13 out
of 28
11 out
of 11
24 out
of 28
Luminance
uniformity 37 out of 39
From all measurements after calibration, four monitors
in total (3 from conventional radiology, one from the
CT department) failed the luminance response test after
calibration, all of them were diagnostic types. These
monitors were impossible to calibrate. Part of the reason
was that they were very old and worked for a very long
time.
One sample t-test was performed for the diagnostic
monitors to evaluate whether the true mean from the
measured sample exceeds recommended 10% value.
The test showed that the true mean deviation of the
tested sample values was 6.02% (t = -5.4, df = 27,
p = 5.04×10⁻⁶). This means that the average DICOM
GSDF deviation from all measured diagnostic type
monitors was not significantly higher than 10%. After
initial measurements, the minimum deviation of
diagnostic monitors was 1.4 %, maximum for this type
reached 15.1%.
All clinical type monitors passed this criterion;
therefore, no statistical analysis was performed, as in
such a case, it is evident that the mean DICOM GSDF
deviation was lower than 20%. After initial
measurements, the minimum deviation of clinical
monitors was 2.1%, the maximum for this type reached
18.3%, and the mean deviation of all measured clinical
type monitors of this type reached 7.9% deviation.
After comparing clinical type display measured values
of DICOM GSDF absolute deviation percentage in just
noticeable difference per grey level (JND/GL) before
and after calibration using Student Two Sample t-test,
the true difference in means was significant with p-
value of 2.128×10⁻⁹, (t = 11.1, df = 17.8). Comparing
the true difference in means for diagnostic monitor type,
Student Two Sample t-test showed significant
difference as well (t = 4.3, df = 28.2, p-value = 0.0002).
This indicates that for both clinical and diagnostic
monitors, calibration improved DICOM GSDF
parameter, according to AAPM recommendations
significantly reducing its absolute deviation percentage
in just noticeable difference per grey level.
Fig. 6. Diagnostic monitor type average luminance response
deviation percentage before calibration.
Fig. 7. Diagnostic monitor type average luminance response
deviation percentage after calibration.
Fig. 8. Clinical monitor type average luminance response
deviation percentage before calibration.
Fig. 9. Clinical monitor type average luminance response
deviation percentage after calibration.
195

M. Džiugelis et al. / Medical Physics in the Baltic States 15 (2021) 191-196
While comparing the average luminance response
deviation percentages per each DDL (as shown in figure
10) for all monitors, it is evident that each DDL error
decreased. The most noticeable change (14.8 %
improvement) was in the 15th display driving level
(DDL 15), where the error was the largest after initial
measurements (19.6%). Also, the smallest change (2.1%
improvement) was in the 120th display driving level,
which after initial measurements had the smallest error
from the ideal result (5.3%).
Fig. 10. Average all monitor luminance response deviation
(measured in percent) per each DDL (display driving level)
before and after the calibration. The top dashed line indicates
the maximum allowed average error for diagnostic type
displays; the lower dashed line indicates the maximum
allowed error for the clinical (secondary) type of displays.
5. Conclusions
In this work, 39 monitors including 28 diagnostic
(primary) and 11 clinical (secondary) type were
evaluated, and their performance parameters before and
after calibration were compared. Measurements were
performed in three different departments (nuclear
medicine, conventional radiology, and computed
tomography).
It was found that after the calibration the performance
of the monitors according to the luminance response
criteria has been improved from 33% to 89%, while
other parameters were not improved significantly.
When comparing DDL value errors before and after
calibration, the largest improvement was in the 15th
DDL value - 14.8% decreased error from the GSDF
curve model. The largest errors before calibration were
measured at terminal DDL values, which showed the
most noticeable improvement after the calibration.
6. References
1. Scharitzer M., Prokop M., Weber M., Fuchsjger M.,
Oschatz E., Schaefer-Prokop C. Detectability of catheters
on bedside chest radiographs: comparison between liquid
crystal display and high-resolution cathode-ray tube
monitors. Radiology, 2005. 234, p. 611 - 616.
2. Balassy C., Prokop M., Weber M., Sailer J., Herold C.J.,
Schaefer-Prokop C. Flat-panel display (LCD) versus high-
resolution gray-scale display (CRT) for chest radiography:
an observer preference study. Am J Roentgenol., 2005.
184, p.752–756.
3. Bevins N. B., Flynn M. J., Silosky M.S., Marsh R. M.,
Walz-Flannigan A. I., Badano A. “Display Quality
Assurance. The Report of AAPM Task Group 270.”
American Association of Physicists in Medicine, 2019. 77
p.
4. Gennaro G., Avramova-Cholakova S., Azzalini A., Luisa
Chapel M., Chevalier M., Ciraj O., Torresin A. Quality
Controls in Digital Mammography protocol of the EFOMP
Mammo Working group. Physica Medica, 2018. p. 55-64.
5. Ekpo E. U., McEntee M. F. An Evaluation of Performance
Characteristics of Primary Display Devices. Journal of
Digital Imaging, 2015. 29, p. 175–182.
6. Digital Imaging and Communications in Medicine
(DICOM) Part 14: Grayscale Standard Display Function,
National Electrical Manufacturers Association, 2011.
7. Krupinski E. A. Medical Grade vs Off-the-Shelf Color
Displays: Influence on Observer Performance and Visual
Search. Journal of Digital Imaging, 2008. 22, p. 363–368.
8. Blume H. R., Ho A. M. K., Stevens F., Steven P. M.
Practical aspects of grayscale calibration of display
systems. Medical Imaging, 2001. 4323, p. 28-41.
9. Ogawa E., Shimura K. Appearance matching of
radiographic images using lightness index. Medical
Imaging, 1999. 3663, p. 20-26.
10. Tyler C. W., Chan H., Liu L., McBride B., Kontsevich L.
L. Bit stealing: how to get 1786 or more gray levels from
an 8-bit color monitor. Human Vision, Visual Processing,
and Digital Display III, 1992. 1666, p. 1-15.
11. McEntee M. F., Toomey R. J. Display Optimization from a
Perception Perspective. The Handbook of Medical Image
Perception and Techniques, Ch. 30, Cambridge University
Press, 2018. p. 452–469.
196

MEDICAL PHYSICS IN THE BALTIC STATES 15 (2021)
Proceedings of International Conference “Medical Physics 2021”
4-6 November 2021, Kaunas, Lithuania
APPLICATION OF 3D PRINTED INDIVIDUAL COMPENSATING BOLUS
FOR THE VERIFICATION OF SHALLOW HEAD AND NECK CANCER
TREATMENT
Kamilė DAMBRAUSKAITĖ1, Jurgita LAURIKAITIENĖ2, 3, Artūras ANDREJAITIS3 1Kaunas University of Applied Sciences; 2 Kaunas University of Technology, Kaunas, Lithuania; 3Hospital of
Lithuanian University of Health Sciences Kaunas Clinics, Oncology Hospital [email protected]; [email protected]
Abstract: Bolus is used as an additional body to ensure
the delivery of appropriate irradiation dose for shallow
tumours. The aim of this study was to apply an
individualised 3D printed polylactic acid (PLA) boluses
for a simulated case of shallow head and neck cancer on
the anthropomorphic phantom “Shane”. Obtained
results showed that the 3D minimum dose of the
planned tumour volume increased more than 30 % in
comparison with a plan without individualised 3D
printed bolus. Therefore, 3D printed bolus could be
successfully used in clinical practice to provide an
adequate superficial tumour irradiation.
Keywords: radiation therapy, 3D printing, compensating
bolus
1. Introduction
Radiotherapy aims at accurately targeting tumours with
sufficient dose while preserving as much healthy tissue
as possible. Radiotherapy are frequently delivered using
photons with energies in the megavoltage (MV) range.
The benefit of such beam energies is that the majority of
the dose is delivered deeper inside the patient, with
maximum dose depths reaching several centimetres
below the patient's surface. Because of this effect,
radiotherapists may target tumours on organs such as
the prostate. On the other hand, larger dose often must
be deposited to the near-skin area, for example, in cases
of head and neck cancer . Thus, the most important
aspects to consider when irradiating surface and shallow
tumours are achieving conformal dose distribution in
tumour area while protecting healthy tissues. In such
clinical cases, one way of solving the issue may be the
use of an additional body, also known as a bolus. It
provides a water equivalent material with sufficient
coverage of the tumour and a uniform dosage delivery.
However, the problem is that commercially available
boluses made of sheet gels are difficult to apply to
certain uneven skin surfaces, such as those of the nose,
ears, eyes, and scalp. The air gap between the bolus and
the skin is the most significant problem with these flat
boluses, particularly when using a high-energy beam
which may reduce the surface dosage [1]. Therefore, the
new and relevant technique of three-dimensional (3D)
printed patient-specific bolus was suggested to increase
the irregular surface dose and improve dose delivery to
the tumour in the build-up region.
A lot of studies show successful results for the
implementation of 3D printed bolus in radiotherapy
treatment. For example, J. Robar et al. [2] compared
3D printed polylactic acid (PLA) bolus used for the
chest wall radiation therapy with a standard sheet bolus.
Analysis of the formed air gaps showed that using a
standard sheet bolus, air gaps of >5 mm were formed
for ~30% of all irradiated fractions, while 13 % of the
patients air gaps were reduced with 3D printed bolus.
D. Kang et al. [1] showed, that a low-cost, 3D printed,
patient-specific bolus printed of commonly available
materials offered a better dose distribution than the one
with a standard flat bolus, having better dose coverage
to the PTV and dose conformity. 3D surface was created
and printed using a cell phone camera for acquiring
surface images. Plan with 3D printed bolus showed
improved coverage of 95% volume for the PTV
(95.65% (3D-printed bolus), while using flat bolus
coverage was equal to 88.39%). K. Fujimoto et al. [3],
reported a shift of the dose distribution towards the
surface by 0.3 cm while using 0.5 cm thickness 3D
printed bolus in comparison with plan without bolus.
The dmax values for the bolus-free and 3D-bolus cases
are 0.9 and 0.6 cm, respectively
The most important feature of individualized boluses is
that they improve dose homogeneity in the irradiated
tumour, especially in the case of shallow tumours.
However, when irradiating irregular and curved surfaces
of the body or postmastectomy scars, the traditional
bolus with a smooth surface can not be fully attached to
the skin and an air gaps might be formed in between. It
is known, that for air gap of > 5 mm, the surface dose
197

K. Dambrauskaitė et al. / Medical Physics in the Baltic States 15 (2021) 197-200
decreases to ~90% [4,5]. In such cases, patient-specific
compensating boluses can be successfully used.
The aim of this study was to assess the role of
individualised 3D printed PLA compensating bolus in
external beam radiotherapy, while imitating treatment of
shallow head and neck cancer.
2. Materials and methods
Printing: Individualized 3D printed polylactic acid
(PLA) bolus was used for simulating shallow head and
neck cancer irradiation with high-energy photons 6
MeV. Polylactic acid (PLA) material was chosen to
print boluses with 90 % infill ratio, due to its properties
being similar to soft tissues (78 HU and 1.06 - 1.43
g/cm3). The main problem of shallow tumours
radiotherapy is insufficient irradiation of the surface and
insufficient protection of OARs in the vicinity of the
tumour. Due to this, two patient-specific boluses were
fabricated and used for imitation of shallow tumour
irradiation for head and neck patient/ anthropomorphic
phantom Shane (Fig. 1). Three different cases were
analysed: 1) without 3D printed PLA bolus; 2) with
standard 1 cm thickness 3D printed PLA bolus; 3) with
individualised compensating 3D printed PLA bolus.
Fig. 1. Anthropomorphic phantom Shane
The main workflow of reconstruction, printing 3D PLA
boluses and their use in radiotherapy is presented in
Figure 2.
Fig. 2. Workflow for reconstruction and printing 3D PLA
boluses
3D printed individualised PLA standard and
compensating boluses (Fig. 3) were printed using PLA
printing material. It is known, that PLA is tissue-
equivalent and mostly similar to water or soft tissues.
Also, according to other studies [6] PLA is a non-toxic
and does not undergoes any shrinking upon cooling,
which ensures that geometrical integrity would be
maintained during printing process. Printing was
performed using 3D printer Zortax M300 at Kaunas
University of Technology, Department of Physics.
Using the same 3D printing scheme, two boluses were
printed: 1) standard 3D printed PLA 1 cm thickness
bolus and 2) compensating bolus: the red area of 2.5 cm
thickness over the eyeball; the blue area - about 1 cm
thickness around the eye region; and remaining part of
the bolus is 0.5 cm thickness (Fig. 3).
Fig. 3. Image of 3D individualized standard 1 cm
thickness (A) and compensating (B) boluses
Radiotherapy treatment planning: Dose distribution
evaluation for the planning target volume (PTV) and
organs at risk (OARs) volume depends on the type and
thickness of 3D printed individualised bolus. 3D
treatment planning system (TPS) Eclipse (Varian
Medical Systems) was used for treatment planning,
evaluating effect of used 3D printed boluses.
Three volumetric modulated arc therapy (VMAT) plans
were created for the evaluation of dose distribution
without bolus and with two different individualised 3D
printed boluses. Radiotherapy treatment plans were
created, using the same irradiation parameters: triple
coplanar clockwise (CW)/counter-clockwise (CCW)
arcs, 6 MeV photon energy beams, and were planned
for Halcyon 1378 medical linear accelerator. The
radiation dose of 66 Gy/33 fractions was prescribed.
Planning target volume (PTV) and all organs at risk
(OARs) were delineated imitating nasopharynx cancer
case irradiation procedure. All three plans data were
compared using isodose distribution and dose volume
histograms (DVHs). Using DVHs for the target volume
and OARs, Dmax, Dmin, Dmean or certain volume of
irradiated structure could be analysed depending on
evaluated organ or target. Dmax, Dmin, Dmean represent the
maximum, minimum and mean doses for the target or
OAR volume, respectively.
3. Results
Evaluation of the dose distribution for the phantom
Shane imitating shallow tumour irradiation procedure
showed insufficient surface dose coverage for VMAT
plan with no bolus. The isodose was shifted from the
surface to the phantom by 0.6 cm (evaluating minimum
recommended 95% coverage of PTV). 3D minimum
dose for PTV was equal to 48.2% and 3D mean dose for
PTV was equal to 98.9 (Fig. 4). It is important to
mention that the minimum successfull target coverage
ranges from 95% to 107% [7]. This means, that for this
case the target is not irradiated sufficiently since the
coverage is less than recommended (< 95%).
198

K. Dambrauskaitė et al. / Medical Physics in the Baltic States 15 (2021) 197-200
Fig. 4. Radiotherapy treatment plan without bolus (red arrow
shows the shift of the isodose of 95 % inside the volume of the
phantom
Analysing DVH results, it was observed that 95%
(usually only the 95% limit is used for plans evaluation;
however, due to VMAT technique ability to ensure
higher coverage of the target, it is recommended to also
evaluate 98% and 99% dose coverage [8]), 98% and
99% dose coverage of the PTV volume was lower than
recommended in this case. According to the DVH of
PTV, 95% of the target volume was irradiated with
94.60 % of the prescribed total dose (66 Gy), 98% of
PTV volume was covered with 91.40% dose and 99% -
88.00% of prescribed dose. These results also show that
the tumour was not irradiated sufficiently when
irradiating anthropomorphic phantom Shane without
bolus. The same tendency was observed by S. Kim et al.
In this study, reported Dmax, Dmin and Dmean of the target
volume were 101.3%, 25.4% and 86.4%, respectively.
As a result, the lack of the coverage may lead to disease
recurrence. It is known, that after radical treatment of
head and neck cancer, about 20–50 % of patients are
diagnosed with locoregional recurrence during the first
two years [9].
Fig. 5. VMAT plan with 3D printed patient-specific bolus
It is important to highlight that formed air gaps in
between the phantom and bolus were less than 0.2 cm,
thus evaluation of the dose difference resulting from the
air gaps was not done. It was found, that using
individualised 1 cm thickness 3D printed PLA bolus,
the isodose of 95% of coverage was shifted towards the
surface and the 3D minimum dose increased to 74.3%
(Fig. 5).
In external radiotherapy, even though technologies have
improved for conformal delivery of prescribed dose to
the tumour, the healthy tissues are unavoidably
irradiated. Because a standard 3D printed bolus does not
give significant OAR protection, in order to spare
OAR‘s, 3D printed compensating bolus was used,
which give higher OAR protection.
The 3D printed compensating bolus created airgaps up
to 0.6 cm in the 0.5 cm thickness region, however this
had no effect on the irradiation treatment plan because
that zone was not analysed. Air gaps arise because of
the thermal action during printing and the temperature
difference during cooling. In the eyes and nose region,
bolus thickness of 1 cm and 2.5 cm were measured, with
created airgaps of up to 0.2 cm, as in the first 3D printed
standard bolus.
It was observed, that implementing patient-specific 3D
printed compensating bolus increase the 3D minimum
dose for PTV to 75.7 % (Fig. 6). Based on the DVH of
PTV, 95% of the target volume was irradiated with
95.00 % of the prescribed dose, 98 % of PTV volume
was covered with 92.60 % dose and 99% - 90.30 % of
prescribed dose. Therefore, results show that using 3D
printed compensating bolus can improve superficial
tumour irradiation.
Fig. 6. VMAT plan with 3D printed patient-specific
compensating bolus
On the other hand, even though 3D minimum dose
coverage does not differ significantly while using both
boluses, isodose distribution shows some important
results.
Therefore, the isodose of 52.8 Gy slightly covers the
right eyeball in the plan with 3D printed standard bolus.
While the plan with 3D compensating bolus, the isodose
is shifted away from the right eyeball (Fig. 5 and Fig.6).
Therefore, 3D printed compensating bolus can
successfully protect the OAR from harmful dose.
According to DVH, maximum dose for 99.4% of right
eyeball volume was 60.189 Gy in plan without bolus,
whereas with added compensating bolus Dmax was
56.138 Gy. 87.8 % of optic nerve volume is irradiated
with Dmax 57.988 Gy and Dmax 55.523 Gy for the plan
with compensating bolus (Fig. 7). 3D maximum dose
for right eyeball, optic nerve, midbrain, pons and
medulla, optic chiasm and right eye lens were lowered
by 5.10 %, 2.70 %, 16.43 %, 12.56 %, 44.81 % and
20.72 %, respectively. According to these results, 3D
199

K. Dambrauskaitė et al. / Medical Physics in the Baltic States 15 (2021) 197-200
printed compensating bolus perfectly fulfils its function
by replacing missing tissues and shielding the OAR.
Fig. 7. Histogram that shows 3D maximum dose for OAR‘s
for two plans: without bolus and with 3D printed
compensating bolus
4. Conclusions
1. Bolus as an additional body is successfully used for
shallow tumour irradiation, using high-energy photons.
The main problem occurs regarding uneven and/ or
concaved surface of patient’s body (especially important
for head and neck cancer cases), leading to the
formation ofair gaps between the patient and bolus (up
to few cm) that influence dose distribution. This
problem could be solved using so called individualised,
for example, 3D printed boluses, minimizing air gaps up
to 5 mm. Therefore, the efficiency of the treatment
procedure could be ensured and probability of disease
recurrence reduced.
2. 3D printed individualised polylactic acid (PLA)
boluses were reconstructed according to the CT scans of
anthropomorphic phantom Shane, using the smallest
slice thickness (0.25 cm). Since boluses are usually used
to imitate soft tissues, 3D boluses were printed with
polylactic acid (PLA) at 90% infill ratio owing to the
fact that soft tissues equivalent properties (78 HU and
1.06 - 1.43 g/cm3) can be achieved at this infill ratio.
3. Three different cases of treatment planning (without
bolus, with standard 3D printed individualised PLA
bolus and with compensating 3D printed individualised
PLA bolus) were analysed. It was found, that without
bolus, the planning target volume (PTV) coverage was
insufficient (Dmin (48.2 %)), while coverage of PTV
was significantly increased using standard 3D printed
PLA bolus (Dmin (74.3 %)) and compensating 3D
printed PLA bolus (Dmin (75.7%)). Furthermore, using
compensating bolus, it was observed that doses of
organs at risk (OARs) were minimized (right eyeball
(5.10 %), optic nerve (2.70 %), midbrain (16.43 %),
pons and medulla (12.56 %), optic chiasm (44.81 %)
and right eye lens (20.72 %)). Thus, 3D printed
individualised standard and compensating boluses could
be successfully used in a clinical practice in order to
irradiate tumour sufficiently, avoiding possible cancer
recurrence.
5. References
1. Kang D., Wang B., Peng Y., Liu X., Deng X. Low-Cost
iPhone-Assisted Processing to Obtain Radiotherapy
Bolus Using Optical Surface Reconstruction and 3D-
Printing. Scientific Reports. 2020 Dec 1;10(1).
2. Robar J.L., Moran K., Allan J., Clancey J., Joseph T.,
Chytyk-Praznik K., et al. Intrapatient study comparing
3D printed bolus versus standard vinyl gel sheet bolus for
postmastectomy chest wall radiation therapy. Practice in
Radiation Oncology. 2018 Jul 1;8(4):221–9.
3. Fujimoto K., Shiinoki T., Yuasa Y., Hanazawa H.,
Shibuya K. Efficacy of patient-specific bolus created
using three-dimensional printing technique in photon
radiotherapy. Physica Medica. 2017 Jun 1; 38:1–9.
4. Zhang Y., Han N., Zhang N. Application value of 3D-
printed Bolus in radiotherapy after radical mastectomy.
2021 Mar 26.
5. Jreije A.; Keshelava L., Ilickas M.; Laurikaitiene J.;
Urbonavicius B.G.; Gabrielis; Adliene D. Development
of patient specific conformal 3D-printed devices for dose
verification in radiotherapy // Applied sciences. Basel:
MDPI. ISSN 2076-3417. 2021, vol. 11, iss. 18, art. no.
8657, p. 1-12.
6. Kim S., Kwak J., Cho B., Song S.Y., Lee S.W., Jeong C.
Clinical Implementation of 3D Printing in the
Construction of Patient Specific Bolus for Photon Beam
Radiotherapy for Mycosis Fungoides. 2017;
7. Atiq M., Atiq A., Iqbal K., Shamsi Q., Andleeb F.,
Buzdar S.A. Evaluation of dose conformity and coverage
of target volume for intensity-modulated radiotherapy of
pelvic cancer treatment. Indian Journal of Cancer. 2017
Jan 1;54(1):379–84.
8. Palmans H., Andreo P., Huq M.S., Seuntjens J., Christaki
K.E., Meghzifene A. Dosimetry of small static fields
used in external photon beam radiotherapy: Summary of
TRS-483, the IAEA–AAPM international Code of
Practice for reference and relative dose determination.
Medical Physics. 2018 Nov 1;45(11):e1123–45.
9. Rudzianskas V., Kupcinskaite, Noreikiene R. Re-
irradiation for Recurrent Head and Neck Cancer. In:
Radiotherapy. InTech; 2017.
200

MEDICAL PHYSICS IN THE BALTIC STATES 15 (2021)
Proceedings of International Conference “Medical Physics 2021”
4-6 November 2021, Kaunas, Lithuania
MASTER’S PROGRAM IN MEDICAL PHYSICS IN ENGLISH
Todorka L. DIMITROVA
University of Plovdiv “Paisii Hilendarski”, 24 Tsar Asen St., 4000 Plovdiv, Bulgaria
Abstract: Medical Physics is an important field of
contemporary scientific research, leading to innovative
technologies with vast application in medicine. This
raises the need for well-educated and trained specialists,
as well continuous lifelong learning. In 2012 Medical
Physics was recognized as a profession at international
level, therefore European countries started to give more
attention to the legislation concerning the medical
application of ionizing radiation. This way more
emphasis was given to Medical Radiation Physics, and
it also reflected on educational programs. The number
of master programs in Medical Physics increases
worldwide. However, they differ not only in every
country, but also in every university, depending on
available equipment in medical centers, training of
lecturers, and how adequately equipped student
laboratories are. However, there is a need to define an
obligatory set of disciplines by developing a
professional profile based on competences. The
common efforts of different national and international
institutions are needed. The expected result is the
modernization and synchronization of education and
meeting hospital needs.
Keywords: High Education, Master Program, Medical
Physics, Medical Physicist
1. Introduction
The participation of qualified experts in Radiation
Protection during any activity with ionizing radiation,
including medical applications has been requested since
1997 by EC Directive 97/43/Euratom [1]. However,
Medical Physics has been recognized as profession only
since 2012. It has been included at the International
Standard Classification of Occupation under the
standard ICSO-08 in both professional directions:
Physics and Engineering, and Healthcare.
The trend has been set and recommendations for
academic education and training in Medical Physics
(MP) has been given by EFOMP and IOMP Policy
Statements [2-6]. All of them are applicable only to
Medical Physicists working with ionizing radiation.
These recommendations are specific to different areas
of Medical Radiation Physics and depend on the
national legislation, economy, education, healthcare,
etc. IOMP Policy Statement No.2 requires that “The
minimum educational qualification for an MP is a
university degree (level corresponding to a master’s
degree) or equivalent majoring in medical physics or an
appropriate science subject.” [6]. This also includes
requirements for Professional Training and for
Professional Certification.
In Bulgaria, the statute of Medical Radiological
Physicists is established via state regulations for
standards in Radiotherapy [6] and in Medical Imaging
[7], as well via regulation for Radiation Protection in
Medical Treatment of the Personnel [8]. Actually,
Bachelor’s and Master’s Programs are active at the
University of Plovdiv and at the University of Sofia.
The Postgraduate Specializations are delivered by the
National Center for Radiobiology and Radiation
Protection, Ministry of Public Health since 1982 [9].
2. Short notes for the Master Programs in Medical
Physics in Bulgaria
The first Master Program in Medical Physics and
Radioecology in Bulgaria started at the University of
Shumen in 1990. It is not active anymore [10, 11].
A Master Program in Medical Radiation Physics and
Technique delivered in English was developed at the
University of Plovdiv in 1997 [10, 11]. It was an
initiative of Prof. Slavic Tabakov, the president of the
International Organization for Medical Physics (IOMP)
2015-2018 and the program was sponsored by an EC
TEMPUS Project. An Inter-University Center was
created between the University of Plovdiv, the Medical
University Plovdiv, and the Technical University Sofia
– branch Plovdiv. The project was strongly supported
by foreign partners – Kings’ College London (UK),
University of Florence (Italy) and University of Dublin
(Ireland). The program got accreditation for 5 years
from the Institute of Physics and Engineering in
Medicine (IPEM), UK. This was the first course in
Medical Physics accredited by this institution outside
the United Kingdom. After that the education was
201

T. L. Dimitrova et al. / Medical Physics in the Baltic States 15 (2021) 201-203
delivered in the Bulgarian language. The program was
adopted by several foreign universities in Latvia,
Lithuania, Estonia, Malaysia, Sudan, and others. The
program in Plovdiv ran until 2013. The new government
accreditation requested an update of the program. The
main problems were related to the big number of
external lecturers and lack of elective disciplines. The
program was renewed in 2015 while successfully
keeping the core courses of the previous program.
The Master Program in Medical Physics at the
University of Sofia was opened in 2000. Here one shell
mentioned that it differed significantly from its
equivalent in the University of Plovdiv.
Today the two Universities – of Sofia and of Plovdiv –
became partners in a joint project aiming to develop a
new program in Medical Physics delivered in English.
The project is called MODERN-A: Modernization in
partnership through digitalization of the Academic
ecosystem. Several foreign universities are involved as
Associated Partners: from UK, France, Spain, Lithuania,
Latvia, Greece, and Croatia.
The project is in its beginning and hereby the author
expresses her own point of view as a director of the
current Master Program in Plovdiv.
3. The Need for an update of the Master’s Programs
in Medical Physics
Medical Physics is developing very rapidly. The
curriculum always tends to be up-to-date, but it never
succeeds to follow all trends of science, technology, and
the labor market [12-14]. There is always some delay,
and no educational program can include the entire
related knowledge, nerveless ensure enough practical
training. It needs constant updating.
Medical imaging techniques and radiotherapy
equipment offer more and more new diagnostic and
therapeutic options. For example, the newest
Hybrid/Multimodality Medical Imaging technique
combines different techniques in one device, such as
PET/MRI, SPECT/CT, PET/CT [15]. A good Medical
Physicists should be specialized in at least two different
fields.
4. The Need for Master Program in Medical Physics
delivered in English
The world is varied, but the diseases are the same. There
is a lack of Medical Physicists all over the world. Many
countries do not have education in Medical Physics at
all, but they need Medical Physicists and therefore
educate their own abroad. From another side, many
specialists work abroad. For example, a big number of
Medical Physicists who graduated in Bulgaria work all
over the world in clinics, in the academic field or at
some of the international institutions. Nowadays,
English is the most recognized language for science
communication and technology exchange.
Medical equipment is supplied by leading international
companies (Siemens, Varian, Elekta, and others) which
also provide technical support.
Medical Physics is international. EFOM, IOMP, IAEA
and other international institutions push and support the
development of Medical Physics and the establishment
of the professional profile. They issue recommendations
and regulations and provide printed materials and post-
graduated training.
Maintaining a certain level of performance of Medical
Physicists requires their permanent participation in
scientific conferences, seminars, webinars, and
specialized courses. Therefore, English is the commonly
accepted language of Medical Physics.
5. The Need for joint Master Programs in Medical
Physics
Education in Medical Physics is not a routine task. It
needs theoretically well-prepared lecturers with
sufficient experience. The courses should be updated
regularly with the newest diagnostic and therapeutic
methods applied at hospitals. The best case is when a
teacher performs scientific research in the related field.
Such specialists are small in numbers in our country.
Unfortunately, experts with broad experience are of a
certain age and most of them cannot be employed in
regular academic positions, according to the new law
for academic development. There is an urgent need to
educate young people, however this needs time. The
statistics shows that over the past decade both
universities, the ones in Plovdiv and in Sofia, saw the
graduation of 10-15 Master students per year. This type
of education is quite expensive and economically not
sustainable.
Both universities, in Plovdiv and in Sofia, have well-
equipped laboratories in Radiation Physics disciplines –
Atomic and Nuclear Physics, Radiation Measurements,
Radiation Protection etc. But the practical work in
Medical Physics is usually performed at hospitals upon
voluntary negotiation. This leads to many difficulties.
The medical equipment is extremely expensive, and
training cannot be financially supported. Except for
doing it at laboratories at the university, students are not
permitted to work with ionizing radiation. This
difficulty can be overcome through the acquisition of
specialized software, for example, simulation systems
for treatment planning in Radiotherapy. Due to the
small number of students, it’s more convenient to
purchase such systems via a project in a joint Master
Program, as we intend to do. On the other hand,
development of a new joint master program would lead
to long discussions for defining the core courses, the
educational methods etc., and as a result would help
clarify the common needs on a national level. In this
way the program would become more sustainable.
6. The Need for foreign Associated Partners
There’s only so much that a person can do alone.
Education needs cooperation, exchange of experience,
continuous training of teachers. Foreign Associated
Partners could offer their help in preparing/updating
courses by providing recommendations and teaching
materials, delivering lectures and exchanging scientific
visits. This would increase the quality of educational
programs on international level. It would bring more
visibility for Medical Physics education and the
profession itself. A new international network in the
field of education and research could be created.
202

T. L. Dimitrova et al. / Medical Physics in the Baltic States 15 (2021) 201-203
7. Challenges for the establishment of a new Master
Program in Medical Physics
Creating a new joint Master Program in Medical
Physics delivered in English is a big challenge. There
are several different aspects, which can go beyond of its
direct education purpose.
Being essential for human life and health, Medical
Physicists’ work is of public importance. There is
regulation for Medical Physicists working with ionizing
radiation in medicine. But Medical Physicist with
Master’s and Bachelor’s degrees in Bulgaria are neither
in the list of regulated professions, nor in the list of
professional qualification yet! The specializations (after
Master’s degree) in Medical Radiological Physics and
Medical Sanitary Physics (for Physicists and Engineers)
are included as specialists in medicine with no medical
education. But they are also not included in the list of
regulated professions nor are they in the Directive
2005/36/ЕО for recognition of the professional
qualification. It’s a big challenge to approach the public
institutions and convince them to change this status.
No University in Bulgaria has accreditation for a doctor
degree in Medical Physics! Recently both the
universities of Sofia and Plovdiv were recognized as
research universities. They perform research in the
Medical Physics field as well, but they cannot educate
this kind of Ph.D. students. The one and only accredited
institution in Bulgaria for Ph.D. degree in Medical
Physics is the National Center for Radiobiology and
Radiation Protection, Ministry of Public Health. This is
an obstacle for academic career development.
There is a huge need for Medical Physicists in Bulgaria.
This is obvious from information recently provided by
BSBPE (2019). Two years ago, there were 20
departments in Radiotherapy with 81 different devices
(linear accelerators, orthovoltage machines,
CyberKnifes, planning systems etc.) and 61 employed
Medical Physicists; 21 Nuclear departments with 28
devices (PET, SPECTS etc.) and 15 employed Medical
Physicists; 2478 X ray machines with 7 employed
Medical Physicists. The certification of Medical Physics
Experts started in 2019 and since then 30 specialists
have been certified – 24 in Radiotherapy, 13 in Medical
Imaging and 3 in Nuclear Medicine. 7 of them have
passed 2 kinds of specializations, and 1 person obtained
all 3 kinds of specialization.
Medical Physics needs more publicity. Despite the fact
that the profession is crucial for every Medical Imaging
and Radiotherapy department, Medical Physicists are
invisible. A Medical Physicist works closely with
medical doctors but does not have the same level of
contact with the patient. Additionally, there is not
enough publicly released information for the other
branches of Medical Physics, like Medical Sanitary
Physics, Medical measurements Nonionizing Radiation
in Medicine, etc. This also results in low attraction of
students toward academic education in Medical Physics.
4. Conclusions
Medical Physics is an important part of contemporary
science, technology, and clinical practice. The need for
well-educated and trained specialists in this filed is
increasing worldwide. There are recommendations from
EFOMP, IOMP and IAEA for the grades of education
of Medical Specialists. It’s included partially at the
Bulgarian national legislation and addressed to people
working with ionizing radiation. However, an extension
toward other, nonionizing methods is needed.
The minimum degree required for working as a Medical
Physicist is a Master’s one. An update of the
educational and training Programs is needed - according
to recent technological developments and the current
economic and social situation. Master programs in
Medial Physics delivered in English would open more
possibilities for high performance, work, and
achievements of international relevance.
5. References
1. European Commission. Council Directive 97/43/EURATOM
of 30 June 1997 on health protection of individuals against
the dangers of ionizing radiation in relation to medical
exposure, Official Journal of the EC, L180, V22, 1997.
2. EFOMP Policy statement No. 1: Medical Physics Education
and Training: The Present European Level and
Recommendations for its Future Development, 1984.
3. EFOMP Policy statement No. 2: The Roles, Responsibilities
and Status of the Clinical Medical Physicist, 1984.
4. EFOMP Policy statement No. 8: Continuing Professional
Development for the Medical Physicist, 1998.
5. IOMP Policy Statement No. 1 The Medical Physicist: Role
and Responsibilities IOMP Working Group on Policy
Statement No. 11 10 August 2010. Approved by the IOMP
Council in WC 2012, Beijing, China.
6. IOMP Policy Statement No. 2 Basic Requirements for
Education and Training of Medical Physicists. IOMP
Working Group on Policy Statement No. 21, 10 August,
2010. Approved by the IOMP Council in WC 2012, Beijing,
China.
7. Наредба 6 от 29 януари 2010 г. за утвърждаване на
медицински стандарт „Лъчелечение”. ДВ. бр. 63 от
30.07.2021.
8. Наредба No 9 от 13 юли 2018 г. за утвърждаване на
медицински стандарт „Образна диагностика“.
9. Наредба 2 от 5 февруари 2018 г. за условията и реда за
осигуряване на защита на лицата при медицинско
облъчване, Министъра на здравеопазването, обн. ДВ.
бр.13 от 9 Февруари 2018г.
10. L. Litov, T.L. Dimitrova, Education in Medical Physics in
Bulgaria. (2010). Medical Physics in the Baltic States 2010, 1,
6-10.
11. T. L. Dimitrova, H. Hristov, E. Milieva. (2011). Medical
physics education and training in Bulgaria. “Medical physics
– the current status, problems, the way of development. High
technologies”, First International Workshop, Workshop
proceeding, June 02-03, 2011, Kyiv, Ukraine, 24-29.
12. Т. Л. Димитрова. (2014). Примери за добри европейски
практики в обучението по медицинска физика. XLII
Национална конференция на въпросите на обучението по
физика „Световни образователни стандарти, сравнителни
измервания и образованието по физика в България“,
Стара Загора, 8-11 септември 2014 г., 127-130.
13. Т. Л. Димитрова. (2014). Обучението по медицинска
физика в Европа - модерно и актуално. Физика:
Методология на обучението, т. 2, кн. 4, 254-261.
14. Т. Л. Димитрова, (2015). „Медицински физик“ - модерна
и перспективна професия. Светът на физиката, 1, 44-49.
15. https://www.ifmp.eu/Plovdiv-page-1.htm
203

CONTENT
Sören Mattsson. Reflections on 60 years of development in medical physics and thoughts about the future .................... 3
Carmel J. Caruana. Developing strategic leadership skills is crucial for the future of medical physics ............................. 9
P.S. Druzhinina, A. Chipiga, A. V. Vodovatov, A.V. Pozdnyakov, Yu. N. Kapyrina, D.O. Ivanov, Yu. V. Petrenko,
V.G. Puzyrev. The adjusted effective dose assessment from CT of the chest for pediatric patients: a hospital based
study ................................................................................................................................................................................. 11
Aleksandr Vodovatov, Ivan Romanovich, Sergey Ryzhov, Larisa Chipiga, Gleb Berkovich, Artem Biblin. Assessment
of the changes in structure of X-ray diagnostics and collective dose from CT examinations related to Covid-19 in the
Russian Federation in 2020............................................................................................................................................... 15
Leonid Repin, Rustam Akhmatdinov, Artem Biblin. Application of summary measures of population health to radiation
risks assessment ................................................................................................................................................................ 19
Kirill Skovorodko, Mažena Maciusovič, Marius Burkanas, Sigitas Tiškevičius, Laurynas Gilys, Renata Komiagienė,
Jonas Venius. Towards harmonization of clinical bone scintigraphy protocol between three different SPECT/CT
systems in Lithuania ......................................................................................................................................................... 23
Richard Deyhle Jr., Christian Bernhardsson, Lovisa Waldner, Lars E. Olsson, Marie Sydoff. Dosimetry concepts for
quality assurance in µCT ................................................................................................................................................ 28
Artem Davydov, Dmitri Kononenko, Artem Biblin, Alexander Vodovatov. Perception of medical risks and
sociodemographic characteristics of respondents ............................................................................................................. 32
Tatjana Vigovska, Katrina Caikovska, Mara Epermane. Estimation method of breast absorbed radiation dose during
coronary angiography ....................................................................................................................................................... 35
Leonid Krynke, Birutė Gricienė, Antonio Jreije, Laura Bilotaitė. Radiation dose follow-up for common interventional
cardiology and radiology procedures ................................................................................................................................ 39
Ilia Shatskiy, Dmitry Ivanov, Vitaly Reznik, Aleksandr Pozdnyakov, Viktor Puzyrev, Yuliya Kapyrina, Anna Nabieva,
Karine Panuntseva, Svetlana Bannova, Yury Petrenko. Relation between the severity of the course of the disease and
doses and radiation risk of the chest X-ray and CT examination of children with Covid-19 ........................................... 43
Aurimas Krauleidis, Vanda Andrijaitienė. Gamma spectroscopic analysis of 18 MeV photons activated radioisotopes in
Siemens Oncor Impression 3D linac head and its decommissioning experience ............................................................. 47
Sumeyra Can, Didem Karacetin, Niyazi Meric. A new monte carlo algorithm to simulate virtual source model on an
Elekta Versa HD linac ...................................................................................................................................................... 53
Marijus Astrauskas, Romualdas Griškevičius, Kęstutis Akelaitis, Ieva Markevičienė, Jonas Venius. Case study report:
advantages of Hyperarc™ in brain radiosurgery treatment planning ............................................................................... 57
Nur Kodaloğlu, Cafer Atar, Selami Karahan. A successful patient management system during Covid-19 pandemic and
the impact of the restrictions in a radiation oncology clinic in Turkey ............................................................................. 62
Linas Kudrevičius, Evelina Jaselskė, Diana Adlienė. Radiosurgery dose optimization for the patients with cerebral
arteriovenous malformations after endovascular embolization..........................................................................................66
Lyudmila Aslamova, Mykhaylo Zabolotnyy, Galina Dovbeshko, Galina Solyanik. Increasing the antitumor efficacy of
doxorubicin by highenergy irradiation of saline ............................................................................................................... 70
Ramune Ulrich. Extending lap product portfolio: Solutions for patient QA and machine QA ........................................ 74
204

Džiugilė Valiukevičiutė, Judita Puišo, Jurgita Laurikaitienė, Linas Kudrevičius. Formation and investigation of
Cu/CuOx nancompomcosite films for low dose dosimetry application ........................................................................... 78
Neringa Šeperienė, Ignas Pikas. Development of polymer gel based exhaled breath biomarkers detection sensor for
Covid-19 monitoring ........................................................................................................................................................ 82
Vijayanand Sivakumar, Diana Adlienė. Development of patient‘s biometric data based CT
dose optimization algorithm ............................................................................................................................................. 86
Christian Bernhardsson, Lovisa Waldner, Christopher Rääf, Aleksandr Vodovatov. Household salt (NaCl) for optically
stimulated luminescence dosimetry: an overview ............................................................................................................ 90
Vytenis Barkauskas, Lukas Rimkus, Jonas Reklaitis, Artūras Plukis, Mikas Vengris. Evaluation of the irradiation doses
from the operation of the intense femtosecond laser ........................................................................................................ 95
Artem Davydov, Artem Biblin, Alexander Vodovatov, Vladimir Safronov. Perceptions of the risks of radiodiagnostic
examinations in potentially high-dose and low-dose patients ........................................................................................... 99
Svetlana Sarycheva, Zumrud Vagidova. Prediction of deterministic skin effects in patients undergoing high-doses
interventional radiology examinations ............................................................................................................................ 102
Yuliya Dvornik, Natalia Veyalkina, Kseniya Fabusheva. Early effects of radiation exposure on peripheral blood cells
and normal organs of mice.............................................................................................................................................. 105
Antonio Jreije, Kirill Skovorodko, Mykolas Pavlauskas, Roman Machnin, Diana Adlienė, Birutė Gricienė. Optimization
of conventional X-ray image acquisition parameters for pelvic procedures: a phantom study ...................................... 109
Larisa Chipiga, Aleksandr Vodovatov, Polina Piven, Gleb Berkovich, Gennadiy Trufanov,
Irina Maschenko, Polina Druzhinina, Viktor Puzyrev. Fetal doses for pregnant patients undergoing chest CT
examinations ................................................................................................................................................................... 113
Inga Andriulevičiūtė, Kirill Skovorodko, Jurgita Laurikaitienė, Birutė Gricienė. Assessment of extremity exposure for
nuclear medicine personnel ............................................................................................................................................ 117
Mikhail V. Osipov, Andrey V. Vazhenin, Daria A. Vazhenina, Tatyana S. Novikova, Anna I.
Kuznetsova, Irina A. Aksenova, Mikhail E. Sokolnikov. PET-CT and occupational exposure: cohort profile update .. 121
Giedrė Morkūnaitė, Rimantas Ožiūnas, Vytautas Čeplauskas. Color changes of dental ceramics exposed to bleaching
materials.......................................................................................................................................................................... 125
Vladislav Golikov. Assessment of the radiation risks from medical X-ray examinations considering age and gender
composition of the patients ............................................................................................................................................. 129
Kristina Eriksson Stenström, Vytenis Barkauskas, Christian Bernhardsson, Aliaksandr Dvornik, Mattias Jönsson,
Charlotta Nilsson, Mattias Olsson, Guillaume Pédehontaa-Hiaa, Valery Ramzaev, Christopher Rääf, Aleksandr
Vodovatov. Preoperational assessment of 14C in the vicinity of the Belarusian nuclear power plant ........................... 133
Aliaksandr Dvornik, Veranika Sehlin. Accumulation of 137Cs by forest lichens in the chernobyl
affected territories ........................................................................................................................................................... 138
Guillaume Pédehontaa-Hiaa, Christian Bernhardsson, Vytenis Barkauskas, Andrius Puzas, Kristina Eriksson Stenström,
Christopher Rääf, Sören Mattsson. Evaluation of the region-specific risks of accidental radioactive releases from the
European Spallation Source ............................................................................................................................................ 142
205

Nur Kodaloğlu, Can Azak, Sezai Güçlü Kiliçoğlu, Tuğba Ulu, Gizem Kavak Eren, Hasan
Çamlicali, Ebru Karakaya. Back to the future: the positive educational impact of Covid-19 pandemic with online
learning program into clinic ............................................................................................................................................ 147
Aurimas Plaga, Ignas Pikas, Judita Puišo, Jurgita Laurikaitienė, Diana Adlienė. Ionizing radiation induced colour
changes in hydrogels....................................................................................................................................................... 150
Agnė Giedrytė, Lamiaa Abdelrazik, Marius Laurikaitis, Reda Čerapaitė-Trušinskienė, Jurgita Laurikaitienė. Phantom-
based quality control measurements for the newly installed linear accelerator halcyon ................................................. 155
Mindaugas Ilickas, Jurgita Laurikaitienė. Medical 3D image segmentation in radiotherapy treatment for a patient with
head and neck tumours ................................................................................................................................................... 159
Aleksandras Ševčik, Diana Adlienė. Comparison of experimentally measured dose depth distributions with MC
simulations in electron-irradiated dose gels .................................................................................................................... 163
Lijana Lileikytė, Benas Gabrielis Urbonavičius. TLD-100 response dependence on various factors ............................ 167
Mantas Brukštus, Diana Adlienė. Metallic artifacts and their reduction in nuclear magnetic resonance imaging (an
overview) ........................................................................................................................................................................ 171
Nur Kodaloğlu. Is it possible to apply a new technique with an old linac? A feasibility study of PLDR with Elekta
Synergy platform linac ................................................................................................................................................... 176
Justas Beresnevičius, Benas Gabrielis Urbonavičius. Prototype of contemporary gamma spectrometer based on obsolete
radiometer ....................................................................................................................................................................... 179
Mantvydas Merkis, Ignas Pikas, Diana Adlienė. Investigation of low toxicity dose gels with enhanced sensitivity ..... 183
Greta Vainiūtė, Laurynas Gilys, Lijana Lileikytė, Diana Adlienė. Investigation of exposure doses to nuclear medicine
staff working with Tc-99m ............................................................................................................................................. 187
Mindaugas Džiugelis, Leonid Krynke. Diagnostic and clinical grade medical imaging display performance evaluation
and optimization using quality assurance protocols ....................................................................................................... 191
Kamilė Dambrauskaitė, Jurgita Laurikaitienė, Artūras Andrejaitis. Application of 3D printed individual compensating
bolus for the verification of shallow head and neck cancer treatment ............................................................................ 197
Todorka L. Dimitrova. Master’s program in medical physics in english ........................................................................ 201
206

AUTHOR INDEX
Abdelrazik L. 155
Adlienė D. 66, 86, 109, 150,
163, 171, 183, 187
Akelaitis K. 57
Akhmatdinov R. 19
Aksenova I. 121
Andrejaitis A. 197
Andrijaitienė V. 47
Andriulevičiūtė I. 117
Aslamova L. 70
Astrauskas M. 57
Atar C. 62
Azak C. 147
Bannova S. 43
Barkauskas V. 95, 133, 142
Beresnevičius J. 179
Berkovich G. 15, 113
Bernhardsson C. 28, 90, 133,
142
Biblin A. 15, 19, 32, 99
Bilotaitė L. 39
Brukštus M. 171
Burkanas M. 23
Caikovska K. 35
Çamlicali H. 147
Can S. 53
Caruana C. J. 9
Chipiga L. 11, 15, 113,
Čeplauskas V. 125
Čerapaitė-Trušinskienė R. 155,
Dambrauskaitė K. 197
Davydov A. 32, 99
Deyhle R. Jr. 28
T. L. Dimitrova 201
Dovbeshko G. 70
Druzhinina P. 11, 113
Dvornik Y. 105
Dvornik A. 133, 138
Džiugelis M. 191
Epermane M. 35
Eren G. K. 147
Fabusheva K. 105
Giedrytė A. 155
Gilys L. 23, 187
Golikov V. 129
Gricienė B. 39, 109, 117,
Griškevičius R. 57
Ilickas M. 159
Ivanov D. O. 11, 43
Jaselskė E. 66
Jönsson M. 133
Jreije A. 39, 109
Kapyrina Y. 11, 43
Karacetin D. 53
Karahan S. 62
Karakaya E. 147
Kiliçoğlu S.G. 147
Kodaloğlu N. 62, 147, 176
Komiagienė R. 23
Kononenko D. 32
Krauleidis A. 47
Krynke L. 39, 191
Kudrevičius L. 66, 78
Kuznetsova A. 121
Laurikaitienė J. 78, 117, 150,
155, 159, 197
Laurikaitis M. 155
Lileikytė L. 167, 187
Machnin R. 109
Maciusovič M. 23
Markevičienė I. 57
Maschenko I. 113
Mattsson S. 3, 142
Meric N. 53
Merkis M. 183
Morkūnaitė G. 125
Nabieva A. 43
Nilsson C. 133
Novikova T. 121
Olsson M. 28, 133
Osipov M. 121
Ožiūnas R. 125
Panuntseva K. 43
Pavlauskas M. 109
Pédehontaa-Hiaa G. 133, 142
Petrenko Y. 11, 43
Pikas I. 82, 150, 183
Piven P. 113
Plaga A. 150
Plukis A. 95
Pozdnyakov A. 11, 43
Puišo J. 78, 150
Puzas A. 142
Puzyrev V. 11, 43, 113
Rääf C. 90, 133, 142
Ramzaev V. 133
Reklaitis J. 95
Repin L. 19
Reznik V. 43
Rimkus L. 95
Ryzhov S. 15
Romanovich I. 15
Safronov V. 99
Sarycheva S. 102
Sehlin V. 138
Shatskiy I. 43
Sivakumar V. 86
Skovorodko K. 23, 109, 117
Sokolnikov M. 121
Solyanik G. 70
Stenström K. E. 133, 142
Sydoff M. 28
Šeperienė N. 82
Ševčik A. 163
Tiškevičius S. 23
Trufanov G. 113
Ulrich R. 74
Ulu T. 147
Urbonavičius B. G. 167, 179
Vagidova Z. 102
Vainiūtė G. 187
Valiukevičiutė Dž. 78
Vazhenin A. 121
Vazhenina D. 121
Veyalkina N. 105
Vengris M. 95
Venius J. 23, 57
Vigovska T. 35
Vodovatov A.11, 15, 32, 90, 99,
113, 133
Waldner L. 28, 90
Zabolotnyy M. 70
207
Copyright © 2022 FDOKUMEN