2018_Azizi_Juzaili_1244934_et... - King's Research Portal
285
This electronic thesis or dissertation has been downloaded from the King’s Research Portal at https://kclpure.kcl.ac.uk/portal/ Take down policy If you believe that this document breaches copyright please contact [email protected] providing details, and we will remove access to the work immediately and investigate your claim. END USER LICENCE AGREEMENT Unless another licence is stated on the immediately following page this work is licensed under a Creative Commons Attribution-NonCommercial-NoDerivatives 4.0 International licence. https://creativecommons.org/licenses/by-nc-nd/4.0/ You are free to copy, distribute and transmit the work Under the following conditions: Attribution: You must attribute the work in the manner specified by the author (but not in any way that suggests that they endorse you or your use of the work). Non Commercial: You may not use this work for commercial purposes. No Derivative Works - You may not alter, transform, or build upon this work. Any of these conditions can be waived if you receive permission from the author. Your fair dealings and other rights are in no way affected by the above. The copyright of this thesis rests with the author and no quotation from it or information derived from it may be published without proper acknowledgement. Evaluation of brain permeability and neuroprotection of novel 3-hydroxy-4-pyridinone bidentate iron chelators for the treatment of parkinson’s disease Azizi, Juzaili Bin Awarding institution: King's College London Download date: 10. Aug. 2022
-
Upload
khangminh22 -
Category
Documents
-
view
1 -
download
0
Transcript of 2018_Azizi_Juzaili_1244934_et... - King's Research Portal

This electronic thesis or dissertation has been
downloaded from the King’s Research Portal at
https://kclpure.kcl.ac.uk/portal/
Take down policy
If you believe that this document breaches copyright please contact [email protected] providing
details, and we will remove access to the work immediately and investigate your claim.
END USER LICENCE AGREEMENT
Unless another licence is stated on the immediately following page this work is licensed
under a Creative Commons Attribution-NonCommercial-NoDerivatives 4.0 International
licence. https://creativecommons.org/licenses/by-nc-nd/4.0/
You are free to copy, distribute and transmit the work
Under the following conditions:
Attribution: You must attribute the work in the manner specified by the author (but not in anyway that suggests that they endorse you or your use of the work).
Non Commercial: You may not use this work for commercial purposes.
No Derivative Works - You may not alter, transform, or build upon this work.
Any of these conditions can be waived if you receive permission from the author. Your fair dealings and
other rights are in no way affected by the above.
The copyright of this thesis rests with the author and no quotation from it or information derived from it
may be published without proper acknowledgement.
Evaluation of brain permeability and neuroprotection of novel 3-hydroxy-4-pyridinonebidentate iron chelators for the treatment of parkinson’s disease
Azizi, Juzaili Bin
Awarding institution:King's College London
Download date: 10. Aug. 2022

1
EVALUATION OF BRAIN PERMEABILITY AND
NEUROPROTECTION OF NOVEL 3-HYDROXY-4-
PYRIDINONE BIDENTATE IRON CHELATORS FOR
THE TREATMENT OF PARKINSON’S DISEASE
by
JUZAILI AZIZI
A thesis submitted to King’s College London for the degree of
Doctor of Philosophy
February 2018

2
DECLARATION
This thesis submitted for the degree of Ph.D. entitled “Evaluation of brain permeability
and neuroprotection of novel 3-hydroxy-4-pyridinone bidentate iron chelators for
the treatment of Parkinson’s disease” is based upon work conducted by the author at
the Institute of Pharmaceutical Science, King’s college London between January 2013 and
May 2017. All the work described herein is original unless otherwise acknowledged in the
text or by references. None of the work has been submitted for another degree in this or
any other university.
JUZAILI AZIZI
February 2018

3
TABLE OF CONTENTS
1 GENERAL INTRODUCTION................................................................................. 22
Parkinson’s disease (PD) ...................................................................... 22
Aetiology of PD .............................................................................................. 22
Pathology of PD ............................................................................................. 25
Cell death mechanism in PD .......................................................................... 26
Pathogenesis of cell death in PD ................................................................... 28
Irons and their role in PD ............................................................................... 33
Iron chelators ................................................................................................. 34
Novel HPO iron chelators as potential treatment for PD ................................ 37
The blood-brain barrier (BBB) ........................................................................ 40
Overcoming the BBB ..................................................................................... 42
General hypothesis and aims ............................................................... 48
2 MATERIALS AND METHODS .............................................................................. 51
Evaluation of the blood-brain barrier permeability of iron chelators using in
situ brain perfusion....................................................................................... 52
Introduction .................................................................................................... 52
Animals.......................................................................................................... 53
Preparation of buffers .................................................................................... 53
In situ brain perfusion .................................................................................... 55
Measurement of pH, gases and ions in whole blood and perfusate ............... 58
Validation of in situ brain perfusion ................................................................ 63
Preparation of in situ brain perfusion samples for quantification analysis ....... 64
Validation of capillary depleted brain preparation ........................................... 68
Quantification analysis of in situ brain perfusion samples .............................. 72
Determination of unbound HPO in brain, plasma and perfusion fluid ......... 76
Brain uptake calculation ............................................................................. 80
Concepts and description of brain uptake parameters ............................... 83
Patlak plot .................................................................................................. 84
Linearity of brain uptake ............................................................................. 85

4
Optimised and validated protocol for in situ brain perfusion ....................... 90
Determination of neurotoxins IC50 and HPO toxicity for neuroprotection
studies using neuroblastoma cell lines (SH-SY5Y) .................................... 92
Introduction .................................................................................................... 92
Human neuroblastoma cell lines (SH-SY5Y) ................................................. 96
Sub-culturing SH-SY5Y ................................................................................. 97
Cells storage ................................................................................................. 97
Growing cells from storage ............................................................................ 98
Counting cells with hematocytometer ............................................................ 98
Plating SH-SY5Y cells to 96-well plates ......................................................... 99
Estimation of cell viability ............................................................................... 99
Neurotoxins ................................................................................................. 102
3-hydroxy-4-pyridinones .......................................................................... 110
HPLC method validation for evaluation of selected novel 3-hydroxy-4-
pyridinone iron chelators in rat brain and plasma for pharmacokinetics
application. .................................................................................................. 114
Introduction .................................................................................................. 114
Experimental animals .................................................................................. 115
HPLC method validation in plasma and brain .............................................. 115
HPOs solution preparation ........................................................................... 115
Standard calibration curve ........................................................................... 115
Quality control.............................................................................................. 118
Determination of optimum 6-OHDA dose for striatal injection in rat 120
Introduction .................................................................................................. 120
Animals........................................................................................................ 121
6-Hydroxydopamine (6-OHDA) preparation ................................................. 121
Intrastriatal injection of 6-OHDA .................................................................. 122
D-amphetamine rotation test ........................................................................ 125
Brain fixation ................................................................................................ 127
Brain sections .............................................................................................. 128
Immunohistochemical staining ..................................................................... 128
Quantification of immunoreactive cells ......................................................... 129

5
3 EVALUATION OF NOVEL 3-HYDROXY-4-PYRIDINONE BIDENTATE IRON
CHELATORS PENETRATION TO THE BRAIN ......................................................... 134
Introduction ......................................................................................... 134
Hypothesis ................................................................................................... 136
Aims ............................................................................................................ 136
Materials and methods ........................................................................ 137
Animals........................................................................................................ 137
HPO ............................................................................................................ 137
Brain uptake studies .................................................................................... 137
Brain uptake-inhibition studies ..................................................................... 139
Brain uptake calculation ............................................................................... 140
Relationship between brain uptake and HPOs physicochemical properties . 141
Statistical and data analysis ......................................................................... 141
Results ................................................................................................. 142
Brain uptake of novel HPOs ......................................................................... 142
HPO brain uptake relationship with lipophilicity (cLogP) .............................. 144
Brain uptake-inhibition studies ..................................................................... 145
Relationship of brain uptake with physicochemical properties before and after
inhibition studies. ..................................................................................................... 151
Discussion ........................................................................................... 153
Summary of the findings .............................................................................. 153
Brain uptake of CP20 ................................................................................... 154
Brain uptake of novel HPOs ......................................................................... 156
Brain distribution of novel HPO iron chelators .............................................. 162
Advantages and shortcomings of this study ................................................. 163
Conclusion ................................................................................................... 164
4 NEUROPROTECTION STUDY OF NOVEL HPOS WITH NEUROBLASTOMA
CELL LINE (SH-SY5Y) ............................................................................................... 167
Introduction ......................................................................................... 167
Hypothesis ................................................................................................... 168

6
Aims ............................................................................................................ 168
Materials and methods ........................................................................ 169
SH-SY5Y cells culture ................................................................................. 169
Preparation of 3-hydroxy-4-pyridinones (HPOs) solution ............................. 169
Preparation of neurotoxins solution .............................................................. 169
In vitro neuroprotection studies .................................................................... 170
Determination of cell viability with MTT assay .............................................. 171
Comparison between pFe3+ for HPOs and cell viability after treatment with
toxins 171
Data analysis ............................................................................................... 172
Results ................................................................................................. 173
Effect of HPOs on viability of SH-SY5Y cells exposed to H2O2 .................... 173
Effect of HPOs on viability of SH-SY5Y cells exposed to 6-OHDA ............... 176
Effect of HPOs on viability of SH-SY5Y cells exposed to MG132 ................ 178
Effect of HPOs on viability of SH-SY5Y cells exposed to FeNTA ................. 180
Discussion ........................................................................................... 182
Summary of the findings .............................................................................. 182
Neuroprotection of HPOs against H2O2 toxicity in SH-SY5Y ........................ 184
Neuroprotection of HPOs against 6-OHDA toxicity in SH-SY5Y ................... 186
Neuroprotection of HPOs against MG132 .................................................... 187
Neuroprotection of HPOs against FeNTA .................................................... 188
Advantages and shortcomings of this study ................................................. 190
Summary ..................................................................................................... 193
Conclusion ................................................................................................... 193
5 NEUROPROTECTION STUDY OF NOVEL HPOS WITH 6-OHDA LESIONED RAT
MODEL OF PARKINSON’S DISEASE ....................................................................... 196
Introduction ......................................................................................... 196
Hypothesis ................................................................................................... 198
Aims ............................................................................................................ 198
Materials and methods ........................................................................ 199

7
Experimental animals .................................................................................. 199
Pharmacokinetics evaluation of selected novel 3-hydroxy-4-pyridinone iron
chelators in rats ....................................................................................................... 199
6-OHDA model of PD for neuroprotection study .......................................... 200
D-amphetamine rotation test ........................................................................ 201
Determination of dopamine and serotonin level by HPLC-ECD ................... 202
Brain fixation and sectioning ........................................................................ 205
Immunohistochemistry ................................................................................. 205
Data and statistical analysis ......................................................................... 205
Results ................................................................................................. 207
Pharmacokinetics study for HPO dose justification ...................................... 207
Effects of partial striatal 6-OHDA lesion and HPOs treatment on rat body
weight 209
Effects of toxins and HPOs treatment on D-amphetamine-induced ipsilateral
rotations .................................................................................................................. 210
Effects of toxins and HPOs treatment on catecholaminergic neurotransmitters
in striatum ............................................................................................................... 211
Effects of toxins and HPOs treatment on TH-positive cells in SNPc ............. 214
Discussion ........................................................................................... 216
Pharmacokinetic study ................................................................................. 216
Effect of unilateral partial 6-OHDA-lesioned on D-amphetamine induced
rotation .................................................................................................................... 219
Effect of CP20 and CN128 on 6-OHDA-induced alterations of dopamine and
serotonin levels in striatum ...................................................................................... 221
Effect of CP20 and CN128 on 6-OHDA-induced dopaminergic cell loss in
SNPc 222
Advantages and shortcomings of this study ................................................. 224
Conclusion ................................................................................................... 228
6 GENERAL DISCUSSION .................................................................................... 230
Thesis hypothesis and aims ............................................................... 230
Summary of the findings .................................................................... 231

8
Did the modifications of the chemical structure of CP20 permit BBB
permeability and show neuroprotection? ................................................. 232
Brain permeability of novel HPOs ................................................................ 232
In vitro neuroprotection of brain permeable HPOs ....................................... 234
Pharmacokinetics of brain permeable HPOs ............................................... 234
In vivo neuroprotection of brain permeable HPO ......................................... 235
Conclusion ................................................................................................... 236
PD models to evaluate neuroprotection ............................................ 237
Validity of the PD models to study neuroprotective ability of HPOs .............. 237
Suggestion for improvements in neuroprotection studies ............................. 238
Future outlook ..................................................................................... 239
Suggested further studies ............................................................................ 241
Final conclusion .................................................................................. 244

9
ABSTRACT
Iron has been linked with the neurodegenerative process in Parkinson’s disease (PD) as
autopsied Parkinsonian showed increases in iron level in the brain, especially in the basal
ganglia. Treatment with the blood-brain barrier (BBB) permeable iron chelator, deferiprone
(CP20) shows improvement in motor symptoms among PD patients possibly by
neuroprotective mechanism. However, serious side effects such as agranulocytosis and
neutrocytopenia limit its use especially for the elderly PD patients that are more prone
such toxicity. A series of CP20 derivatives with chiral functional group have been
developed by chemical modification and showed better toxicity profiles than CP20 when
tested in rodents. However, the structural modifications of CP20 might change their brain
permeability profile and reduce their effectiveness as neuroprotective agents. For this
reason, the aim of the studies reported in this thesis was to investigate the brain
permeability of CP20 derivatives by in situ brain perfusion. In addition, a CP20 derivative
that is conjugated with glucose was also investigated as a strategy to improve BBB
permeation. This was followed by investigation of the neuroprotective capability on
dopaminergic cell death in in vitro and in vivo models of cell death in PD. The effect of
functional group chirality on the biological experiments were also evaluated.
Seven out of eight of the CP20 derivatives tested showed successful brain penetration as
assessed by in situ brain perfusion. From these seven brain penetrant CP20 derivatives,
one (CP84) show superior brain uptake, three CN128, CN226 and CN228) showed
comparable brain uptake, and three (CN116, CN118 and CN126) showed lower brain
uptake than CP20. Glucose conjugated CP20 derivative failed to cross the BBB. The in
vitro neuroprotection study in SH-SY5Y neuroblastoma cells revealed neuroprotective
effect of the brain penetrant CP20 derivatives against H2O2-, 6-OHDA-, and FeNTA- but
not MG-132-induced cell death. Some of the CP20 derivatives showed better
neuroprotection at equimolar concentration of CP20. In both studies, molecules chirality
did not have effect on in situ brain permeability or in vitro neuroprotection. One CP20
derivative (CN128) was selected for in vivo neuroprotection study with 6-OHDA rat model
of PD. CN128 showed comparable neuroprotection of dopaminergic neurons in the nigro-
striatal dopamine pathway. In conclusion, these studies showed that all but the glucose-
conjugated derivative of CP20 can permeate the BBB and are neuroprotective in

10
experimental models of PD suggesting these novel iron chelators may be used as potential
neuroprotective agent in the treatment of PD.

11
LIST OF FIGURES
Figure 1.1.1: a) CP20 molecular structure with oxygen ligand (3-OH) available to form
bond with iron b) CP20 glucuronide structure which is pharmacologically inactive. ....... 38
Figure 2.1.1: Schematic diagram of in situ brain perfusion set up. ................................ 55
Figure 2.1.2: The tubing and cannula for in situ brain perfusion. ................................... 56
Figure 2.1.3: Step by step procedures of carotid artery cannulation. ............................. 57
Figure 2.1.4: pH, ions and blood gaseous in arterial and venous of whole blood (naïve
rats) or perfusate (perfused rats). .................................................................................. 59
Figure 2.1.5: Arterial-venous O2 (A-V) and venous-arterial (V-A) CO2 diferences in rats.62
Figure 2.1.6: Arterial-venous (A-V) glucose diference in rats. ........................................ 63
Figure 2.1.7: Illustration of capillary depleted brain preparation. .................................... 66
Figure 2.1.8: Sample preparation for LSS analysis. ...................................................... 67
Figure 2.1.9: Sample preparation for HPLC analysis by gradient reversed-phase ion-pair
method. ......................................................................................................................... 68
Figure 2.1.10: Conversion of p-nitrophenyl phosphate, a probe substrate for alkaline
phosphatase to formed yellowish hue product in alkaline condition, p-nitrophenol, which
has maximal absorption at 405 nm. ............................................................................... 69
Figure 2.1.11: Typical BSA standard curve obtained from BCA protein assay............... 70
Figure 2.1.12: Typical pNP standard curve obtained from alkaline phosphatase enzyme
assay. ........................................................................................................................... 71
Figure 2.1.13: Alkaline phosphatase specific activity in capillary depleted brain (Cd) and
capillary enriched pellet (Cap). ...................................................................................... 71
Figure 2.1.14: HPLC gradient method for a successful separation of HPOs. Mobile
phase B contained 90 % (v/v) acetonitrile in water with 1 g/L pentadecafluorooctanoic
and 0.01 % (v/v) formic acid. ......................................................................................... 73
Figure 2.1.15: Representative chromatogram for CP20. ............................................... 74
Figure 2.1.16: Representative calibration curve for CP20 prepared in HPLC water. ...... 74
Figure 2.1.17: Percentage of free-unbound HPOs in perfusate, plasma and brain
homogenate. ................................................................................................................. 78
Figure 2.1.18: Relationship between free unbound HPO with HPO cLogP. ................... 79
Figure 2.1.19: Example of calculation for 3H-OMG RCd and Kin,Cd. ................................. 81
Figure 2.1.20: Example of calculation for CP20 RCd,u and Kin,Cd,u ................................... 83
Figure 2.1.21: Example of Patlak plot for CP20 in rat brain. .......................................... 85

12
Figure 2.1.22: Patlak plot for 3H-OMG, CP20 and 14C-sucrose in rat brain. ................... 86
Figure 2.1.23: Brain uptake at 20-minutes perfusion time for 3H-OMG and CP20 in
capillary depleted brain before (RCd,u,total) and after (RCd,u) correction with 14C-sucrose
vascular space. ............................................................................................................. 89
Figure 2.2.1: SH-SY5Y cells grown at approximately 80% confluence (5X
magnification)................................................................................................................ 97
Figure 2.2.2: Example of cells number calculation with haemocytometer. ..................... 98
Figure 2.2.3: Schematic diagram showing steps from cells thawing, growing in flask,
counting and plating into 96-well plates. ........................................................................ 99
Figure 2.2.4: Schematic diagram for conversion of mitochondria reductase substrate,
MTT to purple formazan that has maximal absorption at 570 nm. ............................... 100
Figure 2.2.5: Linearity of MTT absorbance at 570 nm with different cell density. ......... 101
Figure 2.2.6: Cell death of SH-SY5Y cells following exposure to H2O2. ....................... 103
Figure 2.2.7: Cell death of SH-SY5Y cells following exposure to 6-OHDA and L-ascorbic
acid. ............................................................................................................................ 104
Figure 2.2.8: Cell death of SH-SY5Y cells following exposure to MG132. ................... 106
Figure 2.2.9: Cell death of SH-SY5Y cells following exposure to FeNTA (1:5). ........... 108
Figure 2.2.10: Cell death of SH-SY5Y cells following exposure to FeNTA (1:3). ......... 109
Figure 2.2.11: Effect of CP20 and novel HPOs on SH-SY5Y cells viability. ................. 112
Figure 2.3.1: Representative chromatogram for CP20 and CN226 spiked into rat plasma
or brain homogenate. .................................................................................................. 116
Figure 2.3.2: Representative standard calibration curve of CP20 spiked into blanked
plasma and brain. Data was analysed by least-square linear regression analysis
(GraphPad Prism 7 Software). .................................................................................... 116
Figure 2.4.1: Surgical setup for stereotaxic brain lesion procedure. ............................ 123
Figure 2.4.2: Site and co-ordinate of left striatum base on Paxinos and Watson (2004) for
intrastriatal injection of 6-OHDA in rat. The red dot () depicts the site of injection in the
striatum. ...................................................................................................................... 124
Figure 2.4.3: Recorded body weight on the day of lesion and after lesioned for up to 14
days. n=4 rats. ............................................................................................................ 125
Figure 2.4.4: Illustration of the 6-OHDA lesioned in the left striatum and the expected
ipsilateral rotation after injection with D-amphetamine. ................................................ 125
Figure 2.4.5: D-Amphetamine rotation test for 6-OHDA unilateral striatal lesioned rat. 127

13
Figure 2.4.6: Representative photomicograph of brain coronal section at 2.5X
magnification showing basal ganglia. .......................................................................... 130
Figure 2.4.7: TH+ cell counts in the ipsilateral and contralateral SNPc. ....................... 131
Figure 2.4.8: Top panel: Representative photomicrographs of TH+ striatum. Bottom
panel: Optical density for TH immunostaining in a) caudal, b) medial and c) rostral
striatum following intrastriatal administration of varying doses of 6-OHDA. ................. 132
Figure 3.1.1: General chemical structure of CP20 chiral N-hydroxyalkyl derivatives (CN
compounds).. .............................................................................................................. 134
Figure 3.3.1: Brain uptake of HPO iron chelators for total HPO in whole brain (RBr,u), total
HPO in capillary depleted brain (RCd,u) and unbound HPO (RCd,uu) in capillary depleted
brain over 20 minutes in situ brain perfusion. .............................................................. 142
Figure 3.3.2: Regression analysis of RCd,uu plotted against HPO lipophilicity (cLogP). . 145
Figure 3.3.3: Self-inhibition study for CP84 at various concentrations ......................... 146
Figure 3.3.4: CP84 flux derived from bar graph in Figure 3.3.4. .................................. 147
Figure 3.3.5: Inhibition study of CP84 with 10 mM BCH. ............................................. 148
Figure 3.3.6: Chromatograms of FCF132 in lower glucose condition a) FCF132 perfusate
b) FCF132 perfused whole brain c) FCF132 perfused capillary depleted brain d) blank
(whole brain). FCF132 retention time was ~6.7 minute. .............................................. 149
Figure 3.3.7: Effect of Pgp inhibitor on the brain uptake of selected HPOs. ................. 150
Figure 3.3.8: Regression analysis of brain uptake of total HPO in brain (RCd,u) plotted
against HPO physicochemical properties. ................................................................... 152
Figure 3.4.1: a) Interaction of –OH group on glucose molecule to the GLUT-1 active site.
Taken from Mueckler and Makepeace (2009) b) FCF132 chemical structure. The circled
OH-functional groups are vital for glucose recognition site at GLUT-1 activite site. ..... 159
Figure 4.2.1: Experimental timeline for in vitro neuroprotection study with SH-SY5Y. . 171
Figure 4.3.1: Effect of H2O2 on cell viability assessed by MTT assay after pre-incubation
with novel HPO iron chelators. .................................................................................... 175
Figure 4.3.2: Effect of 6-OHDA on cell viability assessed by MTT assay after pre-
incubation with novel HPO iron chelators. ................................................................... 177
Figure 4.3.3: Effect of MG132 on cell viability assessed by MTT assay after pre-
incubation with novel HPO iron chelators. ................................................................... 179
Figure 4.3.4: Effect of FeNTA (1:3) on cell viability assessed by MTT assay after pre-
incubation with novel HPO iron chelators. ................................................................... 181

14
Figure 4.4.1: Chemical structure of a) CP20 and b) Apo6856, a fluorinated derivative of
CP20.. ......................................................................................................................... 185
Figure 4.4.2: Production of ROS during 6-OHDA metabolism to p-quinone (Izumi et. al.,
2005). ......................................................................................................................... 187
Figure 4.4.3: Suggested mechanism of Fe(III) transfer-equilibration between NTA and
HPOs. ......................................................................................................................... 190
Figure 5.2.1: Overview of experimental timeline. ......................................................... 201
Figure 5.2.2: Steps of striatum dissection on the isolated perfused brain. ................... 202
Figure 5.2.3: Representative chromatogram and standard curves for dopamine and
serotonin with their metabolites. .................................................................................. 204
Figure 5.3.1: Concentration in plasma/brain against plasma sampling time after i.p.
injection with 500 µmol/kg HPOs. ................................................................................ 207
Figure 5.3.2: Weight of rats over the course of in vivo neuroprotection study. ............. 209
Figure 5.3.3: D-Amphetamine rotation test for 6-OHDA unilateral striatal lesioned rat. 210
Figure 5.3.4: Dopamine and metabolites measurement in striatum.Level of dopamine,
DOPAC and HVA in the striatum as determined by HPLC-ECD. Data are mean+SEM
(n=6 rats). * p<0.05, *** p<0.001 compared to ipsilateral side; # p<0.05, ##
p<0.01compared to Sal/6-OHDA ipsilateral side (two-way ANOVA followed by Holm-
Šídák multiple comparison test). ................................................................................. 211
Figure 5.3.5: 5-HT and metabolite measurement in striatum. ...................................... 213
Figure 5.3.6: TH+ staining cells in the SNPc. ............................................................... 214
Figure 5.3.7: Representative photomicograph of brain coronal section showing TH+ cells
in SNPc region. ........................................................................................................... 215

15
LIST OF TABLES
Table 1.1.1: Physicochemical property ranges. Suggested for increased CNS
permeability. ................................................................................................................. 45
Table 2.2.1: Chemical constituent of normal Ringer’s solution and their concentration. . 54
Table 2.2.2: Chemicals constituents of physiological buffer solution and their
concentration. ............................................................................................................... 54
Table 2.1.3: Specific activity of radionuclides and amount perfused. ............................. 64
Table 2.1.4:Total dilution of in situ brain perfusion samples before injected into HPLC . 73
Table 2.1.5: Percentage (%) recovery of HPOs extracted with 10% (v/v) TFA from spiked
perfusion fluid and brain homogenate. .......................................................................... 76
Table 2.1.6: Effects of brain homogenate dilution on the detection of free, unbound CP20
in brain tissue ................................................................................................................ 77
Table 2.1.7:Rate of brain uptake in capillary depleted brain for 3H-OMG and CP20, and
the respective brain vascular space derived from linear regression analysis on Patlak
plot (Figure 2.23b). ........................................................................................................ 88
Table 2.1.8: Comparison between Kin,Cd,u for 3H-OMG and CP20 calculated by single-
time point (20 minutes) or regression analysis on Patlak plot (Figure 2.23b). ................ 89
Table 2.2.1: Complete cell culture medium (complete-DMEM) constituents .................. 96
Table 2.2.2: Summary of the toxin with their IC50 use in the in vitro neuroprotection study.
................................................................................................................................... 110
Table 2.2.3: IC50 values for HPOs assessed by MTT assay. ....................................... 113
Table 2.3.1: LOD and LOQ of CP20 spiked into rat brain and plasma. ........................ 117
Table 2.3.2: Intraday assay precision and accuracy for CP20 in rat plasma and brain 118
Table 2.3.3: Interday assay precision and accuracy for CP20 in rat plasma and brain 119
Table 2.4.1: The concentrations and doses of 6-OHDA injected into the rat left striatum.
................................................................................................................................... 122
Table 3.2.1: List of HPOs, their chemical structures and selected physicochemical
properties [lipophilicity (cLogP), molecular weight (MW) and total polar surface area
(TPSA)]. ...................................................................................................................... 138
Table 3.3.1: Rate of brain uptake for unbound HPO in brain (Kin,Cd,uu) over 20 minutes in
situ brain perfusion. ..................................................................................................... 144
Table 3.3.2: Rate of brain uptake for total CP84 in brain (Kin,Cd,uu) over 20 minutes in situ
brain perfusion with various concentration of CP84. .................................................... 147

16
Table 3.3.3: Rate (Kin,Cd,uu) of CP84 brain uptake co-perfused with 10 mM BCH over 20
minutes in situ brain perfusion. .................................................................................... 149
Table 3.3.4: Rate (Kin,Cd,uu) of selected HPOs brain uptake co-perfused with 5 µM CsA
over 20 minutes in situ brain perfusion. ....................................................................... 151
Table 3.4.1: Summary of the findings .......................................................................... 154
Table 4.2.1: pFe3+ values for HPOs as determined by potentiometric technique ......... 172
Table 4.4.1: Summary of the findings for in vitro neuprotection study with SH-SY5Y cells
................................................................................................................................... 183
Table 5.3.1: Pharmacokinetic profile for CP20, CN128 and CN226 after 500 µmol/kg
single i.p. injection. ...................................................................................................... 208
Table 5.3.2: Dopamine turnover in rat striatal tissue.................................................... 212
Table 5.3.3: Serotonin turnover in rat striatal tissue. ................................................... 213

17
LIST OF ABBREVIATIONS
3H-OMG 3H-O-methyl-D-glucose
6-OHDA 6-hydroxydopamine
ATP Adenosine triphosphate
BBB Blood-brain barrier
BCEC Brain capillary endothelial cells
BCH 2-amino-2-norbornanecarboxylic
BSA Bovine serum albumin
cLogP Lipophilicity
CNS Central nervous system
CP20 Deferiprone
CSF Cerebrospinal fluid
DFO Deferrioxamine
DFX Deferasirox
DNA Deoxyribonucleic acid
DOPAC 3,4-dihydroxyphenylacetic acid
DPM Disintegration per minute
ETC Electron-transport chain
Fe2+ Ferrous iron
Fe3+ Ferric ion
FeNTA Ferric nitrolotriacetoacetate
GLUT1 Glucose transporter 1
GLUTs Glucose transporters
GSH Glutathione
HEPES 4-(2-hydroxyethyl)-1-piperazineethanesulfonic acid
HPLC High performance liquid chromatography
HPO 3-hydroxy-4-pyridinone
HVA Homovanilic acid
i.p. Intraperitoneal
ID Internal diameter
ISF Interstitial fluid
LAT1 Large neutral amino acid transporter 1

18
LB Lewy bodies
LIP Labile iron pool
LPS Lipopolysaccharide
LSS Liquid scintillation spectroscopy
MAO-B Monoamine-oxidase B
MPTP 1-methyl-4-phenyl-1,2,3,6- tetrahydropyridine
mRNA Messenger RNA
mtDNA Mitochondrial DNA
MTT 3-(4,5-dimethylthiazol-2-yl)-2,5-diphenyltetrazolium
NMDA N-methyl-D-aspartate
NRS Normal Ringer’s solution
OD Outer diameter
PCO2 CO2 partial pressure
PD Parkinson’s disease
PE Polyethylene
pFe3 Iron affinity constant
P-gp P-glycoprotein
PhyBS Physiological buffer solution
PO2 O2 partial pressure
PTFE Polytetrafluoroethylene
RBC Red blood cells
ROS Reactive oxygen species
SNPc Substantia nigra pars compacta
TFA Trifluoroacetic acid
UPS Ubiquitin proteasome system

19
LIST OF CONTRIBUTIONS
KCL IPS Postgraduate Research
Symposium
Poster London, UK May 2014
4th UK and Ireland Blood-Brain Barrier
Symposium
Oral London, UK November 2014
KCL IPS Postgraduate Research
Symposium
Oral London, UK May 2015
American Association of
Pharmaceutical Scientists (AAPS)
Annual Meeting and Exposition
Poster Florida, USA October 2015

20
ACKNOWLEDGEMENT
With boundless love and appreciation, I would like to extend my heartfelt gratitude and
appreciation to the people who help me bring this study into reality. I would like to extend
my profound gratitude to the following: My supervisors, Dr Sarah Salvage, Dr Jane Preston
and Dr David Begley whom expertise, consistent guidance, ample time spent and
consistent advices that help me bring this study into success. I would also like to express
my appreciation to Professor Robert Hider to provide the compounds for this study and for
technical advices. My deepest gratitude and appreciation to Dr Atsuko Hikima for her
invaluable advice, support and assistance in the laboratory.
To my best friend, Awis Sabere, who have been by my side through thick and thin of my
PhD journey. Without his moral support, this journey would be harder to traverse. Not to
forget my PhD friends: Asyura Amdan, Fauzi Jalil, Goh Choon Fu, Hazeeq Azman
Muzamir Mahat and Norzawani Buang whom have been facing the same hurdle. The
journey felt livelier when surrounding with friends whom understand your struggles. My
utmost gratitude to Louis Porta, whom allows me to stay in his flat in the last year of my
PhD and helping me with the proof-reading of the thesis. To my past and present
colleagues whom have been helping me with my study, especially Ana Georgian,
Dominika Klisko, Ferdinand Fuchs, Jaewon Lee and Louise Lincoln.
Finally, my greatest gratitude and love to my family especially my father, the late Azizi
Buyong and my mother, Khadijah Elias for their love, support and encouragement. This
project was supported financially by The Ministry of Higher Education Malaysia and
Universiti Sains Malaysia (USM) Penang, for which I am indebted.

CHAPTER 1: GENERAL INTRODUCTION
21
CHAPTER 1
GENERAL INTRODUCTION

CHAPTER 1: GENERAL INTRODUCTION
22
1 General Introduction
Parkinson’s disease (PD)
Parkinson’s disease (PD) is the second most common neurodegenerative disease after
Alzheimer’s disease which affects 1% of the population over 60 years of age and the
incidence increases with age (de Lau and Breteler, 2006). The disease is characterised
by progressive cardinal motor symptom which include bradykinesia, rigidity, resting
tremor, gait dysfunction and postural instability (Jankovic, 2008). Non-motor symptoms
can also occur including depression, anxiety, autonomic dysfunction, cognitive
impairment, and sleep disturbance (Jankovic, 2008). With increasing life expectancy, it is
estimated that the world-wide population of PD patients will double by 2050 (Schapira and
Jenner, 2011). Current therapy focuses on symptomatic management of the motor
symptoms, however, there is currently no available treatment to prevent the progress of
the disease, and this remains a serious unmet clinical need.
Aetiology of PD
PD is a multifactorial neurodegenerative disease that involves genetic, environmental or
combination of both factors in inducing cell death (Warner and Schapira, 2003). Extensive
years of research has unveiled mutated genes and environmental toxins that could cause
PD. Familial-type of PD which involves genetic mutations only account for less than 10%
of PD cases and is normally characterised by early age of onset (<40 years old) (Gasser,
2009). The rest of the reported cases of PD is sporadic without definite causes (>90%)
which usually affect population of age more than 40 years old (de Lau and Breteler, 2006).
The cases of sporadic PD also corroborate the theory that aging as an important risk factor
in developing PD (Zhang et al., 2000).
Although familial-type of PD only accounts for less than 10% of PD population, the
discovery of mutated-genes identified by genetic linkage analysis and genome wide
association studies is an important breakthrough and provide explanation of the molecular
mechanism underlying the pathogenesis of PD (Klein and Westenberger, 2012). These
genes express proteins that are involved in cell regulation and protection which include
protein degradation, antioxidant and mitochondria homeostasis. To date, 28 genes
associated with PD have been identified with five of them are the most studied (Lin and

CHAPTER 1: GENERAL INTRODUCTION
23
Farrer, 2014, Pankratz and Foroud, 2007). These genes are SNCA (encode for α-
synuclein), LRRK2 (encode for leucine-rich repeat kinase-2), parkin (encode for parkin),
PINK1 (encode for phosphatise and tensin homologue induced putative kinase-1) and DJ-
1 (encode for DJ-1).
SNCA is the first PD-associated gene that was identified in ‘Contursi kindred’ of Italian
descent (Golbe et al., 1999). Mutation in this gene lead to accumulation and aggregation
of fibrillar α-synuclein as a major component of LB, a signature and a post-mortem
diagnostic criterion for familial and sporadic PD (Chai and Lim, 2013). Remarkably,
cytosolic dopamine can form an adduct with α-synuclein protofibril, stabilise it and inhibit
conversion to α-synuclein fibril (Conway et al., 2001). Although this may seem as
neuroprotective, the dopamine-α-synuclein protofibril adduct is capable of disrupting the
cellular membrane by forming pore-like structure which might suggest the selective
dopaminergic neuron loss in PD (Tosatto et al., 2012). This finding also provides the role
of α-synuclein not only in familial-PD, but also in sporadic-PD.
Mutation in LRRK2 is the most common cause of familial PD in the world characterised by
hyper-phosphorylation activity of mutated LRRK2, a tyrosine kinase like protein (Chai and
Lim, 2013). Elevated phosphorylation of LRKK2 substrates which include MAP kinase and
peroxiredoxin underlies the pathogenesis of LRRK2 mutation (Boon et al., 2014).
Parkin function as E3 ligase associated with the ubiquitin-proteasome system which
degrades unwanted proteins (Riley et al., 2013). Mice expressing mutant parkin and parkin
knock-out mice have been shown to exhibit features of PD pathology and symptom such
as mitochondrial dysfunction, age-dependent hypokinetic motor deficits and dopaminergic
neuron degeneration (Lu et al., 2009, Palacino et al., 2004).
PINK-1 mutations are prevalent in PD patients of Asian descent by 20-fold than European
descent (Kilarski et al., 2012). This gene encodes for mitochondrial membrane-bound
serine/threonine kinase that involves in the recruitments of protein for mitophagy (Zhou et
al., 2008). Study of PD-related PINK-1 mutant expressed in human neuroblastoma cell
line revealed dysfunction of mitophagy as the cause of apoptosis while overexpression of
wild-type PINK-1 was found to be neuroprotective (Petit et al., 2005).
CHAPTER 1: GENERAL INTRODUCTION
24
DJ1 encodes for peroxiredoxin-like peroxidase that is localised in mitochondria and
capable to scavenge mitochondrial H2O2 (Andres-Mateos et al., 2007). Base on the fact
that DJ1 protein involve as a mitochondrial antioxidant, it can be deduced that mutation of
DJ1 could predispose dopaminergic neurons to oxidative stress, consistent with finding
observed in MPTP treated DJ1-deficient mice (Kim et al., 2005).
Although genetic mutations have contributed greatly to the understanding of pathogenesis
of PD, they do not explain most sporadic PD cases. Therefore, some suggest that
environmental agents are the main causal factor, and this is supported with the following
evidence. The notion that environmental toxins could induce PD come from the
observation of four young drug abusers that developed chronic Parkinsonism. This chronic
Parkinsonism was later revealed to be cause by the contamination with the meperidine
analogue, 1-methyl-4-phenyl-1,2,3,6- tetrahydropyridine (MPTP) after using illicit drugs
intravenously. The ability of MPTP to induce neurochemical, pathological and clinical
features of PD suggest that other toxins could also induce PD (Dick et al., 2007). Indeed,
epidemiological studies reveal the positive correlation between exposure to pesticides with
developing PD (Gorell et al., 1998, Petrovitch et al., 2002, Semchuk et al., 1992). This has
been confirmed in the laboratory whereby injection of pesticides such as rotenone and
paraquat into rodents induce loss of nigral dopaminergic neurons (Greenamyre et al.,
2003, Peng et al., 2004). Consumption of well water by rural population associated with
agricultural industry have also been linked to an increased risk of PD (Gatto et al., 2009,
Priyadarshi et al., 2001). The involvement of metals in the aetiology of PD has been
demonstrated from epidemiological studies. It is evident that people chronically exposed
to welding manganese fumes exhibited PD-like clinical features (Jankovic, 2008). Indeed,
metals such as iron and copper has been reported to accumulate within the SNPc of
autopsied Parkinsonian brain. These metals contribute to the production of H2O2 during
the non-enzymatic oxidation of dopamine and the conversion of H2O2 to OH- by Fenton
reaction (Dexter et al., 1989, Earle, 1968). Based on the epidemiological data, there is a
clear link between environmental factors with PD. Nevertheless, some people may be
more prone to developing PD when expose to toxins than the other. This might suggest
that both genetics and environmental factors could be the plausible explanation for
idiopathic PD. Although the causal factors are still not fully understood, PD has well
defined pathological features that is discussed next.

CHAPTER 1: GENERAL INTRODUCTION
25
Pathology of PD
Two important pathological features characterise PD in autopsied brains namely the loss
of dopaminergic neurons within SNPc and accumulation of intracellular inclusions within
the cell body of surviving neurons termed as Lewy bodies (LBs) (Antony et al., 2013).
Loss of dopaminergic neurons within SNPc occurs progressively without causing the
cardinal motor symptoms of PD until approximately 50% of nigral dopaminergic cell bodies
have degenerated and about 70% of striatal dopamine content has depleted (Cheng et
al., 2010, Delaville et al., 2011). This is because, normal function of nigro-striatal pathway
in controlling voluntary movement is maintain by compensatory mechanisms which include
increase dopamine turnover and increase in post-synaptic dopamine D2 receptors in the
striatum (Navntoft and Dreyer, 2016). In addition to the loss of nigral dopaminergic
neurons that defines the motor symptom in PD, loss of noradrenaline neurones in locus
coeruleus (LC), serotonin neurones in the dorsal raphe nuclei (RN) and cholinergic
neurones in nucleus basalis of Meynert (NBM) which causes non-motor symptoms to
occur (Ferrer, 2011, Olanow et al., 2009a). Non-motor symptoms associated with
neurodegeneration in these areas include anxiety and depression that are related to the
loss of noradrenergic and serotonergic neurons while dementia is linked to the
degeneration of the cholinergic neurons (Calabresi et al., 2006, Hanagasi and Emre,
2005). Neuron loss is also found in areas some distance from SNPc such as the olfactory
system, the dorsal motor nucleus of the vagus (DMNV) and the peripheral nervous system
(PNS) although to a lesser extent (Visanji et al., 2013).
The second pathological feature of PD is the accumulation of globular LBs in surviving
neurons within SNPc (Antony et al., 2013). LBs are eosinophilic proteinaceous
cytoplasmic inclusions mainly compose of α-synuclein aggregates as well as ubiquitin,
neurofilaments and parkin (Wakabayashi et al., 2013). Besides SNPc, LBs are also found
in other brain areas that experience degeneration (Braak et al., 2003, Olanow and
Prusiner, 2009b). The role of LBs in pathology of PD is remained elusive. LBs are initially
thought to be toxic to the neurons since they are related to neuronal loss (Wakabayashi
et al., 2006). However, later discoveries suggest that α-synuclein oligomers and
protofibrils are cytotoxic, while the formation of fibrillar LBs containing α-synuclein
aggregates may be cytoprotective (Wakabayashi et al., 2013). Therefore, although LBs
may serve as the pathological marker of PD, it does not necessarily indicate that the

CHAPTER 1: GENERAL INTRODUCTION
26
inclusions are the cause of cell death. Nevertheless, LBs are clearly associated with the
progressive cell death in the basal ganglia. Having said this, the mechanism of cell death
in PD brain is described in the following section.
Cell death mechanism in PD
Neurodegeneration in PD started with neuronal cell death. There are two type of neuronal
cell death mechanism namely apoptosis and necrosis that are mainly differentiate by their
morphology (Nikoletopoulou et al., 2013). Cells undergo apoptosis morphologically exhibit
shrinkage, chromatin and cytoplasmic condensation, nuclear fragmentation and budding
of the plasma membrane forming smaller apoptotic bodies (Elmore, 2007). Membrane-
bound apoptotic bodies are destructed by controlled phagocytosis which does not induce
inflammatory reaction. Changes in cell morphologies and cell destruction are regulated
genetically by pro-apoptotic molecules such as caspases which requires ATP-dependent
steps for activation (Tsujimoto, 1997, Zamaraeva et al., 2005). On the contrary, cells
undergo necrosis show extensive cytoplasmic vacuolisation and swelling. Cell are
destructed by spontaneous ruptures of cell membrane and releases of cell’s content that
initiate inflammatory response (Nikoletopoulou et al., 2013). Necrosis is a passive form of
cell death which does not require ATP and occurs in response to toxic insults or
spontaneous insults such as stroke or trauma (Stoica and Faden, 2010).
Evidence from in vitro and in vivo studies, as well as post-mortem on Parkinsonian brains
lean towards apoptosis as the primary mechanism of cell death in PD. However, necrosis
is also suggested as a possible mechanism of cell death although there has not been
sufficient evidence supporting this view (Jellinger, 2000). In vitro studies using primary rat
ventral mesencephalic cultures, and rat pheochromocytoma PC-12 and SH-SY5Y cell
lines expose to MPP+, the toxic metabolite of MPTP, induce morphological and
biochemical hallmarks of apoptosis (Walkinshaw and Waters, 1994, Blum et al., 1997,
Lotharius et al., 1999, Viswanath et al., 2001). Similarly, dopamine and 6-OHDA also
induces morphological and biochemical changes in PC12 cell line with characteristics of
that apoptosis. The protection conferred by overexpression of antiapoptotic protein Bcl-2
and pre-treatment with caspase in this toxins-induced cell death further support apoptosis
as the chief mechanism of cell death (Offen et al., 1997, Takai et al., 1998).

CHAPTER 1: GENERAL INTRODUCTION
27
In addition to the in vitro studies, data from in vivo PD models strongly suggest the
involvement of apoptosis in dopaminergic cell death in SNPc. Mice treated with MPTP
exhibits increased number of apoptotic markers such as DNA fragmentation, caspases
and JNK activation, and upregulation of bax mRNA (Saporito et al., 2000, Tatton and Kish,
1997, Vila et al., 2001). Inhibition of caspase-3 substrate and JNK ablation of the pro-
apoptotic Bax gene as well as overexpression of Bcl-2 protein appears to be protective
against MPTP-induced cell death in mice (Wang et al., 2004, Cosi et al., 1996, Vila et al.,
2001, Offen et al., 1997, Yang et al., 1998). Likewise, studies from 6-OHDA-lesioned rats
also display a typical morphology of cells undergoing apoptosis in basal ganglia which was
confirmed by terminal deoxynucleotidyl transferase-mediated dUTP nick-end labelling
(TUNEL) staining (He et al., 2000, Marti et al., 2002). Interestingly, the dose of 6-OHDA
use to induce lesion seem to determine the preferred cell death pathway, where high
concentration of 6-OHDA exclusively causes cell necrosis (Jeon et al., 1995). This support
the theory that cells can decide which appropriate route of cell death mechanism
depending on the specific situation (Nikoletopoulou et al., 2013).
Finally, evidence from autopsies performed on brain tissue of PD patients reveal the
presence of apoptotic neurons in SNPc, morphologically characterised by chromatin
condensation, cell shrinkage and DNA fragmentation in dying neurones (Mochizuki et al.,
1996, Anglade et al., 1997, Tatton et al., 1998). In addition to the well-defined morphology
characteristics of apoptosis, molecular markers of apoptosis such as Bax and caspase-3
have been reported to increase (Anglade et al., 1997, Tatton, 2000, Hartmann, 2004).
Besides apoptosis, the presence of necrotic neurons was also evidence in the post-
mortem brain suggesting involvement of more than one type of cell death mechanism in
PD brain (Anglade et al., 1997).
To conclude, evidence from in vitro and in vivo studies as well as from brain autopsies
support apoptosis as the primary mechanism of cell death neuronal degeneration of PD,
although necrosis could also occur depending on the specific situation. The exact cause
of apoptosis in PD brain is remain elusive but oxidative stress, mitochondrial dysfunction,
ubiquitin proteasome system impairment and inflammation might partly contribute to the
process.

CHAPTER 1: GENERAL INTRODUCTION
28
Pathogenesis of cell death in PD
Many factors are implicated in the neuronal cell death cascade observed in PD. The
initiator of the cascade is unknown, but they are deleterious and potential targets for
disease-modifying agents. For this reason, it is essential to fully understand the
mechanisms associated with cell death. These mechanisms described in detail below
include the dysfunctions in the protein degradation systems: oxidative stress,
mitochondrial dysfunction, ubiquitin proteasome system impairment and inflammation.
Oxidative stress
Oxidative stress is defined as the imbalance between reactive oxygen species (ROS)
production and endogenous anti-oxidant systems. ROS such as superoxide anions (O2-),
hydrogen peroxide (H2O2), hydroxyl radicals (OH-) and peroxy radicals (O2-2) are
continuously produce as by-products of the of mitochondrial electron-transport chain
(ETC). Under normal physiological condition, ROS participates in the immunity and
autophagy processes in cells (Sena and Chandel, 2012). A defence mechanism consisting
of enzymes such as superoxide dismutase (SOD), catalase, glutathione (GSH) and
glutathione proxidae (GPx) convert these radicals into harmless molecules (Turrens,
2003). Excessive ROS production causes oxidation of cellular macromolecules such as
proteins, DNA and lipids which results in their damage and loss of membrane integrity
(Popa-Wagner et al., 2013). Remarkably, aging process appears to increase the incidence
of oxidative stress as shown by elevated level of oxidised proteins (carboxyls and nitro-
protein adducts), DNA (8-Hydroxy-2-guanosine) and lipid (4-hydroxynonenal and
malondialdehyde) in PD brain suggesting age as one of the risk factor in
neurodegeneration process (Mariani et al., 2005, Dexter et al., 1994, Cardoso et al., 2005).
Abnormal activity of antioxidant defence mechanism such as GSH appears to play a role
in precipitating oxidative stress in PD. Evidence from post mortem brain of PD patients
showed simultaneous increased level of SOD but reduced levels of GSH within the SNPc
suggesting accumulation of H2O2 due to inability of GPx to reduce H2O2 to H2O (Jenner
and Olanow, 1996, Sian et al., 1994, Sofic et al., 1992, Perry and Yong, 1986). Similarly,
the reduction of GSH levels was also seen in the autopsied brain of incidental Lewy body
disease (ILBD) patients which are considered to represent the early-stage PD, thus
suggesting oxidative stress might occur earlier before PD develop (DelleDonne et al.,

CHAPTER 1: GENERAL INTRODUCTION
29
2008). Increase ROS production due to abnormal antidefense mechanism impaired
Complex I of ETC due to thiol oxidation of critical residues (Genestra, 2007). Conversely,
impairment of Complex I by neurotoxins such as rotenone also reduce GSH production by
inhibition of glutathione reductase also by thiol oxidation (Chinta and Andersen, 2008, Li
et al., 2003). Either way, this imbalance results in mitochondrial dysfunction and eventually
cell death (Dias et al., 2013).
Dopaminergic neurons in the basal ganglia are inherently prone to oxidative stress due to
the nature of dopamine metabolism in generating ROS. Spontaneous auto-oxidation of
dopamine creates O2-, H2O2 and reactive quinone (Izumi et al., 2005). Additionally,
enzymatic conversion of dopamine to 3,4-dihydroxyphenylacetic acid (DOPAC) and
homovanilic acid (HVA) by monoamine-oxidase B (MAO-B) generates H2O2 (Meiser et al.,
2013). Nevertheless, dopamine metabolism alone cannot explain neurodegeneration in
PD since other non-dopaminergic neurons in brain also undergo degeneration (Braak et
al., 2003). Increase of iron as well as decrease iron storage protein, ferritin level seen in
basal ganglia exacerbates oxidative stress by undergo Fenton reaction with H2O2
generates highly reactive OH- (Dexter et al., 1987, Dexter et al., 1989, Sofic et al., 1992,
Sofic et al., 1988).
Mitochondrial dysfunction
Mitochondria serve the role as the energy factory for cells by producing the adenosine
triphosphate (ATP) molecules, the primary energy source that facilitates many of the
energy-dependent biochemical reactions within cells. Accumulating lines of evidence has
shown abnormalities of the mitochondrial respiratory chain in PD. Production of ATP
involves series of electrons transport and oxidative phosphorylation through Complex I-IV
of mitochondrial ETC, which finally end up with reduction of O2 to H2O. Impairment of
electrons transfer along ETC such as inhibition of Complex I by environmental toxins MPP+
and rotenone cause oxidative stress due to increase of electrons leakage and deficiency
in ATP production (Keane et al., 2011, Betarbet et al., 2000). Indeed, early evidence of
mitochondrial dysfunction in PD come from investigation of drug users and farmers
inflicted with MPP+ and rotenone toxicity respectively. Besides increase in ROS
production, inhibition or impairment of mitochondrial ETC causes inability of Na+/K+
ATPase pumps to maintain membrane potential due to inadequate ATP production

CHAPTER 1: GENERAL INTRODUCTION
30
(Sherer et al., 2003). This lead to partial depolarisation of neurons and increase sensitivity
of excitatory N-methyl-D-aspartate (NMDA) receptor to glutamate resulting in excitotoxicity
by accumulation of intracellular Ca2+. Furthermore, firing of glutamate from subthalamic
nucleus to SNPc in PD further exacerbate the condition and lead to cell death (Keane et
al., 2011).
Reduction in activity and reduce amount of mitochondrial Complex I in the SNPc and
frontal cortex of autopsied PD patient brain have been reported (Mizuno et al., 1989,
Schapira et al., 1990). Interestingly, mitochondria isolated from PD patients’ platelet also
showed a reduction in Complex I activity. Formation of cybrid cell line containing the
isolated mitochondria was more prone to MPP+-induced cell loss suggesting a widespread
pathology of mitochondrial dysfunction (Schapira et al., 1990, Parker et al., 2008). Indeed,
genetic factors may contribute to the impairment of mitochondrial function as exemplified
by increased levels of mitochondrial DNA (mtDNA) deletions in the striatum of PD patients
(Ikebe et al., 1990)
Studies on transgenic mouse model further support the role play by genetic factors such
as gene mutations in mitochondrial dysfunction. Evidence from mitochondrial transcription
factor (Tfam) knock-out mouse reveal progressive degeneration of dopaminergic neurons
and progressive motor deficits (Ekstrand et al., 2007). Gene mutation in PINK1 that
encodes for mitochondrial membrane kinase is associated with autosomal recessive forms
of PD (Gandhi et al., 2006). This is supported by PINK1 knock-out mice that exhibit
impairment in dopamine release mitochondrial respiration, as well as increased sensitivity
to oxidative stress (Gautier et al., 2008, Kitada et al., 2007).
Ubiquitin proteasome system (UPS) impairment
The ubiquitin proteasome system (UPS) is an ATP-dependant protein degradation
pathways for unwanted intracellular proteins that are misfolded, mutated and damaged to
smaller peptides. Degradation of unwanted proteins is important for maintaining cell
homeostasis (Wang and Maldonado, 2006). Additionally, UPS is involved in the regulation
of many cellular processes such as cell cycle and division, development and
differentiation, apoptosis, cell trafficking and morphogenesis of neuronal networks

CHAPTER 1: GENERAL INTRODUCTION
31
(Ciechanover, 1998). Besides protein, UPS also play a role in degradation of defective
mitochondria.
The mechanism of protein degradation by UPS involve two separate but related
components. Protein for degradation is firstly marked with ubiquitin (Ub) with a series of
Ub activating, conjugating and ligating enzymes (Glickman and Ciechanover, 2002). Poly-
ubiquited protein is a substrate for multisubunit tubular proteasome, the second
components of UPS that function to digest the tagged protein into smaller peptides. Poly-
ubiquitination only serve to mark unwanted protein for recognition by proteasome, that is
later release into cytoplasm and hydrolysed to ubiquitin monomers (Gong and Leznik,
2007). Therefore, dysfunction of the UPS including poly-ubiquitin hydrolysis are implicated
in degeneration of dopaminergic neurons in PD.
Defect in one or both components of UPS machinery lead to accumulation of tagged and
un-tagged unwanted proteins that are toxic to the cells by forming insoluble aggregates.
Indeed, fail in UPS system might be related to the presence of inclusion body such as LBs
that contain ubiquitinated α-synuclein (McNaught et al., 2004, McNaught et al., 2002a,
Olanow et al., 2004). This hypothesis is confirmed in in vitro studies whereby inhibition of
UPS with inhibitors such epoxomicin and lactacystin in neuronal cells result in
accumulation of ubiquitinated proteins. Additionally, this cell exhibit increases in
inflammatory markers such as cyclooxygenase-2 (COX2) and prostaglandin-E2 (PGE2)
(Rockwell et al., 2000), that activate cell death mechanism (McNaught et al., 2002b).
Similar observation is replicated in in vivo study in which case administration of N-
benzyloxy-carbonyl-Ile-Glu(O-t-butyl)-Ala-leucinal (PSI) and epoxomicin to rodents
caused nigrostriatal degeneration with simultaneous formation of LB inclusions consisting
of ubiquitin and α- synuclein (McNaught et al., 2004, Zeng et al., 2006, Bukhatwa et al.,
2009)
Mutation of genes that encodes for component in UPS system also play a role in
impairment of protein degradation. Mutation in parkin and UCHL1 genes that encode for
ubiquitin ligase and ubiquitin hydrolase cause familial forms of PD (Cordato and Chan,
2004). In addition, UPS activity appears to decrease in autopsied brain of sporadic PD
patients which may suggest contribution of environmental factors in UPS dysfunction
(McNaught and Jenner, 2000, McNaught et al., 2003).
CHAPTER 1: GENERAL INTRODUCTION
32
To conclude, impairment of UPS by proteasomes inhibitors and gene mutations that
encode for UPS components promote the accumulation of misfolded or damaged proteins,
as well as the formation of Lbs. This evidence supports the role of UPS impairment in the
pathogenesis of dopaminergic cell death in PD.
Inflammation
Evidence from post mortem brain of PD patient reveal increase level of inflammatory
markers and mediators in SNPc as assessed by immunohistochemical technique. The
type of inflammatory markers and mediators present at raised levels include interleukin-
1β (IL-1β), interleukin-6 (IL-6), tumour necrosis factor-α (TNFα), interferon-γ (IFNγ) and
prostaglandin-E2 (PGE2) (Wu et al., 2008, Teismann and Schulz, 2004, Long-Smith et al.,
2009, Hirsch and Hunot, 2009). The presence of raised inflammatory markers are not
restricted in brain parenchyma, but also in cerebrospinal fluid (CSF) of PD patients
suggesting that this could serve as a biomarker as part of diagnosis of PD (Dobbs et al.,
1999, Nagatsu et al., 2000). Additionally, there is a consistent and substantial increase in
the number of activated resident immune cells of the brain in the SN of post-mortem PD
brains when compared to control which suggest their involvement in neuroinflammatory-
induced nigrostriatal dopamine neurone degeneration (Wu et al., 2002).
Studies in animal model of PD involving inflammation has given more insight into the
involvement of microglia in PD brain. Lipopolysaccharide (LPS), a pro-inflammatory
endotoxin from Gram-negative bacteria induce inflammation by interacting with Toll-like
receptor 4 (TLR-4) expressed on cell surface (Pålsson-McDermott and O'Neill, 2004).
Injection of this endotoxin into rodents SNPc lead to dopaminergic cell death through the
reaction with inflammatory insults. The inflammation response to LPS is mediated by
microglia, a resident macrophage in the CNS because neurons do not express TLR-4 (Liu
and Bing, 2011, Castano et al., 1998). The mechanism of inflammation generated by
microglia upon LPS exposure is unclear, but is thought to involve increase production of
pro-inflammatory cytokines (TNF-α, IL-1β, IL-2 and IL-6), proteinases, eicosanoids and
nitric oxide (NO) to the site of injection that is toxic to the cells and promote persistent
degeneration (Knott et al., 2000, Czlonkowska et al., 2002, Zhang et al., 2005, Beal, 2003,
Long-Smith et al., 2009). For example, inhibition of inducible NO synthase (iNOS) activity
in microglia attenuate LPS induce inflammation in rats (Iravani et al., 2005, Iravani et al.,

CHAPTER 1: GENERAL INTRODUCTION
33
2002, Dutta et al., 2008, Arimoto and Bing, 2003). This is because, excessive NO is
capable to react with superoxide radicals to produce highly reactive peroxynitrite radicals,
which damage cellular proteins and DNA by forming adducts with them (Hald and
Lotharius, 2005). To summarise, post mortem on human brain and studies on animal
model of PD support the damaging role of glial cell in mediating inflammation that lead to
dopaminergic cell death in SNPc.
Irons and their role in PD
Excessive iron accumulation by two-fold of age-matched normal brain, has been observed
within the SNPc of Parkinsonian brain (Sofic et al., 1988, Dexter et al., 1987). Although
iron does accumulate progressively in SNPc as people aged, this iron is tightly regulated
by intracellular iron storage protein, ferritin and therefore confer little or no toxicity
(Daugherty and Raz, 2015, Zecca et al., 2004). The reason why SNPc is prone to iron
accumulation remain unclear. Dopamine oxidation product (neuromelanin) (Zecca et al.,
2001), neuroinflammation (Ward et al., 2009, Frank-Cannon et al., 2009), changes in BBB
permeability (Mills et al., 2010, Gerlach et al., 2006) and malfunction of iron homeostasis
(Mills et al., 2010) have all been proposed to be the contributing factors. The toxicity of
iron in PD is central on the ability of iron to undergo Fenton reaction with H2O2 to produce
OH-, the most harmful ROS because of its high reactivity with biomolecules such as
protein, lipid and DNA (Sharma et al., 2012). Unlike O2- and H2O2 that are converted to O2
and H2O by antioxidant enzymes (catalase, glutathione peroxidase and superoxide
dismutase), no enzymes exist to scavenge OH- (Rosario de la Torre et al., 1996).
Therefore, excess accumulation of OH- due to iron-catalyse Fenton reaction causes
cellular death (Pinto et al., 2003). The excessive production of OH- could contribute to the
pathogenesis of PD by causing sequence of pathogenic events such as oxidative stress,
mitochondrial dysfunction, ubiquitin proteasome system (UPS) impairment and
inflammation as described in Section 1.1.4 (Mounsey and Teismann, 2012). For example,
oxidative stress confers by excessive OH- production through iron-catalysed Fenton
reaction may cause mitochondrial membrane oxidation. This leads to mitochondrial
dysfunction and reduction of ATP synthesis. This would implicate cellular protein
degradation that requires energy in the form of ATP causing UPS impairment and followed
by cell death (Mounsey and Teismann, 2012).

CHAPTER 1: GENERAL INTRODUCTION
34
Iron chelators
Intracellularly iron is stored by sequestering into ferritin (Ponka et al., 1998). Ferritin is an
oligomeric protein composed of an apoprotein shell of 24 subunits that forms a hollow
protein shell which capable of storing up to 4500 iron atoms (Pan et al., 2009). The 24
subunits are heteropolymers of light (L) and heavy (H) chain subunits. Both H and L
subunits cooperate for the iron mineral core formation (Sammarco et al., 2008, Boyd et
al., 1985). The H subunit of ferritin has ferroxidase activity for oxidation of Fe2+ to Fe3+ as
iron is internalised and packed into the ferritin mineral core. On the other hand, L subunits
enhance oxidation activity by increasing the binding affinity of ferric iron at the nucleation
sites of the iron core (Levi and Rovida, 2015, Pfaffen et al., 2013). Not all intracellular iron
is stored within ferritin. About 5% of intracellular iron is available in cytoplasm and form a
complex with various population of ligands such as glutathione, ascorbate and citrate. Iron
bound to these ligands is not properly co-ordinated and therefore is redox active. This
chelatable intracellular redox-active iron complex is widely known as the cellular labile iron
pool (LIP) (Kruszewski, 2003, Kakhlon and Cabantchik, 2002, Cabantchik, 2014). LIP play
an important role as an immediate transitory pool for the biosynthesis of iron-associated
protein such as mitochondrial iron-sulfur-cluster and metalloenzymes (Cabantchik, 2014).
The level of LIP is normally under tight control because non-coordinated free iron can
generate oxygen derived free radicals and render tissue damage as in extreme cases of
iron overload (Halliwell and Gutteridge, 1984). However, in extreme cases of iron overload,
the changes might exceed the cell homeostatic capacity, thus compromising its integrity.
In this situation, the oxidative stress impose by excessive LIP could be minimise by
administration of iron chelators (Glickstein et al., 2005, Kakhlon and Cabantchik, 2002).
Iron chelators are primarily indicated for the treatment of systemic iron-overload as seen
in Thalassemia patient due to chronic blood transfusion (Saliba et al., 2015, Cianciulli,
2008). Introduction of the first iron chelators in the market in 1960 significantly improve the
quality of life and life expectancy of Thalassemia patients (Chaston and Richardson,
2003). Before the first iron chelation therapy is available, most chronically transfused
patients died in their teens and twenties due to toxicity associated with iron overload
(Sheth, 2014, Poggiali et al., 2012). Since the first introduction of iron chelators for clinical
use, researchers have successfully developed much better iron chelators molecules that
use in clinics. Nowadays, there are three options for iron chelation therapy available for

CHAPTER 1: GENERAL INTRODUCTION
35
the treatment of iron overload which is discussed below (Poggiali et al., 2012, Sheth,
2014).
Deferrioxamine (DFO)
Deferrioxamine (DFO, Desferal®) is a microbial siderophore derived from Streptomyces
pilosus and show selectivity towards ferric ion (Fe3+) (Zhou et al., 2012). DFO has high
iron affinity constant (pFe3+=26.6) and chelates iron in a hexadentate fashion
[FeIII(DFO)1+1 iron complex]. Ferrioxamine, the 1:1 iron complex of DFO has net positive
charge (+1) and does not permeate plasma membrane due to its low lipophilicity (logD7.4
= -2). DFO enter the liver via carrier-mediated transport and interacts with both
hepatocelluar and reticuloendothelial iron stores which later promote both biliary and
urinary iron excretion (Hershko, 1978). DFO is a complex molecule and therefore has a
large molecular weight (560 Da) which render it orally inactive due to limited
gastrointestinal tract permeability. DFO is the first authorised iron chelator for the
treatment of iron overload in Thalassemia patient in 1960. It is developed and marketed
by Ciba-Geigy and has been extensively use in the clinics before the emergence of orally
active iron chelators (Bernhardt, 2007). Due to lack of oral permeability, DFO is
administered by intravenous or subcutaneous routes. Unfortunately, DFO has an
extremely short half-life in the plasma (~10 minutes) due to extensive metabolism and
rapid renal clearance. Because of this, DFO is continuously infuse systematically for 8-
12h per day, 5-7 days per week at a standard dose of 40 mg/kg/day to achieve body iron
homeostasis. Some major side effects that are associated with DFO infusion are depletion
of body iron stores, neurotoxicity and abnormalities of cartilage formation (Porter et al.,
1989). Because of its administration route, longer treatment time, high cost and severe
side effects patient compliance is often poor (Porter et al., 1989).
Deferasirox (DFX)
Deferasirox (DFX, Exjade®, ICL670) is a triazole iron chelator. DFX prefer trivalent ion
such as Fe3+ over divalent ions. DFX has pFe3+ that is comparable to deferoxamine (22.5)
and chelates iron in a tridentate fashion [FeIII(DFX)2]3- iron complex]. The 1:2 iron complex
of DFX has a net -3 charge under physiological condition and can permeates plasma
membranes easily due to its high lipophilicity (logD7.4 = 1.0) (Zhou et al., 2012). The low
molecular weight of DFX (373 Da) facilitates its absorption from the gastrointestinal tract

CHAPTER 1: GENERAL INTRODUCTION
36
which makes it orally active. Indeed, DFX is the second orally active iron chelator use in
the clinic for removal of excessive iron accumulation in Thalassemia patient due to routine
blood transfusions and the first orally active iron chelators approved worldwide. DFX
promotes iron excretion approximately four to five times more effective than DFO in
hypertransfused rat model. Furthermore, the pattern of iron excretion produced by DFX is
distinct from DFO. A substantial proportion of DFO-chelated iron derived from
reticuloendothelial (RE) cells is excreted in the urine. On the other hand, DFX-chelated
iron excretion is limited to the bile regardless of whether it is derived from RE or
hepatocellular stores (Hershko et al., 2001). DFX was approved for human use in 2005 by
FDA and marketed by Novartis (Zhou et al., 2012). DFX has long plasma half-life upon
oral consumption and therefore is taken only once daily. DFX has been demonstrated to
be efficient in removing liver iron from regularly transfused patients but appear to be less
effective in removing cardiac iron (Wood et al., 2010, Cappellini et al., 2010). High
lipophilicity of DFX contributes to great affinity towards plasma albumin (>98%) and
therefore is less toxic by limiting its distribution to peripheral tissues (Weiss et al., 2006).
Kidney toxicity is the prevalent side effect of this chelator (Rafat et al., 2009).
Deferiprone (CP20)
Deferiprone (CP20) is 1, 2-dimethyl derivative of 3-hydroxypyridin-4-ones (HPOs) iron
chelator. HPOs like CP20 prefer trivalent ions such as Fe3+ and not physiologically
important divalent ions such as Zn2+, Cu2+, Mn2+ and Co2+ (Hider et al., 2000). However,
although CP20 shows very high affinity towards Fe3+, it still can bind to Fe2+ under aerobic
conditions and autoxidise them to Fe3+ (Harris, 1977). CP20 has pFe3+ that is comparable
to deferoxamine (20.5) and chelates iron in a bidentate fashion [FeIII(CP20)3 iron
complex]. In contrast to ferrioxamine, the 1:3 iron complex of CP20 is neutral in charge
and therefore can permeate plasma membrane to removes potentially toxic iron such as
in iron-loaded liver, cardiac and brain tissues (Hider et al., 2000, Jamuar and Lai, 2012).
CP20 is relatively hydrophilic (LogD7.4=-0.77) in comparison to DFO and DFX. The low
molecular weight of CP20 (139 Da) facilitates its absorption from the gastrointestinal tract
which makes it orally active. Indeed, CP20 is the first orally active iron chelator use in the
clinic for removal of excessive iron accumulation in Thalassemia patient due to routine
blood transfusions. CP20 was authorised to enter the European Union and Canadian
markets by European Medicines in 2002 and was approved by the FDA in 2011. It is

CHAPTER 1: GENERAL INTRODUCTION
37
marketed by Apotex Inc. Toronto, Canada as Ferriprox™ (Zhou et al., 2012). Despite all
the advantages, CP20 suffered from extensive glucuronidation at the 3-hydroxyl in the
liver after oral consumption, and therefore has lower bioavailability and short half-life (3-4
hours) in the plasma. Because of this, large dose of CP20 is required to achieve body iron
homeostasis which is 75 mg/kg/day. Consequently, some major side effects are
associated with the use of CP20 which includes musculoskeletal and joint pains,
neutropenia, agranulocytosis and gastric intolerance (Fisher et al., 2013, Kontoghiorghes,
1995, Hoffbrand, 2005, Hoffbrand et al., 2003).
Novel HPO iron chelators as potential treatment for PD
One noticeable effect of CP20 is the improvement of motor symptom and slower disease
progression in Parkinson’s disease (PD) patients (Devos et al., 2014, Abbruzzese et al.,
2011). It is established that interruption of iron homeostasis in the basal ganglia of PD
patients contribute to the progression of the disease (Griffiths et al., 1999, Hopes et al.,
2012, Hopes et al., 2016). Indeed, iron dysregulation in the substantia nigra is
hypothesised to be the primary or secondary factor that initiate or exacerbate the death of
dopaminergic neurons in this brain region (Liddell, 2015, Munoz et al., 2016, Urrutia et al.,
2014). This is because, iron-binding protein such as transferrin and ferritin cannot keep up
with the excess influx of iron into the mitochondrial matrix and therefore increase the
reduction-oxidation (redox) reaction of ferrous iron (Fe2+) with hydrogen peroxide (H2O2)
which is abundant in mitochondria as a by-product of oxidative respiration (Kudin et al.,
2004). The redox reaction coined as Fenton reaction produce the mischievous hydroxyl
radicals (OH-) that initiate the chain of radical reaction which ultimately lead to cell death
(Liddell, 2015, Munoz et al., 2016, Urrutia et al., 2014)
This positive effect of CP20 in PD patients undoubtedly due to the ability of CP20 to enter
the brain via passive membrane diffusion in addition to their ability to chelate labile iron in
brain (Glickstein et al., 2005, Hider et al., 2011a). In fact, CP20 has been reported to not
only chelate excess iron in the brain region, the CP20-iron complex formed in the brain
was also able to permeate out and redistribute iron the circulated transferrin in plasma
(Evans et al., 2012, Abbruzzese et al., 2011, Ayton et al., 2016, Cabantchik et al., 2013).
Furthermore, CP20 at the dose indicated for PD patients did not interfere with normal
systemic iron balance (Abbruzzese et al., 2011, Ayton et al., 2016, Cabantchik et al.,
2013).

CHAPTER 1: GENERAL INTRODUCTION
38
However, CP20 suffered from extensive first-pass metabolism in the liver on its 3-hydroxyl
(3-OH) group to glucuronidation (45% in rat and 85% in man) lead to a very low
bioavalaibility in plasma upon oral dosing (Singh et al., 1992). The 3-OH group on the
HPO molecule is important for the iron chelation activity of CP20, therefore extensive
glucuronidation at this site render it inactive Figure 1.1.1 (Hider, 2014).
a)
b)
Figure 1.1.1: a) CP20 molecular structure with oxygen ligand (3-OH) available to form bond
with iron b) CP20 glucuronide structure which is pharmacologically inactive.
Thus, very large and frequent oral doses (75 mg/kg daily) was needed to keep the iron-
overload patients in the negative-iron state albeit CP20 route of administration was more
feasible than desferioxamine. Although the aim of treatment with CP20 in PD patients was
slightly different and therefore lower dosage was indicated (30 mg/kg daily), it was still
considered as high (Devos et al., 2014, Abbruzzese et al., 2011). Moreover, due to the
prevalence of PD in the elderly, the high and frequent doses are inconvenience, and this
contribute to the low compliance among patients, and thus reducing the success rate of
the treatment (Hirsch et al., 2016).
Concerted efforts have been taken to minimise or eliminate the metabolism of CP20 by
modification of CP20 structure. The approached involved the functionalisation of the
pyridinone ring with bulkier alkyl side chains with the aims to hinder or limit the access of
drug metabolising enzymes active site to the labile 3-OH group (Li et al., 2015, Novakovic
et al., 2004). One of the molecules, CP94 showed a promising result in rats with lower
glucuronidation at the 3-OH side (Porter et al., 1990). Unfortunately, the result did not
translate into man where 85% of the administrated dose was recovered in the urine as a
3-OH glucuronide metabolite (Porter et al., 1993, Porter et al., 1994). Another promising
molecule, CP40 and CP41 were synthesised by adding OH functional group to N1 (Hider
and Liu, 2003). However, this approach cause reduction in lipophilicity, and thus contribute

CHAPTER 1: GENERAL INTRODUCTION
39
to lower absorption from GIT and possibly not efficient to get into the brain (Fredenburg et
al., 1996, Singh et al., 1996).
Recently, a range of novel HPO iron chelators were synthesised by alteration of CP20
structure by adding substituent at the N1 and/or C2 of HPO ring in the Professor Robert
C. Hider laboratory at King’s College London in collaboration with Zhejiang University
China (Hider et al., 2011a). The HPO were designed to minimise the glucuronidation
reaction by adding chiral alkyl substituent containing -OH functional group at N1. The
strategy to add substituent containing -OH with chiral centre to the N1 is due to the
observation that drug metabolising enzymes are stereo-specific in which one
strereosiomer would be more susceptible to metabolism than the other (Molenda et al.,
1994, Nguyen et al., 2006). In contrast to CP40 and CP41, this structural modification did
not lead to lower lipophilicity, but rather increase in lipophilicity due to additional alkyl
group. At the same time, the modification of the structure does not cause signification
alteration of the ferric ion (Fe3+) affinity constant, pFe3+ compared to CP20. Therefore, it
was expected to be more efficacious than CP20 in removing iron upon oral dosing at the
same dose. Indeed, a preliminary study with rats has showed increased bioavailability and
efficacy of these compounds to remove excess iron compared to CP20 due to reduction
in the first-pass metabolism upon oral dosing (Lu, 2016, Hider et al., 2011a).
Remarkably, the lethal dose for these novel iron chelators obtained from acute toxicities
study performed on mice were found to be higher than CP20 (Hider et al., 2011a). This
also negates the claimed of Kontoghiorghes et al. (1993) that increasing HPO lipophilicity
lowered the LD50. These findings lead to the potential development of these set of
compounds as a clinical drug better than CP20. Moreover, higher efficacy means lower
doses and frequency are required to give to patients, therefore increase patients’
compliance and saving cost. As mentioned earlier, CP20 has been demonstrated to
improved symptoms in PD patient. Therefore, one potential future application of this new
set of compounds is for the treatment of PD that is better than CP20 in term of efficacy for
chelating iron, high in potency and possibly fewer side effects. Theoretically, in order for a
drug to elicit it effect in the brain, it must able to cross the blood-brain barrier (BBB) (Abbott
et al., 2010).

CHAPTER 1: GENERAL INTRODUCTION
40
The blood-brain barrier (BBB)
The brain is the integration centre of communicating neurons that make up the nervous
system (Abbott et al., 2010, Bundgaard and Abbott, 2008b). The nature of neuronal
communications via ion propagation along the axons is achieve by differences in ionic
concentration between interstitial fluid and intracellular fluid which warrant a delicate
control (Kress and Mennerick, 2009, Holcman and Yuste, 2015). Disturbance with the ionic
balance between interstitial fluid and intracellular fluid is therefore catastrophic as it affects
the body universally. To prevent this to happen, the brain is protected with three levels of
protective barrier which are arachnoid membrane-cerebrospinal fluid barrier (ACSFB),
blood-cerebrospinal fluid barrier (BCSFB) and blood-brain barrier (BBB) (Abbott et al.,
2010, Liddelow, 2011, Abbott, 2005, Engelhardt and Sorokin, 2009). ACSFB and BCSFB
barrier sites are located at the level of the epithelial cells that make up the arachnoid
membrane and choroid plexus. On the other hand, BBB barrier site is at the level of
endothelial cells brain capillary that make up brain capillary. These sites share the same
characteristics such as complex tight junctions that seal the paracellular route and
expression of transporters to transport nutrients, electrolytes and metabolites into or out
of the brain (Luissint et al., 2012, Tietz and Engelhardt, 2015, Upadhyay, 2014b, Abbott
et al., 2010).
Although these three levels of protective barrier share the same characteristics as
mentioned, the degree of the restrictiveness was different. BBB showed the most
restrictive barrier with transendothelial resistance (TEER) reaching up to 2000 Ω.cm in
vivo (Wong et al., 2013, Wang et al., 2017, Srinivasan et al., 2015). TEER is a measure
of differences in electrolytes concentration between blood and interstitial fluid (ISF) which
indicates the junction tightness in allowing electrolytes movements between compartment.
In perspective, peripheral TEER is just below 10 Ω.cm. On the other hand, TEER for A-
CSFB and CP-CSFB are less than BBB but higher than the peripheral epithelial membrane
(Srinivasan et al., 2015). The variation of barrier restriction with BBB at the level of brain
capillary endothelial cells (BCEC) having the highest restriction is an evolutionary process
that mainly to protect the brain parenchyma from the fluctuation of electrolytes in brain ISF
as explained earlier (Bundgaard and Abbott, 2008a, Mayer et al., 2009).
The brain arteries on the surface of meningeal layer penetrate deeper brain tissue and
braches into smaller capillaries (Cipolla, 2009). The capillary branches are so extensive

CHAPTER 1: GENERAL INTRODUCTION
41
with a surface area of 15 m2 per kg brain (Pardridge, 2002b, Hitchcock and Pennington,
2006). One capillary branch at least serves 1 neuron with proximity between capillaries
and neuron is 8-13 µm (Cipolla, 2009). In addition to that, 30% of systemic blood perfused
to the brain despite its weight being just 0.02% of the weight in 70 kg man (Cipolla, 2009).
To put this in perspective, the liver, which is 0.07% of body weight, receives only 5% of
systemic blood (Abbott et al., 2010). The total length of brain capillaries is 450 km (Cipolla,
2009). The extensive blood perfusion into the brain reflect it high metabolic demand for
nutrients suited with the active physiological functions in integrating the neuronal
communications (Raichle and Gusnard, 2002, Bélanger et al., 2011, Mergenthaler et al.,
2013). At the same time, the compensatory mechanism to maintain ISF homeostasis such
as active efflux pump requiring energy. Therefore, it is understood why brain need a huge
blood perfusion to get the nutrients it needs for neurons and for maintaining the barrier
functions.
Taking into account the total length of brain capillaries, and the fact that a large proportion
of circulating blood is directed to these blood vessels, and that the BBB has a large surface
area and is at close proximity to the individual neurons, there is significant interest in
developing CNS drugs that have improved BBB penetration (Hitchcock and Pennington,
2006). Since BBB equipped with multitude transporters and receptors with overlap
specificity for micro- and macromolecules, this can be an advantage to manipulate the
transport systems into transporting CNS-active drug (Pardridge, 2005, Pulicherla and
Verma, 2015, Banks, 2016, Pardridge, 2002a, Upadhyay, 2014a). The research into
circumventing BBB by various approach has become an area of active research
(Papademetriou and Porter, 2015, Hendricks et al., 2015, Misra et al., 2003). This is
because, up to 90% of CNS-drug in the initial stage of development failed to get into the
brain despite showing promising pharmacological effect in in vitro studies (Misra et al.,
2003, Pardridge, 2005, Basavaraj and Betageri, 2014). If this could be rectified earlier
during the drug discovery and development process, other approach can be taken for
example by converted into prodrugs, encapsulation with nanoparticles or changing the
drug molecular structure. This can save the cost later when it reaches the pre-clinical stage
(Papademetriou and Porter, 2015, Hendricks et al., 2015, Misra et al., 2003).
CHAPTER 1: GENERAL INTRODUCTION
42
Overcoming the BBB
The major problem that hinders delivery of drug molecules to brain is the presence of the
BBB which limit the movement of water and lipid soluble molecules from blood to brain.
Therefore, molecules that are targeted against diseases in the CNS must be effectively
passing the BBB to reach the brain via the blood compartment. Paracellular diffusion is a
non-saturable and noncompetitive movement of molecules such as water between cells
(O'Donnell and Maddrell, 1983, Pantzar et al., 2006). However, it is absence at the BBB,
due to the presence of complex tight junctions. The following briefly described the
available transport mechanism for molecules brain uptake:
Passive membrane diffusion is a non-saturable and noncompetitive movement
across cells that utilise by lipophilic molecules such as ethanol.
Carrier-mediated transporters are expressed on BCEC to facilitate the entry of
essential polar metabolites, such as glucose and amino acids due to the tightness
of brain endothelial cells (Begley and Brightman, 2003). The expression of these
carriers is often polarized which mean they are co-localized on both the luminal
and abluminal membranes of the brain capillary endothelium to optimize substrates
transport into the brain (Begley, 2004). Carrier-mediated transport utilise
membrane protein carriers that recognise specific solute molecule. Solute like
glucose bind to carrier triggers a conformational change of the carrier; which
results in uptake (Egleton and Davis, 2005).
Endocytosis can be isolated into bulk-phase (pinocytosis) endocytosis and
mediated endocytosis (receptor and absorptive mediated) (Pardridge, 2005).
Pinocytosis is the noncompetitive, non-saturable, temperature and energy
dependent non-specific uptake of extracellular fluids. It occurs to a very limited
degree in the endothelial cells of the cerebral microvasculature (Pardridge, 1995).
Receptor-mediated endocytosis provides a means for selective uptake of high
molecular weight molecules by specific type receptors present on the luminal
membrane (Nicholson and Sykova, 1998). Cells have different receptors for the
uptake of many different types of ligands, including hormones, growth factors,
enzymes, and plasma proteins (Pardridge, 2007, Duffy et al., 1988). Absorptive-
mediated endocytosis is triggered by an electrostatic interaction between a

CHAPTER 1: GENERAL INTRODUCTION
43
positively charged substance (charge moiety of a peptide) and the negatively
charged plasma membrane surface such as glycocalyx. It has a lower affinity and
higher capacity than receptor-mediated endocytosis (Bickel et al., 2001).
Multiple strategies have been reported to overcome the BBB for successful brain uptake
such as direct injection of drugs into the CNS (intrathecal), nanoparticle carrier systems
for large drug delivery, and chemical modification of drugs to improve small drug delivery
(Pardridge, 2005, Pulicherla and Verma, 2015, Banks, 2016, Pardridge, 2002a,
Upadhyay, 2014a). One of the best strategies for improving brain uptake for low molecular
weight molecule such as CP20 (139.1 Da) is by alteration of the chemical structure to
increase the lipophilicity, so that its propensity to cross the brain via passive membrane
diffusion would also increase. Alternatively, CP20 attaches with endogenous substrate for
carrier-mediated transporter such as glucose or amino acid is also possible.
Passive membrane diffusion
Passive membrane diffusion at BBB is driven by the gradient between the extracellular
and intracellular concentration of molecules (Avdeef, 2011, Sugano et al., 2010, Avdeef,
2001). The ability of small molecules to permeate through the membrane lipid bilayer is
governed by their physicochemical properties such as lipophilicity, polarity and size.
(Lipinski et al., 2001) had proposed a range of optimum physicochemical properties
termed the ‘Rule of Five’ as guidelines for discovery and development of drug-like
molecules. A molecule is more likely to be successfully developing into drug if it has the
following properties namely a molecular weight smaller than 500 Da, a lipophilicity (logP)
smaller than 5, 5 or fewer hydrogen bond donors and 10 or fewer hydrogen bond acceptors
(Lipinski et al., 2001, Lipinski et al., 1997).
Molecular weight smaller than 500 Da: Large molecules that have a cross sectional
area (CSA) more than 80A is energetically unfavourable due to the need to displace large
number of lipid molecules in the biological membrane (Fischer et al., 1998). Indeed, the
diffusion of molecules across biological membrane is inversely related with their CSA.
Since CSA need to be determined experimentally or using specific software for estimation,
approximation to molecular weight is often use due to ease of getting the value by a simple
calculation. It has been estimated that molecular weight between 300 to 400Da

CHAPTER 1: GENERAL INTRODUCTION
44
correspond to be around 80A (Fischer et al., 1998, Pardridge, 2003). This mark the
rationale of the maximum limit of molecular weight for drug-like molecules as suggested
by Lipinski et al. (2001).
Lipophilicity (logP) smaller than 5: A good balance between solubility in water or lipid
is paramount in development of drug-like molecules. Due to the nature of biological
membranes which compose of lipid bilayer, molecules with low lipophilicity would have
low level of partition into the membrane and therefore slow down the diffusion processes
(Smith et al., 2014, Tsinman et al., 2011). Conversely, highly lipophilic molecules would
have difficulty to dissolve in aqueous media and may precipitate out from the solution.
Furthermore, lipophilic molecules tend to trap within the biological membrane and thus
would not reach the target site across the cell membranes. The systemic distribution of
lipophilic molecules would also be limited due to their high affinity toward plasma protein
especially albumin (Smith et al., 2014, Tsinman et al., 2011, Lipinski et al., 2001).
Polarity (5 or fewer hydrogen bond donors and 10 or fewer hydrogen bond
acceptors): The sums of the surface of all polar atoms in a molecule dictate the overall
polarity of a molecule. Hydrogen bond donor (HBD) and acceptor (HBA) play an important
role in determining the overall polarity. High polarity would increase molecules solubility in
water but solubility in lipid would be limited, and vice versa. Therefore, it is suggested that
the cut off point for polarity would be 5 or fewer HBD and 10 or fewer HBA (Lipinski et al.,
2001).
The ‘Rule of Five Guidelines’ is originally devise to assist in the discovery and development
of drug-like molecules that would be likely to permeate gastrointestinal tract (GIT) after
oral administration (Lipinski et al., 2001). However, due to it is the first comprehensive
guidelines in the field pharmaceutical research, it is also widely used as a guide for
discovery of new molecules intended for BBB permeation with some success (Pajouhesh
and Lenz, 2005, Banks, 2009). However, the lipid composition and packing in the plasma
membrane in addition to expression of multitudes of transport mechanism at BBB call for
more stringent guidelines for drug-like molecules targeting the brain. The modification of
Lipinski rule of 5 with more stringent parameters has been devised by Hitchcock and
Pennington (2006), Table 1.1.1.

CHAPTER 1: GENERAL INTRODUCTION
45
Table 1.1.1: Physicochemical property ranges. Suggested for increased CNS permeability.
Property (Lipinski et al., 2001) (Hitchcock and Pennington,
2006)
MW ≤500 <500
LogP ≤5 2-5
HBA ≤10 -
HBD ≤5 <3
TPSA - <90
Alkylated HPO uptake into the brain by membrane diffusion has been shown to increase
as the alkyl group is getting longer, due to increase in lipophilicity. By contrast, addition of
hydroxyl group into HPO molecules lower the lipophilicity and their entry into the brain is
almost entirely abolished in comparison to their non-hydroxylated derivatives (Habgood et
al., 1999). Nevertheless, it is important to highlight that breaking one of the suggested cut-
offs point in these guidelines would not necessarily lead to unsuccessful brain permeation
by passive membrane diffusion.
Transporter systems
Due to the presence of complex tight junction that form continuous belt along the perimeter
of BCEC, the paracellular diffusion of small molecules through the intercellular space is
completely absent. Furthermore, passive membrane diffusion for hydrophilic molecules is
very limited due to the lipidic nature of biological membranes. Because of these reasons,
multitude of different transport systems are expressed at the BBB to assist with nutrients
uptake and metabolites removal (carrier-mediated uptake). Additionally, a specific
transport system with broad substrate specificity is aimed for preventing the entry of
xenobiotics, toxins and potentially harmful molecules into the brain (efflux pump) (Zlokovic,
2008, Abbott et al., 2010, Pardridge, 2012). Utilization of these carrier systems expressed
at the BBB might be an attractive strategy for improve delivery of therapeutics such as iron
chelators that would otherwise have minimal access to the CNS (Pardridge, 2012, Lee et
al., 2001, Qin et al., 2010).
Carrier mediated transport (CMT). The brain requires many hydrophilic biomolecules as
nutrients to support normal biochemical and physiological functions. Access of these
molecules to the brain from blood circulation via paracellular route are completely absent,

CHAPTER 1: GENERAL INTRODUCTION
46
and therefore is entirely rely on carrier-mediated transport. BBB express many specialise
carriers to transport these biomolecules which include glucose, amino acids, nucleotides
and choline (Lee et al., 2001, Pardridge, 2012, Abbott et al., 2010). Mechanisms of CMT
could be passive (uniporter) or secondary-active (symporter and antiporter). Many drugs
are known to take the advantage of these CMT to get into the brain. These include L-
DOPA, valproic acid, gabapentin, lidocaine and morphine glucuronide (Begley, 2004,
Tamai and Tsuji, 2000, Anderson, 1996).
One of the CMT at BBB that has successfully been employed for drug delivery is the large
neutral amino acid transporter 1 (LAT1). LAT1 is an amino acid exchanger (antiporter)
expressed on the apical (blood side) and basolateral (brain side) of BCEC. This transporter
recognises and transport for large L-α-amino acids such as tyrosine, phenylalanine and
leucine (Ylikangas et al., 2014, Pavan et al., 2008, Abbott et al., 2010). Similarly, drugs
that are transported by LAT1 such as L-DOPA (Gomes and Soares-da-Silva, 1999),
melphalan (Cornford et al., 1992) and 4-chlorokynurenine (Hokari et al., 1996) are L-α-
amino acids derivatives which resembles their natural substrates. On the contrary,
gabapentin does not show structural similarity with L-α-amino, however, its cyclic structure
and restricted conformation bring the amino and carboxy groups in close proximity
allowing recognition and transport by LAT1 (Pardridge, 2012). Other CMTs have also been
suggested as facilitators of brain-directed drug delivery (Pardridge, 2012, Begley, 2004,
Tamai and Tsuji, 2000, DiNunzio and Williams, 2008). A good example in this respect is
the glucose transporters (GLUTs) at BBB. Because brain neurons are unable to
synthesize or store glucose, they are fully dependent on glucose transport across the BBB,
which is facilitated by glucose transporters. In mammalian brain, GLUT1 and GLUT3 are
the predominant GLUTs responsible for glucose transport (McEwen and Reagan, 2004).
GLUT1 is highly expressed in the brain capillary endothelial cells and is responsible for
transporting glucose from blood into the extracellular space of the brain (Qutub and Hunt,
2005). GLUT3 is the major neuronal GLUT and helps transport glucose from the
extracellular space into the neurons (Dwyer et al., 2002). In addition, GLUT2 is expressed
in astrocytes of the brain. The GLUT1 is located in the membrane of brain capillary
endothelial cells composing the BBB (Choeiri et al., 2002). Furthermore, the glucose
consumption of the brain amounts to about 30% of the total body glucose consumption
(Dick et al., 1984). This high level of cerebral glucose uptake suggests that the facilitative
transporter by GLUTs might be a useful carrier for efficient and selective glucose-targeted

CHAPTER 1: GENERAL INTRODUCTION
47
drug delivery to the brain. Glucose analogues are theoretically good candidates for drug
transport through the BBB (Qin et al., 2010).
Currently, there are no available clinical drugs that target GLUT transporter at BBB. The
idea of conjugating CNS-targeted drugs with glucose is based on the observation that
GLUT1 transporters are highly expressed on brain capillary endothelial cells, increasing
the chances of glucose-conjugated drugs to cross the BBB via GLUT1 transporters.
However, due to the widespread expression of other isoforms of GLUTs, severe side
effects might arise since the glucose-conjugated drugs can be distributed all over the body.
Potential side effects can be minimised when GLUT1 is selected as a targeted transporter,
taking advantage of different regulation of GLUT1 in comparison with other GLUTs.
GLUT1 is a non-insulin dependent glucose transporter in which it is continuously
expressed on brain capillary endothelial cell membrane regardless of the blood insulin
level (Gould and Holman, 1993). Other types of GLUTs are transiently stored in
cytoplasmic vesicles and expressed only on cell membrane upon rising of blood insulin
level after food intake. Therefore, side effects could be set to minimum if glucose-
conjugated drugs are taken during low blood insulin level for example in between meals
or patients required to fast prior to drugs intake (Calvaresi and Hergenrother, 2013). In
previous studies, different glycoconjugates used as candidates for the treatment of CNS
diseases have been synthesized, which could increase the BBB permeability by carrier-
mediated transport, such as 7-chlorokynurenic acid (Bonina et al., 2000b), dopamine
(Francesco et al., 2003), glycosyl derivatives of ibuprofen (Chen et al., 2009).
Efflux-pump. BBB is armed with efflux pumps to export potentially toxic molecules out
from the brain. Efflux pump exclusively requires ATP regardless of the concentration
gradient of the molecules between extracellular (blood) and intracellular (cytoplasm)
space. Notable examples of efflux pumps that are express at BBB are P-glycoprotein (P-
gp), breast cancer resistance protein (BCRP) and the multidrug resistance-associated
proteins (MRP) (DiNunzio and Williams, 2008, Löscher and Potschka, 2005). These efflux
pumps have broad substrate specificity but they share one common characteristic, that is
lipophilic molecules as their primary substrates (Rautio et al., 2008a, Jong and Huang,
2005). Therefore, although having the range of optimum lipophilicity for drug molecules
appear to be important for passive membrane diffusion at BBB, it does not confirm
successful brain penetration. Co-administration of drug molecule that is a substrate for

CHAPTER 1: GENERAL INTRODUCTION
48
efflux-pump with efflux pump inhibitor have been shown to effective to increase brain
uptake in in vitro and in vivo model (Hoosain et al., 2015, Amin, 2013). However,
translation into the clinic was unsuccessful due to the effective dose for efflux-pump
inhibitor to allow brain penetration of efflux-pump substrate, is associated with toxicity
(Amin, 2013). Recognising contribution of efflux pumps in brain uptake at the early stage
of drug discovery and development is important to avoid failure or inefficient brain
permeability in the later clinical stage. Clinical example of drug that has low brain
permeability due to efflux pump is the antiretroviral, zidovudine for AIDS treatment (Pan
et al., 2007, Ene et al., 2011, Fox et al., 2002). Although zidovudine helps to slow down
HIV replication and thus delay disease progression, it does not effectively reduce
neurological symptoms associated with HIV virus. It was later found out that zidovudine is
a substrate for BCRP efflux pump that was discovered in 1998 (Pan et al., 2008, Ni et al.,
2010).
Having said this, increase in lipophilicity of the novel CP20 derivatives with chiral
substituent containing -OH functional group (cLogP=-0.496 to 1.130) may increase brain
uptake compare to CP20 (cLogP=-0.903) as described in Section 1.1.7. However, this
may at the same time increase the potential of the compounds to be a substrate for efflux
pumps which counteract the increase partition in cell membrane (Banks, 2009).
Additionally, conjugating CP20 derivatives with molecules that are known to be carried by
specific transporters at BBB may also be one of the strategy to circumvent BBB. The
glucose conjugated compound was very likely to exhibit increase brain uptake due to
possible interaction of glucose moiety with GLUT that facilitated uptake into the brain
(Rautio et al., 2008b, Devraj et al., 2011).
General hypothesis and aims
Accumulating evidence has shown that loss of dopaminergic neurones in the substantia
nigra pars compacta in Parkinson’s disease (PD) patients are exacerbated by the
presence of excess iron which contribute to the generation of reactive oxygen species
(ROS), leading to oxidative stress and eventually, cell death (Mochizuki and Yasuda,
2012, Ayton et al., 2014).
Deferiprone (CP20) is the only orally active 3-hydroxy-4-pyridinone (HPO) iron chelator
used in clinic, mainly to treat Thalassemia, sickle cell anaemia and Friedrich’s ataxia.
CHAPTER 1: GENERAL INTRODUCTION
49
CP20 crosses the blood-brain barrier (BBB), and is effective in improving motor symptoms
in PD patients (Mounsey and Teismann, 2012, Abbruzzese et al., 2011). However, high
dose of CP20 need to be administered due to low oral bioavailability as a result of
extensive glucuronidation in the liver (Singh et al., 1992). Additionally, CP20 can cause
severe side effects due to the iron chelation property such as agranulocytosis and
cytopenia (Henter and Karlen, 2007). As a potential future treatment for PD patients and
to outweigh the therapeutic ability over side effects, novel iron chelators have been
developed to overcome this problem.
A series of novel bidentate HPO iron chelators synthesised base on CP20 structure was
designed to resist glucuronidation in the liver by adding chiral hydroxyalkyl group but
maintain the affinity towards iron at least comparable to CP20 (Hider et al., 2011). Despite
structural alteration, the novel HPOs still exhibit physicochemical properties that favour
brain penetration.
It is hypothesised that the novel HPO iron chelators based on the CP20 structure are able
to cross the BBB and show neuroprotection in PD.
The aims of these studies were to investigate whether the novel iron chelators can cross
the BBB and are protective against dopaminergic neurons from toxin-induced cell death.
Specifically, these studies had the following objectives:
a) The determination of the BBB permeability of novel HPO bidentate iron chelators
by using in situ brain perfusion technique in rats.
b) Determination of the neuroprotective properties of the novel iron chelators against
Parkinson’s disease (PD)-related toxins in vitro using neuroblastoma cell line (SH-
SY5Y).
c) The evaluation of the pharmacokinetic distribution of selected novel iron chelators
upon intraperitoneal (i.p.) injection in plasma and brain to determine dose and
frequency for in vivo studies.
d) The evaluation of the neuroprotective effect of selected novel iron chelators in vivo
using the 6-hydroxydopamine (6-OHDA) rat model of PD.

CHAPTER 2: MATERIALS AND METHODS
50
CHAPTER 2
MATERIALS AND METHODS

CHAPTER 2: MATERIALS AND METHODS
51
2 Materials and Methods
In order to test the hypothesis that the novel HPO iron chelators based on the CP20
structure are able to cross the BBB and show neuroprotection in PD the following studies
were performed:
Six novel HPO bidentate iron chelators (CN116, CN118, CN126, CN128, CN226 and
CN228) were evaluated for brain penetration by using in situ brain perfusion in male
Wistar rat. In addition, CP84 and its glucose conjugate (FCF132) were also evaluated
to determine whether transport via the glucose transporter (GLUT) would enhance
brain delivery. The brain permeability results were compared with the parent
molecule, CP20. This study addressed the first aim in order to determine the BBB
permeability of novel HPO bidentate iron chelators.
The novel HPO bidentate iron chelators which crossed the BBB (CP84, CN116,
CN118, CN126, CN128, CN226 and CN228) were then evaluated for thir ability to
protect SH-SY5Y neuroblastoma cell lines against toxins that are relevant to the
mechanism of induction of cell death in PD (H2O2, 6-OHDA and Fe3+). The cell viability
was assessed with 3-(4,5-dimethylthiazol-2-yl)-2,5-diphenyltetrazolium bromide
(MTT) assay. This addressed the second aim determine the neuroprotective
properties of the novel iron chelators against Parkinson’s disease (PD)-related toxins
in vitro,
Selected novel HPO bidentate iron chelators that showed brain permeation in situ and
neuroprotective in vitro (CP84, CN128 and CN226) were then assessed for
distribution in plasma and brain of male Wistar rat after an i.p. injection. CP20 was
used as a reference drug in this study. A validated HPLC assay was used to quantify
the concentration of HPO in plasma and brain. This addressed the third aim to
evaluate of the pharmacokinetic distribution of selected novel iron chelators upon
intraperitoneal (i.p.) injection in plasma and brain to determine dose and frequency
for in vivo studies.
Finally, selected novel HPO bidentate iron chelators that showed brain permeation in
situ, neuroprotection in vitro and brain permeation in vivo were assessed for
neuroprotective effect by i.p. injection on 6-OHDA striatal lesioned male Wistar rat.

CHAPTER 2: MATERIALS AND METHODS
52
The neuroprotective effect was compared to lesioned rat treated with CP20.This
chapter describes in detail the methodologies that were used in these studies which
includes method optimisation and validation for each results chapter. This addressed
the final aim to evaluate of the neuroprotective effect of selected novel iron chelators
in vivo using the 6-hydroxydopamine (6-OHDA) rat model of PD.
The material and methods required to perform these studies are described in this chapter.
Evaluation of the blood-brain barrier permeability of
iron chelators using in situ brain perfusion
Introduction
In situ brain perfusion technique involves direct insertion of cannula into the common
carotid arteries that bring oxygenated blood and nutrients to the brain. The inserted
cannula allows perfusion with oxygenated buffers (normal Ringer’s buffer) and studied
compounds replacing the circulating blood. The jugular veins are severed, making the
system open, and thus avoiding re-circulation of perfusate. This technique is used at the
initial stage of drug discovery and development to determine the brain permeability of
compounds of interest. The compounds are perfused into the brain in situ bypassing the
systemic circulation, thus, avoiding systemic drug metabolism not only in the liver, but also
in other metabolically active organs such as spleen and kidney that render the compound
intact (Preston et al., 1995). Besides circumventing systemic metabolism, this technique
also restricts peripheral distribution, making sure that the studied compound is primarily
distributed to the brain (Smith, 2003). Having said this, metabolism in brain tissue, if any,
is unavoidable. Although direct systemic injection of a drug of interest is considered as a
‘gold standard’ in BBB permeability study, data derived from this technique need to be
carefully interpreted and are not straightforward as it involves systemic metabolism and
distribution to other tissues (Takasato et al., 1984, Bickel, 2005, Mensch et al., 2009). The
perfusion was terminated during predominantly influx and unidirectional transports
process at the BBB, allowing determination of both brain uptake and rate of brain uptake
(Smith, 2003, Takasato et al., 1984).
Total brain uptake and rate over time can be determined from the drug concentration in
brain and perfusate at terminal time point. In addition, brain homogenate devoid of brain

CHAPTER 2: MATERIALS AND METHODS
53
capillary endothelial cells (BCEC) can be prepared from brain homogenate by differential
density centrifugation using concentrated dextran, which has a density in between brain
capillary endothelial cells and the rest of brain tissue. The so called ‘capillary depleted
brain’ will correct for compound that adhere to endothelial cells and trapped intracellularly
(Triguero et al., 1990).
In situ brain perfusion was performed by a modified version of Preston et al. (1995).
Detailed methodology is described below.
Animals
Male Wistar rats weighing between 250-300 g (Harlan UK Ltd) were housed between 2-4
rats per cage in the Biological Service Unit (BSU), King’s College London. Temperature
and humidity were maintained at 21-24 ºC and 55-65% respectively with 12h light/dark
cycle. The rats had accessed to standard food pellet and tap water ad libitum. The rats
were allowed an acclimatisation period of at least one day after arrival at BSU before the
perfusion experiment commence. The experiments were approved under Animal
(Scientific Procedure Act) 1986 and conducted under project license number 70/0688.
Preparation of buffers
Normal Ringer’s solution
The perfusion fluid was a normal Ringer’s solution (NRS), Table 2.2.1, containing bovine
serum albumin (BSA; representing physiological concentration of plasma proteins) with
traces of Evan’s blue for visualisation of vessels (Triguero et al., 1990). NRS was kept
warm at 37 °C, and continuously bubbled with 5% CO2/95% O2 during in situ brain
perfusion. The NRS was initially allowed to equilibrate with 5% CO2/95% O2 for at least 20
minutes. The pH of the solution was evaluated after equilibrium and within the range of
7.35 to 7.45. After equilibration with O2, NRS pH deviating from the aforementioned ranges
was adjusted using 2 N NaOH or 2 N HCl. Prior to perfusion, oxygen equilibrated NRS
was pumped into the in situ brain perfusion surgical set up by peristaltic pump (505S;
Watson Marlow, UK), passing through all the connecting tubing to terminal polyethylene
(PE) cannula. Prepared NRS (without glucose, BSA and Evan’s blue) was stored at 4 °C
and used within 4 weeks of preparation.

CHAPTER 2: MATERIALS AND METHODS
54
Table 2.1.1: Chemical constituent of normal Ringer’s solution and their concentration.
Chemicals Concentration (g/L)
Concentration (mM)
NaCl 6.90 118.0
KCl 0.35 4.7
CaCl2 0.37 2.5
MgSO4 0.30 1.2
NaHCO3 2.10 25.0
KH2PO4 0.16 1.2
HEPES 2.38 10.0
Glucose* 1.80 10.0
BSA* 40.00 -
Evan’s blue* 0.0011 -
*Glucose, BSA and Evan’s blue were added on the day of the experiment to avoid microbial growth.
Physiological buffer
Physiological buffer solution (PhyBS), Table 2.2.2 (Triguero et al., 1990), was used during
the brain homogenisation process to maintain the pH and physiological environment of
brain tissue. PhyBS pH was adjusted using 2 N NaOH or 2 N HCl to be within the range
of pH 7.35 to pH 7.45.
Table 2.1.2: Chemicals constituents of physiological buffer solution and their concentration.
Chemicals
Concentration (g/L)
Concentration (mM)
NaCl 8.24 141.0
KCl 0.30 4.0
CaCl2.2H2O 0.41 2.8
MgSO4.7H2O 0.25 1.0
NaH2PO4.H2O 0.14 1.0
HEPES 2.38 10.0
Glucose* 1.80 10.0
*Glucose was added on the day of the experiment to avoid microbial growth.

CHAPTER 2: MATERIALS AND METHODS
55
In situ brain perfusion
The perfusion set up is portrayed in Figure 2.1.1. This system was made ready before
surgery by filling all connected tubing with oxygen equilibrated NRS. HPO and
radiolabelled compounds were filled into two 20 mL syringes and secure on slow-drive
Harvard Type 22 syringe pump (Harvard Apparatus, USA) and primed into the flowing
NRS to make sure all air bubbles are removed. The connecting tubing was then clamped,
and NRS was allowed to flow for another 2 minutes to wash out all traces of compounds.
Figure 2.1.1: Schematic diagram of in situ brain perfusion set up.
The in situ brain perfusion technique in this study involves perfusion of both hemispheres
of the brain in the absence of the systemic circulation as a modification of the unilateral
perfusion described by Takasato et al. (1984), and modified to bilateral perfusion by
Preston et al. (1995). Rats were anaesthetised with 50 mg/kg ketamine (VetalarTMV; Pfizer,
USA) and 0.2 mg/kg medetomidine (Domitor®; Orion Pharma, UK) intraperitoneally (i.p.),
and maintained at 37 °C using a heating pad. Whilst in a supine position, rats were injected
with 100,000 U/kg heparin (i.p.; Wockhardt UK Ltd, UK) to prevent blood clotting. Local
anaesthetic, lignocaine/adrenaline (Norbrook, UK) was then injected subcutaneously (s.c.)
at five multiple sites (total dose was 20 and 12.5 mg/kg) on the chest.

CHAPTER 2: MATERIALS AND METHODS
56
An incision was made posterior to the chest and going upward to the chin. Muscles that
covered the trachea were slowly detached to the sides to expose the trachea. Carotid
arteries were located beneath the muscle layers under trachea. The common carotid
arteries were exposed and cleaned from fat tissues with forceps. Two pairs of surgical
cotton threads were loosely ligated posterior and anterior to the exposed arteries.
In all of the experiments, tubing made from silicone was used to reduce drug or protein
binding in the tube lumen (Figure 2.1.2). NRS was passed through a heat exchanger, then
a double chamber filter and bubble trap filled with polymer wool to the silicone tubing
(internal diameter, ID=1 mm, outer diameter, OD=1.5 mm, length=420 mm; Altec, UK)
connected to bevelled PE tubing cannula (ID=0.58 mm, OD=0.96 mm, length=20 mm; Carl
Stuart UK Ltd., UK) through PE tubing fitting (ID=0.86 mm, OD=1.27 mm, length=10 mm;
Carl Stuart UK Ltd., UK).
Figure 2.1.2: The tubing and cannula for in situ brain perfusion.
NRS was infused at 90% (1.44 mL/min) of the total flow rate (1.60 mL/min in total) to each
brain hemisphere. The posterior ligation of the artery was tightened to halt blood flow and
a small hole was made in each carotid artery with Vanna scissors. The PE cannulas
connected to the NRS perfusion system were inserted into the hole for perfusate inflow
and held in place by tightening the anterior ligature (Figure 2.1.3). The jugular veins on
both sides were exposed and severed for perfusate drainage out from the brain just after
the insertion of cannula. Brain was allowed to perfuse with NRS for at least one minute to
wash out the blood.

CHAPTER 2: MATERIALS AND METHODS
57
Figure 2.1.3: Step by step procedures of carotid artery cannulation.
A) The neck area was exposed and injected with local anaesthetic, lignocaine and adrenaline (s.c.)
B) An incision was made vertically on the neck C) The fats and muscles covering the neck was
pulled away until the tissue covering the trachea is visible D) The tissue covering the trachea was
pulled away with haemostat E) Carotid artery was located beneath the tissue covering the trachea.
A pair of forceps were used to isolate the carotid artery from the tissue. The carotid artery was
cleaned from fats and associated tissues F) A pair of cotton thread was loosely ligated on the
anterior and posterior part of the artery G) The ventral ligation was tightened H) Small hole was
made above the tightened posterior ligation with Vanna scissors I) A cannula with flowing NRS was
slowly inserted into the pre-made hole J) The anterior ligation was tightened to hold the cannula in
place K) The jugular vein on the ipsilateral side was cut-off to allow the perfused NRS to flow out.
The same steps were repeated on the contralateral side of carotid artery.
Compounds for study were filled into a 20 mL syringe powered by slow-drive syringe pump
(22-5555, Harvard Apparatus, USA). The perfusion rate of slow drive syringe pump was
10% (0.16 mL/min) of the overall flow rate (1.60 mL/min in total). Ninety percent of the
perfusate came from the oxygenated/proteinaceous NRS to support normal brain
physiology. Brain perfusion with compounds of interest began at least 3 minutes after both
of the cannulas were inserted into right and left common carotid arteries in order to allow
removal of blood from brain capillaries (Smith and Allen, 2003). The perfusion pressure
was monitored constantly by a pressure transducer and fell between 30 mmHg to 50
mmHg in this setup. Pressure deviating from this range may indicate improper perfusion.

CHAPTER 2: MATERIALS AND METHODS
58
Measurement of pH, gases and ions in whole blood and perfusate
In situ brain perfusion was performed for 5, 10, 20, 40 and 60 minutes to evaluate the
physiological parameters of the perfused NRS to support normal brain function during long
duration of perfusion, the perfusate was sampled before beginning of perfusion and after
it has passed the brain and flow out through the jugular vein. Additionally, whole blood
was also sampled from the anaesthetised rat before the start of the perfusion so that
comparison can be made with the NRS perfusate.
The arterial blood was sampled via tail ventral artery with 23G winged needle (Hospira,
USA) connected to 1 mL syringe (Terumo, Japan) with 25G needle (Terumo, Japan)
before start of perfusion. Rat jugular vein on the left side was made visible with a pair of
forceps from surrounding muscle tissues and fats. Surgical cotton thread was loosely
ligated anterior to the incision site. Isolated jugular vein was held in place with forceps and
small incision was made on the vein with Vanna scissors. Bevelled PE cannula (internal
diameter, ID=0.58 mm, outer diameter, OD=0.96 mm, length=20 mm; Carl Stuart UK Ltd.,
UK) connected to silicone tubing (ID=0.5 mm, OD=0.75 mm, length=120 mm; Altec, UK)
was inserted and the cotton thread was tightened to secure the cannula in place. Flowing
venous blood was collected into 1 mL syringe (Terumo, Japan) attached to 25G needle
(Terumo, Japan).
Additionally, the perfusion fluid (oxygenated NRS) was sampled from the tip of the
perfusion cannula before carotid artery cannulation. After the perfusion started, venous
perfusate was sampled from the cannulated jugular vein at 10, 20, 40 and 60 minutes.
The collected whole blood and perfusate samples were immediately pipetted into a CG8+
cartridge (Abbott, USA) and analysed for O2, CO2, glucose, pH and physiological ions
[Na+, K+, HCO3- and ionised Ca2+ (iCa2+)] level with an iSTAT portable blood analyser
(Abbott, USA). Figure 2.1.4 shows the results obtained from whole blood and perfusate
using iSTAT portable blood analyser.

CHAPTER 2: MATERIALS AND METHODS
59
A V A
V 1
0
V 2
0
V 4
0
V 6
0
0
2
4
7 .0
7 .2
7 .4
7 .6
B lo o d P e rfu s a te
# ## # #
# # ## # #
pH
* ** * *
* * ** * *
&
A V A
V 1
0
V 2
0
V 4
0
V 6
0
0
5 0
1 0 0
1 2 0
1 3 0
1 4 0
1 5 0
P e rfu s a teB lo o d
#
#
Na
+(m
mo
l/L
)
A V A
V 1
0
V 2
0
V 4
0
V 6
0
0 .0
0 .5
1 .0
1 .2
1 .4
1 .6
1 .8
P e rfu s a teB lo o d
iCa
2+
(m
mo
l/L
)A V A
V 1
0
V 2
0
V 4
0
V 6
0
0
1
3
4
5
6
7
8
P e rfu s a teB lo o d
##
# #
# #
K+
(mm
ol/
L)
* ** *
* * ** * *
A V A
V 1
0
V 2
0
V 4
0
V 6
0
0
3
6
1 0
2 0
3 0
4 0
P e rfu s a teB lo o d
$ $ $
# # #
# # #
# # #
# # #
HC
O3 (
mm
ol/
L)
A V A
V 1
0
V 2
0
V 4
0
V 6
0
0
6
1 2
1 5
2 0
2 5
P e rfu s a teB lo o d
& & &
# # #
# # #
# # #
# # #
glu
co
se
(m
mo
l/L
)
A V A
V 1
0
V 2
0
V 4
0
V 6
0
0
5 0
1 0 0
1 5 0
2 0 0
P e rfu s a teB lo o d
$
PO
2 (
mm
Hg
)
& & &
#
#
# #
****
***
A V A
V 1
0
V 2
0
V 4
0
V 6
0
0
2 0
4 0
6 0
8 0
1 0 0
B lo o d P e rfu s a te
$
& & &
#
# #
# #
# # #
PC
O2 (
mm
Hg
)
******
******
a ) p H b ) N a+
c ) iC a2 +
d ) K+
h ) P C O 2g ) P O 2
f ) g lu c o s ee ) H C O 3-
A = arte ria l
V = v e n o u s
1 0 = 1 0 m in u te s
2 0 = 2 0 m in u te s
4 0 = 4 0 m in u te s
6 0 = 6 0 m in u te s
Figure 2.1.4: pH, ions and blood gaseous in arterial and venous of whole blood (naïve rats)
or perfusate (perfused rats).
The whole blood and perfusate samples were analysed by iSTAT portable blood analyser using
CG8+ cartridge for simultaneous analysis of pH, ions and blood gaseous (Graph a-h). Red bars
denote data for whole blood and blue bars denote data for perfusate. The grey shaded area showed
the normal physiogical range of pH, gases and ions in blood. Data are expressed as mean+SEM
(n=3-6 rats). $ p<0.05 (arterial blood vs venous blood; paired t-test, two-tailed); & p<0.05, &&&
p<0.001 (arterial blood vs arterial perfusate; unpaired t-test, two-tailed); * P<0.05, ** p<0.01, ***
p<0.001 (arterial perfusate vs venous perfusate; one-way ANOVA followed by Holm-Šídák multiple
comparison test); # p<0.05, ## p<0.01, ### p<0.001 (venous blood vs venous perfusate; one-way
ANOVA followed by Holm-Šídák multiple comparison test).

CHAPTER 2: MATERIALS AND METHODS
60
The pH between arterial and venous blood was not different from each other and was
within the reported physiological range (Figure 2.1.4a; Subramanian et al., 2013, Guyenet
et al., 2005). Arterial perfusate pH was within the physiological pH although the pH was
slightly higher. In contrast to the venous blood, pH of venous perfusate dropped at all
perfusion time end-point, with the average pH was 0.1 unit lower than the reported
physiological range (physiological range pH=7.20-7.50; Subramanian et al., 2013,
Guyenet et al., 2005).
Na+, ionised Ca2+ (iCa2+) and K+ concentration in whole blood fall within the physiological
range (Figure 2.1.4b, c & d; Giknis and Clifford, 2008, Hemmingsen et al., 1998). There
was no different in Na+, iCa2+ and K+ level between arterial and venous blood. Similarly,
no different was observed in Na+, iCa2+ and K+ level between arterial blood and arterial
perfusate. Comparison between venous blood and venous perfusate showed no different
in iCa2+ level. In contrast, Na+ and K+ level in venous perfusate were higher than venous
blood, although they still fall within the reported physiological range (Giknis and Clifford,
2008, Hemmingsen et al., 1998).
HCO3- level in arterial and venous blood were within reported physiological pH (Figure
2.1.4e; Giknis and Clifford, 2008). However, HCO3- showed unexpected lower
concentration (2-fold lower) in arterial perfusate although during preparation of the NRS
perfusion fluid, NaHCO3 salt amounting to 25 mM that mimics physiological condition was
added. One possible explanation for this observation is that continuous and extensive
oxygenation of the perfusion fluid caused displacement of CO2 in the solution, thus the
reaction showed in Equation 2.1.1 move to the left (Swietach et al., 2010).
𝐻2𝑂 + 𝐶𝑂2 ↔ 𝐻2𝐶𝑂3 ↔ 𝐻𝐶𝑂3− + 𝐻+ Equation 2.1.1
Similar observation has been reported in hyperventilated rat whereby the HCO3- level in
blood dropped 2-fold to 11.5 mmol/L (Weyne et al., 1970). As the reaction shifted to the
left, the bicarbonate buffering system was less able to maintain the perfusion fluid pH
within the physiological range as described above. Thus, addition of 10 mM 4-(2-
hydroxyethyl)-1-piperazineethanesulfonic acid (HEPES) into the perfusion fluid helped to
maintain the pH (Choi and Zheng, 2009).

CHAPTER 2: MATERIALS AND METHODS
61
Glucose concentration in whole blood was higher (18-20 mmol/L) than the reported
physiological range (3.9-11.6 mmol/L; Figure 2.1.4f; Giknis and Clifford, 2008,
Subramanian et al., 2013). However, this is expected as rats anaesthetised with general
anaesthesia and muscle relaxant such as ketamine and xylazine have been shown to
exhibit higher level of blood glucose up to 19.4 mmol/L (Brăslaşu et al., 2007, Saha et al.,
2005). Therefore, the accepted physiological range became widened in this study to
include range of blood glucose in anaesthtised rats (3.9-20 mmol/L). Arterial and venous
perfusate level were within physiological range correspond to the 10 mM glucose added
into the perfusion fluid.
O2 partial pressure (PO2) in arterial blood was within physiological range (Figure 2.1.4g;
Giknis and Clifford, 2008). Venous blood PO2 dropped 1.7-fold as would be expected for
jugular venous blood (Duong et al., 2001). Arterial perfusate PO2 was 2.4-fold higher than
arterial blood PO2 as the NRS perfusion fluid was continously bubble with 95% O2/5%
CO2. Similar observation has been reported where hyperventilation in living rats caused
1.3-fold increase in arterial PO2 (Duong et al., 2001).The continous and extensive
oxygenation of the NRS was important to supply the perfused brain with sufficient O2 to
support brain metabolism. Venous perfusate PO2 was 2.4-fold higher than venous blood
PO2. However, venous perfusate PO2 was 1.7-fold lower than arterial perfusate PO2 which
corresponds to venous PO2 dropped in whole blood. This suggest that the brain was
metabolically active as in living rat when perfused for up to 60 minutes.
CO2 partial pressure (PCO2) in whole blood was within physiological range. PCO2 in
venous blood increase by 1.2-fold as reported (Figure 2.1.4h; Dauchy et al., 2000).
Arterial perfusate CO2 was 2.4-fold lower than arterial blood PCO2 as should be expected
for continuously oxygenated perfusate (Duong et al., 2001, Weyne et al., 1970). Venous
perfusate PCO2 was 1.3-fold lower than venous blood PCO2. However, venous perfusate
PCO2 was increase by 2.2-fold compared to arterial perfusate PCO2. This suggest that the
brain actively remove metabolic waste for up to 60 minute perfusion. The absence of red
blood cells (RBC) in the perfusate might explain the higher PCO2 in venous perfusate as
carbonic anhydrous in RBC helps in reducing the level of post-capillary CO2. The higher
PCO2 in venous perfusate might also explain the slight dropped in pH in venous perfusate
as incresased soluble CO2 in solution contributed to decrease in pH (Motais et al., 1989).

CHAPTER 2: MATERIALS AND METHODS
62
The concentration of dissolved O2 and CO2 in blood and perfusate were calculated by
multiplying the PO2 and PCO2 with 0.0031 mL O2/mmHg O2/dL and 0.067 mL CO2/mmHg
CO2/dL respectively as described by Henry’s Law (Bacher, 2005). The difference of O2
and CO2 concentration in arterial and venous samples were calculated. Arterial-venous
(A-V) difference of soluble O2 in whole blood and perfusate were within the physiological
range (Figure 2.1.5). Similarly, venous-arterial (V-A) difference of soluble CO2 in whole
blood was also within the reported physiological range (Giknis and Clifford, 2008, Duong
et al., 2001).
a ) b )
10
20
40
60
0 .0
0 .1
0 .2
0 .3
0 .4
N a ive
rat
P e r fu s e d
rat
Arte
ria
l-v
en
ou
s d
iffe
re
nc
e,
A-V
(mL
/dL
)
10
20
40
60
0
1
2
3
4
N a ive
rat
P e r fu s e d
rat
*
*
* *
*
Ve
no
us
-arte
ria
l d
iffe
re
nc
e,
V-A
(mL
/dL
)
1 0 = 1 0 m in u te s
2 0 = 2 0 m in u te s
4 0 = 4 0 m in u te s
6 0 = 6 0 m in u te s
Figure 2.1.5: Arterial-venous O2 (A-V) and venous-arterial (V-A) CO2 diferences in rats.
a) The O2 concentration difference between arterial and venous blood/perfusate in naïve and
perfused rats. b) The CO2 concentration difference between venous and arterial blood/perfusate in
naïve and perfused rats. The grey shaded area showed the normal physiogical range. Data are
expressed as mean+SEM (n=3-6 rats).* P<0.05, ** P<0.01 (naïve rat vs perfused rat; one-way
ANOVA followed by Holm-Šídák multiple comparison test).
Physiologically reported arterial-venous difference of glucose was very low (0.06-1.11
mmol/L (Somogyi, 1948). Thus, negative A-V values can easily be obtained due to slight
analytical error (Figure 2.1.6). Nevertheless, the positive A-V of glucose obtained in this
study was within the reported physiological range. This observation suggested that the
brain was metabolically active up to 60-minute perfusion.

CHAPTER 2: MATERIALS AND METHODS
63
10
20
40
60
-1 0
-5
0
5
1 0
N a ive
rat
P e r fu s e d
rat
*
*
Arte
ria
l-v
en
ou
s d
iffe
re
nc
e,
V-A
(mm
ol/
L)
Figure 2.1.6: Arterial-venous (A-V) glucose diference in rats.
Glucose concentration difference between arterial and venous blood/perfusate in naïve and
perfused rats. The grey shaded area showed the normal physiogical range. Data are expressed as
mean+SEM (n=3-6 rats). * P<0.05 (naïve rat vs perfused rat; one-way ANOVA followed by Holm-
Šídák multiple comparison test).
In summary, the pH, electrolytes and blood gases in the arterial perfusate generally agreed
with the accepted physiological range in whole blood. Although some parameters showed
deviation from physiological range, this is expected and explainable as the perfusion fluid
was continously and extensively gas with O2, and lacked RBC that help buffering pH and
ion levels.
Validation of in situ brain perfusion
It has been shown in previous section (Section 2.1.5) that the NRS perfusate physiological
parameters were within the blood physiological range for up to 60-minutes perfusion. In
this section, details of the experiment conducted to determine the linearity of HPO brain
uptake for up to 60-minute perfusion using CP20 as the prototype HPO was described.
14C-sucrose and 3H-O-methyl-D-glucose (3H-OMG) were simultaneously measured to
determine the integrity and functionality of BBB.
In situ brain perfusion was validated by using deferiprone (CP20, MW=139.15 g/mol;
Sigma-Aldrich, USA) as a model drug of HPO bidentate iron chelators, 3H-O-methyl-D-
glucose (3H-OMG, MW=194.2 g/mol; Perkin Elmer, USA) and 14C-sucrose (MW=342.3
g/mol; Perkin Elmer, USA). CP20 crosses the BBB through passive diffusion and was used
as prototype drug to evaluate the brain penetration of novel HPO (Hider et al., 2011,

CHAPTER 2: MATERIALS AND METHODS
64
Habgood et al., 1999). 3H-OMG was transported across the BBB via GLUT-1 transporter
(Reyes et al., 2002). 14C-sucrose was used as a vascular space marker and negative
control since it does not crossed BBB (Ennis and Betz, 1986).
CP20 (500 µM), 3H-OMG [(296 kBq/rat (8 µCi/rat)] and 14C-sucrose [185 kBq/rat (5
µCi/rat)] in NRS were filled in a 20 mL syringe. The specific activity and amount of 3H-
OMG and 14C-sucrose were summarised in Table 2.1.3. The carotid arteries were isolated
as described earlier in Section 2.1.4.
Table 2.1.3: Specific activity of radionuclides and amount perfused.
Radionuclide
Specific activity
(Ci/mmol)
Purity (%)
Molecular weight (g/mol)
Amount perfused per rat (nmol)
3H-OMG 80 >97 194.2 0.100
14C-sucrose 0.432 >97 342.3 12
These compounds were perfused simultaneously to the brain for 5, 10, 20, 40 and 60
minutes. At each of the perfusion time point, the perfusion was stopped and the head was
decapitated.
Preparation of in situ brain perfusion samples for quantification
analysis
At the end of perfusion, the rats were decapitated and the brain was removed immediately
for sample processing. Additionally, sample of flowing perfusate was taken from the end
of the PE cannula. Brain hemispheres were cleaned with cotton bud moistened with
PhyBS to remove pial layer followed by dissection to remove the cerebellum and choroid
plexus. Cerebellum is mainly supplied by a vertebral artery and therefore was not included
in the brain uptake measurement (Yao et al., 1990, Preston et al., 1995). Additionally,
choroid plexus, a highly vascularise brain structure found at the lateral, third and fourth
ventricles was also removed because of the leaky capillaries in this region (Liddelow,
2015, Preston et al., 1995). The brain was homogenised in PhyBS. 14C-sucrose perfused
along with 3H-OMG and CP20 work as a vascular marker so that 3H-OMG and CP20 in
capillary lumen leaked during the homogenisation process can be estimated and corrected
(Triguero et al., 1990, Preston et al., 1995). Processed whole brain homogenate represent

CHAPTER 2: MATERIALS AND METHODS
65
the uptake of 3H-OMG and CP20 in BCEC and brain parenchyma. As BCEC is the barrier
component of BBB, the uptake of 3H-OMG and CP20 in BCEC and brain parenchyma
must be differentiated. Differential centrifugation with concentrated dextran that has a
density in between BCEC and brain parenchyma helps to physically separate these two
compartments, thus allowing measurement of 3H-OMG and CP20 in brain parenchyma
only (Triguero et al., 1990). This section explained in detail the method used in preparation
of the samples for quantification analysis.
The brain was weighed and homogenise in PhyBS [1:1 (w/v) dilutions, ten strokes
homogenisation in a Potter-Elvehjem borosilicate glass homogeniser, 150 mm x 10 mL;
Jencons, England]. Sequentially, the same volume of 30% (w/v) dextran [(final
concentration 15% (w/v)] was added and briefly homogenised for four strokes with the
homogeniser producing whole brain homogenate. Total dilution of brain at this point was
1:3 (w/v).
Sample preparation for 3H-OMG and 14C-sucrose measurement
i) Perfusate
Perfusate sample (100 µL) taken from the end of polyethylene cannula upon termination
of in situ brain perfusion was pipetted into 7 mL scintillation vial. Tissue solubiliser (0.5
mL, Soluene; Canberra-Packard, UK) was added and mix with a mixer (Vortex-Genie2;
Scientific Industries, USA). The samples were incubated at room temperature for 24 h.
Five millilitre of scintillation cocktail (Ultima Gold XR; Perkin Elmer, USA) was added,
mixed with a mixer and incubated for 30 minutes before analysis by liquid scintillation
spectroscopy (LSS) counter. Vehicle (NRS) was processed the same way as a blank.
Samples preparation was performed in duplicate.
ii) Whole brain fraction
Five hundred microliters of whole brain homogenate were pipetted into a 7 mL scintillation
vial. Tissue solubiliser (0.5 mL) was added and mixed with a mixer. The samples were
incubated at room temperature for 24 h to allow tissue solubilisation. Scintillation cocktail
(5 mL) was added, vortex and incubated for 30 minutes before analysis by LSS counter.
Vehicle (PhyBS and dextran mixture) was processed in the same way forming blank
controls. Sample preparation was performed in duplicate.

CHAPTER 2: MATERIALS AND METHODS
66
iii) Capillary depleted brain fraction
Seven hundred microliters of whole brain homogenate were pipetted into 1.5 mL
microcentrifuge tube and spun at 5400 g for 20 minutes at 4 ºC (Triguero et al., 1990).
Three layers of separation were formed upon centrifugation (Figure 2.1.7).
Figure 2.1.7: Illustration of capillary depleted brain preparation.
First layer from the top was brain parenchyma, second layer was mixture of physiological buffer
and dextran, and third layer was capillary rich brain tissue pellet. Capillary depleted brain
parenchyma (1st layer) was carefully loosened by small spatula from the microcentrifuge wall before
decanted into other microcentrifuge tube together with the 2nd layer and subsequently vortexed to
evenly distribute the supernatant. PhyBS= physiological buffer saline; EC=endothelial cells.
Tissue solubiliser (0.5 mL) was added to 500 µL of capillary depleted brain homogenate
and mixed by a mixer. The samples were incubated at room temperature for 24 h. Five
millilitre of scintillation cocktail was added, vortexed and incubated for 30 minutes before
analysis by LSS counter (Figure 2.1.8). Vehicle (PhyBS and dextran mixture) was
processed in the same way as blank controls.

CHAPTER 2: MATERIALS AND METHODS
67
Figure 2.1.8: Sample preparation for LSS analysis.
Sample preparation for HPO iron chelators measurement
i) Perfusate
Perfusate sample (300 µL) taken from the end of polyethylene cannula upon termination
of in situ brain perfusion was diluted 1:4 (v/v) with NRS. Three hundred microliter of diluted
perfusate was pipetted into 1.5 mL microcentrifuge tube and 30 µL of trifluoroacetic acid
(TFA; Sigma-Aldrich, USA) was added to denature the proteins. After a brief mixed with a
mixer, the samples were centrifuged at 20800 g for 45 minutes to precipitate the protein.
One hundred microliters of supernatant were taken and pipetted into 0.3 mL conical crimp
vial (Kinesis, UK), seal with 8 mm polytetrafluoroethylene (PTFE) crimp cap (Kinesis, UK)
sealed with a crimper. Thirty microliters was injected into high performance liquid
chromatography (HPLC) system (Figure 2.1.9). Samples preparation was performed in
duplicate.
ii) Whole brain fraction
Five hundred microliters of whole brain homogenate were pipetted into 1.5 mL
microcentrifuge tube and 50 µL of TFA was added to denature the proteins. After a brief
mixed with a mixer, the samples were centrifuged at 20800 g for 45 minutes to precipitate

CHAPTER 2: MATERIALS AND METHODS
68
the protein. One hundred microliters of supernatant were taken and pipetted into HPLC
vial and seal with crimper. Samples preparation was performed in duplicate.
iii) Capillary depleted brain fraction
Capillary depleted brain was prepared as described in Section 2.1.6.a.iii. Capillary
depleted brain homogenate (500 uL) was pipetted into 1.5 mL microcentrifuge tube and
50 µL of TFA was added to denature proteins. After a brief mixed by a mixer, the samples
were centrifuged at 20800 g for 45 minutes to precipitate the protein. One hundred
microliters of supernatant were taken and pipetted into 0.3 mL conical HPLC vial. Samples
preparation was performed in duplicate.
Figure 2.1.9: Sample preparation for HPLC analysis by gradient reversed-phase ion-pair
method.
Validation of capillary depleted brain preparation
Alkaline phosphatase is a water-soluble enzyme abundantly present in brain capillary
endothelial cells but not in brain parenchyma. Therefore, alkaline phosphatase enzyme
activity was assayed in capillary-depleted brain parenchyma and capillary enriched pellet
to asses for effective separation (Triguero et al., 1990, Williams et al. 1980). p-nitrophenyl
phosphate (pNPP) was used as a probe substrate in the reaction. Alkaline phosphatase
catalysed dephosphorylation of pNPP to p-nitrophenol (pNP), a product that turn yellow in
alkaline condition and shows maximal absorption at 405 nm (Figure 2.1.10).

CHAPTER 2: MATERIALS AND METHODS
69
Figure 2.1.10: Conversion of p-nitrophenyl phosphate, a probe substrate for alkaline
phosphatase to formed yellowish hue product in alkaline condition, p-nitrophenol, which
has maximal absorption at 405 nm.
The amount of pNP formation is proportional to the amount of alkaline phosphatase
present in the brain homogenate, and therefore the activity of the enzyme can be
calculated.
Determination of protein concentration
Prior to alkaline phosphatase assay, protein concentration of capillary depleted brain and
capillary enriched tissues were determined with a commercial Pierce™ bicinchoninic acid
(BCA) Protein Assay Kit (Thermo Fisher, UK). A set of known concentrations of bovine
serum albumin (BSA) in 0.9 % NaCl were prepared and the absorbance of each sample
was read on a microplate reader (540 nm). A standard curve of absorbance against BSA
concentration was constructed just prior to measurements of samples (Figure 2.1.11).
Capillary depleted brain and capillary enriched tissues (25 µL) were pipetted into a 96-well
microplate. Reaction reagent (200 µL) composed of reagent A and reagent B at 50 to 1
ratio was added to each well and the plate was mix thoroughly on a plate shaker for 30
seconds. The plate was covered and incubated at 37 °C for 30 minutes and the
absorbance was measured at 540 nm on a plate reader. The amount of protein in brain
samples was calculated based on linear equation derived from BSA standard curve.

CHAPTER 2: MATERIALS AND METHODS
70
0 5 0 0 1 0 0 0 1 5 0 0 2 0 0 0 2 5 0 0
0 .0
0 .5
1 .0
1 .5
y = 0 .0 0 0 5 x + 0 .0 3 4 4
r2
= 0 .9 9 7 6
B S A (g /m L )
Ab
so
rb
an
ce
at
57
0 n
m
Figure 2.1.11: Typical BSA standard curve obtained from BCA protein assay.
Data analysed by least-square regression analysis (GraphPad Prism 7 Software).
Alkaline phosphatase assay
Reaction mixture (500 µL) contained 50 mM MgCl2, 5 mM CaCl2, 100 mM KCl, 100 mM
Tris (pH 9) and 5 mM pNPP. The reaction was initiated by adding 50 µL of capillary
depleted brain or capillary enriched tissues (0.5 mg/mL final concentration) and incubated
at 37 ºC for 30 minutes. At the end of the incubation time, the reaction was terminated with
500 µL NaOH (1 M) and put on ice for 10 minutes. The absorbance was taken at 405 nm
in a final volume of 300 µL against a blank (reaction mixture with capillary depleted
brain/capillary rich fraction was replaced with water).
The concentration of pNP formed in the reaction mixture was determined by substituting
the absorbance in the linear equation obtained from pNP standard curve (Figure 2.1.12)
constructed from absorbance reading at 405 nm of pNP concentration between 0.04 to
0.7 mM.

CHAPTER 2: MATERIALS AND METHODS
71
0 .0 0 .2 0 .4 0 .6 0 .8
0
1
2
3
y = 3 .9 0 6 6 x - 0 .0 5 0 1
r2
= 0 .9 9 9 9
pN P (m M )
Ab
so
rb
an
ce
at
40
5 n
m
Figure 2.1.12: Typical pNP standard curve obtained from alkaline phosphatase enzyme
assay.
Data analysed by least-square regression analysis (GraphPad Prism 7 Software).
The alkaline phosphatase specific activity was calculated as followed:
𝐴𝑃 (𝑛𝑚𝑜𝑙/𝑚𝑖𝑛/𝑔) =𝑝𝑁𝑃 (𝑢𝑀)
𝑡 (min) X protein (mg/mL) 𝑋 1000 Equation 2.2.2
Alkaline phosphatase specific activity in capillary enriched pellet was greater than capillary
depleted brain by 37-fold (Figure 2.1.13). The percentage purity of capillary separation
from brain homogenate was 96.68 % based on alkaline phosphatase specific activity, thus
confirming the separation using dextran density differential centrifugation (Moos and
Morgan, 2001, Triguero et al., 1990).
Cd
Cap
0
1 0
2 0
3 0
4 0
5 0***
Alk
ali
ne
ph
os
ph
ata
se
ac
tiv
ity
(nm
ol/
min
/g)
Figure 2.1.13: Alkaline
phosphatase specific activity in
capillary depleted brain (Cd) and
capillary enriched pellet (Cap).
Individual brain was taken from in situ
brain perfused rats. Capillary enriched
pellet (Cap) shows higher alkaline
phospatase activity compared to
capillary depleted brain (Cd). Data are
expressed as mean+SEM (n=6 rats).
*** P<0.001 (paired t-test, one-tailed).

CHAPTER 2: MATERIALS AND METHODS
72
Quantification analysis of in situ brain perfusion samples
Samples prepared after in situ brain perfusion were analysed by liquid scintillation
spectroscopy (LSS) counter and high-performance liquid chromatography (HPLC) to
quantify HPO and radiolabelled compounds.
Liquid-scintillation spectroscopy (LSS)
3H-OMG and 14C-sucrose (Perkin Elmer®, USA) activity were counted on a LSS counter
(LKB Wallac 1219 Rackbeta, Wallac, USA). The LSS counter was pre-programmed in the
computer memory to correct automatically the preparation errors for newly quenched
samples. The radioactivity was expressed as disintegration per minute (DPM).
High-performance liquid chromatograpy (HPLC)
i) Calibration curve
Standard solutions of HPOs ranging from 5 to 1000 µM were prepared by serial dilution
from a 5000 µM stock dissolved in HPLC water.
ii) Quantification of hydroxypyridinones (HPOs) by HPLC
HPOs concentrations were evaluated by a gradient ion-pair HPLC method. The
quantification method was provided by Dr Sukhvinder Bansal from Institute of
Pharmaceutical Science, King’s College London. Two mobile phase systems compose of
10% (v/v) acetonitrile in water (mobile phase A) and 90% (v/v) acetonitrile in water (mobile
phase B) with 1 g/L pentadecafluorooctanoic acid as the ion-pair reagent in each mobile
phase were used to separate the HPOs.
The quantification was performed on an Ultimate 3000 Standard LC Systems equipped
with quaternary pump delivery system (LPG-3400SD), autosampler (WPS-3000(T)SL
Analytical) and multi-wavelength detector (3000 VWD).
Thirty microliters (30 µL) of each sample was injected into Poroshell 120 EC-C18
reversed-phase column, 2.7 µm particle size, 2.1 x 50 mm diameter and length
manufactured by Agilent (Cat no. 699775-902). The pump flow rate was set at 0.2 mL/min
and HPO separation was obtained with a mobile phase B gradient starting at 10% B, rising

CHAPTER 2: MATERIALS AND METHODS
73
to 90% over 10mins, held for 3 mins and falling back to 10% over 2 mins (Figure 2.1.14).
The total running time was 25 minutes including equilibration time for the column at 10 %
B 10 minutes before the next injection. HPOs eluted from the column were detected at
280 nm wavelength.
Figure 2.1.14: HPLC gradient method for a successful separation of HPOs. Mobile phase B
contained 90 % (v/v) acetonitrile in water with 1 g/L pentadecafluorooctanoic and 0.01 % (v/v)
formic acid.
The peak integrations and data analysis were performed using Chromeleon 6.8
Chromatography Data System (Figure 2.1.15). The peak height (H) signal of
concentration-known HPO chromatogram was used to construct the calibration curve
(Figure 2.1.16). The peak height (H) signal of HPO chromatogram for in perfusate, brain
homogenate and capillary depleted brain was multiplied with the dilution factor (Table
2.1.4). The corrected value was converted to concentration in µM based on the
constructed calibration curve.
Table 2.1.4:Total dilution of in situ brain perfusion samples before injected into HPLC
Samples Dilution factor
(DF)
Perfusate 5.5
Brain homogenate 4.4
Capillary depleted brain 4.4

CHAPTER 2: MATERIALS AND METHODS
74
0 5 1 0 1 5 2 0 2 5
-5 0 0
0
5 0 0
1 0 0 0
1 5 0 0
2 0 0 0
T im e (m in )
He
igh
t (m
.AU
)
W VL:280nm
CP
20
a ) b )
c ) d )
0 5 1 0 1 5 2 0 2 5
-5 0 0
0
5 0 0
1 0 0 0
1 5 0 0
2 0 0 0
T im e (m in )
He
igh
t (m
.AU
)W VL:280nm
CP
20
0 5 1 0 1 5 2 0 2 5
-5 0 0
0
5 0 0
1 0 0 0
1 5 0 0
2 0 0 0
T im e (m in )
He
igh
t (m
.AU
)
W VL:280nm
CP
20
0 5 1 0 1 5 2 0 2 5
-5 0 0
0
5 0 0
1 0 0 0
1 5 0 0
2 0 0 0
T im e (m in )
He
igh
t (m
.AU
)
W VL:280nm
CP
20
Figure 2.1.15: Representative chromatogram for CP20. a) 500 µM standard b) brain homogenate c) capillary depleted brain and d) perfusion fluid from
rat perfused with 500 µM CP20 for 20 minutes. CP20 retention time was ~8.3 minute. m.AU: mili-
absorption unit.
0 2 0 0 4 0 0 6 0 0 8 0 0 1 0 0 0 1 2 0 0
0
4 0 0
8 0 0
1 2 0 0
1 6 0 0
y = 1 .4 6 8 x + 4 .0 0 5
r2
= 0 .9 9 9 9
C P 2 0 ( M )
He
igh
t (m
.AU
)
Figure 2.1.16: Representative calibration curve for CP20 prepared in HPLC water.
m.AU: mili-absorption unit. Data was analysed by least-square linear regression analysis
(GraphPad Prism 7 Software).

CHAPTER 2: MATERIALS AND METHODS
75
iii) Recovery study for HPOs
Recovery studies of HPOs from brain tissues and perfusion fluid was performed since the
standard calibration curve was prepared in HPLC water. HPOs working stock (450 µM)
were prepared in water. The working stock was spiked into HPLC water, pooled brain
homogenate or perfusate in triplicate at 1:14 (v/v) dilution (final = 30 µM). TFA was added
so that its final concentration in the solution was 10% (v/v). All of the samples were mixed
and centrifuged at 20800 g for 45 minutes. The supernatant was taken and analysed by
HPLC as described in Section 2.1.7a ii. Percentage recovery was calculated as showed
in Equation 2.1.3.
𝑅𝑒𝑐𝑜𝑣𝑒𝑟𝑦 (%) =𝐻𝐵𝑟 𝑜𝑟 𝐻𝑃𝑓
𝐻𝑤𝑎𝑡𝑒𝑟 𝑋 100 Equation 2.1.3
Where HBr is the peak height of HPO chromatogram in brain homogenate, HPf is the peak
height of HPO chromatogram in perfusion fluid and Hwater peak height of HPO
chromatogram in water.
The sample extraction step was a crucial part in HPLC analysis of biological samples to
precipitate proteins and release HPO from the association of biological matrices protein
and lipid into the solution (Alshammari et al., 2015). CP20, FCF132, CN116 and CN118
in perfusion fluid and brain samples showed between 88-100% recovery (Table 2.1.5).
CN126 and CN128 were showed 80-86 % recovery from perfusate and 64-70% from brain.
CP84, CN226 and CN228 showed the least recovery among all of the HPOs tested (61-
65% recovered). As showed in Table 2.1.5, recovery from perfusion fluid was equal to or
higher than recovery from brain homogenate. The percentage recovery for all of the HPOs
were corrected when the peak height signal of HPO chromatograms was converted to
concentration using a constructed standard calibration curve.

CHAPTER 2: MATERIALS AND METHODS
76
Table 2.1.5: Percentage (%) recovery of HPOs extracted with 10% (v/v) TFA from spiked
perfusion fluid and brain homogenate.
HPOs % Recovery
Perfusion fluid Brain
CP20 95.3±2.8 87.7±1.2
CP84 68.7±4.6 62.0±12.7
FCF132 104.0±3.5 104.7±3.3
CN116 104.7±0.9 102.3±0.9
CN118 94.0±3.6 95.3±0.3
CN126 79.7±2.3 64.3±3.2
CN128 85.6±5.8 70.7±4.2
CN226 65.0±4.0 50.7±2.3
CN228 60.7±3.7 50.7±0.7
Data are expressed as mean±SEM (n=3 independent samples).
Determination of unbound HPO in brain, plasma and perfusion
fluid
The NRS perfusion fluid contained the physiological concentration of bovine serum
albumin (40 g/L BSA; Section 2.1.3). Therefore, it is imperative to determine the extent of
HPO binding to BSA as only unbound HPO would be able to cross the BBB (Hammarlund-
Udenaes et al., 2008, Friden et al., 2007). In addition, HPO binding in brain tissue was
also evaluated.
The method reported by Summerfield et al. (2007) was followed to determine the fraction
of HPO unbound in brain, plasma and perfusion fluid. Evaluation of unbound HPO was
performed in a separate in vitro experiment, as the bound HPO releases during sample
processing and extraction with TFA due to protein denaturation (Section 2.1.7). 3H-OMG
and 14C-sucrose has been reported to not significantly bind to plasma protein at low
concentrations (Mereish et al., 1982, Chinachoti and Steinberg, 1988). Brain from control
rats were used to prepare a whole brain homogenate at 1:3, 1:7 and 1:15 (w/v) dilutions.
Degree of dilutions did not affect the degree of HPOs binding to protein; therefore, brain
diluted 1:3 (w/v) was used for all experiments (Table 2.1.6).

CHAPTER 2: MATERIALS AND METHODS
77
Table 2.1.6: Effects of brain homogenate dilution on the detection of free, unbound CP20 in
brain tissue
Brain dilution factor (w:v) CP20
% unbound
1:3 103.1±0.7
1:7 104.3±1.8
1:15 104.0±3.5
CP20 was spiked into a diluted pooled brain homogenate. Data are expressed as mean±SEM (n=
3 tubes). Statistical analysis using one way ANOVA showed no significant different.
Blood was collected from control rats by cardiac puncture with 21G needle attached to 5
mL syringe. The collected whole blood was transferred into heparinised tube and spun at
5400 g for 20 minutes; the supernatant which is the plasma was isolated and kept frozen
until use. Perfusion fluid was prepared by supplementing NRS with 10 mM glucose and
40 g/L BSA as described in Section 2.1.3. HPO stock solution (1800 µM) was spiked into
whole brain homogenate, plasma, perfusion fluid and distilled H2O (as a control) in a ratio
of 1:10 to give a final HPO concentration of 180 µM. The tubes were mixed with vortex
mixer and incubated in a shaking water bath at 37 °C for 20 minutes before transferred
into Vivaspin® tubes (2 kDa MWCO; GE Healthcare Life Sciences, UK). Vivaspin® tubes
were spun at 3000 g for 20 minutes and the filtrate collected at the bottom collector of
Vivaspin® tube was analysed by HPLC. The percentage of HPO unbound to protein in
brain homogenate, plasma and perfusate, was calculated as showed in Equation 2.1.4.
% 𝑢𝑛𝑏𝑜𝑢𝑛𝑑 =𝐶𝑓
𝐶𝑐 𝑋 100 Equation 2.1.4
Where Cf = concentration of HPO in filtrate (µM) and Cc = concentration of HPO for control (µM).
The extent of unbound HPO in perfusion fluid was compared with pooled rat plasma as
showed in Figure 2.1.17. There was no difference between plasma and perfusion fluid
unbound concentration for all of the HPOs tested. Indeed, it has generally been accepted
that plasma albumin primarily governs the binding of drug in blood circulation (Gurevich,
2013, Weiss et al., 2006, Smith et al., 2010, Bohnert and Gan, 2013). This justifies the
addition of physiological concentration of BSA (40 g/L) into the normal Ringer’s solution
for brain perfusion to mimic in vivo plasma content (Table 2.1.1). FCF132, CN116 and
CN118 showed no or limited binding in plasma and perfusion fluid (86–100% unbound

CHAPTER 2: MATERIALS AND METHODS
78
concentration). CP84, CN126, CN128 and CN228 were between 54–69% unbound in
plasma and perfusion fluid. CN228 and CP20 have 50% or less in unbound state in
plasma and perfusion fluid with CP20 in perfusion fluid showed the least unbound (45%).
For all of the HPOs evaluated, percentage unbound in perfusion fluid was always less than
percentage unbound in plasma although this was not significantly different.
CP
20
CP
84
FC
F132
CN
116
CN
118
CN
126
CN
128
CN
226
CN
228
0
5 0
1 0 0
1 5 0
HP
Os
un
bo
un
d
(%)
*** **
***
***
P e r fu s io n f lu id
P la s m a
B ra in
Figure 2.1.17: Percentage of free-unbound HPOs in perfusate, plasma and brain
homogenate.
HPO were spiked into pooled diluted [1:3 (w/v) dilution] brain homogenate. Data are expressed as
mean+SEM. n=3 different determinations. No significant different P> 0.05 (plasma vs perfusion
fluid; unpaired t-test, two-tailed),** P< 0.01, *** P< 0.001 (perfusion fluid vs brain; unpaired t-test,
two-tailed).
CP20, FCF132 and CN116 showed 100% unbound in the brain (Figure 2.1.17). CP84,
CN118, CN128, CN226 and CN228 were moderately unbound in brain (62–68%). CN126
showed the least unbound among all other HPO in the brain (57%). As opposed to drug
binding to albumin in blood, drug binding in brain is primarily governed by the lipid
constituent of brain tissues. This is because, brain has a lower composition of protein (8%
vs 18%) and higher lipid composition than blood (11% vs 0.7%; Jeffrey and Summerfield,
2007). CP20, CN116 and CN226 unbound concentration in brain was higher by 2-fold,
1.2-fold and 1.4-fold respectively than perfusion fluid. In contrast, CN118 unbound in brain
was 1.3-fold lower than in perfusion fluid. Other HPO (CP84, FCF132, CN126, CN128 and
CN228) showed the same degree of binding in perfusion fluid and brain. The fraction of

CHAPTER 2: MATERIALS AND METHODS
79
HPO unbound was taken into account during brain uptake calculation as was described in
Section 2.1.10.
In order to see any relationship between free, unbound HPO with lipophilicity (cLogP),
regression analysis was performed on the unbound HPO against cLogP plot. The
percentage unbound HPO in plasma, perfusion fluid and brain homogenate were less as
the lipophilicity constant (cLogP) increased (Figure 2.1.18).
-1 .5 -1 .0 -0 .5 0 .0 0 .5 1 .0 1 .5
0
5 0
1 0 0
1 5 0
C P 2 0
F C F 1 3 2C N 1 1 8
C N 1 1 6
C N 1 2 8
C N 1 2 6
C P 8 4
C N 2 2 8
C N 2 2 6
r2
= 0 .2 6 1 6
D F d = 2 5
P = 0 .0 0 6 4
Un
bo
un
d H
PO
s
(%)
-1 .5 -1 .0 -0 .5 0 .0 0 .5 1 .0 1 .5
0
5 0
1 0 0
1 5 0
F C F 1 3 2
C P 2 0
C N 1 1 8
C N 1 1 6 C N 1 2 8
C N 1 2 6
C N 2 2 8
C N 2 2 6C P 8 4
r2
= 0 .1 8 8 8
D F d = 2 5
P = 0 .0 2 3 5
-1 .5 -1 .0 -0 .5 0 .0 0 .5 1 .0 1 .5
0
5 0
1 0 0
1 5 0
F C F 1 3 2C P 2 0 C N 1 1 6
C N 1 1 8
C N 1 2 8
C N 1 2 6
C N 2 2 6
C N 2 2 8
C P 8 4
r2
= 0 .6 3 3 7
D F d = 2 5
P < 0 .0 0 0 1
c L o g P
Un
bo
un
d H
PO
s
(%)
a ) P la s m a b ) P e r fu s io n f lu id
c ) B ra in
Figure 2.1.18: Relationship between free unbound HPO with HPO cLogP.
Unbound HPO were plotted against HPO lipophilicity (cLogP). Black circle () represents unbound HPO in graphs a) pooled plasma, b) perfusion fluid and c) pooled brain homogenate. Black dotted line (…) represents best-fit line for regression analysed on compounds represented by black circle () in graph a), b) and c). HPO cLogP were obtained using a ChemDraw Software version 15.1. Data are expressed as mean±SEM (n=3 tubes). Significant difference for linear regression analysis was set at P<0.05. Co-efficient of variation (r2), degree of freedom (df; 25) and P values were calculated
using linear-regression analysis (GraphPad Prism 7 Software).
The relationship was strongest in the brain followed by plasma while perfusion fluid
showed the weakest relationship with cLogP. In plasma and perfusion fluid, unbound
CP20 was the outlier that contributed to a weaker relationship with cLogP. cLogP has been

CHAPTER 2: MATERIALS AND METHODS
80
shown to be the dominant factor in determining the brain tissue binding due to its higher
lipid content than blood (Wan et al., 2007, Jeffrey and Summerfield, 2007).
In summary, it can be concluded that there was a significant inverse relationship between
the degree of HPO cLogP and unbound HPO in plasma, perfusion fluid and brain
homogenate that was going to influence the total uptake of HPO into the brain.
Brain uptake calculation
3H-OMG and 14C-sucrose
Disintegration per minute (DPM) was taken to show the rate of radioactive decay. Total
brain uptake (Rtotal) of 14C-sucrose and 3H-OMG was calculated by finding a ratio between
concentration in whole brain (CBr) or capillary depleted brain (CCd) (DPM/g) and
concentration in perfusate, CPf (DPM/mL), Equation 2.1.5.
𝑅𝐵𝑟,𝑡𝑜𝑡𝑎𝑙 𝑜𝑟 𝑅𝐶𝑑,𝑡𝑜𝑡𝑎𝑙 (𝑚𝐿/𝑔) =𝐶𝐵𝑟 𝑜𝑟 𝐶𝐶𝑑 (𝐷𝑃𝑀/𝑔)
𝐶𝑃𝑓 (𝐷𝑃𝑀/𝑚𝐿) Equation 2.1.5
Similarly, 14C-sucrose confined in vasculature was also calculated, Equation 2.1.6.
𝑅𝑠𝑢𝑐𝑟𝑜𝑠𝑒(𝑚𝐿/𝑔) =𝐶𝑠𝑢𝑐𝑟𝑜𝑠𝑒 (𝐷𝑃𝑀/𝑔)
𝐶𝑃𝑓 (𝐷𝑃𝑀/𝑚𝐿) Equation 2.1.6
Rsucrose were subtracted from RBr,total and RCd,total to give a net brain uptake, RBr or RCd,
Equation 2.1.7.
𝑅𝐵𝑟 𝑜𝑟 𝑅𝐶𝑑(𝑚𝐿/𝑔) = 𝑅𝐵𝑟, 𝑡𝑜𝑡𝑎𝑙 𝑜𝑟 𝑅𝐶𝑑, 𝑡𝑜𝑡𝑎𝑙 − 𝑅𝑠𝑢𝑐𝑟𝑜𝑠𝑒 Equation 2.1.7
The rate of brain uptake Kin, was calculated only for capillary depleted brain dividing with
total perfusion time in minute (t), Equation 2.1.8.
𝐾𝑖𝑛,𝐶𝑑 (𝑚𝐿/𝑔/𝑚𝑖𝑛) =𝑅𝐶𝑑 (𝑚𝐿/𝑔)
𝑡 (𝑚𝑖𝑛) Equation 2.1.8
Figure 2.1.19 showed the example of brain uptake calculation for 3H-OMG.

CHAPTER 2: MATERIALS AND METHODS
81
Figure 2.1.19: Example of calculation for 3H-OMG RCd and Kin,Cd.
HPO
HPO percentage unbound in perfusion fluid and brain was determined in vitro as described
in Section 2.1.10. Total brain uptake (RBr, total and RCd, total) was calculated by finding a ratio
between concentration in whole brain (CBr) or capillary depleted brain (CCd) (nmol/g) and
concentration in perfusate (CPf) (nmol/mL).
𝑅𝐵𝑟, 𝑡𝑜𝑡𝑎𝑙 𝑜𝑟 𝑅𝐶𝑑, 𝑡𝑜𝑡𝑎𝑙 (𝑚𝐿/𝑔) =𝐶𝐵𝑟 𝑜𝑟 𝐶𝐶𝑑 (𝑛𝑚𝑜𝑙/𝑔)
𝐶𝑃𝑓 (𝑛𝑚𝑜𝑙/𝑚𝐿) Equation 2.1.9
Rsucrose were subtracted from RBr,total and RCd,total to give a net brain uptake, RBr or RCd, as
described in Equation 2.1.7.
HPO concentration in perfusion fluid were corrected for percentage unbound as only free
HPO were able to cross the BBB. Net brain uptake corrected for HPO unbound in
perfusate (RBr,u and RCd,u) was calculated by dividing with percentage HPO unbound in
perfusate (Pfu).
𝑅𝐵𝑟,𝑢 𝑜𝑟 𝑅𝐶𝑑,𝑢 (𝑚𝐿/𝑔) =𝑅𝐵𝑟 𝑜𝑟 𝑅𝐶𝑑 (𝑚𝐿/𝑔)
𝑃𝑓𝑢 Equation 2.1.10
CHAPTER 2: MATERIALS AND METHODS
82
RBr,u and RCd,u described the transport properties at BBB and brain affinity towards HPO.
RCd,u was used to calculate the rate of brain uptake, Kin,Cd,u by dividing with the total
perfusion time in minute (t) as described by Equation 2.1.11.
𝐾𝑖𝑛,𝐶𝑑,𝑢 (𝑚𝐿/𝑔/𝑚𝑖𝑛) =𝑅𝐶𝑑, 𝑢 (𝑚𝐿/𝑔)
𝑡 (𝑚𝑖𝑛) Equation 2.1.11
Additionally, both HPO concentration in perfusate and capillary depleted brain were
corrected for percentage unbound and described as RCd,uu (Equation 2.1.12).
𝑅𝐶𝑑,𝑢𝑢 (𝑚𝐿/𝑔) = 𝑅𝐶𝑑 𝑋 𝐵𝑟𝑢
𝑃𝑓𝑢 Equation 2.1.12
RCd, uu was used to describe the extent of distribution of unbound HPO in brain tissue. RCd,
uu was used to calculate the rate of brain uptake, Kin,cd,uu by dividing with the total perfusion
time in minute (t) as described by Equation 2.1.13.
𝐾𝑖𝑛,𝐶𝑑,𝑢𝑢 (𝑚𝐿/𝑔/𝑚𝑖𝑛) =𝑅𝐶𝑑, 𝑢𝑢 (𝑚𝐿/𝑔)
𝑡 (𝑚𝑖𝑛) Equation 2.1.13
The concepts of these brain uptake parameters are explained in more detailed in the
following Section (Section 2.1.11). Figure 2.1.20 showed the example of brain uptake
calculation for CP20.

CHAPTER 2: MATERIALS AND METHODS
83
Figure 2.1.20: Example of calculation for CP20 RCd,u and Kin,Cd,u
Concepts and description of brain uptake parameters
Two main brain uptake parameters arises from the brain uptake calculation for HPO
(Section 2.1.11) namely brain uptake from unbound compound in perfusate, in whole
brain (RBr,u) and in capillary depleted brain (RCd,u). RBr,u includes total brain uptake in brain
capillary endothelial cells (BCEC) and brain parenchyma. RCd,u is total brain uptake in brain
parenchyma only since BCEC was removed through differential centrifugation with 15%
(w/v) dextran (Section 2.1.7). Differences between RBr,u and RCd,u showed the degree of
trapping of compound in BCEC (Triguero et al., 1990). Compounds trapped in BCEC were
not considered as to have crossed the BBB since BCEC is the component of the BBB
itself. Therefore, it was important to evaluate this phenomenon to avoid false positive
results.
RCd,u describes the transport properties at BBB and the affinity of brain for HPO (Loryan et
al., 2016, Hammarlund-Udenaes et al., 2008, Friden et al., 2007). Correction for HPO

CHAPTER 2: MATERIALS AND METHODS
84
unbound in both perfusate and in capillary depleted brain give rise to another parameter,
RCd,uu that is independent of binding to protein and lipid. This parameter describes the
distribution of unbound HPO in brain tissue at the terminal perfusion time point. Therefore,
this parameter is useful in describing the level of pharmacologically unbound (presumed
to be active) HPO in brain tissue (Loryan et al., 2016, Hammarlund-Udenaes et al., 2008,
Friden et al., 2007). In summary, RCd,u and RCd,uu parameters were used in this thesis to
describe the brain uptake at the BBB and to calculate the rate of brain uptake (Kin,Cd,u and
Kin,Cd,uu).
Patlak plot
RBr, u total and RCd, u total was plotted against multiple terminal perfusion times to determine
the linearity of brain uptake as described by Patlak (Patlak et al., 1983, Patlak and
Blasberg, 1985). Linear regression analysis was performed on the linear portion of the
points and the linear equation, y = mx + C was expressed as:
𝑅𝑡 = 𝐾𝑖𝑛 (𝑡) + 𝑉𝑉𝑎𝑠 Equation 2.1.13
Where Rt is the total brain uptake at time t, Kin is the unidirectional rate constant, t is the
perfusion time and Vvas is the vascular luminal space of brain capillaries. Figure 2.1.21
showed a Patlak plot for CP20. CP20 showed a linear brain uptake up to 60-minute
perfusion. Linear regression analysis using all the point gives a linear equation y = 1.265x
+ 2.819. This showed that Kin and vascular space expressed respectively as
mass/volume/time and volume/mass were 12.65 µL/min/g and 0.028 mL/g.

CHAPTER 2: MATERIALS AND METHODS
85
0 2 0 4 0 6 0
0
2 0
4 0
6 0
8 0
1 0 0
y = 1 .2 6 5 x + 2 .8 1 9
r2
= 0 .6 6 5 3
P e rfu s io n t im e
(m in u te s )
RC
d,u
,to
tal
(%
)
Figure 2.1.21: Example of Patlak plot for CP20 in rat brain.
Each point represents RCd, u for CP20 plotted against respective terminal perfusion time. The data
was not corrected for Rsucrose. Each point represents the mean±SEM (n=3-10 rats). Data was
analysed by least square regression analysis (GraphPad Prism 7 Software). Degrees of freedom
(Df; n-2) = 26.
Linearity of brain uptake
It is important to determine the linearity of brain uptake especially for HPO since the rate
of brain uptake can only be reliably measured before HPO reaching the steady-state (SS)
concentration in the brain. RBr,u,total and RCd,u,total for 5, 10, 20, 40 and 60 minutes were
plotted as a Patlak plot as showed in Figure 2.1.22. Both brain uptake profiles are not
significantly different from each other, which indicate no significant trapping of HPO in the
BCEC (Triguero et al., 1990). RCd,u showed brain uptake beyond the BBB, and thus was
explained further in the following paragraph.

CHAPTER 2: MATERIALS AND METHODS
86
a ) R B r ,u u ,to ta l b ) R C d ,u u ,to ta l
0 2 0 4 0 6 0
0
2 0
4 0
6 0
8 0
1 0 0
C P 2 0
3H -O M G
1 4C -s u c ro s e
P e rfu s io n t im e
(m in u te s )
Bra
in u
pta
ke
(%
)
0 2 0 4 0 6 0
0
2 0
4 0
6 0
8 0
1 0 0
C P 2 0
3H -O M G
1 4C -s u c ro s e
P e rfu s io n t im e
(m in u te s )
Figure 2.1.22: Patlak plot for 3H-OMG, CP20 and 14C-sucrose in rat brain.
a) RBr,u,total for 3H-OMG, CP20 and 14C-sucrose was plotted against multiple perfusion times. b) RCd,
u,total for 3H-OMG, CP20 and 14C-sucrose was plotted against multiple perfusion times. Blue square
() represents brain uptake for 3H-OMG. Red circle () represents brain uptake for CP20. Green
triangle (∆) represents brain uptake for 14C-sucrose. Data are expressed as mean±SEM (n=3-18
rats). The blue line represent best-fit of data at multiple perfusion time (5, 10 and 20 minutes) while
the red and green lines represent best-fit of data at multiple perfusion time (5, 10, 20, 40 and 60
minutes) analysed by linear regression analysis (GraphPad Prism 7 Software). The dotted blue
line represent the best-fit of data at multiple perfusion time analysed by non-linear fit analysis
(competitive inhibition, GraphPad Prism 7 Software).
14C-sucrose
The range of vascular space values during 5 to 60 minutes in situ brain perfusion were
between 0.01-0.02 mL/g. This correspond with previously reported studies which showed
14C-sucrose vascular space fell between 0.01-0.04 mL/g (Triguero et al., 1990, Zlokovic
et al., 1994, Pardridge et al., 1990).14C-sucrose was used as a negative control to confirm
the integrity of the BBB because of it hydrophilicity and the lack of specific carrier at the
BBB which render it to confine only in the vascular space (Ennis and Betz, 1986).
Additionally, 14C-sucrose was also employed as a vascular space marker to differentiate
between brain capillary lumen space and brain parenchyma space after brain
homogenisation take place (Triguero et al., 1990, Lockman et al., 2003). Selection of
vascular space marker with suitable molecular weight is important to represent the
vascular space of co-administered HPO. 14C-sucrose has a molecular weight of 342.3
g/mol. The molecular weight falls within the range of tested compounds [3H-OMG (194

CHAPTER 2: MATERIALS AND METHODS
87
g/mol) and hydroxypyridinones (139 to 363 g/mol)] making 14C-sucrose appropriate as a
vascular space marker in this study.
3H-OMG
3H-OMG showed a linear uptake up to 20-minutes perfusion before reaching plateau
afterwards. Maximum 3H-OMG accumulated uptake was approximately 29% of the
concentration perfused (Figure 2.1.22b). 3H-OMG is a substrate for glucose transporter
(GLUT1) and was employed as a positive control and as a functional indicator of intact
BBB in respect of carrier-mediated transporter. As with the 14C-sucrose, 3H-OMG is a
hydrophilic compound which would not crossed the BBB. However, GLUT1 carrier was
expressed at the BBB to transport glucose from blood to brain down the concentration
gradient (Reyes et al., 2002). 3H-OMG is a non-metabolised derivative of glucose, thus
make it suitable for quantification for brain uptake via GLUT1 transporter (Jay et al., 1990).
CP20
Since the novel HPO were designed based on CP20 structure, it was used as a model of
HPO brain uptake. CP20 uptake was linear for up to 60-minutes perfusion time. Maximum
accumulated brain uptake at the terminal time point (60 minutes) was approximately 80%
of the concentration perfused (Figure 2.1.22b). CP20 showed increase accumulation in
the brain over the perfusion time (5 to 60 minutes) confirming the linearity of the brain
uptake for reliable determination of Kin. CP20 has been previously reported to penetrate
the brain (Fredenburg et al., 1996, Roy et al., 2010). Indeed, a ground-breaking pilot
clinical study in Parkinson’s disease patients that were administered with 30 mg/kg/day
for 36 months attenuates disease symptoms and analysis with T* MRI showed a reduction
of iron in basal ganglia, demonstrating that deferiprone entered the brain to chelate and
re-distributed iron (Abbruzzese et al., 2011).
Regression analysis performed on 3H-OMG and CP20 Patlak plot revealed that the rate
of uptake in the capillary depleted brain were 10.2 and 12.7 µL/min/g respectively (Table
2.1.7). The vascular space (Vvas) obtained from the y-intercept of least-square linear
regression analysis for 3H-OMG and CP20 agreed with the published data (Roy et al.,
2010, Triguero et al., 1990, Zlokovic et al., 1994, Pardridge et al., 1990).

CHAPTER 2: MATERIALS AND METHODS
88
Table 2.1.7:Rate of brain uptake in capillary depleted brain for 3H-OMG and CP20, and the
respective brain vascular space derived from linear regression analysis on Patlak plot
(Figure 2.23b).
14C-sucrose 3H-OMG CP20
Kin,Cd,u (µL/min/g) 0.2±0.1 10.2±1.9 12.7±1.8
Vvas (mL/g) 0.01±0.38 0.03±0.06 0.03±0.02
Vvas (%) 1.0 3.0 3.0
r2 0.0671 0.5835 0.6653
p 0.1216 < 0.0001 < 0.0001
df (n-2) 35 20 26
Least-square linear regression analysis was performed on the linear portion of Patlak plot in Figure
2.2.22b. Linear portion for 3H-OMG was from 5 to 20 minutes perfusion. Linear portion for CP20
and 14C-sucrose was from 5 to 60 minutes perfusion. 14C-sucrose Kin,Cd,u showed rate of distribution
in brain capillary lumen rather than brain uptake. Data are expressed as mean±SEM (n=22-37
rats). p< 0.001 compared to CP20 (one-way ANOVA followed by Tukey’s multiple comparison test).
Significant difference for linear regression analysis was set at P<0.05. Co-efficient of variation (r2),
degree of freedom (df: n-2) and p values were calculated using linear-regression analysis
(GraphPad Prism 7 Software).
Base on multiple times point uptake presented in Figure 2.1.22b, 20 minutes was selected
as the terminal perfusion time point for other novel HPO iron chelators. This is because,
at 20 minutes, the brain uptake was still in the linear portion for a reliable estimation of Kin.
Furthermore, HPO accumulated in the brain at 20-minute time point give enough
sensitivity to be detected by HPLC-UV analysis. What most important is the vascular
space showed by 14C-sucrose and uptake of 3H-OMG at 20 minutes strongly suggest that
the BBB was physiologically intact and functional.
RCd, u, total for 20-minutes perfusion for 3H-OMG, CP20 and 14C-sucrose depicted in Figure
2.1.22b was extracted and plotted into bar graph as shown in Figure 2.1.23. The Rsucrose
that represent the capillary space was subtracted from 3H-OMG and CP20 RCd, u, total.
*** ***

CHAPTER 2: MATERIALS AND METHODS
89
0
1 0
2 0
3 0
c a p illa ry d e p le te d b ra in
Bra
in u
pta
ke
(%
)C P 2 0
3H -O M G
1 4C -s u c ro s e
C P 2 0 (c o r re c te d )
3H -O M G (c o rre c te d )
* * ** * * * * *
* * *
Figure 2.1.23: Brain uptake at 20-minutes perfusion time for 3H-OMG and CP20 in capillary
depleted brain before (RCd,u,total) and after (RCd,u) correction with 14C-sucrose vascular space.
Striped bar graphs depict brain uptake that was corrected for 14C-sucrose vascular space. Data are
expressed as mean±SEM (n=10-18 rats). ** P< 0.01, *** P< 0.001 compared to CP20 (corrected)
(one-way ANOVA followed by Dunnett’s test).
The initial rate of uptake (Kin,Cd,u) for 20 minutes was calculated as described in Section
2.1.11. The Kin,Cd,u obtained from 20-minute perfusion showed no different from the results
obtained from linear regression analysis of Patlak plot (Table 2.1.8). This strongly
suggests that the methods and analysis used in this study were validated where the Rsucrose
value reflecting the vascular space (Vvas) for CP20 derived from Patlak plot.
Table 2.1.8: Comparison between Kin,Cd,u for 3H-OMG and CP20 calculated by single-time
point (20 minutes) or regression analysis on Patlak plot (Figure 2.23b).
Kin,Cd,u (µL/min/g)
3HOMG CP20
Patlak plot 10.2±1.9 12.7±1.8
Single-time point 10.7±1.0 10.7±1.2
Data are expressed as mean±SEM (n=10-36 rats). Statistical analysis using showed no significant
different, p> 0.05 (unpaired t-test,two-tailed).
To summarise, in situ brain perfusion was validated prior to brain permeability evaluation
of novel HPO. These include measurement of pH, gas and ions in whole blood and
perfusate in rats. After in situ brain perfusion, brain was taken out and the blood capillary
associated with brain tissues was separated by density centrifugation with 15% (w/v)
dextran. Following this, alkaline phosphatase specific activity was assessed in some of

CHAPTER 2: MATERIALS AND METHODS
90
the capillary depleted brain to confirm the success of separation. HPO that get into the
brain after perfusion was extracted with 10 % (v/v) TFA. Recovery of HPO after extraction
with TFA in brain and perfusate samples was measured with HPLC quantification method.
Free-unbound concentration of HPO in perfusate and brain homogenate was evaluated in
separate in vitro experiment whereby HPO were incubated with perfusate (NRS) or naïve
rat brain homogenate followed by membrane-ultrafiltration. Results from this experiment
were used to correct for unbound HPO in perfusate and brain.
Experiment performed with CP20 at 5, 10, 20, 40 and 60 minutes showed linear uptake
with tight and functional BBB (Figure 2.1.22). Following this, in situ brain perfusion were
conducted in Male Wistar rats to evaluate permeability of novel HPO iron chelators using
20 minutes as the optimum perfusion time due to linearity of brain uptake and adequate
sensitivity for HPO measurement by HPLC-UV analysis.
Optimised and validated protocol for in situ brain perfusion
This section explained the final protocol used for in situ brain perfusion for evaluation of
novel HPO iron chelators, after optimisation and validation processes. Rats were
anaesthetised with 50 mg/kg ketamine and 0.2 mg/kg medetomidine, i.p., and maintained
at 37 °C using a heating pad (Figure 2.1.1). Whilst in a supine position, rats were injected
with 100,000 U/kg heparin (i.p). Local anaesthetic, lignocaine/adrenaline was then injected
subcutaneously (s.c.) at five multiple sites (total dose was 20 and 12.5 mg/kg) on the area
of the chest. Common carotid arteries on the left and right sides were isolated one at a
time. Two loose ligatures on the anterior and posterior part of each common carotid artery
were added. Sequentially, jugular veins on both sides were isolated with a pair of forceps
(Figure 2.1.2). Posterior loose ligature was tightened and a small incision with Vanna
scissors was performed just above the tightened ligation. Cannula with flowing oxygenated
NRS at 1.44 mL/min rate was inserted through the incision. At the same time, the jugular
vein was severed to allow the drainage of the perfusate. The anterior ligature was
tightened to secure the cannula in place. The NRS was allowed to perfuse for at least
three minutes to wash out the blood. The same procedure was repeated for the
contralateral common carotid artery.
Infusion of novel HPO iron chelators was started when both common carotid arteries were
cannulated with slow drive syringe pump that joined the main NRS circulation at 0.16

CHAPTER 2: MATERIALS AND METHODS
91
mL/min rate. The total flow rate that reach the end of the cannula was 1.6 mL/min. In situ
brain perfusion with iron chelators were performed for 20 minutes after which the cannulas
were removed from the arteries. Perfusate flowing out from the end of the cannulas were
collected every time after completion of brain perfusion. Following this the rats were
decapitated, and the brain was removed immediately for sample processing and analysis
as described previously in Section 2.1.7 and Section 2.1.8.

CHAPTER 2: MATERIALS AND METHODS
92
Determination of neurotoxins IC50 and HPO toxicity
for neuroprotection studies using neuroblastoma
cell lines (SH-SY5Y)
Introduction
In vitro models of Parkinson’s disease (PD) are often used as a preliminary tool in the
discovery of neuroprotection agents. The most utilised in vitro model of PD is the
dopaminergic neuroblastoma cell line, SH-SY5Y (Xicoy et al., 2017). It is widely employed
due to its catecholaminergic nature, which is relevant to the pathogenesis of PD in the
general population of PD patients (Hasegawa et al., 2003, West et al., 1977). Historically,
the SH-SY5Y cell line was derived from a third successive sub-clone (SH-SY → SH-SY5
→ SH-SY5Y) of metastatic bone tumour biopsy (SK-SN-SH) of a 4-year old female with a
neuroblastoma in 1973 (Kovalevich and Langford, 2013a). The SH-SY5Y cell line was
preferred as an in vitro tool in neuroprotection study over neuronal primary culture such
as primary mesencephalic cell or primary cortical neuron because of its ease of growing
in the laboratory, stability for higher passage number and with limited contamination with
glial cells (Xicoy et al., 2017). Furthermore, due to its wide acceptance and extensive use
among the research community, comparison and reference with other similar types of work
are possible.
Typically, in the in vitro PD model for neuroprotection study using SH-SY5Y, cells were
exposed to several different types of toxin to mimic the pathological event in vivo that lead
to cell death. Each toxin is unique in terms of mechanism that causes the cell death.
Therefore, selection of different types of toxins would give an insight into the way the
neuroprotective agents work. The current study employed hydrogen peroxide (H2O2), 6-
hydroxydopamine (6-OHDA), MG132 and iron [ferric nitrolotriacetate (FeNTA)] as
neurotoxins. This introduction section described the mechanism on how these neurotoxins
cause cell death.
H2O2
H2O2 is the most commonly used toxin to create oxidative stress in in vitro research. H2O2
is a ubiquitous molecule that is continuously produced during mitochondria respiration
(Giorgio et al., 2007). It is soluble in water and readily permeate biological membranes. In

CHAPTER 2: MATERIALS AND METHODS
93
the cell, H2O2 is produced either spontaneously or catalytically by superoxide dismutase
(SOD) from the superoxide radical (O2-) that is released specifically from the Complex I
or Complex III of the mitochondria respiratory chain. This endogenous molecule is
metabolised immediately after production by enzyme catalase, glutathione peroxidase
(GPx) or peroxiredoxin to water and/or molecular oxygen (Rocha et al., 2015). H2O2 per
se is mildly toxic relative to other neurotoxins, however, during oxidative stress, production
of H2O2 increases as catalase fails to inactivate H2O2 efficiently due to saturation of the
active site. In this situation, probability for H2O2 to react with endogenous iron via Fenton
reaction also increases (Reaction 2.2.1). The Fenton reaction occurs spontaneously to
produce highly reactive hydroxyl radical (OH-). In the presence of O2- that was
concomitantly produced as a by-product of mitochondria respiration, Fe3+ is reduced to
Fe2+ by Heber-Weiss reaction (Reaction 2.2.2). In this condition, a vicious cycle of OH-
production occurs.
𝐻2𝑂2 + 𝐹𝑒2+
→ 𝑂𝐻 ⋅− + 𝑂𝐻− + 𝐹𝑒3+ Reaction 2.2.1
𝑂2⋅− + 𝐹𝑒3+
→ 𝑂2 + 𝐹𝑒
2+ Reaction 2.2.2
OH- species primarily contributes to cell death by membrane lipid peroxidation that cause
disintegration of cells and by interaction with DNA that interrupts the production of
essential proteins. Loss of membrane integration disrupts the homeostatic balance of
physiological ions. In the case of mitochondria as the production site of the OH-, disruption
of mitochondrial membrane induces releases of mitochondrial Ca2+ into cytoplasm that
leads to activation of cell death. Similarly, the proximity of OH- production to mitochondrial
DNA might interfere with the expression of mitochondrial respiratory chain proteins that
exacerbates oxidative stress (Chinnery and Hudson, 2013). Besides the production of
OH- from H2O2 degradation, H2O2 on its own stimulates activation of intracellular
signalling pathways for cell death (Marinho et al., 2014). The combination of these cellular
events eventually leads to cell death.
6-OHDA
6-OHDA is a classical tool to model Parkinson’s disease pathology and was initially
thought to be a non-endogenous metabolite of dopamine (Jellinger et al., 1995).
Interestingly, it was later found in the brain and urine of Parkinsonian patients and is

CHAPTER 2: MATERIALS AND METHODS
94
believed to form by non-enzymatic hydroxylation of endogenous dopamine in the presence
of Fe2+ and H2O2; Reaction 2.2.3 (Andrew et al., 1993, Curtius et al., 1974).
𝐷𝑜𝑝𝑎𝑚𝑖𝑛𝑒 𝐻2𝑂2+ 𝐹𝑒
2+ → 6 − 𝑂𝐻𝐷𝐴 Reaction 2.2.3
6-OHDA is a metabolite of dopamine that is toxic to the dopaminergic cells by two distinct
but related mechanisms. The first mechanism directly generates ROS by auto-oxidation
with O2 forming p-quinone and O2- (Reaction 2.2.4) or through enzymatic conversion by
monoamine oxidase (MAO) forming H2O2 (Reaction 2.2.5) (Soto-Otero et al., 2000, Izumi
et al., 2005).
6 − 𝑂𝐻𝐷𝐴 𝑂2 → 𝑝 − 𝑞𝑢𝑖𝑛𝑜𝑛𝑒 + 𝑂2
⋅− Reaction 2.2.4
6 − 𝑂𝐻𝐷𝐴 𝑀𝐴𝑂 → 𝐷𝑂𝑃𝐴𝐶 + 𝐻2𝑂2 Reaction 2.2.5
The second mechanism is by direct inhibition of electron transport chain (ETC) in
mitochondrial (Glinka and Youdim, 1995, Glinka et al., 1998). Extracellular toxicity occurs
primarily by ROS generation through 6-OHDA metabolism, while intracellular toxicity
occurs by both ROS generation and ETC inhibition. Preliminary step of intracellular toxicity
relies on the expression of dopamine transporters (DAT) express on the axon terminal of
dopaminergic neurons (Lehmensiek et al., 2006, Storch et al., 2004). Inside the neuron,
6-OHDA either undergoes oxidative metabolism or directly inhibits Complex I and
Complex IV of mitochondrial respiratory chain (Glinka and Youdim, 1995). Inhibition of the
mitochondrial complexes generate more ROS that further exacerbates oxidative stress.
Several studies revealed that p-quinone, an electrophile formed from 6-OHDA auto-
oxidation (Reaction 2.2.4) might be the primary species that confers 6-OHDA toxicity
(Izumi et al., 2005, Villa et al., 2013). p-Quinone generated extracellularly can readily
penetrate the cell membrane and exert toxicity by forming protein-adduct with intracellular
proteins (Miyazaki et al., 2007). Furthermore, generation of p-quinone causes oxidative
stress through depletion of GSH and ATP levels (Villa et al., 2013). 6-OHDA can also
induce the release of iron bound to ferritin, which can induce the formation of dopamine
toxic metabolite, 6-OHDA, in vivo; Reaction 2.2.3 (Jameson et al., 2004, Double et al.,
1998). Furthermore, 6-OHDA can also modulate several proteins for intracellular iron
uptake such as Nedd4 family-interacting protein 1 (Ndfip1); an adaptor protein for the

CHAPTER 2: MATERIALS AND METHODS
95
Nedd4 family of ubiquitin ligases, hepcidin; an iron binding protein and divalent-metal
transporter 1 (DMT1); an iron transporter that raised the level of intracellular iron (Jia et
al., 2015, Xu et al., 2016). All these cellular events lead to decrease in cell protective
mechanism which results in cellular degeneration (Glinka & Youdim, 1995).
MG132
MG132 is a peptide-aldehyde that inhibits proteasomes enzymes complex responsible for
intracellular protein degradation. As part of the ubiquitin-proteasomes system (UPS), this
enzymes complex degrades intracellular proteins that are tagged with ubiquitin to smaller
peptides for further degradation to amino acids and re-cycling for the synthesis of
intracellular proteins. MG132 is relevant to model the pathogenesis of PD in vitro as mutant
α-synuclein expressed in familial PD patients which tend to self-aggregate forming Lewy
bodies also inhibit the proteasome (Kim et al., 2014). It has been shown that transfected
cells overexpressing mutant α-synuclein were sensitised to cell death compared to non-
transfected cells after exposure to MG132 (Petrucelli et al., 2002). Inhibition of
proteasomes enzymes complex initiate ROS productions presumably by decreasing the
turnover rate of mitochondria and thus decreasing the capacity of electron transport chain
(ETC) (Sullivan et al., 2004). Increase in ROS generates more misfolded protein by
oxidation with some misfolded proteins forming fibrils that can increase mitochondria
membrane permeability through pore formation. These can activate another pathway for
ROS generations by releasing Ca2+ and cytochrome c to the cytosol (He and Lemasters,
2002). Apart from ROS production, inhibition of the proteasome raises the level of
intracellular proteins, most of which are important in intracellular signalling involving cell
survival. One mechanism of MG132 that lead to cell death is by increasing the level of the
short-lived tumour-suppressor protein, p53 which mediate apoptosis by decreasing its
degradation (Nakaso et al., 2004). Besides tumour-suppressor proteins, other proteins
involved in intracellular cell signalling such as transcription factors [e.g. nuclear factor-
kappa B (NF-kB)] and cell cycle protein [e.g. cyclin A] are also modulated which favour
towards activation of cell death machineries (Guo and Peng, 2013). In summary,
proteasomes inhibition caused accumulation of intracellular signalling proteins and
generations of free-radicals that induce cell death.

CHAPTER 2: MATERIALS AND METHODS
96
This section described the method used to grow the SH-SY5Y cells and the determination
of toxins and HPOs toxicity.
Human neuroblastoma cell lines (SH-SY5Y)
Human neuroblastoma cell line (SH-SY5Y) was obtained from the European Collection of
Cell Cultures (ECCC). The cells were arrived in dry ice and were grown in serum-
supplemented cell culture medium, complete-DMEM (Table 2.2.1) on the day of arrival.
SH-SY5Y cells used in this study were initially at passage 18.
Table 2.2.1: Complete cell culture medium (complete-DMEM) constituents
Component Volume
(mL)
Supplier
Dulbecco's Modified Eagle Medium (DMEM) 500 Life Technologies, UK
Fetal bovine serum (FBS) 50 Life Technologies, UK
Penicillin-Streptomycin-Neomycin (PSN)
antibiotic mixture [0.5% P, 0.5% S, 0.5% N in
0.85% (w/v) saline]
6 Life Technologies, UK
To grow the cells, the cryovial containing cells suspension was thawed quickly in a water
bath (Grant Instruments Ltd, UK) pre-set at 37 °C. Cell handling after this step was
performed in sterile condition under a Grade II biosafety cabinet (Envair Ltd, UK). The
commercially obtained SH-SY5Y cell suspension was slowly added into 10 mL complete-
DMEM in a Falcon tube followed by centrifugation (ThermoFisher, UK) at 200 g for 5
minutes.
Subsequently, supernatant was removed, and the cell pellet was reconstituted in 1 mL
complete-DMEM. The cells suspension was briefly triturated and added to 25 cm2 (T25)
flask coated with Nunclon Delta Surface (Nunc®; ThermoFisher, UK) containing 10 mL
complete-DMEM followed by gentle shaking to distribute the cells. The cells were grown
in an incubator (Panasonic Corporation, Japan) with humidified carbogen (5% CO2 and
95% O2), and the cells were observed under an inverted optical light microscope (Nikon
TMS) at 5X magnification the following day to confirm cell attachment to flask. Medium
was replaced once or twice every week with fresh complete-DMEM.
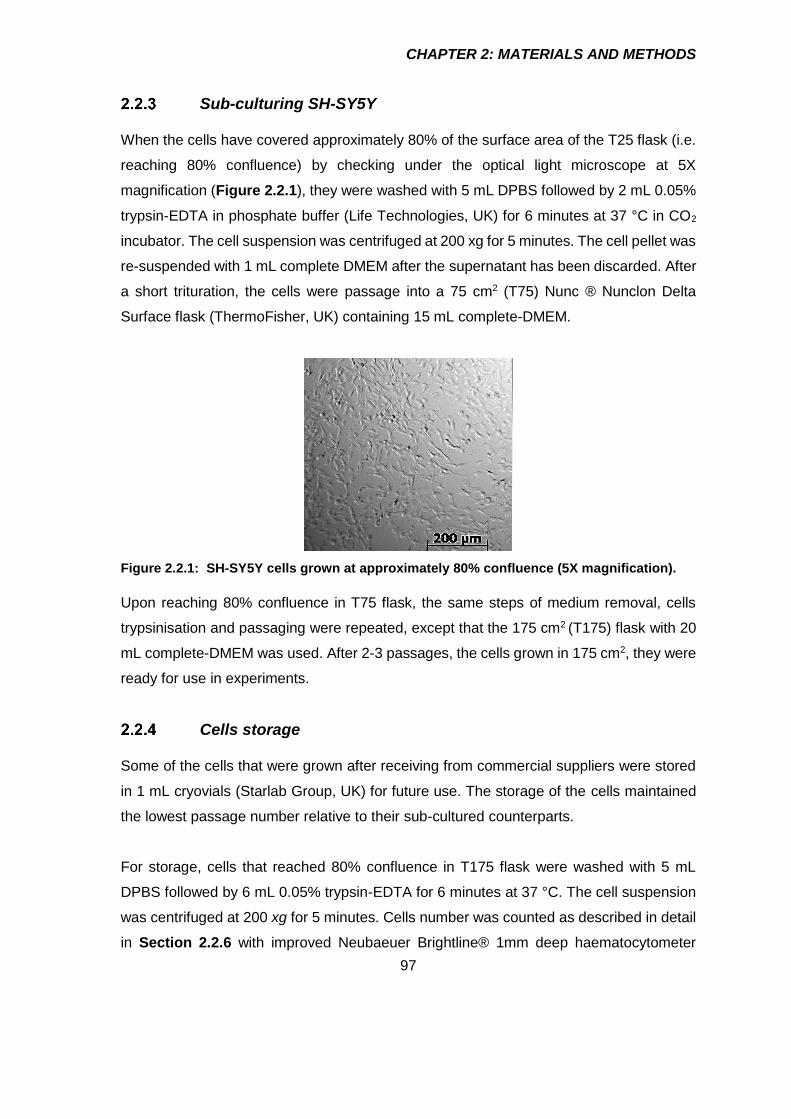
CHAPTER 2: MATERIALS AND METHODS
97
Sub-culturing SH-SY5Y
When the cells have covered approximately 80% of the surface area of the T25 flask (i.e.
reaching 80% confluence) by checking under the optical light microscope at 5X
magnification (Figure 2.2.1), they were washed with 5 mL DPBS followed by 2 mL 0.05%
trypsin-EDTA in phosphate buffer (Life Technologies, UK) for 6 minutes at 37 °C in CO2
incubator. The cell suspension was centrifuged at 200 xg for 5 minutes. The cell pellet was
re-suspended with 1 mL complete DMEM after the supernatant has been discarded. After
a short trituration, the cells were passage into a 75 cm2 (T75) Nunc ® Nunclon Delta
Surface flask (ThermoFisher, UK) containing 15 mL complete-DMEM.
Figure 2.2.1: SH-SY5Y cells grown at approximately 80% confluence (5X magnification).
Upon reaching 80% confluence in T75 flask, the same steps of medium removal, cells
trypsinisation and passaging were repeated, except that the 175 cm2 (T175) flask with 20
mL complete-DMEM was used. After 2-3 passages, the cells grown in 175 cm2, they were
ready for use in experiments.
Cells storage
Some of the cells that were grown after receiving from commercial suppliers were stored
in 1 mL cryovials (Starlab Group, UK) for future use. The storage of the cells maintained
the lowest passage number relative to their sub-cultured counterparts.
For storage, cells that reached 80% confluence in T175 flask were washed with 5 mL
DPBS followed by 6 mL 0.05% trypsin-EDTA for 6 minutes at 37 °C. The cell suspension
was centrifuged at 200 xg for 5 minutes. Cells number was counted as described in detail
in Section 2.2.6 with improved Neubaeuer Brightline® 1mm deep haematocytometer

CHAPTER 2: MATERIALS AND METHODS
98
(Reichert Tecnologies, USA). The optimum cells number (3 X 10⁶ cells/mL) was prepared
in storage medium (40% DMEM, 40% FBS and 20% DMSO) and aliquoted (1 mL) to
cryovials. The cryovials containing cells were frozen at -20 ºC (12 h), and finally stored at
-70 ºC.
Growing cells from storage
Two 1 mL cryovials containing cells were removed from the -70 ºC freezer and thawed
quickly in a waterbath at 37 ºC. The cells were grown in T25 flask and sub-cultured to
larger flask before use in experiments as described in Section 2.2.2 and Section 2.2.3.
Counting cells with hematocytometer
SH-SY5Y cells grown in T175 flask were washed when the cells reached 80% confluence
with 5 mL DPBS followed by incubation with 6 mL 0.05% trypsin for 5 minutes at 37 °C.
The cell suspension was centrifuged at 200 xg for 5 minutes. The cell pellet was re-
suspended with 1 mL complete DMEM after the supernatant has been discarded. The
cells suspension was diluted 1:49 (v/v) with 0.4% trypan blue solution prepared in 0.81%
(w/v) NaCl and 0.06% (w/v) K2HPO4 (Sigma-Aldrich, UK). Two microliter of diluted cells-
trypan blue suspension was loading at the edge of a glass coverslip on a haemocytometer.
Haemocytometer contains a grid of four identical squares on each corner with 16 smaller
boxes with each square can occupy 0.0001 mL cell suspension. The average of cells from
the four corner squares was taken and the cells number was calculated as the following:
𝑪𝒆𝒍𝒍𝒔 𝒏𝒖𝒎𝒃𝒆𝒓 (𝒄𝒆𝒍𝒍𝒔 𝒎𝑳⁄ ) = 𝑎𝑣𝑒𝑟𝑎𝑔𝑒 𝑜𝑓 4 𝑐𝑜𝑟𝑛𝑒𝑟 𝑏𝑜𝑥𝑒𝑠 × 𝐷𝐹 × 104 Equation 2.2.1
Figure 2.2.2: Example of cells number calculation with haemocytometer.

CHAPTER 2: MATERIALS AND METHODS
99
Plating SH-SY5Y cells to 96-well plates
Passage number (P) of SH-SY5Y used in this study were between P20 to P40. Whenever
the cells show increase in the growth rate and resistance towards toxins, cells with lower
passage number were used. Cells were diluted into several concentrations from the main
cell suspension with complete-DMEM and were plated in a volume of 100 µL per well. The
cells were allowed to attach to the surface of 96-well plate for at least 12 h after plating
before use for experiment. The remaining stock of cells suspension was passaged to a
new T175 cm2 for the next experiments.
Figure 2.2.3: Schematic diagram showing steps from cells thawing, growing in flask,
counting and plating into 96-well plates.
Estimation of cell viability
Cells viability was estimated with 3-(4,5-dimethylthiazol-2-yl)-2,5-diphenyltetrazolium
(MTT) assay. The assay was based on the principle that viable cells could take up MTT
intracellularly and reduce to insoluble purple formazan crystal by mitochondria reductase
(van Meerloo et al., 2011). The formazan crystal was solubilised with dimethyl sulfoxide
(DMSO) after the incubation medium removed and has a maximum absorption at 570 nm
which correspond to the viable cells and mitochondrial enzyme activity (Figure 2.2.4).

CHAPTER 2: MATERIALS AND METHODS
100
Figure 2.2.4: Schematic diagram for conversion of mitochondria reductase substrate, MTT
to purple formazan that has maximal absorption at 570 nm.
MTT main stock solution (5.5 mg/mL) was prepared by dissolving in distilled water and
was sonicated for 30 minutes, protected from light. The MTT main stock solution was
sterile filtered using a 0.45 µm membrane with a 20 mL syringe under the biosafety
cabinet. The filtered MTT main stock solution was aliquoted into microcentrifuge tubes and
stored at -20 ˚C until use.
On the day of the assay, the MTT stock solution was thawed in a water bath at 37 ˚C and
MTT working stock solution (0.5 mg/mL), prepared in serum-free DMEM was added to the
cells in 96-well plate. The plate was then incubated for 4h in CO2 incubator at 37 ˚C after
incubation medium was removed. At the end of the incubation time, the culture medium
with MTT was removed by quick inversion into a sink and slowly tapped into tissue to
remove excess liquid (Morgan, 1998). DMSO (100 µL) was added into the 96-well, and
lightly tapped to assist solubilisation. Absorbance at 570 nm was taken immediately and
the percentage of viable cells calculated as follows:
𝑉𝑖𝑎𝑏𝑙𝑒 𝑐𝑒𝑙𝑙𝑠 (%) =𝑇𝑟𝑒𝑎𝑡𝑒𝑑570𝑛𝑚−𝐵𝑙𝑎𝑛𝑘𝐷𝑀𝑆𝑂,570𝑛𝑚
𝐶𝑜𝑛𝑡𝑟𝑜𝑙570𝑛𝑚 − 𝐵𝑙𝑎𝑛𝑘𝐷𝑀𝑆𝑂,570𝑛𝑚 𝑋 100 Equation 2.2.2
The formation of formazan crystals as detected at 570 nm shows linear positive correlation
with SH-SY5Y densities in the 96-well plates (Figure 2.2.5). Base on this observation, SH-
SY5Y density at 1X10⁵ cells/mL was selected to be sufficient for toxicity and
neuroprotection studies. The selected density was also widely reported by other literatures
which makes comparison between studies feasible.

CHAPTER 2: MATERIALS AND METHODS
101
0 .0 0 .5 1 .0 1 .5 2 .0 2 .5 3 .0
0 .0
0 .1
0 .2
0 .3
0 .4
0 .5
C e lls d e n s ity (x 1 05
c e lls /m L )
Ab
s a
t 5
70
nm
y = 0 .1 6 4 5 x + 0 .0 0 5 7 5
r2
= 0 .9 4 0 2
Figure 2.2.5: Linearity of MTT absorbance at 570 nm with different cell density.
Data are expressed as mean±SEM (n=3). Data was analysed by least-square regression analysis
(GraphPad Prism 7 Software). Degrees of freedom (df) = 19.

CHAPTER 2: MATERIALS AND METHODS
102
Neurotoxins
Selected neurotoxins were used to induce SH-SY5Y cells death. The death of SH-SY5Y
cells mimicked the dying dopaminergic neurons, the pathological hallmark of Parkinson’s
disease. Series of concentrations range were prepared for determination of concentration
that caused 50% cell death (IC50) by MTT assay described in Section 2.2.8. The IC50
concentration obtained were used in the neuroprotection studies.
Hydrogen peroxide (H2O2)
Working stock solution (2000 µM) for H2O2 was prepared from the 30% (w/v) H2O2 main
stock solution (Sigma-Aldrich, UK) in serum-free DMEM. A series of H2O2 concentrations
ranging from 16-1000 µM were prepared in serum-free DMEM using the H2O2 working
stock solution and were added (100 µL) into the 96-well plate containing 1x10⁵ SH-SY5Y
cells/mL. The cells were exposed to the various concentration of H2O2 (16-2000 µM) for
20 h in a CO2 incubator. Cells incubated with serum-free DMEM were served as a control.
After 20 h exposure to H2O2, the medium was removed and replaced with serum-free
DMEM containing 0.5 mg/mL MTT and further incubated in the CO2 incubators for 4 h. At
the end of the incubation, the medium was removed followed by cells lysis with 100% (v/v)
DMSO and the absorbance was taken at 570 nm as described in Section 2.2.8.
H2O2 started to show a concentration dependent reduction in cell viability at 125 µM and
above (Figure 2.2.6). The IC50 value for H2O2 obtained by non-linear regression analysis
was 222±33 µM which is within the range of reported values (Yeon and Kim, 2010, Ismail
et al., 2012).

CHAPTER 2: MATERIALS AND METHODS
103
-2 5
0
2 5
5 0
7 5
1 0 0
1 2 5
1 0 -5 . 0 1 0 -4 . 5 1 0 -4 . 0 1 0 -3 . 5 1 0 -3 . 0 1 0 -2 . 5
L o g [H 2 O 2 ] , M
Ce
ll v
iab
ilit
y (
% c
on
tro
l)C o n t
*
***
***
IC 5 0 = 2 2 2 3 3 M
***
***
Figure 2.2.6: Cell death of SH-SY5Y cells following exposure to H2O2.
SH-SY5Y cells were exposed to H2O2 (16-2000 µM) for 20h. Cell viability was assesed by the MTT
assay, where untreated cells was recorded as ~100% viable and served as a control. Data are
expressed as mean±SEM (n=5). Non-linear regression analysis [log(toxin) vs. response -- Variable
slope (four parameters)] was performed to calculate the IC50 (GraphPad Prism 7 Software).
Degrees of freedom (df) = 42. * p <0.05, *** p <0.001 compared to control cells (one-way ANOVA
followed by Dunnett’s test).
6-Hydroxydopamine (6-OHDA)
Main stock solution (50 mM) for 6-OHDA (Sigma-Aldrich, UK) was prepared in 0.3% (w/v)
ascorbic acid as sodium ascorbate (Sigma-Aldrich, UK) dissolved in serum-free DMEM.
6-OHDA working stock solution (1000 µM) was prepared from the 6-OHDA main stock
solution by 1:49 (v/v) dilution in serum-free DMEM. A series of 6-OHDA concentrations
ranging from 4-250 µM were prepared in 0.006% (w/v) ascorbic acid in serum-free DMEM
from the 6-OHDA working stock solution and were added (100 µL) into the 96-well plate
containing 1x10⁵ SH-SY5Y cells/mL. The cells were exposed to the various concentration
of 6-OHDA (4-250 µM) for 20 h in a CO2 incubator. Cells incubated with 0.006% (w/v)
ascorbic acid in serum-free DMEM was served as a control. After 20 h exposure to 6-
OHDA, the medium was removed and replaced with free-medium containing 0.5 mg/mL
MTT and further incubated in the CO2 incubators for 4 h. At the end of the incubation, the
medium removed followed by cells lysis with 100% (v/v) DMSO and the absorbance was
taken at 570 nm as described in Section 2.2.8.
6-OHDA showed a concentration dependent reduction in cell viability at 31 µM and above
(Figure 2.2.7a). The IC50 value for 6-OHDA obtained by non-linear regression analysis
was 39.5±5.8 µM which is within the range of reported values (Ryu et al., 2013, Storch et

CHAPTER 2: MATERIALS AND METHODS
104
al., 2000, Shi et al., 2013, Silva et al., 2016). The final concentration of ascorbic acid added
into serum-free DMEM to reduce the rate of 6-OHDA oxidation was 0.006% (w/v) chosen
based on the cell viability-ascorbic acid concentration response curve, which did not cause
significant cell death (Figure 2.2.7b). Indeed, sodium ascorbate has been reported to
induce apoptosis in neuroblastoma cell lines by interfering with iron uptake (Carosio et al.,
2007). In addition, report on protective effect of ascorbate on amyloid beta-exposed SH-
SY5Y cells used much lower concentration of ascorbate, 0.001% (w/v) than that was used
in the current study (Huang and May, 2006).
-2 5
0
2 5
5 0
7 5
1 0 0
1 2 5
1 0 -6 1 0 -5 1 0 -4 1 0 -3
L o g [6 -O H D A ], M
Ce
ll v
iab
ilit
y (
% c
on
tro
l)
C o n t
* *
* * *
* * ** * *
IC 5 0 = 3 9 .5 5 .8 M
-2 5
0
2 5
5 0
7 5
1 0 0
1 2 5
1 0 -3 .5 1 0 -3 .0 1 0 -2 .5 1 0 -2 .0 1 0 -1 .5 1 0 -1 .0
L o g [A s c o rb ic a c id ] , % (w /v )
C o n t
* * *
* * *
* * * * * *
IC 5 0 = 0 .0 0 9 0 .0 0 1 % (w /v )
* * *
a ) b )
Figure 2.2.7: Cell death of SH-SY5Y cells following exposure to 6-OHDA and L-ascorbic acid.
SH-SY5Y cells were exposed to a) 6-OHDA (4-250 µM) and b) L-ascorbic acid [(0.0004-0.1%
(w/v)] for 20 hours. Cell viability was assesed by the MTT assay, where a) cells treated with 0.006
% (w/v) ascorbic acid b) untreated cells were recorded as ~100% viable and served as controls.
Arrowhead indicates the final L-ascorbic acid concentration chosen to protect 6-OHDA from rapid
oxidation. Data are expressed as mean±SEM a) n=4, b) n=5. Non-linear regression analysis
[log(toxin) vs. response-variable slope (four parameters)] was performed to calculate the IC50
(GraphPad Prism 7 Software). Degrees of freedom (df)= a) 36 and b) 26. ** p <0.05, *** p <0.001
compared to control cells (one-way ANOVA followed by Dunnett’s test).
MG132
MG132 main stock solution (1 mM) was prepared in 100% DMSO (Fisher Scientific, UK).
MG132 working stock solution (10 µM) was prepared from the MG132 main stock solution
by 1:9999 (v/v) dilution in serum-free DMEM. A series of MG132 concentrations ranging
from 5 pM - 5 µM were prepared in 0.001% (v/v) DMSO in serum-free DMEM from the
MG132 working stock solution and were added (100 µL) into the 96-well plate containing

CHAPTER 2: MATERIALS AND METHODS
105
1x10⁵ SH-SY5Y cells/mL. The cells were exposed to the various concentration of MG132
(5 pM -10 µM) for 20 h in a CO2 incubator. Cells incubated with 0.001% (w/v) DMSO in
serum-free DMEM served as a control. After 20 h exposure to MG132, the medium was
removed and replaced with free-medium containing 0.5 mg/mL MTT and further incubated
in the CO2 incubators for 4 h. At the end of the incubation, the medium removed followed
by cells lysis with 100% (v/v) DMSO and the absorbance was taken at 570 nm as
described in Section 2.2.8.
MG132 showed a concentration dependent reduction in cell viability at 0.0005 µM and
above (Figure 2.2.8a). The IC50 value for MG132 obtained by non-linear regression
analysis was 352±0.05 pM which is rather lower than the reported values. The reported
IC50 values for MG132 were between 0.5 to 10 µM (Yamada et al., 2011, Nakaso et al.,
2004). The higher IC50 values in those reports probably due to the used of cells at higher
passage number as they tend to be resistant toward toxins. Unfortunately, for most
reported studies employing SH-SY5Y, details on the passage number used were not
provided and therefore this is not conclusive. Another possible explanation was that,
repeated freezing and thawing of MG132 main stock solution may contributed to the
significant loss of MG132 potency due to the fact that MG132 is a small peptide. It is
believed that small peptides are prone to misconfiguration after a freezing-thawing cycles
which reduced its potency (Prasad et al., 2013, Turner et al., 2011). The final concentration
of 0.001% (v/v) DMSO did not significantly cause cell death (Figure 2.2.8b).

CHAPTER 2: MATERIALS AND METHODS
106
-2 5
0
2 5
5 0
7 5
1 0 0
1 2 5
1 0 -1 2 1 0 -1 0 1 0 -8 1 0 -6 1 0 -4
L o g [M G 1 3 2 ], M
Ce
ll v
iab
ilit
y (
% c
on
tro
l)
C o n t
* * ** * * * * *
* * *
* * *
IC 5 0 = 3 5 2 0 .0 5 p M
* * *
-2 5
0
2 5
5 0
7 5
1 0 0
1 2 5
1 0 -5 1 0 -3 1 0 -1 1 0 1 1 0 3
L o g [D M S O ], % (v /v )
C o n t
* * ** * *
IC 5 0 = 2 .3 0 0 .5 8 % (v /v )
* *
a ) b )
Figure 2.2.8: Cell death of SH-SY5Y cells following exposure to MG132.
SH-SY5Y cells were exposed to a) MG132 (5 pM – 10 µM) and b) DMSO [0.0001-50% (v/v)] for
20 hours. Cell viability was assesed by the MTT assay, where a) cells treated with 0.001 % (v/v)
DMSO b) untreated cells were recorded as ~100% viable and served as controls. Arrowhead
indicates the final DMSO concentration chosen to not significantly cause cell death. Data are
expressed as mean±SEM a) n=4 & b) n=3. Non-linear regression analysis [log(toxin) vs. response-
variable slope (four parameters)] was performed to calculate the IC50 (GraphPad Prism 7 Software).
Degrees of freedom (df)= a) 33 & b) 24. ** p <0.05, *** p <0.001 compared to control cells (one-
way ANOVA followed by Dunnett’s test).
Ferric nitrolotriacetoacetate (FeNTA)
Main stock solution (12.5 mM) for ferric nitrolotriacetoacetate (FeNTA) was prepared from
a combination of FeNO3.9H2O (Sigma-Aldrich, UK) and sodium nitrilotriacaetace (NaNTA)
(Santa Cruz Biotechnelogy, USA) in a 1 to 5 molar ratio (FeNTA 1:5) in 10 mM HEPES
(Sigma-Aldrich, UK) according to a method described by Molina-Holgado et al. (2008).
The pH of the main stock solution was adjusted to pH 7.4 with 5 M NaOH and sterile
filtered (0.45 µm filter; ThermoFisher, UK) under the biosafety cabinet. The working stock
solution for FeNTA (1:5; 5000 µM) was prepared in serum-free DMEM from the main stock
solution. A series of FeNTA (1:5) concentrations ranging from 40-2500 µM were prepared
in in serum-free DMEM from the FeNTA (1:5) working stock solution and were added (100
µL) into the 96-well plate containing 1x10⁵ SH-SY5Y cells/mL. The cells were exposed to
the various concentration of FeNTA (1:5) (40-5000 µM) for 20 h in a CO2 incubator. Cells
incubated with serum-free DMEM was served as a control. After 20 h exposure to FeNTA
(1:5) the medium was removed and replaced with serum-free DMEM containing 0.5
mg/mL MTT and further incubated in the CO2 incubators for 4 h. At the end of the

CHAPTER 2: MATERIALS AND METHODS
107
incubation, the medium removed followed by cells lysis with 100% (v/v) DMSO and the
absorbance was taken at 570 nm as described in Section 2.2.8.
FeNTA (1:5) showed a concentration dependent reduction in cell viability at 1250 µM and
above (Figure 2.2.9a). SH-SY5Y is relatively resistance towards FeNTA (1:5) compared
to other neurotoxins used in this study with an IC50 value obtained by non-linear regression
analysis was 1082±125 µM. No reported IC50 values available for FeNTA (1:5) with SH-
SY5Y cells. IC50 for FeNTA (1:5) on primary cells of mouse cortical neurons was low, 10
µM, relative to the IC50 obtained in this study (Molina-Holgado et al., 2008). In the same
report, SH-SY5Y was also employed, however, FeNTA was not used as a toxin for SH-
SY5Y cells probably because of its marked resistance towards cell death. Furthermore,
IC50 for NaNTA derived from exposure of comparable NaNTA concentration over Fe3+
concentration (5 to 1 ratio) showed approximately 5-fold the IC50 of FeNTA (1:5) (Figure
2.2.9b). It can be concluded that the IC50 value from FeNTA was primarily due to the NTA
toxicity rather than Fe3+ itself. NTA is a tripodal chelator for Fe3+ that requires 3 molecules
of NTA to act as a bidentate chelator to completely chelate 1 molecule of iron (Gabričević
and Crumbliss, 2003). It is possible that the interaction of NTA as a ligand for Fe3+ is so
strong that Fe3+ was not available for chemical reactions. Alternatively, due to the excess
molecules of NTA, availability of Fe3+ was limited due to efficient chelation. Fe(NO)3 on its
own did not kill the cells because of precipitation to form inactive Fe(OH)3 at physiological
pH which limit the use by its own in this study (Figure 2.2.9c).

CHAPTER 2: MATERIALS AND METHODS
108
-2 5
0
2 5
5 0
7 5
1 0 0
1 2 5
1 0 -5 1 0 -4 1 0 -3 1 0 -2
L o g [F e N T A (1 :5 )] , M
Ce
ll v
iab
ilit
y (
% c
on
tro
l)
C o n t
* * *
* * *
* * *
IC 5 0 = 1 0 8 2 1 2 5 M
-2 5
0
2 5
5 0
7 5
1 0 0
1 2 5
1 0 -4 1 0 -3 1 0 -2 1 0 -1
L o g [N a N T A ], M
C o n t
* * *
* * *
* * *
IC 5 0 = 5 7 0 4 3 2 2 M
a ) b )
-2 5
0
2 5
5 0
7 5
1 0 0
1 2 5
1 0 -7 1 0 -6 1 0 -5 1 0 -4 1 0 -3
L o g [F e N O 3 ] , M
Ce
ll v
iab
ilit
y (
% c
on
tro
l)
C o n t
IC 5 0 = n o t c o n v e r g e d
c )
Figure 2.2.9: Cell death of SH-SY5Y cells following exposure to FeNTA (1:5).
SH-SY5Y cells were exposed to a) FeNTA (1:5) (40 - 5000 µM), b) NaNTA (20 - 25000 µM) & c)
FeNO3 (4 - 5000 µM) for 20 hours. Cell viability was assesed by the MTT assay, where untreated
cells was recorded as ~100% viable and served as a control. Data are expressed as mean±SEM
a) n=4 , b) & c) n=3. Non-linear regression analysis [log(toxin) vs. response-variable slope (four
parameters)] was performed to calculate the IC50 (GraphPad Prism 7 Software). Degrees of
freedom (df) = a) 33 & b) 24. *** p <0.001 compared to control cells (one-way ANOVA followed by
Dunnett’s test).
In an attempt to lower the NTA concentration for every mole of Fe3+, FeNTA was prepared
as above, however by a combination of 1 to 3 molar ratio of FeNO3.9H2O and NaNTA as
reported by Iqbal et al. (2003). Several concentrations of FeNTA (1:3) were prepared and
exposed to SH-SY5Y cells as described above. After 20 h exposure with FeNTA, the
medium was removed and replaced with serum-free DMEM containing 0.5 mg/mL MTT
and further incubated in the CO2 incubators for 4 h. At the end of the incubation, the
medium was removed followed by cells lysis with 100% (v/v) DMSO and the absorbance
was taken at 570 nm as described in Section 2.2.8.

CHAPTER 2: MATERIALS AND METHODS
109
FeNTA (1:3) showed a concentration dependent reduction in cell viability at 625 µM and
above (Figure 2.2.10a). The IC50 value for FeNTA (1:3) obtained by non-linear regression
analysis was 457±32 µM. At this FeNTA (1:3) concentration, the equivalent NTA
concentration is 1371 µM. The IC50 value derived from cell viability-NTA concentration
response curve for each equivalent concentration of FeNTA (1:3) was 6383±308 µM with
reduction of cells viability started at 3750 µM and above (Figure 2.2.10b). Exposure of
500 µM FeNTA (1:3) on hepatoma cell lines, HepG2, only killed approximately 20% of the
cells population (Sakurai and Cederbaum, 1998).
-2 5
0
2 5
5 0
7 5
1 0 0
1 2 5
1 0 -5 1 0 -4 1 0 -3 1 0 -2
L o g [F e N T A (1 :3 )] , M
Ce
ll v
iab
ilit
y (
% c
on
tro
l)
C o n t
* * ** * *
* * *
IC 5 0 = 4 5 7 3 2 M
* * *
-2 5
0
2 5
5 0
7 5
1 0 0
1 2 5
1 0 -4 1 0 -3 1 0 -2 1 0 -1
L o g [N a N T A ], M
C o n t
*
* * *
* * *
IC 5 0 = 6 3 8 3 3 0 8 M
a ) b )
Figure 2.2.10: Cell death of SH-SY5Y cells following exposure to FeNTA (1:3).
SH-SY5Y cells were exposed to a) FeNTA (1:3) (4-5000 µM) and b) NaNTA (12-15000 µM) for 20
hours. Cell viability was assesed by the MTT assay, where untreated cells was recorded as ~100%
viable and served as a control. Arrowhead indicates the final NaNTA concentration for the FeNTA
(1:3) complex. Data are expressed as mean±SEM (n=3). Non-linear regression analysis
[log(inhibitor) vs. response-variable slope (four parameters)] was performed to calculate the IC50
(GraphPad Prism 7 Software). Degrees of freedom (df) = 24. * p <0.05, *** p <0.001 compared to
control cells (one-way ANOVA followed by Dunnett’s test).
To summarise, MG132 was the most toxic to SH-SY5Y as evaluated by MTT assay with
IC50 value of 352 pM. This was followed by 6-OHDA (IC50 = 39 µM) and H2O2 (IC50 = 222
µM). FeNTA was the least toxic of all toxicants with IC50 value of 457 µM. The IC50
concentrations for toxins were rounded up to the nearest whole number and was used as
final IC50 concentrations in the neuroprotection study (Table 2.2.2).

CHAPTER 2: MATERIALS AND METHODS
110
Table 2.2.2: Summary of the toxin with their IC50 use in the in vitro neuroprotection study.
Toxins IC50
Hydrogen peroxide (H2O2) 220 µM
6-Hydroxydopamine 40 µM
MG132 350 pM
FeNTA (1:3) 460 µM
3-hydroxy-4-pyridinones
Several concentrations of HPOs (5, 50, 100, 500, 1250, 2500 and 5000 µM) were tested
for their toxicity against SH-SY5Y cells and the cell viability was measured with MTT
assay. Main stock solution for CP20 and novel HPOs (50 mM) were prepared in sterile
distilled water except for CP84 that was dissolved in 100% (v/v) DMSO. The working stock
solution for HPOs (5000 µM) was prepared in serum-free DMEM from the main stock
solution. A series of HPOs concentrations ranging from 5 to 5000 µM were prepared in
serum-free DMEM from the HPOs working stock solution and were added (100 µL) into
the 96-well plate containing 1x10⁵ SH-SY5Y cells/mL. The cells were exposed to the
various concentration of HPOs for 20 h in a CO2 incubator. Cells incubated with serum-
free DMEM was served as a control. After 20h exposure to HPOs, the medium was
removed and replaced with free-medium containing 0.5 mg/mL MTT and further incubated
in the CO2 incubators for 4 h. At the end of the incubation, the medium was removed
followed by cells lysis with 100% (v/v) DMSO and the absorbance was taken at 570 nm
as described in Section 2.2.8.
CP20 did not cause significant cell death when compared to control group for all of the
concentrations tested (Figure 2.2.11a). Similarly, CN116 and CN118 also did not cause
cell death up to the highest concentration (5000 µM) tested when compared to control
(Figure 2.2.11c). CN126 and CN128 caused significant cell death when compared to
control at the highest concentration tested (5000 µM; Figure 2.2.11d). Conversely, CN226
and CN228 started to lower the cell viability at 2500 µM compared to control with almost
complete cell death following 5000 µM (Figure 2.2.11e). Among all HPOs, only CP84
significantly killed the cells at 500 µM and above suggesting that it is relatively toxic
compare to other HPOs (Figure 2.2.11b).

CHAPTER 2: MATERIALS AND METHODS
111
Comparison between equimolar concentrations of CP20 with novel HPOs revealed that
treatment with CN126 and CN128 significantly lowered cell viability at 5000 µM. On the
other hand, treatment with CN226 and CN228 significantly lowered cell viability at 2500
and 5000 µM compared to equimolar concentration of CP20. Additionally, CP84 lowered
the cell viability in a concentration-dependant manner starting at 500 µM when compared
with equimolar concentration of CP20.
SH-SY5Y cells have been shown to be resistance towards toxicity of deferioxamine, a
hexadentate iron chelator due to higher level of ferritin expressed in SH-SY5Y compared
to non-cancerous cells (Castino et al., 2011, Selig et al., 1998). In this situation, the
intracellular iron was sequestered and tightly bound within ferritin complex and was
released as intracellular free-iron as needed for cellular functions. Because of the high
number of ferritins in SH-SY5Y cells, more iron chelators are needed to compete with
ferritin to bind iron until free-irons are depleted and causing cell death.
The IC50 values for HPOs rounded up to the nearest whole number were listed in Table
2.2.3. The selected concentration of HPOs used for in vitro neuroprotection study were
50, 100 and 500 µM which have been shown to be sufficient to protect SH-SY5Y cells
from toxin-induced cell death (Selig et al., 1998). In neuroprotection study employing
FeNTA (1:3), HPOs concentrations for up to 1250 µM were used to show neuroprotection
due to the nature of co-ordination chemistry for iron chelation. For CP84, the concentration
employed was limited for up to 100 µM due to its marked toxicity at 500 µM (Figure
2.2.11b).
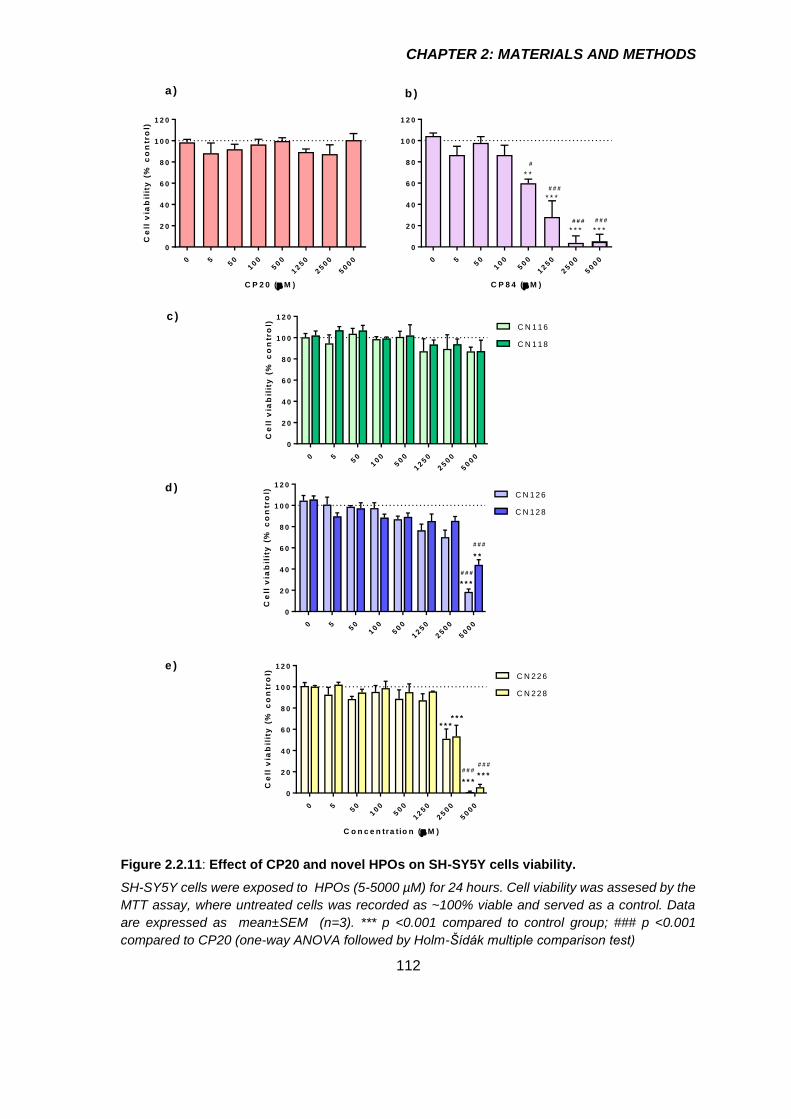
CHAPTER 2: MATERIALS AND METHODS
112
0 550
100
500
1250
2500
5000
0
2 0
4 0
6 0
8 0
1 0 0
1 2 0
C P 2 0 ( M )
Ce
ll v
iab
ilit
y (
% c
on
tro
l)
a ) b )
0 550
100
500
1250
2500
5000
0
2 0
4 0
6 0
8 0
1 0 0
1 2 0
C P 8 4 ( M )
* * *
* * *
* * *
* *
#
# # #
# # # # # #
0 550
100
500
1250
2500
5000
0
2 0
4 0
6 0
8 0
1 0 0
1 2 0
Ce
ll v
iab
ilit
y (
% c
on
tro
l) C N 1 1 6
C N 1 1 8
c )
0 550
100
500
1250
2500
5000
0
2 0
4 0
6 0
8 0
1 0 0
1 2 0
Ce
ll v
iab
ilit
y (
% c
on
tro
l) C N 1 2 6
C N 1 2 8
* * *
* *
# # #
# # #
d )
0 550
100
500
1250
2500
5000
0
2 0
4 0
6 0
8 0
1 0 0
1 2 0
C o n c e n tra t io n ( M )
Ce
ll v
iab
ilit
y (
% c
on
tro
l) C N 2 2 6
C N 2 2 8
* * ** * *
# # ## # #
* * ** * *
e )
Figure 2.2.11: Effect of CP20 and novel HPOs on SH-SY5Y cells viability.
SH-SY5Y cells were exposed to HPOs (5-5000 µM) for 24 hours. Cell viability was assesed by the
MTT assay, where untreated cells was recorded as ~100% viable and served as a control. Data
are expressed as mean±SEM (n=3). *** p <0.001 compared to control group; ### p <0.001
compared to CP20 (one-way ANOVA followed by Holm-Šídák multiple comparison test)

CHAPTER 2: MATERIALS AND METHODS
113
Table 2.2.3: IC50 values for HPOs assessed by MTT assay.
HPOs IC50 (µM)
CP20 na
CP84 690
CN116 na
CN118 na
CN126 na
CN128 na
CN226 2590
CN228 2550
na = not applicable; for this HPOs, an accurate IC50 value cannot be determined due to absence of
inflection point in the log(toxin) vs. response-variable slope. Data are expressed as mean±SEM
(n=3). Non-linear regression analysis [log(toxin) vs. response-variable slope (four parameters)] was
performed to calculate the IC50 (GraphPad Prism 7 Software).

CHAPTER 2: MATERIALS AND METHODS
114
HPLC method validation for evaluation of selected
novel 3-hydroxy-4-pyridinone iron chelators in rat
brain and plasma for pharmacokinetics application.
Introduction
Biological fluid or matrix such as urine, plasma, milk and brain homogenate often
contained analytes inherent to the matrix that might interfere with the separation and
efficiency of drug extraction (Siddiqui et al., 2017). In addition, recovery of HPOs spiked
into NRS supplemented with BSA and brain homogenate were less than 100 percent for
some HPOs when extracted with TFA (Section 2.1.9b iii), which requires correction for
recovery during HPLC data analysis. The Food and Drug Administration, USA (US-FDA)
had released guidelines for analysis of analytes in biological matrices (US-FDA, 2001).
The guidelines suggested preparation of standard calibration curve by spiking a standard
analyte into the relevant biological matrix rather that water, followed by extraction
procedures similar to the actual biological samples so that preparation error could be
minimised. Additionally, a second standard (internal standard) preferably with the same
physicochemical properties of the main standard but with different retention time was also
added at a constant concentration prior to the extraction (Pitt, 2009). The HPLC response
was taken as the ratio of area under the curve (AUC) or height of the peaks for the main
standard and internal standard. This step could minimise the error that might be
introduced during sample preparation such as during pipetting or during sample injection
into HPLC. To ensure accuracy and reproducibility (precision) of the HPLC analysis within
day (intraday) or between days (interday), concentrations of standard that covers the low,
middle and high concentration were selected as quality controls to be run along the
standard calibration curve (US-FDA, 2001). Accuracy is defined as the closeness of the
obtained response to the expected response. On the other hand, precision measures the
reproducibility of HPLC response in between analysis (Kadian et al., 2016).
This section described the improved sample preparation method for HPO analysis in
matrix other than water according to the guidelines provided by the US-FDA (2001). This
step was taken to minimise error that might be introduced during sample preparation
and/or flaws in the HPLC machinery for application in the pharmacokinetic study.

CHAPTER 2: MATERIALS AND METHODS
115
Experimental animals
Male Wistar rats weighing between 300-350 g (Harlan UK Ltd) and were housed between
2-4 rats per cage in the Biological Service Unit (BSU), King’s College London. The
conditions of the holding unit at BSU and rat diet were described previously in Section
2.1.2. The experiments were approved under Animal (Scientific Procedure Act) 1986 and
performed under the project license number 70/0688.
HPLC method validation in plasma and brain
The method validation for HPOs determination in plasma and brain was performed
according to the US-FDA Bioanalytical Method Validation Guidance for Industry (US-FDA,
2001) with CP20 was used as an HPO prototype. Blanked plasma and brain were obtained
from naïve rats. Upon confirmation of loss of reflex by toe pinching, the rats were terminally
anaesthetised with 600 mg/kg pentobarbital sodium (Merial Animal Health Ltd, UK) by i.p.
injection, the chest was open with a pair of scissors to expose the heart. Whole blood was
collected by cardiac puncture using 21G needle attached to a 5 mL syringe and transferred
into a heparinised tube. Whole blood was centrifuged at 5400 g, 4 ºC for 20 minutes and
plasma removed and stored at -20º C until analysis. The brain was removed and
homogenised in PhyBS in 1:3 (w/v) dilution and stored in -20º C.
HPOs solution preparation
CP20 and CN226 were dissolved in HPLC water at a concentration of 50 mM which was
used as main stock solution. Dilutions of CP20 (20 to 1250 µM) were prepared from the
CP20 stock solution in HPLC water for calibration curve and quality control (QC)
preparation. CN226 working stock solution at 200 µM was prepared from the CN226 main
stock solution and was used as an internal standard (IS).
Standard calibration curve
CP20 calibration curve with concentrations ranging from 2 to 125 µM were prepared in
blank plasma and brain from naïve rats. CP20 (20-1250 µM; 20 µL) was spiked into 180
µL blank matrices (plasma or brain) followed by 22 µL internal standard (CN226) working
solution. TFA (22 µL) was added to the spiked matrices so that the final concentration of
TFA was 9.1% (v/v). The mixture was vortexed and centrifuged at 20800 g, 4º C for 45

CHAPTER 2: MATERIALS AND METHODS
116
minutes. Clear supernatant was taken and injected (30 µL) into HPLC for analysis. The
method for analysis of HPOs in the plasma and brain was performed as described in
Section 2.1.9b. The ratio of the CP20 and CN226 peak height was calculated and plotted
for linear regression analysis.
𝐻𝑃𝐿𝐶 𝑠𝑖𝑔𝑛𝑎𝑙 =𝑃𝑒𝑎𝑘 ℎ𝑒𝑖𝑔ℎ𝑡 𝑜𝑓 𝐶𝑃20
𝑃𝑒𝑎𝑘 ℎ𝑒𝑖𝑔ℎ𝑡 𝑜𝑓 𝐶𝑁226 Equation 2.3.1
0 5 1 0 1 5 2 0 2 5
0
2 0 0
4 0 0
6 0 0
8 0 0
T im e (m in )
He
igh
t (m
.AU
)
W V L :2 8 0 n m
CP
20 C
N226
0 5 1 0 1 5 2 0 2 5
0
2 0 0
4 0 0
6 0 0
8 0 0
T im e (m in )
He
igh
t (m
.AU
)
CP
20
CN
226
W V L :2 8 0 n m
0 5 1 0 1 5 2 0 2 5
0
2 0 0
4 0 0
6 0 0
8 0 0
T im e (m in )
He
igh
t (m
.AU
)
CP
20
CN
226
W V L :2 8 0 n m
0 5 1 0 1 5 2 0 2 5
0
2 0 0
4 0 0
6 0 0
8 0 0
T im e (m in )
He
igh
t (m
.AU
)
CP
20
CN
226
W V L :2 8 0 n m
0 5 1 0 1 5 2 0 2 5
0
2 0 0
4 0 0
6 0 0
8 0 0
T im e (m in )
He
igh
t (m
.AU
)
CP
20
CN
226
W V L :2 8 0 n m
0 5 1 0 1 5 2 0 2 5
0
2 0 0
4 0 0
6 0 0
8 0 0
T im e (m in )
He
igh
t (m
.AU
)
CP
20
CN
226
W V L :2 8 0 n m
ii) 1 6 M iii) 6 4 Mi) 4 M
Figure 2.3.1: Representative chromatogram for CP20 and CN226 spiked into rat plasma or
brain homogenate.
CP20 and CN226 retention times were ~8.3 minute and ~9.1 minute respectively.
Linear regression analysis was performed on the linear plot of CP20 to CN226 height ratio
against CP20 concentrations to obtain the linear equation y = mx + C.
0 5 0 1 0 0 1 5 0
0
2
4
6
8
y = 0 .0 5 5 2 4 x - 0 .0 5 3 2
r2 = 0 .9 9 8 0
C P 2 0 (M ) in p las m a
He
igh
t ra
tio
(CP
20
/CN
22
6)
0 5 0 1 0 0 1 5 0
0
2
4
6
8
y = 0 .0 5 0 7 x + 0 .2 5 8 6
r2 = 0 .9 9 4 4
C P 2 0 (M ) in b ra in
a ) b )
Figure 2.3.2: Representative standard calibration curve of CP20 spiked into blanked plasma
and brain. Data was analysed by least-square linear regression analysis (GraphPad Prism 7
Software).

CHAPTER 2: MATERIALS AND METHODS
117
Lower limit of detection (LOD) is defined as the lowest concentration in the standard curve
that can be detected by the HPLC system, but cannot be accurately quantify (Armbruster
and Pry, 2008). LOD was calculated following this formula:
𝐿𝑂𝐷 =3 𝜎
𝑚 Equation 2.3.2
Where, σ is standard deviation of the residuals of the calibration curve linear equation, y
= mx + C, and m is the slope of the line.
Lower limit of quantification (LOQ) is defined as the lowest concentration in the standard
curve that can be accurately quantify (Armbruster and Pry, 2008). LOQ was calculated
using the following formula:
𝐿𝑂𝑄 =10 𝜎
𝑚 Equation 2.3.3
Where, σ is standard deviation of the residuals of the calibration curve linear equation, y
= mx + C, and m is the slope of the line.
LOD and LOQ for CP20 spiked into blanked plasma were approximately 0.5 and 2 µM
(Table 2.3.1). On the other hand, LOD and LOQ for CP20 spiked into brain homogenate
were about twice the value in plasma (Armbruster and Pry, 2008). Therefore 2 µM and 4
µM were selected as the minimum concentration to construct standard calibration curves
for CP20 spiked into plasma and brain respectively.
Table 2.3.1: LOD and LOQ of CP20 spiked into rat brain and plasma.
Matrices LOD (µM) LOQ (µM)
Plasma 0.55±0.14 1.82±0.46
Brain 1.19±0.14 3.95±0.8
Data are expressed as mean±SEM (n=3 independent standard calibration curve).

CHAPTER 2: MATERIALS AND METHODS
118
Quality control
Three quality controls (QC) that covers low (4 µM), middle (16 µM) and high (64 µM)
concentrations were prepared from the CP20 working solution in 3 different vials for each
concentration. QC samples were prepared by spiking CP20 into blank plasma or brain
homogenate, extracted and analysed by one working day for intraday analysis or by 3
consecutive days for interday analysis. Accuracy gives an information on how far the
obtained concentration derived from the standard calibration curve deviate from the
expected concentration.
% 𝐴𝑐𝑐𝑢𝑟𝑎𝑐𝑦 =[𝑂𝑏𝑡𝑎𝑖𝑛𝑒𝑑]
[𝐸𝑥𝑝𝑒𝑐𝑡𝑒𝑑] 𝑋 100 Equation 2.3.4
Precision gives an information on how close the similarity of the obtained concentration
derived from standard calibration curve.
% 𝑃𝑟𝑒𝑐𝑖𝑠𝑖𝑜𝑛 =𝑀𝑒𝑎𝑛 [𝑂𝑏𝑡𝑎𝑖𝑛𝑒𝑑]
𝑆𝐷 𝑋 100 Equation 2.3.5
Based on the guidelines provided by the US-FDA Bioanalytical Method Validation
Guidance for Industry (2001), accuracy and precision for intraday and interday analysis
should be within ±15-20% from the expected concentration. Intraday and interday analysis
revealed that both accuracy and precision for CP20 spiked into blanked plasma or brain
were within the accepted range as suggested by the guidelines (Table 2.3.2 and Table
2.3.3).
Table 2.3.2: Intraday assay precision and accuracy for CP20 in rat plasma and brain
Matrices Concentration Accuracy (%) Precision (%)
Plasma
4 92.3 3.5
16 109.7 7.5
64 107.3 1.5
Brain
4 84.3 2.5
16 98.2 1.7
64 95.1 2.2
Accuracy represent the mean values (n=3 injection in one day).
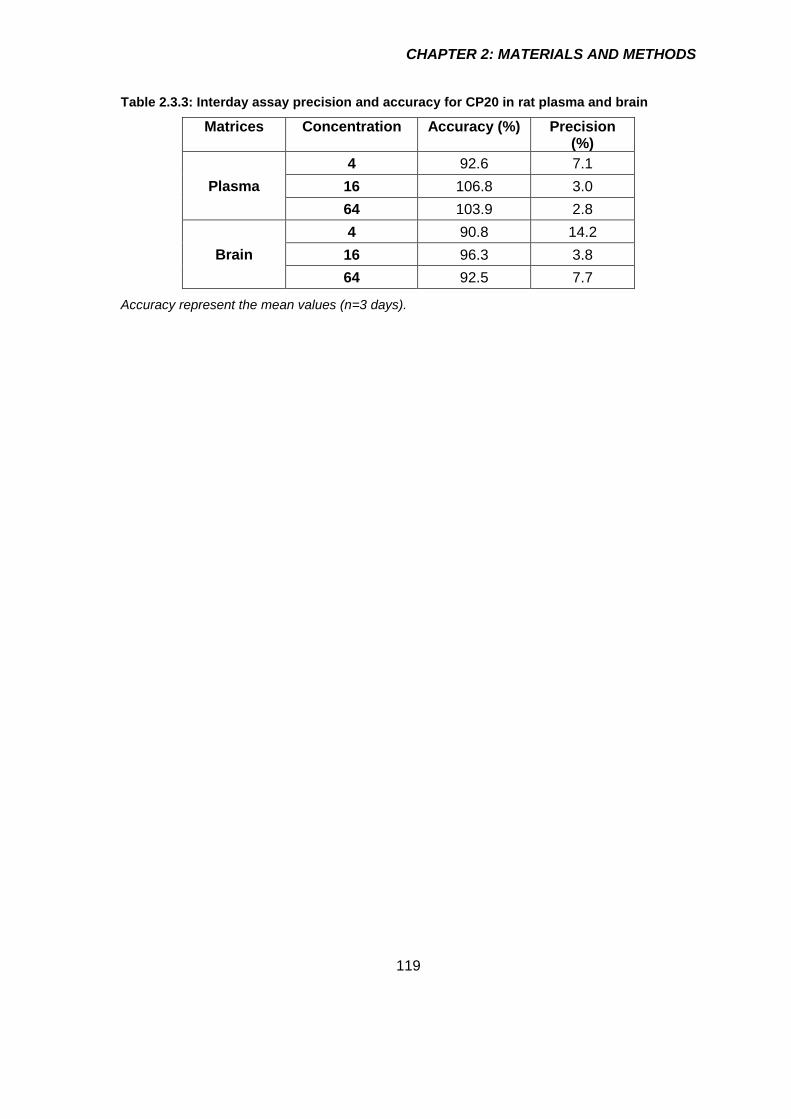
CHAPTER 2: MATERIALS AND METHODS
119
Table 2.3.3: Interday assay precision and accuracy for CP20 in rat plasma and brain
Matrices Concentration Accuracy (%) Precision (%)
Plasma
4 92.6 7.1
16 106.8 3.0
64 103.9 2.8
Brain
4 90.8 14.2
16 96.3 3.8
64 92.5 7.7
Accuracy represent the mean values (n=3 days).

CHAPTER 2: MATERIALS AND METHODS
120
Determination of optimum 6-OHDA dose for striatal
injection in rat
Introduction
PD is pathologically characterised by loss of dopaminergic neurons in basal ganglia
specifically the neurons that made up the nigro-striatal pathway in the midbrain area, with
the cell bodies located within the substantia nigra pars compacta (SNPc) region and the
axons projection terminate in the striatum (Alexander, 2004). In an animal model of PD,
the loss of dopaminergic neurons was induced by injection of toxins either systematically
or directly to the area associated with the nigro-striatal dopaminergic tract (Tieu, 2011,
Bové et al., 2005, Duty and Jenner, 2011). Specific areas in this tract namely striatum,
medial forebrain bundle (MFB) and SNPc have been targeted for induction of cell death
depending on the aim of study (Duty and Jenner, 2011).
Unilateral 6-OHDA rat model is extensively use during the early stage of drug discovery
and development due to the model mirror some of the important aspect of pathogenesis
and biochemistry of PD such as oxidative stress and reduced level of striatal dopamine
and tyrosine hydroxylase (TH) (Duty and Jenner, 2011). 6-OHDA is the metabolite of
dopamine that can generates oxidative stress via mechanism explained in detail in
Section 2.2.1b. One main drawback of the 6-OHDA model is the need of substantial
surgical training to administer the 6-OHDA into the brain using a stereotaxic technique due
to the inability of 6-OHDA to cross the BBB in contrast to other toxins such as 1-methyl-4-
phenyl-1,2,3,6-tetrahydropyridine (MPTP) that can be administered systematically
creating bilateral lesion (Kostrzewa and Jacobowitz, 1974, Duty and Jenner, 2011). On
the other hand, unilateral lesions by stereotaxic technique allow the use of the contralateral
hemisphere as an internal control of cell loss measurement (Duty and Jenner, 2011).
Furthermore, the unilateral 6-OHDA-lesion model shows a rotational pattern ipsiversive or
contraversive to the lesion site when injected with amphetamine or apomorphine
respectively, that can be used as an indicator of lesion severity (Torres and Dunnett, 2007,
Jerussi and Glick, 1975).
For neuroprotection studies, partial unilateral 6-OHDA lesions (40% to 60% cell loss in
SNPc) are often generated to allow the assessment of efficacy of potential disease
modifying agents. By contrast, full lesion (>90% cell loss in SNPc) are more appropriate

CHAPTER 2: MATERIALS AND METHODS
121
to assess drug that is intended for symptomatic relief such as L-DOPA (Duty and Jenner,
2011). This is because, partial lesion represents the early stage of PD where the cardinal
motor symptoms are absent contrary to the full lesion that represents the late stage of PD
where the cardinal motor symptoms are visible. Generation of partial or full lesion of 6-
OHDA model is largely depending on the doses used to create the lesions. Moreover, the
location of the 6-OHDA injection for partial lesion dictate the rate of progression of the
nigral cell loss with striatal injection showing slower progress (maximal cell loss within 3
weeks after lesion) compared to injection into SNPc or MFB that have maximal cell loss
within 2 weeks after the 6-OHDA treatment (Duty and Jenner, 2011).
This section described the method used to create a partial unilateral 6-OHDA-lesioned rat
model of Parkinson’s disease and the subsequent techniques to determine the extent of
cell death. Three doses of 6-OHDA were employed to determine the optimum dose for 6-
OHDA that will be used in in vivo neuroprotection study.
Animals
Male Wistar rats weighing between 225-250 g (Harlan UK Ltd) and were housed between
2-4 rats per cage in the Biological Service Unit (BSU), King’s College London. The rats
were allowed to acclimatise for at least a week after arrival at BSU before the striatal
lesion. Only rats that reached the weight between 250 to 300 g after a week of
acclimatisation were used for the lesion. The conditions of the holding unit at BSU and rat
diet were described in Section 2.1.2. The experiments were approved under Animal
(Scientific Procedure Act) 1986 and performed under the project license number 70/7977.
6-Hydroxydopamine (6-OHDA) preparation
The concentration of 6-OHDA HCl (Sigma-Aldrich, UK) was calculated as a free base and
dissolved in 0.9% (w/v) NaCl (Sigma-Aldrich, UK) containing 0.1% (w/v) L-ascorbic acid
(Sigma-Aldrich, UK) on the day of surgery. Concentrations of 6-OHDA prepared for striatal
injection were 1 mg/mL, 2 mg/mL or 3 mg/mL. Aliquots of 6-OHDA (1000 µL) were
wrapped with aluminium foil to protect from light and was kept on ice. The prepared 6-
OHDA aliquots were used within 6 hours of preparation.

CHAPTER 2: MATERIALS AND METHODS
122
Intrastriatal injection of 6-OHDA
The aliquot of 6-OHDA (1 mg/mL, 2 mg/mL or 3 mg/mL) in a total volume of 4 µL was
injected using a microsyringe into striatum to develop a unilateral lesioned of rat PD model.
The dose for each concentration was listed in Table 2.4.1. The details of the surgical
procedures performed under a sterile condition were outlined below.
Table 2.4.1: The concentrations and doses of 6-OHDA injected into the rat left striatum.
Concentration Dose injected
1 mg/mL 4 µg
2 mg/mL 8 µg
3 mg/mL 12 µg
6-OHDA was prepared in in 0.9% (w/v) NaCl containing 0.1% (w/v) L-ascorbic acid. The dose
volume was 4 µL/rat
Surgery
Rats were anaesthesised with 5% (w/w) isoflurane (IsoFlo®, Abbott, UK), delivered in
100% (w/w) O2 for 2 minutes in an anaesthetic chamber. Anaesthesia was confirmed by
the absence of reflex to toe pinching and eye tapping. Following this, the head of the rat
was shaved, and the rat was secured in a prone position with the ear bars placed
symmetrically into a Kopf® stereotaxic frame (David Kopf Instruments, USA) and tooth-bar
set at -3.3 mm (Paxinon and Watson, 2004). The isoflurane was delivered at 5% (w/w)
through a nose cone to maintain anaesthesia. The temperature was maintained at 37 ºC
during the entire procedure using a homoeothermic blanket with rectal probe. The secured
rat was surgically prepared by disinfecting the scalp with diluted chlorhexidine gluconate
[0.4% (w/v)] (Hibiscrub®, Mölnlycke Health Care Ltd, UK) and followed by s.c. injection
with 1 mg/kg bupivacaine HCl (Marcaine®, AstraZeneca Ltd, UK) at the site of incision.
Eye gel (Viscotears®, Alcon Laboratories Ltd, UK) was generously applied on the rat eyes
to prevent eye dryness during the surgery. Subsequently, the isoflurane flow was reduced
to 3% (w/w). The complete surgical set-up is illustrated in Figure 2.4.1.

CHAPTER 2: MATERIALS AND METHODS
123
Figure 2.4.1: Surgical setup for stereotaxic brain lesion procedure.
Flowing O2 () is mixed with isoflurane in the isoflurane chamber. Blue circuit () is activated for induction of anaesthesia by isoflurane in the anaesthesia induction chamber. Red circuit () is activated once the anaesthetised rat is placed on the heating pad for maintaining of anaesthesia. Flowing isoflurane was terminally adsorbed on the activated charcoal.
Lesion induction
An incision was made on the scalp with a sterile disposable scalpel (SP Services Ltd, UK)
to expose the skull. The skull was cleaned of tissues remnant with the scalpel blade and
cleaned from blood with sterile cotton buds, exposing bregma. During this time, the
isoflurane dose was reduced to and maintain between 1-2% (w/w). Coordinate of the
striatum on the left hemispheres were taken from the bregma according to the rat brain
atlas of Paxinos and Watson (2004): anterior = +1.0 mm, lateral = +3.0 mm, and ventral =
-5.5 mm) (Figure 2.4.2) using a Vernier scale on the stereotaxic frame. A burr hole (0.5
mm ID) was then made in the skull over the lesion site. The needle tip was slowly lowered
to the lesion site, and the left striatum was injected with 6-OHDA (4 µL at 1 µL/min over 4
minutes) using a 10 μL 1701ASRN Hamilton® microsyringe fitted with a 26s-gauge
Hamilton needle (Essex Scientific Laboratory Supplies Ltd, UK). The total amount of 6-
OHDA injected was 4, 8 or 12 µg in a total volume of 4 µL. Sham rats were injected with
vehicle [4 µL of 0.9% (w/v) NaCl containing 0.1% (w/v) L-ascorbic acid] using the same
co-ordinates. The needle was left at the injection site for 4 minutes to ensure complete
diffusion of 6-OHDA into surrounding tissues and prevent reflux along the needle tract and

CHAPTER 2: MATERIALS AND METHODS
124
was then slowly removed. The incision was closed with 16 mm Ethicon-coated vicryl
absorbable sutures (Johnson’s & Johnson’s, UK) and 5% (w/w) prilocaine and lidocaine
cream (EMLATM, AstraZeneca Ltd, UK) was applied on the wound area. Glucose [5% (w/v)
in 0.9% (w/v) NaCl, 10 mL] was injected i.p. to avoid dehydration. Subsequently, the rat
was injected s.c. with 0.01 mg/kg buprenorphine HCl (Alstoe Animal Health, UK). The rat
was taken out from the stereotaxic frame to the pre-warmth cage for recovery before
returning to the housing unit at BSU. Surgical equipment was sterilised with autoclave
machine (Prestige Medical Ltd, UK) prior to and in-between procedures.
Anatomical location From the bregma (mm)
Anterior-Posterior (AP) +1.0
Medial-Lateral (ML) +3.0
Dorsal-Ventral (DV) -5.5
Figure 2.4.2: Site and co-ordinate of left striatum base on Paxinos and Watson (2004) for
intrastriatal injection of 6-OHDA in rat. The red dot () depicts the site of injection in the
striatum.
Post-operative care
Rats were given water-softened pellet and Recovery DietGel® (ClearH2O®, UK) for 3 days
after surgery. The rats were weighed daily until reaching their pre-operative weight. If their
weight was reduced by 5% of their pre-surgery body weight, the rats were injected i.p. with
5% (w/v) glucose in 0.9% (w/v) NaCl. Figure 2.4.3 showed the body weight for rats before
and after the brain lesion procedures. The body weights were slightly decreased a day
after the procedures but slowly regained the pre-surgical body weight 4 to 5 days after the
surgery and were steadily increased afterwards which suggest a good recovery.

CHAPTER 2: MATERIALS AND METHODS
125
0 1 2 3 4 5 6 7
2 2 0
2 4 0
2 6 0
2 8 0
3 0 0
3 2 0
1 0 1 4 1 8
L e s io n
D a y
We
igh
t (g
)
12 g
8 g
4 g
S h am
Figure 2.4.3: Recorded body weight on the day of lesion and after lesioned for up to 14 days.
n=4 rats.
D-amphetamine rotation test
On the day 14th after the lesion, the rats were subjected to D-amphetamine rotation test
using an automated rotometer system (RotoRatTM, Med Associates, Inc., USA). This study
was performed to evaluate the effect of partial-lesioned in the rat striatum as D-
amphetamine induced imbalance in dopamine release from the presynaptic terminal
between intact and lesioned sites. The imbalance of dopamine level between these two
sites induce ipsilateral rotations towards the lesioned site (Torres and Dunnett, 2007).
Figure 2.4.4 illustrates the principles of this behaviour assessment.
Figure 2.4.4: Illustration of the 6-OHDA lesioned in the left striatum and the expected
ipsilateral rotation after injection with D-amphetamine.
To determine D-amphetamine induces rotations, rats were strapped with a tethered jacket
attached to a sensor in the rotometer. The rats were allowed to acclimatise to the
CHAPTER 2: MATERIALS AND METHODS
126
rotometers for 30 minutes after which baseline activity was recorded using the RotoRatTM
hardware and RotoRatTM software Version 2.0 for 30 minutes. Following this, the rats were
injected i.p. with 2.5 mg/kg D-amphetamine sulphate (Tocris Bioscience, UK) prepared in
0.9% (w/v) NaCl and the number of rotations were recorded for 3 hours. The sensor was
set to record the 45˚ rotation in one-minute period. The numbers of complete 360o rotations
were collated into 10-minutes time bin for the total of 3 hours. Data was automatically
recorded into two columns, which display counter-clockwise and clockwise rotations. To
calculate the complete circle rotation (360˚ rotation), the data were divided by eight since
360÷45 = 8 followed by subtracting counter clockwise rotations from clockwise rotations
to give the net ipsilateral rotations per 10 minutes per animal (Figure 2.4.5).
There was no significant different of D-amphetamine induced ipsilateral rotations between
6-OHDA treated group and vehicle treated group (Figure 2.4.5e). The lack of difference
between groups was due to the high variation of rotational behaviour in 6-OHDA-treated
group (Figure 2.4.5b, c, and d). Indeed, this observation is in accordance with previous
reports that showed a lack of relationship between the number of net ipsilateral rotations
and the size of lesion in the unilateral 6-OHDA partial lesion PD model (Hudson et al.,
1993, Hefti et al., 1980).

CHAPTER 2: MATERIALS AND METHODS
127
-5 0 0 5 0 1 0 0 1 5 0
-5 0
0
5 0
1 0 0
1 5 0
2 0 0
T im e (m in )
Ne
t ip
sil
ate
ra
l ro
tati
on
s/1
0 m
inu
te
2 .5 m g /k g
D -a m p h e ta m in e , i.p .R at 1
R a t 2
R a t 3
R a t 4
-5 0 0 5 0 1 0 0 1 5 0
-5 0
0
5 0
1 0 0
1 5 0
2 0 0
T im e (m in )
Ne
t ip
sil
ate
ra
l ro
tati
on
s/1
0 m
inu
te
R at 1
R a t 2
R a t 3
R a t 4
2 .5 m g /k g
D -a m p h e ta m in e , i.p .
a ) S h a m
c ) 8 g 6 -O H D A
-5 0 0 5 0 1 0 0 1 5 0
-5 0
0
5 0
1 0 0
1 5 0
2 0 0
T im e (m in )
Ne
t ip
sil
ate
ra
l ro
tati
on
s/1
0 m
inu
te
R at 1
R a t 2
R a t 3
R a t 4
2 .5 m g /k g
D -a m p h e ta m in e , i.p .
-5 0 0 5 0 1 0 0 1 5 0
-5 0
0
5 0
1 0 0
1 5 0
2 0 0
T im e (m in )
Ne
t ip
sil
ate
ra
l ro
tati
on
s/1
0 m
inu
te
R at 1
R a t 2
R a t 3
R a t 4
2 .5 m g /k g
D -a m p h e ta m in e , i.p .
b ) 4 g 6 -O H D A
d ) 1 2 g 6 -O H D A
e)
Sh
am
4
g/4
L
8
g/4
L
12
g/4
L
0
2 0 0 0
4 0 0 0
6 0 0 0
8 0 0 0
Ne
t ip
sil
ate
ra
l ro
tati
on
AU
C
(0-1
50
min
)
R at 1
R a t 2
R a t 3
R a t 4
Figure 2.4.5: D-Amphetamine rotation test for 6-OHDA unilateral striatal lesioned rat.
Individual net ipsilateral rotation of rat injected with D-amphetamine for a) Vehicle b) 4 µg/µL 6-
OHDA c) 8 µg/µL 6-OHDA and d) 12 µg/µL 6-OHDA. e) The mean AUC of net ipsilateral rotation
for each treatment group. Data are mean+SEM (n=4 rats). 1-way ANOVA analysis showed no
significant different.
Brain fixation
Rats were terminally anaesthetised with 600 mg/kg pentobarbital sodium (Merial Animal
Health Ltd, UK) two-days after D-amphetamine test. The brain was perfused-fixed with 50
mL 4% (w/v) PFA in 0.1 M PBS, pH 7.4 by transcardial perfusion using a 19G needle
attached to a 50 mL syringe. The brain was post-fixed with 4% (w/v) PFA for 3 days. The
fixed brain was then cryoprotected with 30% (w/v) sucrose (Sigma-Aldrich, UK) containing

CHAPTER 2: MATERIALS AND METHODS
128
0.05% (w/v) sodium azide (NaN3; Sigma-Aldrich, UK) in 0.1 M PBS (pH 7.4) until the tissue
sank (~3-5 days).
Brain sections
Coronal sections (30 μm) of rat brains were cut using a freezing microtome (Leica SM
2000R; Leica Biosystem, UK). Substantia nigra pars compacta (SNpc) was sectioned at
the level of the third nerve and striatum was sectioned approximately between -1.4 mm to
2.0 mm AP from the bregma (Paxinos G. & Franklin F., 2004). Striatum sections were
categorised anatomically into caudal (AP: ~-1.4 mm from the bregma), medial (AP: ~1.0
mm from the bregma) and rostral (AP: ~2.0 mm from the bregma). Free floating sections
were collected into 24-well plates (5 sections/well) filled with 0.1 M PBS and 0.05% (w/v)
NaN3 for immunohistochemical staining.
Immunohistochemical staining
Day 1
Coronal brain sections (2-4 sections) of SNPc and striatum were incubated with 0.3% (w/v)
H2O2 in 0.1 M PBS, pH 7.4 (1 mL) for 30 minutes on a shaker to block the endogenous
peroxidase at room temperature. The sections were washed with 0.05% (w/v) Triton-X100
in 0.1 M PBS, pH 7.4 (PBS-T) followed by incubation with 1% (w/v) BSA in PBS-T on a
shaker for at least one hour. Subsequently, the sections were incubated for at least 12h
on a shaker with 1 mL polyclonal rabbit anti-rat tyrosine hydroxylase (TH) primary antibody
(Pel-Freeze Biologicals, USA) prepared in 1% (w/v) BSA in PBS-T [1:500 (v/v) and 1:200
(v/v) dilutions for SNPc and striatum respectively].
Day 2
The sections were washed with 1 mL PBS-T followed by incubation for one hour on a
shaker with 0.5 mL biotinylated goat anti-mouse IgG secondary antibody (Vector
Laboratories, UK) prepared in PBS-T at room temperature. The sections were washed
with 1 mL PBS-T followed by incubation with 1 mL avidin-biotin complex (ABC) reagent
(Vector Laboratories, UK) for 45 minutes on a shaker. Subsequently, the sections were
washed with 0.1M PBS followed by incubation with 1 mL 0.05% (w/v) 3,3'-
diaminobenzidine (DAB) prepared in 0.01% (w/v) H2O2 in 0.1 M PBS for ~3 minutes. The

CHAPTER 2: MATERIALS AND METHODS
129
sections were transferred into 1 mL PBS whereby the washing steps were repeated three
times. Two to four sections were mounted onto coated adhesion slides (Polysine®, Thermo
Scientific, UK) and were dried overnight.
Day 3
Dried sections were dehydrated with three series of increasing ethanol concentrations [70,
98 and 100% (v/v)] for 5 minutes each. Following this, the sections were immersed in
Histoclear® clearing agent (Fisher Scientific, Leicestershire, UK) for 15 minutes.
Immediately after taking out from the Histoclear® solution, the sections were covered with
DePeX mounting medium (VWR International, UK). The sections were covered with a
coverslip (22x50cm; VWR International, UK), and left to dry in fume cupboard overnight.
Quantification of immunoreactive cells
Positively stained TH cells in the SNPc were counted bilaterally from three to five sections
per rat at 10X magnification under a light microscope (Zeiss Axioskop, Carl Zeiss, UK) in
a blinded manner. The number of positively labelled cells was expressed as the mean of
the counts obtained from the representative sections (n=3-5). Positively stained TH cells
in the striatum on the other hand were determined by measuring the optical density (OD)
using ImageJ software (Version 1.32; National Institute of Health, USA) due to the high
density of TH staining in this region (Schneider et al., 2012). SNPc images (Figure 2.4.6)
were taken using the Axio Vision software, powered by the Zeiss Axiocam camera.
Striatum images were taken with DSLR camera (Nikon, Japan) in AV mode (Figure 2.4.8,
top panel).

CHAPTER 2: MATERIALS AND METHODS
130
Figure 2.4.6: Representative photomicograph of brain coronal section at 2.5X magnification
showing basal ganglia.
The oval circle in a) indicates the SNPc region where TH+ cells were counted. Inset a’) shows the
TH+ cells at 10X magnification. The black line on each photomicrograph marks the third cranial
nerve that demarcate the dopaminergic neurons cell bodies in SNPc and VTA.
The percentage of TH+ cells in SNPc relative to the contralateral site after striatal injection
with 4 µg/µL, 8 µg/µL and 12 µg/µL 6-OHDA were 51%, 58% and 65% respectively (Figure
2.4.7). Comparison of the ipsilateral sites in vehicle lesioned group with 6-OHDA lesioned
groups revealed significant different in the percentage of TH+ cells for 4 µg/µL and 8 µg/µL
6-OHDA, but not for 12 µg/µL which only showed a trend towards significant cell loss. It
has been reported by Lee et al. (1996) that the TH+ cells did not necessarily correlate with
the 6-OHDA dose infused into the striatum.

CHAPTER 2: MATERIALS AND METHODS
131
Sh
am
4
g
8
g
12
g
0
5 0
1 0 0
1 5 0
6 -O H D A a m o u n t
Nu
mb
er o
f T
H+ c
ell
s i
n t
he
SN
Pc
***
****
#
##
C o n tr a la te ra l Ip s ila te ra l
Figure 2.4.7: TH+ cell counts in the ipsilateral and contralateral SNPc.
Data are expressed as mean+SEM (n=4 rats). Graph a) ** p < 0.01, *** p < 0.001 compared to the
contralateral hemisphere. # p < 0.05, ## p < 0.01 compared to the ipsilateral hemisphere of vehicle
group (two-way ANOVA followed by Holm-Šídák multiple comparison test).
Analysis of the intensity of TH staining in the caudal, medial and rostral striatum revealed
a substantial lesioned in the medial striatum (AP: 1.0 mm from the bregma) in agreement
with the co-ordinate where 6-OHDA was injected (Figure 2.4.8b, top panel); Paxinos G.
& Franklin F., 2004). The percentage of optical density for TH staining in medial striatum
relative to the contralateral site for 4 µg/µL, 8 µg/µL and 12 µg/µL 6-OHDA were 67%,
52% and 53% respectively (Figure 2.4.8b, bottom panel). Based on these data, 8 µg/4
µL 6-OHDA was selected as the optimum dose to induce partial lesion in the striatum.

CHAPTER 2: MATERIALS AND METHODS
132
TOP
BOTTOM
Sh
am
4
g
8
g
12
g
0
1 0
2 0
3 0
4 0
5 0
6 -O H D A d o s e
OD
of
TH
+ f
ibe
rs
in
th
e s
tria
tum
*
##
# # #
Sh
am
4
g
8
g
12
g
0
1 0
2 0
3 0
4 0
5 0
6 -O H D A d o s e
*
* *
##
##
Sh
am
4
g
8
g
12
g
0
1 0
2 0
3 0
4 0
5 0
6 -O H D A d o s e
*
c o n tra la te ra l
ip s ila te ra l
a ) c a u d a l b ) m e d ia l c ) ro s tra l
Figure 2.4.8: Top panel: Representative photomicrographs of TH+ striatum. Bottom panel:
Optical density for TH immunostaining in a) caudal, b) medial and c) rostral striatum
following intrastriatal administration of varying doses of 6-OHDA.
Data are expressed as mean+SEM (n=4 rats). ** p < 0.01, *** p < 0.001 compared to the
contralateral hemisphere. # p < 0.05, ## p < 0.01 compared to the ipsilateral hemisphere of vehicle
group (two-way ANOVA followed by Holm-Šídák multiple comparison test).

CHAPTER 3: IN SITU BRAIN PERMEABILITY OF HPOs
133
CHAPTER 3
EVALUATION OF NOVEL 3-
HYDROXY-4-PYRIDINONE
BIDENTATE IRON CHELATORS
PENETRATION TO THE BRAIN

CHAPTER 3: IN SITU BRAIN PERMEABILITY OF HPOs
134
3 Evaluation of novel 3-hydroxy-4-pyridinone
bidentate iron chelators penetration to the
brain
Introduction
In pilot clinical trials investigating the effect of orally active hydoxypyridinone (HPO) iron
chelators in PD patients, deferiprone (CP20) has been shown to improve the motor
symptom and slow disease progression (Devos et al., 2014, Abbruzzese et al., 2011).
However, CP20 showed poor efficacy following oral administration as 85% of the
administered dose undergoes extensive metabolism to inactive glucuronide metabolites
(Singh et al., 1992). For this reason, repeated administration of large doses of CP20 (30
mg/kg/day) is required to maintain effective plasma levels. However, large doses of CP20
are associated with agranulocytosis and cytopenia that are prevalent in older patients
(Andres et al., 2002, Mohan et al., 2015, Rajagopal, 2005). Since over 1% of general
population over the age 60 years old are affected with PD (de Lau and Breteler, 2006),
long-term treatment with CP20 is not viable. To overcome this problem, a set of CP20
derivatives with chiral N-hydroxyalkyl substituent (CN compounds) were designed to limit
glucuronidation and showed better efficacy than CP20 after oral administration in rats
(Figure 3.1.1; Hider et al., 2011).
Figure 3.1.1: General chemical structure of CP20 chiral N-hydroxyalkyl derivatives (CN
compounds). Structure in blue shows the main CP20 structure, while structure in red show
additional functional group. Carbon atom marked with * is chiral centre and R represent alkyl
functional group.
Interestingly, these CP20 derivatives exhibited better toxicity profiles than CP20 as
assessed in mice (Hider et al., 2011a). The combination of the better efficacy and reduced

CHAPTER 3: IN SITU BRAIN PERMEABILITY OF HPOs
135
toxicity profiles of the CN compounds prompts further investigation as potential drugs for
the treatment of PD.
In addition to the CN compounds, one derivative of CP20 (CP84) containing a N-phenyl
substituent is also of interest. CP84 has iron affinity constant similar to CP20 and showed
greater brain permeability than CP20 in in vitro study (Fuchs, 2015). CP84 inhibited
aggregation of amyloid-β in presence of metals ion and showed superior antioxidant
activity compare to α-tocopherol and butylated hydroxytoluene (BHT) (Schugar et al.,
2007). However, CP84 has poor brain penetrability, and so was modified to target the BBB
glucose transporter. Glucose transporters are abundantly express at BBB as described
in detail in Section 1.1.9. As a proof of concept to specifically target glucose transporter
at blood-brain barrier (BBB), glucose conjugated CP84 (FCF132) was sucessfully
synthesised (Schugar et al., 2007, Roy et al., 2010) and investigated in these studies.
The ability of theses iron chelators to cross the BBB in order to reach the target site is vital
for potential treatment of PD. Indeed, the positive outcome with CP20 in PD patients was
partly due to its ability to enter the brain via passive membrane diffusion (Glickstein et al.,
2005, Hider et al., 2011b). In fact, CP20 not only chelates excess iron in brain, but also
the CP20-iron complex formed in the brain is also able to permeate out and redistribute
iron to the circulated transferrin in the plasma (Evans et al., 2012, Abbruzzese et al., 2011,
Ayton et al., 2016, Cabantchik et al., 2013). As the BBB is a complex lipid barrier with
multitude of transport mechanisms as described in Section 1.1.9, single alteration in the
CP20 chemical structure could alter brain permeability. The addition of chiral hydroxyalkyl
or phenyl groups on CP20 molecule increase lipophilicity and might consequently improve
simple membrane diffusion of novel HPOs as explained in Section 1.1.9. Likewise,
presence of glucose on HPO molecule might enhance brain permeability via interaction
with specific transporters at BBB. Therefore, it is crucial to determine the brain permeability
for this new set of compounds.
In this study, a set of CP20 derivatives with chiral N-hydroxylalkyl substituent were
evaluated for brain permeability by using in situ brain perfusion technique. In addition to
these chiral N-hydroxyalkyl derivatives, two other HPOs were also evaluated for brain
permeability with one of them specifically target the glucose transporters at BBB.

CHAPTER 3: IN SITU BRAIN PERMEABILITY OF HPOs
136
Hypothesis
It was hypothesised that modification to the structure of CP20 can improve the efficiency
of BBB transport because of increase in lipophilicity or addition of glucose moiety.
Aims
To test this hypothesis, in situ brain perfusion studies were performed with the following
aims:
To evaluate the brain permeability of novel HPO bidentate iron chelators in
comparison with CP20.
To evaluate the effect of chirality of CN compounds to the brain uptake.
To evaluate the contribution of transporters to the HPO brain uptake.
To evaluate the relationship between brain uptake and HPO.

CHAPTER 3: IN SITU BRAIN PERMEABILITY OF HPOs
137
Materials and methods
In situ brain perfusion studies were performed to evaluate the brain permeability of CP84,
FCF132, CN116, CN118, CN126, CN128, CN226 and CN228 (Table 3.2.1). Brain uptake
and rate of brain uptake for all the HPOs were determined and compared with CP20.
Selected HPOs were evaluated for interaction with transporters at BBB by using selective
transport inhibitors. Finally, least-square regression analysis was performed between
HPO brain uptake and selected HPO physicochemical properties namely lipophilicity
(cLogP), molecular weight (MW) and total polar surface area (TPSA). Detailed
methodology is described below.
Animals
Male Wistar rats weighing between 250-300 g (Harlan UK Ltd) and were housed between
2-4 rats per cage at BSU, King’s College London as described in Section 2.1.2.
HPO
Nine HPOs including CP20 (Table 3.2.1) were evaluated for brain permeability using the
validated in situ brain perfusion technique as described in Chapter 2. CP20 was
purchased from Sigma (UK). All other compounds were donated by Professor Robert C.
Hider to perform this study. The synthesis route and potential application of the novel iron
chelators was patented under the patent number EP 2692724 A1 (Hider et al., 2011a).
Brain uptake studies
HPOs listed in Table 3.2.1 were evaluated for their brain permeability. In order to
determine the brain uptake of novel HPOs, in situ brain perfusions were performed with
500 µM HPO as described in Section 2.2.15. Briefly, a polyethylene (PE) cannula was
inserted into carotid arteries of anesthetised and heparinised rat one at a time. Jugular
veins were cut to allow outflow drainage of NRS perfusion fluid from the perfused brain.
After flushing of cerebral blood with perfusion fluid, perfusion with HPO was started for 20
minutes as optimum perfusion time as described in detail in Section 2.1.14. At the end of
20 minutes, the cannulas were removed from the rat carotid arteries and the perfusate
was collected from the end of the cannula for HPO quantification in the perfusate by HPLC.
Following this, the rat was decapitated, the brain was taken out and process as described
in Section 2.1.7 for quantification of HPO in the brain by HPLC.

CHAPTER 3: IN SITU BRAIN PERMEABILITY OF HPOs
138
Table 3.2.1: List of HPOs, their chemical structures and selected physicochemical properties [lipophilicity (cLogP), molecular weight (MW) and total polar surface area (TPSA)].
HPO and chemical structures
CP20
cLogP -0.903
MW
139.1
TPSA 40.5
CP84
cLogP 0.269
MW
201.2
TPSA 40.5
FCF132
cLogP -1.506
MW
363.4
TPSA 119.7
CN116
cLogP -0.496
MW
211.3
TPSA 60.8
CN118
cLogP -0.496
MW
211.3
TPSA 60.8
CN126
cLogP 0.558
MW
273.3
TPSA 60.8
CN128
cLogP 0.558
MW
273.3
TPSA 60.8
CN226
cLogP 1.130
MW
287.4
TPSA 60.8
CN228
cLogP 1.130
MW
287.4
TPSA 60.8
Chemical structure was drawn using ChemDraw Software (Version 15.1; Perkin-Elmer, USA). CP20 chemical
structure was coloured red. Paired of CN compound was enantiomer at chiral carbon (*) with 6-suffixed
indicate S-orientation while 8-suffixed indicate R-orientation.
CHAPTER 3: IN SITU BRAIN PERMEABILITY OF HPOs
139
Brain uptake-inhibition studies
Brain uptake-inhibition study was performed on selected HPO using either substrate
inhibition or specific transporters inhibitor to evaluate the contribution of any transport
mechanism to the brain uptake. CP20, CP84, FCF132, CN118, CN128 and CN226 were
employed on this study.
Concentration-competition study
CP84 (5, 50 or 250 µM) was perfused into the rat brain for 20 minutes to determine whether
uptake was saturable. At the end of 20 minutes, the PE cannulas were removed from the
rat carotid arteries and the perfusate was collected from the end of the cannula for HPO
quantification in the perfusate by HPLC. Following this, the rat was decapitated, the brain
was taken out and process as described in Section 2.1.7 for quantification of HPO in the
brain by HPLC.
Transporter inhibition study
i) CP84: competition with BCH (large neutral amino acid, LAT-1)
analogue
CP84 (50 or 500 µM) was co-perfused with 2-amino-2-norbornanecarboxylic acid (BCH;
Sigma, UK), a known inhibitor for LAT-1 carrier for 20 minutes. The reported concentration
of BCH (10 mM) that sufficiently inhibits LAT-1 was used in this study (Ennis et al., 1998).
At the end of 20 minutes, the PE cannulas were removed from the rat carotid arteries and
the perfusate was collected from the end of the cannula for HPO quantification in the
perfusate by HPLC. Following this, the rat was decapitated, the brain was taken out and
process as described in Section 2.1.7 for quantification of HPO in the brain by HPLC.
ii) FCF132 (glycosylated HPO): Low-glucose study
Experiments with lower concentration of glucose (1 mM) in the perfusate were performed
to reduce substrate competition between glucose and FCF132 for GLUT-1. To support
normal brain physiology and metabolism during perfusion with lower glucose, 1 mM
pyruvate was supplemented in the NRS (Cater et al., 2001). At the end of 20 minutes, the
PE cannulas were removed from the rat carotid arteries and the perfusate was collected
from the end of the cannula for HPO quantification in the perfusate by HPLC. Following

CHAPTER 3: IN SITU BRAIN PERMEABILITY OF HPOs
140
this, the rat was decapitated, the brain was taken out and process as described in Section
2.1.7 for quantification of HPO in the brain by HPLC.
iii) Brain efflux-pump inhibition study for CP20, CN118, CN128 and CN226
Selected HPO namely CP20, CN118, CN128 and CN226 (500 µM) were co-perfused with
a P-glycoprotein (Pgp) efflux-pump inhibitor, cyclosprorin A (CsA) for 20 minutes.
Concentration of CsA used was 5 µM to cause substantive inhibition of Pgp efflux-pump
as reported in literatures (Avdeef and Sun, 2011). At the end of 20 minutes, the PE
cannulas were removed from the rat carotid arteries and the perfusate was collected from
the end of the cannula for HPO quantification in the perfusate by HPLC. Following this,
the rat was decapitated, the brain was taken out and process as described in Section
2.1.7 for quantification of HPO in the brain by HPLC.
Brain uptake calculation
Brain uptake was calculated as described in Section 2.1.11. Brain uptake of total HPO in
whole brain (RBr,u) and capillary depleted brain (RCd,u) were compared to evaluate the HPO
trapping in BCEC. Additionally, brain uptake of unbound HPO in brain (RCd,uu) was used to
describe the pharmacologically active HPO in brain. RCd,uu was transformed to rate of brain
uptake (Kin,Cd,uu) by dividing with total perfusion time as described in Section 2.1.11.
For concentration-competition study with CP84, total flux (Jin,total) was calculated as
follows:
𝐽𝑖𝑛,𝑡𝑜𝑡𝑎𝑙(𝑛𝑚𝑜𝑙/𝑚𝑖𝑛/𝑔) = 𝐾𝑖𝑛,𝐶𝑑,𝑢𝑢 ∗ 𝐶 Equation 3.2.1
Where Kin,Cd,uu is the rate of brain uptake for HPO perfused at a defined concentration, C.
Jin,total was fitted into Michaelis-Menten kinetics which consist of saturable (facilitated
diffusion) and unsaturable (membrane diffusion) components of brain uptake (Pardridge,
1983; Equation 3.2.2):
𝐽𝑖𝑛,𝑡𝑜𝑡𝑎𝑙 = 𝑉𝑚𝑎𝑥 ∗ 𝐶
𝐾𝑚+𝐶+ (𝐾𝑑 ∗ 𝐶) Equation 3.2.2
Where Vmax is the maximal velocity of brain uptake for saturable component, Km is the
concentration of HPO at half-Vmax and Kd is the membrane diffusion constant of
unsaturable component. The Kd was determined by calculating the slope of flux against

CHAPTER 3: IN SITU BRAIN PERMEABILITY OF HPOs
141
concentration for values after saturation using least-square linear regression analysis.
Saturation points are the points which the values did not significantly different from each
other. The Kd was multiplied with C to obtain the brain uptake of unsaturable component,
i.e. membrane diffusion, Dm (Equation 3.2.3).
𝐷𝑚 = 𝐾𝑑 ∗ 𝐶 Equation 3.2.3
Jin,net was obtained by subtracting Dm from Jin,total (Equation 3.2.4).
𝐽𝑖𝑛,𝑛𝑒𝑡 = 𝐽𝑖𝑛,𝑡𝑜𝑡𝑎𝑙 − 𝐷𝑚 Equation 3.2.4
Nonlinear regression analysis (Michaelis-Menten) were performed for Jin,net to obtain Vmax
and Km for facilitated diffusion transport (Equation 3.2.5).
𝐽𝑖𝑛,𝑛𝑒𝑡 = 𝑉𝑚𝑎𝑥 ∗ 𝐶
𝐾𝑚+𝐶 Equation 3.2.5
Relationship between brain uptake and HPOs physicochemical
properties
Brain uptake was plotted against HPO physicochemical properties [lipophilicity (cLogP),
molecular weight (MW) and total polar surface area (TPSA)] derived from ChemDraw
Software (Version 15.1). Least-square linear regression analysis was performed to
investigate the relationship between brain uptake and the physicochemical properties.
Statistical and data analysis
Data from all experiments are presented as mean + or ± standard error of the mean (SEM).
Due to the broad range of experimental design and methods, specific details of statistical
analyses performed on individual data sets will be presented in the context of the data.
Statistical significance was taken as follows: Not significant p > 0.05, * p < 0.05, ** p <
0.01, *** p < 0.001. All statistical analyses were performed using GraphPad Prism 7
(GraphPad Software, Inc, USA).

CHAPTER 3: IN SITU BRAIN PERMEABILITY OF HPOs
142
Results
Brain uptake of novel HPOs
In order to compare the brain permeability of novel HPOs with CP20, in situ brain perfusion
with the novel HPOs (500 µM) was performed for 20 minutes in rats. Brain uptake of total
HPO in whole brain (RBr,u) and in capillary depleted brain (RCd,u) was calculated by finding
a ratio between the total concentration of HPO in brain and unbound HPO in perfusate as
described in Section 2.1.11. All the HPO evaluated penetrated the brain to some extent
except FCF132 (Figure 3.3.1). RBr,u showed the sum of brain uptake of total HPO in brain
capillary endothelial cells (BCEC) and brain parenchyma. On the other hand, RCd,u showed
brain uptake of total HPO only in brain parenchyma. There were no significant differences
between RBr,u and RCd,u; F (16, 87) = 5.218, for all of the HPOs perfused which indicate no
trapping in BCEC. For this reason, only uptake into capillary depleted brain will be
considered from this point.
CP
20
CP
84
FC
F132
CN
116
CN
118
CN
126
CN
128
CN
226
CN
228
0
1 0
2 0
3 0
5 0
1 0 0
1 5 0
2 0 0
Bra
in u
pta
ke
(%
) R C d , u
R C d , u u
R B r , u$ $ $
* * **
# # #
#
Figure 3.3.1: Brain uptake of HPO iron chelators for total HPO in whole brain (RBr,u), total
HPO in capillary depleted brain (RCd,u) and unbound HPO (RCd,uu) in capillary depleted brain
over 20 minutes in situ brain perfusion.
Data are expressed as mean+SEM (n=3-10 rats).* p < 0.05, *** p < 0.001 HPOs RCd,u compared to CP20
RCd,u. # p < 0.05, ### p < 0.001 HPOs RCd,uu compared to CP20 RCd,uu. $$$ p < 0.001 compared between
RCd,u and RCd,uu. No significant different, p > 0.05 compared i) between RBru and RCdu for matched HPO ii)
between RCd,uu for enantiomer pair; CN116 vs CN118, CN126 vs CN128, CN226 vs CN228 (2-way ANOVA
followed by Holm-Šídák multiple comparison test).

CHAPTER 3: IN SITU BRAIN PERMEABILITY OF HPOs
143
Brain uptake of total HPO in capillary depleted brain (RCd,u) includes the bound and
unbound HPO in the brain parenchyma, therefore, it describes brain uptake beyond BBB
and the affinity of HPO towards brain tissue (Figure 3.3.1). RCd,u for CP84 was
considerably greater than CP20 (7.1-fold). FCF132 however was undetectable in brain
after perfusion despite having glucose moiety attached to the parent molecule. CN116,
CN118, CN126, CN128, CN226 and CN228 brain uptake showed no significant different
compared to CP20. In addition, enantiomer pair of CN compounds (CN116 vs CN118;
CN126 vs CN128; CN226 vs CN228) were also not different from each other, without any
trend towards significant.
Brain uptake for unbound HPO in brain (RCd,uu) described the uptake of pharmacologically
relevant HPOs in brain tissue since only unbound HPO can chelate iron (Figure 3.3.1).
The RCd,uu to RCd,u ratio for matched HPOs reflect the unbound portion of HPOs in the brain.
The RCd,uu to RCd,u ratio for CP20 and CN116 were 1.0, and therefore were 100% unbound
in the brain. The RCd,uu to RCd,u ratio for CP84, CN118, CN128, CN226 and CN228 were
between 0.62 to 0.69 which translate into 62% to 69% unbound HPOs in the brain. The
RCd,uu to RCd,u ratio for CN126 was the lowest among all HPOs, which was 0.56 (56%
unbound in brain). Statistically, the unbound CP20 in the brain (RCd,uu) was not significantly
different from the total CP20 in the brain (RCd,u). Likewise, all other HPOs were also
showed no significant difference except for CP84 where the RCd,uu was 1.6-fold lower than
the RCd,u. Comparison of RCd,uu for HPOs with CP20 revealed that only RCd,uu for CP84 was
higher than CP20 by 4.5-fold, while RCd,uu for other HPOs were not significantly different
than CP20, although RCd,uu for CN116, CN118 and CN126 tended to be reduced
suggesting a trend towards lower brain uptake than CP20. Additionally, RCd,uu and RCd,u for
CN compounds enantiomer pair was not different from each other.
The rate of brain uptake for unbound HPO in brain (Kin,Cd,uu) was calculated as described
in Section 2.1.11. The Kin,Cd,uu ranked from the fastest to the slowest was:
CP84>CN226>CN228>CP20>CN128>CN126>CN116>CN118<FCF132 (Table 3.3.1).
The Kin,Cd,uu for CP84 was 4.5-fold faster than CP20. The Kin,Cd,uu for CN128, CN226 and
CN228 were not different than CP20. On the other hand, the Kin,Cd,uu for CN126, CN116
and CN118 were 3.6-, 5.2- and 9.4-folds slower than CP20. Additionally, Kin,Cd,uu for CN
compounds enantiomer pair was not different from each other.

CHAPTER 3: IN SITU BRAIN PERMEABILITY OF HPOs
144
Table 3.3.1: Rate of brain uptake for unbound HPO in brain (Kin,Cd,uu) over 20 minutes in situ
brain perfusion.
HPOs Kin,Cd,uu (µL/min/g) n
CP20 9.4±1.1 10
CP84 42.3±2.6 5
CN116 1.8±0.4 3
CN118 1.0±0.2 3
CN126 2.6±0.6 3
CN128 5.6±1.1 3
CN226 7.2±1.9 3
CN228 7.1±0.4 3
Data are expressed as mean±SEM (n=3-10 rats). * p < 0.05, ** p < 0.01, *** p < 0.001 compared to CP20. No
significant different, p > 0.05 when enantiomer pair was compared; CN116 vs CN118, CN126 vs CN128,
CN226 vs CN228 (1-way ANOVA followed by by Holm-Šídák multiple comparison test).
HPO brain uptake relationship with lipophilicity (cLogP)
Lipophilicity plays an important role in brain uptake for molecules that are not a substrate
for any transporters via passive membrane diffusion and can be used to investigate the
mechanism of HPOs transport across BBB. Predicted lipophilicity (cLogP) was employed
in this study as a measured of HPOs lipophilicity. CP84 and CN compounds were between
3 to 108-folds more lipophilic than CP20. On the other hand, FCF132 was 4-fold less
lipophilic than CP20 (Figure 3.3.2).
In order to see a relationship between HPO brain uptake and cLogP, least-square linear
regression analysis was performed on the plot of HPO RCd,uu against cLogP (Figure 3.3.2).
Overall the HPOs RCd,uu tended to have a positive linear relationship with cLogP although
this was not significant. However, when comparing the CN compounds alone, there was
a significant linear relationship with cLogP.
*** *
**
*

CHAPTER 3: IN SITU BRAIN PERMEABILITY OF HPOs
145
-2 -1 0 1 2
0
1 0
2 0
3 0
4 0
7 0
8 0
9 0
1 0 0
CP2 0
CP8 4
FCF1 3 2
CN1 1 6
CN1 1 8 CN1 2 6
CN1 2 8
CN2 2 6CN2 2 8
c L o g P
RC
d,u
u (
%)
a) Black line
(all HPOs)
b) Blue line
(CN compounds only)
r2 0.0625 0.6444
df 36 16
p 0.1391 <0.0001
Figure 3.3.2: Regression analysis of RCd,uu plotted against HPO lipophilicity (cLogP).
Black circle () represents RCd,uu for HPO. Black line ( ) represents best-fit line for least-square regression
analysis on compounds represented by black circle (). Blue dotted line (…) represents best-fit line for least-
square linear regression analysis performed on CN compounds. HPOs cLogP were obtained using a
ChemDraw Software version 15.1. Data are expressed as mean±SEM (n=3-5 rats). Significant difference (*)
for least-square linear regression analysis was set at p <0.05. Co-efficient of variation (r2), degree of freedom
(df: n-2) and p values for all lines were calculated using GraphPad Prism 7 software.
Brain uptake-inhibition studies
To evaluate the contribution of transporters to the brain uptake of HPOs, selected HPOs
were perfused with inhibitors of the proposed transporters. In addition, FCF132, an HPO
that has a glucose moiety conjugated to the pyridinone ring (Table 3.2.1), was also
evaluated for uptake in a lower non-physiological concentration of glucose in order to
determine if glucose in the perfusion fluid was inhibiting or competing for the glucose
transporter (GLUT1).
*

CHAPTER 3: IN SITU BRAIN PERMEABILITY OF HPOs
146
Evaluation of the carrier-mediated uptake of CP84 into brain
CP84 showed a very high uptake into the brain compared to CP20 suggesting that it might
be carrier-mediated. To ascertain whether CP84 was carrier-mediated by a specific
transporter into the brain, a range of concentrations of CP84 (5-500 µM). RCd,uu for group
perfused with 5 µM CP84 was 2.1-fold higher compared to brain uptake for group perfused
with 500 µM CP84 (Figure 3.3.3). There was no different in RCd,uu for the groups perfused
with 50 and 250 µM CP84 compared to group perfused with 500 µM CP84 which indicate
saturation of transporter. There was a concentration related decrease in RCd,uu, such that
with increasing concentration RCd,uu values reduced up to 250 µM. there was no further
reduction when CP84 concentration was increased to 500 µM suggesting saturation of the
transporter.
550
250
500
0
5 0
1 0 0
1 5 0
2 0 0
2 5 0
C P 8 4 (M )
RC
d,u
u (
%)
* *
Figure 3.3.3: Self-inhibition study for CP84 at various concentrations
Data are expressed as mean+SEM (n=3-5 rats). The 500 µM CP84 data was taken from Figure 3.3.1. ** p
< 0.01 compared to group perfused with 500 µM CP84 (1-way ANOVA followed by Dunnett’s test).
There was a concentration-related decrease in rate of uptake with increasing
concentration of CP84. The rate of uptake (Kin,Cd,uu) for 50 and 250 µM CP84 showed no
different with CP84 Kin,Cd,uu perfused with 500 µM CP84 (Table 3.3.2). In contrast, CP84
Kin,Cd,uu perfused with 5 µM CP84 was 2.1-fold faster than CP84 Kin,Cd,uu perfused with 500
µM CP84.

CHAPTER 3: IN SITU BRAIN PERMEABILITY OF HPOs
147
Table 3.3.2: Rate of brain uptake for total CP84 in brain (Kin,Cd,uu) over 20 minutes in situ brain
perfusion with various concentration of CP84.
CP84 (µM) Kin,Cd,uu (µL/min/g) n
5 87.8±11.0 3
50 57.0±8.1 4
250 32.0±7.3 3
500 42.3±2.6 5
Data are expressed as mean±SEM (n=3-5 rats). ** p < 0.01 compared to group perfused with 500 µM CP84
(1-way ANOVA followed by Dunnett’s test).
RCd,uu was converted to total flux that described the velocity of CP84 uptake at different
concentration as showed in Figure 3.3.4. The membrane diffusion constant, Kd for CP84
flux determined by the slope of unsaturable component (Figure 3.3.4, blue line) was
29.6±0.8 µL/min/g. CP84 flux at 50 µM concentration showed initial saturation of the
uptake process. Non-linear regression analysis following a Michaelis-Menten kinetics was
performed on the saturable component to obtain the maximum velocity (Vmax) and half-
maximal concentration (Km) of CP84 transport (Figure 3.3.4, red line). Vmax and Km for
CP84 transport was 13.1±3.5 nmol/min/g and 135.7±2.8 µM respectively.
0200
400
600
0
1 0
2 0
3 0
C P 8 4 (M )
Flu
x
*
S a tu ra b le (n m o l/m in /g )
U n s a tu ra b le (L /m in /g )
T o ta l f lu x (n m o l/m in /g )
Figure 3.3.4: CP84 flux derived from bar graph in Figure 3.3.4.
Least-square linear regression analysis was performed on the unsaturable component () of CP84 flux to
obtain membrane diffusion constant, Kd. For unsaturable component (), the SEM were very small compared
to the scale and was not visible in the graph. Nonlinear regression analysis following a Michaelis-Menten
model was fitted for saturable component (∆) of CP84 flux to obtain Vmax and Km. Data are expressed as
mean±SEM (n=3-5 rats). * p < 0.05, compared to group perfused with 500 µM CP84 of the saturable
component (1-way ANOVA followed by Dunnett’s test).
**
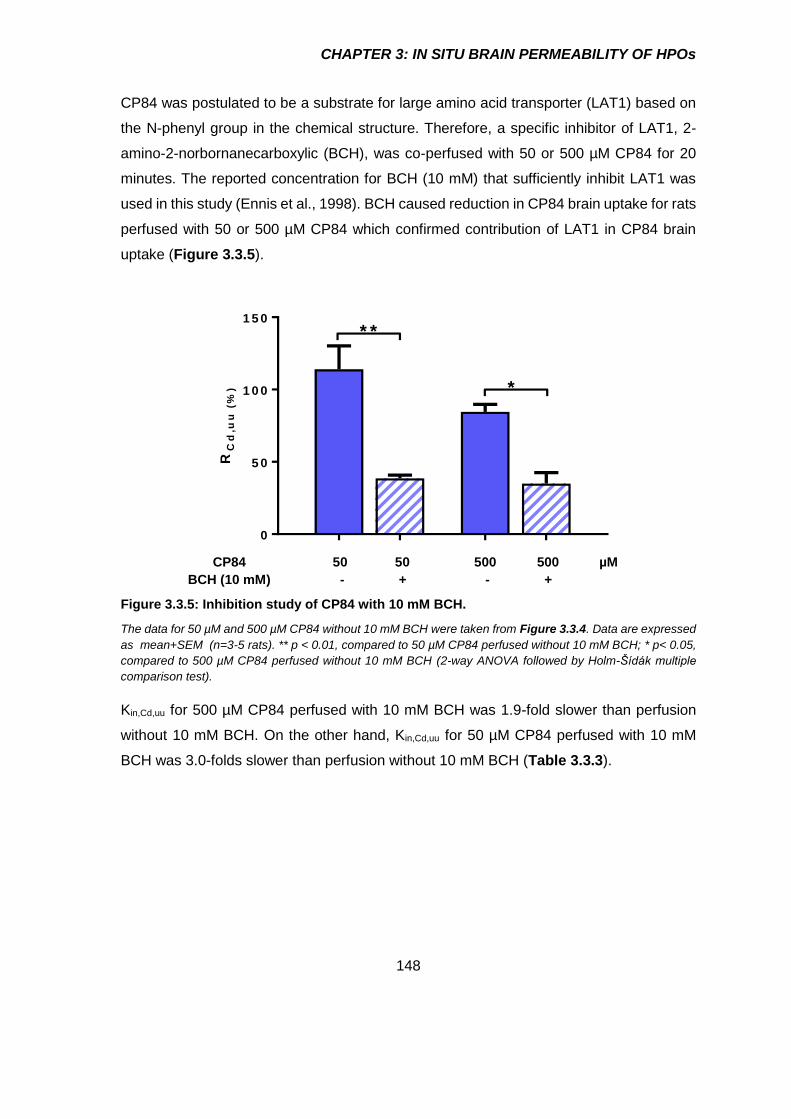
CHAPTER 3: IN SITU BRAIN PERMEABILITY OF HPOs
148
CP84 was postulated to be a substrate for large amino acid transporter (LAT1) based on
the N-phenyl group in the chemical structure. Therefore, a specific inhibitor of LAT1, 2-
amino-2-norbornanecarboxylic (BCH), was co-perfused with 50 or 500 µM CP84 for 20
minutes. The reported concentration for BCH (10 mM) that sufficiently inhibit LAT1 was
used in this study (Ennis et al., 1998). BCH caused reduction in CP84 brain uptake for rats
perfused with 50 or 500 µM CP84 which confirmed contribution of LAT1 in CP84 brain
uptake (Figure 3.3.5).
0
5 0
1 0 0
1 5 0
RC
d,u
u (
%)
* *
*
CP84 50 50 500 500 µM
BCH (10 mM) - + - +
Figure 3.3.5: Inhibition study of CP84 with 10 mM BCH.
The data for 50 µM and 500 µM CP84 without 10 mM BCH were taken from Figure 3.3.4. Data are expressed
as mean+SEM (n=3-5 rats). ** p < 0.01, compared to 50 µM CP84 perfused without 10 mM BCH; * p< 0.05,
compared to 500 µM CP84 perfused without 10 mM BCH (2-way ANOVA followed by Holm-Šídák multiple
comparison test).
Kin,Cd,uu for 500 µM CP84 perfused with 10 mM BCH was 1.9-fold slower than perfusion
without 10 mM BCH. On the other hand, Kin,Cd,uu for 50 µM CP84 perfused with 10 mM
BCH was 3.0-folds slower than perfusion without 10 mM BCH (Table 3.3.3).

CHAPTER 3: IN SITU BRAIN PERMEABILITY OF HPOs
149
Table 3.3.3: Rate (Kin,Cd,uu) of CP84 brain uptake co-perfused with 10 mM BCH over 20
minutes in situ brain perfusion.
CP84 Kin,Cd,uu (µL/min/g)
No BCH 10 mM BCH
50 µM 57.0±8.1 19.3±1.1
500 µM 42.3±2.6 17.4±3.8
Data are expressed as mean+SEM (n=3-5 rats). * p< 0.05 compared to 500 µM CP84 perfused without 10
mM BCH, ** p < 0.01 compared to 50 µM CP84 perfused without 10 mM BCH; (2-way ANOVA followed by
Holm-Šídák test multiple comparison test).
Evaluation of FCF132 uptake into brain in low glucose
In the previous section (Section 3.3.1), it was revealed that FCF132 failed to get into the
brain. It was postulated that the physiological concentration of glucose (10 mM) might
competitively inhibited the GLUT-1 transporter. Therefore, a lower concentration of
glucose was used in the perfusion fluid (1 mM). Perfusion fluid was supplemented with 1
mM pyruvate to compensate the lower glucose to support normal brain metabolism (Broer
et al., 1998). It was determined from this experiment that none of the FCF132 was detected
even though when lower concentration of glucose was used (Figure 3.3.6).
a ) P e r fu s a te (5 0 0 M ) b ) P e r fu s e d w h o le b ra in
0 1 2 3 4 5 6 7 8 9 1 0 1 1 1 2 1 3 1 4 1 5
0
5 0 0
1 0 0 0
1 5 0 0
FC
F1
32
He
igh
t (m
.AU
)
0 1 2 3 4 5 6 7 8 9 1 0 1 1 1 2 1 3 1 4 1 5
0
5 0 0
1 0 0 0
1 5 0 0
c ) P e r fu s e d c a p illa ry d e p le te d b ra in
0 1 2 3 4 5 6 7 8 9 1 0 1 1 1 2 1 3 1 4 1 5
0
5 0 0
1 0 0 0
1 5 0 0
R e te n tio n tim e (m in )
He
igh
t (m
.AU
)
d ) B la n k (b ra in )
0 1 2 3 4 5 6 7 8 9 1 0 1 1 1 2 1 3 1 4 1 5
0
5 0 0
1 0 0 0
1 5 0 0
R e te n tio n tim e (m in )
Figure 3.3.6: Chromatograms of FCF132 in lower glucose condition a) FCF132 perfusate b)
FCF132 perfused whole brain c) FCF132 perfused capillary depleted brain d) blank (whole
brain). FCF132 retention time was ~6.7 minute.
**
*

CHAPTER 3: IN SITU BRAIN PERMEABILITY OF HPOs
150
Evaluation of the affinity of CP20, CN118, CN128 and CN226 for the Pgp efflux
pump
In order to determine the role of the Pgp efflux pump in brain uptake, CP20, CN118, CN128
and CN226 were co-perfused with 5 µM CsA, a Pgp efflux-pump inhibitor. RCd,uu for CP20,
CN118 and CN128 co-perfused with CsA were not different from RCd,uu for CP20, CN118
and CN128 perfused without CsA (Figure 3.3.7). By contrast RCd,uu for CN226 co-perfused
with CsA were increased by 2.1-fold compared to RCd,uu for CN226 perfused without CsA.
This observation confirmed that CN226 is a substrate for PgP efflux pump. RCd,uu for
CN226 co-perfused with CsA was 2.1- and 2.6-folds higher than RCd,u for CP20 perfused
without and with CsA respectively. Conversely, RCd,uu for CN118 perfused without CsA
were 7.5-fold lower than RCd,uu for CP20 perfused without CsA.
0
1 0
2 0
3 0
4 0
5 0
RC
d,
uu
(%
)
5 0 0 M
C N 118
5 0 0 M
C N 226
5 0 0 M
CP20
5 0 0 M
C N 128
#
*
$ $
$ = 0 .6 7
CsA
(5 µM) - + - + - + - +
Figure 3.3.7: Effect of Pgp inhibitor on the brain uptake of selected HPOs.
The data for 500 µM CP20, CN118, CN128 and CN226 without 5 µM CsA were taken from Figure 3.3.2. Data
are expressed as mean+SEM (n=3-5 rats). * p< 0.05 compared to group perfused without 5 µM CsA. # p <
0.05 compared to CP20 perfused without 5 µM CsA. $$ p < 0.01 compared to CP20 perfused with 5 µM CsA
(two-way ANOVA followed by Holm-Šídák multiple comparison test).
Kin,Cd,uu for CP20, CN118 and CN128 co-perfused with CsA were not different from Kin,Cd,uu
for CP20, CN118 and CN128 perfused without CsA (Table 3.3.4). In contrast, Kin,Cd,uu for
CN226 co-perfused with CsA were faster by 2.0-fold compared to Kin,Cd,uu for CN226
perfused without CsA. This observation confirmed that CN226 were substrates for Pgp

CHAPTER 3: IN SITU BRAIN PERMEABILITY OF HPOs
151
efflux pump transporters. Kin,Cd,uu for CN226 co-perfused with CsA was 1.6-fold faster than
Kin,Cd,uu for CP20 with CsA. Conversely, Kin,Cd,uu for CN118 without CsA were 9.9-fold slower
than Kin,Cd,uu for CP20 without CsA.
Table 3.3.4: Rate (Kin,Cd,uu) of selected HPOs brain uptake co-perfused with 5 µM CsA over 20
minutes in situ brain perfusion.
HPO
(500 µM)
Kin,Cd,uu (µL/min/g)
No CsA 5 µM CsA
CP20 9.4±1.1 8.8±1.3
CN118 1.0±0.2 2.1±0.04
CN128 5.6±1.1 3.0±0.2
CN226 7.2±1.9 15.1±2.8
Data are expressed as mean±SEM (n=3-5 rats). * p < 0.05 compared to group perfused without 5 µM CsA.
# p < 0.05 compared to CP20 perfused without 5 µM CsA. $$ p <0.01 compared to CP20 perfused with 5 µM
CsA (2-way ANOVA followed by Holm-Šídák multiple comparison test).
Relationship of brain uptake with physicochemical properties
before and after inhibition studies.
Brain uptake (RCd,uu) of HPOs before and after inhibition studies were plotted against their
physicochemical properties namely lipophilicity (cLogP), molecular weight (MW) and total
polar surface area (TPSA) followed by analysis with least-square linear regression
analysis (Figure 3.3.8).
Initially, there was no significant relationship between RCd,uu for HPOs and cLogP.
However, after transport inhibition study with selected HPOs, a positive relationship
emerged between RCd,uu and cLogP that was statistically significant (Table 3.3.8a).
MW for novel iron chelators are between 1.4- to 2.6-folds higher than CP20. There was
no significant relationship between RCd,uu and MW. Transport inhibition with selected HPOs
did not improve the relationship (Table 3.3.8b).
TPSA for CP84 is the same as CP20. TPSA for all CN compounds was 1.5-folds higher
than CP20. FCF132 shows the highest TPSA which is 3.0-fold higher than CP20. There
was a negative relationship between RCd,uu and TPSA both before and after inhibition
studies (Table 3.3.8c).
#
*, $$

CHAPTER 3: IN SITU BRAIN PERMEABILITY OF HPOs
152
Lipophilicity
-2 -1 0 1 2
0
2 0
4 0
6 0
8 0
1 0 0
c L o g P
RC
d,u
u (
%)
C P 2 0
C P 8 4
FC F1 3 2 C N1 1 6
C N1 1 8 C N1 2 6
C N1 2 8 C N2 2 6
C N2 2 8
C P 2 0
C P 8 4
FC F1 3 2 C N1 1 8C N1 2 8
C N2 2 6
B e fo re in h ib it io n
A fte r in h ib it io n
Molecular weight
1 0 0 2 0 0 3 0 0 4 0 0
0
2 0
4 0
6 0
8 0
1 0 0
M W (g /m o l)
C P 2 0
C P 8 4
FC F1 3 2C N1 1 6 C N1 1 8 C N1 2 6
C N1 2 8
C N2 2 6C N2 2 8C P 2 0
C P 8 4
FC F1 3 2
C N1 1 8C N1 2 8
C N2 2 6
Red line (control brain
uptake)
Blue line (after inhibition
of uptake or efflux)
r2 0.0903 0.4834
p 0.0668
0.0003
Red line (control brain
uptake)
Blue line (after inhibition
of uptake or efflux)
r2 0.0663 0.0805
p 0.1187
0.2006
Total polar surface area
0 5 0 1 0 0 1 5 0
0
2 0
4 0
6 0
8 0
1 0 0
T P S A (A )
RC
d,u
u (
%)
C P 2 0
C P 8 4
FC F1 3 2
C N1 1 6
C N1 1 8
C N1 2 6
C N1 2 8
C N2 2 6
C N2 2 8
C P 2 0
C P 8 4
FC F1 3 2C N1 1 8C N1 2 8
C N2 2 6
Red line (control brain
uptake)
Blue line (after inhibition
of uptake or efflux)
r2 0.1956 0.3218
p 0.0054
0.0059
Figure 3.3.8: Regression analysis of brain uptake of total HPO in brain (RCd,u) plotted
against HPO physicochemical properties.
Graphs show selected HPO RCd,uu plotted against a) lipophilicity (cLogP) b) molecular weight (MW), c) total
polar surface area (TPSA). Red circle () represents RCd,uu before perfusion with transport inhibitors. Blue
square () represents RCd,uu after perfusion with transport inhibitors. Red dotted line (…) represents best-
fit line for regression analysed on compounds represented by red circle (). Blue dotted line (…) represents
best-fit line for least square-linear regression analysis performed on compounds represented by blue
square (). Data are expressed as mean±SEM (n=3-5 rats). HPO physicochemical properties were
obtained using ChemDraw Software version 15.1. Significant difference (*) for linear regression analysis
was set at p < 0.05. Co-efficient of variation (r2), degree of freedom (Df; n-2) and p values were calculated
using linear-regression analysis.
*
* *

CHAPTER 3: IN SITU BRAIN PERMEABILITY OF HPOs
153
Discussion
In situ brain perfusion was performed in rats in this study to evaluate the brain permeability
of novel HPO iron chelators compared to CP20. It was hypothesised that the structure
modification of CP20 could enhanced brain uptake. The current study revealed that, of the
seven novel HPOs that permeated the brain, only CP84 showed marked increment
increase in the rate of brain uptake compared to CP20. Indeed, FCF132, which contains
the glucose moiety, was, by contrast unable to cross the BBB.
Summary of the findings
CP20 successfully crossed the BBB by simple membrane diffusion which agrees with
previous finding (Habgood et al., 1999, Hider et al., 2011b, Glickstein et al., 2005). Only
CP84 has a faster rate of brain uptake than CP20 while the three HPOs (CN128, CN226
and CN228) have equal rate of brain uptake with CP20. On the other hand, the rate of
brain uptake for the other three HPOs (CN116, CN118 and CN126) were slower than
CP20. A glycosylated HPO, FCF132 did not permeate the brain at all. There was no
different in the rate of brain uptake for the HPO chiral pair (CN116 vs CN118; CN126 vs
CN128; CN226 vs CN228). Transport inhibition studies showed that CP84 is a substrate
for L-type amino acid transporter-1 (LAT1), while CN226 is a substrate for Pgp efflux
pump. Total polar surface area (TPSA) exhibit the best relationship with the rate of brain
uptake followed by lipophilicity (cLogP). In contrast, molecular weight seems not to play
an important role for this set of compounds. Summary of overall finding was compiled in
Table 3.4.1.

CHAPTER 3: IN SITU BRAIN PERMEABILITY OF HPOs
154
Table 3.4.1: Summary of the findings
Rate of brain uptake Physicochemical properties Unbound
No inhibitor
With influx
inhibitor
With efflux
inhibitor
Lipophilicity (cLogP)
Molecular weight (MW)
TPSA Brain
CP20 + + na nc + + + + + + + +
CP84 + + + + + + + na + + + + + + + + + +
FCF132 nd nd na + + + + + + + + na
CN116 + na na + + + + + + + + + +
CN118 + na nc + + + + + + + + +
CN126 + na na + + + + + + + + + +
CN128 + + na nc + + + + + + + + + + +
CN226 + + na + + + + + + + + + + + + + + +
CN228 + + na na + + + + + + + + + + + +
CP20 is highlighted in green. nc=no change, na=not applicable, nd= not detected.
Legend: + = low; ++ = mild; +++ = moderate; ++++ = high
HPOs that leak into perivascular space (PVS) around brain arterioles and venules, which
exhibits minimal barrier properties, do not penetrate the brain due to the presence of
astrocytic end feet that surround the PVS (Sofroniew, 2015). These astrocytic end feet
form a barrier similar to BBB termed the glial limitans which prevents the entry of HPOs
into brain parenchyma. Additionally, specialised brain structure collectively known as
circumventricular organs (CVOs), which include choroid plexus, are also supplied with
‘leaky capillaries’ (Gross, 1992, Ganong, 2000). However, specialised epithelial wall that
line these structures are sealed with tight junctions likened to BBB, preventing HPOs entry
into brain parenchyma (Gross, 1992, Langlet et al., 2013). Methodologically, these routes
of HPOs penetration has been considered in this study by subtracting the total brain
uptake with the non-permeant BBB marker, 14C-sucrose (Section 2.1.14a). In addition,
highly perfused choroid plexus that are easily accessible anatomically were removed
during brain dissection before the brain homogenisation process to minimise experimental
error (Section 2.1.7).
Brain uptake of CP20
There was no difference in brain uptake of CP20 in brain between whole brain and capillary
depleted brain. The distinction between uptake into whole brain and capillary depleted
brain is important to avoid false positive interpretation of HPO uptake (Paris-Robidas et
al., 2016). This is because, whole brain uptake comprised the HPO contained in brain
capillary endothelial cells (BCEC) and brain parenchyma, whereas capillary depleted brain
uptake showed HPO only in brain parenchyma (Triguero et al., 1990). This data showed

CHAPTER 3: IN SITU BRAIN PERMEABILITY OF HPOs
155
that CP20 did not accumulate in BCEC and successfully traverse beyond BBB into the
brain parenchyma and is in agreement with previous findings of Roy et al. (2010).
After 20 minutes in situ brain perfusion, CP20 was detected in capillary depleted brains
with total and unbound brain uptake of 21%. This study is not the first to report CP20 brain
uptake in rats using in situ brain perfusion method. An in situ brain perfusion with CP20
performed in Wistar rat for 1 minute showed approximately 1% of CP20 perfused get into
the brain (Habgood et al., 1999). Regardless of the lower CP20 uptake due to shorter
perfusion, the rate of uptake per unit time of unbound CP20 in brain was not significantly
different from the current study (12.9±1.2 vs 9.4±1.1 µL/min/g) which confirmed the validity
of this technique across different laboratories. The rate of uptake for CP20 in this study is
comparable to other CNS-targeted drugs such as the serotonin receptor (5HT1) agonist,
rizatriptan (Summerfield et al., 2007) and the anticancer drug, vincristine (Greig et al.,
1990). A recent report on CP20 brain uptake using 20 minutes in situ brain perfusion in
Dunkin-Hartley guinea pigs (Roy et al., 2010) showed 2-fold lower rate of CP20 brain
uptake than previously reported in rats (Habgood et al., 1999). This was probably because
of the interspecies difference as variation in brain uptake of the same drug between Wistar
rats and Dunkin-Hartley guinea pigs can be as high as 7-folds (Tóth et al., 2014). Indeed,
variations in gene sequences and level of protein expression across species including
human may affect the activities of metabolic enzymes and transporters at BBB (Syvanen
et al., 2009). For example, higher concentration of Pgp inhibitor were needed in Guinea
pigs than in rats to achieve a similar increase in brain concentration of a Pgp substrate
(Cutler et al., 2006). However, this does not explain the discrepancy of brain uptake
observed for CP20 between rats and Guinea pig as the current study showed that CP20
was not a substrate for Pgp. This may suggest the differential contribution of other efflux
pumps families or alternatively enhanced brain metabolism in one but not in the other
species (Syvanen et al., 2009). There is no systematic study or evidence on which rodent
species better represents brain uptake in humans, and therefore it is not possible to
conclude which species should be used to determine brain uptake. However, rats pose a
number of advantages over other rodent species due to their wide use to model CNS
associated diseases such as Parkinson’s disease, ischaemic stroke and traumatic brain
injury which means comparison and translation between studies are possible (Duty and
Jenner, 2011, Fluri et al., 2015, Xiong et al., 2013). Nevertheless, it has previously been
reported than brain uptake of CP20 in rats was primarily governed by simple membrane

CHAPTER 3: IN SITU BRAIN PERMEABILITY OF HPOs
156
diffusion as reported by Habgood et. al. (1999), Glickstein et. al. (2005) and Hider et. al.
(2011) which corresponds to the linearity of brain uptake for CP20 for up to 60 minutes
perfusion showed in the current study (Figure 2.1.21).
Brain uptake of novel HPOs
As for CP20, there was no difference in brain uptake of novel HPOs between whole brain
and capillary depleted brain apart from FCF132, these data confirmed the successful
penetration of HPO into the brain parenchyma. FCF132 was not detected in either whole
brain or capillary depleted brain suggesting poor penetration of the BBB. In this section,
brain uptake of novel HPO iron chelators will be discussed.
CP84
Following 20 minutes in situ brain perfusion, CP84, a N-phenyl derivative of CP20
perfused at 500 µM showed remarkably higher brain uptake than CP20. The rate of brain
uptake for unbound CP84 in brain was 87.8±11.0 µL/min/g compared to CP20 (9.4±1.1
µL/min/g). To put this into a perspective, rate of brain uptake for CP84 is comparable to
other CNS active drug such as butanediol (Abbott, 2004), prazosin (Cisternino et al.,
2004), pramipexole (Okura et al., 2007), theophylline (Liu et al., 2004) and tolbutamide
(Murakami et al., 2000). In addition, the rate of brain uptake for CP84 was also comparable
to the essential amino acids, L-lysine and L-glutamine (Smith, 2000).
The high rate of brain uptake for CP84 could not be explained by its lipophilicity, therefore,
it can be concluded that CP84 may entered the brain via a carrier-mediated process in
addition to the passive membrane diffusion. To confirm that CP84 brain uptake was by a
carrier mediated transport, in situ brain perfusion with CP84 were performed for 20
minutes over a wide concentration range to see if at high concentration of CP84, the
transporter was saturated. It was revealed that the rate of brain uptake for CP84 showed
concentration-related decrease suggesting that CP84 brain uptake was carrier-mediated
(Greenwood et al., 1982, Chapy et al., 2016). Interaction with a specific transporter is not
a sole indicator for a high brain uptake at the BBB. Diazepam and sertraline are a perfect
example of CNS active compound that has extremely high rate of brain uptake just by a
simple membrane diffusion and not carrier mediated (Dubey et al., 1989, Badhan et al.,
2014), therefore, it is possible that CP84 is also able to get into the brain via simple

CHAPTER 3: IN SITU BRAIN PERMEABILITY OF HPOs
157
diffusion in addition to the carrier-mediated process. To look on more detail on the
transport kinetics of CP84, the rate of brain uptake was transformed into flux which showed
the velocity of the transport process at the different CP84 concentrations. It was
discovered that after a non-linear regression analysis using Michaelis-Menten model, the
Vmax and Km for CP84 were 13.1±3.5 nmol/min/g and 135.7±2.8 µM respectively. The
second mechanism was non-saturable uptake through membranes diffusion with Kd of
29.6±0.8 µL/min/g. These results confirmed that CP84 crossed the BBB by carrier-
mediated transport process in addition to passive membrane diffusion.
The chemical structure of CP84 is different from CP20 by a single additional phenyl moiety
linked to the main 3-hydroxy-4-pyridinone ring (Table 3.2.1). This phenyl functional group
can potentially interact with L-type amino acid transporter-1 (LAT1) that are abundantly
expressed at the BBB (Boado et al., 1999, Boado et al., 2004). Indeed, several new
compounds and pro-drugs bearing a phenyl group in the chemical structure have been
successfully transported into the brain by targeting LAT1 (Peura et al., 2013, Peura et al.,
2011). Additionally, an established pro-drug in clinic that is used as the main line of
treatment for Parkinson’s disease patients, L-dopa, utilises LAT1 at the BBB (Kageyama
et al., 2000). As the evidence showed that CP84 brain uptake was partly carrier-mediated
and its chemical structure contained N-phenyl group, it was proposed that CP84 is
transported into the brain by means of the N-phenyl group interaction with LAT1 at the
BBB. This appeared to be the case as brain uptake of CP84 was inhibited by BCH, the
specific LAT1 inhibitor. Interestingly after BCH inhibition, the CP84 rate of brain uptake
was about 20 µL/min/g which close to the Kd for CP84 which suggest the mechanism of
CP84 brain uptake was mainly via membrane diffusion during LAT1 inhibition with BCH.
In summary, the strategy of adding phenyl group to the N1 of hydroxypyridinine ring
increased the brain uptake of CP84 compared to CP20 by interaction with LAT1, however,
CP84 was also crossed the BBB via membrane diffusion to a limited extent.
CHAPTER 3: IN SITU BRAIN PERMEABILITY OF HPOs
158
FCF132
The glucose transporter under subfamily 1 (GLUT1) is highly expressed at the BBB to
transport glucose into the brain (Zheng et al., 2010, Ojelabi and Carruthers, 2015, Qutub
and Hunt, 2005, Dwyer and Pardridge, 1993). Due to the high expression of GLUT1 at the
BBB, targeting GLUT1 to enhance brain uptake could be one of the best strategies to
circumvent the BBB. In this study, CP84 was conjugated with a glucose moiety to the 2-
OH pyridinone ring to form FCF132 and evaluated for brain uptake with in situ brain
perfusion. It was expected that brain uptake would be at least comparable to CP84 and
higher than CP20. However, conjugation of glucose moiety to the parent molecules was
showed to be counterproductive as FCF132 was not detected in the brain after 20-minute
perfusion. The chromatogram of rat brain perfused with FCF132 also failed to show the
presence of CP84, a metabolite of FCF132 which its presence might suggest FCF132
permeability into brain followed by metabolism to CP84. Lacking chromatogram peaks for
FCF132 and CP84 in the perfused brain homogenate conclude that FCF132 was not
transported at all. Indeed, it was reported previously that iodinated FCF132 also showed
inability to cross the BBB (Roy et al., 2010). In that study, it was suggested that the addition
of I125 for radioactivity detection might cause steric hindrance for FCF132 interaction to
GLUT1. However, that was not the case, since the current study also showed undetectable
FCF132 in the brain after perfusion. Similar negative outcome has been reported for other
glucosylated HPO iron chelators. Glycosylated CP20 was undetectable in brain in contrast
to the parent molecules which showed about 5% brain uptake (Roy et al., 2010).
Nevertheless, there are reports of successful penetration of drug conjugated with glucose
at BBB (Bonina et al., 2000, Bonina et al., 2003, Chen et al., 2009). In those studies,
different glycol-conjugates such as 7-chlorokynurenic acid (Bonina et al., 2000), dopamine
(Bonina et al., 2003) and ibuprofen (Chen et al., 2009) have been synthesized as
candidates for the treatment of CNS diseases and showed increment in BBB permeability.
From these studies, it was unclear why FCF132 was unable to penetrate the BBB. It may
be that, due to low affinity for GLUT1, FCF132 uptake was blocked by high levels of
glucose in the NRS perfusion fluid. However, following in situ brain perfusion with FCF132
with lower concentration of glucose (1 mM) there was still no evidence of brain uptake.
Due to the mix of report on success and failure of brain penetration by glycol-conjugates,
a close examination of the mechanism of glucose binding to GLUT1 is warranted. This is

CHAPTER 3: IN SITU BRAIN PERMEABILITY OF HPOs
159
because, interaction for correct positioning and orientation of glucose molecules must
occur for succesful transport (Deng et al., 2014). When the chemical structure of FCF132
was examined, the OH group on C3 of the pyridinone ring form a glycosidic bond with the
OH group on C1 of the glucose ring.
According to a study by Mueckler and Makepeace (2009), the OH group on C1 of the
glucose ring is vital for binding into the GLUT1 binding site via hydrogen bonds. Indeed,
evidence based on competitive inhibition studies on erythrocyte GLUT1 showed that OH
groups on C1 and C3 are paramount for glucose binding as they serve as hydrogen bond
acceptor (Figure 3.4.1; Barnett et al., 1975, Carruthers et al., 2009). OH group on C4 is
also capable to form hydrogen bond with GLUT1 and this was supported by the
observation that galactose, which is an epimer of glucose at C4, has 10 times lower
binding affinity than glucose for GLUT1. The most recent model of GLUT1 binding with
glucose produced by Mucklear (2013) showed that OH group on C1, C3, C4 and C6 form
hydrogen bonds with the active site, and this supported the earlier theory (Mueckler and
Makepeace, 2009). Only the OH on C2 is free to form hydrogen bond within the GLUT1
active site. Additionally, it has been shown that bulky substitution of OH at C1 prevent
binding to GLUT1 on the active site, while similar-size substitution at C6 did not
(Carruthers et al., 2009).
a)
b)
Figure 3.4.1: a) Interaction of –OH group on glucose molecule to the GLUT-1 active site. Taken from Mueckler and Makepeace (2009) b) FCF132 chemical structure. The circled OH-functional groups are vital for glucose recognition site at GLUT-1 activite site.

CHAPTER 3: IN SITU BRAIN PERMEABILITY OF HPOs
160
Furthermore, previous reported success of brain penetration of glycosyl conjugate was
when the glucose forms a glycosidic bond with OH on C2 or C6 of glucose ring (Chen et
al., 2009). This might explain the undetectable level of glycosylated CP20 and FCF132 as
both HPOs form glyosidic bond with OH on C1 of glucose ring. Therefore, it seems that,
although the OH on C2 and C6 on glucose ring form a hydrogen bond within the GLUT1
active site, this binding can be compromised for successful glucose transport. Having said
this, the selection of which OH on glucose ring to form the glycosidic bond is highly
important for successful brain penetration of glycosylated HPO. Base on this observation,
it can be concluded that, to design a new compound conjugated with glucose, OH on C2
or C6 of glucose ring would be favourable for successful brain uptake. In summary, the
strategy of adding glucose moiety by forming a glycosidic bond between the 1-OH of
glucose and the 3-OH of hydroxypyridinine ring was counterproductive as it halts the brain
uptake of FCF132 (glycosylated form of CP84). It is already known that free OH-1 of the
glycosyl group is most crucial for the identification of D-glucose by GLUT1 (Thérèse et al.,
1996; Mehdi et al., 1999).
CN compounds (CN116, CN118, CN126, CN128, CN226 & CN228)
The CN compounds can be clustered into three groups namely CN 11, CN 12 and CN 22
based on increasing lipophilicity. Each group contains two iron chelators with chiral alkyl
substituent containing -OH functional group at N1 which are enantiomer pair: [CN 11:
CN116 (S-) and CN118 (R-); CN 12: CN126 (S-) and CN128 (R-); CN 22: CN226 (S-) and
CN228 (R-)]. In this study, brain permeability of the CN compounds was evaluated and
compared to CP20. Additionally, the enantiomer pairs in each group were also compared
to evaluate if there is any effect of optical stereoisomerism in the brain uptake. The results
showed that there was no significant different of rate of brain uptake for CN128, CN226
and CN228 and CP20 compared to CP20. Conversely, CN116 and CN118 showed slower
rate of brain uptake than CP20. Comparison between enantiomer pairs showed no
significant different in brain uptake suggesting that optical stereoisomerism in these set of
molecules did not contribute to variation in brain uptake. Indeed, in general compounds
that crossed the BBB via passive membrane diffusion, optical stereoisomerism seems not
to be an important factor compare to compound that is carrier-mediated (Chang et al.,
2015, Fong, 2015).

CHAPTER 3: IN SITU BRAIN PERMEABILITY OF HPOs
161
The lack of relationship between brain uptake and lipophilicity has been reported
elsewhere (Liu et al., 2011, Summerfield et al., 2007). It has been demonstrated in the
earlier studies that prediction of brain permeability of HPOs based on lipophilicity was not
sufficient (Habgood et al., 1999). In that study, a set of CP20 derivatives with N-alkyl or N-
hydroxyalkyl substituents with lipophilicity higher than CP20 were evaluated for brain
permeability. However, two of the CP20 derivatives with N-hydroxyalkyl substituent that
have lipophilicity 1.2 and 3.0-folds higher than CP20 were not detected in the brain. It was
revealed in the study that only N-alkyl substituent of CP20 with cLogP 2.9- to 466-folds
higher contributed to the positive relationship between brain uptake and lipophilicity. It was
then suggested that the additional -OH caused the formation of extra hydrogen bond with
surrounding water which requires more energy for breaking the bond. This mechanism
contributes to additional barrier for brain penetration (Rafi et al., 2012). Indeed, the total
polar surface area (TPSA) that account for the combined surface area between interaction
of electronegative atom such as oxygen and nitrogen with hydrogen was 1.5-fold higher
than CP20 for all of the CN compounds. Similarly, CN compounds are also a group of
CP20 derivatives with N-hydroxyalkyl substituents which may explain the lack of
relationship between brain uptake and lipophilicity. Moreover, Frieden et al. (2009) have
argued against the traditional notion among the pharmaceutical scientist and clinicians
that lipophilicity was the main driving force of BBB permeation. Their findings showed that
the intermolecular hydrogen bond was the main driving force for the 41 CNS drugs tested
for brain permeability and not the lipophilicity. Their findings were further substantiated by
a larger set of 246 drugs which showed that intermolecular hydrogen bonding was
certainly the primary driving force for brain permeability (Chen et al., 2011).
Nevertheless, although extra hydroxyl group presented additional barrier for brain
permeation, simultaneous increase in lipophilicity which is between 2.6- to 108-folds
higher than CP20 may compensate for this as they were not significantly different than
CP20 rather than not getting into the brain at all. Additionally, the lack of observable brain
uptake for the N-hydroxyalkyl substituent of CP20 in the previous study might partly be
because of the short perfusion time (1 minute) which did not allow sufficient duration of
slowly permeable compounds through passive membrane diffusion. Furthermore, the
study employed UV as the detection method for HPOs levels in brain after separation by
HPLC which was less sensitive for such a short perfusion time compared to detection via
liquid scintillation spectroscopy or mass-spectrometry (MS) (Habgood et al., 1999).

CHAPTER 3: IN SITU BRAIN PERMEABILITY OF HPOs
162
Besides the energy barrier conferred by the extra OH-group on the brain uptake of CN
compounds, the interaction of the CN compounds with efflux pump such as Pgp
abundantly expressed at BBB was also possible (Loscher and Potschka, 2005, Bartels,
2011). Pgp efflux pump are abundantly expressed in rat BBB and is known to favour small
lipophilic molecules as its substrate and lowering BBB permeation which offsetting their
much higher partition into the BBB membrane (Mikitsh and Chacko, 2014, (Friden et al.,
2009, Fridén, 2014). The data revealed that out of the four HPO tested, only CN226 was
showed to be a substrate for Pgp efflux pump where cyclosporin A caused approximately
50% increase in brain uptake. This lead to increase in CN226 brain uptake by 2-folds
compared to CP20. In order to decrease glucuronidation in the liver, CP20 chemical
structure was altered to form CN compounds with the simultaneous increase in total polar
surface area and lipophilicity which showed that increase in total polar surface area
predominantly affect the rate of brain uptake for CN118 and CN126 (Hider et al., 2011a).
However, in the case of CN226, the similarity in the rate of brain uptake compare to CP20
was probably because of the combination of these two factors; the higher intermolecular
hydrogen bond formation with the surrounding H2O that limit brain permeation and the
increase in lipophilicity which made CN226 more permeable to cell membrane but was
then favoured by efflux pumps.
One interesting point to bring up is that, CN 12 and CN 22 group of compounds contained
a phenyl functional group without enhancement of brain uptake seen on CP84. This might
suggest that orientation of the phenyl functional group in these compounds not favour
interaction with a specific carrier-mediated transporter such as LAT1 (Killian and Chikhale,
2001). Rather surprisingly, there was indeed an interaction with LAT1, but without a
subsequent internalisation into the brain (Killian et al., 2007). In summary, brain uptake of
CN compounds was not different to CP20, except for CN226 which showed 2-fold higher
brain uptake in the presence of Pgp efflux pump inhibitor, cyclosprorine A.
Brain distribution of novel HPO iron chelators
CP20 showed negligible non-specific binding to brain tissue which suggest that
theoretically, all CP20 in the brain can chelate iron. This assumption is in line with the free-
drug hypothesis, which stated that only drugs in the unbound form are pharmacologically
relevant (Liu and Chen, 2015). Other novel HPOs except CN116 however, showed a
certain degree of binding to brain tissue. Lipophilicity higher than CP20 for these novel

CHAPTER 3: IN SITU BRAIN PERMEABILITY OF HPOs
163
HPOs could be one of the determining factors to this observation as brain tissue contains
approximately 11% of lipid by weight (Jeffrey and Summerfield, 2007). Indeed, evaluation
of thirty-three CNS active drugs showed less unbound fraction in the brain compared to
plasma which only contain around 0.7% lipid (Maurer et al., 2004). Interestingly, CN118
showed a different profile of binding in the brain tissues compare to its enantiomer CN116
with the former been 60% unbound while the latter been 100% unbound to brain tissues,
although this was not eventually translated into differences between rates of brain uptake
for CN116 and CN118. For some novel HPOs that showed a certain degree of affinity
towards brain tissues, this in turn may be a factor that contributes to the lower iron
chelation activity than CP20. In contrast, affinity of HPOs towards brain tissues could be
therapeutically advantageous for prolong action of iron chelation as the brain tissues act
as a reservoir that continuously released bound HPOs (Loryan and Hammarlund-
Udenaes, 2014).
To summarise, CP20 was superior in term of rate of brain uptake compared to other novel
HPOs as it was not bound to brain tissues. However, for the novel iron chelators, affinity
towards brain tissue may benefit in term of longer exposure in brain tissues.
Advantages and shortcomings of this study
The in-situ brain perfusion technique attempted to overcome the limitation of in vivo
systemic injection for determination of brain permeability which are pharmacokinetically
difficult to interpret due to wide peripheral distribution and metabolism (Boje, 2001, Smith
and Allen, 2003b). Cannulation of carotid arteries in in situ brain perfusion allow direct
delivery of artificial blood containing HPOs to the brain, thus avoiding peripheral
distribution and metabolism (Murakami et al., 2000, Smith and Allen, 2003a). HPOs that
get into the brain after perfusion at an optimum time can be determined by quantification
method such as HPLC. By this technique, lower concentration of HPOs can be used and
HPOs brain uptake can be confidently measured relative to the systemic injection.
Furthermore, this technique offers a flexibility to manipulate the artificial blood for the
identification and characterisation of transporters by inhibitors as described in this
chapter.
This technique is however technically challenging which requires substantial amount of
training for isolation and cannulation of the carotid arteries. Secondly, the perfusion is

CHAPTER 3: IN SITU BRAIN PERMEABILITY OF HPOs
164
performed in anaesthetised rats and therefore does not truly represent brain uptake in
awake animals. Thirdly, the artificial blood does not contain erythrocytes which have pH
buffering capacity and helps in contributing to the viscosity of the actual blood (Boje, 2001,
Jensen, 2004, Windberger et al., 2003). Some of these issues have been addressed in
this study by continuous infusion of oxygen in the artificial blood, adding HEPES to
maintain the pH at physiological level and adding physiological concentration of BSA to
increase the solution viscosity. Data for optimisation as shown in Chapter 2 suggest that
the perfused brain is viable, and the BBB is intact for up to 60 minutes. The capillary
depletion technique to determine HPOs trapped in the brain capillary endothelial cells is
prone to artefacts due to redistribution of trapped HPOs during centrifugation process
(Bickel, 1998). However, this is very unlikely base on the molecular weight of HPOs that
are small (<500 Da).
The UV detection method for HPOs identification in perfused brain after separation by
HPLC in the current study is the least sensitive method for biological measurement. The
best option is by employing MS or MS/MS detection method for analysis. This technique
offer sensitivity down to nanomole and picomole concentration in biological samples
(Avdeef and Sun, 2011, Tabanor et al., 2016). Because of this, lower concentration of
HPOs in artificial blood can be infused to more represent achievable HPOs concentration
in human plasma. However, this requires sophisticated LCMS machine which is not
available in all laboratory. Nevertheless, the current technique employed in this thesis to
determine brain permeability is sufficient for brain uptake comparison between novel
HPOs and CP20, and for determination of contribution of transporter-mediated uptake.
Conclusion
The present study aimed to evaluate the rate of brain uptake of novel HPOs iron chelators
and compare with CP20. From the results obtained, only CP84 showed faster rate of brain
uptake than CP20 while six others novel HPOs showed no difference or slower rate of
brain uptake. The glycosylated HPO FCF132 unexpectedly did not get into the brain at all
suggesting lack of FCF132 affinity towards glucose transporter. Also, the brain uptake for
S- and R- enantiomer pairs of CN compounds did not show any different indicating
stereoisomerism had no effect for these set of compounds. In addition, CP84 was shown
to be a substrate for LAT-1 transporter explaining its increased rate of brain uptake
compared to CP20, while CN226 was a substrate for Pgp efflux-pump suggesting that it

CHAPTER 3: IN SITU BRAIN PERMEABILITY OF HPOs
165
was expelled from the brain after crossing the BBB. There was a positive linear relationship
between brain uptake and lipophilicity only when transporters/pumps were inhibited, while
negative linear relationship between brain uptake and polarity was observed both before
and after inhibition, signifying that polarity is the best descriptors of brain uptake for this
set of compounds. Therefore, in this study, the hypothesis that modification to the structure
of CP20 can improve the efficiency of BBB transport was partly accepted as only CP84
showed increase in the rate of brain uptake compared to CP20 while other novel HPOs
rate of brain uptake were unchanged or lower than CP20.
As a potential neuroprotection agent, brain permeability is only one of the prerequisites.
To select the best candidate as a neuroprotection agent, an evaluation of the
neuroprotective ability of novel HPOs is warranted. Therefore, in the following chapter, the
evaluation of neuroprotection of these novel HPOs with neuroblastoma cell lines, SH-
SY5Y will be covered in detail.

CHAPTER 4: IN VITRO NEUROPROTECTION OF HPOs
166
CHAPTER 4
NEUROPROTECTION STUDY OF
HPOS WITH NEUROBLASTOMA
CELL LINES (SH-SY5Y)

CHAPTER 4: IN VITRO NEUROPROTECTION OF HPOs
167
4 Neuroprotection study of novel HPOS with
neuroblastoma cell line (SH-SY5Y)
Introduction
In the preceding chapter, novel HPO iron chelators were evaluated for their brain
permeability with in situ brain perfusion. As presented in Chapter 3, seven from eight of
the novel HPO iron chelators tested crossed the BBB and get into the brain. Ability to cross
the BBB is a prerequisite for Parkinsonian drugs to elicit their pharmacological effects in
the brain (Smith et al., 2012, Bezard et al., 2013). Iron content in substantia nigra generally
increases by 10-fold at 40 years of age compared to infants without any problem (Reeve
et al., 2014). However, dysfunction of tightly regulated brain iron homeostasis occurs in
PD which cause excessive accumulation of free iron (Double et al., 2000). A rise in the
level of labile iron pool (LIP; Section 1.1.4) subsequently generates free-radicals through
Fenton reaction and induce oxidative stress (Kruszewski, 2003). Oxidative stress has
been implicated in the pathogenesis of PD as described in detail in Section 1.1.4.
Transgenic mice that overexpressed ferritin were less prone to various PD toxins inducers
through sufficient sequestration of LIP (Kaur et al., 2009). This further suggest the use of
iron chelators as a potential treatment for PD (Perez et al., 2008, Mounsey and Teismann,
2012). Indeed, synthetic and natural iron chelators have been shown to slow down disease
progression in in vitro and in vivo PD models by attenuating dopaminergic neurons death
(Mounsey and Teismann, 2012, Hatcher et al., 2009).
Among the clinically available iron chelators (Section 1.1.6), deferiprone (CP20) is the
most promising for PD treatment as it is orally active, can penetrate the brain, the CP20-
iron complex is neutral and can distribute iron to extracellular transferrin (Devos et. al.,
2014). Studies in in vitro and in vivo models of PD showed that CP20 conferred
neuroprotection better than other clinically available iron chelators (Dexter et al., 2011;
Molina-Holgado et. al., 2008; Devos et. al., 2014). In human, CP20 exhibited better motor
performance as early as 6 months after treatment compared to control (Devos et. al.,
2014). Although CP20 is extensively metabolised in the liver, the 3,4-hydroxypyridinone
scaffold of CP20 is easily functionalised for improvement of physicochemical and
biological properties, while retaining their affinity to iron and other important characteristics
for potential PD treatment (Santos et al., 2012).

CHAPTER 4: IN VITRO NEUROPROTECTION OF HPOs
168
To confirm that the brain permeable novel HPOs could also confer neuroprotection, SH-
SY5Y cell line was used to model the dying neurons in this study. SH-SY5Y cell line is a
catecholaminergic which expresses DAT that closely resembles the affected
dopaminergic neurons in the substantia nigra pars compacta (SNPc) in PD brain
(Kovalevich and Langford, 2013b, Filograna et al., 2015). H2O2, 6-OHDA and MG132 were
employed in this study to induce cell death. Selection of these toxins in this study is
relevant due to the reported accumulation of iron in in vitro and in vivo models of PD that
associate with the toxicity of the toxins (Wang et al., 2004, Panopoulos et al., 2005). Apart
from that, ferric ion (Fe3+) in the form of co-ordination complex with NTA (FeNTA) was
used as a direct source of iron and to evaluate the ease of novel HPOs to chelate iron.
Therefore, based on the results from the experiment described in the preceding chapter,
seven of the novel brain penetrant HPOs were chosen along with CP20 for in vitro
neuroprotection study with SH-SY5Y cell lines.
Hypothesis
It was hypothesised that novel HPOs iron chelators would confer protection against H2O2,
6-OHDA, MG132 and FeNTA (1:3) induced toxicity in SH-SY5Y cells.
Aims
To test the hypothesis, SH-SY5Y cells were pre-treated with HPOs before exposing to
toxins with the following aims.
a) Confirm the lack of cell death induced by HPOs iron chelators.
b) Confirm the induction of cell death when exposed to IC50 concentrations of H2O2,
6-OHDA, MG132 and FeNTA (1:3).
c) Compare the effect of novel HPO iron chelators on toxin-induced cell death.
d) Compare the neuroprotection of novel HPO iron chelators with CP20.
e) Compare the neuroprotection between enantiomers pair of novel HPO iron
chelators.

CHAPTER 4: IN VITRO NEUROPROTECTION OF HPOs
169
Materials and methods
SH-SY5Y cells culture
Human neuroblastoma cells line (SH-SY5Y) at passage 18 was obtained from the
European Collection of Cell Cultures (ECCC). The cells were grown in T175 cm2 (T175)
(ThermoFisher, UK) containing 20 mL Dulbecco's Modified Eagle medium (DMEM)
supplemented with 10% (v/v) fetal bovine serum (FBS) and 0.01% (v/v) penicillin-
streptomycin-neomycin (PSN) antibiotic mixture (complete-DMEM) as described in
Section 2.2.3. Briefly, at 80% confluence, the cells were washed with DPBS, trypsinised
with 0.05% trypsin-EDTA in phosphate buffer and centrifuged at 200 g for 5 minutes. The
cell pellet was re-suspended with 1 mL complete-DMEM at a density 1x10⁵ cells/mL. One
hundred microliters of working cell suspension were pipetted into 96-well plates and
incubated in CO2 incubator at 37 ºC for at least 12 h.
Preparation of 3-hydroxy-4-pyridinones (HPOs) solution
Main stock solution for HPOs were dissolved in sterile distilled water, except for CP84
which was dissolved in 10% (v/v) DMSO. HPOs with concentration between 50 to 1250
µM were prepared in serum-free DMEM and were used to incubate with the SH-SY5Y
cells. The final DMSO concentration when exposed to cells was below 1% (v/v).
Preparation of neurotoxins solution
Five different neurotoxins namely H2O2, 6-OHDA, MG132 and FeNTA (1:3) were
employed in this study to induce cell death. The preparation of the toxins was outlined
below:

CHAPTER 4: IN VITRO NEUROPROTECTION OF HPOs
170
H2O2
Working stock solution (2.2 mM) for IC50 concentration of H2O2 (220 µM) was prepared
fresh in serum-free DMEM on the day of the experiment from the 200 mM H2O2 main stock
solution in serum-free DMEM. Left-over of working stock solution was frozen at -20 ºC and
was used within one month after preparation.
6-OHDA
Working stock solution (400 µM) for IC50 concentration of 6-OHDA (40 µM) was prepared
fresh in serum-free DMEM on the day of the experiment from the 40 mM 6-OHDA main
stock solution in serum-free DMEM containing 0.06% (w/v) ascorbic acid. Left-over of
working stock solution was frozen at -20 ºC and was used within one month after
preparation.
MG132
Working stock solution (3500 pM) for IC50 concentration of MG132 (350 pM) was prepared
fresh in serum-free DMEM on the day of the experiment from the 10 mM MG132 main
stock solution in 100% DMSO. Left-over of working stock solution was not re-used as
MG132 lost it activity after freezing-thawing cycles.
FeNTA (1:3)
Working stock solution (4600 µM) for IC50 concentration of FeNTA (1:3) (460 µM) was
prepared fresh in serum-free DMEM on the day of the experiment from the 125 mM FeNTA
(1:3) main stock solution in serum-free DMEM. Left-over of working stock solution was
frozen at -20 ºC and was used within one month after preparation.
In vitro neuroprotection studies
After an overnight incubation in CO2 incubator, the cells were treated with 50, 100, 500
and/or 1250 µM of HPOs in serum-free DMEM and were incubated for 20 h in the CO2
incubator. Control cells were incubated with vehicle in serum-free DMEM. After 20 h
incubation with HPOs, neurotoxins at 10-fold of the IC50 concentration were pipetted into

CHAPTER 4: IN VITRO NEUROPROTECTION OF HPOs
171
the well (11 µL) and incubated for 20 h. When 20 h incubation time had passed, the viable
cells were estimated with MTT assay (Figure 4.2.1).
Figure 4.2.1: Experimental timeline for in vitro neuroprotection study with SH-SY5Y.
Determination of cell viability with MTT assay
Cell viability after SH-SY5Y co-treated with HPOs and toxin was estimated with MTT
assay. After 20 h co-treatment with neurotoxins, the medium was replaced with serum-
free DMEM containing 0.5 mg/mL MTT and incubated for 4 h at 37 ºC in the CO2 incubator.
At the end of the incubation, the medium was removed by quick inversion into the sink and
lightly tapped on paper towel to remove excess liquid. The formed MTT formazan crystal
was solubilised with 100 µL 100% DMSO and absorbance at 570 nm was taken with a
microplate reader. The percentage of viable cells was calculated by finding a ratio between
treated cells and control cells with serum-free DMEM as described in Section 2.2.8.
Comparison between pFe3+ for HPOs and cell viability after
treatment with toxins
The iron (Fe3+) affinity constant (pFe3+) values for HPOs were determined
spectrophotometrically by automated potentiated titration (Kong et al., 2006) and was
provided by Dr Xiao Kong from Institute of Pharmaceutical Science (IPS), King’s College
London. The pFe3+ value is a negative logarithm of free Fe3+ concentration at physiological
pH (pH 7.4) when the total Fe3+ concentration, [Fe3+]total is 1 µM and the total HPO
concentration, [HPO]total is 10 µM. The higher the pFe3+ value indicates a higher affinity
towards Fe3+ ion. The pFe3+ values for HPOs were outlined in Table 4.2.1.

CHAPTER 4: IN VITRO NEUROPROTECTION OF HPOs
172
Table 4.2.1: pFe3+ values for HPOs as determined by potentiometric technique
HPO pFe3+
CP20 20.20
CP84 20.00
CN116 20.40
CN118 20.40
CN126 20.18
CN128 20.18
CN226 19.80
CN228 19.80
pFe3+ at pH 7.4 when [Fe3+]total is 1 µM and [HPO]total is 10 µM
Data analysis
Experiments were performed in at least triplicate on three separate occasion with data
expressed as mean+SEM (n=3). Two-way ANOVA followed by Holm-Šídák multiple
comparison test was performed to compare between cells treated with toxin and cells co-
treated with HPOs and toxin. The same way of analysis was performed to compare
between cells co-treated with CP20 and toxin with the rest of cells co-treated with HPOs
other than CP20, and toxin. Comparisons between enantiomer pairs was also observed
to look for any statistical difference.

CHAPTER 4: IN VITRO NEUROPROTECTION OF HPOs
173
Results
To evaluate the neuroprotective effect of the novel HPOs, the SH-SY5Y cells were pre-
treated with 50, 100 500 or 1250 µM HPOs for 20 h before being exposed to neurotoxins
for a further 20 h. The cell viability of the SH-SY5Y after treatments was assessed by MTT
assay.
Effect of HPOs on viability of SH-SY5Y cells exposed to H2O2
In order to evaluate the neuroprotective ability of novel HPOs, SH-SY5Y cell were treated
with various concentrations of HPOs (50 to 500 µM) with or without the IC50 concentration
of H2O2 (220 µM). Control cells were treated with serum-free DMEM only or H2O2 in serum-
free DMEM. At the end of the treatment, the cell viability was measured by MTT assay as
described in Section 2.2.8.
Treatment of SH-SY5Y cells with 50, 100 and 500 µM HPOs only did not affect cells
viability when compared to untreated control. By contrast, SH-SY5Y cells exposed to 220
µM H2O2 for 20 h showed approximately between 47% to 52% cell viability compared to -
H2O2 (Figure 4.3.1). In general, treatment of SH-SY5Y cells with HPOs 20 h prior to co-
treatment with H2O2 for a further 20 h protected against H2O2-induced loss of cell viability,
but to different degrees.
CP20 protected against H2O2-induced cell loss, with a significant 27% reduction at 100 µM
compared to H2O2 alone (Figure 4.3.1a). By contrast, CP84 co-treated with H2O2 did not
protect against H2O2-induced cell loss at any concentration (Figure 4.3.1b).
Both CN116 and CN118 protected against H2O2 toxicity which was significant at 50 and
100 µM (CN116) and 50 µM (CN118) respectively.
Similarly, CN126 and CN128 appeared to protect against H2O2-induced cell death. CN126
produced a non-concentration-related improvement in cell viability by approximately 30%
compared to H2O2 alone (+H2O2), however the protection following CN128 was not
significant.

CHAPTER 4: IN VITRO NEUROPROTECTION OF HPOs
174
Both CN226 and CN228 produced a significant, non-concentration-related protection of
around 40% compared to +H2O2.
There was no difference in cell viability when the equimolar concentrations of enantiomer
pairs, (CN116 vs CN118, CN126 vs CN128 and CN226 vs CN228), co-incubated with
H2O2 were compared. Likewise, comparison of equimolar concentrations between novel
HPOs and CP20 reveals no significant different.

CHAPTER 4: IN VITRO NEUROPROTECTION OF HPOs
175
Co
nt
50
100
500
Co
nt
50
100
500
0
5 0
1 0 0
1 5 0
Ce
ll v
iab
ilit
y (
% c
on
tro
l)
2 2 0 M H 2 O 2
* * *
#
-H 2 O 2
+H 2 0 2
* *p = 0 .0 6
* *
Co
nt
50
100
500
Co
nt
50
100
500
0
5 0
1 0 0
1 5 0
Ce
ll v
iab
ilit
y (
% c
on
tro
l) -H 2 O 2
+H 2 0 2
* * *
## p = 0 .1 0
2 2 0 M H 2 O 2
* *
Co
nt
50
100
500
Co
nt
50
100
500
0
5 0
1 0 0
1 5 0
Ce
ll v
iab
ilit
y (
% c
on
tro
l)
-H 2 O 2
+H 2 0 2
* * *
# # #
2 2 0 M H 2 O 2
* * * * *
Co
nt
50
100
500
Co
nt
50
100
500
0
5 0
1 0 0
1 5 0
Ce
ll v
iab
ilit
y (
% c
on
tro
l) -H 2 O 2
+H 2 0 2
* * *
# # ## # # # # #
2 2 0 M H 2 O 2
Co
nt
50
100
500
Co
nt
50
100
500
0
5 0
1 0 0
1 5 0
Ce
ll v
iab
ilit
y (
% c
on
tro
l)
-H 2 O 2
+H 2 0 2
* * *
p = 0 .1 0
2 2 0 M H 2 O 2
* *
Co
nt
50
100
500
Co
nt
50
100
500
0
5 0
1 0 0
1 5 0
C o n c e n tra t io n ( M )
Ce
ll v
iab
ilit
y (
% c
on
tro
l) -H 2 O 2
+H 2 0 2
* * *
# # # # # ##
2 2 0 M H 2 O 2
Co
nt
50
100
500
Co
nt
50
100
500
0
5 0
1 0 0
1 5 0
C o n c e n tra t io n ( M )
Ce
ll v
iab
ilit
y (
% c
on
tro
l)
-H 2 O 2
+H 2 0 2
* * *
# # #
# # # #
2 2 0 M H 2 O 2
Co
nt
50
100
Co
nt
50
100
0
5 0
1 0 0
1 5 0
Ce
ll v
iab
ilit
y (
% c
on
tro
l)
2 2 0 M H 2 O 2
-H 2 O 2
+H 2 0 2
* * ** * * * * *
a ) C P 2 0 b ) C P 8 4
c ) C N 1 1 6 d ) C N 1 1 8
e ) C N 1 2 6 f) C N 1 2 8
g ) C N 2 2 6 h ) C N 2 2 8
Figure 4.3.1: Effect of H2O2 on cell viability assessed by MTT assay after pre-incubation with
novel HPO iron chelators.
SH-SY5Y cells were pre-incubated for 20h with HPOs followed by 20h co-incubation with 220 µM H2O2. Data
are expressed as mean+SEM (n=3). ** p < 0.05, *** p < 0.001 compared between HPOs treatments without
H2O2 (-H2O2) and HPOs treatments with H2O2 (+H2O2). # p < 0.05, ### p < 0.001 compared between HPOs
treatments with H2O2 (+H2O2) and control with H2O2 (+H2O2). No significant different, p > 0.05 compared i)
between HPOs treatments without H2O2 (-H2O2) and control without H2O2 (-H2O2) ii) between CP20 treatments
with H2O2 (+H2O2) and novel HPOs with H2O2 (+H2O2) iii) between HPO enantiomer pairs (CN116 vs CN118,
CN126 vs CN128 and CN226 vs CN228) treatments with H2O2 (2-way ANOVA followed by Holm-Šídák
multiple comparison test).

CHAPTER 4: IN VITRO NEUROPROTECTION OF HPOs
176
Effect of HPOs on viability of SH-SY5Y cells exposed to 6-OHDA
SH-SY5Y cell were treated with various concentrations of HPOs (50 to 500 µM) with or
without the IC50 concentration of 6-OHDA (40 µM) prepared in 0.006% (w/v) ascorbic acid.
Control cells were treated with serum-free DMEM containing 0.006% (w/v) ascorbic acid
only or 6-OHDA in serum-free DMEM containing 0.006% (w/v) ascorbic acid. At the end
of the treatment, the cell viability was measured by MTT assay as described in Section
2.2.8.
As expected, treatment of SH-SY5Y cells with 50, 100 and 500 µM HPOs alone did not
affect cells viability when compared to control and exposure to 40 µM 6-OHDA for 20 h
showed between 48 to 57% cell viability which were significantly reduced compared to
control (Figure 4.3.2). Generally, treatment of SH-SY5Y cells with HPOs 20 h prior to co-
treatment with 6-OHDA showed significant protection against 6-OHDA-induced cell loss.
CP20 showed a protection against 6-OHDA toxicity in a concentration-dependant manner
(22% and 51% improvement) at 100 µM and 500 µM respectively (Figure 4.3.2a).
Similarly, CP84 protected against 6-OHDA induced cell death by approximately 30% in a
non-concentration-dependant manner at 50 and 100 µM (Figure 4.3.2b).
CN116, CN118, CN126, CN128, CN226 or CN228 exhibited a non-concentration related
prevention of cell death in between 27 to 41% at all concentrations compared to 6-OHDA
alone (+6-OHDA) (Figure 4.3.2c, d & e).
There was no difference in cell viability when the equimolar concentrations of enantiomer
pairs (CN116 vs CN118, CN126 vs CN128 and CN226 vs CN228), co-treated with 6-
OHDA were compared. However, comparison of equimolar concentrations between novel
HPOs and CP20 co-incubated with 6-OHDA showed that CN118 (50 µM), CN226 (100
and 500 µM) and CN228 (100 and 500 µM) improved cell viability.

CHAPTER 4: IN VITRO NEUROPROTECTION OF HPOs
177
Figure 4.3.2: Effect of 6-OHDA on cell viability assessed by MTT assay after pre-incubation with novel HPO iron chelators.
SH-SY5Y cells were pre-incubated for 20h with HPOs followed by 20h co-incubation with 40 µM 6-OHDA.
Data are expressed as mean+SEM (n=3). *** p < 0.001 compared between HPOs treatments without 6-
OHDA (-6-OHDA) and HPOs treatments with 6-OHDA (+6-OHDA). # p < 0.05, ## p < 0.01, ### p < 0.001
compared between HPOs treatments with 6-OHDA (+6-OHDA) and control with 6-OHDA (+6-OHDA). $ p <
0.05, $$ p < 0.01 compared between CP20 treatments with 6-OHDA (+6-OHDA) and novel HPOs with 6-
OHDA (+6-OHDA). No significant different, p > 0.05 compared i) between HPOs treatments without 6-OHDA
(-6-OHDA) and control without 6-OHDA (-6-OHDA) ii) between HPO enantiomer pairs (CN116 vs CN118,
CN126 vs CN128 and CN226 vs CN228) treatments with H2O2 (2-way ANOVA followed by Holm-Šídák
multiple comparison test).
Co
nt
50
100
500
Co
nt
50
100
500
0
5 0
1 0 0
1 5 0
Ce
ll v
iab
ilit
y (
% c
on
tro
l)
4 0 M 6 -O H D A
* * *
-6 -O H D A
+ 6 -O H D A
p = 0 .0 8
# # #
Co
nt
50
100
500
Co
nt
50
100
500
0
5 0
1 0 0
1 5 0
Ce
ll v
iab
ilit
y (
% c
on
tro
l) -6 -O H D A
+ 6 -O H D A
* * *
## # #
4 0 M 6 -O H D A
# # #
Co
nt
50
100
500
Co
nt
50
100
500
0
5 0
1 0 0
1 5 0
Ce
ll v
iab
ilit
y (
% c
on
tro
l)
-6 -O H D A
+ 6 -O H D A
* * *
# # #
4 0 M 6 -O H D A
# # # # # #
$ $
Co
nt
50
100
500
Co
nt
50
100
500
0
5 0
1 0 0
1 5 0
Ce
ll v
iab
ilit
y (
% c
on
tro
l) -6 -O H D A
+ 6 -O H D A
* * *
# # # # #
# # #
4 0 M 6 -O H D A
Co
nt
50
100
500
Co
nt
50
100
500
0
5 0
1 0 0
1 5 0
Ce
ll v
iab
ilit
y (
% c
on
tro
l)
-6 -O H D A
+ 6 -O H D A
* * *
4 0 M 6 -O H D A
# # ## #
# # #
Co
nt
50
100
500
Co
nt
50
100
500
0
5 0
1 0 0
1 5 0
C o n c e n tra t io n ( M )
Ce
ll v
iab
ilit
y (
% c
on
tro
l) -6 -O H D A
+ 6 -O H D A
* * *
# # ## # #
# # #
4 0 M 6 -O H D A
$ $$
Co
nt
50
100
500
Co
nt
50
100
500
0
5 0
1 0 0
1 5 0
C o n c e n tra t io n ( M )
Ce
ll v
iab
ilit
y (
% c
on
tro
l)
-6 -O H D A
+ 6 -O H D A
* * *
# # # # # #
4 0 M 6 -O H D A
# # #$ $
Co
nt
50
100
Co
nt
50
100
0
5 0
1 0 0
1 5 0
Ce
ll v
iab
ilit
y (
% c
on
tro
l)
4 0 M 6 -O H D A
-6 -O H D A
+ 6 -O H D A
* * *
# # ## # #
a ) C P 2 0 b ) C P 8 4
c ) C N 1 1 6 d ) C N 1 1 8
e ) C N 1 2 6 f) C N 1 2 8
g ) C N 2 2 6 h ) C N 2 2 8

CHAPTER 4: IN VITRO NEUROPROTECTION OF HPOs
178
Effect of HPOs on viability of SH-SY5Y cells exposed to MG132
SH-SY5Y cells were treated with various concentrations of HPOs (50 to 500 µM) with or
without the IC50 concentration of MG132 (350 pM) prepared in 0.001% (v/v) DMSO.
Control cells were treated with serum-free DMEM containing 0.001% (v/v) DMSO only or
MG132 in serum-free DMEM containing 0.001% (v/v) DMSO. At the end of the treatment,
the cell viability was measured by MTT assay as described in Section 2.2.8.
Treatment of SH-SY5Y cells with 50, 100 and 500 µM HPOs only did not affect cells
viability when compared to untreated control. Conversely, SH-SY5Y cells exposed to 350
pM MG132 for 20 h showed approximately between 51 to 56% cell viability which were
significantly lower compared to untreated control (Figure 4.3.3). Comparison of equimolar
concentrations between HPOs without MG132 and HPOs with MG132 revealed significant
reduction in cell viability except for CN128 at 50 µM concentration where there was no
significant different (Figure 4.3.3). Overall, treatment of SH-SY5Y cells with HPOs for 20
h prior had no effect on MG132-induced cell death.

CHAPTER 4: IN VITRO NEUROPROTECTION OF HPOs
179
Co
nt
50
100
500
Co
nt
50
100
500
0
5 0
1 0 0
1 5 0
Ce
ll v
iab
ilit
y (
% c
on
tro
l)
3 5 0 p M M G 1 3 2
* * *
-M G 1 3 2
+ M G 1 3 2
* * ** * *
* * *
Co
nt
50
100
500
Co
nt
50
100
500
0
5 0
1 0 0
1 5 0
Ce
ll v
iab
ilit
y (
% c
on
tro
l) -M G 1 3 2
+ M G 1 3 2
* * *
3 5 0 p M M G 1 3 2
* * ** * *
* * *
Co
nt
50
100
500
Co
nt
50
100
500
0
5 0
1 0 0
1 5 0
Ce
ll v
iab
ilit
y (
% c
on
tro
l)
-M G 1 3 2
+ M G 1 3 2
* * *
3 5 0 p M M G 1 3 2
* * ** * *
* * *
Co
nt
50
100
500
Co
nt
50
100
500
0
5 0
1 0 0
1 5 0
Ce
ll v
iab
ilit
y (
% c
on
tro
l) -M G 1 3 2
+ M G 1 3 2
* * *
3 5 0 p M M G 1 3 2
* * ** * *
* *
Co
nt
50
100
500
Co
nt
50
100
500
0
5 0
1 0 0
1 5 0
Ce
ll v
iab
ilit
y (
% c
on
tro
l)
-M G 1 3 2
+ M G 1 3 2
* * *
3 5 0 p M M G 1 3 2
* * * *
Co
nt
50
100
500
Co
nt
50
100
500
0
5 0
1 0 0
1 5 0
C o n c e n tra t io n ( M )
Ce
ll v
iab
ilit
y (
% c
on
tro
l) -M G 1 3 2
+ M G 1 3 2
* * *
3 5 0 p M M G 1 3 2
* * * * * * *
Co
nt
50
100
500
Co
nt
50
100
500
0
5 0
1 0 0
1 5 0
C o n c e n tra t io n ( M )
Ce
ll v
iab
ilit
y (
% c
on
tro
l)
-M G 1 3 2
+ M G 1 3 2
* * *
3 5 0 p M M G 1 3 2
* * * ** * *
Co
nt
50
100
Co
nt
50
100
0
5 0
1 0 0
1 5 0
Ce
ll v
iab
ilit
y (
% c
on
tro
l)
3 5 0 p M M G 1 3 2
-M G 1 3 2
+ M G 1 3 2
* * ** * *
* * *
a ) C P 2 0 b ) C P 8 4
c ) C N 1 1 6 d ) C N 1 1 8
e ) C N 1 2 6 f) C N 1 2 8
g ) C N 2 2 6 h ) C N 2 2 8
Figure 4.3.3: Effect of MG132 on cell viability assessed by MTT assay after pre-incubation
with novel HPO iron chelators.
SH-SY5Y cells were pre-treated for 20h with HPOs followed by 20h co-treatment with 350 pM MG132. Data
are expressed as mean+SEM (n=3). *** p < 0.001 compared between HPOs treatments without MG132 (-
MG132) and HPOs treatments with MG132 (+MG132). No significant different, p > 0.05 compared i) between
HPOs treatments without MG132 (-MG132) and control without MG132 (-MG132) ii) between HPO
enantiomer pairs (CN116 vs CN118, CN126 vs CN128 and CN226 vs CN228) treatments with H2O2 (2-way
ANOVA followed by Holm-Šídák multiple comparison test).

CHAPTER 4: IN VITRO NEUROPROTECTION OF HPOs
180
Effect of HPOs on viability of SH-SY5Y cells exposed to FeNTA
SH-SY5Y cell were treated with various concentrations of HPOs (50 to 1250 µM) with or
without the IC50 concentration of FeNTA (460 µM) alone. Control cells were treated with
serum-free DMEM or FeNTA (1:3) in serum-free DMEM. At the end of the treatment, the
cell viability was measured by MTT assay as described in Section 2.2.8.
None of the HPOs altered the viability of SH-SY5Y cells at any concentrations except for
CN126 which showed reduced cell viability at the highest concentrations (500 and 1250
µM) compared to untreated control. As expected, SH-SY5Y cells exposed to FeNTA (450
µM) for 20 h produced between 43 and 48% loss in cell viability which were significantly
lower compared to untreated controls (Figure 4.3.4).
CP20 (1250 µM) reduced FeNTA-induced cell death by 23% (Figure 4.3.4a), however,
CP84 (50 and 100 µM) failed to show any protection (Figure 4.3.4b).
Although CN116 failed to show any protection against FeNTA-induced cell death (Figure
4.3.4c), its stereoisomer CN118 (500 and 1250 µM) protected against FeNTA-induced cell
death by 19 and 14% respectively (Figure 4.3.4d).
By contrast, both CN126 and its stereoisomer CN128 protected the SH-SY5Y cell from
FeNTA-induced toxicity (CN126: 26 and 29% protection; CN128: 33% and 23% protection)
at 500 and 1250 µM (Figure 4.3.4e & f).
Both CN226 and CN228 reduced FeNTA-induced cell death at 100, 500 and 1250
concentrations, with almost complete protection at the highest concentration (Figure
4.3.4g & h).
Comparison of equimolar concentrations of enantiomer pairs, (CN116 vs CN118, CN126
vs CN128 and CN226 vs CN228), on FeNTA-induced cell death showed no significant
different. By contrast, comparison of equimolar concentrations between novel HPOs and
CP20 reveals enhanced protection by 29%, 37% and 36% for CN128, CN226 and CN228
respectively, at 500 µM (Figure 4.3.4).

CHAPTER 4: IN VITRO NEUROPROTECTION OF HPOs
181
Co
nt
50
100
500
1250
Co
nt
50
100
500
1250
0
5 0
1 0 0
1 5 0
Ce
ll v
iab
ilit
y (
% c
on
tro
l)
4 5 0 M F e N T A (1 :3 )
* * *
# # #
Co
nt
50
100
500
1250
Co
nt
50
100
500
1250
0
5 0
1 0 0
1 5 0
Ce
ll v
iab
ilit
y (
% c
on
tro
l)
* * *
4 5 0 M F e N T A (1 :3 )
Co
nt
50
100
500
1250
Co
nt
50
100
500
1250
0
5 0
1 0 0
1 5 0
Ce
ll v
iab
ilit
y (
% c
on
tro
l)
-F e N T A (1 :3 )
+ F e N T A (1 :3 )
* * *
4 5 0 M F e N T A (1 :3 )
## # #
Co
nt
50
100
500
1250
Co
nt
50
100
500
1250
0
5 0
1 0 0
1 5 0
Ce
ll v
iab
ilit
y (
% c
on
tro
l)
* * *
# #
4 5 0 M F e N T A (1 :3 )
+ ++
#
Co
nt
50
100
500
1250
Co
nt
50
100
500
1250
0
5 0
1 0 0
1 5 0
Ce
ll v
iab
ilit
y (
% c
on
tro
l)
-F e N T A (1 :3 )
+ F e N T A (1 :3 )
* * *
# # #
4 5 0 M F e N T A (1 :3 )
$ $
Co
nt
50
100
500
1250
Co
nt
50
100
500
1250
0
5 0
1 0 0
1 5 0
C o n c e n tra t io n ( M )
Ce
ll v
iab
ilit
y (
% c
on
tro
l)
* * *
#
# # ## # #
4 5 0 M F e N T A (1 :3 )
$ $ $
Co
nt
50
100
500
1250
Co
nt
50
100
500
1250
0
5 0
1 0 0
1 5 0
C o n c e n tra t io n ( M )
Ce
ll v
iab
ilit
y (
% c
on
tro
l)
-F e N T A (1 :3 )
+ F e N T A (1 :3 )
* * *
# # ## # #
4 5 0 M F e N T A (1 :3 )
#
$ $ $
Co
nt
50
100
Co
nt
50
100
0
5 0
1 0 0
1 5 0
Ce
ll v
iab
ilit
y (
% c
on
tro
l) -F e N T A (1 :3 )
+ F e N T A (1 :3 )
* * *
4 5 0 M F e N T A (1 :3 )
a ) C P 2 0 b ) C P 8 4
c ) C N 1 1 6 d ) C N 1 1 8
e ) C N 1 2 6 f) C N 1 2 8
g ) C N 2 2 6 h ) C N 2 2 8
Figure 4.3.4: Effect of FeNTA (1:3) on cell viability assessed by MTT assay after pre-
incubation with novel HPO iron chelators.
SH-SY5Y cells were pre-treated for 20h with HPOs followed by 20h co-treatment with 460 µM FeNTA (1:3).
Data are expressed as mean+SEM (n=3). + p < 0.05, ++ p < 0.01 compared between HPOs treatments with
FeNTA (1:3) [+FeNTA (1:3)] and control without FeNTA (1:3) [-FeNTA (1:3)]. *** p < 0.001 compared between
HPOs treatments without FeNTA (1:3) [-FeNTA (1:3)] and HPOs treatments with FeNTA (1:3) [+FeNTA (1:3)].
# p < 0.05, ## p < 0.01, ### p < 0.001 compared between HPOs treatments with FeNTA (1:3) [+FeNTA (1:3)]
and control with FeNTA (1:3) [+FeNTA (1:3)]. $ p < 0.05, $$ p < 0.01, $$$ p < 0.001 compared between CP20
treatments with FeNTA (1:3) [+FeNTA (1:3)] and novel HPOs with FeNTA (1:3) [+FeNTA (1:3)]. No significant
different, p > 0.05 compared i) between HPOs treatments without FeNTA (1:3) [-FeNTA (1:3)] and control
without FeNTA (1:3) [-FeNTA (1:3)] ii) between HPO enantiomer pairs (CN116 vs CN118, CN126 vs CN128
and CN226 vs CN228) treatments with FeNTA (1:3) (2-way ANOVA followed by Holm-Šídák multiple
comparison test).

CHAPTER 4: IN VITRO NEUROPROTECTION OF HPOs
182
Discussion
In this study, in vitro neuroprotection study was performed in SH-SY5Y neuroblastoma cell
lines exposed to the neurotoxins H2O2, 6-OHDA, MG132 and FeNTA, to evaluate the
neuroprotective ability of novel HPO iron chelators. CP20 has been shown to be
neuroprotective in in vitro and in vivo studies (Dexter et al., 2011, Molina-Holgado et al.,
2008). Therefore, it was hypothesised that modification to the structure of CP20 would
retained the neuroprotective ability of CP20. The current study revealed that, all seven
novel HPOs showed some degree of neuroprotection against toxins insults on SH-SY5Y
cells except for cells exposed to MG132 which although appear to show a mild
neuroprotection however was not significant.
Summary of the findings
In general, all HPOs did not confer toxicity to SH-SY5Y on their own. Conversely, SH-
SY5Y exposed to the toxins H2O2, 6-OHDA, MG132 and FeNTA induced cell death as
expected. The novel HPOs produced the greatest protection against toxin-induced cell
death when 6-OHDA was used as a toxin, although they also protected SH-SY5Y cells
from H2O2 and FeNTA. In these conditions, the neuroprotection was increasingly
pronounced as the lipophilicity of the HPOs increased. Among all the toxins employed,
MG132 toxicity was the least protected by HPOs. CN118, CN226 and CN228 showed
more protection at 50 and/or 100 µM in 6-OHDA-induced cell death than equimolar
concentration of CP20. CN128, CN226 and CN228 showed a better protection from
FeNTA-induced cell death than CP20 at 500 µM. Comparison between HPOs enantiomer
pair did not show any difference in neuroprotection ability. Summary of overall finding was
compiled in Table 4.4.1.

CHAPTER 4: IN VITRO NEUROPROTECTION OF HPOs
183
Table 4.4.1: Summary of the findings for in vitro neuprotection study with SH-SY5Y cells
Toxin H2O2 6-OHDA MG132 FeNTA (1:3)
HPOsµM
50 100 500 50 100 500 50 100 500 50 100 500 1250
CP20 nc ++ nc nc ++ ++++ nc nc nc nc nc nc ++
CP84 nc nc nd +++ +++ nd nc nc nd nc nc nd nd
CN116 +++ +++ ++ +++ +++ +++ nc nc nc nc nc nc nc
CN118 +++ nc nc ++++ $
+++ +++ nc nc nc nc nc ++ +
CN126 ++ ++ +++ +++ +++ ++++ nc nc nc nc nc +++ +++
CN128 nc ++ nc +++ ++ ++++ nc nc nc nc nc ++++ $
+++
CN226 ++ +++ ++ ++++ $
++++ $
+++ nc nc nc + ++ ++++ $
++++
CN228 +++ ++ +++ ++++ $
++++ $
+++ nc nc nc ++ ++ ++++ $
++++
CP20 is highlighted in green. nc=no change, nd=not determined. + = low; ++ = mild; +++ = moderate; ++++ =
high, neuroprotection compared to control with toxin only. $ = Better neuroprotection compared to equimolar
concentration of CP20 with toxins

CHAPTER 4: IN VITRO NEUROPROTECTION OF HPOs
184
Neuroprotection of HPOs against H2O2 toxicity in SH-SY5Y
H2O2 was employed to model the SH-SY5Y cells death and to evaluate the effect of novel
HPOs iron chelator due to its relationship with iron in producing OH- radical through the
Fenton reaction. OH- radical is a highly reactive radical that caused disintegration of
biological membranes through lipid peroxidation, caused protein misfolding and point
mutations in DNA sequences (Guo et al., 2013). Therefore, the aim of this study was to
determine whether co-treatment of HPOs with H2O2 would protect against SH-SY5Y cell
death by minimising the toxic effect of OH- radical formed through iron chelation. These
data support the idea as CP20 and the novel HPOs reduced H2O2-induced cell death
between 48 to 79%.
This is the first time that the protective effect of CP20 on H2O2-induced toxicity in SH-SY5Y
cells has been reported, therefore, direct comparison with the existing study is not
possible. Nevertheless, CP20 has been shown to protect primary cortical neuronal
cultures from H2O2- induced cell death as measured by reduced LDH release (Molina-
Holgado et al., 2008). Moreover, CP20 has been shown to reduce the production of OH-
radical through Fenton reaction by spectroscopy analysis which suggest that this is
probably one of the main mechanism of CP20 protection against H2O2 toxicity (Devanur
et al., 2008b, Timoshnikov et al., 2015). As expected due to their structural similarities with
CP20, with the exception of CP84, the novel HPOs also showed significant protection
against H2O2 toxicity in SH-SY5Y cells, and this was comparable to CP20. CN116, CN118,
CN126, CN226 and CN228 co-treated with H2O2 significantly protected from H2O2 toxicity
at 50 µM while CP20 only did so only at 100 µM which might suggest higher chelation
potency for novel HPOs. The neuroprotection might be partly due to the pFe3+ as
determined by potentiometric titration which were similar to that of CP20. Interestingly, the
enantiomer pair of HPOs did not show any differences in neuroprotection suggesting little
or no contribution of stereochemistry to the activity of HPOs. As for CP84, although there
appeared to be a small protection against cell death, this was not significant.
Although the existing studies of CP20 on H2O2-induced toxicity in vitro are scanty,
neuroprotection studies with DFO and H2O2 can be compared with the current results.
Although DFO is structurally different to the HPOs used in this study as it is in which it is
a larger hexadentante molecule, DFO and HPOs are both Fe(III) iron chelator. Therefore,
the reported mechanisms of neuroprotection of DFO is expected to be similar to HPOs

CHAPTER 4: IN VITRO NEUROPROTECTION OF HPOs
185
through their primary pharmacological action. Previous study showed that SH-SY5Y cells
pre-treated with DFO for 2 hours completely abolished H2O2-induced autophagy (Castino
et al., 2011). Besides DFO, a novel fluorinated derivative of CP20, Apo6856 (Figure 4.4.1)
also protected SH-SY5Y against H2O2 toxicity in a concentration dependent manner
(Premyslova et al., 2016, Tam et al., 2014). Treatment with Apo6856 also caused a
concentration- and time-dependent up-regulation of Nrf2 activity in SH-SY5Y cells and
modulated the expression of genes in a pattern consistent with downregulation of
inflammation and ROS production and increased cellular antioxidant defence capacity.
CP20
Apo6856
Figure 4.4.1: Chemical structure of a) CP20 and b) Apo6856, a fluorinated derivative of CP20.
Functional group highlighted in red denotes the structural different from CP20. Atoms
highlighted in blue indicates the pharmacophore that is important for the bidentate co-
ordination with iron.
It is likely that CP20 and the novel HPOs would also act via the same molecular
mechanism due to the close structural and functional similarity to Apo6856 in manifesting
the neuroprotection in H2O2-treated SH-SY5Y cells. However, this is not conclusive and
remain speculative until the molecular mechanism of CP20 and novel HPOs in H2O2-
treated SH-SY5Y are studied in detail.
In summary, all novel HPOs except CP84 showed comparable neuroprotection to CP20
against H2O2-induced cell death. Most of the novel HPOs started to show significant
neuroprotection at 50 µM in contrast to 100 µM for CP20 suggesting better efficacy than
CP20. It is suggested that the mechanism of neuroprotection of the novel HPOs against
H2O2 toxicity was mainly through the chelation of excess intracellular iron which is
associated with H2O2 toxicity.

CHAPTER 4: IN VITRO NEUROPROTECTION OF HPOs
186
Neuroprotection of HPOs against 6-OHDA toxicity in SH-SY5Y
6-OHDA was employed to induce SH-SY5Y cell death and to evaluate the ability of novel
HPOs to protect SH-SY5Y from 6-OHDA-induced cell death. As a metabolite of dopamine,
6-OHDA was used as a toxin to induce SH-SY5Y cell death through the generation of
ROS through interaction with O2 (Section 2.2.1b). Furthermore, the oxidation product of
6-OHDA, p-quinone, is a highly reactive electrophile that formed an adduct with
nucleophilic groups of intracellular proteins (Soto-Otero et al., 2000, Napolitano et al.,
1995). Most importantly, 6-OHDA induced the accumulation of iron into the cells by
enhancement of iron cell-uptake mechanisms which accelerate the process of cell death
by producing more ROS via Fenton reaction. Therefore, SH-SY5Y cells treated with iron
chelators are expected to slow down or inhibit cell death and reduce cell death.
The data revealed that CP20 protected against 6-OHDA-induced cell death in a
concentration dependent manner with significant protection at 100 and 500 µM
concentration. Furthermore, cell viability for SH-SY5Y cells was also reverted to the control
level at 500 µM concentration in agreement with a recent report (Workman et al., 2015).
Interestingly, novel HPO iron chelators showed significant protection against 6-OHDA
induced cell death at all of the concentration tested with CN118, CN226 and CN228
inhibiting toxin-induced cell death to the control level at lower HPOs concentrations. These
HPOs also showed significant reduction in cell death in comparison to equimolar
concentrations of CP20. This observation supports the hypothesis made by Workman et
al. (2015) that increasing the lipophilicity of HPO chelators enhances neuroprotection of
SH-SY5Y cell death induced by 6-OHDA. It was suggested that increased in lipophilicity
made the HPO more accessible to intracellular iron by crossing the biological membranes
which include the mitochondrial membranes. Since the pFe3+ for the novel HPO iron
chelators (pFe3+=19.80-20.40) was similar to the pFe3+ for CP20 (pFe3+=20.20), it is likely
that this contributed less to the different in extent of iron chelation compare to lipophilicity.
It has been demonstrated by Kobayashi et al. (2008) that 6-OHDA and iron mixture
generates higher level of H2O2 and p-quinone than 6-OHDA alone. It was suggested that
a semiquinone radical is formed through a reduction of Fe3+ as an intermediate before the
semiquinone is oxidised to p-quinone by O2 with ROS produced along the course of the
reaction (Figure 4.4.2).

CHAPTER 4: IN VITRO NEUROPROTECTION OF HPOs
187
Figure 4.4.2: Production of ROS during 6-OHDA metabolism to p-quinone (Izumi et. al.,
2005).
Indeed, ROS generated during p-quinone formation has been reported to be the primary
contributor of 6-OHDA toxicity and reducing p-quinone level was found to be
neuroprotective (Izumi et. al., 2005, Storch et al., 2000). Additionally, this observation was
further supported by several neuroprotection studies in vitro using different type of iron
chelators that managed to prevent the 6-OHDA induced cell death (Zheng et al., 2006,
Cacciatore et al., 2013). In the situation where semiquinone formation is halted by efficient
iron chelation, 6-OHDA would be the predominant species. 6-OHDA has been reported to
inhibit Complex I and Complex IV of mitochondrial respiratory chain, but further experiment
showed that these electron transport chain inhibitions did not lead to interruption in ATP
production. This might explain the complete prevention of 6-OHDA-induced cell death in
some of the treatment group with HPOs.
To summarise, novel HPOs showed a pronounced neuroprotection against 6-OHDA-
induced cell death with some of them are a better neuroprotectant at equimolar
concentrations (CN118, CN226 and CN228) of CP20. It is proposed that the mechanism
of neuroprotection of the novel HPOs against 6-OHDA-induced cell death was through the
inhibition of p-quinone metabolite formation from 6-OHDA that requires iron.
Neuroprotection of HPOs against MG132
MG132 was chosen to induce SH-SY5Y cell death due to its proteasomes inhibition
property that emulate the toxicity of mutant or aggregated α-synuclein found in
dopaminergic neuron of patients with familial PD. α-Synuclein is targeted for degradation
by the UPS pathway, however, mutant or aggregated α-synuclein can interact with the
proteasomes active sites and inhibits its activity (McNaught et al., 2002, Snyder et al.,
2003). Inhibition of UPS also lead to accumulation of iron by decreasing the iron binding
proteins (IRPs) degradation. IRP bind to iron response element (IRE) on mRNA of proteins

CHAPTER 4: IN VITRO NEUROPROTECTION OF HPOs
188
that involve with iron uptake, regulation and metabolism (Xie et al., 2010b, Wang et al.,
2007, Guo et al., 1995). Simultaneous accumulation of intracellular proteins and iron-
induced free-radicals could aggravate the oxidative stress through free-radical generation
(Kalivendi et al., 2004). Therefore, the aim of this study was to determine whether by
chelating iron in MG132-treated SH-SY5Y cells, the cell death could be prevented. Neither
CP20 nor the novel HPOs protected against MG132-induced toxicity. This is consistent
with the previous report that, the antioxidant N-acetylcysteine failed to protect against
MG132-induced cell death (Cheng et al., 2016, Zafar et al., 2007). UPS inhibition results
in the build-up of damaged and unwanted intracellular proteins. These data confirm that
chelation of iron alone is not sufficient to prevent MG132-induced cell death. Remarkably,
repression of p53 level by genetic silencing or inhibiting p53 activity prevented cell death
resulted from proteasomes inhibition (Lopes et al., 1997, Nair et al., 2006, Dietrich et al.,
2003). This may suggest that, apart from iron-induced free radicals, other distinct factors
might predominantly contribute to cell death after proteasomes inhibition. It may be argued
that proteasome dysfunction is not a primary phenomenon in PD as seen using
proteasomes inhibitors such as MG132, lactasystin or PSI, but rather a secondary
phenomenon as a result of damaged caused by oxidative stress. Oxidative stress induces
misfolding and aggregation of proteins such as α-synuclein that in turn inhibit proteasomes
function. Therefore, the treatment approach might strictly depend on the nature of the
cause of the UPS inhibition.
To sum up, CP20 and the novel HPOs showed no neuroprotection against MG132-
induced cell death. It is proposed that the main pathogenesis of MG132 toxicity was not
sufficiently prevented by treatment with HPOs iron chelator alone, which presumably
because MG132 toxicity predominantly involved other pathways that do not involve iron.
Neuroprotection of HPOs against FeNTA
In this study, the FeNTA (1:3) complex (shortened to FeNTA) was used to induce iron
toxicity in SH-SY5Y cells. In addition, FeNTA can be used to evaluate the efficiency of iron
transfer to HPOs in which case FeNTA act as non-transferrin bound iron (NTBI) to HPOs.
High concentration of NTBI characterised the intracellular physiology of cells with iron
overload. This is the first reported study of CP20 neuroprotection on FeNTA-induced cell
death using SH-SY5Y cells. CP20 exhibited a concentration-dependant neuroprotection
against FeNTA toxicity with significant protection at 1250 µM. This agrees with a previous

CHAPTER 4: IN VITRO NEUROPROTECTION OF HPOs
189
study where, CP20 prevented FeNTA toxicity in a concentration dependant manner in
primary cortical neurons albeit at relatively lower concentrations (30 and 100 µM) (Molina-
Holgado et al., 2008). The discrepancies in the concentrations of CP20 that conferred
neuroprotection was due to the different types of cells employed between these studies.
Primary cortical neurones are more sensitive to FeNTA toxicity (IC50 = 10 µM) than SH-
SY5Y cells which require higher concentrations to incur cell death (IC50 = 460 µM). This is
likely to be due to the buffering provided by the iron storage protein, ferritin, which is
overexpressed in cancer cell lines (Guan et al., 2017, Selig et al., 1993). Nevertheless,
both studies showed the same efficiency (about 3-folds of the IC50 concentrations for
FeNTA) of CP20 to significantly chelate iron from NTA. Remarkably, novel HPOs CN116,
CN118, CN226 and CN228 prevented cell death at or below the IC50 concentration of
FeNTA which suggest that iron transfer and re-distributes from NTA to these HPOs. This
redistribution more readily occurs at lower concentrations compared to CP20 which only
significantly protected cells from FeNTA toxicity at the concentration of two-folds of FeNTA
IC50 (1250 µM). On the other hand, CN116 and CP84 did not protect SH-SY5Y cells at all
from FeNTA insult.
Additionally, CN128, CN226 and CN228 were superior than CP20 neuroprotection at
equimolar concentration (500 µM). It is even more interesting to emphasise that the degree
of neuroprotection of novel HPOs used in this study are more related to the lipophilicity
than the pFe3+. Similar observations were also found when other toxins were used to
induced cell death as has been explained in the previous sections. It has been suggested
that FeNTA complex can permeate through biological membranes (Bunescu et al., 2008)
and bidentate chelators such as CP20 could competitively chelate iron in a concentration-
dependant manner from an existing iron complex (Devanur et al., 2008a). The suggested
mechanism of iron transfer from FeNTA to HPOs is presented in Figure 4.4.3. Base on
the current results, it can be proposed that FeNTA induced iron toxicity intracellularly and
HPOs with higher lipophilicity could gain sufficient concentration in the cytoplasm to
prevent iron-induced cell death. The results suggest the suitability of novel HPOs to treat
localised brain iron accumulation as seen in PD brain. This is crucial as traditional iron
chelator, DFO, although could efficiently chelate iron, has very low membrane permeability
and has limited ability to cross biologicals membranes (Guan et al., 2017).

CHAPTER 4: IN VITRO NEUROPROTECTION OF HPOs
190
Figure 4.4.3: Suggested mechanism of Fe(III) transfer-equilibration between NTA and
HPOs.
In summary, all the novel HPOs protected against FeNTA-induced cell death with some
of them showing better neuroprotection (CN128, CN226 and CN228) than CP20 at
equimolar concentrations. It is proposed that the neuroprotection of HPOs against FeNTA-
induced cell death was improved as the lipophilicity increased.
Advantages and shortcomings of this study
Cell-based assay is widely employed for evaluating and screening potential
neuroprotective agent due to their physiology and mechanisms closely related to the cells
in living animals but with added flexibility (Burroughs et al., 2012, Zhang et al., 2014).
Additionally, experiment on cell lines for testing neuroprotection agents are less expensive
than testing in living animals. Homogeneous neuroblastoma cell lines such as SH-SY5Y
is one of the important tools widely employed during the early stage for screening potential
new drug in PD research. Importantly, SH-SY5Y cell line is a catecholaminergic
neuroblastoma cell line from human origin. This cell line expresses both DAT and TH
which resembles the affected dopaminergic neurons in the substantia nigra pars compacta
(SNPc) in PD brain (Kovalevich and Langford, 2013b, Filograna et al., 2015). Being
immortalised, the cells are easy to grow, rapidly reaches confluence in culture, stable for
multiple passages and can be stored frozen in contrast to primary cell cultures. Because
of these reasons, SH-SY5Y cells is suitable for initial screening for large set of potential
neuroprotection agents for PD (Xicoy et al., 2017, Xie et al., 2010a). Moreover, large array
of neurotoxins with different mechanisms of toxicity could be used to induce cell death by
adding into the cell culture medium. As discussed in this chapter, novel HPOs prevented
SH-SY5Y cell death when exposed to H2O2, 6-OHDA and iron, but not with MG132. This
observation could be used to justify the primary mode of action of HPOs when oxidative-
stress is predominant in inducing cell death.
However, in vitro cell lines are expected to behave differently than the cells in vivo due to
their isolation from living system, that may affect the results in the current study.
Additionally, cell lines such as SH-SY5Y are cancerous and therefore the cell cycle

CHAPTER 4: IN VITRO NEUROPROTECTION OF HPOs
191
regulations are atypical from mature neuron which has limited ability to divide. Indeed, the
rapid cell proliferation of SH-SY5Y is due to the chronic activation of MAPK-ERK signalling
pathway by mutated Ras and leads to alteration of genes transcription that are important
for cell-cycles. Thus, SH-SY5Y may utilize different mechanisms of cell death than in
mature primary neurons because of the MAPK-ERK overactivation (Abramova et al.,
2002). Moreover, cancerous cells such as SH-SY5Y are known to express multitudes of
cell-survival mechanism that render the cells resistance to chemotherapeutic agent. For
example, toxin such as iron (FeNTA) employed in the current study showed higher IC50
value (50-fold) in comparison to primary neuronal culture that significantly more sensitive
to these toxins (Molina-Holgado et al., 2008). Indeed, tumour cell lines such as SH-SY5Y
and HepG2 are relatively insensitive to iron chelation by iron chelators due to increase
ferritin level in these cells (Selig et al., 1993, Selig et al., 1998, Guan et al., 2017). In this
situation, higher concentration of iron chelators is needed to completely deplete cellular
iron and causing cell death.
Continuously dividing cells like SH-SY5Y makes it difficult to determine whether the
observed neuroprotection is solely because of prevention of cell death and not induction
of cell proliferation (Datki et al., 2003). Because of this reason, serum which provide
important biological factors for cell growth was omitted during the neuroprotection phase
of this study. Serum removal helps to synchronise the development stage of the dividing
SH-SY5Y cell line by enabling cells to enter the nondividing state (G0) characterised by
low metabolic activity (Langan and Chou, 2011). Lower IC50 value for toxin is achievable
when serum is removed as absence of serum in cell culture media retards cell growth.
However, omission of serum introduces other disadvantages. Serum deprivation has been
shown to cause progressive decline in SH-SY5Y cell viability with almost 50% cell
reduction after 4 days without serum due to increase in pro-apoptotic and autophagic
proteins (Kim et al., 2008, Bar-Am et al., 2005, Xu et al., 2013). This to some extent may
have affected the degree of the measured cell viability in toxin-induced cell death but this
has been considered in the current experiment design by running a simultaneous
negative-control.
Although SH-SY5Y cell lines shares some important characteristics of dopaminergic
neurons that enable their usage to screen neuroprotection agents, array-based
comparative genomic hybridization studies have identified significant chromosomal

CHAPTER 4: IN VITRO NEUROPROTECTION OF HPOs
192
aberration which contributes to different genetics information compared to dopaminergic
neurones in brain (Do et al., 2007, Skibinski and Finkbeiner, 2011). This may explain lower
expression of TH and DAT in SH-SY5Y cells, which may mean that the mechanism of
toxicity and neuroprotection are different than primary dopaminergic neurons (Presgraves
et al., 2004). For example, 6-OHDA could confer its toxicity both extracellularly and
intracellularly as discussed in Chapter 2. Mechanism of intracellular toxicity of 6-OHDA is
dependent on the expression of DAT, thus may create variations in the cellular response
to exogenous stimuli between SH-SY5Y and primary neurones. In addition, SH-SY5Y cell
that have undergone multiple passages could lose their neuronal and dopaminergic
characteristic as they accumulate genetic and epigenetic alterations. Accumulated genetic
and epigenetic alterations after multiple passage make it hard to get reproducible and
reliable results. This could be prevented by using cells at low passage number as in the
current study.
Since SH-SY5Y cells grown in vitro is an open system as opposed to neurons in the brain
that are separated from systemic circulation by BBB, question may arise on the validity of
observed neuroprotection in vivo. This is because, potential neuroprotection agent that
shows promising results in vitro might not work in vivo due to poor brain permeability. This
issue has been addressed in Chapter 3 and 5, whereby HPOs were assessed for brain
permeability by in situ brain perfusion and after i.p. injections. Besides the brain
permeability issue, the concentration of compounds that showed neuroprotection may not
necessarily achieved in the brain eventhough they could cross the BBB (Weber, 2015).
Despite all the disadvantages and limitations discussed above, cell lines such as SH-SY5Y
has served an important role for studying the mechanism of toxins in causing cell death in
PD and also to explore neuroprotection strategies to prevent or delay cell death
(Falkenburger and Schulz, 2006). It should be acknowledged that the effect of potential
neuroprotection agents may not be fully represent to pharmacologic effects in vivo. For
this reason, subsequent studies in animal model of PD is vital to confirm the results from
in vitro cell cultures study.

CHAPTER 4: IN VITRO NEUROPROTECTION OF HPOs
193
Summary
The differences of HPOs ability to exhibit neuroprotection in these in vitro models appears
to be related to the pathogenesis that leads to cell loss. In this circumstance, it can be
speculated that cell death pathogenesis that predominantly involved iron accumulation
could be prevented by chelating excess iron with HPOs. Having said this, SH-SY5Y cell
death caused by exposure to 6-OHDA could be prevented nearly 100% when treated with
HPOs. Paradoxically, FeNTA-induced cell death was not prevented as efficiently as in 6-
OHDA-induced cell death. This could be explained based on the competition between
NTA and HPOs to chelate iron. Iron chelation with HPOs also significantly prevented H2O2-
induced cell death possibly through the chelation of excess iron which subsequently
reduced OH- radical synthesis from the Fenton reaction. Toxicity of MG132 was not
reduced by iron-chelation suggesting that the mechanism of toxicity does not involved
ROS generated by iron alone. However, it needs to be emphasised that the data from the
current study only come from a single method of detecting cell death. The MTT assay
relies on measuring mitochondrial enzyme activity (Wang et al., 1996). It has been
reported that some compounds can modulate the enzyme activity or directly interact with
MTT which confound the final results (Hsu et al., 2003, Devika and Stanely Mainzen
Prince, 2008). Other cell viability methods such as measurement of ATP level or trypan
blue exclusion assay could be used for confirmation of the results. Additionally, molecular
study to reveal the downstream mechanism towards neuroprotection of these novel HPOs
is also of great interest.
Conclusion
The present study aimed to evaluate the neuroprotection of novel HPOs and compare with
CP20. Treatment of SH-SY5Y cell with HPOs alone did not induce cell death, while
treatment with toxins only at the IC50 concentration induced cell death. Novel HPOs
managed to prevent cell death associated with exposure to neurotoxins to various degree
suggesting an involvement of iron in the promotion of cell death, except for MG132.
CN118, CN226 and CN228 showed better neuroprotection than the equimolar
concentration of CP20 in 6-OHDA-induced cell death. Similarly, CN126, CN226 and
CN228 were superior than equimolar concentration of CP20 towards protection against
FeNTA-induced cell death. Chirality in novel HPOs chemical structure did not cause
different in neuroprotection capability. In conclusion, the hypothesis that novel HPOs are

CHAPTER 4: IN VITRO NEUROPROTECTION OF HPOs
194
neuroprotective in in vitro model of PD are accepted. Due to the neuroprotection shown in
vitro, it is not known whether these compounds will show neuroprotection in vivo. For this
reason, selected HPOs were chosen for a further neuroprotection study utilising an in vivo
rat model of PD.

CHAPTER 5: IN VIVO NEUROPROTECTIONS OF HPOs
195
CHAPTER 5
NEUROPROTECTION STUDY OF
NOVEL HPOs WITH 6-OHDA
LESIONED RAT MODEL OF
PARKINSON’S DISEASE

CHAPTER 5: IN VIVO NEUROPROTECTIONS OF HPOs
196
5 Neuroprotection study of novel HPOs with
6-OHDA lesioned rat model of Parkinson’s
disease
Introduction
At the start of these studies it was hypothesised that the novel HPOs based on the
structure of CP20 could cross the BBB and show neuroprotection in Parkinson’s disease
(PD). In Chapter 3 of this thesis the first part of this hypothesis was tested. Studies were
described that showed that, of all the HPOs studies, only CP84 had a superior rate of brain
uptake compared to CP20, and that although the rate of brain uptake for CN128, CN226
and CN228 were not different than CP20, those of CN116, CN118 and CN126 were lower.
In Chapter 4, the second part of this hypothesis was tested. The neuroprotection ability of
all brain permeable novel HPOs was investigated in vitro using toxin-treated SH-SY5Y
neuroblastoma cells. In this study, novel HPOs showed a tendency for positive correlation
between their neuroprotective potency and lipophilicity, especially against 6-OHDA and
FeNTA induced cell death.
In the studies described in this chapter the overall hypothesis was tested by comparing
the ability of selected HPOs to protect against cell death in vivo. This assesses both the
properties of CNS penetration and neuroprotection. From the previous results CP84,
CN128 and CN226, along with CP20 were selected to take forward into these studies.
Studies on the effect of CP20 in in vivo model of PD have been reported in the literature
(Dexter et al., 2011, Devos et al., 2014). CP20 was found to be neuroprotective in 6-OHDA
treated rats and MPTP treated mice. In addition, recently, clinical trials to assess the effect
of CP20 in PD patients (FAIRPARK) showed reduction in iron level in the nigrostriatal
system and improved motor score after 6- to 12-months treatment (Devos et al., 2014a,
Martin-Bastida et al., 2017). CP20 was therefore included in these studies as a positive
control.
Although CP84 showed limited neuroprotection compared to other novel HPOs, its high
brain permeability relative to other HPOs, and significant protection against 6-OHDA
toxicity warranted its inclusion in this in vivo study. Both CN128 and CN226 showed similar

CHAPTER 5: IN VIVO NEUROPROTECTIONS OF HPOs
197
or better CNS penetration and neuroprotection than CP20. Of the enantiomeric pair,
CN126 and CN128, both showed similar neuroprotection in the in vitro models, but the
latter showed a 2-fold greater brain uptake which was not significantly different to CP20.
For this reason, CN128 was taken forward to the in vivo neuroprotection study. By
contrast, the enantiomeric pair, CN226 and CN228, showed equal brain permeability and
in vitro neuroprotection suggest that chirality did not play a role in brain permeability or
neuroprotection against the selected toxins. However, only CN226 was selected due to its
preferable physical property that remain dry at room temperature in contrast to CN228 that
is hygroscopic.
The choice of compounds taken forward was based not only on their brain penetrability
and neuroprotective effect in vitro, but also on their pharmacokinetic profile and evidence
of in vivo iron chelating activity. Previously, oral treatment with CN128 and CN226 in iron-
overloaded rat revealed ability of these HPOs to excrete iron (Hider et al., 2011a, Lu,
2016). In addition, CN128 has been shown to be the most efficient iron-chelating agent
among the novel iron chelators when assessed in iron-overloaded rat due to improved
bioavailability than CP20 (Hider et al., 2011a, Lu, 2016, Paiboonsukwong et al., 2016).
CN128 also exhibited better toxicity profile than CP20 in preventing reduction of
leukocytes counts in rats and monkeys (Paiboonsukwong et al., 2016).
Based on the current and previous findings along with toxicity profiles assessed in rats
and monkeys (Paiboonsukwong et al., 2016), it is speculated that CP84, CN128 and/or
CN226 would be neuroprotective and could perform better in human than CP20. However,
before this can be tested in human, data from animal studies is needed to progress to the
clinical phase. Therefore, to assess the neuroprotective ability of CP84, CN128 and
CN226, neuroprotection study was performed along with CP20 as a positive control in
partial unilateral 6-OHDA-lesioned rats.

CHAPTER 5: IN VIVO NEUROPROTECTIONS OF HPOs
198
Hypothesis
It was hypothesised that CP84, CN128 and CN226 are neuroprotective against 6-OHDA-
induced degeneration of dopaminergic neurons in the rat nigrostriatal pathway in vivo.
Aims
To test the hypothesis, rats were treated with equimolar doses of HPOs before, during and
after a partial 6-OHDA lesion. Using 6-OHDA- or sham-lesioned rats, these studies had
the following aims:
a) Confirm that CP20, CP84, CN128 and CN226 is absorbed into systemic
circulation after i.p. injection.
b) Assess the effect of selected HPOs on body weight.
c) Evaluate the effect of selected HPOs on D-amphetamine-induced rotational
behaviour.
d) Investigate the effect of selected HPOs on striatal level of dopamine and
serotonin and their metabolites.
e) Determine the effect of selected HPOs on dopaminergic cell death in the SNPc.

CHAPTER 5: IN VIVO NEUROPROTECTIONS OF HPOs
199
Materials and methods
Experimental animals
Male Wistar rats weighing between 250-300 g (Harlan UK Ltd) and were housed between
2-4 rats per cage at BSU, King’s College London as described in Section 2.2.2.
Pharmacokinetics evaluation of selected novel 3-hydroxy-4-
pyridinone iron chelators in rats
Rats (n=3-4 per treatment group) were injected i.p. in a volume of 5 mL/kg with 200
µmol/kg (CP84) or 500 µmol/kg (CP20, CP84, CN128 and CN226). All HPOs were
prepared in 0.9% (w/v) NaCl, except for CP84 that contained a final concentration of 0.1%
(v/v) DMSO in 0.9% (w/v) NaCl.
Samples collection
Blood sample were collected into heparinised tube at 5, 10, 20, 60, 120, 240, and 360 min
after i.p. injection from the rat lateral vein using 23G wing infusion needle (Terumo®;
MediSupplies, UK). Rat tail was immersed into warm (40 ˚C) tap water 2 minutes prior to
blood sampling to visualise the lateral vein and to assist blood flow during sample
collection. Plasma samples were obtained from the collected blood via centrifugation at
5400 g for 10 min and were stored in -70 ˚C until use. Rats were terminally anaesthetised
with 600 mg/kg pentobarbital sodium (Merial Animal Health Ltd, UK) at the terminal time
point (360 min) and the brain was taken out. The brain was homogenised in PhyBS [1:1
(w/v)] and stored in -70 ˚C until use.
Samples preparation and analysis
Plasma and brain samples obtained from HPOs treated rats were prepared and analysed
using a validated method as described in Section 2.3. In short, internal standard, IS (200
µM; 10-fold concentration) was added into plasma and brain homogenate collected from
the treated rats. Following this, the samples were extracted with TFA as described in
Section 2.3.5. Briefly, clear supernatant was collected after centrifugation at 20800 g for
45 minutes and 30 µL was injected into HPLC system along with standard calibration
curve. The HPLC method for analysis of HPOs in the plasma and brain samples was

CHAPTER 5: IN VIVO NEUROPROTECTIONS OF HPOs
200
performed as described in detail in Section 2.1.9b. The HPLC response signal was taken
as the ratio of HPO and IS peak height and converted into concentration (µM) using linear
equation obtained from the standard calibration curve. The HPOs concentrations in
plasma and brain from treated rats were corrected for protein binding as described in detail
in Section 2.1.10.
Data analysis
The pharmacokinetic parameters were calculated by non-compartmental analysis (plasma
data after extravascular input) using Microsoft Excel Solver add-in, PK-Solver 2.0 (Zhang
et al., 2010). One-way ANOVA followed by Dunnett’s test was performed to compare
between the PK parameters.
6-OHDA model of PD for neuroprotection study
Male Wistar rats (n=6 per group; 250-300 g) were pre-treated with CP20 or CN128 three
days prior to 6-OHDA lesion and for four days after the lesion following a dosage regime
reported by Dexter et al. (2011). CP20 and CN128 (70 µmol/kg) or vehicle (5 mL/kg; 0.9%
(w/v) NaCl) were injected i.p twice daily with 12 h gap between treatments (doses at 9
a.m. and 9 p.m). On the day of the surgery only the first i.p. injection was performed 30
minutes prior to induction of the lesion. The dose of 6-OHDA-HCl (Sigma-Aldrich, UK) was
calculated as a free base and dissolved in 0.9% saline containing 0.1% (w/v) L-ascorbic
acid on ice on the day of surgery. Aliquots (1000 μL) were protected from light exposure
and stored on ice until the surgical procedure. The intra-striatal lesion was induced by
injection of 6-OHDA (8 µg/4 µL) as described in Section 2.4.4. Similarly, control animals
received sham injection (4 µL of 0.9% saline containing 0.1% (w/v) L-ascorbic acid. The
weights of all the rats were recorded daily before and after surgery. At the end of the
treatment period, the rats entered a ‘wash-out’ period for seven days. Behavioural
assessment as described below (Section 5.2.4) was performed on day 12th of the
experimental timeline as illustrated in Figure 5.2.1.

CHAPTER 5: IN VIVO NEUROPROTECTIONS OF HPOs
201
Figure 5.2.1: Overview of experimental timeline.
Rats were treated twice daily with CP20 or CN128 (70 µmol/kg, i.p.) or vehicle for 7 days.
Intrastriatal 6-OHDA (8 μg/4 μL) or sham-lesions (vehicle) were performed 30 minutes after drug
administration on the third day of HPOs treatment. Following a 7 days wash-out period, the rats
were culled.
D-amphetamine rotation test
On the day 9th after lesioned, D-amphetamine rotation test using a rotometer (RotoRatTM,
Med Associates, Inc., USA) was performed on the rats as described in Section 2.4.5. In
brief, the rats were injected i.p with 2.5 mg/kg D-amphetamine sulphate (Tocris
Bioscience, UK) prepared in 0.9% (w/v) saline. The rotations were recorded for a total of
3 h after D-amphetamine injection by a sensor attached to a tethered jacket that was
strapped on the rats. Prior to injection with D-amphetamine, the rotational baseline was
recorded for 30 minutes following acclimatisation to the rotometers. Data was collected
using the RotoRatTM hardware and RotoRatTM software Version 2.0 followed by analysis
to determine net ipsilateral rotations as described in Section 2.4.5.

CHAPTER 5: IN VIVO NEUROPROTECTIONS OF HPOs
202
Determination of dopamine and serotonin level by HPLC-ECD
Striatum dissection
The brain was removed from the skull and cleaned of meninges and striatum dissected.
The brain was cut laterally with single-edge blade (VWR International Ltd, UK) at the level
of optic tracts (Figure 5.2.2a).
Figure 5.2.2: Steps of striatum dissection on the isolated perfused brain.
a) Rat brain at ventral position i = optic chiasma, ii = optic tracts, iii = middle olfactory tracts and iv
= mammillary bodies (Ibe et al., 2014). Dotted straight line indicates the position of horizontal brain
cutting into halve b) the coronal slice of the upper part of the halve brain. Dotted circled shows the
location of striatum in the left and right hemispheres of brain c) Striatal tissues were separated from
the rest of brain tissues d) Isolated striatal tissues with white matter mostly removed and stored in
-70 ºC for HPLC analysis.
The upper-half part of the brain was positioned into coronal section. White matter was
pulled away with a pair of forceps and striatum as shown in Figure 5.2.2b was dissected
out and put into a pre-weighed microcentrifuge tube stored on dry ice. Similar steps were
repeated for contralateral side of striatum. The isolated striata were stored in -70 ºC until
analysis with HPLC.
Sample preparation
Striatum was weighed and diluted 1:9 (v/v) with 0.4 M perchloric acid containing 0.01%
(w/v) sodium metabisulfite (Na2S2O5) and 1 mM EDTA (PCA). DHBA at a final
concentration of 1 µM was added into the mixture and function as an internal standard.
The mixture was homogenised with a sonic homogeniser for 30 to 60 seconds (Sonics &
Materials Inc, USA). The homogenate was centrifuge for 10 minutes at 20800 g at 4 ˚C.
Finally, the supernatant was collected and store at -70 ˚C.

CHAPTER 5: IN VIVO NEUROPROTECTIONS OF HPOs
203
Standard
Main stock (1 mM) for dopamine and serotonin with their metabolites (DOPAC, HVA, 5-
HT & 5-HIAA) were prepared in PCA. A range of working stock solutions (10-640 µM) of
dopamine and serotonin with their metabolites was prepared in PCA. The injected
standards were prepared by 1:9 (v/v) dilution in PCA. 2,3-Dihydroxybenzoic acid (DHBA)
was used as an internal standard. Similarly, 1 mM of DHBA main stock was prepared in
PCA, diluted 1:99 (v/v) to 10 µM in 0.4 M PCA as working stock solution. Working stock
solution of DHBA was added into individual standard at 1:9 (v/v) dilution (final = 1 µM).
Additionally, a standard that consist of dopamine and metabolites at a selected single
concentration was also prepared in PCA. All chemicals were obtained from Sigma-Aldrich,
UK unless stated otherwise.
Mobile phase
Mobile phase was 0.1 M sodium dihydrogen orthophosphate (NaH2PO4) containing of 1
mM EDTA, 0.01% (w/v) octane sulfonic acid (OSA) in 12% (v/v) methanol, pH adjusted to
3.2 with phosphoric acid. Mobile phase was filtered with polyamide membrane filters (0.45
µm pore size; Sartorius Stedim UK Limited, UK).
HPLC conditions
The quantification was performed on an Ultimate 3000 Standard LC Systems equipped
with quaternary pump delivery system (LPG-3400SD), autosampler (WPS-3000(T)SL
Analytical) and INTRO electrochemical detector (Antec Scientific, USA). A column set in
the system was a Spherisorb ODS (2) 3 µm particle size HPLC column (SpheriClone 0.46
cm x 10 cm; Phenomenex, UK) was equilibrated at 30 ºC. Sample elution was performed
under isocratic mode at a flow rate of 1.0 mL/min. A potential of 0.72V was maintained
across the electrode, filter was set at 5 seconds, sensitivity range was set at 20 nA/V and
injection volume was 10 µL. Concentrations of catecholamines are calculated by using
peak height ratio (versus DHBA).

CHAPTER 5: IN VIVO NEUROPROTECTIONS OF HPOs
204
a) Representative dopamine and serotonin with metabolites at 1 µM
0 5 1 0 1 5 2 0 2 5
0
5 0 0
1 0 0 0
T im e (m in )
He
igh
t (m
.AU
)
E C D
DH
BA
Do
pa
min
eD
OP
AC
5H
IAA
5-H
T
HV
A
0 5 0 1 0 0 1 5 0
0
5 0
1 0 0
1 5 0
C o n c ( M )
He
igh
t ra
tio
n
(Do
pa
min
e/D
HB
A)
0 5 0 1 0 0 1 5 0
0
5 0
1 0 0
1 5 0
C o n c ( M )
He
igh
t ra
tio
n
(DO
PA
C/D
HB
A)
0 5 0 1 0 0 1 5 0
0
2
4
6
8
C o n c ( M )
He
igh
t ra
tio
n
(HV
A/D
HB
A)
0 5 0 1 0 0 1 5 0
0
5 0
1 0 0
1 5 0
C o n c ( M )
He
igh
t ra
tio
n
(5-H
T/D
HB
A)
0 5 0 1 0 0 1 5 0
0
5 0
1 0 0
1 5 0
C o n c ( M )
He
igh
t ra
tio
n
(5H
IAA
/DH
BA
)
a ) D o p a m in e b ) D O P A C c ) H V A
d ) 5 -H T e ) 5 H IA A
Figure 5.2.3: Representative chromatogram and standard curves for dopamine and
serotonin with their metabolites.
The catecholamines of interest are DHBA (RT = ~4.4 min), dopamine (RT = ~6.1 min), DOPAC
(RT = ~7.3 min), HVA (RT = ~18.7 min), 5-HT (RT = 13.4 min) and 5HIAA (RT = ~11.1 min)
Calibration curves was constructed from 0.1, 1, 10 and 100 µM concentrations.

CHAPTER 5: IN VIVO NEUROPROTECTIONS OF HPOs
205
Brain fixation and sectioning
Following dissection of the anterior part of the brain for removal of the striatum, the
posterior part of the brain was post-fixed with 4% (w/v) PFA for 6 days. The fixed brain
was then cryoprotected with 30% (w/v) sucrose containing 0.05% (w/v) sodium azide
(NaN3) in 0.1 M PBS (pH 7.4) until the tissue sank (~3-5 days). The processed brains were
cut coronally into 30 µm sections at the level of 3rd cranial nerve using a freezing
microtome and collected into 24-well plates containing 0.1 M PBS, pH 7.4 with 0.05% (w/v)
NaN3 as described in Sections 2.4.6 & 2.4.7.
Immunohistochemistry
Coronal brain sections were assessed for TH immunoreactivity in the SNPc by
immunoperoxidase staining, as described in detail in Section 2.4.8. In short, the coronal
sections (30 μm) were incubated in 24-well plates with primary antibody against TH (1:500)
overnight at room temperature. On the subsequent day, the sections were incubated with
biotinylated secondary antibody (1:200) for 1 hour and further 45 minutes incubation with
the ABC kit at room temperature. The antibody complex was visualised by exposing the
sections to 1 mL 0.05% (w/v) DAB prepared in 0.01% (w/v) H2O2 in 0.1 M PBS for ~3
minutes. The sections were then mounted onto coated adhesion microscope slides,
dehydrated, cover slipped and examined as described in Section 2.4.9.
Data and statistical analysis
Data are expressed as individual, mean+SEM or mean±SEM of experimental groups (n=6
rats per group). Dopamine turnover was calculated by finding the ratio between the
concentration of dopamine metabolites (DOPAC & HVA) over concentration of dopamine:
𝐷𝑜𝑝𝑎𝑚𝑖𝑛𝑒 𝑡𝑢𝑟𝑛𝑜𝑣𝑒𝑟 = [𝐷𝑂𝑃𝐴𝐶]+[𝐻𝑉𝐴]
[𝑑𝑜𝑝𝑎𝑚𝑖𝑛𝑒] Equation 5.2.1
Serotonin turnover was calculated by finding the ratio between the concentration of
serotonin metabolite (5-HIAA) over concentration of serotonin (5-HT)
𝑆𝑒𝑟𝑜𝑡𝑜𝑛𝑖𝑛 𝑡𝑢𝑟𝑛𝑜𝑣𝑒𝑟 = [5−𝐻𝐼𝐴𝐴]
[5−𝐻𝑇] Equation 5.2.2

CHAPTER 5: IN VIVO NEUROPROTECTIONS OF HPOs
206
GraphPad Prism 7 software was used for statistical analysis. Difference between control
and treatment groups was analysed with one-way or two-way ANOVA followed by Holm-
Šídák multiple comparison test where appropriate. p<0.05 was considered significant.
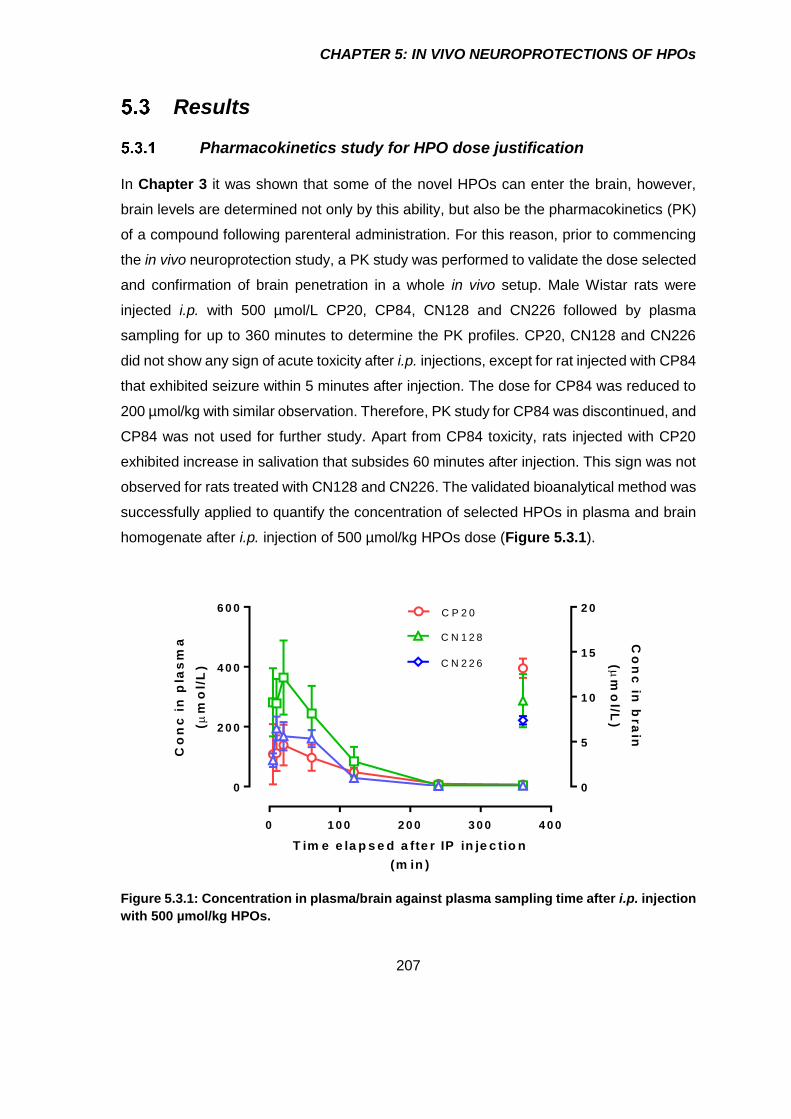
CHAPTER 5: IN VIVO NEUROPROTECTIONS OF HPOs
207
Results
Pharmacokinetics study for HPO dose justification
In Chapter 3 it was shown that some of the novel HPOs can enter the brain, however,
brain levels are determined not only by this ability, but also be the pharmacokinetics (PK)
of a compound following parenteral administration. For this reason, prior to commencing
the in vivo neuroprotection study, a PK study was performed to validate the dose selected
and confirmation of brain penetration in a whole in vivo setup. Male Wistar rats were
injected i.p. with 500 µmol/L CP20, CP84, CN128 and CN226 followed by plasma
sampling for up to 360 minutes to determine the PK profiles. CP20, CN128 and CN226
did not show any sign of acute toxicity after i.p. injections, except for rat injected with CP84
that exhibited seizure within 5 minutes after injection. The dose for CP84 was reduced to
200 µmol/kg with similar observation. Therefore, PK study for CP84 was discontinued, and
CP84 was not used for further study. Apart from CP84 toxicity, rats injected with CP20
exhibited increase in salivation that subsides 60 minutes after injection. This sign was not
observed for rats treated with CN128 and CN226. The validated bioanalytical method was
successfully applied to quantify the concentration of selected HPOs in plasma and brain
homogenate after i.p. injection of 500 µmol/kg HPOs dose (Figure 5.3.1).
0 1 0 0 2 0 0 3 0 0 4 0 0
0
2 0 0
4 0 0
6 0 0
0
5
1 0
1 5
2 0C P 2 0
C N 1 2 8
T im e e la p s e d a fte r IP in je c tio n
(m in )
Co
nc
in
pla
sm
a
(
mo
l/L
) C N 2 2 6
Co
nc
in b
ra
in
(
mo
l/L)
Figure 5.3.1: Concentration in plasma/brain against plasma sampling time after i.p. injection
with 500 µmol/kg HPOs.

CHAPTER 5: IN VIVO NEUROPROTECTIONS OF HPOs
208
The PK parameters for plasma obtained after analysis with PK Solver (Zhang et al., 2010)
are summarised in Table 5.3.1. CP20 was rapidly absorbed and reached maximum
concentration in plasma (Tmax) in 27 minutes. Likewise, CN128 and CN226 also reached
Tmax within 30 minutes after i.p. injection. The rapid absorption phase was followed by
exponential declined in plasma which correspond to the short half-lives (t1/2) of 61, 40 and
47 minutes after Tmax for CP20, CN128 and CN226 respectively. CP20, CN128 and CN226
were also characterised by high volume of distributions (Vd) between 1.5 to 2.8 L/kg with
rate of clearances (CL) between 0.02 to 0.03 L/kg/min. The concentrations of CP20,
CN128 and CN226 in plasma at the terminal time points (360 min) were between 2.9 to
7.0 µM. Furthermore, HPOs appeared to accumulate in the brain at the terminal time point
with concentrations approximately 2-fold of that found in plasma. Overall, there was no
significant different when CN128 and CN226 pharmacokinetic parameters were compared
with CP20. Nevertheless, CN128 showed a trend towards higher Cmax than CP20 (p=0.19).
Since the PK profile following i.p. injection for CN128 and CN226 were not different than
CP20 in addition to equal brain permeability and neuroprotection in vitro, only CN128 was
selected for in vivo neuroprotection study.
Table 5.3.1: Pharmacokinetic profile for CP20, CN128 and CN226 after 500 µmol/kg single
i.p. injection.
Parameter CP20 CN128 CN226
MW 139.1 273.3 287.4
Injected dose (µmol/kg) 500 500 500
Injected dose (mg/kg) 70 160 160
Tmax (min) 26.7±10.1 15.0±5.0 30.0±15.3
t1/2 (min) 60.7±11.0 40.2±14.3 46.8±3.0
Cmax (μmol/L) 149.8±69.7 369.4±123.2 193.8±36.2
AUC0-t (mmol/L/min) 16.1±3.4 32.8±12.9 18.6±4.0
AUC0-∞(mmol/L/min) 19.8±4.8 33.2±12.7 18.8±4.1
Vd (L/kg) 2.8±1.3 1.5±1.0 2.0±0.5
Cl (L/kg/min) 0.03±0.01 0.02±0.01 0.03±0.01
Clast (plasma) (µmol/L) 7.0±1.3 4.3±1.5 2.9±0.8
Clast (brain) (µmol/L) 13.2±1.1 9.6±3.0 7.4±0.5
Pharmacokinetics parameters were derived from analysis using Excel solver add-in (PK Solver)
provided by Zhang et al. (2010). Data are expressed as mean+SEM (n=3-4 rats). Statistical
analysis (one-way ANOVA) showed no significant different.

CHAPTER 5: IN VIVO NEUROPROTECTIONS OF HPOs
209
Effects of partial striatal 6-OHDA lesion and HPOs treatment on rat
body weight
The rat body weights steadily increased when the HPO/vehicle dosage regime started on
day 1 (Figure 5.3.2). The body weight dropped by 3% a day after the brain lesion
procedures but slowly attained the pre-surgical body weight about 4 days after the surgery.
By day 9th after the surgery, all rats had exceeded their pre-surgical body weight. Rats
treated with either 70 µmol/kg CP20 or CN128 twice daily for 7 days did not show any
abnormal symptoms during the dosing regimen.
0 1 2 3 4 5 6 7
2 2 0
2 4 0
2 6 0
2 8 0
3 0 0
3 2 0
1 0 1 2 1 4
1s
t d
ay
of
do
sin
g
Le
ft-s
tria
tum
6-O
HD
A l
es
ion
La
st
da
y o
f d
os
ing
D-A
mp
he
ta
min
e r
ota
tio
n
tes
t
We
igh
t (g
)
s a l/sh a m
C N 1 2 8 /6 -O H D A
C P 2 0 /6 -O H D A
s a l/6 -O H D A
C u l le d
Figure 5.3.2: Weight of rats over the course of in vivo neuroprotection study.
Data are mean±SEM (n=6 rats).

CHAPTER 5: IN VIVO NEUROPROTECTIONS OF HPOs
210
Effects of toxins and HPOs treatment on D-amphetamine-induced
ipsilateral rotations
There was no significant different on D-amphetamine induced ipsilateral rotations between
saline/6-OHDA group and saline/sham, CP20/6-OHDA and CN128/6-OHDA groups
(Figure 5.3.3) similar to the finding observed during the selection of 6-OHDA dose
(Section 2.4.5).
-5 0 0 5 0 1 0 0 1 5 0
-5 0
0
5 0
1 0 0
1 5 0
2 0 0
T im e (m in )Ne
t ip
sil
ate
ra
l ro
tati
on
s/1
0 m
inu
te
2 .5 m g /k g
D -a m p h e ta m in e , i.p .
R a t 1
R a t 2
R a t 3
R a t 4
R a t 5
R a t 6
-5 0 0 5 0 1 0 0 1 5 0
-5 0
0
5 0
1 0 0
1 5 0
2 0 0
T im e (m in )Ne
t ip
sil
ate
ra
l ro
tati
on
s/1
0 m
inu
te
R a t 1
R a t 2
R a t 3
R a t 4
R a t 5
R a t 6
2 .5 m g /k g
D -a m p h e ta m in e , i.p .
-5 0 0 5 0 1 0 0 1 5 0
-5 0
0
5 0
1 0 0
1 5 0
2 0 0
T im e (m in )Ne
t ip
sil
ate
ra
l ro
tati
on
s/1
0 m
inu
te
R a t 1
R a t 2
R a t 3
R a t 4
R a t 5
R a t 6
2 .5 m g /k g
D -a m p h e ta m in e , i.p .
-5 0 0 5 0 1 0 0 1 5 0
-5 0
0
5 0
1 0 0
1 5 0
2 0 0
T im e (m in )Ne
t ip
sil
ate
ra
l ro
tati
on
s/1
0 m
inu
te
R a t 1
R a t 2
R a t 3
R a t 4
R a t 5
R a t 6
2 .5 m g /k g
D -a m p h e ta m in e , i.p .
a ) s a lin e /s h a m b ) s a lin e /6 -O H D A
c ) C P 2 0 /6 -O H D A d ) C N 1 2 8 /6 -O H D A
e) Area under the curve
sal/sh
am
sal/6-O
HD
A
CP
20/6
-OH
DA
CN
128/6
-OH
DA
0
5 0 0 0
1 0 0 0 0
1 5 0 0 0
Ne
t ip
sil
ate
ra
l ro
tati
on
AU
C
(0-1
50
min
)
Figure 5.3.3: D-Amphetamine rotation test for 6-OHDA unilateral striatal lesioned rat.
Graphs a), b), c) and d) show data for net ipsilateral rotation shows individual data. Data are
individual rat or mean±SEM (n=6 rats). Statistical analysis with one-way ANOVA showed no
significant different.

CHAPTER 5: IN VIVO NEUROPROTECTIONS OF HPOs
211
Effects of toxins and HPOs treatment on catecholaminergic
neurotransmitters in striatum
Striatum from non-lesioned (contralateral) and 6-OHDA-lesioned (ipsilateral) sides were
dissected and processed for the measurement of dopamine or serotonin and metabolites
levels by HPLC-ECD. Treatment with either CP20 or CN128 had no effect on the
dopamine level in the contralateral side when compared to the saline-treatment groups
(Figure 5.3.4).
There was no different on the level of dopamine in the sham-lesioned striatum compared
to the non-lesioned striatum in the saline-treatment group (negative control) (Figure
5.3.4a). By contrast, intra-striatal injection of 6-OHDA caused depletion of dopamine in the
ipsilateral side by 64% compared to the contralateral side in the saline-treatment group
(positive control). Treatment with CP20 and CN128 protected against 6-OHDA induced
dopamine depletion by only causing 38% and 31% dopamine depletion respectively in the
6-OHDA ipsilateral side compared to the contralateral side of striatum, with no difference
in the dopamine levels in the contralateral side of SNPc for rats treated with CN128 or
CP20.
Neither 6-OHDA lesioned nor HPOs treated group showed significant different on the level
of DOPAC and HVA in the striatum when compared to the saline-treatment + sham-
lesioned group (Figure 5.3.4b & c).
Sal/sh
am
Sal/6-O
HD
A
CP
20/6
-OH
DA
CN
128/6
-OH
DA
0
1 0
2 0
3 0
pm
ol/
g t
iss
ue
* * *
# ##
* * **
#
Sal/sh
am
Sal/6-O
HD
A
CP
20/6
-OH
DA
CN
128/6
-OH
DA
0
1 0
2 0
3 0
Sal/sh
am
Sal/6-O
HD
A
CP
20/6
-OH
DA
CN
128/6
-OH
DA
0
1 0
2 0
3 0
a ) D o p a m in e b ) D O P A C c ) H V A
ip s ila te ra l
c o n tra la te ra l
Figure 5.3.4: Dopamine and metabolites measurement in striatum. Level of dopamine,
DOPAC and HVA in the striatum as determined by HPLC-ECD. Data are mean+SEM (n=6 rats).
* p<0.05, *** p<0.001 compared to ipsilateral side; # p<0.05, ## p<0.01compared to Sal/6-OHDA
ipsilateral side (two-way ANOVA followed by Holm-Šídák multiple comparison test).

CHAPTER 5: IN VIVO NEUROPROTECTIONS OF HPOs
212
Dopamine turnover was calculated by the formula described in Equation 5.2.1. Treatment
of CP20 and CN128 did not have any effect on the dopamine turnover in the non-lesioned
side (Table 5.3.2). Intra-striatal injection of 6-OHDA lead to significant 2.6-fold increase in
dopamine turnover. Treatment with both CP20 and CN128 prevented the 6-OHDA-
induced increment in dopamine turnover in the ipsilateral side such that turnover values
were not different to saline/sham treated controls or values on the contralateral non-
lesioned side.
Table 5.3.2: Dopamine turnover in rat striatal tissue.
Treatment
Dopamine turnover
[DOPAC]+[HVA]/[dopamine]
contralateral ipsilateral
Sal/sham 0.82±0.05 0.90±0.08 ##
Sal/6-OHDA 0.79±0.07 2.04±0.38 **
CP20/6-OHDA 0.69±0.03 0.84±0.13 ##
CN128/6-OHDA 0.97±0.18 0.97±0.22 ##
Data are mean or mean±SEM (n=6 rats). ** p<0.01 compared to contralateral side of the
corresponding group; ## p<0.01 compared to Sal/6-OHDA ipsilateral side (two-way ANOVA
followed by Holm-Šídák multiple comparison test).
Treatment with either CP20 or CN128 had no effect on the serotonin level the on the
contralateral side when compared to the saline-treatment groups. There was no different
on the level of serotonin in the sham-lesioned striatum compared to the non-lesioned
striatum in the sham-lesioned group (negative control) (Figure 5.3.5a). In contrast, intra-
striatal injection of 6-OHDA caused depletion on the level of serotonin in the ipsilateral
side by 33% compared to the contralateral side in the 6-OHDA-lesioned group (positive
control). By contrast there was no difference in the levels of serotonin between the
ipsilateral and contralateral sides in either the CP20 and CN128 treatment group.
However, there was a small but significant increase in the level of serotonin on the
contralateral sides of the 6-OHDA-lesioned group and CN128 treated animals.
Neither 6-OHDA lesioned nor HPOs treated group showed significant different on the level
of 5HIAA in the striatum when compared to the saline-treatment + sham-lesioned group
(Figure 5.3.5b).

CHAPTER 5: IN VIVO NEUROPROTECTIONS OF HPOs
213
Sal/sh
am
Sal/6-O
HD
A
CP
20/6
-OH
DA
CN
128/6
-OH
DA
0
1
2
3
4p
mo
l/m
g t
iss
ue
*
$ $
a ) 5 -H T b ) 5 -H IA A
Sal/sh
am
Sal/6-O
HD
A
CP
20/6
-OH
DA
CN
128/6
-OH
DA
0
1
2
3
4
ip s ila te ra l
c o n tra la te ra l
Figure 5.3.5: 5-HT and metabolite measurement in striatum.
Level of 5-HT and 5-HIAA in the striatum as determined by HPLC-ECD. Data are mean+SEM
(n=6 rats). * p<0.05 compared to ipsilateral side; $$ p<0.01 compared between contralateral
sides (two-way ANOVA followed by Holm-Šídák multiple comparison test).
Serotonin turnover was calculated by the formula described in Equation 5.2.2. Treatment
of CP20 and CN128 did not have any effect on the serotonin turnover in the non-lesioned
side (Table 5.3.5). Intra-striatal injection of 6-OHDA not significantly changed serotonin
turnover although there was a trend towards increase serotonin turnover (p=0.06).
Treatment with CP20 and CN128 prevented 6-OHDA induced increased in serotonin
turnover in the lesioned side compared to the non-lesioned side.
Table 5.3.3: Serotonin turnover in rat striatal tissue.
Treatment
Serotonin turnover
[5-HIAA]/[5-HT]
contralateral ipsilateral
Sal/sham 1.76±0.07 1.77±0.18
Sal/6-OHDA 1.51±0.18 2.18±0.11
CP20/6-OHDA 1.81±0.0.03 1.91±0.12
CN128/6-OHDA 1.92±0.26 1.86±0.08
Data are mean or mean±SEM (n=6 rats). Statistical analysis with two-way ANOVA showed no
significant different.

CHAPTER 5: IN VIVO NEUROPROTECTIONS OF HPOs
214
Effects of toxins and HPOs treatment on TH-positive cells in SNPc
Brain coronal sections at the level of SNPc were stained for TH by immunoperoxidase
method to quantify the number of TH+ cells. The TH+ cells in the non-lesioned
(contralateral) and 6-OHDA lesioned (ipsilateral) sides of SNPc were counted manually
for analysis in a blinded manner.
Treatment with either CP20 or CN128 alone had no effect on the number of TH+ cells on
the contralateral side when compared to the saline-treatment groups (Figure 5.3.6). There
was no different on the number of TH+ cells in the SNPc of sham-lesioned compared to
the contralateral side in the saline-treatment group (negative control) (Figure 5.3.7). By
contrast, intra-striatal injection of 6-OHDA (8 µg) reduced the number of TH+ cells in SNPc
by 46% compared to the contralateral side in the saline-treatment group (positive control).
Treatment with CP20 and CN128 significantly protected against 6-OHDA-induced TH+ cell
loss in the SNPc of ipsilateral side with only 20% and 14% loss of cells respectively
compared to the contralateral side which was not a statistically significant difference.
Sal/sh
am
Sal/6-O
HD
A
CP
20/6
-OH
DA
CN
128/6
-OH
DA
0
5 0
1 0 0
1 5 0
c o n tra la te ra l
ip s ila te ra l
TH
+ c
ell
s i
n t
he
SN
Pc
* *
# #
# #
# # #
Figure 5.3.6: TH+ staining cells in the SNPc.
Data are mean or mean+SEM (n=6 rats). ** p<0.01 compared to ipsilateral side; ## p<0.01,
### p<0.001 compared to Sal/6-OHDA ipsilateral side (2-way ANOVA followed by Holm-Šídák
multiple comparison test). Data are mean+SEM (n=6 rats). ** p<0.01 compared to ipsilateral
side; ## p<0.01, ### p<0.001 compared to Sal/6-OHDA ipsilateral side (2-way ANOVA
followed by Holm-Šídák multiple comparison test).

CHAPTER 5: IN VIVO NEUROPROTECTIONS OF HPOs
215
Figure 5.3.7: Representative photomicograph of brain coronal section showing TH+ cells in
SNPc region.
The black line marks the third cranial nerve that demarcate the dopaminergic neurons cell bodies
in SNPc and VTA. TH+ cells in ipsilateral SN in (a) vehicle-lesioned and saline treated rats; (b) 6-
OHDA-lesioned (8 μg/4 μl) and saline treated rats (c) 6-OHDA-lesioned (8 μg/4 μl) and CP20-
treated (70 µmol/kg/twice-daily/7 days, i.p) rats, (d) 6-OHDA-lesioned (8 μg/4 μl) and CN128-
treated (70 µmol/kg/twice-daily/7 days, i.p) rats. Inset a’) a typical TH+ cell. Scale bar = 500 μm and
inset scale bar = 50 μm are representative of all images.

CHAPTER 5: IN VIVO NEUROPROTECTIONS OF HPOs
216
Discussion
In this study, it was hypothesised that CP84, CN128 and CN226 would confer a
neuroprotection against the 6-OHDA-induced dopaminergic neuron degeneration in basal
ganglia. However, after preliminary assessment of pharmacokinetic (PK) profile of these
HPOs, only CN128 was chosen for in vivo neuroprotection study. The effect of
intraperitoneal injection of CP20 and CN128 on 6-OHDA induced degeneration of
dopaminergic neuron in SNPc was investigated in vivo. The D-amphetamine induced
ipsilateral rotation were first assessed one week after termination of CP20 and CN128
treatment in rats, 12 days following the 6-OHDA or sham lesion. Secondly, striatal tissues
from rat brains were dissected and processed two-days after rotational test to measure
dopamine and serotonin together with their metabolites by HPLC-ECD. Finally, brain
coronal sections at the level of SNPc and striatum for 6-OHDA lesioned rats treated with
CP20 and CN128 were assessed by TH immunohistochemistry to establish whether they
exert a protective effect by preventing dopaminergic cell loss in the SNPc.
Pharmacokinetic study
CP20 has previously been assessed of its PK profile after systemic injection and was
shown to penetrate the brain (Fredenburg et al., 1996b). Indeed, in situ brain perfusion of
CP20 in rats as explained in Chapter 3 support these previous reports of CP20 brain
penetration in in vivo set up. Additionally, it has been revealed from the in situ brain
perfusion experiment that CN128 and CN226 brain permeability were not different than
CP20. Nevertheless, investigation of PK is important to gain a better understanding on
the distribution and clearance for novel HPOs after a systemic injection, and to confirm
brain penetration in in vivo rat model. Therefore, the aim of the study was to characterise
the PK profile of the novel HPOs in plasma after i.p. injection and compared to CP20.
Additionally, the level of HPOs in brain were measured at the terminal sampling time (360
min).
The reported CP20 dose employed that succesfully showed neuroprotection in rats was
70 µmol/kg (single i.p.dose) which was below the sensitivity limit of the current analytical
method (Dexter et al., 2011). Nevertheless, since the aim of the current study is for the
confirmation of plasma exposure and brain permeability of novel HPOs after i.p. injection
in rats, a higher dose was preferred. The dose selected for this PK study (500 µmol/kg)

CHAPTER 5: IN VIVO NEUROPROTECTIONS OF HPOs
217
was based on a previous PK study on HPOs performed by Fredenburg et al. (1993 &
1996). However, rats injected with 500 µmol/kg CP84 exhibited convulsion within 5
minutes after injection which suggest a CNS-related toxicity (Schlag et al., 2000,
Kontoghiorghes, 1991). This observation corresponded to the rapid brain permeability of
CP84 in in situ brain perfusion experiment (Chapter 3). Additionally, convulsion after
single dose administration of 4000 µmol/kg CP20 by intravenous route has been
described, but this only occur within 2 to 8 h after treatment (European Medicines Agency,
2005, Hider et al., 1990). The dose of CP84 was reduced to 200 µmol/kg with similar
outcome, and therefore CP84 was dropped for further studies despite it showing promising
result in term of brain permeability in in situ brain perfusion experiment, although only
showed mild neuroprotection in in vitro study (Chapter 4). One noticeable observation in
all rats after injection with CP20 was increased in salivation that diminished within 60
minutes in line with the t1/2 for CP20. This observation was not seen in other rats treated
with CN128 or CN226. Indeed, hypersalivation has been reported to be a unique symptom
for rat treated only with CP20 and not for other derivatives of CP20 (Hider et al., 1990,
European Medicines Agency, 2005). The cause of this observation is unclear, however
increase in salivation is often associated with cholinergic toxicity (Takakura et al., 2003).
Unfortunately, there are no studies that specifically focus on the interaction between CP20
and cholinergic transmission has been reported partly because the hypersalivation was
only observed in rats but not in human suggesting interspecies different in CP20 toxicity
(Porter, 1996, Olivieri et al., 1998). CP20 has been shown to significantly deplete
leukocytes counts in control and iron overloaded mice (Porter et al., 1991). Indeed, CP20
appeared to induce neutropenia and agranulocytosis in 7% of Thalassemia patients within
6 months of treatment, which ceased after discontinuation of the therapy (Devos et al.,
2014, Martin-Bastida et al., 2017). Remarkably, sub-chronic toxicity study of CN128 in rat
and cynomolgus monkey revealed no reduction in leukocytes count and pathological
changes in sternal bone marrow which was observed in CP20-treated animals, suggesting
better toxicity profile for CN128 than CP20 (Paiboonsukwong et al., 2016).
The selected dose was sensitive enough for the detection of CP20, CN128 and CN226 in
the plasma and brain up to 360 minutes post-injection by the established HPLC-UV
method. Blood sampling time was limited to 360 minutes based on the previous report of
rapid elimination of CP20 in plasma and almost undetectable in the plasma after 12 h of
intravenous injection (Fredenburg et al., 1993). This also allows sufficient HPOs levels

CHAPTER 5: IN VIVO NEUROPROTECTIONS OF HPOs
218
remained in the brain for sensitive measurement by HPLC-UV. CP20, CN128 and CN226
reach maximal concentration in plasma (Tmax) in less than 30 minutes after i.p. injection.
Half-life (t1/2) for CP20 in this study was 61 min which is within the range of previously
reported t1/2 (72±30 minutes) after a single bolus injection in rats (Fredenburg et al., 1996).
Likewise, CN128 and CN226 also rapidly cleared from the plasma with t1/2 less than 60
minutes. The short t1/2 for CP20, CN128 and CN226 agreed with their high volume of
distribution (Vd) which is approximately 2.0 L/kg. This suggest that the HPOs were
disributed extravascularly since the Vd exceeded the total plasma volume in rat (31.6
mL/kg) which is related to their lipophilicity (Bijsterbosch et al., 1981). Similar pattern of
pharmacokinetic profile were observed in human when CP20 was ingested orally where
the Tmax was less than 60 minutes and the t1/2 was between 1.5 to 2 h after the oral
consumption (Hoffbrand, 2005). In addition to the high Vd, the HPOs were also rapidly
cleared from the plasma with rate of clearance (CL) was aprroximately 0.03 L/kg/min which
agreed with reported CP20 CL in rats and humans (Quanquan et al., 2010, Fredenburg et
al., 1993, Thuma et al., 1998). Most importantly, novel HPOs level were successfully
measured in the brain at 360 minutes post-injection, and the level was not different than
CP20. This confirms brain penetration of CP20, CN128 and CN226 observed in in situ
brain perfusion experiment as discussed in Chapter 3.
The most recent study performed by intragastric administration of 1000 µmol/kg CP20
showed a shorter half-life (21 min) (Quanquan et. al., 2010). This observation was
expected by the means of the CP20 administration which made it succeptible to the first-
pass metabolism in the liver. Indeed, CP20 has been reported to undergo extensive
metabolism in the liver to glucuronide conjugate (85% of the administered dose) and
rapidly excreted in the urine of man (Hoffbrand et al., 1998, Hoffbrand et al., 2003). The
PK profiles in this study is of importance since CN128 was previously reported to have a
better efficacy in mobilising iron from the liver in iron-loaded rats after an oral
administration due CN128 slower rate of conversion to glucuronide metabolite (2-folds
slower) than CP20, and therefore would be expected to show higher Cmax than CP20 (Lu,
2016, Hider et al., 2011a, Paiboonsukwong et al., 2016). This could be further reflected
by higher CN128 oral bioavailability in rats (82%) than CP20 (56%) (Paiboonsukwong et
al., 2016, Singh et al., 1992). This contradiction in HPOs level could be explained by the
route of administration of HPOs in this study that was by i.p. injection. In this circumstance,
CP20 and CN128 are readily reaching the systemic circulation after absorption through

CHAPTER 5: IN VIVO NEUROPROTECTIONS OF HPOs
219
the peritoneal tissues lining and rapidly distributed peripherally as showed by its high Vd
which is 1.5 L/kg. In contrast, oral administration of CN128 would reaches the liver in the
first instance where most of the metabolism occur, before entering the sytemic circulation
(Badria et al., 2015). Nevertheless, in this study, CN128 showed a trend towards higher
Cmax than CP20 (p=0.19) which might support the report of slower glucuronides formation
in the liver (Lu, 2016, Hider et al., 2011a, Singh et al., 1992).
This study provide a direct evidence of the presence of HPOs in plasma and brain after
500 µmol/kg i.p. injection in rats. However, the dose employed in this study is not suitable
for the sub-chronic experimental design for in vivo neuroprotection study. Furthermore,
administration of high dose of HPO in non-systemic iron overlead rats sub-chronically
often lead to toxicity due to depletion of systemic iron (Sauerbeck et al., 2013, Mounsey
and Teismann, 2012). Neuroprotection study for CP20 performed by Dexter et al. (2011)
used a lower dose of CP20 (70 µmol/kg) in in vivo PD model of rat in contrast to 600
µmol/kg CP20 for iron-mobilisation study in iron-overload rat model (Crowe and Morgan,
1994). In his study, a unilateral 6-OHDA rat model of PD were treated with CP20 at 70
µmol/kg twice daily for 5 days. The treatment regime started a day before lesion and the
study managed to show significant neuroprotection as assessed by TH+ cell counting in
SNPc and dopamine level in sriatum (Dexter et al., 2011). Based on this reported study,
the same dose regiment was emplyoed for assesment of novel HPO neuroprotection in
vivo.
Effect of unilateral partial 6-OHDA-lesioned on D-amphetamine
induced rotation
The current study showed that the D-amphetamine rotation test failed to cause significant
different in rotational activity on the unilateral partial 6-OHDA-lesioned rats compared to
sham-lesioned rats. This finding replicated the data presented in Section 2.5.5 whereby
intra-striatal injection with 4 µg, 8 µg or 12 µg 6-OHDA were not significantly differed in
rotational behaviour compared to sham-lesioned rats. Similarly, treatment with CP20 or
CN128 also did not cause different in the rotation induced by D-amphetamine when
compared to control.
Amphetamine-induced rotations have previously been shown to correlate with the size of
6-OHDA-lesion (Carmen et al., 1991, Przedborski et al., 1995, Kirik et al., 1998), however,
CHAPTER 5: IN VIVO NEUROPROTECTIONS OF HPOs
220
there is a threshold for induction of behavioural impairment. Amphetamine-induced
rotation start to show in rats with 40-50% reduction in total striatal DA content, and 30-
50% loss of TH cell bodies (Hefti et al., 1980; Lee et al., 1996; Przedborski et al., 1995).
In the present study, there was approximately 60% loss of striatal DA content and 50%
loss of the number of nigral dopamine cell bodies, so one might expect to see some
rotational activity. However, the number of TH+ cells was only counted in one level of the
SNPc, and the degree of cell loss may be less in more rostral and caudal areas, allowing
compensation for the lesion. In addition, the degree of cell loss may be on the cusp of
allowing rotations to be observed, with ipsilateral postsynaptic receptor changes balancing
the contralateral DA release induced by amphetamine (Carmen et. al., 1991). Indeed, in
agreement with the present study, the lack of significant rotational activity in partial-
lesioned compared to sham-lesioned rats has been previously reported (Robinson et al.,
1994). On the other hand, the site of the striatum where the profound lesion occurred may
also contributed to the absence of asymmetrical rotational behaviour in this study. Olds et
al. (2006) demonstrated that cell loss at the lateral portion of striatum lead to profound
asymmetrical rotation in contrast to cell loss at the central and/or medial portion of striatum
which showed very low asymmetrical rotations in rats after D-amphetamine injection. In
the present study, striatum immuno-stained for TH showed profound dopaminergic fibre
loss in the central portion of the striatum which correspond to the site where the syringe
was lowered during 6-OHDA infusion (Figure 2.4.8, top panel in Section 2.4.9).
Therefore, it seems inappropriate to use the amphetamine rotation test as an indication of
lesion size and hence protection induced by the HPOs in the current study. Other
spontaneous behavioural test that evaluate locomotor activities such as cylinder and
rotarod tests could be explored to give insight on the effect of 6-OHDA lesion and
treatment with HPOs (Carvalho et al., 2013, Decressac et al., 2012), however, these too
require lesions of >50% (Kirik et al., 1998). Overall, it can be concluded that the size and
site of 6-OHDA lesioned in the striatum are important for D-amphetamine rotation
behavioural read-out to be consistently observed.
As there was clearly loss of dopamine cell bodies and striatal dopamine levels in the 6-
OHDA-lesioned rats, it is apparent that no conclusion about the protective nature for
CP128 or CP20 can be made from these data. It may be that the behavioural studies were
performed before the full extent of the lesion had developed, or that the compensatory
mechanisms such as increased dopamine turnover in the striatum had developed that

CHAPTER 5: IN VIVO NEUROPROTECTIONS OF HPOs
221
were sufficient to overcome the partial 64% lesion induced in these studies (Marinova-
Mutafchieva et al., 2009).
Effect of CP20 and CN128 on 6-OHDA-induced alterations of
dopamine and serotonin levels in striatum
Despite the fact that the D-amphetamine-induced rotation study failed to show a difference
in 6-OHDA lesioned compared to sham-lesioned rats, 6-OHDA (8 µg) injected into the
ipsilateral striatum caused depletion of dopamine level by 64% of control which suggest
degeneration and loss of axonal projection of dopaminergic neurons in the striatum that
originates from SNPc (Haber et al., 2000, Wall et al., 2013, Reynolds and Wickens, 2000).
The observed depletion level of dopamine in ipsilateral striatum was consistent with
previous studies targeting partial lesion and correspond to the early phase of PD (Zigmond
et al., 1989, Walker et al., 2013, Branchi et al., 2010). Similarly, serotonin level in the
ipsilateral striatum was also depleted although milder (33%) than dopamine depletion
which was expected due to direct injection of 6-OHDA into the striatum would also killed
the serotonergic terminals by oxidative stress (Smith and Cass, 2007). However, close
inspection on the level of serotonin showed no significant different when ipsilateral sides
were compared. This is further supported by lack of different in serotonin turnover between
ipsilateral and contralateral sides in 6-OHDA-lesioned group. Therefore, the effect of CP20
and CN128 on the level of serotonin in the striatum were inconclusive and may require
additional experimental data for confirmation. Nevertheless, higher turnover rate of
dopamine in the ipsilateral striatum compared to sham-lesioned suggesting increased in
activity of the remaining dopaminergic terminals to synthesis dopamine in order to
compensate for dopamine loss after 6-OHDA lesioned (Meiser et al., 2013, Robinson et
al., 1994).
Treatment with CP20 and CN128 had no effect on the basal level of dopamine and
serotonin suggesting that the rate limiting enzyme in dopamine (tyrosine hydroxylase, TH)
and serotonin (tryptophan hydroxylase, TPH) were not affected. This is important since
iron is an important co-factor for those enzymes and inhibition of these enzymes would
exacerbate rather than improve the symptoms of PD (Zhou et al., 2005, Daubner et al.,
2011). Indeed, previous report showed that measurement of dopamine and serotonin with
their metabolites 2 h after 70 µmol/kg i.p. injection of CP20 in rats revealed no changed
except for HVA and 5-HIAA that reduced approximately by 40 and 20% respectively, which

CHAPTER 5: IN VIVO NEUROPROTECTIONS OF HPOs
222
returned to control level within 6 h after injection (Waldmeier et al., 1993). As hypothesized,
intraperitoneal injection of CP20 and CN128 protected against 6-OHDA-induced depletion
of dopamine by approximately 30% compared to dopamine content in saline/6-OHDA-
lesioned rats which agreed with a finding reported by Dexter et al. (2011). In addition,
CP20 and CN128 fully protected against the reduction in serotonin level induced by 6-
OHDA probably because a smaller density of striatal serotonergic compared to
dopaminergic terminals (Zhou et al., 2005). Although CP20 and CN128 did not fully
prevent dopamine level depletion to the level as in sham-lesioned rats, the dopamine
turnover was not significantly different than the sham-lesioned rat which might suggest
that functionally the dopamine neurons were normal. Thus, the lesion threshold for an
increase in activity of the remaining neurons was not reached due to the smaller level of
dopamine loss which, therefore, did not interfere with the normal function of the nigro-
striatal pathway (Dexter et al., 2011, Robinson et al., 1994). Intraperitoneal injection of
other novel iron chelator, VK28 also showed protection against 6-OHDA-induce dopamine
reduction in striatum, although it did not maintain the dopamine turnover at the control
level (Shachar et al., 2004).
Effect of CP20 and CN128 on 6-OHDA-induced dopaminergic cell
loss in SNPc
Depletion of dopamine after 6-OHDA intra-striatal injection was accompanied by a
moderate 46% reduction in TH+ cell in the SNPc compared to control as would be expected
for targeting partial lesion (Penttinen et al., 2016, Rodrigues et al., 2003). Although 6-
OHDA doses less than 8 µg can also create a partial lesion, this is less recommended as
the variation in lesion size was higher with smaller amount of 6-OHDA (Duty and Jenner,
2011). On the other hand, intra-striatal injection of 6-OHDA exceeding 10 µg has been
reported to non-specifically causing tissue damaged and striatal cell loss around the lesion
site (Bjorklund et al., 1997, Przedborski et al., 1995). The lower percentage of TH+ cell
loss in SNPc agrees with the higher percentage of dopamine depletion in the striatum as
reported by Debeir et al. (2005) and Penttinen et al. (2016). This is because, intra-striatal
injection of 6-OHDA causes immediate degeneration of dopaminergic terminals in
proximity to injection site by extracellular production of ROS (Ferger et al., 2001, Debeir
et al., 2005). Some 6-OHDA was taken up by the surviving axon terminal through DAT
and followed by slower retrograde loss of dopaminergic cell bodies through a combination
of oxidative stress and inhibition of mitochondrial respiratory chain within a week after

CHAPTER 5: IN VIVO NEUROPROTECTIONS OF HPOs
223
lesion (Lu et al., 2014, Rodriguez-Pallares et al., 2007). Furthermore, the observed TH+
cell loss was prominent in the dorsal tier of the SNPc which correspond to the nigro-striatal
dopaminergic projection which supports the retrograde degeneration mechanism of 6-
OHDA through interaction with DAT transporter (Storch et al., 2004). This observation
confirmed that the axons of neuronal cell bodies in SNPc are terminated in the striatum
(Reynolds and Wickens, 2000). The delayed loss of dopaminergic cell bodies mimics the
dying back theory of PD pathogenesis and allow a therapeutic intervention well suited for
a neuroprotection study with CP20 and CN128 (Tagliaferro and Burke, 2016, Dauer and
Przedborski, 2003). Additionally, 6-OHDA-lesioned rats exhibited increased in iron level in
striatum and SNPc which is relevant to investigate the neuroprotective effect using iron
chelator (Wang et al., 2004, Virel et al., 2014b). To support this further, HPOs showed
better neuroprotection in 6-OHDA-induced SH-SY5Y cell death compared to other type of
toxins which suggest part if not full, involvement of iron in causing cell death as discussed
in detail in Chapter 4.
CP20 and CN128 have been shown to enter the brain as measured by in situ brain
perfusion and systemic i.p. injection. In contrast to the observe milder effect of CP20 and
CN128 in preventing reduction of dopamine level in the striatum, CP20 and CN128 fully
protected against the loss of dopaminergic cell bodies in SNPc which agreed with previous
study using CP20 (Dexter et al., 2011, Zhu et al., 2017a). It could be that higher
concentration of 6-OHDA at the injection site and surrounding tissues prevented the action
of CP20 and CN128 in reducing oxidative stress in the striatum. On the other hand,
delayed retrograde axonal degeneration of dopaminergic neurons and distance from the
injection site allow sufficient period for CP20 and CN128 to protect dopaminergic neurons
in the SNPc. The ability of CP20 and CN128 to protect against 6-OHDA
neurodegeneration was more likely by the iron chelation itself. Furthermore, oxidative
stress after 6-OHDA or MPTP administration has been shown to increase iron level in
basal ganglia (Virel et al., 2014a, Hall et al., 1992, He et al., 1996). However, the
processes by which 6-OHDA causes iron accumulation in the basal ganglia is not
conclusive and may involve multiple mechanisms such as release of iron from intracellular
iron storage protein, ferritin (Jameson et al., 2004) and up regulation of the divalent metal
transporter (DMT1) that translocate sequestered vesicular iron into cytoplasm as free-
labile iron (Jia et al., 2015, Jiang et al., 2010). Additionally, intracerebral injection of 6-
OHDA may disturbed the BBB integrity due to the invasive nature of the lesioned

CHAPTER 5: IN VIVO NEUROPROTECTIONS OF HPOs
224
procedure causing leakage of plasma iron that are normally transported into the brain by
transferrin receptor (TfR) (Bien-Ly et al., 2014). This view is supported by Walker et al.
(2013) who demonstrated brain oedema associated with deposition of iron along the
needle path after intra-striatal injection of 6-OHDA in rats. Moreover, oxidative-stress
causes by 6-OHDA could also make BBB more permeable to iron by microglial activation
(Virel et al., 2014a, Zhu et al., 2017b). Free non-chelated irons are neurotoxic due to their
contribution in exacerbating oxidative stress (Friedman, 2011). Indeed, free irons have
been shown to cause brain inflammation by activation of NFkB, IL6 and TNF-α which can
be prevented by iron-chelating drugs such as DFO, (−)-epigallocatechin-3-gallate (EGCG)
and R-apomorphine (Li et al., 2016, Levites et al., 2001, Youdim et al., 2000, Grunblatt et
al., 2001). To further support the involvement of iron in neurodegenerative mechanism,
mice on restricted-iron diet were more resistance towards MPP+ toxicity and did not exhibit
impaired in motor behaviour after MPTP treatment (Levenson et al., 2004).
In theory, therefore, HPOs such as CP20 and CN128 could conferred neuroprotection by
two mechanisms. First is by direct chelation of labile-iron pool thus minimised one of the
reactants needed for Fenton reaction (Devanur et al., 2008b). Secondly is by mobilising
intracellular chelated iron to systemic circulation. This is because, a completely chelated
iron by bidentante iron chelators such as CP20 and CN128 has a net zero charge and
therefore are membrane permeable (Hider et al., 1990, Paiboonsukwong et al., 2016).
Furthermore, chelated-iron in systemic circulation are readily transferred to circulating
apo-transferrin due to relatively lower pFe3+ of CP20 and CN128 compared to transferrin
(Hider et al., 1990, Devanur et al., 2008a). Indeed, the most recent report evaluating CP20
neuroprotection revealed almost 60% reduction of ferric iron deposits in the SNPc of 6-
OHDA-lesioned rats (Levenson et al., 2004).
Advantages and shortcomings of this study
Testing neuroprotection agents in living animals may provide a better approximation of the
pharmacological and physiological processes occur in humans than testing in in vitro cell
lines. Over the years, several in vivo models of PD have been developed in laboratories
to cater for the increasing needs for evaluation and discovery of the first functional and
effective neuroprotection agent in clinic (Tieu, 2011, Duty and Jenner, 2011). Although
none of the in vivo PD models reflects all the pathologies and symptoms of PD in man,
these models play an important role for pre-clinical evaluation of potential treatment for

CHAPTER 5: IN VIVO NEUROPROTECTIONS OF HPOs
225
PD. Indeed, in vivo models of PD have successfully offered insights into the understanding
of the cell death processes, aetiology, pathology as well as molecular mechanisms of
neurodegeneration (Blesa et al., 2012). The decision of which in vivo PD models to choose
is normally based on the type of investigation required. Here, the 6-OHDA rat model was
chosen since 6-OHDA has been shown to promote abnormal iron accumulation in the
basal ganglia which exacerbate oxidative stress by iron participation in Fenton reaction
(Zhu et al., 2017, Virel et al., 2014, Wang et al., 2015). Indeed, elevated iron levels in the
basal ganglia is one of the known pathological signs of PD brain (Mochizuki and Yasuda,
2012). Therefore, this model would be relevant to evaluate the effect of HPO iron chelators
in preventing loss of dopaminergic neurons in the basal ganglia. Additionally, in vitro
neuroprotection study in Chapter 4 showed the neuroprotective effect of HPOs in reducing
6-OHDA-induced cell death. The pathological events associated with 6-OHDA in vivo PD
model mirror some of PD pathology in human such as mitochondrial impairment, increase
in ROS level, increase in inflammatory markers, reduce striatal dopamine level, reduce
TH protein expression and reduce of antioxidant enzymes level (Duty and Jenner, 2011).
These pathological markers are highly reproducible in different species and laboratories
(Duty and Jenner, 2011). Most importantly, this model allows assessment of degenerated
dopaminergic neurons by behavioural observation, quantification of neurotransmitter level
and immunostaining of dopaminergic markers as described in this chapter.
Unilateral injection of 6-OHDA into the striatum was preferred in this study to create a
partial lesioned associated with gradual loss of dopaminergic neurons over a period of
weeks (~50% cell death) (Marinova-Mutafchieva et al., 2009, Moon et al., 2010). Less
severe and progressive cell loss in this model represent a better approximate of the early
stage and slow development of PD in humans. This provide a window of opportunity where
administration of HPOs would be effective to confer neuroprotection. Injection of 6-OHDA
into other sites of the nigro-striatal tract such SNPc or MFB to create partial lesioned is
much difficult to construct due to smaller target area and therefore is easily off-target (Duty
and Jenner, 2011). Additionally, injection into these areas cause extensive loss of
dopaminergic neurons. Indeed, SNPc and MFB targeted lesioned is most often used to
create full lesioned (>70% cell death) which is more appropriate for symptomatic study of
PD (Duty and Jenner, 2011).

CHAPTER 5: IN VIVO NEUROPROTECTIONS OF HPOs
226
Despite all the advantages described above, 6-OHDA PD model unfortunately does not
offer the full spectrum of PD pathology as in man. Lewy body primarily consist of α-
synuclein which serve as pathological hallmark in PD brain is absent (Bezard et al., 2013).
Furthermore, neurodegeneration observed in 6-OHDA model is only restricted to the
nigrostriatal tract and not in other part of the brain which are greatly affected in actual PD
(Simola et al., 2007, Braak et al., 2003). Indeed, post-mortem studies on PD brain revealed
that Lewy body accumulated in stages outside basal ganglia, and thus affected other part
of the brain prior to the basal ganglia (Braak et al., 2003). In this sense, the neuroprotection
seen in 6-OHDA PD model does not capture this stage of disease development and
progression which might be important for early intervention or providing clue to the
mechanism of neurodegeneration. Recent advances in PD model reveals that rats injected
with proteasomes inhibitors exhibited neuronal loss in the locus coeruleus, dorsal motor
nucleus of the vagus and nucleus basalis of Meynert which is associated with protein
inclusion similar to Lewy body pathology (McNaught et al., 2004, Bentea et al., 2016).
However, this model is not properly validated and is difficult to reproduce (Kordower et al.,
2006, Cook and Petrucelli, 2009). Hence, it might take several more years before
construction of this model is refined and validated to be advantageous for a better model
of PD.
The 6-OHDA model is relatively more difficult to construct which requires stereotaxic
surgical skills in contrast to MPTP which can be administered by systemic injections
(Jackson-Lewis and Przedborski, 2007). This is because, 6-OHDA does not cross the BBB
and therefore requires precise intracerebral injection. Implication from this invasive
technique is that the BBB integrity may be compromised due to damage cause by the
inserted needle. PD brain is associated with accumulation of iron in the basal ganglia and
this is replicated in 6-OHDA model. It has been shown that misregulation of iron transport
and BBB breakdown occur as results of oxidative stress and inflammation induced by 6-
OHDA (Carvey et al., 2005). However, a study revealed higher level of iron accumulated
around the needle tract of 6-OHDA injection site in the striatum due to physical damage in
addition to iron misregulation (Virel et al., 2014). Because of this, HPOs iron chelators may
not be as effective in preventing cell death in the striatum compared to other area distance
unaffected by the physical BBB damage such as SNPC. This suggest that inaccurate
results could be obtained in this type of model such as underestimation of neuroprotection.
An alternative model that could be used in this study to overcome this limitation is by using

CHAPTER 5: IN VIVO NEUROPROTECTIONS OF HPOs
227
MPTP-mice model of PD. Like 6-OHDA, MPTP-treated mice also show abnormal iron
accumulation in the basal ganglia due to iron misregulation (You et al., 2015, Mandel et
al., 2004). Indeed, this model has been successfully employed to show the neuroprotective
effect of CP20 (Devos et al., 2014).
The motor behaviour of unilateral partial-lesioned is less robust than unilateral full-lesioned
of 6-OHDA model as described in Chapter 2 and Chapter 5. Due to less reliable behaviour
readout in unilateral partial 6-OHDA-lesioned, a slightly different approach could be taken
in the current study. Bilateral partial 6-OHDA-lesioned offers additional brain samples for
different purpose that might be advantageous in the current study (Roedter et al., 2001).
For example, halves hemisphere could be dedicated for immunostaining and other halves
could be used for biochemical analysis for both striatum and SNPc. This approach would
generate and provide more comprehensive and valuable data from just a single treatment
group. Furthermore, the bilateral degeneration of the nigro-striatal tract is more reflective
of that seen in PD. On the negative side, this model would take more time to construct and
additional sham-lesioned groups for the studied compounds.
Even though intrastriatal 6-OHDA-lesioned provides a reproducible model of nigrostriatal
degeneration, there is still variability in the extent of the lesion depending on the striatal
co-ordinate and amount injected (Duty and Jenner, 2011). Interestingly, even different size
of needle employed (26 vs 30G) to create lesion following an exact protocol also lead to a
significant variation in lesion size (Penttinen et al., 2016). Most recently, Penttinen et al.
(2016) had evaluated and classified the neurodegeneration after 6-OHDA lesioned at
various co-ordinate into progressive, stable and regressive based on behavioural
observation for up to 14 weeks following striatal lesion. This study provides an excellent
guidance for the selection of co-ordinate for striatum that best represent PD progression
in human. In this sense, co-ordinate for striatum that lead to progressive
neurodegeneration shown in this study is of interest.
In conclusion, none of the toxin induced neurodegeneration model able to recapitulate all
features of PD in human. Proteasome-inhibition model appeared to have more complete
features of PD, however this model is hard to reproduce and therefore its validity is
questioned (Cook and Petrucelli, 2009). In the absence of a perfect PD model, the 6-

CHAPTER 5: IN VIVO NEUROPROTECTIONS OF HPOs
228
OHDA-lesioned rat model seem to be adequate for early in vivo assessment of HPOs iron
chelator neuroprotection.
Conclusion
Based on the data obtained, CP20 and CN128 showed a comparable pharmacokinetics
profile after a single i.p. injection. D-amphetamine rotation test failed to show any different
to control group which include the 6-OHDA-lesioned rats. Nevertheless, CP20 and CN128
managed to prevent the dopamine level depletion in rat striatal tissues by approximately
30%. This was further supported by prevention of nigral cell death assessed in SNPc.
Therefore, it can be concluded that CP20 and CN128 were neuroprotective against 6-
OHDA-induced nigrostriatal degeneration as shown by unaltered dopamine and serotonin
turnovers and prevention of dopaminergic cell loss in SNPc. The protection against
dopamine depletion seen after treatment with iron chelators might suggest a potential
disease modifying effect due to the iron chelation. Indeed, focal administration of
deferasirox (DFX), a tridentate iron chelator and deferioxamine (DFO), a hexadentate iron
chelator into a striatum of 6-OHDA lesioned rats abolished the production of hydroxyl
radicals by Fenton reaction as measured by microdialysis (Dexter et al., 2011).
Additionally, CP20 also has been shown to diminish OH radical production in the
presence of iron and H2O2 in vitro (Devanur et al., 2008b). Therefore, the mechanism of
neuroprotection was likely by the iron chelating property of CP20 and CN128.

CHAPTER 6: GENERAL DISCUSSIONS
229
CHAPTER 6
GENERAL DISCUSSION

CHAPTER 6: GENERAL DISCUSSIONS
230
6 General Discussion
Thesis hypothesis and aims
Accumulating lines of evidence have demonstrated the neuroprotective ability of iron
chelators in PD (Kaur et al., 2003, Youdim et al., 2004, Zheng et al., 2005, Ben-Shachar
et al., 1991, Xu et al., 2008, Avramovich-Tirosh et al., 2007, Dexter et al., 2011, Devos et
al., 2014, Martin-Bastida et al., 2017, Wang et al., 2017, Gotsbacher et al., 2017).
Specifically, CP20, an orally active HPO bidentate iron chelator, has undergone early
stage clinical trials showing promising results (Devos et al., 2014, Martin-Bastida et al.,
2017). However, the associated neutropenia and agranulocytosis of CP20 treatment
reported in 15% of the recruited PD patients could limit it usage in a wider population
(Devos et al., 2014). In order to address this problem, several HPO analogues (CN
compounds) have been developed based on the chemical structure of CP20 in order to
retain their iron binding ability (Hider et al., 2011). In addition, a glycosylated HPO together
with the parent HPO were also developed to target the GLUT transporter at BBB (Roy et
al., 2010). Acute studies in mice revealed that the toxicity for these novel HPOs (CN
compounds) were lower than CP20 (Hider et al., 2011). As CP20 has been shown to cross
the BBB and neuroprotective in animals and humans, it was hypothesised that the novel
HPO iron chelators based on the CP20 structure and glycosylated HPO are able to cross
the BBB and show neuroprotection in PD. Consequently, the aims of the studies described
in this thesis were to investigate the brain permeability of novel HPOs in rats and their
neuroprotection ability in in vitro and in vivo model of PD. Data obtained from the current
studies revealed that the novel HPOs can cross the BBB as long as there is a balance
between intermolecular hydrogen bond and lipophilicity as well as recognition by transport
system at BBB. Modification of CP20 structure for brain permeable HPOs did not eliminate
the neuroprotection capability as seen in in vitro and in vivo neuroprotection studies as the
affinity towards iron (pFe3+) is only slightly altered as well as maintaining permeation
across biological membranes and barrier.

CHAPTER 6: GENERAL DISCUSSIONS
231
Summary of the findings
The present study examined the brain permeability of novel HPOs in rats. Additionally, the
effect of the novel HPOs on toxin-induced cell death in SH-SY5Y cell line and rats were
evaluated. The following results were obtained in the individual studies:
Rate of brain penetration for three novel HPOs (CN128, CN226 and CN228) were
comparable to CP20 in rats. CP84 showed higher brain uptake while CN116, CN118
and CN126 showed lower brain uptake than CP20. In contrast, glycosylated HPO
(FCF132) failed to get into the brain.
Novel HPOs showed different degrees of neuroprotection in toxins-induced SH-SY5Y
cell death with the best neuroprotection observed in 6-OHDA-induced cell death while
no protection was observed in MG132-induced cell death.
Chirality in the chemical structures of novel HPOs neither contributed to the
differences in brain uptake in rats nor in in vitro neuroprotection study with SH-SY5Y
cell lines.
Selected HPOs (CP20, CN128 and CN226) did not show any signs of acute toxicity
in rats when injected i.p. at 500 µmol/kg dose, while CP84 was toxic at 200 and 500
µmol/kg doses.
CP20 and CN128 prevented the toxin-induced neuron cell loss in the nigrostriatal
dopamine pathway in 6-OHDA-lesioned rats.
In conclusion, these studies showed that the novel HPOs developed based on the
chemical structure of CP20 were able to cross the blood brain barrier in rats. However,
attachment of glucose moiety to CP84 (FCF132) was counter-productive and prevented
brain uptake. Additionally, novel HPOs conferred neuroprotection in H2O2, 6-OHDA and/or
FeNTA-induced cell death but not in MG132-induced cell death in vitro. CN128 was further
evaluated for neuroprotection in 6-OHDA PD model and replicated the neuroprotection
observed in in vitro study. This confirms that iron plays a role in degenerative process of
dopaminergic neurons and that targeting free labile-iron pool (LIP) in brain using the novel
iron chelators might be neuroprotective against progressive dopaminergic cell loss in PD.

CHAPTER 6: GENERAL DISCUSSIONS
232
Did the modifications of the chemical structure of
CP20 permit BBB permeability and show
neuroprotection?
The primary motivation for alteration of CP20 chemical structure by adding extra functional
group was to make the novel HPOs more resistance to metabolism in the liver especially
from glucuronidation after oral ingestion, hence increase their bioavailability and lower oral
dose could be possible (Hider et al., 2011, Hider et al., 1990, Singh et al., 1992, Singh et
al., 1996). Additionally, the novel HPOs were designed to preserve the oxygen ligands on
the molecule that are important to chelate iron and therefore the affinity towards iron
determined by potentiometric measurements are within the same range as CP20 (Kong
et al., 2006). The bioavailability, toxicity and efficacy of novel HPOs have been evaluated
in rodents and primates in the previous studies (Paiboonsukwong et al., 2016, Hider et al.,
2011, Lu, 2016). Novel HPOs that showed good oral bioavailability as assessed by iron
excretion efficiency in iron overloaded rat were taken forward for evaluation of brain
permeability in this study with the aim to develop as a neuroprotection agent in PD. This
is because, changing the chemical structure also changed the physicochemical properties
such as lipophilicity, molecular size and hydrogen bond formation with surrounding water
which could affect BBB permeability and therefore the extend of iron chelation in the brain
that is important for neuroprotection (Mikitsh and Chacko, 2014).
Brain permeability of novel HPOs
The current study showed that the physicochemical properties play a role in brain
permeability of HPOs that crossed the BBB via membrane diffusion. The total polar
surface area (TPSA) for HPOs which indicate the propensity to form hydrogen bonds
appears to show a better relationship with brain uptake compare to lipophilicity (cLogP,
Chapter 3). Hence, a general increase in lipophilicity of novel HPOs does not necessarily
guarantee a proportional increase in rate of brain permeability when compare to CP20 as
one might expect (Hider et al., 2011, Liu et al., 2011, Habgood et al., 2000, Habgood et
al., 1999). This observation is supported by recent finding that showed brain permeability
for CNS drugs used in clinics are primarily dictate by their intermolecular hydrogen bond
rather than lipophilicity (Frieden et al., 2009, Chen et al., 2011). Nevertheless, it seems
that as the lipophilicity increases, it does helps to counter the effect of increase hydrogen
bonding between novel HPOs and surrounding water so that the rate of brain permeability
CHAPTER 6: GENERAL DISCUSSIONS
233
was not different than CP20. This is obvious among the CN compounds which have higher
but constant TPSA than CP20 in addition to increasing lipophilicity.
In addition, functional group that is recognised by endogenous transport systems may
improve or deter brain uptake as seen for CP84 and FCF132 respectively. It was revealed
that CP84 not only crossed the BBB via membrane diffusion but is also a substrate for
large amino acid transporter (LAT) which enhance the rate of brain uptake. Several CNS
drugs used LAT to cross the BBB which include L-DOPA (antiparkinsonian), melphalan
(anticancer) and gabapentin (anticonvulsant). Indeed, the LAT appear more versatile in
accommodating pseudo-nutrients and drug conjugates when compare to GLUT (Pavan et
al., 2008, Yang et al., 2001). Although targeting LAT as means to deliver HPOs to the
brain in PD sounds promising, it would pose another challenge. This is due to the fact that
L-DOPA, the primary drug for the treatment of PD is also a substrate for LAT (del Amo et
al., 2008, Geier et al., 2013). It is not a good idea to co-administer drugs that target the
same transporters to treat PD as drugs that target LAT1 would require dose adjustment
due to competition between drugs for the transport binding site (Bitner et al., 2015, Jost
and Bruck, 2002). Dose increment of L-DOPA, for example, could lead to unpredictable
levels of the drug in plasma and brain and thus increase the risk of severe adverse effects
such as peripheral cardiovascular and gastrointestinal symptoms, and central motor and
non-motor side effects (eg dyskinesias, insomnia, hallucinations and psychosis) (Foster
and Hoffer, 2004, Barbeau, 1976). In contrast to CP84, FCF132, a glucose conjugated
form of CP84 was specifically designed to target GLUT but failed to cross the BBB.
FCF132 lost membrane diffusion capacity due to decrease in lipophilicity and increase
molecular weight after conjugation with glucose. Additionally, the conjugated glucose did
not in any way facilitated brain uptake of FCF132. It is apparent from this and other studies
targeting the glucose transporter (GLUT) at BBB that is not the best option due to several
reasons. Firstly, glucose recognition site in GLUT1 at BBB is very restrictive and therefore
only allow conjugation of HPOs at C2 and C6 for substrate recognition (Mueckler and
Thorens, 2013, Mueckler and Makepeace, 2009, Carruthers et al., 2009). Several
attempts using various synthetic method to conjugate HPO at C6 of glucose molecule
have failed to yield HPO 6-glycoconjugate (Fuchs, 2015). Secondly, glucose is exclusively
served as the energy source at BBB and brain under normal physiologically condition
which explain the high affinity of GLUT1 at BBB (Km= 1 mM) (Gorovits and Charron, 2003).
Under normal physiological concentration of glucose, GLUT1 is always saturated with

CHAPTER 6: GENERAL DISCUSSIONS
234
glucose which compete with glucose conjugated HPOs which translate into higher
concentration of HPO glycol-conjugate in plasma are required for successful brain
crossing (Giknis and Clifford, 2008, Subramanian et al., 2013).
In vitro neuroprotection of brain permeable HPOs
As various iron chelators including CP20 have been shown to be neuroprotective in in vitro
and in vivo model of PD (Dexter et al., 2011, Forni et al., 2008, Zorzi et al., 2011, Youdim
et al., 1999, Shachar et al., 2004, Gal et al., 2005, Zheng et al., 2005, Zhu et al., 2007,
Yassin et al., 2000, Kaur et al., 2003, Reznichenko et al., 2010, Leaver et al., 2009, Xu et
al., 2008, Xu et al., 2011), these brain penetrant novel HPOs were evaluated for their
neuroprotective potential. It was clear from the in vitro neuroprotection study with SH-
SY5Y cell lines that brain permeable HPOs are neuroprotective towards all the toxins
employed except for MG132 which indirectly suggest the involvement of iron in cell death
(Chapter 4). As explained in Chapter 1, iron participates in the Fenton reaction producing
highly reactive hydroxyl radical (OH-). However, it can be speculated that extensive
accumulation of intracellular proteins with multiple signalling routes causes cell death
which cannot be prevented by iron chelators alone. This is supported by accumulation of
pro-apoptotic signalling protein p53 in dopaminergic cells exposed to MG132 due to
decrease degradation by proteasomes system (Lopes et al., 1997, Nair et al., 2006,
Dietrich et al., 2003). Genetics silencing of p53 or inhibition of p53 activity however
protected against MG132-induced cell death (Lopes et al., 1997, Nair et al., 2006).
Besides, it can generally be observed in the current study that the efficacy of novel HPOs
positively correlate with lipophilicity and less with iron affinity constant (pFe3+) which might
suggest better ability to penetrate SH-SY5Y cell membrane for chelating more iron
(Workman et al., 2015).
Pharmacokinetics of brain permeable HPOs
Selected novel HPOs (CP84, CN128 and CN226) were administered intraperitoneally (i.p.)
in rats to confirm the brain distribution seen in in situ brain perfusion experiment and to
see the pharmacokinetics profile of novel HPOs. Although, novel HPOs were intended for
oral consumption, oral administration of crude drugs would require large doses to attain
therapeutic concentration in plasma especially for drugs such as CP20 that have very high
first-pass effect in the liver (Singh et al., 1992, Bellanti et al., 2014). The requirement for

CHAPTER 6: GENERAL DISCUSSIONS
235
oral large doses for compound that still unknown to show neuroprotection in animal model
of PD is not feasible in term of time and resources for chemical synthesis. Nevertheless,
the aim of the current study is to confirm the neuroprotection ability in animal model of PD
and not the oral bioavailability which justify the method of HPOs administration by
intraperitoneal route. In this study CP84 was neurotoxic through the unknown
mechanism(s) in rats as shown by sudden aggressive behaviour and seizure after
intraperitoneal injection. However, this was not the case for other novel HPOs. It might be
that the massive uptake of CP84 as showed in in situ brain perfusion study caused rapid
depletion of free iron in the brain and interfere with the activity of essential enzymes.
Aldehyde oxidase, an enzyme responsible for serotonin degradation requires iron
(Mackler et al., 1979, Mackler et al., 1978) and depletion of iron would increase serotonin
level in the brain which has been shown to be associated with seizure (Bidabadi and
Mashouf, 2009, Idro et al., 2010, Baf et al., 1994). Interestingly, despite structural
alteration, total brain concentration for novel HPOs in rats were not different than CP20.
This observation could be due to the high volume of distribution (Vd) which is common for
lipophilic HPOs (Bijsterbosch et al., 1981, Quanquan et al., 2010, Fredenburg et al., 1993,
Thuma et al., 1998). Furthermore, CN226 was shown to be a substrate for Pgp efflux
pump at BBB which might limit brain distribution despite being more lipophilic than CP20
(Chapter 3).
In vivo neuroprotection of brain permeable HPO
Although three novel HPOs were initially selected, only CN128 was further tested for
neuroprotection in 6-OHDA rat model of PD. CP84 was discarded due to toxicity while
CN226 PK profile was not different to CP20 in addition to be a substrate for Pgp efflux
pump (Chapters 3 & 5). In this study, CN128 along with CP20 were shown to be
neuroprotective by preventing the depletion of dopamine level in striatum and nigral cell
loss in SNPc in 6-OHDA rat model of PD. This finding corroborates the study performed
by Dexter et. al. (2010) in which three clinically available iron chelators (deferoxamine,
deferasirox and CP20) exhibited neuroprotection in 6-OHDA rat with CP20 being the most
potent. The most recent finding also showed remarkable neuroprotection of CP20 in
MPTP-mice model (Devos et al., 2014). Indeed, Phase I and II randomised double blinded
placebos controlled clinical trial for 6 months to assessed CP20 neuroprotection in early
stage PD patients (mean age 65 years old) showed promising results which suggest the
applicability of PD models as a tool for selecting promising neuroprotective agents (Martin-

CHAPTER 6: GENERAL DISCUSSIONS
236
Bastida et al., 2017, Devos et al., 2014a). One major limitation of the current study is that
no measurement of labile iron pool (LIP; Chapter 1) were performed in in vitro and in vivo
neuroprotection studies, thus the mechanism by which the HPOs elicited their
neuroprotective effect is not conclusive (Jiang et al., 2010).
One problem associated with CP20 therapy is the extensive glucuronidation in the liver
which in turn require large oral dose to attain therapeutic concentration in plasma (Singh
et al., 1992, Bellanti et al., 2014). CP20 is also associated with blood toxicity with
agranulocytosis is the prominent one (Elalfy et al., 2012, Tricta et al., 2016). In the
aforementioned clinical trials, although the dose given to the PD patients were 3-fold lower
than Thalassemia patients, 15% of the recruited PD subjects were dis-continued from the
treatment due to agranulocytosis and neutropenia. Furthermore, the incident of
agranulocytosis and neutropenia increases with age (Andres et al., 2002, Mohan et al.,
2015, Rajagopal, 2005). Therefore, while CP20 could delayed progression of PD, the
associated toxicities would limit its used in PD patients which the majority age of onset is
over 60 years old (Mourot-Cottet et al., 2016). Interestingly, equimolar dose of CN128
when administered to iron-loaded rodents and primates showed 3-fold better iron excretion
suggesting improved oral bioavailability (Hider et al., 2011a, Lu, 2016, Paiboonsukwong
et al., 2016). Analysis of glucuronide metabolite for CN128 in rat urine revealed 21-fold
less glucuronide compare to CP20 (Paiboonsukwong et al., 2016, Singh et al., 1992).
Remarkably, CN128 also exhibited better toxicity profile than CP20 in preventing reduction
of leukocytes counts in rats and monkeys (Paiboonsukwong et al., 2016). Higher oral
bioavailability and lower rate of glucuronidation in the liver than CP20 in experimental
animals provide additional advantage for the development of CN128 as an efficient and
less toxic orally active iron chelator for neuroprotection in PD (Paiboonsukwong et al.,
2016). However, the data reported in this thesis could not support the improved
bioavailability of CN128 compare to CP20 due the route of administration was
intraperitoneal and not oral. Nevertheless, current study confirmed equivalent brain
permeability and neuroprotective ability of CN128 to CP20 despite structural modification.
Conclusion
Taking all things together, structural modification of CP20 still allow brain uptake of novel
HPOs except for glucose conjugated HPOs which was not optimally designed for substrate
recognition at GLUT. It appears that additional polar group in novel HPOs limit brain

CHAPTER 6: GENERAL DISCUSSIONS
237
permeability but increasing lipophilicity help to overcome the problem. Novel HPOs
showed neuroprotection in in vitro PD models with some showing better protection than
CP20. Of these, CP128 was chosen for assessment of in vivo neuroprotection in a rat
model of PD. Interestingly the neuroprotection shown by CP128 was similar to that of
CP20 despite higher lipophilicity and reported improve bioavailability possibly due to high
volume of distribution and route of HPOs administration (i.p.) employed in the current
study. However, with the lower potential for neutropenia, these studies suggest that this
compound may be a candidate for future clinical trials for disease modification on man.
PD models to evaluate neuroprotection
Searching for effective neuroprotection agents in human has proceeded up to this time
with little success. MAO-B specific inhibitor selegiline, for example, was previously
thought to be the first successful neuroprotective agent in clinic. However, studies in
human reveal that the effect of MAO-B inhibitor was primarily symptomatic rather than
neuroprotective (LeWitt, 1994, Stocchi and Olanow, 2003, Athauda and Foltynie, 2015).
Many factors have been suggested to contribute to this failure such as animal models that
do not reflect widespread pathology of PD and poor experimental design in preclinical and
clinical research. Consequently, there is a dire need for better animal models that cover
overall pathology and symptoms in human PD as well as providing prediction of effective
neuroprotective agents for successful translation in clinical trial (Duty and Jenner, 2011).
Currently available animal models only impart part of the overall pathology of PD with each
model hold certain degree of relevance to answer the research question (Bezard et al.,
2013). Most importantly, Lewy body inclusion which serve as the pathological hallmark in
autopsied PD brain is absent in all animal models. The finding that Lewy body mainly
compose of aggregated α-synuclein leads to creation of transgenic mice that expressed
mutant α-synuclein or overexpress wild-type α-synuclein with the propensity to aggregate
(Fernagut and Chesselet, 2004, Kurz et al., 2012). Unfortunately, these mice showed mix
results in term of relationship between α-synuclein and neuronal death which makes them
unreliable and not robust as a model for neuroprotection study.
Validity of the PD models to study neuroprotective ability of HPOs
It was suggested that dopaminergic neurons are susceptible to oxidative stress due to
metabolism of dopamine by monoamine oxidase (MAO) that produces hydrogen peroxide

CHAPTER 6: GENERAL DISCUSSIONS
238
(Nicolaus, 2005, Zucca et al., 2017, Gerlach et al., 2003). This condition exacerbates when
the capacity of iron storage protein become limited due to accumulation of iron in aging
brain. Iron has a central role in generating the highly destructive hydroxyl radical (OH-)
which damage biomolecules and initiate neurodegeneration processes as seen in PD
(Berg et al., 2001, Medeiros et al., 2016). Furthermore, dopamine could also react with
iron to produce dopamine-o-quinones that is also redox active and able to promote α-
synuclein aggregation (Bisaglia et al., 2010, Lee et al., 2011). Although the level of iron
in the SH-SY5Y cells and rat brain after exposure to toxins was not determined in this
study, previous reports revealed that exposure to H2O2, 6-OHDA, MG132 or MPTP
increase iron level inside the cells in in vitro and/or in vivo models of PD by modulating
expression of protein that regulates iron such as transferrin, transferrin receptor, divalent
metal transporter 1 (DMT1), ferroportin and/or ferritin (Dev et al., 2015, Andriopoulos et
al., 2007, Wang et al., 2009, Kobayashi et al., 2008, Howitt et al., 2009, Li et al., 2012). In
regard to 6-OHDA rat model of PD that was employed in this study, this model is relevant
to study the neuroprotective effect of iron chelator such as HPOs since multiple studies
have shown iron accumulation in striatum and SNPc in this model which suggest
dysregulation of iron (He et al., 1996, Kondoh et al., 2005, Virel et al., 2014). Furthermore,
autopsy and radiological studies have reported accumulation of iron in the basal ganglia
of PD patients which confirmed the translational characteristic of this model into human
(Dexter et al. 1994; Berg 2006; Wypijewska et al. 2010). It has been shown that
dysregulation of iron transport and BBB breakdown occur as results of oxidative stress
and inflammation induced by 6-OHDA (Carvey et al., 2005). Although 6-OHDA rat model
exhibited iron accumulation, but the effect of iron accumulation is only secondary to the 6-
OHDA administration. Since, CP20 and/or CN128 treatments in 6-OHDA model and
human suggested neuroprotection, a more relevant and applicable PD model for testing
HPOs iron chelator would be iron rat model of PD (Devos et al., 2014, Dexter et al., 2011).
This iron rat model of PD can be used to evaluate the direct effect of iron chelation as well
as dose-response relationship (Junxia et al., 2003).
Suggestion for improvements in neuroprotection studies
Bezard et al., (2013) criticised the widely used experimental design for neuroprotection
study in animal model of PD. Most often, the putative neuroprotective agent is
administered before or during brain lesion. According to the authors, the experimental
design fails to represent the actual situation whereby the agent is likely to be administered

CHAPTER 6: GENERAL DISCUSSIONS
239
in PD patients only when about 50% of neurons had already loss. Proposal for ideal
experimental design in pre-clinical research was further suggested. This includes the use
of progressive animal model of PD instead of acute model, administration of putative
neuroprotective agents after creation of lesion and finally the use of non-human primates
to verify the neuroprotection of promising neuroprotection agents (Bezard et al., 2013).
The second proposal is only possible when progressive animal models are made available
to test neuroprotective agents. For example, 6-OHDA administered intrastriatally as
discussed in this thesis cause rapid cell death and treatment with HPOs after creation of
lesion would evaluate neurorestorative potential rather than neuroprotection. This justify
the approach taken in the current study whereby HPOs were administered i.p. two days
and within 1h before 6-OHDA lesion so that HPOs reaching the striatum can protect from
acute cell death. In addition to these, a better tools and biological markers for early
definitive diagnosis of PD in clinic is as equally important as better animal models. PD
diagnosis is usually made when the disease has reached a stage where more than 70%
of dopaminergic neurons in SNPc had diminished (Lohle and Reichmann, 2010, Schapira,
2009). This stage of PD may be considered too late to observe an effective
neuroprotection if there is any. This could be one of the reasons that until now, none of
the promising neuroprotective agent tested pre-clinically succeeded in clinical trials, in
addition to not having better animal models.
Future outlook
It can be seen from this study that by modifying HPOs chemical structure could lead to no
change, enhance or diminish brain uptake independent on the physicochemical properties
of the compound, recognition by efflux pump as well as being a substrate for carrier-
mediated transporters. Chemical modification of drug requires knowledge in synthetic
chemistry and the synthetic route is tailored base on the chemical structures. Chemical
modification also needs to take into account the size of the molecule so that the molecular
weight not exceeding 400D for good BBB membrane permeability (Hitchcock and
Pennington, 2006, Lipinski et al., 2001). Additionally, steric hindrance introduce by the
ancillary functional group may prevent substrate recognition when carrier-mediated
transporter is targeted (Li et al., 2015). To rationalise the molecular design of novel HPOs
to target the BBB, computational modelling should be incorporated during drug
development process. This computational approach predicts how molecular changes

CHAPTER 6: GENERAL DISCUSSIONS
240
affect the free-energy of solvation in which case low free-energy indicates better BBB
crossing (Goncalves and Stassen, 2003, Jia et al., 2002). Similarly, computational method
can be used to evaluate the likelihood of ligand-transporter interaction for successful drug
uptake into the brain (Matsson and Bergström, 2015, Schlessinger et al., 2013).
In respect to method of drug delivery to the brain, brain permeable nanoparticle vesicles
such as liposomes, polymersomes and exosomes are recently received much attention
(Saraiva et al., 2016). This method avoids the chemical modification of HPOs that has
been pharmacologically optimised since the HPOs are incorporated into the brain
permeable nanoparticles. Additionally, the nanoparticle can be designed to increase brain
uptake by attaching with ligand or antibody for receptor-mediated endocytosis (Chapter
1). One ligand of interest which is relevant for iron chelation is transferrin. This transferrin
coated nanoparticles with incorporated HPOs could be recognised by transferrin receptors
(TfR) that abundantly expressed at BBB (Liu et al., 2006, Ayton et al., 2016). Additionally,
the trancytosed transferrin could also chelate and help with iron distribution in addition to
incorporated HPOs. One major drawback of this approach is that nanoparticles are not
orally stable and hence limits their application if oral route is the method of choice for
convenience and compliance among aging PD patients (Pridgen et al., 2015).
It is unclear whether iron chelation only is sufficient to prevent neurodegeneration in PD.
It would be likely sufficient if the neurodegeneration is primarily cause by abnormal iron
accumulation and not a secondary phenomenon. Since the current clinical diagnosis
cannot determine which factors is the main contributors in neurodegeneration of PD, wide
spectrum neuroprotection agents with limited side effects is coveted. It would be
interesting if drugs could target more than one mechanism apart from iron chelation for
disease improvement in PD. Premyslova et al. (2016) has recently reported that a brain-
penetrant fluorinated derivative of CP20 modulated multiple genes expression that led to
downregulation of inflammation and ROS production and increased cellular antioxidant
defence capacity in SH-SY5Y cells. Other researchers have taken an approach by
combining an iron chelator with MAO-B inhibitor pharmacophores in a single molecule with
promising results (Bar-Am et al., 2015, Gal et al., 2006, Youdim et al., 2005). One potential
molecule exenatide, a synthetic glucagon-like-peptide-1 (GLP-1) was shown to affect a
wide range of pathological processes in PD which has led some to speculate that this
class of agent has the greatest potential to be a successful neuroprotection agent in

CHAPTER 6: GENERAL DISCUSSIONS
241
human (Athauda and Foltynie, 2015, Bertilsson et al., 2008, Aviles-Olmos et al., 2013).
However, although this may sound promising, compound that act on multiple target may
exert multiple side effects when introduce into the systemic circulation. Therefore, another
area of research that focus on targeted drug delivery to the brain especially to the site
where neuroprotection is needed (basal ganglia) is likewise important.
Suggested further studies
With respect to the current study, CN128 merits further investigation in order to confirm it
neuroprotective effect. The suggested further studies are:
Evaluate the neuroprotection of CN128 after oral administration and compare
with CP20.
Administration of CN128 in the current study to 6-OHDA rat model of PD was performed
through intraperitoneal (i.p.) injection. This route of administration require much less dose
than oral route with the aim to confirm the neuroprotection capability of CN128 in
comparison with CP20. Data from the current study showed that CN128 was
neuroprotective as CP20 after i.p. injection. However, CN128 was designed to resist
glucuronidation in the liver better than CP20 after oral consumption (Hider et al., 2011).
Supporting data from previous studies showed that CN128 has profound bioavailability
than CP20 after oral administration in rodents and primates (Hider et al., 2011,
Paiboonsukwong et al., 2016). This would suggest that CN128 which has been confirmed
to exhibit neuroprotective capability in this study may show better neuroprotection when
administered orally at equimolar dose of CP20 in animal models of PD.
Evaluate different doses of CN128 to see if the neuroprotection is dose
dependent and to evaluate the limit of toxicity in PD models.
Current study only tests a single dose of CN128 which and therefore the dose-response
relationship could not be elucidated. Dose of CN128 at 70 µmol/kg (i.p.) in the current
study protected against 6-OHDA induced cell death by 32%. However, it is not known
whether this was the maximum neuroprotection possible and whether the neuroprotection
was dose-dependent. Additionally, the suggested future study will provide toxicity profiles
at different doses by evaluating effect of CN128 on total body iron content and the extend

CHAPTER 6: GENERAL DISCUSSIONS
242
of inhibition on iron containing biomolecules in comparison to CP20. Supporting data
revealed that CN128 is less toxic at equimolar dose in rodents and primates despite much
CN128 reaches the blood stream after oral administration, however, the cause of reduce
toxicity remains unknown (Paiboonsukwong et al., 2016, Hider et al., 2011).
Evaluate the neuroprotection of CN128 in PD models induced by different
toxins.
Different toxins have unique mechanisms to induce Parkinson’s disease that are
associated with iron toxicity. This provide proof, justification and confirmation of the use of
iron chelators as neuroprotection agent.
i) MPTP
MPTP crosses the BBB and is metabolise by monoamine oxidase B (MAOB) in astrocytes
to MPP+ (Sai et al., 2013). MPP+ mechanism of toxicity is primarily through inhibition of
Complex I of mitochondrial transport chain in dopaminergic neurons which lead to increase
concentration of reactive oxygen species (ROS; Marella et al., 2009, Choi et al., 2011).
cDNA microarray study in mice model of MPTP also revealed upregulation of cytotoxic
cytokines which include IL-1β, IL-6, IL-7 and IL-10 (Mandel et al., 2000, Youdim et al.,
2002). These pro-inflammatory mediators have recently been shown to cause iron
accumulation in neurons (explain further below in (ii); You et al., 2017). Combination of
increase ROS and iron accumulation induce oxidative stress in this model.
ii) Lipopolysaccharide (LPS)
LPS induces neuroinflammation and activates microglia to release the pro-inflammatory
mediator IL-6 (You et al., 2017, Urrutia et al., 2013). Released IL-6 in turn causes an
increase in expression of iron-regulator protein (hepcidin) that inhibit iron transporter
(ferroportin) on neuron membranes. This cause accumulation of iron in neuron that involve
in oxidative stress and eventually cell death.
Clearly both these models could be used to evaluate the in vivo neuroprotective effect of
iron chelators. To increase the predictability of preclinical in vivo assessment, the effect
of the iron chelator should be evaluated in a number of models using toxins that induce
cell death by different mechanisms of action.

CHAPTER 6: GENERAL DISCUSSIONS
243
Evaluate the effect of CN128 treatment on other neurovascular units such as
astrocytes and microglia.
The study reported in this thesis only look at the effect of CN128 on dopaminergic neurons.
However, surrounding cells such as astrocytes and microglia are also involved in the
pathogenesis of dopaminergic cell death in animal models of PD (Sai et al., 2013, You et
al., 2017). Comprehensive understanding on the overall effect of CN128 on these
important neurons associated cells will provide in-depth mechanisms on CN128
neuroprotection.
Evaluate the effect of CN128 on the brain level of iron and on the expression of
iron regulatory proteins.
Previous studies suggested that iron is accumulated in PD brain especially in basal ganglia
and contributes to oxidative stress (Hartmann, 2004, Wang et al., 2016). The accumulated
iron is likely to be caused by metabolism of dopaminergic neurons and dysregulation of
iron transport and storage (Zucca et al., 2017). Indeed, 6-OHDA, LPS and MPTP animal
model of PD exhibit accumulation of iron in the basal ganglia which is translated to what
occurrs in man (Dev et al., 2015, Andriopoulos et al., 2007, Wang et al., 2009, Kobayashi
et al., 2008, Howitt et al., 2009, Li et al., 2012). Current study did not evaluate the effect
of CN128 on the level of iron and expression of iron regulatory proteins in the basal ganglia
to support the mechanism of neuroprotection observed in PD model, and so this should
be addressed in a future study.
Assess the inhibitory property of CN128 onto iron containing enzymes
especially in the basal ganglia such as tyrosine hydroxylase (TH) and catechol-
O-methyl transferase (COMT).
Many of the enzymes in basal ganglia require iron as a co-factor for reaction. In particular,
TH is responsible for the hydroxylation of tyrosine to L-DOPA, the precursor for dopamine
in dopaminergic neurons (Rausch et al., 1988). Iron is also a co-factor for COMT, the
enzyme responsible for dopamine degradation in synaptic cleft (Waldmeier et al., 1993,
Bastos et al., 2014). It is important to determine the extent of the inhibition of these
enzymes by the iron chelator to give insight into the potential inhibitory effect on dopamine

CHAPTER 6: GENERAL DISCUSSIONS
244
formation or dopamine metabolism as this could distinguish between neuroprotection and
symptomatic improvement in PD models.
Final conclusion
As hypothesised, data from the current study revealed that novel HPO iron chelators
based on the CP20 structure can crossed the BBB, except for glucose conjugated HPO
which suggest limitation of targeting GLUT at BBB. The brain permeable HPOs also
exhibited neuroprotection in SH-SY5Y cell lines and this was confirmed in vivo using
CN128 as the best representative of the novel HPOs. It is too early to confirm that HPOs
iron chelator such as CP20 and CN128 are neuroprotective in human until clinical trials
with PD subjects that may take years are completed (Ravina et al., 2003, van der Brug et
al., 2015). It is important to highlight again that PD is a multifactorial disease, and until
today the exact cause that initiate neurodegeneration in PD brain is unknown (Sheikh et
al., 2013, Schlossmacher et al., 2017). Nevertheless, abnormal iron accumulation has
been repeatedly observed in the post-mortem brain of PD patients which suggest that iron
accumulation could be one of the culprits either primary or secondary to the
neurodegeneration and treatment with iron chelators are therefore potentially
neuroprotective (Hartmann, 2004, Wang et al., 2016).

REFERENCES
245
REFERENCES

REFERENCES
246
ABBOTT, N. J. 2004. Prediction of blood-brain barrier permeation in drug discovery from in vivo, in vitro and in silico models. Drug Discov Today Technol, 1, 407-16.
ABBOTT, N. J. 2005. Dynamics of CNS barriers: evolution, differentiation, and modulation. Cell Mol Neurobiol, 25, 5-23.
ABBOTT, N. J., PANTABENDIGE, A. A. K., DOLMAN, D. E. M., YUSOF, S. R. & BEGLEY, D. J. 2010. Structure and function of the blood-brain barrier. Neurobiology of Disease, 37, 13-25.
ABBRUZZESE, G., COSSU, G., BALOCCO, M., MARCHESE, R., MURGIA, D., MELIS, M., GALANELLO, R., BARELLA, S., MATTA, G., RUFFINENGO, U., BONUCCELLI, U. & FORNI, G. L. 2011. A pilot trial of deferiprone for neurodegeneration with brain iron accumulation. Haematologica, 96, 1708-11.
ABRAMOVA, N. A., CASSARINO, D. S., KHAN, S. M., PAINTER, T. W. & BENNETT, J. P. 2002. Inhibition by R(+) or S(–) pramipexole of caspase activation and cell death induced by methylpyridinium ion or beta amyloid peptide in SH-SY5Y neuroblastoma. Journal of Neuroscience Research, 67, 494-500.
ALEXANDER, G. E. 2004. Biology of Parkinson's disease: pathogenesis and pathophysiology of a multisystem neurodegenerative disorder. Dialogues in Clinical Neuroscience, 6, 259-280.
ALGREN, D. A. 2010. Review of Oral Iron Chelators (Deferiprone and Deferasirox) for the Treatment of Iron Overload in Pediatric Patients.
AL-REFAIE, F. N., SHEPPARD, L. N., NORTEY, P., WONKE, B. & HOFFBRAND, A. V. 1995. Pharmacokinetics of the oral iron chelator deferiprone (L1) in patients with iron overload. British Journal of Haematology, 89, 403-408.
ALSHAMMARI, T. M., AL-HASSAN, A. A., HADDA, T. B. & ALJOFAN, M. 2015. Comparison of different serum sample extraction methods and their suitability for mass spectrometry analysis. Saudi Pharm J, 23, 689-97.
AMIN, M. L. 2013. P-glycoprotein Inhibition for Optimal Drug Delivery. Drug Target Insights, 7, 27-34.
ANDERSON, B. D. 1996. Prodrugs for improved CNS delivery. Advanced Drug Delivery Reviews, 19, 171-202.
ANDRES, E., KURTZ, J. E., MARTIN-HUNYADI, C., KALTENBACH, G., ALT, M., WEBER, J. C., SIBILIA, J., SCHLIENGER, J. L., DUFOUR, P. & MALOISEL, F. 2002. Nonchemotherapy drug-induced agranulocytosis in elderly patients: the effects of granulocyte colony-stimulating factor. Am J Med, 112, 460-4.
ANDRES-MATEOS, E., PERIER, C., ZHANG, L., BLANCHARD-FILLION, B., GRECO, T. M., THOMAS, B., KO, H. S., SASAKI, M., ISCHIROPOULOS, H., PRZEDBORSKI, S., DAWSON, T. M. & DAWSON, V. L. 2007. DJ-1 gene deletion reveals that DJ-1 is an atypical peroxiredoxin-like peroxidase. Proc Natl Acad Sci U S A, 104, 14807-12.
ANDREW, R., WATSON, D. G., BEST, S. A., MIDGLEY, J. M., WENLONG, H. & PETTY, R. K. H. 1993. The determination of hydroxydopamines and other trace amines in the urine of Parkinsonian patients and normal controls. Neurochemical Research, 18, 1175-1177.
ANDRIOPOULOS, B., HEGEDUSCH, S., MANGIN, J., RIEDEL, H. D., HEBLING, U., WANG, J., PANTOPOULOS, K. & MUELLER, S. 2007. Sustained hydrogen peroxide induces iron uptake by transferrin receptor-1 independent of the iron regulatory protein/iron-responsive element network. J Biol Chem, 282, 20301-8.
ANGLADE, P., VYAS, S., JAVOY-AGID, F., HERRERO, M. T., MICHEL, P. P., MARQUEZ, J., MOUATT-PRIGENT, A., RUBERG, M., HIRSCH, E. C. & AGID, Y. 1997. Apoptosis and autophagy in nigral neurons of patients with Parkinson's disease. Histol Histopathol, 12, 25-31.

REFERENCES
247
ANTONY, P. M., DIEDERICH, N. J., KRUGER, R. & BALLING, R. 2013. The hallmarks of Parkinson's disease. Febs j, 280, 5981-93.
APOPHARMA INC. 2011. Ferriprox (R) [package insert] [Online]. Weston, FL: ApoPharma Inc. Available: http://www.accessdata.fda.gov/drugsatfda_docs/label/2011/021825lbl.pdf 2017].
ARIMOTO, T. & BING, G. 2003. Up-regulation of inducible nitric oxide synthase in the substantia nigra by lipopolysaccharide causes microglial activation and neurodegeneration. Neurobiol Dis, 12, 35-45.
ARMBRUSTER, D. A. & PRY, T. 2008. Limit of blank, limit of detection and limit of quantitation. Clin Biochem Rev, 29 Suppl 1, S49-52.
ATHAUDA, D. & FOLTYNIE, T. 2015. The ongoing pursuit of neuroprotective therapies in Parkinson disease. Nat Rev Neurol, 11, 25-40.
AVDEEF, A. & SUN, N. 2011. A new in situ brain perfusion flow correction method for lipophilic drugs based on the pH-dependent Crone-Renkin equation. Pharm Res, 28, 517-30.
AVDEEF, A. 2001. Physicochemical profiling (solubility, permeability and charge state). Curr Top Med Chem, 1, 277-351.
AVDEEF, A. 2011. How well can in vitro brain microcapillary endothelial cell models predict rodent in vivo blood-brain barrier permeability? European Journal of Pharmaceutical Sciences, 43, 109-124.
AVILES-OLMOS, I., DICKSON, J., KEFALOPOULOU, Z., DJAMSHIDIAN, A., ELL, P., SODERLUND, T., WHITTON, P., WYSE, R., ISAACS, T., LEES, A., LIMOUSIN, P. & FOLTYNIE, T. 2013. Exenatide and the treatment of patients with Parkinson’s disease. The Journal of Clinical Investigation, 123, 2730-2736.
AYTON, S., LEI, P., MCLEAN, C., BUSH, A. I. & FINKELSTEIN, D. I. 2016. Transferrin protects against Parkinsonian neurotoxicity and is deficient in Parkinson’s substantia nigra. Signal Transduction And Targeted Therapy, 1, 16015.
BACHER, A. 2005. Effects of body temperature on blood gases. Intensive Care Med, 31, 24-7.
BADHAN, R. K., CHENEL, M. & PENNY, J. I. 2014. Development of a physiologically-based pharmacokinetic model of the rat central nervous system. Pharmaceutics, 6, 97-136.
BADRIA, F. A., IBRAHIM, A. S., BADRIA, A. F. & ELMARAKBY, A. A. 2015. Curcumin Attenuates Iron Accumulation and Oxidative Stress in the Liver and Spleen of Chronic Iron-Overloaded Rats. PLOS ONE, 10, e0134156.
BAF, M. H., SUBHASH, M. N., LAKSHMANA, K. M. & RAO, B. S. 1994. Alterations in monoamine levels in discrete regions of rat brain after chronic administration of carbamazepine. Neurochem Res, 19, 1139-43.
BANKS, W. A. 2009. Characteristics of compounds that cross the blood-brain barrier. BMC Neurology, 9(Suppl 1), 1-5.
BANKS, W. A. 2016. From blood-brain barrier to blood-brain interface: new opportunities for CNS drug delivery. Nat Rev Drug Discov, 15, 275-292.
BAR-AM, O., AMIT, T., KUPERSHMIDT, L., ALUF, Y., MECHLOVICH, D., KABHA, H., DANOVITCH, L., ZURAWSKI, V. R., YOUDIM, M. B. & WEINREB, O. 2015. Neuroprotective and neurorestorative activities of a novel iron chelator-brain selective monoamine oxidase-A/monoamine oxidase-B inhibitor in animal models of Parkinson's disease and aging. Neurobiol Aging, 36, 1529-42.

REFERENCES
248
BAR-AM, O., WEINREB, O., AMIT, T. & YOUDIM, M. B. 2005. Regulation of Bcl-2 family proteins, neurotrophic factors, and APP processing in the neurorescue activity of propargylamine. Faseb j, 19, 1899-901.
BARBEAU, A. 1976. Neurological and psychiatric side-effects of L-DOPA. Pharmacology & Therapeutics. Part C: Clinical Pharmacology and Therapeutics, 1, 475-494.
BARNEOUD, P., DESCOMBRIS, E., AUBIN, N. & ABROUS, D. N. 2000. Evaluation of simple and complex sensorimotor behaviours in rats with a partial lesion of the dopaminergic nigrostriatal system. Eur J Neurosci, 12, 322-36.
BARNETT, J. E., HOLMAN, G. D., CHALKLEY, R. A. & MUNDAY, K. A. 1975. Evidence for two asymmetric conformational states in the human erythrocyte sugar-transport system. Biochem J, 145, 417-29.
BARTELS, A. L. 2011. Blood-brain barrier P-glycoprotein function in neurodegenerative disease. Curr Pharm Des, 17, 2771-7.
BASAVARAJ, S. & BETAGERI, G. V. 2014. Can formulation and drug delivery reduce attrition during drug discovery and development—review of feasibility, benefits and challenges. Acta Pharmaceutica Sinica B, 4, 3-17.
BASTOS, P., ARAUJO, J. R., AZEVEDO, I., MARTINS, M. J. & RIBEIRO, L. 2014. Effect of a natural mineral-rich water on catechol-O-methyltransferase function. Magnes Res, 27, 131-41.
BAUER, H. C., KRIZBAI, I. A., BAUER, H. & TRAWEGER, A. 2014. "You Shall Not Pass"-tight junctions of the blood brain barrier. Front Neurosci, 8, 392.
BEAL, M. F. 2003. Mitochondria, oxidative damage, and inflammation in Parkinson's disease. Ann N Y Acad Sci, 991, 120-31.
BEGLEY, D. J. 2004. Delivery of therapeutic agents to the central nervous system: the problems and the possibilities. Pharmacol Ther, 104, 29-45.
BÉLANGER, M., ALLAMAN, I. & MAGISTRETTI, PIERRE J. 2011. Brain Energy Metabolism: Focus on Astrocyte-Neuron Metabolic Cooperation. Cell Metabolism, 14, 724-738.
BELLANTI, F., DANHOF, M. & DELLA PASQUA, O. 2014. Population pharmacokinetics of deferiprone in healthy subjects. British Journal of Clinical Pharmacology, 78, 1397-1406.
BENOIT-BIANCAMANO, M. O., CONNELLY, J., VILLENEUVE, L., CARON, P. & GUILLEMETTE, C. 2009. Deferiprone glucuronidation by human tissues and recombinant UDP glucuronosyltransferase 1A6: an in vitro investigation of genetic and splice variants. Drug Metab Dispos, 37, 322-9.
BENTEA, E., VERBRUGGEN, L. & MASSIE, A. 2016. The Proteasome Inhibition Model of Parkinson’s Disease. Journal of Parkinson's Disease, 7, 31-63.
BERNHARDT, P. V. 2007. Coordination chemistry and biology of chelators for the treatment of iron overload disorders. Dalton Transactions, 3214-3220.
BERTILSSON, G., PATRONE, C., ZACHRISSON, O., ANDERSSON, A., DANNAEUS, K., HEIDRICH, J., KORTESMAA, J., MERCER, A., NIELSEN, E., RONNHOLM, H. & WIKSTROM, L. 2008. Peptide hormone exendin-4 stimulates subventricular zone neurogenesis in the adult rodent brain and induces recovery in an animal model of Parkinson's disease. J Neurosci Res, 86, 326-38.
BETARBET, R., SHERER, T. B., MACKENZIE, G., GARCIA-OSUNA, M., PANOV, A. V. & GREENAMYRE, J. T. 2000. Chronic systemic pesticide exposure reproduces features of Parkinson's disease. Nat Neurosci, 3, 1301-6.

REFERENCES
249
BEZARD, E., YUE, Z., KIRIK, D. & SPILLANTINI, M. G. 2013. Animal Models of Parkinson’s Disease: limits and relevance to neuroprotection studies. Movement disorders : official journal of the Movement Disorder Society, 28, 61-70.
BICKEL, U. 1998. Intravenous Injection/Pharmacokinetics. In: PARDRIDGE, W. M. (ed.) Introduction to the Blood Brain Barrier, . Cambridge: University Press, Cambridge.
BICKEL, U. 2005. How to measure drug transport across the blood-brain barrier. NeuroRx, 2, 15-26.
BIDABADI, E. & MASHOUF, M. 2009. Association between iron deficiency anemia and first febrile convulsion: A case–control study. Seizure, 18, 347-351.
BIEN-LY, N., YU, Y. J., BUMBACA, D., ELSTROTT, J., BOSWELL, C. A., ZHANG, Y., LUK, W., LU, Y., DENNIS, M. S., WEIMER, R. M., CHUNG, I. & WATTS, R. J. 2014. Transferrin receptor (TfR) trafficking determines brain uptake of TfR antibody affinity variants. The Journal of Experimental Medicine, 211, 233-244.
BIJSTERBOSCH, M. K., DUURSMA, A. M., BOUMA, J. M. W. & GRUBER, M. 1981. The plasma volume of the Wistar rat in relation to the body weight. Experientia, 37, 381-382.
BJORKLUND, A., ROSENBLAD, C., WINKLER, C. & KIRIK, D. 1997. Studies on neuroprotective and regenerative effects of GDNF in a partial lesion model of Parkinson's disease. Neurobiol Dis, 4, 186-200.
BLESA, J., PHANI, S., JACKSON-LEWIS, V. & PRZEDBORSKI, S. 2012. Classic and new animal models of Parkinson's disease. J Biomed Biotechnol, 2012, 845618.
BLUM, D., WU, Y., NISSOU, M. F., ARNAUD, S., ALIM LOUIS, B. & VERNA, J. M. 1997. p53 and Bax activation in 6-hydroxydopamine-induced apoptosis in PC12 cells. Brain Res, 751, 139-42.
BOADO, R. J., LI, J. Y. & PARDRIDGE, W. M. 2004. Developmental regulation of the rabbit blood-brain barrier LAT1 large neutral amino acid transporter mRNA and protein. Pediatr Res, 55, 557-60.
BOADO, R. J., LI, J. Y., NAGAYA, M., ZHANG, C. & PARDRIDGE, W. M. 1999. Selective expression of the large neutral amino acid transporter at the blood-brain barrier. Proc Natl Acad Sci U S A, 96, 12079-84.
BOHNERT, T. & GAN, L. S. 2013. Plasma protein binding: from discovery to development. J Pharm Sci, 102, 2953-94.
BOJE, K. M. 2001. In vivo measurement of blood-brain barrier permeability. Curr Protoc Neurosci, Chapter 7, Unit 7.19.
BONINA, F., ARENARE, L., IPPOLITO, R., BOATTO, G., BATTAGLIA, G., BRUNO, V. & DE CAPRARIIS, P. 2000. Synthesis, pharmacokinetics and anticonvulsant activity of 7-chlorokynurenic acid prodrugs. International Journal of Pharmaceutics, 202, 79-88.
BONINA, F., PUGLIA, C., RIMOLI, M. G., MELISI, D., BOATTO, G., NIEDDU, M., CALIGNANO, A., RANA, G. L. & CAPRARIIS, P. D. 2003. Glycosyl Derivatives of Dopamine and L-dopa as Anti-Parkinson Prodrugs: Synthesis, Pharmacological Activity and In Vitro Stability Studies. Journal of Drug Targeting, 11, 25-36.
BOON, J. Y., DUSONCHET, J., TRENGROVE, C. & WOLOZIN, B. 2014. Interaction of LRRK2 with kinase and GTPase signaling cascades. Frontiers in Molecular Neuroscience, 7, 64.
BOVÉ, J., PROU, D., PERIER, C. & PRZEDBORSKI, S. 2005. Toxin-Induced Models of Parkinson's Disease. NeuroRx, 2, 484-494.
BOYD, D., VECOLI, C., BELCHER, D. M., JAIN, S. K. & DRYSDALE, J. W. 1985. Structural and functional relationships of human ferritin H and L chains deduced from cDNA clones. J Biol Chem, 260, 11755-61.

REFERENCES
250
BRAAK, H., DEL TREDICI, K., RUB, U., DE VOS, R. A., JANSEN STEUR, E. N. & BRAAK, E. 2003. Staging of brain pathology related to sporadic Parkinson's disease. Neurobiol Aging, 24, 197-211.
BRANCHI, I., D'ANDREA, I., ARMIDA, M., CARNEVALE, D., AJMONE-CAT, M. A., PEZZOLA, A., POTENZA, R. L., MORGESE, M. G., CASSANO, T., MINGHETTI, L., POPOLI, P. & ALLEVA, E. 2010. Striatal 6-OHDA lesion in mice: Investigating early neurochemical changes underlying Parkinson's disease. Behav Brain Res, 208, 137-43.
BROER, S., SCHNEIDER, H. P., BROER, A., RAHMAN, B., HAMPRECHT, B. & DEITMER, J. W. 1998. Characterization of the monocarboxylate transporter 1 expressed in Xenopus laevis oocytes by changes in cytosolic pH. Biochem J, 333 ( Pt 1), 167-74.
BUKHATWA, S., IRAVANI, M. M., ZENG, B. Y., COOPER, J. D., ROSE, S. & JENNER, P. 2009. An immunohistochemical and stereological analysis of PSI-induced nigral neuronal degeneration in the rat. J Neurochem, 109, 52-9.
BUNDGAARD, M. & ABBOTT, N. J. 2008. All vertebrates started out with a glial blood-brain barrier 4-500 million years ago. Glia, 56, 699-708.
BUNESCU, A., BESSE-HOGGAN, P., SANCELME, M., MAILHOT, G. & DELORT, A. M. 2008. Fate of the nitrilotriacetic acid-Fe(III) complex during photodegradation and biodegradation by Rhodococcus rhodochrous. Appl Environ Microbiol, 74, 6320-6.
BURROUGHS, S. L., DUNCAN, R. S., RAYUDU, P., KANDULA, P., PAYNE, A. J., CLARK, J. L., KOULEN, P. & KAJA, S. 2012. Plate reader-based assays for measuring cell viability, neuroprotection and calcium in primary neuronal cultures. Journal of neuroscience methods, 203, 141-145.
CABANTCHIK, Z. I. 2014. Labile iron in cells and body fluids: physiology, pathology, and pharmacology. Frontiers in Pharmacology, 5, 45.
CACCIATORE, I., FORNASARI, E., BALDASSARRE, L., CORNACCHIA, C., FULLE, S., DI FILIPPO, E., PIETRANGELO, T. & PINNEN, F. 2013. A Potent (R)-alpha-bis-lipoyl Derivative Containing 8-Hydroxyquinoline Scaffold: Synthesis and Biological Evaluation of Its Neuroprotective Capabilities in SH-SY5Y Human Neuroblastoma Cells. Pharmaceuticals, 6, 54.
CALABRESI, P., PICCONI, B., PARNETTI, L. & DI FILIPPO, M. 2006. A convergent model for cognitive dysfunctions in Parkinson's disease: the critical dopamine-acetylcholine synaptic balance. Lancet Neurol, 5, 974-83.
CAMPBELL, S. D., REGINA, K. J. & KHARASCH, E. D. 2014. Significance of lipid composition in a blood-brain barrier-mimetic PAMPA assay. J Biomol Screen, 19, 437-44.
CAPPELLINI, M. D., COHEN, A., ELEFTHERIOU, A., PIGA, A., PORTER, J. & TAHER, A. 2008. Guidelines for the Clinical Management of Thalassaemia. 2nd Revised ed. Nicosia (CY).
CAPPELLINI, M. D., PORTER, J., EL-BESHLAWY, A., LI, C.-K., SEYMOUR, J. F., ELALFY, M., GATTERMANN, N., GIRAUDIER, S., LEE, J.-W., CHAN, L. L., LIN, K.-H., ROSE, C., TAHER, A., THEIN, S. L., VIPRAKASIT, V., HABR, D., DOMOKOS, G., ROUBERT, B. & KATTAMIS, A. 2010. Tailoring iron chelation by iron intake and serum ferritin: the prospective EPIC study of deferasirox in 1744 patients with transfusion-dependent anemias. Haematologica, 95, 557.
CARDOSO, S. M., MOREIRA, P. I., AGOSTINHO, P., PEREIRA, C. & OLIVEIRA, C. R. 2005. Neurodegenerative pathways in Parkinson's disease: therapeutic strategies. Curr Drug Targets CNS Neurol Disord, 4, 405-19.
CAROSIO, R., ZUCCARI, G., ORIENTI, I., MANGRAVITI, S. & MONTALDO, P. G. 2007. Sodium Ascorbate induces apoptosis in neuroblastoma cell lines by interfering with iron uptake. Molecular Cancer, 6, 55.

REFERENCES
251
CARRUTHERS, A., DEZUTTER, J., GANGULY, A. & DEVASKAR, S. U. 2009. Will the original glucose transporter isoform please stand up! American Journal of Physiology-Endocrinology and Metabolism, 297, E836-E848.
CARVEY, P. M., ZHAO, C. H., HENDEY, B., LUM, H., TRACHTENBERG, J., DESAI, B. S., SNYDER, J., ZHU, Y. G. & LING, Z. D. 2005. 6-Hydroxydopamine-induced alterations in blood–brain barrier permeability. European Journal of Neuroscience, 22, 1158-1168.
CASTANEDA, E., WHISHAW, I. & ROBINSON, T. 1990. Changes in striatal dopamine neurotransmission assessed with microdialysis following recovery from a bilateral 6-OHDA lesion: variation as a function of lesion size. The Journal of Neuroscience, 10, 1847-1854.
CASTANO, A., HERRERA, A. J., CANO, J. & MACHADO, A. 1998. Lipopolysaccharide intranigral injection induces inflammatory reaction and damage in nigrostriatal dopaminergic system. J Neurochem, 70, 1584-92.
CASTINO, R., FIORENTINO, I., CAGNIN, M., GIOVIA, A. & ISIDORO, C. 2011. Chelation of lysosomal iron protects dopaminergic SH-SY5Y neuroblastoma cells from hydrogen peroxide toxicity by precluding autophagy and Akt dephosphorylation. Toxicol Sci, 123, 523-41.
CATER, H. L., BENHAM, C. D. & SUNDSTROM, L. E. 2001. Neuroprotective role of monocarboxylate transport during glucose deprivation in slice cultures of rat hippocampus. J Physiol, 531, 459-66.
CECI, A., MANGIARINI, L., FELISI, M., BARTOLONI, F., CIANCIO, A., CAPRA, M., D'ASCOLA, D., CIANCIULLI, P. & FILOSA, A. 2011. The management of iron chelation therapy: preliminary data from a national registry of thalassaemic patients. Anemia, 2011, 435683.
CHAI, C. & LIM, K.-L. 2013. Genetic Insights into Sporadic Parkinson's Disease Pathogenesis. Current Genomics, 14, 486-501.
CHANG, K. L., PEE, H. N., YANG, S. & HO, P. C. 2015. Influence of drug transporters and stereoselectivity on the brain penetration of pioglitazone as a potential medicine against Alzheimer's disease. Sci Rep, 5, 9000.
CHAPY, H., SAUBAMEA, B., TOURNIER, N., BOURASSET, F., BEHAR-COHEN, F., DECLEVES, X., SCHERRMANN, J. M. & CISTERNINO, S. 2016. Blood-brain and retinal barriers show dissimilar ABC transporter impacts and concealed effect of P-glycoprotein on a novel verapamil influx carrier. British Journal of Pharmacology, 173, 497-510.
CHAPY, H., SMIRNOVA, M., ANDRÉ, P., SCHLATTER, J., CHIADMI, F., COURAUD, P.-O., SCHERRMANN, J.-M., DECLÈVES, X. & CISTERNINO, S. 2015. Carrier-Mediated Cocaine Transport at the Blood-Brain Barrier as a Putative Mechanism in Addiction Liability. International Journal of Neuropsychopharmacology, 18, pyu001.
CHASTON, T. B. & RICHARDSON, D. R. 2003. Iron chelators for the treatment of iron overload disease: relationship between structure, redox activity, and toxicity. Am J Hematol, 73, 200-10.
CHEN, H., WINIWARTER, S., FRIDEN, M., ANTONSSON, M. & ENGKVIST, O. 2011. In silico prediction of unbound brain-to-plasma concentration ratio using machine learning algorithms. J Mol Graph Model, 29, 985-95.
CHEN, Q., GONG, T., LIU, J., WANG, X., FU, H. & ZHANG, Z. 2009. Synthesis in vitro and in vivo Characterization of Glycosyl Derivatives of Ibuprofen as Novel Prodrugs for Brain Drug Delivery. journal of Drug Targeting, 4, 318-328.
CHENG, H.-C., ULANE, C. M. & BURKE, R. E. 2010. Clinical Progression in Parkinson's Disease and the Neurobiology of Axons. Annals of neurology, 67, 715-725.
CHINACHOTI, P. & STEINBERG, M. P. 1988. Interaction of Sucrose with Gelatin, Egg-Albumin and Gluten in Freeze-Dried Mixtures as Shown by Water Sorption. Journal of Food Science, 53, 932-&.
REFERENCES
252
CHINNERY, P. F. & HUDSON, G. 2013. Mitochondrial genetics. British Medical Bulletin, 106, 135-159.
CHINTA, S. J. & ANDERSEN, J. K. 2008. Redox imbalance in Parkinson's disease. Biochim Biophys Acta, 1780, 1362-7.
CHOI, B. S. & ZHENG, W. 2009. Copper transport to the brain by the blood-brain barrier and blood-CSF barrier. Brain Res, 1248, 14-21.
CHOI, W. S., PALMITER, R. D. & XIA, Z. 2011. Loss of mitochondrial complex I activity potentiates dopamine neuron death induced by microtubule dysfunction in a Parkinson's disease model. J Cell Biol, 192, 873-82.
CIANCIULLI, P. 2008. Treatment of iron overload in thalassemia. Pediatr Endocrinol Rev, 6 Suppl 1, 208-13.
CIECHANOVER, A. 1998. The ubiquitin-proteasome pathway: on protein death and cell life. The EMBO Journal, 17, 7151-7160.
CIPOLLA, M. J. 2009. The Cerebral Circulation. Integrated Systems Physiology: From Molecule to Function. San Rafael (CA): Morgan & Claypool Life Sciences.
CISTERNINO, S., CHAPY, H., ANDRÉ, P., SMIRNOVA, M., DEBRAY, M. & SCHERRMANN, J.-M. 2013. Coexistence of Passive and Proton Antiporter-Mediated Processes in Nicotine Transport at the Mouse Blood–Brain Barrier. The AAPS Journal, 15, 299-307.
CISTERNINO, S., MERCIER, C., BOURASSET, F., ROUX, F. & SCHERRMANN, J. M. 2004. Expression, up-regulation, and transport activity of the multidrug-resistance protein Abcg2 at the mouse blood-brain barrier. Cancer Res, 64, 3296-301.
CONWAY, K. A., ROCHET, J. C., BIEGANSKI, R. M. & LANSBURY, P. T., JR. 2001. Kinetic stabilization of the alpha-synuclein protofibril by a dopamine-alpha-synuclein adduct. Science, 294, 1346-9.
COOK, C. & PETRUCELLI, L. 2009. A critical evaluation of the ubiquitin–proteasome system in Parkinson's disease. Biochimica et Biophysica Acta (BBA) - Molecular Basis of Disease, 1792, 664-675.
CORDATO, D. J. & CHAN, D. K. 2004. Genetics and Parkinson's disease. J Clin Neurosci, 11, 119-23.
CORNFORD, E. M., YOUNG, D., PAXTON, J. W., FINLAY, G. J., WILSON, W. R. & PARDRIDGE, W. M. 1992. Melphalan penetration of the blood-brain barrier via the neutral amino acid transporter in tumor-bearing brain. Cancer Res, 52, 138-43.
COSI, C., COLPAERT, F., KOEK, W., DEGRYSE, A. & MARIEN, M. 1996. Poly(ADP-ribose) polymerase inhibitors protect against MPTP-induced depletions of striatal dopamine and cortical noradrenaline in C57B1/6 mice. Brain Research, 729, 264-269.
CROWE, A. & MORGAN, E. H. 1994. Effects of chelators on iron uptake and release by the brain in the rat. Neurochem Res, 19, 71-6.
CUI, Z.-W., XIE, Z.-X., WANG, B.-F., ZHONG, Z.-H., CHEN, X.-Y., SUN, Y.-H., SUN, Q.-F., YANG, G.-Y. & BIAN, L.-G. 2015. Carvacrol protects neuroblastoma SH-SY5Y cells against Fe(2+)-induced apoptosis by suppressing activation of MAPK/JNK-NF-κB signaling pathway. Acta Pharmacologica Sinica, 36, 1426-1436.
CURTIUS, H. C., WOLFENSBERGER, M., STEINMANN, B., REDWEIK, U. & SIEGFRIED, J. 1974. Mass fragmentography of dopamine and 6-hydroxydopamine. Application to the determination of dopamine in human brain biopsies from the caudate nucleus. J Chromatogr, 99, 529-40.

REFERENCES
253
CUTLER, L., HOWES, C., DEEKS, N. J., BUCK, T. L. & JEFFREY, P. 2006. Development of a P-glycoprotein knockout model in rodents to define species differences in its functional effect at the blood-brain barrier. J Pharm Sci,
95, 1944-53.
CZLONKOWSKA, A., KURKOWSKA-JASTRZEBSKA, I., CZLONKOWSKI, A., PETER, D. & STEFANO, G. B. 2002. Immune processes in the pathogenesis of Parkinson's disease - a potential role for microglia and nitric oxide. Med Sci Monit, 8, Ra165-77.
DATKI, Z., JUHASZ, A., GALFI, M., SOOS, K., PAPP, R., ZADORI, D. & PENKE, B. 2003. Method for measuring neurotoxicity of aggregating polypeptides with the MTT assay on differentiated neuroblastoma cells. Brain Res Bull, 62, 223-9.
DAUBNER, S. C., LE, T. & WANG, S. 2011. Tyrosine Hydroxylase and Regulation of Dopamine Synthesis. Archives of biochemistry and biophysics, 508, 1-12.
DAUCHY, R. T., BLASK, D. E. & SAUER, L. A. 2000. Preparation of the inguinal fat pad for perfusion in situ in the rat: a surgical technique that preserves continuous blood flow. Contemp Top Lab Anim Sci, 39, 29-33.
DAUER, W. & PRZEDBORSKI, S. 2003. Parkinson's Disease: Mechanisms and Models. Neuron, 39, 889-909.
DAUGHERTY, A. M. & RAZ, N. 2015. Appraising the Role of Iron in Brain Aging and Cognition: Promises and Limitations of MRI Methods. Neuropsychology review, 25, 272-287.
DE LAU, L. M. L. & BRETELER, M. M. B. 2006. Epidemiology of Parkinson's disease. The Lancet Neurology, 5, 525-535.
DEBEIR, T., GINESTET, L., FRANCOIS, C., LAURENS, S., MARTEL, J. C., CHOPIN, P., MARIEN, M., COLPAERT, F. & RAISMAN-VOZARI, R. 2005. Effect of intrastriatal 6-OHDA lesion on dopaminergic innervation of the rat cortex and globus pallidus. Exp Neurol, 193, 444-54.
DEL AMO, E. M., URTTI, A. & YLIPERTTULA, M. 2008. Pharmacokinetic role of L-type amino acid transporters LAT1 and LAT2. Eur J Pharm Sci, 35, 161-74.
DELAVILLE, C., DEURWAERDÈRE, P. D. & BENAZZOUZ, A. 2011. Noradrenaline and Parkinson's Disease. Frontiers in Systems Neuroscience, 5, 31.
DELLEDONNE, A., KLOS, K. J., FUJISHIRO, H., AHMED, Z., PARISI, J. E., JOSEPHS, K. A., FRIGERIO, R., BURNETT, M., WSZOLEK, Z. K., UITTI, R. J., AHLSKOG, J. E. & DICKSON, D. W. 2008. Incidental Lewy body disease and preclinical Parkinson disease. Arch Neurol, 65, 1074-80.
DENG, D., XU, C., SUN, P. C., WU, J. P., YAN, C. Y., HU, M. X. & YAN, N. 2014. Crystal structure of the human glucose transporter GLUT1. Nature, 510, 121-+.
DEV, S., KUMARI, S., SINGH, N., KUMAR BAL, S., SETH, P. & MUKHOPADHYAY, C. K. 2015. Role of extracellular Hydrogen peroxide in regulation of iron homeostasis genes in neuronal cells: Implication in iron accumulation. Free Radic Biol Med, 86, 78-89.
DEVANUR, L. D., EVANS, R. W., EVANS, P. J. & HIDER, R. C. 2008a. Chelator-facilitated removal of iron from transferrin: relevance to combined chelation therapy. Biochem J, 409, 439-47.
DEVANUR, L. D., NEUBERT, H. & HIDER, R. C. 2008b. The fenton activity of iron(III) in the presence of deferiprone. J Pharm Sci, 97, 1454-67.
DEVOS, D., MOREAU, C., DEVEDJIAN, J. C., KLUZA, J., PETRAULT, M., LALOUX, C., JONNEAUX, A., RYCKEWAERT, G., GARCON, G., ROUAIX, N., DUHAMEL, A., JISSENDI, P., DUJARDIN, K., AUGER, F.,
REFERENCES
254
RAVASI, L., HOPES, L., GROLEZ, G., FIRDAUS, W., SABLONNIERE, B., STRUBI-VUILLAUME, I., ZAHR, N., DESTEE, A., CORVOL, J. C., POLTL, D., LEIST, M., ROSE, C., DEFEBVRE, L., MARCHETTI, P., CABANTCHIK, Z. I. & BORDET, R. 2014. Targeting Chelatable Iron as a Therapeutic Modality in Parkinson's Disease. Antioxidants & Redox Signaling, 21, 195-210.
DEVRAJ, K., KLINGER, M. E., MYERS, R. L., MOKASHI, A., HAWKINS, R. A. & SIMPSON, I. A. 2011. GLUT-1 GLUCOSE TRANSPORTERS IN THE BLOOD-BRAIN BARRIER: DIFFERENTIAL PHOSPHORYLATION. Journal of neuroscience research, 89, 10.1002/jnr.22738.
DEXTER, D. T., SIAN, J., ROSE, S., HINDMARSH, J. G., MANN, V. M., COOPER, J. M., WELLS, F. R., DANIEL, S. E., LEES, A. J., SCHAPIRA, A. H. & ET AL. 1994. Indices of oxidative stress and mitochondrial function in individuals with incidental Lewy body disease. Ann Neurol, 35, 38-44.
DEXTER, D. T., STATTON, S. A., WHITMORE, C., FREINBICHLER, W., WEINBERGER, P., TIPTON, K. F., DELLA CORTE, L., WARD, R. J. & CRICHTON, R. R. 2011. Clinically available iron chelators induce neuroprotection in the 6-OHDA model of Parkinson's disease after peripheral administration. Journal of Neural Transmission, 118, 223-231.
DEXTER, D. T., WELLS, F. R., AGID, F., AGID, Y., LEES, A. J., JENNER, P. & MARSDEN, C. D. 1987. Increased nigral iron content in postmortem parkinsonian brain. Lancet, 2, 1219-20.
DEXTER, D. T., WELLS, F. R., AGID, F., AGID, Y., LEES, A. J., JENNER, P. & MARSDEN, C. D. 1987. Increased nigral iron content in postmortem parkinsonian brain. Lancet, 2, 1219-20.
DEXTER, D. T., WELLS, F. R., LEES, A. J., AGID, F., AGID, Y., JENNER, P. & MARSDEN, C. D. 1989. Increased nigral iron content and alterations in other metal ions occurring in brain in Parkinson's disease. J Neurochem, 52, 1830-6.
DI, L., ARTURSSON, P., AVDEEF, A., ECKER, G. F., FALLER, B., FISCHER, H., HOUSTON, J. B., KANSY, M., KERNS, E. H., KRAMER, S. D., LENNERNAS, H. & SUGANO, K. 2012. Evidence-based approach to assess passive diffusion and carrier-mediated drug transport. Drug Discovery Today, 17, 905-912.
DIAS, V., JUNN, E. & MOURADIAN, M. M. 2013. The role of oxidative stress in Parkinson's disease. J Parkinsons Dis, 3, 461-91.
DICK, F. D., DE PALMA, G., AHMADI, A., SCOTT, N. W., PRESCOTT, G. J., BENNETT, J., SEMPLE, S., DICK, S., COUNSELL, C., MOZZONI, P., HAITES, N., WETTINGER, S. B., MUTTI, A., OTELEA, M., SEATON, A., SÖDERKVIST, P. & FELICE, A. 2007. Environmental risk factors for Parkinson's disease and parkinsonism: the Geoparkinson study. Occupational and Environmental Medicine, 64, 666-672.
DIETRICH, P., RIDEOUT, H. J., WANG, Q. & STEFANIS, L. 2003. Lack of p53 delays apoptosis, but increases ubiquitinated inclusions, in proteasomal inhibitor-treated cultured cortical neurons. Molecular and Cellular Neuroscience, 24, 430-441.
DINUNZIO, J. C. & WILLIAMS, R. O., 3RD 2008. CNS disorders--current treatment options and the prospects for advanced therapies. Drug Dev Ind Pharm, 34, 1141-67.
DO, J. H., KIM, I. S., PARK, T. K. & CHOI, D. K. 2007. Genome-wide examination of chromosomal aberrations in neuroblastoma SH-SY5Y cells by array-based comparative genomic hybridization. Mol Cells, 24, 105-12.
DOBBS, R. J., CHARLETT, A., PURKISS, A. G., DOBBS, S. M., WELLER, C. & PETERSON, D. W. 1999. Association of circulating TNF-alpha and IL-6 with ageing and parkinsonism. Acta Neurol Scand, 100, 34-41.
DOUBLE, K. L., MAYWALD, M., SCHMITTEL, M., RIEDERER, P. & GERLACH, M. 1998. In vitro studies of ferritin iron release and neurotoxicity. J Neurochem, 70, 2492-9.

REFERENCES
255
DUBEY, R. K., MCALLISTER, C. B., INOUE, M. & WILKINSON, G. R. 1989. Plasma binding and transport of diazepam across the blood-brain barrier. No evidence for in vivo enhanced dissociation. J Clin Invest, 84, 1155-9.
DUONG, T. Q., IADECOLA, C. & KIM, S. G. 2001. Effect of hyperoxia, hypercapnia, and hypoxia on cerebral interstitial oxygen tension and cerebral blood flow. Magn Reson Med, 45, 61-70.
DUTTA, G., ZHANG, P. & LIU, B. 2008. The lipopolysaccharide Parkinson's disease animal model: mechanistic studies and drug discovery. Fundam Clin Pharmacol, 22, 453-64.
DUTY, S. & JENNER, P. 2011. Animal models of Parkinson's disease: a source of novel treatments and clues to the cause of the disease. Br J Pharmacol, 164, 1357-91.
DWYER, K. J. & PARDRIDGE, W. M. 1993. Developmental Modulation of Blood-Brain-Barrier and Choroid-Plexus Glut1 Glucose Transporter Messenger-Ribonucleic-Acid and Immunoreactive Protein in Rabbits. Endocrinology, 132, 558-565.
EARLE, K. M. 1968. Studies on Parkinson's disease including x-ray fluorescent spectroscopy of formalin fixed brain tissue. J Neuropathol Exp Neurol, 27, 1-14.
EKSTRAND, M. I., TERZIOGLU, M., GALTER, D., ZHU, S., HOFSTETTER, C., LINDQVIST, E., THAMS, S., BERGSTRAND, A., HANSSON, F. S., TRIFUNOVIC, A., HOFFER, B., CULLHEIM, S., MOHAMMED, A. H., OLSON, L. & LARSSON, N.-G. 2007. Progressive parkinsonism in mice with respiratory-chain-deficient dopamine neurons. Proceedings of the National Academy of Sciences of the United States of America, 104, 1325-1330.
ELALFY, M. S., SHEBL, S. S., BADR, M. A., ELSAFY, U. R., SALAMA, M. A., AL-TONBARY, Y., RAHMAN, Y. A., QARI, M. H., AL DAMNHOURI, G. A., AL HAWSAWI, Z., WALI, Y. A., YESILIPEK, M. A., KILINC, Y., YAZMAN, D., KARAKAS, Z. & TRICTA, F. 2012. Frequency of Agranulocytosis and Mild Neutropenia During Deferiprone Therapy in Clinical Practice. Blood, 120, 996-996.
EL-KATTAN, A. & VARMA, M. 2012. Oral absorption, intestinal metabolism and human oral bioavailability. In: PAXTON, D. J. (ed.) Topics on Drug Metabolism. InTech.
ELMORE, S. 2007. Apoptosis: A Review of Programmed Cell Death. Toxicologic pathology, 35, 495-516.
ENE, L., DUICULESCU, D. & RUTA, S. M. 2011. How much do antiretroviral drugs penetrate into the central nervous system? Journal of Medicine and Life, 4, 432-439.
ENGELHARDT, B. & SOROKIN, L. 2009. The blood-brain and the blood-cerebrospinal fluid barriers: function and dysfunction. Semin Immunopathol, 31, 497-511.
ENNIS, S. R. & BETZ, A. L. 1986. Sucrose permeability of the blood-retinal and blood-brain barriers. Effects of diabetes, hypertonicity, and iodate. Invest Ophthalmol Vis Sci, 27, 1095-102.
ENNIS, S., KAWAI, N., REN, X., ABDELKARIM, G. & KEEP, R. 1998. Glutamine uptake at the blood-brain barrier is mediated by N-system transport. J Neurochem, 71, 2565-2573.
EUROPEAN MEDICINES AGENCY 2005. Procedural steps taken before authorisation: background information on the procedure In: AGENCY, E. M. (ed.).
FALKENBURGER, B. H. & SCHULZ, J. B. 2006. Limitations of cellular models in Parkinson's disease research. J Neural Transm Suppl, 261-8.
FEBBRARO, F., GIORGI, M., CALDAROLA, S., LORENI, F. & ROMERO-RAMOS, M. 2012. alpha-Synuclein expression is modulated at the translational level by iron. Neuroreport, 23, 576-80.

REFERENCES
256
FERGER, B., ROSE, S., JENNER, A., HALLIWELL, B. & JENNER, P. 2001. 6-hydroxydopamine increases hydroxyl free radical production and DNA damage in rat striatum. Neuroreport, 12, 1155-9.
FERRER, I. 2011. Neuropathology and Neurochemistry of Nonmotor Symptoms in Parkinson's Disease. Parkinson's Disease, 2011, 708404.
FILOGRANA, R., CIVIERO, L., FERRARI, V., CODOLO, G., GREGGIO, E., BUBACCO, L., BELTRAMINI, M. & BISAGLIA, M. 2015. Analysis of the Catecholaminergic Phenotype in Human SH-SY5Y and BE(2)-M17 Neuroblastoma Cell Lines upon Differentiation. PLOS ONE, 10, e0136769.
FISCHER, H., GOTTSCHLICH, R. & SEELIG, A. 1998. Blood-brain barrier permeation: molecular parameters governing passive diffusion. J Membr Biol, 165, 201-11.
FISHER, S. A., BRUNSKILL, S. J., DOREE, C., CHOWDHURY, O., GOODING, S. & ROBERTS, D. J. 2013. Oral deferiprone for iron chelation in people with thalassaemia. Cochrane Database of Systematic Reviews.
FONG, C. W. 2015. Permeability of the Blood–Brain Barrier: Molecular Mechanism of Transport of Drugs and Physiologically Important Compounds. The Journal of Membrane Biology, 248, 651-669.
FORNI, G. L., BALOCCO, M., CREMONESI, L., ABBRUZZESE, G., PARODI, R. C. & MARCHESE, R. 2008. Regression of symptoms after selective iron chelation therapy in a case of neurodegeneration with brain iron accumulation. Movement Disorders, 23, 904-907.
FOSTER, H. D. & HOFFER, A. 2004. The two faces of L-DOPA: benefits and adverse side effects in the treatment of Encephalitis lethargica, Parkinson's disease, multiple sclerosis and amyotrophic lateral sclerosis. Med Hypotheses, 62, 177-81.
FOX, E., BUNGAY, P. M., BACHER, J., MCCULLY, C. L., DEDRICK, R. L. & BALIS, F. M. 2002. Zidovudine concentration in brain extracellular fluid measured by microdialysis: steady-state and transient results in rhesus monkey. J Pharmacol Exp Ther, 301, 1003-11.
FRANK-CANNON, T. C., ALTO, L. T., MCALPINE, F. E. & TANSEY, M. G. 2009. Does neuroinflammation fan the flame in neurodegenerative diseases? Mol Neurodegener, 4, 47.
FREDENBURG, A., SETHI, R., ALLEN, D. & YOKEL, R. 1996a. The pharmacokinetics and blood-brain barrier permeation of the chelators 1,2 dimethly-, 1,2 diethyl-, and 1-[ethan-1'ol]-2-methyl-3-hydroxypyridin-4-one in the rat. Toxicology, 108, 191-199.
FRIDÉN, M. 2014. Prediction of Drug Exposure in the Brain from the Chemical Structure. In: HAMMARLUND-UDENAES, M., DE LANGE, E. C. M. & THORNE, R. G. (eds.) Drug Delivery to the Brain: Physiological Concepts, Methodologies and Approaches. New York, NY: Springer New York.
FRIDEN, M., GUPTA, A., ANTONSSON, M., BREDBERG, U. & HAMMARLUND-UDENAES, M. 2007. In vitro methods for estimating unbound drug concentrations in the brain interstitial and intracellular fluids. Drug Metab Dispos, 35, 1711-9.
FRIDEN, M., WINIWARTER, S., JERNDAL, G., BENGTSSON, O., WAN, H., BREDBERG, U., HAMMARLUND-UDENAES, M. & ANTONSSON, M. 2009. Structure-brain exposure relationships in rat and human using a novel data set of unbound drug concentrations in brain interstitial and cerebrospinal fluids. J Med Chem, 52, 6233-43.
FRIEDMAN, J. 2011. Why Is the Nervous System Vulnerable to Oxidative Stress? In: GADOTH, N. & GÖBEL, H. H. (eds.) Oxidative Stress and Free Radical Damage in Neurology. Totowa, NJ: Humana Press.

REFERENCES
257
GABRIČEVIĆ, M. & CRUMBLISS, A. L. 2003. Kinetics and Mechanism of Iron(III)−Nitrilotriacetate Complex Reactions with Phosphate and Acetohydroxamic Acid. Inorganic Chemistry, 42, 4098-4101.
GAL, S., FRIDKIN, M., AMIT, T., ZHENG, H. & YOUDIM, M. B. 2006. M30, a novel multifunctional neuroprotective drug with potent iron chelating and brain selective monoamine oxidase-ab inhibitory activity for Parkinson's disease. J Neural Transm Suppl, 447-56.
GAL, S., ZHENG, H., FRIDKIN, M. & YOUDIM, M. B. 2005. Novel multifunctional neuroprotective iron chelator-monoamine oxidase inhibitor drugs for neurodegenerative diseases. In vivo selective brain monoamine oxidase inhibition and prevention of MPTP-induced striatal dopamine depletion. J Neurochem, 95, 79-88.
GANDHI, S., MUQIT, M. M., STANYER, L., HEALY, D. G., ABOU-SLEIMAN, P. M., HARGREAVES, I., HEALES, S., GANGULY, M., PARSONS, L., LEES, A. J., LATCHMAN, D. S., HOLTON, J. L., WOOD, N. W. & REVESZ, T. 2006. PINK1 protein in normal human brain and Parkinson's disease. Brain, 129, 1720-31.
GASSER, T. 2009. Mendelian forms of Parkinson's disease. Biochimica et Biophysica Acta (BBA) - Molecular Basis of Disease, 1792, 587-596.
GATTO, N. M., COCKBURN, M., BRONSTEIN, J., MANTHRIPRAGADA, A. D. & RITZ, B. 2009. Well-Water Consumption and Parkinson’s Disease in Rural California. Environmental Health Perspectives, 117, 1912-1918.
GAUTIER, C. A., KITADA, T. & SHEN, J. 2008. Loss of PINK1 causes mitochondrial functional defects and increased sensitivity to oxidative stress. Proc Natl Acad Sci U S A, 105, 11364-9.
GEIER, E. G., SCHLESSINGER, A., FAN, H., GABLE, J. E., IRWIN, J. J., SALI, A. & GIACOMINI, K. M. 2013. Structure-based ligand discovery for the Large-neutral Amino Acid Transporter 1, LAT-1. Proceedings of the National Academy of Sciences of the United States of America, 110, 5480-5485.
GENESTRA, M. 2007. Oxyl radicals, redox-sensitive signalling cascades and antioxidants. Cell Signal, 19, 1807-19.
GERLACH, M., DOUBLE, K. L., YOUDIM, M. B. & RIEDERER, P. 2006. Potential sources of increased iron in the substantia nigra of parkinsonian patients. J Neural Transm Suppl, 133-42.
GIKNIS, M. L. A. & CLIFFORD, C. B. 2008. Clinical laboratory parameters for Crl:WI (Han). In: RIVER, C. (ed.).
GIORGIO, M., TRINEI, M., MIGLIACCIO, E. & PELICCI, P. G. 2007. Hydrogen peroxide: a metabolic by-product or a common mediator of ageing signals? Nat Rev Mol Cell Biol, 8, 722-8.
GLICKMAN, M. H. & CIECHANOVER, A. 2002. The ubiquitin-proteasome proteolytic pathway: destruction for the sake of construction. Physiol Rev, 82, 373-428.
GLICKSTEIN, H., EL, R. B., SHVARTSMAN, M. & CABANTCHIK, Z. I. 2005. Intracellular Labile Iron Pools as Direct Targets of Iron Chelators: A Fluorescence Study of Chelator Action in Living Cells. Blood, 106, 3242-3250.
GLINKA, Y. Y. & YOUDIM, M. B. 1995. Inhibition of mitochondrial complexes I and IV by 6-hydroxydopamine. Eur J Pharmacol, 292, 329-32.
GLINKA, Y., TIPTON, K. F. & YOUDIM, M. B. 1998. Mechanism of inhibition of mitochondrial respiratory complex I by 6-hydroxydopamine and its prevention by desferrioxamine. Eur J Pharmacol, 351, 121-9.
GOLBE, L. I., DI IORIO, G., LAZZARINI, A., VIEREGGE, P., GERSHANIK, O. S., BONAVITA, V. & DUVOISIN, R. C. 1999. The Contursi kindred, a large family with autosomal dominant Parkinson's disease: implications of clinical and molecular studies. Adv Neurol, 80, 165-70.

REFERENCES
258
GOMES, P. & SOARES-DA-SILVA, P. 1999. L-DOPA transport properties in an immortalised cell line of rat capillary cerebral endothelial cells, RBE 4. Brain Res, 829, 143-50.
GONG, B. & LEZNIK, E. 2007. The role of ubiquitin C-terminal hydrolase L1 in neurodegenerative disorders. Drug News Perspect, 20, 365-70.
GORELL, J. M., JOHNSON, C. C., RYBICKI, B. A., PETERSON, E. L. & RICHARDSON, R. J. 1998. The risk of Parkinson's disease with exposure to pesticides, farming, well water, and rural living. Neurology, 50, 1346-50.
GOTSBACHER, M. P., TELFER, T. J., WITTING, P. K., DOUBLE, K. L., FINKELSTEIN, D. I. & CODD, R. 2017. Analogues of desferrioxamine B designed to attenuate iron-mediated neurodegeneration: synthesis, characterisation and activity in the MPTP-mouse model of Parkinson's disease. Metallomics, 9, 852-864.
GREENAMYRE, J. T., BETARBET, R. & SHERER, T. B. 2003. The rotenone model of Parkinson's disease: genes, environment and mitochondria. Parkinsonism Relat Disord, 9 Suppl 2, S59-64.
GREENWOOD, J., LOVE, E. R. & PRATT, O. E. 1982. Kinetics of thiamine transport across the blood-brain barrier in the rat. J Physiol, 327, 95-103.
GREIG, N. H., SONCRANT, T. T., SHETTY, H. U., MOMMA, S., SMITH, Q. R. & RAPOPORT, S. I. 1990. Brain uptake and anticancer activities of vincristine and vinblastine are restricted by their low cerebrovascular permeability and binding to plasma constituents in rat. Cancer Chemother Pharmacol, 26, 263-8.
GRIFFITHS, P. D., DOBSON, B. R., JONES, G. R. & CLARKE, D. T. 1999. Iron in the basal ganglia in Parkinson's disease - An in vitro study using extended X-ray absorption fine structure and cryo-electron microscopy. Brain, 122, 667-673.
GRUNBLATT, E., MANDEL, S., MAOR, G. & YOUDIM, M. B. 2001. Effects of R- and S-apomorphine on MPTP-induced nigro-striatal dopamine neuronal loss. J Neurochem, 77, 146-56.
GUAN, H., YANG, H., YANG, M., YANAGISAWA, D., BELLIER, J. P., MORI, M., TAKAHATA, S., NONAKA, T., ZHAO, S. & TOOYAMA, I. 2017. Mitochondrial ferritin protects SH-SY5Y cells against H2O2-induced oxidative stress and modulates alpha-synuclein expression. Exp Neurol, 291, 51-61.
GUO, B., PHILLIPS, J. D., YU, Y. & LEIBOLD, E. A. 1995. Iron regulates the intracellular degradation of iron regulatory protein 2 by the proteasome. J Biol Chem, 270, 21645-51.
GUO, C., SUN, L., CHEN, X. & ZHANG, D. 2013. Oxidative stress, mitochondrial damage and neurodegenerative diseases. Neural Regeneration Research, 8, 2003-2014.
GUO, N. & PENG, Z. 2013. MG132, a proteasome inhibitor, induces apoptosis in tumor cells. Asia-Pacific Journal of Clinical Oncology, 9, 6-11.
GUREVICH, K. G. 2013. Effect of blood protein concentrations on drug-dosing regimes: practical guidance. Theor Biol Med Model, 10, 20.
GUYENET, P. G., MULKEY, D. K., STORNETTA, R. L. & BAYLISS, D. A. 2005. Regulation of ventral surface chemoreceptors by the central respiratory pattern generator. J Neurosci, 25, 8938-47.
HABER, S. N., FUDGE, J. L. & MCFARLAND, N. R. 2000. Striatonigrostriatal Pathways in Primates Form an Ascending Spiral from the Shell to the Dorsolateral Striatum. The Journal of Neuroscience, 20, 2369-2382.
HABGOOD, M. D., BEGLEY, D. J. & ABBOTT, N. J. 2000. Determinants of Passive Drug Entry into the Central Nervous System. Cellular and Molecular Neurobiology, 20, 231-253.

REFERENCES
259
HABGOOD, M. D., LIU, Z. D., DEHKORDI, L. S., KHODR, H. H., ABBOTT, J. & HIDER, R. C. 1999. Investigation into the correlation between the structure of hydroxypyridinones and blood-brain barrier permeability. Biochem Pharmacol, 57, 1305-10.
HALD, A. & LOTHARIUS, J. 2005. Oxidative stress and inflammation in Parkinson's disease: is there a causal link? Exp Neurol, 193, 279-90.
HALL, S., RUTLEDGE, J. N. & SCHALLERT, T. 1992. MRI, brain iron and experimental Parkinson's disease. J Neurol Sci, 113, 198-208.
HALLIWELL, B. & GUTTERIDGE, J. M. 1984. Oxygen toxicity, oxygen radicals, transition metals and disease. Biochem J, 219.
HAMMARLUND-UDENAES, M., FRIDEN, M., SYVANEN, S. & GUPTA, A. 2008. On the rate and extent of drug delivery to the brain. Pharm Res, 25, 1737-50.
HANAGASI, H. A. & EMRE, M. 2005. Treatment of behavioural symptoms and dementia in Parkinson's disease. Fundam Clin Pharmacol, 19, 133-46.
HARRIS, D. C. 1977. Different metal-binding properties of the two sites of human transferrin. Biochemistry, 16, 560-4.
HARTMANN, A. 2004. Postmortem studies in Parkinson's disease. Dialogues in Clinical Neuroscience, 6, 281-293.
HASEGAWA, T., MATSUZAKI, M., TAKEDA, A., KIKUCHI, A., FURUKAWA, K., SHIBAHARA, S. & ITOYAMA, Y. 2003. Increased dopamine and its metabolites in SH-SY5Y neuroblastoma cells that express tyrosinase. J Neurochem, 87, 470-5.
HAVERFIELD, E. V., WEATHERALL, D. J., GRABER, A. Y., RAMIREZ, J. & RATAIN, M. J. 2005. Pharmacogenomics of Deferiprone Metabolism. Blood, 106, 2703-2703.
HE, L. & LEMASTERS, J. J. 2002. Regulated and unregulated mitochondrial permeability transition pores: a new paradigm of pore structure and function? FEBS Lett, 512, 1-7.
HE, Y., LEE, T. & LEONG, S. K. 2000. 6-Hydroxydopamine induced apoptosis of dopaminergic cells in the rat substantia nigra. Brain Res, 858, 163-6.
HE, Y., THONG, P. S., LEE, T., LEONG, S. K., SHI, C. Y., WONG, P. T., YUAN, S. Y. & WATT, F. 1996. Increased iron in the substantia nigra of 6-OHDA induced parkinsonian rats: a nuclear microscopy study. Brain Res, 735, 149-53.
HEFTI, F., MELAMED, E., SAHAKIAN, B. J. & WURTMAN, R. J. 1980. Circling behavior in rats with partial, unilateral nigro-striatal lesions: effect of amphetamine, apomorphine, and DOPA. Pharmacol Biochem Behav, 12, 185-8.
HEMMINGSEN, C., STAUN, M. & OLGAARD, K. 1998. The effect of 1,25-vitamin D3 on calbindin-D and calcium-metabolic variables in the rat. Pharmacol Toxicol, 82, 118-21.
HENDRICKS, B. K., COHEN-GADOL, A. A. & MILLER, J. C. 2015. Novel delivery methods bypassing the blood-brain and blood-tumor barriers. Neurosurg Focus, 38, E10.
HENTER, J. I. & KARLEN, J. 2007. Fatal agranulocytosis after deferiprone therapy in a child with Diamond-Blackfan anemia. Blood, 109, 5157-9.
HERSHKO, C. 1978. Determinants of fecal and urinary iron excretion in desferrioxamine-treated rats. Blood, 51, 415-23.

REFERENCES
260
HERSHKO, C., KONIJN, A. M., NICK, H. P., BREUER, W., CABANTCHIK, Z. I. & LINK, G. 2001. ICL670A: a new synthetic oral chelator: evaluation in hypertransfused rats with selective radioiron probes of hepatocellular and reticuloendothelial iron stores and in iron-loaded rat heart cells in culture. Blood, 97, 1115.
HIDER, R. C. & LIU, Z. D. 2003. Emerging understanding of the advantage of small molecules such as hydroxypyridinones in the treatment of iron overload. Current Medicinal Chemistry, 10, 1051-1064.
HIDER, R. C., LIU, Z. D. & PIYAMONGKOL, S. 2000. The design and properties of 3-hydroxypyridin-4-one iron chelators with high pFe3 values. Transfusion Science, 23, 201-209.
HIDER, R. C., ROY, S., MA, Y. M., AND, X. L. K. & PRESTON, J. 2011a. The potential application of iron chelators for the treatment of neurodegenerative diseases. Metallomics, 3, 239-249.
HIDER, R. C., SINGH, S., PORTER, J. B. & HUEHNS, E. R. 1990. The Development of Hydroxypyridin-4-ones as Orally Active Iron Chelators. Annals of the New York Academy of Sciences, 612, 327-338.
HIDER, R., LIU, Z., YU, Y. & LI, Z. 2011a. Chiral 3-hydroxypyrid-4-one derivative, and synthesis and use thereof. China patent application EP20110862562.
HIRSCH, E. C. & HUNOT, S. 2009. Neuroinflammation in Parkinson's disease: a target for neuroprotection? Lancet Neurol, 8, 382-97.
HIRSCH, L., JETTE, N., FROLKIS, A., STEEVES, T. & PRINGSHEIM, T. 2016. The Incidence of Parkinson's Disease: A Systematic Review and Meta-Analysis. Neuroepidemiology, 46, 292-300.
HITCHCOCK, S. A. & PENNINGTON, L. D. 2006. Structure−Brain Exposure Relationships. Journal of Medicinal Chemistry, 49, 7559-7583.
HOFFBRAND, A. V., COHEN, A. & HERSHKO, C. 2003. Role of deferiprone in chelation therapy for transfusional iron overload. Blood, 102, 17-24.
HOFFBRAND, V. 2005. Deferiprone therapy for transfusional iron overload. Best Practice & Research Clinical Haematology, 18, 299-317.
HOKARI, M., WU, H. Q., SCHWARCZ, R. & SMITH, Q. R. 1996. Facilitated brain uptake of 4-chlorokynurenine and conversion to 7-chlorokynurenic acid. Neuroreport, 8, 15-8.
HOLCMAN, D. & YUSTE, R. 2015. The new nanophysiology: regulation of ionic flow in neuronal subcompartments. Nat Rev Neurosci, 16, 685-692.
HOOSAIN, F. G., CHOONARA, Y. E., TOMAR, L. K., KUMAR, P., TYAGI, C., DU TOIT, L. C. & PILLAY, V. 2015. Bypassing P-Glycoprotein Drug Efflux Mechanisms: Possible Applications in Pharmacoresistant Schizophrenia Therapy. BioMed Research International, 2015, 21.
HOPES, L., DEVOS, D., DELMAIRE, C., JISSENDI, P., ALAIN, D. & LUC, D. 2012. Volume and increased iron content in the basal ganglia and substantia nigra: Two potential early biomarkers of Parkinson's disease? Movement Disorders, 27, S239-S239.
HOPES, L., GROLEZ, G., MOREAU, C., LOPES, R., RYCKEWAERT, G., CARRIERE, N., AUGER, F., LALOUX, C., PETRAULT, M., DEVEDJIAN, J. C., BORDET, R., DEFEBVRE, L., JISSENDI, P., DELMAIRE, C. & DEVOS, D. 2016. Magnetic Resonance Imaging Features of the Nigrostriatal System: Biomarkers of Parkinson's Disease Stages? PLoS One, 11, e0147947.

REFERENCES
261
HOWITT, J., PUTZ, U., LACKOVIC, J., DOAN, A., DORSTYN, L., CHENG, H., YANG, B., CHAN-LING, T., SILKE, J., KUMAR, S. & TAN, S. S. 2009. Divalent metal transporter 1 (DMT1) regulation by Ndfip1 prevents metal
toxicity in human neurons. Proc Natl Acad Sci U S A, 106, 15489-94.
HU, Q. & WANG, G. 2016. Mitochondrial dysfunction in Parkinson's disease. 5, 14.
HUANG, J. & MAY, J. M. 2006. Ascorbic acid protects SH-SY5Y neuroblastoma cells from apoptosis and death induced by β-amyloid. Brain Research, 1097, 52-58.
HUDSON, J. L., VAN HORNE, C. G., STROMBERG, I., BROCK, S., CLAYTON, J., MASSERANO, J., HOFFER, B. J. & GERHARDT, G. A. 1993. Correlation of apomorphine- and amphetamine-induced turning with nigrostriatal dopamine content in unilateral 6-hydroxydopamine lesioned rats. Brain Res, 626, 167-74.
IANCU, R., MOHAPEL, P., BRUNDIN, P. & PAUL, G. 2005. Behavioral characterization of a unilateral 6-OHDA-lesion model of Parkinson's disease in mice. Behavioural Brain Research, 162, 1-10.
IDRO, R., GWER, S., WILLIAMS, T. N., OTIENO, T., UYOGA, S., FEGAN, G., KAGER, P. A., MAITLAND, K., KIRKHAM, F., NEVILLE, B. G. R. & NEWTON, C. R. J. 2010. Iron Deficiency and Acute Seizures: Results from Children Living in Rural Kenya and a Meta-Analysis. PLoS ONE, 5, e14001.
IKEBE, S.-I., TANAKA, M., OHNO, K., SATO, W., HATTORI, K., KONDO, T., MIZUNO, Y. & OZAWA, T. 1990. Increase of deleted mitochondrial DNA in the striatum in Parkinson's disease and senescence. Biochemical and Biophysical Research Communications, 170, 1044-1048.
IQBAL, M., OKAZAKI, Y. & OKADA, S. 2003. In vitro curcumin modulates ferric nitrilotriacetate (Fe-NTA) and hydrogen peroxide (H2O2)-induced peroxidation of microsomal membrane lipids and DNA damage. Teratog Carcinog Mutagen, Suppl 1, 151-60.
IRAVANI, M. M., KASHEFI, K., MANDER, P., ROSE, S. & JENNER, P. 2002. Involvement of inducible nitric oxide synthase in inflammation-induced dopaminergic neurodegeneration. Neuroscience, 110, 49-58.
IRAVANI, M. M., LEUNG, C. C., SADEGHIAN, M., HADDON, C. O., ROSE, S. & JENNER, P. 2005. The acute and the long-term effects of nigral lipopolysaccharide administration on dopaminergic dysfunction and glial cell activation. Eur J Neurosci, 22, 317-30.
ISMAIL, N., ISMAIL, M., FATHY, S. F., MUSA, S. N., IMAM, M. U., FOO, J. B. & IQBAL, S. 2012. Neuroprotective effects of germinated brown rice against hydrogen peroxide induced cell death in human SH-SY5Y cells. Int J Mol Sci, 13, 9692-708.
IZUMI, Y., SAWADA, H., SAKKA, N., YAMAMOTO, N., KUME, T., KATSUKI, H., SHIMOHAMA, S. & AKAIKE, A. 2005. p-Quinone mediates 6-hydroxydopamine-induced dopaminergic neuronal death and ferrous iron accelerates the conversion of p-quinone into melanin extracellularly. J Neurosci Res, 79, 849-60.
JACKSON-LEWIS, V. & PRZEDBORSKI, S. 2007. Protocol for the MPTP mouse model of Parkinson's disease. Nat. Protocols, 2, 141-151.
JAMESON, G. N. L., JAMESON, R. F. & LINERT, W. 2004. New insights into iron release from ferritin: direct observation of the neurotoxin 6-hydroxydopamine entering ferritin and reaching redox equilibrium with the iron core. Organic & Biomolecular Chemistry, 2, 2346-2351.
JAMUAR, S. S. & LAI, A. H. M. 2012. Safety and efficacy of iron chelation therapy with deferiprone in patients with transfusion-dependent thalassemia. Therapeutic Advances in Hematology, 3, 299-307.
JANKOVIC, J. 2008. Parkinson's disease: clinical features and diagnosis. J Neurol Neurosurg Psychiatry, 79, 368-76.

REFERENCES
262
JAY, T. M., DIENEL, G. A., CRUZ, N. F., MORI, K., NELSON, T. & SOKOLOFF, L. 1990. Metabolic stability of 3-O-methyl-D-glucose in brain and other tissues. J Neurochem, 55, 989-1000.
JEFFREY, P. & SUMMERFIELD, S. G. 2007. Challenges for blood-brain barrier (BBB) screening. Xenobiotica, 37, 1135-51.
JELLINGER, K. A. 2000. Cell death mechanisms in Parkinson's disease. J Neural Transm (Vienna), 107, 1-29.
JELLINGER, K., LINERT, L., KIENZL, E., HERLINGER, E. & YOUDIM, M. B. 1995. Chemical evidence for 6-hydroxydopamine to be an endogenous toxic factor in the pathogenesis of Parkinson's disease. J Neural Transm Suppl, 46, 297-314.
JENNER, P. & OLANOW, C. W. 1996. Oxidative stress and the pathogenesis of Parkinson's disease. Neurology, 47, S161-70.
JENSEN, F. B. 2004. Red blood cell pH, the Bohr effect, and other oxygenation-linked phenomena in blood O2 and CO2 transport. Acta Physiol Scand, 182, 215-27.
JEON, B. S., JACKSON-LEWIS, V. & BURKE, R. E. 1995. 6-Hydroxydopamine lesion of the rat substantia nigra: time course and morphology of cell death. Neurodegeneration, 4, 131-7.
JIA, W., XU, H., DU, X., JIANG, H. & XIE, J. 2015. Ndfip1 attenuated 6-OHDA-induced iron accumulation via regulating the degradation of DMT1. Neurobiol Aging, 36, 1183-93.
JIANG, H., SONG, N., XU, H., ZHANG, S., WANG, J. & XIE, J. 2010. Up-regulation of divalent metal transporter 1 in 6-hydroxydopamine intoxication is IRE/IRP dependent. Cell Res, 20, 345-356.
JONG, A. & HUANG, S. H. 2005. Blood-brain barrier drug discovery for central nervous system infections. Curr Drug Targets Infect Disord, 5, 65-72.
KADIAN, N., RAJU, K. S., RASHID, M., MALIK, M. Y., TANEJA, I. & WAHAJUDDIN, M. 2016. Comparative assessment of bioanalytical method validation guidelines for pharmaceutical industry. J Pharm Biomed Anal, 126, 83-97.
KAGEYAMA, T., NAKAMURA, M., MATSUO, A., YAMASAKI, Y., TAKAKURA, Y., HASHIDA, M., KANAI, Y., NAITO, M., TSURUO, T., MINATO, N. & SHIMOHAMA, S. 2000. The 4F2hc/LAT1 complex transports L-DOPA across the blood-brain barrier. Brain Research, 879, 115-121.
KAKHLON, O. & CABANTCHIK, Z. I. 2002. The labile iron pool: characterization, measurement, and participation in cellular processes(1). Free Radic Biol Med, 33, 1037-46.
KARASOVA, J. Z., POHANKA, M., MUSILEK, K., ZEMEK, F. & KUCA, K. 2010. Passive diffusion of acetylcholinesterase oxime reactivators through the blood–brain barrier: Influence of molecular structure. Toxicology in Vitro, 24, 1838-1844.
KAUR, D., YANTIRI, F., RAJAGOPALAN, S., KUMAR, J., MO, J. Q., BOONPLUEANG, R., VISWANATH, V., JACOBS, R., YANG, L., BEAL, M. F., DIMONTE, D., VOLITASKIS, I., ELLERBY, L., CHERNY, R. A., BUSH, A. I. & ANDERSEN, J. K. 2003. Genetic or pharmacological iron chelation prevents MPTP-induced neurotoxicity in vivo: a novel therapy for Parkinson's disease. Neuron, 37, 899-909.
KEANE, P. C., KURZAWA, M., BLAIN, P. G. & MORRIS, C. M. 2011. Mitochondrial Dysfunction in Parkinson's Disease. Parkinson's Disease, 2011.
KILARSKI, L. L., PEARSON, J. P., NEWSWAY, V., MAJOUNIE, E., KNIPE, M. D., MISBAHUDDIN, A., CHINNERY, P. F., BURN, D. J., CLARKE, C. E., MARION, M. H., LEWTHWAITE, A. J., NICHOLL, D. J., WOOD, N. W., MORRISON, K. E., WILLIAMS-GRAY, C. H., EVANS, J. R., SAWCER, S. J., BARKER, R. A.,

REFERENCES
263
WICKREMARATCHI, M. M., BEN-SHLOMO, Y., WILLIAMS, N. M. & MORRIS, H. R. 2012. Systematic review and UK-based study of PARK2 (parkin), PINK1, PARK7 (DJ-1) and LRRK2 in early-onset Parkinson's disease. Mov Disord, 27, 1522-9.
KILLIAN, D. M. & CHIKHALE, P. J. 2001. A bioreversible prodrug approach designed to shift mechanism of brain uptake for amino-acid-containing anticancer agents. J Neurochem, 76, 966-74.
KILLIAN, D. M., HERMELING, S. & CHIKHALE, P. J. 2007. Targeting the cerebrovascular large neutral amino acid transporter (LAT1) isoform using a novel disulfide-based brain drug delivery system. Drug Deliv, 14, 25-31.
KIM, N. R., PARK, S. W., LEE, J. G. & KIM, Y. H. 2008. Protective effects of olanzapine and haloperidol on serum withdrawal-induced apoptosis in SH-SY5Y cells. Prog Neuropsychopharmacol Biol Psychiatry, 32, 633-42.
KIM, R. H., SMITH, P. D., ALEYASIN, H., HAYLEY, S., MOUNT, M. P., POWNALL, S., WAKEHAM, A., YOU-TEN, A. J., KALIA, S. K., HORNE, P., WESTAWAY, D., LOZANO, A. M., ANISMAN, H., PARK, D. S. & MAK, T. W. 2005. Hypersensitivity of DJ-1-deficient mice to 1-methyl-4-phenyl-1,2,3,6-tetrahydropyrindine (MPTP) and oxidative stress. Proc Natl Acad Sci U S A, 102, 5215-20.
KIM, W. S., KÅGEDAL, K. & HALLIDAY, G. M. 2014. Alpha-synuclein biology in Lewy body diseases. Alzheimer's Research & Therapy, 6, 73-73.
KIRIK, D., ROSENBLAD, C. & BJORKLUND, A. 1998. Characterization of behavioral and neurodegenerative changes following partial lesions of the nigrostriatal dopamine system induced by intrastriatal 6-hydroxydopamine in the rat. Exp Neurol, 152, 259-77.
KITADA, T., PISANI, A., PORTER, D. R., YAMAGUCHI, H., TSCHERTER, A., MARTELLA, G., BONSI, P., ZHANG, C., POTHOS, E. N. & SHEN, J. 2007. Impaired dopamine release and synaptic plasticity in the striatum of PINK1-deficient mice. Proc Natl Acad Sci U S A, 104, 11441-6.
KLEIN, C. & WESTENBERGER, A. 2012. Genetics of Parkinson’s Disease. Cold Spring Harbor Perspectives in Medicine, 2, a008888.
KNOTT, C., STERN, G. & WILKIN, G. P. 2000. Inflammatory regulators in Parkinson's disease: iNOS, lipocortin-1, and cyclooxygenases-1 and -2. Mol Cell Neurosci, 16, 724-39.
KOBAYASHI, H., OIKAWA, S., UMEMURA, S., HIROSAWA, I. & KAWANISHI, S. 2008. Mechanism of metal-mediated DNA damage and apoptosis induced by 6-hydroxydopamine in neuroblastoma SH-SY5Y cells. Free Radic Res, 42, 651-60.
KONG, X., ZHOU, T., NEUBERT, H., LIU, Z. & HIDER, R. C. 2006. 3-Hydroxy-2-(5-hydroxypentyl)-4H-chromen-4-one: a bidentate or tridentate iron(III) ligand? J Med Chem, 49, 3028-31.
KONTOGHIORGHES, G. 1991. In vivo testing of oral iron chelators intended for clinical use. Blood, 78, 535-7.
KONTOGHIORGHES, G. J. 1995. Comparative efficacy and toxicity of desferrioxamine, deferiprone and other iron and aluminium chelating drugs. Toxicology Letters, 80, 1-18.
KONTOGHIORGHES, G. J., BARR, J., NORTEY, P. & SHEPPARD, L. 1993. Selection of a new generation of orally active alpha-ketohydroxypyridine iron chelators intended for use in the treatment of iron overload. Am J Hematol, 42, 340-9.
KORDOWER, J. H., KANAAN, N. M., CHU, Y., SURESH BABU, R., STANSELL, J., TERPSTRA, B. T., SORTWELL, C. E., STEECE-COLLIER, K. & COLLIER, T. J. 2006. Failure of proteasome inhibitor administration to provide a model of Parkinson's disease in rats and monkeys. Annals of Neurology, 60, 264-268.

REFERENCES
264
KOSTRZEWA, R. M. & JACOBOWITZ, D. M. 1974. Pharmacological Actions of 6-Hydroxydopamine. Pharmacological Reviews, 26, 199.
KOVALEVICH, J. & LANGFORD, D. 2013a. Considerations for the use of SH-SY5Y neuroblastoma cells in neurobiology. Methods Mol Biol, 1078, 9-21.
KRESS, G. J. & MENNERICK, S. 2009. Action potential initiation and propagation: upstream influences on neurotransmission. Neuroscience, 158, 211-222.
KRUSZEWSKI, M. 2003. Labile iron pool: the main determinant of cellular response to oxidative stress. Mutat Res, 531, 81-92.
KUDIN, A. P., BIMPONG-BUTA, N. Y., VIELHABER, S., ELGER, C. E. & KUNZ, W. S. 2004. Characterization of superoxide-producing sites in isolated brain mitochondria. J Biol Chem, 279, 4127-35.
KWIATKOWSKI, A., RYCKEWAERT, G., JISSENDI TCHOFO, P., MOREAU, C., VUILLAUME, I., CHINNERY, P. F., DESTEE, A., DEFEBVRE, L. & DEVOS, D. 2012. Long-term improvement under deferiprone in a case of neurodegeneration with brain iron accumulation. Parkinsonism Relat Disord, 18, 110-2.
LANGAN, T. J. & CHOU, R. C. 2011. Synchronization of mammalian cell cultures by serum deprivation. Methods Mol Biol, 761, 75-83.
LEAVER, K. R., ALLBUTT, H. N., CREBER, N. J., KASSIOU, M. & HENDERSON, J. M. 2009. Oral pre-treatment with epigallocatechin gallate in 6-OHDA lesioned rats produces subtle symptomatic relief but not neuroprotection. Brain Research Bulletin, 80, 397-402.
LEE, C. S., SAUER, H. & BJORKLUND, A. 1996. Dopaminergic neuronal degeneration and motor impairments following axon terminal lesion by instrastriatal 6-hydroxydopamine in the rat. Neuroscience, 72, 641-53.
LEE, G., DALLAS, S., HONG, M. & BENDAYAN, R. 2001. Drug transporters in the central nervous system: brain barriers and brain parenchyma considerations. Pharmacol Rev, 53, 569-96.
LEHMENSIEK, V., TAN, E. M., LIEBAU, S., LENK, T., ZETTLMEISL, H., SCHWARZ, J. & STORCH, A. 2006. Dopamine transporter-mediated cytotoxicity of 6-hydroxydopamine in vitro depends on expression of mutant alpha-synucleins related to Parkinson's disease. Neurochem Int, 48, 329-40.
LEPPENS-LUISIER, G., URNER, F. & SAKKAS, D. 2001. Facilitated glucose transporters play a crucial role throughout mouse preimplantation embryo development. Human Reproduction, 16, 1229-1236.
LEVENSON, C. W., CUTLER, R. G., LADENHEIM, B., CADET, J. L., HARE, J. & MATTSON, M. P. 2004. Role of dietary iron restriction in a mouse model of Parkinson's disease. Experimental Neurology, 190, 506-514.
LEVI, S. & ROVIDA, E. 2015. Neuroferritinopathy: From ferritin structure modification to pathogenetic mechanism. Neurobiology of Disease, 81, 134-143.
LEVITES, Y., WEINREB, O., MAOR, G., YOUDIM, M. B. & MANDEL, S. 2001. Green tea polyphenol (-)-epigallocatechin-3-gallate prevents N-methyl-4-phenyl-1,2,3,6-tetrahydropyridine-induced dopaminergic neurodegeneration. J Neurochem, 78, 1073-82.
LI, J., LU, Z., KONG, X., MA, Y., ZHANG, X., BANSAL, S. S., ABBATE, V. & HIDER, R. C. 2015. Design and synthesis of novel pegylated iron chelators with decreased metabolic rate. Future Med Chem, 7, 2439-49.
LI, N., RAGHEB, K., LAWLER, G., STURGIS, J., RAJWA, B., MELENDEZ, J. A. & ROBINSON, J. P. 2003. Mitochondrial complex I inhibitor rotenone induces apoptosis through enhancing mitochondrial reactive oxygen species production. J Biol Chem, 278, 8516-25.

REFERENCES
265
LI, X. P., XIE, W. J., ZHANG, Z., KANSARA, S., JANKOVIC, J. & LE, W. D. 2012. A mechanistic study of proteasome inhibition-induced iron misregulation in dopamine neuron degeneration. Neurosignals, 20, 223-36.
LI, Y., PAN, K., CHEN, L., NING, J.-L., LI, X., YANG, T., TERRANDO, N., GU, J. & TAO, G. 2016. Deferoxamine regulates neuroinflammation and iron homeostasis in a mouse model of postoperative cognitive dysfunction. Journal of Neuroinflammation, 13, 268.
LIDDELOW, S. A. 2011. Fluids and barriers of the CNS: a historical viewpoint. Fluids and Barriers of the CNS, 8, 2-2.
LIDDELOW, S. A. 2015. Development of the choroid plexus and blood-CSF barrier. Front Neurosci, 9, 32.
LIMENTA, L. M. G., JIRASOMPRASERT, T., TANKANITLERT, J., SVASTI, S., WILAIRAT, P., CHANTHARAKSRI, U., FUCHAROEN, S. & MORALES, N. P. 2008. UGT1A6 genotype-related pharmacokinetics of deferiprone (L1) in healthy volunteers. British Journal of Clinical Pharmacology, 65, 908-916.
LIN, M. K. & FARRER, M. J. 2014. Genetics and genomics of Parkinson’s disease. Genome Medicine, 6, 48.
LIPINSKI, C. A., LOMBARDO, F., DOMINY, B. W. & FEENEY, P. J. 2001. Experimental and computational approaches to estimate solubility and permeability in drug discovery and development settings. Adv Drug Deliv Rev, 46, 3-26.
LIU, M. & BING, G. 2011. Lipopolysaccharide Animal Models for Parkinson's Disease. Parkinson's Disease, 2011, 327089.
LIU, X. & CHEN, C. 2015. Free Drug Hypothesis for CNS Drug Candidates. Blood-Brain Barrier in Drug Discovery. John Wiley & Sons, Inc.
LIU, X., TESTA, B. & FAHR, A. 2011. Lipophilicity and its relationship with passive drug permeation. Pharm Res, 28, 962-77.
LIU, X., TU, M., KELLY, R. S., CHEN, C. & SMITH, B. J. 2004. Development of a computational approach to predict blood-brain barrier permeability. Drug Metab Dispos, 32, 132-9.
LOCKMAN, P. R., KOZIARA, J., RODER, K. E., PAULSON, J., ABBRUSCATO, T. J., MUMPER, R. J. & ALLEN, D. D. 2003. In vivo and in vitro assessment of baseline blood-brain barrier parameters in the presence of novel nanoparticles. Pharm Res, 20, 705-13.
LOHLE, M. & REICHMANN, H. 2010. Clinical neuroprotection in Parkinson's disease - still waiting for the breakthrough. J Neurol Sci, 289, 104-14.
LONG-SMITH, C. M., SULLIVAN, A. M. & NOLAN, Y. M. 2009. The influence of microglia on the pathogenesis of Parkinson's disease. Prog Neurobiol, 89, 277-87.
LOPES, U. G., ERHARDT, P., YAO, R. & COOPER, G. M. 1997. p53-dependent induction of apoptosis by proteasome inhibitors. J Biol Chem, 272, 12893-6.
LORYAN, I. & HAMMARLUND-UDENAES, M. 2014. Drug Discovery Methods for Studying Brain Drug Delivery and Distribution. In: HAMMARLUND-UDENAES, M., DE LANGE, E. C. M. & THORNE, R. G. (eds.) Drug Delivery to the Brain: Physiological Concepts, Methodologies and Approaches. New York, NY: Springer New York.
LORYAN, I., MELANDER, E., SVENSSON, M., PAYAN, M., KONIG, F., JANSSON, B. & HAMMARLUND-UDENAES, M. 2016. In-depth neuropharmacokinetic analysis of antipsychotics based on a novel approach to estimate unbound target-site concentration in CNS regions: link to spatial receptor occupancy. Mol Psychiatry, 21, 1527-1536.

REFERENCES
266
LÖSCHER, W. & POTSCHKA, H. 2005. Blood-Brain Barrier Active Efflux Transporters: ATP-Binding Cassette Gene Family. NeuroRx, 2, 86-98.
LOSCHER, W. & POTSCHKA, H. 2005. Role of drug efflux transporters in the brain for drug disposition and treatment of brain diseases. Prog Neurobiol, 76, 22-76.
LOTHARIUS, J. & BRUNDIN, P. 2002. Pathogenesis of parkinson's disease: dopamine, vesicles and [alpha]-synuclein. Nat Rev Neurosci, 3, 932-942.
LOTHARIUS, J., DUGAN, L. L. & O'MALLEY, K. L. 1999. Distinct mechanisms underlie neurotoxin-mediated cell death in cultured dopaminergic neurons. J Neurosci, 19, 1284-93.
LU, X., KIM-HAN, J. S., HARMON, S., SAKIYAMA-ELBERT, S. E. & O'MALLEY, K. L. 2014. The Parkinsonian mimetic, 6-OHDA, impairs axonal transport in dopaminergic axons. Molecular Neurodegeneration, 9, 17.
LU, X.-H., FLEMING, S. M., MEURERS, B., ACKERSON, L. C., MORTAZAVI, F., LO, V., HERNANDEZ, D., SULZER, D., JACKSON, G. R., MAIDMENT, N. T., CHESSELET, M.-F. & YANG, X. W. 2009. Bacterial Artificial Chromosome Transgenic Mice Expressing a Truncated Mutant Parkin Exhibit Age-Dependent Hypokinetic Motor Deficits, Dopaminergic Neuron Degeneration, and Accumulation of Proteinase K-Resistant α-Synuclein. The Journal of Neuroscience, 29, 1962-1976.
LU, Z. 2016. Investigation of The Efficacy of Some Hydroxypyridinone Iron Chelators. Doctor of Philosophy, King's College London.
LUISSINT, A.-C., ARTUS, C., GLACIAL, F., GANESHAMOORTHY, K. & COURAUD, P.-O. 2012. Tight junctions at the blood brain barrier: physiological architecture and disease-associated dysregulation. Fluids and Barriers of the CNS, 9, 23-23.
MACKLER, B., PERSON, R., MILLER, L. R. & FINCH, C. A. 1979. Iron deficiency in the rat: effects on phenylalanine metabolism. Pediatr Res, 13, 1010-1.
MACKLER, B., PERSON, R., MILLER, L. R., INAMDAR, A. R. & FINCH, C. A. 1978. Iron deficiency in the rat:
biochemical studies of brain metabolism. Pediatr Res, 12, 217-20.
MAKIS, A., CHALIASOS, N., ALFANTAKI, S., KARAGOUNI, P. & SIAMOPOULOU, A. 2013. Chelation therapy with oral solution of deferiprone in transfusional iron-overloaded children with hemoglobinopathies. Anemia, 2013, 121762.
MANDEL, S., GRUNBLATT, E. & YOUDIM, M. 2000. cDNA microarray to study gene expression of dopaminergic neurodegeneration and neuroprotection in MPTP and 6-hydroxydopamine models: implications for idiopathic Parkinson's disease. J Neural Transm Suppl, 117-24.
MANDEL, S., MAOR, G. & YOUDIM, M. B. 2004. Iron and alpha-synuclein in the substantia nigra of MPTP-treated mice: effect of neuroprotective drugs R-apomorphine and green tea polyphenol (-)-epigallocatechin-3-gallate. J Mol Neurosci, 24, 401-16.
MARELLA, M., SEO, B. B., YAGI, T. & MATSUNO-YAGI, A. 2009. Parkinson’s disease and mitochondrial complex I: a perspective on the Ndi1 therapy. Journal of bioenergetics and biomembranes, 41, 493-497.
MARIANI, E., POLIDORI, M. C., CHERUBINI, A. & MECOCCI, P. 2005. Oxidative stress in brain aging, neurodegenerative and vascular diseases: an overview. J Chromatogr B Analyt Technol Biomed Life Sci, 827.
MARILYN J. CIPOLLA 2009. The Cerebral Circulation, San Rafael (CA), Morgan & Claypool Life Sciences.

REFERENCES
267
MARINHO, H. S., REAL, C., CYRNE, L., SOARES, H. & ANTUNES, F. 2014. Hydrogen peroxide sensing, signaling and regulation of transcription factors. Redox Biology, 2, 535-562.
MARINOVA-MUTAFCHIEVA, L., SADEGHIAN, M., BROOM, L., DAVIS, J. B., MEDHURST, A. D. & DEXTER, D. T. 2009. Relationship between microglial activation and dopaminergic neuronal loss in the substantia nigra: a time course study in a 6-hydroxydopamine model of Parkinson's disease. J Neurochem, 110, 966-75.
MARTI, M. J., SAURA, J., BURKE, R. E., JACKSON-LEWIS, V., JIMENEZ, A., BONASTRE, M. & TOLOSA, E. 2002. Striatal 6-hydroxydopamine induces apoptosis of nigral neurons in the adult rat. Brain Res, 958, 185-91.
MARTIN-BASTIDA, A., WARD, R. J., NEWBOULD, R., PICCINI, P., SHARP, D., KABBA, C., PATEL, M. C., SPINO, M., CONNELLY, J., TRICTA, F., CRICHTON, R. R. & DEXTER, D. T. 2017. Brain iron chelation by deferiprone in a phase 2 randomised double-blinded placebo controlled clinical trial in Parkinson's disease. 7, 1398.
MAURER, T. S., DEBARTOLO, D. B., TESS, D. A. & SCOTT, D. O. 2004. RELATIONSHIP BETWEEN EXPOSURE AND NONSPECIFIC BINDING OF THIRTY-THREE CENTRAL NERVOUS SYSTEM DRUGS IN MICE. Drug Metabolism and Disposition, 33, 175.
MAYER, F., MAYER, N., CHINN, L., PINSONNEAULT, R. L., KROETZ, D. & BAINTON, R. J. 2009. Evolutionary conservation of vertebrate blood-brain barrier chemoprotective mechanisms in Drosophila. The Journal of neuroscience : the official journal of the Society for Neuroscience, 29, 3538-3550.
MCNAUGHT, K. S. & JENNER, P. 2000. Dysfunction of rat forebrain astrocytes in culture alters cytokine and neurotrophic factor release. Neurosci Lett, 285, 61-5.
MCNAUGHT, K. S., BELIZAIRE, R., ISACSON, O., JENNER, P. & OLANOW, C. W. 2003. Altered proteasomal function in sporadic Parkinson's disease. Exp Neurol, 179, 38-46.
MCNAUGHT, K. S., MYTILINEOU, C., JNOBAPTISTE, R., YABUT, J., SHASHIDHARAN, P., JENNERT, P. & OLANOW, C. W. 2002. Impairment of the ubiquitin-proteasome system causes dopaminergic cell death and inclusion body formation in ventral mesencephalic cultures. J Neurochem, 81, 301-6.
MCNAUGHT, K. S., PERL, D. P., BROWNELL, A. L. & OLANOW, C. W. 2004. Systemic exposure to proteasome inhibitors causes a progressive model of Parkinson's disease. Ann Neurol, 56, 149-62.
MCNAUGHT, K. S., SHASHIDHARAN, P., PERL, D. P., JENNER, P. & OLANOW, C. W. 2002b. Aggresome-related biogenesis of Lewy bodies. Eur J Neurosci, 16, 2136-48.
MEISER, J., WEINDL, D. & HILLER, K. 2013. Complexity of dopamine metabolism. Cell Communication and Signaling : CCS, 11, 34-34.
MENSCH, J., OYARZABAL, J., MACKIE, C. & AUGUSTIJNS, P. 2009. In Vivo, In Vitro and In Silico Methods for Small Molecule Transfer Across the BBB. Journal of Pharmaceutical Sciences, 98, 4429-4468.
MEREISH, K. A., ROSENBERG, H. & COBBY, J. 1982. Glucosylated albumin and its influence on salicylate binding. J Pharm Sci, 71, 235-8.
MERGENTHALER, P., LINDAUER, U., DIENEL, G. A. & MEISEL, A. 2013. Sugar for the brain: the role of glucose in physiological and pathological brain function. Trends in neurosciences, 36, 587-597.
MIKITSH, J. L. & CHACKO, A.-M. 2014. Pathways for Small Molecule Delivery to the Central Nervous System Across the Blood-Brain Barrier. Perspectives in Medicinal Chemistry, 6, 11-24.
MILLS, E., DONG, X.-P., WANG, F. & XU, H. 2010. Mechanisms of Brain Iron Transport: Insight into Neurodegeneration and CNS Disorders. Future medicinal chemistry, 2, 51-51.

REFERENCES
268
MISRA, A., GANESH, S., SHAHIWALA, A. & SHAH, S. P. 2003. Drug delivery to the central nervous system: a review. J Pharm Pharm Sci, 6, 252-73.
MIYAZAKI, I., ASANUMA, M., HOZUMI, H., MIYOSHI, K. & SOGAWA, N. 2007. Protective effects of metallothionein against dopamine quinone-induced dopaminergic neurotoxicity. FEBS Letters, 581, 5003-5008.
MIZUNO, Y., OHTA, S., TANAKA, M., TAKAMIYA, S., SUZUKI, K., SATO, T., OYA, H., OZAWA, T. & KAGAWA, Y. 1989. Deficiencies in complex I subunits of the respiratory chain in Parkinson's disease. Biochem Biophys Res Commun, 163, 1450-5.
MOCHIZUKI, H. & YASUDA, T. 2012. Iron accumulation in Parkinson's disease. J Neural Transm (Vienna), 119, 1511-4.
MOHAN, A., JOSEPH, S., SIDHARTHAN, N. & MURALI, D. 2015. Carbimazole-induced agranulocytosis. Journal of Pharmacology & Pharmacotherapeutics, 6, 228-230.
MOLENDA, J. J., JONES, M. M., JOHNSTON, D. S., WALKER, E. M., JR. & CANNON, D. J. 1994. Mobilization of iron by chiral and achiral anionic 3-hydroxypyrid-4-ones. J Med Chem, 37, 4363-70.
MOLINA-HOLGADO, F., GAETA, A., FRANCIS, P. T., WILLIAMS, R. J. & HIDER, R. C. 2008. Neuroprotective actions of deferiprone in cultured cortical neurones and SHSY-5Y cells. Journal of Neurochemistry, 105, 2466-2476.
MOLINO, Y., JABES, F., LACASSAGNE, E., GAUDIN, N. & KHRESTCHATISKY, M. 2014. Setting-up an In Vitro Model of Rat Blood-brain Barrier (BBB): A Focus on BBB Impermeability and Receptor-mediated Transport. Jove-Journal of Visualized Experiments.
MOON, S. H., KIM, S. E., SON, J. Y., JUNG, I. S., KIM, S. J., KIM, J. S., MOON, B. S., LEE, J. J., LEE, B. C. & KIM, Y. K. 2010. Time course of striatal dopamine transporter loss in striatal 6-hydroxydopamine rat model of Parkinson’s disease: A study with [123I]beta-CIT and small animal SPECT. Journal of Nuclear Medicine, 51, 1758.
MOOS, T. & MORGAN, E. H. 2001. Restricted transport of anti-transferrin receptor antibody (OX26) through the blood-brain barrier in the rat. Journal of Neurochemistry, 79, 119-129.
MORGAN, D. M. L. 1998. Tetrazolium (MTT) Assay for Cellular Viability and Activity. In: MORGAN, D. M. L. (ed.) Polyamine Protocols. Totowa, NJ: Humana Press.
MOTAIS, R., FIEVET, B., GARCIA-ROMEU, F. & THOMAS, S. 1989. Na+-H+ exchange and pH regulation in red blood cells: role of uncatalyzed H2CO3 dehydration. Am J Physiol, 256, C728-35.
MOUNSEY, R. B. & TEISMANN, P. 2012. Chelators in the treatment of iron accumulation in Parkinson's disease. Int J Cell Biol, 2012, 983245.
MOUROT-COTTET, R., MALOISEL, F., SÉVERAC, F., KELLER, O., VOGEL, T., TEBACHER, M., WEBER, J.-C., KALTENBACH, G., GOTTENBERG, J.-E., GOICHOT, B., SIBILIA, J., KORGANOW, A.-S., HERBRECHT, R. & ANDRÈS, E. 2016. Idiosyncratic Drug-Induced Severe Neutropenia and Agranulocytosis in Elderly Patients (≥75 years): A Monocentric Cohort Study of 61 Cases. Drugs - Real World Outcomes, 3, 393-399.
MUECKLER, M. & MAKEPEACE, C. (2009) Model of the exofacial substrate-binding site and helical folding of the human glut1 glucose transporter based on scanning mutagenesis. Biochemistry, 48, 5934-5942.
MUECKLER, M. & THORENS, B. 2013. The SLC2 (GLUT) family of membrane transporters. Mol Aspects Med, 34, 121-38.

REFERENCES
269
MUNOZ, Y., CARRASCO, C. M., CAMPOS, J. D., AGUIRRE, P. & NUNEZ, M. T. 2016. Parkinson's Disease: The Mitochondria-Iron Link. Parkinsons Dis, 2016, 7049108.
MURAKAMI, H., TAKANAGA, H., MATSUO, H., OHTANI, H. & SAWADA, Y. 2000. Comparison of blood-brain barrier permeability in mice and rats using in situ brain perfusion technique. Am J Physiol Heart Circ Physiol, 279, H1022-8.
NAGATSU, T., MOGI, M., ICHINOSE, H. & TOGARI, A. 2000. Cytokines in Parkinson's disease. J Neural Transm Suppl, 143-51.
NAIR, V. D., MCNAUGHT, K. S., GONZALEZ-MAESO, J., SEALFON, S. C. & OLANOW, C. W. 2006. p53 mediates nontranscriptional cell death in dopaminergic cells in response to proteasome inhibition. J Biol Chem, 281, 39550-60.
NAKASO, K., YOSHIMOTO, Y., YANO, H., TAKESHIMA, T. & NAKASHIMA, K. 2004. p53-mediated mitochondrial dysfunction by proteasome inhibition in dopaminergic SH-SY5Y cells. Neurosci Lett, 354, 213-6.
NAPOLITANO, A., CRESCENZI, O., PEZZELLA, A. & PROTA, G. 1995. Generation of the neurotoxin 6-hydroxydopamine by peroxidase/H2O2 oxidation of dopamine. J Med Chem, 38, 917-22.
NAVNTOFT, C. A. & DREYER, J. K. 2016. How compensation breaks down in Parkinson's disease: Insights from modeling of denervated striatum. Movement Disorders, 31, 280-289.
NGUYEN, L. A., HE, H. & PHAM-HUY, C. 2006. Chiral drugs: an overview. Int J Biomed Sci, 2, 85-100.
NI, Z., BIKADI, Z., ROSENBERG, M. F. & MAO, Q. 2010. Structure and Function of the Human Breast Cancer Resistance Protein (BCRP/ABCG2). Current drug metabolism, 11, 603-617.
NIKOLETOPOULOU, V., MARKAKI, M., PALIKARAS, K. & TAVERNARAKIS, N. 2013. Crosstalk between apoptosis, necrosis and autophagy. Biochimica et Biophysica Acta (BBA) - Molecular Cell Research, 1833, 3448-3459.
NOVAKOVIC, J., TESORO, A., THIESSEN, J. J. & SPINO, M. 2004. Metabolic and pharmacokinetic evaluation of a novel 3-hydroxypyridinone iron chelator, CP502, in the rat. Eur J Drug Metab Pharmacokinet, 29, 221-4.
OFFEN, D., ZIV, I., PANET, H., WASSERMAN, L., STEIN, R., MELAMED, E. & BARZILAI, A. 1997. Dopamine-induced apoptosis is inhibited in PC12 cells expressing Bcl-2. Cell Mol Neurobiol, 17, 289-304.
OJELABI, O. & CARRUTHERS, A. 2015. Acute Stimulation of GLUT1 Cell Surface Localization in Blood-Brain Barrier Endothelial Cells. Faseb Journal, 29.
OKURA, T., ITO, R., ISHIGURO, N., TAMAI, I. & DEGUCHI, Y. 2007. Blood-brain barrier transport of pramipexole, a dopamine D2 agonist. Life Sci, 80, 1564-71.
OLANOW, C. W. & PRUSINER, S. B. 2009b. Is Parkinson’s disease a prion disorder? Proc Natl Acad Sci U S A, 106.
OLANOW, C. W., PERL, D. P., DEMARTINO, G. N. & MCNAUGHT, K. S. 2004. Lewy-body formation is an aggresome-related process: a hypothesis. Lancet Neurol, 3, 496-503.
OLANOW, C. W., STERN, M. B. & SETHI, K. 2009a. The scientific and clinical basis for the treatment of Parkinson disease (2009). Neurology, 72, S1-136.
OLDS, M. E., JACQUES, D. B. & KOPYOV, O. 2006. Relation between rotation in the 6-OHDA lesioned rat and dopamine loss in striatal and substantia nigra subregions. Synapse, 59, 532-44.

REFERENCES
270
OLIVIERI, N. F., BRITTENHAM, G. M., MCLAREN, C. E., TEMPLETON, D. M., CAMERON, R. G., MCCLELLAND, R. A., BURT, A. D. & FLEMING, K. A. 1998. Long-term safety and effectiveness of iron-chelation therapy with deferiprone for thalassemia major. N Engl J Med, 339, 417-23.
PAIBOONSUKWONG, K., HIDER, R. C. & YU, Y. 2016. An open-label, single center and single dose study to assess safety tolerability and pharmacokinetics of CN128 in healthy volunteers. In: CENTER, T. R. (ed.). Thailand.
PAJOUHESH, H. & LENZ, G. R. 2005. Medicinal Chemical Properties of Successful Central Nervous System Drugs. NeuroRx, 2, 541-553.
PALACINO, J. J., SAGI, D., GOLDBERG, M. S., KRAUSS, S., MOTZ, C., WACKER, M., KLOSE, J. & SHEN, J. 2004. Mitochondrial dysfunction and oxidative damage in parkin-deficient mice. J Biol Chem, 279, 18614-22.
PÅLSSON-MCDERMOTT, E. M. & O'NEILL, L. A. J. 2004. Signal transduction by the lipopolysaccharide receptor, Toll-like receptor-4. Immunology, 113, 153-162.
PAN, G., GIRI, N. & ELMQUIST, W. F. 2007. Abcg2/Bcrp1 Mediates the Polarized Transport of Antiretroviral Nucleosides Abacavir and Zidovudine. Drug Metabolism and Disposition, 35, 1165-1173.
PAN, M. H., GHAI, G. & HO, C. T. 2008. Food bioactives apoptosis, and cancer. Mol Nutr Food Res, 52.
PAN, Y., SCANLON, M. J., OWADA, Y., YAMAMOTO, Y., PORTER, C. J. & NICOLAZZO, J. A. 2015. Fatty Acid-Binding Protein 5 Facilitates the Blood-Brain Barrier Transport of Docosahexaenoic Acid. Mol Pharm, 12, 4375-85.
PAN, Y.-H., SADER, K., POWELL, J. J., BLELOCH, A., GASS, M., TRINICK, J., WARLEY, A., LI, A., BRYDSON, R. & BROWN, A. 2009. 3D morphology of the human hepatic ferritin mineral core: New evidence for a subunit structure revealed by single particle analysis of HAADF-STEM images. Journal of Structural Biology, 166, 22-31.
PANG, K. S. 2003. Modeling of intestinal drug absorption: roles of transporters and metabolic enzymes (for the Gillette Review Series). Drug Metab Dispos, 31, 1507-19.
PANKRATZ, N. & FOROUD, T. 2007. Genetics of Parkinson disease. Genet Med, 9, 801-811.
PANOPOULOS, A., HARRAZ, M., ENGELHARDT, J. F. & ZANDI, E. 2005. Iron-mediated H2O2 production as a mechanism for cell type-specific inhibition of tumor necrosis factor alpha-induced but not interleukin-1beta-induced IkappaB kinase complex/nuclear factor-kappaB activation. J Biol Chem, 280, 2912-23.
PAPADEMETRIOU, I. T. & PORTER, T. 2015. Promising approaches to circumvent the blood-brain barrier: progress, pitfalls and clinical prospects in brain cancer. Therapeutic delivery, 6, 989-1016.
PARDRIDGE, W. M. 1983. Brain metabolism: a perspective from the blood-brain barrier. Physiol Rev, 63, 1481-535.
PARDRIDGE, W. M. 2002a. Drug and Gene Delivery to the Brain. Neuron, 36, 555-558.
PARDRIDGE, W. M. 2002b. Drug and gene targeting to the brain with molecular Trojan horses. Nat Rev Drug Discov, 1, 131-9.
PARDRIDGE, W. M. 2003. Blood-brain barrier drug targeting: the future of brain drug development. Mol Interv, 3, 90-105, 51.
PARDRIDGE, W. M. 2005. The Blood-Brain Barrier: Bottleneck in Brain Drug Development. NeuroRx, 2, 3-14.

REFERENCES
271
PARDRIDGE, W. M. 2012. Drug transport across the blood–brain barrier. Journal of Cerebral Blood Flow & Metabolism, 32, 1959-1972.
PARDRIDGE, W. M., TRIGUERO, D., YANG, J. & CANCILLA, P. A. 1990. Comparison of in vitro and in vivo models of drug transcytosis through the blood-brain barrier. J Pharmacol Exp Ther, 253, 884-91.
PARIS-ROBIDAS, S., BROUARD, D., EMOND, V., PARENT, M. & CALON, F. 2016. Internalization of targeted quantum dots by brain capillary endothelial cells in vivo. J Cereb Blood Flow Metab, 36, 731-42.
PARKER, W. D., PARKS, J. K. & SWERDLOW, R. H. 2008. Complex I Deficiency in Parkinson’s Disease Frontal Cortex. Brain research, 1189, 215-218.
PATLAK, C. S. & BLASBERG, R. G. 1985. Graphical evaluation of blood-to-brain transfer constants from multiple-time uptake data. Generalizations. J Cereb Blood Flow Metab, 5, 584-90.
PATLAK, C. S., BLASBERG, R. G. & FENSTERMACHER, J. D. 1983. Graphical evaluation of blood-to-brain transfer constants from multiple-time uptake data. J Cereb Blood Flow Metab, 3, 1-7.
PAVAN, B., DALPIAZ, A., CILIBERTI, N., BIONDI, C., MANFREDINI, S. & VERTUANI, S. 2008. Progress in drug delivery to the central nervous system by the prodrug approach. Molecules, 13, 1035-65.
PENG, J., MAO, X. O., STEVENSON, F. F., HSU, M. & ANDERSEN, J. K. 2004. The herbicide paraquat induces dopaminergic nigral apoptosis through sustained activation of the JNK pathway. J Biol Chem, 279, 32626-32.
PENTTINEN, A. M., SULEYMANOVA, I., ALBERT, K., ANTTILA, J., VOUTILAINEN, M. H. & AIRAVAARA, M. 2016. Characterization of a new low-dose 6-hydroxydopamine model of Parkinson's disease in rat. J Neurosci Res, 94, 318-28.
PERRY, T. L. & YONG, V. W. 1986. Idiopathic Parkinson's disease, progressive supranuclear palsy and glutathione metabolism in the substantia nigra of patients. Neuroscience Letters, 67, 269-274.
PETIT, A., KAWARAI, T., PAITEL, E., SANJO, N., MAJ, M., SCHEID, M., CHEN, F., GU, Y., HASEGAWA, H., SALEHI-RAD, S., WANG, L., ROGAEVA, E., FRASER, P., ROBINSON, B., ST GEORGE-HYSLOP, P. & TANDON, A. 2005. Wild-type PINK1 prevents basal and induced neuronal apoptosis, a protective effect abrogated by Parkinson disease-related mutations. J Biol Chem, 280, 34025-32.
PETROVITCH, H., ROSS, G. W., ABBOTT, R. D., SANDERSON, W. T., SHARP, D. S., TANNER, C. M., MASAKI, K. H., BLANCHETTE, P. L., POPPER, J. S., FOLEY, D., LAUNER, L. & WHITE, L. R. 2002. Plantation work and risk of Parkinson disease in a population-based longitudinal study. Arch Neurol, 59, 1787-92.
PETRUCELLI, L., O'FARRELL, C., LOCKHART, P. J., BAPTISTA, M., KEHOE, K., VINK, L., CHOI, P., WOLOZIN, B., FARRER, M., HARDY, J. & COOKSON, M. R. 2002. Parkin protects against the toxicity associated with mutant alpha-synuclein: proteasome dysfunction selectively affects catecholaminergic neurons. Neuron, 36, 1007-19.
PEURA, L., MALMIOJA, K., HUTTUNEN, K., LEPPANEN, J., HAMALAINEN, M., FORSBERG, M. M., GYNTHER, M., RAUTIO, J. & LAINE, K. 2013. Design, synthesis and brain uptake of LAT1-targeted amino acid prodrugs of dopamine. Pharm Res, 30, 2523-37.
PEURA, L., MALMIOJA, K., LAINE, K., LEPPANEN, J., GYNTHER, M., ISOTALO, A. & RAUTIO, J. 2011. Large amino acid transporter 1 (LAT1) prodrugs of valproic acid: new prodrug design ideas for central nervous system delivery. Mol Pharm, 8, 1857-66.
PFAFFEN, S., ABDULQADIR, R., LE BRUN, N. E. & MURPHY, M. E. 2013. Mechanism of ferrous iron binding and oxidation by ferritin from a pennate diatom. J Biol Chem, 288, 14917-25.

REFERENCES
272
PINTO, E., SIGAUD-KUTNER, T. C. S., LEITÃO, M. A. S., OKAMOTO, O. K., MORSE, D. & COLEPICOLO, P. 2003. HEAVY METAL–INDUCED OXIDATIVE STRESS IN ALGAE1. Journal of Phycology, 39, 1008-1018.
PITT, J. J. 2009. Principles and Applications of Liquid Chromatography-Mass Spectrometry in Clinical Biochemistry. The Clinical Biochemist Reviews, 30, 19-34.
POGGIALI, E., CASSINERIO, E., ZANABONI, L. & CAPPELLINI, M. D. 2012. An update on iron chelation therapy. Blood Transfusion, 10, 411-422.
PONKA, P., BEAUMONT, C. & RICHARDSON, D. R. 1998. Function and regulation of transferrin and ferritin. Seminars in hematology, 35, 35-54.
POPA-WAGNER, A., MITRAN, S., SIVANESAN, S., CHANG, E. & BUGA, A.-M. 2013. ROS and Brain Diseases: The Good, the Bad, and the Ugly. Oxidative Medicine and Cellular Longevity, 2013, 14.
PORTER, J. B. 1996. Evaluation of new iron chelators for clinical use. Acta Haematol, 95, 13-25.
PORTER, J. B., ABEYSINGHE, R. D., HOYES, K. P., BARRA, C., HUEHNS, E. R., BROOKS, P. N., BLACKWELL, M. P., ARANETA, M., BRITTENHAM, G., SINGH, S. & ET AL. 1993. Contrasting interspecies efficacy and toxicology of 1,2-diethyl-3-hydroxypyridin-4-one, CP94, relates to differing metabolism of the iron chelating site. Br J Haematol, 85, 159-68.
PORTER, J. B., HOYES, K. P., ABEYSINGHE, R. D., BROOKS, P. N., HUEHNS, E. R. & HIDER, R. C. 1991. Comparison of the subacute toxicity and efficacy of 3-hydroxypyridin-4-one iron chelators in overloaded and nonoverloaded mice. Blood, 78, 2727-34.
PORTER, J. B., HUEHNS, E. R. & HIDER, R. C. 1989. The development of iron chelating drugs. Bailliere's clinical haematology, 2, 257-292.
PORTER, J. B., MORGAN, J., HOYES, K. P., BURKE, L. C., HUEHNS, E. R. & HIDER, R. C. 1990. Relative oral efficacy and acute toxicity of hydroxypyridin-4-one iron chelators in mice. Blood, 76, 2389-96.
PORTER, J. B., SINGH, S., HOYES, K. P., EPEMOLU, O., ABEYSINGHE, R. D. & HIDER, R. C. 1994. Lessons from preclinical and clinical studies with 1,2-diethyl-3-hydroxypyridin-4-one, CP94 and related compounds. Adv Exp Med Biol, 356, 361-70.
PRASAD, R., ATUL, KOLLA, V. K., LEGAC, J., SINGHAL, N., NAVALE, R., ROSENTHAL, P. J. & SIJWALI, P. S. 2013. Blocking Plasmodium falciparum development via dual inhibition of hemoglobin degradation and the ubiquitin proteasome system by MG132. PLoS One, 8, e73530.
PREMYSLOVA, M., XU, J., WANG, L., XIONG, H., NITIA-NOOTAN, T., DEOSARAN, E., PENG, C., CALLAGHAN, D., ZANG, W., RABADIA, V., FEENEY, C., WODZINSKA, J., SPINO, M. & CONNELLY, J. 2016. Neuroprotective Properties of Apo6856, a Novel Hydroxypyridinone Iron Chelator, in Alzheimer’s Disease (P5.208). Neurology, 86.
PRESGRAVES, S. P., AHMED, T., BORWEGE, S. & JOYCE, J. N. 2004. Terminally differentiated SH-SY5Y cells provide a model system for studying neuroprotective effects of dopamine agonists. Neurotox Res, 5, 579-98.
PRESTON, J., AL-SARRAF, H. & SEGAL, M. 1995. Permeability of the developing blood-brain barrier to 14C-mannitol using the rat in situ brain perfusion technique. Developmental Brain Research, 87, 69-76.
PRIYADARSHI, A., KHUDER, S. A., SCHAUB, E. A. & PRIYADARSHI, S. S. 2001. Environmental risk factors and Parkinson's disease: a metaanalysis. Environ Res, 86, 122-7.

REFERENCES
273
PRZEDBORSKI, S., LEVIVIER, M., JIANG, H., FERREIRA, M., JACKSON-LEWIS, V., DONALDSON, D. & TOGASAKI, D. M. 1995. Dose-dependent lesions of the dopaminergic nigrostriatal pathway induced by intrastriatal injection of 6-hydroxydopamine. Neuroscience, 67, 631-47.
PULICHERLA, K. K. & VERMA, M. K. 2015. Targeting Therapeutics Across the Blood Brain Barrier (BBB), Prerequisite Towards Thrombolytic Therapy for Cerebrovascular Disorders—an Overview and Advancements. AAPS PharmSciTech, 16, 223-233.
QIN, Y., FAN, W., CHEN, H., YAO, N., TANG, W., TANG, J., YUAN, W., KUAI, R., ZHANG, Z., WU, Y. & HE, Q. 2010. In vitro and in vivo investigation of glucose-mediated brain-targeting liposomes. Journal of Drug Targeting, 18, 536-549.
QUANQUAN, G., PING, L., YAZUO, Z., HUALEI, X., YUCAI, L. & XIAOJING, J. 2010. Pharmacokinetics and tissue distribution of deferiprone in rats. Chinese Journal of Pharmacology and Toxicology, 59-63.
QUTUB, A. A. & HUNT, C. A. 2005. Glucose transport to the brain: A systems model. Brain Research Reviews, 49, 595-617.
RAFAT, C., FAKHOURI, F., RIBEIL, J.-A., DELARUE, R. & LE QUINTREC, M. 2009. Fanconi Syndrome Due to Deferasirox. American Journal of Kidney Diseases, 54, 931-934.
RAFI, S. B., HEARN, B. R., VEDANTHAM, P., JACOBSON, M. P. & RENSLO, A. R. 2012. Predicting and Improving the Membrane Permeability of Peptidic Small Molecules. Journal of Medicinal Chemistry, 55, 3163-3169.
RAICHLE, M. E. & GUSNARD, D. A. 2002. Appraising the brain's energy budget. Proceedings of the National Academy of Sciences, 99, 10237-10239.
RAJAGOPAL, S. 2005. Clozapine, agranulocytosis, and benign ethnic neutropenia. Postgraduate Medical Journal, 81, 545-546.
RAUSCH, W.-D., HIRATA, Y., NAGATSU, T., RIEDERER, P. & JELLINGER, K. 1988. Tyrosine Hydroxylase Activity in Caudate Nucleus from Parkinson's Disease: Effects of Iron and Phosphorylating Agents. Journal of Neurochemistry, 50, 202-208.
RAUTIO, J., LAINE, K., GYNTHER, M. & SAVOLAINEN, J. 2008. Prodrug approaches for CNS delivery. Aaps j, 10, 92-102.
RAVINA, B. M., FAGAN, S. C., HART, R. G., HOVINGA, C. A., MURPHY, D. D., DAWSON, T. M. & MARLER, J. R. 2003. Neuroprotective agents for clinical trials in Parkinson's disease: a systematic assessment. Neurology, 60, 1234-40.
REYES, A. M., BUSTAMANTE, F., RIVAS, C. I., ORTEGA, M., DONNET, C., ROSSI, J. P., FISCHBARG, J. & VERA, J. C. 2002. Nicotinamide is not a substrate of the facilitative hexose transporter GLUT1. Biochemistry, 41, 8075-81.
REYNOLDS, J. N. J. & WICKENS, J. R. 2000. Substantia nigra dopamine regulates synaptic plasticity and membrane potential fluctuations in the rat neostriatum, in vivo. Neuroscience, 99, 199-203.
REZNICHENKO, L., KALFON, L., AMIT, T., YOUDIM, M. B. & MANDEL, S. A. 2010. Low dosage of rasagiline and epigallocatechin gallate synergistically restored the nigrostriatal axis in MPTP-induced parkinsonism. Neurodegener Dis, 7, 219-31.
RILEY, B. E., LOUGHEED, J. C., CALLAWAY, K., VELASQUEZ, M., BRECHT, E., NGUYEN, L., SHALER, T., WALKER, D., YANG, Y., REGNSTROM, K., DIEP, L., ZHANG, Z., CHIOU, S., BOVA, M., ARTIS, D. R., YAO,
REFERENCES
274
N., BAKER, J., YEDNOCK, T. & JOHNSTON, J. A. 2013. Structure and function of Parkin E3 ubiquitin ligase reveals aspects of RING and HECT ligases. Nat Commun, 4, 1982.
ROBINSON, T. E., MOCSARY, Z., CAMP, D. M. & WHISHAW, I. Q. 1994. Time course of recovery of extracellular dopamine following partial damage to the nigrostriatal dopamine system. J Neurosci, 14, 2687-96.
ROCHA, S., GOMES, D., LIMA, M., BRONZE-DA-ROCHA, E. & SANTOS-SILVA, A. 2015. Peroxiredoxin 2, glutathione peroxidase, and catalase in the cytosol and membrane of erythrocytes under H2O2-induced oxidative stress. Free Radic Res, 49, 990-1003.
ROCKWELL, P., YUAN, H., MAGNUSSON, R. & FIGUEIREDO-PEREIRA, M. E. 2000. Proteasome inhibition in neuronal cells induces a proinflammatory response manifested by upregulation of cyclooxygenase-2, its accumulation as ubiquitin conjugates, and production of the prostaglandin PGE(2). Arch Biochem Biophys, 374, 325-33.
RODRIGUES, R. W. P., GOMIDE, V. C. & CHADI, G. 2003. Striatal injection of 6-hydroxydopamine induces retrograde degeneration and glial activation in the nigrostriatal pathway. Acta Cirurgica Brasileira, 18, 272-282.
RODRIGUEZ-PALLARES, J., PARGA, J. A., MUNOZ, A., REY, P., GUERRA, M. J. & LABANDEIRA-GARCIA, J. L. 2007. Mechanism of 6-hydroxydopamine neurotoxicity: the role of NADPH oxidase and microglial activation in 6-hydroxydopamine-induced degeneration of dopaminergic neurons. J Neurochem, 103, 145-56.
ROEDTER, A., WINKLER, C., SAMII, M., WALTER, G. F., BRANDIS, A. & NIKKHAH, G. 2001. Comparison of unilateral and bilateral intrastriatal 6-hydroxydopamine-induced axon terminal lesions: evidence for interhemispheric functional coupling of the two nigrostriatal pathways. J Comp Neurol, 432, 217-29.
ROSARIO DE LA TORRE, M., CASADO, A., LÓPEZ-FERNÁNDEZ, M. E., CARRASCOSA, D., CASADO, M. C., VENARUCCI, D. & VENARUCCI, V. 1996. Human aging brain disorders: Role of antioxidant enzymes. Neurochemical Research, 21, 885-888.
ROY, S., PRESTON, J. E., HIDER, R. C. & MA, Y. M. 2010. Glucosylated Deferiprone and Its Brain Uptake: Implications for Developing Glucosylated Hydroxypyridinone Analogues Intended to Cross the Blood-Brain Barrier. Journal of Medicinal Chemistry, 53, 5886-5889.
RYU, J., ZHANG, R., HONG, B. H., YANG, E. J., KANG, K. A., CHOI, M., KIM, K. C., NOH, S. J., KIM, H. S., LEE, N. H., HYUN, J. W. & KIM, H. S. 2013. Phloroglucinol attenuates motor functional deficits in an animal model of Parkinson's disease by enhancing Nrf2 activity. PLoS One, 8, e71178.
SAHA, J. K., XIA, J., GRONDIN, J. M., ENGLE, S. K. & JAKUBOWSKI, J. A. 2005. Acute hyperglycemia induced by ketamine/xylazine anesthesia in rats: mechanisms and implications for preclinical models. Exp Biol Med (Maywood), 230, 777-84.
SAI, T., UCHIDA, K. & NAKAYAMA, H. 2013. Biochemical evaluation of the neurotoxicity of MPTP and MPP(+) in embryonic and newborn mice. J Toxicol Sci, 38, 445-58.
SAKURAI, K. & CEDERBAUM, A. I. 1998. Oxidative stress and cytotoxicity induced by ferric-nitrilotriacetate in HepG2 cells that express cytochrome P450 2E1. Mol Pharmacol, 54, 1024-35.
SALIBA, A. N., HARB, A. R. & TAHER, A. T. 2015. Iron chelation therapy in transfusion-dependent thalassemia patients: current strategies and future directions. Journal of Blood Medicine, 6, 197-209.
SAMMARCO, M. C., DITCH, S., BANERJEE, A. & GRABCZYK, E. 2008. Ferritin L and H subunits are differentially regulated on a post-transcriptional level. J Biol Chem, 283, 4578-87.

REFERENCES
275
SAPORITO, M. S., THOMAS, B. A. & SCOTT, R. W. 2000. MPTP activates c-Jun NH(2)-terminal kinase (JNK) and its upstream regulatory kinase MKK4 in nigrostriatal neurons in vivo. J Neurochem, 75, 1200-8.
SAUERBECK, A., SCHONBERG, D. L., LAWS, J. L. & MCTIGUE, D. M. 2013. Systemic iron chelation results in limited functional and histological recovery after traumatic spinal cord injury in rats. Experimental Neurology, 248, 53-61.
SCHAPIRA, A. H. & JENNER, P. 2011. Etiology and pathogenesis of Parkinson's disease. Mov Disord, 26, 1049-55.
SCHAPIRA, A. H. 2009. Neuroprotection in Parkinson's disease. Parkinsonism Relat Disord, 15 Suppl 4, S41-3.
SCHAPIRA, A. H., COOPER, J. M., DEXTER, D., CLARK, J. B., JENNER, P. & MARSDEN, C. D. 1990. Mitochondrial complex I deficiency in Parkinson's disease. J Neurochem, 54, 823-7.
SCHLAG, M. G., HOPF, R. & REDL, H. 2000. Convulsive seizures following subdural application of fibrin sealant containing tranexamic acid in a rat model. Neurosurgery, 47, 1463-7.
SCHLOSSMACHER, M. G., TOMLINSON, J. J., SANTOS, G., SHUTINOSKI, B., BROWN, E. G., MANUEL, D. & MESTRE, T. 2017. Modelling idiopathic Parkinson disease as a complex illness can inform incidence rate in healthy adults: the P(R)EDIGT score. The European Journal of Neuroscience, 45, 175-191.
SCHNEIDER, C. A., RASBAND, W. S. & ELICEIRI, K. W. 2012. NIH Image to ImageJ: 25 years of image analysis. Nat Meth, 9, 671-675.
SELIG, R. A., MADAFIGLIO, J., HABER, M., NORRIS, M. D., WHITE, L. & STEWART, B. W. 1993. Ferritin production and desferrioxamine cytotoxicity in human neuroblastoma cell lines. Anticancer Res, 13, 721-5.
SELIG, R. A., WHITE, L., GRAMACHO, C., STERLING-LEVIS, K., FRASER, I. W. & NAIDOO, D. 1998. Failure of iron chelators to reduce tumor growth in human neuroblastoma xenografts. Cancer Res, 58, 473-8.
SEMCHUK, K. M., LOVE, E. J. & LEE, R. G. 1992. Parkinson's disease and exposure to agricultural work and pesticide chemicals. Neurology, 42, 1328-35.
SENA, L. A. & CHANDEL, N. S. 2012. Physiological roles of mitochondrial reactive oxygen species. Molecular cell, 48, 158-167.
SHACHAR, D. B., KAHANA, N., KAMPEL, V., WARSHAWSKY, A. & YOUDIM, M. B. H. 2004. Neuroprotection by a novel brain permeable iron chelator, VK-28, against 6-hydroxydopamine lession in rats. Neuropharmacology, 46, 254-263.
SHARMA, P., JHA, A. B., DUBEY, R. S. & PESSARAKLI, M. 2012. Reactive Oxygen Species, Oxidative Damage, and Antioxidative Defense Mechanism in Plants under Stressful Conditions. Journal of Botany, 2012, 26.
SHEIKH, S., SAFIA, HAQUE, E. & MIR, S. S. 2013. Neurodegenerative Diseases: Multifactorial Conformational Diseases and Their Therapeutic Interventions. Journal of Neurodegenerative Diseases, 2013, 8.
SHERER, T. B., KIM, J. H., BETARBET, R. & GREENAMYRE, J. T. 2003. Subcutaneous rotenone exposure causes highly selective dopaminergic degeneration and alpha-synuclein aggregation. Exp Neurol, 179, 9-16.
SHETH, S. 2014. Iron chelation: an update. Curr Opin Hematol, 21, 179-85.
SHI, Z., LU, Z., ZHAO, Y., WANG, Y., ZHAO-WILSON, X., GUAN, P., DUAN, X., CHANG, Y. Z. & ZHAO, B. 2013. Neuroprotective effects of aqueous extracts of Uncaria tomentosa: Insights from 6-OHDA induced cell damage and transgenic Caenorhabditis elegans model. Neurochem Int, 62, 940-7.

REFERENCES
276
SHUCHMAN, M. 2011. FDA panel recommends approval of deferiprone. CMAJ, 183, E1159-60.
SIAN, J., DEXTER, D. T., LEES, A. J., DANIEL, S., AGID, Y., JAVOY-AGID, F., JENNER, P. & MARSDEN, C. D. 1994. Alterations in glutathione levels in Parkinson's disease and other neurodegenerative disorders affecting basal ganglia. Ann Neurol, 36, 348-55.
SIDDIQUI, M. R., ALOTHMAN, Z. A. & RAHMAN, N. 2017. Analytical techniques in pharmaceutical analysis: A review. Arabian Journal of Chemistry, 10, Supplement 1, S1409-S1421.
SILVA, A. H., FONSECA, F. N., PIMENTA, A. T., LIMA, M. S., SILVEIRA, E. R., VIANA, G. S., VASCONCELOS, S. M. & LEAL, L. K. 2016. Pharmacognostical Analysis and Protective Effect of Standardized Extract and Rizonic Acid from Erythrina velutina against 6-Hydroxydopamine-Induced Neurotoxicity in SH-SY5Y Cells. Pharmacogn Mag, 12, 307-312.
SIMOLA, N., MORELLI, M. & CARTA, A. R. 2007. The 6-Hydroxydopamine model of parkinson’s disease. Neurotoxicity Research, 11, 151-167.
SINGH, S., CHOUDHURY, R., EPEMOLU, R. O. & HIDER, R. C. 1996. Metabolism and pharmacokinetics of 1-(2'-hydroxy-ethyl)- and 1-(3'-hydroxypropyl)-2-ethyl-3-hydroxypyridin-4-ones in the rat. Eur J Drug Metab Pharmacokinet, 21, 33-41.
SINGH, S., EPEMOLU, R. O., DOBBIN, P. S., TILBROOK, G. S., ELLIS, B. L., DAMANI, L. A. & HIDER, R. C. 1992. Urinary metabolic profiles in human and rat of 1,2-dimethyl- and 1,2-diethyl-substituted 3-hydroxypyridin-4-ones. Drug Metabolism and Disposition, 20, 256-261.
SKIBINSKI, G. & FINKBEINER, S. 2011. Drug discovery in Parkinson's disease-Update and developments in the use of cellular models. Int J High Throughput Screen, 2011, 15-25.
SMITH, D. A., DI, L. & KERNS, E. H. 2010. The effect of plasma protein binding on in vivo efficacy: misconceptions in drug discovery. Nat Rev Drug Discov, 9, 929-39.
SMITH, D., ARTURSSON, P., AVDEEF, A., DI, L., ECKER, G. F., FALLER, B., HOUSTON, J. B., KANSY, M., KERNS, E. H., KRAMER, S. D., LENNERNAS, H., VAN DE WATERBEEMD, H., SUGANO, K. & TESTA, B. 2014. Passive Lipoidal Diffusion and Carrier-Mediated Cell Uptake Are Both Important Mechanisms of Membrane Permeation in Drug Disposition. Molecular Pharmaceutics, 11, 1727-1738.
SMITH, M. P. & CASS, W. A. 2007. Oxidative stress and dopamine depletion in an intrastriatal 6-hydroxydopamine model of Parkinson’s disease. Neuroscience, 144, 1057-1066.
SMITH, Q. R. & ALLEN, D. D. 2003. In Situ Brain Perfusion Technique. In: NAG, S. (ed.) The Blood Brain Barrier: Biology and Research Protocols. Totowa, NJ: Humana Press Inc.
SMITH, Q. R. 2000. Transport of glutamate and other amino acids at the blood-brain barrier. J Nutr, 130, 1016S-22S.
SMITH, Q. R. 2003. A Review of Blood-Brain Barrier Transport Techniques. In: NAG, S. (ed.) The Blood-Brain Barrier: Biology and Research Protocols. Totowa, NJ: Humana Press Inc.
SNYDER, H., MENSAH, K., THEISLER, C., LEE, J., MATOUSCHEK, A. & WOLOZIN, B. 2003. Aggregated and monomeric alpha-synuclein bind to the S6' proteasomal protein and inhibit proteasomal function. J Biol Chem, 278, 11753-9.
SOFIC, E., LANGE, K. W., JELLINGER, K. & RIEDERER, P. 1992. Reduced and oxidized glutathione in the substantia nigra of patients with Parkinson's disease. Neurosci Lett, 142, 128-30.

REFERENCES
277
SOFIC, E., RIEDERER, P., HEINSEN, H., BECKMANN, H., REYNOLDS, G. P., HEBENSTREIT, G. & YOUDIM, M. B. 1988. Increased iron (III) and total iron content in post mortem substantia nigra of parkinsonian brain. J Neural Transm, 74, 199-205.
SOFRONIEW, M. V. 2015. Astrocyte barriers to neurotoxic inflammation. Nat Rev Neurosci, 16, 249-263.
SOMOGYI, M. 1948. Studies of arteriovenous differences in blood sugar; effect of alimentary hyperglycemia on the rate of extrahepatic glucose assimilation. J Biol Chem, 174, 189-200.
SOTO-OTERO, R., MENDEZ-ALVAREZ, E., HERMIDA-AMEIJEIRAS, A., MUNOZ-PATINO, A. M. & LABANDEIRA-GARCIA, J. L. 2000. Autoxidation and neurotoxicity of 6-hydroxydopamine in the presence of some antioxidants: potential implication in relation to the pathogenesis of Parkinson's disease. J Neurochem, 74, 1605-12.
SPINO, M., CONNELLY, J., TSANG, Y.-C., FRADETTE, C. & TRICTA, F. 2015. Deferiprone Pharmacokinetics with and without Iron Overload and in Special Patient Populations. Blood, 126, 3365-3365.
SRINIVASAN, B., KOLLI, A. R., ESCH, M. B., ABACI, H. E., SHULER, M. L. & HICKMAN, J. J. 2015. TEER measurement techniques for in vitro barrier model systems. Journal of laboratory automation, 20, 107-126.
STOICA, B. A. & FADEN, A. I. 2010. Cell death mechanisms and modulation in traumatic brain injury. Neurotherapeutics, 7, 3-12.
STORCH, A., KAFTAN, A., BURKHARDT, K. & SCHWARZ, J. 2000. 6-Hydroxydopamine toxicity towards human SH-SY5Y dopaminergic neuroblastoma cells: independent of mitochondrial energy metabolism. J Neural Transm (Vienna), 107, 281-93.
STORCH, A., LUDOLPH, A. C. & SCHWARZ, J. 2004. Dopamine transporter: involvement in selective dopaminergic neurotoxicity and degeneration. J Neural Transm (Vienna), 111, 1267-86.
SUBRAMANIAN, R. K., SIDHARTHAN, A., MANEKSH, D., RAMALINGAM, L., MANICKAM, A. S., KANTHAKUMAR, P. & SUBRAMANI, S. 2013. Normative data for arterial blood gas and electrolytes in anesthetized rats. Indian J Pharmacol, 45, 103-4.
SUGANO, K., KANSY, M., ARTURSSON, P., AVDEEF, A., BENDELS, S., DI, L., ECKER, G. F., FALLER, B., FISCHER, H., GEREBTZOFF, G., LENNERNAES, H. & SENNER, F. 2010. Coexistence of passive and carrier-mediated processes in drug transport. Nature Reviews Drug Discovery, 9, 597-614.
SULLIVAN, P. G., DRAGICEVIC, N. B., DENG, J. H., BAI, Y., DIMAYUGA, E., DING, Q., CHEN, Q., BRUCE-KELLER, A. J. & KELLER, J. N. 2004. Proteasome inhibition alters neural mitochondrial homeostasis and mitochondria turnover. J Biol Chem, 279, 20699-707.
SUMMERFIELD, S., READ, K., BEGLEY, D., OBRADOVIC, T., HIDALGO, I., COGGON, S., LEWIS, A., PORTER, R. & JEFFREY, P. 2007. Central nervous system drug disposition: the relationship between in situ brain permeability and brain free fraction. Journal of Pharmacology and Experimental Therapeutics, 322, 205-213.
SWIETACH, P., TIFFERT, T., MAURITZ, J. M., SEEAR, R., ESPOSITO, A., KAMINSKI, C. F., LEW, V. L. & VAUGHAN-JONES, R. D. 2010. Hydrogen ion dynamics in human red blood cells. J Physiol, 588, 4995-5014.
SYVANEN, S., LINDHE, O., PALNER, M., KORNUM, B. R., RAHMAN, O., LANGSTROM, B., KNUDSEN, G. M. & HAMMARLUND-UDENAES, M. 2009. Species differences in blood-brain barrier transport of three positron emission tomography radioligands with emphasis on P-glycoprotein transport. Drug Metab Dispos, 37, 635-43.

REFERENCES
278
TABANOR, K., LEE, P., KIPTOO, P., CHOI, I.-Y., SHERRY, E. B., EAGLE, C. S., WILLIAMS, T. D. & SIAHAAN, T. J. 2016. Brain Delivery of Drug and MRI Contrast Agent: Detection and Quantitative Determination of Brain Deposition of CPT-Glu Using LC–MS/MS and Gd-DTPA Using Magnetic Resonance Imaging. Molecular Pharmaceutics, 13, 379-390.
TAGLIAFERRO, P. & BURKE, R. E. 2016. Retrograde Axonal Degeneration in Parkinson Disease. Journal of Parkinson's Disease, 6, 1-15.
TAKAI, N., NAKANISHI, H., TANABE, K., NISHIOKU, T., SUGIYAMA, T., FUJIWARA, M. & YAMAMOTO, K. 1998. Involvement of caspase-like proteinases in apoptosis of neuronal PC12 cells and primary cultured microglia induced by 6-hydroxydopamine. J Neurosci Res, 54, 214-22.
TAKAKURA, A. C., DOS SANTOS MOREIRA, T., DE LUCA, L. A., JR., RENZI, A. & MENANI, J. V. 2003. Central alpha(2) adrenergic receptors and cholinergic-induced salivation in rats. Brain Res Bull, 59, 383-6.
TAKASATO, Y., RAPOPORT, S. & SMITH, Q. 1984. An in situ brain perfusion technique to study cerebrovascular transport in the rat. American Journal of Physiology, 247, H484-H493.
TAM, T. F., LEUNG-TOUNG, R., WANG, Y. & ZHAO, Y. 2014. Fluorinated derivatives of deferiprone. Google Patents.
TAMAI, I. & TSUJI, A. 2000. Transporter-mediated permeation of drugs across the blood-brain barrier. J Pharm Sci, 89, 1371-88.
TATTON, N. A. & KISH, S. J. 1997. In situ detection of apoptotic nuclei in the substantia nigra compacta of 1-methyl-4-phenyl-1,2,3,6-tetrahydropyridine-treated mice using terminal deoxynucleotidyl transferase labelling and acridine orange staining. Neuroscience, 77, 1037-48.
TATTON, N. A. 2000. Increased caspase 3 and Bax immunoreactivity accompany nuclear GAPDH translocation and neuronal apoptosis in Parkinson's disease. Exp Neurol, 166, 29-43.
TATTON, N. A., MACLEAN-FRASER, A., TATTON, W. G., PERL, D. P. & OLANOW, C. W. 1998. A fluorescent double-labeling method to detect and confirm apoptotic nuclei in Parkinson's disease. Ann Neurol, 44, S142-8.
TEISMANN, P. & SCHULZ, J. B. 2004. Cellular pathology of Parkinson's disease: astrocytes, microglia and inflammation. Cell Tissue Res, 318, 149-61.
THUMA, P. E., OLIVIERI, N. F., MABEZA, G. F., BIEMBA, G., PARRY, D., ZULU, S., FASSOS, F. F., MCCLELLAND, R. A., KOREN, G., BRITTENHAM, G. M. & GORDEUK, V. R. 1998. Assessment of the effect of the oral iron chelator deferiprone on asymptomatic Plasmodium falciparum parasitemia in humans. Am J Trop Med Hyg, 58, 358-64.
TIETZ, S. & ENGELHARDT, B. 2015. Brain barriers: Crosstalk between complex tight junctions and adherens junctions. J Cell Biol, 209, 493-506.
TIEU, K. 2011. A Guide to Neurotoxic Animal Models of Parkinson’s Disease. Cold Spring Harbor Perspectives in Medicine:, 1, a009316.
TIMOSHNIKOV, V. A., KOBZEVA, T. V., POLYAKOV, N. E. & KONTOGHIORGHES, G. J. 2015. Inhibition of Fe2+- and Fe3+- induced hydroxyl radical production by the iron-chelating drug deferiprone. Free Radical Biology and Medicine, 78, 118-122.
TOSATTO, L., ANDRIGHETTI, A. O., PLOTEGHER, N., ANTONINI, V., TESSARI, I., RICCI, L., BUBACCO, L. & DALLA SERRA, M. 2012. Alpha-synuclein pore forming activity upon membrane association. Biochimica et Biophysica Acta (BBA) - Biomembranes, 1818, 2876-2883.

REFERENCES
279
TÓTH, M., HÄGGKVIST, J., VARRONE, A., FINNEMA, S. J., DOORDUIN, J., TOKUNAGA, M., HIGUCHI, M., GULYÁS, B. & HALLDIN, C. 2014. ABC transporter-dependent brain uptake of the 5-HT1B receptor radioligand [ (11)C]AZ10419369: a comparative PET study in mouse, rat, and guinea pig. EJNMMI research, 4, 64.
TRICTA, F., UETRECHT, J., GALANELLO, R., CONNELLY, J., ROZOVA, A., SPINO, M. & PALMBLAD, J. 2016. Deferiprone‐induced agranulocytosis: 20 years of clinical observations. American Journal of Hematology, 91, 1026-1031.
TRIGUERO, D., BUCIAK, J. & PARDRIDGE, W. 1990. Capillary depletion method for quantification of blood-brain barrier transport of circulating peptides and plasma proteins. Journal of Neurochemistry, 54, 1882-1888.
TRIMBLE, W. S. & GRINSTEIN, S. 2015. Barriers to the free diffusion of proteins and lipids in the plasma membrane. J Cell Biol, 208, 259-71.
TSINMAN, O., TSINMAN, K., SUN, N. & AVDEEF, A. 2011. Physicochemical selectivity of the BBB microenvironment governing passive diffusion--matching with a porcine brain lipid extract artificial membrane permeability model. Pharm Res, 28, 337-63.
TSUJIMOTO, Y. 1997. Apoptosis and necrosis: intracellular ATP level as a determinant for cell death modes. Cell Death Differ, 4, 429-34.
TURNER, A., RADBURN-SMITH, K., MUSHTAQ, A. & TAN, L. 2011. Storage and Handling Guidelines for Custom Peptides. Current Protocols in Protein Science. John Wiley & Sons, Inc.
TURRENS, J. F. 2003. Mitochondrial formation of reactive oxygen species. J Physiol, 552, 335-44.
U.S.-F.D.A. 2001. Guidance for Industry: Bioanalytical Method Validation. In: DEPARTMENT OF HEALTH AND HUMAN SERVICES, C. F. D. E. A. R. C., CENTER OF VETERINARY MEDICINE (CVM) (ed.).
UPADHYAY, R. K. 2014. Transendothelial Transport and Its Role in Therapeutics. Int Sch Res Notices, 2014, 309404.
URRUTIA, P. J., MENA, N. P. & NÚÑEZ, M. T. 2014. The interplay between iron accumulation, mitochondrial dysfunction, and inflammation during the execution step of neurodegenerative disorders. Frontiers in Pharmacology, 5, 38.
URRUTIA, P., AGUIRRE, P., ESPARZA, A., TAPIA, V., MENA, N. P., ARREDONDO, M., GONZALEZ-BILLAULT, C. & NUNEZ, M. T. 2013. Inflammation alters the expression of DMT1, FPN1 and hepcidin, and it causes iron accumulation in central nervous system cells. J Neurochem, 126, 541-9.
VAN DER BRUG, M. P., SINGLETON, A., GASSER, T. & LEWIS, P. A. 2015. Parkinson's disease: From human genetics to clinical trials. Sci Transl Med, 7, 205ps20.
VAN MEERLOO, J., KASPERS, G. J. & CLOOS, J. 2011. Cell sensitivity assays: the MTT assay. Methods Mol Biol, 731, 237-45.
VILA, M., JACKSON-LEWIS, V., VUKOSAVIC, S., DJALDETTI, R., LIBERATORE, G., OFFEN, D., KORSMEYER, S. J. & PRZEDBORSKI, S. 2001. Bax ablation prevents dopaminergic neurodegeneration in the 1-methyl- 4-phenyl-1,2,3,6-tetrahydropyridine mouse model of Parkinson's disease. Proceedings of the National Academy of Sciences, 98, 2837-2842.
VILLA, M., MUÑOZ, P., AHUMADA-CASTRO, U., PARIS, I., JIMÉNEZ, A., MARTÍNEZ, I., SEVILLA, F. & SEGURA-AGUILAR, J. 2013. One-Electron Reduction of 6-Hydroxydopamine Quinone is Essential in 6-Hydroxydopamine Neurotoxicity. Neurotoxicity Research, 24, 94-101.

REFERENCES
280
VIREL, A., FAERGEMANN, E., ORADD, G. & STROMBERG, I. 2014a. Magnetic resonance imaging (MRI) to study striatal iron accumulation in a rat model of Parkinson's disease. PLoS One, 9, e112941.
VISANJI, N. P., BROOKS, P. L., HAZRATI, L.-N. & LANG, A. E. 2013. The prion hypothesis in Parkinson's disease: Braak to the future. Acta Neuropathologica Communications, 1, 2-2.
VISWANATH, V., WU, Y., BOONPLUEANG, R., CHEN, S., STEVENSON, F. F., YANTIRI, F., YANG, L., BEAL, M. F. & ANDERSEN, J. K. 2001. Caspase-9 activation results in downstream caspase-8 activation and bid cleavage in 1-methyl-4-phenyl-1,2,3,6-tetrahydropyridine-induced Parkinson's disease. J Neurosci, 21, 9519-28.
WAHEED, N., ALI, S. & BUTT, M. A. 2014. Comparison of deferiprone and deferrioxamine for the treatment of transfusional iron overload in children with beta thalassemia major. J Ayub Med Coll Abbottabad, 26, 297-300.
WAKABAYASHI, K., MORI, F. & TAKAHASHI, H. 2006. Progression patterns of neuronal loss and Lewy body pathology in the substantia nigra in Parkinson's disease. Parkinsonism & Related Disorders, 12, S92-S98.
WAKABAYASHI, K., TANJI, K., ODAGIRI, S., MIKI, Y., MORI, F. & TAKAHASHI, H. 2013. The Lewy body in Parkinson's disease and related neurodegenerative disorders. Mol Neurobiol, 47, 495-508.
WALDMEIER, P. C., BUCHLE, A. M. & STEULET, A. F. 1993. Inhibition of catechol-O-methyltransferase (COMT) as well as tyrosine and tryptophan hydroxylase by the orally active iron chelator, 1,2-dimethyl-3-hydroxypyridin-4-one (L1, CP20), in rat brain in vivo. Biochem Pharmacol, 45, 2417-24.
WALKER, M. D., DINELLE, K., KORNELSEN, R., LEE, A., FARRER, M. J., STOESSL, A. J. & SOSSI, V. 2013. Measuring dopaminergic function in the 6-OHDA-lesioned rat: a comparison of PET and microdialysis. EJNMMI Res, 3, 69.
WALKINSHAW, G. & WATERS, C. M. 1994. Neurotoxin-induced cell death in neuronal PC12 cells is mediated by induction of apoptosis. Neuroscience, 63, 975-87.
WALL, NICHOLAS R., DE LA PARRA, M., CALLAWAY, EDWARD M. & KREITZER, ANATOL C. 2013. Differential Innervation of Direct- and Indirect-Pathway Striatal Projection Neurons. Neuron, 79, 347-360.
WAN, H., REHNGREN, M., GIORDANETTO, F., BERGSTROM, F. & TUNEK, A. 2007. High-throughput screening of drug-brain tissue binding and in silico prediction for assessment of central nervous system drug delivery. J Med Chem, 50, 4606-15.
WAN, W., JIN, L., WANG, Z., WANG, L., FEI, G., YE, F., PAN, X., WANG, C. & ZHONG, C. 2017. Iron Deposition Leads to Neuronal α-Synuclein Pathology by Inducing Autophagy Dysfunction. Frontiers in Neurology, 8, 1.
WANG, J. & MALDONADO, M. A. 2006. The ubiquitin-proteasome system and its role in inflammatory and autoimmune diseases. Cell Mol Immunol, 3, 255-61.
WANG, J., BI, M. & XIE, J. 2015. Ceruloplasmin is Involved in the Nigral Iron Accumulation of 6-OHDA-Lesioned Rats. Cell Mol Neurobiol, 35, 661-8.
WANG, J., FILLEBEEN, C., CHEN, G., BIEDERBICK, A., LILL, R. & PANTOPOULOS, K. 2007. Iron-Dependent Degradation of Apo-IRP1 by the Ubiquitin-Proteasome Pathway. Molecular and Cellular Biology, 27, 2423-2430.
WANG, J., JIANG, H. & XIE, J. X. 2004. Time dependent effects of 6-OHDA lesions on iron level and neuronal loss in rat nigrostriatal system. Neurochem Res, 29, 2239-43.

REFERENCES
281
WANG, J.-Y., ZHUANG, Q.-Q., ZHU, L.-B., ZHU, H., LI, T., LI, R., CHEN, S.-F., HUANG, C.-P., ZHANG, X. & ZHU, J.-H. 2016a. Meta-analysis of brain iron levels of Parkinson’s disease patients determined by postmortem and MRI measurements. Scientific Reports, 6, 36669.
WANG, L., XU, S., XU, X. & CHAN, P. 2009. (-)-Epigallocatechin-3-Gallate protects SH-SY5Y cells against 6-OHDA-induced cell death through STAT3 activation. J Alzheimers Dis, 17, 295-304.
WANG, W., SHI, L., XIE, Y., MA, C., LI, W., SU, X., HUANG, S., CHEN, R., ZHU, Z., MAO, Z., HAN, Y. & LI, M. 2004. SP600125, a new JNK inhibitor, protects dopaminergic neurons in the MPTP model of Parkinson's disease. Neurosci Res, 48, 195-202.
WANG, Y. I., ABACI, H. E. & SHULER, M. L. 2017. Microfluidic blood-brain barrier model provides in vivo-like barrier properties for drug permeability screening. Biotechnol Bioeng, 114, 184-194.
WANG, Z., LUO, X.-G. & GAO, C. 2016b. Utility of susceptibility-weighted imaging in Parkinson’s disease and atypical Parkinsonian disorders. Translational Neurodegeneration, 5, 17.
WARD, R. J., COLIVICCHI, M. A., ALLEN, R., SCHOL, F., LALLEMAND, F., DE WITTE, P., BALLINI, C., CORTE, L. D. & DEXTER, D. 2009. Neuro-inflammation induced in the hippocampus of 'binge drinking' rats may be mediated by elevated extracellular glutamate content. J Neurochem, 111, 1119-28.
WARNER, T. T. & SCHAPIRA, A. H. 2003. Genetic and environmental factors in the cause of Parkinson's disease. Ann Neurol, 53 Suppl 3, S16-23; discussion S23-5.
WEBER, J. T. 2015. Methodologies and limitations in the analysis of potential neuroprotective compounds derived from natural products. New Horizons in Translational Medicine, 2, 81-85.
WEISS, H. M., FRESNEAU, M., CAMENISCH, G. P., KRETZ, O. & GROSS, G. 2006. In vitro blood distribution and plasma protein binding of the iron chelator deferasirox (ICL670) and its iron complex Fe-[ICL670]2 for rat, marmoset, rabbit, mouse, dog, and human. Drug Metab Dispos, 34, 971-5.
WEST, G. J., UKI, J., HERSCHMAN, H. R. & SEEGER, R. C. 1977. Adrenergic, cholinergic, and inactive human neuroblastoma cell lines with the action-potential Na+ ionophore. Cancer Res, 37, 1372-6.
WEYNE, J., PANNIER, J. L., DEMEESTER, G. & LEUSEN, I. 1970. Bicarbonate and chloride of rat brain during infusion-induced changes in bicarbonate concentration of blood. Pflugers Arch, 320, 45-63.
WILLIAMS, S. K., GILLIS, J. F., MATTHEWS, M. A., WAGNER, R. C. & BITENSKY, M. W. 1980. Isolation and characterization of brain endothelial cells: morphology and enzyme activity. J Neurochem, 35, 374-81.
WINDBERGER, U., BARTHOLOVITSCH, A., PLASENZOTTI, R., KORAK, K. J. & HEINZE, G. 2003. Whole blood viscosity, plasma viscosity and erythrocyte aggregation in nine mammalian species: reference values and comparison of data. Exp Physiol, 88, 431-40.
WONG, A., YE, M., LEVY, A., ROTHSTEIN, J., BERGLES, D. & SEARSON, P. 2013. The blood-brain barrier: an engineering perspective. Frontiers in Neuroengineering, 6.
WOOD, J. C., KANG, B. P., THOMPSON, A., GIARDINA, P., HARMATZ, P., GLYNOS, T., PALEY, C. & COATES, T. D. 2010. The effect of deferasirox on cardiac iron in thalassemia major: impact of total body iron stores. Blood, 116, 537-43.
WORKMAN, D. G., TSATSANIS, A., LEWIS, F. W., BOYLE, J. P., MOUSADOUST, M., HETTIARACHCHI, N. T., HUNTER, M., PEERS, C. S., TETARD, D. & DUCE, J. A. 2015. Protection from neurodegeneration in the 6-hydroxydopamine (6-OHDA) model of Parkinson's with novel 1-hydroxypyridin-2-one metal chelators. Metallomics, 7, 867-76.

REFERENCES
282
WU, D. C., JACKSON-LEWIS, V., VILA, M., TIEU, K., TEISMANN, P., VADSETH, C., CHOI, D. K., ISCHIROPOULOS, H. & PRZEDBORSKI, S. 2002. Blockade of microglial activation is neuroprotective in the 1-methyl-4-phenyl-1,2,3,6-tetrahydropyridine mouse model of Parkinson disease. J Neurosci, 22, 1763-71.
WU, X., CHEN, P. S., DALLAS, S., WILSON, B., BLOCK, M. L., WANG, C.-C., KINYAMU, H., LU, N., GAO, X., LENG, Y., CHUANG, D.-M., ZHANG, W., LU, R. B. & HONG, J.-S. 2008. Histone deacetylase inhibitors up-regulate astrocyte GDNF and BDNF gene transcription and protect dopaminergic neurons. The international journal of neuropsychopharmacology / official scientific journal of the Collegium Internationale Neuropsychopharmacologicum (CINP), 11, 1123-1134.
XICOY, H., WIERINGA, B. & MARTENS, G. J. M. 2017. The SH-SY5Y cell line in Parkinson’s disease research: a systematic review. Molecular Neurodegeneration, 12, 10.
XIE, H. R., HU, L. S. & LI, G. Y. 2010a. SH-SY5Y human neuroblastoma cell line: in vitro cell model of dopaminergic neurons in Parkinson's disease. Chin Med J (Engl), 123, 1086-92.
XIE, W., LI, X., LI, C., ZHU, W., JANKOVIC, J. & LE, W. 2010b. Proteasome inhibition modeling nigral neuron degeneration in Parkinson's disease. J Neurochem, 115, 188-99.
XU, H.-D., WU, D., GU, J.-H., GE, J.-B., WU, J.-C., HAN, R., LIANG, Z.-Q. & QIN, Z.-H. 2013. The Pro-Survival Role of Autophagy Depends on Bcl-2 Under Nutrition Stress Conditions. PLOS ONE, 8, e63232.
XU, Q., KANTHASAMY, A. G., JIN, H. & REDDY, M. B. 2016. Hepcidin Plays a Key Role in 6-OHDA Induced Iron Overload and Apoptotic Cell Death in a Cell Culture Model of Parkinson's Disease. Parkinsons Dis, 2016, 8684130.
YAMADA, T., HASHIDA, K., TAKARADA-IEMATA, M., MATSUGO, S. & HORI, O. 2011. alpha-Lipoic acid (LA) enantiomers protect SH-SY5Y cells against glutathione depletion. Neurochem Int, 59, 1003-9.
YANG, L., MATTHEWS, R. T., SCHULZ, J. B., KLOCKGETHER, T., LIAO, A. W., MARTINOU, J. C., PENNEY, J. B., JR., HYMAN, B. T. & BEAL, M. F. 1998. 1-Methyl-4-phenyl-1,2,3,6-tetrahydropyride neurotoxicity is attenuated in mice overexpressing Bcl-2. J Neurosci, 18, 8145-52.
YAO, H., SADOSHIMA, S., OKADA, Y., IBAYASHI, S. & FUJISHIMA, M. 1990. Hindbrain ischemia produced by bilateral vertebral artery occlusion and moderate hypotension in spontaneously hypertensive rats. Angiology, 41, 848-54.
YASSIN, M. S., EKBLOM, J., XILINAS, M., GOTTFRIES, C. G. & ORELAND, L. 2000. Changes in uptake of vitamin B(12) and trace metals in brains of mice treated with clioquinol. J Neurol Sci, 173, 40-4.
YEON, J. A. & KIM, S. J. 2010. Neuroprotective Effect of Taurine against Oxidative Stress-Induced Damages in Neuronal Cells. Biomolecules & Therapeutics, 18, 24-31.
YLIKANGAS, H., MALMIOJA, K., PEURA, L., GYNTHER, M., NWACHUKWU, E. O., LEPPANEN, J., LAINE, K., RAUTIO, J., LAHTELA-KAKKONEN, M., HUTTUNEN, K. M. & POSO, A. 2014. Quantitative insight into the design of compounds recognized by the L-type amino acid transporter 1 (LAT1). ChemMedChem, 9, 2699-707.
YOU, L. H., LI, F., WANG, L., ZHAO, S. E., WANG, S. M., ZHANG, L. L., ZHANG, L. H., DUAN, X. L., YU, P. & CHANG, Y. Z. 2015. Brain iron accumulation exacerbates the pathogenesis of MPTP-induced Parkinson’s disease. Neuroscience, 284, 234-246.
YOU, L. H., YAN, C. Z., ZHENG, B. J., CI, Y. Z., CHANG, S. Y., YU, P., GAO, G. F., LI, H. Y., DONG, T. Y. & CHANG, Y. Z. 2017. Astrocyte hepcidin is a key factor in LPS-induced neuronal apoptosis. Cell Death Dis, 8, e2676.

REFERENCES
283
YOUDIM, M. B. H., GRÜNBLATT, E. & MANDEL, S. 1999. The Pivotal Role of Iron in NF-κB Activation and Nigrostriatal Dopaminergic Neurodegeneration: Prospects for Neuroprotection in Parkinson's Disease with Iron Chelators. Annals of the New York Academy of Sciences, 890, 7-25.
YOUDIM, M. B., FRIDKIN, M. & ZHENG, H. 2005. Bifunctional drug derivatives of MAO-B inhibitor rasagiline and iron chelator VK-28 as a more effective approach to treatment of brain ageing and ageing neurodegenerative diseases. Mech Ageing Dev, 126, 317-26.
YOUDIM, M. B., GASSEN, M., GROSS, A., MANDEL, S. & GRUNBLATT, E. 2000. Iron chelating, antioxidant and cytoprotective properties of dopamine receptor agonist; apomorphine. J Neural Transm Suppl, 83-96.
YOUDIM, M. B., GRUNBLATT, E., LEVITES, Y., MAOR, G. & MANDEL, S. 2002. Early and late molecular events in neurodegeneration and neuroprotection in Parkinson's disease MPTP model as assessed by cDNA microarray; the role of iron. Neurotox Res, 4, 679-689.
ZAMARAEVA, M. V., SABIROV, R. Z., MAENO, E., ANDO-AKATSUKA, Y., BESSONOVA, S. V. & OKADA, Y. 2005. Cells die with increased cytosolic ATP during apoptosis: a bioluminescence study with intracellular luciferase. Cell Death Differ, 12, 1390-7.
ZECCA, L., TAMPELLINI, D., GERLACH, M., RIEDERER, P., FARIELLO, R. G. & SULZER, D. 2001. Substantia nigra neuromelanin: structure, synthesis, and molecular behaviour. Molecular Pathology, 54, 414-418.
ZECCA, L., YOUDIM, M. B. H., RIEDERER, P., CONNOR, J. R. & CRICHTON, R. R. 2004. Iron, brain ageing and neurodegenerative disorders. Nat Rev Neurosci, 5, 863-873.
ZENG, B. Y., BUKHATWA, S., HIKIMA, A., ROSE, S. & JENNER, P. 2006. Reproducible nigral cell loss after systemic proteasomal inhibitor administration to rats. Ann Neurol, 60, 248-52.
ZHANG, W., WANG, T., PEI, Z., MILLER, D. S., WU, X., BLOCK, M. L., WILSON, B., ZHANG, W., ZHOU, Y., HONG, J. S. & ZHANG, J. 2005. Aggregated alpha-synuclein activates microglia: a process leading to disease progression in Parkinson's disease. Faseb j, 19, 533-42.
ZHANG, X.-M., YIN, M. & ZHANG, M.-H. 2014. Cell-based assays for Parkinson's disease using differentiated human LUHMES cells. Acta Pharmacol Sin, 35, 945-956.
ZHANG, Y., HUO, M., ZHOU, J. & XIE, S. 2010. PKSolver: An add-in program for pharmacokinetic and
pharmacodynamic data analysis in Microsoft Excel. Comput Methods Programs Biomed, 99, 306-14.
ZHANG, Z., ANDERSEN, A., SMITH, C., GRONDIN, R., GERHARDT, G. & GASH, D. 2000. Motor slowing and parkinsonian signs in aging rhesus monkeys mirror human aging. J Gerontol A Biol Sci Med Sci, 55, B473-80.
ZHENG, H., BLAT, D. & FRIDKIN, M. 2006. Novel neuroprotective neurotrophic NAP analogs targeting metal toxicity and oxidative stress: potential candidates for the control of neurodegenerative diseases. J Neural Transm Suppl, 163-72.
ZHENG, H., GAL, S., WEINER, L. M., BAR-AM, O., WARSHAWSKY, A., FRIDKIN, M. & YOUDIM, M. B. 2005. Novel multifunctional neuroprotective iron chelator-monoamine oxidase inhibitor drugs for neurodegenerative diseases: in vitro studies on antioxidant activity, prevention of lipid peroxide formation and monoamine oxidase inhibition. J Neurochem, 95, 68-78.
ZHENG, P. P., ROMME, E., VAN DER SPEK, P. J., DIRVEN, C. M. F., WILLEMSEN, R. & KROS, J. M. 2010. Glut1/SLC2A1 Is Crucial for the Development of the Blood-Brain Barrier In Vivo. Annals of Neurology, 68, 835-844.

REFERENCES
284
ZHOU, C., HUANG, Y., SHAO, Y., MAY, J., PROU, D., PERIER, C., DAUER, W., SCHON, E. A. & PRZEDBORSKI, S. 2008. The kinase domain of mitochondrial PINK1 faces the cytoplasm. Proc Natl Acad Sci U S A, 105, 12022-7.
ZHOU, F. M., LIANG, Y., SALAS, R., ZHANG, L., DE BIASI, M. & DANI, J. A. 2005. Corelease of dopamine and serotonin from striatal dopamine terminals. Neuron, 46, 65-74.
ZHOU, T., MA, Y., KONG, X. & HIDER, R. C. 2012. Design of iron chelators with therapeutic application. Dalton Transactions, 41, 6371-6389.
ZHU, W., XIE, W., PAN, T., XU, P., FRIDKIN, M., ZHENG, H., JANKOVIC, J., YOUDIM, M. B. & LE, W. 2007. Prevention and restoration of lactacystin-induced nigrostriatal dopamine neuron degeneration by novel brain-permeable iron chelators. Faseb j, 21, 3835-44.
ZHU, Y., WANG, B., TAO, K., YANG, H., WANG, Y., ZHOU, T., YANG, Y., YUAN, L., LIU, X. & DUAN, Y. 2017b. Iron accumulation and microglia activation contribute to substantia nigra hyperechogenicity in the 6-OHDA-induced rat model of Parkinson's disease. Parkinsonism Relat Disord, 36, 76-82.
ZHU, Y., WANG, B., TAO, K., YANG, H., WANG, Y., ZHOU, T., YANG, Y., YUAN, L., LIU, X. & DUAN, Y. 2017. Iron accumulation and microglia activation contribute to substantia nigra hyperechogenicity in the 6-OHDA-induced rat model of Parkinson's disease. Parkinsonism Relat Disord, 36, 76-82.
ZIGMOND, M. J., BERGER, T. W., GRACE, A. A. & STRICKER, E. M. 1989. Compensatory responses to nigrostriatal bundle injury. Studies with 6-hydroxydopamine in an animal model of parkinsonism. Mol Chem Neuropathol, 10, 185-200.
ZLOKOVIC, B. V. 2008. The blood-brain barrier in health and chronic neurodegenerative disorders. Neuron, 57, 178-201.
ZLOKOVIC, B. V., MACKIC, J. B., MCCOMB, J. G., WEISS, M. H., KAPLOWITZ, N. & KANNAN, R. 1994. Evidence for transcapillary transport of reduced glutathione in vascular perfused guinea-pig brain. Biochem Biophys Res Commun, 201, 402-8.
ZORZI, G., ZIBORDI, F., CHIAPPARINI, L., BERTINI, E., RUSSO, L., PIGA, A., LONGO, F., GARAVAGLIA, B., AQUINO, D., SAVOIARDO, M., SOLARI, A. & NARDOCCI, N. 2011. Iron-related MRI images in patients with pantothenate kinase-associated neurodegeneration (PKAN) treated with deferiprone: results of a phase II pilot trial. Mov Disord, 26, 1756-9.