
Studentthesis-Timothy_Lockie_2012.pdf - King's Research ...
235
This electronic thesis or dissertation has been downloaded from the King’s Research Portal at https://kclpure.kcl.ac.uk/portal/ Take down policy If you believe that this document breaches copyright please contact [email protected] providing details, and we will remove access to the work immediately and investigate your claim. END USER LICENCE AGREEMENT Unless another licence is stated on the immediately following page this work is licensed under a Creative Commons Attribution-NonCommercial-NoDerivatives 4.0 International licence. https://creativecommons.org/licenses/by-nc-nd/4.0/ You are free to copy, distribute and transmit the work Under the following conditions: Attribution: You must attribute the work in the manner specified by the author (but not in any way that suggests that they endorse you or your use of the work). Non Commercial: You may not use this work for commercial purposes. No Derivative Works - You may not alter, transform, or build upon this work. Any of these conditions can be waived if you receive permission from the author. Your fair dealings and other rights are in no way affected by the above. The copyright of this thesis rests with the author and no quotation from it or information derived from it may be published without proper acknowledgement. Adaptive Mechanisms of the Heart to Ischaemic Stress Lockie, Tim Awarding institution: King's College London Download date: 16. Feb. 2022
-
Upload
khangminh22 -
Category
Documents
-
view
0 -
download
0
Transcript of Studentthesis-Timothy_Lockie_2012.pdf - King's Research ...
This electronic thesis or dissertation has been
downloaded from the King’s Research Portal at
https://kclpure.kcl.ac.uk/portal/
Take down policy
If you believe that this document breaches copyright please contact [email protected] providing
details, and we will remove access to the work immediately and investigate your claim.
END USER LICENCE AGREEMENT
Unless another licence is stated on the immediately following page this work is licensed
under a Creative Commons Attribution-NonCommercial-NoDerivatives 4.0 International
licence. https://creativecommons.org/licenses/by-nc-nd/4.0/
You are free to copy, distribute and transmit the work
Under the following conditions:
Attribution: You must attribute the work in the manner specified by the author (but not in anyway that suggests that they endorse you or your use of the work).
Non Commercial: You may not use this work for commercial purposes.
No Derivative Works - You may not alter, transform, or build upon this work.
Any of these conditions can be waived if you receive permission from the author. Your fair dealings and
other rights are in no way affected by the above.
The copyright of this thesis rests with the author and no quotation from it or information derived from it
may be published without proper acknowledgement.
Adaptive Mechanisms of the Heart to Ischaemic Stress
Lockie, Tim
Awarding institution:King's College London
Download date: 16. Feb. 2022

This electronic theses or dissertation has been
downloaded from the King’s Research Portal at
https://kclpure.kcl.ac.uk/portal/
The copyright of this thesis rests with the author and no quotation from it or information
derived from it may be published without proper acknowledgement.
Take down policy
If you believe that this document breaches copyright please contact [email protected]
providing details, and we will remove access to the work immediately and investigate your claim.
END USER LICENSE AGREEMENT
This work is licensed under a Creative Commons Attribution-NonCommercial-NoDerivs 3.0
Unported License. http://creativecommons.org/licenses/by-nc-nd/3.0/
You are free to:
Share: to copy, distribute and transmit the work Under the following conditions:
Attribution: You must attribute the work in the manner specified by the author (but not in any way that suggests that they endorse you or your use of the work).
Non Commercial: You may not use this work for commercial purposes.
No Derivative Works - You may not alter, transform, or build upon this work.
Any of these conditions can be waived if you receive permission from the author. Your fair dealings
and other rights are in no way affected by the above.
Title:Adaptive Mechanisms of the Heart to Ischaemic Stress
Author:Timothy Lockie
1
Adaptive Mechanisms of the Heart to Ischaemic Stress
Version 1.3
Timothy Paul Emrys Lockie
Kings College London Cardiovascular Division
Rayne Institute, BHF Centre 4th Floor Lambeth Wing St Thomas’ Hospital London, SE1 7EH
Submitted for the
Degree of Doctor of Philosophy
To the University of London
2012
2
ABSTRACT
Background
The response of the human heart to ischaemic stress is not uniform and adaptive
mechanisms play a role in attenuating myocyte damage and improving performance.
The mechanisms of such adaptations are poorly understood and likely multifactorial.
The main aim of this thesis was to examine these mechanisms using the models of
exercise induced myocardial ischaemia and acute myocardial infarction
Methods
Using a specially adapted supine ergometer, we used invasive physiological
measurements and high-‐resolution cardiac magnetic resonance imaging to assess
changes in coronary blood flow, central haemodynamics and transmural myocardial
perfusion during exercise. In a separate group, we sought to examine the role of
post-‐conditioning as a potential therapeutic tool in a randomised controlled trial
involving patients undergoing primary percutaneous revascularisation for acute
myocardial infarction.
Results
We were able to demonstrate that the reduction of ischaemia seen on second
exercise in patients with stable coronary artery disease is associated with synergistic
changes in central and coronary haemodynamics, with a fall in myocardial
microvascular resistance and enhanced vascular-‐ventricular coupling. High-‐speed
CMR perfusion imaging using k-‐t acceleration is a feasible tool to investigate these
differences, with sufficient spatial resolution to detect transmural flow
heterogeneity. The data from the postconditioning study did not show a difference
in infarct size between the groups but numbers were small.
Conclusion
The mechanisms of adaptation of the heart to ischaemic stress are complex and
likely multifactorial. These results suggest that synergistic changes in systemic and
coronary circulations as part of a generalised reactive hyperaemic vasodilatory
response to exercise results in improved myocardial perfusion and overall

3
performance. Transmural flow redistribution to the subendocardium is likely to play
an important role in attenuating myocardial ischaemia on repeat exercise although
we await the results of ongoing work. Innate myocardial protection, such as that
afforded by postconditioning remains a possibility, although the results from this
study are inconclusive.

4
ACKNOWLEDGMENTS
I would like to thank my supervisors, Professor Simon Redwood and Professor Sven
Plein for their inspiration and expertise throughout the period of my research. I am
also deeply indebted to Professor Michael Marber. The clinical studies in this thesis
were a challenge to get going as all had to be practically started from scratch,
especially those relating to the exercise bikes that were specially developed for the
catheterisation lab and the MRI scanner. They all required endless meetings to
convince, cajole and eventually complete and without the enthusiasm and support
of my supervisors this project would certainly have fallen short at any of the
innumerable hurdles that arose along the way.
On this note I would also like to thank the staff of the cath labs at St Thomas’ who
would let out a groan as I wheeled my research kit into the lab for another study, but
without whom these studies could not have been completed and whose suggestions
and advice were invaluable in the evolution of the final clinical protocol. I am also
grateful to the skills and patience of the CMR radiographers in the Rayne Institute for
expertly optimising and assisting in the CMR studies.
I would like to thank all my fellow research fellows for their important help in
recruitment of patients and volunteers. I am also very grateful to Dr. Maria Siebes
and her team at the AMC Hospital in Amsterdam for their generous support with
data analysis and world-‐class expertise in the intricacies of coronary pressure and
flow measurements.
I would like to acknowledge all the beautiful places around the world where my
family has spread, including Malabar (Australia), Unterphüret (Austria), El Trapiche
(Spain) and Alissos (Greece). I was lucky enough to go and spend time in each one
over the last year and as well as the warmth and familiarity provided by all my loved
ones I was able find a small corner with my lap-‐top and complete the writing of this
thesis.

5
I am also deeply grateful to my wife Nadia, who was a constant source of support
and love without whom I could not have completed this work. It is to her that I
dedicate my thesis.
This Thesis was kindly supported by a Fellowship from the British Heart Foundation
6
TABLE OF CONTENTS
Abstract 2 Acknowledgments 4 Table of Contents 6
List of Figures 10
1 Background 13 1.1 Anatomy and Physiology of the Human Circulation 14 1.1.1 The Coronary Circulation 14 1.1.2 Coronary Blood Flow and Exercise: In the Normal Heart 16 1.1.3 Coronary Blood Flow and Exercise: In the Presence of Coronary Stenoses 23 1.1.4 Systemic Arterial Blood Flow 28
1.2 Ischaemic Heart Disease 31 1.2.1 Warm-‐Up Angina 31 1.2.2 Myocardial Infarction and “No Re-‐Flow” 35
1.3 Non-‐Invasive Techniques to Investigate Ischaemic Heart Disease 39 1.3.1 Detection of Reversible Myocardial Ischaemia 39 1.3.2 Cardiac Magnetic Resonance Imaging 41
1.4 Invasive Techniques to Investigate Ischaemic Heart Disease 49 1.4.1 X Ray Coronary Angiography 49 1.4.2 Invasive Coronary Physiology 50
1.5 Aims and Outline of this Thesis 54
2 Methods and Techniques used in this thesis 56 2.1 Introduction 56 2.2 Catheter Lab Derived Data 57 2.2.1 Assessment of Coronary Pressure and Flow 57 2.2.2 Pulse Wave Analysis 62 2.2.3 Wave Intensity Analysis 64 2.2.4 Assessment of Invasive Coronary Pressure and Flow During Exercise Stress
70 2.3 Cardiac Magnetic Resonance Imaging Methods 82 2.3.1 Determining Infarct Size and Microvascular Obstruction 82 2.3.2 Dynamic Contrast Enhanced Perfusion Methods 83
7
2.3.3 Development of an Exercise-‐Stress CMR Perfusion Protocol 92 2.4 Acknowledgements 105
3 A Clinical Trial Examining Postconditioning of the Myocardium Following
Myocardial Infarction: Innate Cardiac Protection? 106 3.1 Abstract 107 3.2 Background 108 3.3 Aims 110 3.4 Study Design 111 3.4.1 Inclusion criteria 111 3.4.2 Exclusion criteria 111 3.4.3 Randomisation 111 3.4.4 Interventional Protocol 111 3.4.5 Cardiac Magnetic Resonance Imaging 112 3.4.6 Power Calculations and Sample Size 113 3.4.7 Ethics 114
3.5 Results 114 3.5.1 Baseline characteristics 114 3.5.2 Coronary Angiography and Primary PCI 115 3.5.3 Enzymatic Infarct Size 118 3.5.4 ST-‐Segment Shift 120 1.1.5 Cardiac Magnetic Resonance Imaging 120
3.6 Discussion 122 3.7 Study Limitations 126 3.8 Conclusion 127 3.9 Acknowledgements 128
4 K-‐t Accelerated MRI Perfusion to Detect Coronary Ischaemia 129 4.1 Abstract 130 4.2 Background 131 4.3 Objectives 132 4.4 Methods 132 4.4.1 Volunteer Recruitment 132 4.4.2 Patient Recruitment 132 4.4.3 CMR Protocol 133 4.4.4 Cardiac Catheterisation Lab Protocol 133 4.4.5 CMR Perfusion Analysis 134

8
4.4.6 Statistical Analysis 135 4.5 Results 136 4.5.1 Volunteer Studies 136 4.5.2 Patient Studies 137
4.6 Discussion 145 4.7 Study Limitations 147 4.8 Conclusions 148 4.9 Acknowledgments 148
5 Synergistic Adaptations to Exercise in the Systemic and Coronary Circulations
that Underlie Warm-‐Up Angina 149 5.1 Abstract 150 5.2 Background 151 5.3 Methods 152 5.3.1 Study Patients 152 5.3.2 Catheter laboratory protocol 152 5.3.3 Exercise protocol 153 5.3.4 Ethics 154 5.3.5 Data Analysis 154 5.3.6 Statistical Analysis 156
5.4 Results 157 5.5 Discussion 162 5.6 Limitations 173 5.7 Conclusions 174 5.8 Acknowledgments 174
6 Detection of Transmural flow heterogeneity using high resolution MRI
Perfusion Imaging 175 6.1 Abstract 176 6.2 Introduction 177 6.2.1 Coronary Physiology and Myocardial Perfusion During Exercise 177 6.2.2 High resolution CMR Imaging-‐ the Challenges of Exercise Stress 178 6.2.3 Rationale for the Proposed Study 179
6.3 Methods 180 6.3.1 Adenosine Protocol 180 6.3.2 Exercise Protocol 182 6.3.3 CMR Quantification Methods 183
9
6.3.4 Statistical Analysis 183 6.4 Results 183 6.4.1 Adenosine 183 6.4.2 Exercise 186
6.5 Discussion 186 6.5.1 Adenosine Stress Studies 187 6.5.2 Exercise Stress Study 190
6.6 Limitations 192 6.7 Future Work 193 6.8 Conclusion 195 6.9 Acknowledgments 196
7 Synthesis 197 7.1 Aims and Hypotheses of this Thesis 197 7.2 Summary of the Main Findings 198 7.2.1 Postconditioning in Acute Myocardial Infarction 198 7.2.2 High Resolution CMR Perfusion Imaging in Stable Coronary Disease 199 7.2.3 Synergistic Adaptations in Warm-‐Up Angina 200 7.2.4 Transmural Flow Heterogeneity During Exercise 201
7.3 Conclusion 202
8 Publications and Presentations Relating to this Thesis 203
9 References 207

10
LIST OF FIGURES Figure 1. Dr Heberden who first described classical angina pectoris ......................................................... 13 Figure 2. Anatomy of the heart showing the major epicardial coronary arteries ................................ 15 Figure 3. 3-‐Dimensional reconstruction of cryomicrotome ............................................................................ 15 Figure 4. A schematic overview of the effect of exercise on myocardial oxygen balance. ................. 19 Figure 5. A schematic of a coronary stenosis ......................................................................................................... 24 Figure 6. The quadratic nature of the stenosis pressure drop-‐velocity relationship ........................... 24 Figure 7. Coronary pressure-‐flow curve in the subepicardial (Epi) and subendocardial (Endo)
layers during autoregulation .............................................................................................................................................. 26 Figure 8. Typical resting ascending aortic waveform in a healthy middle-‐aged man. ....................... 30 Figure 9. Pressure waveforms obtained at baseline and during exercise ................................................. 31 Figure 10. Kinetics of gadolinium during the 3 different acquisition periods. ....................................... 43 Figure 11. Different CMR imaging methods. ......................................................................................................... 45 Figure 12. Summary of the k-‐t SENSE method. .................................................................................................... 47 Figure 13. Fivefold (5x) k-‐t SENSE–accelerated adenosine-‐induced stress 3.0-‐ and 1.5-‐T perfusion
MR images in a 65-‐year-‐old patient suspected of having coronary artery disease. ................................... 48 Figure 14. Pressure wire tracing from an LAD containing a moderate mid-‐vessel stenosis ............ 51 Figure 15. 0.014” Dual-‐sensor guide wire, Combowire® .................................................................................. 58 Figure 16. Screenshop from the ComboMap™ ...................................................................................................... 58 Figure 17. Bland-‐Altman Plots showing mean difference and standard error (SE) for A) Average
peak velocity (APV), B) coronary flow reserve (CFR), C) Pressure measurements, D) index
myocardial resistance (MRv), E) fractional flow reserve (FFR), and F) hyperaemic stenosis
resistance index (SRv). ........................................................................................................................................................... 62 Figure 18. Typical resting ascending aortic waveform in a healthy middle-‐aged man. .................... 64 Figure 19. Identification of waves in the human circumflex artery, ........................................................... 67 Figure 20. Sequence of energy waves in the human coronary artery during the cardiac cycle. .... 68 Figure 21. Coronary net wave intensity (dI) and the corresponding forward and backward
contributions. ............................................................................................................................................................................. 70 Figure 22. Supine cycle ergometer ............................................................................................................................. 73 Figure 23. Still image showing a 6F guiding catheter with a dual sensor pressure-‐flow wire
(Combowire) positioned in the left anterior descending artery (LAD) and a pressure wire positioned
in the aortic root. ..................................................................................................................................................................... 76 Figure 24. The set-‐up in the cath lab during an experimental exercise protocol. ................................. 77 Figure 25. Arterial pressure tracings taken at peak exercise showing the superior quality of the
central aortic pressure tracings. ....................................................................................................................................... 77 Figure 26. Diastolic (A) and systolic (B) frame from a cine CMR study acquired at the
midventricular level in the short-‐axis orientation in a patient with a recent anterior wall acute ST-‐
elevation MI. ............................................................................................................................................................................. 84
11
Figure 27. Examples of the sampling grid used to extract SI curves from apical (a), mid (b), and
basal (c) slice of a SA perfusion CMR series .................................................................................................................. 88 Figure 28. The heart is imaged every cardiac cycle during the first passage of gadolinium-‐based
contrast agent.. ......................................................................................................................................................................... 88 Figure 29. a) Mid-‐ventricular slice from an adenosine-‐stress CMR perfusion scan showing
mapping of the endo-‐and epicardial boarders scan, (b) associated signal intensity curve, (c)
associated deconvoluted signal intensity curve. ......................................................................................................... 90 Figure 30. Quantitative analysis of myocardial perfusion magnetic resonance images using the
Patlak plot method.. ................................................................................................................................................................ 92 Figure 31. Image of the MR compatible cycle ergometer ................................................................................ 95 Figure 32. Images taken from the volunteer exercise CMR studies.. ........................................................... 97 Figure 33. Plot of measured myocardial T1 vs. expected values extrapolated from previously
published contrast washout kinetics. ........................................................................................................................... 100 Figure 34. Patlack plots in a volunteer ................................................................................................................. 104 Figure 35. Study protocol for the cardiac catheterisation laboratory after the diagnostic
coronary angiogram confirming an occluded vessel (TIMI 0 flow) in patients being treated with
PPCI for acute STEMI. ......................................................................................................................................................... 112 Figure 36. Flow diagram showing recruitment to the study. ...................................................................... 118
Figure 38. Figure showing peak release of CK (IU) and the release over the first 36 hours after
presentation. .......................................................................................................................................................................... 119 Figure 39. Showing peak Troponin I (μg/L) at 12 hours after presentation. ...................................... 119 Figure 40. Showing ST-‐segment resolution on ECG following primary PCI. ........................................ 120 Figure 41. CMR images taken at 36 hours from a study patient presenting with a lateral STEMI
due to an occluded left circumflex coronary artery. .............................................................................................. 121 Figure 42. Showing mid slice short axis CMR images in a patient 21 hours after presenting with
an acute anterior ST-‐elevation MI. ................................................................................................................................ 123 Figure 43. Showing illustrating the main MRI data. ....................................................................................... 124 Figure 44. Comparison of FFR and diameter stenosis (%) with reference lines indicating an FFR
of 0.75 and diameter stenosis of 50%. ......................................................................................................................... 140 Figure 45. Effects of flow limiting and non-‐limiting stenoses on FFR and CMR perfusion images..
142 Figure 46. Receiver Operator Curve (ROC) showing the sensitivity and specificity of MR perfusion
visual analysis to detect a haemodynamically significant coronary stenosis using a dichotomous
value of 0.75 for fractional flow reserve (FFR).. ...................................................................................................... 143 Figure 47. Receiver Operator Curve (ROC) showing the sensitivity and specificity of MPR to detect
a haemodynamically significant coronary stenosis using a dichotomous value of 0.75 for fractional
flow reserve (FFR).. ............................................................................................................................................................... 143 Figure 48. Scatter plot showing the distribution of MPR values according to FFR using a
dichotomous cut-‐off of 0.75 to signify a significant lesion. ................................................................................. 144

12
Figure 49. Correlation between MPR and FFR .................................................................................................. 145 Figure 50. Summary of catheterisation lab exercise protocol. ................................................................... 154 Figure 51. Panel A shows a typical pressure waveform at rest recorded from the ascending aorta
in a healthy middle-‐aged man. ........................................................................................................................................ 155 Figure 52. Illustrating an example of flow velocity and pressure signals collected at baseline and
at peak equivalent workload during Exercise.1 and Exercise 2 from a sample patient. ....................... 161 Figure 53. Systemic parameters derived from aortic pressure at different time points for Ex1 and
Ex2. . ......................................................................................................................................................................... 165 Figure 54. Coronary parameters at different time points for Ex1 and Ex2. ......................................... 166 Figure 55. Coronary net wave intensity (dI) and the corresponding forward and backward
contributions taken at peak equivalent exercise from one of the study subjects. ..................................... 167 Figure 56. Showing the calculation of diastolic time fraction (DTF) from the central aortic
pressure waveform.. ............................................................................................................................................................. 181 Figure 57. Showing diastolic time fraction (DTF) and diastolic duration (in milliseconds) at rest
and during adenosine stress. . .......................................................................................................................................... 185 Figure 58. Differences in endo-‐ and epicardial flow at rest and stress. .................................................. 186 Figure 59. Showing differences in transmural flow and endo-‐ and epicardial flow differences both
during adenosine and exercise stress. .......................................................................................................................... 188
13
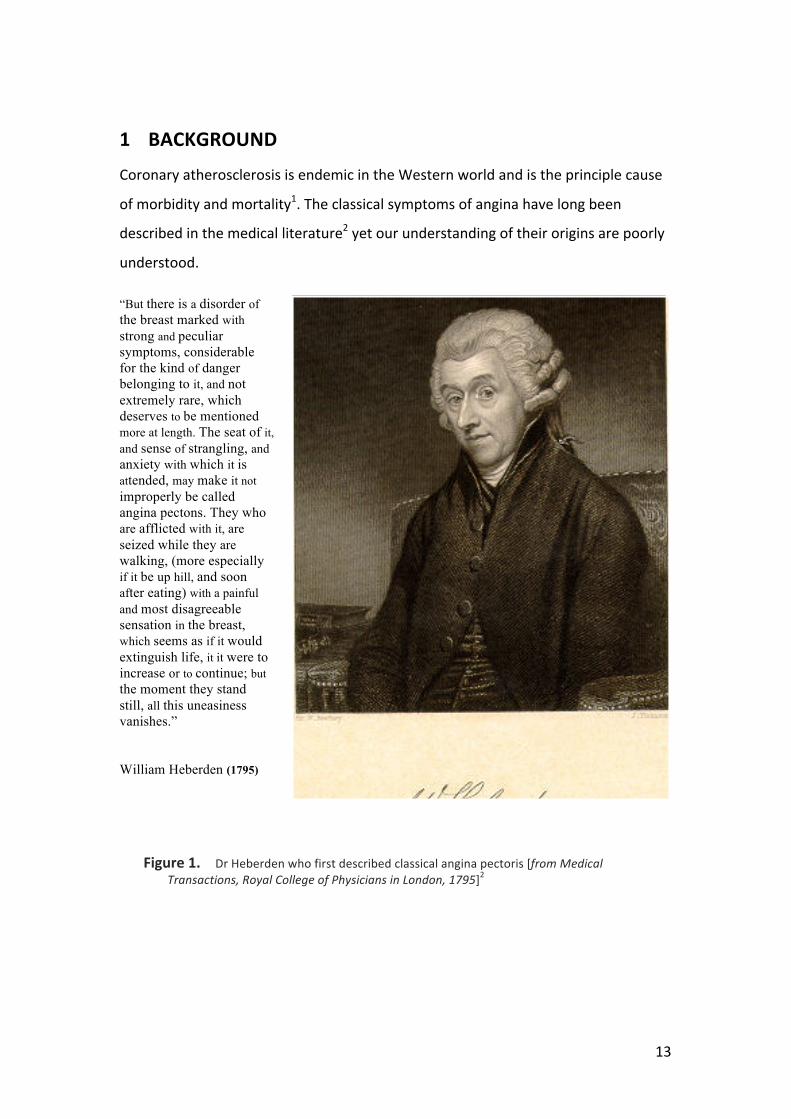
1 BACKGROUND
Coronary atherosclerosis is endemic in the Western world and is the principle cause
of morbidity and mortality1. The classical symptoms of angina have long been
described in the medical literature2 yet our understanding of their origins are poorly
understood.
“But there is a disorder of the breast marked with strong and peculiar symptoms, considerable for the kind of danger belonging to it, and not extremely rare, which deserves to be mentioned more at length. The seat of it, and sense of strangling, and anxiety with which it is attended, may make it not improperly be called angina pectons. They who are afflicted with it, are seized while they are walking, (more especially if it be up hill, and soon after eating) with a painful and most disagreeable sensation in the breast, which seems as if it would extinguish life, it it were to increase or to continue; but the moment they stand still, all this uneasiness vanishes.” William Heberden (1795)
Figure 1. Dr Heberden who first described classical angina pectoris [from Medical Transactions, Royal College of Physicians in London, 1795]2

Chapter 1. Background
14
1.1 Anatomy and Physiology of the Human Circulation
1.1.1 The Coronary Circulation The coronary circulation can be divided into three compartments: arteries,
microcirculation, and veins. The microcirculation can be further split into arterioles,
capillaries and venules. The epicardial compartment includes vessels ranging from
0.5mm-‐5mm. The predominant function of these vessels is to provide capacitance
and under normal conditions they offer minimal resistance to flow. The small
arteries then branch out into pre arterioles, which are 200μm -‐500μm in diameter
and are located on the epicardial surface of the heart. These vessels maintain
pressure at the entrance to the arterioles and are able to compensate for changes in
flow. These develop into arterioles less than 200μm, which can be further divided
into three sub compartments, each characterised by their size, function and
predominant regulatory mechanism. There is a significant overlap between the
mechanisms that regulate the flow of blood into the microcirculation. There is a
tendency for each domain of microvessel to have a predominant regulating
mechanism, and in the event that one mechanism becomes dysfunctional or is
inhibited, then other mechanisms become active to compensate. The largest of
these arterioles are 100μm -‐200μm in diameter. Kuo et al. demonstrated that
endothelial dependent dilation was most prominent in larger arterioles and least
effective in the smallest vessels3. In these vessels, an increase in flow rate causes
vasodilatation and a reduction in flow causes vasoconstriction. The medium sized
arterioles are 40μm -‐ 100μm in diameter and the main regulating mechanism is
dependent on intraluminal pressure changes in the vessels. Intraluminal pressure is
detected by vascular smooth muscle cell stretch receptors, which respond to
increased intraluminal pressure by causing vasoconstriction. Conversely a reduction
in intraluminal pressure causes compensatory vasodilatation due to smooth muscle
relaxation. This pressure sensitive mechanism is known as myogenic control4.
Endothelial dependent mechanisms are also present in medium sized arterioles,
although the dominant mechanism is myogenic mediation. The smallest arterioles
(<30 μm) are regulated by changes in metabolic activity, whereby an increase in
Chapter 1. Background
15
metabolic activity leads to vasodilatation3. Therefore in the microcirculation, an
increase in metabolic activity initially causes the tiny vessels to dilate. This causes a
secondary reduction in pressure upstream in the medium sized vessels causing
myogenic dilation, leading to increased flow further upstream in the larger arterioles
causing endothelial dependent dilation5. This self-‐regulating mechanism allows for
an integrated sequential activation from the smallest vessels to the largest arterioles
in response to increased metabolic demand. These mechanisms are discussed in
further detail below.
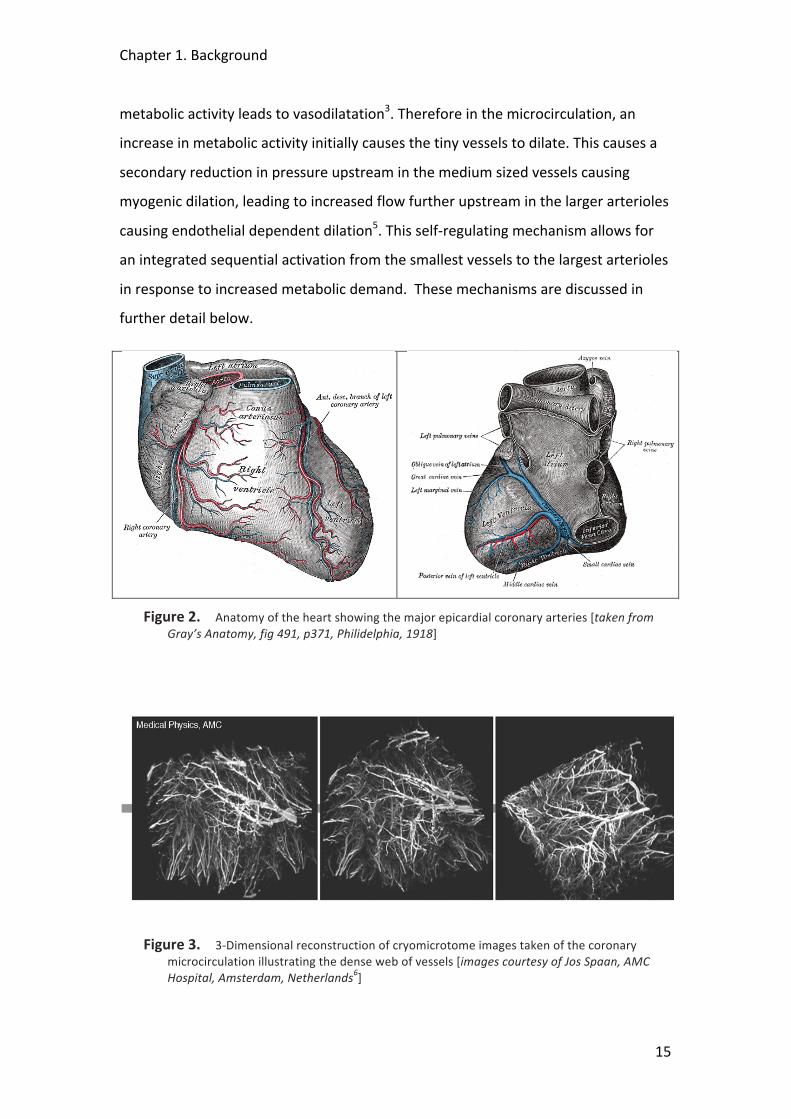
Figure 2. Anatomy of the heart showing the major epicardial coronary arteries [taken from Gray’s Anatomy, fig 491, p371, Philidelphia, 1918]
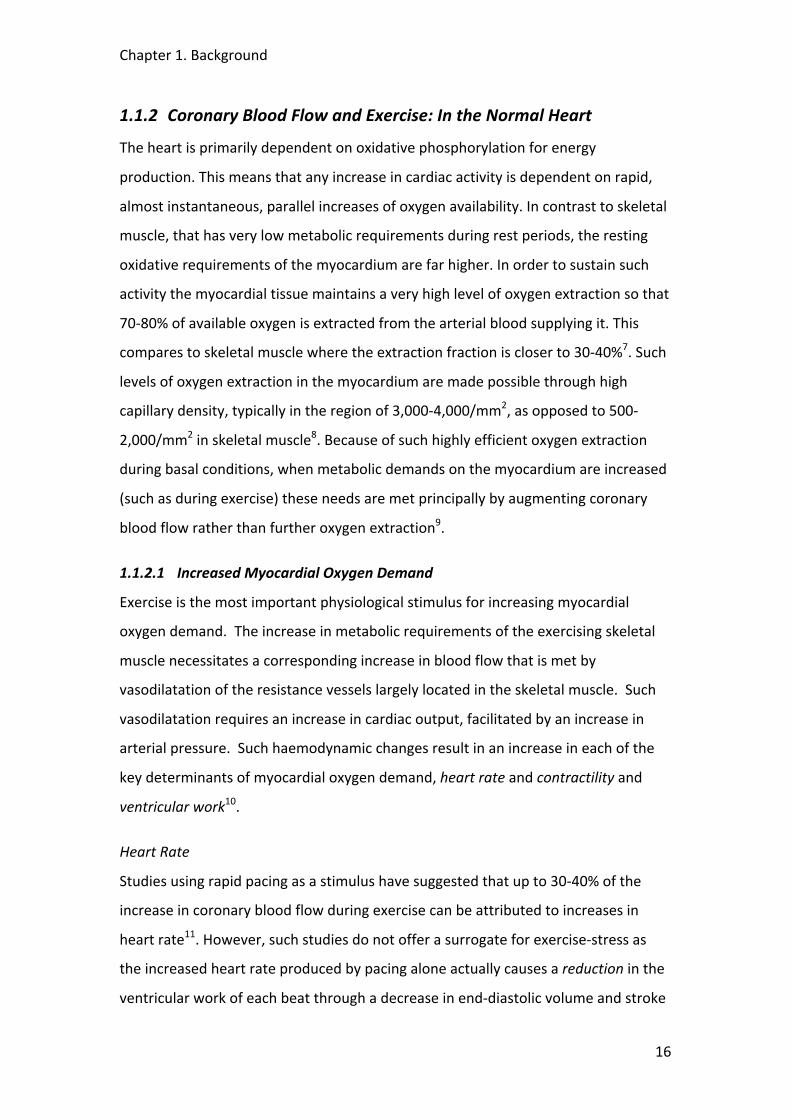
Figure 3. 3-‐Dimensional reconstruction of cryomicrotome images taken of the coronary microcirculation illustrating the dense web of vessels [images courtesy of Jos Spaan, AMC Hospital, Amsterdam, Netherlands6]
Chapter 1. Background
16
1.1.2 Coronary Blood Flow and Exercise: In the Normal Heart
The heart is primarily dependent on oxidative phosphorylation for energy
production. This means that any increase in cardiac activity is dependent on rapid,
almost instantaneous, parallel increases of oxygen availability. In contrast to skeletal
muscle, that has very low metabolic requirements during rest periods, the resting
oxidative requirements of the myocardium are far higher. In order to sustain such
activity the myocardial tissue maintains a very high level of oxygen extraction so that
70-‐80% of available oxygen is extracted from the arterial blood supplying it. This
compares to skeletal muscle where the extraction fraction is closer to 30-‐40%7. Such
levels of oxygen extraction in the myocardium are made possible through high
capillary density, typically in the region of 3,000-‐4,000/mm2, as opposed to 500-‐
2,000/mm2 in skeletal muscle8. Because of such highly efficient oxygen extraction
during basal conditions, when metabolic demands on the myocardium are increased
(such as during exercise) these needs are met principally by augmenting coronary
blood flow rather than further oxygen extraction9.
1.1.2.1 Increased Myocardial Oxygen Demand
Exercise is the most important physiological stimulus for increasing myocardial
oxygen demand. The increase in metabolic requirements of the exercising skeletal
muscle necessitates a corresponding increase in blood flow that is met by
vasodilatation of the resistance vessels largely located in the skeletal muscle. Such
vasodilatation requires an increase in cardiac output, facilitated by an increase in
arterial pressure. Such haemodynamic changes result in an increase in each of the
key determinants of myocardial oxygen demand, heart rate and contractility and
ventricular work10.
Heart Rate
Studies using rapid pacing as a stimulus have suggested that up to 30-‐40% of the
increase in coronary blood flow during exercise can be attributed to increases in
heart rate11. However, such studies do not offer a surrogate for exercise-‐stress as
the increased heart rate produced by pacing alone actually causes a reduction in the
ventricular work of each beat through a decrease in end-‐diastolic volume and stroke

Chapter 1. Background
17
volume, thereby underestimating myocardial oxygen consumption12. Overall, the
increase in heart rate during exercise is thought to contribute around 60% of the
increased myocardial oxygen consumption13.
Contractility
Beta-‐adrenergic activation as well as the direct positive inotropic effect of heart rate
cause the increased contractility observed during exercise14. In studies that used
propanolol to block beta-‐adrenergic receptors and rapid pacing to maintain a steady
heart rate it was estimated that the contribution of increased contractility to the
increase in oxygen consumption during exercise was in the region 15-‐25%15, 16. The
effect of beta-‐blockers in reducing left ventricular systolic pressure and stroke
volume and consequently left ventricular work per beat also needs to be
considered11.
Ventricular Work
Left ventricular work goes up during exercise in proportion to the increased
afterload that is primarily formed by increases in systolic arterial pressure. It is also
related to the increase in left ventricular end-‐diastolic volume17, 18. External work
increases as a result of the augmented stroke volume and hence smaller end-‐systolic
volume caused by the increased contractility resulting in an overall increase in
ventricular work. This accounts for around 15-‐25% of the increased myocardial
oxygen demand during exercise19.
1.1.2.2 Increased Myocardial Oxygen Supply
The increased oxygen demands of the myocardium during exercise are primarily met
through an augmentation in coronary flow. The increase in coronary blood flow
results from a combination of coronary vasodilatation, with a reduction in coronary
vascular resistance, and an increase in mean arterial pressure20-‐22.
Coronary Blood Flow
Resting left ventricular coronary blood flow in humans is in the range 0.5-‐
1.5ml/min/mg myocardium23-‐26. Dynamic exercise increases coronary blood flow in
proportion to the heart rate, with peak values during maximal exercise typically 3 to

Chapter 1. Background
18
5 times the resting level26, 27. This relationship is amazingly similar across different
species with a strong correlation on regression analysis of left ventricular blood flow
against heart rate13, 28, 29.
Oxygen-‐carrying Capacity
Unlike other species where oxygen delivery may be improved by a rise in
haemoglobin20, 30, the haemoglobin concentration in humans increases by no more
than 15% in response to upright exercise31 This is largely as a result of a reduction in
plasma volume resulting from extravasation of fluid from the capillaries during
exercise32. In addition, arterial oxygen tension and saturation are generally
unchanged during different grades of exercise in normal humans31.
Myocardial Oxygen Extraction
In many species the increase in oxygen delivery to the heart does not meet demand
thereby requiring an increase in oxygen extraction. In humans this increase is
relatively small due to the high levels of basal extraction attained at rest31, 33. The
decrease in blood pH resulting from lactate production by working skeletal muscle
has been reported to cause a rightward shift of the haemoglobin oxygen dissociation
curve thereby facilitating oxygen delivery to the myocardium, with an observed 8%
drop in coronary venous oxygen content, but minimal change in coronary oxygen
venous tension during exercise27, 34. Although the vast majority of increased oxygen
demands are met through increased blood flow, several mechanisms are thought to
contribute to this need for increased oxygen extraction. Adrenergic-‐mediated
vasoconstriction may attenuate the maximal increase in coronary blood flow during
exercise and hence contribute to the need for increased oxygen extraction. Studies
using α-‐adrenergic blocking agents showed an increase in myocardial blood flow
during exercise with a corresponding fall in myocardial oxygen extraction35, 36.
Chapter 1. Background
19
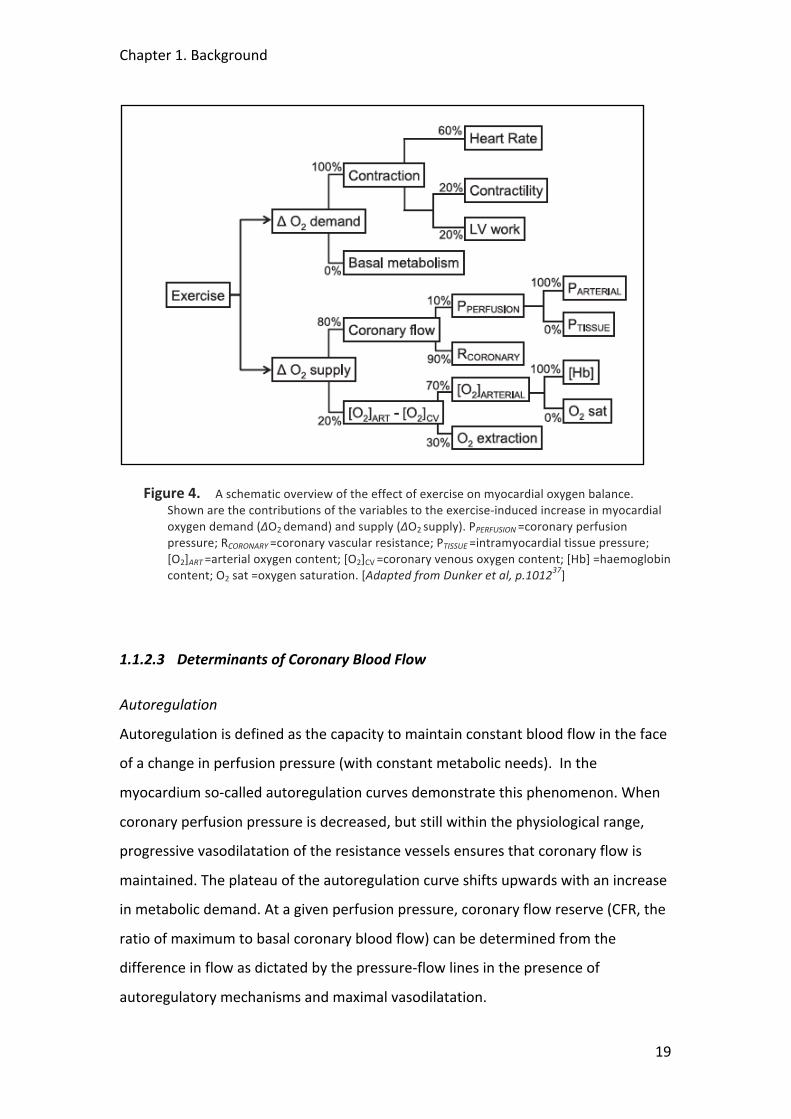
Figure 4. A schematic overview of the effect of exercise on myocardial oxygen balance. Shown are the contributions of the variables to the exercise-‐induced increase in myocardial oxygen demand (ΔO2 demand) and supply (ΔO2 supply). PPERFUSION =coronary perfusion pressure; RCORONARY =coronary vascular resistance; PTISSUE =intramyocardial tissue pressure; [O2]ART =arterial oxygen content; [O2]CV =coronary venous oxygen content; [Hb] =haemoglobin content; O2 sat =oxygen saturation. [Adapted from Dunker et al, p.101237]
1.1.2.3 Determinants of Coronary Blood Flow
Autoregulation
Autoregulation is defined as the capacity to maintain constant blood flow in the face
of a change in perfusion pressure (with constant metabolic needs). In the
myocardium so-‐called autoregulation curves demonstrate this phenomenon. When
coronary perfusion pressure is decreased, but still within the physiological range,
progressive vasodilatation of the resistance vessels ensures that coronary flow is
maintained. The plateau of the autoregulation curve shifts upwards with an increase
in metabolic demand. At a given perfusion pressure, coronary flow reserve (CFR, the
ratio of maximum to basal coronary blood flow) can be determined from the
difference in flow as dictated by the pressure-‐flow lines in the presence of
autoregulatory mechanisms and maximal vasodilatation.
Chapter 1. Background
20
Coronary Vascular Resistance
While the increased blood flow to the heart is in part due to the increased effective
perfusion pressure the majority of increase in coronary blood flow is mediated
through a reduction in coronary vascular resistance. Total coronary resistance is the
sum of both passive (structural) and active (smooth muscle tone) components. In the
completely vasodilated bed, flow to the different regions of the heart is determined
by the cross-‐sectional area of the vessels, the length of the vasculature, and the
number of parallel vessels that supply a defined perfusion territory. Blood flow has 3
major resistance components: the epicardial vessel (R1), the small arteries and
arterioles (R2) and the intramyocardial capillary system (R3). When coronary reserve
is normal these 3 resistances are assumed to be functioning normally. In patients
without atherosclerosis, the large epicardial vessel resistance (R1) is trivial. Arteries
with diameter >400μm have only minimal resistance. It is suggested that 90% of the
adjustment of coronary resistance that controls autoregulation resides in the small
(<400μm) resistance vessels, due to the integrated response of several mechanisms.
The myogenic response describes the property of these small resistance vessels to
respond to a change in transmural pressure by changing tone, resulting in a diameter
change in a direction opposite to the pressure stimulus38, 39. When the vasodilatory
capacity of these vessels is exhausted and vasomotor tone is absent during
ischaemic heart disease or following administration of vasodilators, then the vessels
react passively to changes in intraluminal pressure and their diameter changes in the
same direction as intraluminal pressure40, 41.
Flow dependent dilatation refers to the property of endothelial cells to respond to an
increase in blood flow by releasing nitric oxide (NO), which relaxes smooth muscle
tone and induces vasodilatation. Endothelial dependent hyperpolarizing factor
(EDHF) may act as a reserve for the NO-‐mediated flow-‐dependent dilatation
mechanism42.
1.1.2.4 Transmural Redistribution of Myocardial Blood Flow
There is abundant proof that coronary perfusion is impeded by cardiac contraction, a
process known as coronary systolic flow impediment (CSFI)43, 44. This means that
Chapter 1. Background
21
during basal conditions coronary arterial blood flow occurs predominantly during
diastole.
However, during heavy exercise due to high heart rates there is a progressive
increase in systolic flow such that up to 40-‐50% of coronary blood flow may occur
during systole20, 45. This has important implications for the transmural distribution of
blood flow, where the effects of ventricular extravascular compression have a
disproportionate effect on the subendocardium. During exercise there is a
redistribution of blood away from the subendocardial region towards the
epicardium46.
The Effect of Extravascular Compressive Forces
The pressure drop across the coronary vascular bed determines its effective
perfusion pressure, with the proximal pressure equal to central aortic pressure. The
effective backpressure, however, cannot be simply derived from right atrial pressure
because of the extravascular forces exerted on the compressible intramural coronary
vessels by the surrounding myocardium. The “vascular waterfall” and model
addresses the interaction between the intravascular distending pressure and the
extravascular compressive forces that occur during systole43, 44, 47, 48. It assumes that
the radial stress in the ventricular wall generates a tissue pressure that varies over
the myocardial wall, from LV pressure at the endocardium to thoracic pressure at
the epicardium. It further assumes that this tissue pressure acts on the outer
surface of the intramural vessels as a fluid pressure. If tissue pressure happens to
exceed coronary arterial pressure, then coronary flow would cease altogether. With
a lower tissue pressure only intramural veins would collapse locally and at this point
intramural pressure would equal tissue pressure. Flow, therefore, would be equal to
the difference between arterial and tissue pressure divided by the vascular
resistance between coronary main artery and the point of collapse. Thus, during
systole, the contracting myocardium generates a high level of intramyocardial
pressure that compresses the microvasculature resulting in the attenuation of flow.
Conversely, during diastole, intraventricular pressures transmitted into the left
ventricular wall exert a small compressive force on the intramural vascular network,
Chapter 1. Background
22
creating the so-‐called “waterfalls” at the level of the arterioles and venules47, 49.
While the vascular waterfall model provides a good framework to explain transmural
flow heterogeneity it ignores the variations in resistance during the cardiac cycle and
cannot account for retrograde systolic blood flow50. The “intramyocardial pump”
model is probably the best model to incorporate the dynamics of the cardiac cycle.
It includes the compliance of the intramural vessels and attributes systolic-‐diastolic
variations in coronary flow to an active intramyocardial pump and not resistances
varying over the cardiac cycle43. The phasic variation in coronary flow and pressure
during the cardiac cycle is complex and will be discussed in greater detail in Chapter
5.
Coronary Pressure-‐Flow Relationship During Exercise
The observation that coronary blood flow during exercise can be further augmented
with a pharmacological or ischaemic vasodilator stimulus suggests that, in the
normal heart, maximal exercise does not the result in the exhaustion of coronary
vasodilator reserve. Studies have demonstrated in dogs and swine a reactive
hyperaemia to brief episodes of coronary occlusion resulting in an increase in blood
flow during maximal exercise51, 52. Similarly, intravenous administration of adenosine
resulted in a 15-‐26% increase in myocardial blood flow during maximal exercise in
swine despite a fall in arterial pressure45, 53. It has been demonstrated that such
pharmacological induced increases of coronary blood flow during exercise can
enhance contractile function (known as the Gregg effect)7, 44.
Overall the increase in extravascular compressive forces during exercise is unlikely to
be of physiological significance in the normal coronary circulation because of the fact
that coronary vasodilator capacity reserve persists even during maximal exercise46, 53,
54. However, when the oxygen-‐carrying capacity of the blood is reduced by anaemia
or hypoxia or when obstructive atherosclerotic coronary disease reduces vascular
calibre and reactivity then the increased vascular forces produced by exercise can
produce significant restriction of coronary flow rates.

Chapter 1. Background
23
1.1.3 Coronary Blood Flow and Exercise: In the Presence of Coronary
Stenoses
1.1.3.1 Functional Effect of an Epicardial Stenosis on Coronary Flow
Normally the large epicardial coronary “conductance” vessels contribute little to
total coronary resistance. However, autoregulation becomes clinically important
when vessels become narrowed due to atherosclerotic disease. Such stenoses may
result in a variety of shapes and forms and may be rigid or compliant55. The
haemodynamic effect of a particular stenosis can be determined by the equation
(see p.16 KT), where Q is the flow through the lesion and A, B and C are constants
that depend on the geometry of the lesion and the viscous properties of the blood;
where all are critically dependent on the inverse fourth power of the diameter of the
stenosis56. The first term of the equation corresponds to the law of Poisuille and
describes the pressure drop because of the viscous friction exerted on the blood
stream by the stenotic wall. The second non-‐linear term refers to the pressure loss
caused by the convergence and divergence of flow as it enters and leaves the
stenosis respectively. According to the law of Bernoulli, velocity is increased and
therefore pressure must be decreased as the blood flow enters the stenosis. At the
exit, because of the increase in area flow velocity drops and this is accompanied by a
partial pressure recovery, but some energy is permanently lost due to flow
separation and eddy formation at the downstream end of the stenosis. Because of
these, pressure-‐drop increases quadrantically with flow (version of figure 2.9 KT
p.16 and also one of flow diagram of stenosis). A direct result of this is that stenosis
resistance (ΔP/Q) is flow dependent.
Chapter 1. Background
24
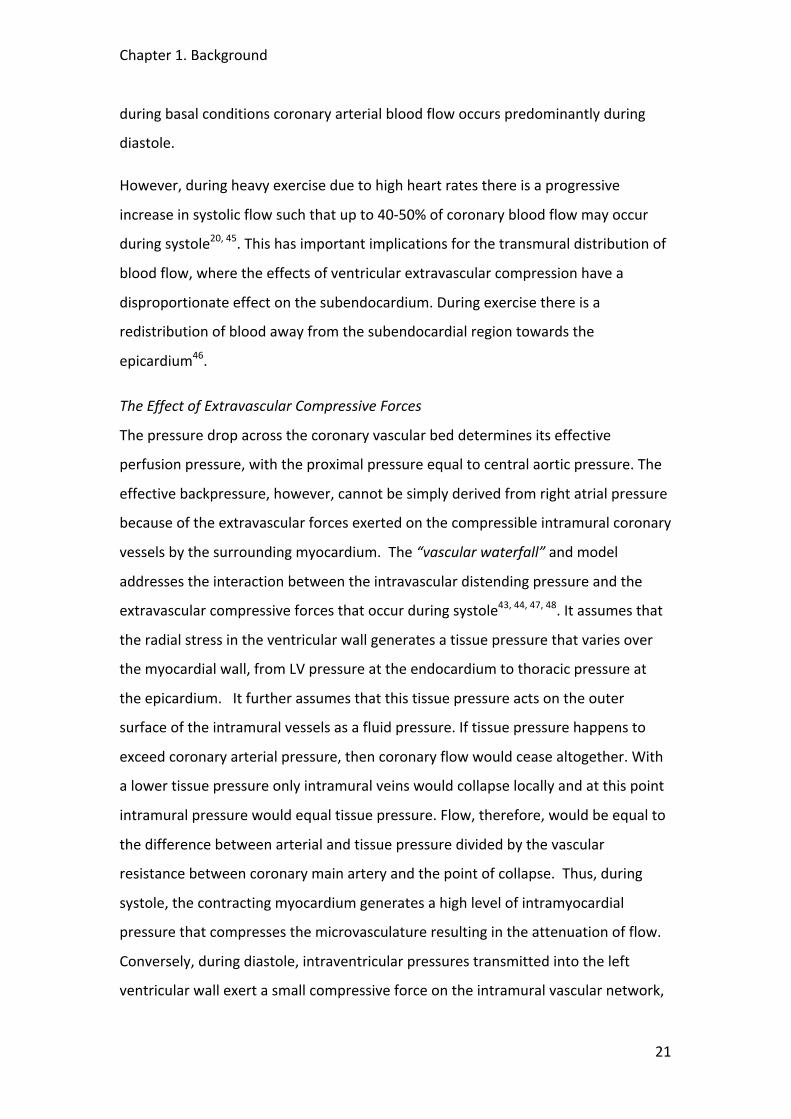
Figure 5. A schematic of a coronary stenosis showing the two main sources of pressure loss as blood flows through the stenosis. 1) frictional loss, and 2) inertial loss stemming from the sudden expansion at the exit of the stenosis causing flow separation and eddies [adapted from Kern et al figure 1 p.132357].
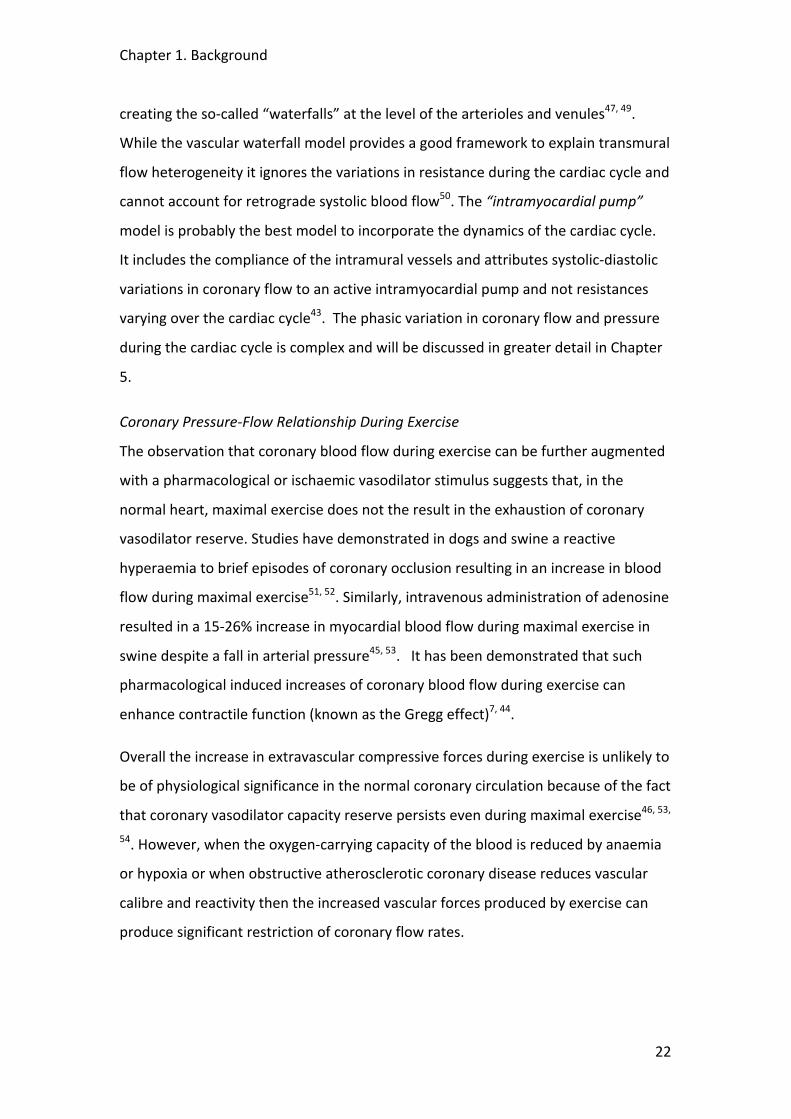
Figure 6. The quadratic nature of the stenosis pressure drop-‐velocity relationship illustrated by data obtained in a vessel of a patient with a moderate coronary stenosis (shown in closed circles) and in a normal reference vessel (open circles) using a dual sensor guidewire. Data points represent mean values of consecutive beats, from baseline to hyperaemia induced by i.c. adenosine injection [adapted from Kern el at figure 2 p.132357]
When the narrowing reaches over 50% of the luminal diameter, the increase in
proximal resistance causes a decrease in distal coronary perfusion pressure. In this
Chapter 1. Background
25
situation, autoregulation can preserve coronary blood flow, but maximum coronary
blood flow (such as measured during intracoronary infusion of adenosine) is
reduced. Consequently CFR, is reduced. When a diameter stenosis becomes so
severe as to reduce distal perfusion pressure to below 40mmHg during resting
conditions, then endogenous vasodilator reserve becomes exhausted resulting in
myocardial hypoperfusion and subsequent ischaemia58, 59.
1.1.3.2 Subendocardial/Subepicardial Coronary Perfusion
When autoregulation is intact then flow distribution between these different layers
is maintained in a relatively homogenous manner60. This is achieved by the
appropriate adjustment of vascular resistance at a local level and, provided that the
vasodilatory capacity of the resistance vessels in the subendocardium is sufficient,
demand and supply can still be matched in this myocardial layer.
Coronary Steal
Autoregulatory reserve, however, is not distributed evenly across the LV wall and
perfusion to the subendocardium is more impeded by myocardial contraction than
subepicardial flow43. This causes the lower limb of the autoregulatory curve to be
shifted to the right compared to that in the subepicardial layers as is illustrated in
the figure below. This also demonstrates the phenomenon of “coronary steal”. In
this situation, intracoronary infusions of adenosine (or dipyridomole) in the presence
of a severe stenosis where the subendocardial vasodilatory reserve is exhausted
results in enhanced subepicardial flow, thereby increasing the pressure gradient
across the stenosis and further attenuating subendocardial flow through the
consequent reduction in distal perfusion pressure59, 61.
When myocardial exercise oxygen consumption increases during exercise then the
autoregulatory curve will be shifted upwards (see figure above). During exercise, the
increased heart rate causes more systolic blood flow and results in an increase in
average myocardial tissue pressure, particularly in the subendocardial layers. This
explains why a subcritical coronary lesion can have little or no effect during resting
conditions but can result in selective subendocardial hypoperfusion during exercise
stress.
Chapter 1. Background
26
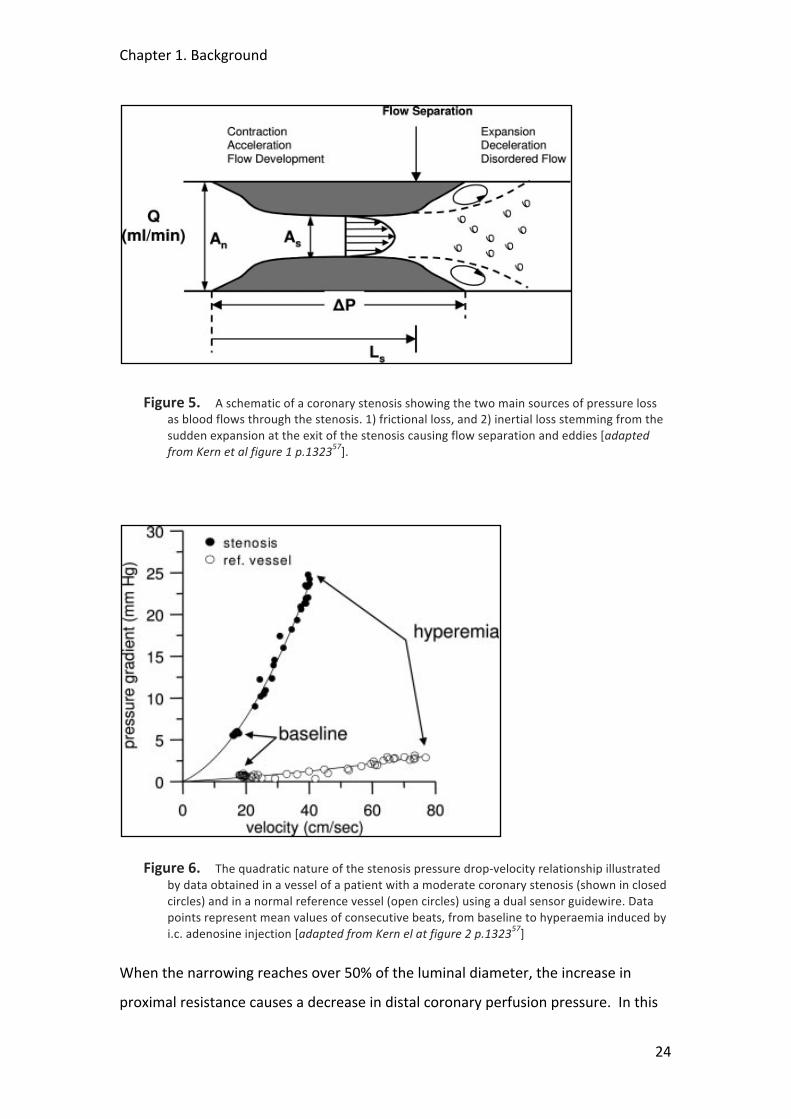
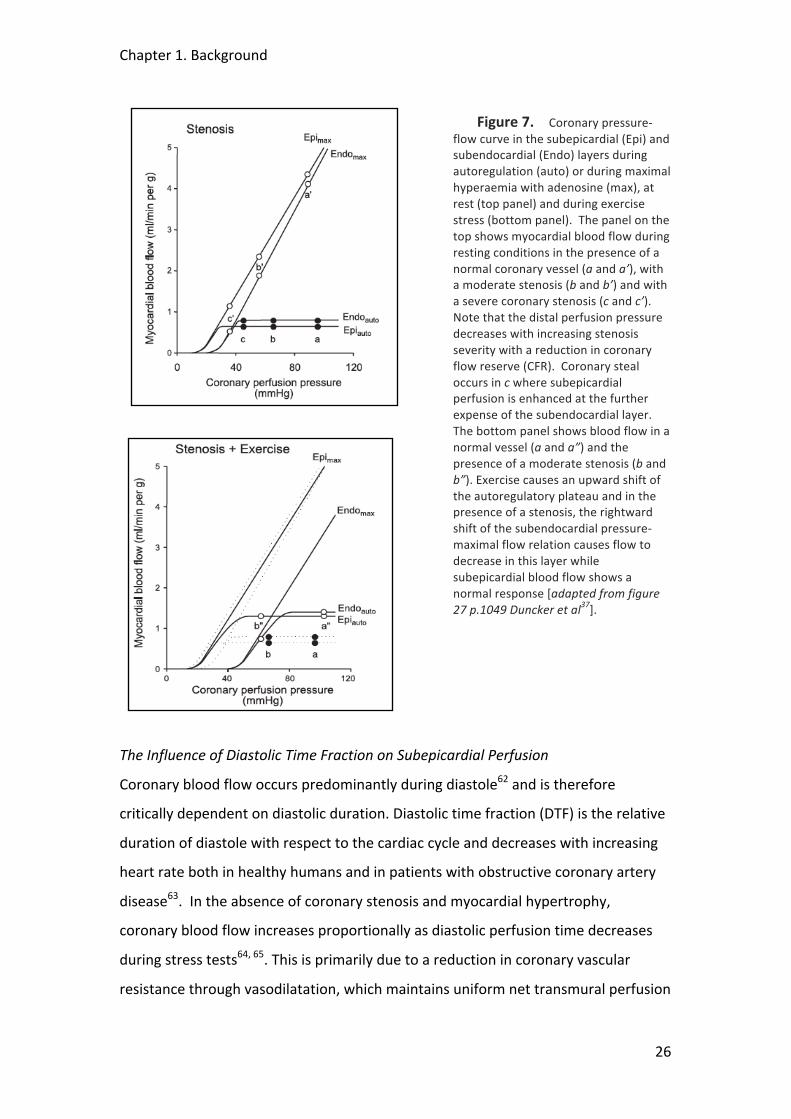
Figure 7. Coronary pressure-‐flow curve in the subepicardial (Epi) and subendocardial (Endo) layers during autoregulation (auto) or during maximal hyperaemia with adenosine (max), at rest (top panel) and during exercise stress (bottom panel). The panel on the top shows myocardial blood flow during resting conditions in the presence of a normal coronary vessel (a and a’), with a moderate stenosis (b and b’) and with a severe coronary stenosis (c and c’). Note that the distal perfusion pressure decreases with increasing stenosis severity with a reduction in coronary flow reserve (CFR). Coronary steal occurs in c where subepicardial perfusion is enhanced at the further expense of the subendocardial layer. The bottom panel shows blood flow in a normal vessel (a and a”) and the presence of a moderate stenosis (b and b”). Exercise causes an upward shift of the autoregulatory plateau and in the presence of a stenosis, the rightward shift of the subendocardial pressure-‐maximal flow relation causes flow to decrease in this layer while subepicardial blood flow shows a normal response [adapted from figure 27 p.1049 Duncker et al37].
The Influence of Diastolic Time Fraction on Subepicardial Perfusion
Coronary blood flow occurs predominantly during diastole62 and is therefore
critically dependent on diastolic duration. Diastolic time fraction (DTF) is the relative
duration of diastole with respect to the cardiac cycle and decreases with increasing
heart rate both in healthy humans and in patients with obstructive coronary artery
disease63. In the absence of coronary stenosis and myocardial hypertrophy,
coronary blood flow increases proportionally as diastolic perfusion time decreases
during stress tests64, 65. This is primarily due to a reduction in coronary vascular
resistance through vasodilatation, which maintains uniform net transmural perfusion
Chapter 1. Background
27
even if there is a marked reduction in diastolic perfusion time or higher heart rate60,
66. In the presence of significant coronary artery disease, however, during stress
these autoregulatory mechanisms are exhausted67, 68 and subendocardial perfusion
becomes inversely dependent on heart rate and decreases with decreasing DTF,
whereas subepicardial perfusion is minimally affected60, 66, 69. Importantly, while
diastolic perfusion time was found to be closely related to stenosis severity at the
onset of stress-‐induced myocardial ischaemia in humans, no correlation was found
between DTF and heart rate at the ischaemic threshold70. At a given heart rate, the
decrease in DTF at the ischaemic threshold was more marked in supine rather than
in upright exercise and more notable in exercise than in atrial pacing. This variation
reflects differences between the stressors that result from changes in left ventricular
loading conditions and sympathetic nervous system activity that have been shown to
influence systolic duration and consequently diastolic perfusion time, especially at
the onset of ischaemia71-‐73. By accounting for the amount of diastole (i.e. supply)
relative to that of systole (i.e. demand), this would explain why DTF is a much better
parameter for predicting subendocardial ischaemia than heart rate alone.
There is thought to be an inverse nonlinear relation between DTF and intracoronary
pressure and flow suggesting a possible protective mechanism whereby DTF
increases when coronary perfusion is impaired distal to a stenosis74. Such a
mechanism may explain the clinical benefit of betablockers where the
administration of urapidil, a selective α1-‐blocker, following coronary angioplasty
resulted in a significant prolongation in the DTF that was independent of heart
rate75.
Is Coronary Vasodilatation Maximal During Myocardial Ischaemia?
It is known from the descriptions of coronary steal that vasodilatory reserve can exist
in the subepicardium in the presence of a coronary stenosis causing subendocardial
ischaemia, but what is more uncertain is whether residual coronary reserve exists
within these ischaemic subendocardial regions. It has been traditionally assumed
that ischaemic stress induces maximal vasodilatation, overriding any persistent and
opposing vasoconstrictor control. Studies, however, have shown that this is not the
Chapter 1. Background
28
case with recruitable subendocardial vasodilator reserve still present even under
conditions of stress-‐induced ischaemia due to a flow-‐limiting coronary stenosis76-‐79.
When the coronary pressure distal to the stenosis was maintained at a constant
level, an intracoronary adenosine infusion was found to increase subendocardial
flow by 50% and subsequently enhance contractile function79. Such recruitment has
been shown to be most significant under conditions of increased sympathetic drive,
in particular during treadmill exercise80. This is consistent with the finding that
residual vasomotor tone during ischaemia has been found to reside within the small
arteriolar resistance vessels of the subendocardium suggesting that this reserve is
under the influence of α-‐adrenoreceptor stimulation that is not under local
metabolic control81.
1.1.4 Systemic Arterial Blood Flow
1.1.1.1 Central vs. Peripheral Blood Pressures
Traditionally, blood pressure is measured by cuff sphygmomanometry at the brachial
artery. However, there is variation in blood pressure throughout the arterial tree,
with systolic blood pressure increasing towards the periphery, while diastolic and
mean arterial pressures remain relatively constant. The overall effect is the
amplification of pulse pressure from the aorta to the brachial artery. Therefore,
blood pressure obtained peripherally is not representative of central blood
pressure82. It has been demonstrated that during exercise, aortic systolic blood
pressure may be overestimated by as much as 80 mmHg if only brachial systolic
blood pressure is considered83. The variation in pulse pressure throughout the
arterial tree is likely to be clinically important because the heart, coronary and
carotid arteries are influenced by central, not peripheral blood pressure. Indeed, it is
central blood pressure that determines left ventricular workload84 and correlates
with carotid artery intima-‐media thickness85, both of which are independent
predictors of mortality. Moreover, central blood pressure is a stronger predictor of
all-‐cause mortality in high-‐risk patients with cardiovascular disease than peripheral
blood pressure86. However, the difference between central and peripheral pressure
varies with a number of factors, including age, gender and heart rate87.
Chapter 1. Background
29
1.1.4.1 Propagation and Reflection of Pressure Waves
Central pressure waves generated during the cardiac cycle are propagated along the
arterial tree and return as reflected waves to interact with the out-‐going incident
waves. This results in characteristic waveform morphology, which is subject to
modification by various homeostatic and environmental factors and changes with
increasing distance from the heart. A typical central pressure waveform is shown in
Figure 8 below.
1.1.4.2 Changes in Arterial Pressure in Response to Exercise
Reduced Pressure Augmentation
Arterial pressure during exercise is largely dependent on the function of large elastic
and muscular arteries. Exercise induces marked changes in the arterial waveform,
similar to those changes induced by nitrovasodilators88 with a reduction in
augmentation of the central and peripheral pulse waveforms and a reduction in
central systolic pressure and central pulse pressure to a greater degree than
peripheral pressure88, 89. These effects are thought to be due to a reduction of
pressure wave reflection from peripheral to central arteries by vasodilatation of
muscular arteries. The changes in arterial waveform increase with increasing
intensity of exercise and persist for up to 60 minutes into recovery. These changes
appear to be independent of heart rate and other changes in ventricular ejection
characteristics that occur acutely during exercise as the changes in waveform
morphology are observed well after the heart rate has returned to baseline.
Chapter 1. Background
30
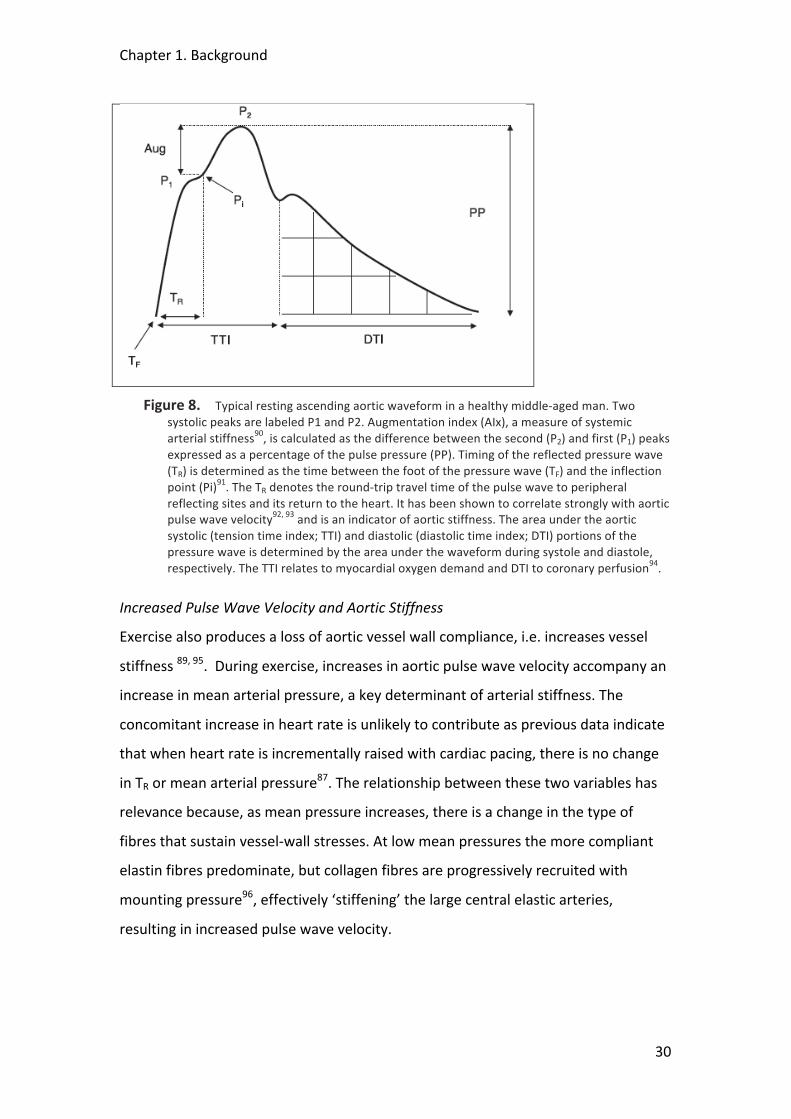
Figure 8. Typical resting ascending aortic waveform in a healthy middle-‐aged man. Two systolic peaks are labeled P1 and P2. Augmentation index (AIx), a measure of systemic arterial stiffness90, is calculated as the difference between the second (P2) and first (P1) peaks expressed as a percentage of the pulse pressure (PP). Timing of the reflected pressure wave (TR) is determined as the time between the foot of the pressure wave (TF) and the inflection point (Pi)91. The TR denotes the round-‐trip travel time of the pulse wave to peripheral reflecting sites and its return to the heart. It has been shown to correlate strongly with aortic pulse wave velocity92, 93 and is an indicator of aortic stiffness. The area under the aortic systolic (tension time index; TTI) and diastolic (diastolic time index; DTI) portions of the pressure wave is determined by the area under the waveform during systole and diastole, respectively. The TTI relates to myocardial oxygen demand and DTI to coronary perfusion94.
Increased Pulse Wave Velocity and Aortic Stiffness
Exercise also produces a loss of aortic vessel wall compliance, i.e. increases vessel
stiffness 89, 95. During exercise, increases in aortic pulse wave velocity accompany an
increase in mean arterial pressure, a key determinant of arterial stiffness. The
concomitant increase in heart rate is unlikely to contribute as previous data indicate
that when heart rate is incrementally raised with cardiac pacing, there is no change
in TR or mean arterial pressure87. The relationship between these two variables has
relevance because, as mean pressure increases, there is a change in the type of
fibres that sustain vessel-‐wall stresses. At low mean pressures the more compliant
elastin fibres predominate, but collagen fibres are progressively recruited with
mounting pressure96, effectively ‘stiffening’ the large central elastic arteries,
resulting in increased pulse wave velocity.
Chapter 1. Background
31
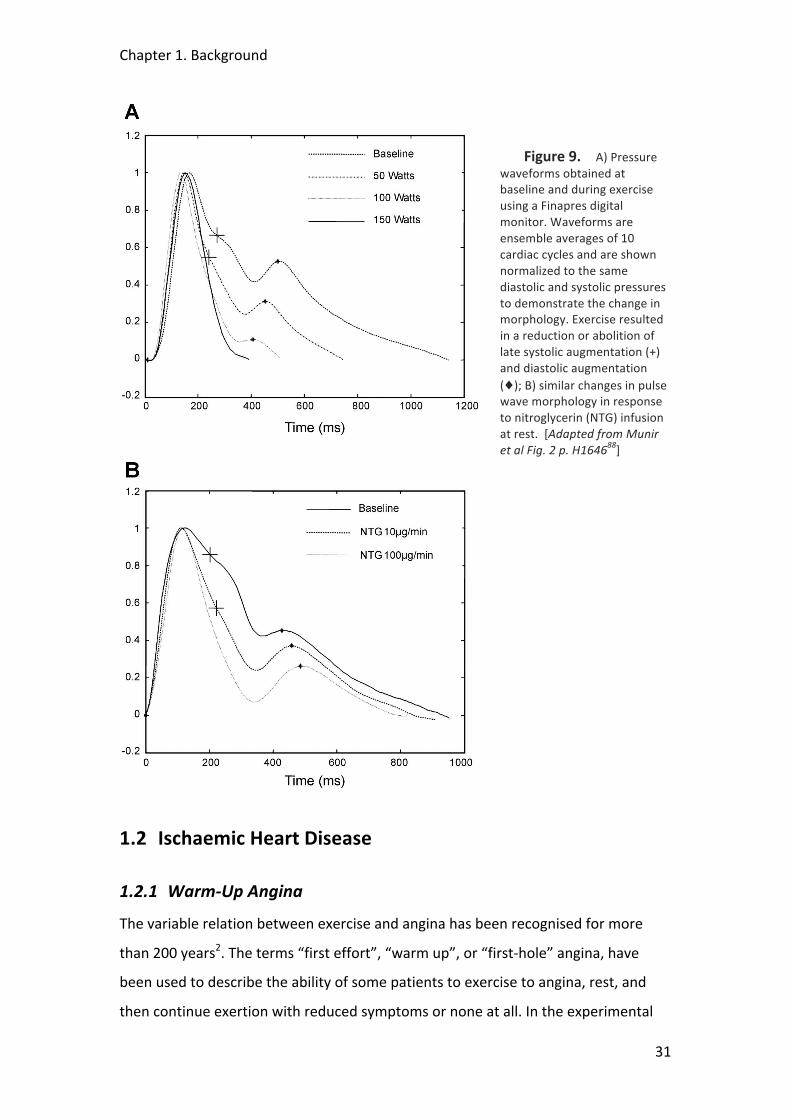
Figure 9. A) Pressure waveforms obtained at baseline and during exercise using a Finapres digital monitor. Waveforms are ensemble averages of 10 cardiac cycles and are shown normalized to the same diastolic and systolic pressures to demonstrate the change in morphology. Exercise resulted in a reduction or abolition of late systolic augmentation (+) and diastolic augmentation (♦); B) similar changes in pulse wave morphology in response to nitroglycerin (NTG) infusion at rest. [Adapted from Munir et al Fig. 2 p. H164688]
1.2 Ischaemic Heart Disease
1.2.1 Warm-‐Up Angina
The variable relation between exercise and angina has been recognised for more
than 200 years2. The terms “first effort”, “warm up”, or “first-‐hole” angina, have
been used to describe the ability of some patients to exercise to angina, rest, and
then continue exertion with reduced symptoms or none at all. In the experimental
Chapter 1. Background
32
setting, the salient observation is that at the accumulated work (exercise duration)
causing max ST-‐segment depression on first exercise, on second exercise there is less
ST depression, chest pain and dysrhythmia97. The traditional view is that angina is
the result of an imbalance between the supply and demand of the myocardium for
blood98, 99. However, the mechanisms underlying the warm-‐up phenomenon are still
poorly known and somewhat controversial. Potential causes of the warm-‐up
phenomenon include: (1) an improvement of blood flow, which, in turn, may be
caused by stenosis dilation, collateral recruitment or myocardial perfusion
redistribution100-‐102; (2) an adaptation of the myocardium to ischaemia, such as that
caused by ischaemic preconditioning98, 103-‐105; and (3) peripheral effects causing a
slower increase of cardiac workload, such as seen during training106 or changes in
central blood pressure107. Initial results from our own department suggest that
changes in collateral flow have little influence97.
Previous Studies
Okazaki et al104 suggested that the benefits observed during the warm-‐up
phenomenon were due to changes in regional myocardial oxygen consumption
rather than increases in blood flow. The investigators, however, relied on great
cardiac vein catheterisation to assess flow through thermodilution which has been
shown to be inaccurate and highly dependent on the position of the catheter107. In
addition, because it only assesses global LV myocardial flow this method cannot
determine the changes that may occur in a particular vessel or the redistribution of
flow between the different myocardial layers which may have a very important
role108. Williams et al103 performed a similar protocol but relied on rapid right
ventricular pacing, a non-‐physiological surrogate for exercise, to induce tachycardia
stress in a small group of stable coronary disease patients with exertional symptoms
but not necessarily warm-‐up angina. Only 7 out of their cohort of 9 patients actually
exhibited warm-‐up angina clinically. They also relied on great cardiac vein sampling
to determine global coronary flow and similarly concluded to the Okazaki group that
warm-‐up angina could not be explained by an increase in coronary flow alone. See
chapter XX for further discussion.
Chapter 1. Background
33
1.2.1.1 Preconditioning
Ischaemic preconditioning (IPC), is the term used to describe the increased
myocardial resistance to ischaemia that follows a brief episode of ischaemia109, 110. In
animal models it protects against infarct size and arrhythmias111 and has shown to
have a similar beneficial effect in human studies97, 112. Patients with coronary artery
disease have been observed to exercise longer before developing angina and may
develop less angina and ischaemia during a second exercise test compared with a
first test when these tests are separated by a brief rest period104, 113. It has been
suggested that the clinical observation of the warm-‐up phenomenon may represent
one aspect of IPC in humans105. IPC, like warm-‐up angina is also unexplained by a
down-‐regulation of contractile function or an increase in collateral myocardial
perfusion induced by initial exercise114, 115. Warm-‐up angina, however, does not
seem to be mediated by adenosine or by cardiac adenosine triphosphate-‐sensitive
potassium channels116, 117 suggesting that it is mechanistically distinct from classic
ischaemic preconditioning.
1.2.1.2 Subendocardial Perfusion and Microvascular Function
The transmural distribution of myocardial blood flow from endocardium to
epicardium is critical during exercise and was discussed in the previous section.
Because the contractile forces within the heart have a disproportionate effect on the
subendocardial layer it renders it much more sensitive to ischaemia43. When
coronary blood flow control mechanisms are intact, the flow distribution across the
myocardium is relatively uniform through local autoregulation with vasodilatation of
the myocardial resistance vessels60. When this vasodilatory capacity is exhausted
(such as during exercise), subendocardial conductance becomes inversely dependent
on heart rate and is decreased as the diastolic time fraction (DTF) shortens.
Subepicardial perfusion, in contrast, is generally unaffected by these changes69. DTF
is the relative duration of diastole with respect to the duration of the heart cycle and
decreases with increasing heart rate. In the presence of a coronary stenosis, the
autoregulatory mechanisms regulating myocardial blood flow are exhausted at an
earlier stage during exercise (or even at rest) rendering the subendocardial layer
even more critically dependent on the DTF118. Changes in DTF have been found to
Chapter 1. Background
34
reduce microvascular resistance and improve perfusion69. It has been suggested that
an increase in diastolic duration during ischaemia may therefore be an important
mechanism for matching coronary supply and demand of oxygen by simultaneously
decreasing demand and increasing supply. It is possible that such changes contribute
to the protective effects of serial exercise observed during warm-‐up angina.
1.2.1.3 Global Ventricular Work and Myocardial Stunning
It has been suggested that the reduction in ischaemia seen on second exercise in
patients with warm-‐up angina can be explained by enhanced vaso-‐ventricular
coupling caused by a reduction in augmentation index (AI)88 as discussed in the
previous section. Peripheral vasodilatation causes attenuation of wave reflection
with a resultant lowering of central systolic blood pressure thereby reducing global
cardiac work and subsequent ischaemia. To date, this work has not been carried out
but remains an exciting possibility.
Myocardial stunning occurs when ischaemic insult to a region of myocardium results
in the transient reduction of contractile function in that territory and has also been
suggested as a potential mechanism for warm-‐up. With less contraction in that
region, oxygen requirements are reduced and hence the ischaemic threshold raised.
However, work has shown that stunned areas of myocardium do not have lower
rates of oxygen consumption and are just as sensitive to myocardial infarction119. In
addition, contractile dysfunction has not been shown to correlate with warm-‐up115,
116.
1.2.1.4 Conclusion
The mechanisms of the phenomenon warm-‐up angina remain elusive. Warm-‐up
shares many characteristics with ischaemic preconditioning but also maintains
distinct differences, which suggest that other factors may predominate. During
repetitive exercise, differences in ventricular afterload, subendocardial perfusion
and microvascular resistance that relate to the propagation of waves within the
aortic and coronary circulation may play an important role and form one of the
major investigative areas of this thesis.
Chapter 1. Background
35
1.2.2 Myocardial Infarction and “No Re-‐Flow”
Myocardial infarction and subsequent heart failure constitute a leading cause of
death in the UK120. Prognosis after AMI is related to the extent of myocardial injury
occurring around the time of coronary occlusion121, 122. It is known that patients with
extensive myocardial infarction are at risk of post-‐infarction remodeling and heart
failure123. Early restoration of TIMI III blood flow through the infarct related artery is
the main goal of modern treatment124. This has led to reduction of infarct size,
preservation of left ventricular (LV) function and improved survival125-‐127. Primary
angioplasty is superior to thrombolysis in restoration of TIMI III flow128. Although the
restoration of epicardial blood flow does improve the myocardial perfusion of the
affected area, the process is not homogenous. In fact 25-‐40% of patients have
severely impaired flow at tissue level despite restoration of TIMI III flow in the infarct
related artery (IRA)129. This “no-‐reflow” or “low-‐reflow” phenomenon has been
documented in the endocardial portion of the LV wall. Electron microscopic studies
of tissue within the no-‐reflow region reveal severe microvascular damage and
obstruction by swollen endothelial cells and other necrotic debris130. It has been
demonstrated that progressive microvascular impairment and myocyte damage
continues after coronary artery recanalisation131. This increase was found to occur
over and above infarct size augmentation during the same period. While the early
reperfusion of the heart is essential to prevent further tissue injury and cell necrosis,
it may be that the reintroduction of blood flow expedites the death of vulnerable,
but still viable, myocardial tissue.
1.2.2.1 Reperfusion Injury and Cardiac Protection
Lethal myocardial reperfusion injury is defined as the death of myocytes, alive at the
moment of reperfusion, as a direct result of one or more events initiated by
reperfusion itself132. Numerous experimental studies have provided compelling
evidence as to its existence as an entity and animal models suggest that 50% of final
infarct size may be a result of reperfusion injury133. Hearse et al. first introduced the
so-‐called “oxygen-‐paradox” when they noted significant cardiac muscle enzyme
release and alterations in ultra structure when isolated hearts were reoxygenated
after a period of hypoxic perfusion134, 135. It is believed that many different
Chapter 1. Background
36
mechanisms are involved in reperfusion injury in a highly complex process that
occurs in both the intracellular and extracellular environments136. This complexity is
reflected in the diverse array of physiological sequelae that arise including
endothelial and microvascular dysfunction, metabolic and contractile dysfunction,
arrhythmias, cellular necrosis and apoptosis137. Novel therapies to attenuate these
processes may reduce final infarct size and improve outcome. Ischaemic
preconditioning has long been regarded as the gold standard of “cardiac protection”.
It is a phenomenon whereby brief periods of myocardial ischaemia offer protection
during subsequent prolonged ischaemia. There is a large body of experimental data
from perfused isolated, and in situ animal hearts with preconditioning resulting in
substantial reductions in volume of myocardial infarction109. Studies on ischaemic
preconditioning have demonstrated that cell death cannot be seen as a mere
consequence of energy deficiency; preconditioning does not alter the progression of
ischaemic injury but, rather, modifies the consequences of reperfusion by switching
the cell fate from death to survival138, 139. Preconditioning has proven clinical benefits
in settings where the ischaemia can be predicted such as in elective percutaneous
coronary intervention (PCI), cardiac surgery and the phenomenon of warm-‐up
angina140 (See chapter 5). The unpredictable nature of AMI, however, means that
one cannot pre-‐empt the event and initiate an intervention prior to it occurring.
1.2.2.2 Postconditioning
Postconditioning is defined as rapid intermittent interruptions of blood flow in the
early phase of reperfusion. Zhao et al first demonstrated the cardioprotective
effects of postconditioning using a canine model of 1 hour coronary occlusion and 3
hours of reperfusion141. After 30 seconds of reperfusion the artery was occluded
again for 30s with the cycle repeated 3 times. Compared to the control group,
postconditioning resulted in significantly reduced infarct size. This cardioprotective
effect was associated with an improvement in endothelial function, a reduction in
tissue superoxide generation, a reduction in cardiac apoptosis, and a decrease in
microvascular injury. In fact, the infarct reduction was similar to that observed in a
group who had undergone ischaemic preconditioning. Subsequent studies have
confirmed a similar infarct size reduction in other species with the duration of the

Chapter 1. Background
37
alternating periods of reperfusion and ischaemia varying from species to species142-‐
144. Common to all is the time-‐dependent manner in which postconditioning must be
applied if cardioprotection is to be achieved and post-‐ischaemic injury reduced. If
the first interruption of blood flow was applied more than 1 minute after the onset
of reperfusion then the infarct sparing effect was not observed143. There are many
cellular and molecular events involved in the pathogenesis of myocardial infarction
occurring during the early moments of reperfusion that are thought to be modulated
by postconditioning, including the activation of survival kinases principally known to
attenuate the pathogenesis of apoptosis and possibly necrosis145. It has been
suggested that this may represent an innate final common pathway of cardiac
protection shared with ischaemic preconditioning137. Post-‐ischaemic dysfunction, or
myocardial stunning, is the mechanical dysfunction that persists after reperfusion
despite the absence of irreversible damage and despite restoration of normal or
near-‐normal coronary flow119. Myocardial stunning is thought to be partly caused by
reperfusion injury but also partly by damage sustained during the ischaemic insult
and therefore less amenable to therapies to reduce reperfusion injury146.
Contrasting to its beneficial effects on reducing overall myocardial infarction
postconditioning does not protect against myocardial stunning in dogs and
rabbits147. Staat et al were the first group to assess the benefit of post-‐conditioning
at the time of primary angioplasty for AMI in humans148. Compared to a control
group who underwent angioplasty alone they demonstrated a 36% reduction in
infarct size as determined from creatinine kinase release over 72 hours following
reperfusion. In addition, myocardial blush grade, an angiographic marker of
myocardial perfusion, was significantly increased in postconditioned compared to
control subjects suggesting an improvement in microvascular integrity. This was also
suggested by Laskey who demonstrated improved ST segment shift and improved
Doppler-‐derived coronary flow in a postconditioned group of patients149. Several
other clinical studies have been carried out since using varying postconditioning
protocols in patients at the time of reperfusion of AMI and a consistent reduction in
infarct size of around 30% has been demonstrated. Yang150 used SPECT at 1 week to
show a 27% reduction in infarct size. Ma151 also found reduced infarct size based on
Chapter 1. Background
38
CK release and improved wall motion scores on echo. Although this early work is
encouraging, both clinical and animal studies examining postconditioning to date
have concentrated on early time points following reperfusion. It has been suggested
that many of the mechanisms leading to myocyte necrosis occur some time after
reperfusion152 and that post-‐ischaemic injury is an ongoing process with infarct
expansion continuing for at least 24 hours following onset of reperfusion131, 144, 153.
Early determination of infarct size may therefore lead to inaccuracies with an
underestimate of final infarct volume. Miki et al154 found in a rabbit model of acute
MI using the diffusible antioxidant MPG, that protection assessed with early TTC
staining was seen in the rabbits treated with MPG following reperfusion. When the
experiment was repeated, however, with infarct size determined at a later time
point after reperfusion no such differences could be found compared to control.
Whether postconditioning results in a long-‐term sustained attenuation of post-‐
ischaemic injury and infarct reduction rather than simply a delay in inevitable injury
is a question still to be determined. The demonstration of such an effect would add
significantly to the argument of the existence of intrinsic cardiac protection in
ischaemic heart disease patients, where the promise of such a phenomenon based
on laboratory studies has perhaps failed to live up to expectations in the clinical
setting. A randomised clinical trial investigating the potential beneficial effect of
postconditioning in patients presenting with acute myocardial infarction forms one
of the major chapters of this thesis; it also complements the clinical investigation of
the other cardioprotective phenomenon, warm up angina.

Chapter 1. Background
39
1.3 Non-‐Invasive Techniques to Investigate Ischaemic Heart
Disease
1.3.1 Detection of Reversible Myocardial Ischaemia
The detection of reversible myocardial ischaemia has formed a cornerstone for the
investigation and treatment of patients with stable coronary disease155. Studies
involving thousands of patients have shown that in the absence of inducible
ischaemia, patients with coronary artery disease (CAD) have an excellent prognosis
with an adverse event rate of less than 1% p.a., which is nearly as low as the general
population156-‐158. Large perfusion defects and defects in multiple coronary
territories, however, suggest a poor prognosis159-‐161. In addition, those with a low
burden of ischaemia have been found to gain little benefit from coronary
revascularisation compared to optimal medical therapy162. Conversely, the CASS
registry suggests that those with a high burden of ischaemia are at risk of adverse
events if left without revascularisation, with a mortality of around 5% per annum in
the medically treated arm with a strongly positive exercise tolerance test (ETT)
compared to a mortality rate of less than 1% p.a. in those medically treated patients
without inducible ischaemia163.
Testing for reversible ischaemia requires the induction of some marker of myocardial
ischaemia (such as ECG ST-‐segment shift, a new regional LV wall motion abnormality
or a myocardial perfusion defect) during conditions of exercise or pharmacological
stress. A variety of different techniques may be employed for this, ranging from the
simple exercise ECG, through echocardiography, PET and SPECT imaging and cardiac
magnetic resonance. Because of the limits of this thesis, we will concentrate on
ischaemia detection and perfusion imaging provided by cardiac magnetic resonance
imaging which will be covered in the following section.
1.3.1.1 Pharmacological Stress
Adenosine, dipyridamole and, dobutamine are three agents currently used in
pharmacological stress testing. Dobutamine is a synthetic sympathomimetic amine.
Like exercise, dobutamine increases myocardial oxygen demand by increasing
Chapter 1. Background
40
myocardial contractility164. CFR is therefore increased indirectly by creating a
greater flow demand. Direct exercise and dobutamine can therefore provoke
ischaemia due to their effects in increasing oxygen demand and flow.
Adenosine and dipyridamole are vasodilators and induce hyperaemic flow directly by
dilating the coronary microcirculation. Adenosine binds and activates A2 receptors
on smooth muscle cells causing relaxation and thus coronary vasodilatation165.
Dipyridamole inhibits cellular uptake of adenosine thus increasing the interstitial
adenosine concentration which results in active hyperaemia and vasodilatation166.
Caffeine inhibits the effects of dipyridamole and adenosine and thus should be
avoided 24 hours before a stress test167.
Direct vasodilatation of the coronary arteries provokes blood flow heterogeneity in
patients with CAD because areas of stenosis receive relatively reduced flow in
comparison to areas without stenosis. This heterogeneity of flow may present as a
perfusion defect during stress testing with myocardial perfusion imaging (MPI). Such
perfusion defects correlate strongly with clinical endpoints and are thought to
represent regions of inducible myocardial ischaemia160, 161.
1.3.1.2 Exercise Stress
In most cases, exercise stress testing would be the ideal method for assessing CAD
because it is the most physiological stimulus for increasing myocardial oxygen
demand and therefore coronary blood flow. Vasodilating agents increase coronary
flow directly, independent of endothelial function, and without increasing cardiac
work and so may therefore be inappropriate in demonstrating reduced CFR.
However, exercise stress testing is not always possible or may be inappropriate.
Apart from monitoring ECG, it is difficult to actually acquire data during exercise
therefore such acquisition must occur almost immediately after peak exercise stress
is achieved as heart rate depreciates rapidly after cessation of exercise. It may be
difficult to perform an exercise test in the immediate vicinity of the scanner, be it
ultrasound, nuclear or MRI imaging for practical reasons. In addition,
pharmacological stress testing is usually preferred in the elderly or those with
physical disabilities that do not allow them to exercise to adequate diagnostic or
Chapter 1. Background
41
prognostic levels. Caution must be used in patients with recent myocardial
infarction or those with severe valvular heart disease.
1.3.2 Cardiac Magnetic Resonance Imaging
1.3.2.1 Basic Principles
Magnetic resonance (MR) images depend on the distribution and concentration of
hydrogen nuclei in the body and on the physical and chemical environment of those
nuclei. It is beyond the scope of this introduction to explain the detailed physics
behind the acquisition of MR images but there are numerous reviews where
excellent and clear descriptions can be found168-‐170. When a patient enters the core
of the magnet within a scanner, hydrogen nuclei align with and precess about the
axis of the magnetic field. This precession can be altered by application of additional
small magnetic field pulses. The application of these pulses in a controlled manner
(in the form of pulse sequences) means that signals can be received and processed to
produce an image of the spatial distribution of the spins or protons within the body.
Multiple types of pulse sequences can be used for different imaging protocols to
define cardiac structure, tissue characterisation, or measurement of cardiovascular
function; all can be employed within a single study. The unique ability to provide
such a comprehensive assessment of cardiac form and function, together with the
lack of exposure to ionising radiation to patients makes CMR a very useful non-‐
invasive imaging modality171.
1.3.2.2 Different CMR Techniques
Cine Imaging
The assessment of global and regional left ventricular (LV) and right ventricular (RV)
function by CMR is typically based on a cine data set aligned in the true LV short axis
that covers the heart in 10-‐12 consecutive two-‐dimensional slices172. Alternatively,
three-‐dimensional cine data sets covering the entire heart in a single breath-‐hold can
be acquired173, 174. In addition to its high tissue contrast, the main advantage of CMR
over other imaging modalities is that imaging planes can be freely and reproducibly
defined. Consequently, CMR is the most accurate and reproducible imaging modality
Chapter 1. Background
42
for the assessment of global ventricular volumes and function 175, 176. In addition,
regional contractile function can be assessed either by visual interpretation of cine
loops177, 178 or by measuring wall motion, thickening and strain using myocardial
tagging methods179, 180. Myocardial tagging during low dose dobutamine stress has
been used to measure parameters of diastolic dysfunction such as the time to peak
untwist which may identify coronary stenosis181,182. Following AMI, low dose
dobutamine cine CMR can be used to predict viability and functional recovery183-‐186.
High dose dobutamine stress CMR has high diagnostic accuracy to identify inducible
LV wall motion abnormalities indicative of flow-‐limiting coronary stenosis187-‐189.
First Pass Myocardial perfusion
Current first pass myocardial perfusion CMR methods track the passage of a bolus of
a T1-‐shortening contrast agent injected into a peripheral vein190, 191. Data acquired
during intravenous vasodilator-‐stress (most commonly with adenosine) delineate
relatively underperfused regions associated with myocardial ischaemia. The spatial
resolution of CMR myocardial perfusion imaging of 2 to 3 mm is vastly superior to
other imaging modalities, so that subendocardial ischaemia can be more reliably
identified. Recent developments have seen further improvements in spatial
resolution to around 1 mm in the imaging plane192 and acquisition at 3-‐Tesla
promises improved signal to noise ratio and diagnostic yield193, 194. Both of these
developments should continue to enhance the value of CMR perfusion assessment.
The interpretation of CMR myocardial perfusion studies in clinical practice is most
commonly visual, but quantitative approaches that measure characteristics of
myocardial signal intensity profiles are available191, 195-‐198 and have been validated
against x-‐ray angiography, SPECT and PET199-‐201. The recent MR-‐IMPACT study in 234
patients reported improved detection of coronary stenosis by CMR compared with
SPECT in the first multi-‐centre, multi-‐vendor comparison156. In the context of ACS,
myocardial perfusion CMR imaging can be used to delineate microvascular
obstruction and ischaemia, as described in subsequent sections. See Figure 10
below.
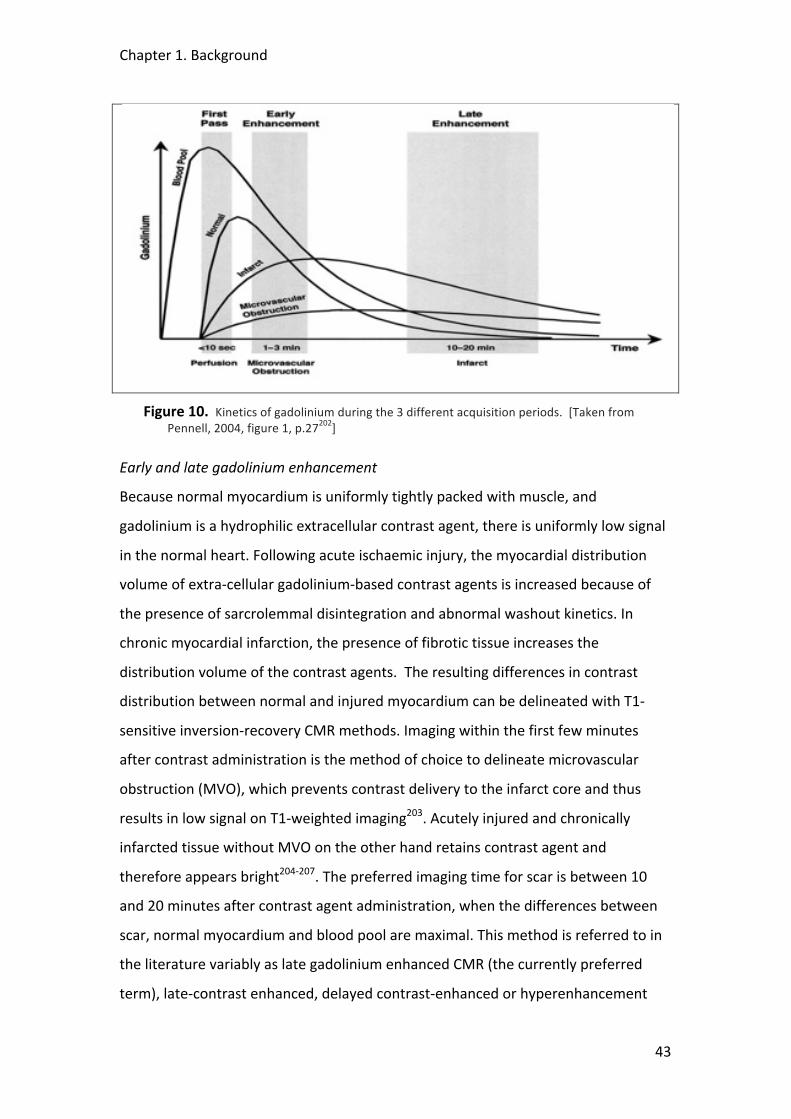
Chapter 1. Background
43
Figure 10. Kinetics of gadolinium during the 3 different acquisition periods. [Taken from Pennell, 2004, figure 1, p.27202]
Early and late gadolinium enhancement
Because normal myocardium is uniformly tightly packed with muscle, and
gadolinium is a hydrophilic extracellular contrast agent, there is uniformly low signal
in the normal heart. Following acute ischaemic injury, the myocardial distribution
volume of extra-‐cellular gadolinium-‐based contrast agents is increased because of
the presence of sarcrolemmal disintegration and abnormal washout kinetics. In
chronic myocardial infarction, the presence of fibrotic tissue increases the
distribution volume of the contrast agents. The resulting differences in contrast
distribution between normal and injured myocardium can be delineated with T1-‐
sensitive inversion-‐recovery CMR methods. Imaging within the first few minutes
after contrast administration is the method of choice to delineate microvascular
obstruction (MVO), which prevents contrast delivery to the infarct core and thus
results in low signal on T1-‐weighted imaging203. Acutely injured and chronically
infarcted tissue without MVO on the other hand retains contrast agent and
therefore appears bright204-‐207. The preferred imaging time for scar is between 10
and 20 minutes after contrast agent administration, when the differences between
scar, normal myocardium and blood pool are maximal. This method is referred to in
the literature variably as late gadolinium enhanced CMR (the currently preferred
term), late-‐contrast enhanced, delayed contrast-‐enhanced or hyperenhancement
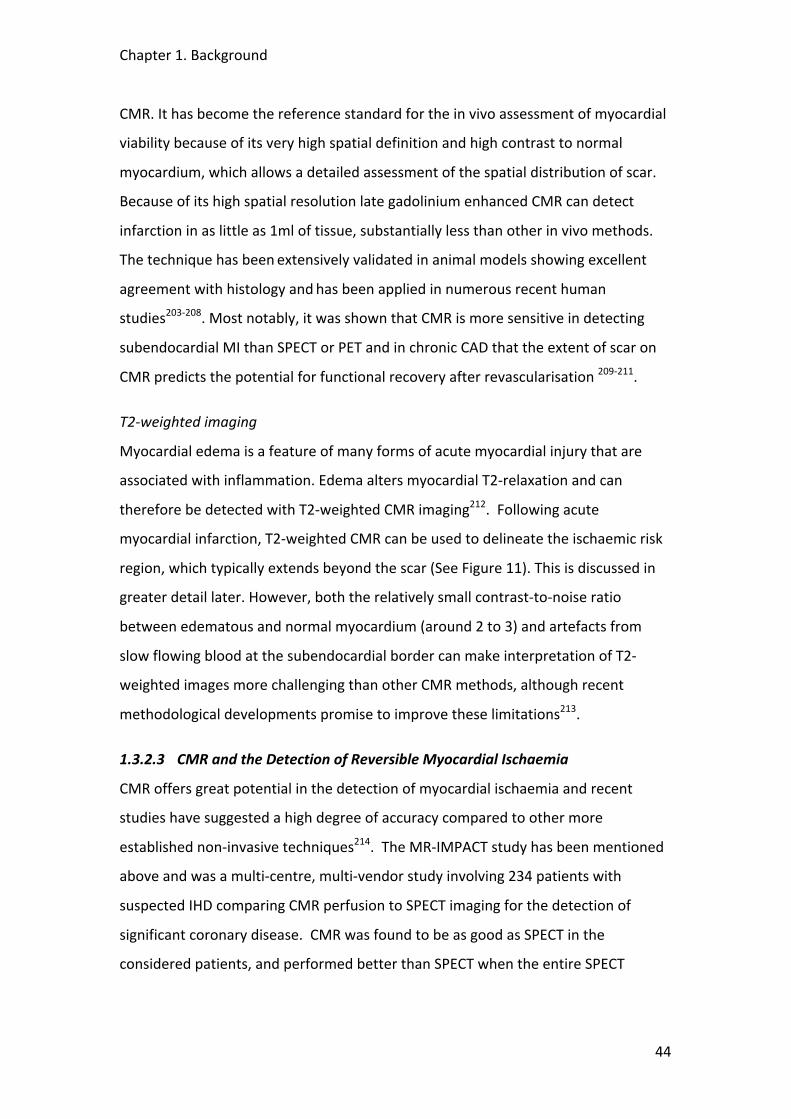
Chapter 1. Background
44
CMR. It has become the reference standard for the in vivo assessment of myocardial
viability because of its very high spatial definition and high contrast to normal
myocardium, which allows a detailed assessment of the spatial distribution of scar.
Because of its high spatial resolution late gadolinium enhanced CMR can detect
infarction in as little as 1ml of tissue, substantially less than other in vivo methods.
The technique has been extensively validated in animal models showing excellent
agreement with histology and has been applied in numerous recent human
studies203-‐208. Most notably, it was shown that CMR is more sensitive in detecting
subendocardial MI than SPECT or PET and in chronic CAD that the extent of scar on
CMR predicts the potential for functional recovery after revascularisation 209-‐211.
T2-‐weighted imaging
Myocardial edema is a feature of many forms of acute myocardial injury that are
associated with inflammation. Edema alters myocardial T2-‐relaxation and can
therefore be detected with T2-‐weighted CMR imaging212. Following acute
myocardial infarction, T2-‐weighted CMR can be used to delineate the ischaemic risk
region, which typically extends beyond the scar (See Figure 11). This is discussed in
greater detail later. However, both the relatively small contrast-‐to-‐noise ratio
between edematous and normal myocardium (around 2 to 3) and artefacts from
slow flowing blood at the subendocardial border can make interpretation of T2-‐
weighted images more challenging than other CMR methods, although recent
methodological developments promise to improve these limitations213.
1.3.2.3 CMR and the Detection of Reversible Myocardial Ischaemia
CMR offers great potential in the detection of myocardial ischaemia and recent
studies have suggested a high degree of accuracy compared to other more
established non-‐invasive techniques214. The MR-‐IMPACT study has been mentioned
above and was a multi-‐centre, multi-‐vendor study involving 234 patients with
suspected IHD comparing CMR perfusion to SPECT imaging for the detection of
significant coronary disease. CMR was found to be as good as SPECT in the
considered patients, and performed better than SPECT when the entire SPECT
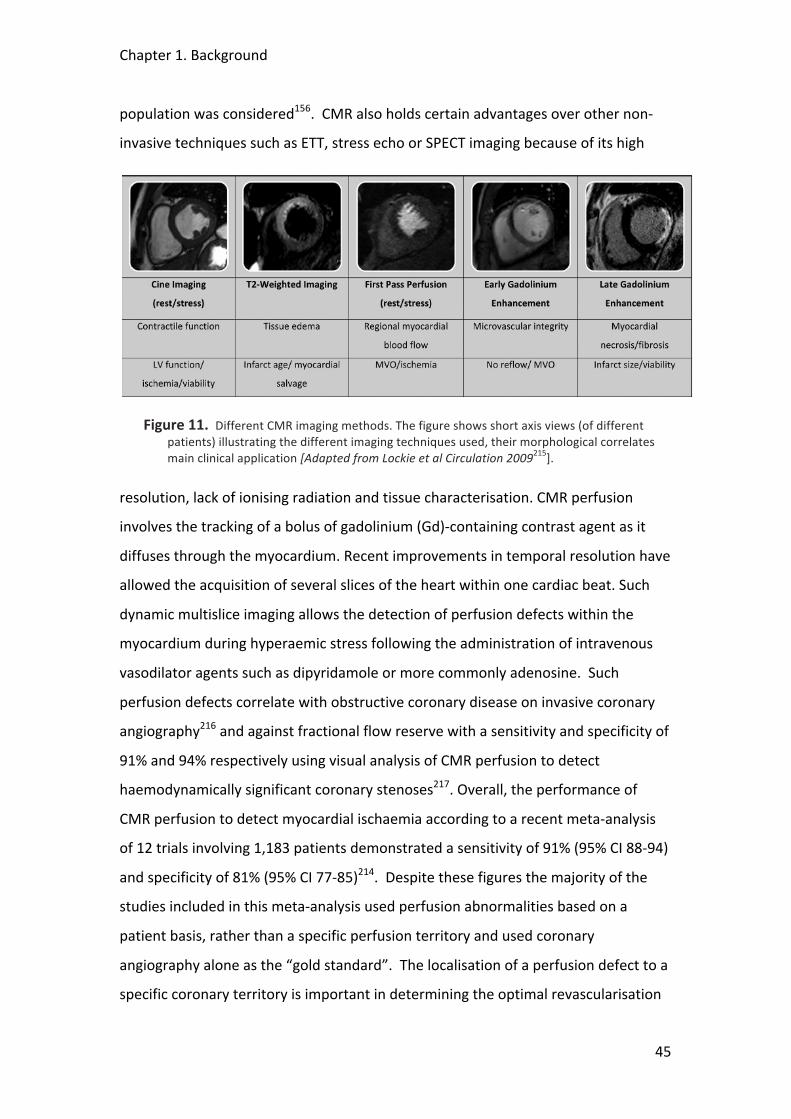
Chapter 1. Background
45
population was considered156. CMR also holds certain advantages over other non-‐
invasive techniques such as ETT, stress echo or SPECT imaging because of its high
Figure 11. Different CMR imaging methods. The figure shows short axis views (of different patients) illustrating the different imaging techniques used, their morphological correlates main clinical application [Adapted from Lockie et al Circulation 2009215].
resolution, lack of ionising radiation and tissue characterisation. CMR perfusion
involves the tracking of a bolus of gadolinium (Gd)-‐containing contrast agent as it
diffuses through the myocardium. Recent improvements in temporal resolution have
allowed the acquisition of several slices of the heart within one cardiac beat. Such
dynamic multislice imaging allows the detection of perfusion defects within the
myocardium during hyperaemic stress following the administration of intravenous
vasodilator agents such as dipyridamole or more commonly adenosine. Such
perfusion defects correlate with obstructive coronary disease on invasive coronary
angiography216 and against fractional flow reserve with a sensitivity and specificity of
91% and 94% respectively using visual analysis of CMR perfusion to detect
haemodynamically significant coronary stenoses217. Overall, the performance of
CMR perfusion to detect myocardial ischaemia according to a recent meta-‐analysis
of 12 trials involving 1,183 patients demonstrated a sensitivity of 91% (95% CI 88-‐94)
and specificity of 81% (95% CI 77-‐85)214. Despite these figures the majority of the
studies included in this meta-‐analysis used perfusion abnormalities based on a
patient basis, rather than a specific perfusion territory and used coronary
angiography alone as the “gold standard”. The localisation of a perfusion defect to a
specific coronary territory is important in determining the optimal revascularisation
Chapter 1. Background
46
strategy in patients with multi-‐vessel disease and requires high-‐resolution scanning
capacity. In addition, functional coronary measurements such as fractional flow
reserve (FFR) should be used to determine the haemodynamic significance of a
coronary lesion as angiography alone correlates poorly with the presence of
ischaemia218. This is discussed in further detail in the following sections.
1.1.4.3 The Influence of higher field strength
MR imaging at 3-‐T potentially provides a substantial improvement of tissue contrast
in T1-‐weighted imaging techniques relying on gadolinium-‐based contrast material
enhancement219. In a systematic comparison between CMR perfusion using 3-‐T and
1.5-‐T, Cheng et al found the perfusion at 3-‐T to be superior to that at 1.5-‐T194. They
suggest that the significantly higher diagnostic accuracy of 3-‐T perfusion could be
attributed to a combination of higher SNR (signal-‐to-‐noise ratio), allowing detection
of subendocardial perfusion defects (the most sensitive parameter for a reduction of
overall coronary blood flow) and reduced occurrence of dark rim artefacts. These are
an acknowledged problem with 1.5-‐T perfusion imaging and can often be mistaken
for real perfusion defects, potentially explaining the lower specificity seen at 1.5-‐T.
1.3.2.4 K-‐t SENSE Encoding
Standard CMR first-‐pass perfusion methods are limited by the need for acquisition of
the complete data set in a single shot with a limited portion of each cardiac cycle.
This limits the maximum resolution attainable by perfusion imaging compared to
other sequences such as late Gd-‐enhancement or cine imaging which may be
acquired over several heartbeats. New acquisition strategies that simultaneously
take advantage of coil encoding and spatiotemporal correlations, such as k-‐space
and time sensitivity encoding (k-‐t SENSE), allow considerable acceleration of CMR
data acquisition220. These methods are based on the premise that the raw data in
dynamic images exhibit correlations in k-‐space and in time and that it is sufficient to
acquire only a reduced amount of data and recover the missing portion
afterwards220. Such correlations can be obtained from a set of training images that
are obtained beforehand and by exploiting this prior information it is possible to
vastly accelerate data sampling. Such acceleration can be invested in improved
Chapter 1. Background
47
spatial resolution leading to in-‐plane spatial resolution approaching 1mm2, which is
far superior to conventional methods where a maximum spatial resolution of 3-‐
5mm2 is possible. This is accompanied by a reduction in dark rim (susceptibility)
artefacts, which may be problematic in other perfusion sequences with less spatial
resolution, especially in the assessment of subendocardial perfusion defects.
Previous studies have suggested that there is improved signal to noise ratio (SNR)
and image quality using k-‐t perfusion at higher field strength (i.e. at 3-‐T rather than
1.5-‐T) due to the potential loss of SNR that can occur due to acquisition of data at
higher spatial resolution and with the use of spatiotemporal under-‐sampling216. K-‐t
has proved accurate in the detection of coronary disease as determined
anatomically by a 50% stenosis on the coronary angiogram221. However, to date
there have been no studies comparing the performance of k-‐t perfusion to FFR to
detect haemodynamically significant coronary disease.
Figure 12. Summary of the k-‐t SENSE method. k-‐t SENSE involves the reconstruction of images. First a low-‐resolution scan is performed to provide training data (a). An estimate of the expected signal intensities of the moving object is obtained based on this data. During the data acquisition stage, under-‐sampling is applied, creating multiple foldover in the images (b). Training data and acquisition data are then both combined and reconstructed using k-‐t SENSE to produce high-‐resolution images (c). [Adapted from Korezeke and Tsao, 2004, figure 7, p.165222]
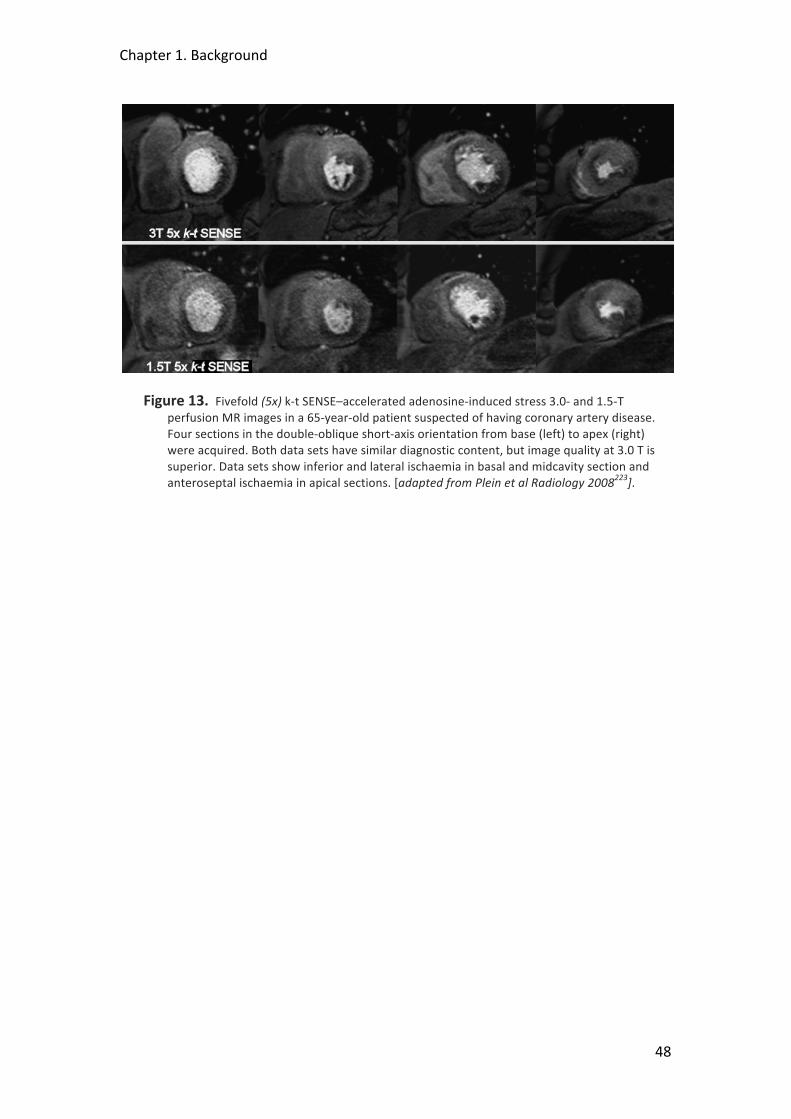
Chapter 1. Background
48
Figure 13. Fivefold (5x) k-‐t SENSE–accelerated adenosine-‐induced stress 3.0-‐ and 1.5-‐T perfusion MR images in a 65-‐year-‐old patient suspected of having coronary artery disease. Four sections in the double-‐oblique short-‐axis orientation from base (left) to apex (right) were acquired. Both data sets have similar diagnostic content, but image quality at 3.0 T is superior. Data sets show inferior and lateral ischaemia in basal and midcavity section and anteroseptal ischaemia in apical sections. [adapted from Plein et al Radiology 2008223].
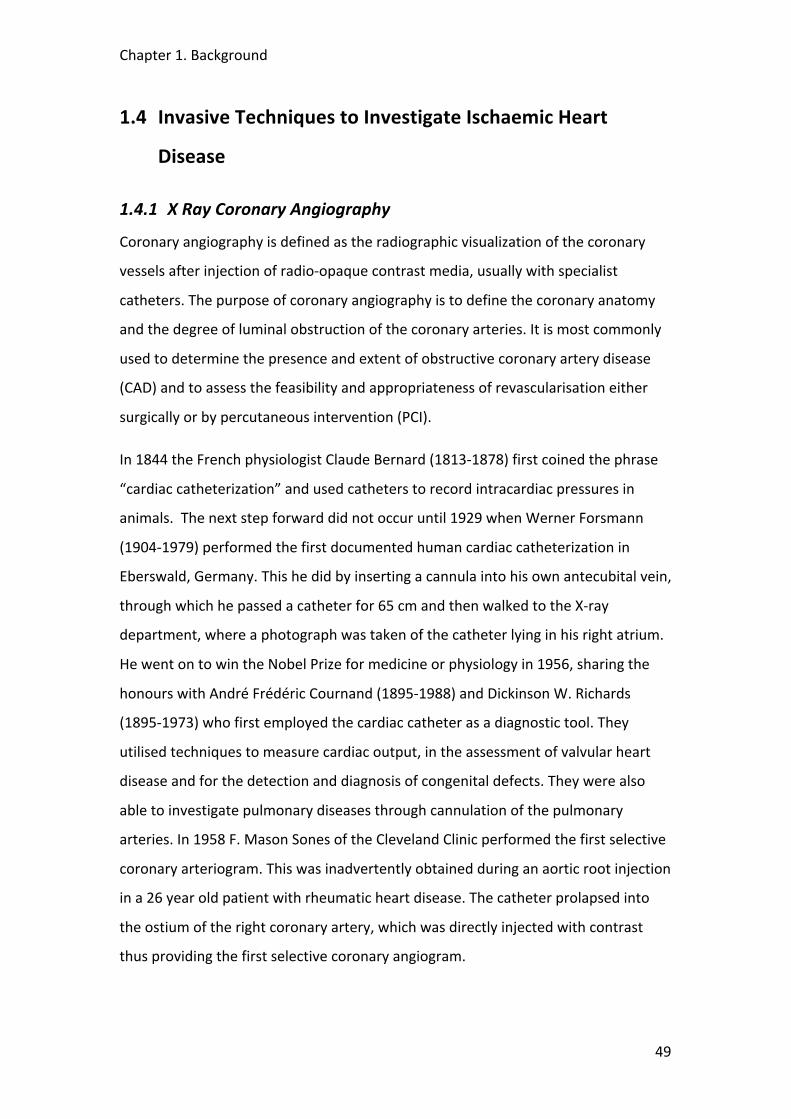
Chapter 1. Background
49
1.4 Invasive Techniques to Investigate Ischaemic Heart
Disease
1.4.1 X Ray Coronary Angiography Coronary angiography is defined as the radiographic visualization of the coronary
vessels after injection of radio-‐opaque contrast media, usually with specialist
catheters. The purpose of coronary angiography is to define the coronary anatomy
and the degree of luminal obstruction of the coronary arteries. It is most commonly
used to determine the presence and extent of obstructive coronary artery disease
(CAD) and to assess the feasibility and appropriateness of revascularisation either
surgically or by percutaneous intervention (PCI).
In 1844 the French physiologist Claude Bernard (1813-‐1878) first coined the phrase
“cardiac catheterization” and used catheters to record intracardiac pressures in
animals. The next step forward did not occur until 1929 when Werner Forsmann
(1904-‐1979) performed the first documented human cardiac catheterization in
Eberswald, Germany. This he did by inserting a cannula into his own antecubital vein,
through which he passed a catheter for 65 cm and then walked to the X-‐ray
department, where a photograph was taken of the catheter lying in his right atrium.
He went on to win the Nobel Prize for medicine or physiology in 1956, sharing the
honours with André Frédéric Cournand (1895-‐1988) and Dickinson W. Richards
(1895-‐1973) who first employed the cardiac catheter as a diagnostic tool. They
utilised techniques to measure cardiac output, in the assessment of valvular heart
disease and for the detection and diagnosis of congenital defects. They were also
able to investigate pulmonary diseases through cannulation of the pulmonary
arteries. In 1958 F. Mason Sones of the Cleveland Clinic performed the first selective
coronary arteriogram. This was inadvertently obtained during an aortic root injection
in a 26 year old patient with rheumatic heart disease. The catheter prolapsed into
the ostium of the right coronary artery, which was directly injected with contrast
thus providing the first selective coronary angiogram.
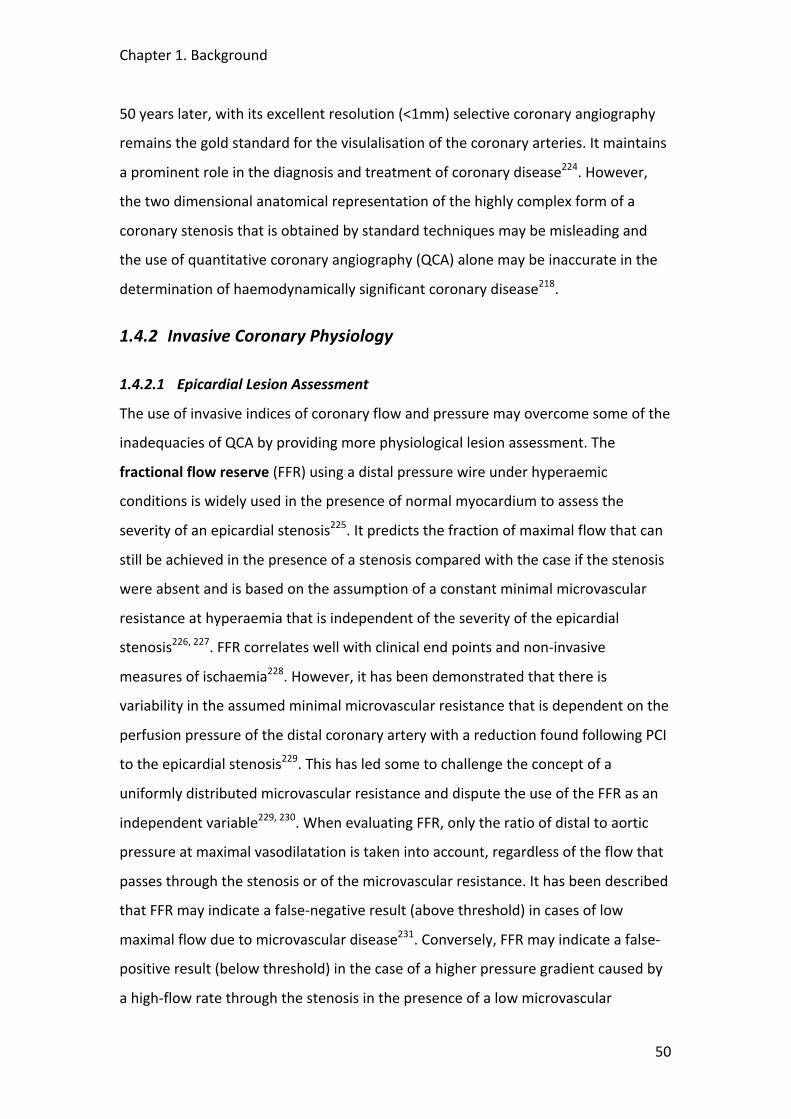
Chapter 1. Background
50
50 years later, with its excellent resolution (<1mm) selective coronary angiography
remains the gold standard for the visulalisation of the coronary arteries. It maintains
a prominent role in the diagnosis and treatment of coronary disease224. However,
the two dimensional anatomical representation of the highly complex form of a
coronary stenosis that is obtained by standard techniques may be misleading and
the use of quantitative coronary angiography (QCA) alone may be inaccurate in the
determination of haemodynamically significant coronary disease218.
1.4.2 Invasive Coronary Physiology
1.4.2.1 Epicardial Lesion Assessment
The use of invasive indices of coronary flow and pressure may overcome some of the
inadequacies of QCA by providing more physiological lesion assessment. The
fractional flow reserve (FFR) using a distal pressure wire under hyperaemic
conditions is widely used in the presence of normal myocardium to assess the
severity of an epicardial stenosis225. It predicts the fraction of maximal flow that can
still be achieved in the presence of a stenosis compared with the case if the stenosis
were absent and is based on the assumption of a constant minimal microvascular
resistance at hyperaemia that is independent of the severity of the epicardial
stenosis226, 227. FFR correlates well with clinical end points and non-‐invasive
measures of ischaemia228. However, it has been demonstrated that there is
variability in the assumed minimal microvascular resistance that is dependent on the
perfusion pressure of the distal coronary artery with a reduction found following PCI
to the epicardial stenosis229. This has led some to challenge the concept of a
uniformly distributed microvascular resistance and dispute the use of the FFR as an
independent variable229, 230. When evaluating FFR, only the ratio of distal to aortic
pressure at maximal vasodilatation is taken into account, regardless of the flow that
passes through the stenosis or of the microvascular resistance. It has been described
that FFR may indicate a false-‐negative result (above threshold) in cases of low
maximal flow due to microvascular disease231. Conversely, FFR may indicate a false-‐
positive result (below threshold) in the case of a higher pressure gradient caused by
a high-‐flow rate through the stenosis in the presence of a low microvascular
Chapter 1. Background
51
Figure 14. Pressure wire tracing from an LAD containing a moderate mid-‐vessel stenosis showing the distal coronary pressure (Pd) in green and proximal aortic pressure (Pa) in red. The ratio of the two during adenosine-‐induced hyperaemia is the fractional flow reserve (FFR). An FFR of 0.69, (normal >0.8) suggests a highly haemodynamically significant lesion that would benefit from revascularisation [adapted from Lockie et al, Circulation, 2009215].
resistance232. Coronary flow reserve (CFR) can be measured in the vessel either
using Doppler or thermodilution233. It represents the ratio of maximal-‐to-‐baseline
flow velocity distal to the stenosis and like FFR correlates well with non-‐invasive
indices of ischaemia234. However, CFR is sensitive to haemodynamic conditions235
with poor reproducibility and it cannot discriminate between the potential effects of
an epicardial stenosis or a damaged microcirculation on coronary flow236, 237. The
hyperaemic stenosis resistance index (SR) has been introduced as a more powerful
predictor of reversible perfusion defects by incorporating both pressure and flow238.
It involves the ratio between stenosis pressure drop and the distally measured flow
velocity at maximal hyperaemia (Pa –Pd)/Vd and therefore acts as a measure of
stenosis severity that can be separated from the effect of microvascular resistance.
Recent technological advances mean that such measurements can be made with a
single combined flow/pressure wire. SR has been shown to be the best predictor of
reversible perfusion defects as determined by SPECT compared to FFR or CFR238. The
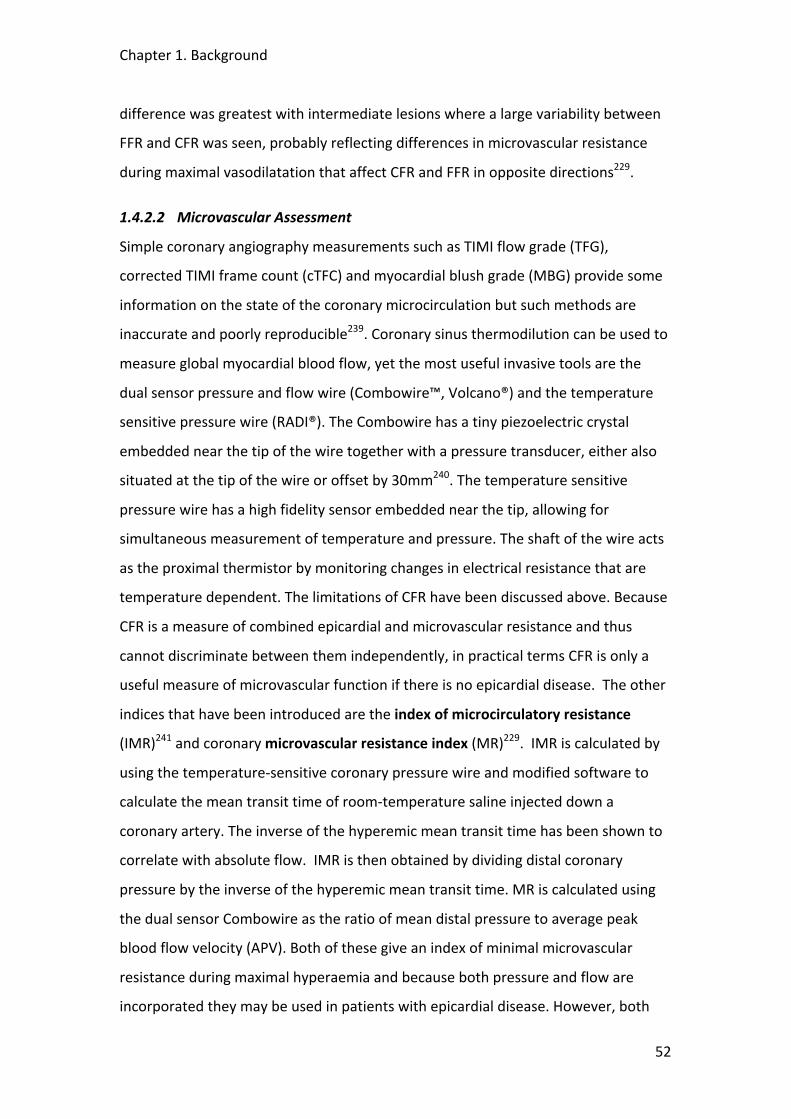
Chapter 1. Background
52
difference was greatest with intermediate lesions where a large variability between
FFR and CFR was seen, probably reflecting differences in microvascular resistance
during maximal vasodilatation that affect CFR and FFR in opposite directions229.
1.4.2.2 Microvascular Assessment
Simple coronary angiography measurements such as TIMI flow grade (TFG),
corrected TIMI frame count (cTFC) and myocardial blush grade (MBG) provide some
information on the state of the coronary microcirculation but such methods are
inaccurate and poorly reproducible239. Coronary sinus thermodilution can be used to
measure global myocardial blood flow, yet the most useful invasive tools are the
dual sensor pressure and flow wire (Combowire™, Volcano®) and the temperature
sensitive pressure wire (RADI®). The Combowire has a tiny piezoelectric crystal
embedded near the tip of the wire together with a pressure transducer, either also
situated at the tip of the wire or offset by 30mm240. The temperature sensitive
pressure wire has a high fidelity sensor embedded near the tip, allowing for
simultaneous measurement of temperature and pressure. The shaft of the wire acts
as the proximal thermistor by monitoring changes in electrical resistance that are
temperature dependent. The limitations of CFR have been discussed above. Because
CFR is a measure of combined epicardial and microvascular resistance and thus
cannot discriminate between them independently, in practical terms CFR is only a
useful measure of microvascular function if there is no epicardial disease. The other
indices that have been introduced are the index of microcirculatory resistance
(IMR)241 and coronary microvascular resistance index (MR)229. IMR is calculated by
using the temperature-‐sensitive coronary pressure wire and modified software to
calculate the mean transit time of room-‐temperature saline injected down a
coronary artery. The inverse of the hyperemic mean transit time has been shown to
correlate with absolute flow. IMR is then obtained by dividing distal coronary
pressure by the inverse of the hyperemic mean transit time. MR is calculated using
the dual sensor Combowire as the ratio of mean distal pressure to average peak
blood flow velocity (APV). Both of these give an index of minimal microvascular
resistance during maximal hyperaemia and because both pressure and flow are
incorporated they may be used in patients with epicardial disease. However, both

Chapter 1. Background
53
techniques attract controversy, such as the uncertain effect of coronary collaterals
and coronary steal and there is ongoing debate as to which is the more
representative of true myocardial microvascular resistance230.
Chapter 1. Background
54
1.5 Aims and Outline of this Thesis
The main aim of this thesis was to examine the adaptive mechanisms of the heart to
ischaemic stress, using the models of exercise induced myocardial ischaemia and
acute myocardial infarction. In the former, we sought to use invasive physiological
measurements and high-‐resolution cardiac magnetic resonance imaging to assess
changes in coronary blood flow, central haemodynamics and transmural myocardial
perfusion in patients with symptomatic coronary arterial disease. In the latter, we
sought to examine the role of post-‐conditioning as a potential therapeutic tool in a
randomised controlled trial involving patients undergoing primary percutaneous
revascularisation for acute myocardial infarction. The results of the post-‐
conditioning trial are presented in Chapter 3.
The principle tools required for the studies involving stable IHD patients were high-‐
speed and high-‐resolution CMR imaging and invasive dual-‐sensor coronary
measurements in the cardiac catheterisation lab. Both of these involved the
development of a specially adapted supine ergometer that would be used to
exercise the patients to provoke myocardial ischaemia. The development of the
catheter lab exercise protocol as well as the different analytical techniques used are
described in the methods section in Chapter 2 and the results of these studies in
Chapter 5. For the CMR protocol, data sampling had to be very fast, not only to
allow imaging at high heart rates such as during peak exercise but also to allow high-‐
resolution imaging required to determine differences in endo-‐ and epicardial
patterns of perfusion. A novel k-‐t SENSE perfusion protocol was used (see Methods)
and imaging was undertaken using a dedicated 3-‐T magnet at the Rayne Institute. 3-‐
T offers better signal-‐to-‐noise ratio with a reduction in artefacts compared to 1.5-‐T.
Because there have been only few studies using k-‐t perfusion at 3-‐T a validation
study was first required comparing it’s diagnostic accuracy with the invasively
measured fractional flow reserve (FFR). The results of this are presented in Chapter
4. Once the perfusion sequence was validated, it was tested in volunteers
undergoing exercise stress and novel quantification methods were used to

Chapter 1. Background
55
determine differences in transmural myocardial blood flow. The results of these
studies are presented in Chapter 6.
Key Hypotheses Under Investigation in this Thesis
1. The reduction of ischaemia seen on second exercise in patients with coronary
artery disease can be explained by changes in central haemodynamics,
especially a reduction in central blood pressure causing a reduction in
ventricular afterload and enhanced vascular-‐ventricular coupling.
2. Warm up angina is associated with reduced microvascular resistance and an
improvement in subendocardial perfusion and on second exercise
3. Postconditioning causes a reduction in infarct size through activation of
innate myocardial protective mechanisms
56
2 METHODS AND TECHNIQUES USED IN THIS THESIS
2.1 Introduction
This chapter outlines some of the specific techniques used in this thesis. A general
description of many of these has been given in the previous chapter and detailed
derivations of certain indices and quantification methods will be referenced rather
than presented in full. Such derivations will be presented, however, if they are of
relevance to the results and discussion of the particular experiments in which they
were used.
This chapter will also cover the development of the novel techniques used in this
thesis and include some of the preliminary data that were obtained for internal
validations and reproducibility purposes and to fine-‐tune methods prior to their use
in the main studies.
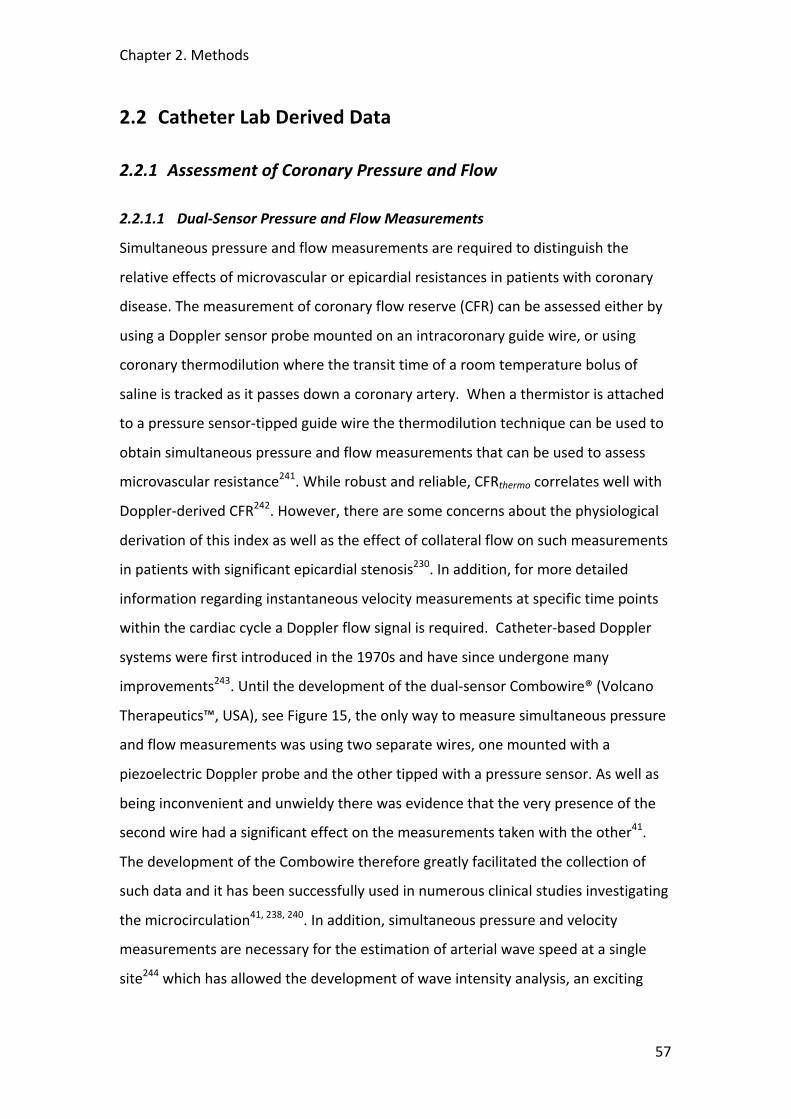
Chapter 2. Methods
57
2.2 Catheter Lab Derived Data
2.2.1 Assessment of Coronary Pressure and Flow
2.2.1.1 Dual-‐Sensor Pressure and Flow Measurements
Simultaneous pressure and flow measurements are required to distinguish the
relative effects of microvascular or epicardial resistances in patients with coronary
disease. The measurement of coronary flow reserve (CFR) can be assessed either by
using a Doppler sensor probe mounted on an intracoronary guide wire, or using
coronary thermodilution where the transit time of a room temperature bolus of
saline is tracked as it passes down a coronary artery. When a thermistor is attached
to a pressure sensor-‐tipped guide wire the thermodilution technique can be used to
obtain simultaneous pressure and flow measurements that can be used to assess
microvascular resistance241. While robust and reliable, CFRthermo correlates well with
Doppler-‐derived CFR242. However, there are some concerns about the physiological
derivation of this index as well as the effect of collateral flow on such measurements
in patients with significant epicardial stenosis230. In addition, for more detailed
information regarding instantaneous velocity measurements at specific time points
within the cardiac cycle a Doppler flow signal is required. Catheter-‐based Doppler
systems were first introduced in the 1970s and have since undergone many
improvements243. Until the development of the dual-‐sensor Combowire® (Volcano
Therapeutics™, USA), see Figure 15, the only way to measure simultaneous pressure
and flow measurements was using two separate wires, one mounted with a
piezoelectric Doppler probe and the other tipped with a pressure sensor. As well as
being inconvenient and unwieldy there was evidence that the very presence of the
second wire had a significant effect on the measurements taken with the other41.
The development of the Combowire therefore greatly facilitated the collection of
such data and it has been successfully used in numerous clinical studies investigating
the microcirculation41, 238, 240. In addition, simultaneous pressure and velocity
measurements are necessary for the estimation of arterial wave speed at a single
site244 which has allowed the development of wave intensity analysis, an exciting

Chapter 2. Methods
58
new method of assessment of travelling waves within the coronary circulation (see
next section)245.
Figure 15. 0.014” Dual-‐sensor guide wire, Combowire® (Volcano Therapeutics™, USA). On this version of the wire (model 9515), the pressure sensor is offset by 30mm from the Doppler sensor which is situated at the tip if the wire. Another version is available (model 9500) where both sensors are situated at the tip, although this can be more difficult to manipulate in tortuous vessels or across tight lesions.
Figure 16. Screenshop from the ComboMap™ console showing simultaneous pressure and flow measurements.
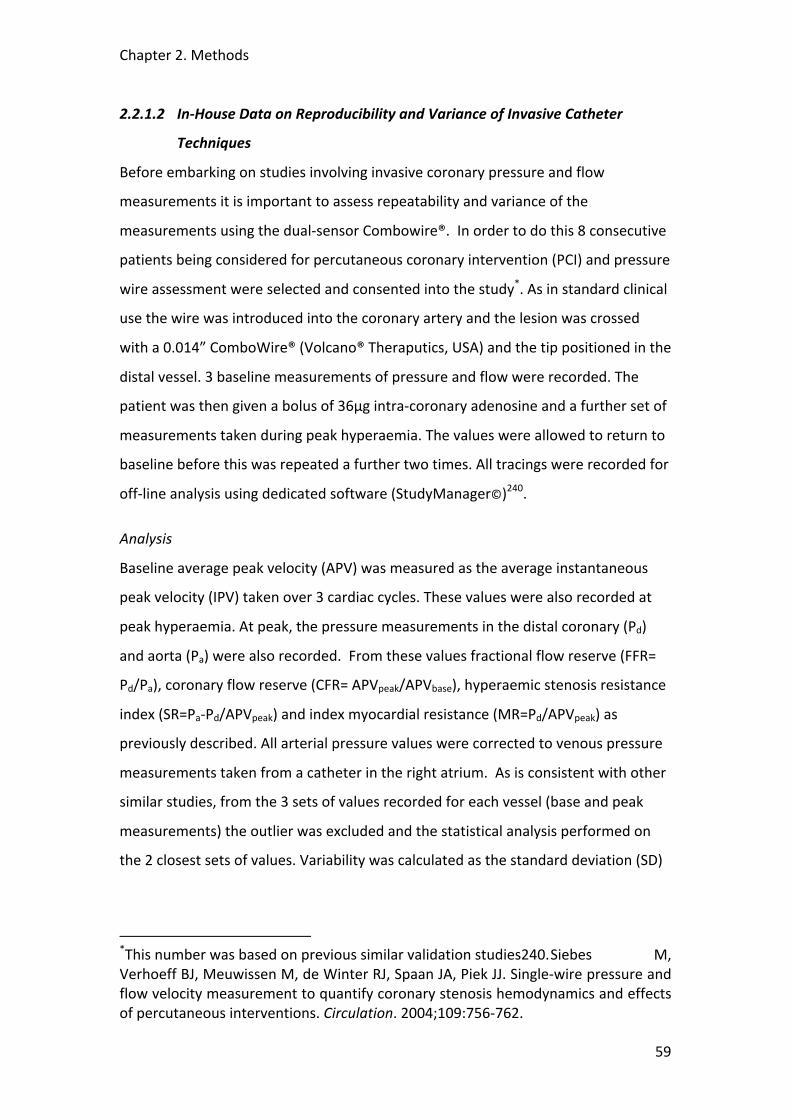
Chapter 2. Methods
59
2.2.1.2 In-‐House Data on Reproducibility and Variance of Invasive Catheter
Techniques
Before embarking on studies involving invasive coronary pressure and flow
measurements it is important to assess repeatability and variance of the
measurements using the dual-‐sensor Combowire®. In order to do this 8 consecutive
patients being considered for percutaneous coronary intervention (PCI) and pressure
wire assessment were selected and consented into the study*. As in standard clinical
use the wire was introduced into the coronary artery and the lesion was crossed
with a 0.014” ComboWire® (Volcano® Theraputics, USA) and the tip positioned in the
distal vessel. 3 baseline measurements of pressure and flow were recorded. The
patient was then given a bolus of 36μg intra-‐coronary adenosine and a further set of
measurements taken during peak hyperaemia. The values were allowed to return to
baseline before this was repeated a further two times. All tracings were recorded for
off-‐line analysis using dedicated software (StudyManager©)240.
Analysis
Baseline average peak velocity (APV) was measured as the average instantaneous
peak velocity (IPV) taken over 3 cardiac cycles. These values were also recorded at
peak hyperaemia. At peak, the pressure measurements in the distal coronary (Pd)
and aorta (Pa) were also recorded. From these values fractional flow reserve (FFR=
Pd/Pa), coronary flow reserve (CFR= APVpeak/APVbase), hyperaemic stenosis resistance
index (SR=Pa-‐Pd/APVpeak) and index myocardial resistance (MR=Pd/APVpeak) as
previously described. All arterial pressure values were corrected to venous pressure
measurements taken from a catheter in the right atrium. As is consistent with other
similar studies, from the 3 sets of values recorded for each vessel (base and peak
measurements) the outlier was excluded and the statistical analysis performed on
the 2 closest sets of values. Variability was calculated as the standard deviation (SD)
*This number was based on previous similar validation studies240. Siebes M, Verhoeff BJ, Meuwissen M, de Winter RJ, Spaan JA, Piek JJ. Single-‐wire pressure and flow velocity measurement to quantify coronary stenosis hemodynamics and effects of percutaneous interventions. Circulation. 2004;109:756-‐762.

Chapter 2. Methods
60
divided by the mean and expressed as a percentage. Bland-‐Altman plots were then
used to record the mean difference and standard error.
Results
14 vessels in 8 patients were examined in the study. Measurements were
successfully taken in 13 vessels (5 LAD, 5 Cx and 3 RCA). One set of data was
unusable due to poor quality of the traces.
Absolute mean±SD
Variability (%)
Mean absolute difference
95% CI Standard Error
Base APV 19±7.9 7.8 2.16 0.3-‐4 2.2
Peak APV 33.5±11.5 7.3 3.43 1.1-‐5.8 3.2
Pa 73.3±11.8 2.5 2.56 0.1-‐5 3.3
Pd 58±10.7 2.9 2.57 0.2-‐2.9 2.9
FFR 0.79±0.16 1.7 0.02 -‐0.004-‐0.05 0.05
CFR 1.8±0.6 8.4 0.2 0.03-‐0.3 0.17
SR 0.67±1 12.3 0.05 0.006-‐0.1 0.27
MR 2±0.72 7.3 0.21 0.02-‐0.4 0.2
Table 1. Table of results for Combowire measurements taken from 3 sequential data sets taken from 13 vessels in 8 patients. Variability was calculated as the standard deviation (SD) divided by the mean and expressed as a percentage. APV = average peak velocity, Pa = mean aortic pressure, Pd= mean distal coronary pressure, FFR =fractional flow reserve, CFR =coronary flow reserve, SR =hyperaemic stenosis resistance index, MR =index of myocardial resistance, SD =standard deviation.
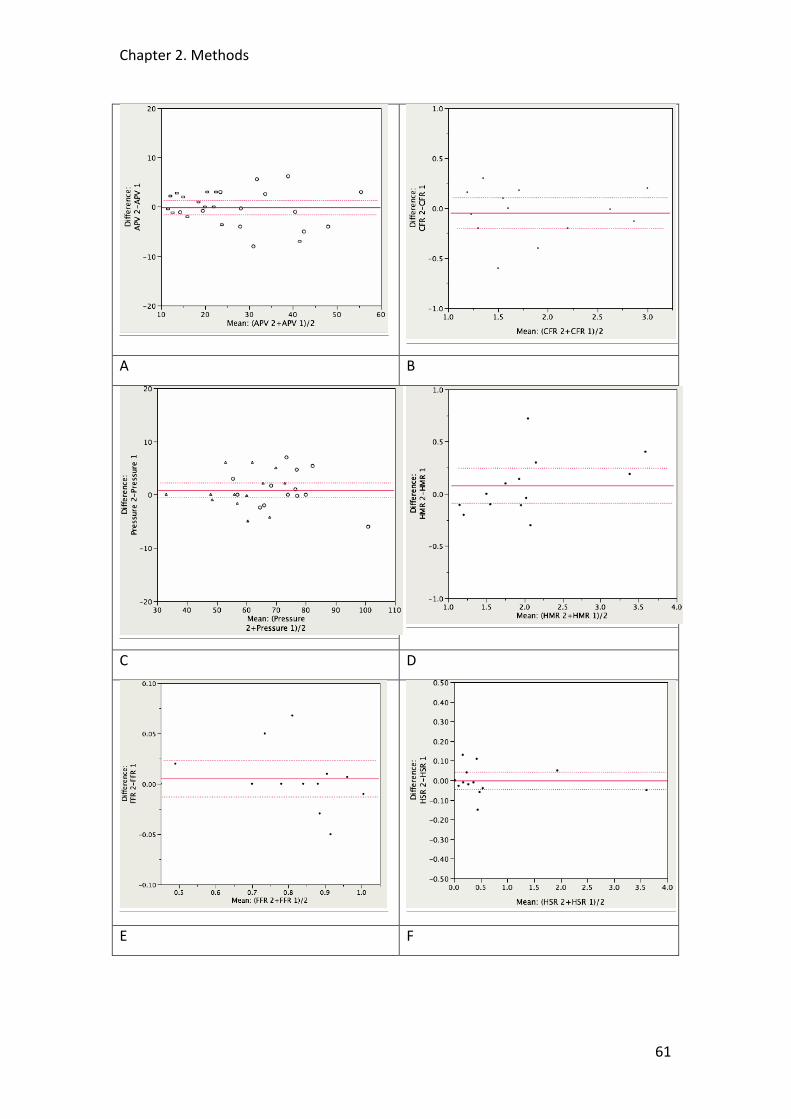
Chapter 2. Methods
61
A B
C D
E F
Chapter 2. Methods
62
Figure 17. Bland-‐Altman Plots showing mean difference and standard error (SE) for A) Average peak velocity (APV), B) coronary flow reserve (CFR), C) Pressure measurements, D) index myocardial resistance (MRv), E) fractional flow reserve (FFR), and F) hyperaemic stenosis resistance index (SRv).
These data suggest a high degree of repeatability with low variance for Combowire
measurements in our institution that compare well to results from other centres
published in the literature240.
2.2.2 Pulse Wave Analysis
Assessment of the arterial pulse has been a major part of medical assessment and
investigation since the earliest times. The arterial pulse is of complex shape, varies
with age, differs in different arteries, and changes markedly with physiological and
pharmacological interventions. However, advances in pulse wave interpretation
have only been possible since the development of accurate high-‐fidelity instruments
for invasive and non-‐invasive pressure wave recording, and for a deeper
understanding of arterial hemodynamics to be achieved. This occurred with the
introduction of catheter-‐tip manometers in the 1970s, and with the development of
methods to characterize and analyze the arterial pulse in the frequency as well as
the time domain246.
2.2.2.1 Peripheral Vs. Central Measurement of the Aortic Pressure Waveform
In the majority of studies, limitations in the direct measurement of central aortic
systolic pressure mean that such measurements are usually estimated using a radial-‐
aortic transfer function, such as that incorporated into a peripheral applanation
tonometer88, 89, 247, 248. This transfer function has been validated to estimate reliably
central systolic blood pressure (and pulse pressure) at low workloads249 but has not
been validated at higher heart rates/workloads which would limit it’s use in the
proposed studies for this thesis. Transfer functions do change during exercise 250,
and therefore this technique may have limitations with respect to precise estimation
of central pressure at high heart rates/workloads. Limitations on the accuracy of
estimation of central pressure may also be imposed by calibration of peripheral
arterial waveforms by brachial cuff pressure251 and by brachial-‐to-‐ radial
Chapter 2. Methods
63
amplification252. Because of these, we sought to develop a protocol whereby central
aortic pressure would be measured directly using a high fidelity pressure-‐sensor
tipped wire. The development of this protocol is described in more detail in Section
2.2.4 below
2.2.2.2 Physiological Parameters Derived from the Central Aortic Pressure
Waveform
A typical central pressure waveform is shown in Figure 8 above. TF marks the foot
(start) of the pressure waveform. The time between two consecutive TF is the
cardiac cycle, or pulse, duration. P1 is the pressure at the “first shoulder”
(“inflection”) that represents the non-‐augmented systolic pressure that is devoid of
the effects of the reflected waveform. P2 is the maximum height of the waveform
and represents the central systolic blood pressure (cSBP). TR is the time between TF
and Pi that denotes the round-‐trip time taken for pressure waveform to be
propagated from the central aorta to the site of reflection and back again, which
results in pressure augmentation. The difference between P1 and P2 quantifies this
phenomenon (Aug). The lowest point of the pressure waveform is the central
diastolic blood pressure (cDBP, not shown), and the difference between cSBP and
cDBP is the central pulse pressure (cPP). Systolic (ejection) duration is defined as the
time between TF to the dicrotic notch; the latter corresponding to the global
maximum of the second derivative of the pressure waveform between the systolic
peak and the end of the pressure waveform. Diastolic duration is the time from the
dicrotic notch to the foot of the next wave. The diastolic time fraction (DTF) is the
diastolic duration expressed as a fraction of the pulse duration. The area under the
waveform (pressure-‐time integral) during systole is the tension time index (TTI) and
that during diastole is the diastolic time index (DTI, hatched), which are indices for
myocardial oxygen consumption and supply respectively89. TTI and DTI divided by
the systolic and diastolic durations respectively constitute the mean systolic and
diastolic pressures.
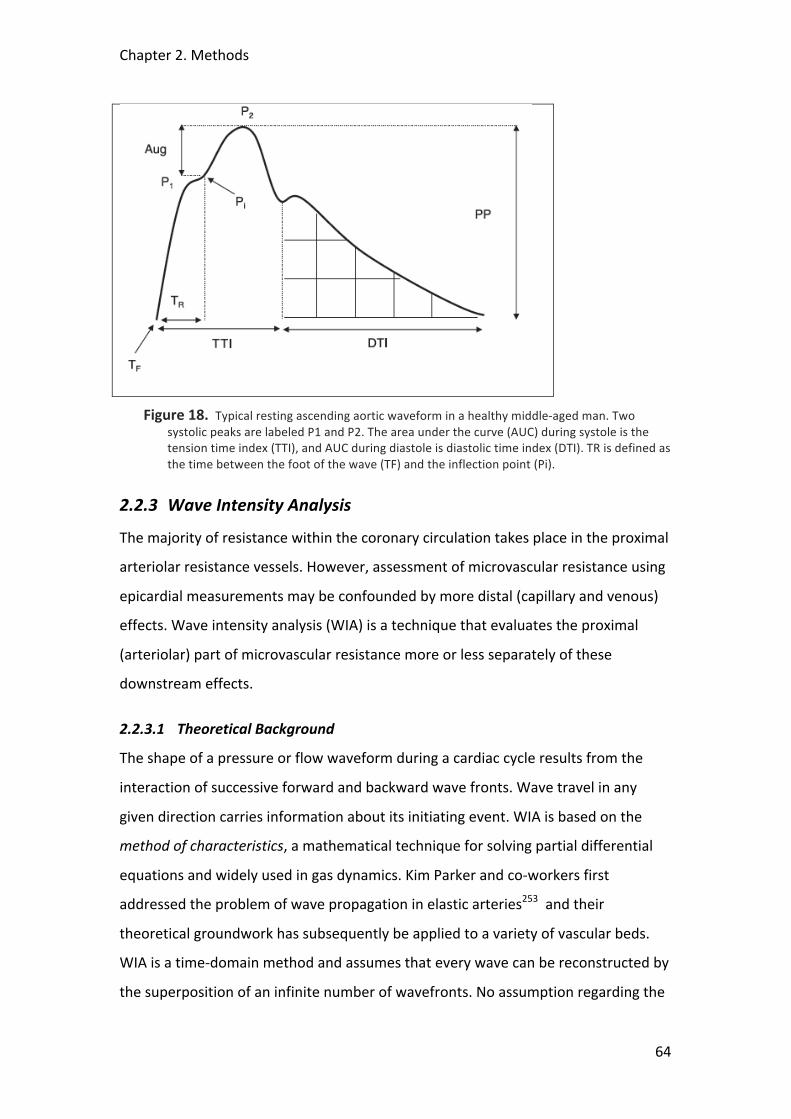
Chapter 2. Methods
64
Figure 18. Typical resting ascending aortic waveform in a healthy middle-‐aged man. Two systolic peaks are labeled P1 and P2. The area under the curve (AUC) during systole is the tension time index (TTI), and AUC during diastole is diastolic time index (DTI). TR is defined as the time between the foot of the wave (TF) and the inflection point (Pi).
2.2.3 Wave Intensity Analysis
The majority of resistance within the coronary circulation takes place in the proximal
arteriolar resistance vessels. However, assessment of microvascular resistance using
epicardial measurements may be confounded by more distal (capillary and venous)
effects. Wave intensity analysis (WIA) is a technique that evaluates the proximal
(arteriolar) part of microvascular resistance more or less separately of these
downstream effects.
2.2.3.1 Theoretical Background
The shape of a pressure or flow waveform during a cardiac cycle results from the
interaction of successive forward and backward wave fronts. Wave travel in any
given direction carries information about its initiating event. WIA is based on the
method of characteristics, a mathematical technique for solving partial differential
equations and widely used in gas dynamics. Kim Parker and co-‐workers first
addressed the problem of wave propagation in elastic arteries253 and their
theoretical groundwork has subsequently be applied to a variety of vascular beds.
WIA is a time-‐domain method and assumes that every wave can be reconstructed by
the superposition of an infinite number of wavefronts. No assumption regarding the

Chapter 2. Methods
65
periodicity of the interrogated signals or the linearity of the system under study is
necessary. The full mathematical derivation of WIA is not presented here but can be
found in the paper by Parker et al referenced above. WIA has dimensions of power
per unit area and refers to the power carried by the waves travelling in the blood
stream and not to the waves propagating in the vessel wall. It allows separation of
upstream from downstream originating events based on a single set of
measurements at an accessible site remote from where the waves were initiated244,
254.
WIA is uniquely suited to investigate events in the coronary circulation, where
forward waves originate in the left ventricular cavity and are transmitted to the
coronary vessels via the aorta, and backward waves originate in the small vessels
within the contracting or relaxing myocardium and are damped by the proximal
resistance arteries254. WIA can identify the origin and nature (acceleration or
deceleration of blood flow) of these overlapping waves and cast light on how the
complex interaction of ventricle, coronary artery, and myocardial microcirculation
produces the recognisable coronary pressure and flow profiles. These new concepts
have recently been applied to normal coronary vessels in animals255, 256 and
humans245.
2.2.3.2 The Pattern of Coronary Waves Generated Throughout the Cardiac Cycle
The application of WIA to the human coronary circulation was first carried out by
Davies et al245 and the description below is adapted from their observations of
waves during the cardiac cycle.
Waves Occurring During Ventricular Contraction
The early backward-‐traveling pushing wave (labelled 1 in Figure 19) originates from
the microcirculation in early systole before opening of the aortic valve, when small
vessels that permeate throughout the myocardial beds are compressed by the
contracting ventricle, as described by Spaan et al43 in the intramyocardial pump
model. This pushing wave propagates backwards along the coronary artery toward
the coronary ostium. Because of the severe impedance mismatch between the
coronary artery and the aorta, a large proportion of this wave is reflected back into
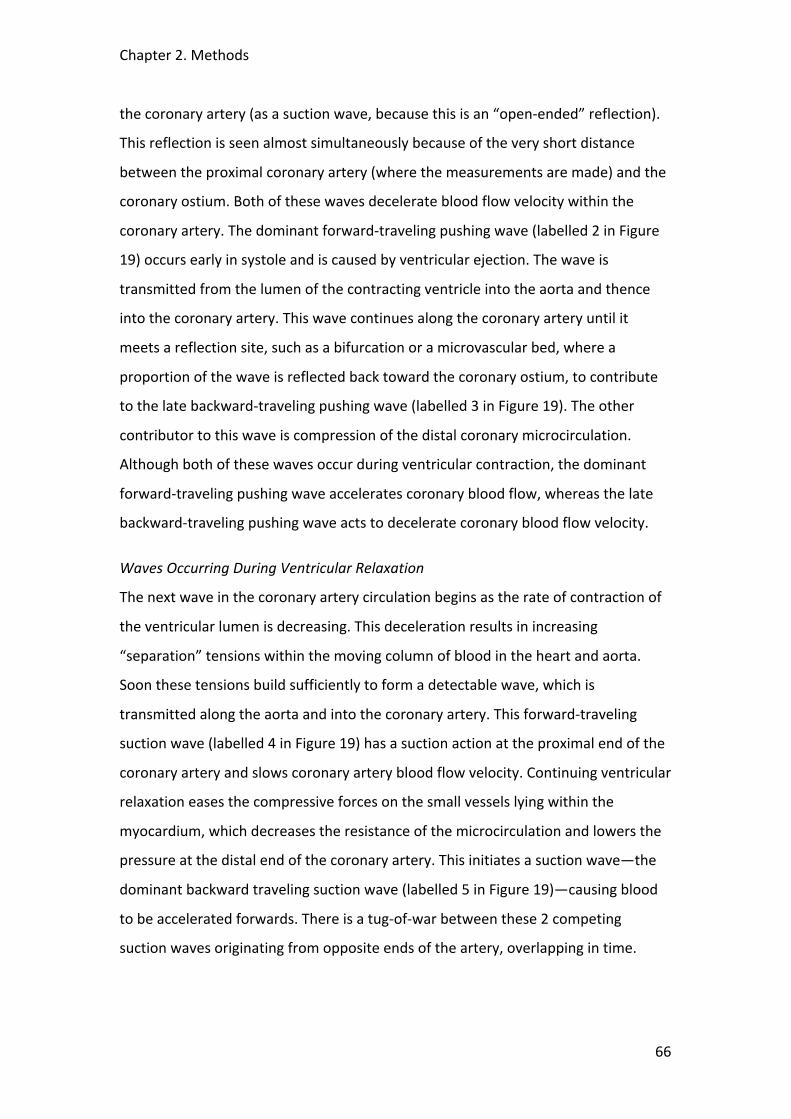
Chapter 2. Methods
66
the coronary artery (as a suction wave, because this is an “open-‐ended” reflection).
This reflection is seen almost simultaneously because of the very short distance
between the proximal coronary artery (where the measurements are made) and the
coronary ostium. Both of these waves decelerate blood flow velocity within the
coronary artery. The dominant forward-‐traveling pushing wave (labelled 2 in Figure
19) occurs early in systole and is caused by ventricular ejection. The wave is
transmitted from the lumen of the contracting ventricle into the aorta and thence
into the coronary artery. This wave continues along the coronary artery until it
meets a reflection site, such as a bifurcation or a microvascular bed, where a
proportion of the wave is reflected back toward the coronary ostium, to contribute
to the late backward-‐traveling pushing wave (labelled 3 in Figure 19). The other
contributor to this wave is compression of the distal coronary microcirculation.
Although both of these waves occur during ventricular contraction, the dominant
forward-‐traveling pushing wave accelerates coronary blood flow, whereas the late
backward-‐traveling pushing wave acts to decelerate coronary blood flow velocity.
Waves Occurring During Ventricular Relaxation
The next wave in the coronary artery circulation begins as the rate of contraction of
the ventricular lumen is decreasing. This deceleration results in increasing
“separation” tensions within the moving column of blood in the heart and aorta.
Soon these tensions build sufficiently to form a detectable wave, which is
transmitted along the aorta and into the coronary artery. This forward-‐traveling
suction wave (labelled 4 in Figure 19) has a suction action at the proximal end of the
coronary artery and slows coronary artery blood flow velocity. Continuing ventricular
relaxation eases the compressive forces on the small vessels lying within the
myocardium, which decreases the resistance of the microcirculation and lowers the
pressure at the distal end of the coronary artery. This initiates a suction wave—the
dominant backward traveling suction wave (labelled 5 in Figure 19)—causing blood
to be accelerated forwards. There is a tug-‐of-‐war between these 2 competing
suction waves originating from opposite ends of the artery, overlapping in time.
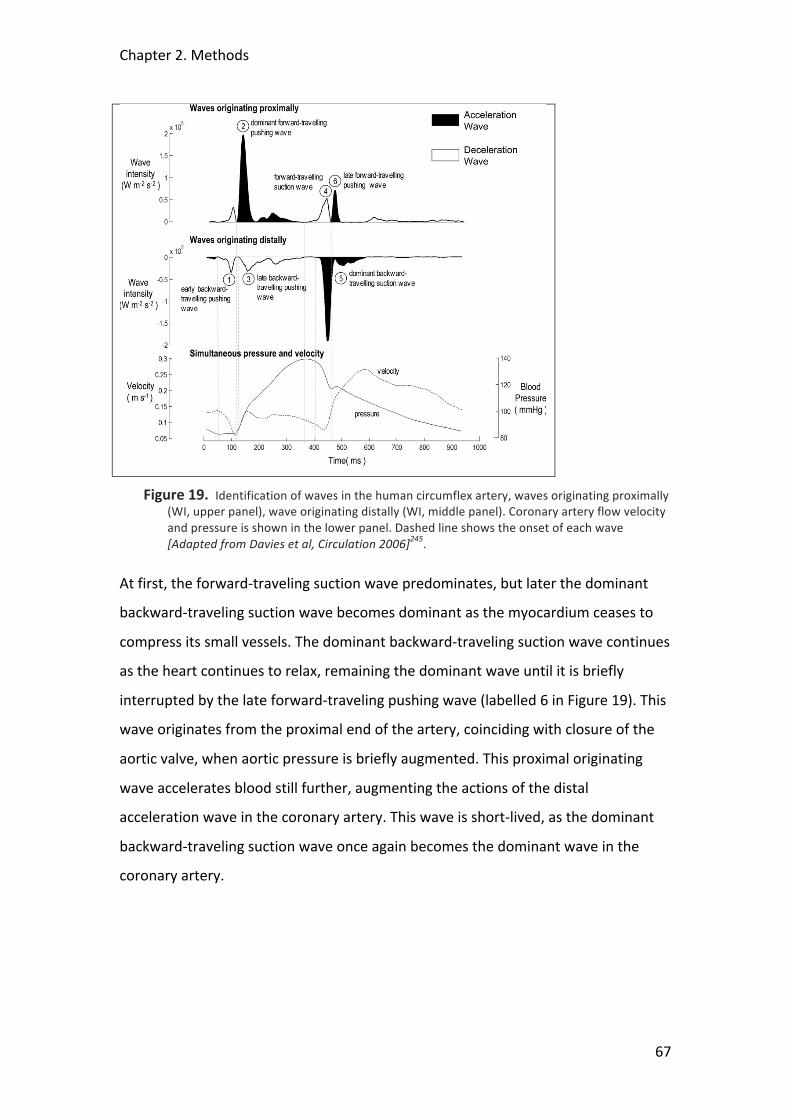
Chapter 2. Methods
67
Figure 19. Identification of waves in the human circumflex artery, waves originating proximally (WI, upper panel), wave originating distally (WI, middle panel). Coronary artery flow velocity and pressure is shown in the lower panel. Dashed line shows the onset of each wave [Adapted from Davies et al, Circulation 2006]245.
At first, the forward-‐traveling suction wave predominates, but later the dominant
backward-‐traveling suction wave becomes dominant as the myocardium ceases to
compress its small vessels. The dominant backward-‐traveling suction wave continues
as the heart continues to relax, remaining the dominant wave until it is briefly
interrupted by the late forward-‐traveling pushing wave (labelled 6 in Figure 19). This
wave originates from the proximal end of the artery, coinciding with closure of the
aortic valve, when aortic pressure is briefly augmented. This proximal originating
wave accelerates blood still further, augmenting the actions of the distal
acceleration wave in the coronary artery. This wave is short-‐lived, as the dominant
backward-‐traveling suction wave once again becomes the dominant wave in the
coronary artery.
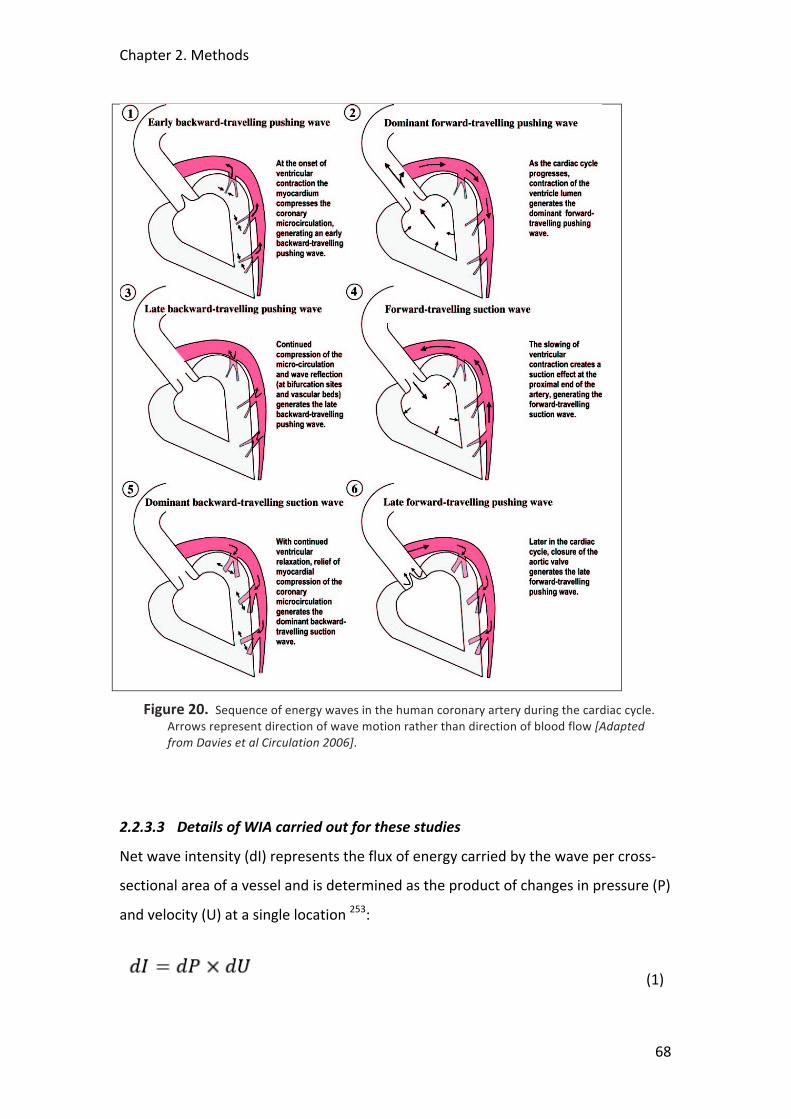
Chapter 2. Methods
68
Figure 20. Sequence of energy waves in the human coronary artery during the cardiac cycle. Arrows represent direction of wave motion rather than direction of blood flow [Adapted from Davies et al Circulation 2006].
2.2.3.3 Details of WIA carried out for these studies
Net wave intensity (dI) represents the flux of energy carried by the wave per cross-‐
sectional area of a vessel and is determined as the product of changes in pressure (P)
and velocity (U) at a single location 253:
(1)
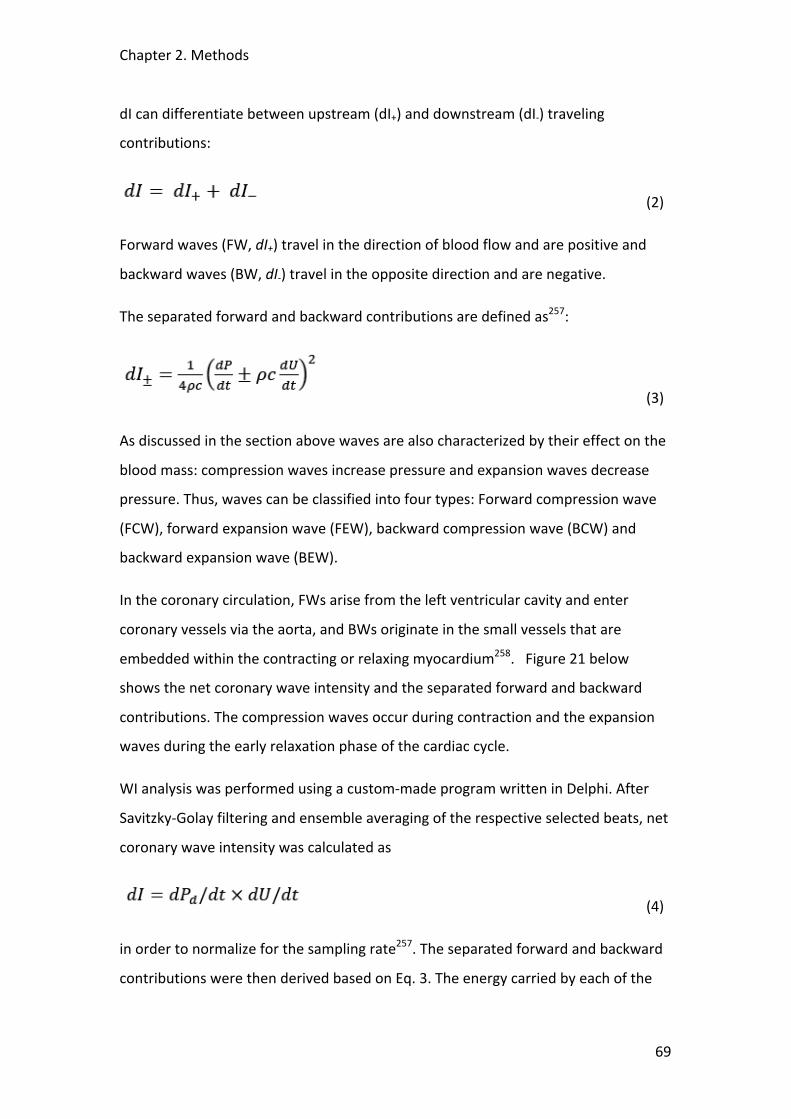
Chapter 2. Methods
69
dI can differentiate between upstream (dI+) and downstream (dI-‐) traveling
contributions:
(2)
Forward waves (FW, dI+) travel in the direction of blood flow and are positive and
backward waves (BW, dI-‐) travel in the opposite direction and are negative.
The separated forward and backward contributions are defined as257:
(3)
As discussed in the section above waves are also characterized by their effect on the
blood mass: compression waves increase pressure and expansion waves decrease
pressure. Thus, waves can be classified into four types: Forward compression wave
(FCW), forward expansion wave (FEW), backward compression wave (BCW) and
backward expansion wave (BEW).
In the coronary circulation, FWs arise from the left ventricular cavity and enter
coronary vessels via the aorta, and BWs originate in the small vessels that are
embedded within the contracting or relaxing myocardium258. Figure 21 below
shows the net coronary wave intensity and the separated forward and backward
contributions. The compression waves occur during contraction and the expansion
waves during the early relaxation phase of the cardiac cycle.
WI analysis was performed using a custom-‐made program written in Delphi. After
Savitzky-‐Golay filtering and ensemble averaging of the respective selected beats, net
coronary wave intensity was calculated as
(4)
in order to normalize for the sampling rate257. The separated forward and backward
contributions were then derived based on Eq. 3. The energy carried by each of the
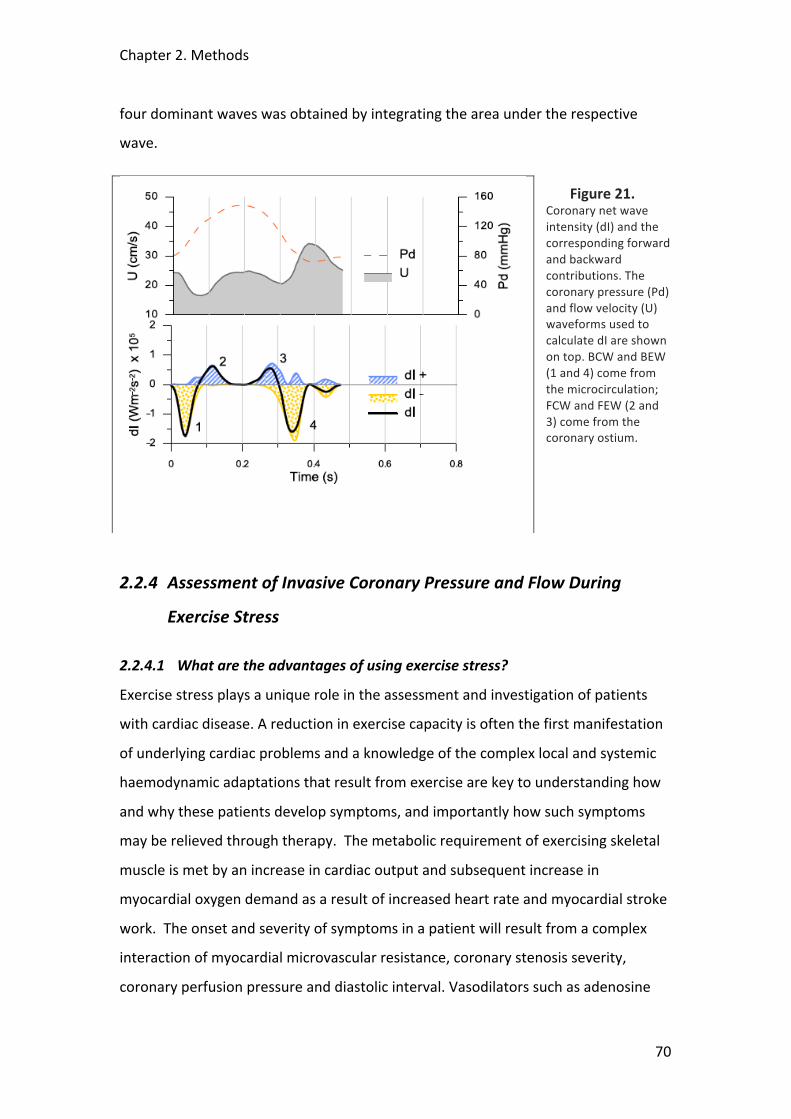
Chapter 2. Methods
70
four dominant waves was obtained by integrating the area under the respective
wave.
Figure 21. Coronary net wave intensity (dI) and the corresponding forward and backward contributions. The coronary pressure (Pd) and flow velocity (U) waveforms used to calculate dI are shown on top. BCW and BEW (1 and 4) come from the microcirculation; FCW and FEW (2 and 3) come from the coronary ostium.
2.2.4 Assessment of Invasive Coronary Pressure and Flow During
Exercise Stress
2.2.4.1 What are the advantages of using exercise stress?
Exercise stress plays a unique role in the assessment and investigation of patients
with cardiac disease. A reduction in exercise capacity is often the first manifestation
of underlying cardiac problems and a knowledge of the complex local and systemic
haemodynamic adaptations that result from exercise are key to understanding how
and why these patients develop symptoms, and importantly how such symptoms
may be relieved through therapy. The metabolic requirement of exercising skeletal
muscle is met by an increase in cardiac output and subsequent increase in
myocardial oxygen demand as a result of increased heart rate and myocardial stroke
work. The onset and severity of symptoms in a patient will result from a complex
interaction of myocardial microvascular resistance, coronary stenosis severity,
coronary perfusion pressure and diastolic interval. Vasodilators such as adenosine
Chapter 2. Methods
71
and dipyridamole, or inotropes such as dobutamine are used in everyday practice as
pharmacological stressor agents in a wide range of cardiac investigations, including
echocardiography, nuclear perfusion and in the catheter lab to measure fractional
flow reserve (FFR). In research, rapid cardiac pacing has been advocated as an
additional, alternative stressor and while it reduces diastolic interval it may actually
reduce cardiac work by diminishing diastolic filling and hence stroke volume12. While
the effect of these different methods can simulate some of the haemodynamic
components of exercise, none can recapitulate its full effects and therefore such
methods do not provide an accurate impression of what is actually happening at the
time of onset of symptoms in the patient.
Exercise stress testing using either a treadmill or bicycle is widely used in the non-‐
invasive sphere of cardiac investigation and research. In the catheter laboratory,
however, impracticalities have limited its use despite an increase in the interest and
utilization of invasive physiological measurements, both in the clinical assessment of
coronary disease259 and as a research tool. The development of a combined pressure
and flow intracoronary wire 240 has further improved our capability to interrogate
the intricate haemodynamic events occurring at a coronary and microvascular level.
Vasodilator agents (primarily adenosine) are generally used to induce maximal blood
flow, or hyperaemia, either delivered locally or systemically. While the
administration of such agents may be sufficient to induce minimal microvascular
resistance or invoke a pressure drop across a coronary stenosis, such effects bear
little resemblance to the intense systemic haemodynamic impact of strenuous
exercise on the circulation. The effects of exercise on large artery haemodynamics
are also thought to play a key role in the manifestations of cardiac disease. Pulse
wave analysis88 of the central aortic pressure trace as well as wave intensity analysis
of combined central pressure and flow measurements260 have the potential to take
our understanding further but rely on high fidelity signals obtained invasively during
exercise. To date, there have been no published data examining the effects of
exercise stress on invasively-‐acquired aortic and coronary pressure and flow data
obtained during cardiac catheterisation.

Chapter 2. Methods
72
Our purpose was to develop a protocol where invasive aortic and intracoronary
physiological measurements could be obtained during strenuous exercise stress in
patients undergoing cardiac catheterisation.
2.2.4.2 Development of the experimental protocol
The requirement for the development of this protocol was that measurements be
actually recorded during exercise stress rather than immediately before or after.
Under some circumstances bicycle stress is used immediately before measurements
of pulmonary artery pressure during right heart catheterisation via the brachial
vein261. However, in most patients there is a rapid decrement in peak heart rate that
occurs after the cessation of exercise262 and in our study with the time that would be
taken to position the patient, intubate the coronary artery and pass the sensor wire
into the diseased vessel, this would not be possible. In addition, we wanted to
record the full range of data throughout exercise from baseline through incremental
increases in workload until peak stress and then through recovery.
Study Patients
Patients were recruited from routine waiting lists for percutaneous coronary
intervention (PCI) for single vessel coronary disease. Exclusion criteria were unstable
symptoms, previous myocardial infarction/CABG, impaired left ventricular (LV)
function, severe co-‐morbidities, and inability to exercise.
Supine ergometer
A variety of methods to induce exercise stress were considered. Handgrip repetitive
exercise is simple and allows trans-‐femoral arterial access. However, it only utilizes
the small muscles in the hand and forearm and does not induce the large
haemodynamic changes that accompany lower limb bulk muscle exercise89; hence it
is difficult to reach the ischaemic threshold in patients with coronary disease.
Straight leg-‐raising is another option, but is difficult to standardize and ensure
consistency of workload. Again it is difficult for patients to reach their ischaemic
threshold through this technique alone. After due deliberation, a specially adapted
supine cycle ergometer (Ergosana®, Germany) was selected (see Figure 22 below)
which allows a standardized and incremental increase in workload, as well as
Chapter 2. Methods
73
allowing leg movements familiar to most patients. Supine cycle ergometers are
commonly used in other settings, such as stress echocardiography, where the
patients exercise to their ischaemic threshold. A special clamping mechanism to
allow the bike (which weighs in excess of 60 kilograms) to be firmly attached to the
catheter laboratory table was designed and built by the engineering department at
our institution as well as a mechanism for its rapid fitting to, and removal from, the
table. The device was then thoroughly tested by the local health and safety team to
ensure it complied with all safety regulations and did not hinder the movement of
the table or interfere with the ability of the team to carry out the catheter procedure
or deal with its rare acute complications.
Figure 22. Supine cycle ergometer (Ergosana®, Germany) with purpose made mechanism to and from, and to attach to, the catheter lab table.
Supine Vs. Upright Exercise
For the purposes of this study where the intention was to record invasive
physiological data in the catheterisation lab actually during exercise, we were
obliged to use supine exercise. Supine exercise has been used in numerous previous
physiological studies104, 263, 264. In one such study, Sowton et al measured
hemodynamic changes in a group of young subjects (some with pulmonary valve
disease) during both upright and supine exercise263. The alteration in posture from
lying supine to sitting erect on the bicycle ergometer was accompanied by a mean
fall in cardiac output of 25 per cent; the stroke volume fell by 36 per cent and there
was a 12 per cent increase in the heart rate. These changes are in agreement with
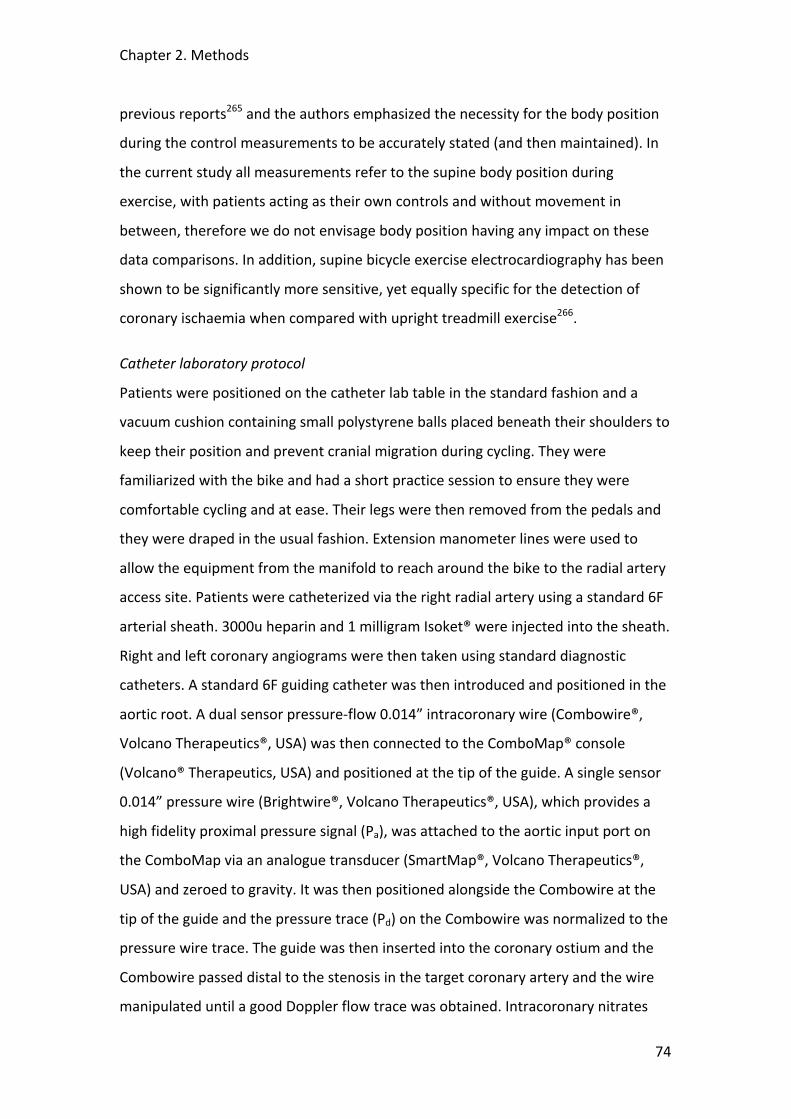
Chapter 2. Methods
74
previous reports265 and the authors emphasized the necessity for the body position
during the control measurements to be accurately stated (and then maintained). In
the current study all measurements refer to the supine body position during
exercise, with patients acting as their own controls and without movement in
between, therefore we do not envisage body position having any impact on these
data comparisons. In addition, supine bicycle exercise electrocardiography has been
shown to be significantly more sensitive, yet equally specific for the detection of
coronary ischaemia when compared with upright treadmill exercise266.
Catheter laboratory protocol
Patients were positioned on the catheter lab table in the standard fashion and a
vacuum cushion containing small polystyrene balls placed beneath their shoulders to
keep their position and prevent cranial migration during cycling. They were
familiarized with the bike and had a short practice session to ensure they were
comfortable cycling and at ease. Their legs were then removed from the pedals and
they were draped in the usual fashion. Extension manometer lines were used to
allow the equipment from the manifold to reach around the bike to the radial artery
access site. Patients were catheterized via the right radial artery using a standard 6F
arterial sheath. 3000u heparin and 1 milligram Isoket® were injected into the sheath.
Right and left coronary angiograms were then taken using standard diagnostic
catheters. A standard 6F guiding catheter was then introduced and positioned in the
aortic root. A dual sensor pressure-‐flow 0.014” intracoronary wire (Combowire®,
Volcano Therapeutics®, USA) was then connected to the ComboMap® console
(Volcano® Therapeutics, USA) and positioned at the tip of the guide. A single sensor
0.014” pressure wire (Brightwire®, Volcano Therapeutics®, USA), which provides a
high fidelity proximal pressure signal (Pa), was attached to the aortic input port on
the ComboMap via an analogue transducer (SmartMap®, Volcano Therapeutics®,
USA) and zeroed to gravity. It was then positioned alongside the Combowire at the
tip of the guide and the pressure trace (Pd) on the Combowire was normalized to the
pressure wire trace. The guide was then inserted into the coronary ostium and the
Combowire passed distal to the stenosis in the target coronary artery and the wire
manipulated until a good Doppler flow trace was obtained. Intracoronary nitrates

Chapter 2. Methods
75
were not given, to maintain as close to real life conditions as possible. At this point
the guide was disengaged, carefully avoiding displacing the Combowire, and the
pressure wire was passed into the aortic root and a stable pressure signal obtained
(see Figure 23 below). Finally, a servo-‐controlled finger pressure cuff (Finometer,
Finapres Medical Systems®) was positioned and used to record the peripheral
pressure waveform. All data were recorded at 100 Hz and stored on a disk for off-‐
line analysis.
Exercise protocol
When the set-‐up was complete the patient’s feet were fitted into the pedals on the
bike and baseline measurements were taken before the patient underwent 2 periods
of exercise (see Figure 24 below). The exercise protocol is a standardised
incremental programme based on the patients weight and age, typically starting at
25W and increasing by 20W each minute. Exercise was continued until any of the
following occurred, 1) ST depression >3mm, 2) maximum age-‐related heart rate, 3)
severe chest pain, 4) physical exhaustion, 5) occurrence of adverse conditions such
as hypotension, severe arrhythmia or dyspnoea.
Coronary flow and pressure data, ECG, central aortic pressure and peripheral
pressure waveforms were recorded continuously throughout exercise and recovery.
At intervals throughout the exercise protocol the aortic root was screened to ensure
the correct position of the wires and the guide. At the end of the study protocol the
patient underwent their planned percutaneous revascularization procedure.
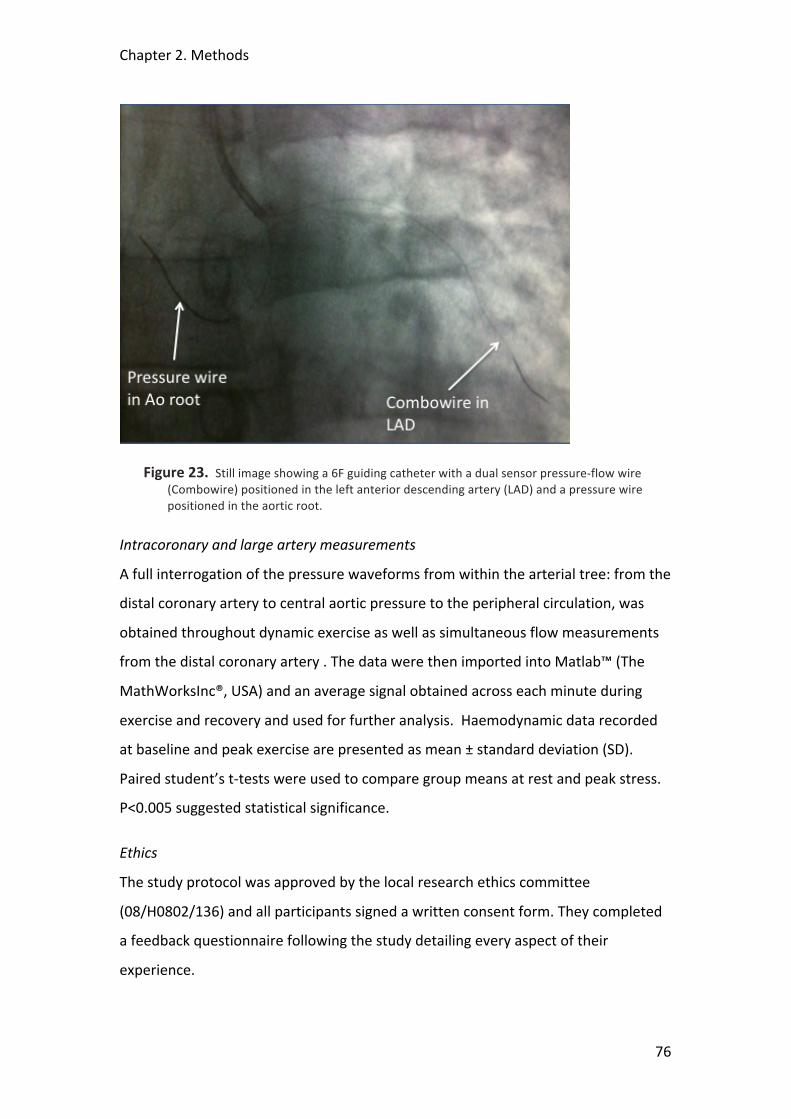
Chapter 2. Methods
76
Figure 23. Still image showing a 6F guiding catheter with a dual sensor pressure-‐flow wire (Combowire) positioned in the left anterior descending artery (LAD) and a pressure wire positioned in the aortic root.
Intracoronary and large artery measurements
A full interrogation of the pressure waveforms from within the arterial tree: from the
distal coronary artery to central aortic pressure to the peripheral circulation, was
obtained throughout dynamic exercise as well as simultaneous flow measurements
from the distal coronary artery . The data were then imported into Matlab™ (The
MathWorksInc®, USA) and an average signal obtained across each minute during
exercise and recovery and used for further analysis. Haemodynamic data recorded
at baseline and peak exercise are presented as mean ± standard deviation (SD).
Paired student’s t-‐tests were used to compare group means at rest and peak stress.
P<0.005 suggested statistical significance.
Ethics
The study protocol was approved by the local research ethics committee
(08/H0802/136) and all participants signed a written consent form. They completed
a feedback questionnaire following the study detailing every aspect of their
experience.
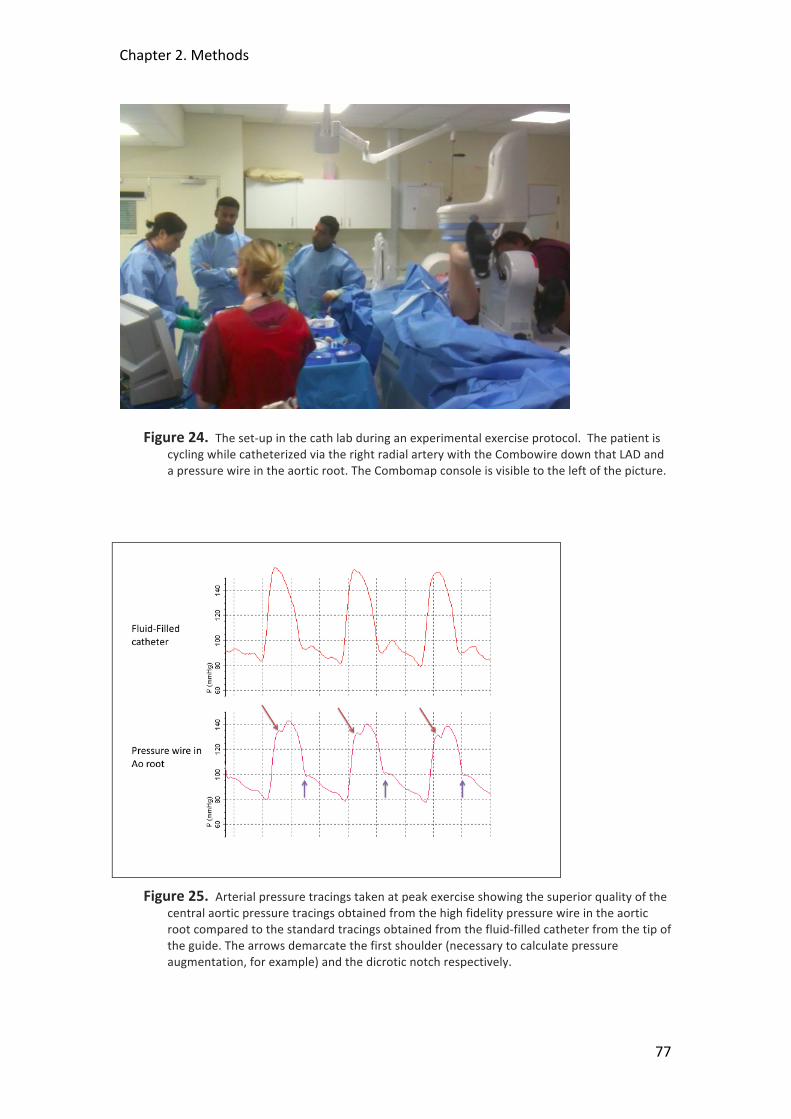
Chapter 2. Methods
77
Figure 24. The set-‐up in the cath lab during an experimental exercise protocol. The patient is cycling while catheterized via the right radial artery with the Combowire down that LAD and a pressure wire in the aortic root. The Combomap console is visible to the left of the picture.
Figure 25. Arterial pressure tracings taken at peak exercise showing the superior quality of the central aortic pressure tracings obtained from the high fidelity pressure wire in the aortic root compared to the standard tracings obtained from the fluid-‐filled catheter from the tip of the guide. The arrows demarcate the first shoulder (necessary to calculate pressure augmentation, for example) and the dicrotic notch respectively.
Chapter 2. Methods
78
2.2.4.3 Results
5 patients (4 male, age 54±7.5 years) who fulfilled the inclusion criteria were
recruited into the study. Details of each case are given below. All successfully
completed the protocol, exercising for 6.4±0.5 minutes with an increase in heart rate
from 72.8±8.1 baseline to 120.6±8.9 (p<0.0001) peak and rate pressure product
(RPP, mmHg.min-‐1) from 95.8±17.9 x 10³ to 200.3±33.6 x10³ (p=0.001). Coronary
average peak velocity (APV) went from 18.7±6.5 to 31.4±5.8 cm.sec-‐1 (p=0.002).
There were no complications. All data were of sufficient quality for further analysis.
Full haemodynamic data are presented in Table 2.
Case 1
66 year old male with a background of hypertension and exertional angina with an
equivocal ETT. Angiogram showed a moderate lesion in the LAD with a 50% diameter
stenosis and mild atheromatous disease in the other vessels. The patient underwent
the full protocol with the Combowire in the LAD. He exercised for 6.5 minutes and
stopped as target heart rate was achieved. He had no chest pain or ECG changes.
Case 2
51 year old male with a background of smoking and dyslipidaemia and exertional
angina with a dobutamine stress echo suggesting a small area of apical ischaemia.
Angiogram showed diffuse disease in the mid-‐LAD with a severe stenosis at the
ostium of a small diagonal. The patient underwent the full protocol with the
Combowire down the LAD. He exercised for 7 minutes and stopped because of chest
pain and some ST depression. There was no pressure gradient along the LAD but a
relatively modest flow reserve suggested some potential microvascular dysfunction.
Case 3
55 year old male with a background of hypertension and exertional chest pain and a
positive ETT. Angiogram showed a moderate lesion in the RCA. The patient
underwent the full protocol with the Combowire in the RCA. He exercised for 6.9
minutes and stopped because he reached his target heart rate. There were some
minor ECG changes but no he did not suffer chest pain. Again, a modest flow reserve
suggests microvascular dysfunction.
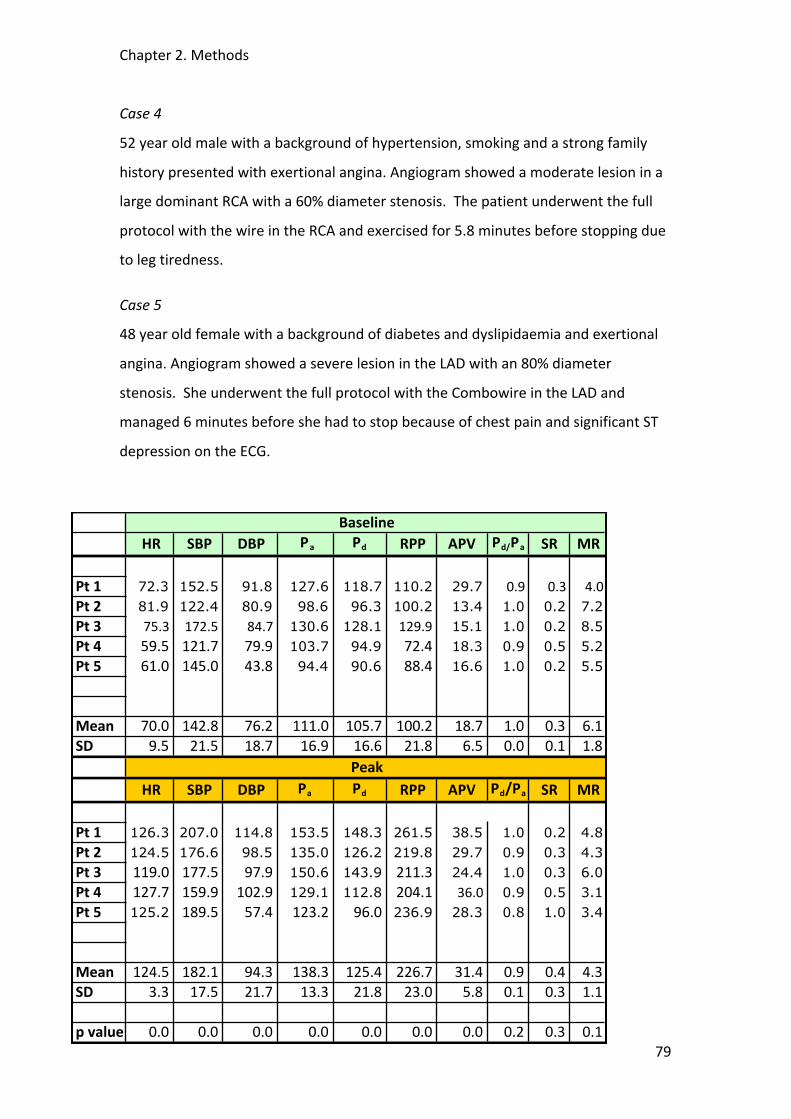
Chapter 2. Methods
79
Case 4
52 year old male with a background of hypertension, smoking and a strong family
history presented with exertional angina. Angiogram showed a moderate lesion in a
large dominant RCA with a 60% diameter stenosis. The patient underwent the full
protocol with the wire in the RCA and exercised for 5.8 minutes before stopping due
to leg tiredness.
Case 5
48 year old female with a background of diabetes and dyslipidaemia and exertional
angina. Angiogram showed a severe lesion in the LAD with an 80% diameter
stenosis. She underwent the full protocol with the Combowire in the LAD and
managed 6 minutes before she had to stop because of chest pain and significant ST
depression on the ECG.
!HR !SBP !DBP !Pa Pd !RPP APV Pd/Pa SR MR
Pt!1 72.3 152.5 91.8 127.6 118.7 110.2 29.7 0.9 0.3 4.0Pt!2 81.9 122.4 80.9 98.6 96.3 100.2 13.4 1.0 0.2 7.2Pt!3 75.3 172.5 84.7 130.6 128.1 129.9 15.1 1.0 0.2 8.5Pt!4 59.5 121.7 79.9 103.7 94.9 72.4 18.3 0.9 0.5 5.2Pt!5 61.0 145.0 43.8 94.4 90.6 88.4 16.6 1.0 0.2 5.5
Mean 70.0 142.8 76.2 111.0 105.7 100.2 18.7 1.0 0.3 6.1SD 9.5 21.5 18.7 16.9 16.6 21.8 6.5 0.0 0.1 1.8
!HR !SBP !DBP Pa Pd !RPP APV Pd/Pa SR MR
Pt!1 126.3 207.0 114.8 153.5 148.3 261.5 38.5 1.0 0.2 4.8Pt!2 124.5 176.6 98.5 135.0 126.2 219.8 29.7 0.9 0.3 4.3Pt!3 119.0 177.5 97.9 150.6 143.9 211.3 24.4 1.0 0.3 6.0Pt!4 127.7 159.9 102.9 129.1 112.8 204.1 36.0 0.9 0.5 3.1Pt!5 125.2 189.5 57.4 123.2 96.0 236.9 28.3 0.8 1.0 3.4
Mean 124.5 182.1 94.3 138.3 125.4 226.7 31.4 0.9 0.4 4.3SD 3.3 17.5 21.7 13.3 21.8 23.0 5.8 0.1 0.3 1.1
p!value* 0.0 0.0 0.0 0.0 0.0 0.0 0.0 0.2 0.3 0.1
Baseline
Peak
Chapter 2. Methods
80
Table 2. Haemodynamic data from the 5 study patients recorded at baseline and peak exercise. HR = heart rate, beats per minute; SBP = central systolic blood pressure, mmHg; DBP =central diastolic blood pressure, mmHg; Pa = mean central arterial pressure, mmHg; Pd= distal coronary pressure, mmHg; RPP = rate pressure product (=HR x SBP), mmHg.min-‐1; APV= average peak velocity (distal coronary), cm.sec-‐1; SR =stenosis resistance (ΔP/APV); MR=microvascular resistance (Pd/APV). *paired student’s T-‐test.
2.2.4.4 Discussion of technique and modifications
This study demonstrates that exercise stress can be used in the catheter laboratory
to obtain useful and good quality invasive physiological data. The protocol is
complex but became more practicable with each case. The 5th case (6 minutes
exertion) added about 30 minutes to the usual procedure duration. There were no
complications during this early feasibility study and all patients, given sufficient
preparation and encouragement, managed to complete the protocol with a good
increment in workload as suggested by RPP. Although all the patients recruited had
exertional angina and background risk factors for IHD, only case 5 had
angiographically and functionally significant disease with an apparent pressure drop
across the stenosis that became significant with exercise. Interestingly, the addition
of i.c. adenosine at the end of the case to confirm the functional severity of the
lesion demonstrated an FFR of 0.51*, much lower than the Pd/Pa ratio of 0.78
obtained at peak exercise. This suggests that even during conditions of ischaemia
there was still some vasodilatory reserve within the perfusion territory of this vessel;
perhaps mediated by the vasoconstrictor effects of adreno-‐receptor stimulation
during exercise. Such effects have been demonstrated in animal studies78. While
cases 2 and 3 did not have severe epicardial disease an attenuated flow reserve
suggested some microvascular dysfunction which may have been contributing to
their symptoms.
Each iteration in the development of the protocol merited careful consideration with
paramount concern for the safety of the study participants. There was some anxiety
about the potential traumatic effect of the guide tip on the coronary ostium during
* By definition FFR can only be determined under confirmed conditions of maximal hyperaemia or minimal microvascular resistance, such as during administration of adenosine.
Chapter 2. Methods
81
exercise. This was mitigated by disengaging the guide and leaving the tip well away
from the coronary ostium throughout exercise. In addition, the use of the second
wire in the aortic root helped prevent the guide from accidently re-‐engaging with
the coronary ostium. By using a pressure wire for this purpose it allowed high-‐fidelity
pressure tracings far superior to those that would have been obtained from a fluid-‐
filled catheter alone (see Figure 25). The quality of the signal from the pressure wire
was sufficient for pulse wave analysis to determine systolic augmentation, wave
reflection, diastolic time fraction and other variables that would not be possible
using the highly filtered trace from the fluid filled catheter.
2.2.4.5 Conclusion
It is feasible to obtain good quality, invasive intracoronary and central aortic
physiological data during strenuous exercise stress in patients undergoing cardiac
catheterization. The protocol develop during these preliminary studies was used in
the main study and the results can be found in Chapter 5.

Chapter 2. Methods
82
2.3 Cardiac Magnetic Resonance Imaging Methods
2.3.1 Determining Infarct Size and Microvascular Obstruction
Cardiac magnetic resonance (CMR) has emerged as a powerful tool in the
assessment of ventricular function, perfusion and viability in AMI. Many studies
using CMR have tracked the complex changes that occur in ventricular structure and
function post AMI in both animal models and humans267. Its high spatial resolution
and reproducibility make it an excellent tool for assessing ventricular function over
time268 and allow discernable differences between groups with small study
populations269. The first-‐pass administration of gadolinium-‐DTPA (Gd-‐DTPA),
myocardial perfusion can be assessed both at rest and with stress. Hypo-‐enhanced
areas in the first few minutes after the gadolinium injection correlate very closely
with regions of microvascular obstruction documented by radioactive microspheres
and histological staining of post mortem specimens with thioflavin205. Delayed
hyper-‐enhancement (10-‐20 min) after gadolinium injection enables precise
localisation of myocardial infarction (acutely) and scar (chronically) over the full
range of infarct size204. See The pathophysiology of infarct healing and LV
remodeling has been studied in a canine model of AMI using Gd-‐DTPA enhanced
CMR270. Infarct healing seemed to be an ongoing process, with early infarct
expansion followed by infarct resorption, scar formation, and late wall thinning.
Necrotic myocytes, interstitial oedema, hemorrhage, and inflammatory cells are
resorbed and replaced by collagenous scar tissue. During the phase of initial infarct
expansion it has been shown that flow within the infarct region is non-‐uniform with
MVO continuing to progress for up to 48 hours following reperfusion131. Gadolinium
enhancement has been used to track the changes in infarct morphology over time in
humans. Following reperfusion of AMI there was about a 30% reduction in infarct
volume at 5 months with some recovery of function271. Segments containing little
MVO showed good recovery, with improved wall thickening and function. Segments
containing MVO became thinned and scarred at 5 months and showed minimal
recovery. Such microvascular perfusion defects are widespread and can be
demonstrated in a large proportion of AMI patients despite excellent angiographic
Chapter 2. Methods
83
results after primary PCI272. The presence of severely delayed microvascular
reperfusion is predictive of impaired LV systolic function independently of the
transmurality of infarction and is a strong predictor of adverse cardiovascular
complications even after control for infarct size273. CMR has been shown to be safe
in patients within 24 hours of stent placement in patients undergoing primary
angioplasty for AMI272.
In the present thesis CMR was used to determine infarct size, as well as the burden
of MVO at baseline and at 3 months in the postconditioning study (see Chapter 3).
Its low variability and excellent reproducibility reduce the sample size to detect
differences in such studies268, 269 and make it the ideal choice for comparing these
endpoints both across subjects initially and within subjects at follow-‐up. Standard
infarct and MVO detection sequences were used. For further specific details
regarding these, as well as the quantification methods used, see Chapter 3.
2.3.2 Dynamic Contrast Enhanced Perfusion Methods
MR first pass perfusion imaging has become a valuable clinical tool for the
assessment of myocardial perfusion274. The development of high spatial resolution
perfusion techniques holds great potential to examine the changes in endo-‐ and
epicardial blood flow during exercise. We intended to develop a protocol to
investigate this using a specially adapted cycle ergometer. First we had to validate
the high-‐resolution k-‐t perfusion sequence at 3T, initially in healthy volunteers, and,
then in patients with ischaemic heart disease (see Chapter 4). We then sought to
examine whether the perfusion and quantification methods used could identify the
physiological changes in endo-‐epicardial perfusion ratios that would be expected to
occur during adenosine hyperaemia (see Chapter 6). Unlike with standard adenosine
perfusion methods where typically only two contrast injections are used (i.e. at rest
and during hyperaemic stress), during the proposed exercise protocols at least three
contrast injections would be used (i.e. rest, exercise 1 and then exercise 2 after a
period of rest to look for any warm-‐up effect).
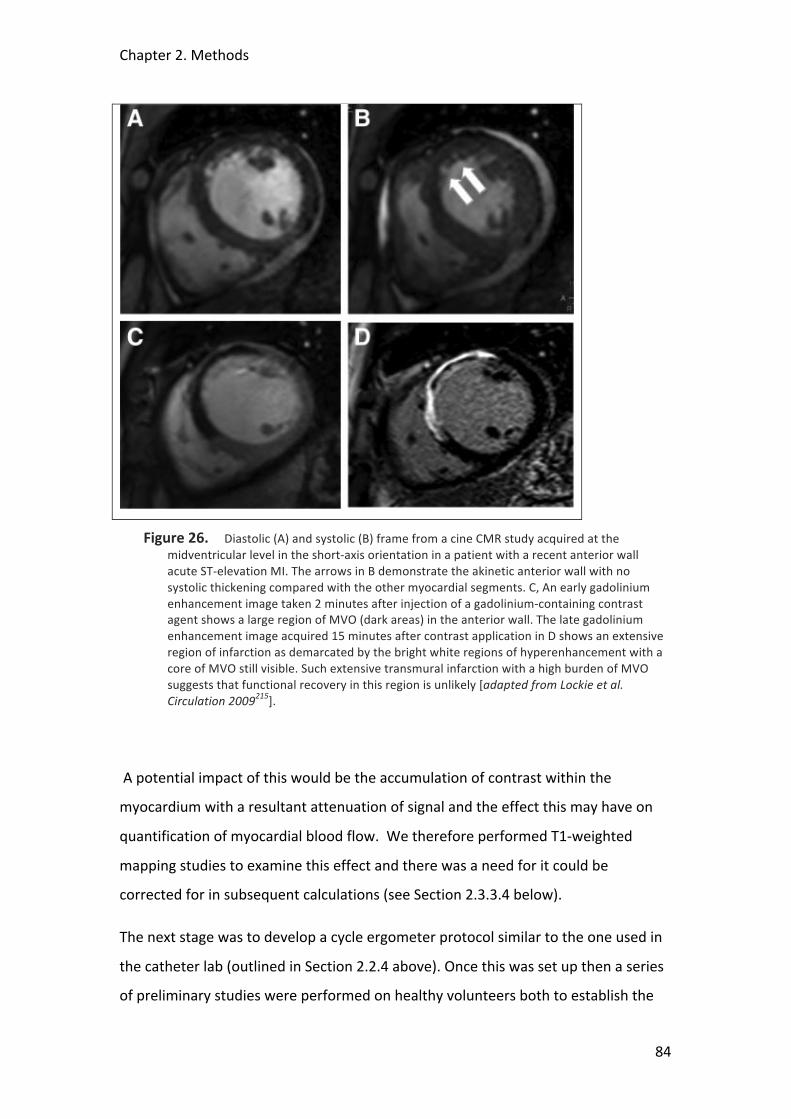
Chapter 2. Methods
84
Figure 26. Diastolic (A) and systolic (B) frame from a cine CMR study acquired at the midventricular level in the short-‐axis orientation in a patient with a recent anterior wall acute ST-‐elevation MI. The arrows in B demonstrate the akinetic anterior wall with no systolic thickening compared with the other myocardial segments. C, An early gadolinium enhancement image taken 2 minutes after injection of a gadolinium-‐containing contrast agent shows a large region of MVO (dark areas) in the anterior wall. The late gadolinium enhancement image acquired 15 minutes after contrast application in D shows an extensive region of infarction as demarcated by the bright white regions of hyperenhancement with a core of MVO still visible. Such extensive transmural infarction with a high burden of MVO suggests that functional recovery in this region is unlikely [adapted from Lockie et al. Circulation 2009215].
A potential impact of this would be the accumulation of contrast within the
myocardium with a resultant attenuation of signal and the effect this may have on
quantification of myocardial blood flow. We therefore performed T1-‐weighted
mapping studies to examine this effect and there was a need for it could be
corrected for in subsequent calculations (see Section 2.3.3.4 below).
The next stage was to develop a cycle ergometer protocol similar to the one used in
the catheter lab (outlined in Section 2.2.4 above). Once this was set up then a series
of preliminary studies were performed on healthy volunteers both to establish the
Chapter 2. Methods
85
optimum perfusion sequence, and then ensure that the data produced was of
sufficient quality that it could be analysed, both to examine overall changes in
myocardial blood flow, but also, and crucially, differences in flow to the endo-‐ and
epicardium. The results of these studies are presented in Chapter 6.
2.3.2.1 Principles of Dynamic CMR Perfusion
Dynamic CMR typically exploits the first-‐pass kinetics of conventional T1-‐enhancing
extracellular gadolinium chelates. The magnetic resonance contrast medium,
typically Gadolinium-‐DTPA (Gd-‐DTPA) enters the microvasculature and also starts to
diffuse within the interstitial space during the first pass274-‐277. As a result, the signal
intensity of the myocardium increases, the rate of which is linked to the perfusion
status of the tissue. Accordingly, normally perfused myocardium demonstrates a fast
signal increase per unit time in the vasodilated state, whereas signal increase is
delayed in myocardium supplied by, for example, a flow-‐limiting coronary stenosis.
The first pass lasts only a few seconds and therefore in such dynamic studies it is
crucial to acquire good quality data during this period to allow subsequent analysis
(see below). Respiratory and cardiac motion are the two main potential sources of
artefact. The data acquisition can be completed within a breath-‐hold, which
efficiently eliminates respiratory motion; in addition, the MR data collection is
electrocardiography (ECG)–triggered, which eliminates cardiac motion. Together,
breath holding and ECG-‐triggering allow a high spatial resolution for perfusion data
of around 1.5 to 2.5 mm x 1.5 to 2.5 mm. This excellent spatial resolution allows for
discrimination of perfusion deficits that are limited to the vulnerable subendocardial
layer of the left ventricular myocardium191, 278.
To increase the sensitivity of the pulse sequence to detect changes in the contrast as
it diffuses through the myocardium, the magnetisation may be prepared before data
readout occurs. In the past an inversion recovery preparation was most often used,
providing a large dynamic range of signal response. However, in practice the delay
time from preparation to readout required 300 to 400 milliseconds of waiting time,
thus precluding true multislice imaging. Therefore the currently accepted
preparation is a saturation recovery approach, which renders the signal response
Chapter 2. Methods
86
independent of heart rate variations and further shortens the waiting time down to
100 to 200 milliseconds191, 201, 279. Selection of the optimum delay time should not
only optimise signal response for the expected changes in the contrast bolus
concentration during the first pass but also locate the window for data readout into
phases of the cardiac cycle where motion is minimal. Data acquisition in late systole
is ideal as during this phase the myocardium is at it’s thickest and facilitates
subsequent perfusion analysis.
Data Post-‐Processing Strategies
It is important to ensure maximum coverage of the LV myocardium in order to
detect and quantify perfusion defects accurately. In addition, to obtain signal
intensity–time curves from which perfusion parameters (see below) can be derived,
a temporal resolution of 1 stack covering the left ventricular myocardium being
acquired every 1 to 2 RR intervals is recommended279, 280. To satisfy these conditions
very fast data acquisition for perfusion imaging is crucial. Echoplanar imaging (EPI),
which describes the acquisition of a full k-‐space (required to reconstruct 1 single
image) after a single radiofrequency excitation is one such fast approach. In contrast,
with a conventional fast gradient echo approach, 1 radiofrequency excitation is
required for every line in k-‐space. Single shot EPI is very fast, but its relatively long
echo time renders the sequence prone to susceptibility artifacts281. Therefore a
hybrid-‐EPI approach appears to be ideal, in which 4 to 8 k-‐lines per radiofrequency
excitation are acquired279, 282. Steady-‐state free precession pulse (SSFP) sequences
preserve magnetization and are particularly promising with respect to a high signal-‐
to-‐noise ratio (SNR) but may suffer from other disadvantages because of the
relatively long acquisition windows280. Alternatively, parallel imaging techniques,
such as SENSE (SENSitivity Encoding) can be combined with perfusion imaging283.
These are based on the fact that receiver sensitivity generally has an encoding effect
complementary to Fourier preparation by linear field gradients. Thus, by using
multiple receiver coils in parallel, scan time in Fourier imaging can be considerably
reduced. These techniques acquire data from folded fields of view and resolve
wraparound artifacts by taking into account the different spatial sensitivities of
various coil elements284. In general, parallel imaging techniques trade the SNR for
Chapter 2. Methods
87
speed of acquisition. These parallel imaging approaches can be combined with
techniques that exploit spatiotemporal correlations in k-‐t–space, which results in
even higher acceleration factors. Techniques such as k-‐t SENSE (discussed in previous
chapter) and k-‐t BLAST (Broad-‐use Linear Acquisition Speed-‐up Technique) achieve
high acceleration factors but with higher susceptibility to motion and could smooth
temporal information220. The suitability of these different perfusion post-‐processing
strategies for use in the studies contained in this thesis is discussed below.
2.3.2.2 CMR Perfusion Quantification Methods
Qualitative and Semi-‐quantitative Perfusion Analysis
The simplest method for interpreting CMR perfusion is to view the study in cine-‐loop
format for regions of relative hypoperfusion. Such a qualitative approach yields high
diagnostic accuracy when compared with invasive angiography214 and is the method
most widely used in everyday clinical practice to interpret CMR perfusion scans.
Semi-‐quantitative analysis of a CMR perfusion scan involves firstly mapping the
endo-‐ and epicardial borders of a myocardial slice at rest and then at stress to form a
sampling grid (see Figure 27 below); from this the mean signal intensity within a
region of interest over time, or “signal intensity (SI) curve” is extracted (see Figure 28
below). From these curves the maximum upslope or initial area under the SI curve
have been used as indexes of regional flow285 and correlate well with flow
measurements based on microsphere analysis286, 287. Semi-‐quantitative analysis has
been shown to improve diagnostic accuracy over visual analysis alone198, 288. The
MR-‐IMPACT multi-‐centre study indicates the prognostic significance of CMR
perfusion with a higher incidence of cardiac death or nonfatal myocardial infarction
in patients with an abnormal scan than those with a normal scan289.
Although qualitative and semi-‐quantitative methods either used separately or
together are useful clinical tools to detect relative areas of hypoperfusion it was felt
that for the more detailed analysis required for the studies in this thesis we should
pursue full quantification of myocardial blood flow. Having said that, given its
widespread use in everyday clinical practice we did use qualitative assessment of the
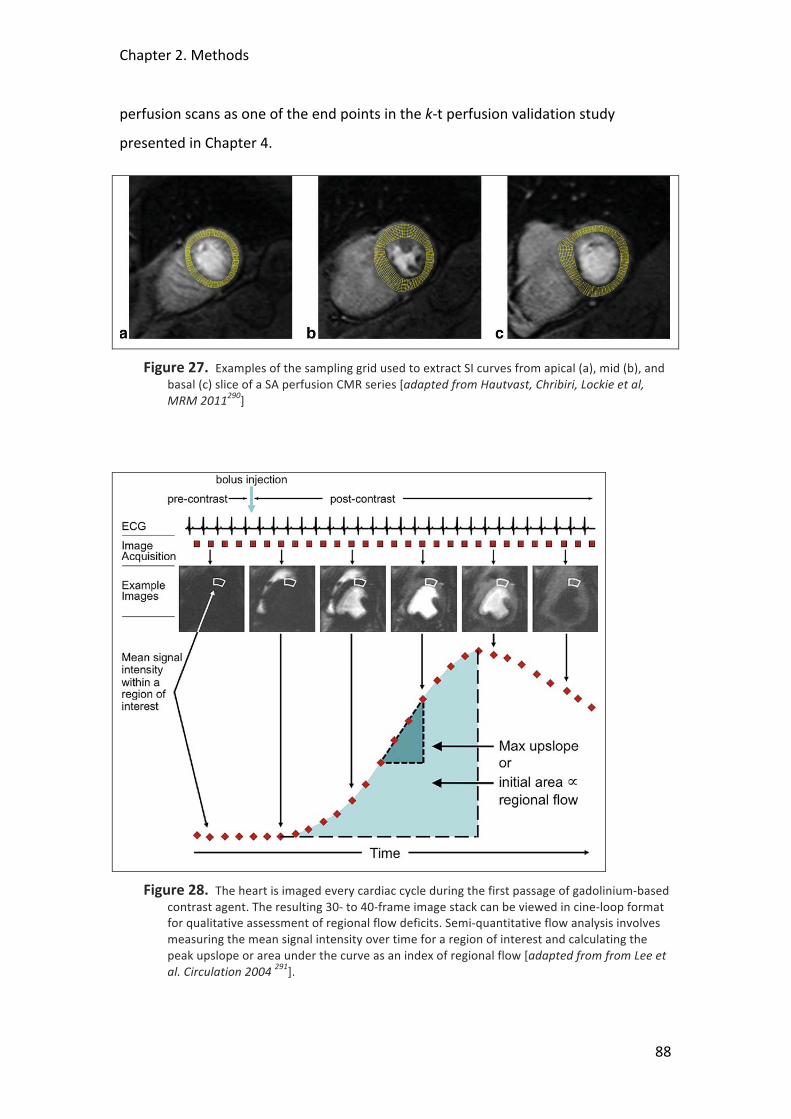
Chapter 2. Methods
88
perfusion scans as one of the end points in the k-‐t perfusion validation study
presented in Chapter 4.
Figure 27. Examples of the sampling grid used to extract SI curves from apical (a), mid (b), and basal (c) slice of a SA perfusion CMR series [adapted from Hautvast, Chribiri, Lockie et al, MRM 2011290]
Figure 28. The heart is imaged every cardiac cycle during the first passage of gadolinium-‐based contrast agent. The resulting 30-‐ to 40-‐frame image stack can be viewed in cine-‐loop format for qualitative assessment of regional flow deficits. Semi-‐quantitative flow analysis involves measuring the mean signal intensity over time for a region of interest and calculating the peak upslope or area under the curve as an index of regional flow [adapted from from Lee et al. Circulation 2004 291].

Chapter 2. Methods
89
Absolute Perfusion Quantification
In contrast to qualitative, which rely on the comparison of regions of relative
hypoperfusion with regions of “normal” myocardium, and semi-‐quantitative
methods, which allow the calculation of a myocardial perfusion reserve, it is also
possible to quantify absolute myocardial blood flow. These are similar in derivation
to those employed in quantitative PET and computed tomography perfusion as well
as thermodilution estimation of cardiac output. Flow models use the myocardial and
left ventricular (LV) blood pool SICs to estimate absolute myocardial blood flow. Two
major classes of models exist: linear, shift-‐invariant (LSI) models and compartment
models. Each class of model has its own assumptions that must hold or at least
approximately hold for the model to produce meaningful and valid estimations of
flow. We tested both of these models to see which was the most suitable for use in
the further studies in this thesis.
The LSI models are generally more widespread in the calculation of absolute flow
values than compartment models. The LSI models assume the cardiac circulatory
system is linear and temporally invariant in its response. In other words, if two
contrast boluses are injected, then the myocardial uptake is the linear sum of the
uptake had each bolus been injected separately; and if the injection of a bolus is
delayed by a certain amount of time, then its uptake is delayed (shifted) by the same
amount of time. These two assumptions allow for a powerful and complete
description of the system by its so-‐called “transfer function.” Characteristics of the
transfer function reflect properties of its system, the most relevant of which is
absolute myocardial blood flow. The output from an LSI system (the myocardial SI
curve) is equal to the input to the system (the tracer bolus, measured from the LV SI
curve) merged with the transfer function by a mathematical process known as
convolution (see Figure 29 below). Convolution folds two curves together via a shift-‐
scale-‐and-‐add process similar to cross-‐correlation in statistics. To obtain the transfer
function, the input and output curves must undergo the reverse process of
deconvolution. Unfortunately the process of deconvolution is very sensitive to noise,
so that small errors in the input data can lead to large differences in the resulting
transfer function. Therefore, additional constraints need to be imposed to obtain a
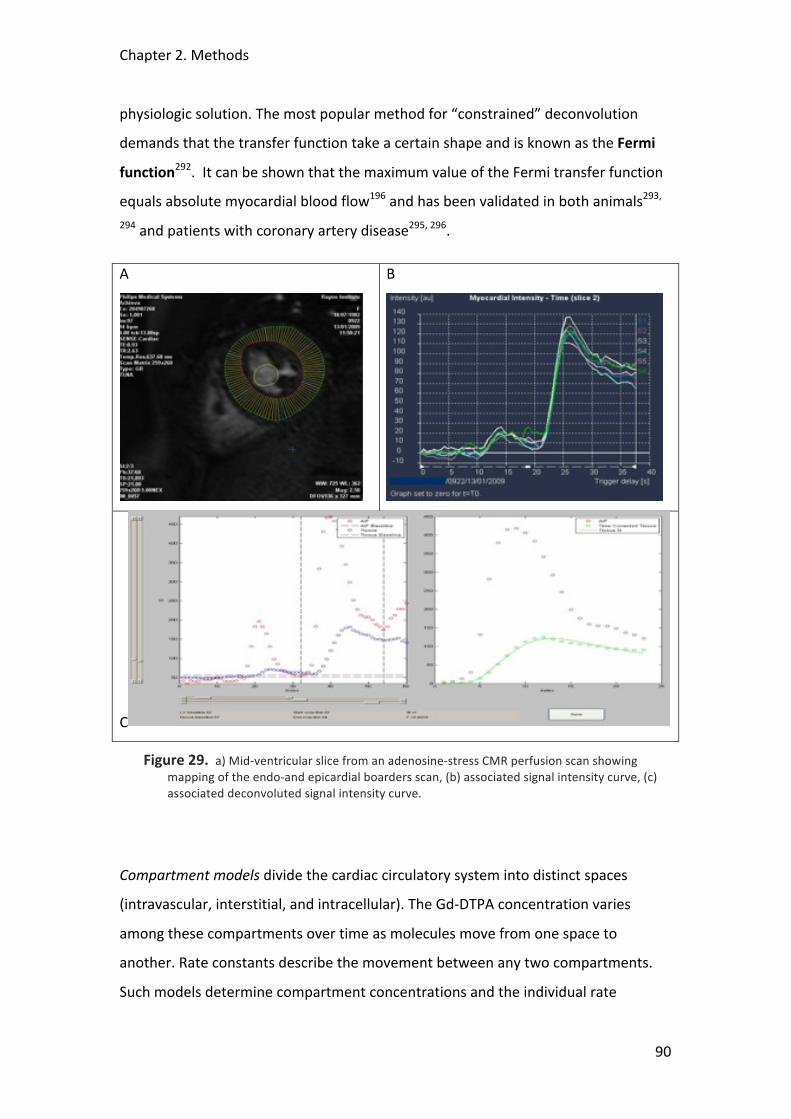
Chapter 2. Methods
90
physiologic solution. The most popular method for “constrained” deconvolution
demands that the transfer function take a certain shape and is known as the Fermi
function292. It can be shown that the maximum value of the Fermi transfer function
equals absolute myocardial blood flow196 and has been validated in both animals293,
294 and patients with coronary artery disease295, 296.
A
B
C
Figure 29. a) Mid-‐ventricular slice from an adenosine-‐stress CMR perfusion scan showing mapping of the endo-‐and epicardial boarders scan, (b) associated signal intensity curve, (c) associated deconvoluted signal intensity curve.
Compartment models divide the cardiac circulatory system into distinct spaces
(intravascular, interstitial, and intracellular). The Gd-‐DTPA concentration varies
among these compartments over time as molecules move from one space to
another. Rate constants describe the movement between any two compartments.
Such models determine compartment concentrations and the individual rate
Chapter 2. Methods
91
constants from the summed SI curve of all compartments297. Clinically approved Gd-‐
DTPA -‐containing contrast agents leak from the intravascular compartment into the
interstitial compartment along an osmotic gradient but do not enter the intracellular
compartment. Thus, a 2-‐compartment model (intravascular and interstitial) has been
used to model its transit through the cardiac circulatory system294. There are two
parameters to the 2-‐compartment model’s transfer function. Unlike the LSI model,
for which the maximum amplitude of its transfer function is equal to absolute
myocardial blood flow, the maximum amplitude of the 2-‐compartment model
transfer function is equal to the product of absolute flow and the myocardial
extraction efficiency of the contrast agent. Their product is conventionally referred
to as “k1” (the first-‐order rate constant). If the extraction efficiency is known or can
be estimated, then blood flow can be determined. However, this adds an extra
assumption to the model for quantifying perfusion. Thus, an advantage of the LSI
model is that blood flow can be calculated explicitly, provided the transfer function
can account for the extravascular leakage of contrast. The 2-‐compartment model
also depends on linearity of signal response, so the previous comments about
ensuring linearity in the blood pool and myocardium apply as well.
In Europe, the most common method for full quantification of myocardial blood flow
is using the Fermi deconvolution and this was chosen as the main quantification tool
for our studies. For the results of the repeatability and reproducibility data in
volunteers as well as the full data from the validation against the invasively
measured FFR see Chapter 4. The results of the Fermi derived absolute blood flow in
exercise volunteers can be found I Chapter 6. In addition to the Fermi deconvolution
technique, we also had the advantage of the expertise of Dr. Masaki Ishida, a visiting
fellow from Japan, who has experience of using the Patlak plot model of
quantification of absolute myocardial blood flow298. The Patlak plot method is based
on a two-‐compartment model and describes the k1 of one-‐way transfer of contrast
material from the LV blood to the myocardium. Patlak plot analysis is performed
using a blood SI curve as an input function and a regional myocardial SI curve as an
output function297, 299. Myocardial blood flow can then be calculated as k1 divided by
the extraction fraction of Gd-‐DTPA, using extraction fraction values from the
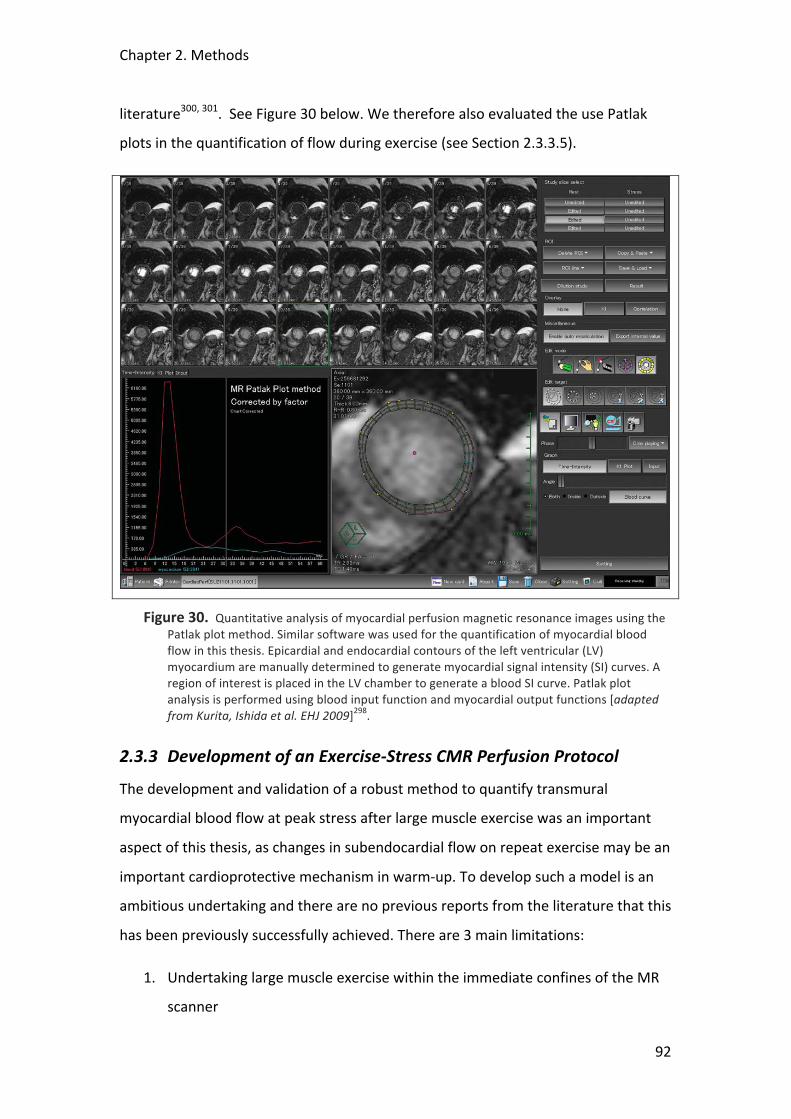
Chapter 2. Methods
92
literature300, 301. See Figure 30 below. We therefore also evaluated the use Patlak
plots in the quantification of flow during exercise (see Section 2.3.3.5).
Figure 30. Quantitative analysis of myocardial perfusion magnetic resonance images using the Patlak plot method. Similar software was used for the quantification of myocardial blood flow in this thesis. Epicardial and endocardial contours of the left ventricular (LV) myocardium are manually determined to generate myocardial signal intensity (SI) curves. A region of interest is placed in the LV chamber to generate a blood SI curve. Patlak plot analysis is performed using blood input function and myocardial output functions [adapted from Kurita, Ishida et al. EHJ 2009]298.
2.3.3 Development of an Exercise-‐Stress CMR Perfusion Protocol
The development and validation of a robust method to quantify transmural
myocardial blood flow at peak stress after large muscle exercise was an important
aspect of this thesis, as changes in subendocardial flow on repeat exercise may be an
important cardioprotective mechanism in warm-‐up. To develop such a model is an
ambitious undertaking and there are no previous reports from the literature that this
has been previously successfully achieved. There are 3 main limitations:
1. Undertaking large muscle exercise within the immediate confines of the MR
scanner
Chapter 2. Methods
93
2. Obtaining good quality perfusion data at high heart rates
3. Overcoming the potential obstacles of breathing and other movement
artefact
We also needed to determine the effect of repeated Gd-‐DTPA doses on background
myocardial saturation levels might have on subsequent quantification, and whether
or not this would need to be corrected for.
2.3.3.1 Development of the CMR-‐Compatible Cycle Ergometer
The reasons why it is preferable to use large-‐muscle exercise stress, as opposed to
other pharmacological methods are discussed in Section 2.2.4.1 above. There are
various ways to induce exercise stress in the MR scanner environment. Handgrip
exercise is straightforward and can provoke modest increases in heart rate and
cardiac output although the limitations of this and other forms of small-‐muscle
exercise are also discussed above. Studies have been undertaken with MR
compatible cycles, or ergometers, although these tend to focus either on aortic and
lower limb blood flow302, 303 or SVC and pulmonary blood flow304. In all of these
cases, either the cycle has either been distant to the MR scanner, so at peak exercise
the subject must get off the bike and walk across to the scanner, or the patient is
lying in the scanner but with the bike adapted to undertake a pumping leg exercise,
rather than the usual circular motion with the pedals. Neither of these is ideal. In
the first instance, walking across to the scanner would not be feasible in patients
with chest pain and other symptoms, or who may be older and less mobile. This may
add a considerable delay in getting the scan underway during which time the heart
rate and cardiac output rapidly fall away from peak89. Keeping the subject in the
scanner to minimise such delays and using the alternative lower-‐limb exercise is also
not optimal as subjects struggle to reach their peak target heart rates with such an
unfamiliar task305. Semi-‐quantitative perfusion analysis was obtained in a group of
healthy volunteers using an MR compatible treadmill that was within the MR
scanner room, but again involved the subject having to walk across to the scanner
after exercising to peak stress306. In this study, scanning was commenced after a
mean of 45 seconds from peak exercise which is impressive although these were a
Chapter 2. Methods
94
young and mobile group of volunteers, and even then there were problems with
regaining the correct position on the scanner (very important as the reference
images for the perfusion sequence rely on this), and problems with re-‐attaching i.v
lines and the radiofrequency coil and other leads in a hurry. This group did use a
vacuum mattress (Vac Lok™, CIVCO® Medical Solutions, USA) to help maintain the
correct position on the scanner table, and after contacting them we ordered a
similar one to use in our protocol. This turned out to be extremely useful.
After trying various alternatives, we elected to use an MR-‐compatible cycle
ergometer (Lode® Medical Systems, UK) that we specially adapted to use with the 3T
scanner in the Rayne Institute at St Thomas’ campus, KCL. To minimise delays
between scanning, and also to ensure that position on the scanner table was
maintained and the patients would not have to move between the bike and the
scanner, we decided to exercise the patients just outside the scanner, but remaining
on the table, with i.v lines, ECG leads and the RF coil etc. all in position. At peak
exercise we would then rapidly slide the subject back into the scanner. After several
further adaptations we came up with the final design and successfully tried it on our
first healthy volunteer (see Figure 31 below). Heart rate and blood pressure were
monitored throughout via cables that reached into the control room. The use of the
vacuum cushion together with straps for the subject to hold onto minimised the
tendency for cranial migration that we found occurred during the cycling, especially
as the effort increased. A supervisor remained in the scanner room at all times both
during the period of exercise and the subsequent scan. Consistent with other
studies (and in particular in our initial volunteers who were young and fit), we
observed that heart rate would fall rapidly after cessation of exercise; by the time
scanning started, even if it was less than 1 minute from the end of the exercise,
there was a substantial reduction in heart rate compared to peak. We found that
continuing to squeeze a soft ball, during the duration of the scan was a good way to
maintain the heart rate and slow the rate of decline.
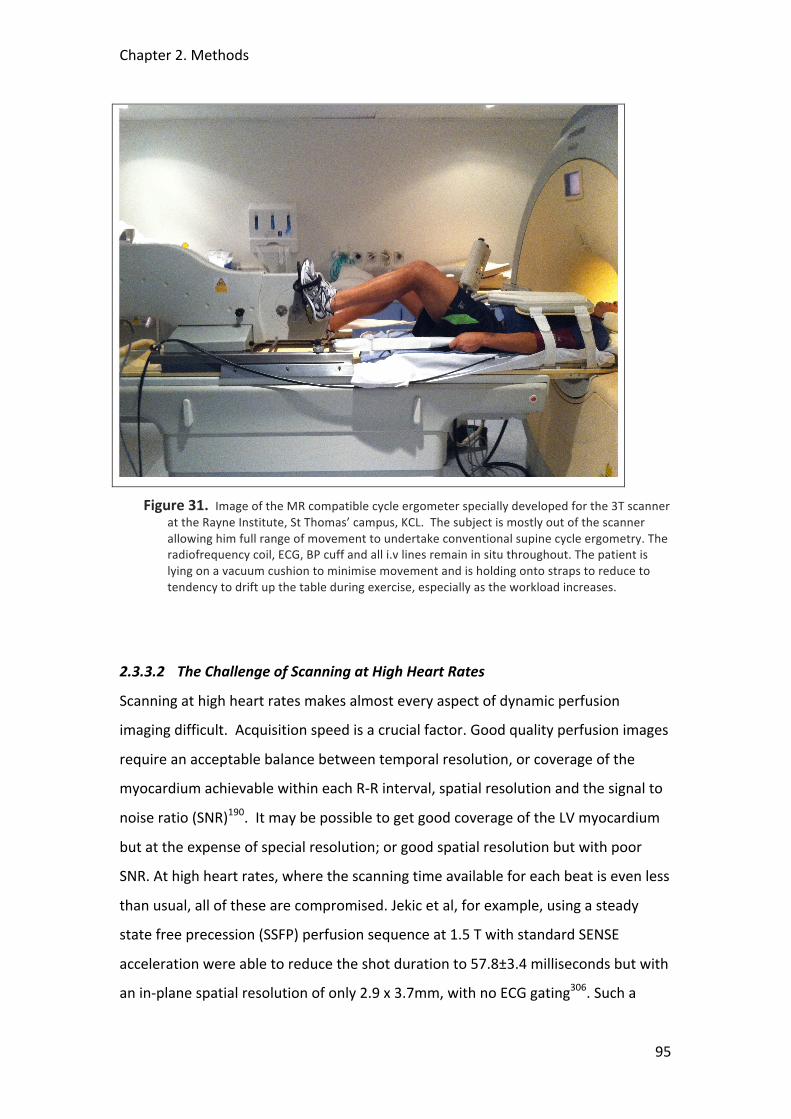
Chapter 2. Methods
95
Figure 31. Image of the MR compatible cycle ergometer specially developed for the 3T scanner at the Rayne Institute, St Thomas’ campus, KCL. The subject is mostly out of the scanner allowing him full range of movement to undertake conventional supine cycle ergometry. The radiofrequency coil, ECG, BP cuff and all i.v lines remain in situ throughout. The patient is lying on a vacuum cushion to minimise movement and is holding onto straps to reduce to tendency to drift up the table during exercise, especially as the workload increases.
2.3.3.2 The Challenge of Scanning at High Heart Rates
Scanning at high heart rates makes almost every aspect of dynamic perfusion
imaging difficult. Acquisition speed is a crucial factor. Good quality perfusion images
require an acceptable balance between temporal resolution, or coverage of the
myocardium achievable within each R-‐R interval, spatial resolution and the signal to
noise ratio (SNR)190. It may be possible to get good coverage of the LV myocardium
but at the expense of special resolution; or good spatial resolution but with poor
SNR. At high heart rates, where the scanning time available for each beat is even less
than usual, all of these are compromised. Jekic et al, for example, using a steady
state free precession (SSFP) perfusion sequence at 1.5 T with standard SENSE
acceleration were able to reduce the shot duration to 57.8±3.4 milliseconds but with
an in-‐plane spatial resolution of only 2.9 x 3.7mm, with no ECG gating306. Such a
Chapter 2. Methods
96
relatively poor spatial resolution would not allow examination of transmural flow
differences that are crucial for the purposes of our proposed studies; spatial
resolution approaching 1mm was what we were aiming for. Scanning at 3T gave us
significant advantage, allowing greater SNR with the potential for faster scanning219.
It was felt that to start with we should try and use standard SSFP perfusion
sequences similar to the one above, but to try and utilize the advantages of scanning
with the 3T magnet to improve spatial resolution. There were other reasons that we
thought that standard SSFP might actually be advantageous over other more
complex sequences even though they had the potential for even faster data
acquisition (see below). However, despite using various adaptations in the initial 10
exercise volunteers including the use of WET pre-‐pulses, linear half-‐scan, TFE
perfusion sequences, alteration of the M0 flip angles, and increasing the SENSE
factor, it was not possible to obtain decent images that were suitable for further
analysis. Movement and dark rim artefacts seemed to be the major issue, and it
was key to try and reduce the shot duration, which despite all the above remained at
around 100ms. Another problem that we encountered was through the use of ECG
gating to optimise the timing of the scan to mid-‐systole where the myocardium is
the thickest, which greatly facilitates subsequent data analysis. The increased field
strength of the 3T magnet has a tendency to interfere with the ECG even under
optimum conditions and with the additional factors of high heart rates, plus the
subject moving around during the exercise this could be problematic. In one or two
studies we lost the ECG trace altogether and thus lost much of the data from the
scan. To overcome this, we also fitted a pulse finger probe (PPU) that can be used to
gate the perfusion sequence. Although not ideal (as it is hard to time systole with
this) it served as a useful backup should the ECG fail and we fitted the probe to all
our subsequent subjects.
k-‐space and time sensitivity encoding (k-‐t SENSE) has been discussed in previous
sections (XXX). It simultaneously exploits coil encoding and spatiotemporal data
correlations to allow acceleration of data acquisition, which is crucial during dynamic
MR perfusion222. This acceleration can be used to improve temporal and spatial
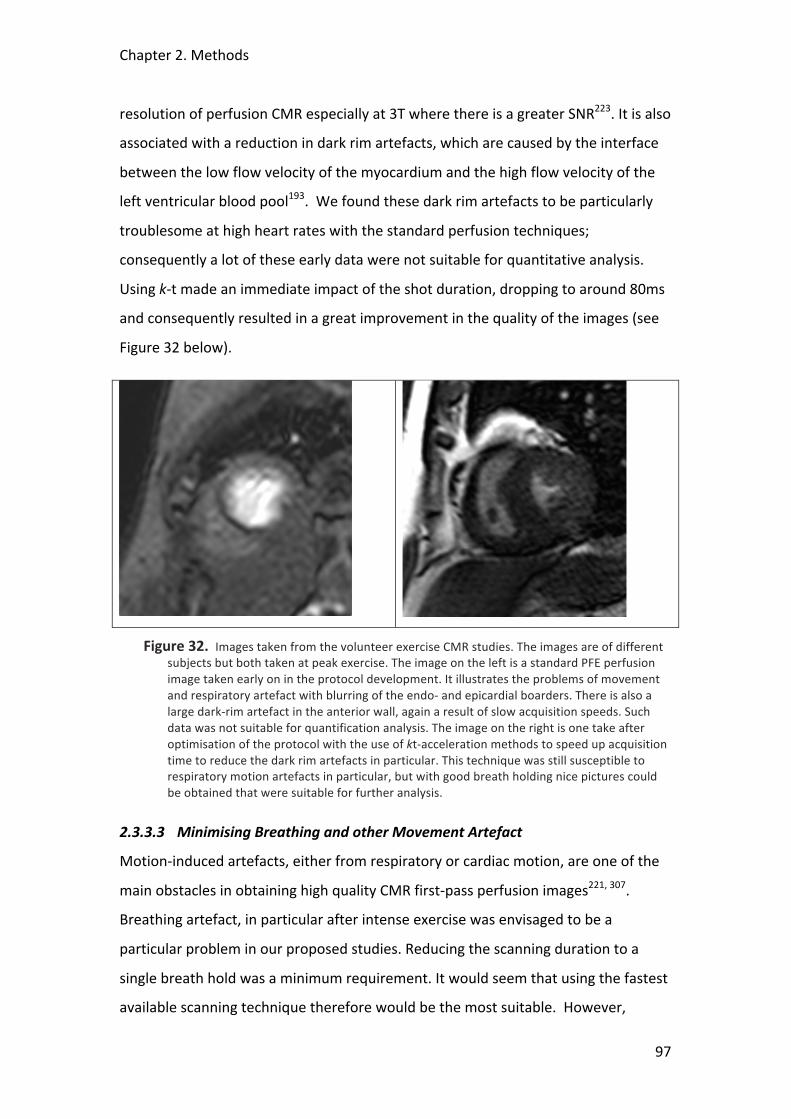
Chapter 2. Methods
97
resolution of perfusion CMR especially at 3T where there is a greater SNR223. It is also
associated with a reduction in dark rim artefacts, which are caused by the interface
between the low flow velocity of the myocardium and the high flow velocity of the
left ventricular blood pool193. We found these dark rim artefacts to be particularly
troublesome at high heart rates with the standard perfusion techniques;
consequently a lot of these early data were not suitable for quantitative analysis.
Using k-‐t made an immediate impact of the shot duration, dropping to around 80ms
and consequently resulted in a great improvement in the quality of the images (see
Figure 32 below).
Figure 32. Images taken from the volunteer exercise CMR studies. The images are of different subjects but both taken at peak exercise. The image on the left is a standard PFE perfusion image taken early on in the protocol development. It illustrates the problems of movement and respiratory artefact with blurring of the endo-‐ and epicardial boarders. There is also a large dark-‐rim artefact in the anterior wall, again a result of slow acquisition speeds. Such data was not suitable for quantification analysis. The image on the right is one take after optimisation of the protocol with the use of kt-‐acceleration methods to speed up acquisition time to reduce the dark rim artefacts in particular. This technique was still susceptible to respiratory motion artefacts in particular, but with good breath holding nice pictures could be obtained that were suitable for further analysis.
2.3.3.3 Minimising Breathing and other Movement Artefact
Motion-‐induced artefacts, either from respiratory or cardiac motion, are one of the
main obstacles in obtaining high quality CMR first-‐pass perfusion images221, 307.
Breathing artefact, in particular after intense exercise was envisaged to be a
particular problem in our proposed studies. Reducing the scanning duration to a
single breath hold was a minimum requirement. It would seem that using the fastest
available scanning technique therefore would be the most suitable. However,
Chapter 2. Methods
98
despite the advantages of faster scanning using k-‐t outlined above it also presents
some potential drawbacks; as a result of the spatiotemporal under-‐sampling it is
particularly vulnerable to breathing and other movement artefact. By relying on the
consistency of spatiotemporal correlations obtained in the training images taken
beforehand, any movement results in the substantial loss of data in the subsequent
reconstruction222. This was the rationale to try and start with standard perfusion
sequences that did not rely so crucially on the subject being able to hold their breath
throughout the scan. Unfortunately, as outlined above it was not possible to get data
of sufficient spatial resolution and quality without resorting to k-‐t. We therefore had
the pay-‐off between much better images overall, but if the subject took a breath at
any point during the scan, especially during the first pass of the Gd-‐DTPA contrast
bolus, then the images were almost un-‐useable. After several meetings and review
of the data of the first 20 volunteers scans, roughly half standard perfusion and half
k-‐t, it was felt that overall we should proceed with the k-‐t scanning protocol and
concentrate on preparing the subjects carefully and emphasizing the importance of
holding their breath during the scan; if they had to breath at all then to do so gently
towards the end of the scan, when the initial contrast bolus had already passed. This
proved successful by and large, and we were able to proceed with the initial
evaluation of quantitative analysis in the next batch of volunteers.
2.3.3.4 Myocardial T1 Mapping to Determine the Effect of Repeated Contrast
Bolus Injections during CMR Perfusion Imaging
The first stage in the development of a CMR protocol to investigate the effects of
repeat exercise on myocardial perfusion was to examine the impact of repeat
injections of Gadolinium (Gd-‐DTPA)-‐containing contrast agent. In standard rest-‐
stress perfusion scan protocols there are only two contrast injections required.
However, in our proposed protocol there would be at least three. The increased
spin-‐lattice relaxation rate 1/T1 and dynamic signal enhancement following the
intravenous injection of Gd-‐DTPA has been shown to be a linear function of local
gadolinium concentration276. However, studies in rat myocardium revealed that the
enhancement may reach a plateau, which would inhibit the deduction of reliable
kinetics from observed signal intensity-‐time curves308. The purpose of this
Chapter 2. Methods
99
preliminary study was to determine the effect of repeated injections of Gd-‐DTPA on
background myocardial saturation. If a saturation effect is found then this would
need to be accounted for in quantification of perfusion scans involving multiple
injections of Gd-‐DTPA. The myocardial T1 values were measured at multiple points in
time during the study and compared with a reference, i.e. the expected T1
extrapolated from the previously published washout kinetic tables of Gd-‐DTPA
following a single injection277.
Methods
All experiments were performed on a clinical 3T scanner (Achieva®, Philips Medical
Systems) equipped with a 32-‐element cardiac coil array. Experiments were
conducted in 10 healthy adult volunteers with no history of cardiac disease. 1-‐2
injections of a 10% dilute (Scan 0, 0.025mMol/kg) were given to optimize the
perfusion sequence timing. Three subsequent contrast injections (Scans 1-‐3,
dose=0.25 mMol/kg) were given at an approximate temporal spacing of 15 mins, and
a fourth injection (Scan 4, 0.25mMol/kg) was given immediately after the third.
Myocardial T1 was measured before the respective contrast injections using an ECG-‐
triggered “Look Locker” inversion recovery sequence. The scan parameters were as
follows: FOV=300x300mm², measured voxel size=2.5x2.16x10mm³, inversion-‐
prepared T1 weighted FFE-‐EPI, flip=10°, EPI factor=3, 9 excitations per phase, 16
phases distributed over 2 RR intervals (phase interval 100ms). One pause interval
was employed in between inversion pulses to allow for magnetization recovery. The
total scan duration was one breathhold (9 RR intervals). T1 was measured in a ROI in
the septum wall (position adjusted in each phase to cope with cardiac motion). T1
values were calculated using a plug-‐in tool comprising a 3-‐parameter exponential fit
with Look-‐Locker correction implemented in an open source DICOM viewer
(OSIRIX®). The measured T1 values were compared with the expected values
extrapolated from the previously published Gd-‐DTPA concentrations found in blood
serum after intravenous contrast injection, where a fixed blood volume fraction in
myocardium and equal relaxation times of Gd-‐DTPA in blood and myocardium were
assumed. The molar concentration of contrast agent in blood was assumed to be a
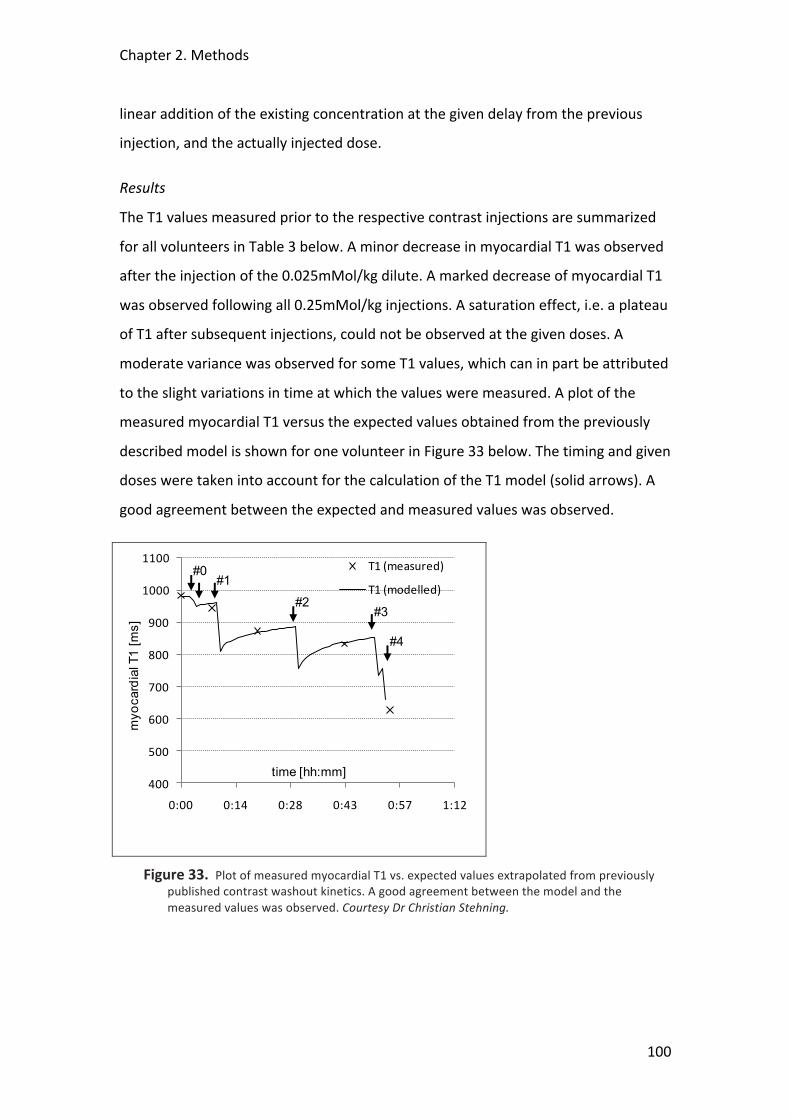
Chapter 2. Methods
100
linear addition of the existing concentration at the given delay from the previous
injection, and the actually injected dose.
Results
The T1 values measured prior to the respective contrast injections are summarized
for all volunteers in Table 3 below. A minor decrease in myocardial T1 was observed
after the injection of the 0.025mMol/kg dilute. A marked decrease of myocardial T1
was observed following all 0.25mMol/kg injections. A saturation effect, i.e. a plateau
of T1 after subsequent injections, could not be observed at the given doses. A
moderate variance was observed for some T1 values, which can in part be attributed
to the slight variations in time at which the values were measured. A plot of the
measured myocardial T1 versus the expected values obtained from the previously
described model is shown for one volunteer in Figure 33 below. The timing and given
doses were taken into account for the calculation of the T1 model (solid arrows). A
good agreement between the expected and measured values was observed.
Figure 33. Plot of measured myocardial T1 vs. expected values extrapolated from previously published contrast washout kinetics. A good agreement between the model and the measured values was observed. Courtesy Dr Christian Stehning.
400
500
600
700
800
900
1000
1100
0:00 0:14 0:28 0:43 0:57 1:12
T1 (measured)
T1 (modelled)
time [hh:mm]
myo
card
ialT
1 [m
s]
#0#1
#2#3
#4
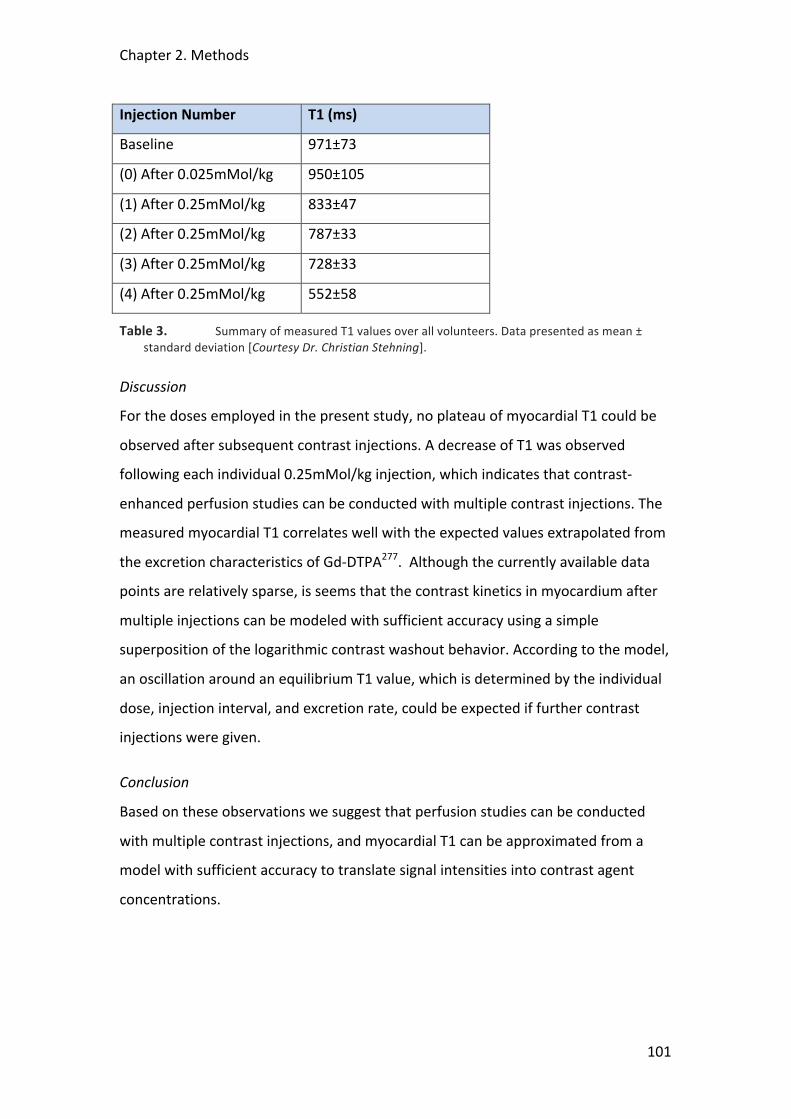
Chapter 2. Methods
101
Injection Number T1 (ms)
Baseline 971±73
(0) After 0.025mMol/kg 950±105
(1) After 0.25mMol/kg 833±47
(2) After 0.25mMol/kg 787±33
(3) After 0.25mMol/kg 728±33
(4) After 0.25mMol/kg 552±58
Table 3. Summary of measured T1 values over all volunteers. Data presented as mean ± standard deviation [Courtesy Dr. Christian Stehning].
Discussion
For the doses employed in the present study, no plateau of myocardial T1 could be
observed after subsequent contrast injections. A decrease of T1 was observed
following each individual 0.25mMol/kg injection, which indicates that contrast-‐
enhanced perfusion studies can be conducted with multiple contrast injections. The
measured myocardial T1 correlates well with the expected values extrapolated from
the excretion characteristics of Gd-‐DTPA277. Although the currently available data
points are relatively sparse, is seems that the contrast kinetics in myocardium after
multiple injections can be modeled with sufficient accuracy using a simple
superposition of the logarithmic contrast washout behavior. According to the model,
an oscillation around an equilibrium T1 value, which is determined by the individual
dose, injection interval, and excretion rate, could be expected if further contrast
injections were given.
Conclusion
Based on these observations we suggest that perfusion studies can be conducted
with multiple contrast injections, and myocardial T1 can be approximated from a
model with sufficient accuracy to translate signal intensities into contrast agent
concentrations.
Chapter 2. Methods
102
2.3.3.5 Assessment of Physiological Flow Reserve in Normal Volunteers
Undergoing Exercise Stress Using Patlak Plots
Having established that k-‐t SENSE was the optimal perfusion sequence for the
exercise studies the next stage was to determine whether the data that we acquired
was of sufficient quality to obtain myocardial flow data that was consistent with the
physiological data from the literature. On the basis of previous experience and more
widespread availability of the software we had decided that we would use the Fermi
deconvolution methods outlined in Section 2.3.2.2 above. Fermi deconvolution is
also the only technique validated in the assessment of differences in transmural flow
distribution293. However, we also had the opportunity to analyse this data with the
Patlak plot method, which would allow a useful comparison with the data obtained
from the Fermi deconvolution. The results from the Fermi analysis are included in
Chapter 6. The Patlak data is presented below.
Methods and Analysis
8 healthy volunteers (age 25-‐35 years) underwent a standardised exercise protocol
(increments of 20W each minute for 6 minutes at a rate of 60 rpm) using a specially
adapted supine cycle ergometer that was attached to the sliding table inside the
CMR scanner; the subject could exercise without leaving the table and scanning
could occur almost immediately after peak exercise. Rate pressure product (RPP)
calculated as peak systolic blood pressure x peak HR was recorded at peak exercise.
k-‐t SENSE accelerated perfusion CMR was performed on a 3T Philips Achieva® system
using 0.025mmol/kg/min Gd-‐DO3A-‐butrol and the following pulse sequence:
saturation recovery gradient echo, repetition time/echo time 3.0ms/1.0ms, flip angle
15°, 5x k-‐t SENSE acceleration, 11 interleaved training profiles, WET pre-‐pulse
(angles 120°, 90°, 180°, 140°); delay 100ms, spatial resolution 1.8x1.8x10mm3, 3
slices at each RR interval, 40 dynamic images. For blood pool saturation correction
MR images with diluted Gd-‐DO3A-‐butrol injection (0.0025mmol/kg) were also
acquired. The mid-‐slice was used in each subject for further analysis. After correcting
for saturation of the blood signal, arterial input and myocardial output time-‐intensity
curves were analyzed with a Patlak plot method to quantify global myocardial K1 at
rest and stress. Then, absolute global myocardial blood flow (MBF) at rest and stress
Chapter 2. Methods
103
and myocardial perfusion reserve (MPR) were calculated from the K1 measurement
using the extraction fraction (EF) of the Gd contrast agent, where EF=0.5 at rest,
EF=0.3 at stress. The local ethics board approved the study and all subjects signed a
consent form beforehand. Data are presented as mean ± standard deviation (SD).
Results
All subjects successfully completed the exercise protocol. Full data are presented in
Chapter 6. Resting MBF was 89.8±10 ml/min/100g compared to stress of
302.1±141.1ml/min/100g (P<0.008), giving an MPR of 3.3±1.4. RPP was 17556 ±
1209 indicating equivalent workload across all subjects.
Discussion and Conclusions
k-‐t SENSE can be used to acquire perfusion CMR data during ergometer stress and
analysis with Patlak plots can be used to determine global myocardial perfusion
reserve in healthy volunteers. The value of 3.3 for the MPR is consistent with
physiological values from the literature306, 309. Also see Chapter 6, where the mean
MPR derived from the Fermi deconvolution was very similar 3.3±0.5; obtaining the
same values from two different quantification methods is reassuring and suggests
consistency of the data. We did not use Patlak plots to examine differences in
transmural flow distribution as the technique is not validated for this purpose.
More studies are required to determine regional flow distribution but this technique
holds potential for the functional assessment of patients with cardiac disease.
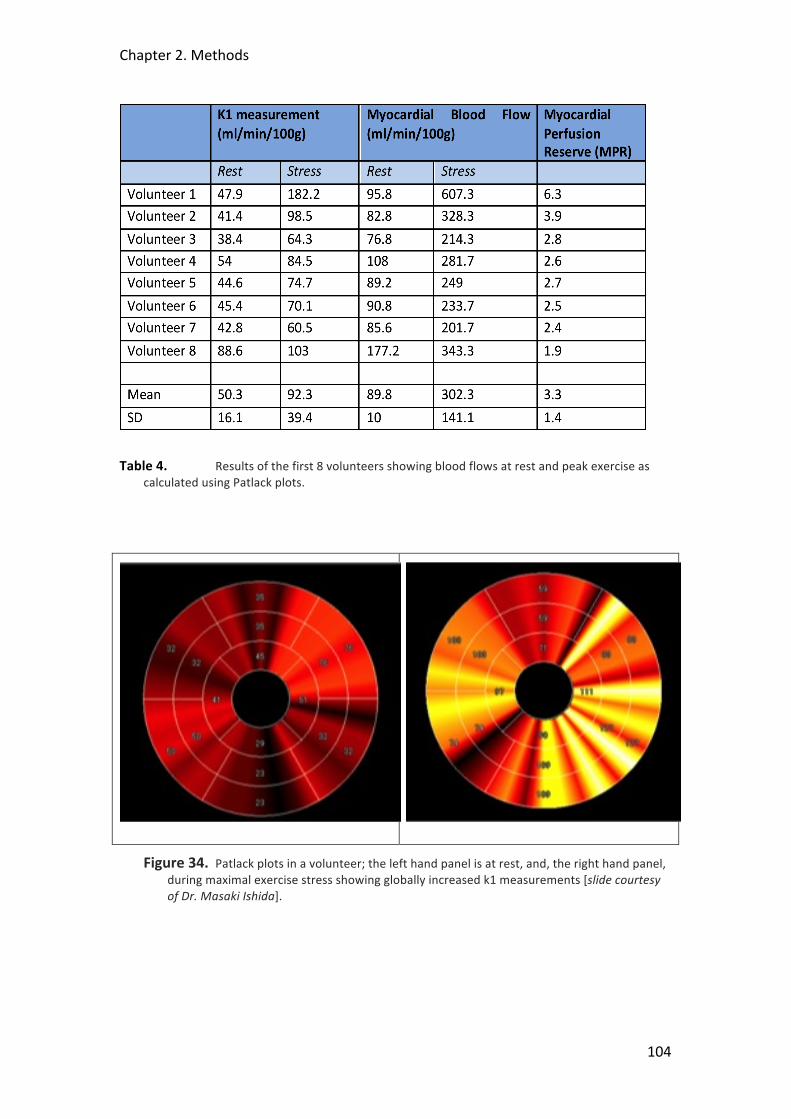
Chapter 2. Methods
104
Table 4. Results of the first 8 volunteers showing blood flows at rest and peak exercise as calculated using Patlack plots.
Figure 34. Patlack plots in a volunteer; the left hand panel is at rest, and, the right hand panel, during maximal exercise stress showing globally increased k1 measurements [slide courtesy of Dr. Masaki Ishida].

Chapter 2. Methods
105
2.4 Acknowledgements
I am most grateful to Mick Kelly and his team in the Works Dept., St Thomas’
Hospital for his valuable assistance with the many adaptations required to both the
catheterisation lab and MRI ergometers. His endless enthusiasm and innovative
ideas were crucial to the project. I am also grateful to all the staff in the cath lab and
MRI suite who endured the many frustrations and delays through the early
development stages of both exercise protocols, again without whom this project
would not have been possible. I would like to thanks Masaki Ishida for his help with
the Patlak plot analysis, and Christian Stehning for his work on the T1 plots and
modeling to look at background contrast saturation. Thanks to Dr. Maria Siebes and
her team at the Academic Medical Centre, Amsterdam, the Netherlands, for their
help with the WIA of data used in this thesis.
106
3 A CLINICAL TRIAL EXAMINING POSTCONDITIONING OF THE
MYOCARDIUM FOLLOWING MYOCARDIAL INFARCTION:
INNATE CARDIAC PROTECTION?
Tim Lockie1, Ian Webb1, Divaka Perera1, Amedeo Chiribiri2 Sven Plein2, 3, Eike Nagel2,
Simon Redwood1, Mike Marber1
1Cardiovascular Research Division, The Rayne Institute, St Thomas’ Hospital, KCL, London UK
2Division Imaging Sciences, The Rayne Institute, St Thomas’ Hospital, KCL, London, UK
3 Academic Unit of Cardiovascular Medicine, University of Leeds, UK

Chapter 3. Postconditioning in Acute Myocardial Infarction
107
3.1 Abstract
Background
Postconditioning (PC) is a novel strategy to reduce reperfusion injury following
myocardial infarction through graded restoration of blood flow. Cardiac magnetic
resonance (CMR) imaging provides unique tissue characterization.
Methods
Patients undergoing primary percutaneous coronary intervention (PPCI) were
enrolled into a prospective randomised control pilot study to evaluate the feasibility
of early CMR imaging to examine the effect of PC. Following restoration of TIMI 3
flow the PC protocol involved 4 x 1 minute serial balloon inflations at 4-‐6 atm to re-‐
occlude the artery, with 1 minute between each inflation. Patients in the control arm
were stented after 8 minutes of unhindered reperfusion. CMR was then performed
<36 hrs to determine the extent of infarction by late gadolinium enhancement (LGE).
Microvascular obstruction (MVO) was represented by areas of low signal on the
early gadolinium enhanced image. Results are presented as mean ± standard error
(SE). Student’s t-‐test was used to compare the groups. CMR data were blinded for
analyses.
Results
33 patients were randomised into the study of which 19 patients completed the
protocol (3 haemodynamic instability, 5 IABP insertion, 2 thrombectomy, 4 no-‐
reflow post stent (2 control, 2 PC)) and 14 underwent a successful CMR scan (8 PC, 6
control) <36 hrs. Baseline characteristics were similar as was the pain-‐to-‐balloon
time (mins) (137±24 con; 183±45 PC, NS). ST segment resolution (mm), a marker of
reperfusion, was significantly improved in the PC group (3.3±0.3 vs. 1.3±0.3,
p<0.004). Peak CK release (IU) was not different between the groups (2319±540 con
vs. 2010±336 PC, NS) nor was the area under the curve of CK release over 36 hours.
There was no significant difference in the area of LGE(cm3) (25.4±4.9 con vs.
36.8±7.1 PC, NS) nor was there a difference in MVO(cm3) (4.18±1.9 con vs. 6.6±3.6
PC, NS). There were no MACE reported in any study patients at 9 months.
Chapter 3. Postconditioning in Acute Myocardial Infarction
108
Conclusions
A CMR scan early after PPCI is feasible and provides high quality data. Initial data
suggest improved perfusion by PC but no infarct reduction.
3.2 Background
The consequences of acute myocardial infarction (AMI) are a major cause of
morbidity and mortality. Primary percutaneous intervention (PPCI) aims to restore
myocardial blood flow rapidly but there is evidence that this process in-‐itself may
precipitate cell death, microvascular obstruction (MVO) and tissue dysfunction
through reperfusion injury. Postconditioning is a novel strategy to reduce
reperfusion injury through graded restoration of blood flow148. More detailed
background is given in Section 1.2.2.2. Preliminary clinical trials have suggested that
postconditioning at the time of reperfusion results in an early reduction in infarct
size. Our proposed prospective, randomised, controlled study will compare PPCI
alone to PPCI with a postconditioning protocol. We aim to study the effects of post
conditioning on late infarct volume and left ventricular (LV) segmental and global
performance using delayed Gadolinium-‐enhanced cardiac magnetic resonance
imaging (CMR). We suggest that postconditioning will result in reduced late
infarction at 5 months with improved LV wall thickening and overall improved
function. We suggest that MVO within the infarct zone in the 24 hours following AMI
will be reduced by postconditioning and will predict LV recovery. MVO will be
measured by early first-‐pass Gadolinium hypoenhancement CMR imaging.
To date there have been no clinical studies using CMR imaging to assess the effects
of postconditioning at the time of primary PCI. CMR provides unique tissue
characterisation of the myocardium with high resolution and reproducibility and
without the use of ionising radiation. It is able to determine function, perfusion,
viability and scar characteristics that are not possible through other imaging
modalities. Although other studies148, 150, 310 have suggested that postconditioning
provides a significant reduction in early infarct volume they have generally relied on

Chapter 3. Postconditioning in Acute Myocardial Infarction
109
enzyme release to infer infarct size with only the recent Yang paper utilising SPECT
imaging at 1 week. Although CK release profile has been used previously as a marker
of infarct size it is very crude and prone to error. The process of postconditioning
itself may affect the dynamics of enzyme release and such a rise alone gives little
indication of the processes occurring at a microvascular level. It is also known that
interventions can reduce necrosis at the expense of increased oncosis/apoptosis, a
process not associated with immediate CK release311. By relying on CK release one
cannot be sure that such interventions are not simply delaying the progression to
infarction rather than representing a sustained anti-‐infarct effect. Robust, serial
imaging modalities are therefore required to assess the long term sustained effect of
postconditioning in reducing infarct size. SPECT imaging has many well-‐recognized
limitations. The poor resolution of the technique, which cannot distinguish
subendocardial from transmural myocardial infarction, means that it may
significantly underestimate infarcts where there is not full thickness involvement. In
a heterogeneous study population with a large range of infarct sizes this may be very
significant. To compound this myocardial stunning and acute abnormalities in
microvascular perfusion may result in the well reported overestimation of infarct
size in certain groups with the possibility that late recovery of the myocardium may
alter the measurement312. The large radiation dose from each study means that
serial examinations are not feasible. A much more accurate means of tracking
changes in infarct size and LV function is using Gd-‐enhanced CMR, a well-‐validated
and robust modality. CMR is safe, reproducible and does not result in excess
radiation doses to patients undergoing repeated examinations. The latest CMR
navigation and tracking sequences allow highly accurate comparisons to be made
over time313. To show whether early infarct reduction is maintained the patients in
the proposed study will be rescanned at 5 months which is the time when it is
considered the scar has achieved its final form314. No studies to date have published
such data. Recovery of LV function following AMI is directly related to clinical
outcome121. Improvements in function at 5 months compared to baseline will form
the primary endpoint of the study. Crucial to the recovery of wall motion is the
presence of MVO within infarcted segments as it is highly predictive of poor recovery
Chapter 3. Postconditioning in Acute Myocardial Infarction
110
compared to dysfunctional segments at time of reperfusion that do not contain
MVO271. CMR will be able to track both changes in LV segmental wall thickening and
the presence of MVO. It is suggested that by ameliorating the deleterious effects of
reperfusion injury in the first minutes following restoration of coronary flow
postconditioning will reduce MVO and promote LV recovery over and above the
reduction in infarct size alone. To assess microvascular function the
postconditioning studies to date have either relied on the myocardial blush grade
(MBG), a crude angiographically derived marker of perfusion, or coronary flow
reserve, also unreliable and highly dependent on loading conditions and residual
epicardial coronary disease. In addition, they were measured almost immediately
after PCI; this may simply represent post-‐PCI hyperaemia and does not account for
the well described dynamic nature of MVO continuing to evolve beyond
reperfusion315. In our study we will assess microvascular function through accurate
and validated measures at 24-‐48 hours following reperfusion. The purpose of this
study is to use contemporary CMR techniques to confirm that the described short-‐
term benefits of postconditioning are followed by long-‐term improvements in LV
performance. So far, studies have relied on unreliable markers of infarct size or
imaging modalities early after tissue reperfusion and therefore the sustained
positive effects of postconditioning have yet to be determined.
3.3 Aims
1. To establish the existence and potential therapeutic role of postconditioning
in the setting of primary angioplasty for acute myocardial infarction in
reducing anatomical infarct size through a prospective, randomised,
controlled clinical study.
2. To investigate whether the early reduction in infarction volume with
postconditioning is maintained at 5 months and results in improved wall
motion scores and global LV performance
3. To establish whether postconditioning reduces microvascular obstruction
acutely in the infarct zone which in turn predicts improved LV recovery
Chapter 3. Postconditioning in Acute Myocardial Infarction
111
3.4 Study Design
3.4.1 Inclusion criteria Patients with AMI defined by chest pain >30 minutes and <12 hours, ST elevation
>0.1mV in 2 contiguous limb leads or >0.2mV in >2 contiguous precordial leads or
new LBBB. There must be TIMI 0/1 flow in the infarct related artery (IRA) at
diagnostic angiogram.
3.4.2 Exclusion criteria Contra-‐indications to MRI, pregnancy, concomitant illness, culprit left main stem
disease, thrombolysis, Q-‐waves in territories without ST elevation, previous CABG,
spontaneous recanalisation (TIMI 2/3 flow in the IRA) or extensive collateralisation
(Rentrop Score >1) at diagnostic angiogram.
3.4.3 Randomisation
Was carried out after the coronary angiogram confirmed TIMI 1/0 flow in the infarct
related artery and was via an envelope to either postconditioning or control group.
3.4.4 Interventional Protocol All procedures were carried out by the interventional cardiologists at St Thomas’
Hospital. The infarct related artery (IRA) and culprit lesion were identified, lesion
crossed and flow restored with a single balloon inflation. Those patients with TIMI
2/3 flow after this first balloon inflation were randomized to (1) routine PCI or (2) PCI
followed by the postconditioning protocol. This process is time-‐dependent and there
must not be more than 1 minute between the restoration of flow to the IRA and the
start of the postconditioning protocol. Patients who required multiple balloon
inflations to achieve satisfactory flow were excluded. The postconditioning protocol
involved 4 x 1 minute serial re-‐inflations of the pre-‐dilatation balloon at low
atmospheres (e.g. 4-‐6 atmospheres) in order to re-‐occlude the artery with a period
of 1 minute left between each inflation. Occlusion of the artery was confirmed by
either further ST elevation on the electrocardiograph or a short contrast injection
with the balloon inflated to ensure no distal flow. If there was evidence of flow then

Chapter 3. Postconditioning in Acute Myocardial Infarction
112
the balloon was inflated further or up-‐sized. The protocol was commenced after 1
minute of initial reperfusion and at the same intra-‐coronary site. The lesion was then
stented as per usual. Patients in the control arm were stented after 8 minutes of
unhindered reperfusion (see figure below). The loading of patients with aspirin and
clopidogrel and the use of adjuvant glycoprotein IIb/IIIa inhibitors as suggested by
guidelines was allowed, however, the use of thrombus aspiration or haemodynamic
instability that required temporary pacing or the use of an intra-‐aortic balloon pump
or other inotropic support meant the patient was excluded from the study
Figure 35. Study protocol for the cardiac catheterisation laboratory after the diagnostic coronary angiogram confirming an occluded vessel (TIMI 0 flow) in patients being treated with PPCI for acute STEMI.
3.4.5 Cardiac Magnetic Resonance Imaging
Imaging was carried out on a Philips Intera CV 1.5T dedicated research MR scanner.
The imaging protocol consisted: a plan scan; a SENSE reference scan; cine SSFP short
axis LV function scan (app. 12 slices, 40 phases of the cardiac cycle); a 1st pass Turbo
Field Echo dynamic perfusion scan (3 slices per cardiac cycle, resolution (better than
2.5 mm x 2.5 mm x 8 mm) using Gd-‐DTPA (0.1 mmol/kg); 3D Inversion Recovery (IR)
myocardial viability late enhancement scans in short and long axis views, resolution
(2 mm x 2 mm x 10mm) at 2 minutes (for hypo-‐enhancement) and 15-‐20 minutes
(for hyper-‐enhancement) following Gd-‐DTPA injection (additional 0.3 mmol/kg). End
systolic volume (ESV) and end diastolic (EDV) were quantified by drawing
endocardial and epicardial contours on the short axis series of the cine-‐MRI images
Control GroupUnhindered reperfusion 8 mins
1st TIMI 2-3 flow StentBalloon
1min 1’ 1’ 1’
InflateDeflate
1min 1’ 1’
Post-Conditioning Group
Chapter 3. Postconditioning in Acute Myocardial Infarction
113
and ejection fraction (EF) was calculated as: (EDV-‐ESV)/EDV x 100%271. The 17-‐
segment model of the LV was used for regional wall motion assessment316. LV
segmental thickening (%) at baseline and at 5 months was compared to regions of
remote myocardium that are unaffected by significant coronary disease. Myocardial
perfusion was evaluated per segment and scored as: 1, normal perfusion
(homogeneous enhancement of myocardium); 2, mild perfusion defect
(subendocardial layer of hypo-‐enhancement); and 3, severe perfusion defect (30%
transmural extent of hypo-‐enhancement)271. Infarct mass was determined by
multiplying delayed enhancement volume by 1.05g/ml as previously described271.
The dynamic increase in infarct size in the hours beyond reperfusion has been well
documented with continued tissue oedema, inflammation and myocardial stunning
that may last for several days131, 273. Subsequently, there is little recovery in wall
motion in the days following reperfusion317. The early CMR scan within 24 hours of
reperfusion representing baseline function is, therefore, likely to reflect the extent of
myocardial ischaemia through contractile dysfunction caused by both irreversible,
and reversible (stunning), injury.
3.4.6 Power Calculations and Sample Size
A standard (two-‐tailed) t-‐test was used to assess sample size to detect a mean
improvement in LV function in the control and intervention groups. We use a
standard formula for sample size determination55
N = 2(σ/δ)2(z1-‐α/2+ z1-‐β)2 +(z1-‐α/2)2/4
Where N is the sample size, α is the significance level, 1-‐β is the study power
required, σ is the inter-‐study standard deviation, δ is the difference in ejection
fraction to be detected and zx is the x-‐th percentile of a standard normal distribution.
Using α=0.05, 1-‐β=0.9, σ=5.1 (derived from published data36 as well as in-‐house
observations) and δ= 3 (a 36% reduction in infarct size suggested by Staat et al27
would equate to an approximate improvement in EF of 6% from post MI longitudinal
studies40; an improvement of 3% EF will be sought to allow for smaller infarct
sizes), N= 15 using the above values. With potential patient dropout we aimed to
Chapter 3. Postconditioning in Acute Myocardial Infarction
114
recruit 20 patients per group. This will also compensate for assumptions regarding a
known standard deviation and using a standard normal, rather than t critical values.
3.4.7 Ethics Full ethical approval was obtained (COREC Ref 06/Q0702/67). Consent was a two-‐
stage process with the patient giving verbal consent to the postconditioning protocol
prior to going to the catheter lab and then written consent to the rest of the study
afterwards. Both stages of the consent were taken by either TL or IW. A study safety
and event monitoring committee met regularly and assessed the patients recruited
to the study. At a pre-‐specified point after the recruitment of 20 patients into the
study a full interim analysis of data recorded so far was undertaken to assess safety
of the protocol and the usefulness of continuing.
3.5 Results
These results reflect the interim analysis performed after 14 patients successfully
completed the entire study protocol.
3.5.1 Baseline characteristics 33 patients were randomised into the study of which 19 patients completed the
catheter lab protocol. 3 were excluded due to haemodynamic instability during the
initial wiring of the vessel, 5 required intra-‐aortic balloon insertion, 2 required
thrombectomy because of heavy thrombus load, in 4 patients there was no-‐reflow
after stent insertion requiring multiple further balloon inflations (2 occurred in the
control arm and 2 in the PC arm). In total, 14 (13 male, 1 female) underwent a
successful CMR scan (8 post con, 6 control) within 36 hrs and of these 9 underwent a
successful follow-‐up scan at 5 months. The full details of the study population and
recruitment are listed in Table 5. Data are presented as mean ± standard deviation.
There were no differences regarding baseline characteristics, other than the PC
population tended to be slightly older with a higher proportion of left anterior
descending (LAD) infarcts. Otherwise, background medication, incidence of prior
ischaemic heart disease and cardiovascular risk factors were similar other than a

Chapter 3. Postconditioning in Acute Myocardial Infarction
115
higher proportion of diabetics in the control arm. The pain-‐to-‐balloon times showed
that these were longer in the PC group at 183±45 minutes compared to the control
group at 137±24 minutes although these differences were not statistically significant
and were skewed by one subject in the PC arm who arrived at the lab after 420
minutes of pain.
3.5.2 Coronary Angiography and Primary PCI
Out of the 33 patients randomised into the study it can be seen from the above flow
chart that there was a high proportion of patients who dropped out of the study
with 8 being excluded in the PC arm and 6 excluded in the control arm before the
cath lab protocol was completed or if completed before the patient left the lab and
was safely back on the coronary care unit (CCU). The causes for this are listed above
and were evenly distributed between the groups. There was no suggestion that the
PC protocol of re-‐occluding the vessel with serial balloon inflations was associated
with procedural complications and was tolerated very well by the patients. Any form
of instability, however, meant that in the interests of the safety of the patient he or
she had to be taken out of the study to receive therapy such as intravenous inotropic
support agents, temporary pacing, thrombus aspiration or the insertion of an IABP
all of which, in addition, may have confounded the results of the study. The use of
GP IIb/IIIa inhibitors is standard in our institution and the use of such agents was
equal between the groups. All the patients recruited into the study had TIMI 0 flow
at the time of the first diagnostic pictures and in the PC group the protocol was
commenced within the first minute in all cases. There was a spread of infarct related
arteries between the groups with slight preponderance for LAD involvement in the
PC arm.
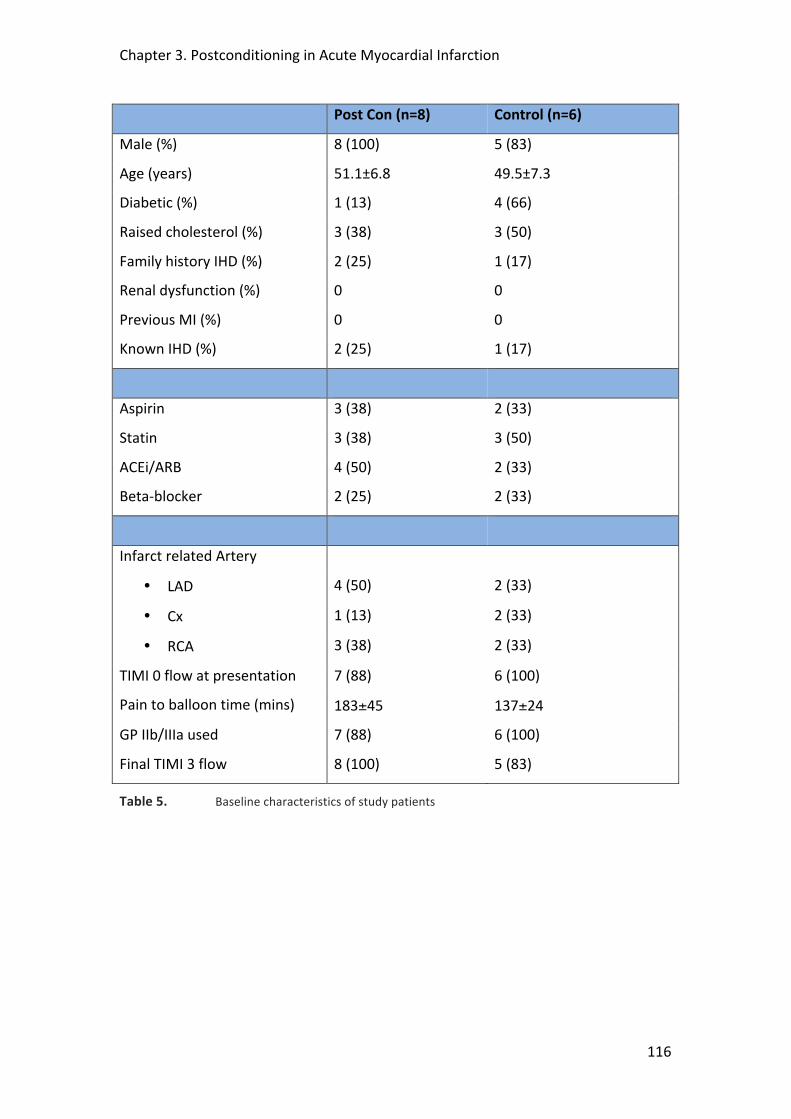
Chapter 3. Postconditioning in Acute Myocardial Infarction
116
Post Con (n=8) Control (n=6)
Male (%) 8 (100) 5 (83)
Age (years) 51.1±6.8 49.5±7.3
Diabetic (%) 1 (13) 4 (66)
Raised cholesterol (%) 3 (38) 3 (50)
Family history IHD (%) 2 (25) 1 (17)
Renal dysfunction (%) 0 0
Previous MI (%) 0 0
Known IHD (%) 2 (25) 1 (17)
Aspirin 3 (38) 2 (33)
Statin 3 (38) 3 (50)
ACEi/ARB 4 (50) 2 (33)
Beta-‐blocker 2 (25) 2 (33)
Infarct related Artery
• LAD 4 (50) 2 (33)
• Cx 1 (13) 2 (33)
• RCA 3 (38) 2 (33)
TIMI 0 flow at presentation 7 (88) 6 (100)
Pain to balloon time (mins) 183±45 137±24
GP IIb/IIIa used 7 (88) 6 (100)
Final TIMI 3 flow 8 (100) 5 (83)
Table 5. Baseline characteristics of study patients
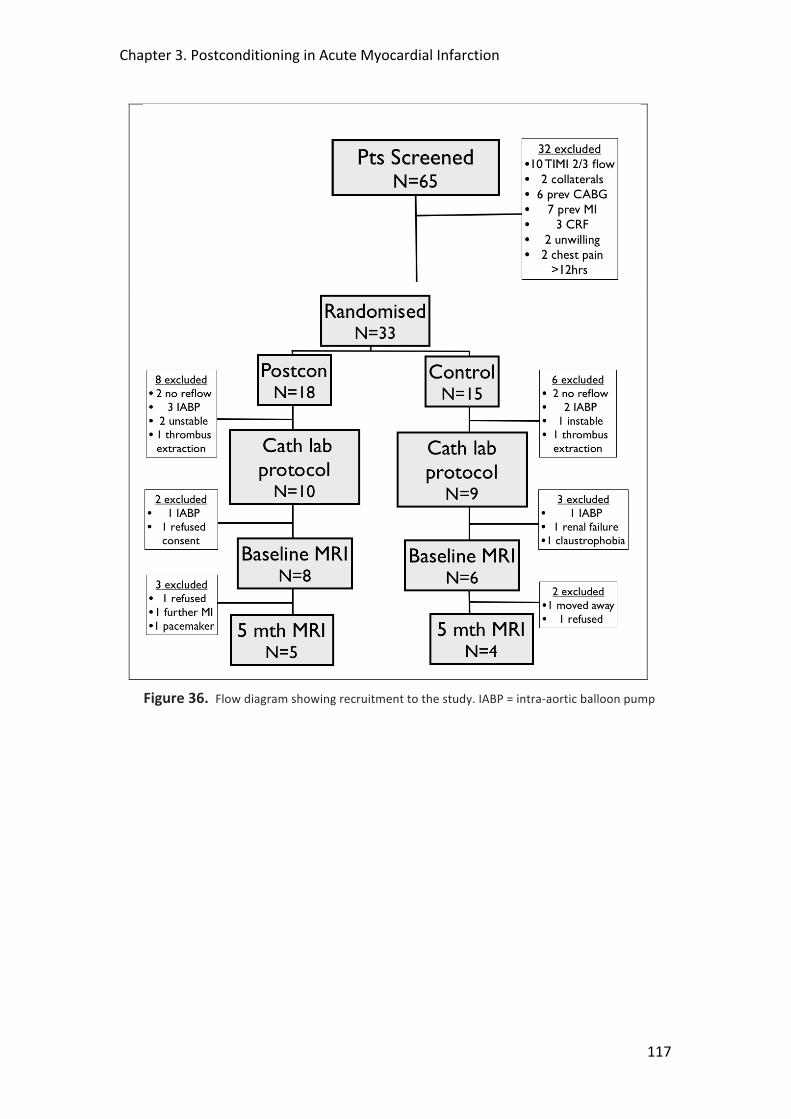
Chapter 3. Postconditioning in Acute Myocardial Infarction
117
Figure 36. Flow diagram showing recruitment to the study. IABP = intra-‐aortic balloon pump
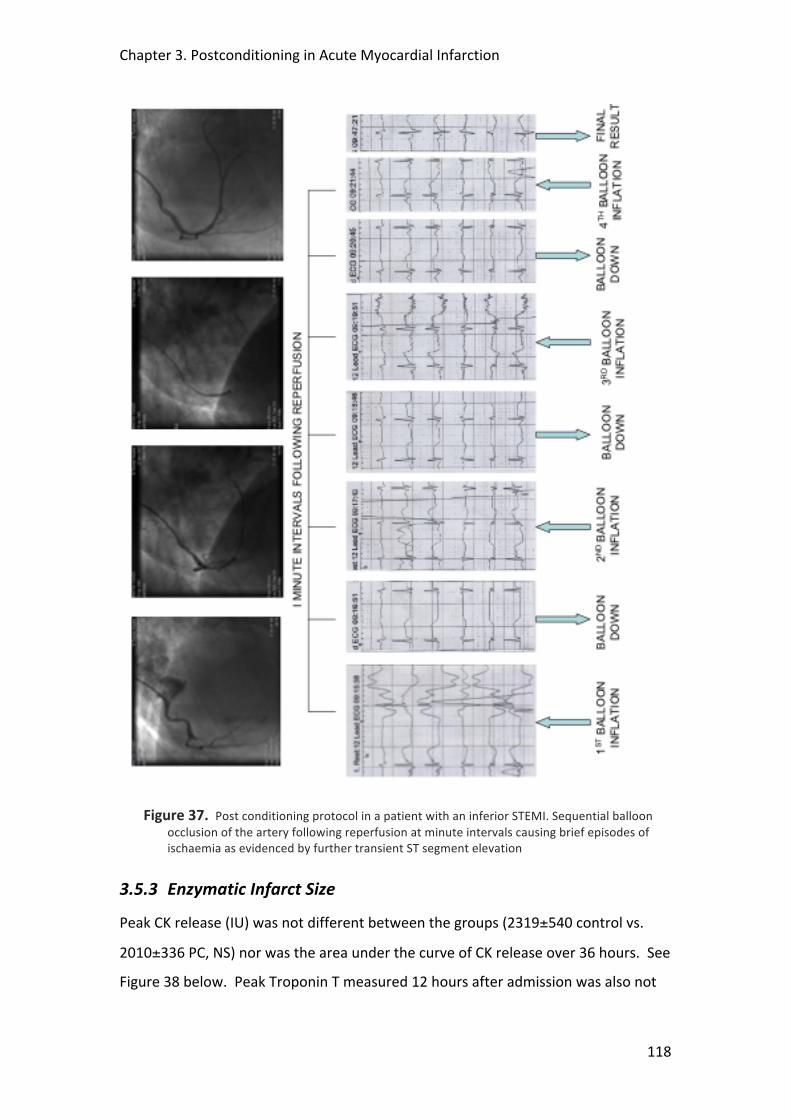
Chapter 3. Postconditioning in Acute Myocardial Infarction
118
Figure 37. Post conditioning protocol in a patient with an inferior STEMI. Sequential balloon occlusion of the artery following reperfusion at minute intervals causing brief episodes of ischaemia as evidenced by further transient ST segment elevation
3.5.3 Enzymatic Infarct Size
Peak CK release (IU) was not different between the groups (2319±540 control vs.
2010±336 PC, NS) nor was the area under the curve of CK release over 36 hours. See
Figure 38 below. Peak Troponin T measured 12 hours after admission was also not
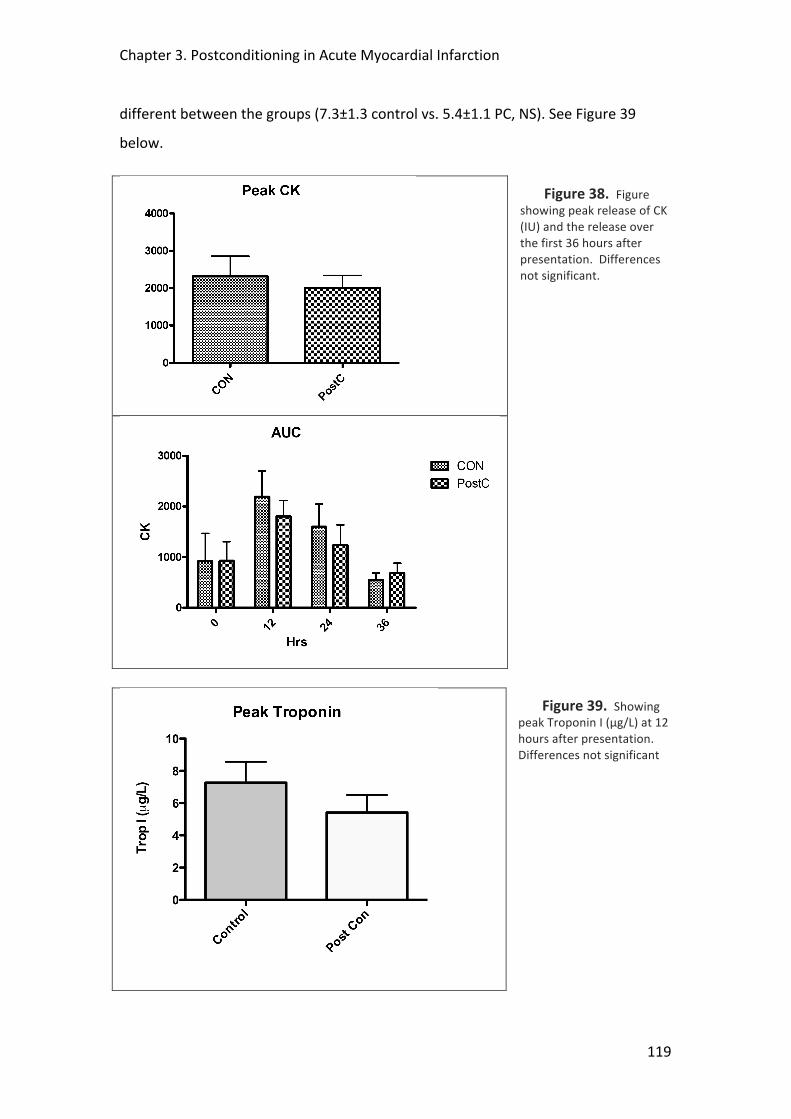
Chapter 3. Postconditioning in Acute Myocardial Infarction
119
different between the groups (7.3±1.3 control vs. 5.4±1.1 PC, NS). See Figure 39
below.
Figure 38. Figure showing peak release of CK (IU) and the release over the first 36 hours after presentation. Differences not significant.
Figure 39. Showing peak Troponin I (μg/L) at 12 hours after presentation. Differences not significant

Chapter 3. Postconditioning in Acute Myocardial Infarction
120
3.5.4 ST-‐Segment Shift
ECG ST-‐segment resolution (mm), a marker of reperfusion, was significantly
improved in the PC group (3.3±0.3 vs. 1.3±0.3, p<0.002).
Figure 40. Showing ST-‐segment resolution on ECG following primary PCI. *P<0.002.
1.1.5 Cardiac Magnetic Resonance Imaging
Early CMR imaging was carried out on all subjects successfully within 36 hours of
presentation (mean 23 ±13.3 hours), apart from one patient in the control arm who
suffered claustrophobia at the beginning of the scan meaning that no data could be
collected. The mean scanning time was 51±18 minutes and all images were of
sufficient quality for analysis.
Baseline CMR Scan
There was no difference in LV size (cm3), which was 128.5±29.8 in the PC group
compared to 151.6±25.8 in the control group, or, mass (g) where the corresponding
values were 133.6±31 in the PC group vs. 157.6±26.8 for the control. The volume of
late gadolinium enhancement was not different between the groups, either when
expressed as a absolute measurement (cm3) (35.6±16.4 in the PC group compared to
26.1±9.8 control), or as a percentage of the LV myocardium as a whole (26.9±9.3 PC
vs. 17.4±6.3 control).
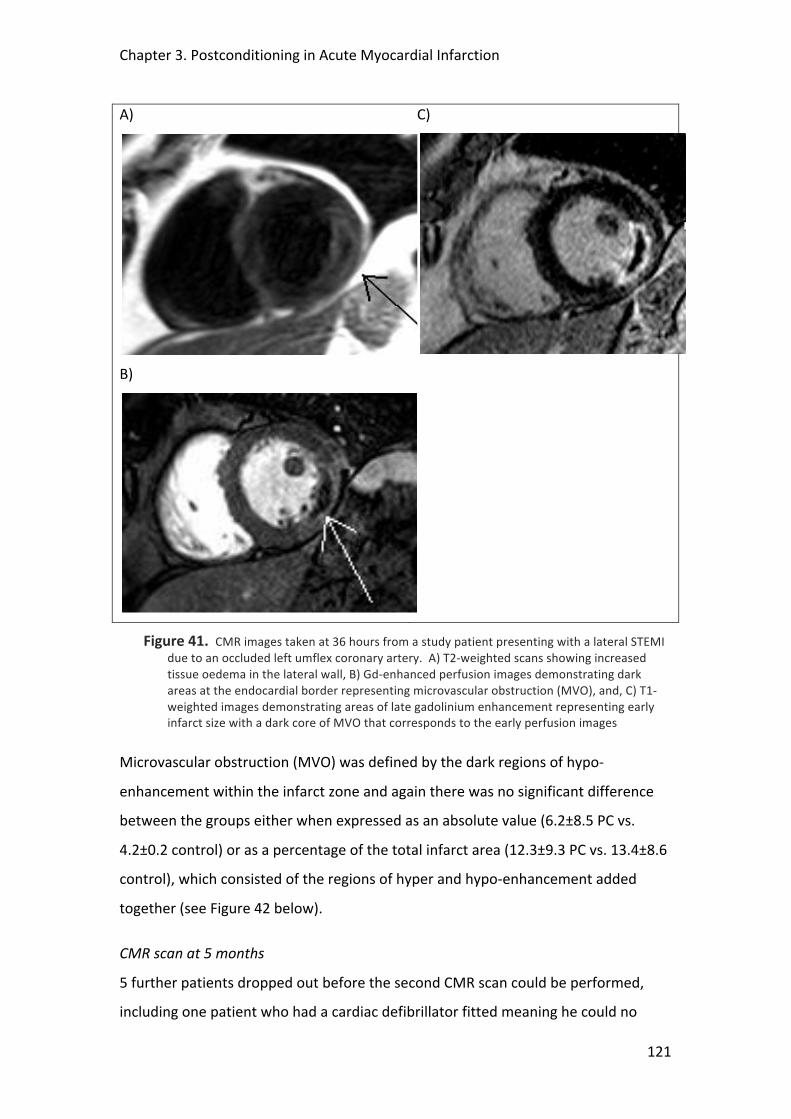
Chapter 3. Postconditioning in Acute Myocardial Infarction
121
A)
C)
B)
Figure 41. CMR images taken at 36 hours from a study patient presenting with a lateral STEMI due to an occluded left umflex coronary artery. A) T2-‐weighted scans showing increased tissue oedema in the lateral wall, B) Gd-‐enhanced perfusion images demonstrating dark areas at the endocardial border representing microvascular obstruction (MVO), and, C) T1-‐weighted images demonstrating areas of late gadolinium enhancement representing early infarct size with a dark core of MVO that corresponds to the early perfusion images
Microvascular obstruction (MVO) was defined by the dark regions of hypo-‐
enhancement within the infarct zone and again there was no significant difference
between the groups either when expressed as an absolute value (6.2±8.5 PC vs.
4.2±0.2 control) or as a percentage of the total infarct area (12.3±9.3 PC vs. 13.4±8.6
control), which consisted of the regions of hyper and hypo-‐enhancement added
together (see Figure 42 below).
CMR scan at 5 months
5 further patients dropped out before the second CMR scan could be performed,
including one patient who had a cardiac defibrillator fitted meaning he could no
Chapter 3. Postconditioning in Acute Myocardial Infarction
122
longer undergo a scan. The full details of the data are presented in the table above
but there remained no differences in any of the major endpoints at 5 months
between the groups.
3.6 Discussion
The main results of the interim analysis of this randomised, prospective study
examining the benefits of postconditioning compared to control in a population of
patients undergoing primary PCI for acute ST-‐elevation MI suggest an improvement
in tissue perfusion, but no reduction in infarct size. These results must be treated
cautiously as they are not powered to determine any significant differences due to
low numbers.
Although Staat et al148, 318 showed that postconditioning can reduce infarct size,
other similar small, single-‐centre studies have been disappointing and more
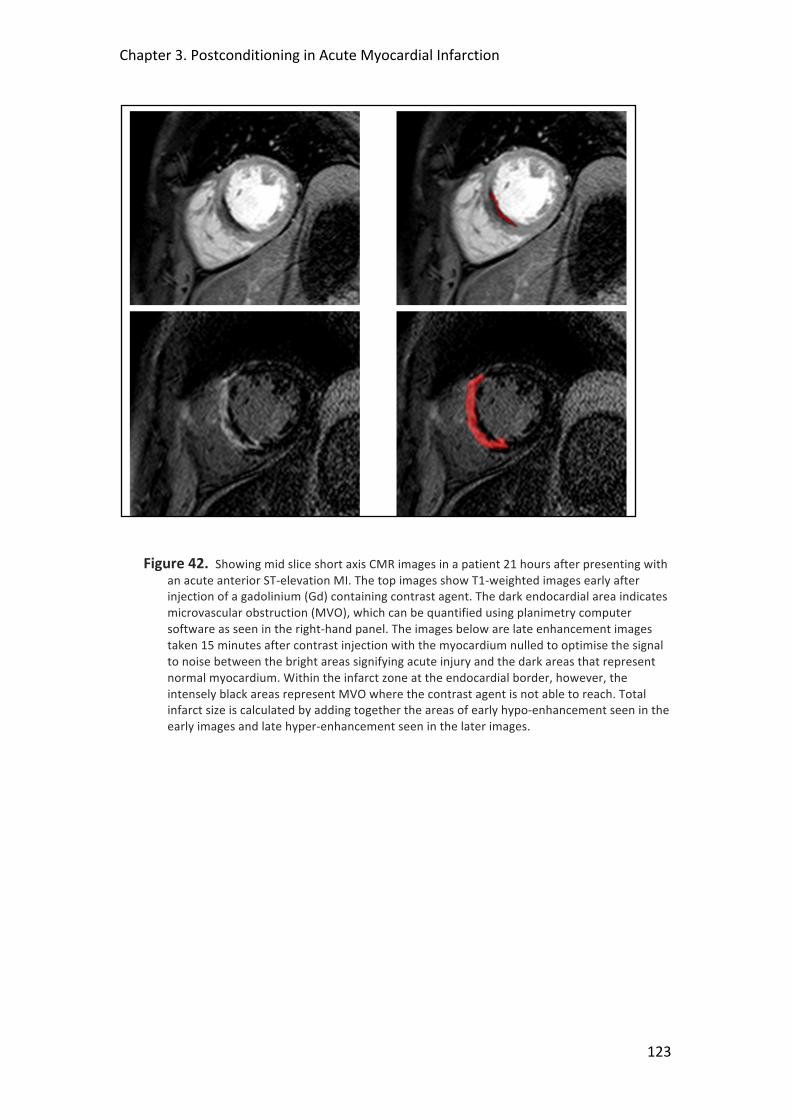
Chapter 3. Postconditioning in Acute Myocardial Infarction
123
Figure 42. Showing mid slice short axis CMR images in a patient 21 hours after presenting with an acute anterior ST-‐elevation MI. The top images show T1-‐weighted images early after injection of a gadolinium (Gd) containing contrast agent. The dark endocardial area indicates microvascular obstruction (MVO), which can be quantified using planimetry computer software as seen in the right-‐hand panel. The images below are late enhancement images taken 15 minutes after contrast injection with the myocardium nulled to optimise the signal to noise between the bright areas signifying acute injury and the dark areas that represent normal myocardium. Within the infarct zone at the endocardial border, however, the intensely black areas represent MVO where the contrast agent is not able to reach. Total infarct size is calculated by adding together the areas of early hypo-‐enhancement seen in the early images and late hyper-‐enhancement seen in the later images.
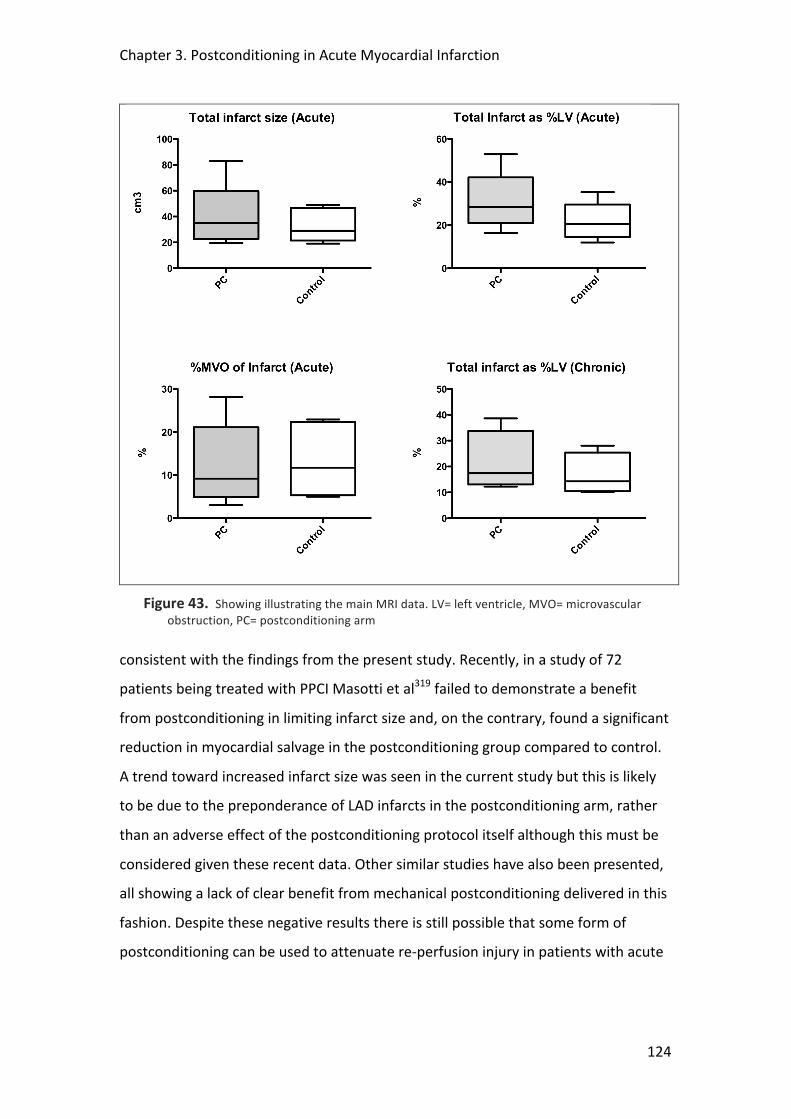
Chapter 3. Postconditioning in Acute Myocardial Infarction
124
Figure 43. Showing illustrating the main MRI data. LV= left ventricle, MVO= microvascular obstruction, PC= postconditioning arm
consistent with the findings from the present study. Recently, in a study of 72
patients being treated with PPCI Masotti et al319 failed to demonstrate a benefit
from postconditioning in limiting infarct size and, on the contrary, found a significant
reduction in myocardial salvage in the postconditioning group compared to control.
A trend toward increased infarct size was seen in the current study but this is likely
to be due to the preponderance of LAD infarcts in the postconditioning arm, rather
than an adverse effect of the postconditioning protocol itself although this must be
considered given these recent data. Other similar studies have also been presented,
all showing a lack of clear benefit from mechanical postconditioning delivered in this
fashion. Despite these negative results there is still possible that some form of
postconditioning can be used to attenuate re-‐perfusion injury in patients with acute
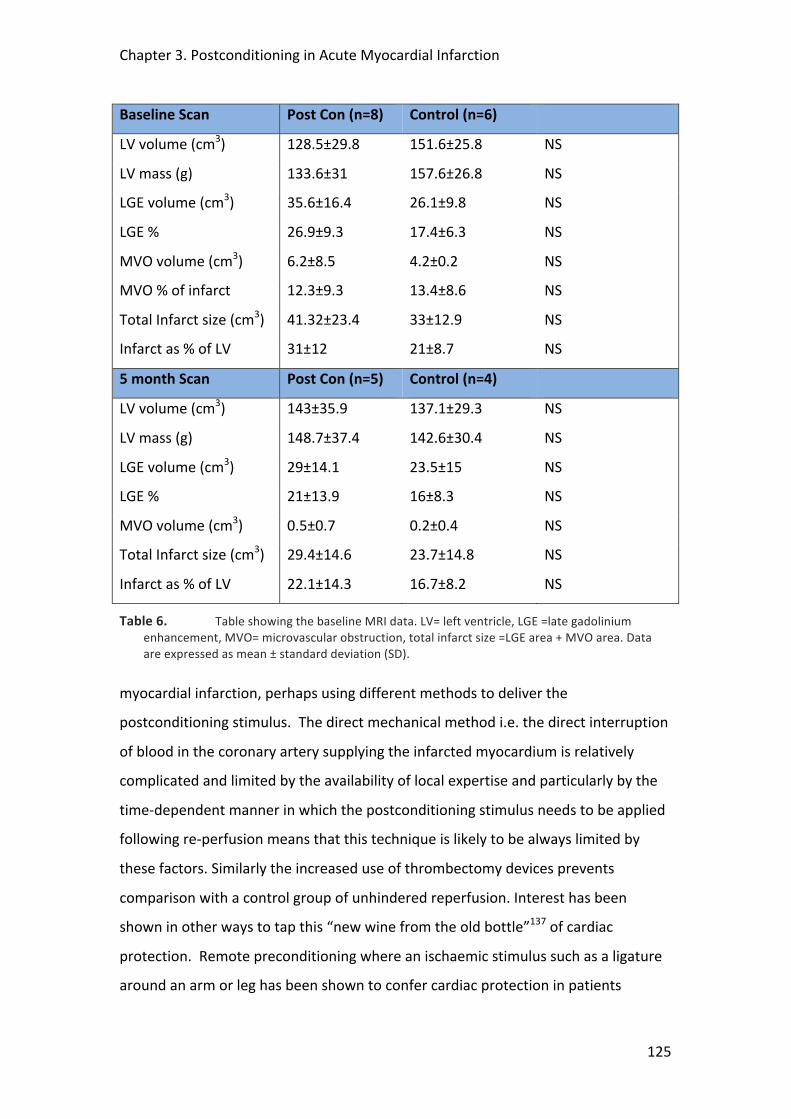
Chapter 3. Postconditioning in Acute Myocardial Infarction
125
Baseline Scan Post Con (n=8) Control (n=6)
LV volume (cm3) 128.5±29.8 151.6±25.8 NS
LV mass (g) 133.6±31 157.6±26.8 NS
LGE volume (cm3) 35.6±16.4 26.1±9.8 NS
LGE % 26.9±9.3 17.4±6.3 NS
MVO volume (cm3) 6.2±8.5 4.2±0.2 NS
MVO % of infarct 12.3±9.3 13.4±8.6 NS
Total Infarct size (cm3) 41.32±23.4 33±12.9 NS
Infarct as % of LV 31±12 21±8.7 NS
5 month Scan Post Con (n=5) Control (n=4)
LV volume (cm3) 143±35.9 137.1±29.3 NS
LV mass (g) 148.7±37.4 142.6±30.4 NS
LGE volume (cm3) 29±14.1 23.5±15 NS
LGE % 21±13.9 16±8.3 NS
MVO volume (cm3) 0.5±0.7 0.2±0.4 NS
Total Infarct size (cm3) 29.4±14.6 23.7±14.8 NS
Infarct as % of LV 22.1±14.3 16.7±8.2 NS
Table 6. Table showing the baseline MRI data. LV= left ventricle, LGE =late gadolinium enhancement, MVO= microvascular obstruction, total infarct size =LGE area + MVO area. Data are expressed as mean ± standard deviation (SD).
myocardial infarction, perhaps using different methods to deliver the
postconditioning stimulus. The direct mechanical method i.e. the direct interruption
of blood in the coronary artery supplying the infarcted myocardium is relatively
complicated and limited by the availability of local expertise and particularly by the
time-‐dependent manner in which the postconditioning stimulus needs to be applied
following re-‐perfusion means that this technique is likely to be always limited by
these factors. Similarly the increased use of thrombectomy devices prevents
comparison with a control group of unhindered reperfusion. Interest has been
shown in other ways to tap this “new wine from the old bottle”137 of cardiac
protection. Remote preconditioning where an ischaemic stimulus such as a ligature
around an arm or leg has been shown to confer cardiac protection in patients
Chapter 3. Postconditioning in Acute Myocardial Infarction
126
undergoing cardiac surgery160 and early evidence suggests a similar protective
benefit with remote postconditioning320-‐322. Trials are underway to evaluate role the
role of remote postconditioning in acute myocardial infarction where it has the
advantage of being able to be applied in the ambulance by the paramedics almost
immediately and as such can potentially yield the maximum benefit. Interest is also
being shown in pharmacological agents such as glucagon-‐like-‐peptide323,
erythropoietin324, atorvastatin296, atrial naturetic peptide295 and cyclosporin325 which
have all been shown to have a cardioprotective effect and are undergoing further
evaluation in larger clinical trials. Again these agents have the advantage of being
easily and rapidly administered at an early stage so that their effect will be apparent
as soon as anterograde blood flow is restored and they are able to take advantage of
that golden moment after reperfusion when there is some chance of conferring
cardio-‐protection and increasing myocardial salvage.
3.7 Study Limitations
Clinical studies involving patients presenting with acute myocardial infarction are a
notoriously difficult group to study due to the inherent clinical instability and
unpredictability of their presentation. It is often difficult to gain an accurate history
from patients about both the duration and severity of their symptoms and past
medical history; in addition, patients are naturally anxious about consenting into
clinical trials when they are scared and uncertain about what is happening to them.
In addition, there are those patients in whom anterograde flow is already present
when the diagnostic pictures are taken or have evidence of extensive multi-‐vessel
disease with collateralisation or previous myocardial infarction all of which are
exclusion criteria for the study. As can be seen from the recruitment flow chart,
even if they are randomised then there is still a high chance of the patient being
excluded from the study with the inherent complications that are present in a high
proportion of PPCI cases, such as no-‐reflow or haemodynamic compromise requiring
additional LV support. All of the above conspired to a slower than predicted
recruitment rate.
Chapter 3. Postconditioning in Acute Myocardial Infarction
127
From a protocol perspective this was well tolerated in the cath lab and the early MRI
scan was feasible and produced good quality data. With its excellent tissue
characterization and accurate evaluation of infarct size and area of MVO, CMR
should become the investigation of choice for such trials in the future. There is the
potential for inadvertent bias due to the fact that the interventionalist was not
blinded to whether the patient was either in the postconditioning or control arm. To
ameliorate this possible bias, analysis of ECG and blood enzyme levels as well as all
the CMR data collection and analysis were undertaken in a blinded fashion by
researchers who were unaware of the intervention received by the patient.
With the problems encountered in the recruitment of patients into the present study
together with the lack of any positive signal from the pre-‐specified interim analysis
and the publication of similar (albeit better powered) single-‐centre trials which also
failed to elicit a positive result, it was decided by the study steering committee that
it was not worth continuing with the present study for reasons of futility. Future
studies need to be directed in the form of multi-‐centre large trials to establish the
benefits of postconditioning using hard clinical endpoints, and possibly utilising less
invasive methods such as pharmacotherapy or remote postconditioning.
3.8 Conclusion
In this small, single-‐centre pilot we examined the role of postconditioning in
reducing infarct size in patients undergoing PPCI for acute ST-‐elevation MI. The study
was attenuated by slow recruitment and high drop-‐out rates and while a pre-‐
specified interim analysis suggested better tissue perfusion in the postconditioning
group as evidenced by better ST-‐segment resolution, there was no reduction in
infarct size or reduction in MVO as determined by cardiac enzyme release and CMR
imaging. These data need to be interpreted cautiously because of the lack of
statistical power.

Chapter 3. Postconditioning in Acute Myocardial Infarction
128
3.9 Acknowledgements
I would like to thank all the staff at St Thomas’ hospital cardiac catheterisation labs
and coronary care unit in particular for their support. I would also like to thank Dr
Chiribiri for his analysis of the MRI data and Prof Nagel and Dr. Plein for their
expertise in optimising the sequences. I am also grateful to all the interventional
consultants at St Thomas’, in particular Prof. Redwood and Dr. Perera and to Prof
Marber for his help in the conception and over-‐seeing of the study. I would also like
to thank the BHF for their funding for this project. Dr. Siobhan Crichton from the
Dept. of Medical Statistics, KCL, provided statistical support, in particular with
respect the sample size calculation.
129
4 K-‐T ACCELERATED MRI PERFUSION TO DETECT CORONARY
ISCHAEMIA
Tim Lockie1 , Masaki Ishida2 , Divaka Perera1 , Amedeo Chiribiri2 , Sebastian Kozerke2 ,
Mike Marber1 , Eike Nagel2 , Simon Redwood1 , Sven Plein2, 3
1Cardiovascular Research Division, The Rayne Institute, St Thomas’ Hospital, KCL, London UK
2Division Imaging Sciences, The Rayne Institute, St Thomas’ Hospital, KCL, London, UK
3 Academic Unit of Cardiovascular Medicine, University of Leeds, UK
Chapter 4. High Resolution MR Perfusion Imaging vs. FFR
130
4.1 Abstract
Background
Cardiac magnetic resonance (CMR) myocardial perfusion is an evolving technique for
the detection of significant coronary artery disease (CAD). New acquisition strategies
may enable high spatial resolution CMR perfusion images but requires further
clinical validation.
Objectives
To compare visual and quantitative analysis of high spatial resolution CMR perfusion
at 3 Tesla against fractional flow reserve (FFR) determined in the cath lab.
Methods and Results
42 patients (33 male, age 57.4±9.6 years) with known or suspected CAD underwent a
k-‐t SENSE accelerated adenosine-‐stress perfusion CMR scan at 3T achieving in-‐plane
spatial resolution of 1.2 x1.2 mm2. In the catheter laboratory, FFR was measured in
all vessels with >50% severity stenosis. FFR < 0.75 was considered haemodynamically
significant. 2 blinded observers visually interpreted the CMR data, which was further
fully quantified to determine the myocardial perfusion reserve (MPR). In total, 126
coronary territories were examined and 52 major vessels underwent pressure wire
assessment. Of these, 27 lesions had an FFR <0.75 and 25 lesions had an FFR ≥0.75.
Sensitivity and specificity of visual analysis of CMR perfusion to detect coronary
stenoses at a threshold of FFR <0.75 was 0.82 and 0.94 (p<0.0001) respectively with
an area under the curve (AUC) of 0.92 (p<0.0001). From quantitative analysis, the
optimum MPR to detect such lesions was 1.58 with a sensitivity of 0.80 and
specificity of 0.89 (p<0.0001) and an AUC 0.89 (p<0.0001).
Conclusions
High-‐resolution CMR perfusion MR at 3T accurately detects flow-‐limiting coronary
artery disease as defined by FFR, using both visual and quantitative analyses.

Chapter 4. High Resolution MR Perfusion Imaging vs. FFR
131
4.2 Background
Cardiac magnetic resonance (CMR) myocardial perfusion imaging offers great
potential for the non-‐invasive detection of myocardial ischaemia due to its high
resolution, lack of ionising radiation and additional tissue characterisation. Recent
studies have suggested a high degree of accuracy of CMR compared to other non-‐
invasive techniques156, 214. New CMR acquisition strategies that simultaneously take
advantage of coil encoding and spatiotemporal correlations, such as k-‐space and
time sensitivity encoding (k-‐t SENSE), allow considerable acceleration of CMR data
acquisition220. Such acceleration can be invested in further improved in-‐plane spatial
resolution approaching 1mm2. The introduction of 3 Tesla CMR scanners is a further
improvement in perfusion CMR due to the intrinsically high signal to noise ratio
(SNR) compared with 1.5 Tesla. Combined, high spatial resolution and high SNR at 3
Tesla may offer a step change in the performance of myocardial perfusion CMR.
High-‐resolution myocardial perfusion CMR at 3 Tesla has been proved accurate in
the detection of coronary disease as determined anatomically by a 50% stenosis on
the coronary angiogram223. However, coronary angiography alone is known to be
inaccurate in the determination of haemodynamically significant coronary disease218.
Fractional flow reserve (FFR) determined invasively by measuring the pressure
gradient across a coronary stenosis during hyperaemia correlates well with clinical
end points and non-‐invasive measures of ischaemia based on a dichotomous cut-‐off
of 0.75225, 326. FFR is highly reproducible under a range of haemodynamic conditions
and considered by many to be the “gold standard” to determine functionally
significant coronary stenoses that would benefit from revascularisation. To date
there have been no studies comparing the performance of high resolution CMR
myocardial perfusion CMR at 3 Tesla to FFR in the detection of haemodynamically
significant coronary stenosis.
Chapter 4. High Resolution MR Perfusion Imaging vs. FFR
132
4.3 Objectives
• To validate CMR k-‐t perfusion and quantification methods in a set of normal
volunteers
• To compare visual and quantitative analysis of high spatial resolution CMR
perfusion at 3 Tesla against fractional flow reserve (FFR) determined in the
catheterisation lab.
4.4 Methods
Ethics approval for the patient and volunteer studies was obtained from the local
ethics committee (REC Study No: 07/Q0704/16). As part of the consent process, all
patients were provided with an information sheet and signed a written consent
form.
4.4.1 Volunteer Recruitment
To validate the quantitative perfusion methods 8 normal subjects aged less than 40
years with no history of previous coronary artery disease and with no other
underlying medical problems or contraindications to CMR scanning were
approached and consented into the trial. They were asked to abstain from any
caffeine-‐containing products for 24 hours before the scan.
4.4.2 Patient Recruitment
Patients were selected who either had confirmed coronary artery disease and were
awaiting revascularisation, or those who had a high suspicion of coronary artery
disease and had been booked in for a coronary angiogram with a view to proceed if a
significant coronary stenosis was detected. Exclusion criteria for the study were
contraindications for CMR; known allergies or a contra-‐indication to Gd-‐chelates;
significant cardiac arrhythmia; pregnancy; previous myocardial infarction; previous
coronary artery bypass grafting (CABG); unstable angina pectoris (CCS IV) or acute

Chapter 4. High Resolution MR Perfusion Imaging vs. FFR
133
coronary syndrome (ACS); impaired LV function (EF<40%); asthma, or obstructive
pulmonary disease.
4.4.3 CMR Protocol
Myocardial perfusion CMR was performed on a 3T Philips Achieva® system using a 6
channel cardiac phased array receiver coil for signal reception and a
vectorcardiogram for triggering and gating. Subjects had a peripheral cannula
inserted in both antecubital fossae, one for administration of a contrast agent and
the other for the infusion of adenosine. All perfusion data were acquired in the true
short axis of the LV at end-‐inspiration to minimise respiratory artefacts. The
perfusion pulse sequence consisted of a saturation recovery gradient echo method
with a repetition time/echo time 3.0ms/1.0ms and flip angle 15°; 5x k-‐t SENSE
acceleration was used with 11 interleaved training profiles providing an effective
acceleration of 3.8x and a spatial resolution of 1.2x1.2x10mm3. 3 slices were
acquired at each RR interval. The first slice was acquired immediately following the
R-‐wave on the ECG. In order to acquire data during cardiac phases with minimal bulk
cardiac motion, mid-‐systole and mid-‐diastole were identified on cine images and the
trigger delays for slice two and three set so that acquisition occurred in these cardiac
phases. Data were acquired during adenosine-‐induced hyperaemia (140µg/kg/min)
and after a 15 minute delay at rest using a dose of 0.05mmol/kg Gd-‐DTPA
(Magnevist®, Shering, Germany) at a rate of 4ml/minute followed by a flush of 20ml
Saline. Blood pressure and heart rate were monitored throughout, as was the
subject’s response to adenosine to ensure that hyperaemic conditions were
achieved. In patients, standard dual inversion recovery late gadolinium
enhancement images were acquired after 15 minutes to ensure there were no
significant areas of scar that may interfere with the analysis.
4.4.4 Cardiac Catheterisation Lab Protocol In the cardiac catheterisation lab arterial access was secured in the right femoral
artery with a 6F sheath. A 7F sheath was inserted into the right femoral vein to
record right atrial pressure via a multipurpose catheter327. Diagnostic images were
taken using standard Judkins catheters in at least 2 orthogonal views to determine
Chapter 4. High Resolution MR Perfusion Imaging vs. FFR
134
the maximum visual vessel diameter stenosis. For PCI a guiding catheter was
inserted into the coronary ostium and 500μg nitrates were injected intracoronary to
ensure maximal dilatation of the epicardial vessel. A 0.014” coronary pressure
sensor-‐tipped wire (Volcano®) was passed into any vessel with a >50% diameter
stenosis. A vessel with a <50% diameter stenosis was not considered to be
haemodynamically significant. Fractional flow reserve (FFR) was measured in all
vessels with a >50% diameter stenosis and calculated as (Pd – Pv)/(Pa -‐ Pv), where Pa,
Pv and Pd are simultaneous aortic, right atrial and distal coronary pressures
measured during an intravenous infusion of adenosine at 140µg/kg/min. An FFR
reading of <0.75 was considered to be haemodynamically significant6. If serial
stenoses were present then a pullback was performed with the pressure wire and
the lowest FFR measurement was used. Following the FFR measurement the vessel
was then stented as appropriate at the discretion of the operator. Quantitative
coronary angiography (QCA) was calculated for all lesions using off-‐line software
(Medcon™) by an observer blinded to the FFR and CMR data.
4.4.5 CMR Perfusion Analysis
Visual analysis
In the patient cohort, 2 experienced observers blinded to the clinical background
undertook the analysis using a dedicated off-‐line analysis workstation (ViewForum®,
Philips Medical Systems). The LV myocardium was divided into 3 perfusion territories
correlating to each of the major coronary vessels (left anterior descending, LAD,
circumflex, Cx and right coronary artery, RCA) according to the modified
standardised nomenclature for tomographic imaging of the heart328. Defects were
reported for each perfusion territory by visual analysis using a scale from 0 to 3
(0=normal, 1=probably normal, 2=probably abnormal, 3=abnormal). Abnormal
perfusion was reported if contrast enhancement in a segment was delayed relative
to that of a remote segment, or if a transmural enhancement gradient was seen. If
any LGE was present then the observers identified only perfusion defects outside of
the areas of LGE. In case of disagreement, arbitration from a third observer was
sought.
Chapter 4. High Resolution MR Perfusion Imaging vs. FFR
135
Quantitative analysis
Data was analysed off-‐line by means of a commercially available dedicated software
package (MASS®, Medis, Leiden, the Netherlands) by two separate experienced
observers who were blinded to the results of the visual perfusion analysis and both
the coronary angiogram and FFR data. Subendocardial borders and subepicardial
borders were positioned on each slice with a region of interest (ROI) placed in the LV
cavity. The LV myocardium was divided into 6 equiangular segments per slice
according to the modified standardised nomenclature for tomographic imaging of
the heart9. Data generated in MASS were imported to a Fermi Function
deconvolution algorithm implemented in Matlab® (The MathWorksInc®, USA)196. The
Fermi deconvolution provided estimates of absolute myocardial blood flow
(ml/g/min) following correction for baseline and timing offsets between the input
and tissue response functions. Inter-‐and intra-‐observer variability was calculated.
Myocardial perfusion reserve (MPR) was calculated by dividing the peak stress flow
by resting flow. The segments were then assigned to the respective perfusion
territory9 and the mean value of the two lowest scoring segments for each perfusion
territory was used for further analysis. Although the observers were blinded to the
coronary angiogram and hence information relating to the dominance of the
coronary artery, if a large perfusion defect was present relating to a presumed
dominant RCA that spilled over into the segments assigned to the Cx artery then
these data were regarded as being within the RCA perfusion territory and vice-‐versa.
4.4.6 Statistical Analysis Continuous data were expressed as the mean ± standard deviation (SD). Group
means were compared using paired and unpaired Student t-‐test as appropriate.
Discrete data were expressed as percentages. Statistical significance was considered
for P<0.005. Receiver operating characteristic (ROC) analysis was used to determine
the diagnostic accuracy of visual analysis to detect haemodynamically significant
coronary stenoses with an FFR≤0.75 and also to determine the optimal myocardial
perfusion reserve (MPR) to determine significant coronary disease using a
dichotomous FFR cut-‐off of 0.75. Areas under the curve (AUCs) with 95% confidence
intervals (95% CI) were determined from ROC analysis and used to compare the
Chapter 4. High Resolution MR Perfusion Imaging vs. FFR
136
diagnostic accuracy of the two methods. Linear regression was used for correlation
of MPR with FFR and QCA, which were compared using Seiger’s Z-‐test. The inter-‐ and
intra-‐observer variability was calculated using the Cohen kappa (k) statistic for the
discrete visual analysis data and for the continuous quantitative analysis data
observers were compared using the method described by Bland and Altman329.
Coefficient of variability was calculated as standard deviation of differences between
the measurements divided by the mean value of the two observations or studies.
Because three coronary territories were examined per patient the intra-‐class
correlation coefficient (ICC) was calculated to determine the design effect and the
need to adjust these data for clustering 323. Statistical analysis, including generation
of the ROC curves was performed using SPSS (IBM®, Statistics, Version 19) software.
4.5 Results
4.5.1 Volunteer Studies In the 8 volunteers (6 male, 32 ±8.3 years) all subjects experienced mild, transient,
typical symptoms with the administration of adenosine suggesting adequate
hyperaemia. There were no complications from the adenosine. Full quantitative
analysis was possible with all studies. The MPR was 2.64±0.63 with a mean intra-‐
observer difference of 0.1±0.57 (p=0.68) and a coefficient of variability of 21%.
Inter-‐observer difference was 0.3±0.28 (p=0.13) with a coefficient of variability of
18%. Full results are shown in Table 7 below.
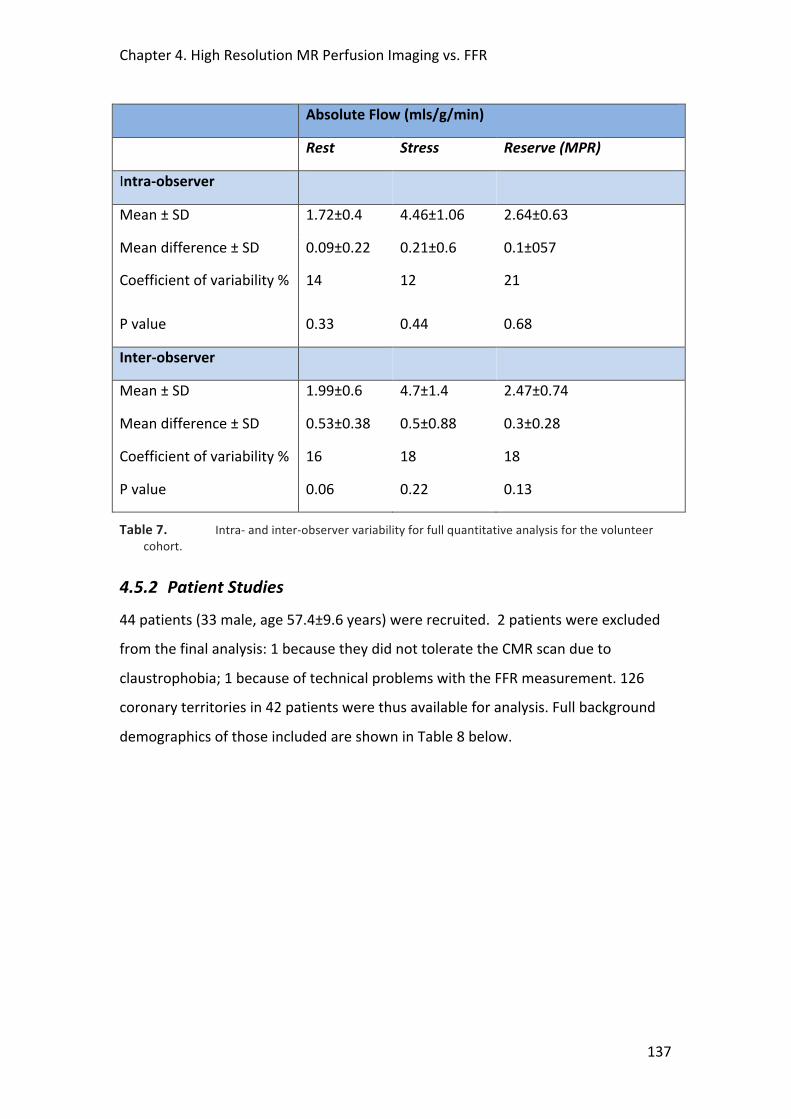
Chapter 4. High Resolution MR Perfusion Imaging vs. FFR
137
Absolute Flow (mls/g/min)
Rest Stress Reserve (MPR)
Intra-‐observer
Mean ± SD 1.72±0.4 4.46±1.06 2.64±0.63
Mean difference ± SD 0.09±0.22 0.21±0.6 0.1±057
Coefficient of variability % 14 12 21
P value 0.33 0.44 0.68
Inter-‐observer
Mean ± SD 1.99±0.6 4.7±1.4 2.47±0.74
Mean difference ± SD 0.53±0.38 0.5±0.88 0.3±0.28
Coefficient of variability % 16 18 18
P value 0.06 0.22 0.13
Table 7. Intra-‐ and inter-‐observer variability for full quantitative analysis for the volunteer cohort.
4.5.2 Patient Studies 44 patients (33 male, age 57.4±9.6 years) were recruited. 2 patients were excluded
from the final analysis: 1 because they did not tolerate the CMR scan due to
claustrophobia; 1 because of technical problems with the FFR measurement. 126
coronary territories in 42 patients were thus available for analysis. Full background
demographics of those included are shown in Table 8 below.

Chapter 4. High Resolution MR Perfusion Imaging vs. FFR
138
Parameter Data (n=42)
Male (%) 33 (78.6)
Age (years) 57.4±9.6
Previous PCI (%) 8 (19)
DM (%) 8 (19)
Previous stroke (%) 1 (2.3)
PVD (%) 3 (7.1)
Smoker (%) 9 (21.4)
Family history IHD (%) 11 (26.1)
Medications
• Statin (%) 31 (73.8)
• Betablocker (%) 20 (47.6)
• Aspirin (%) 35 (83.3)
• Clopidogrel (%) 22 (52.3)
• Nitrate (%) 17 (40.4)
• Calcium channel blocker (%) 10 (23.8)
Table 8. Baseline demographics of patient cohort. DM =diabetes melitus, PVD =peripheral vascular disease, LAD =left anterior descending artery, Cx =circumflex, RCA =right coronary artery, FFR =fractional flow reserve. Data presented as mean ±SD.
CMR Data
Resting BP (MAP mmHg) 78±11
Stress BP (MAP mmHg) 70±15
Resting HR (bpm) 71±15
Stress HR (bpm) 87±25
Scanning time (mins) 56±13
Late Gadolinium Enhancement (%)
• Full thickness
• Partial thickness
0 (0)
2 (4.7)
Adenosine symptoms 42 (100%)
Adenosine complications 0 (0)
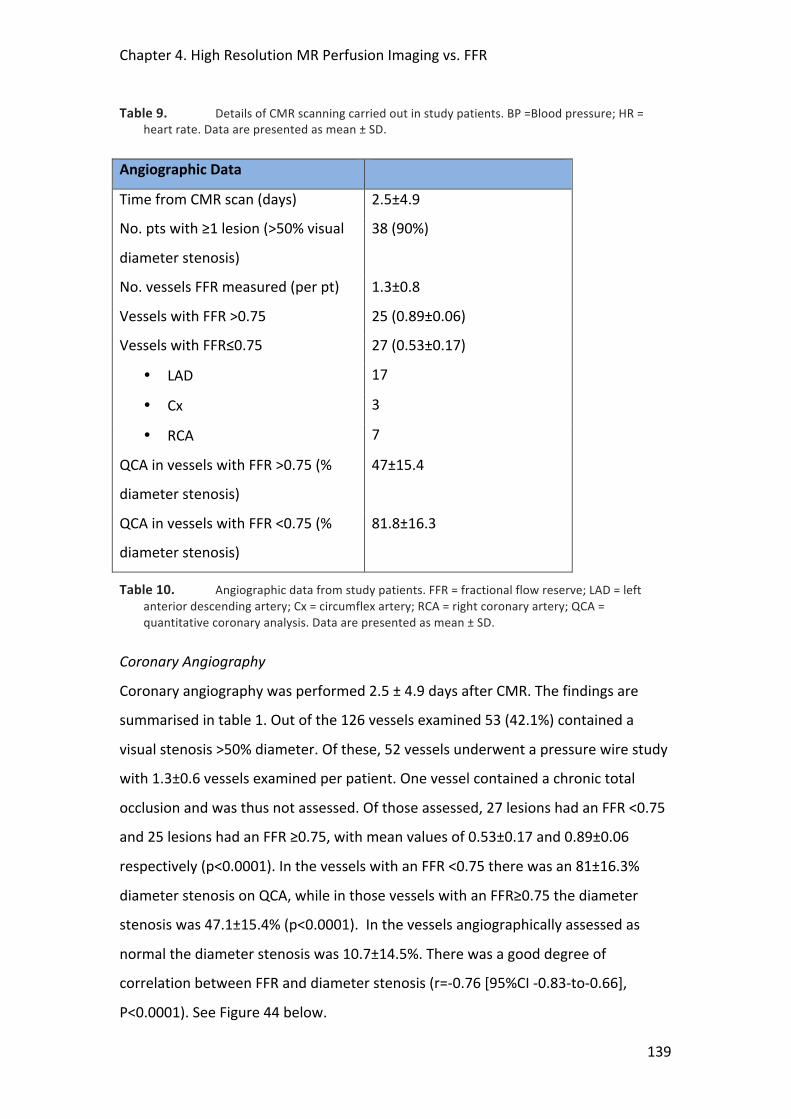
Chapter 4. High Resolution MR Perfusion Imaging vs. FFR
139
Table 9. Details of CMR scanning carried out in study patients. BP =Blood pressure; HR = heart rate. Data are presented as mean ± SD.
Angiographic Data
Time from CMR scan (days) 2.5±4.9
No. pts with ≥1 lesion (>50% visual
diameter stenosis)
38 (90%)
No. vessels FFR measured (per pt) 1.3±0.8
Vessels with FFR >0.75 25 (0.89±0.06)
Vessels with FFR≤0.75 27 (0.53±0.17)
• LAD 17
• Cx 3
• RCA 7
QCA in vessels with FFR >0.75 (%
diameter stenosis)
47±15.4
QCA in vessels with FFR <0.75 (%
diameter stenosis)
81.8±16.3
Table 10. Angiographic data from study patients. FFR = fractional flow reserve; LAD = left anterior descending artery; Cx = circumflex artery; RCA = right coronary artery; QCA = quantitative coronary analysis. Data are presented as mean ± SD.
Coronary Angiography
Coronary angiography was performed 2.5 ± 4.9 days after CMR. The findings are
summarised in table 1. Out of the 126 vessels examined 53 (42.1%) contained a
visual stenosis >50% diameter. Of these, 52 vessels underwent a pressure wire study
with 1.3±0.6 vessels examined per patient. One vessel contained a chronic total
occlusion and was thus not assessed. Of those assessed, 27 lesions had an FFR <0.75
and 25 lesions had an FFR ≥0.75, with mean values of 0.53±0.17 and 0.89±0.06
respectively (p<0.0001). In the vessels with an FFR <0.75 there was an 81±16.3%
diameter stenosis on QCA, while in those vessels with an FFR≥0.75 the diameter
stenosis was 47.1±15.4% (p<0.0001). In the vessels angiographically assessed as
normal the diameter stenosis was 10.7±14.5%. There was a good degree of
correlation between FFR and diameter stenosis (r=-‐0.76 [95%CI -‐0.83-‐to-‐0.66],
P<0.0001). See Figure 44 below.

Chapter 4. High Resolution MR Perfusion Imaging vs. FFR
140
Figure 44. Comparison of FFR and diameter stenosis (%) with reference lines indicating an FFR of 0.75 and diameter stenosis of 50%. Pearson correlation co-‐efficient was r=-‐0.76 [95%CI -‐0.83-‐to-‐0.66], P<0.0001) indicating a good degree of correlation.
CMR imaging
Mean scanning time was 56±13 minutes and all patients experienced mild, transient,
typical symptoms with the administration of adenosine. There were no
complications from the adenosine. There was an appropriate fall in the mean arterial
blood pressure (MAP) from 78±11mmHg to 70±15mmHg (p=0.001) and an increase
in heart rate from 71±10 beats per minute to 87±18 beats per minute (p<0.0001)
suggesting that adequate hyperaemia was achieved. 2 (4.7%) patients had evidence
of subendocardial scar based on the gadolinium late enhancement images; none had
evidence of full thickness transmural scar.
Visual Analysis vs. FFR
Perfusion was reported as abnormal for 30 coronary territories (23.8%) and normal
for 96 territories. Examples of normal and abnormal perfusion scans are shown in
Figure 45 below. The inter-‐observer reliability was k=0.79 [95% CI 0.69-‐0.91]
(p<0.0001). FFR in vessels with a visually detected perfusion defect was 0.59±0.22
and was 0.93±0.09 (p<0.0001) in those with visually normal perfusion. Conversely,
22 out of the 27 territories with an FFR<0.75 had a perfusion defect on visual CMR
analysis. 5 perfusion defects were reported in 99 vessels that were angiographically
normal or had an FFR ≥0.75. Sensitivity of CMR perfusion to detect coronary
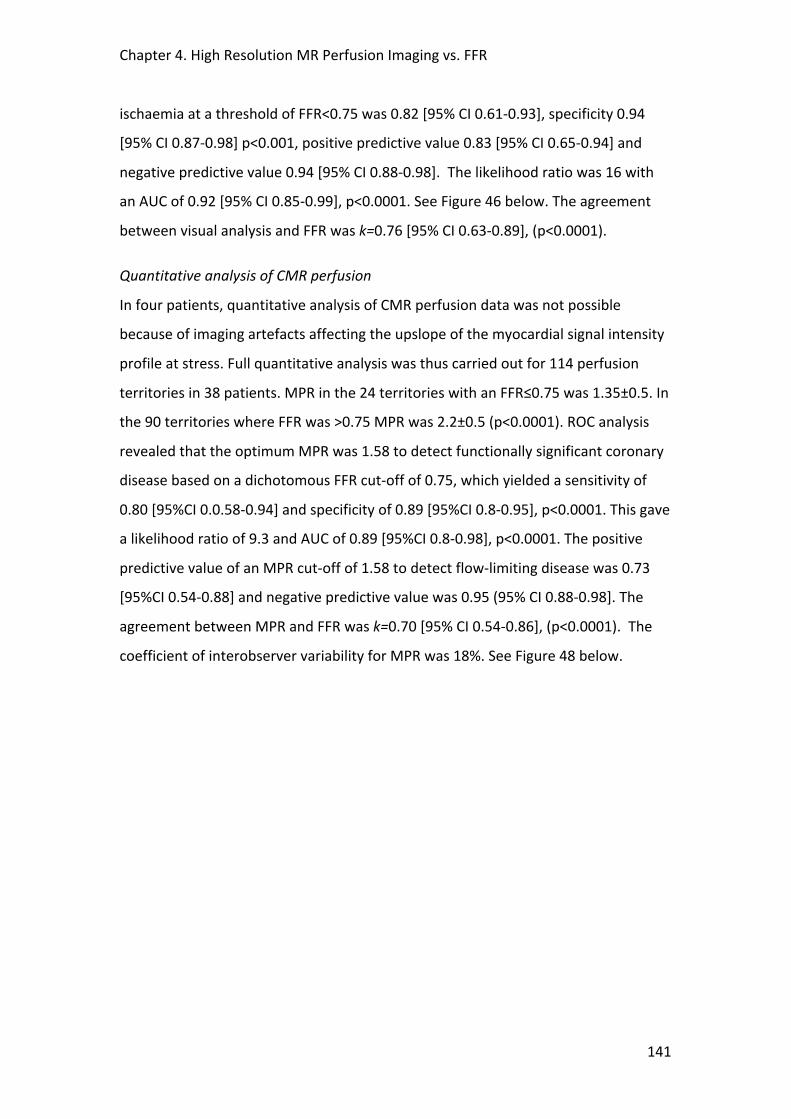
Chapter 4. High Resolution MR Perfusion Imaging vs. FFR
141
ischaemia at a threshold of FFR<0.75 was 0.82 [95% CI 0.61-‐0.93], specificity 0.94
[95% CI 0.87-‐0.98] p<0.001, positive predictive value 0.83 [95% CI 0.65-‐0.94] and
negative predictive value 0.94 [95% CI 0.88-‐0.98]. The likelihood ratio was 16 with
an AUC of 0.92 [95% CI 0.85-‐0.99], p<0.0001. See Figure 46 below. The agreement
between visual analysis and FFR was k=0.76 [95% CI 0.63-‐0.89], (p<0.0001).
Quantitative analysis of CMR perfusion
In four patients, quantitative analysis of CMR perfusion data was not possible
because of imaging artefacts affecting the upslope of the myocardial signal intensity
profile at stress. Full quantitative analysis was thus carried out for 114 perfusion
territories in 38 patients. MPR in the 24 territories with an FFR≤0.75 was 1.35±0.5. In
the 90 territories where FFR was >0.75 MPR was 2.2±0.5 (p<0.0001). ROC analysis
revealed that the optimum MPR was 1.58 to detect functionally significant coronary
disease based on a dichotomous FFR cut-‐off of 0.75, which yielded a sensitivity of
0.80 [95%CI 0.0.58-‐0.94] and specificity of 0.89 [95%CI 0.8-‐0.95], p<0.0001. This gave
a likelihood ratio of 9.3 and AUC of 0.89 [95%CI 0.8-‐0.98], p<0.0001. The positive
predictive value of an MPR cut-‐off of 1.58 to detect flow-‐limiting disease was 0.73
[95%CI 0.54-‐0.88] and negative predictive value was 0.95 (95% CI 0.88-‐0.98]. The
agreement between MPR and FFR was k=0.70 [95% CI 0.54-‐0.86], (p<0.0001). The
coefficient of interobserver variability for MPR was 18%. See Figure 48 below.
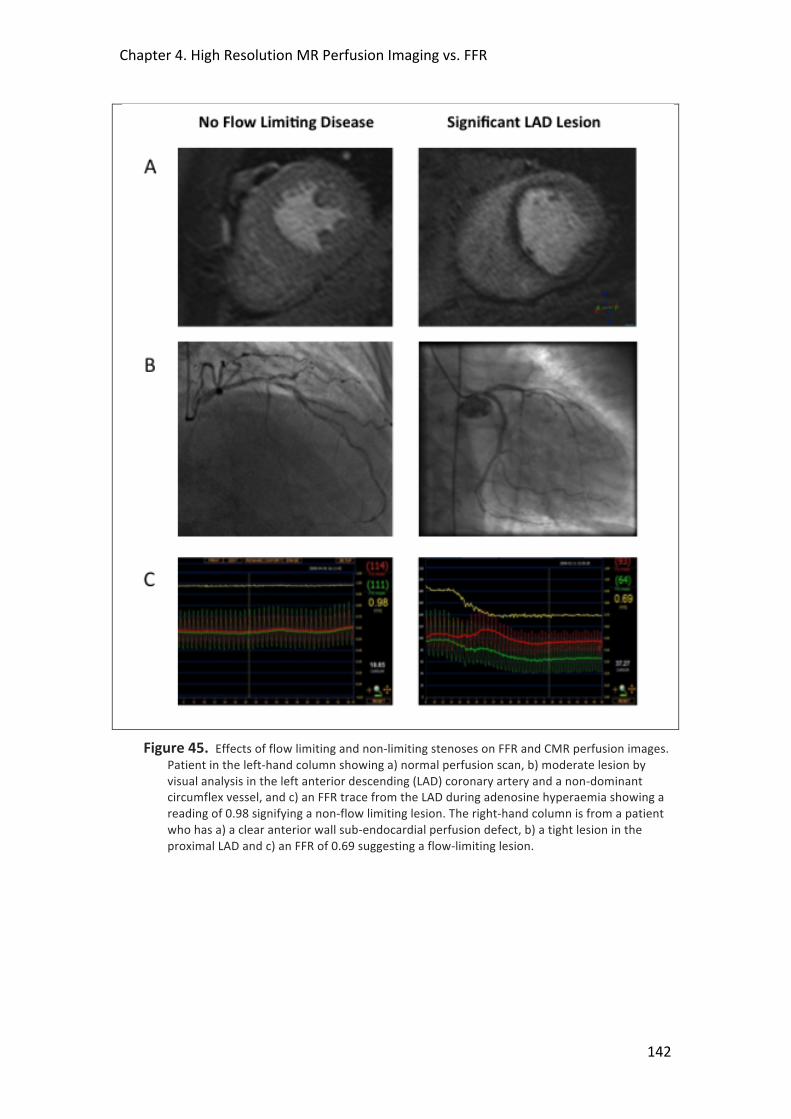
Chapter 4. High Resolution MR Perfusion Imaging vs. FFR
142
Figure 45. Effects of flow limiting and non-‐limiting stenoses on FFR and CMR perfusion images. Patient in the left-‐hand column showing a) normal perfusion scan, b) moderate lesion by visual analysis in the left anterior descending (LAD) coronary artery and a non-‐dominant circumflex vessel, and c) an FFR trace from the LAD during adenosine hyperaemia showing a reading of 0.98 signifying a non-‐flow limiting lesion. The right-‐hand column is from a patient who has a) a clear anterior wall sub-‐endocardial perfusion defect, b) a tight lesion in the proximal LAD and c) an FFR of 0.69 suggesting a flow-‐limiting lesion.
Chapter 4. High Resolution MR Perfusion Imaging vs. FFR
143
Figure 46. Receiver Operator Curve (ROC) showing the sensitivity and specificity of MR perfusion visual analysis to detect a haemodynamically significant coronary stenosis using a dichotomous value of 0.75 for fractional flow reserve (FFR). The area under the curve (AUC) was 0.922.
Figure 47. Receiver Operator Curve (ROC) showing the sensitivity and specificity of MPR to detect a haemodynamically significant coronary stenosis using a dichotomous value of 0.75 for fractional flow reserve (FFR). The area under the curve (AUC) was 0.89.

Chapter 4. High Resolution MR Perfusion Imaging vs. FFR
144
Figure 48. Scatter plot showing the distribution of MPR values according to FFR using a dichotomous cut-‐off of 0.75 to signify a significant lesion. The cut-‐off of 1.58 for the MPR has been marked that yielded the optimum sensitivity and specificity to detect a significant lesion as determined by FFR.
Linear Regression
Linear regression analysis showed a closer correlation between MPR and FFR (r=0.59
[95% CI 0.43-‐0.71] p<0.0001) than between MPR and QCA (r=-‐0.47 [95% CI -‐0.61—
0.29] p<0.0001), Z=4.73 (p<0.0001). ICC was low (r1= 0.03 [95% CI -‐0.19-‐0.771],
p=0.6) with a design effect D= 1.06 where cluster size m=3. See Figure 49 below.
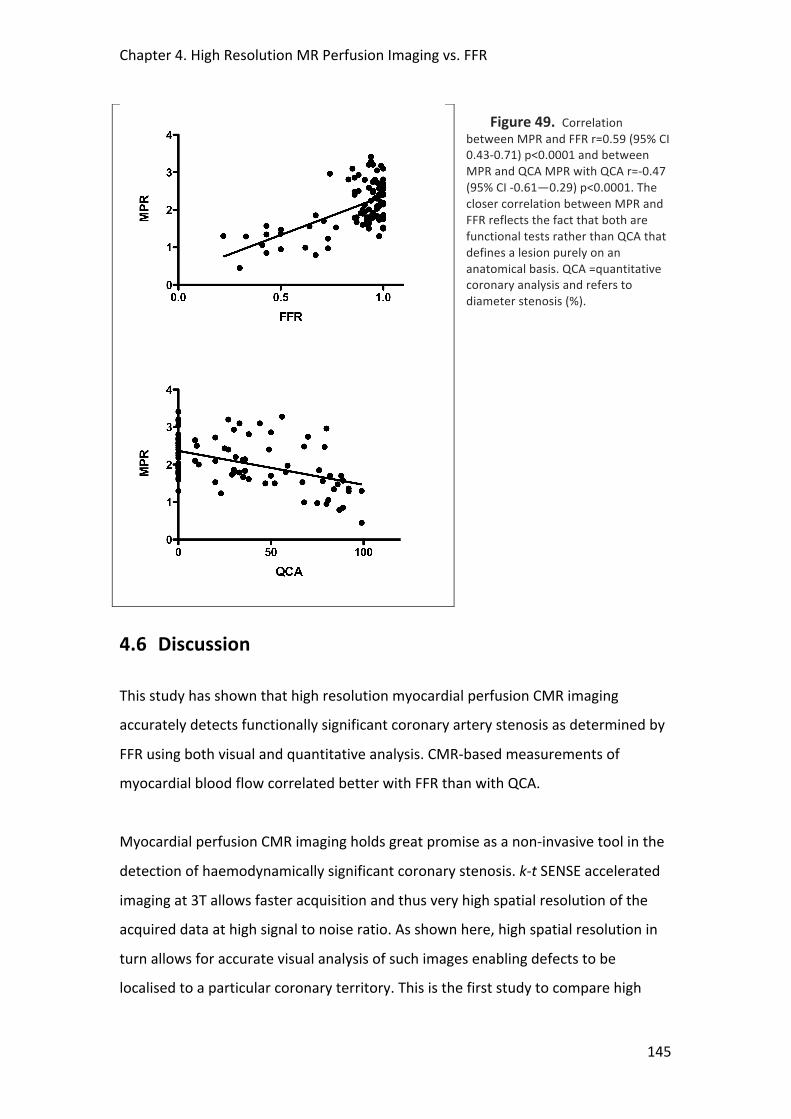
Chapter 4. High Resolution MR Perfusion Imaging vs. FFR
145
Figure 49. Correlation between MPR and FFR r=0.59 (95% CI 0.43-‐0.71) p<0.0001 and between MPR and QCA MPR with QCA r=-‐0.47 (95% CI -‐0.61—0.29) p<0.0001. The closer correlation between MPR and FFR reflects the fact that both are functional tests rather than QCA that defines a lesion purely on an anatomical basis. QCA =quantitative coronary analysis and refers to diameter stenosis (%).
4.6 Discussion
This study has shown that high resolution myocardial perfusion CMR imaging
accurately detects functionally significant coronary artery stenosis as determined by
FFR using both visual and quantitative analysis. CMR-‐based measurements of
myocardial blood flow correlated better with FFR than with QCA.
Myocardial perfusion CMR imaging holds great promise as a non-‐invasive tool in the
detection of haemodynamically significant coronary stenosis. k-‐t SENSE accelerated
imaging at 3T allows faster acquisition and thus very high spatial resolution of the
acquired data at high signal to noise ratio. As shown here, high spatial resolution in
turn allows for accurate visual analysis of such images enabling defects to be
localised to a particular coronary territory. This is the first study to compare high

Chapter 4. High Resolution MR Perfusion Imaging vs. FFR
146
resolution CMR perfusion with fractional flow reserve in the detection of functionally
significant lesions and it demonstrated that visual analysis of the data was able to
identify such lesions with a high degree of accuracy.
The acquired perfusion data were also suitable for full quantification with the MPR
obtained per coronary territory correlating well with the FFR measurements. ROC
analysis gave an optimal MPR cut-‐off value of 1.58 to discriminate accurately
between haemodynamically significant and non-‐significant lesions, which is
consistent with cut-‐off values from other studies using CMR perfusion imaging200, 330,
331. The majority of these other studies, however, used XCA to determine the lesion
severity. It has been discussed previously why a more functional test such as FFR to
assess lesion significance is preferable to using anatomically based endpoints alone.
The more discriminatory nature of FFR measurements is highlighted in figure 1 in the
present study where a significant proportion of the patients with a diameter stenosis
>50% had an FFR >0.75 and therefore represent false-‐positive results. This also
explains why MPR was found to correlate more closely with FFR than QCA (see figure
6), reflecting the fact that both are functional tests, rather than QCA that defines a
lesion on purely anatomical terms. Rieber et al assessed a standard CMR perfusion
sequence at 1.5T for the detection of FFR-‐determined coronary disease. A semi-‐
quantitative analysis of upslopes of the signal-‐intensity profiles in 43 patients yielded
a sensitivity and specificity of 88% and 90% respectively330. Visual analysis was not
performed. By comparison, Watkins et al used visual analysis of CMR perfusion alone
with FFR in the assessment of 103 CAD patients and were able to detect functionally
significant disease with similarly high accuracy217. In this later study 25% of the
patients had acute coronary syndromes and 23% had evidence of prior myocardial
infarction. Although FFR has been used in these settings332, 333 its applicability
remains uncertain and there are concerns about the necessary assumptions of
minimal microvascular resistance attained during hyperaemia230. In addition, the
presence of acutely injured myocardium or variable amounts of scar may have an
unpredictable effect on the visual interpretation of myocardial perfusion. For these
reasons, such patients were not included in the present study.
Chapter 4. High Resolution MR Perfusion Imaging vs. FFR
147
No previous study has compared visual and quantitative analysis of myocardial
perfusion CMR images. While visual analysis of CMR perfusion is widely used in
clinical practice and is quick and convenient, current methods to quantify myocardial
perfusion more objectively, either semi-‐ or fully quantitatively, although accurate
can be slow and time consuming. The Fermi deconvolution method used has been
validated with microsphere techniques and has been shown to be accurate and
reproducible10. In the present study, despite the potential limitations of an
optimised data under-‐sampling perfusion technique like k-‐t SENSE good quality data
were obtained that were amenable to such analysis with an acceptable degree of
inter-‐ and intra-‐observer variability which were similar to previously published
values334. In terms of diagnostic accuracy, both quantitative and visual analysis
yielded high diagnostic accuracy (AUC=0.89 vs. AUC=0.92, respectively) to detect
haemodynamically significant disease as determined by FFR. This probably reflects
the high quality of the visual images acquired with high spatial resolution and high
SNR. It is possible that temporal filtering effects may have rendered the quantitative
analysis less accurate. Such effects can be limited with recently proposed
improvements of the k-‐t method that were not available at the time this study was
performed335.
4.7 Study Limitations
Consistent with clinical practice, FFR was only measured in vessels with intermediate
coronary stenosis. We have studied a population with a very high prevalence of CAD
who were already listed for invasive studies so that our data need to be considered
preliminary and the reported accuracy is likely to represent a best-‐case scenario. The
applicability of our results to a population with a lower pre-‐test probability of
significant CAD needs to be determined, where the accuracy may well be lower.
Artefacts may be a problem with the k-‐t method due to respiratory or cardiac
motion and in 4 cases quantitative analysis was not possible because if this. Such
problems may be accentuated in patients with tachyarrhythmia or an inability to

Chapter 4. High Resolution MR Perfusion Imaging vs. FFR
148
breath hold for the scan. Because three perfusion territories were examined per
patient there is the potential for data loss through clustering. Although the design
effect of this was low due to a small ICC and cluster size, our results may have
overestimated data correlations.
4.8 Conclusions
In patients with stable coronary disease, high resolution CMR perfusion at 3 Tesla
detects haemodynamically significant coronary stenoses as determined by FFR with
a high degree of accuracy, using both visual and quantitative analysis methods.
Visual analysis may be an appropriate analysis strategy for the very high quality CMR
perfusion images that can be obtained today.
4.9 Acknowledgments
We thank H. Tang and E. Chung for their contributions to the CMR perfusion
quantitative analysis and the QCA analysis respectively. Dr. Siobhan Crichton from
the Dept. of Medical Statistics, KCL, provided statistical support.
149
5 SYNERGISTIC ADAPTATIONS TO EXERCISE IN THE
SYSTEMIC AND CORONARY CIRCULATIONS THAT UNDERLIE
WARM-‐UP ANGINA
T.P.E Lockie1, M.C Rolandi2, A. Guilcher3, D. Perera1, S. Plein MD4, 5, P. Chowienczyk3,
M. Siebes2, S.R Redwood1, M.S Marber1
1King's College London British Heart Foundation Centre of Excellence. The Rayne Institute, St Thomas’
Hospital Campus, London, UK; 2Dept Biomechanical Engineering, Academic Medical Centre,
Amsterdam, the Netherlands; 3Dept. Clinical Pharmacology, KCL, St Thomas’ Campus, London UK; 4
Division Imaging Sciences, The Rayne Institute, St Thomas’ Hospital, KCL, London, UK; 5Division of
Cardiovascular and Neuronal Remodeling, University of Leeds, UK and NIHR Comprehensive
Biomedical Research Centre at Guy’s and St Thomas’ NHS Foundation Trust.
Chapter 5. Synergistic Adaptations in Warm-‐up Angina
150
5.1 Abstract
Background
The mechanisms of reduced angina in patients with coronary arterial disease on
second exertion, also known as warm-‐up angina, are poorly understood. Adaptations
by the coronary and systemic circulations have been suggested but never
demonstrated in vivo. In this study we measured central and coronary
haemodynamics during serial exercise.
Methods and Results
16 patients (15 male, 61±4.3 yrs) with a positive exercise ECG and exertional angina
completed the protocol. During cardiac catheterisation via radial access they
performed 2 consecutive exertions (Ex1, Ex2) using a supine cycle ergometer.
Throughout exertions, distal coronary pressure and flow velocity were recorded in
the culprit vessel using a dual sensor wire whilst central aortic pressure was
recorded using a second wire. Patients achieved a similar workload in Ex2 but with
less ischaemia than in Ex1 (p<0.01). A 33% decline in aortic pressure augmentation in
Ex2 (p<0.0001) coincided with a reduction in tension time index (TTI), a major
determinant of LV afterload (p<0.001). Coronary stenosis resistance was unchanged.
A sustained reduction in coronary microvascular resistance resulted in augmented
coronary flow velocity on second exertion (both p<0.001). These changes were
accompanied by a 21% increase in the energy of the early diastolic coronary
backward-‐travelling expansion, or suction, wave on second exercise (p<0.001),
indicating improved microvascular conductance and enhanced LV relaxation.
Conclusions
On repeat exercise in patients with effort angina, synergistic changes in the systemic
and coronary circulations combine to improve vascular-‐ventricular coupling and
enhance myocardial perfusion, thereby contributing to the warm-‐up effect.
Chapter 5. Synergistic Adaptations in Warm-‐up Angina
151
5.2 Background
The variable relation between exercise and angina has been recognised for more
than 200 years2. The terms “first effort”, “warm-‐up”, or “first-‐hole” angina, have
been used to describe the ability of patients to exercise to angina, rest, and then
continue exertion with reduced symptoms100. In the experimental setting, the salient
observation is that at the accumulated external work causing maximum ST-‐segment
depression and chest pain on first exercise, on second exercise there is less ST
depression, chest pain and dysrhythmia101. During effort, coronary microvascular
resistance adapts to match the increase in coronary blood flow to the higher oxygen
consumption associated with the increase in heart rate69, 336. With the onset of effort
angina, the adaptation of the microvasculature is exhausted and resistance is
thought to be near minimal, beyond the culprit coronary stenosis37, 60. It is therefore
surprising that symptoms and signs of myocardial ischaemia can improve on second
effort. Thus, the phenomenon of warm-‐up angina was an enigma that attracted the
attention of early pioneers of physiological investigation in the cardiac
catheterisation laboratory101-‐104, 115, 140, 337. These early studies used relatively
insensitive techniques such as coronary sinus thermodilution to estimate coronary
blood flow and failed to reach a definitive conclusion. More recently, the warm up
phenomenon was proposed to be a manifestation of ischaemic preconditioning109,
but this theory was refuted by subsequent studies116, 338. Most recently, it has been
suggested that warm up results from reduction in the overall amplitude of the
central aortic pressure waveform that has been documented following exercise in
healthy volunteers88, 339. However such changes, while reducing afterload, would be
expected to compromise myocardial perfusion in the presence of a flow-‐limiting
coronary stenosis through a reduction in the coronary driving pressure.
Warm-‐up angina is not a mere intellectual curiosity since it is observed in patients
taking standard anti-‐anginal medication98, 102 and reduces ischaemic dysrhythmia as
well as chest discomfort and ST segment depression97. Therefore, if its underlying
mechanism could be better understood and mimicked, further therapeutic strategies
could be developed.
Chapter 5. Synergistic Adaptations in Warm-‐up Angina
152
The purpose of the present study was to clarify these controversies by invasive
measurement of aortic pressure and distal coronary pressure and flow velocity
during serial exertion in patients with coronary artery disease causing angina.
5.3 Methods
5.3.1 Study Patients 27 Patients were recruited from routine waiting lists for percutaneous coronary
intervention (PCI) with symptoms of exertional angina pectoris and a positive
exercise treadmill stress test (ETT). Exclusion criteria were unstable symptoms,
previous myocardial infarction/CABG, impaired left ventricular (LV) function, severe
co-‐morbidities, paced rhythm or bundle branch block on ECG or inability to
undertake exercise. Patients with chronic total occlusions or significant visible
collateral vessels (Rentrop Class 3+) were not included. Oral nitrate preparations,
calcium channel blockers and beta-‐blockers were stopped at least 48 hours before
the procedure.
5.3.2 Catheter laboratory protocol A specially adapted supine cycle ergometer (Ergosana®, Germany) that allows a
standardized incremental increase in workload was attached to the catheter lab
table. Patients were catheterized via the right radial artery using a standard 6F
arterial sheath. Weight adjusted heparin was administered (70u/kg) intra-‐arterial.
Right and left coronary angiograms were then taken using standard diagnostic
catheters. Intracoronary nitrates were not used. A standard 6F-‐guiding catheter was
then introduced and positioned in the aortic root. A dual sensor pressure-‐velocity
0.014” intracoronary wire (Combowire®, Volcano Corp.®, USA)240 was then
connected to the ComboMap® console (Volcano® Corp. USA) and positioned at the
tip of the guide. A single sensor 0.014” pressure wire (Brightwire®, Volcano Corp.®,
USA) was connected to the ComboMap via an analogue transducer (SmartMap®,
Volcano Corp. ®, USA) to provide a high fidelity pressure signal (Pa) that was
normalized against aortic pressure measured through the guiding catheter. The
pressure wire was then positioned alongside the Combowire at the tip of the guide
Chapter 5. Synergistic Adaptations in Warm-‐up Angina
153
and the pressure (Pd) on the Combowire was normalized to the pressure wire signal.
The guide was then inserted into the coronary ostium and the Combowire advanced
distal to the stenosis in the target coronary artery and manipulated until a good
Doppler velocity trace was obtained. At this point, the guide was disengaged and the
pressure wire was passed into the aortic root and a stable pressure signal obtained.
All signals were sampled at 200 Hz and stored on disk for off-‐line analysis. The data
were imported into the custom-‐made Studymanager program (Academic Medical
Center, University of Amsterdam, The Netherlands) and 20 consecutive beats
showing good velocity signals were extracted from each minute of exercise and
recovery. Averaged signals over each of these time periods were used in further
analyses.
5.3.3 Exercise protocol Once wires were in place with good quality and stable signals, baseline
measurements were taken before the patient underwent 2 periods of exercise. The
exercise protocol was a standardized incremental programme340 based on the
patient’s weight and age, typically starting at 25W and increasing by 20W each
minute. Exercise was continued until any of the following occurred, 1) ST depression
>3mm, 2) maximal age-‐related heart rate, 3) severe chest pain, 4) physical
exhaustion, 5) occurrence of detrimental effects such as hypotension, severe
arrhythmia or dyspnoea. Coronary flow velocity and pressure, ECG, and central
arterial pressure signals were recorded continuously throughout exercise and
recovery. After 5 minutes of recovery, or after resting measurements approached
baseline, the exercise protocol was repeated. At the end of the study protocol the
patient underwent their planned percutaneous revascularization procedure. The full
experimental protocol is illustrated in Figure 50 below.

Chapter 5. Synergistic Adaptations in Warm-‐up Angina
154
Figure 50. Summary of catheterisation lab exercise protocol.
5.3.4 Ethics The study protocol was approved by the local research ethics committee
(08/H0802/136) and all participants were provided a detailed information sheet
prior to obtaining informed consent.
5.3.5 Data Analysis All patients had continuous 12-‐lead ECG monitoring throughout exercise that was
analyzed in a blinded fashion, off-‐line. The exercise test was considered positive at
first appearance of 1mm (0.1 mV) ST-‐segment depression (STD) 80ms after the J
point compared with the resting ECG just prior to exercise. The time of onset of ECG
changes signifying exercise test positivity and the corresponding heart rate-‐central
systolic blood pressure product (RPP) were noted.
Central arterial pressure waveforms were obtained from the pressure sensor-‐tipped
guide wire positioned in the aortic root. A typical aortic pressure waveform is shown
in Figure 51A. Pulse wave analysis was performed using custom-‐made programs
(Matlab™ ,The MathWorksInc®, USA). Augmentation index (AI), a measure of central
systolic blood pressure augmentation thought to arise from pressure-‐wave
reflection, was calculated as the difference between the second (P2) and first (P1)
peaks expressed as a percentage of the pulse pressure (PP). Timing of the reflected
pressure wave (TR) was determined as the time between the foot of the pressure
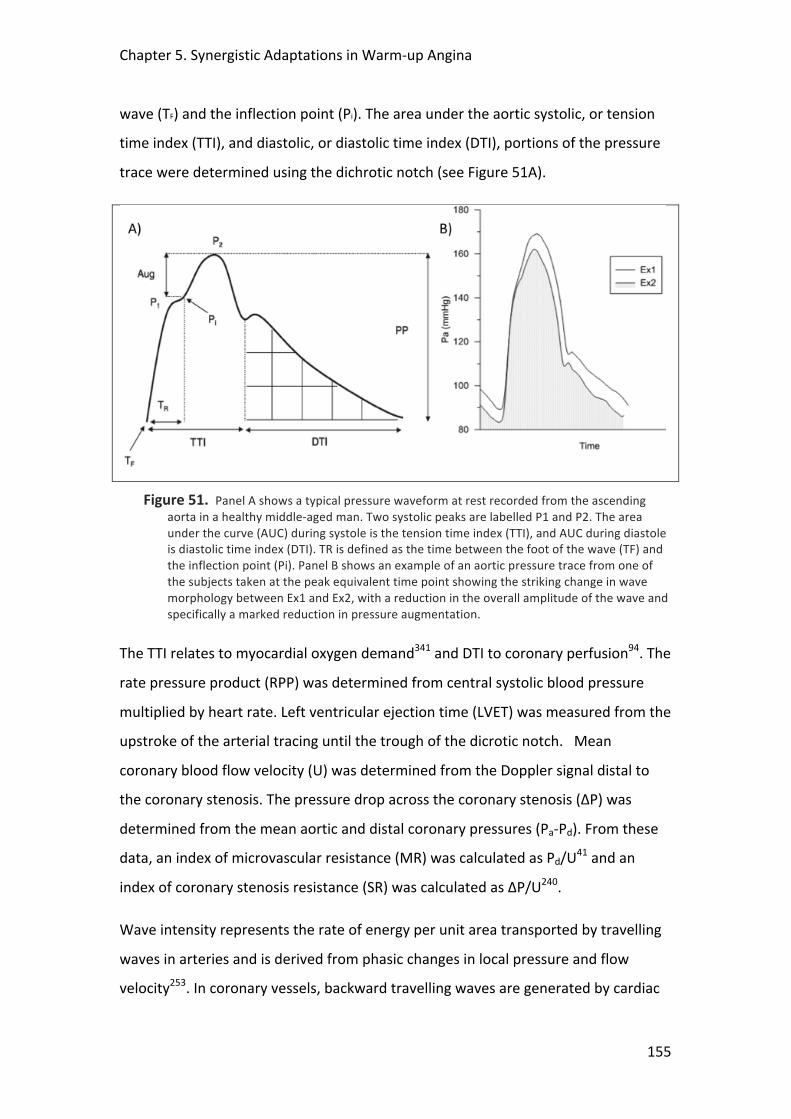
Chapter 5. Synergistic Adaptations in Warm-‐up Angina
155
wave (TF) and the inflection point (Pi). The area under the aortic systolic, or tension
time index (TTI), and diastolic, or diastolic time index (DTI), portions of the pressure
trace were determined using the dichrotic notch (see Figure 51A).
Figure 51. Panel A shows a typical pressure waveform at rest recorded from the ascending aorta in a healthy middle-‐aged man. Two systolic peaks are labelled P1 and P2. The area under the curve (AUC) during systole is the tension time index (TTI), and AUC during diastole is diastolic time index (DTI). TR is defined as the time between the foot of the wave (TF) and the inflection point (Pi). Panel B shows an example of an aortic pressure trace from one of the subjects taken at the peak equivalent time point showing the striking change in wave morphology between Ex1 and Ex2, with a reduction in the overall amplitude of the wave and specifically a marked reduction in pressure augmentation.
The TTI relates to myocardial oxygen demand341 and DTI to coronary perfusion94. The
rate pressure product (RPP) was determined from central systolic blood pressure
multiplied by heart rate. Left ventricular ejection time (LVET) was measured from the
upstroke of the arterial tracing until the trough of the dicrotic notch. Mean
coronary blood flow velocity (U) was determined from the Doppler signal distal to
the coronary stenosis. The pressure drop across the coronary stenosis (ΔP) was
determined from the mean aortic and distal coronary pressures (Pa-‐Pd). From these
data, an index of microvascular resistance (MR) was calculated as Pd/U41 and an
index of coronary stenosis resistance (SR) was calculated as ΔP/U240.
Wave intensity represents the rate of energy per unit area transported by travelling
waves in arteries and is derived from phasic changes in local pressure and flow
velocity253. In coronary vessels, backward travelling waves are generated by cardiac
Chapter 5. Synergistic Adaptations in Warm-‐up Angina
156
contraction and relaxation at the downstream end, and forward travelling waves
arise from changes in aortic pressure at the inlet245, 254, 342. Coronary wave intensity
hence reflects the interactive effects of cardiac mechanics and coronary
conductance on coronary haemodynamics342. Wave intensity analysis was
performed using custom-‐made software (Delphi, Embarcadero, San Francisco). The
distal pressure and velocity signals were smoothed with a Savitzky-‐Golay filter to
reduce signal noise343. Net coronary wave intensity (dI) was calculated from the
time-‐derivatives of ensemble-‐averaged coronary pressure and flow velocity as dI=
dPd/dt x dU/dt245, 253. Since the aim was to examine coronary perfusion during
exercise, and coronary blood flow is predominantly diastolic, we focused our
investigation on the flow-‐accelerating wave at the onset of diastole, the so-‐called
backward expansion wave (BEW); generated by relaxation of the myocardium that
sucks blood back into microvascular space245, 342. The energy carried by the BEW (in
J.m-‐2.sec-‐2 x10³) was obtained by the area under the wave and normalized for the
sampling interval. The investigators who performed the data analyses were blinded
to the sequence of the exercise tests and to the coronary anatomy.
5.3.6 Statistical Analysis Continuous data are presented as means ± SEM. The study was powered to ensure
there were a sufficient number of patients to observe a robust warm up effect on
second, compared to first, exertion. This was required as a firm foundation from
which to observe associated hemodynamic change. The calculation was based on
paired t-‐tests within subjects, using an anticipated difference of 50 seconds between
Ex1 compared to Ex2, with a standard deviation of 27, based on previous research97.
This gave a sample size of 15 subjects with complete data to achieve 99% power with
a probability of a Type 1 error of 0.001. We felt it necessary to achieve at least this
level of power since it was likely multiple hemodynamic variables contributed to the
warm up effect and their variance was possibly greater than that of the ST-‐segment.
Paired Student’s t-‐tests were used as indicated. Systemic and coronary parameters
were compared between the first and second exertions sessions at each of 4
common time points: baseline (tbaseline), 1 minute (t1min), 50% of time to peak RPP
(t50%) and time of peak RPP (tpeak) during first exertion. Repeated measures analysis
Chapter 5. Synergistic Adaptations in Warm-‐up Angina
157
of variance (ANOVA) with 2 within-‐subject factors (exercise and time) were used to
compare the common time points between exercise exertions and evaluate the main
time trends across exercise periods (IBM® SPSS® Statistics, Version 19). If the overall
test for the main effect of exercise exertion reached significance in the ANOVA, we
evaluated each separate time point with paired t-‐tests. We did not apply any
correction for multiple comparisons, in order to reduce the chance of missing
significant associations in this exploratory study (Type II error)344. The sphericity
assumption, which equates to a compound symmetry correlation structure, was
used with the repeated measures ANOVA (IBM® SPSS® Statistics, Version 19).
Mauchly’s test of sphericity was used to confirm the sphericity assumption.
Relationships between variables were investigated with the Pearson correlation
coefficient. P-‐values were two-‐sided and values of p<0.05 were considered
significant.
5.4 Results
Out of 27 patients who were consented into the study 16 (15 male, aged 61±8.9
years old) successfully completed the full protocol. Reasons for exclusion were: 4
were found to have left main stem or severe 3-‐vessel disease on initial angiography;
2 were found to have chronic total occlusions; in 2 patients radial arterial access was
unsuccessful; 1 patient developed RBBB during exercise (precluding ECG analysis); 1
patient was unable to cycle; 1 patient developed myocardial ischaemia very early
during first exertion and the ECG was slow to return to baseline. Full background
demographics and procedural details are shown in Table 11.
Patients exercised for 382±27 seconds during exertion 1 (Ex1) and for 405±28
seconds during exertion 2 (Ex2), p=0.08. The details of exercise performance are
summarized in Table 13 below. The maximum external workload attained was
similar for both efforts. 15 out of the 16 patients (93%) reached 1mm ST-‐segment
depression (STD) during both periods of exercise. Time to 1mm STD was 53±14
seconds longer in Ex2 than Ex1 (p=0.003) confirming warm-‐up. In addition, the rate
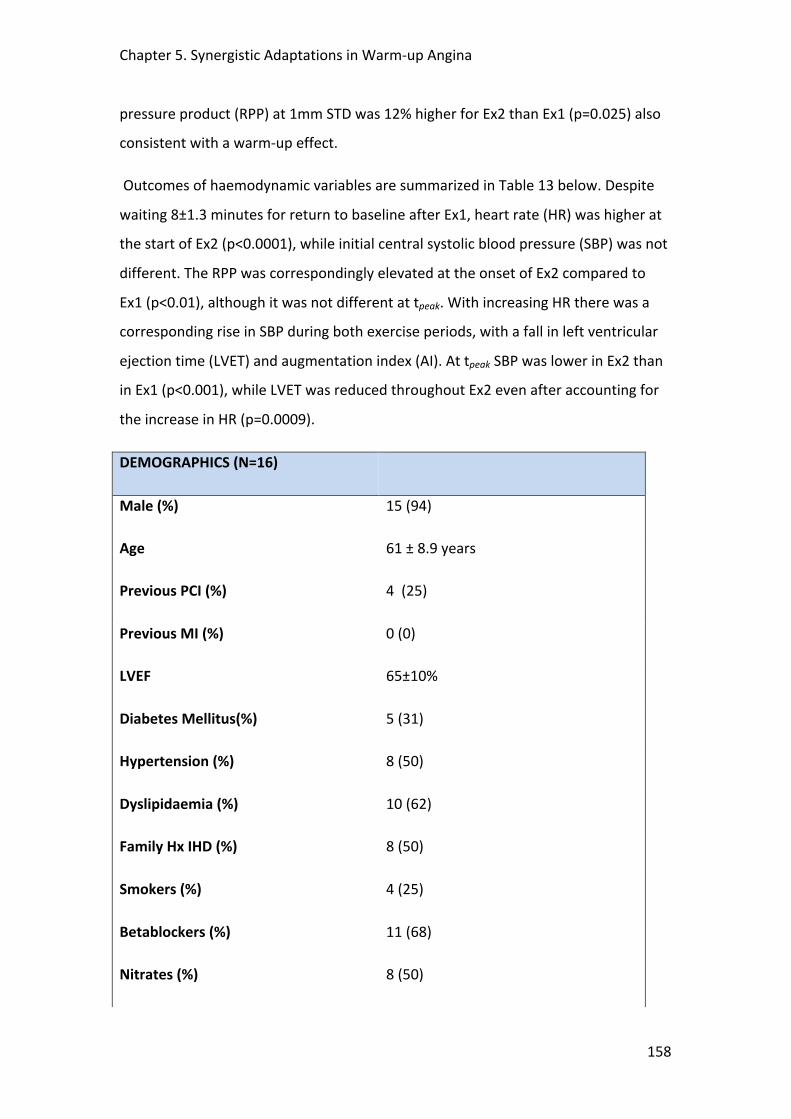
Chapter 5. Synergistic Adaptations in Warm-‐up Angina
158
pressure product (RPP) at 1mm STD was 12% higher for Ex2 than Ex1 (p=0.025) also
consistent with a warm-‐up effect.
Outcomes of haemodynamic variables are summarized in Table 13 below. Despite
waiting 8±1.3 minutes for return to baseline after Ex1, heart rate (HR) was higher at
the start of Ex2 (p<0.0001), while initial central systolic blood pressure (SBP) was not
different. The RPP was correspondingly elevated at the onset of Ex2 compared to
Ex1 (p<0.01), although it was not different at tpeak. With increasing HR there was a
corresponding rise in SBP during both exercise periods, with a fall in left ventricular
ejection time (LVET) and augmentation index (AI). At tpeak SBP was lower in Ex2 than
in Ex1 (p<0.001), while LVET was reduced throughout Ex2 even after accounting for
the increase in HR (p=0.0009).
DEMOGRAPHICS (N=16)
Male (%) 15 (94)
Age 61 ± 8.9 years
Previous PCI (%) 4 (25)
Previous MI (%) 0 (0)
LVEF 65±10%
Diabetes Mellitus(%) 5 (31)
Hypertension (%) 8 (50)
Dyslipidaemia (%) 10 (62)
Family Hx IHD (%) 8 (50)
Smokers (%) 4 (25)
Betablockers (%) 11 (68)
Nitrates (%) 8 (50)
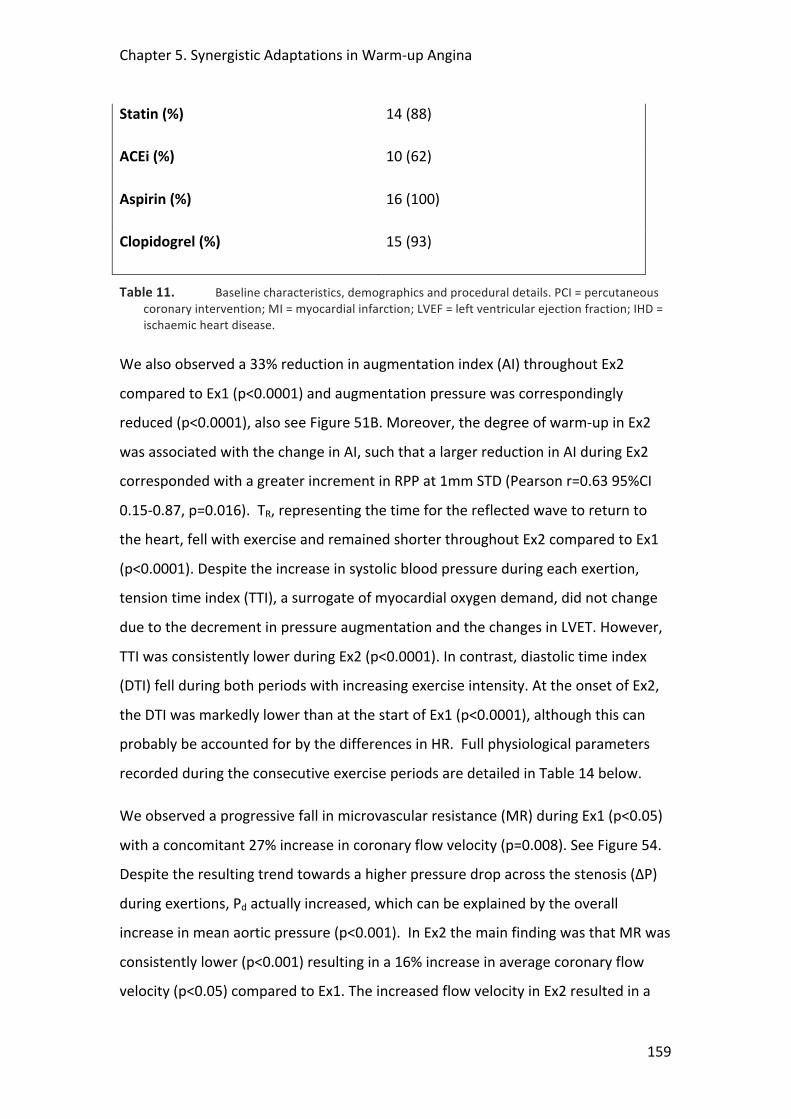
Chapter 5. Synergistic Adaptations in Warm-‐up Angina
159
Statin (%) 14 (88)
ACEi (%) 10 (62)
Aspirin (%) 16 (100)
Clopidogrel (%) 15 (93)
Table 11. Baseline characteristics, demographics and procedural details. PCI = percutaneous coronary intervention; MI = myocardial infarction; LVEF = left ventricular ejection fraction; IHD = ischaemic heart disease.
We also observed a 33% reduction in augmentation index (AI) throughout Ex2
compared to Ex1 (p<0.0001) and augmentation pressure was correspondingly
reduced (p<0.0001), also see Figure 51B. Moreover, the degree of warm-‐up in Ex2
was associated with the change in AI, such that a larger reduction in AI during Ex2
corresponded with a greater increment in RPP at 1mm STD (Pearson r=0.63 95%CI
0.15-‐0.87, p=0.016). TR, representing the time for the reflected wave to return to
the heart, fell with exercise and remained shorter throughout Ex2 compared to Ex1
(p<0.0001). Despite the increase in systolic blood pressure during each exertion,
tension time index (TTI), a surrogate of myocardial oxygen demand, did not change
due to the decrement in pressure augmentation and the changes in LVET. However,
TTI was consistently lower during Ex2 (p<0.0001). In contrast, diastolic time index
(DTI) fell during both periods with increasing exercise intensity. At the onset of Ex2,
the DTI was markedly lower than at the start of Ex1 (p<0.0001), although this can
probably be accounted for by the differences in HR. Full physiological parameters
recorded during the consecutive exercise periods are detailed in Table 14 below.
We observed a progressive fall in microvascular resistance (MR) during Ex1 (p<0.05)
with a concomitant 27% increase in coronary flow velocity (p=0.008). See Figure 54.
Despite the resulting trend towards a higher pressure drop across the stenosis (ΔP)
during exertions, Pd actually increased, which can be explained by the overall
increase in mean aortic pressure (p<0.001). In Ex2 the main finding was that MR was
consistently lower (p<0.001) resulting in a 16% increase in average coronary flow
velocity (p<0.05) compared to Ex1. The increased flow velocity in Ex2 resulted in a
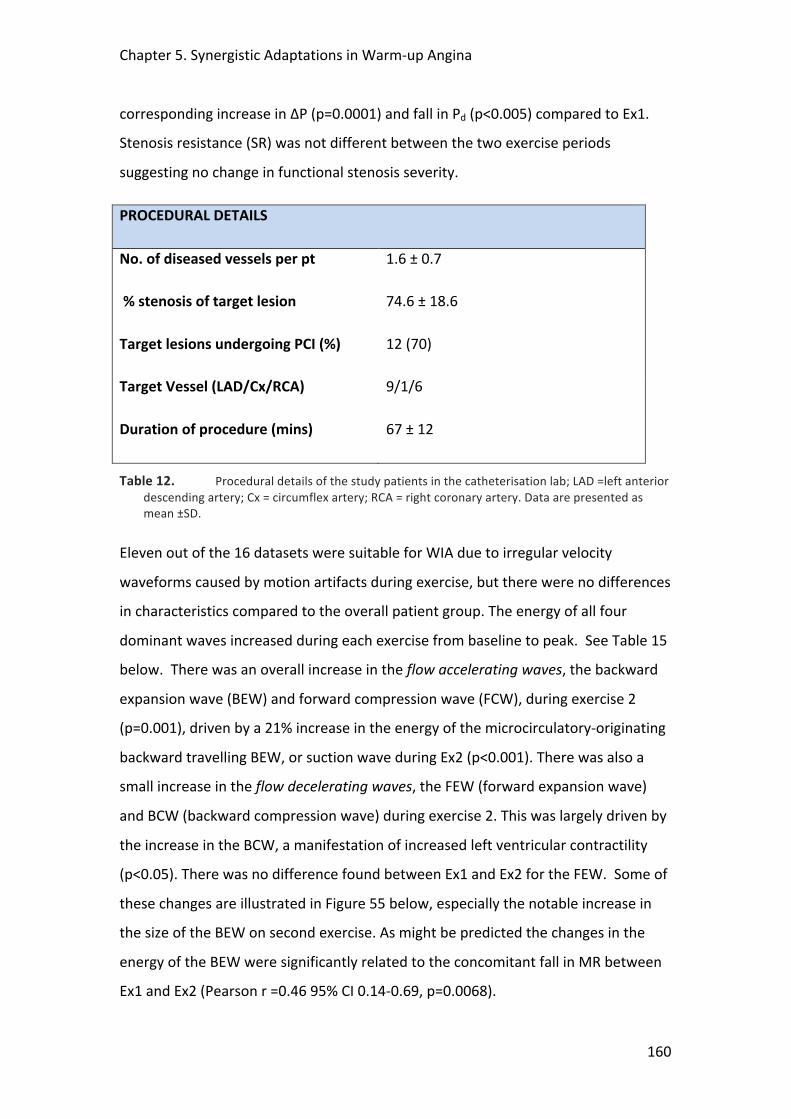
Chapter 5. Synergistic Adaptations in Warm-‐up Angina
160
corresponding increase in ΔP (p=0.0001) and fall in Pd (p<0.005) compared to Ex1.
Stenosis resistance (SR) was not different between the two exercise periods
suggesting no change in functional stenosis severity.
PROCEDURAL DETAILS
No. of diseased vessels per pt 1.6 ± 0.7
% stenosis of target lesion 74.6 ± 18.6
Target lesions undergoing PCI (%) 12 (70)
Target Vessel (LAD/Cx/RCA) 9/1/6
Duration of procedure (mins) 67 ± 12
Table 12. Procedural details of the study patients in the catheterisation lab; LAD =left anterior descending artery; Cx = circumflex artery; RCA = right coronary artery. Data are presented as mean ±SD.
Eleven out of the 16 datasets were suitable for WIA due to irregular velocity
waveforms caused by motion artifacts during exercise, but there were no differences
in characteristics compared to the overall patient group. The energy of all four
dominant waves increased during each exercise from baseline to peak. See Table 15
below. There was an overall increase in the flow accelerating waves, the backward
expansion wave (BEW) and forward compression wave (FCW), during exercise 2
(p=0.001), driven by a 21% increase in the energy of the microcirculatory-‐originating
backward travelling BEW, or suction wave during Ex2 (p<0.001). There was also a
small increase in the flow decelerating waves, the FEW (forward expansion wave)
and BCW (backward compression wave) during exercise 2. This was largely driven by
the increase in the BCW, a manifestation of increased left ventricular contractility
(p<0.05). There was no difference found between Ex1 and Ex2 for the FEW. Some of
these changes are illustrated in Figure 55 below, especially the notable increase in
the size of the BEW on second exercise. As might be predicted the changes in the
energy of the BEW were significantly related to the concomitant fall in MR between
Ex1 and Ex2 (Pearson r =0.46 95% CI 0.14-‐0.69, p=0.0068).
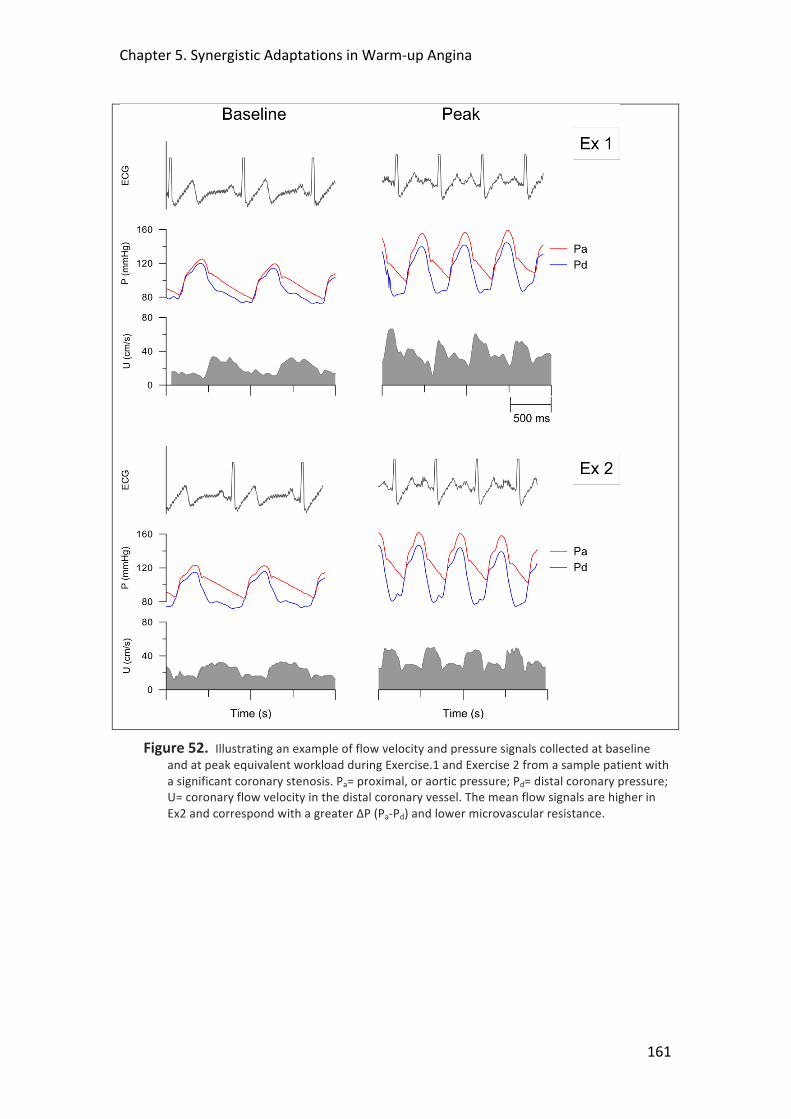
Chapter 5. Synergistic Adaptations in Warm-‐up Angina
161
Figure 52. Illustrating an example of flow velocity and pressure signals collected at baseline and at peak equivalent workload during Exercise.1 and Exercise 2 from a sample patient with a significant coronary stenosis. Pa= proximal, or aortic pressure; Pd= distal coronary pressure; U= coronary flow velocity in the distal coronary vessel. The mean flow signals are higher in Ex2 and correspond with a greater ΔP (Pa-‐Pd) and lower microvascular resistance.
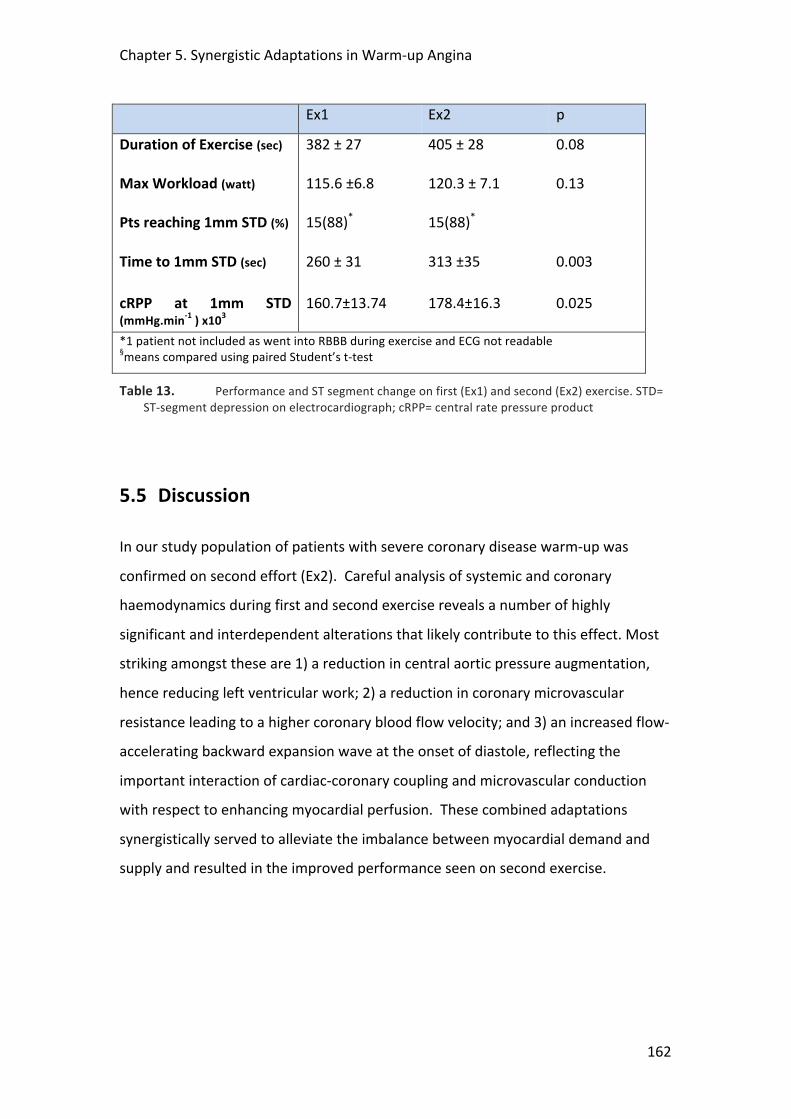
Chapter 5. Synergistic Adaptations in Warm-‐up Angina
162
Ex1 Ex2 p
Duration of Exercise (sec) 382 ± 27
405 ± 28
0.08
Max Workload (watt) 115.6 ±6.8 120.3 ± 7.1
0.13
Pts reaching 1mm STD (%) 15(88)* 15(88)*
Time to 1mm STD (sec) 260 ± 31
313 ±35
0.003
cRPP at 1mm STD (mmHg.min-‐1 ) x103
160.7±13.74
178.4±16.3
0.025
*1 patient not included as went into RBBB during exercise and ECG not readable §means compared using paired Student’s t-‐test
Table 13. Performance and ST segment change on first (Ex1) and second (Ex2) exercise. STD= ST-‐segment depression on electrocardiograph; cRPP= central rate pressure product
5.5 Discussion
In our study population of patients with severe coronary disease warm-‐up was
confirmed on second effort (Ex2). Careful analysis of systemic and coronary
haemodynamics during first and second exercise reveals a number of highly
significant and interdependent alterations that likely contribute to this effect. Most
striking amongst these are 1) a reduction in central aortic pressure augmentation,
hence reducing left ventricular work; 2) a reduction in coronary microvascular
resistance leading to a higher coronary blood flow velocity; and 3) an increased flow-‐
accelerating backward expansion wave at the onset of diastole, reflecting the
important interaction of cardiac-‐coronary coupling and microvascular conduction
with respect to enhancing myocardial perfusion. These combined adaptations
synergistically served to alleviate the imbalance between myocardial demand and
supply and resulted in the improved performance seen on second exercise.
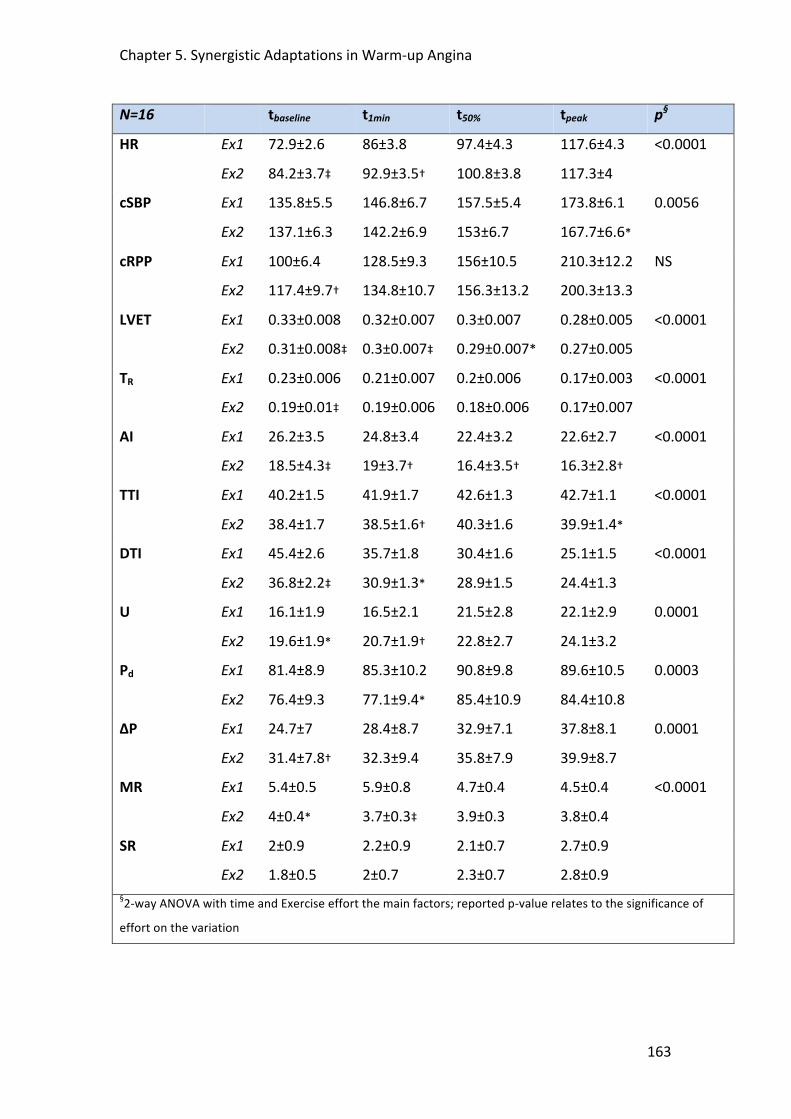
Chapter 5. Synergistic Adaptations in Warm-‐up Angina
163
N=16 tbaseline t1min t50% tpeak p§
HR
Ex1
Ex2
72.9±2.6
84.2±3.7‡
86±3.8
92.9±3.5†
97.4±4.3
100.8±3.8
117.6±4.3
117.3±4
<0.0001
cSBP Ex1
Ex2
135.8±5.5
137.1±6.3
146.8±6.7
142.2±6.9
157.5±5.4
153±6.7
173.8±6.1
167.7±6.6*
0.0056
cRPP Ex1
Ex2
100±6.4
117.4±9.7†
128.5±9.3
134.8±10.7
156±10.5
156.3±13.2
210.3±12.2
200.3±13.3
NS
LVET Ex1
Ex2
0.33±0.008
0.31±0.008‡
0.32±0.007
0.3±0.007‡
0.3±0.007
0.29±0.007*
0.28±0.005
0.27±0.005
<0.0001
TR Ex1
Ex2
0.23±0.006
0.19±0.01‡
0.21±0.007
0.19±0.006
0.2±0.006
0.18±0.006
0.17±0.003
0.17±0.007
<0.0001
AI Ex1
Ex2
26.2±3.5
18.5±4.3‡
24.8±3.4
19±3.7†
22.4±3.2
16.4±3.5†
22.6±2.7
16.3±2.8†
<0.0001
TTI Ex1
Ex2
40.2±1.5
38.4±1.7
41.9±1.7
38.5±1.6†
42.6±1.3
40.3±1.6
42.7±1.1
39.9±1.4*
<0.0001
DTI Ex1
Ex2
45.4±2.6
36.8±2.2‡
35.7±1.8
30.9±1.3*
30.4±1.6
28.9±1.5
25.1±1.5
24.4±1.3
<0.0001
U
Ex1
Ex2
16.1±1.9
19.6±1.9*
16.5±2.1
20.7±1.9†
21.5±2.8
22.8±2.7
22.1±2.9
24.1±3.2
0.0001
Pd Ex1
Ex2
81.4±8.9
76.4±9.3
85.3±10.2
77.1±9.4*
90.8±9.8
85.4±10.9
89.6±10.5
84.4±10.8
0.0003
ΔP Ex1
Ex2
24.7±7
31.4±7.8†
28.4±8.7
32.3±9.4
32.9±7.1
35.8±7.9
37.8±8.1
39.9±8.7
0.0001
MR
Ex1
Ex2
5.4±0.5
4±0.4*
5.9±0.8
3.7±0.3‡
4.7±0.4
3.9±0.3
4.5±0.4
3.8±0.4
<0.0001
SR Ex1
Ex2
2±0.9
1.8±0.5
2.2±0.9
2±0.7
2.1±0.7
2.3±0.7
2.7±0.9
2.8±0.9
§2-‐way ANOVA with time and Exercise effort the main factors; reported p-‐value relates to the significance of
effort on the variation
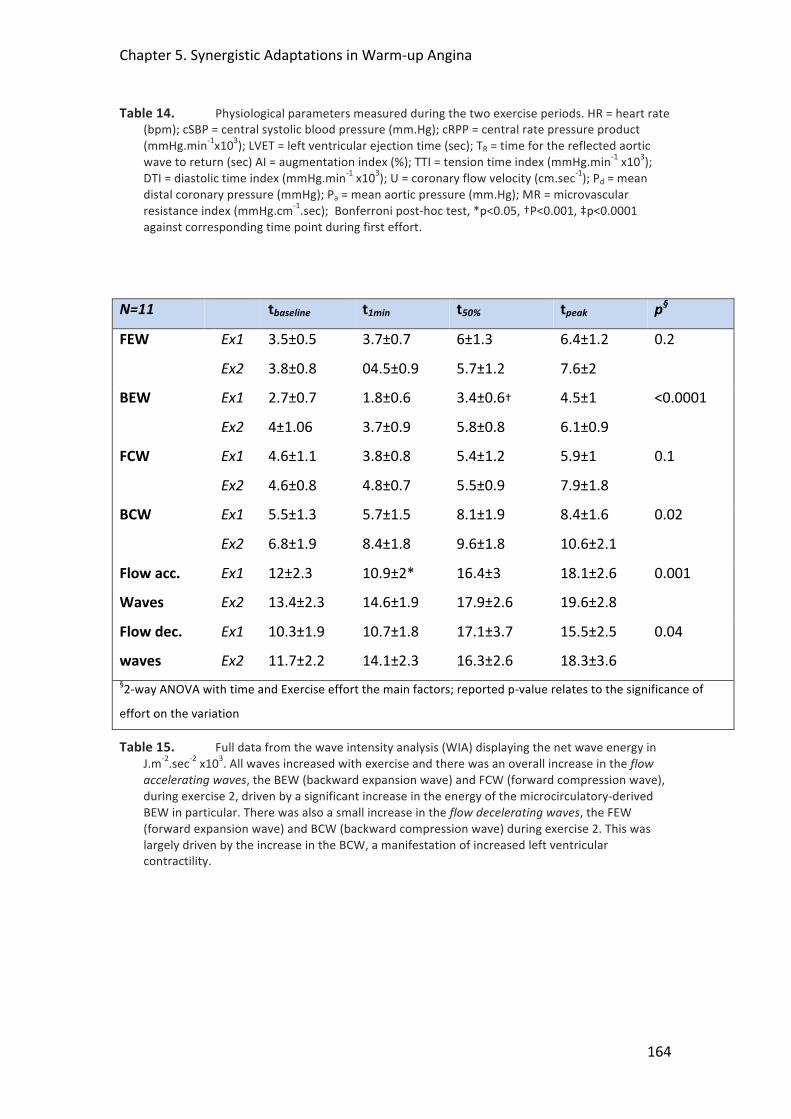
Chapter 5. Synergistic Adaptations in Warm-‐up Angina
164
Table 14. Physiological parameters measured during the two exercise periods. HR = heart rate (bpm); cSBP = central systolic blood pressure (mm.Hg); cRPP = central rate pressure product (mmHg.min-‐1x10³); LVET = left ventricular ejection time (sec); TR = time for the reflected aortic wave to return (sec) AI = augmentation index (%); TTI = tension time index (mmHg.min-‐1 x10³); DTI = diastolic time index (mmHg.min-‐1 x10³); U = coronary flow velocity (cm.sec-‐1); Pd = mean distal coronary pressure (mmHg); Pa = mean aortic pressure (mm.Hg); MR = microvascular resistance index (mmHg.cm-‐1.sec); Bonferroni post-‐hoc test, *p<0.05, †P<0.001, ‡p<0.0001 against corresponding time point during first effort.
N=11 tbaseline t1min t50% tpeak p§
FEW Ex1
Ex2
3.5±0.5
3.8±0.8
3.7±0.7
04.5±0.9
6±1.3
5.7±1.2
6.4±1.2
7.6±2
0.2
BEW Ex1
Ex2
2.7±0.7
4±1.06
1.8±0.6
3.7±0.9
3.4±0.6†
5.8±0.8
4.5±1
6.1±0.9
<0.0001
FCW Ex1
Ex2
4.6±1.1
4.6±0.8
3.8±0.8
4.8±0.7
5.4±1.2
5.5±0.9
5.9±1
7.9±1.8
0.1
BCW Ex1
Ex2
5.5±1.3
6.8±1.9
5.7±1.5
8.4±1.8
8.1±1.9
9.6±1.8
8.4±1.6
10.6±2.1
0.02
Flow acc.
Waves
Ex1
Ex2
12±2.3
13.4±2.3
10.9±2*
14.6±1.9
16.4±3
17.9±2.6
18.1±2.6
19.6±2.8
0.001
Flow dec.
waves
Ex1
Ex2
10.3±1.9
11.7±2.2
10.7±1.8
14.1±2.3
17.1±3.7
16.3±2.6
15.5±2.5
18.3±3.6
0.04
§2-‐way ANOVA with time and Exercise effort the main factors; reported p-‐value relates to the significance of
effort on the variation
Table 15. Full data from the wave intensity analysis (WIA) displaying the net wave energy in J.m-‐2.sec-‐2 x10³. All waves increased with exercise and there was an overall increase in the flow accelerating waves, the BEW (backward expansion wave) and FCW (forward compression wave), during exercise 2, driven by a significant increase in the energy of the microcirculatory-‐derived BEW in particular. There was also a small increase in the flow decelerating waves, the FEW (forward expansion wave) and BCW (backward compression wave) during exercise 2. This was largely driven by the increase in the BCW, a manifestation of increased left ventricular contractility.
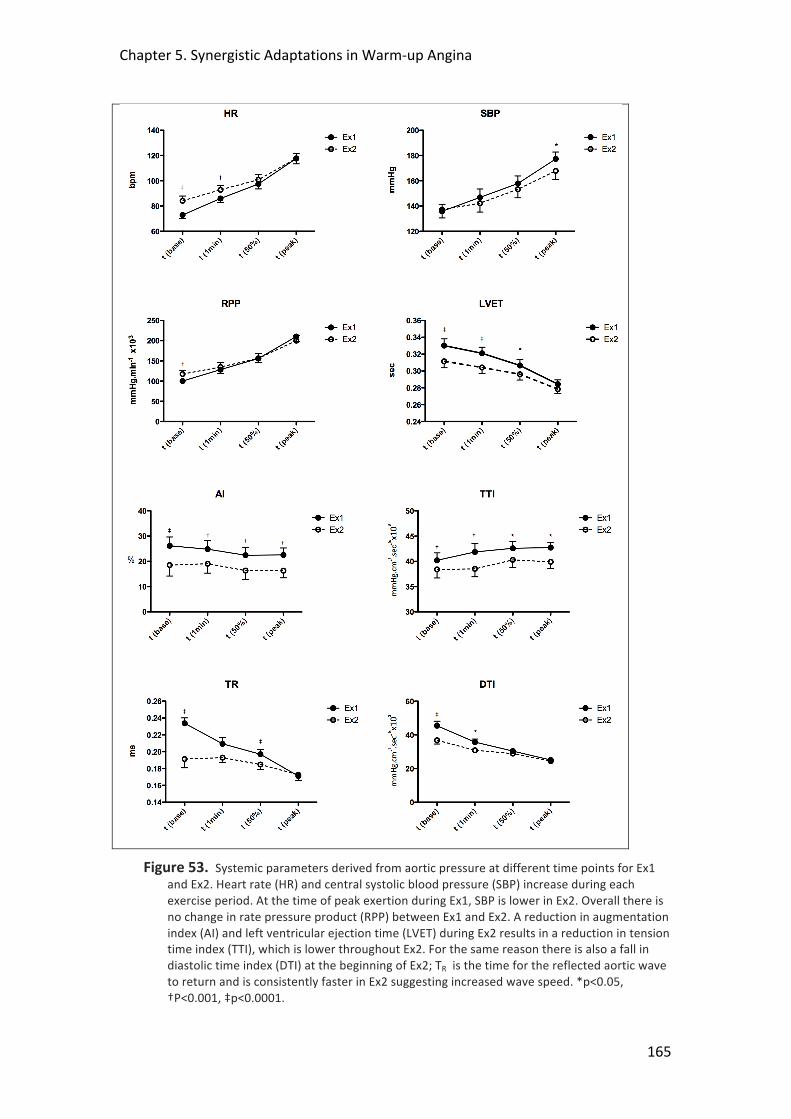
Chapter 5. Synergistic Adaptations in Warm-‐up Angina
165
Figure 53. Systemic parameters derived from aortic pressure at different time points for Ex1 and Ex2. Heart rate (HR) and central systolic blood pressure (SBP) increase during each exercise period. At the time of peak exertion during Ex1, SBP is lower in Ex2. Overall there is no change in rate pressure product (RPP) between Ex1 and Ex2. A reduction in augmentation index (AI) and left ventricular ejection time (LVET) during Ex2 results in a reduction in tension time index (TTI), which is lower throughout Ex2. For the same reason there is also a fall in diastolic time index (DTI) at the beginning of Ex2; TR is the time for the reflected aortic wave to return and is consistently faster in Ex2 suggesting increased wave speed. *p<0.05, †P<0.001, ‡p<0.0001.
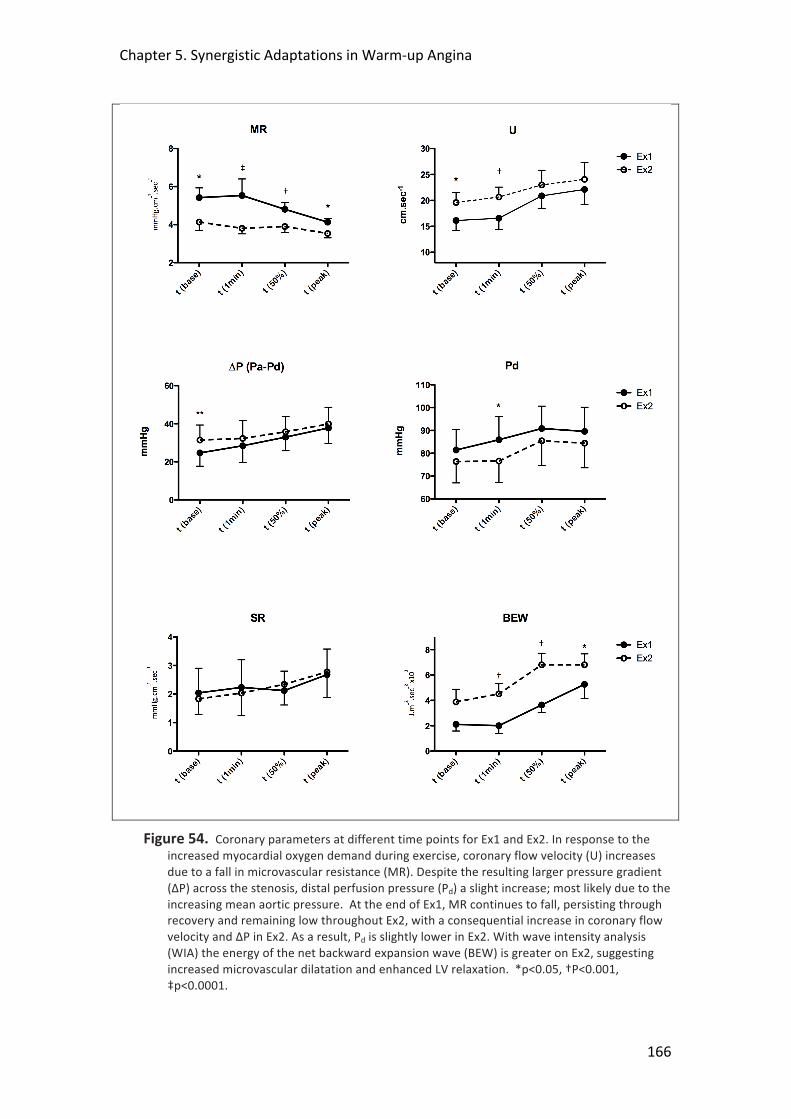
Chapter 5. Synergistic Adaptations in Warm-‐up Angina
166
Figure 54. Coronary parameters at different time points for Ex1 and Ex2. In response to the increased myocardial oxygen demand during exercise, coronary flow velocity (U) increases due to a fall in microvascular resistance (MR). Despite the resulting larger pressure gradient (ΔP) across the stenosis, distal perfusion pressure (Pd) a slight increase; most likely due to the increasing mean aortic pressure. At the end of Ex1, MR continues to fall, persisting through recovery and remaining low throughout Ex2, with a consequential increase in coronary flow velocity and ΔP in Ex2. As a result, Pd is slightly lower in Ex2. With wave intensity analysis (WIA) the energy of the net backward expansion wave (BEW) is greater on Ex2, suggesting increased microvascular dilatation and enhanced LV relaxation. *p<0.05, †P<0.001, ‡p<0.0001.

Chapter 5. Synergistic Adaptations in Warm-‐up Angina
167
Coronary Blood Flow and Oxygen Consumption
Conceptually and physiologically it is unlikely that increased antegrade blood flow
alone is responsible for the beneficial adaptations seen with warm-‐up103, 104, 345.
Warm-‐up is also unexplained by the recruitment of collateral vessels97. Instead, it
has been suggested that warm-‐up is due to attenuation of increased regional
myocardial oxygen consumption (MVO2), possibly mediated by adenosine A1
receptor activation, a signaling system known to improve tolerance to ischaemia346.
Bogaty et al., however, were neither able to demonstrate a role for the adaptive
down regulation of regional myocardial contractile function during exercise, nor for
adenosine-‐initiated adaptation in patients with warm-‐up angina115, 116. Our findings
suggest reduced myocardial work during Ex2, with a reduced RPP and TTI at the time
point of 1mm STD during Ex1; both TTI and RPP are known determinants of
myocardial oxygen consumption.
Figure 55. Coronary net wave intensity (dI) and the corresponding forward and backward contributions taken at peak equivalent exercise from one of the study subjects. The coronary pressure (Pd) and flow velocity (U) waveforms used to calculate dI are shown on top. BCW and BEW (1 and 4) come from the microcirculation; FCW and FEW (2 and 3) come from the coronary ostium. The marked increase in energy of the BEW (4) during Ex2 compared to Ex1 can be seen.
Arterial Vasodilation and Changes in LV Afterload
The exercised-‐induced change to the aortic pressure waveform seen in the present
study, i.e. reduced pressure augmentation, is consistent with previous studies347, 348,
Chapter 5. Synergistic Adaptations in Warm-‐up Angina
168
349. It results from reduced peripheral wave reflection due to vasodilation of the
systemic muscular arteries88, 95. At the equivalent time point at peak exercise in Ex2,
the augmentation index was 33% lower than in Ex1. These changes are also
consistent with more recent studies in healthy volunteers, where exercise provoked
a prolonged reduction in pressure augmentation that persisted for up to 60 minutes
into recovery despite stroke volume and carotid-‐femoral pulse wave velocity
returning to baseline14. This is a similar time-‐scale to the persistence of the warm-‐up
effect seen after first exertion in other studies97, 101, 140. In the study by Munir et al.88,
the reduction in pressure augmentation in the aorta was almost identical to that
seen following the administration of nitro-‐vasodilators, suggesting that the reduced
tone of muscular arteries together with a reduction in pressure wave reflection from
the lower body is an independent mechanism underlying exercise-‐induced changes
in pulse wave morphology. In the present study, improved ventricular-‐vascular
coupling, induced by the favorable and persistent haemodynamic changes following
the first episode of exercise, may have contributed to the beneficial adaptation
observed during second exercise by reducing afterload and shortening systole. A
reduction in ejection duration is associated with enhanced diastolic relaxation350.
Exercise-‐induced peripheral vasodilation has been previously suggested as a
potential important mechanism in warm-‐up339, but this is the first time it has been
demonstrated clinically.
Persistent Decrease in Coronary Microvascular Resistance Index with Exercise
In the presence of a coronary stenosis the subendocardial myocardium is especially
sensitive to impedance of blood flow during systole, and maintenance of uniform
transmural myocardial flow distribution is very dependent on changes to
microvascular resistance during diastole, especially at increased hearts rates,
requiring active coronary vasodilatation60, 336. It is well established that the
subendocardial tissue layer is sensitive to the systolic flow impediment of cardiac
contraction, especially in the presence of reduced coronary pressure due to a
proximal stenosis342 and that the resultant hypoperfusion spreads from
endocardium to epicardium37, 336. Subendocardial flow therefore depends critically
on diastolic duration60, 69. At increased hearts rates, as the interval of diastole is
Chapter 5. Synergistic Adaptations in Warm-‐up Angina
169
reduced, active coronary vasodilatation is required to maintain transmural diastolic
perfusion69, 336. Exercise produces an intense vasodilatory stimulus on the coronary
resistance vessels, which substantially alters the relative distribution of blood flow
over the coronary vascular bed 351, 352. We observed an increase in coronary flow
velocity during Ex1 where MR continued to fall, after an initial slight increase at the
start, suggesting progressive vasodilation of the coronary vascular bed with
increasing workload. It has been shown that persistent vasomotor tone is present
throughout the coronary microcirculation even during ischaemia, with substantial
vasodilator reserve remaining within the exercising vascular bed of a hypo-‐perfused
region35, 353. This is confirmed in the present study, since MR continues to fall after
the end of Ex1, through recovery and into the start of Ex2, where the final resistance
attained is lower than that which occurred during the myocardial ischaemia induced
by peak exercise during Ex1 (p=0.0002).
The reduction in coronary microvascular resistance we observed during Ex2 indicates
a sustained vasodilatory action. Previous studies have suggested that vasodilation
may play an important role in warm-‐up. Joy102 and Ylitalo354 used nifedipine and
nisoldipine, respectively, in patients with warm-‐up angina. In both cases, the
addition of these vasodilating agents attenuated the magnitude of warm-‐up,
implying a shared common mechanism. Interestingly, the beta-‐blocker timolol,
which is thought to exert its antianginal effect through reduced myocardial oxygen
demand and may cause an increase in α-‐adrenoceptor mediated coronary
vasoconstriction355, did not attenuate the warm-‐up response. Bogaty et al. examined
the transmural redistribution of coronary blood flow within the myocardium as a
mechanism of warm-‐up using SPECT imaging but was unable to demonstrate any
differences, perhaps due to the limited spatial resolution of SPECT116. Further studies
using high-‐resolution cardiac magnetic resonance imaging to examine changes in
subendocardial perfusion may provide insight.
Coronary-‐Cardiac Interaction
In the presence of a severe proximal stenosis (and thereby small residual vasodilator
capacity) other factors may also influence transmural distribution of perfusion in
Chapter 5. Synergistic Adaptations in Warm-‐up Angina
170
response to increased stress. In the setting of myocardial ischaemia it is known that
changes in myocardial function, including increased compliance and enhanced LV
diastolic relaxation contribute to transmural flow redistribution to the
subendocardium356. Coronary wave intensity analysis reflects the effects of both
cardiac contraction and coronary conductance on coronary blood flow dynamics. In
the coronary artery, the effects of LV relaxation generate a dominant backward (via
the vasculature) expansion wave. This BEW is a flow-‐accelerating (suction) wave and
plays a prominent role in diastolic coronary blood flow 245, 254. A higher magnitude of
this wave has been observed after a decrease in microvascular resistance through
pharmacological vasodilation342 and also with enhanced LV relaxation due to a
decrease in microvascular compression254. Similarly, Davies et al found a 30%
reduction in the magnitude of the BEW in patients with LV hypertrophy, a group with
known impaired microvascular function and LV relaxation when compared to a
group of matched controls245. In the present study, although the exercise levels
were similar, the magnitude of the BEW was 21% greater on second exertion. This
important increase in the BEW, together with the beneficial energetics afforded by a
reduction in ejection time and LV afterload suggest that enhanced vascular-‐
ventricular coupling, as well as persistent coronary vasodilation and improved
cardiac-‐coronary interaction, play an important role in the improved performance
seen on second exertion.
Other Potential Mechanisms
Although the adaptations seen during Ex2 may be a result of the exercise itself, one
must also consider the potential role of 1) ischaemic preconditioning (IPC) whereby
the ischaemia itself resulted in intrinsic myocardial adaptation; and 2) the
contribution of recruitable coronary collaterals. IPC is the term used to describe the
increased myocardial resistance to ischaemia that follows a brief episode of
ischaemia109, 110. It has been suggested that the clinical observation of the warm-‐up
phenomenon may represent one aspect of IPC in humans105. IPC, like warm-‐up
angina is also unexplained by a down-‐regulation of contractile function or an
increase in collateral myocardial perfusion induced by initial exercise114, 115. The
finding, however, that warm-‐up angina does not seem to be mediated by adenosine
Chapter 5. Synergistic Adaptations in Warm-‐up Angina
171
or by cardiac adenosine triphosphate-‐sensitive potassium channels116, 117 suggests
that it is mechanistically distinct from classic ischaemic preconditioning.
Recruitable coronary collaterals have long been proposed as a mechanism for warm-‐
up and other ischaemic adaptation100. While in the present study we excluded those
with chronic total occlusions or with significant angiographic collateral vessels, there
is2 the possibility (indeed likelihood) that those included did have some collateral
vessels present. Previously, our group has examined this phenomenon specifically
and found that there was no relationship between the presence and extent of
coronary collaterals and the presence of warm-‐up, based on a model of coronary
vessel occlusion using an angioplasty balloon and measuring collateral flow index97.
Other studies have also shown ischaemic adaptation to be independent of the
presence of recruitable coronary collateral vessels357, 358. Although the magnitude of
inducible myocardial ischaemia is lower when significant collaterals are present,
there is no effect of repetitive ischaemic stress357. However, a recent study by Togni
et al demonstrated an instantaneous increase in collateral flow index (CFI) in
response to dynamic isometric exercise in patients with coronary artery disease264.
They measured CFI at rest and during the last minute of peak exercise, randomly
assigning the patients to either rest or exercise measurements first, to overcome the
potential confounder of the initial rest ischaemic stimulation (one minute of balloon
inflation) influencing the subsequent exercise measurements. In both cases there
was a significant increase in CFI in response to exercise irrespective of which was
measured first. Interestingly, when exercise was performed first both the peak
exercise CFI and the subsequent resting CFI values were higher, although not
statistically significantly, from when the rest measurements were taken first.
Although one must be cautious in how one extrapolates such data to the findings
from the present study, if collateral vessel recruitment were to play a significant role
in warm-‐up then perhaps one might have expected a higher peak exercise CFI
measurement in the group where there had been a preceding ischaemic stimulus; in
fact the opposite was true.
Chapter 5. Synergistic Adaptations in Warm-‐up Angina
172
In the current study we did not measure CFI. Again, we wanted to preserve the
conditions of exercise-‐induced angina as far as possible in our model and the
necessary prolonged balloon inflations for CFI measurement would have
substantially altered this. In addition, there is evidence from the literature that even
in the presence of exercise-‐induced coronary ischaemia microvascular resistance is
not minimal35, 353, and this was evidenced in the present study where microvascular
resistance continued to fall throughout Ex1 and into recovery. For pressure based
CFI measurements, minimal microvascular resistance, as well as central venous
pressure measurements are very important as variations in these can have a
significant impact on measurements. This is the reason such measurements are
usually made following the administration of both intracoronary nitrates and
systemic adenosine to minimise such resistances. Again, for these reasons we did
not measure CFI in this way. Undoubtedly, however, further work in the response of
collateral blood flow to serial exercise exertions would be very interesting, perhaps
utilising contrast echocardiography, although again this presents significant technical
challenges in itself264, 359.
Further Work and Potential Therapies?
Endothelin (ET) exerts a constrictor influence on the coronary and systemic
circulation through the ET -‐receptor A, which decreases during exercise thereby
contributing to metabolic vasodilation360. Mechanisms for this may include exercise-‐
induced increases in adenosine levels, which decrease the sensitivity of the
vasculature to ET361, and, nitric oxide (NO) production that increases during exercise,
and can directly modulate the binding of ET to the ETA receptor362, 363. These effects
were shown to persist after cessation of exercise thereby potentially providing the
favorable conditions similar to those seen in the current study, where lasting
coronary and systemic vasodilatation through recovery and into the second exertion
resulted in reduced ischaemia. In a study in patients with essential hypertension,
treatment with the endothelin receptor antagonist BQ-‐123 was found to increase
exercise capacity, with an enhanced peripheral vasodilatory response, especially at
higher workloads364. Another group found that intensive exercise training resulted
in an improvement in endothelium-‐dependent coronary vasodilatation352;
Chapter 5. Synergistic Adaptations in Warm-‐up Angina
173
nitroglycerin-‐induced (endothelium-‐independent) coronary vasodilatation conferred
no benefit. Further work is warranted to examine ways to modulate the acute
responses to intense exercise seen in the present study, with the goal of “bottling”
the beneficial haemodynamic responses that we observed for subsequent exertions.
Early studies suggest that metabolic dilation in the systemic and coronary circulation
during exercise involves not only increased vasodilator influences but also inhibition
of vasoconstrictor influences. Inhibition of endothelin may provide a potential novel
target in the treatment of exertional angina.
5.6 Limitations
This was a small, single center study but is the first to examine simultaneously the
important changes in aortic pressure waveform, patterns of coronary blood flow,
and coronary microvascular resistance during large-‐muscle exercise in the
investigation of warm-‐up angina. In previous non-‐invasive studies examining warm-‐
up, an interval of 10-‐15 minutes was used between the repetitive bouts of exercise.
Due to practical considerations this was not possible in the current study and the
time between exertions was shorter. Consequently, the lingering effects of Ex1
prevented a return to true baseline conditions at the start of Ex2. We did not
measure LV or pulmonary arterial pressures in our study and therefore cannot
exclude further differences that may have contributed. We do not expect differences
in extra-‐cellular circulating volumes between Ex1 and Ex2, but previous studies have
shown LVEDP to be lower on second exercise, although this did not seem to be
related to warm-‐up349 . No pharmacological vasodilation was given to keep the
environment as close to real-‐life conditions as possible; minimal resistance was
therefore not known. In addition, intracoronary nitrates were not administered at
the beginning of the study to avoid the possibility of these exerting a confounding
preconditioning effect. There is the possibility that wire induced coronary spasm
may have had an effect of the coronary flow and pressure measurements.
5 patients were not suitable for WI analysis, which utilizes the first derivative of
pressure and velocity waveforms and is therefore particularly affected by the quality
Chapter 5. Synergistic Adaptations in Warm-‐up Angina
174
of the acquired signals. The average systemic and coronary haemodynamic
parameters were comparable between the selected group and the entire study
group, and hence our findings from this group likely apply to the whole study
population.
5.7 Conclusions
In patients with coronary artery disease and demonstrable warm-‐up, exercise
induces vasodilatory changes in the systemic and coronary circulations that reduce
central aortic pressure and myocardial microvascular resistance. These combine to
improve vascular-‐ventricular coupling and enhance myocardial perfusion, thereby
contributing to the warm-‐up effect seen on repeat exercise.
5.8 Acknowledgments
The study was conceived, designed and carried out by TL, MM, and SR. MCR, AG and
MS assisted with data collection and analysis, as did KP. DP, KA, RW and KDS
contributed to data collection and patient recruitment. PC and SP provided
additional support. Professor J.G.P Tijssen and N. van Geloven (Academic Medical
Centre, Amsterdam, The Netherlands) provided statistical support.
175
6 DETECTION OF TRANSMURAL FLOW HETEROGENEITY
USING HIGH RESOLUTION MRI PERFUSION IMAGING
Tim Lockie1, Kal Asrass1, Rupert Williams1, Hanson Tang1, Masaki Ischida2, Antoine
Guilcher3, Sebastian Kozerke2, Eike Nagel2, Simon Redwood1, Mike Marber1, Sven
Plein2, 4
1Cardiovascular Research Division, The Rayne Institute, St Thomas’ Hospital, KCL, London UK
2Division Imaging Sciences, The Rayne Institute, St Thomas’ Hospital, KCL, London, UK
3Dept Clinical Pharmacology, St Thomas’ Hospital, KCL, London, UK
4Multidisciplinary Cardiovascular Research Centre, University of Leeds, Leeds, UK
Chapter 6. Detection of Transmural Flow Heterogeneity
176
6.1 Abstract
Background
With increasing heart rate there is redistribution of blood away from the
subendocardium due to the compressive forces of the LV during systole.
Subendocardial perfusion is therefore critically dependent on the diastolic time
fraction (DTF). With high spatial resolution, cardiac magnetic resonance perfusion
has the potential to examine important differences in transmural flow distribution.
Purpose
1. To examine the effect of reduced DTF on coronary flow between the
subendocardium and the subepicardium at rest and during adenosine stress
using high-‐resolution cardiac magnetic resonance (CMR) perfusion.
2. To assess the feasibility of examining these differences using exercise stress.
Methods
The effect of adenosine on DTF was assessed in 2 patients undergoing percutaneous
coronary revascularisation (PCI) using a pressure sensor tipped guide wire in the
aortic root. k-‐t SENSE accelerated perfusion CMR was performed on 19 healthy
volunteers. Images were acquired at rest, and during adenosine hyperaemia (8
volunteers) or after peak exercise (11 volunteers). 0.05 mmol/kg Gd-‐DTPA was
administered as contrast agent. Ventricular and myocardial signal intensity curves
were generated for both studies. The curves were used to quantify myocardial
blood flow (ml/min/g), myocardial perfusion reserve and endocardial/epicardial
ratios using a Fermi Function deconvolution algorithm.
Results
1) Adenosine: Resulted in a variation in both the diastolic duration (mean difference
151.9±59.6 ms, P<0.001) and the DTF (mean difference 0.04±0.01, P<0.0009). In
volunteers, endocardial flow at rest was higher than epicardial across all segments
(2.69±1.07ml/g/min vs. 2.11±0.91 ml/g/min P<0.0001) with an ENDO/EPI ratio of
1.34±0.2. During hyperaemia there remained a difference in perfusion with

Chapter 6. Detection of Transmural Flow Heterogeneity
177
endocardial flow 5.41±2.33 ml/g/min and epicardial flow 4.7±2.09 ml/g/min
respectively (NS) with a reduced ENDO/EPI ratio of 1.16±0.2 (P=0.03 vs. rest).
2) Exercise: 7 out of 11 studies suitable for analysis. Resting transmural blood flow
was 0.8±0.06 ml/g/min that increased to 2.6±0.4 and 2.5±0.3 ml/g/min during
exercise 1 and 2 respectively (p=0.001 rest vs. exercise). MPR was 3.3±0.5 for Ex1
and 3.1±0.4 for Ex2. There was an ENDO/EPI flow ratio at rest of 1.29±0.2 that
reduced to 1.04±0.2 after Ex1 and 1.07±0.1 after Ex2 (P= 0.02 vs. rest).
Conclusion
Using high resolution CMR perfusion we were able to demonstrate in vivo that the
endocardial/epicardial flow ratio decreases during hyperaemic stress.
6.2 Introduction
6.2.1 Coronary Physiology and Myocardial Perfusion During Exercise
During exercise, demand for oxygen increases in skeletal muscle37. This demands an
increase in cardiac output and arterial pressure, which is provided by increases in
heart rate, contractility, and ventricular work. The increase in activity of the heart
augments the demand and consumption for oxygen which is strongly correlated with
coronary flow37. Increases in coronary flow are met by vasodilatation of the
coronary vessels and an increase in mean arterial pressure365. Left ventricular
myocardial blood flow is 0.8-‐1.3 ml/min/g at rest in humans309, 366-‐368. Dynamic
exercise can increase coronary blood flow by three to five times above the resting
level11 309. The difference between the maximal blood flow obtained by coronary
vasodilatation and blood flow at rest is known as the myocardial perfusion reserve
(MPR) and depends largely on the perfusion pressure and the degree of
vasodilatation in the microcirculation44.
The majority of coronary blood flow occurs during diastole74. Physical compression
and myocardial shortening during the systolic phase cause impediment of coronary
blood flow within the intramural vessels43, 44. The LV subendocardium is much more
Chapter 6. Detection of Transmural Flow Heterogeneity
178
vulnerable to the compressive forces of systolic contraction than the subepicardium
and subepicardial flow is roughly twice that of the subendocardium during systole21.
Subendocardial perfusion is therefore critically dependent on diastolic perfusion;
with increasing heart rate and a reduction in the diastolic interval, perfusion is
maintained by vasodilatation of the coronary microvasculature69. In contrast,
subepicardial perfusion is relatively unaffected by changes in the diastolic duration
and heart rate342. To compensate for these differences, the subendocardium has a
greater capillary vascular density with resting endo-‐epicardial flow (ENDO/EPI) ratios
reported between 1.09 and 1.4921, 278, 293, 369. However, as heart rate increases and
diastolic perfusion time (or diastolic time fraction, DTF) reduces it has been shown
that there is a reduction, or even a reversal in this ratio as blood is directed away
from the subendocardium23, 370,11,371.
6.2.2 High resolution CMR Imaging-‐ the Challenges of Exercise Stress
In order to study differences in transmural flow distribution during exercise in the
human myocardium any imaging technique must fulfil some essential criteria. Firstly,
it must be able to image the heart at high heart rates; it must be of sufficient spatial
resolution to distinguish the endo-‐ and epicardial layers; and it must allow full
quantification of myocardial blood flow. Cardiac magnetic resonance (MR) has the
potential to fulfil all of these requirements, although, such imaging presents a
significant challenge. The main challenge relates to the acquisition of data at much
higher heart rates than usual, without significantly degrading either the spatial or
temporal resolution necessary for quantification of blood flow to the different
myocardial layers. Such studies have not been previously carried out.
Through preliminary studies in volunteers we established that the use of k-‐space and
time sensitivity encoding (k-‐t SENSE) was preferable to standard first-‐pass perfusion
techniques [see Chapter 2]. k-‐t SENSE simultaneously exploits coil encoding and
spatiotemporal data correlations to allow acceleration of data acquisition, which is
crucial during dynamic MR perfusion222. This acceleration can be used to improve
temporal or spatial resolution of perfusion CMR especially at 3 Tesla where there is a
greater signal to noise ratio (SNR)223. It is also associated with a reduction in dark rim

Chapter 6. Detection of Transmural Flow Heterogeneity
179
artefacts, which we found to be particularly troublesome at high heart rates with
standard perfusion techniques; consequently a lot of these early data were not
suitable for quantitative analysis. However, despite the advantages of faster
scanning using k-‐t SENSE it also presents some potential drawbacks: the higher
spatial resolution and spatiotemporal under-‐sampling can result in a loss of SNR, as
well as being especially vulnerable to breathing and other movement artefact. The
effect of these on quantification of transmural myocardial blood flow remains to be
determined.
6.2.3 Rationale for the Proposed Study The redistribution of coronary blood flow between the different layers of the
myocardium is of great importance, especially in patients with coronary artery
disease where the subendocardium is particularly vulnerable to the effects of
ischaemia and infarction108, 131. An increased understanding of such changes in
perfusion might allow us to develop interventions or therapies to attenuate such
damage. In the previous chapter (Chapter 5) we documented important changes in
myocardial microvascular resistance (MR) that were associated with improved
performance in patients with obstructive coronary disease and exertional angina. It
is known that with increasing heart rate these reductions in MR are associated with
enhanced subendocardial blood flow60. Although changes in transmural blood flow
have been extensively examined in animals, there is comparatively little data in
humans because of the difficulties in acquiring such data in vivo.
Quantifying myocardial blood flow during exercise stress using CMR is a challenge.
Initially it was important to establish that the scanning and quantification methods
we were going to use were capable of detecting differences in transmural flow
distribution in subjects not undergoing exercise. Adenosine is a vasodilator, lowering
central aortic pressure and increasing heart rate; it is safe and widely used and
therefore provided a good choice of stimulant to use. The effects of the standard
adenosine infusion used in clinical practice (and in the experimental protocol) on
DTF are uncertain. This was determined by analysis of the central aortic pressure

Chapter 6. Detection of Transmural Flow Heterogeneity
180
waveform in two patients undergoing scheduled percutaneous coronary
revascularisation in the catheterisation lab during adenosine infusion.
6.3 Methods
6.3.1 Adenosine Protocol
Catheterisation Lab Protocol
2 patients with obstructive coronary disease in whom percutaneous coronary
intervention (PCI) was planned and were undergoing a pressure wire assessment of
the lesion, were consented into the study. A pressure wire (Brightwire®, Volcano®
Therapeutics, USA) was positioned at the tip of the guide and also connected to the
Combomap via a Smartmap® transducer (Volcano® Therapeutics, USA) which
provided a high fidelity proximal pressure signal (Pa) and was equalised to the fluid-‐
filled catheter pressure trace from the main Philips Sensis® system in the cath lab.
The guide was disengaged from the coronary ostium and the pressure wire was
passed into the aortic root. Data were recorded at rest and during an intravenous
infusion of adenosine at 140µg/kg/min for 3 minutes to achieve hyperaemic stress.
All data were recorded at 1 kHz and stored on a disk for subsequent analysis. The
second derivative of the waveform was used to identify the dicrotic notch and the
first derivative to identify the maximal point of change of the upstroke of the
following beat to determine diastolic duration (see Figure 56 below), using Matlab®
(The MathWorksInc®, USA). DTF was then determined by dividing the diastolic
duration by the whole pulse duration. The analysis was performed blind to whether
the readings were taken at baseline or hyperaemia.
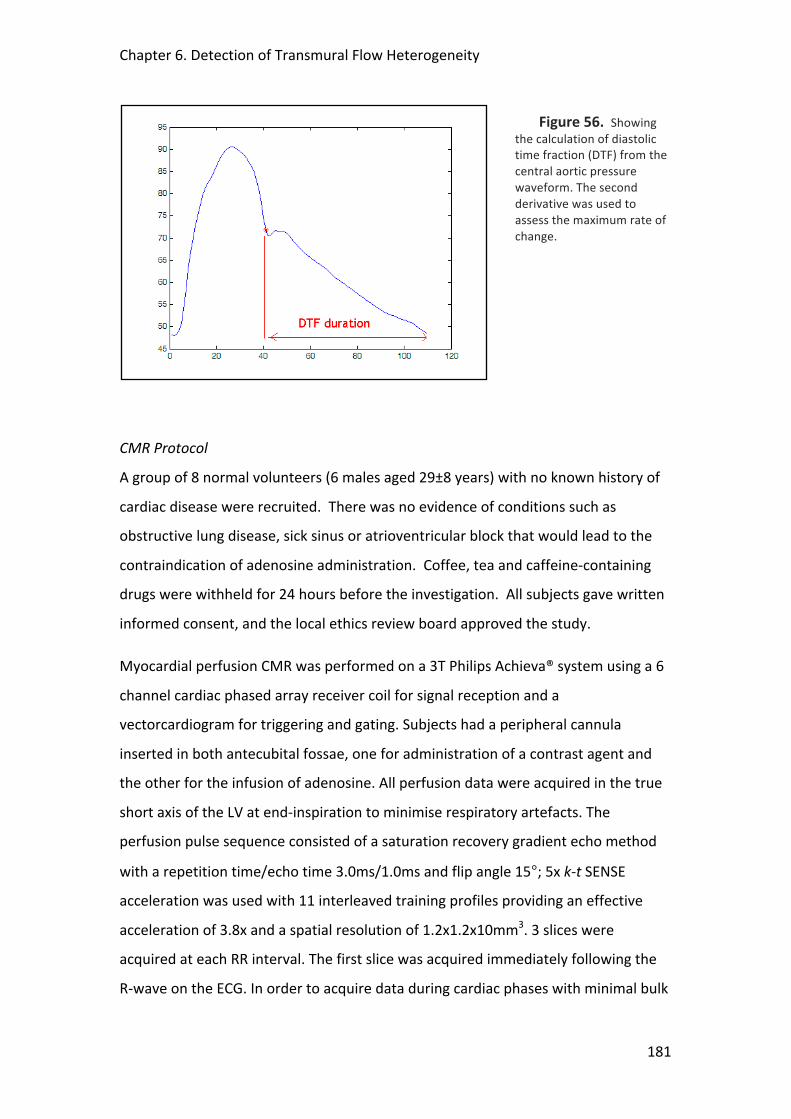
Chapter 6. Detection of Transmural Flow Heterogeneity
181
Figure 56. Showing the calculation of diastolic time fraction (DTF) from the central aortic pressure waveform. The second derivative was used to assess the maximum rate of change.
CMR Protocol
A group of 8 normal volunteers (6 males aged 29±8 years) with no known history of
cardiac disease were recruited. There was no evidence of conditions such as
obstructive lung disease, sick sinus or atrioventricular block that would lead to the
contraindication of adenosine administration. Coffee, tea and caffeine-‐containing
drugs were withheld for 24 hours before the investigation. All subjects gave written
informed consent, and the local ethics review board approved the study.
Myocardial perfusion CMR was performed on a 3T Philips Achieva® system using a 6
channel cardiac phased array receiver coil for signal reception and a
vectorcardiogram for triggering and gating. Subjects had a peripheral cannula
inserted in both antecubital fossae, one for administration of a contrast agent and
the other for the infusion of adenosine. All perfusion data were acquired in the true
short axis of the LV at end-‐inspiration to minimise respiratory artefacts. The
perfusion pulse sequence consisted of a saturation recovery gradient echo method
with a repetition time/echo time 3.0ms/1.0ms and flip angle 15°; 5x k-‐t SENSE
acceleration was used with 11 interleaved training profiles providing an effective
acceleration of 3.8x and a spatial resolution of 1.2x1.2x10mm3. 3 slices were
acquired at each RR interval. The first slice was acquired immediately following the
R-‐wave on the ECG. In order to acquire data during cardiac phases with minimal bulk
Chapter 6. Detection of Transmural Flow Heterogeneity
182
cardiac motion, mid-‐systole and mid-‐diastole were identified on cine images and the
trigger delays for slice two and three set so that acquisition occurred in these cardiac
phases. Data were acquired during adenosine-‐induced hyperaemia (140µg/kg/min)
and after a 15minute delay at rest using a dose of 0.05mmol/kg Gd-‐DTPA
(Magnevist®, Shering, Germany) at a rate of 4ml/minute followed by a flush of 20ml
Saline. Blood pressure and heart rate were monitored throughout, as was the
subject’s response to adenosine to ensure that hyperaemic conditions were
achieved. Standard dual inversion recovery late gadolinium enhancement images
were acquired after 15 minutes to ensure there were no significant areas of scar that
may interfere with the analysis.
6.3.2 Exercise Protocol A specially adapted supine cycle ergometer was used and attached to the sliding
table inside the CMR scanner such that the subject could exercise without leaving
the table and scanning could occur almost immediately after peak exercise. A
standardised exercise protocol was used with increments of 20W each minute for 6
minutes at a rate of 60 rpm340. Rate pressure product (RPP) calculated as peak
systolic blood pressure x peak HR was recorded at peak exercise.
CMR Protocol
Healthy volunteers without known cardiovascular disease gave informed consent for
supine cycle ergometry on the CMR scanner table (Lode, Netherlands). Resting high-‐
resolution perfusion CMR was performed on a 3T Philips Achieva® system using
0.025 mmol/kg Gd-‐DTPA (saturation recovery gradient echo, repetition time/echo
time 2.7ms/0.96ms, flip angle 15°, 5 x k-‐t SENSE acceleration, 11 interleaved training
profiles, WET pre-‐pulse (angles 120°, 90°, 180°, 140°); delay 100ms, spatial
resolution 1.0x1.0x8mm3, 3 slices acquired at each RR interval, 30 dynamic images).
Subjects were then removed from the scanner but remained in a supine position on
the table attached to the ECG electrodes and radiofrequency coil. Position on the
table was maintained using a specially adapted vacuum cushion. Subjects then
underwent a standardised incremental exercise protocol as has been described
previously340. At peak exercise, the patients were quickly slid back into the scanner
Chapter 6. Detection of Transmural Flow Heterogeneity
183
and the perfusion sequence was repeated. After a period of rest for 20 minutes, the
exercise protocol was repeated with a further perfusion scan.
6.3.3 CMR Quantification Methods
Data were analysed off-‐line by means of a commercially available dedicated
software package (MASS®, Medis, The Netherlands). The LV myocardium was
divided into 6 segments per slice and into an endocardial and epicardial third and
signal intensity curves (SI) were generated [see Chapter 2 for a more detailed
explanation of methods]. Data generated in MASS were imported to a Fermi
Function deconvolution algorithm implemented in Matlab® (The MathWorksInc®,
USA). The Fermi deconvolution provided estimates of absolute myocardial blood
flow (ml/g/min)196. Data are presented as mean ±SD. Myocardial perfusion reserve
(MPR) was calculated by dividing peak flow by resting flow values.
6.3.4 Statistical Analysis Paired t-‐tests were performed on the discrete data and used to examine the
difference in means. Multiple comparisons were made using ANOVA. Data are
presented as mean ± standard deviation (SD). Coefficient of variation was used to
compare inter-‐ and intraobserver differences. A P value of <0.05 was considered
significant.
6.4 Results
6.4.1 Adenosine 5 sets of measurements in the 2 patients were taken before and after PCI (see Table
16 below). All data were of suitable quality for full analysis. The adenosine infusion
resulted in the predicted fall in central mean arterial pressure (MAP) and an increase
in heart rate (HR). These haemodynamic changes resulted in a variation in both the
diastolic duration (mean difference 151.9±59.6 ms, P<0.001) and the diastolic time
fraction (mean difference 0.04±0.01, P<0.0009).

Chapter 6. Detection of Transmural Flow Heterogeneity
184
Vessel MAP HR Diastolic duration DTF
Rest Stress Rest Stress Rest Stress Rest Stress
1 RCA pre
PCI
66.3 61.1 54.3 63.9 695.80
549.29
0.63
0.58
2 RCA post
PCI
71.4 66.1 56 64.2 660.91
543.95
0.62 0.58
3 Cx pre
PCI
86.3 82.6 51.3 72.6 729.29
485.88
0.62 0.59
4 LAD pre
PCI
87.1 85.8 65.8 74.4 562.50
476.52
0.61 0.57
5 LAD post
PCI
73.8 76.4 59 73.2 646.25
479.47
0.64 0.59
Mean 76.9 74.4 57.2 69.7 659 507** 0.62 0.58*
SD 9.2 10.5 5.5 5.1 62.8 36.5 0.01 0.008
Table 16. Showing the results of the analysis of 5 sets of measurements taken from 2 patients undergoing percutaneous coronary intervention (PCI). All data were recorded at rest and stress during the infusion of i.v. adenosine. MAP =mean arterial pressure, HR =heart rate, DTF =diastolic time fraction. Diastolic duration is measured in milliseconds (ms). *<0.005, **<0.001
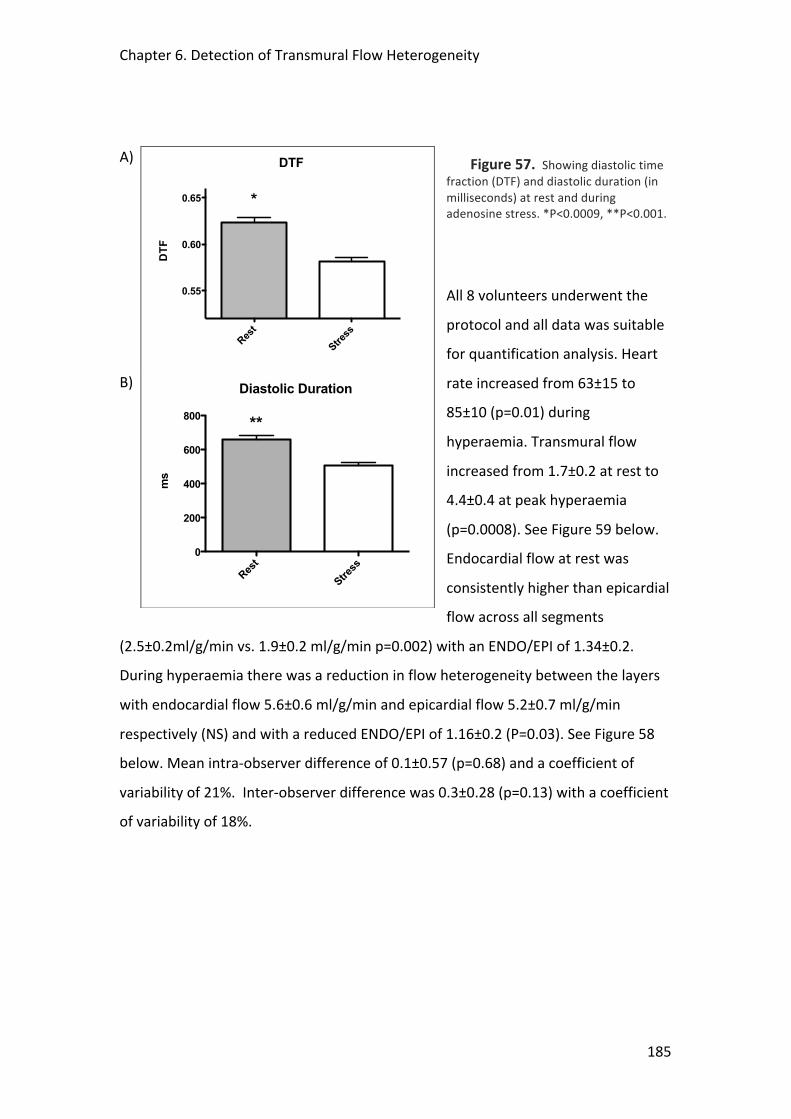
Chapter 6. Detection of Transmural Flow Heterogeneity
185
Figure 57. Showing diastolic time fraction (DTF) and diastolic duration (in milliseconds) at rest and during adenosine stress. *P<0.0009, **P<0.001.
All 8 volunteers underwent the
protocol and all data was suitable
for quantification analysis. Heart
rate increased from 63±15 to
85±10 (p=0.01) during
hyperaemia. Transmural flow
increased from 1.7±0.2 at rest to
4.4±0.4 at peak hyperaemia
(p=0.0008). See Figure 59 below.
Endocardial flow at rest was
consistently higher than epicardial
flow across all segments
(2.5±0.2ml/g/min vs. 1.9±0.2 ml/g/min p=0.002) with an ENDO/EPI of 1.34±0.2.
During hyperaemia there was a reduction in flow heterogeneity between the layers
with endocardial flow 5.6±0.6 ml/g/min and epicardial flow 5.2±0.7 ml/g/min
respectively (NS) and with a reduced ENDO/EPI of 1.16±0.2 (P=0.03). See Figure 58
below. Mean intra-‐observer difference of 0.1±0.57 (p=0.68) and a coefficient of
variability of 21%. Inter-‐observer difference was 0.3±0.28 (p=0.13) with a coefficient
of variability of 18%.
A)
B)
DTF
Rest
Stress
0.55
0.60
0.65 *
DTF
Diastolic Duration
Rest
Stress
0
200
400
600
800 **
ms
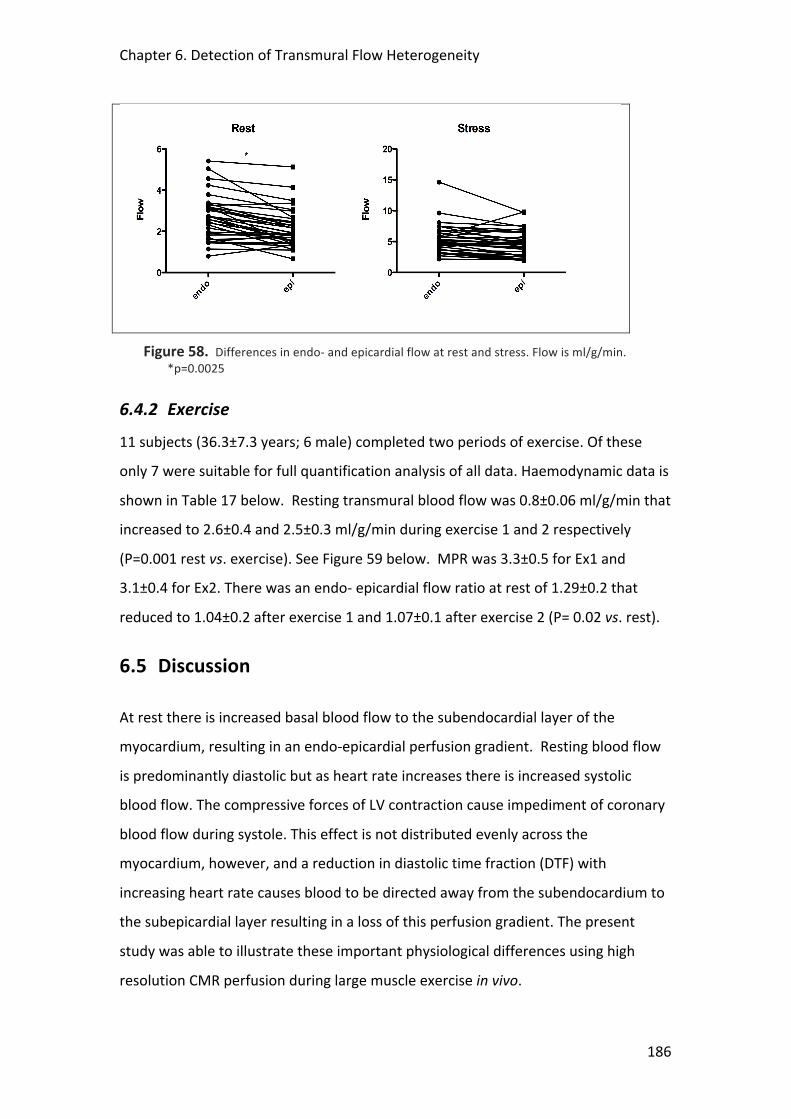
Chapter 6. Detection of Transmural Flow Heterogeneity
186
Figure 58. Differences in endo-‐ and epicardial flow at rest and stress. Flow is ml/g/min. *p=0.0025
6.4.2 Exercise 11 subjects (36.3±7.3 years; 6 male) completed two periods of exercise. Of these
only 7 were suitable for full quantification analysis of all data. Haemodynamic data is
shown in Table 17 below. Resting transmural blood flow was 0.8±0.06 ml/g/min that
increased to 2.6±0.4 and 2.5±0.3 ml/g/min during exercise 1 and 2 respectively
(P=0.001 rest vs. exercise). See Figure 59 below. MPR was 3.3±0.5 for Ex1 and
3.1±0.4 for Ex2. There was an endo-‐ epicardial flow ratio at rest of 1.29±0.2 that
reduced to 1.04±0.2 after exercise 1 and 1.07±0.1 after exercise 2 (P= 0.02 vs. rest).
6.5 Discussion
At rest there is increased basal blood flow to the subendocardial layer of the
myocardium, resulting in an endo-‐epicardial perfusion gradient. Resting blood flow
is predominantly diastolic but as heart rate increases there is increased systolic
blood flow. The compressive forces of LV contraction cause impediment of coronary
blood flow during systole. This effect is not distributed evenly across the
myocardium, however, and a reduction in diastolic time fraction (DTF) with
increasing heart rate causes blood to be directed away from the subendocardium to
the subepicardial layer resulting in a loss of this perfusion gradient. The present
study was able to illustrate these important physiological differences using high
resolution CMR perfusion during large muscle exercise in vivo.
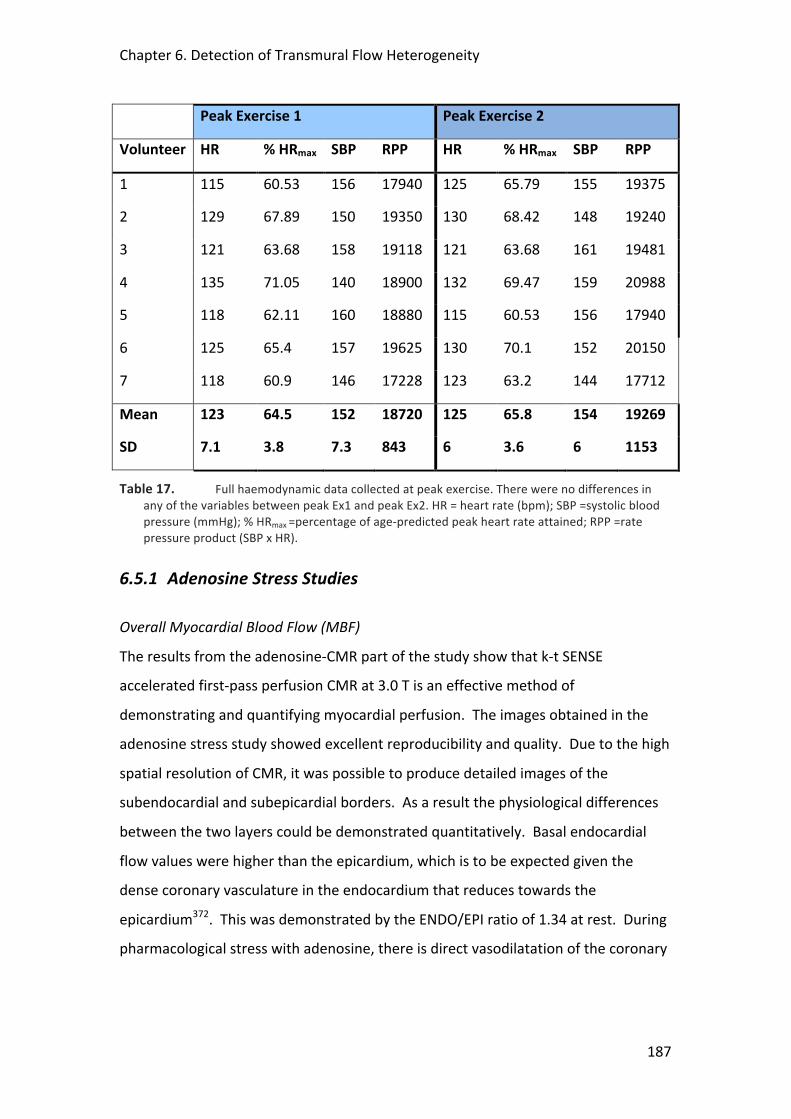
Chapter 6. Detection of Transmural Flow Heterogeneity
187
Peak Exercise 1 Peak Exercise 2
Volunteer HR % HRmax SBP RPP HR % HRmax SBP RPP
1 115 60.53 156 17940 125 65.79 155 19375
2 129 67.89 150 19350 130 68.42 148 19240
3 121 63.68 158 19118 121 63.68 161 19481
4 135 71.05 140 18900 132 69.47 159 20988
5 118 62.11 160 18880 115 60.53 156 17940
6 125 65.4 157 19625 130 70.1 152 20150
7 118 60.9 146 17228 123 63.2 144 17712
Mean 123 64.5 152 18720 125 65.8 154 19269
SD 7.1 3.8 7.3 843 6 3.6 6 1153
Table 17. Full haemodynamic data collected at peak exercise. There were no differences in any of the variables between peak Ex1 and peak Ex2. HR = heart rate (bpm); SBP =systolic blood pressure (mmHg); % HRmax =percentage of age-‐predicted peak heart rate attained; RPP =rate pressure product (SBP x HR).
6.5.1 Adenosine Stress Studies
Overall Myocardial Blood Flow (MBF)
The results from the adenosine-‐CMR part of the study show that k-‐t SENSE
accelerated first-‐pass perfusion CMR at 3.0 T is an effective method of
demonstrating and quantifying myocardial perfusion. The images obtained in the
adenosine stress study showed excellent reproducibility and quality. Due to the high
spatial resolution of CMR, it was possible to produce detailed images of the
subendocardial and subepicardial borders. As a result the physiological differences
between the two layers could be demonstrated quantitatively. Basal endocardial
flow values were higher than the epicardium, which is to be expected given the
dense coronary vasculature in the endocardium that reduces towards the
epicardium372. This was demonstrated by the ENDO/EPI ratio of 1.34 at rest. During
pharmacological stress with adenosine, there is direct vasodilatation of the coronary
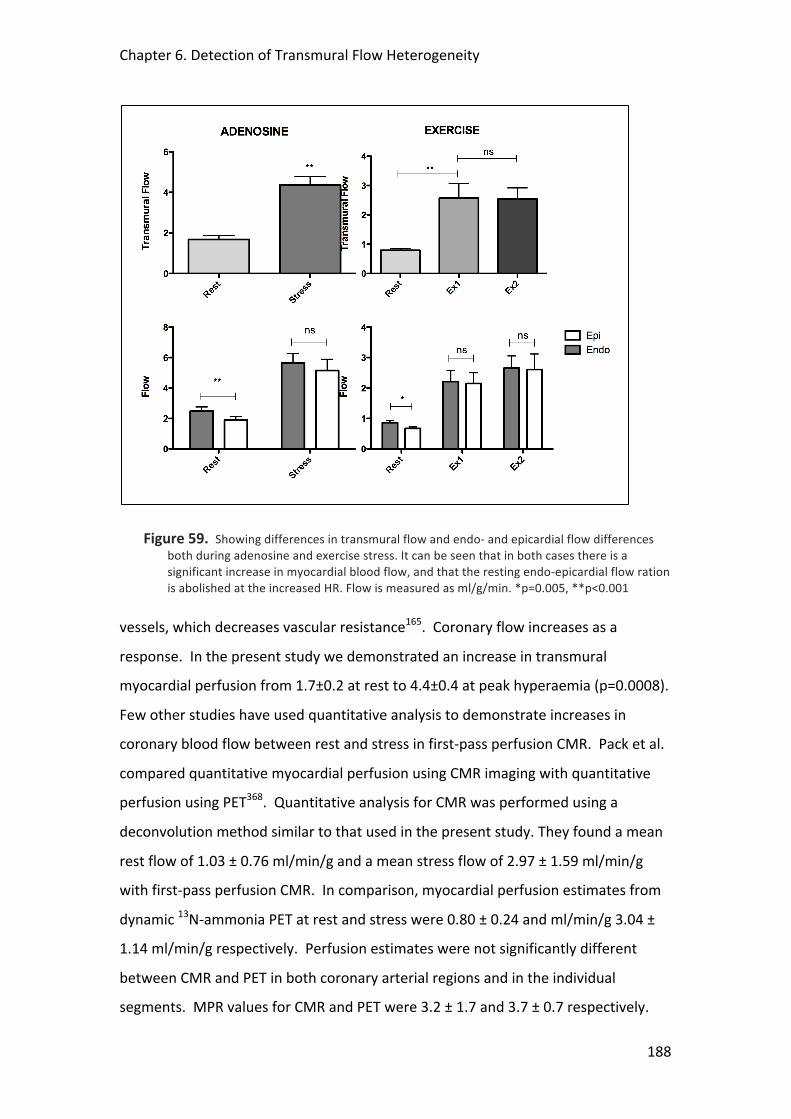
Chapter 6. Detection of Transmural Flow Heterogeneity
188
Figure 59. Showing differences in transmural flow and endo-‐ and epicardial flow differences both during adenosine and exercise stress. It can be seen that in both cases there is a significant increase in myocardial blood flow, and that the resting endo-‐epicardial flow ration is abolished at the increased HR. Flow is measured as ml/g/min. *p=0.005, **p<0.001
vessels, which decreases vascular resistance165. Coronary flow increases as a
response. In the present study we demonstrated an increase in transmural
myocardial perfusion from 1.7±0.2 at rest to 4.4±0.4 at peak hyperaemia (p=0.0008).
Few other studies have used quantitative analysis to demonstrate increases in
coronary blood flow between rest and stress in first-‐pass perfusion CMR. Pack et al.
compared quantitative myocardial perfusion using CMR imaging with quantitative
perfusion using PET368. Quantitative analysis for CMR was performed using a
deconvolution method similar to that used in the present study. They found a mean
rest flow of 1.03 ± 0.76 ml/min/g and a mean stress flow of 2.97 ± 1.59 ml/min/g
with first-‐pass perfusion CMR. In comparison, myocardial perfusion estimates from
dynamic 13N-‐ammonia PET at rest and stress were 0.80 ± 0.24 and ml/min/g 3.04 ±
1.14 ml/min/g respectively. Perfusion estimates were not significantly different
between CMR and PET in both coronary arterial regions and in the individual
segments. MPR values for CMR and PET were 3.2 ± 1.7 and 3.7 ± 0.7 respectively.
Chapter 6. Detection of Transmural Flow Heterogeneity
189
Hsu et al. also used a model of deconvolution to quantify myocardial blood flow in
first-‐pass perfusion CMR366. They found a mean flow of 1.02 ± 0.22 ml/min/g at rest
and 3.39 ± 0.58 ml/min/g during dipyridamole stress. Absolute myocardial blood
flow estimates using PET have yielded similar results. Ibrahim et al. found a mean
rest flow value of 0.8 ± 0.2 ml/min/g and a mean value of 2.9 ± 08 ml/min/g during
adenosine stress using PET367. MPR was 3.9 ± 1.2. Wyss et al. found a mean resting
flow value 1.22 ± 0.16 ml/min/g that increased to 5.13 ± 0.74 ml/min/g during
adenosine stress309. Our rest flow values appear to be slightly higher than reported
values. This may be due to background saturation of contrast agent whereby the LV
input function is underestimated and thus MBF estimate is larger. However, our
adenosine stress values are comparable with the reported ranges. Due to our higher
rest flow values, our MPR results were therefore slightly lower then the reported
values.
Transmural Flow Redistribution
At the standard doses of adenosine used in the clinical setting (140µg/kg/min) there
is often only a relatively small increase in heart rate. Because we wanted to
investigate the effects of alteration of DTF on redistribution of transmural MBF it
was important first to establish the changes in DTF in response to a standard
infusion of adenosine. This was the purpose of the initial stage of the study and it
clearly showed significant alterations in diastolic duration and DTF during adenosine-‐
induced hyperaemia, even though there was only a 21% increase in HR. Although we
did not specifically measure DTF in either the adenosine-‐CMR or the exercise-‐CMR
groups, we can assume that with similar increases in HR (even more so in the
exercise group) that there would be a corresponding reduction in DTF. The effect of
such a reduction is that there would be some redistribution of coronary flow from
the subendocardium towards the epicardium23, 69. This was reflected in the present
study by the subsequent decrease in the ENDO/EPI ratio from 1.34 at rest to 1.16
during adenosine hyperaemia (P=0.03). Christian et al. compared fluorescent
microsphere measurements of canine myocardial blood flow with qualitative,
semiquantitative, and fully quantitative measurements of first-‐pass perfusion using
magnetic resonance (MR) imaging293. They found that CMR full quantitative

Chapter 6. Detection of Transmural Flow Heterogeneity
190
assessment underestimated microsphere measurements of MBF. However, they
found reductions in the ENDO/EPI ratio with adenosine similar to those in the
present study falling from 1.2 to 0.9, and 1.05 to 0.97 for the microsphere and CMR
measurements during rest and adenosine respectively. There are few studies
examining this in humans. Keijer et al. studied a small group of patients with single
vessel coronary disease using perfusion CMR278. Despite the use of a standard
perfusion protocol achieving an in-‐plane spatial resolution of 3x2mm (compared to
1.2x1.2 in the present study) they were able to measure a resting ENDO/EPI ratio in
normal myocardium of 1.25±0.29. During dipyridamol stress (a similar vasodilator to
adenosine), this decreased to 1.08±0.23 (NS). In territories with a significant
coronary stenosis the values for the ENDO/EPI ratios were 1.18±0.18 and 0.96±0.21
(P< 0.0002). George et al. used multidetector CT perfusion imaging to quantify MBF
in patients with and without coronary artery disease369. They found ENDO/EPI ratio
of 1.12 during adenosine infusion in territories supplied by normal coronary arteries.
There were no measurements taken during rest. Like the study by Keijer, they also
found that the ENDO/EPI ratio was reduced in territories with significant coronary
stenoses where the ratio was 0.91.
6.5.2 Exercise Stress Study The adenosine studies demonstrated that we were able to detect differences in
myocardial transmural flow redistribution consistent with the literature, using k-‐t
SENSE accelerated perfusion CMR at 3 T. Because of the more dramatic effect on
heart rate it was hypothesised that large muscle exercise would provoke a similar, if
not even more significant change in ENDO/EPI myocardial blood flow patterns. Such
studies have not been previously carried out.
Absolute Flow Values Reduced Compared to Adenosine
In the present study transmural blood flow increased from 0.8±0.06 ml/g/min to
2.6±0.4 at peak exercise. Although they are still within the normal range from
previously published figures309, 366-‐368, these values are generally lower than we
found with adenosine where the MBF values were 1.7±0.2 at rest increasing to
4.4±0.4 at peak hyperaemia. In the study by Wyss et al. a mean resting flow value
Chapter 6. Detection of Transmural Flow Heterogeneity
191
1.22 ± 0.16 ml/min/g increased to 5.13 ± 0.74 ml/min/g during adenosine stress and
to 2.35 ± 0.66 ml/min/g during exercise309. The reduced exercise flow values were
attributed to volunteers not performing exercise to maximal level of effort, and to
the fact that images were taken immediately after exercise when heart rate and flow
would have fallen fairly rapidly. A similar effect could be seen in the present study.
Although in general the subjects achieved around 60-‐70% of their age-‐predicted
maximum heart rate and they were quickly re-‐introduced into the scanner, because
they were young and fit, there was a rapid decrement in their peak heart rate, such
that by the time of scanning (on average less than 1 minute after stopping cycling)
this had dropped below their peak. While this might explain the reduced peak flow
values compared to the adenosine, however, it does not explain the reduced resting
values. One of the major issues may have been the timing of the rest scan. In clinical
practice this is conventionally carried out after the stress scan and this was the case
for the adenosine volunteers. However, when we started the exercise protocol, we
found that although peak heart rate dropped rapidly subjects took a long time to
return to baseline conditions. Therefore we changed the protocol around so that the
rest scan took place first. Although previous data from our department suggests that
the effects of this should be minimal [see Chapter 2], it is possible that values for the
rest scan in the adenosine protocol therefore may have been generally higher due to
the effects of background contrast saturation. In addition, the images in the exercise
study were generally noisier than the adenosine scans; increased movement and
breathing artefact as well as dark rim, or susceptibility, artefacts associated with
increased heart rates made accurate quantification analysis more difficult. Because
k-‐t SENSE utilises data under-‐sampling methods to accelerate scan time it is
especially susceptible to any movement that can result in loss of data222. The high
heart rates also made it more difficult to ensure that the timing of the scan occurred
during mid-‐systole when the myocardium is thickest, the point where mapping of
the endo-‐ and epicardial boarders is most accurate. Taken together, these factors
may have resulted in less data being available to input into the Fermi deconvolution
algorithm resulting in an underestimation of absolute flow values.
Chapter 6. Detection of Transmural Flow Heterogeneity
192
Detection of Transmural Flow Heterogeneity
Although the absolute flow values seem to have been underestimated in the
exercise study, the relative increases exceeded those with the adenosine. The MPR
was 3.3±0.5 for Ex1 and 3.1±0.4 for Ex2, while the MPR for adenosine was 2.6±0.5.
Differences between flow in the subendocardium and subepicardium were also
detectable in the exercise studies. There was an ENDO/EPI flow ratio at rest of
1.29±0.2 that reduced to 1.04±0.2 after exercise 1 and 1.07±0.1 after exercise 2 (P=
0.02 vs. rest). These are similar values to those previously reported, although this is
the first time such data has been recorded in vivo. Ball et al. found an ENDO/EPI ratio
of 1.12-‐1.33 in various regions of the left ventricle in resting unanaesthetized dogs
using tracer microspheres21. As the dogs were subjected to increasing levels of
exercise, decreases in the ENDO/EPI ratio were observed, with an ENDO/EPI ratio of
0.95-‐1.14 at maximal exercise. Similarly, Barnard et al. also observed a decrease in
the left ventricular ENDO/EPI ratio from 1.29 during rest to 1.03 during exercise in
dogs46.
6.6 Limitations
Both studies involved a small number of patients. Although previous studies have
demonstrated the feasibility of k-‐t SENSE accelerated first-‐pass perfusion CMR in
healthy volunteers and patients221, 288, reproducibility of subendocardial and
subepicardial data need to be explored further in larger samples.
As discussed earlier, the images and data obtained from the exercise stress first-‐pass
perfusion CMR test were often sub-‐optimal. In 4 out of the 11 volunteers it was not
possible to analyse completely all three scans due to excessive artefacts. Data from
these subjects were therefore not included in the final analysis. This represents a
significant proportion of the population and reflects the difficulties of scanning
under such conditions. There is a need to optimize the sequence for physical
exercise further focusing on the need to increase the speed of data acquisition and
reduction in the incidence of respiratory and other movement-‐induced artefacts.
Potential options that we have considered might include: reconstruction of the
Chapter 6. Detection of Transmural Flow Heterogeneity
193
perfusion sequence with kt-‐BLAST and rather than kt-‐SENSE; use of a saturation
'slab' over the anterior chest wall to nullify the signal from the chest which is the
most frequent source of artefact in k-‐space; caudal-‐cranial fold-‐over direction as
opposed to anterior-‐posterior; a new reconstruction protocol called kt-‐PCA (not
available at the time of our studies), which rejects signals that vary too much from
the mean of the surrounding tissue and reduces the impact of artefact on the
averaged output335; use of much lower doses of Gd-‐DTPA (e.g. 0.004mmol/kg),
which avoids potential signal saturation that can occur with higher contrast doses on
the second and third perfusion scans. All of these need to be fully tested and then
incorporated into an updated scanning protocol but it is hoped that they will
substantially improve the quality and consistency of the perfusion images. Further
work also needs to be carried out to assess the inconsistency in the absolute flow
values measured across the studies.
6.7 Future Work
“Gradientograms”
In the present study, we measured the relationship between endo-‐ and epicardial
myocardial blood flow by dividing the myocardium into thirds and comparing mean
flows across each of these segments. Although this is a standard technique and used
in other studies278 it is relatively crude in that it does not account for variations in
flow within each of these segments. Data from the present study was therefore used
to describe a new approach for characterization and visualization of regional and
dynamic differences in myocardial contrast uptake. Conventional quantitative
assessments of myocardial perfusion analyse the temporal relation between the
arterial input function and the myocardial signal intensity (SI) curves, thereby
neglecting the important spatial relation between the myocardial SI curves. The new
method published in MRM enables characterisation of sub-‐endocardial to
subepicardial gradients in myocardial perfusion based on a two dimensional,
‘‘gradientogram’’ representation, which displays the evolution of the transmural
Chapter 6. Detection of Transmural Flow Heterogeneity
194
gradient in myocardial contrast uptake over time in all circumferential positions of
the acquired images290. This gradientogram allows for direct quantification of the
gradient amplitude, the temporal persistence, and circumferential extent of
myocardial perfusion defects and it revealed a clear distinction between normal
perfusion and inducible ischaemia in patients with coronary arterial disease during
adenosine hyperaemia. This analysis has not yet been carried out in the exercise-‐
CMR subjects because, so far, the perfusion images in this group have not been of
sufficient quality. However, this works represents an exciting new method to
examine in detail the changes in transmural flow that occur in response to stress.
Transmural Flow Redistribution and “Warm-‐Up”: A Potential Mechanism?
In Chapter 5 of this thesis we documented that microvascular resistance falls in
response to large muscle exercise in patients with coronary artery disease and
angina. This fall in resistance corresponded with an increase in coronary flow
velocity and a fall in LV afterload due to a reduction in arterial wave reflection in the
aorta. These changes persisted through recovery and into a second exercise period,
resulting in a warm-‐up effect; manifested as increased time to, and greater workload
at the point of ECG-‐ischaemia. Experimental work in animals has shown that with
reducing DTF, subendocardial perfusion becomes dependent on a fall in
microvascular resistance to maintain diastolic perfusion336, 342. These changes
become even more critical in the presence of a coronary stenosis, where the resting
ENDO/EPI perfusion ration may be attenuated278, 369 and vasodilator capacity may be
already near maximal60, 69, 336. It has been suggested that warm-‐up may result from
changes in coronary blood flow. Previous studies have failed to demonstrate
changes in overall coronary flow although such studies used outmoded measures of
myocardial blood flow such as coronary sinus sampling103, 104, 345. It may be that,
rather than changes in bulk flow, warm-‐up arises through more subtle changes in
transmural flow redistribution with enhanced subendocardial perfusion attenuating
ischaemia. This would be consistent with the changes in microvascular resistance
that we reported in the catheter lab studies described in Chapter 5. Bogaty et al.
investigated this using SPECT in patients with exertional angina, but they were not
able to demonstrate any changes in flow between the myocardial layers116; again
Chapter 6. Detection of Transmural Flow Heterogeneity
195
this may have been due to imperfect techniques with the poor spatial resolution
afforded by SPECT not sufficient to detect such differences.
The techniques developed in this chapter, as well as the exciting advances afforded
by the “gradientogram” analysis outlined above, provide a good model to investigate
the changes in transmural myocardial blood flow that accompany heavy exercise in
patients with ischaemic heart disease. Following these initial promising results in
normal volunteers, and after further optimisation of the scanning protocol outlined
above, the next stage of my research was to recruit patients with significant
coronary arterial disease and angina. Full ethical approval had been obtained for
this. Indeed, we got as far as recruiting and scanning a couple of patients, but after
this the 3T scanner at St Thomas’ underwent a major refurbishment, which in the
end lasted 10 months and meant that I was not able to recruit any further patients
or conduct any further studies into this part of my PhD research. Now that the
scanner is operational once again, this line of investigation into mechanisms of
warm-‐up is being continued by my colleagues, Dr. Kal Asrass and Dr. Rupert
Williams, as part of their PhD theses; they have received BHF funding to do so, partly
based on the preliminary data provided in this chapter.
6.8 Conclusion
Exercise stress testing remains the most physiological method of inducing
myocardial stress. Due to high heart rate and respiratory motion the feasibility of
physiological stress in the MR environment has limited its clinical and scientific
application, but following the development of high-‐resolution CMR methods, these
responses now can be measured. k-‐t SENSE is associated with improved temporal
and spatial resolution of perfusion CMR through acceleration of data acquisition.
These results suggest that using k-‐t SENSE we can detect and quantify changes in
flow to the different myocardial layers. We were able to demonstrate that at rest
endocardial flow was greater than epicardial; and, as heart rate increases, there is an
equalisation in flow due to the redistribution of blood secondary to the
disproportionate effect of systolic flow impediment on the subendocardial layer.

Chapter 6. Detection of Transmural Flow Heterogeneity
196
These data are consistent with the available physiological literature. We are not
aware of any previous studies that have documented transmural myocardial flow
heterogeneity in response to exercise stress in vivo. Although in need of some
further refinement, these studies provide a model suited to investigate potential
mechanisms of clinically important phenomena such as warm-‐up angina that may
arise through changes in transmural perfusion gradients.
6.9 Acknowledgments
I would like to thank AG for his assistance in the blinded analysis of the DTF data. MI
and HT carried out the blinded analysis of the adenosine perfusion data, and RW and
HT carried out the analysis of the exercise perfusion data. KA assisted in the
recruitment and the exercise volunteer studies. SP, EN, AC and SK provided
invaluable advice and assistance in the perfusion analysis. SR assisted in the
catheterisation lab measurements and analysis. MM provided overall guidance and
support throughout. Dr. Chris Schofield from the Dept. of Medical Statistics, KCL,
provided statistical support. I would like to thank the BHF for funding this research.
Support was also provided by a grant from the BRC.
197
7 SYNTHESIS
The purpose of this synthesis is to summarise the major findings and implications of
the studies that are the focus of this thesis.
7.1 Aims and Hypotheses of this Thesis
The response of the human heart to ischaemic stress is variable and a variety of
potential adaptive mechanisms attenuate myocyte damage and improve
performance. Such mechanisms are poorly understood and may include innate
myocardial responses, changes in microvascular function and more general systemic
haemodynamic adaptations. The main aim of this thesis was to examine some of
these adaptive mechanisms to ischaemic stress, using the models of exercise
induced myocardial ischaemia and acute myocardial infarction. In the former, we
sought to use invasive physiological measurements and high-‐resolution cardiac
magnetic resonance imaging to assess changes in coronary blood flow, central
haemodynamics and transmural myocardial perfusion in patients with symptomatic
coronary arterial disease. In the latter, we sought to examine the role of post-‐
conditioning as a potential therapeutic tool in a randomised controlled trial involving
patients undergoing primary percutaneous revascularisation for acute myocardial
infarction.
Key Hypotheses Under Investigation in this Thesis
4. The reduction of ischaemia seen on second exercise in patients with coronary
artery disease can be explained by changes in central haemodynamics,
especially a reduction in central blood pressure causing a reduction in
ventricular afterload and enhanced vascular-‐ventricular coupling.
5. Warm up angina is associated with reduced microvascular resistance and an
improvement in subendocardial perfusion on second exercise
6. Postconditioning causes a reduction in infarct size through activation of
innate myocardial protective mechanisms
Chapter 7. Synthesis
198
7.2 Summary of the Main Findings
7.2.1 Postconditioning in Acute Myocardial Infarction
Initial clinical results using a postconditioning protocol in the context of primary
percutaneous revascularisation (PPCI) have been promising148, 319, but whether
postconditioning results in a long-‐term sustained attenuation of post-‐ischaemic
injury and infarct reduction rather than simply a delay in inevitable injury is a
question still to be determined. The demonstration of such an effect would add
significantly to the argument of the existence of intrinsic cardiac protection in
ischaemic heart disease patients, where the promise of such a phenomenon based
on laboratory studies has perhaps failed to live up to expectations in the clinical
setting. The purpose of the initial studies of this thesis was to design and undertake
a randomised clinical trial examining these long-‐term effects. Cardiac magnetic
resonance imaging (CMR) was chosen to assess infarct size, both at baseline and at
follow-‐up as it provides unique tissue characterisation of the myocardium with high
resolution and reproducibility and without the use of ionising radiation. CMR is also
able to track both changes in LV segmental wall thickening and the presence of
microvascular obstruction (MVO). It is suggested that by ameliorating the
deleterious effects of reperfusion injury in the first minutes following restoration of
coronary flow postconditioning will reduce MVO and promote LV recovery over and
above the reduction in infarct size alone.
Out of the 33 patients randomised into the study there was a high proportion who
dropped out, with 8 being excluded in the postconditioning (PC) arm and 6 excluded
in the control arm before the cath lab protocol was completed. There was no
suggestion that the PC protocol of re-‐occluding the vessel with serial balloon
inflations was associated with procedural complications and, indeed, it was tolerated
very well by the patients. 5 further patients dropped out before the second CMR
scan could be performed at 5 month follow-‐up, including one patient who had a
cardiac defibrillator fitted. Such difficulties in recruitment and follow-‐up greatly
hampered our ability to complete this trial.
Chapter 7. Synthesis
199
The main results of the interim analysis of this randomised, prospective study
examining the benefits of postconditioning compared to control in a population of
patients undergoing primary PCI for acute ST-‐elevation MI suggest an improvement
in tissue perfusion, based on ST-‐segment resolution on the ECG, but no reduction in
infarct size. These results must be treated cautiously as they are not powered to
determine any significant differences due to low numbers. Hence the hypothesis
that postconditioning causes a reduction in infarct size through activation of innate
myocardial protective mechanisms cannot be answered decisively with these data.
7.2.2 High Resolution CMR Perfusion Imaging in Stable Coronary
Disease
The principle tools required for the studies involving stable IHD patients were high-‐
speed and high-‐resolution CMR imaging and invasive dual-‐sensor coronary
measurements in the cardiac catheterisation lab. Both of these involved the
development of a specially adapted supine ergometer that would be used to
exercise the patients to provoke myocardial ischaemia. For the CMR protocol, data
sampling had to be very fast, not only to allow imaging at high heart rates such as
during peak exercise but also to allow high-‐resolution imaging required to determine
differences in endo-‐ and epicardial patterns of perfusion. New CMR acquisition
strategies that simultaneously take advantage of coil encoding and spatiotemporal
correlations, such as k-‐space and time sensitivity encoding (k-‐t SENSE), allow
considerable acceleration of CMR data acquisition220. Scanning at higher field
strength of 3-‐Tesla offers better signal-‐to-‐noise ratio with a reduction in artefacts
compared to the more standard 1.5-‐T. The use of such perfusion sequences
therefore offered distinct advantages over standard perfusion techniques. However,
because there have been only few studies using k-‐t perfusion at 3-‐T a validation
study was first required comparing it’s diagnostic accuracy with the invasively
measured fractional flow reserve (FFR). This was carried out in a cohort of patients
at St Thomas’ hospital with stable angina pectoris and single vessel coronary arterial
disease being considered for percutaneous revascularisation (PCI). A group of
Chapter 7. Synthesis
200
normal volunteers was also scanned in order to optimise the k-‐t perfusion sequence
and to validate the full perfusion quantification methods used in the main study.
The main results of the study showed that high-‐resolution myocardial perfusion CMR
imaging accurately detects functionally significant coronary artery stenosis as
determined by FFR using both visual and quantitative analysis of the perfusion data.
Measurements of myocardial blood flow obtained from CMR perfusion correlated
better with the physiologically based FFR than with anatomical assessment of the
coronary angiogram, which is to be expected. Importantly, the data from this study
suggested that these CMR methods were robust and accurate with good
reproducibility and repeatability, and could be used in the further studies of this
thesis.
7.2.3 Synergistic Adaptations in Warm-‐Up Angina
The mechanisms of the phenomenon warm-‐up angina remain elusive. Warm-‐up
shares many characteristics with ischaemic preconditioning but also maintains
distinct differences, which suggest that other factors may predominate. During
repetitive exercise, differences in ventricular afterload, subendocardial perfusion
and microvascular resistance that relate to the propagation of waves within the
aortic and coronary circulation may play an important role, although such
adaptations have never been demonstrated in vivo.
In our study population of patients with severe coronary disease warm-‐up was
confirmed on second effort (Ex2). Careful analysis of systemic and coronary
haemodynamics during first and second exercise revealed a number of highly
significant and interdependent alterations that likely contribute to this effect. Most
striking amongst these was a reduction in central aortic pressure augmentation
hence reducing left ventricular work. This was accompanied by a reduction in
coronary microvascular resistance leading to a higher coronary blood flow velocity
and an increased flow-‐accelerating backward expansion wave at the onset of
diastole, reflecting the important interaction of cardiac-‐coronary coupling and
microvascular conduction with respect to enhancing myocardial perfusion. These
combined adaptations synergistically served to alleviate the imbalance between
Chapter 7. Synthesis
201
myocardial demand and supply and resulted in the improved performance seen on
second exercise. These data are unique and such work has not been previously
carried out. They shine light on one of the main hypotheses of this thesis, suggesting
that important changes in central haemodynamics, especially a reduction in central
blood pressure do cause a reduction in ventricular afterload and enhanced vascular-‐
ventricular coupling. They also support the hypothesis that warm up angina is
associated with reduced microvascular resistance, that in turn would be expected to
lead to an improvement in subendocardial perfusion on second exercise. To address
this issue of enhanced subendocardial perfusion specifically we turn to the last series
of studies reported in this thesis.
7.2.4 Transmural Flow Heterogeneity During Exercise
The revealing results from the exercise studies in the catheterisation lab, showing
reduced microvascular resistance and enhanced coronary-‐cardiac interaction on
second exercise, strongly suggest that an important component of warm-‐up results
from the transmural redistribution of myocardial blood towards the vulnerable
subendocardial layer. This formed the final hypothesis under investigation in this
thesis and utilised the high-‐speed CMR perfusion techniques developed in our earlier
studies. To be able to detect such changes in vivo at peak exercise represented a
considerable challenge, testing our technical capabilities to the limit due to the
problems caused by high heart rates and breathing and movement artefacts. Even in
healthy volunteers, many iterations and much fine-‐tuning of the perfusion sequence
was required before any meaningful data could be obtained. However, finally we
were able to obtain good signals and quantification of myocardial blood flow
demonstrated flow heterogeneity during exercise; the first time such data has been
acquired during exercise in human subjects. Subsequently, we had started acquiring
data from patients with coronary disease with a serial exercise warm-‐up protocol but
unfortunately this coincided with extensive refurbishment and upgrade of the 3T
research scanner, which meant that I was not able to carry out any further data
collection for the duration of my research time. Therefore, while the changes in
microvascular function and increase in the backward-‐travelling coronary suction
wave on second exercise allude to enhanced subendocardial perfusion as a key
Chapter 7. Synthesis
202
element in warm-‐up in patients with exertional angina, we have not been able to
address this question directly from the results of this study.
7.3 Conclusion
The mechanisms of adaptation of the heart to ischaemic stress are complex and
likely multifactorial. We were able to demonstrate that the reduction of ischaemia
seen on second exercise in patients with stable coronary artery disease is associated
with synergistic changes in central and coronary haemodynamics, especially a
reduction in central blood pressure causing a reduction in ventricular afterload and
enhanced vascular-‐ventricular coupling. This is also accompanied by a reduction in
myocardial microvascular resistance suggesting a generalised reactive hyperaemic
vasodilatory response to exercise that results in improved myocardial perfusion and
overall performance. Transmural flow redistribution to the subendocardium is likely
to play an important role in attenuating myocardial ischaemia on repeat exercise
although we await the results of ongoing work. High-‐speed CMR perfusion imaging
using k-‐t acceleration is a feasible tool to investigate these differences, with
sufficient spatial resolution to detect transmural flow heterogeneity. Innate
myocardial protection, such as that afforded by postconditioning remains a
possibility, although the results from this study are inconclusive.

203
8 PUBLICATIONS AND PRESENTATIONS RELATING TO THIS
THESIS
Chapter 1. Introduction
• Lockie, T, Nagel, E, Redwood, S, Plein, S. The Use of Cardiovascular Magnetic
Resonance Imaging in Acute Coronary Syndromes. Circulation 2009;119;
1671-‐1681
• Lockie T, Plein S, Redwood S. Microvascular Obstruction Following Primary
Angioplasty: Beyond the Epicardial Artery. Heart Metab. 2008;40:26-‐29
Chapter 2. Methods
• T Lockie, D Perera, K de Silva, I Webb, S Redwood. The Impact of Measuring
Fractional Flow Reserve on Decision Making in the Cath Lab in an Unselected
Cohort of Patients Being Considered for Coronary Revascularisation. J
Invasive Cardiol. 2010 Sep;22 (9):413-‐6
• Tim Lockie, Masaki Ishiri, Eike Nagel, Mike Marber, Sven Plein. Validation of a
Cycle Ergometer High resolution MR Stress Perfusion Technique in Normal
Volunteers. Moderated poster presentation British Cardiovascular Society
Scientific Sessions, Manchester June 2010 Heart 2010; 96:A49;
doi:10.1136/hrt.2010.196071.3
• Christian Stehning, Tim Lockie, Eike Nagel, Sven Plein. Myocardial T1 During
Multiple Bolus Injections. Oral presentation at ISMRN, Hawaii, USA May 2010
Chapter 3. Postconditioning in Acute Myocardial Infarction
• A Mather T Lockie, E Nagel, M Marber, D Perera, S Redwood, A Radjenovic, A
Saha, J Greenwood, Sven Plein. Appearance of microvascular obstruction on
high-‐resolution first-‐pass perfusion, early and late gadolinium enhancement
CMR in patients with acute myocardial infarction. J of Cardiovascular
Magnetic Resonance 2009, 11:33-‐37
Publications and Presentations Relating to this Thesis
204
• Tim Lockie, Ian Webb, Amedeo Chiribiri, Mrin Saha, Rupert Williams, Sven
Plein, Divaka Perera, Simon Redwood, Michael Marber. Postconditioning To
Reduce Infarct Size Following Acute Myocardial Infarction. Best Original
Resuscitation Science, Moderated Poster Session, American Heart
Association, Orlando, 2009. Circulation. 2009;120:S1467-‐S1468.
• C. Jansen, A.Wiethoff, M. Makowski, T. Lockie, A. Chiribiri, R. Razavi, E. Nagel,
G.Greil, S. Redwood, D. Perrera, R.M. Botnar Contrast enhanced magnetic
resonance imaging of culprit lesions in patients with late presentation
myocardial infarction. Presentation at the AHA, Orlando, 2009; Circulation.
2009;120:S1201-‐S1220
Chapter 4. High-‐Resolution Magnetic Resonance Perfusion
• Motwani M, Lockie T, Greenwood JP, Plein S . Accelerated, high spatial
resolution cardiovascular magnetic resonance myocardial perfusion imaging.
J Nucl Cardiol. 2011 Oct;18(5):952-‐8.
• T Lockie, M Ishiwa, D Perera, K de Silva, S Kozerke, M Marber, E Nagel, S
Redwood, S Plein. High-‐resolution magnetic resonance myocardial perfusion
imaging at 3 tesla to detect haemodynamically significant coronary stenoses
as determined by fractional flow reserve. Journal of the American College of
Cardiology 2010 vol. 57 (1) pp. 70-‐5
• Winner Young Investigator Award (Clinical Science), SCMR Scientific
Sessions, Phoenix, Arizona, Jan2010. Journal of Cardiovascular Magnetic
Resonance 2010, 12(Suppl 1):O3
• Amedeo Chiribiri, Gilion Hautvast, Tim Lockie, Andreas Schuster, Boris
Bigalke, Luca Olivotti, Simon Redwood, Marcel Breeuwer, Sven Plein, Eike
Nagel Transmural perfusion gradient analysis by high-‐resolution MR versus
fractional flow reserve for the assessment of coronary artery stenosis.
Journal of Cardiovascular Magnetic Resonance 2012, 14(Suppl 1):O90 (1
February 2012)
Publications and Presentations Relating to this Thesis
205
Chapter 5. Synergistic Adaptations to Warm-‐Up Angina
• T.P.E Lockie, M.C Rolandi, A. Guilcher, D. Perera, K. De Silva, R. Williams, K.N.
Asrress, K. Patel, S. Plein, P. Chowienczyk, M. Siebes, S.R Redwood, M.S
Marber. Synergistic Adaptations to Exercise in the Systemic and Coronary
Circulations that Underlie the Warm-‐Up Angina Phenomenon. Circulation
2012 Nov 27;126(22):2565-‐74
• Associated Editorial: Usman Baber and George Dangas. Exercise Physiology in
the Cath Lab: Still Alive and Well! Circulation. 2012 Nov 27;126(22):2550-‐2
• C. Rolandi, Tim Lockie, Antoine Guilicher, Divaka Perera, Mike Marber, Simon
Redwood, Maria Siebes. The Effect of Warm-‐Up Exercise on Myocardial
Perfusion Studies with Wave Intensity Analysis. Oral presentation at
European Conference of the International Federation for Medical and
Biological Engineering, September 14-‐18, 2011, Budapest, Hungary
• Tim Lockie, Antoine Guilcher, Cristina Rolandi, Divaka Perera, Phil
Chowienzyk, Sven Plein, Maria Siebes, Simon Redwood, Mike Marber. Warm
Up Angina is Reduced Arterial Wave Reflection and Enhanced LV Relaxation
Contribute to Warm-‐Up Angina. Presented as moderated poster at British
Cardiovascular Society Scientific Sessions, Manchester June 2011 Heart. 97:
A28-‐29. doi:10.1136/heartjnl-‐2011-‐300198.41
• Young Investigator Finalist –Advanced Cardiovascular Interventions, British
Cardiovascular Intervention Society, London, Jan 2011
• Tim Lockie, Antoine Guilcher, Cristina Rolandi, Divaka Perera, Phil
Chowienzyk, Sven Plein, Maria Siebes, Simon Redwood, Mike Marber. The
Heart Sucks While the Circulation Complies. Poster presentation
MRS/AMS/RCP meeting for Clinical Scientists RCP Feb 2011
Chapter 6. Transmural Flow Heterogeneity During Exercise.
• A Chiribiri, G Hautvast, T Lockie, A Schuster, B Bigalke, L Olivotti, S Redwood,
M Breeuwer, S Plein, E Nagel. Quantitative analysis of transmural perfusion
gradients by high-‐resolution magnetic resonance versus fractional flow
reserve for the assessment of coronary artery stenosis severity and location.
Accepted for publication JACC:Imaging July 2012 (in press)
Publications and Presentations Relating to this Thesis
206
• G Hautvast, A Chiribiri, T Lockie, M Breeuwer, E Nagel, S Plein. Quantitative
Analysis of Transmural Gradients in Perfusion CMR Images. Magn Reson
Med. 2011 Nov;66(5):1477-‐87
• Asrress KN, Lockie T, Williams R, , Biglands J, De Silva K, Radjenovic A, Kozerke
S, Nagel E, Chowienczyk P, Marber M, Redwood SR, Plein S. Increased
endocardial to epicardial flow ratio present at rest disappears during exercise
stress in normal volunteers. Oral presentation at SCMR, Orlando, Jan 2012.
Journal of Cardiovascular Magnetic Resonance 2012, 14(Suppl 1):P230 (1
February 2012)
• Asrress KN, Lockie T, Williams R, , Lossnitzer D, Jogiya R, Kozerke S,
Chowienczyk P, Greil G, Marber MS, Nagel E, Redwood SR, Plein S. The Use
of Feature Tracking to Assess Ventricular Strain During Exercise Stress in
Normal Volunteers. Oral presentation at SCMR, Orlando, Jan 2012. Journal of
Cardiovascular Magnetic Resonance 2012, 14(Suppl 1):P226 (1 February
2012)
• Tim Lockie, Hanson Tang, Masaki Ishiri, Kalpa De Silva, Mike Marber, Eike
Nagel, Sven Plein. Transmural Flow Heterogeneoity can be Demonstrated in
Normal Volunteers Using Full Quantification of kt-‐SENSE Accelerated
Myocardial Perfusion at 3Tesla. Poster presentation at EuroCMR, Florence,
Italy, May 2010.
• Tim Lockie, Masaki Ishiri, Eike Nagel, Mike Marber, Sven Plein. The use of a
cycle ergometer to calculate myocardial perfusion reserve with kt-‐SENSE
accelerated myocardial perfusion imaging at 3 Tesla. Presented at SCMR
Scientific Sessions, Phoenix, Arizona, USA, Jan 2010. Journal of Cardiovascular
Magnetic Resonance 2010, 12(Suppl 1):O145
207
9 REFERENCES
1. Bateman TM, Prvulovich E. Assessment of prognosis in chronic coronary artery disease. Heart. 2004;90 Suppl 5:v10-‐15
2. Heberden J. A letter to dr heberden, concerning the angina pectoris; and an account of the dissection of one; who had been troubled with that disorder. Medical Transactions, Royal College of Physicians in London. 1785;3:1-‐11
3. Kuo L, Davis MJ, Chilian WM. Longitudinal gradients for endothelium-‐dependent and -‐independent vascular responses in the coronary microcirculation. Circulation. 1995;92:518-‐525
4. Kuo L, Davis MJ, Chilian WM. Myogenic activity in isolated subepicardial and subendocardial coronary arterioles. Am J Physiol. 1988;255:H1558-‐1562
5. Jones CJ, Kuo L, Davis MJ, Chilian WM. Regulation of coronary blood flow: Coordination of heterogeneous control mechanisms in vascular microdomains. Cardiovasc Res. 1995;29:585-‐596
6. Spaan JA, ter Wee R, van Teeffelen JW, Streekstra G, Siebes M, Kolyva C, Vink H, Fokkema DS, VanBavel E. Visualisation of intramural coronary vasculature by an imaging cryomicrotome suggests compartmentalisation of myocardial perfusion areas. Med Biol Eng Comput. 2005;43:431-‐435
7. Feigl EO. Coronary physiology. Physiol Rev. 1983;63:1-‐205 8. Laughlin MH, Tomanek RJ. Myocardial capillarity and maximal capillary
diffusion capacity in exercise-‐trained dogs. J Appl Physiol. 1987;63:1481-‐1486 9. Richalet JP, Soulard C, Nitenberg A, Teisseire B, de Bovee J, Seroussi S.
Myocardial oxygen extraction and oxygen-‐hemoglobin equilibrium curve during moderate exercise. Eur J Appl Physiol Occup Physiol. 1981;47:27-‐39
10. Suga H. Ventricular energetics. Physiol Rev. 1990;70:247-‐277 11. Jorgensen CR, Gobel FL, Taylor HL, Wang Y. Myocardial blood flow and
oxygen consumption during exercise. Ann N Y Acad Sci. 1977;301:213-‐223 12. Sonnenblick EH, Braunwald E, Williams JF, Jr., Glick G. Effects of exercise on
myocardial force-‐velocity relations in intact unanesthetized man: Relative roles of changes in heart rate, sympathetic activity, and ventricular dimensions. J Clin Invest. 1965;44:2051-‐2062
13. Merkus D, Sorop O, Houweling B, Hoogteijling BA, Duncker DJ. Kca+ channels contribute to exercise-‐induced coronary vasodilation in swine. Am J Physiol Heart Circ Physiol. 2006;291:H2090-‐2097
14. Koch-‐Weser J, Blinks JR. The influence of the interval between beats on myocardial contractility. Pharmacol Rev. 1963;15:601-‐652
15. Ekstrom-‐Jodal B, Haggendal E, Malmberg R, Svedmyr N. The effect of adrenergic -‐receptor blockade on coronary circulation in man during work. Acta Med Scand. 1972;191:245-‐248
16. Jorgensen CR, Wang K, Wang Y, Gobel FL, Nelson RR, Taylor H. Effect of propranolol on myocardial oxygen consumption and its hemodynamic correlates during upright exercise. Circulation. 1973;48:1173-‐1182
17. Poliner LR, Dehmer GJ, Lewis SE, Parkey RW, Blomqvist CG, Willerson JT. Left ventricular performance in normal subjects: A comparison of the responses to exercise in the upright and supine positions. Circulation. 1980;62:528-‐534

References
208
18. Horwitz LD, Atkins JM, Leshin SJ. Role of the frank-‐starling mechanism in exercise. Circ Res. 1972;31:868-‐875
19. Vatner SF, Franklin D, Higgins CB, Patrick T, Braunwald E. Left ventricular response to severe exertion in untethered dogs. J Clin Invest. 1972;51:3052-‐3060
20. Khouri EM, Gregg DE, Rayford CR. Effect of exercise on cardiac output, left coronary flow and myocardial metabolism in the unanesthetized dog. Circ Res. 1965;17:427-‐437
21. Ball RM, Bache RJ, Cobb FR, Greenfield JC, Jr. Regional myocardial blood flow during graded treadmill exercise in the dog. J Clin Invest. 1975;55:43-‐49
22. Nelson RR, Gobel FL, Jorgensen CR, Wang K, Wang Y, Taylor HL. Hemodynamic predictors of myocardial oxygen consumption during static and dynamic exercise. Circulation. 1974;50:1179-‐1189
23. Duncker DJ, Ishibashi Y, Bache RJ. Effect of treadmill exercise on transmural distribution of blood flow in hypertrophied left ventricle. Am J Physiol. 1998;275:H1274-‐1282
24. Kitamura K, Jorgensen CR, Gobel FL, Taylor HL, Wang Y. Hemodynamic correlates of myocardial oxygen consumption during upright exercise. J Appl Physiol. 1972;32:516-‐522
25. Namdar M, Koepfli P, Grathwohl R, Siegrist PT, Klainguti M, Schepis T, Delaloye R, Wyss CA, Fleischmann SP, Gaemperli O, Kaufmann PA. Caffeine decreases exercise-‐induced myocardial flow reserve. J Am Coll Cardiol. 2006;47:405-‐410
26. Wyss CA, Koepfli P, Mikolajczyk K, Burger C, von Schulthess GK, Kaufmann PA. Bicycle exercise stress in pet for assessment of coronary flow reserve: Repeatability and comparison with adenosine stress. J Nucl Med. 2003;44:146-‐154
27. Heiss HW, Barmeyer J, Wink K, Hell G, Cerny FJ, Keul J, Reindell H. Studies on the regulation of myocardial blood flow in man. I.: Training effects on blood flow and metabolism of the healthy heart at rest and during standardized heavy exercise. Basic Res Cardiol. 1976;71:658-‐675
28. Richmond KN, Tune JD, Gorman MW, Feigl EO. Role of k(atp)(+) channels and adenosine in the control of coronary blood flow during exercise. J Appl Physiol. 2000;89:529-‐536
29. Parks CM, Manohar M. Distribution of blood flow during moderate and strenuous exercise in ponies (equus caballus). American journal of veterinary research. 1983;44:1861-‐1866
30. Parks CM, Manohar M. Transmural coronary vasodilator reserve and flow distribution during severe exercise in ponies. J Appl Physiol. 1983;54:1641-‐1652
31. Cerretelli P DPP. Gas exchange in exercise. Handbook of physiology. The respiratory system. Gas exchange. Bethesda; 1987.
32. Harrison MH. Effects on thermal stress and exercise on blood volume in humans. Physiol Rev. 1985;65:149-‐209
33. Messer JV, Wagman RJ, Levine HJ, Neill WA, Krasnow N, Gorlin R. Patterns of human myocardial oxygen extraction during rest and exercise. J Clin Invest. 1962;41:725-‐742
References
209
34. Grubbstrom J, Berglund B, Kaijser L. Myocardial blood flow and lactate metabolism at rest and during exercise with reduced arterial oxygen content. Acta Physiol Scand. 1991;142:467-‐474
35. Bache RJ, Dai XZ, Herzog CA, Schwartz JS. Effects of nonselective and selective alpha 1-‐adrenergic blockade on coronary blood flow during exercise. Circ Res. 1987;61:II36-‐41
36. Bache RJ, Homans DC, Schwartz JS, Dai XZ. Differences in the effects of alpha-‐1 adrenergic blockade with prazosin and indoramin on coronary blood flow during exercise. J Pharmacol Exp Ther. 1988;245:232-‐237
37. Duncker DJ, Bache RJ. Regulation of coronary blood flow during exercise. Physiol Rev. 2008;88:1009-‐1086
38. Spaan JA, M, Piek JJ, Siebes,. Coronary circulation and haemodynamics. In: Sperelakis Nea, ed. Heart physiology and pathophysiology. Academic Press; 2001:19-‐44.
39. Spaan JA, Siebes, M, Verhoeff, B-‐J, Piek, JJ. The coronary circulation. In: al KSe, ed. Interventional cardiology. McGraw Hill; 2007:25-‐45.
40. Hanley FL, Messina LM, Grattan MT, Hoffman IE. The effect of coronary inflow pressure on coronary vascular resistance in the isolated dog heart. Circ Res. 1984;54:760-‐772
41. Verhoeff BJ, Siebes M, Meuwissen M, Atasever B, Voskuil M, de Winter RJ, Koch KT, Tijssen JG, Spaan JA, Piek JJ. Influence of percutaneous coronary intervention on coronary microvascular resistance index. Circulation. 2005;111:76-‐82
42. Brandes RP, Schmitz-‐Winnenthal FH, Feletou M, Godecke A, Huang PL, Vanhoutte PM, Fleming I, Busse R. An endothelium-‐derived hyperpolarizing factor distinct from no and prostacyclin is a major endothelium-‐dependent vasodilator in resistance vessels of wild-‐type and endothelial no synthase knockout mice. Proc Natl Acad Sci U S A. 2000;97:9747-‐9752
43. Spaan JA. Mechanical determinants of myocardial perfusion. Basic Res Cardiol. 1995;90:89-‐102
44. Westerhof N, Boer C, Lamberts RR, Sipkema P. Cross-‐talk between cardiac muscle and coronary vasculature. Physiol Rev. 2006;86:1263-‐1308
45. Sanders M, White FC, Peterson TM, Bloor CM. Characteristics of coronary blood flow and transmural distribution in miniature pigs. Am J Physiol. 1978;235:H601-‐609
46. Barnard RJ, Duncan HW, Livesay JJ, Buckberg GD. Coronary vasodilator reserve and flow distribution during near-‐maximal exercise in dogs. J Appl Physiol. 1977;43:988-‐992
47. Downey JM, Kirk ES. Inhibition of coronary blood flow by a vascular waterfall mechanism. Circ Res. 1975;36:753-‐760
48. Spaan JA. Coronary blood flow: Mechanics, distribution and control. Dordrecht: Kluwer Academic; 1991.
49. Duncker DJ, Zhang J, Bache RJ. Coronary pressure-‐flow relation in left ventricular hypertrophy. Importance of changes in back pressure versus changes in minimum resistance. Circ Res. 1993;72:579-‐587
References
210
50. Bender SB, van Houwelingen MJ, Merkus D, Duncker DJ, Laughlin MH. Quantitative analysis of exercise-‐induced enhancement of early-‐ and late-‐systolic retrograde coronary blood flow. J Appl Physiol.108:507-‐514
51. von Restorff W, Holtz J, Bassenge E. Exercise induced augmentation of myocardial oxygen extraction in spite of normal coronary dilatory capacity in dogs. Pflugers Arch. 1977;372:181-‐185
52. White FC, Roth DM, Bloor CM. Coronary collateral reserve during exercise induced ischemia in swine. Basic Res Cardiol. 1989;84:42-‐54
53. Breisch EA, White FC, Nimmo LE, McKirnan MD, Bloor CM. Exercise-‐induced cardiac hypertrophy: A correlation of blood flow and microvasculature. Journal of applied physiology. 1986;60:1259-‐1267
54. Laughlin MH, Burns JW, Fanton J, Ripperger J, Peterson DF. Coronary blood flow reserve during +gz stress and treadmill exercise in miniature swine. J Appl Physiol. 1988;64:2589-‐2596
55. Siebes M, Campbell CS, D'Argenio DZ. Fluid dynamics of a partially collapsible stenosis in a flow model of the coronary circulation. J Biomech Eng. 1996;118:489-‐497
56. Mates RE, Gupta RL, Bell AC, Klocke FJ. Fluid dynamics of coronary artery stenosis. Circ Res. 1978;42:152-‐162
57. Kern MJ, Lerman A, Bech JW, De Bruyne B, Eeckhout E, Fearon WF, Higano ST, Lim MJ, Meuwissen M, Piek JJ, Pijls NH, Siebes M, Spaan JA. Physiological assessment of coronary artery disease in the cardiac catheterization laboratory: A scientific statement from the american heart association committee on diagnostic and interventional cardiac catheterization, council on clinical cardiology. Circulation. 2006;114:1321-‐1341
58. Canty JM, Jr., Smith TP, Jr. Adenosine-‐recruitable flow reserve is absent during myocardial ischemia in unanesthetized dogs studied in the basal state. Circ Res. 1995;76:1079-‐1087
59. Duncker DJ, Bache RJ. Regulation of coronary vasomotor tone under normal conditions and during acute myocardial hypoperfusion. Pharmacol Ther. 2000;86:87-‐110
60. Bache RJ, Cobb FR. Effect of maximal coronary vasodilation on transmural myocardial perfusion during tachycardia in the awake dog. Circ Res. 1977;41:648-‐653
61. Bache RJ, Duncker, D.J. . Coronary steal. Acc Cur J Rev. 1994;3:9-‐12 62. Hoffman JI, Spaan JA. Pressure-‐flow relations in coronary circulation. Physiol
Rev. 1990;70:331-‐390 63. Boudoulas H. Diastolic time: The forgotten dynamic factor. Implications for
myocardial perfusion. Acta Cardiol. 1991;46:61-‐71 64. Holmberg S, Serzysko W, Varnauskas E. Coronary circulation during heavy
exercise in control subjects and patients with coronary heart disease. Acta Med Scand. 1971;190:465-‐480
65. Holmberg S, Varnauskas E. Coronary circulation during pacing-‐induced tachycardia. Acta Med Scand. 1971;190:481-‐490
66. Flynn AE, Coggins DL, Goto M, Aldea GS, Austin RE, Doucette JW, Husseini W, Hoffman JI. Does systolic subepicardial perfusion come from retrograde subendocardial flow? Am J Physiol. 1992;262:H1759-‐1769
References
211
67. Nabel EG, Selwyn AP, Ganz P. Paradoxical narrowing of atherosclerotic coronary arteries induced by increases in heart rate. Circulation. 1990;81:850-‐859
68. Epstein SE, Talbot TL. Dynamic coronary tone in precipitation, exacerbation and relief of angina pectoris. Am J Cardiol. 1981;48:797-‐803
69. Fokkema DS, VanTeeffelen JW, Dekker S, Vergroesen I, Reitsma JB, Spaan JA. Diastolic time fraction as a determinant of subendocardial perfusion. Am J Physiol Heart Circ Physiol. 2005;288:H2450-‐2456
70. Ferro G, Duilio C, Spinelli L, Liucci GA, Mazza F, Indolfi C. Relation between diastolic perfusion time and coronary artery stenosis during stress-‐induced myocardial ischemia. Circulation. 1995;92:342-‐347
71. Braunwald E, Sarnoff SJ, Stainsby WN. Determinants of duration and mean rate of ventricular ejection. Circ Res. 1958;6:319-‐325
72. Shaver JA, Kroetz FW, Leonard JJ, Paley HW. The effect of steady-‐state increases in systemic arterial pressure on the duration of left ventricular ejection time. J Clin Invest. 1968;47:217-‐230
73. Lewis RP, Boudoulas H, Forester WF, Weissler AM. Shortening of electromechanical systole as a manifestation of excessive adrenergic stimulation in acute myocardial infarction. Circulation. 1972;46:856-‐862
74. Merkus D, Kajiya F, Vink H, Vergroesen I, Dankelman J, Goto M, Spaan JA. Prolonged diastolic time fraction protects myocardial perfusion when coronary blood flow is reduced. Circulation. 1999;100:75-‐81
75. Kolyva C, Verhoeff BJ, Spaan JA, Piek JJ, Siebes M. Increased diastolic time fraction as beneficial adjunct of alpha1-‐adrenergic receptor blockade after percutaneous coronary intervention. Am J Physiol Heart Circ Physiol. 2008;295:H2054-‐2060
76. Aversano T, Becker LC. Persistence of coronary vasodilator reserve despite functionally significant flow reduction. Am J Physiol. 1985;248:H403-‐411
77. Canty JM, Jr., Klocke FJ. Reduced regional myocardial perfusion in the presence of pharmacologic vasodilator reserve. Circulation. 1985;71:370-‐377
78. Gorman MW, Sparks HV, Jr. Progressive coronary vasoconstriction during relative ischemia in canine myocardium. Circ Res. 1982;51:411-‐420
79. Pantely GA, Bristow JD, Swenson LJ, Ladley HD, Johnson WB, Anselone CG. Incomplete coronary vasodilation during myocardial ischemia in swine. Am J Physiol. 1985;249:H638-‐647
80. Heusch G, Guth BD, Seitelberger R, Ross J, Jr. Attenuation of exercise-‐induced myocardial ischemia in dogs with recruitment of coronary vasodilator reserve by nifedipine. Circulation. 1987;75:482-‐490
81. Laxson DD, Dai XZ, Homans DC, Bache RJ. The role of alpha 1-‐ and alpha 2-‐adrenergic receptors in mediation of coronary vasoconstriction in hypoperfused ischemic myocardium during exercise. Circ Res. 1989;65:1688-‐1697
82. Pauca AL, Wallenhaupt SL, Kon ND, Tucker WY. Does radial artery pressure accurately reflect aortic pressure? Chest. 1992;102:1193-‐1198
83. Rowell LB, Brengelmann GL, Blackmon JR, Bruce RA, Murray JA. Disparities between aortic and peripheral pulse pressures induced by upright exercise and vasomotor changes in man. Circulation. 1968;37:954-‐964
References
212
84. Westerhof N, O'Rourke MF. Haemodynamic basis for the development of left ventricular failure in systolic hypertension and for its logical therapy. J Hypertens. 1995;13:943-‐952
85. Boutouyrie P, Bussy C, Lacolley P, Girerd X, Laloux B, Laurent S. Association between local pulse pressure, mean blood pressure, and large-‐artery remodeling. Circulation. 1999;100:1387-‐1393
86. Safar ME, Blacher J, Pannier B, Guerin AP, Marchais SJ, Guyonvarc'h PM, London GM. Central pulse pressure and mortality in end-‐stage renal disease. Hypertension. 2002;39:735-‐738
87. Wilkinson IB, Mohammad NH, Tyrrell S, Hall IR, Webb DJ, Paul VE, Levy T, Cockcroft JR. Heart rate dependency of pulse pressure amplification and arterial stiffness. Am J Hypertens. 2002;15:24-‐30
88. Munir S, Jiang B, Guilcher A, Brett S, Redwood S, Marber M, Chowienczyk P. Exercise reduces arterial pressure augmentation through vasodilation of muscular arteries in humans. Am J Physiol Heart Circ Physiol. 2008;294:H1645-‐1650
89. Sharman JE, McEniery CM, Campbell RI, Coombes JS, Wilkinson IB, Cockcroft JR. The effect of exercise on large artery haemodynamics in healthy young men. Eur J Clin Invest. 2005;35:738-‐744
90. Safar ME, London GM. Therapeutic studies and arterial stiffness in hypertension: Recommendations of the european society of hypertension. The clinical committee of arterial structure and function. Working group on vascular structure and function of the european society of hypertension. J Hypertens. 2000;18:1527-‐1535
91. Murgo JP, Westerhof N, Giolma JP, Altobelli SA. Aortic input impedance in normal man: Relationship to pressure wave forms. Circulation. 1980;62:105-‐116
92. London G, Guerin A, Pannier B, Marchais S, Benetos A, Safar M. Increased systolic pressure in chronic uremia. Role of arterial wave reflections. Hypertension. 1992;20:10-‐19
93. Marchais SJ, Guerin AP, Pannier BM, Levy BI, Safar ME, London GM. Wave reflections and cardiac hypertrophy in chronic uremia. Influence of body size. Hypertension. 1993;22:876-‐883
94. Buckberg GD, Fixler DE, Archie JP, Hoffman JI. Experimental subendocardial ischemia in dogs with normal coronary arteries. Circ Res. 1972;30:67-‐81
95. Murgo JP, Westerhof N, Giolma JP, Altobelli SA. Effects of exercise on aortic input impedance and pressure wave forms in normal humans. Circ Res. 1981;48:334-‐343
96. Armentano RL, Levenson J, Barra JG, Fischer EI, Breitbart GJ, Pichel RH, Simon A. Assessment of elastin and collagen contribution to aortic elasticity in conscious dogs. Am J Physiol. 1991;260:H1870-‐1877
97. Edwards RJ, Redwood SR, Lambiase PD, Tomset E, Rakhit RD, Marber MS. Antiarrhythmic and anti-‐ischaemic effects of angina in patients with and without coronary collaterals. Heart. 2002;88:604-‐610
98. Marber MS, Joy MD, Yellon DM. Is warm-‐up in angina ischaemic preconditioning? Br Heart J. 1994;72:213-‐215
References
213
99. Yellon DM, Baxter GF, Marber MS. Angina reassessed: Pain or protector? Lancet. 1996;347:1159-‐1162
100. MacAlpin RN KA. Adaptation to exercise in angina pectoris. The electrocardiogram during treadmill walking and coronary angiographic findings. Circulation. 1966;33:118-‐131
101. Jaffe MD, Quinn NK. Warm-‐up phenomenon in angina pectoris. Lancet. 1980;2:934-‐936
102. Joy M, Cairns AW, Sprigings D. Observations on the warm up phenomenon in angina pectoris. Br Heart J. 1987;58:116-‐121
103. Williams DO, Bass TA, Gewirtz H, Most AS. Adaptation to the stress of tachycardia in patients with coronary artery disease: Insight into the mechanism of the warm-‐up phenomenon. Circulation. 1985;71:687-‐692
104. Okazaki Y, Kodama K, Sato H, Kitakaze M, Hirayama A, Mishima M, Hori M, Inoue M. Attenuation of increased regional myocardial oxygen consumption during exercise as a major cause of warm-‐up phenomenon. J Am Coll Cardiol. 1993;21:1597-‐1604
105. Tzivoni D, Maybaum S. Attenuation of severity of myocardial ischemia during repeated daily ischemic episodes. J Am Coll Cardiol. 1997;30:119-‐124
106. Waters DD, McCans JL, Crean PA. Serial exercise testing in patients with effort angina: Variable tolerance, fixed threshold. J Am Coll Cardiol. 1985;6:1011-‐1015
107. Bagger JP. Coronary sinus blood flow determination by the thermodilution technique: Influence of catheter position and respiration. Cardiovasc Res. 1985;19:27-‐31
108. van den Wijngaard JP, Kolyva C, Siebes M, Dankelman J, van Gemert MJ, Piek JJ, Spaan JA. Model prediction of subendocardial perfusion of the coronary circulation in the presence of an epicardial coronary artery stenosis. Med Biol Eng Comput. 2008
109. Murry CE, Jennings RB, Reimer KA. Preconditioning with ischemia: A delay of lethal cell injury in ischemic myocardium. Circulation. 1986;74:1124-‐1136
110. Kloner RA, Bolli R, Marban E, Reinlib L, Braunwald E. Medical and cellular implications of stunning, hibernation, and preconditioning: An nhlbi workshop. Circulation. 1998;97:1848-‐1867
111. Li YW, Whittaker P, Kloner RA. The transient nature of the effect of ischemic preconditioning on myocardial infarct size and ventricular arrhythmia. Am Heart J. 1992;123:346-‐353
112. Kloner RA, Yellon D. Does ischemic preconditioning occur in patients? J Am Coll Cardiol. 1994;24:1133-‐1142
113. Maybaum S, Ilan M, Mogilevsky J, Tzivoni D. Improvement in ischemic parameters during repeated exercise testing: A possible model for myocardial preconditioning. Am J Cardiol. 1996;78:1087-‐1091
114. Murry CE, Richard VJ, Jennings RB, Reimer KA. Myocardial protection is lost before contractile function recovers from ischemic preconditioning. Am J Physiol. 1991;260:H796-‐804
115. Bogaty P, Kingma JG, Jr., Robitaille NM, Plante S, Simard S, Charbonneau L, Dumesnil JG. Attenuation of myocardial ischemia with repeated exercise in subjects with chronic stable angina: Relation to myocardial contractility,
References
214
intensity of exercise and the adenosine triphosphate-‐sensitive potassium channel. J Am Coll Cardiol. 1998;32:1665-‐1671
116. Bogaty P, Kingma JG, Guimond J, Poirier P, Boyer L, Charbonneau L, Dagenais GR. Myocardial perfusion imaging findings and the role of adenosine in the warm-‐up angina phenomenon. J Am Coll Cardiol. 2001;37:463-‐469
117. Correa SD, Schaefer S. Blockade of k(atp) channels with glibenclamide does not abolish preconditioning during demand ischemia. Am J Cardiol. 1997;79:75-‐78
118. Gould KL. Pressure-‐flow characteristics of coronary stenoses in unsedated dogs at rest and during coronary vasodilation. Circ Res. 1978;43:242-‐253
119. Bolli R. Mechanism of myocardial "stunning". Circulation. 1990;82:723-‐738 120. Murray CJ, Lopez AD. Alternative projections of mortality and disability by
cause 1990-‐2020: Global burden of disease study. Lancet. 1997;349:1498-‐1504
121. Risk stratification and survival after myocardial infarction. N Engl J Med. 1983;309:331-‐336
122. Volpi A, De Vita C, Franzosi MG, Geraci E, Maggioni AP, Mauri F, Negri E, Santoro E, Tavazzi L, Tognoni G. Determinants of 6-‐month mortality in survivors of myocardial infarction after thrombolysis. Results of the gissi-‐2 data base. The ad hoc working group of the gruppo italiano per lo studio della sopravvivenza nell'infarto miocardico (gissi)-‐2 data base. Circulation. 1993;88:416-‐429
123. Pfeffer MA, Pfeffer JM, Lamas GA. Development and prevention of congestive heart failure following myocardial infarction. Circulation. 1993;87:IV120-‐125
124. Simes RJ, Topol EJ, Holmes DR, Jr., White HD, Rutsch WR, Vahanian A, Simoons ML, Morris D, Betriu A, Califf RM, et al. Link between the angiographic substudy and mortality outcomes in a large randomized trial of myocardial reperfusion. Importance of early and complete infarct artery reperfusion. Gusto-‐i investigators. Circulation. 1995;91:1923-‐1928
125. Fieno DS, Hillenbrand HB, Rehwald WG, Harris KR, Decker RS, Parker MA, Klocke FJ, Kim RJ, Judd RM. Infarct resorption, compensatory hypertrophy, and differing patterns of ventricular remodeling following myocardial infarctions of varying size. J Am Coll Cardiol. 2004;43:2124-‐2131
126. Keeley EC, Boura JA, Grines CL. Primary angioplasty versus intravenous thrombolytic therapy for acute myocardial infarction: A quantitative review of 23 randomised trials. Lancet. 2003;361:13-‐20
127. Christian TF, Schwartz RS, Gibbons RJ. Determinants of infarct size in reperfusion therapy for acute myocardial infarction. Circulation. 1992;86:81-‐90
128. A clinical trial comparing primary coronary angioplasty with tissue plasminogen activator for acute myocardial infarction. The global use of strategies to open occluded coronary arteries in acute coronary syndromes (gusto iib) angioplasty substudy investigators. N Engl J Med. 1997;336:1621-‐1628
References
215
129. Lincoff AM, Topol EJ. Illusion of reperfusion. Does anyone achieve optimal reperfusion during acute myocardial infarction? Circulation. 1993;88:1361-‐1374
130. Ragosta M, Camarano G, Kaul S, Powers ER, Sarembock IJ, Gimple LW. Microvascular integrity indicates myocellular viability in patients with recent myocardial infarction. New insights using myocardial contrast echocardiography. Circulation. 1994;89:2562-‐2569
131. Rochitte CE, Lima JA, Bluemke DA, Reeder SB, McVeigh ER, Furuta T, Becker LC, Melin JA. Magnitude and time course of microvascular obstruction and tissue injury after acute myocardial infarction. Circulation. 1998;98:1006-‐1014
132. Park JL, Lucchesi BR. Mechanisms of myocardial reperfusion injury. Ann Thorac Surg. 1999;68:1905-‐1912
133. Yellon DM, Hausenloy DJ. Myocardial reperfusion injury. N Engl J Med. 2007;357:1121-‐1135
134. Hearse DJ, Humphrey SM, Nayler WG, Slade A, Border D. Ultrastructural damage associated with reoxygenation of the anoxic myocardium. J Mol Cell Cardiol. 1975;7:315-‐324
135. Hearse DJ, Humphrey SM, Bullock GR. The oxygen paradox and the calcium paradox: Two facets of the same problem? J Mol Cell Cardiol. 1978;10:641-‐668
136. Hearse DJ, Bolli R. Reperfusion induced injury: Manifestations, mechanisms, and clinical relevance. Cardiovasc Res. 1992;26:101-‐108
137. Zhao ZQ, Vinten-‐Johansen J. Postconditioning: Reduction of reperfusion-‐induced injury. Cardiovasc Res. 2006;70:200-‐211
138. Garcia-‐Dorado D, Ruiz-‐Meana M, Padilla F, Rodriguez-‐Sinovas A, Mirabet M. Gap junction-‐mediated intercellular communication in ischemic preconditioning. Cardiovasc Res. 2002;55:456-‐465
139. Hausenloy D, Wynne A, Duchen M, Yellon D. Transient mitochondrial permeability transition pore opening mediates preconditioning-‐induced protection. Circulation. 2004;109:1714-‐1717
140. Tomai F, Crea F, Chiariello L, Gioffre PA. Ischemic preconditioning in humans: Models, mediators, and clinical relevance. Circulation. 1999;100:559-‐563
141. Zhao ZQ, Corvera JS, Halkos ME, Kerendi F, Wang NP, Guyton RA, Vinten-‐Johansen J. Inhibition of myocardial injury by ischemic postconditioning during reperfusion: Comparison with ischemic preconditioning. Am J Physiol Heart Circ Physiol. 2003;285:H579-‐588
142. Kin H, Zatta AJ, Lofye MT, Amerson BS, Halkos ME, Kerendi F, Zhao ZQ, Guyton RA, Headrick JP, Vinten-‐Johansen J. Postconditioning reduces infarct size via adenosine receptor activation by endogenous adenosine. Cardiovasc Res. 2005;67:124-‐133
143. Kin H, Zhao ZQ, Sun HY, Wang NP, Corvera JS, Halkos ME, Kerendi F, Guyton RA, Vinten-‐Johansen J. Postconditioning attenuates myocardial ischemia-‐reperfusion injury by inhibiting events in the early minutes of reperfusion. Cardiovasc Res. 2004;62:74-‐85
References
216
144. Mykytenko J, Kerendi F, Reeves JG, Kin H, Zatta AJ, Jiang R, Guyton RA, Vinten-‐Johansen J, Zhao ZQ. Long-‐term inhibition of myocardial infarction by postconditioning during reperfusion. Basic Res Cardiol. 2007;102:90-‐100
145. Sun HY, Wang NP, Halkos M, Kerendi F, Kin H, Guyton RA, Vinten-‐Johansen J, Zhao ZQ. Postconditioning attenuates cardiomyocyte apoptosis via inhibition of jnk and p38 mitogen-‐activated protein kinase signaling pathways. Apoptosis. 2006;11:1583-‐1593
146. Bolli R, Marban E. Molecular and cellular mechanisms of myocardial stunning. Physiol Rev. 1999;79:609-‐634
147. Couvreur N, Lucats L, Tissier R, Bize A, Berdeaux A, Ghaleh B. Differential effects of postconditioning on myocardial stunning and infarction: A study in conscious dogs and anesthetized rabbits. Am J Physiol Heart Circ Physiol. 2006;291:H1345-‐1350
148. Staat P, Rioufol G, Piot C, Cottin Y, Cung TT, L'Huillier I, Aupetit JF, Bonnefoy E, Finet G, Andre-‐Fouet X, Ovize M. Postconditioning the human heart. Circulation. 2005;112:2143-‐2148
149. Laskey WK. Brief repetitive balloon occlusions enhance reperfusion during percutaneous coronary intervention for acute myocardial infarction: A pilot study. Catheter Cardiovasc Interv. 2005;65:361-‐367
150. Yang XC, Liu Y, Wang LF, Cui L, Wang T, Ge YG, Wang HS, Li WM, Xu L, Ni ZH, Liu SH, Zhang L, Jia HM, Vinten-‐Johansen J, Zhao ZQ. Reduction in myocardial infarct size by postconditioning in patients after percutaneous coronary intervention. J Invasive Cardiol. 2007;19:424-‐430
151. Ma XJ, Zhang XH, Li CM, Luo M. Effect of postconditioning on coronary blood flow velocity and endothelial function in patients with acute myocardial infarction. Scand Cardiovasc J. 2006;40:327-‐333
152. Horwitz LD, Fennessey PV, Shikes RH, Kong Y. Marked reduction in myocardial infarct size due to prolonged infusion of an antioxidant during reperfusion. Circulation. 1994;89:1792-‐1801
153. Farb A, Kolodgie FD, Jenkins M, Virmani R. Myocardial infarct extension during reperfusion after coronary artery occlusion: Pathologic evidence. J Am Coll Cardiol. 1993;21:1245-‐1253
154. Miki T, Swafford AN, Cohen MV, Downey JM. Second window of protection against infarction in conscious rabbits: Real or artifactual. J Mol Cell Cardiol. 1999;31:809-‐816
155. Fox K, Garcia MA, Ardissino D, Buszman P, Camici PG, Crea F, Daly C, De Backer G, Hjemdahl P, Lopez-‐Sendon J, Marco J, Morais J, Pepper J, Sechtem U, Simoons M, Thygesen K, Priori SG, Blanc JJ, Budaj A, Camm J, Dean V, Deckers J, Dickstein K, Lekakis J, McGregor K, Metra M, Osterspey A, Tamargo J, Zamorano JL. Guidelines on the management of stable angina pectoris: Executive summary: The task force on the management of stable angina pectoris of the european society of cardiology. Eur Heart J. 2006;27:1341-‐1381
156. Schwitter J, Wacker CM, van Rossum AC, Lombardi M, Al-‐Saadi N, Ahlstrom H, Dill T, Larsson HB, Flamm SD, Marquardt M, Johansson L. Mr-‐impact: Comparison of perfusion-‐cardiac magnetic resonance with single-‐photon
References
217
emission computed tomography for the detection of coronary artery disease in a multicentre, multivendor, randomized trial. Eur Heart J. 2008;29:480-‐489
157. Zaret BL, Wackers FJ. Nuclear cardiology (2). N Engl J Med. 1993;329:855-‐863 158. Zaret BL, Wackers FJ. Nuclear cardiology (1). N Engl J Med. 1993;329:775-‐783 159. Schinkel AF, Bax JJ, Geleijnse ML, Boersma E, Elhendy A, Roelandt JR,
Poldermans D. Noninvasive evaluation of ischaemic heart disease: Myocardial perfusion imaging or stress echocardiography? Eur Heart J. 2003;24:789-‐800
160. Underwood SR, Anagnostopoulos C, Cerqueira M, Ell PJ, Flint EJ, Harbinson M, Kelion AD, Al-‐Mohammad A, Prvulovich EM, Shaw LJ, Tweddel AC. Myocardial perfusion scintigraphy: The evidence. Eur J Nucl Med Mol Imaging. 2004;31:261-‐291
161. Hachamovitch R, Berman DS, Shaw LJ, Kiat H, Cohen I, Cabico JA, Friedman J, Diamond GA. Incremental prognostic value of myocardial perfusion single photon emission computed tomography for the prediction of cardiac death: Differential stratification for risk of cardiac death and myocardial infarction. Circulation. 1998;97:535-‐543
162. Shaw LJ, Berman DS, Maron DJ, Mancini GB, Hayes SW, Hartigan PM, Weintraub WS, O'Rourke RA, Dada M, Spertus JA, Chaitman BR, Friedman J, Slomka P, Heller GV, Germano G, Gosselin G, Berger P, Kostuk WJ, Schwartz RG, Knudtson M, Veledar E, Bates ER, McCallister B, Teo KK, Boden WE. Optimal medical therapy with or without percutaneous coronary intervention to reduce ischemic burden: Results from the clinical outcomes utilizing revascularization and aggressive drug evaluation (courage) trial nuclear substudy. Circulation. 2008;117:1283-‐1291
163. Weiner DA, Ryan TJ, McCabe CH, Chaitman BR, Sheffield LT, Ferguson JC, Fisher LD, Tristani F. Prognostic importance of a clinical profile and exercise test in medically treated patients with coronary artery disease. J Am Coll Cardiol. 1984;3:772-‐779
164. Lee J, Chae SC, Lee K, Heo J, Iskandrian AS. Biokinetics of thallium-‐201 in normal subjects: Comparison between adenosine, dipyridamole, dobutamine and exercise. J Nucl Med. 1994;35:535-‐541
165. Sato A, Terata K, Miura H, Toyama K, Loberiza FR, Jr., Hatoum OA, Saito T, Sakuma I, Gutterman DD. Mechanism of vasodilation to adenosine in coronary arterioles from patients with heart disease. Am J Physiol Heart Circ Physiol. 2005;288:H1633-‐1640
166. Knabb RM, Gidday JM, Ely SW, Rubio R, Berne RM. Effects of dipyridamole on myocardial adenosine and active hyperemia. Am J Physiol. 1984;247:H804-‐810
167. Salcedo J, Kern MJ. Effects of caffeine and theophylline on coronary hyperemia induced by adenosine or dipyridamole. Catheter Cardiovasc Interv. 2009;74:598-‐605
168. van Geuns RJ, Wielopolski PA, de Bruin HG, Rensing BJ, van Ooijen PM, Hulshoff M, Oudkerk M, de Feyter PJ. Basic principles of magnetic resonance imaging. Progress in cardiovascular diseases. 1999;42:149-‐156
169. Armstrong P, Keevil SF. Magnetic resonance imaging-‐-‐1: Basic principles of image production. Bmj. 1991;303:35-‐40

References
218
170. Scherzinger AL, Hendee WR. Basic principles of magnetic resonance imaging-‐-‐an update. The Western journal of medicine. 1985;143:782-‐792
171. Hundley WG, Bluemke DA, Finn JP, Flamm SD, Fogel MA, Friedrich MG, Ho VB, Jerosch-‐Herold M, Kramer CM, Manning WJ, Patel M, Pohost GM, Stillman AE, White RD, Woodard PK. Accf/acr/aha/nasci/scmr 2010 expert consensus document on cardiovascular magnetic resonance: A report of the american college of cardiology foundation task force on expert consensus documents. Circulation. 2010;121:2462-‐2508
172. Barkhausen J, Ruehm SG, Goyen M, Buck T, Laub G, Debatin JF. Mr evaluation of ventricular function: True fast imaging with steady-‐state precession versus fast low-‐angle shot cine mr imaging: Feasibility study. Radiology. 2001;219:264-‐269
173. Jahnke C, Paetsch I, Gebker R, Bornstedt A, Fleck E, Nagel E. Accelerated 4d dobutamine stress mr imaging with k-‐t blast: Feasibility and diagnostic performance. Radiology. 2006;241:718-‐728
174. Jahnke C, Nagel E, Gebker R, Bornstedt A, Schnackenburg B, Kozerke S, Fleck E, Paetsch I. Four-‐dimensional single breathhold magnetic resonance imaging using kt-‐blast enables reliable assessment of left-‐ and right-‐ventricular volumes and mass. J Magn Reson Imaging. 2007;25:737-‐742
175. Bellenger NG, Burgess MI, Ray SG, Lahiri A, Coats AJ, Cleland JG, Pennell DJ. Comparison of left ventricular ejection fraction and volumes in heart failure by echocardiography, radionuclide ventriculography and cardiovascular magnetic resonance; are they interchangeable? Eur Heart J. 2000;21:1387-‐1396
176. Semelka RC, Tomei E, Wagner S, Mayo J, Caputo G, O'Sullivan M, Parmley WW, Chatterjee K, Wolfe C, Higgins CB. Interstudy reproducibility of dimensional and functional measurements between cine magnetic resonance studies in the morphologically abnormal left ventricle. Am Heart J. 1990;119:1367-‐1373
177. Sechtem U, Sommerhoff BA, Markiewicz W, White RD, Cheitlin MD, Higgins CB. Regional left ventricular wall thickening by magnetic resonance imaging: Evaluation in normal persons and patients with global and regional dysfunction. Am J Cardiol. 1987;59:145-‐151
178. Hoffmann R, von Bardeleben S, Kasprzak JD, Borges AC, ten Cate F, Firschke C, Lafitte S, Al-‐Saadi N, Kuntz-‐Hehner S, Horstick G, Greis C, Engelhardt M, Vanoverschelde JL, Becher H. Analysis of regional left ventricular function by cineventriculography, cardiac magnetic resonance imaging, and unenhanced and contrast-‐enhanced echocardiography: A multicenter comparison of methods. J Am Coll Cardiol. 2006;47:121-‐128
179. Zerhouni EA, Parish DM, Rogers WJ, Yang A, Shapiro EP. Human heart: Tagging with mr imaging-‐-‐a method for noninvasive assessment of myocardial motion. Radiology. 1988;169:59-‐63
180. Rutz AK, Ryf S, Plein S, Boesiger P, Kozerke S. Accelerated whole-‐heart 3d cspamm for myocardial motion quantification. Magn Reson Med. 2008;59:755-‐763
References
219
181. Garot J, Pascal O, Diebold B, Derumeaux G, Gerber BL, Dubois-‐Rande JL, Lima JA, Gueret P. Alterations of systolic left ventricular twist after acute myocardial infarction. Am J Physiol Heart Circ Physiol. 2002;282:H357-‐362
182. Paetsch I, Foll D, Kaluza A, Luechinger R, Stuber M, Bornstedt A, Wahl A, Fleck E, Nagel E. Magnetic resonance stress tagging in ischemic heart disease. Am J Physiol Heart Circ Physiol. 2005;288:H2708-‐2714
183. Kramer CM, Rogers WJ, Geskin G, Power TP, Theobald TM, Hu YL, Reichek N. Usefulness of magnetic resonance imaging early after acute myocardial infarction. Am J Cardiol. 1997;80:690-‐695
184. Geskin G, Kramer CM, Rogers WJ, Theobald TM, Pakstis D, Hu YL, Reichek N. Quantitative assessment of myocardial viability after infarction by dobutamine magnetic resonance tagging. Circulation. 1998;98:217-‐223
185. Kramer CM, Malkowski MJ, Mankad S, Theobald TM, Pakstis DL, Rogers WJ, Jr. Magnetic resonance tagging and echocardiographic response to dobutamine and functional improvement after reperfused myocardial infarction. Am Heart J. 2002;143:1046-‐1051
186. Gerber BL, Rochitte CE, Melin JA, McVeigh ER, Bluemke DA, Wu KC, Becker LC, Lima JA. Microvascular obstruction and left ventricular remodeling early after acute myocardial infarction. Circulation. 2000;101:2734-‐2741
187. Baer FM, Voth E, Schneider CA, Theissen P, Schicha H, Sechtem U. Comparison of low-‐dose dobutamine-‐gradient-‐echo magnetic resonance imaging and positron emission tomography with [18f]fluorodeoxyglucose in patients with chronic coronary artery disease. A functional and morphological approach to the detection of residual myocardial viability. Circulation. 1995;91:1006-‐1015
188. Paetsch I, Jahnke C, Ferrari VA, Rademakers FE, Pellikka PA, Hundley WG, Poldermans D, Bax JJ, Wegscheider K, Fleck E, Nagel E. Determination of interobserver variability for identifying inducible left ventricular wall motion abnormalities during dobutamine stress magnetic resonance imaging. Eur Heart J. 2006;27:1459-‐1464
189. Paetsch I, Jahnke C, Wahl A, Gebker R, Neuss M, Fleck E, Nagel E. Comparison of dobutamine stress magnetic resonance, adenosine stress magnetic resonance, and adenosine stress magnetic resonance perfusion. Circulation. 2004;110:835-‐842
190. Schwitter J. Myocardial perfusion imaging by cardiac magnetic resonance. J Nucl Cardiol. 2006;13:841-‐854
191. Schwitter J, Nanz D, Kneifel S, Bertschinger K, Buchi M, Knusel PR, Marincek B, Luscher TF, von Schulthess GK. Assessment of myocardial perfusion in coronary artery disease by magnetic resonance: A comparison with positron emission tomography and coronary angiography. Circulation. 2001;103:2230-‐2235
192. Plein S, Ryf S, Schwitter J, Radjenovic A, Boesiger P, Kozerke S. Dynamic contrast-‐enhanced myocardial perfusion mri accelerated with k-‐t sense. Magn Reson Med. 2007;58:777-‐785
193. Gebker R, Jahnke C, Paetsch I, Kelle S, Schnackenburg B, Fleck E, Nagel E. Diagnostic performance of myocardial perfusion mr at 3 t in patients with coronary artery disease. Radiology. 2008;247:57-‐63
References
220
194. Cheng AS, Pegg TJ, Karamitsos TD, Searle N, Jerosch-‐Herold M, Choudhury RP, Banning AP, Neubauer S, Robson MD, Selvanayagam JB. Cardiovascular magnetic resonance perfusion imaging at 3-‐tesla for the detection of coronary artery disease: A comparison with 1.5-‐tesla. J Am Coll Cardiol. 2007;49:2440-‐2449
195. Fritz-‐Hansen T, Hove JD, Kofoed KF, Kelbaek H, Larsson HB. Quantification of mri measured myocardial perfusion reserve in healthy humans: A comparison with positron emission tomography. J Magn Reson Imaging. 2008;27:818-‐824
196. Jerosch-‐Herold M, Wilke N, Stillman AE. Magnetic resonance quantification of the myocardial perfusion reserve with a fermi function model for constrained deconvolution. Med Phys. 1998;25:73-‐84
197. Selvanayagam JB, Jerosch-‐Herold M, Porto I, Sheridan D, Cheng AS, Petersen SE, Searle N, Channon KM, Banning AP, Neubauer S. Resting myocardial blood flow is impaired in hibernating myocardium: A magnetic resonance study of quantitative perfusion assessment. Circulation. 2005;112:3289-‐3296
198. Nagel E, Klein C, Paetsch I, Hettwer S, Schnackenburg B, Wegscheider K, Fleck E. Magnetic resonance perfusion measurements for the noninvasive detection of coronary artery disease. Circulation. 2003;108:432-‐437
199. Cullen JH, Horsfield MA, Reek CR, Cherryman GR, Barnett DB, Samani NJ. A myocardial perfusion reserve index in humans using first-‐pass contrast-‐enhanced magnetic resonance imaging. J Am Coll Cardiol. 1999;33:1386-‐1394
200. Al-‐Saadi N, Nagel E, Gross M, Bornstedt A, Schnackenburg B, Klein C, Klimek W, Oswald H, Fleck E. Noninvasive detection of myocardial ischemia from perfusion reserve based on cardiovascular magnetic resonance. Circulation. 2000;101:1379-‐1383
201. Wolff SD, Schwitter J, Coulden R, Friedrich MG, Bluemke DA, Biederman RW, Martin ET, Lansky AJ, Kashanian F, Foo TK, Licato PE, Comeau CR. Myocardial first-‐pass perfusion magnetic resonance imaging: A multicenter dose-‐ranging study. Circulation. 2004;110:732-‐737
202. Pennell DJ. Cardiovascular magnetic resonance and the role of adenosine pharmacologic stress. Am J Cardiol. 2004;94:26D-‐31D; discussion 31D-‐32D
203. Kim RJ, Chen EL, Lima JA, Judd RM. Myocardial gd-‐dtpa kinetics determine mri contrast enhancement and reflect the extent and severity of myocardial injury after acute reperfused infarction. Circulation. 1996;94:3318-‐3326
204. Kim RJ, Wu E, Rafael A, Chen EL, Parker MA, Simonetti O, Klocke FJ, Bonow RO, Judd RM. The use of contrast-‐enhanced magnetic resonance imaging to identify reversible myocardial dysfunction. N Engl J Med. 2000;343:1445-‐1453
205. Judd RM, Lugo-‐Olivieri CH, Arai M, Kondo T, Croisille P, Lima JA, Mohan V, Becker LC, Zerhouni EA. Physiological basis of myocardial contrast enhancement in fast magnetic resonance images of 2-‐day-‐old reperfused canine infarcts. Circulation. 1995;92:1902-‐1910
206. Kim RJ, Fieno DS, Parrish TB, Harris K, Chen EL, Simonetti O, Bundy J, Finn JP, Klocke FJ, Judd RM. Relationship of mri delayed contrast enhancement to irreversible injury, infarct age, and contractile function. Circulation. 1999;100:1992-‐2002
References
221
207. Fieno DS, Kim RJ, Chen EL, Lomasney JW, Klocke FJ, Judd RM. Contrast-‐enhanced magnetic resonance imaging of myocardium at risk: Distinction between reversible and irreversible injury throughout infarct healing. J Am Coll Cardiol. 2000;36:1985-‐1991
208. Wu E, Judd RM, Vargas JD, Klocke FJ, Bonow RO, Kim RJ. Visualisation of presence, location, and transmural extent of healed q-‐wave and non-‐q-‐wave myocardial infarction. Lancet. 2001;357:21-‐28
209. Klein C, Nekolla SG, Bengel FM, Momose M, Sammer A, Haas F, Schnackenburg B, Delius W, Mudra H, Wolfram D, Schwaiger M. Assessment of myocardial viability with contrast-‐enhanced magnetic resonance imaging: Comparison with positron emission tomography. Circulation. 2002;105:162-‐167
210. Wagner A, Mahrholdt H, Holly TA, Elliott MD, Regenfus M, Parker M, Klocke FJ, Bonow RO, Kim RJ, Judd RM. Contrast-‐enhanced mri and routine single photon emission computed tomography (spect) perfusion imaging for detection of subendocardial myocardial infarcts: An imaging study. Lancet. 2003;361:374-‐379
211. Bondarenko O, Beek AM, Nijveldt R, McCann GP, van Dockum WG, Hofman MB, Twisk JW, Visser CA, van Rossum AC. Functional outcome after revascularization in patients with chronic ischemic heart disease: A quantitative late gadolinium enhancement cmr study evaluating transmural scar extent, wall thickness and periprocedural necrosis. J Cardiovasc Magn Reson. 2007;9:815-‐821
212. Abdel-‐Aty H, Zagrosek A, Schulz-‐Menger J, Taylor AJ, Messroghli D, Kumar A, Gross M, Dietz R, Friedrich MG. Delayed enhancement and t2-‐weighted cardiovascular magnetic resonance imaging differentiate acute from chronic myocardial infarction. Circulation. 2004;109:2411-‐2416
213. Kellman P, Aletras AH, Mancini C, McVeigh ER, Arai AE. T2-‐prepared ssfp improves diagnostic confidence in edema imaging in acute myocardial infarction compared to turbo spin echo. Magn Reson Med. 2007;57:891-‐897
214. Nandalur KR, Dwamena BA, Choudhri AF, Nandalur MR, Carlos RC. Diagnostic performance of stress cardiac magnetic resonance imaging in the detection of coronary artery disease: A meta-‐analysis. J Am Coll Cardiol. 2007;50:1343-‐1353
215. Lockie T, Nagel E, Redwood S, Plein S. Use of cardiovascular magnetic resonance imaging in acute coronary syndromes. Circulation. 2009;119:1671-‐1681
216. Plein S, Radjenovic A, Ridgway JP, Barmby D, Greenwood JP, Ball SG, Sivananthan MU. Coronary artery disease: Myocardial perfusion mr imaging with sensitivity encoding versus conventional angiography. Radiology. 2005;235:423-‐430
217. Watkins S, McGeoch R, Lyne J, Steedman T, Good R, McLaughlin MJ, Cunningham T, Bezlyak V, Ford I, Dargie HJ, Oldroyd KG. Validation of magnetic resonance myocardial perfusion imaging with fractional flow reserve for the detection of significant coronary heart disease. Circulation. 2009;120:2207-‐2213
References
222
218. Bartunek J, Sys SU, Heyndrickx GR, Pijls NH, De Bruyne B. Quantitative coronary angiography in predicting functional significance of stenoses in an unselected patient cohort. J Am Coll Cardiol. 1995;26:328-‐334
219. Araoz PA, Glockner JF, McGee KP, Potter DD, Jr., Valeti VU, Stanley DW, Christian TF. 3 tesla mr imaging provides improved contrast in first-‐pass myocardial perfusion imaging over a range of gadolinium doses. J Cardiovasc Magn Reson. 2005;7:559-‐564
220. Tsao J, Boesiger P, Pruessmann KP. K-‐t blast and k-‐t sense: Dynamic mri with high frame rate exploiting spatiotemporal correlations. Magn Reson Med. 2003;50:1031-‐1042
221. Plein S, Kozerke S, Suerder D, Luescher TF, Greenwood JP, Boesiger P, Schwitter J. High spatial resolution myocardial perfusion cardiac magnetic resonance for the detection of coronary artery disease. Eur Heart J. 2008
222. Kozerke S, Tsao J. Reduced data acquisition methods in cardiac imaging. Top Magn Reson Imaging. 2004;15:161-‐168
223. Plein S, Schwitter J, Suerder D, Greenwood JP, Boesiger P, Kozerke S. K-‐space and time sensitivity encoding-‐accelerated myocardial perfusion mr imaging at 3.0 t: Comparison with 1.5 t. Radiology. 2008;249:493-‐500
224. Scanlon PJ, Faxon DP, Audet AM, Carabello B, Dehmer GJ, Eagle KA, Legako RD, Leon DF, Murray JA, Nissen SE, Pepine CJ, Watson RM, Ritchie JL, Gibbons RJ, Cheitlin MD, Gardner TJ, Garson A, Jr., Russell RO, Jr., Ryan TJ, Smith SC, Jr. Acc/aha guidelines for coronary angiography: Executive summary and recommendations. A report of the american college of cardiology/american heart association task force on practice guidelines (committee on coronary angiography) developed in collaboration with the society for cardiac angiography and interventions. Circulation. 1999;99:2345-‐2357
225. Pijls NH, De Bruyne B, Peels K, Van Der Voort PH, Bonnier HJ, Bartunek JKJJ, Koolen JJ. Measurement of fractional flow reserve to assess the functional severity of coronary-‐artery stenoses. N Engl J Med. 1996;334:1703-‐1708
226. Aarnoudse W, Fearon WF, Manoharan G, Geven M, van de Vosse F, Rutten M, De Bruyne B, Pijls NH. Epicardial stenosis severity does not affect minimal microcirculatory resistance. Circulation. 2004;110:2137-‐2142
227. Fearon WF, Aarnoudse W, Pijls NH, De Bruyne B, Balsam LB, Cooke DT, Robbins RC, Fitzgerald PJ, Yeung AC, Yock PG. Microvascular resistance is not influenced by epicardial coronary artery stenosis severity: Experimental validation. Circulation. 2004;109:2269-‐2272
228. Blows LJ, Redwood SR. Pressure wire in practice. Heart. 2006 229. Chamuleau SA, Siebes M, Meuwissen M, Koch KT, Spaan JA, Piek JJ.
Association between coronary lesion severity and distal microvascular resistance in patients with coronary artery disease. Am J Physiol Heart Circ Physiol. 2003;285:H2194-‐2200
230. Spaan JA, Piek JJ, Hoffman JI, Siebes M. Physiological basis of clinically used coronary hemodynamic indices. Circulation. 2006;113:446-‐455
231. Pijls NH, Kern MJ, Yock PG, De Bruyne B. Practice and potential pitfalls of coronary pressure measurement. Catheter Cardiovasc Interv. 2000;49:1-‐16
232. Meuwissen M, Chamuleau SA, Siebes M, Schotborgh CE, Koch KT, de Winter RJ, Bax M, de Jong A, Spaan JA, Piek JJ. Role of variability in microvascular

References
223
resistance on fractional flow reserve and coronary blood flow velocity reserve in intermediate coronary lesions. Circulation. 2001;103:184-‐187
233. De Bruyne B, Pijls NH, Smith L, Wievegg M, Heyndrickx GR. Coronary thermodilution to assess flow reserve: Experimental validation. Circulation. 2001;104:2003-‐2006
234. Ibrahim T, Nekolla SG, Schreiber K, Odaka K, Volz S, Mehilli J, Guthlin M, Delius W, Schwaiger M. Assessment of coronary flow reserve: Comparison between contrast-‐enhanced magnetic resonance imaging and positron emission tomography. J Am Coll Cardiol. 2002;39:864-‐870
235. Klocke FJ. Measurements of coronary flow reserve: Defining pathophysiology versus making decisions about patient care. Circulation. 1987;76:1183-‐1189
236. Ng MK, Yeung AC, Fearon WF. Invasive assessment of the coronary microcirculation: Superior reproducibility and less hemodynamic dependence of index of microcirculatory resistance compared with coronary flow reserve. Circulation. 2006;113:2054-‐2061
237. Shimada K, Sakanoue Y, Kobayashi Y, Ehara S, Hirose M, Nakamura Y, Fukuda D, Yamagishi H, Yoshiyama M, Takeuchi K, Yoshikawa J. Assessment of myocardial viability using coronary zero flow pressure after successful angioplasty in patients with acute anterior myocardial infarction. Heart. 2003;89:71-‐76
238. Meuwissen M, Siebes M, Chamuleau SA, van Eck-‐Smit BL, Koch KT, de Winter RJ, Tijssen JG, Spaan JA, Piek JJ. Hyperemic stenosis resistance index for evaluation of functional coronary lesion severity. Circulation. 2002;106:441-‐446
239. Nijveldt R, Beek AM, Hirsch A, Stoel MG, Hofman MB, Umans VA, Algra PR, Twisk JW, van Rossum AC. Functional recovery after acute myocardial infarction: Comparison between angiography, electrocardiography, and cardiovascular magnetic resonance measures of microvascular injury. J Am Coll Cardiol. 2008;52:181-‐189
240. Siebes M, Verhoeff BJ, Meuwissen M, de Winter RJ, Spaan JA, Piek JJ. Single-‐wire pressure and flow velocity measurement to quantify coronary stenosis hemodynamics and effects of percutaneous interventions. Circulation. 2004;109:756-‐762
241. Fearon WF, Balsam LB, Farouque HM, Caffarelli AD, Robbins RC, Fitzgerald PJ, Yock PG, Yeung AC. Novel index for invasively assessing the coronary microcirculation. Circulation. 2003;107:3129-‐3132
242. Fearon WF, Farouque HM, Balsam LB, Caffarelli AD, Cooke DT, Robbins RC, Fitzgerald PJ, Yeung AC, Yock PG. Comparison of coronary thermodilution and doppler velocity for assessing coronary flow reserve. Circulation. 2003;108:2198-‐2200
243. Hartley CJ, Cole JS. An ultrasonic pulsed doppler system for measuring blood flow in small vessels. J Appl Physiol. 1974;37:626-‐629
244. Davies JE, Whinnett ZI, Francis DP, Willson K, Foale RA, Malik IS, Hughes AD, Parker KH, Mayet J. Use of simultaneous pressure and velocity measurements to estimate arterial wave speed at a single site in humans. Am J Physiol Heart Circ Physiol. 2006;290:H878-‐885
References
224
245. Davies JE, Whinnett ZI, Francis DP, Manisty CH, Aguado-‐Sierra J, Willson K, Foale RA, Malik IS, Hughes AD, Parker KH, Mayet J. Evidence of a dominant backward-‐propagating "suction" wave responsible for diastolic coronary filling in humans, attenuated in left ventricular hypertrophy. Circulation. 2006;113:1768-‐1778
246. O'Rourke MF, Gallagher DE. Pulse wave analysis. J Hypertens Suppl. 1996;14:S147-‐157
247. Kelly R, Hayward C, Avolio A, O'Rourke M. Noninvasive determination of age-‐related changes in the human arterial pulse. Circulation. 1989;80:1652-‐1659
248. Munir S, Guilcher A, Kamalesh T, Clapp B, Redwood S, Marber M, Chowienczyk P. Peripheral augmentation index defines the relationship between central and peripheral pulse pressure. Hypertension. 2008;51:112-‐118
249. Sharman JE, Lim R, Qasem AM, Coombes JS, Burgess MI, Franco J, Garrahy P, Wilkinson IB, Marwick TH. Validation of a generalized transfer function to noninvasively derive central blood pressure during exercise. Hypertension. 2006;47:1203-‐1208
250. Stok WJ, Westerhof BE, Karemaker JM. Changes in finger-‐aorta pressure transfer function during and after exercise. Journal of applied physiology. 2006;101:1207-‐1214
251. O'Rourke MF, Adji A. An updated clinical primer on large artery mechanics: Implications of pulse waveform analysis and arterial tonometry. Current opinion in cardiology. 2005;20:275-‐281
252. Verbeke F, Segers P, Heireman S, Vanholder R, Verdonck P, Van Bortel LM. Noninvasive assessment of local pulse pressure: Importance of brachial-‐to-‐radial pressure amplification. Hypertension. 2005;46:244-‐248
253. Parker KH, Jones CJ. Forward and backward running waves in the arteries: Analysis using the method of characteristics. J Biomech Eng. 1990;112:322-‐326
254. Sun YH, Anderson TJ, Parker KH, Tyberg JV. Wave-‐intensity analysis: A new approach to coronary hemodynamics. J Appl Physiol. 2000;89:1636-‐1644
255. Khir AW, Parker KH. Wave intensity in the ascending aorta: Effects of arterial occlusion. J Biomech. 2005;38:647-‐655
256. Sun YH, Anderson TJ, Parker KH, Tyberg JV. Effects of left ventricular contractility and coronary vascular resistance on coronary dynamics. Am J Physiol Heart Circ Physiol. 2004;286:H1590-‐1595
257. Parker KH. An introduction to wave intensity analysis. Med Biol Eng Comput. 2009;47:175-‐188
258. Bleasdale RA, Parker KH, Jones CJ. Chasing the wave. Unfashionable but important new concepts in arterial wave travel. American journal of physiology. Heart and circulatory physiology. 2003;284:H1879-‐1885
259. Tonino PA, Fearon WF, De Bruyne B, Oldroyd KG, Leesar MA, Ver Lee PN, Maccarthy PA, Van't Veer M, Pijls NH. Angiographic versus functional severity of coronary artery stenoses in the fame study fractional flow reserve versus angiography in multivessel evaluation. J Am Coll Cardiol.55:2816-‐2821
References
225
260. Hughes AD, Parker KH. Forward and backward waves in the arterial system: Impedance or wave intensity analysis? Med Biol Eng Comput. 2009;47:207-‐210
261. Kovacs G, Maier R, Aberer E, Brodmann M, Scheidl S, Hesse C, Troester N, Salmhofer W, Stauber R, Furst F, Thonhofer R, Ofner-‐Kopeinig P, Gruenig E, Olschewski H. Assessment of pulmonary arterial pressure during exercise in collagen vascular disease: Echocardiography versus right heart catheterisation. Chest.
262. Mattingly TW. Postexercise electrocardiogram: Value in diagnosis and prognosis of coronary artery disease. Fed Proc. 1962;21(4)Pt 2:98
263. Sowton E, Burkart F. Haemodynamic changes during continuous exercise. Br Heart J. 1967;29:770-‐774
264. Togni M, Gloekler S, Meier P, de Marchi SF, Rutz T, Steck H, Traupe T, Seiler C. Instantaneous coronary collateral function during supine bicycle exercise. Eur Heart J.31:2148-‐2155
265. Bevegard S, Holmgren A, Jonsson B. The effect of body position on the circulation at rest and during exercise, with special reference to the influence on the stroke volume. Acta physiologica Scandinavica. 1960;49:279-‐298
266. Wetherbee JN, Bamrah VS, Ptacin MJ, Kalbfleisch JH. Comparison of st segment depression in upright treadmill and supine bicycle exercise testing. J Am Coll Cardiol. 1988;11:330-‐337
267. Kramer CM, Lima JA, Reichek N, Ferrari VA, Llaneras MR, Palmon LC, Yeh IT, Tallant B, Axel L. Regional differences in function within noninfarcted myocardium during left ventricular remodeling. Circulation. 1993;88:1279-‐1288
268. Grothues F, Smith GC, Moon JC, Bellenger NG, Collins P, Klein HU, Pennell DJ. Comparison of interstudy reproducibility of cardiovascular magnetic resonance with two-‐dimensional echocardiography in normal subjects and in patients with heart failure or left ventricular hypertrophy. Am J Cardiol. 2002;90:29-‐34
269. Bellenger NG, Davies LC, Francis JM, Coats AJ, Pennell DJ. Reduction in sample size for studies of remodeling in heart failure by the use of cardiovascular magnetic resonance. J Cardiovasc Magn Reson. 2000;2:271-‐278
270. Richard V, Murry CE, Reimer KA. Healing of myocardial infarcts in dogs. Effects of late reperfusion. Circulation. 1995;92:1891-‐1901
271. Baks T, van Geuns RJ, Biagini E, Wielopolski P, Mollet NR, Cademartiri F, van der Giessen WJ, Krestin GP, Serruys PW, Duncker DJ, de Feyter PJ. Effects of primary angioplasty for acute myocardial infarction on early and late infarct size and left ventricular wall characteristics. J Am Coll Cardiol. 2006;47:40-‐44
272. Taylor AJ, Al-‐Saadi N, Abdel-‐Aty H, Schulz-‐Menger J, Messroghli DR, Friedrich MG. Detection of acutely impaired microvascular reperfusion after infarct angioplasty with magnetic resonance imaging. Circulation. 2004;109:2080-‐2085
273. Wu KC, Zerhouni EA, Judd RM, Lugo-‐Olivieri CH, Barouch LA, Schulman SP, Blumenthal RS, Lima JA. Prognostic significance of microvascular obstruction

References
226
by magnetic resonance imaging in patients with acute myocardial infarction. Circulation. 1998;97:765-‐772
274. Wilke N, Jerosch-‐Herold M, Stillman AE, Kroll K, Tsekos N, Merkle H, Parrish T, Hu X, Wang Y, Bassingthwaighte J, et al. Concepts of myocardial perfusion imaging in magnetic resonance imaging. Magn Reson Q. 1994;10:249-‐286
275. Slutsky RA, Peterson T, Strich G, Brown JJ. Hemodynamic effects of rapid and slow infusions of manganese chloride and gadolinium-‐dtpa in dogs. Radiology. 1985;154:733-‐735
276. Strich G, Hagan PL, Gerber KH, Slutsky RA. Tissue distribution and magnetic resonance spin lattice relaxation effects of gadolinium-‐dtpa. Radiology. 1985;154:723-‐726
277. Weinmann HJ, Brasch RC, Press WR, Wesbey GE. Characteristics of gadolinium-‐dtpa complex: A potential nmr contrast agent. AJR. American journal of roentgenology. 1984;142:619-‐624
278. Keijer JT, van Rossum AC, Wilke N, van Eenige MJ, Jerosch-‐Herold M, Bronzwaer JG, Visser CA. Magnetic resonance imaging of myocardial perfusion in single-‐vessel coronary artery disease: Implications for transmural assessment of myocardial perfusion. Journal of cardiovascular magnetic resonance : official journal of the Society for Cardiovascular Magnetic Resonance. 2000;2:189-‐200
279. Wilke N, Jerosch-‐Herold M, Wang Y, Huang Y, Christensen BV, Stillman AE, Ugurbil K, McDonald K, Wilson RF. Myocardial perfusion reserve: Assessment with multisection, quantitative, first-‐pass mr imaging. Radiology. 1997;204:373-‐384
280. Ishida N, Sakuma H, Motoyasu M, Okinaka T, Isaka N, Nakano T, Takeda K. Noninfarcted myocardium: Correlation between dynamic first-‐pass contrast-‐enhanced myocardial mr imaging and quantitative coronary angiography. Radiology. 2003;229:209-‐216
281. Schwitter J, Debatin JF, von Schulthess GK, McKinnon GC. Normal myocardial perfusion assessed with multishot echo-‐planar imaging. Magnetic resonance in medicine : official journal of the Society of Magnetic Resonance in Medicine / Society of Magnetic Resonance in Medicine. 1997;37:140-‐147
282. Ding S, Wolff SD, Epstein FH. Improved coverage in dynamic contrast-‐enhanced cardiac mri using interleaved gradient-‐echo epi. Magnetic resonance in medicine : official journal of the Society of Magnetic Resonance in Medicine / Society of Magnetic Resonance in Medicine. 1998;39:514-‐519
283. Kellman P, Derbyshire JA, Agyeman KO, McVeigh ER, Arai AE. Extended coverage first-‐pass perfusion imaging using slice-‐interleaved tsense. Magnetic resonance in medicine : official journal of the Society of Magnetic Resonance in Medicine / Society of Magnetic Resonance in Medicine. 2004;51:200-‐204
284. Pruessmann KP, Weiger M, Scheidegger MB, Boesiger P. Sense: Sensitivity encoding for fast mri. Magnetic resonance in medicine : official journal of the Society of Magnetic Resonance in Medicine / Society of Magnetic Resonance in Medicine. 1999;42:952-‐962
285. Lee DC, Klocke FJ. Magnetic resonance approaches and recent advances in myocardial perfusion imaging. Curr Cardiol Rep. 2006;8:59-‐64
References
227
286. Klocke FJ, Simonetti OP, Judd RM, Kim RJ, Harris KR, Hedjbeli S, Fieno DS, Miller S, Chen V, Parker MA. Limits of detection of regional differences in vasodilated flow in viable myocardium by first-‐pass magnetic resonance perfusion imaging. Circulation. 2001;104:2412-‐2416
287. Kraitchman DL, Wilke N, Hexeberg E, Jerosch-‐Herold M, Wang Y, Parrish TB, Chang CN, Zhang Y, Bache RJ, Axel L. Myocardial perfusion and function in dogs with moderate coronary stenosis. Magn Reson Med. 1996;35:771-‐780
288. Lockie T, Ishida M, Perera D, Chiribiri A, De Silva K, Kozerke S, Marber M, Nagel E, Rezavi R, Redwood S, Plein S. High-‐resolution magnetic resonance myocardial perfusion imaging at 3.0-‐tesla to detect hemodynamically significant coronary stenoses as determined by fractional flow reserve. Journal of the American College of Cardiology. 2010;57:70-‐75
289. Jahnke C, Nagel E, Gebker R, Kokocinski T, Kelle S, Manka R, Fleck E, Paetsch I. Prognostic value of cardiac magnetic resonance stress tests: Adenosine stress perfusion and dobutamine stress wall motion imaging. Circulation. 2007;115:1769-‐1776
290. Hautvast GL, Chiribiri A, Lockie T, Breeuwer M, Nagel E, Plein S. Quantitative analysis of transmural gradients in myocardial perfusion magnetic resonance images. Magnetic resonance in medicine : official journal of the Society of Magnetic Resonance in Medicine / Society of Magnetic Resonance in Medicine. 2011;66:1477-‐1487
291. Lee DC, Simonetti OP, Harris KR, Holly TA, Judd RM, Wu E, Klocke FJ. Magnetic resonance versus radionuclide pharmacological stress perfusion imaging for flow-‐limiting stenoses of varying severity. Circulation. 2004;110:58-‐65
292. Axel L. Tissue mean transit time from dynamic computed tomography by a simple deconvolution technique. Investigative radiology. 1983;18:94-‐99
293. Christian TF, Rettmann DW, Aletras AH, Liao SL, Taylor JL, Balaban RS, Arai AE. Absolute myocardial perfusion in canines measured by using dual-‐bolus first-‐pass mr imaging. Radiology. 2004;232:677-‐684
294. Christian TF, Aletras AH, Arai AE. Estimation of absolute myocardial blood flow during first-‐pass mr perfusion imaging using a dual-‐bolus injection technique: Comparison to single-‐bolus injection method. Journal of magnetic resonance imaging : JMRI. 2008;27:1271-‐1277
295. Futamatsu H, Wilke N, Klassen C, Shoemaker S, Angiolillo DJ, Siuciak A, Morikawa-‐Futamatsu K, Suzuki N, von Ziegler F, Bass TA, Costa MA. Evaluation of cardiac magnetic resonance imaging parameters to detect anatomically and hemodynamically significant coronary artery disease. Am Heart J. 2007;154:298-‐305
296. Costa MA, Shoemaker S, Futamatsu H, Klassen C, Angiolillo DJ, Nguyen M, Siuciak A, Gilmore P, Zenni MM, Guzman L, Bass TA, Wilke N. Quantitative magnetic resonance perfusion imaging detects anatomic and physiologic coronary artery disease as measured by coronary angiography and fractional flow reserve. J Am Coll Cardiol. 2007;50:514-‐522
297. Larsson HB, Stubgaard M, Sondergaard L, Henriksen O. In vivo quantification of the unidirectional influx constant for gd-‐dtpa diffusion across the

References
228
myocardial capillaries with mr imaging. Journal of magnetic resonance imaging : JMRI. 1994;4:433-‐440
298. Kurita T, Sakuma H, Onishi K, Ishida M, Kitagawa K, Yamanaka T, Tanigawa T, Kitamura T, Takeda K, Ito M. Regional myocardial perfusion reserve determined using myocardial perfusion magnetic resonance imaging showed a direct correlation with coronary flow velocity reserve by doppler flow wire. European heart journal. 2009;30:444-‐452
299. Vallee JP, Lazeyras F, Kasuboski L, Chatelain P, Howarth N, Righetti A, Didier D. Quantification of myocardial perfusion with fast sequence and gd bolus in patients with normal cardiac function. Journal of magnetic resonance imaging : JMRI. 1999;9:197-‐203
300. Svendsen JH, Efsen F, Haunso S. Capillary permeability of 99mtc-‐dtpa and blood flow rate in the human myocardium determined by intracoronary bolus injection and residue detection. Cardiology. 1992;80:18-‐27
301. Tong CY, Prato FS, Wisenberg G, Lee TY, Carroll E, Sandler D, Wills J, Drost D. Measurement of the extraction efficiency and distribution volume for gd-‐dtpa in normal and diseased canine myocardium. Magnetic resonance in medicine : official journal of the Society of Magnetic Resonance in Medicine / Society of Magnetic Resonance in Medicine. 1993;30:337-‐346
302. Cheng CP, Herfkens RJ, Taylor CA. Abdominal aortic hemodynamic conditions in healthy subjects aged 50-‐70 at rest and during lower limb exercise: In vivo quantification using mri. Atherosclerosis. 2003;168:323-‐331
303. Cheng CP, Herfkens RJ, Taylor CA. Comparison of abdominal aortic hemodynamics between men and women at rest and during lower limb exercise. J Vasc Surg. 2003;37:118-‐123
304. Niezen RA, Doornbos J, van der Wall EE, de Roos A. Measurement of aortic and pulmonary flow with mri at rest and during physical exercise. J Comput Assist Tomogr. 1998;22:194-‐201
305. Hjortdal VE, Emmertsen K, Stenbog E, Frund T, Schmidt MR, Kromann O, Sorensen K, Pedersen EM. Effects of exercise and respiration on blood flow in total cavopulmonary connection: A real-‐time magnetic resonance flow study. Circulation. 2003;108:1227-‐1231
306. Jekic M, Foster EL, Ballinger MR, Raman SV, Simonetti OP. Cardiac function and myocardial perfusion immediately following maximal treadmill exercise inside the mri room. Journal of cardiovascular magnetic resonance : official journal of the Society for Cardiovascular Magnetic Resonance. 2008;10:3
307. Gerber BL, Raman SV, Nayak K, Epstein FH, Ferreira P, Axel L, Kraitchman DL. Myocardial first-‐pass perfusion cardiovascular magnetic resonance: History, theory, and current state of the art. Journal of cardiovascular magnetic resonance : official journal of the Society for Cardiovascular Magnetic Resonance. 2008;10:18
308. Tweedle MF, Hagan JJ, Kumar K, Mantha S, Chang CA. Reaction of gadolinium chelates with endogenously available ions. Magn Reson Imaging. 1991;9:409-‐415
309. Wyss CA, Koepfli P, Mikolajczyk K, Burger C, von Schulthess GK, Kaufmann PA. Bicycle exercise stress in pet for assessment of coronary flow reserve:
References
229
Repeatability and comparison with adenosine stress. Journal of nuclear medicine : official publication, Society of Nuclear Medicine. 2003;44:146-‐154
310. Ma X, Zhang X, Li C, Luo M. Effect of postconditioning on coronary blood flow velocity and endothelial function and lv recovery after myocardial infarction. J Interv Cardiol. 2006;19:367-‐375
311. Maisch B. How cardiac cells die-‐-‐necrosis, oncosis and apoptosis. Herz. 1999;24:181-‐188
312. Gibbons RJ, Valeti US, Araoz PA, Jaffe AS. The quantification of infarct size. J Am Coll Cardiol. 2004;44:1533-‐1542
313. Thiele H, Kappl MJ, Conradi S, Niebauer J, Hambrecht R, Schuler G. Reproducibility of chronic and acute infarct size measurement by delayed enhancement-‐magnetic resonance imaging. J Am Coll Cardiol. 2006;47:1641-‐1645
314. Choi KM, Kim RJ, Gubernikoff G, Vargas JD, Parker M, Judd RM. Transmural extent of acute myocardial infarction predicts long-‐term improvement in contractile function. Circulation. 2001;104:1101-‐1107
315. Wu KC, Kim RJ, Bluemke DA, Rochitte CE, Zerhouni EA, Becker LC, Lima JA. Quantification and time course of microvascular obstruction by contrast-‐enhanced echocardiography and magnetic resonance imaging following acute myocardial infarction and reperfusion. J Am Coll Cardiol. 1998;32:1756-‐1764
316. Armstrong WF, Pellikka PA, Ryan T, Crouse L, Zoghbi WA. Stress echocardiography: Recommendations for performance and interpretation of stress echocardiography. Stress echocardiography task force of the nomenclature and standards committee of the american society of echocardiography. J Am Soc Echocardiogr. 1998;11:97-‐104
317. Bax M, de Winter RJ, Schotborgh CE, Koch KT, Meuwissen M, Voskuil M, Adams R, Mulder KJ, Tijssen JG, Piek JJ. Short-‐ and long-‐term recovery of left ventricular function predicted at the time of primary percutaneous coronary intervention in anterior myocardial infarction. J Am Coll Cardiol. 2004;43:534-‐541
318. Thibault H, Piot C, Staat P, Bontemps L, Sportouch C, Rioufol G, Cung TT, Bonnefoy E, Angoulvant D, Aupetit JF, Finet G, Andre-‐Fouet X, Macia JC, Raczka F, Rossi R, Itti R, Kirkorian G, Derumeaux G, Ovize M. Long-‐term benefit of postconditioning. Circulation. 2008;117:1037-‐1044
319. Masotti M, Freixa, X, Bellera, M, Jimenez, Betriu, A. Is postconditioning usless in acute myocardial infarction? EHJ. 2009;30:Abstract Suppl (892)
320. MacRae JM, Sun YH, Isaac DL, Dobson GM, Cheng CP, Little WC, Parker KH, Tyberg JV. Wave-‐intensity analysis: A new approach to left ventricular filling dynamics. Heart Vessels. 1997;12:53-‐59
321. Silva-‐Tinoco R, Castillo-‐Martinez L, Orea-‐Tejeda A, Asensio-‐Lafuente E, Orozco-‐Gutierrez JJ, Vazquez-‐Diaz O, Rebollar-‐Gonzalez V. The effect of left ventricular dysfunction on right ventricle ejection fraction during exercise in heart failure patients: Implications in functional capacity and blood pressure response. Cardiol J. 2009;16:127-‐132
References
230
322. Koh TW, Pepper JR, DeSouza AC, Parker KH. Analysis of wave reflections in the arterial system using wave intensity: A novel method for predicting the timing and amplitude of reflected waves. Heart Vessels. 1998;13:103-‐113
323. Kerry SM, Bland JM. The intracluster correlation coefficient in cluster randomisation. Bmj. 1998;316:1455
324. Guillevin R, Menuel C, Duffau H, Kujas M, Capelle L, Aubert A, Taillibert S, Idbaih A, Pallud J, Demarco G, Costalat R, Hoang-‐Xuan K, Chiras J, Vallee JN. Proton magnetic resonance spectroscopy predicts proliferative activity in diffuse low-‐grade gliomas. J Neurooncol. 2008;87:181-‐187
325. Piot C, Croisille P, Staat P, Thibault H, Rioufol G, Mewton N, Elbelghiti R, Cung TT, Bonnefoy E, Angoulvant D, Macia C, Raczka F, Sportouch C, Gahide G, Finet G, Andre-‐Fouet X, Revel D, Kirkorian G, Monassier JP, Derumeaux G, Ovize M. Effect of cyclosporine on reperfusion injury in acute myocardial infarction. N Engl J Med. 2008;359:473-‐481
326. Pijls NH, van Schaardenburgh P, Manoharan G, Boersma E, Bech JW, van't Veer M, Bar F, Hoorntje J, Koolen J, Wijns W, de Bruyne B. Percutaneous coronary intervention of functionally nonsignificant stenosis: 5-‐year follow-‐up of the defer study. J Am Coll Cardiol. 2007;49:2105-‐2111
327. Perera D, Biggart S, Postema P, Patel S, Lambiase P, Marber M, Redwood S. Right atrial pressure: Can it be ignored when calculating fractional flow reserve and collateral flow index? J Am Coll Cardiol. 2004;44:2089-‐2091
328. Cerqueira MD, Weissman NJ, Dilsizian V, Jacobs AK, Kaul S, Laskey WK, Pennell DJ, Rumberger JA, Ryan T, Verani MS. Standardized myocardial segmentation and nomenclature for tomographic imaging of the heart: A statement for healthcare professionals from the cardiac imaging committee of the council on clinical cardiology of the american heart association. Circulation. 2002;105:539-‐542
329. Bland JM, Altman DG. Statistical methods for assessing agreement between two methods of clinical measurement. Lancet. 1986;1:307-‐310
330. Rieber J, Huber A, Erhard I, Mueller S, Schweyer M, Koenig A, Schiele TM, Theisen K, Siebert U, Schoenberg SO, Reiser M, Klauss V. Cardiac magnetic resonance perfusion imaging for the functional assessment of coronary artery disease: A comparison with coronary angiography and fractional flow reserve. Eur Heart J. 2006;27:1465-‐1471
331. Al-‐Saadi N, Nagel E, Gross M, Schnackenburg B, Paetsch I, Klein C, Fleck E. Improvement of myocardial perfusion reserve early after coronary intervention: Assessment with cardiac magnetic resonance imaging. J Am Coll Cardiol. 2000;36:1557-‐1564
332. Samady H, Lepper W, Powers ER, Wei K, Ragosta M, Bishop GG, Sarembock IJ, Gimple L, Watson DD, Beller GA, Barringhaus KG. Fractional flow reserve of infarct-‐related arteries identifies reversible defects on noninvasive myocardial perfusion imaging early after myocardial infarction. J Am Coll Cardiol. 2006;47:2187-‐2193
333. De Bruyne B, Pijls NH, Bartunek J, Kulecki K, Bech JW, De Winter H, Van Crombrugge P, Heyndrickx GR, Wijns W. Fractional flow reserve in patients with prior myocardial infarction. Circulation. 2001;104:157-‐162
References
231
334. Jerosch-‐Herold M, Vazquez G, Wang L, Jacobs DR, Jr., Folsom AR. Variability of myocardial blood flow measurements by magnetic resonance imaging in the multi-‐ethnic study of atherosclerosis. Invest Radiol. 2008;43:155-‐161
335. Pedersen H, Kozerke S, Ringgaard S, Nehrke K, Kim WY. K-‐t pca: Temporally constrained k-‐t blast reconstruction using principal component analysis. Magn Reson Med. 2009;62:706-‐716
336. Bache RJ, Schwartz JS. Effect of perfusion pressure distal to a coronary stenosis on transmural myocardial blood flow. Circulation. 1982;65:928-‐935
337. Ylitalo K, Jama L, Raatikainen P, Peuhkurinen K. Adaptation to myocardial ischemia during repeated dynamic exercise in relation to findings at cardiac catheterization. Am Heart J. 1996;131:689-‐697
338. Edwards RJ, Redwood SR, Lambiase PD, Marber MS. The effect of an angiotensin-‐converting enzyme inhibitor and a k+(atp) channel opener on warm up angina. European heart journal. 2005;26:598-‐606
339. Rutenberg HL. Of pre-‐loads, afterloads and warm-‐ups. Lancet. 1981;1:272 340. Pina IL, Balady GJ, Hanson P, Labovitz AJ, Madonna DW, Myers J. Guidelines
for clinical exercise testing laboratories. A statement for healthcare professionals from the committee on exercise and cardiac rehabilitation, american heart association. Circulation. 1995;91:912-‐921
341. Sarnoff SJ, Braunwald E, Welch GH, Jr., Case RB, Stainsby WN, Macruz R. Hemodynamic determinants of oxygen consumption of the heart with special reference to the tension-‐time index. Am J Physiol. 1958;192:148-‐156
342. Spaan J, Kolyva C, van den Wijngaard J, ter Wee R, van Horssen P, Piek J, Siebes M. Coronary structure and perfusion in health and disease. Philos Transact A Math Phys Eng Sci. 2008;366:3137-‐3153
343. Savitzky A. Smoothing and differentiation of data by simplified least squares procedures. Anal Chem. 1964;36:1627-‐1639
344. Rothman KJ. No adjustments are needed for multiple comparisons. Epidemiology. 1990;1:43-‐46
345. Redwood DR, Rosing DR, Goldstein RE, Beiser GD, Epstein SE. Importance of the design of an exercise protocol in the evaluation of patients with angina pectoris. Circulation. 1971;43:618-‐628
346. Kitakaze M, Hori M, Tamai J, Iwakura K, Koretsune Y, Kagiya T, Iwai K, Kitabatake A, Inoue M, Kamada T. Alpha 1-‐adrenoceptor activity regulates release of adenosine from the ischemic myocardium in dogs. Circ Res. 1987;60:631-‐639
347. Wilkinson IB, MacCallum H, Flint L, Cockcroft JR, Newby DE, Webb DJ. The influence of heart rate on augmentation index and central arterial pressure in humans. The Journal of physiology. 2000;525 Pt 1:263-‐270
348. Burkart F, Barold S, Sowton E. Hemodynamic effects of repeated exercise. Am J Cardiol. 1967;20:509-‐515
349. Thadani U, Lewis JR, Manyari D, Boroomand K, Cohen J, West RO, Parker JO. Are the clinical and hemodynamic events during exercise stress testing in invasive studies in patients with angina pectoris reproducible? Circulation. 1980;61:744-‐750
References
232
350. Brutsaert DL, Sys SU, Gillebert TC. Diastolic failure: Pathophysiology and therapeutic implications. Journal of the American College of Cardiology. 1993;22:318-‐325
351. de Beer VJ, Bender SB, Taverne YJ, Gao F, Duncker DJ, Laughlin MH, Merkus D. Exercise limits the production of endothelin in the coronary vasculature. American journal of physiology. Heart and circulatory physiology. 2011;300:H1950-‐1959
352. Hambrecht R, Wolf A, Gielen S, Linke A, Hofer J, Erbs S, Schoene N, Schuler G. Effect of exercise on coronary endothelial function in patients with coronary artery disease. N Engl J Med. 2000;342:454-‐460
353. Sambuceti G, Marzilli M, Mari A, Marini C, Schluter M, Testa R, Papini M, Marraccini P, Ciriello G, Marzullo P, L'Abbate A. Coronary microcirculatory vasoconstriction is heterogeneously distributed in acutely ischemic myocardium. American journal of physiology. Heart and circulatory physiology. 2005;288:H2298-‐2305
354. Ylitalo K, Niemela,K, Linnaluoto,M, Valkama,J, Peuhkurinen,K. Evidence suggesting coronary vasodilation as the principal mechanism in the warm-‐up phenomenon. American Heart Journal. 2001;141:e10
355. Kern MJ, Ganz P, Horowitz JD, Gaspar J, Barry WH, Lorell BH, Grossman W, Mudge GH, Jr. Potentiation of coronary vasoconstriction by beta-‐adrenergic blockade in patients with coronary artery disease. Circulation. 1983;67:1178-‐1185
356. McLaurin LP, Rolett EL, Grossman W. Impaired left ventricular relaxation during pacing-‐induced ischemia. The American journal of cardiology. 1973;32:751-‐757
357. Sakata Y, Kodama K, Kitakaze M, Masuyama T, Hirayama A, Lim YJ, Ishikura F, Sakai A, Adachi T, Hori M. Different mechanisms of ischemic adaptation to repeated coronary occlusion in patients with and without recruitable collateral circulation. Journal of the American College of Cardiology. 1997;30:1679-‐1686
358. Deutsch E, Berger M, Kussmaul WG, Hirshfeld JW, Jr., Herrmann HC, Laskey WK. Adaptation to ischemia during percutaneous transluminal coronary angioplasty. Clinical, hemodynamic, and metabolic features. Circulation. 1990;82:2044-‐2051
359. Vogel R, Indermuhle A, Reinhardt J, Meier P, Siegrist PT, Namdar M, Kaufmann PA, Seiler C. The quantification of absolute myocardial perfusion in humans by contrast echocardiography: Algorithm and validation. Journal of the American College of Cardiology. 2005;45:754-‐762
360. Merkus D, Houweling B, Mirza A, Boomsma F, van den Meiracker AH, Duncker DJ. Contribution of endothelin and its receptors to the regulation of vascular tone during exercise is different in the systemic, coronary and pulmonary circulation. Cardiovascular research. 2003;59:745-‐754
361. Merkus D, Stepp DW, Jones DW, Nishikawa Y, Chilian WM. Adenosine preconditions against endothelin-‐induced constriction of coronary arterioles. American journal of physiology. Heart and circulatory physiology. 2000;279:H2593-‐2597
References
233
362. Wiley KE, Davenport AP. Nitric oxide-‐mediated modulation of the endothelin-‐1 signalling pathway in the human cardiovascular system. Br J Pharmacol. 2001;132:213-‐220
363. Goligorsky MS, Tsukahara H, Magazine H, Andersen TT, Malik AB, Bahou WF. Termination of endothelin signaling: Role of nitric oxide. Journal of cellular physiology. 1994;158:485-‐494
364. McEniery CM, Wilkinson IB, Jenkins DG, Webb DJ. Endogenous endothelin-‐1 limits exercise-‐induced vasodilation in hypertensive humans. Hypertension. 2002;40:202-‐206
365. Duncker DJ, Merkus D. Exercise hyperaemia in the heart: The search for the dilator mechanism. The Journal of physiology. 2007;583:847-‐854
366. Hsu LY, Rhoads KL, Holly JE, Kellman P, Aletras AH, Arai AE. Quantitative myocardial perfusion analysis with a dual-‐bolus contrast-‐enhanced first-‐pass mri technique in humans. Journal of magnetic resonance imaging : JMRI. 2006;23:315-‐322
367. Ibrahim T, Nekolla SG, Schreiber K, Odaka K, Volz S, Mehilli J, Guthlin M, Delius W, Schwaiger M. Assessment of coronary flow reserve: Comparison between contrast-‐enhanced magnetic resonance imaging and positron emission tomography. Journal of the American College of Cardiology. 2002;39:864-‐870
368. Pack NA, DiBella EV, Rust TC, Kadrmas DJ, McGann CJ, Butterfield R, Christian PE, Hoffman JM. Estimating myocardial perfusion from dynamic contrast-‐enhanced cmr with a model-‐independent deconvolution method. Journal of cardiovascular magnetic resonance : official journal of the Society for Cardiovascular Magnetic Resonance. 2008;10:52
369. George RT, Arbab-‐Zadeh A, Miller JM, Kitagawa K, Chang HJ, Bluemke DA, Becker L, Yousuf O, Texter J, Lardo AC, Lima JA. Adenosine stress 64-‐ and 256-‐row detector computed tomography angiography and perfusion imaging: A pilot study evaluating the transmural extent of perfusion abnormalities to predict atherosclerosis causing myocardial ischemia. Circ Cardiovasc Imaging. 2009;2:174-‐182
370. Rembert JC, Boyd LM, Watkinson WP, Greenfield JC, Jr. Effect of adenosine on transmural myocardial blood flow distribution in the awake dog. The American journal of physiology. 1980;239:H7-‐13
371. Berne RM, Rubio R. Regulation of coronary blood flow. Advances in cardiology. 1974;12:303-‐317
372. Sethna DH, Moffitt EA. An appreciation of the coronary circulation. Anesth Analg. 1986;65:294-‐305