2020_McGregor_Lindsay_16784... - King's Research Portal
250
This electronic thesis or dissertation has been downloaded from the King’s Research Portal at https://kclpure.kcl.ac.uk/portal/ Take down policy If you believe that this document breaches copyright please contact [email protected] providing details, and we will remove access to the work immediately and investigate your claim. END USER LICENCE AGREEMENT Unless another licence is stated on the immediately following page this work is licensed under a Creative Commons Attribution-NonCommercial-NoDerivatives 4.0 International licence. https://creativecommons.org/licenses/by-nc-nd/4.0/ You are free to copy, distribute and transmit the work Under the following conditions: Attribution: You must attribute the work in the manner specified by the author (but not in any way that suggests that they endorse you or your use of the work). Non Commercial: You may not use this work for commercial purposes. No Derivative Works - You may not alter, transform, or build upon this work. Any of these conditions can be waived if you receive permission from the author. Your fair dealings and other rights are in no way affected by the above. The copyright of this thesis rests with the author and no quotation from it or information derived from it may be published without proper acknowledgement. Neutron diffraction studies of perdeuterated urate oxidase complexes McGregor, Lindsay Awarding institution: King's College London Download date: 11. Aug. 2022
-
Upload
khangminh22 -
Category
Documents
-
view
0 -
download
0
Transcript of 2020_McGregor_Lindsay_16784... - King's Research Portal

This electronic thesis or dissertation has been
downloaded from the King’s Research Portal at
https://kclpure.kcl.ac.uk/portal/
Take down policy
If you believe that this document breaches copyright please contact [email protected] providing
details, and we will remove access to the work immediately and investigate your claim.
END USER LICENCE AGREEMENT
Unless another licence is stated on the immediately following page this work is licensed
under a Creative Commons Attribution-NonCommercial-NoDerivatives 4.0 International
licence. https://creativecommons.org/licenses/by-nc-nd/4.0/
You are free to copy, distribute and transmit the work
Under the following conditions:
Attribution: You must attribute the work in the manner specified by the author (but not in anyway that suggests that they endorse you or your use of the work).
Non Commercial: You may not use this work for commercial purposes.
No Derivative Works - You may not alter, transform, or build upon this work.
Any of these conditions can be waived if you receive permission from the author. Your fair dealings and
other rights are in no way affected by the above.
The copyright of this thesis rests with the author and no quotation from it or information derived from it
may be published without proper acknowledgement.
Neutron diffraction studies of perdeuterated urate oxidase complexes
McGregor, Lindsay
Awarding institution:King's College London
Download date: 11. Aug. 2022

KING’S COLLEGE LONDON
DOCTORAL THESIS
Neutron diffraction studies of
perdeuterated urate oxidase complexes
Author:
Lindsay MCGREGOR
Supervisor:
Prof. Roberto A. STEINER
Dr. Matthew P. BLAKELEY
A thesis submitted in fulfillment of the requirements
for the degree of Doctor of Philosophy
in the
Steiner Research Group
Randall Centre for Cell and Molecular Biophysics
1
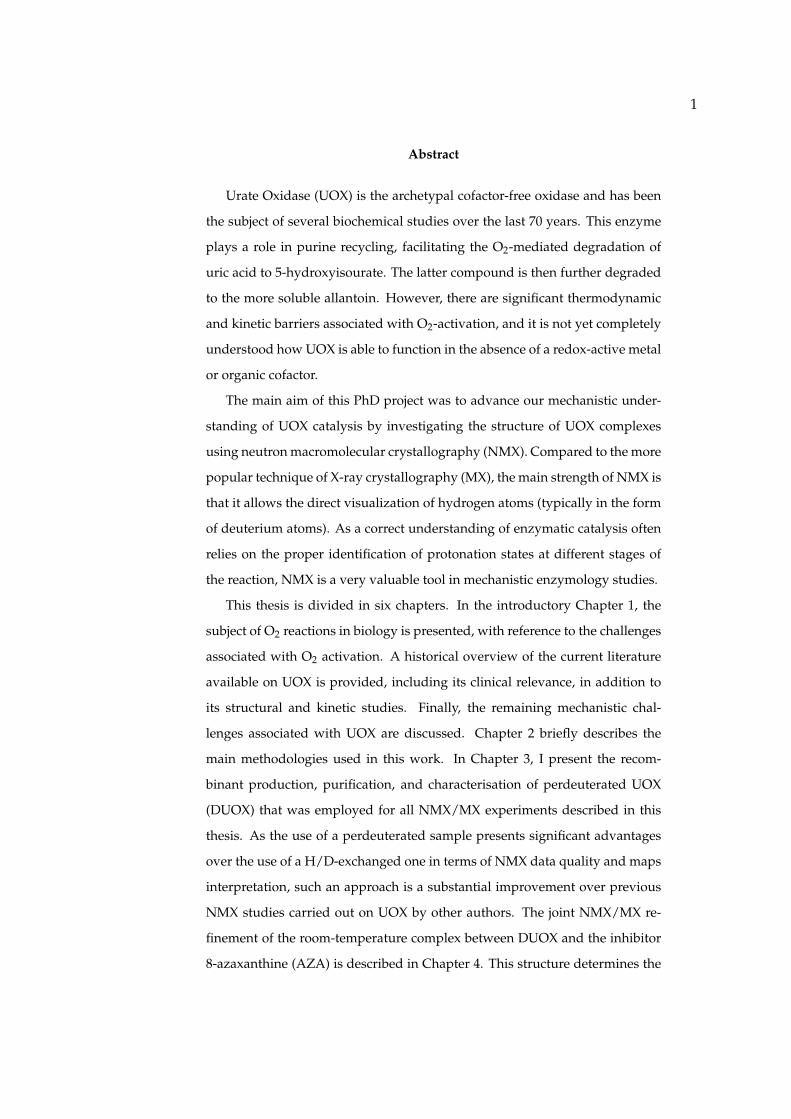
Abstract
Urate Oxidase (UOX) is the archetypal cofactor-free oxidase and has been
the subject of several biochemical studies over the last 70 years. This enzyme
plays a role in purine recycling, facilitating the O2-mediated degradation of
uric acid to 5-hydroxyisourate. The latter compound is then further degraded
to the more soluble allantoin. However, there are significant thermodynamic
and kinetic barriers associated with O2-activation, and it is not yet completely
understood how UOX is able to function in the absence of a redox-active metal
or organic cofactor.
The main aim of this PhD project was to advance our mechanistic under-
standing of UOX catalysis by investigating the structure of UOX complexes
using neutron macromolecular crystallography (NMX). Compared to the more
popular technique of X-ray crystallography (MX), the main strength of NMX is
that it allows the direct visualization of hydrogen atoms (typically in the form
of deuterium atoms). As a correct understanding of enzymatic catalysis often
relies on the proper identification of protonation states at different stages of
the reaction, NMX is a very valuable tool in mechanistic enzymology studies.
This thesis is divided in six chapters. In the introductory Chapter 1, the
subject of O2 reactions in biology is presented, with reference to the challenges
associated with O2 activation. A historical overview of the current literature
available on UOX is provided, including its clinical relevance, in addition to
its structural and kinetic studies. Finally, the remaining mechanistic chal-
lenges associated with UOX are discussed. Chapter 2 briefly describes the
main methodologies used in this work. In Chapter 3, I present the recom-
binant production, purification, and characterisation of perdeuterated UOX
(DUOX) that was employed for all NMX/MX experiments described in this
thesis. As the use of a perdeuterated sample presents significant advantages
over the use of a H/D-exchanged one in terms of NMX data quality and maps
interpretation, such an approach is a substantial improvement over previous
NMX studies carried out on UOX by other authors. The joint NMX/MX re-
finement of the room-temperature complex between DUOX and the inhibitor
8-azaxanthine (AZA) is described in Chapter 4. This structure determines the

2
protonation states of the proposed catalytic triad, Thr57*-Lys10*-His256, and
the relationships between this triad and the active site solvent network are de-
termined.
In Chapter 5, I present the room-temperature NMX structure of DUOX in
complex with 9-methyl-5-peroxyisourate (5-PMUA). The latter compound is
trapped in the active site after co-crystallisation of DUOX with 9-methyl uric
acid (9-MUA) under aerobic conditions, allowing the binding of O2. From this
structure, the trapped peroxide species is found to be negatively charged and
is stabilized by the hydroxyl group of active site residue Thr57*. In addition,
a proton-sharing relationship between residues Lys10* and His256 of the cat-
alytic triad is established.
NMX was employed to obtain information on the protonation states of
UOX complexes in two different environments: in the presence of an inhibitor
that cannot be oxidised, and the trapped peroxide intermediate. The structures
that are presented in this thesis are discussed with reference to the current
knowledge of the UOX mechanism of action, and provide an exciting platform
for future work into the structure of reactive intermediates in UOX catalysis.

3
Acknowledgements
Firstly, I would like to thank both of my supervisors, Professor Roberto A. Steiner
and Dr Matthew P. Blakeley, for their help throughout this PhD project. I thank
the Institut Laue-Langevin (ILL) for their funding and for providing such a fruitful
environment for research. Thank you to my colleagues in the Large Scale Structures
Group (LSS). I would also like to thank the Life Sciences Group (LSG) at the ILL,
for accepting me into their group as one of their own. Thanks go to Professor
Trevor Forsyth, Dr Michael Haertlein, and Dr Martine Moulin for participation in
the deuteration labelling collaboration. Trevor, for always being supportive and
willing to offer advice when I needed it. Martine, I will be eternally grateful for all
that you have taught me over the years. Your patience and kindness, both in the
lab and in our office, has always been appreciated. To all other past and present
members of the LSG, thank you for creating a welcoming and helpful working
environment, and for all of your help professionally and personally.
I would also like to thank the people who have contributed to my research in vari-
ous ways. Thank you to Dr Nicolas Coquelle, ILL, for advice with my NMX stud-
ies. Thank you to Dr Jean-Luc Ferrer, from the ESRF, for his help with X-ray data
collection and analysis, and Dr Matthew Bowler, from the EMBL, for also helping
with data analysis. Thank you to the HTX Platform at the EMBL, from which the
Thermofluor Assay results were obtained. Thank you to Dr Luca Signor, IBS, who
conducted the Mass Spectrometry measurements and helped with the interpreta-
tion of the data.

4
On a personal note, I would also like to extend my gratitude to Dr Olivier Detante
and the staff at the Neurology Department at CHU, Grenoble. Without their care
the completion of this thesis would not have been possible. I would like to say
thank you to all of my friends both in Grenoble and the UK who have been there
for me over the last few years. All your visits and phonecalls have been invalu-
able to me and won’t be forgotten. I would like to thank Dr Stuart Fisher for his
time spent sorting through my thesis and for being a pillar of support to me during
these interesting times, it will always be appreciated. Finally, I would like to say
thank you to my parents Alison and Andrew, my brother Grant, and my grandpar-
ents, Celia and Peter, for all of your love and support that has been unwavering
throughout this process. Any achievement that has come from this is because of
you.

5
Contents
Abstract 1
Acknowledgements 3
Contents 5
List of Figures 6
List of Tables 7
List of Abbreviations 8
1 Introduction 12
1.1 Oxygen-Reacting Enzymes . . . . . . . . . . . . . . . . . . . . . . . . . 13
1.2 Urate Oxidase . . . . . . . . . . . . . . . . . . . . . . . . . . . . . . . . 20
1.2.1 Gene Silencing Event . . . . . . . . . . . . . . . . . . . . . . . . 21
1.2.2 Importance and Clinical Implications . . . . . . . . . . . . . . 23
1.2.3 UOX and T-Fold Enzymes . . . . . . . . . . . . . . . . . . . . . 25
1.2.4 Structure of the Active Site . . . . . . . . . . . . . . . . . . . . 29
1.2.5 The UOX Mechanism . . . . . . . . . . . . . . . . . . . . . . . 38
1.3 Aim and Motivation . . . . . . . . . . . . . . . . . . . . . . . . . . . . 49
2 Experimental Methods 50
2.1 Molecular Biology . . . . . . . . . . . . . . . . . . . . . . . . . . . . . . 51
2.1.1 Cell Growth and Protein Expression . . . . . . . . . . . . . . . 51
2.2 Production of Deuterated Biomolecules . . . . . . . . . . . . . . . . . 54

6
2.3 Purification Techniques . . . . . . . . . . . . . . . . . . . . . . . . . . . 58
2.3.1 Cell Lysis and Protein Extraction . . . . . . . . . . . . . . . . . 58
2.3.2 Dialysis . . . . . . . . . . . . . . . . . . . . . . . . . . . . . . . 59
2.3.3 Ammonium Sulfate Precipitation . . . . . . . . . . . . . . . . . 60
2.3.4 Ion Exchange Chromatography . . . . . . . . . . . . . . . . . . 61
2.3.5 Hydrophobic Interaction Chromatography . . . . . . . . . . . 63
2.3.6 Gel Filtration Chromatography . . . . . . . . . . . . . . . . . . 65
2.4 Crystallisation . . . . . . . . . . . . . . . . . . . . . . . . . . . . . . . . 66
2.5 Crystallography . . . . . . . . . . . . . . . . . . . . . . . . . . . . . . . 69
2.5.1 Crystal Structure . . . . . . . . . . . . . . . . . . . . . . . . . . 69
2.5.2 The Scattering of Waves . . . . . . . . . . . . . . . . . . . . . . 71
2.5.3 The Ewald Sphere . . . . . . . . . . . . . . . . . . . . . . . . . 73
Monochromatic Data Collection . . . . . . . . . . . . . . . . . 73
Quasi-Laue Data Collection . . . . . . . . . . . . . . . . . . . . 75
2.5.4 X-ray and Neutron Scattering Factors . . . . . . . . . . . . . . 77
2.5.5 Structure Factors and Electron Density . . . . . . . . . . . . . 78
2.5.6 Data Collection and Processing . . . . . . . . . . . . . . . . . . 80
2.5.7 Data Quality Indicators . . . . . . . . . . . . . . . . . . . . . . 82
2.5.8 Structure Refinement and Model Building . . . . . . . . . . . 84
2.5.9 Joint Refinement . . . . . . . . . . . . . . . . . . . . . . . . . . 85
2.5.10 Model Validation and Statistical Indicators . . . . . . . . . . . 86
2.5.11 Radiation Damage . . . . . . . . . . . . . . . . . . . . . . . . . 87
2.6 Neutron Macromolecular Crystallography . . . . . . . . . . . . . . . 90
2.6.1 LADI-III Diffractometer at ILL . . . . . . . . . . . . . . . . . . 92
2.7 Mass Spectrometry . . . . . . . . . . . . . . . . . . . . . . . . . . . . . 93
2.8 Thermal Shift Assay . . . . . . . . . . . . . . . . . . . . . . . . . . . . 95
3 Production of Perdeuterated Urate Oxidase (DUOX) and Biophysical Char-
acterisation 97
3.1 Expression and Optimisation of DUOX . . . . . . . . . . . . . . . . . 98

7
3.1.1 Bacterial Transformation . . . . . . . . . . . . . . . . . . . . . . 98
3.1.2 Expression and Solubility Testing . . . . . . . . . . . . . . . . . 98
3.2 The Production of Perdeuterated UOX (DUOX) . . . . . . . . . . . . . 102
3.2.1 Cell Adaptation for Growth in Deuterated Media . . . . . . . 103
3.2.2 Fermentation of DUOX . . . . . . . . . . . . . . . . . . . . . . 104
3.3 Protein Purification of DUOX . . . . . . . . . . . . . . . . . . . . . . . 107
3.3.1 Comparison of HUOX and DUOX Expression . . . . . . . . . 113
3.4 Mass Spectrometry . . . . . . . . . . . . . . . . . . . . . . . . . . . . . 116
3.5 Thermofluor Assay . . . . . . . . . . . . . . . . . . . . . . . . . . . . . 117
4 Joint Refinement of Perdeuterated Urate Oxidase (DUOX) complexed with
8-azaxanthine (AZA) 120
4.1 Introduction . . . . . . . . . . . . . . . . . . . . . . . . . . . . . . . . . 121
4.2 Crystallisation of DUOX:AZA . . . . . . . . . . . . . . . . . . . . . . . 126
4.3 Quasi-Laue Data Collection on LADI-III . . . . . . . . . . . . . . . . . 128
4.4 X-ray Data Collection on FIP . . . . . . . . . . . . . . . . . . . . . . . . 129
4.5 Joint Neutron and X-ray Refinement . . . . . . . . . . . . . . . . . . . 131
4.6 Joint Refinement Results . . . . . . . . . . . . . . . . . . . . . . . . . . 134
4.6.1 UOX:AZA Bonding Interactions . . . . . . . . . . . . . . . . . 134
4.6.2 The Solvent Molecule, W1 . . . . . . . . . . . . . . . . . . . . . 136
4.6.3 Catalytic Residues . . . . . . . . . . . . . . . . . . . . . . . . . 137
4.6.4 Active Site Water Network . . . . . . . . . . . . . . . . . . . . 146
4.7 Discussion . . . . . . . . . . . . . . . . . . . . . . . . . . . . . . . . . . 149
4.8 Conclusion . . . . . . . . . . . . . . . . . . . . . . . . . . . . . . . . . . 152
5 Neutron Refinement of Perdeuterated Urate Oxidase (DUOX) complexed
with 9-methyl uric acid (9-MUA) 155
5.1 Introduction . . . . . . . . . . . . . . . . . . . . . . . . . . . . . . . . . 156
5.2 Crystallisation of DUOX:5-PMUA . . . . . . . . . . . . . . . . . . . . 160
5.3 Quasi-Laue Data Collection on LADI-III . . . . . . . . . . . . . . . . . 163

8
5.4 X-ray Data Collection on FIP . . . . . . . . . . . . . . . . . . . . . . . . 164
5.5 Refinement of DUOX:5-PMUA . . . . . . . . . . . . . . . . . . . . . . 165
5.6 Results . . . . . . . . . . . . . . . . . . . . . . . . . . . . . . . . . . . . 167
5.6.1 Deuterium Incorporation . . . . . . . . . . . . . . . . . . . . . 167
5.6.2 Peroxide Stability . . . . . . . . . . . . . . . . . . . . . . . . . . 170
5.6.3 Results from ’X-ray only’ and Joint neutron/X-ray Refinement 172
5.6.4 Results from Neutron-Only Refinement . . . . . . . . . . . . . 176
5.6.5 DUOX:5-PMUA Bonding Interactions . . . . . . . . . . . . . . 179
5.6.6 Catalytic Residues . . . . . . . . . . . . . . . . . . . . . . . . . 181
5.6.7 Active Site Water Network . . . . . . . . . . . . . . . . . . . . 192
5.6.8 Final Structure of the DUOX:5-PMUA Active Site . . . . . . . 193
5.7 Discussion . . . . . . . . . . . . . . . . . . . . . . . . . . . . . . . . . . 194
5.8 Conclusion . . . . . . . . . . . . . . . . . . . . . . . . . . . . . . . . . . 200
6 Concluding Remarks and Future Perspectives 203
6.1 Perdeuteration of UOX and Characterisation . . . . . . . . . . . . . . 203
6.2 DUOX in complex with AZA . . . . . . . . . . . . . . . . . . . . . . . 204
6.3 DUOX in complex with 9-PMUA . . . . . . . . . . . . . . . . . . . . . 206
6.4 Future Work . . . . . . . . . . . . . . . . . . . . . . . . . . . . . . . . . 207
6.5 Conclusion . . . . . . . . . . . . . . . . . . . . . . . . . . . . . . . . . . 208
A Supplementary Information for Chapter 3 210
Bibliography 214
9
List of Figures
1.1 Electronic states of triplet and singlet O2 . . . . . . . . . . . . . . . . . 14
1.2 The reduction of O2 to H2O via a four stage electron transfer . . . . . 15
1.3 Structures of Flavin and Pterin cofactors . . . . . . . . . . . . . . . . . 17
1.4 Activation of O2 by a reduced Flavin molecule . . . . . . . . . . . . . 19
1.5 Purine degradation pathway . . . . . . . . . . . . . . . . . . . . . . . 21
1.6 Free radical scavenging mechanism of uric acid (UA) . . . . . . . . . 24
1.7 The monomer and tetrameric structure of UOX . . . . . . . . . . . . . 27
1.8 Sequence Alignment of 10 remote Urate Oxidase (UOX) sequences . 30
1.9 Structural comparison of natural substrate uric acid (UA) and in-
hibitor 8-azaxanthine (AZA) . . . . . . . . . . . . . . . . . . . . . . . . 31
1.10 The proposed and corrected binding mode of uric acid (UA) in Urate
Oxidase (UOX) . . . . . . . . . . . . . . . . . . . . . . . . . . . . . . . 32
1.11 Structure of Urate Oxidase (UOX) active site with uric acid (UA) bound 33
1.12 Overall UOX reaction mechanism, presenting the potential role of
UOX and possible intermediates suggested to exist in this catalytic
cycle . . . . . . . . . . . . . . . . . . . . . . . . . . . . . . . . . . . . . 39
1.13 The pKa values of uric acid (UA) and charged species . . . . . . . . . 41
1.14 Neutron density map showing the presence of the 8-hydroxyxanthine
monoanion (8-HX) in the Hydrogenated Urate Oxidase (HUOX) ac-
tive site . . . . . . . . . . . . . . . . . . . . . . . . . . . . . . . . . . . . 44
1.15 The UOX reaction mechanism, showing the deprotonation of the 8-
hydroxyxanthine (8-HX) monoanion by active site residues. . . . . . 45

10
1.16 Direct evidence of a 5-(hydro)peroxyisourate intermediate determined
by X-ray crystallographic studies . . . . . . . . . . . . . . . . . . . . . 47
2.1 pET-24b+ Vector Map . . . . . . . . . . . . . . . . . . . . . . . . . . . . 51
2.2 Cell growth diagram . . . . . . . . . . . . . . . . . . . . . . . . . . . . 53
2.3 The process of cell adaptation . . . . . . . . . . . . . . . . . . . . . . . 56
2.4 The Hofmeister Series . . . . . . . . . . . . . . . . . . . . . . . . . . . 61
2.5 Anion exchange chromatography . . . . . . . . . . . . . . . . . . . . . 62
2.6 Anion exchange ligands . . . . . . . . . . . . . . . . . . . . . . . . . . 63
2.7 Hydrophobic interaction ligands . . . . . . . . . . . . . . . . . . . . . 64
2.8 Hydrophobic interaction chromatography . . . . . . . . . . . . . . . . 64
2.9 Size exclusion chromatography . . . . . . . . . . . . . . . . . . . . . . 66
2.10 Phase diagram for crystallisation . . . . . . . . . . . . . . . . . . . . . 67
2.11 Batch Crystallisation . . . . . . . . . . . . . . . . . . . . . . . . . . . . 69
2.12 Bragg’s Law schematic . . . . . . . . . . . . . . . . . . . . . . . . . . . 72
2.13 The Ewald Sphere . . . . . . . . . . . . . . . . . . . . . . . . . . . . . . 74
2.14 The Ewald Sphere for polychromatic data collection . . . . . . . . . . 76
2.15 LADI-III instrument set-up . . . . . . . . . . . . . . . . . . . . . . . . 93
2.16 Electrospray Ionisation Mass Spectrometry diagram . . . . . . . . . . 94
3.1 SDS-PAGE analysis of H-Enfors expression and solubility tests . . . . 100
3.2 SDS-PAGE analysis of D-Enfors expression and solubility tests . . . . 102
3.3 SDS-PAGE analysis of awoken cells expression test . . . . . . . . . . 104
3.4 Fermenter Profile . . . . . . . . . . . . . . . . . . . . . . . . . . . . . . 105
3.5 SDS-PAGE analysis of the fermenter expression test . . . . . . . . . . 106
3.6 Overview of DUOX Purification Protocol . . . . . . . . . . . . . . . . 107
3.7 SDS-PAGE analysis of ammonium sulfate precipitation of DUOX pu-
rification . . . . . . . . . . . . . . . . . . . . . . . . . . . . . . . . . . . 108
3.8 Chromatograms DEAE and Q anion exchange from DUOX purification110

11
3.9 SDS-PAGE analysis of DEAE and Q anion exchange from DUOX pu-
rification . . . . . . . . . . . . . . . . . . . . . . . . . . . . . . . . . . . 111
3.10 Chromatogram and SDS-PAGE analysis of Phenyl Sepharose Hy-
drophobic Interaction Chromatography for DUOX purification . . . 112
3.11 Chromatogram and SDS-PAGE analysis of Size Exclusion Chromatog-
raphy from DUOX purification . . . . . . . . . . . . . . . . . . . . . . 113
3.12 SDS-PAGE analysis comparing the molecular weight difference be-
tween HUOX and DUOX . . . . . . . . . . . . . . . . . . . . . . . . . 115
3.13 Mass spectrometry results showing the molecular weights of HUOX
and DUOX . . . . . . . . . . . . . . . . . . . . . . . . . . . . . . . . . . 116
3.14 Normalised fluorescence data from thermofluor assay, identifying
the Tm of both HUOX and DUOX . . . . . . . . . . . . . . . . . . . . . 118
4.1 The structure of the natural substrate uric acid (UA) shown in com-
parison to inhibitor 8-azaxanthine (AZA) . . . . . . . . . . . . . . . . 122
4.2 UA bound to UOX active site under anaerobic conditions . . . . . . . 123
4.3 Neutron study of the protonation states of the hydrogenated Urate
Oxidase:8-hydroxyxanthine (HUOX:8-HX) and hydrogenated Urate
Oxidase:8-azaxanthine (HUOX:AZA) complexes, using chloride as
an inhibitor . . . . . . . . . . . . . . . . . . . . . . . . . . . . . . . . . . 125
4.4 Batch crystallisation set up and the perdeuterated Urate Oxidase:8-
azaxanthine (DUOX:AZA) crystal in the capillary. . . . . . . . . . . . 127
4.5 The 1.5 mm3 perdeuterated Urate Oxidase:8-azaxanthine (DUOX:AZA)
crystal selected for neutron data collection . . . . . . . . . . . . . . . . 127
4.6 A Quasi-Laue neutron diffraction pattern of perdeuterated Urate Oxidase:8-
azaxanthine (DUOX:AZA) . . . . . . . . . . . . . . . . . . . . . . . . . 129
4.7 The protonation state of 8-azaxanthine (AZA) inhibitor when bound
to Urate Oxidase (UOX) . . . . . . . . . . . . . . . . . . . . . . . . . . 132
4.8 The DUOX:AZA neutron omit map . . . . . . . . . . . . . . . . . . . . 134

12
4.9 Hydrogen bonding distances between the AZA ligand and active
site residues . . . . . . . . . . . . . . . . . . . . . . . . . . . . . . . . . 135
4.10 The neutron omit maps of solvent molecule W1 in the active site . . . 137
4.11 The alternate conformation of residues Pro253, Asn254 and Lys255 . 139
4.12 The hydrogen bonding distances between the two conformers of Asn254
and W1 . . . . . . . . . . . . . . . . . . . . . . . . . . . . . . . . . . . . 140
4.13 Structure of the DUOX:AZA active site hydrogen bonding distances
between key residues . . . . . . . . . . . . . . . . . . . . . . . . . . . . 145
4.14 Structure of the DUOX:AZA active site and identified protonation
states of key residues . . . . . . . . . . . . . . . . . . . . . . . . . . . . 146
4.15 Hydrogen bonding network connecting solvent molecule W2 and
Lys10* . . . . . . . . . . . . . . . . . . . . . . . . . . . . . . . . . . . . . 147
4.16 Hydrogen bonding network connecting solvent molecule W2 and
His256 . . . . . . . . . . . . . . . . . . . . . . . . . . . . . . . . . . . . 148
4.17 Structure of the DUOX:AZA active site and identified protonation
states of key residues . . . . . . . . . . . . . . . . . . . . . . . . . . . . 153
5.1 Natural substrate uric acid (UA) shown in comparison to structural
analogue 9-methyl uric acid (9-MUA) . . . . . . . . . . . . . . . . . . 157
5.2 The 9-MUA ligand bound to HUOX forming the 9-methyl 5-peroxyisourate
intermediate, as determined by X-ray crystallographic studies . . . . 158
5.3 Details of the buffer exchange method used for the DUOX:5-PMUA
crystal . . . . . . . . . . . . . . . . . . . . . . . . . . . . . . . . . . . . . 161
5.4 The DUOX:5-PMUA crystal used for data collection and mounted in
a capillary . . . . . . . . . . . . . . . . . . . . . . . . . . . . . . . . . . 162
5.5 A Quasi-Laue neutron diffraction pattern of DUOX:5-PMUA . . . . . 163
5.6 A sample of D2O molecules before and after buffer exchange . . . . . 169
5.7 DUOX:5-PMUA crystal timeline . . . . . . . . . . . . . . . . . . . . . 171
5.8 Electron density maps of 5-PMUA in the active site, both omit and
with peroxide fully occupied . . . . . . . . . . . . . . . . . . . . . . . 173

13
5.9 X-ray and neutron omit maps of 5-PMUA from joint refinement . . . 175
5.10 Neutron-only Op1-Op2 omit map and final model of peroxide . . . . 178
5.11 Hydrogen bonding distances between the 5-PMUA ligand and ac-
tive site residues . . . . . . . . . . . . . . . . . . . . . . . . . . . . . . . 180
5.12 The protonation states of the active site residues of interest . . . . . . 181
5.13 Omit map and final model of Thr57* . . . . . . . . . . . . . . . . . . . 182
5.14 The omit maps and models of the singular and alternate conforma-
tions of Lys10* . . . . . . . . . . . . . . . . . . . . . . . . . . . . . . . . 184
5.15 Investigation into the protonation states of residues Lys10* and His256,
with Lys10* in a singular conformation . . . . . . . . . . . . . . . . . . 186
5.16 Investigation into the protonation states of residues Lys10* and His256,
with Lys10* in a singular conformation . . . . . . . . . . . . . . . . . . 187
5.17 Model of residues Lys10* and His256 with split deuterium position . 188
5.18 Model of residues Lys10* and His256 with positive Lys10* and neu-
tral His256 . . . . . . . . . . . . . . . . . . . . . . . . . . . . . . . . . . 190
5.19 Investigation into the orientation of residue Asn254 . . . . . . . . . . 191
5.20 Final model of the DUOX:5-PMUA active site with . . . . . . . . . . 193
5.21 Structural comparison of 5-PMUA peroxide dianion and 5-PMUA
hydroperoxide . . . . . . . . . . . . . . . . . . . . . . . . . . . . . . . . 197
5.22 Proposed mechanism by Wei et al describing the protonation of the
peroxide species . . . . . . . . . . . . . . . . . . . . . . . . . . . . . . . 199
5.23 The final structure of the DUOX:5-PMUA active site, detailing the
protonation states of active site residues . . . . . . . . . . . . . . . . . 202
A.1 Aspergillus flavus UOX amino acid sequence . . . . . . . . . . . . . . . 210
A.2 Expression and Solubility Testing of HUOX in LB medium . . . . . . 212

14
List of Tables
1.1 Standard reduction potentials of one- and two-electron reduction of
O2 species in water . . . . . . . . . . . . . . . . . . . . . . . . . . . . . 15
1.2 Details of Urate Oxidase (UOX) sequences used in the sequence align-
ment shown in Figure 1.8 . . . . . . . . . . . . . . . . . . . . . . . . . 29
2.1 The seven crystal classes . . . . . . . . . . . . . . . . . . . . . . . . . . 70
2.2 Neutron coherent scattering lengths and incoherent cross sections
for common elements found in macromolecular structures. The X-
ray scattering factors are also included for direct comparison. . . . . 77
3.1 Statistics comparing HUOX and DUOX purifications . . . . . . . . . 114
3.2 Tm values for HUOX and DUOX . . . . . . . . . . . . . . . . . . . . . 119
4.1 Neutron and X-ray data collection statistics for the perdeuterated
Urate Oxidase:8-azaxanthine (DUOX:AZA) crystal at 293 K . . . . . . 130
4.2 Model-refinement statistics for the joint refinement of DUOX:AZA . 133
4.3 Table containing DUOX:AZA active site hydrogen bond angles . . . 135
4.4 Omit maps and final models of active site residues Thr57* and Lys10* 142
4.5 Investigation of the His256 protonation state . . . . . . . . . . . . . . 144
4.6 Table containing the hydrogen bond angles between the active site
residues . . . . . . . . . . . . . . . . . . . . . . . . . . . . . . . . . . . . 146
4.7 Table containing hydrogen bond angles relating to the water net-
work between solvent molecule W2 and Lys10* . . . . . . . . . . . . . 147

15
4.8 Table containing hydrogen bond angles relating to the water net-
work between solvent molecule W2 and His256 . . . . . . . . . . . . 148
5.1 Neutron and X-ray data collection statistics for DUOX:5-PMUA crys-
tal at 293 K . . . . . . . . . . . . . . . . . . . . . . . . . . . . . . . . . . 164
5.2 Model-refinement statistics for the neutron-only refinement of perdeuter-
ated Urate Oxidase in complex with 9-methyl-5-peroxyisourate (DUOX:5-
PMUA). . . . . . . . . . . . . . . . . . . . . . . . . . . . . . . . . . . . . 167
5.3 Occupancies of peroxide in X-ray, joint refinement and neutron models178
5.4 Bond angles of 5-PMUA . . . . . . . . . . . . . . . . . . . . . . . . . . 179
5.5 Table containing DUOX:5-PMUA active site hydrogen bond angles . 180
5.6 The hydrogen bond angles of active site residues in DUOX:5-PMUA 192
A.1 Minimal media ingredients . . . . . . . . . . . . . . . . . . . . . . . . 211
A.2 Details of buffers used during the DUOX purification process . . . . 211
A.3 Amino acids, molecular weights and contribution to mass spectrom-
etry results . . . . . . . . . . . . . . . . . . . . . . . . . . . . . . . . . . 213

16
List of Abbreviations
5-HIU 5-hydroxyisourate
5-PIU 5-(hydro)peroxyisourate
8-HX 8-hydroxyxanthine
9-MUA 9-methyl uric acid
9-PMUA 9-methyl-5-peroxyisourate
ADP Atomic Displacement Parameter
AI After Induction
ASP Ammonium Sulfate Precipitation
AZA 8-azaxanthine
BI Before Induction
CCP4 Collaborative Computing Project 4
DEAE Diethylaminoethyl
DHU Dehydrourate
DLAB Deuteration Laboratory
DNA deoxyribonucleic acid
DSC Differential Scanning Calorimetry
DSF Differential Scanning Fluorimetry
DUOX Perdeuterated Urate Oxidase
EPR Electron Paramagnetic Resonance Spectroscopy
ESI-TOF Electrospray Ionisation Time-Of-Flight
ESRF European Synchrotron Radiation Facility
GF Gel Filtration
17
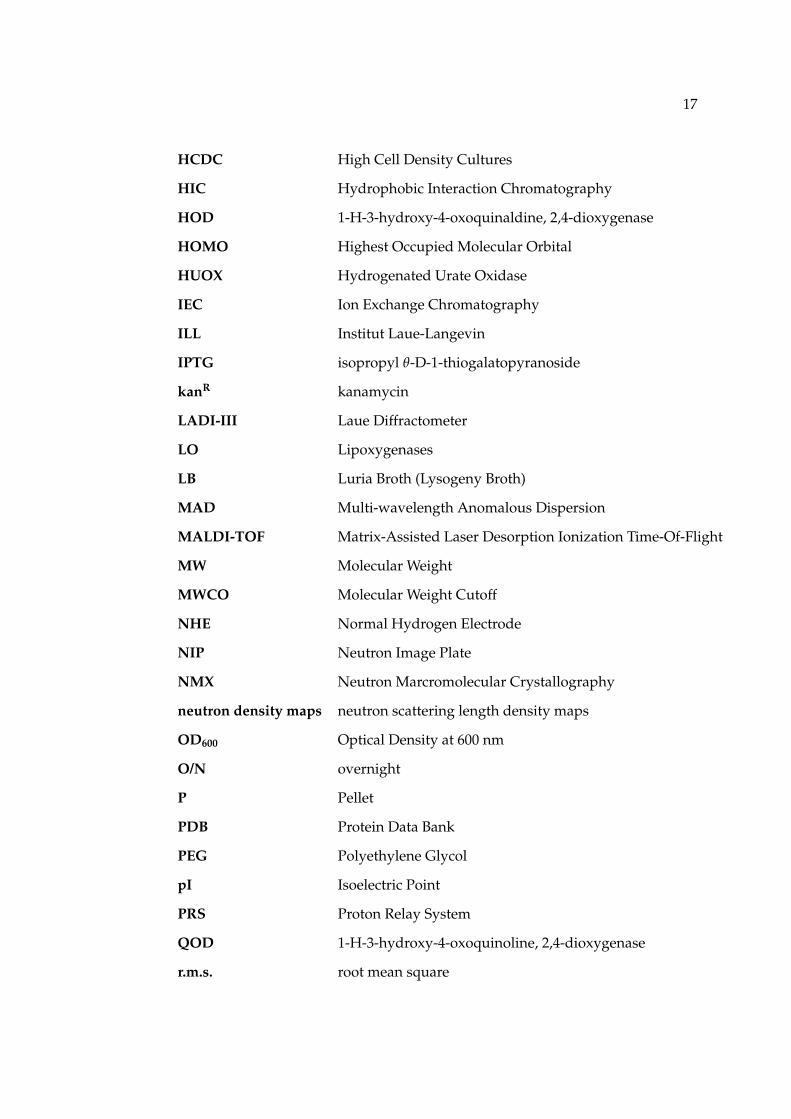
HCDC High Cell Density Cultures
HIC Hydrophobic Interaction Chromatography
HOD 1-H-3-hydroxy-4-oxoquinaldine, 2,4-dioxygenase
HOMO Highest Occupied Molecular Orbital
HUOX Hydrogenated Urate Oxidase
IEC Ion Exchange Chromatography
ILL Institut Laue-Langevin
IPTG isopropyl θ-D-1-thiogalatopyranoside
kanR kanamycin
LADI-III Laue Diffractometer
LO Lipoxygenases
LB Luria Broth (Lysogeny Broth)
MAD Multi-wavelength Anomalous Dispersion
MALDI-TOF Matrix-Assisted Laser Desorption Ionization Time-Of-Flight
MW Molecular Weight
MWCO Molecular Weight Cutoff
NHE Normal Hydrogen Electrode
NIP Neutron Image Plate
NMX Neutron Marcromolecular Crystallography
neutron density maps neutron scattering length density maps
OD600 Optical Density at 600 nm
O/N overnight
P Pellet
PDB Protein Data Bank
PEG Polyethylene Glycol
pI Isoelectric Point
PRS Proton Relay System
QOD 1-H-3-hydroxy-4-oxoquinoline, 2,4-dioxygenase
r.m.s. root mean square

18
RNA ribonucleic acid
ROS Reactive Oxygen Species
RPM Revolutions Per Minute
SAD Single-wavelength Anomalous Dispersion
SDS-PAGE sodium dodecyl sulfate-polyacrylamide gel electrophoresis
SN Supernatant
SOC Super Optimal broth with Catabolite repression
TcmH Tetracenomycin-F1 monooxygenase
TLS Tumor Lysis Syndrome
Tm melting temperature
Tris Tris(hydroxymethyl)aminomethane
TSA Thermal Shift Assay
UA Uric Acid
UOX Urate Oxidase
WT Wild Type
XO Xanthine Oxidase
Declaration: In this thesis the term ’hydrogen’ refers to the 1H isotope, whereas
’deuterium’ refers to the 2H isotope (or D). Throughout this thesis, the term proto-
nation state refers to the presence of either 1H/2H isotope attached to a heavy atom
(C, N, O, S). When describing an atom or residue as unprotonated, this indicates
an absence of either an 1H/2H atom. The term ’proton’ specifically refers to the
1H isotope, whereas to describe the 2H isotope the term ’deuterated’ is used, for
clarity. A ’hydrogen bond’ describes the interaction between either 1H/2H and the
atom acting as a hydrogen bond acceptor (O, N, S).

19
For my parents

20
Chapter 1
Introduction
Abstract
The focus of this research project is the archetypal cofactor-free enzyme Urate Ox-
idase (UOX). This chapter introduces the topic of O2-reacting enzymes, covering
typical methods of O2 activation. The role of UOX in biology is discussed with par-
ticular attention to the gene silencing event which caused its absence in humans,
and subsequent clinical implications. A comprehensive review of the structural
and functional studies of UOX is also conducted, addressing current mechanistic
theories and further challenges. Finally, the aim and motivation for this thesis is
presented, with reference to techniques employed during this research.

Chapter 1. Introduction 21
1.1 Oxygen-Reacting Enzymes
The oxidoreductases are a large family of enzymes that catalyse the transfer of
electrons from an electron donor, or reductant, to an electron acceptor, or oxidant.
Two important subclasses of oxidoreductases are the oxidases and the oxygenases.
Molecular oxygen (O2) is a vital reactant in these enzymatic reactions. Oxidase en-
zymes react with O2 acting as the oxidant, reducing it by two or four electrons to
either H2O2 or H2O. Any oxygen atoms incorporated into the reaction product are
commonly taken from the surrounding solvent, not from the O2 molecule directly.
Oxygenases operate differently by incorporating the atoms of O2 into the structure
of the organic product. Whether one or two of the O2 atoms are bonded to the
product of the reaction determines whether the enzyme is a monooxygenase or a
dioxygenase [1].
Molecular oxygen is classed as an electrophile, and has the ability to accept elec-
trons as it contains vacant orbitals. In fact, the ground state of O2, the most abun-
dant form, contains two unpaired electrons in the Highest Occupied Molecular Or-
bital (HOMO), as shown in the molecular orbital diagram in Figure 1.1. These two
electrons are of the same spin state giving a total spin of S = 1, therefore the spin
state is a ’triplet’ denoted by 3O2: this is considered a stable diradical. In com-
parison, an excited state of O2 that contains paired electrons in the HOMO and is
considered a ’singlet’ species 1O2, shown in Figure 1.1.

Chapter 1. Introduction 22
𝝈*2pz
𝝿*2px,y
𝝈2pz
𝝿*2px,y
3O2
𝝈*2pz
𝝿*2px,y
𝝈2pz
𝝿*2px,y
1O2
FIGURE 1.1: Molecular orbital diagrams for triplet (3O2) and singlet (1O2) dioxygen.Triplet O2 has two unpaired electrons in the HOMO whereas singlet O2 has one pair.Adapted from [2] with permission from Elsevier.
The standard reduction potential E0 for the O2/H2O redox couple at pH 7 is + 0.815
V [3], indicating that O2 has the potential to be a strong oxidising agent. The overall
reduction reaction of O2 is shown in Equation 1.1.
O2 + 4H+ + 4e− −→ 2H2O (1.1)
However, the reduction of O2 to H2O does not occur with a concurrent four-electron
transfer, instead four one-electron reactions typically occur. The details of these
four one-electron reactions are given in Figure 1.2. The first reduction occurs as
O2, a stable diradical triplet species, accepts an electron to form superoxide O2- or
HO-O., a radical doublet species. The second reduction results in the formation of
hydrogen peroxide H2O2. This is followed by two further one electron transfers:
the formation of a hydroxyl radical OH. and one water molecule H2O, finally, the
termination of the reaction with an electron transfer resulting in a total of two water
molecules [4]. The associated reduction potentials for each one- and two-electron
reactions at pH 7.25 are shown in Table 1.1.

Chapter 1. Introduction 23
O2 HO2˙ H2O2 HO˙ + H2O 2H2O
1e-, 1H+ 1e-, 1H+ 1e-, 1H+ 1e-, 1H+
dioxygen(diradical)
superoxide(radical)
hydrogen peroxide
hydroxyl(diradical) water
FIGURE 1.2: The reduction of O2 to H2O via a four stage electron transfer [4].
TABLE 1.1: Standard reduction potentials of one- and two-electron reduction of O2 speciesin water. *NHE: normal hydrogen electrode. Values taken from [5]
E0 vs. NHE, pH 7.25
O2 + e- → O2- - 0.33 V
O2- + e- + 2H+ → H2O2 + 0.89 V
H2O2 + e- + H+ → OH. + H2O + 0.38 V
OH. + e- + H+ → H2O + 2.31 V
Although the reaction between O2 and organic molecules is both exothermic and
thermodynamically favourable, it is not kinetically favourable due to a significant
activation barrier to the reaction [3]. There are two factors that are considered re-
sponsible for this kinetic inertness and are related to the electronic structure of O2.
As shown in Table 1.1, all but one of the O2 reduction reactions are thermodynami-
cally favourable: the primary electron transfer to O2 resulting in superoxide O2- has
a reduction potential of - 0.33 V. This one electron transfer is considered thermody-
namically unfavourable and, therefore, O2 is the kinetically favoured molecule [6].
An additional restriction is due to the difference in spin states of O2 and organic
molecules. Organic molecules typically exist in a singlet state with no unpaired
electrons, whereas ground state O2 exists as a triplet, with two unpaired electrons
[7]. The selection rule, or transition rule, stipulates that angular momentum must
be conserved during a reaction. Therefore, a reaction between triplet state O2 and

Chapter 1. Introduction 24
singlet state organic molecules to form singlet state products is considered ’spin
forbidden’. The O2 molecule itself can be excited to a singlet state, meaning the
reaction with singlet organic molecules would be ’spin allowed’. The molecular
orbital diagram of this O2 species, showing the paired electronic structure, is shown
in Figure 1.1. However, this reaction requires a high activation energy as the lowest
energy singlet state of O2 is 22.5 kcal/mol higher than energy than ground state
triplet O2 [2].
These kinetic restrictions result in the ability to closely control the reaction of O2
with organic molecules in aerobic environments. As a result, O2 can coexist with
a variety of reducing agents inside living cells without reacting with them. This is
considered crucial in biology as it prevents random O2 reactions that may result in
the destruction of essential components of the living cell [6, 7].
The barrier to the reactivity of O2 with organic molecules is unfavourable, but reac-
tions can occur. The oxidising ability of O2 can be accessed by the presence of a suit-
ability powerful reducing agent [6]. Such reducing agents capable of reducing O2
include metal centres and organic cofactors, and are widely used in O2-dependant
reactions. These moieties can assist in the activation of either O2 or the organic
substrate directly.
Redox-active metal centres are commonly present in O2-reacting enzymes, contain-
ing iron, molybdenum, or copper. There are three main ways that transition metals
with unpaired electrons can activate O2 for spin allowed reactions: orbital overlap,
single electron transfer, and reaction with a substrate radical [2].
Orbital-orbital overlap can occur between O2 and a transition metal ion when there
are unpaired 3d electrons on the metal. The π* orbitals of the complexed O2 are able
to overlap with those of the metal ion, creating a singlet species. This is then able
to react with organic material in the singlet state as the reaction is ’spin-allowed’,
providing the overall number of electrons in the complex remains constant [2, 8].

Chapter 1. Introduction 25
When the protein contains a redox-active metal that has multiple oxidation states,
such as Fe (II/III), a single electron transfer can occur to bound O2, reducing it to
form superoxide, O2-. The formation of a superoxide radical has an unfavourable
activation potential (Table 1.1), however, superoxide can participate in further one-
or two-electron transfer reactions favourably. Although this reaction is energeti-
cally unfavourable, the environment surrounding the O2 binding site can favour
the formation of superoxide through stabilisation interactions. These stabilisation
effects have been noted in other enzymes. For example, in the case of myeloperoxi-
dase, the enzymatic activity is highest at low pH, resulting in a protonated histidine
residue located at the active site. It is suggested that this histidine is involved in
the stabilisation of the superoxide bound to the heme centre [9]. Alternatively, en-
zymes may control the active site environment to stabilise either the oxidised or
reduced form of the metal centre [10].
The reaction of O2 with a substrate radical is also a method of activation, seen in fer-
ric substrate-activating enzymes including lipoxygenases (LO) [11]. The oxidised
metal centre in LO enzymes catalyses a hydrogen abstraction from the substrate to
form a substrate radical. This facilitates the reaction of the substrate radical with
O2 as it is now a spin allowed process [2].
FIGURE 1.3: Basic structures of the Flavin and Pterin cofactors that can be present inenzymes to facilitate the reaction of an organic substrate and O2.
Conjugated organic cofactors that are able to form a stable radical intermediate

Chapter 1. Introduction 26
are also able to facilitate the transfer of electrons to O2. Common organic moieties
include Flavins and Pterins: a structural representation of these are shown in Figure
1.3. The ability of reduced Flavins and Pterins to delocalise and stabilise unpaired
electrons is thought to be important in their reactions with O2 [12].
The Flavin moiety acts as a redox cofactor, which is capable of existing in either
a one- or two- electron reduced state [13]. These electrons can be received from a
reduced substrate before delivering them to an electron acceptor. In this case, O2
can be employed as an electron acceptor from a reduced Flavin, commonly result-
ing in the generation of H2O2. The general reaction of Flavin-containing enzymes
with O2 is that a one electron transfer occurs between the cofactor moiety and O2,
generating a radical pair consisting of the Flavin semiquinone and a superoxide
molecule [14, 15]. This reaction circumvents the spin-forbidden aspect similarly
to when there is a transition metal containing multiple oxidation states, described
previously. This radical pair can result in a recombination reaction and the for-
mation of a covalent adduct between the C4a position on the Flavin ring and O2,
generating a reactive C4a-(hydro)peroxide species [14]. The protonation state of
this (hydro)peroxyflavin intermediate determines if the reaction is an electrophilic
or nucleophilic attack [16, 17]. The formation of a C4a-(hydro)peroxyflavin inter-
mediate is thought to be central to the mechanism seen in many Flavin monooxy-
genases, involved in reactions such as Baeyer-Villiger oxidations, hydroxylations,
and epoxidations [17]. This C4a-(hydro)peroxyflavin intermediate has been well
characterised via spectroscopic studies [14, 18, 19], however it has not been visu-
alised structurally. A schematic describing the reaction of a Flavin cofactor with
O2 to form a C4a-(hydro)peroxyflavin intermediate before the expulsion of H2O2,
commonly seen in Flavin-dependant monooxygenases, is shown in Figure 1.4 [2].

Chapter 1. Introduction 27
FIGURE 1.4: The activation of O2 by electron transfer from a Flavin moiety, seen inFlavin-dependent monooxygenases. The reduced Flavin residue transfers an electron toan O2 molecule (1) creating a Flavin semiquinone radical and superoxide (2). The pairthen undergoes a radical recombination reaction to form a C4a-hydroperoxyflavinintermediate (3) or C4a-peroxyflavin intermediate (5). This flavin-oxygen adduct thenbreaks down to form oxidised Flavin and hydrogen peroxide (5). Adapted from [2] withpermission from Elsevier.

Chapter 1. Introduction 28
Pterin-containing enzymes also commonly participate in enzymatic reactions in-
volving O2. Their basic structure and ability to delocalize and stabilise an unpaired
electron is similar to that of Flavin moieties, shown in Figure 1.3 [14]. Less is un-
derstood about the intermediate structures of Pterin reactions, however, several
Pterin-containing ezymes, such as phenylalanine hydroxylase, are thought to pro-
ceed through a similar C4a-intermediate as seen in Figure 1.4 [20, 21].
Interestingly, there are O2-dependant enzymes that contain no metal centre or co-
factor [3, 22]. The mechanism by which these enzymes are able to circumvent the
selection rule is still not fully understood. It has been suggested that the reaction
of a carbanion and O2 is mechanistically possible if a stable radical can be accessed.
However, there is little structural evidence to validate these claims.
1.2 Urate Oxidase
Purines are essential small molecules used as building blocks in DNA and RNA
[23]. Many enzymes are involved in maintaining a balance of purines by promoting
their synthesis or degradation [24]. Purine catabolism can also be referred to as a
’salvage pathway’, where nucleotides are synthesised from intermediates from the
degradation of other nucleotides.
A reaction scheme describing the breakdown of purine molecules to allantoin is
described in Figure 1.5. Enzymes involved in this pathway include Xanthine Oxi-
dase (XO) and Urate Oxidase (UOX). The final product of this pathway in humans
is UA. This is explained in more detail in Section 1.2.1.

Chapter 1. Introduction 29
FIGURE 1.5: Reaction scheme describing the breakdown of purine molecules to Allantoin.Enzymes such as Xanthine Oxidase and Urate Oxidase participate in this salvagepathway. In the case of humans the final product is Uric Acid (highlighted in the red box).
UOX is a peroxisomal cofactor-free oxidase that participates in this purine degrada-
tion pathway. It is responsible for the enzymatic catalysis of UA to 5-hydroxyisourate
(5-HIU), reacting with O2 and producing hydrogen peroxide (H2O2) as a by-product.
1.2.1 Gene Silencing Event
UOX is found in all three domains of life: Archaea, Bacteria and Eukarya. How-
ever, in humans, certain primates, birds, and reptiles, the gene encoding for UOX
is silenced [25, 26]. As a result, the final product of the purine degradation path-
way is UA. Due to its presence in both prokaryotes and eukaryotes it is clear that
UOX is of ancient origin [27]. As other primates have retained the production of

Chapter 1. Introduction 30
UOX, this gene silencing is assumed to have happened during the period of pri-
mate evolution, in a hominoid ancestor after divergence from Old World Monkeys
[28, 29].
The loss of UOX activity has been shown to be due to nonsense mutations [30, 31],
however, exactly how and why this happened is still not fully understood. Several
mutations have been identified in the human UOX gene that may be relevant to
the inactivation of this enzyme. Two nonsense mutations, at positions 33 and 187
coding for arginine, have been identified as premature stop codons [30], with the
mutation at position 33 suggested as the primary cause of UOX silencing in humans
[27].
It has been suggested that the gene silencing event was a multistep process: some
monkeys have retained a lower level of UOX production, implying a gradual re-
duction [28, 32–35]. This is supported by a study that found blocking UOX activity
in mice resulted in fatality: attributed to the inability of the mice to manage the
sudden increase in UA [36]. In addition, the examination of ancestral UOXs pro-
vided evidence that the enzymatic activity had decreased gradually, via stepwise
mutations [30, 35]. There are two suggestions for the systematic removal of UOX.
One suggestion is that ancient apes slowly decreased the transcription of UOX via
mutations in the UOX promoter before the pseudogenisation events [27, 35]. Alter-
natively, a reduction in UOX activity before pseudogenisation would also prevent
the sudden increase in UA [35, 37]. This may be considered a more robust method
for abolishing UOX activity in comparison to genetic mutations, which may result
in compensatory changes that would up-regulate UOX expression [35].
An increase in UA is argued to be the main benefit of UOX silencing due to its
free radical scavenging activity and reducing the likelihood of age-related cancers
[33]. In addition, the loss of UOX may have had a ’survival advantage’ at the time
of silencing, relating to the change in diet of our ancestors [35]. Contrasting the
other proposals, it was suggested that the loss of UOX activity in humans occurred

Chapter 1. Introduction 31
through a single mutation event [29, 30]. Furthermore, it has been postulated that
this event and silencing of UOX was accidental, and the resultant side effects such
as gout and hyperucemia are unwanted [25]. Nevertheless, the absence of UOX in
humans, and the resultant increase in UA, have clinical implications.
1.2.2 Importance and Clinical Implications
Oxidative stress is a result of chemical and biological reactions that produce un-
wanted by-products and side effects. Free radicals are unstable molecules that can
cause damage to other molecules and are usually by-products of essential cell pro-
cesses or metabolism. For example, the metabolism of O2 generates .OH, O2._ and
H2O2 [38]. These Reactive Oxygen Species (ROS) have implications in neurodege-
narative diseases, cancers, and ageing [38, 39].
Free radical scavengers, or antioxidants, are molecules that can react with unstable
free radicals and convert them to stable, unreactive, and less harmful compounds.
One such important antioxidant and free radical scavenger is uric acid (UA) [33,
40]. As previously described in Section 1.2.1, the UOX gene silencing event has
resulted in an increased concentration of UA in humans. As a result the level of
UA in the blood is typically fifty times higher than in other mammals [25]. Excess
UA that is accumulated due to the lack of UOX is excreted in urine.
Specifically, UA is found in the plasma, where it is responsible for around two
thirds of radical scavenging activity [41]. It has been found to be effective both in
vitro and in vivo [33, 42, 43], and shown to scavenge both hydroxyl radicals [44]
and oxo-heme oxidants [33, 44]. In particular, it is efficient at scavenging perox-
ynitrite (ONOO-) in the presence of ascorbic acid and thiols [45–47]. Peroxynitrite
can disrupt cell signalling pathways and react with lipids, DNA, and proteins. The
essential role of UA is supported by the fact that neither ascorbic acid or thiols can

Chapter 1. Introduction 32
prevent the reactions of peroxynitrite alone. This UA radical scavenging pathway
is shown in Figure 1.6 [47].
FIGURE 1.6: The free radical scavenging mechanism of uric acid (UA) in conjunction withascorbic acid. Figure taken from [47], published by The Royal Society of Chemistry.
Although this has the possible evolutionary benefits discussed previously, there are
a number of side effects that can have serious, even fatal, consequences when UA
concentration is high.
Gout is an painful inflammatory disease that results from the accumulation of
monosodium urate crystals in joints [48, 49]. This can be caused by the body over-
producing large quantities of UA, or a build up of UA resulting from the failure
of the kidneys to maintain physiological concentrations by UA excretion. It is im-
portant to note that the overproduction of UA is responsible for ∼ 10% of cases of
gout whereas 90% of cases are as a result of problems with renal excretion [49]. Al-
though there is no cure for gout, there are therapies that reduce the concentration
of UA and minimise long term damage [48].
Chapter 1. Introduction 33
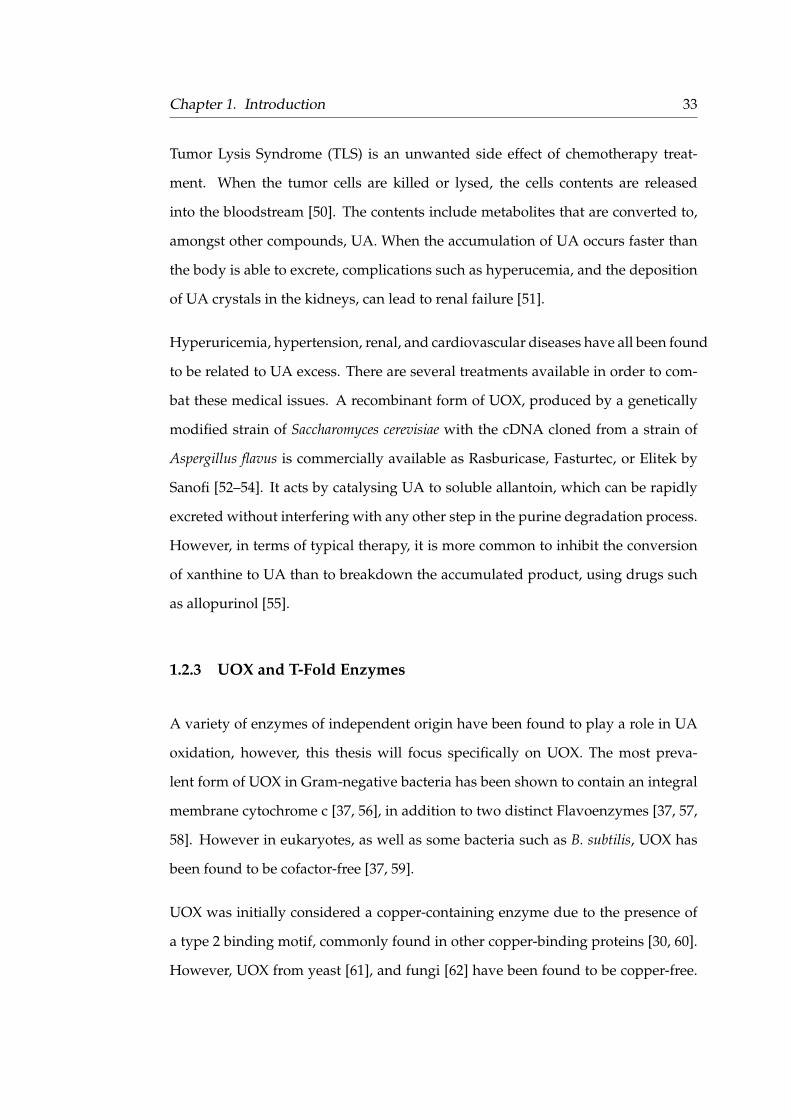
Tumor Lysis Syndrome (TLS) is an unwanted side effect of chemotherapy treat-
ment. When the tumor cells are killed or lysed, the cells contents are released
into the bloodstream [50]. The contents include metabolites that are converted to,
amongst other compounds, UA. When the accumulation of UA occurs faster than
the body is able to excrete, complications such as hyperucemia, and the deposition
of UA crystals in the kidneys, can lead to renal failure [51].
Hyperuricemia, hypertension, renal, and cardiovascular diseases have all been found
to be related to UA excess. There are several treatments available in order to com-
bat these medical issues. A recombinant form of UOX, produced by a genetically
modified strain of Saccharomyces cerevisiae with the cDNA cloned from a strain of
Aspergillus flavus is commercially available as Rasburicase, Fasturtec, or Elitek by
Sanofi [52–54]. It acts by catalysing UA to soluble allantoin, which can be rapidly
excreted without interfering with any other step in the purine degradation process.
However, in terms of typical therapy, it is more common to inhibit the conversion
of xanthine to UA than to breakdown the accumulated product, using drugs such
as allopurinol [55].
1.2.3 UOX and T-Fold Enzymes
A variety of enzymes of independent origin have been found to play a role in UA
oxidation, however, this thesis will focus specifically on UOX. The most preva-
lent form of UOX in Gram-negative bacteria has been shown to contain an integral
membrane cytochrome c [37, 56], in addition to two distinct Flavoenzymes [37, 57,
58]. However in eukaryotes, as well as some bacteria such as B. subtilis, UOX has
been found to be cofactor-free [37, 59].
UOX was initially considered a copper-containing enzyme due to the presence of
a type 2 binding motif, commonly found in other copper-binding proteins [30, 60].
However, UOX from yeast [61], and fungi [62] have been found to be copper-free.

Chapter 1. Introduction 34
The UOX found in soyabean root nodules was also examined and found to only
contain trace quantities of copper [63]. Additionally, MALDI-TOF mass spectrom-
etry measurements showed the absence of any organic cofactor [64]. The first X-
ray structure was taken from Aspergillus flavus UOX and published by Colloch et
al. [65]. This structure was able to unambiguously determine the absence of any
additional metal centre or cofactor present in the enzyme, confirming UOX as a co-
factorless enzyme in Aspergillus flavus [65]. This study was also the first to present
cofactor-free UOX as a member of the tunnelling-fold (T-fold) superfamily.
The T-fold tetrameric structure is found in multimeric proteins crossed by a chan-
nel, forming a ’T’ shape. It consists of an antiparallel β-sheet of four sequen-
tial strands, sandwiching two antiparallel α-helices between the second and third
strands and is denoted by the topology ββααββ [65–67]. Multiple T-fold motifs as-
semble to form a β(2n)α(n) barrel, providing an efficient scaffold for building large
multimeric proteins.
Each UOX monomer contains two successive T-fold domains of 137 and 164 residues
in length, shown in Figure 1.7 (a). The topology of the two domains is identical and
the sequence similarity is 52.3%, however, the sequence identity is low, 8.3% [66].
Two monomers associate to form a dimer related by a two-fold axis, with the active
site located at the interface, this is shown in Figure 1.7 (b) [65]. UOX is function-
ally active as a tetramer, binding a total of four substrate molecules: one at each
dimer interface. The barrel-shaped quaternary structure of UOX is shown in Fig-
ure 1.7 (c) and (d). The PDB used in Figure 1.7 was one of the first Aspergillus flavus
UOX structures to be published (1R51): the deposition by Colloch et al. is no longer
available in the PDB (1UOX) [65, 68].

Chapter 1. Introduction 35
(a) (b)
(c) (d)
FIGURE 1.7: The overall structure of Aspergillus flavus Urate Oxidase (UOX) bound toinhibitor 8-azaxanthine (AZA) in PDB entry 1R51 [68]. (a) A monomer of Af UOX containstwo successive T-folds: the dotted line shows the separation of the domains. H and S areused to represent α-helices in yellow and β-strands in blue, respectively. (b) The ligandbinding site is located at the interface between two dimers. (c) The tetramer of functionalUOX enzyme, forming a barrel structure with the twofold axis shown by a dotted line. (d)90◦ rotation of the tetramer.
Chapter 1. Introduction 36
Superfamilies can have high structural similarities but vary widely in terms of func-
tion. There are currently a total of five enzymes that have been identified as pos-
sessing a T-fold structure. The list includes GTP cyclohydrolase I 10, 6-pyruvol
tetrahydropterin synthase, 7,8-dihydroneopterinn aldolase and 7,8-dihydroneopterin
triphosphase epimerase, in addition to UOX [66]. Enzymatic function ranges from
the biosynthesis of folate and pteridines to purine degradation [69].
A common feature of T-fold enzymes is that all substrate molecules contain pyrim-
idine or purine rings. In addition, all ligand binding pockets are located in a deep
and narrow channel at the interface between monomers, typical for the binding
of small molecule substrates [66]. Another feature found in T-fold-containing en-
zymes is the presence of topohydrophobic regions, where sequences contain a se-
ries of strong hydrophobic residues (Val, Ile, Leu, Phe, Met, Tyr, Trp) [70]. This
characteristic is seen across all members of the T-fold superfamily [66, 70]. In
terms of functionality, the number of monomers required for the structure of ac-
tive site varies across the superfamily, however, conserved glutamine or glutamate
residues are found in the binding sites and are important for anchoring the sub-
strate molecules [66].
T-fold enzymes have been found to have a high structural similarity. In a compari-
son of UOX with the other enzymes possessing the T-fold motif, it was found that
they superimpose with a mean of 1.4 Å root mean square deviation (RMSD) on the
common core (aligned on Cα) [66]. However, the enzymes show a wide sequence
variation, exhibiting a low level of sequence identity, with a mean of 10.5% along
the aligned regions [66]. It has been suggested that all proteins are descended from
a limited number of ancestors and through evolution the sequence similarity has
diverged, but structural aspects, such as the common fold or functional characteris-
tics, have been retained [66, 71, 72]. This is demonstrated in the currently identified
members of the T-fold superfamily where the sequence divergence is high but the
T-fold motif and substrate structure show similarities [66].

Chapter 1. Introduction 37
1.2.4 Structure of the Active Site
In this section, a structural comparison between different UOXs is described, with
reference to a sequence alignment. This alignment is used to highlight identical
residues seen across a range of UOXs. These identical residues are discussed, with
attention given to their role in the active site, and their possible functional capabil-
ities.
A sequence alignment of 10 different UOX sequences with a 30-50% identity is
shown in Figure 1.8: the full details of the UOX sequences included are described
in Table 1.2. Residues likely to be present across the whole UOX family can be
identified from this sample. In total 23 residues are conserved, indicated by a red
background. There are 13 residues in close proximity to the active site and they are
identified by a yellow star: the relevance of these residues is described below.
TABLE 1.2: Details of Urate Oxidase (UOX) sequences used in the sequence alignmentshown in Figure 1.8
SWISS-PROT Residues aligned Organism
identifiers
URIC_ASPFL 1 - 301 Aspergillus flavus
URIC_EMENI 1 - 301 Emericella nidulans
URIC_CYBJA 1 -303 Cyberlindnera jadinii
URIC_DROME 32 - 352 Drosophila melanogaster
URIC_DROVI 26 - 342 Drosophila virilis
URIC_MOUSE 1 - 302 Mus musculus
URIC_SOYBN 1 - 309 Glycine max
URIC_ARATH 1 - 309 Arabidopsis thaliana
PUCL_BACSU 181 - 494 Bacillus subtilis
PUCL_BACSB 1 - 332 Bacillus sp.
The structure of the UOX active site has been extensively investigated, in both the

Chapter 1. Introduction 38
FIG
UR
E1.
8:A
nal
ignm
ento
f10
rem
ote
sequ
ence
sof
Ura
teO
xida
se(U
OX
),la
belle
dw
ith
thei
rSW
ISS-
PRO
Tid
enti
fiers
.The
rear
e23
iden
tica
lre
sidu
esth
atar
ehi
ghlig
hted
bya
red
back
grou
nd.C
onse
rved
resi
dues
ofre
leva
nce
toth
eac
tive
site
are
indi
cate
dby
yello
wst
ars.
Res
idue
num
beri
ngis
inac
cord
ance
wit
hA
.flav
usU
OX
and
α-h
elic
esan
dβ
-she
ets
iden
titi
esar
eta
ken
from
[65]
.Seq
uenc
eid
enti
tyan
dfu
rthe
rde
tails
can
befo
und
inTa
ble
1.2.
Figu
repr
oduc
edus
ing
ESPR
IPT
[73,
74]

Chapter 1. Introduction 39
presence and absence of a ligand with > 100 structures deposited in the PDB [75].
The first X-ray crystal structure from Colloch et al., previously discussed in Section
1.2.3, was taken from Aspergillus flavus UOX and was able to provide details on
the key residues in the active site (PDB entry 1UOX, no longer available). It was
crystallised in complex with 8-azaxanthine (AZA) which acts as an inhibitor to the
reaction as, unlike UA, it cannot be oxidised and prevents the binding of molecu-
lar O2 [65]. A structural comparison of AZA and UA is shown in Figure 1.9. This
allowed the identification of residues surrounding the active site and the interac-
tions with the ligand under aerobic conditions. It is important to note that residues
referred to in this chapter follow the Aspergillus flavus numbering, for consistency.
The * sign is used to denote those residues participating in binding that are present
on the neighbouring monomer, and continues throughout this thesis.
(a) (b)
FIGURE 1.9: (a) Structure of the natural substrate uric acid (UA) in comparison with (b)inhibitor molecule 8-azaxanthine (AZA).
However, the initial binding mode of AZA, as seen in the structure by Colloch et al.
solved to 2.05 Å [65], was corrected in a further X-ray structural study by Retailleau
et al. at a resolution of 1.80 Å [68]. The substrate molecule is found to be rotated
around the active site, changing its interactions with residues Arg176 and Gln228.
The original and revised orientations are shown in Figure 1.10 [68].

Chapter 1. Introduction 40
FIGURE 1.10: (a) Ligand binding mode of uric acid (UA) proposed from the first crystalstructure of Urate Oxidase (UOX) in complex with 8-azaxanthine (AZA) by Colloch et al.[65] solved to 2.05 Å and (b) corrected ligand orientation of UOX:AZA, published byRetailleau et al. in an X-ray structure at a higher resolution of 1.80 Å [68]. Both 2Fo-Fcelectron density maps are contoured at 1.75 σ. Reproduced from [68] with permission ofthe International Union of Crystallography.
Further structural studies showed that the natural substrate UA bound to the en-
zyme in the same location identified in the AZA complex: this was also observed
in other UOX:inhibitor complexes [68, 76, 77]. Negatively charged ions such as Cl-
and CN- have an inhibitory effect by blocking the active site after ligand binding,
preventing the binding of O2 [78–80]. This allowed the visualisation of UA bound
to the active site without being converted to the product [79, 80]. Anaerobic crystal
growth in conjunction with data collection at 100 K enabled the structural investiga-
tion of UOX:UA describing the active site in an anaerobic environment, i.e., before
the binding of O2 [81]. The overall structure of the active site with UA bound is
shown in Figure 1.11, and Figure 1.10 (b) shows the specific bonding interactions
of UA and active site residues.
Chapter 1. Introduction 41
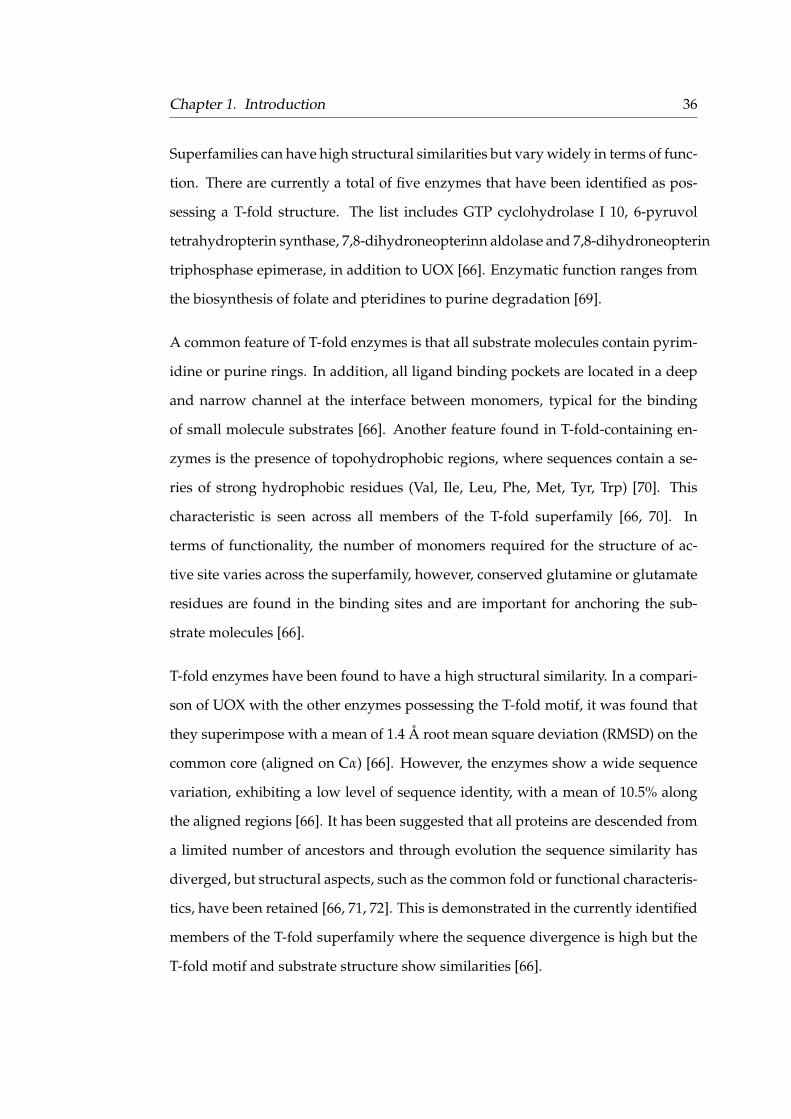
FIGURE 1.11: The active site of Urate Oxidase (UOX) with natural substrate uric acid (UA)bound under anaerobic conditions, trapping solvent molecule, W1, in the active site. Theresidues Gln228 and Arg176 hold the purine ring in position and Phe159 provides πstacking interactions below. Residues Asn254, Lys10*, and Thr57* encompass theperoxohole where solvent molecule W1 occupies the O2 position prior to its binding.Solvent molecule W2 is seen hydrogen bonded to a nitrogen atom at position N9 of UA.Figure adapted from [82]. c© 2011 Wiley-Liss, Inc.
Proximal residues Arg176 and Gln228, often described as "molecular tweezers",
hold the substrate in the active site through hydrogen bonding interactions [77, 82,
83]. The guanidinium group of Arg176 acts as a hydrogen bond donor to both de-
protonated N3 and the carbonyl group at C2, with distances of ∼ 3.01 Å and ∼
2.89 Å respectively [68, 80, 83]. This particular residue is of interest as it one of
the nonsense mutations identified in the gene silencing event, described in Section
1.2.1 [30]. The carbonyl group of Gln228 acts as a hydrogen bonding acceptor for
the protonated N1 at∼ 2.95 Å whilst the amine -NH2 donates to the carbonyl at C6
at a distance of ∼ 3.12 Å [68, 80, 83]. A conserved glutamine or glutamate residue
is found in the active site of T-fold containing enzymes and thought to be impor-
tant for anchoring the substrate molecules, as discussed in Section 1.2.3: a Gln228

Chapter 1. Introduction 42
residue is present in the active site of UOX. The backbone amide of Thr57* is lo-
cated ∼ 2.9 Å from N7, indicative of hydrogen bonding, where the amide is proto-
nated and the N7 is deprotonated [80]. In addition, there is strong π-π interaction
between the purine ring of the substrate and residue Phe159, located directly be-
low the plane of the binding site. Residues Arg176, Gln228, Phe159, and Thr57* are
shown in the sequence alignment to be identical across all sampled UOX sequences
in Figure 1.8, indicating that the active site environment present in different UOXs
is extremely similar.
Above the bound ligand is a cavity with a width of approximately 5.5 Å in the
O2-free UOX [82]. By calculating the electrostatic potential, it was shown that the
cavity is positively charged [68], supported by the binding of negatively charged
CN- and Cl- [83]. Interestingly, in several Flavin enzymes a positive charge sur-
rounding the active site has been proposed to increase the reactivity of O2 [19, 84].
For example, glucose oxidase possesses an electrostatically preorganised active site
where a protonated histidine residue is thought to increase the rate of reaction.
Identified by site-directed mutagenesis and kinetic studies, this positively charged
residue is in a location to stabilise the superoxide-flavin semiquinone radical pair,
important for increasing the rate of reaction in Flavoprotein enzymes with O2 [19,
85, 86]. A histidine residue (His256) is also present in the UOX active site and is
found to be identical across the sample of UOXs shown in the sequence alignment,
however, if the His256 is related to the positively charged active site has not been
determined.
Examination of the cavity located in the active site of the UOX:AZA structure de-
termined using X-ray crystallography [65], identified a solvent molecule, termed
W1, positioned directly above the C4-C5 bond of UA. This solvent molecule W1
is hydrogen bonded to two residues: Thr57* and Asn254 that are flexible in the
ligand-free structure and become locked into a rigid position when O2 is bound
[79]. Upon binding, O2 occupies the cavity above the bound ligand at the location

Chapter 1. Introduction 43
of solvent molecule W1 in the anaerobic structure. The positioning of O2 has lead
to this position being termed the ’peroxohole’ [87]. Both the displacement of sol-
vent molecule W1 and a reorganisation of solvent in the active site occur when O2
binds [81]. This was observed in a study of X-ray structures, the anaerobic UA-
anaerobic complex and the UA oxygen-bound complex, where the displacements
of active site waters could be identified by comparing the two structures [81]. Due
to the proximity of solvent molecule W1 to the C5 position on the ligand, it has
been suggested that solvent molecule W1 is ideally positioned to hydrolyse the
dehydrourate intermediate (DHU) in the formation of 5-hydroxyisourate (5-HIU)
[88].
A number of water molecules surround the active site. Low B-factors indicate a
well ordered, hydrogen-bonded water network that is seen to change on ligand
binding [68]. A second solvent molecule (W2), is located within hydrogen bond-
ing distance of N9 in UA, as shown in Figure 1.11. Solvent molecule W2 is shown
to be central to a hydrogen bonding network of water molecules, all conserved in
ligand bound complexes [68]. Due to the hydrogen bonding distances between
these solvent molecules, W1-W2 have been characterised as the two end points of
a low energy proton transfer system, proposed to play a key role in UOX cataly-
sis [82, 83]. Neutron structures by Oksanen et al. of UOX:AZA and UOX:8-HX at
room temperature investigated the nature of the bonding network between these
two key waters, however, the neutron scattering density along the molecules was
diffuse, giving an indication that this network has a degree of mobility, and sug-
gested that protons are being shuffled [80]. However, this diffuse density left some
ambiguity of the orientation of the individual water molecules and as a result the
exact bonding interactions have not yet been determined.
Residue Asn254 forms the structure of the peroxohole, shown in Figure 1.11, where
the distance between the Asn254 sidechain nitrogen atom and solvent molecule
W1 is ∼ 3.10 Å [78]. The presence of conserved asparagine (and histidine) residues

Chapter 1. Introduction 44
are typically seen in heme catalase X-ray structures: both residues are thought to
be important for binding H2O and H2O2 [88–90]. Therefore, it has been suggested
that Asn254 may be important in the binding of H2O2 before expulsion as a by-
product [88]. Residue Asn254 is also conserved across all samples in the sequence
alignment shown in Figure 1.8.
Two functionally relevant residues have been identified by site-directed mutagene-
sis as Thr57*, a component of the ’peroxohole’ structure, and neighbouring residue
Lys10* (Thr69* and Lys9* in B. subtilis), both located on the neighbouring protomer.
The mutation of both Thr57* and Lys10* showed a large reduction in kinetic activ-
ity, Vmax, determined by stopped-flow spectroscopic measurements [91]. Addition-
ally, measurements of the double mutation showed that the Vmax had only a 2-3
fold difference in activity than that of the single mutants. This reduction in kinetic
activity indicated that these residues may play an important role in the reaction
mechanism [91]. From these findings it was suggested that Thr57* would abstract
a proton from the substrate acting as a ’general base’ [91]. However, Thr57* cannot
conduct this deprotonation step without activation by another residue, therefore,
its close proximity of Lys10* suggested that the Lys10* residue may act to deproto-
nate Thr57* for activation. This would then enable proton abstraction from the sub-
strate by Thr57*: this proposed synergystic mechanism resulted in these residues
being termed a "catalytic dyad" [91]. This ’general base’ proposal is discussed in
more detail in the following Section 1.2.5. A catalytically relevant Lys10* in a prime
position to conduct proton transfers shows similarities to some Flavin-containing
oxidases where a protonated lysine is thought to be important for catalysis [92].
In the case of monomeric sarcosine oxidase, it has been suggested that a lysine
residue forms a Proton Relay System (PRS) with a threonine residue and several
water molecules. This PRS is thought to be involved in delivering protons to the
C4a-peroxyflavin adduct [92].
Further structural studies using X-ray crystallography, observed that residue His256

Chapter 1. Introduction 45
was located at a critical position, hydrogen bonding distance from Lys10*, suggest-
ing a more extensive "catalytic triad" rather than dyad [80, 82, 88, 93]. Imhoff et al.
noted that the extension of this system to incorporate His256 follows the sugges-
tion that the abstraction of a proton from the substrate is followed by the delivery
of this proton to the solvent [91]. In addition, all three of these residues are found
to be conserved across the sampled sequences in Figure 1.8. In Bacillus sp. His256 is
in the same location but slightly displaced [94]. A catalytically important histidine
has been postulated to play an important role in other enzymatic reactions involv-
ing O2. In the case of monooxygenases TcmH and ActVA-Orf6, it is suggested that a
histidine residue acts as a general base, catalysing the dehydration of the peroxide
intermediate in this enzyme [95]. Interestingly, ActVA-Orf6 contains no prosthetic
groups and appears to only require O2 for reaction, similar to UOX [95]. Another
role of an active site histidine residue has been proposed in flavoprotein glucose
oxidase, where a conserved, protonated histidine residue is thought to facilitate
the catalytic reaction by creating a polarized environment favourable for electron
transfer [12, 96].
The catalytic triad seen in the active site of UOX is similar to other enzymes with
different functions. In particular, the presence of a similar catalytic triad is seen
in the α/β-hydrolyse fold superfamily of enzymes [97]. This family have been
found to usually contain a catalytic triad consisting of a nucleophilic residue (ser-
ine, cysteine, or aspartic acid), a strictly conserved histidine, and an acidic residue
acting as a charge relay system [98–100]. Two enzymes of interest are the cofactor-
independent 1-H-3-hydroxy-4-oxoquinaldine, 2,4-dioxygenase (HOD) and 1-H-3-
hydroxy-4-oxoquinoline, 2,4-dioxygenase (QOD) that are the only dioxygenases
suggested to belong to the α/β-hydrolyse fold superfamily [97]. It has been sug-
gested that the Thr57*-Lys10* catalytic dyad/Thr57*-Lys10*-His265 catalytic triad
found in UOX may act similarly to the catalytic triad found in cofactor-free HOD/QOD,
operating as a charge relay system [82].

Chapter 1. Introduction 46
However, due to the limited structural information available on these reactive in-
termediates, none of these hypotheses have been visualised directly. These mecha-
nisms of action continue to remain elusive in the field of O2 activation in biology.
1.2.5 The UOX Mechanism
Without typical methods of activating O2 for reaction (Section 1.1) it is not under-
stood how cofactor-free UOX is able to function effectively. This section will de-
scribe the current mechanistic proposals of UOX catalysis and discuss the interme-
diates suggested to form the UOX catalytic pathway.
A scheme representing the overall reaction mechanism of UA to allantoin is pre-
sented in Figure 1.12. Neutral UA is shown as the initial substrate, followed by the
deprotonation to the N3 monoanion, 8-HX. There are then two possible pathways,
Path 1 and Path 2. The deprotonation of the 8-HX to the UA dianion, followed by
an electron transfer from the UA dianion to O2 is described in Path 1. Alternatively,
Path 2 shows the deprotonation of 8-HX with the concurrent transfer of an electron
to O2. Both paths result in a caged radical pair: the UA radical monoanion and
superoxide. Path A shows the radical recombination of the UA radical monoanion
and superoxide to form a peroxide intermediate 5-(hydro)peroxisourate (5-HPIU),
before the generation of a dehydrourate (DHU), after the expulsion of H2O2. Path
B describes a peroxide independent pathway and the direct formation of DHU. The
formation of 5-hydroxyisourate (5-HIU) is shown as the final reaction step before
further degradation to allantoin. UOX is shown in blue at stages of the reaction
mechanism where it is proposed to play a role. The atoms from the O2 molecule
are expelled as H2O2, shown in red and the solvent molecule that attacks the C5
atom to form 5-HIU, is shown in green.

Chapter 1. Introduction 47
FIGURE 1.12: Reaction scheme of the Urate Oxidase (UOX) catalytic mechanism,presenting the possible steps in the reaction where UOX may play a role. UOX is shown inblue at stages of the reaction where it is suggested to play a role. Molecular O2, expelledas H2, is shown in red. The solvent molecule involved in the formation of5-hydroxyisourate (5-HIU) is shown in green.

Chapter 1. Introduction 48
The two half redox equations, describing the overall UOX reaction are shown in
Equations 1.2 and 1.3.
UA + HOH −→ 5− HIU + 2H+ + 2e− (1.2)
O2 + 2e− + 2H+ −→ H2O2 (1.3)
The protonation state of UA
The optimum pH for UOX activity is under basic conditions, between pH 8 - 10
[101], however, the enzyme is still largely active at physiological pH [64, 102]. The
UA molecule has two pKa sites, approximately 5.4 and 9.8, shown in Figure 1.13
(b) [42, 63]. The preference for basic conditions for catalytic activity, implies that
UA binds to the enzyme as a monoanion, deprotonated at the N3 position, Figure
1.13 (c) [42, 103–106]. In addition, the N3-deprotonated tautomer was found to be
present in the sodium salt of urate [107]. The N9 anion is also present at pH 7, iden-
tified by both NMR and theoretical calculations. In fact, the N3N9 dianionic species
was found to be most prevalent in solution above pH 10, with N3N7 and N1N9 as
minor anionic species [106]. The different UA species are detailed in Figure 1.13.

Chapter 1. Introduction 49
FIGURE 1.13: (a) Neutral uric acid (UA) is shown with atoms numbered as referred to inthe text. (b) The two main pKa sites are shown as position N3 and N9 with values takenfrom [106]. The structure of the N3 monoanion (c) and two dianions, (d) N3N9 and (e)N3N7, are also shown for reference.
The first crystal structure of UOX in complex with ligand 8-azaxanthine by Colloch
et al. suggested that the bound substrate molecule is the N3N9 dianion [65]. This
N3N9 dianion has been identified as the major species present in solution, shown in
Figure 1.13 (e). However, this UOX-bound species was later corrected to the N3N7
dianion by Retailleau et al., as previously shown in Section 1.2.4, Figure 1.10 [68,
76, 88]. The proposal that the bound species was the N3N7 dianion was concluded
due to the proximity of hydrogen atoms from residues Arg176 and Thr57* to the
substrate, shown in Figure 1.13 (e) [68]. In particular, the distance between N7 atom
and the main chain nitrogen atom of Thr57* was reported to be ∼ 2.9 Å, allowing
room for only one hydrogen atom. It was considered more likely that this hydro-
gen belongs to the peptide bond, implying that the N7 atom is deprotonated [68].

Chapter 1. Introduction 50
In addition, UOX in complex with inhibitor 9-methyl uric acid (9-MUA), where a
methyl group replaces the hydrogen at N9, confirms that the protonation state of
the N9 position is not important for binding [81, 106]. The N3N7 dianion is rep-
resented in Figure 1.12 following the deprotonation of 8-HX, the N3 monoanion.
Colloch et al. proposed that the main function of UOX is to create an environment
where the reactants are positioned for reaction, acting more as a scaffold than an
active participant [65].
Investigation into a general base mechanism
However, there are also other suggestions in which UOX is central to the chemistry
of UA oxidation. Researchers Tipton and colleagues had suggested that the di-
anionic UA species was the first reactive intermediate in the UOX mechanism [64,
106]. Therefore, as UA was found to exist as a monoanion in solution, it was consid-
ered that the role of UOX was to abstract a proton from the N3 monoanion (8-HX)
to form the reactive dianion followed by an electron transfer to O2 [64, 91, 108].
The N3N7 dianion was found to be the most reducing available UA species [108]
which would then undergo oxidation, followed by hydration, to form the product
5-HIU [64, 105]. The formation of the reactive N3N7 dianion is shown in Figure
1.12, Path 1. The negative ionisation potential implies that the dianion can sponta-
neously transfer electrons to the O2 molecule more easily than neutral UA and the
UA monoanion [108]. This led to the suggestion by Imhoff et al. that UOX must
contain a ’general base’ system in close proximity of the active site, capable of a
deprotonation [91]. A similar method of substrate activation by proton abstraction,
before reaction with O2, has been reported both in metallo-oxygenase enzymes and
several cofactor-independent oxygenases [3, 22, 109].
In addition to the ’general base’ system, it was suggested that UOX also needed the
capability to store and stabilise electrons, or monoelectron species [82]. EPR spec-
troscopic measurements observed a radical species during the UOX reaction [110],

Chapter 1. Introduction 51
leading to suggestions that the activated state of UA was the N3 radical monoan-
ion, shown in Figure 1.12, Path 2 [82]. The formation of this radical species would
circumvent the spin-forbidden reaction of singlet UA with triplet O2 and allow the
transfer of electrons to O2 by the activated substrate.
Neutron studies by Oksanen et al. investigated the structures of hydrogenated UOX
(HUOX) in complex with AZA and UA, employing the inhibitory nature of Cl- in
the active site by conducting crystal growth in halogenated conditions [80, 111].
The HUOX:UA complex, referred to as HUOX:8-HX, identified the bound urate
species in the active site as the 8-hydroxyxanthine monoanion (8-HX) at the N3
atom instead of the reactive dianion species. The structural difference between
the N3 monoanion and the N3N7 dianion is shown in Figure 1.12 [80]. The pres-
ence of a deuterium atom attached to the oxygen atom at O8, confirmed this enol
tautomer as the species bound to HUOX in the presence of Cl-. The neutron den-
sity map from the published HUOX:8-HX structure is shown in Figure 1.14. From
these results, a mechanism involving this enol tautomer was proposed. Oksanen
et al. suggested that a general base is still required for deprotonation of the 8-HX
monoanion, removing the proton observed at the O8 position in the monoanionic
species. However, it was also postulated that this was concomitant with an electron
transfer to an electron acceptor within the protein, shown as Path 2 in Figure 1.12
[80]. This was in contrast to the proposals made by Tipton and colleagues. The ex-
act location of the general base proposed by Imhoff et al. and whether the electron
transfer step is direct from the substrate or mediated by UOX was not determined
from this study.

Chapter 1. Introduction 52
FIGURE 1.14: 2mFo-DFc neutron density map contoured at 1.0 σ showing the presence ofthe 8-hydroxyxanthine monoanion (8-HX) in the Hydrogenated Urate Oxidase (HUOX)active site [80]. Adapted from [111] c© 2014 Oksanen et al. Distributed under CC-BY 4.0.
In support of the mechanism proposed by Oksanen et al., a purely computational
study by Wei et al., based on the HUOX:8-HX neutron structure [80], suggested that
the N3N7 dianion species did not exist [80, 112]. This is represented by Path 2 in
Figure 1.12. Instead, it was suggested that the more feasible mechanism would pro-
ceed via a deprotonation-electron transfer with both steps mediated by UOX [80,
112]. In this mechanism, it was proposed that the Lys10* residue acted as the ’gen-
eral base’, deprotonating the proton at position O8, assisted by the hydroxyl group
of Thr57*, shown in Figure 1.15 (a) and (b) [112]. In addition, an electron trans-
fer occurs simultaneously from the substrate to the O2 molecule, creating a radical
substrate and radical O2 in the active site, Figure 1.15 (b) and (c) [112]. A second
proton transfer from the positively charged Lys10* group to the O2 radical, Figure
1.15 (d), before a radical recombination reaction, forming the 5-(hydro)peroxide in-
termediate, Figure 1.15 (e) and (f). This is then followed by the expulsion of H2O2.

Chapter 1. Introduction 53
(a) (b)
(d) (c)
(e) (f)
FIGURE 1.15: The UOX reaction mechanism, proposed by Wei et al., showing thedeprotonation of the 8-hydroxyxanthine (8-HX) monoanion by active site residues. Theformation of the 5-(hydro)peroxyisourate intermediate is also described. In this study K9and T69 refer to Lys10* and T57* in Aspergillus flavus, respectively. Adapted withpermission from [112]. Copyright 2017 American Chemical Society.

Chapter 1. Introduction 54
Determination of a Peroxide-dependent Pathway
A study by Altarsha et al. presented theoretical calculations that proposed that UA
oxidation proceeded independently of a peroxide intermediate [108]. Instead, it
was suggested that a dehydrourate (DHU) intermediate was formed directly from
the energetically favoured N3N7 dianion [108]. This is shown by Path B in Figure
1.12. However, the suggestion that the electron transfer from UA to O2, followed
by the immediate attack of the DHU by solvent to form 5-HIU, was termed an
unlikely mechanism [65, 108, 113]. In addition, the transfer of two electrons from
the singlet state UA dianion to the triplet state O2 would violate the spin conversion
rule, previously described in detail in Section 1.1 [113, 114].
Mechanistic studies had proposed a peroxide-dependent pathway for UOX catal-
ysis, however were unable to provide structural evidence of a peroxide interme-
diate, Path A in Figure 1.12 [106, 113, 115]. Direct evidence of a (hydro)peroxide-
intermediate, 5-(hydro) peroxyisourate - 5-PIU, was presented in a structural study
by Bui et al. [81]. Using X-ray crystallography, in conjunction with in crystallo Ra-
man spectroscopy and QM/MM calculations, this study was able to unambigu-
ously determine the presence of a 5-(hydro)peroxide-intermediate [81]. The (hy-
dro) peroxyisourate intermediate determined in this study is shown in Figure 1.16,
and the formation of the 5-(hydro)peroxyisourate intermediate is described as Path
A in Figure 1.12.

Chapter 1. Introduction 55
FIGURE 1.16: Direct evidence of a 5-(hydro)peroxyisourate intermediate determined byX-ray crystallographic studies conducted by Bui et al. [81]. The 2mFo-DFc electron densitymap, contoured at 1σ, clearly shows the bond formed between the C5 atom of uric acid(UA) and the O2 molecule. Figure adapted from [81] c© 2014 The Authors. Published byWiley-VCH Verlag GmbH & Co. KGaA.
The identification of this key 5-PIU intermediate was essential in furthering the
understanding of cofactor-free mechanisms. In fact, peroxide intermediates are
commonly proposed for other systems where reaction with O2 would result in a
violation of the spin conversion rule [2, 114]. However, these related reactions com-
monly involve a cofactor or metallic centre. Flavin and Pterin reactions are thought
to proceed via a similar (hydro)peroxide intermediate. Several Flavin-dependent
monooxygenases have been shown to operate via a semiquinone-superoxide pair,
resulting in the formation of a C4a-(hydro)peroxyflavin intermediate, described in
Section 1.1 [14, 116]. The Flavin C4a-hydroperoxide acts as an electrophile and
substrates containing activating groups such as hydroxyl act as nucleophiles [16,
17]. The mechanism is similar to UOX and UA: the HPIU forms DHU then un-
dergoes attack by a solvent molecule to form 5-HIU [64, 106]. Interestingly, a

Chapter 1. Introduction 56
peroxide-dependent mechanism has also been proposed for families of cofactor-
free monooxygenases and dioxygenases, further support for the suggestion that
cofactor-free reactions proceed in a Flavin-like manner [97, 117, 118]. For the dioxy-
genases HOD, QOD, and DpgC, it is proposed that the substrates transfer a single
electron to O2. This generates a radical pair that can collapse to a peroxide species
after a radical recombination. [97, 119]. These intermediates have only been deter-
mined spectroscopically, meaning there is little structural evidence to support these
claims. However, understanding the mechanism of UOX may also shed some light
on these enzymes if the intermediates are believed to be similar.
Formation of 5-hydroxyisourate and allantoin
The final product of the UOX-mediated UA degradation pathway is allantoin. It
was initially thought that allantoin was the product of UOX catalysis, however, the
expulsion of CO2 was delayed in comparison to the O2 uptake [120], giving an in-
dication other intermediates were present after UA. As a result, the true reaction
product of the UOX catalytic process was identified as 5-hydroxyisourate (5-HIU)
[106, 121, 122]. This metastable species has been shown to degrade to allantoin
either enzymatically or naturally [59, 106, 115, 121, 123, 124]. Isotopic labelling
studies showed the hydroxyl group present on at the C5 position of 5-HIU is de-
rived from a solvent H2O molecule and the O2 atoms involved in the reaction are
expelled as H2O2 [64, 106, 123]. The H2O2 by-product is proposed to take one pro-
ton from UA and one from a solvent molecule [108]. The expulsion of the atoms
of O2 as H2O2 and the addition of hydroxyl group at C5 from the solvent, forming
5-HIU, are shown in Figure 1.12. Spectrophotometric assays showed that there is
an ordered mechanism of substrate addition with UA binding to UOX before O2
and the chirality of the reaction 5-HIU infers that the hydroxylation takes place in
the active site [62, 106]. Hydrolysis of 5-HIU occurs at the N1-C6 bond, followed by
the migration of the carboxylate group to C4. The production of allantoin follows
decarboxylation where CO2 is derived from the C6 of UA [106, 123].

Chapter 1. Introduction 57
1.3 Aim and Motivation
There is limited structural information on reactive intermediates in the UOX cat-
alytic pathway. As a result, the method by which UOX facilitates the oxidation of
UA remains elusive. The exact protonation states of important active site residues
in reactive intermediates are also undetermined. In addition, the structurally con-
served water network surrounding the active site and its importance in catalysis is
also not confirmed.
Building on previous X-ray and neutron studies, the purpose of this study was
to further investigate two structures in the UOX catalytic pathway. Complexes of
perdeuterated Urate Oxidase (DUOX) with 8-azaxanthine (AZA) and 9-methyl uric
acid (9-MUA) are presented in this thesis. The AZA inhibitor binds to the UOX
active site and preserves solvent molecule W1 in situ by preventing O2 binding.
The 9-MUA ligand forms the 9-methyl-5-peroxyisourate intermediate (5-PMUA),
trapping the peroxide before the expulsion of H2O2.
Neutron crystallography, in conjunction with deuterium labelling, enables the de-
termination of protonation states, hydrogen positions, and water networks. This
thesis provides a structural analysis of these two complexes in two different en-
vironments: one where O2 cannot bind, and one where it is bound, trapped in
an intermediate species. The examination of the protonation states of catalytic
residues, and identifying important solvent molecules, provides information typi-
cally unattainable using other techniques. The aim is that these findings further our
understanding on the functionality of cofactor-free enzymes and how they achieve
their reaction with O2.

58
Chapter 2
Experimental Methods
Abstract
This chapter covers the laboratory and experimental techniques employed in this
research project. Molecular biology and techniques of particular interest to the pu-
rification of UOX are presented and analysed. The process by which proteins are
deuterated and the associated challenges are also discussed.
Introduction to crystallographic theory and its applications in structural biology
are described herein. Topics including crystal growth, data collection, and analysis
and structural refinement are also presented.
Finally, the technique of neutron protein crystallography is explored and how it
provides complementary information on hydrogen positions and biological mech-
anisms compared with other techniques.

Chapter 2. Experimental Methods 59
2.1 Molecular Biology
2.1.1 Cell Growth and Protein Expression
Commercial pET vectors are widely used in the production of recombinant pro-
teins. A particular gene of interest can be cloned into the pET vector, which is then
strictly controlled under the T7 transcription and regulatory system. A map of the
expression vector pET-24b+ describing its key components is shown in Figure 2.1.
This particular construct is used in the recombinant expression of UOX.
FIGURE 2.1: The pET-24b+ vector map showing the presence of the kanamycin resistancemarker and the T7/lac promotor system that can be used for the expression ofrecombinant proteins. Figure taken from the Genscript website(https://www.genscript.com/gsfiles/vector-map/bacteria/pET-24b.pdf).
Expression vectors typically contain the following components:
• Antibiotic resistance gene - cells containing the expression plasmid of interest
can be selectively grown. Common antibiotics include kanamycin (kanR) or

Chapter 2. Experimental Methods 60
ampicillin (ampR). KanR is an aminoglycoside antibiotic and binds to the
bacterial 30S ribosomal subunit, resulting in the midreading of t-RNA and
preventing the bacteria from synthesising proteins essential for growth.
• Promotor - this is recognised by RNA polymerase and begins the transcrip-
tion of the gene. Gene expression can be controlled using molecular biol-
ogy reagents causing induction or repression. In this case, the T7lac pro-
motor is employed and can be induced in the presence of isopropyl θ-D-1-
thiogalatopyranoside (IPTG).
• Terminator - also recognised by RNA polymerase and stops transcription.
Bacterial transformation is the process of introducing recombinant DNA into a host
cell. This method can be employed in order to selectively overexpress a protein of
interest. ’Competent’ cells are used, meaning that they are more able to readily
uptake foreign DNA. The transformation process contains an important heat shock
step [125, 126]. Cells are briefly exposed to a temperature of ∼ 42 ◦C, which en-
courages the forming of pores that allow the plasmid of interest to enter the cell.
The cells are returned to room temperature to allow the cell walls to self-heal, the
addition of a nutrient-rich medium, such as SOC, can aid the recovery.
Escherichia coli cells, or E. coli, are widely used in conjunction with commercial pET
vectors. E. coli is a suitable host in the expression of recombinant proteins. The
in-depth knowledge of the genome and its controllability make it a popular choice
for the production of proteins in large quantities [127]. Another reason that E. coli is
commonly chosen as a useful host for the expression of recombinant proteins is that
it has extremely fast growth kinetics, with cell doubling time of about 20 minutes
in an optimal environment [128].
Monitoring the growth of bacterial cells is also essential for optimising and subse-
quently maximising the production of a target protein. The optical density (OD600)
is used to assess the turbidity of the solution and thus give an indication of the

Chapter 2. Experimental Methods 61
quantity of cells. This is because the cells present in the solution scatter the light
away from the photovoltaic cell, giving a lower electrical signal than seen for an
empty cuvette. A wavelength of 600 nm is chosen for analysis in comparison to UV
light as it minimises damage to the cells. This important feature allows the moni-
toring of cell growth and gives an indication of when the log phase is reached and
therefore when to induce the overexpression.
Time
Log
num
ber o
f cel
ls
lag phase log phase stationary phase death phase
OD600 = 0.6 – 0.8
FIGURE 2.2: The main stages of bacterial cell growth. The lag phase indicates initialgrowth is slow before exponential growth during the log phase. The stationary phasefollows before the death phase where cells die faster than multiply. Figure adapted from[129, 130].
Bacterial cell growth occurs in four stages as shown in Figure 2.2. The first stage
is known as the lag phase - during this stage cell growth is slow, allowing the cells
to adapt to their new growth environment. The following stage, the log phase, is
the optimal stage for cell production with an increase in the rate of cell division.
Cell growth begins to stagnate during the stationary phase before finally the death
phase. Cell death results from a lack of growth media, and an excess of waste
products, and overcrowding meaning cells begin to die quicker than divide. It is
considered ideal to induce overexpression of the target protein during the log phase
whilst the culture is fast growing to maximise protein production and to harvest the

Chapter 2. Experimental Methods 62
cells during the stationary phase. This is typically done at OD600 levels of 0.6 - 0.8.
A selective marker for an antibiotic is included in the pET vector, as discussed
above. Ampicillin is commonly used as an antibiotic in this process, however, in
the presence of deuterated media, it can cause leaky expression. This describes plas-
mid instability and leakage of the foreign DNA out of the cell under the stressful
deuterated conditions. This leads to cell multiplication without the incorporation
of the inserted DNA and significant reduction in the production of the desired pro-
tein. Alternatively, there can be leakage of β-lactamase into the medium. The β-
lactamase is responsible for the hydrolysis of the β-lactam ring of ampicillin, ren-
dering the antibiotic ineffective. As a solution, kanamycin is used instead of ampi-
cillin where the enzyme kanamycin acetyl-transferase is not as prone to leakage. As
a result, vectors are recloned to amend the antibiotic resistance before expression
under deuterated High Cell Density Culture (HCDC) conditions [131].
2.2 Production of Deuterated Biomolecules
The production of deuterated biomolecules can contribute to the success of many
neutron scattering experiments. Hydrogen accounts for ∼ 50% of atoms in a pro-
tein, however, replacing the hydrogen atoms with its isotope deuterium can be
beneficial: this is explained in further detail in Section 2.6. The substitution of hy-
drogen (1H) for deuterium (2H or D) is not a straightforward process due to the
relative toxicity associated with 2H [131]. There are two possible ways of incorpo-
rating deuterium into a protein structure. The simplest method is to exchange only
the labile hydrogens, including O-H, N-H, and S-H positions. This can be done
by changing hydrogenated protein solution into deuterated solution using dialy-
sis, a series of concentration/dilution steps, or after crystal growth. However, the
labile hydrogen atoms only account for ∼ 25% of protein hydrogens, and methods

Chapter 2. Experimental Methods 63
of soaking exchange solvent-accessible groups describes 15-20 % of the protein hy-
drogen content [132]. A significant number of non-exchangeable hydrogens in the
protein remain, for example, -CH3 groups. The unwanted effects that this can cause
is explained in Section 2.6. A more rigorous method, perdeuteration, involves the
complete replacement of all hydrogen positions in a protein with deuterium - both
non-exchangeable and labile positions [131]. Carbon-bound hydrogens can only be
incorporated into the protein structure via protein biosynthesis.
Luria broth, or LB, is commonly used as a growth medium in the production of
cell cultures, however, a deuterated equivalent is not commercially available. The
Life Sciences Group based at the ILL, Grenoble have developed the following pro-
tocol for the production of recombinant proteins in deuterated conditions. In the
absence of deuterated LB, a deuterated minimal media (D-Enfors) is used, contain-
ing mineral salts with components essential for bacterial growth (eg, AsSO4 as a
source of nitrogen) and d8-glycerol as the carbon source. However, use of minimal
media can result in slow cell growth and a low yield of recombinant proteins. As
deuterium is toxic in high concentrations, it has been found to be more effective
to introduce deuterium into the cell growth process gradually. This can be done
through a process called adaptation. The E. coli strain BL21 (DE3) is commonly used
in the expression of perdeuterated recombinant proteins as it adapts to the pres-
ence of D2O more easily than other strains [131]. E. coli BL21 (DE3) cells are first
grown in a hydrogenated minimal medium (H-Enfors). This allows the cells to
first adapt to the minimal media growth environment. Repeats of this process are
conducted using 1:10 dilution of overnight culture in fresh hydrogenated minimal
medium, until the growth rate increased and the cell generation time has reduced.
This is then repeated with deuterated minimal medium. The adaptation process
is described in Figure 2.3. After this stage, cells can be recovered and stored on
cryobeads for future use, or scaled up in preparation for fermentation.

Chapter 2. Experimental Methods 64
FIGURE 2.3: Preparation of adapted cells for growth in deuterated medium. E. coli BL21(DE3) cells are grown on an LB agar plate with antibiotic or taken from storage at - 80 ◦C.The cells are grown first in minimal hydrogenated media (H-Enfors) before furthergrowth in minimal deuterated media (D-Enfors). This culture is then scaled up inpreparation for inoculation in the fermenter. Figure adapted from [131].
Fermentation is the process used for producing perdeuterated recombinant pro-
teins in high cell density cultures (HCDC). The process is convenient for producing
HCDCs as it important to encourage growth in challenging conditions and to max-
imise cell growth when working with expensive deuterated medium. Numerous
variable parameters allow closer control of the optimum conditions for cell growth
than for cultures produced in flasks.
• Base - In the aerobic multiplication of cells there is the generation of acidic by-
products. By adding a deuterated base, 1 M NaOD, the pH can be maintained
at an optimal level pH 6.9 and prevent cell death due to toxicity from the build
up of acidic by-products.
• Stirrer Speed - One method of monitoring the growth of cells is by the vari-
ation in pO2 level, reducing as it is consumed by the respiring and dividing
cells. The level is maintained at ∼ 30 %. If the level reduces, the stirrer speed
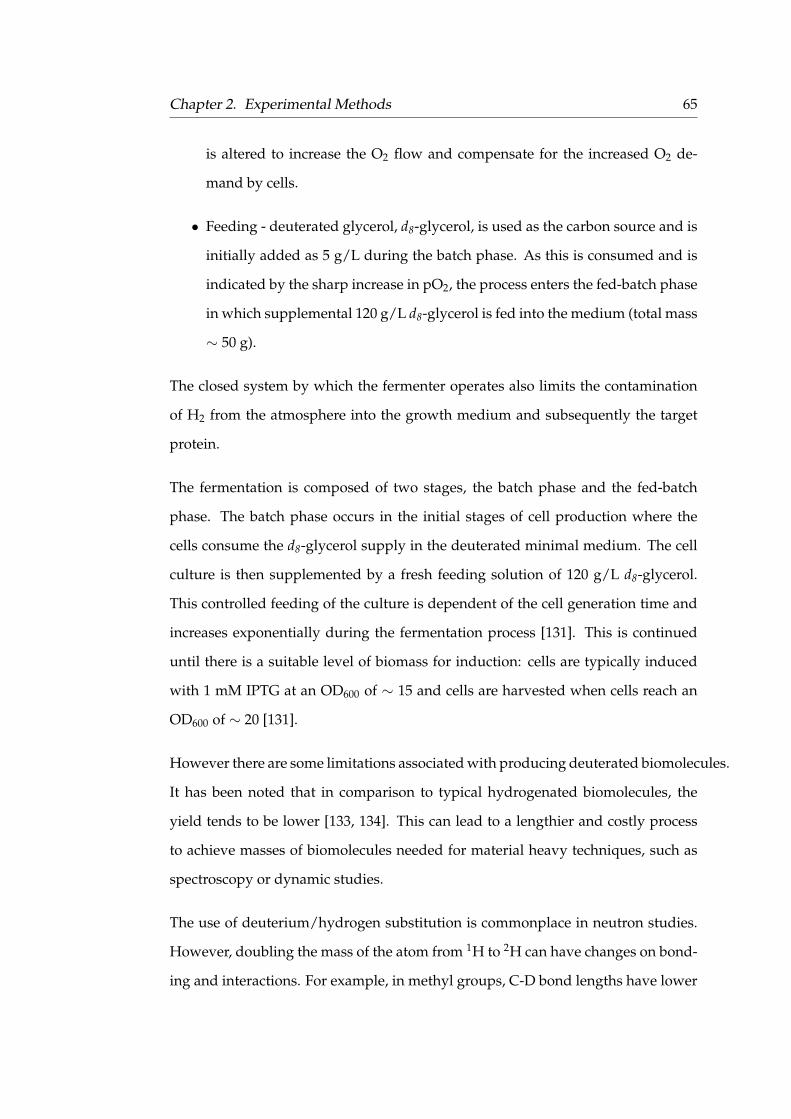
Chapter 2. Experimental Methods 65
is altered to increase the O2 flow and compensate for the increased O2 de-
mand by cells.
• Feeding - deuterated glycerol, d8-glycerol, is used as the carbon source and is
initially added as 5 g/L during the batch phase. As this is consumed and is
indicated by the sharp increase in pO2, the process enters the fed-batch phase
in which supplemental 120 g/L d8-glycerol is fed into the medium (total mass
∼ 50 g).
The closed system by which the fermenter operates also limits the contamination
of H2 from the atmosphere into the growth medium and subsequently the target
protein.
The fermentation is composed of two stages, the batch phase and the fed-batch
phase. The batch phase occurs in the initial stages of cell production where the
cells consume the d8-glycerol supply in the deuterated minimal medium. The cell
culture is then supplemented by a fresh feeding solution of 120 g/L d8-glycerol.
This controlled feeding of the culture is dependent of the cell generation time and
increases exponentially during the fermentation process [131]. This is continued
until there is a suitable level of biomass for induction: cells are typically induced
with 1 mM IPTG at an OD600 of ∼ 15 and cells are harvested when cells reach an
OD600 of ∼ 20 [131].
However there are some limitations associated with producing deuterated biomolecules.
It has been noted that in comparison to typical hydrogenated biomolecules, the
yield tends to be lower [133, 134]. This can lead to a lengthier and costly process
to achieve masses of biomolecules needed for material heavy techniques, such as
spectroscopy or dynamic studies.
The use of deuterium/hydrogen substitution is commonplace in neutron studies.
However, doubling the mass of the atom from 1H to 2H can have changes on bond-
ing and interactions. For example, in methyl groups, C-D bond lengths have lower

Chapter 2. Experimental Methods 66
vibrational amplitudes and frequencies compared to C-H, indicating shorter and
stronger bonds. This has implications in secondary and tertiary structure as fully
deuterated sidechains tend to be more compact, reducing the strength of inter-
molecular and intramolecular interactions of non-polar side chains [135]. Prop-
erties such as oligomerisation rate [135] and exchange rate [136] were found to
be different between hydrogenated and deuterated proteins. Deuterated proteins
were also found to have an increased susceptibility to heat denaturation compared
to their hydrogenated counterparts [134, 137, 138]. These differences are related
to the kinetic properties of the proteins rather than structural effects. It has also
been observed that aggregation properties have been affected in some proteins [139,
140].
Many studies have found there to be no significant changes between the structures
of deuterated and hydrogenated proteins [141–144]. Overall, it is accepted that
each deuterated protein must be characterised using complementary techniques or
high resolution X-ray crystallography in order to identify any possible discrepan-
cies between the samples prior to neutron studies [139, 145].
2.3 Purification Techniques
2.3.1 Cell Lysis and Protein Extraction
The initial step of protein purification aims to isolate the target protein from the
cells in which it was expressed. The method used is dependent on whether the
protein is cytosolic or secreted. UOX is a cytosolic protein therefore cells must be
broken, or lysed, to extract the protein. This can be done either mechanically or
enzymatically, or a combination of techniques can be employed to optimise the
protein extraction step.

Chapter 2. Experimental Methods 67
The purification of UOX employs both mechanical and enzymatic techniques in the
extraction of the protein from cells. The mechanical technique used is sonication.
It acts by generating sonic waves to break open cells, causing them to release their
contents into solution. A sonicator is typically used and contains a probe that can
be placed directly into a homogenous solution containing cells resuspended in a
lysis buffer. The sonicator generates sound energy electronically which is deliv-
ered into the solution by a probe. This is subsequently converted into mechanical
energy and results in the formation of small bubbles which implode. This implo-
sion is also known as ’cavitation’ and causes the disruption of the cell wall and,
ultimately, its rupture. The sonication step should be conducted whilst the protein
solution is kept on ice, preventing the proteolysis or aggregation of the protein due
to overheating. In addition to sonication, lysozyme is added to the resuspended
cells to break down the cell walls, enzymatically assisting the extraction of UOX.
Additives can also be employed in the extraction of the target protein. After cell
breakage, DNA and RNA molecules released into the solution, causing an increase
in viscosity. Endonucleases, such as benzonase, are commonly added to the resus-
pended cells to breakdown these molecules, substantially reducing the viscosity
and aiding the next stages of the purification process. Protease inhibitor cocktails
are also used to block the activity of proteases and prevent the possible digestion
of the target protein. However, many common protease inhibitor tablets contain
EDTA which can inhibit the activity of benzonase at even low concentrations, so
EDTA-free protease inhibitor tablets are preferred.
2.3.2 Dialysis
Dialysis is a commonly used purification technique that involves the exchange of
small molecules, such as salts, by diffusion though a semi-permeable membrane in
solution. A solution containing the protein is placed inside a membrane which is

Chapter 2. Experimental Methods 68
then inserted into a large volume of buffer, known as the dialysate. A concentration
gradient is formed between the regions of high and low concentration of the un-
wanted molecules or salts. Once equilibrium is reached between the two regions,
the dialysate can be changed to a new solution in order to create another concen-
tration gradient, allowing further diffusion. The dialysis membrane tubing used
is carefully selected with consideration to the size of the pores. The pore size, or
molecular weight cutoff (MWCO), must permit the diffusion of molecules smaller
than the protein, whilst retaining the protein within the tubing.
2.3.3 Ammonium Sulfate Precipitation
The differences in the solubilities of proteins can be exploited during purification
as this varies widely depending on the protein structure. Ammonium sulfate pre-
cipitation (ASP) is used as a basic, yet effective, technique that separates proteins
this way. This technique is suitable for many proteins and is tag-independant so is
widely applicable.
At high salt concentrations, the solubility of a protein is reduced leading to precip-
itation and a process called ’salting out’ [146]. Ammonium sulfate dissociates into
the ions NH4+ and SO4
2-, both of which are early members of the the cation and an-
ion Hofmeister series respectively, shown in Figure 2.4. These ions increase solvent
surface tension and increase the hydrophobic interaction between the protein and
water whilst decreasing the solubility of non-polar molecules [147].
These ions interact with the negative and positive regions in a protein. This reduces
the contact with H2O molecules whilst maintaining the core hydration layer, aiding
the preservation of the proteins natural conformation. The protein reacts to a highly
polar environment by limiting its contact with the solvent through compacting and
self-associating [148]. This process becomes energetically favourable as it results
in the additional bound water molecules becoming free, subsequently increasing

Chapter 2. Experimental Methods 69
FIGURE 2.4: The Hofmeister series describes the increasing/decreasing chaotropic effectof both anions and cations.
the entropy of the system and making the process thermodynamically favourable.
By precipitating stepwise fractions of different salt concentrations, it is possible to
isolate proteins of different solubility and remove impurities that aggregate easily.
Published tables can be consulted in order to determine the weight of ammonium
sulfate, or the volume of concentration of ammonium sulfate, needed to obtain the
desired concentration [149].
2.3.4 Ion Exchange Chromatography
Ion Exchange Chromatography (IEC) is based on the fundamental attraction of
oppositely charged moieties. Depending on the pH of the environment and the
isoelectric point (pI) of the protein, proteins carry a charge. This property can
be exploited in IEC by utilising charged ligands attached to resins to bind oppo-
sitely charged proteins. There are two general types of ion-exchangers: cations and
anions. Cations exchangers carry a negative charge and bind positively charged
proteins, whereas anion exchangers carry a positive charge and so bind negatively
charged proteins.
Weak anion exchangers are classified as a weak base that easily loses charge at a
high pH due to deprotonation. Conversely, a strong exchanger consists of charged

Chapter 2. Experimental Methods 70
groups that act as a strong base.
Selection of a buffer species is dependant on the isoelectic point (pI) of the protein.
Binding of proteins is achieved at low salt concentrations and elution typically oc-
curs with the introduction of a high salt concentration. The window for isocratic
elution is very small so a linear salt concentration gradient is used, giving a higher
resolution. The process of ion exchange chromatography is detailed in Figure 2.5.
+ ++
+ +++ ++
+ ++
+ ++
+ ++
+ ++
- +-
--+
- -+
--+
- ++
+ -++
- +
- ++
+ ++
- +-
- ++
Positively charged resin
Negatively charged protein
Positively charged protein
Positively charged protein does not bind to positive resin and flows through the column.
Negatively charged protein binds to positive resin.The protein is eluted by a buffer of high salt concentration.
FIGURE 2.5: The process of ion exchange chromatography. Positively charged resins areused in anion exchange chromatography. Positively charged proteins pass through thecolumn without binding to the resin whereas negatively charged proteins are bound. Thecharge of the protein depends on the pI and on the buffer used. Typically negativelycharged proteins can be eluted by increasing salt concentration in the buffer.
Diethylaminoethyl-sepharose (DEAE) is a positively charged resin and acts as a
weak anion exchanger, binding negatively charged proteins. The positive charge
on the molecule arises from the protonated amine group. This amine group has a
pKa of 10 so it is essential that for the protonation to occur, the pH of the buffer
must be at least 2 pH units lower. Q-Sepharose is a strong anion exchanger which
also binds negatively charged proteins. It is classified as a strong exchanger due to
the fact that it is a quaternary resin so cannot be deprotonated, even at high pHs.
The anion exchange ligands DEAE and Q-Sepharose are shown in Figure 2.6.
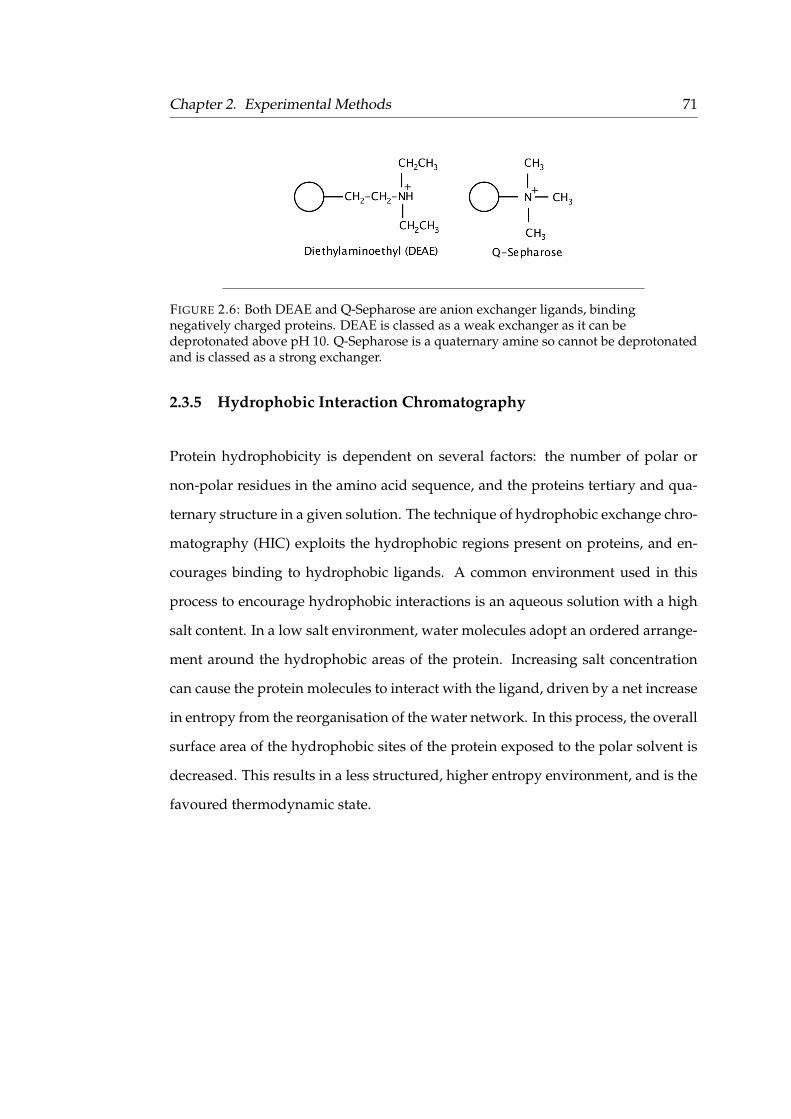
Chapter 2. Experimental Methods 71
FIGURE 2.6: Both DEAE and Q-Sepharose are anion exchanger ligands, bindingnegatively charged proteins. DEAE is classed as a weak exchanger as it can bedeprotonated above pH 10. Q-Sepharose is a quaternary amine so cannot be deprotonatedand is classed as a strong exchanger.
2.3.5 Hydrophobic Interaction Chromatography
Protein hydrophobicity is dependent on several factors: the number of polar or
non-polar residues in the amino acid sequence, and the proteins tertiary and qua-
ternary structure in a given solution. The technique of hydrophobic exchange chro-
matography (HIC) exploits the hydrophobic regions present on proteins, and en-
courages binding to hydrophobic ligands. A common environment used in this
process to encourage hydrophobic interactions is an aqueous solution with a high
salt content. In a low salt environment, water molecules adopt an ordered arrange-
ment around the hydrophobic areas of the protein. Increasing salt concentration
can cause the protein molecules to interact with the ligand, driven by a net increase
in entropy from the reorganisation of the water network. In this process, the overall
surface area of the hydrophobic sites of the protein exposed to the polar solvent is
decreased. This results in a less structured, higher entropy environment, and is the
favoured thermodynamic state.

Chapter 2. Experimental Methods 72
FIGURE 2.7: Common ligands used in HIC are typically carbon based molecules topromote hydrophobic interaction with protein molecules in the presence of high salt.Hydrophobicity increases with aliphatic chain length and molecule size.
Hydrophobic areas
Protein molecule
Water molecule
Highly ordered water molecules around hydrophobic region
Less ordered water molecules
Low salt concentration
High salt concentration
FIGURE 2.8: The process of hydrophobic interaction chromatography. In a low saltenvironment, ordered water exists around the hydrophobic residues on both the proteinmolecule and the ligand. In a high salt concentration, the ions interact with watermolecules, decreasing the number of ordered molecules surrounding the hydrophobicareas and encouraging the interaction between the protein and the ligand.
As a general rule, hydrophobic interactions will increase with aliphatic chain length.
The use of aromatic rings such as phenyl groups can also strengthen hydropho-
bic interactions with absorbed compounds through π-π stacking with aromatic
sidechains. Several sidechains used in HIC are shown in Figure 2.7.

Chapter 2. Experimental Methods 73
Elution of protein molecules is achieved by the addition of a low salt concentra-
tion buffer which decreases the strength of the hydrophobic interactions, leading
to the desorbtion of protein molecules and subsequent elution, shown in Figure
2.8. Protein elution is dependent on the strength of hydrophobic interaction with
the ligand and how quickly it is desorbed.
2.3.6 Gel Filtration Chromatography
Gel filtration/size exclusion chromatography can be used as a preparative method
and separate protein molecules based on their size and shape, or hydrodynamic
volume. The hydrodynamic volume is described as the volume a protein molecule
creates when the molecule is tumbling rapidly in solution. Size exclusion columns
contain a resin with porous holes in the beads, this gives rise to a number of paths
that molecules can travel through. These pores, known as the stationary phase, are
of a certain size and allow only smaller molecules to pass through. This results
in smaller protein molecules taking a longer time to elute from the column. In
comparison, larger molecules are excluded form these pores only passing through
the solvent, mobile phase, and so have the shortest path and are eluted first. The
order of elution of molecules can be described as the inverse of their hydrodynamic
volume. The process of gel filtration is described in Figure 2.9.

Chapter 2. Experimental Methods 74
Smaller molecules travel into porous beads.
Largermoleculescannotenter.
Large protein
Small protein
Porous bead
Protein sample.
Larger molecules are eluted first.
FIGURE 2.9: The process of gel filtration. A protein solution is loaded onto the column,composed of a mixture of different sizes of proteins. The beads present in the column areporous and smaller proteins can pass into these, resulting in a longer elution time. Largerproteins do not pass into the beads and so follow the shortest path and are eluted first.
There is no intentional binding interaction present in the method of size exclu-
sion chromatography which has the additional benefit that fragile proteins are not
damaged, but electrostatic and van der Waals interactions are unavoidable in many
cases. Also, in the absence of binding, the resolution that can be obtained is limited.
This technique is effective in the latter stages in the purification process when the
protein is mostly pure, due to the risk of large levels of contaminants damaging the
column.
2.4 Crystallisation
The crystallisation of proteins for use in crystallography and subsequent structure
solution has been an invaluable technique for scientists to elucidate the structure
and function of biological macromolecules. Crystals are formed by the directional

Chapter 2. Experimental Methods 75
and ordered self-association of protein molecules to form a periodically repeat-
ing 3-dimensional crystal lattice. The growth of good-quality crystals is essential
for successful X-ray diffraction experiments. An additional challenge for neutron
diffraction is the controlled growth of large crystals, often in deuterated conditions
[150].
One important aspect in the formation of highly diffracting protein crystals is the
purity of the protein sample. Any impurities remaining in the protein solution after
the purification process can interfere with nucleation and crystal growth. They may
also be incorporated into the crystal structure, affecting diffraction quality [151].
Therefore it is extremely important to have an efficient purification process where
the final purity of the sample is analysed by SDS-PAGE, or mass spectrometry.
Crystallizing agent concentration
Prot
ein
conc
entr
atio
n
precipitation zone
undersaturated
supersaturated
solubility curve
precipitation curve
metastablezone
labilezone
FIGURE 2.10: Graphical representation of the relationship between increasing proteinconcentration and increasing precipitant concentration. From the solubility diagram it ispossible to identify the optimum zone for crystal growth. At low concentrations, theprotein remains undersaturated and nuclei will not form. However, at very highconcentrations, precipitation will occur due to the aggregation of excess of proteinmolecules. Nucleation occurs in the upper metastable zone, where the solution issupersaturated. This leads to the concentration of protein to decrease and crystal growth.
The phase diagram provides a pictorial representation of the crystallisation process,

Chapter 2. Experimental Methods 76
shown in Figure 2.10. It shows the relationship between protein concentration and
the temperature, pH, or in this case crystallisation agent concentration. Knowledge
of the phase diagram specific to the target protein is valuable for the identification
of the supersaturation zone, increasing the chances of crystal growth. Supersatura-
tion is defined as when the protein concentration is higher than its solubility. On the
diagram, there are four important areas in the phase diagram that relate to the like-
lihood of achieving crystallisation: the undersaturated region, the supersaturated
region consisting of the metastable zone and the labile zone, and the precipitation
zone [152].
There are two separate steps that are involved in the production of protein crystals:
nucleation and growth, both driven by supersaturation [153]. Supersaturation can
be achieved through manipulating the temperature, ionic strength, and pH, as well
as the addition of precipitating agents [154–156]. Nucleation is a first order phase
transition where the protein molecules pass from a disordered state to an ordered
state [156, 157]. The formation of a nucleus involves overcoming an energy barrier
and is the rate determining step in this process [152]. The rate of nuclei formation
is directly related to the number and quality of the crystals produced and occurs in
the labile zone. No production of nucleation is seen in the metastable zone how-
ever it governs crystal growth. Ideal crystallisation conditions initiate nucleation
before leading to growth in the metastable zone, before other nucleates have time
to form [157]. Therefore the optimum location for this on the phase diagram is close
to the border between the metastable and labile zone. Conversely, nuclei close to
the precipitation zone border tend to grow quickly and contain defects. In the pre-
cipitation zone, aggregates can form faster than nuclei if the protein concentration
is too high [152].
The batch crystallisation method is a straightforward technique which involves
mixing the protein solution with the appropriate precipitant solution in a closed
vessel, with no additional reservoir solution [158]. A pictorial representation of the

Chapter 2. Experimental Methods 77
batch method is shown in Figure 2.11. This technique involves no exploration of
the phase diagram as the initial conditions achieve supersaturation directly and re-
main stable for several weeks. Well diffracting crystals can be produced in these
conditions by ensuring that nucleation occurs when the protein and crystallisation
solution are initial contact, reaching the metastable zone as the solutions are mixed
[155].
FIGURE 2.11: Batch crystallisation method. Small vials, or wells, containing protein andprecipitant solutions at supersaturated conditions are sealed and left undisturbed duringcrystal growth. Figure adapted from [155].
2.5 Crystallography
2.5.1 Crystal Structure
The most popular way of obtaining structural information at the atomic level on
biological structures is X-ray crystallography. Protein molecules are ordered into
a crystal in the x, y and z dimensions, where a crystal can be considered as an
infinitely repeating lattice. A lattice is a set of points in space where the environment
of each point can be considered identical.
The simplest building block of a crystal is the unit cell, defined by lengths a, b and
c and angles α, β, γ. The unit cell is generated from a motif, also referred to as
the asymmetric unit, via symmetry operations. This motif can be rotated, reflected,

Chapter 2. Experimental Methods 78
inverted and translated from one lattice point to another and can partially or fully
occupy the unit cell. The full list of symmetry operations required to generate the
unit cell from the asymmetric unit is called the space group. A space group is re-
lated to the point group but is more flexible in definition, where the point group
requires operation around a defined point, the space group however allows trans-
lations and glide planes.
Unit cells can be characterised based on the number and locations of the lattice
points in the following manner: primitive (P), body-centred (I), face-centred (F)
and side-centred (C). When combined with the 7 crystal systems, 14 Bravais lattices
can be described detailing the individual characteristics of both the unit cell and
symmetry, shown in Table 2.1.
TABLE 2.1: The seven crystal classes.
Lattice system Axial lengths and Bravais latticesangles
Cubic a = b = cα = β = γ = 90◦C P, I, F
Tetragonal a = b 6= c P, Iα = β = γ = 90◦C
Orthorhombic a 6= b 6= c P, I, F, Cα = β = γ = 90◦C
Hexagonal a = b 6= c Pα = β = 90◦C, γ = 120◦C
Trigonal a = b = c Pα = β = γ 6= 90◦C
Monoclinic a 6= b 6= c P, Cα = β = 90◦C, γ = 120◦C
Triclinic a 6= b 6= Pα 6= β 6= γ 6= 90◦C
In combination with the number of Bravais lattices, a total of 230 space groups
are possible including 32 point groups. However, mirror planes and centres of
inversion are excluded for biological molecules. These are examples of improper
symmetry where an object is transformed onto a mirror image however it is not
possible in this case as amino acids possess a chiral centre [159]. This leaves a total

Chapter 2. Experimental Methods 79
of 11 point groups that can exist for biological molecules. The point group is what
defines the morphology of the crystal.
The unit cell is repeated by translations throughout the crystal in all directions to
give a highly ordered structure [160].
2.5.2 The Scattering of Waves
Elastic scattering is seen when an incident wave is scattered by an object, for exam-
ple an atom, changing the direction of the wave but conserving its momentum. An
example of elastic scattering is diffraction. Scattering from one atom is extremely
weak so multiple atoms are needed to amplify the intensity of the scattered wave.
In the case of crystalline material, a series of ordered atoms lie on planes at defined
distances apart forming the crystal lattice. Bragg’s Law, Equation 2.1, defines the
conditions in which diffraction is possible. It relates the wavelength of radiation
λ, the scattering angle θ between the incoming wave and plane and the distances
between atoms on planes dhkl [161].
nλ = 2dsinθ (2.1)
In order to examine atomic structures, a probe that has a wavelength of the same
order as atomic spacings is required. X-rays with a wavelength of Angstroms (Å)
are a common and highly used probe as they are relatively cheap to produce in
comparison to other sources. It is also possible to produce X-rays with a high flux
which allows the examination of small and complex structures in a short timeframe.
Neutrons also have a number of advantages as an atomic probe. Both X-rays and
neutrons can be produced with varying wavelengths.

Chapter 2. Experimental Methods 80
Bragg planes are represented by three Miller indicies h, k, l. These values relate the
planes to the unit cell. The hkl value represents the number of times that the Bragg
plane cuts the a, b and c axes of the unit cell respectively. For example (h, k, l) =
(3,2,1) cuts the a axis 3 times, b axis two times and the c axis once. If there is a value
of 0 this indicates that the plane does not cross a particular axis.
dhkl
𝛉
𝛉
Incident X-ray Reflected X-ray𝝺
𝛉
x
𝛉
𝛉𝛉
Bragg plane (hkl)
FIGURE 2.12: Two incident, in phase, X-rays are reflected by planes defined by hkl,separated by an interplaner distance, d. The second wave has to travel extra distance n,equal to an integer number of wavelengths to remain in phase. The angle of incidence isdenoted as θ and is the same as the angle of reflection. The relationship nλ = 2dsinθdefines the conditions that satisfy Bragg’s Law.
There are two types of scattering: coherent and incoherent. Coherent scattering is
seen where the pathlengths of waves are different by nλ representing an integer
number of wavelengths. This means that the waves remain ’in phase’ and interfere
constructively with the addition of their amplitudes. Incoherent scattering is where
these criteria are not met and the amplitudes of the ’out of phase’ waves cancel. A
representation of Bragg’s Law with respect to atomic positions is shown in Figure
2.12.
Reciprocal space is an important concept in crystallography. In addition to the
real space lattice, a reciprocal lattice also exists. This reciprocal lattice is seen on
the diffraction pattern. The diffraction pattern is measured from the constructively
scattered waves that fulfil Bragg’s Law. Each spot on a diffraction pattern, known

Chapter 2. Experimental Methods 81
as a reflection, corresponds to a lattice point in reciprocal space with coordinates
hkl and a set of planes in the real space crystal.
The real space lattice is defined by the dimensions a, b and c however it is neces-
sary to consider a reciprocal lattice defined in the Equation 2.2. Any point on the
reciprocal lattice can be calculated by summing unit translations (a*, b*, c*) of the
reciprocal lattice with any integer (h, k, l), as defined in Equation 2.2.
s = ha∗ + kb∗ + lc∗ (2.2)
2.5.3 The Ewald Sphere
Monochromatic Data Collection
The Ewald sphere gives a pictorial representation of Bragg’s Law and what con-
ditions are required in a diffraction experiment [162]. It is a geometrical construc-
tion of a sphere with the real crystal and what can be considered as the real space
origin in the centre. When a reciprocal lattice point, representing the real space
Bragg planes, lies exactly on the edge of the sphere, Bragg’s Law is satisfied and
diffraction is seen. The sphere has a radius of 1/λ, representing the wavelength
λ in reciprocal space and the diffracted beam is represented by S, the scattered
wave. In addition, there is a limiting sphere within the construction, shown in Fig-
ure 2.13. The radius of 2/λ defines the maximum resolution that can be obtained
from a diffraction experiment: if there are lattice points that fall outwith the limit-
ing sphere, it will not be possible to record these reflections during the experiment.
Reducing the wavelength results in a larger Ewald sphere and more measurable
reflections. Larger unit cell dimensions have smaller reciprocal lattices, resulting
more reflections but also in closer recorded diffraction spots. The Ewald sphere
construction is independent from the contents of the unit cell and relates to both

Chapter 2. Experimental Methods 82
the unit cell dimensions and wavelength of radiation.
Incident beam
Crystal at the centre
of the sphere
Origin of the reciprocal lattice
d*hkl
hkl
𝜃𝜃
1/𝜆 1/𝜆
Diffracted beam
Reflecting sphere
𝜃
d*hkl
2/𝜆
Limiting sphere
S
FIGURE 2.13: The Ewald construction in the monochromatic case. The Ewald, orreflecting, sphere has a radius of 1/λ with the crystal located at the centre. Lattice pointslocated on the edge of the sphere indicate the conditions in which Bragg’s Law is satisfiedand give rise to diffraction. The limiting sphere indicates the maximum resolution thatcan be obtained from this experiment.
There are two ways that Bragg’s Law can be satisfied experimentally as there are
two possible variables, λ and θ, whilst the dhkl values stay fixed. The most common
data collection method uses a monochromatic beam, where the value for λ is fixed
and the angle of incidence, θ, is varied. Rotating the real crystal around an axis also
rotates the reciprocal lattice. This rotation translates the reciprocal lattice points
through the stationary Ewald sphere, achieving the diffraction of multiple lattice
points from the multiple Bragg planes. Monochromatic data collection involves
taking multiple adjacent frames to increase the data completeness and in order to
collect full reflections that are usually spread across a selection of images. This is
known as the rotation or oscillation method [163].

Chapter 2. Experimental Methods 83
Quasi-Laue Data Collection
In Laue, or Quasi-Laue, diffraction experiments, the other variable in Bragg’s Law
is changed, λ. Laue data collection uses the full range of wavelengths, or white
beam, whereas Quasi-Laue uses a range of wavelengths between a bandpass of λ
min and a λ max, considered as a pink beam. The Ewald construction is different
for Laue diffraction when representing what conditions fulfil Bragg’s Law. Due
to the range of wavelengths, there are two spheres representing the λmin and the
λmin used. Each reciprocal lattice point that lies in between these two spheres is
recorded as a diffraction spot, shown in Figure 2.14. This allows a broader range
of reciprocal space, i.e., more reciprocal lattice points, to be measured in a single
frame.
This method can be exploited in neutron diffraction experiments. Due to the typ-
ically low flux of neutrons, a Laue or Quasi-Laue data collection technique can
increase both the number of reflections and the flux relative to the monochromatic
method [164]. However, spatial overlap can become a problem when using the
Quasi-Laue data collection strategy. This issue arises when protein crystals have
large unit cell dimensions or display a high degree of mosaicity. Not only are these
common problems in macromolecules but the need for larger protein crystals in
neutron macromolecular crystallography also leads to an increased risk of higher
mosaicity. To reduce this effect, the bandpass can be narrowed resulting in fewer re-
flections or alternatively the sample to detector distance can be increased to spread
out reflections, preventing overlap [165]. Harmonic overlaps are also problematic
with Quasi-Laue data collection: where Bragg’s law is satisfied by multiple wave-
lengths and reflections are superimposed on the detector [166]. However using a
longer λ can reduce the effect by separating the Bragg peaks [166].

Chapter 2. Experimental Methods 84
1/𝛌max
1/𝛌min
𝛌min reflecting sphere
𝛌max reflecting sphere
Reciprocal lattice points
FIGURE 2.14: A range of wavelengths are used in Quasi-Laue data collection betweenλmin and λmax, defined by the two circles. Points on the reciprocal lattice give rise todiffraction if located inside the two circles, covering a larger area of reciprocal space thanin monochromatic mode.

Chapter 2. Experimental Methods 85
TABLE 2.2: Neutron coherent scattering lengths and incoherent cross sections for commonelements found in macromolecular structures. The X-ray scattering factors are alsoincluded for direct comparison.
Isotope Atomic Neutron Neutron X-raynumber coherent incoherent scattering
scattering cross factorslength section(10-12 cm) (Barn = 10-28 m2) (10-12 cm)
1H 1 -0.374 80.27 0.282H 1 0.667 2.05 0.2812C 6 0.665 0.00 1.6914N 7 0.973 0.50 1.9716O 8 0.580 0.00 2.2532S 16 0.280 0.00 4.50
2.5.4 X-ray and Neutron Scattering Factors
In X-ray diffraction, the X-rays are scattered by electron clouds with the intensity
proportional to the number of electrons squared, I ∝ z2. Each atom has a different
scattering factor, which increases with the number of electrons. Common elements
such as carbon and oxygen have form factors of 1.69 x 10⁻¹² cm and 2.25 x 10⁻¹² cm
whereas lighter elements have a much lower form factor value such as of 0.28 x
10-12 cm for hydrogen. In addition, the scattering factor decreases with increasing
scattering angle sinθ/λ due to the similar size of the electron cloud and the wave-
length of the X-ray beam. Table 2.2 details the X-ray scattering factors for elements
commonly found in macromolecules.
Neutrons do not follow the same trend as they interact with the nucleus, not the
electron cloud. The coherent scattering length bc, is equivalent to the X-ray scatter-
ing factor however it has no dependency on the scattering angle and the magnitude
of bc is indicative of the strength of the interaction. This can be explained by the
smaller size of the nucleus in comparison to the neutron beam. The bc value can
also be positive or negative, unlike X-ray scattering factors which are always pos-
itive. Whether the sign is positive or negative is associated with a shift in phase

Chapter 2. Experimental Methods 86
between the incident and scattered neutron waves. Interestingly, the neutron scat-
tering power shows no clear pattern across the periodic table. This is detailed Table
2.2.
Neutron coherent scattering lengths are also isotope specific, meaning that there
can be different values for nuclei of non-zero spin. We can consider two isotopes
of hydrogen: 1H and 2H, or deuterium. Both 1H and 2D have different nuclear
compositions leading to very different scattering lengths. The average scattering
length for a 1H nucleus is b = -0.374 x 10⁻¹² cm whereas the average value for a 2H
nucleus is b = 0.668 x 10⁻¹² cm (Table 2.2).
There is also an incoherent cross-section to consider, measured in Barns; 1 Barn =
10-24 cm2. The incoherent cross-section is most significant in elements containing
unpaired nuclear spins. This contributes to the overall background measurement,
which can mask the strength of the coherent scattering by decreasing the signal to
noise ratio (Table 2.2).
2.5.5 Structure Factors and Electron Density
Reciprocal space and real space are mathematically related via a Fourier transform
and this relates the diffraction pattern to the diffracting object, as previously de-
scribed. Any given reflection (hkl) can be represented as a structure factor con-
taining an amplitude and a phase, Fhkl. The structure factor is a summation of the
scattering contributions from all atoms on the plane hkl, each with a corresponding
structure factor fhkl.
Structure factors for X-rays can be described as shown in Equation 2.3. This rep-
resents the scattering from any given singular atom i corresponding to plane hkl
resulting in f i contributing to the amplitude of the reflection. The second term
e2πi(hxn + kyn + lzn) represents the phase of the wave.

Chapter 2. Experimental Methods 87
fhkl = fie2πi(hxn+kyn+lzn) (2.3)
Amplitudes are obtained experimentally by measuring the intensity of the diffrac-
tion spots. All atoms contribute to each reflection in the diffraction pattern with
each atomic scattering factor contributing to the measured amplitude. The total
scattering in a reflection can be represented by summing all scattering factors fhkl
and phases for each atom, shown in Equation 2.4.
Fhkl =n=N
∑n=1
fne2πi(hxn+kyn+lzn) (2.4)
Another description of Fhkl involves the integration of the electron density, ρ, at the
given position x, y, z, as described in Equation 2.5. This relationship is important
as it relates the measured amplitudes to the electronic structure of the object under
investigation.
Fhkl =∫
h
∫k
∫lρ(x, y, z)e2πi(hxn+kyn+lzn)dxdydz (2.5)
However crystals are not immobile objects, with atomic vibrations affecting the
quality of the diffraction. An additional factor must be taken into account when
calculating the structure factors, known as the Debye-Waller factor, or B factor, de-
fined in Equation 2.6.
Bj = 8π2U2j (2.6)
This additional term has units Å2 and where U is the measurement the mean-
square displacement of atom j. As the U parameter increases, the overall B-factor
increases and reduces the scattering contribution from the atom. The vibration of

Chapter 2. Experimental Methods 88
the atoms can result in the electron density becoming spread out as a result of the
disorder. The true equation relating the structure factor and the electron density
considering this additional term is shown in Equation 2.7.
Fhkl =∫
h
∫k
∫lρ(x, y, z)e2πi(hxn+kyn+lzn)e−Bjsin2θ/λ2
(2.7)
As previously described, when expressed as a Fourier transform the structure fac-
tors (Fhkl) can be calculated using the electron density, ρ(x,y,z). Fourier transforms
can be reversed, therefore it is possible to calculate the electron density ρ(x,y,z) from
the structure factors Fhkl. This reverse Fourier transform is shown in Equation 2.8,
where the volume of the unit cell is represented by V.
ρx,y,z =1V ∑
h∑
k∑
l|F(h, k, l)|e2πi(hxn+kyn+lzn) (2.8)
Each Fhkl contains the information on all of the atoms in a given plane hkl. It repre-
sents a wave, consisting of an amplitude, a frequency, and a phase. Amplitudes are
measured and λ is known from the X-ray source. The variable that is lost during the
diffraction experiment is the phase information. As this is needed in order to calcu-
late the electron density this poses a problem, known as the phase problem. Methods
developed for solving this phase problem include Patterson Methods, SAD and
MAD Phasing, and Molecular Replacement. There is also the method of protein
structure prediction which uses the amino acid sequence to predict the secondary
and tertiary structure of the protein.
2.5.6 Data Collection and Processing
The first step from diffraction images towards structure solution is indexing the
diffraction patterns from the images collected during the experiment. The aim of

Chapter 2. Experimental Methods 89
indexing is to obtain a list of hkl indicies for each recorded reflection. Indexing the
data once the diffraction images have been collected provides the approximations
of the unit cell dimensions, the crystal orientation and an estimate of the Bravais
lattice. These are used in conjunction with knowledge of the instrument parameters
such as crystal-detector distance and wavelength.
Indexing can also be conducted using only a few images in order to devise a data
collection strategy most suitable for the crystal. Knowledge of the Bravais lattice
indicates any symmetry elements and this knowledge can be useful to ensure the
collection of a complete dataset. It is also possible to estimate the most likely space
group from the symmetry-related intensities. These symmetry elements can then
be exploited to minimise the exposure to the beam, which is especially important
for radiation sensitive samples. As neutrons show no obvious damage from expo-
sure to the beam, this is less of a problem.
To obtain the intensities (I) related to the hkl values from the diffraction pattern,
the diffraction spots must be integrated. It is also necessary to obtain the errors
associated with the intensities or, standard uncertainties (σ). This process involves
predicting the position of each Bragg reflection on each image and measuring the
intensity and error estimate, after background subtraction. There are two methods
that can be employed: summation integration and profile fitting [167]. In summa-
tion integration, the number of pixels and their values are added together, back-
ground pixels are also summed and subtracted from the total pixels value. This is
most useful for strong diffraction spots. The profile fitting method provides a more
accurate estimate of the integrated intensity for weaker reflections. It assumes ei-
ther a 2D or 3D shape is known for each spot and the intensity is calculated when a
best fit is seen between the known spot profile and the observed spot profile [168].
Indexing and integration programs that are commonly used are XDS [169], Mos-
flm [168], HKL2000 [170] and DIALS [171] for monochromatic data and LAUEGEN
[172] for Laue diffraction.

Chapter 2. Experimental Methods 90
After indexing and integration, an mtz file is generated that contains all of the un-
merged reflections. Scaling and merging steps are required in order to equate all
the observations on a common scale. The data are not on a common scale due
to a number of experimental parameters including, but not limited to: radiation
damage, fluctuations in incident beam, absorbance in the crystal as a result of non-
uniform morphology.
Quasi-Laue neutron data collection has an additional stage. As a range of wave-
lengths are used, an additional step known as wavelength normalisation must be con-
ducted. This can be done using the program LSCALE [173]. This is done to equate
the measured intensities from different wavelengths onto a common scale prior to
scaling.
2.5.7 Data Quality Indicators
There are numerous indicators that are available for crystallographers to use when
evaluating the quality of the data. There are indicators for both merged and un-
merged data. The difference between the per image B-factor, Rfactor, and/or Dei-
derichs Rd factor [174] of the unmerged data can be used to estimate the amount
of radiation damage a sample receives, important for biological molecules. There
are also indicators that can calculate the precision of merged data which are more
important for downstream processes.
I/σ(I) (2.9)
Historically, the signal to noise ratio has been used to decide a high resolution cut-
off before scaling. Below that level the diffraction spots can be excluded from the
data used in refinement. The universally accepted cut-off level was ∼ 2 - 3.
Other metrics include Rmerge and Rp.i.m.

Chapter 2. Experimental Methods 91
Rmerge =∑(h,k,l) ∑n
i=1 |Ii(h, k, l)− I(h, k, l)|∑(h,k,l) ∑n
i=1 Ii(h, k, l)(2.10)
Rmerge calculates the agreement between multiple measurements of a reflection around
the average. However, this value tends to increase with an increased number of
observations (multiplicity) and is now commonly replaced with other statistical in-
dicators [167, 175, 176].
Rp.i.m. =∑(hkl)
√1/n− 1 ∑(h,k,l) |Ii(h, k, l)− I(h, k, l)|
∑(h,k,l) ∑ni=1 Ii(h, k, l)
(2.11)
Rp.i.m. (precision-indicating merging Rfactor) is used to calculate the precision of
merged data. It describes the precision of the averaged intensity measurements
and details the standard error of the mean. This statistic is related to Rmerge with
an additional term that removes the relationship with multiplicity. It is therefore a
more appropriate choice than Rmerge for deciding a high resolution cutoff [176, 177].
CC1/2 =∑(x− 〈x〉)(y− 〈y〉)
[∑(x− 〈x〉)2 ∑ (y− 〈y〉)2]1/2 (2.12)
For CC1/2, the dataset is randomly split into two halves and within each dataset the
average intensity is calculated for each unique reflection. Plotting this correlation
coefficient (CC) against resolution measures the internal consistency of the dataset.
The range of CC1/2 is from 1.0: total correlation and 0.0: no correlation. The value
of CC1/2 tends to 0 with the decrease in the signal to noise ratio. It is the primary
indicator for selecting a high resolution cutoff [176]. An example of a recommended
resolution cutoff is given in software package xia2, where the default cutoff value
of CC1/2 > 0.5 [178]. However, it has also been observed that including data up to
a value of CC1/2 ∼ 0.1 - 0.2 resulted in improved the quality of the difference maps
and led to an improved refined model [179].

Chapter 2. Experimental Methods 92
2.5.8 Structure Refinement and Model Building
After data collection and reduction is completed and phases are obtained, it is nec-
essary to refine a model against the data collected. The model is typically in the
form of a PDB, a file which contains information on the protein sequence, atomic
coordinates, B-factors (isotropic or anisotropic), and occupancies. This process in
the context of this thesis is covered in Chapter 4, Section 4.5 and Chapter 5, Section
5.5.
Structural refinement is the optimisation of a series of model parameters in order
to give the best model fit against a set of observations [180]. This iterative process
is carried out which aims to build a molecular model that will best fit the data
collected.
Key aspects of structural refinement are ’observations’ and ’parameters of a model’.
Observations include everything known about the model prior to refinement: unit
cell parameters, structure factor amplitudes, phase information and stereochemical
knowledge [180]. Parameters of a model are commonly detailed in a PDB format
[181], and include the atomic coordinates, atomic displacement parameters, and
occupancies. Refinement quality is improved when there is a larger ratio of obser-
vations to parameters.
Restraints and constraints can be used in order to aid the refinement process. A
restraint prevents specific individual/independent parameters from diverging too
far from target values. This is done using accepted knowledge of the structure such
as bond angles or bond lengths [182, 183]. Knowledge from a higher resolution
similar structure, or a reference model, can also be used as external restraints. This
involves using distance restraints between nearby atoms from the reference model
to aid the refinement. Mathematically, restraints can be considered as additional
experimental observations, by restricting the possible values of the parameters in
question [184]. A constraint forces specific parameters to be refined together, for

Chapter 2. Experimental Methods 93
example, a rigid body refinement or fixing an atomic position. This imposes a
restriction onto the refinement calculation and improves the ratio of observations
to parameters.
The model and electron or neutron density maps can be visualised using molecular
graphics packages, such as Coot [185]. The observed structure factor amplitudes
are described as Fo and the structure factor amplitudes calculated from the model
are described as Fc. Two electron or neutron density maps are consulted during
structural refinement. The 2Fo-Fc, or a Sigma-A weighted map 2mFo-DFc, is a rep-
resentation of the electron density around the model. The Fo-Fc/mFo-DFc map, or
’difference map’, can indicate errors in the model. If there are atoms missing then
these appear as positive density whereas when there are incorrectly placed atoms
in the model, the difference map shows negative density. This map gives an indi-
cation of how close the model is to the experimental data with peaks above 3.0 σ
deemed significant. This map can also provide useful information when used in
calculating an omit map, where parts of the structure such as small molecules and
mutated sidechains are removed. If truly present in the structure, these atoms are
clearly visible in the difference map. As the model is amended as per the indica-
tions of the Fo-Fc, the phases systematically improve.
2.5.9 Joint Refinement
X-ray data provides information on the distribution of electrons within a sample.
As this is intrinsically related to the mass of the atom, X-ray data can provide in-
formation on C, N, O, S atoms within proteins. In comparison, neutrons provide
information on the nuclear positions as they are scattered by nuclei, including 1H
and 2D atoms. Therefore it is possible to use the complementary X-ray and neutron
data together using a joint refinement strategy to solve the structure. This can be
conducted using programs such as phenix.refine [186].

Chapter 2. Experimental Methods 94
Refinement should be conducted on datasets ideally taken from the same crystal,
or at least an isomorphous sample, for example, under the same crystallisation
conditions and experimental temperature [186]. Including 1H and 2H atoms in the
model leads to a substantial increase in the number of refinement parameters, how-
ever, this problem is offset by the increase in experimental data available to use in
a joint structural refinement [186]. Furthermore, the addition of the extra informa-
tion from the X-ray data aids the low completeness and resolution commonly seen
in neutron datasets.
2.5.10 Model Validation and Statistical Indicators
The progress of refinement can be monitored concurrently by the global statistical
indicator the R-value, or Rwork/Rfactor, which measures the discrepancies between
the observed structure amplitudes and those calculated from the model [187]. The
lower the value of this R-factor indicates the increase in correlation between the
data and model. However it is possible to overfit the data, interpreting information
as significant when this is not the case, which can artificially reduce the Rwork [187,
188]. To counteract this problem, an additional cross validation metric known as
Rfree is also monitored during refinement. This involves excluding a small percent-
age of the reflections from the refinement process and calculating an Rfactor from
these reflections independently from the refinement. This is a method of reducing
bias as there is no effect from the refinement to these reflections. A clear indication
of overinterpretation of the data is when the values of Rfree and Rwork diverge to
over a 10% difference.
R f actor =∑(h,k,l)/∈{testset} ‖Fobs(h,k,l) - Fcalc(h,k,l)‖
∑(h,k,l)/∈{testset} |Fobs(h,k,l)| (2.13)

Chapter 2. Experimental Methods 95
R f ree =∑(h,k,l)∈{testset} ‖Fobs(h,k,l)| - |Fcalc(h,k,l)‖
∑(h,k,l)∈{testset} |Fobs(h,k,l)| (2.14)
Another method of model validation is the Ramachandran Plot [189, 190]. This
uses prior knowledge of stereochemical restraints and is essential to the struc-
ture determination of macromolecules [191]. It has a pictorial representation of
the stereochemical information, plotting the torsion angles φ and ψ of all amino
acids contained in the macromolecule. Plotting the possible combinations of an-
gles, establish what angle combinations are not possible due to steric hinderance.
It plots individual residues into ’fully allowed’, ’partially allowed’ and ’forbidden’
depending on identified clashes between atoms within the residues. This informa-
tion can be consulted during and after the model building process in order to assess
the likelihood of amino acid conformations, pointing towards a feasible model.
2.5.11 Radiation Damage
X-rays provide an ideal probe for examining protein structure at the atomic level,
however, radiation-induced degradation, or radiation damage, can occur during
data collection, particularly those conducted at ’brighter’ light sources. At a wave-
length of 1A, around 10% of the interacting X-ray photons are elastically scattered
(diffraction) [192]. Approximately 90% of interacting photons will deposit their en-
ergy into the crystal via the photoelectric effect, resulting in excitation processes
[193], and through Compton inelastic scattering.
The excitation events caused by the photoelectric effect can cause structural dam-
age to the protein molecules and overall crystal lattice. The photoelectric effect
describes the ejection of a tightly bound electron from the inner shell of an atom,
following the absorption of a high energy X-ray photon, and leads to radiation
damage [194]. The ejected electron will produce 500 additional ionisations within

Chapter 2. Experimental Methods 96
a few micrometers of the initial ionisation site [195, 196]. Radiation damage can
be divided into primary and secondary radiation damage. Primary radiation dam-
age is a result of the X-ray photons interacting with an atomic electron within the
crystal. This leads to the absorption of energy, where this energy is either dissi-
pated through heat (thermal vibration of the molecule), or results in the generation
of high energy photoelectrons, lower energy Auger electrons, and other radical
species [197, 198] and is dose dependent. Secondary radiation damage arises when
the species produced in the primary event cause damage to the sample through
the generation of additional free radicals. Secondary radiation damage is both time
and temperature dependant. Both primary and secondary radiation damage can
be further classed as direct or indirect events. Direct events involve the genera-
tion of radicals from the atoms in the protein molecule whereas indirect events are
produced from non-protein atoms, e.g., the destruction of solvent molecules where
hydroxyl and hydrogen radicals are produced [197, 198].
These reactive species lead to a series of chemical reactions which can alter the
structure of the sample and can cause both global and specific effects. Global ra-
diation damage appears by a loss of resolution of the data, an increase in Wilson
B-factors and mosaicity, and can alter unit cell parameters [192, 199]. Experimental
factors that can be consulted to assess radiation damage include per-image Rmerge,
per-image B-factor, and Diederichs Rfactor (Rd) [174]. Specific damage as a result of
irradiation includes modification of individual residues, causing local changes be-
fore the overall diffraction of the crystal is affected. For example, disulphide bonds
can be reduced causing bond breakage, and decarboxylation of acidic residues can
occur, resulting in the generation of CO2 [199–202]. In the case of extensive radi-
ation damage, these effects can be observed in the electron density maps. Active
sites have been found to be particularly vulnerable to radiation damage [201, 203].
Redox proteins and those containing metal atoms can be easily reduced during ir-
radiation, leading to important changes in the structure during the data collection
[203], with Beitlich and colleagues [204] specifically referring to heme proteins as

Chapter 2. Experimental Methods 97
vacuum cleaners, describing their ability to suck up electrons. This is due to the
likelihood that an atom will interact with an X-ray photon increases with atomic
number [196]. As a result it may not be possible to distinguish structural features at-
tributed to radiation damage from the results of mechanistic reactions, questioning
the reliability of the results obtained using this technique, and creating difficulties
in obtaining high resolution data [198, 205]. However, there are cases where radia-
tion damage has been used in experiments as an asset. Phasing methods utilising
structural damage inflicted by X-rays, radiation damage-induced phasing (RIP),
have been shown to be successful in several cases where datasets have been col-
lected at high brilliance sources [206–208]. Investigations into catalytic mechanisms
have also used radiation damage to their advantage [81, 209]. In order to mitigate
the effects of radiation damage, crystals can be cooled to cryogenic temperatures of
between 80-100 K before and during data collection. This process of cryo-cooling
does not prevent primary radiation damage [210, 211], but can reduce the effect
of secondary radiation damage by 70 fold [212] as the diffusion of free radicals is
reduced. As a result, it is now estimated that over 90% of protein structures have
been determined at cryo-temperatures [213]. Alternatively, the use of radical scav-
engers has been suggested to reduce the detrimental effects of free radicals caused
by irradiation [195]. However, there are problems when proteins complexes con-
taining radical scavengers as they can increase the susceptibility of the active site to
radiation damage, as is the case for UOX studies where the substrate UA is a free
radical scavenger [81]. Serial X-ray crystallography involving multiple crystals can
alleviate the effects of radiation damage and complementary techniques can also
be utilised in order to monitor any radiation induced changes, such as microspec-
trophotometry, Raman, and EXAFS [81, 194, 214].
While X-ray crystallography remains the most popular technique in structural biol-
ogy, other methods can be used to investigate radiation-sensitive structures. Stud-
ies involving X-ray Free Electron Lasers have been proved to be advantageous in
such cases [215]. The use of a very intense X-ray beam allows for a large X-ray dose

Chapter 2. Experimental Methods 98
to be deposited at ambient temperatures, with pulses on the femtosecond timescale,
leading to measurable diffraction before the complete ionisation of the structure de-
stroys the lattice [216]. Alternatively, the use of neutrons as a non-destructive probe
can also be valuable in samples susceptible to radiation damage [164, 217]. As neu-
trons do not cause any observable radiation damage, it is possible to study protein
samples at RT without any unwanted destructive effects and under more physi-
ological conditions. The technique of neutron macromolecular crystallography is
covered in more detail in Section 2.6.
2.6 Neutron Macromolecular Crystallography
X-ray crystallography accounts for ∼ 138,000 structures in the PDB and gives in-
formation on the structures of biomacromolecules at the atomic level, namely the
heavier atoms (C, N, O, S) [75]. Due to the short data collection times and small
sample requirements, it is the probe of choice for structural biology. Notably, only
∼ 900 structures have been determined to a resolution of < 1.0 Å, the resolution at
which it is possible to visualise hydrogen atoms. Additional factors such as high
levels of thermal motion or bond polarity may also have an effect on the ability to
locate hydrogen positions, meaning that even at high resolution, confidently iden-
tifying their locations remains challenging [218]. In the context of macromolecules
where around 50% of atoms are hydrogen, the knowledge of these positions is im-
portant to fully understanding both function and structure. Many biological pro-
cesses centre around hydrogen bonding networks, protonation states of residues
and substrates, and proton transfer pathways.
Neutron macromolecular crystallography (NMX) is a complementary structural
technique to X-ray macromolecular crystallography. NMX is responsible for ∼ 150
PDB depositions, with > 50% of these in the last 5 years [75]. Many aspects of enzy-
matic mechanisms involve hydrogen atoms and, from NMX studies, it is possible

Chapter 2. Experimental Methods 99
to locate hydrogen positions in macromolecules. This allows the elucidation of pro-
tonation states of amino acid residues, hydrogen bonding networks, and water ori-
entations, information previously unattainable from other techniques. However,
drawbacks from this is that neutron production is expensive, interaction is rela-
tively weak and the flux of neutrons is very low. This leads to long data collection
time and the need for large samples to amplify the scattering signal.
The scattering power of hydrogen is of the same order of magnitude as carbon
when using neutrons as the diffraction probe compared to using X-rays which is
dependant on the number of electrons, hydrogen only having one (Section 2.5.4,
Table 2.2). However, the coherent scattering length of 1H is negative. This results
in unwanted cancellation effects seen in neutron scattering density maps. For ex-
ample, in common groups, such as -CH2 and -CH3, the negative scattering of the
1H, -0.374 x 10⁻¹² cm, cancels the signal from the positively scattered C atom, 0.665 x
10-12 cm. In addition, the large incoherent cross-section of 1H contributes to a large
background on the detector during experimental measurements. This results in a
decreased signal to noise ratio and subsequently limits the resolution of the data.
The 2H isotope of hydrogen, deuterium, plays a key role in neutron experiments.
As previously mentioned, neutron scattering power varies according to nuclear
composition, therefore deuterium has different properties to 1H. Deuterium has a
positive coherent scattering length value of 0.667 x 10⁻¹² cm, similar to that of 12C
and 16O, shown in Table 2.2. This positive value does not result in cancellation ef-
fects that are seen with 1H. In addition, the incoherent scattering cross-section is
∼ 40 times lower for 2D than 1H (2.05 Barn vs 80.27 Barn). This vastly reduces
the contribution to the background and increases the signal to noise ratio. Replac-
ing hydrogen atoms for deuterium is commonplace in neutron studies to increase
the quality of the neutron density maps. Hydrogens can be replaced by buffer
exchange or by protein expression under deuterated conditions. The deuteration
methods of macromolecules are covered in more detail in Section 2.2.
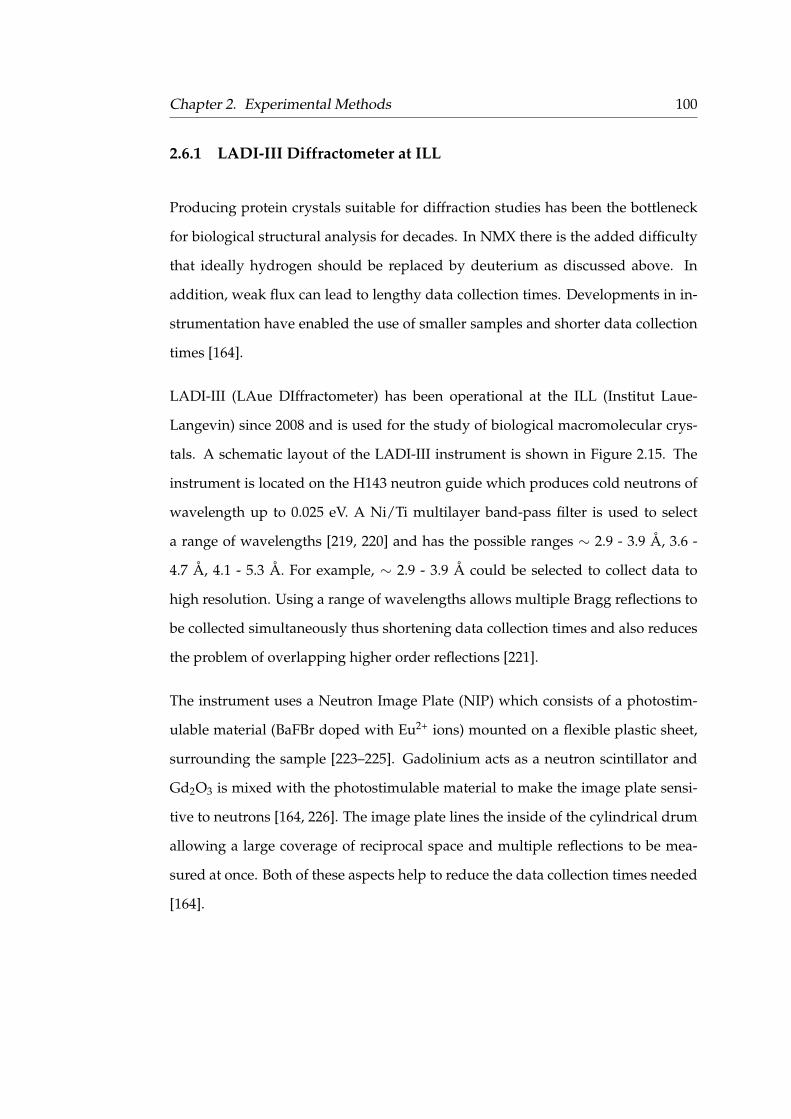
Chapter 2. Experimental Methods 100
2.6.1 LADI-III Diffractometer at ILL
Producing protein crystals suitable for diffraction studies has been the bottleneck
for biological structural analysis for decades. In NMX there is the added difficulty
that ideally hydrogen should be replaced by deuterium as discussed above. In
addition, weak flux can lead to lengthy data collection times. Developments in in-
strumentation have enabled the use of smaller samples and shorter data collection
times [164].
LADI-III (LAue DIffractometer) has been operational at the ILL (Institut Laue-
Langevin) since 2008 and is used for the study of biological macromolecular crys-
tals. A schematic layout of the LADI-III instrument is shown in Figure 2.15. The
instrument is located on the H143 neutron guide which produces cold neutrons of
wavelength up to 0.025 eV. A Ni/Ti multilayer band-pass filter is used to select
a range of wavelengths [219, 220] and has the possible ranges ∼ 2.9 - 3.9 Å, 3.6 -
4.7 Å, 4.1 - 5.3 Å. For example, ∼ 2.9 - 3.9 Å could be selected to collect data to
high resolution. Using a range of wavelengths allows multiple Bragg reflections to
be collected simultaneously thus shortening data collection times and also reduces
the problem of overlapping higher order reflections [221].
The instrument uses a Neutron Image Plate (NIP) which consists of a photostim-
ulable material (BaFBr doped with Eu2+ ions) mounted on a flexible plastic sheet,
surrounding the sample [223–225]. Gadolinium acts as a neutron scintillator and
Gd2O3 is mixed with the photostimulable material to make the image plate sensi-
tive to neutrons [164, 226]. The image plate lines the inside of the cylindrical drum
allowing a large coverage of reciprocal space and multiple reflections to be mea-
sured at once. Both of these aspects help to reduce the data collection times needed
[164].
Chapter 2. Experimental Methods 101
FIGURE 2.15: Schematic of the LADI-III instrument set-up at the ILL, Grenoble. Themultilayer wavelength filter allows the extraction of a wavelength band most suitable tothe sample. The cylindrical detector allows for a wider coverage of reciprocal space incomparison to flat detectors [164]. Image taken from [222].
2.7 Mass Spectrometry
Mass spectrometry can be used for both the qualitative and quantitative analysis of
proteins. This technique can be used to rapidly and accurately determine the mass
of a molecule using a small quantity of sample. There are three sections to a mass
spectrometer: an ion source, a mass analyser and a detector [227]. The ionisation
source is responsible for the generation of an assortment of positive and negative
charged molecules in the gas phase. After ionisation, the molecules pass though a
mass analyser, and are recorded on the detector at different times, directly related
to their mass and charge (m/z, the mass to charge ratio). The detector counts the

Chapter 2. Experimental Methods 102
number of ions and measures the relative abundance. A mass spectrum is gen-
erated plotting m/z versus the intensities. This technique can be used alongside
time-of-flight (TOF).
+++
++ ++ +
+++-
--
Spray needle tip
Taylor cone
+
+
+
+
+ +++
+
+
+
++++
++
+
++
+
+ + +++
+
+++
+ + +
++
+
+
+
+
+ +
++ +
+
+
+
++
+
++ +
+ +
+
Analytemolecule
Analyteions
Charged droplet
power supply
+ve -ve
Desolvation
FIGURE 2.16: ESI-MS: the generation of positive charges in the Taylor cone results in theappearance of a charged droplet. Desolvation occurs until each droplet contains a singlemolecule of analyte, which is then measured on a detector which identifies the m/z ratio.
Electrospray ionisation is most commonly used for biological molecules and is
shown in Figure 2.16 [228]. The sample is dissolved in a volatile solution, loaded
into a conductive capillary where a voltage is applied. This electric field encourages
a build-up of charges to form on the surface of the droplet at the tip of the capillary.
Once the charges have accumulated to a high level the droplet bursts forming many
smaller highly charged droplets. These droplets desolvate through high pressure
and potential differences until each droplet contains a singular molecule of analyte.
From the resulting data, a mass spectrum is generated by plotting the different m/z
ratios. This results in a Gaussian distribution. The value of m does not change
whilst neighbouring peaks have a charge difference given as z1 = z2-1. For the
determination of the m of the protein of interest, the m/z of two neighbouring peaks
is determined experimentally as x and y. By forming two equations as (m/z1 = x
and m/z2 = y), simultaneous equations can be used to calculate the values for m, z1
and z2.

Chapter 2. Experimental Methods 103
Mass spectrometry is a useful technique to evaluate the level of deuteration achieved
from the perdeuteration process. With knowledge of the amino acid sequence and
by measuring the masses of the perdeuterated and hydrogenated samples, it is
possible to calculate the level of deuteration. It is essential to assess this to ensure
a high percentage of deuteration has been reached. It is commonplace to conduct
such experiments before neutron experiments in order to validate deuteration level
[141, 142, 144, 229–236].
2.8 Thermal Shift Assay
The thermal stability of a protein can be determined using a Thermal Shift Assay
(TSA). Also known as Differential Scanning Fluorimetry (DSF), or a ThermoFluor
Assay, this technique identifies the melting temperature (Tm) of proteins upon ther-
mal denaturation [237]. The Tm value is taken from the midpoint of the unfolding
transition [238]. In contrast to Differential Scanning Calorimetry (DSC), which has
historically been the method of choice for assessing the stabilities of proteins, TSA
has a high-throughput and is a much cheaper method of analysis.
The use of fluorescent dyes is commonplace in TSA measurements. For example,
the SYPRO Orange dye [239] is used by the HTX Platform (Platform for Structural
Biology, Grenoble). The fluorescence of this dye is quenched in a polar environ-
ment, but increases in a non-polar environment [240]. With increasing temperature,
the protein unfolds, exposing the hydrophobic core: this increases the fluorescence
signal of the dye until the protein is completely unfolded [240, 241].
The assessment of a proteins Tm in a range of solutions can identify conditions
that enhance the proteins stability [237]. This is beneficial for proteins that ag-
gregate during storage and, therefore, require the addition of stabilising buffers
or ligands [237]. In addition, it has been reported that increased stability closely

Chapter 2. Experimental Methods 104
correlates with the likelihood of crystallisation of recombinant proteins, so TSA
measurements can be used to identify optimal crystallisation conditions [237, 242].
TSA experiments have been conducted to investigate the effect of hydrogen and
deuterium on protein stability [135, 138, 144, 243, 244]. When hydrogenated pro-
teins are exchanged against deuterated buffers, the labile hydrogen positions are
replaced with deuterium atoms. This affects hydrogen bonding interactions and
has been termed the primary deuterium isotope effect [135]. The addition of deu-
terium into the hydrogen bonding network is thought to increase the strength of
the hydrogen bonds and, subsequently, increases the Tm [135]. The replacement of
non-exchangeable hydrogen atoms with deuterium affects the hydrophobic inter-
actions in the protein, termed the secondary deuterium isotope effect [135]. It has
been proposed that the replacement of hydrogen with deuterium weakens the hy-
drophobic interactions in the protein and, as a result, reduces the Tm. Therefore, a
reduction in thermal stability is expected for perdeuterated proteins, and this effect
has been observed in previous studies [138, 243, 244]. However, despite this dif-
ference in thermal stability, limited structural and functional differences have been
reported.
105
Chapter 3
Production of Perdeuterated Urate
Oxidase (DUOX) and Biophysical
Characterisation
Abstract
Deuterium labelling can be an asset to neutron crystallographic experiments. The
perdeuteration of proteins involves the substitution of non-exchangeable hydro-
gens, in addition to those located at labile positions, with deuterium. The biosyn-
thesis of UOX in deuterated conditions requires the optimisation of the expression
system in order to maximise the mass of deuterated protein, DUOX, produced.
This chapter presents the optimisation of the UOX expression system and the pro-
duction of DUOX using High Cell Density Culture (HCDC) in fermentation. The
purification of DUOX is described, detailing the qualitative analysis of the sam-
ple at each stage of the process. Additional characterisation techniques, such as
mass spectrometry and thermofluor assays are also described in this chapter. Mass
spectrometry was employed to evaluate the level of perdeuteration achieved by
Chapter 3. Production of Perdeuterated Urate Oxidase (DUOX) and Biophysical
Characterisation106
fermentation and a thermofluor assay was conducted to ascertain any differences
in stability between hydrogenated UOX (HUOX) and DUOX.
3.1 Expression and Optimisation of DUOX
3.1.1 Bacterial Transformation
The untagged UOX wild type (UOXwt) protein from Aspergillus flavus consists of
301 amino acids (Appendix A). The codon optimised synthetic cDNA (Genscript)
was inserted into a pET24b vector (Novagen) carrying kanamycin (kanR) resistance.
The vector was kindly supplied by colleagues in the Steiner Research Group. Vector
amplification was conducted using E. coli JM109 cells before plasmid DNA isolation
and transformation into E. coli BL21 (DE3) competent cells. These E. coli cells were
selected as the expression system for the production of DUOX. Cell transformation
was carried out by adding 5 ng DNA to 25 µL thawed competent cells on ice for
30 minutes. This sample was then heat shocked at 42 ◦C for 30 seconds to allow
the DNA to enter the cells, then incubated on ice for 2 minutes after mixing the
solution. 100 µL SOC medium was added to the solution and incubated at 37 ◦C
at 150 RPM for 1 hour. After incubation, the cells were spread onto an LB agar
plate containing kanR. Colony growth was seen after incubation at 37 ◦C, overnight
(O/N).
3.1.2 Expression and Solubility Testing
The perdeuteration process requires a minimal deuterated medium and a deuter-
ated carbon source. The expression and solubility of UOX in LB, minimal hydro-
genated media, and deuterated minimal media were compared. Minimal media is
used as common media such as LB are not commercially available in a deuterated

Chapter 3. Production of Perdeuterated Urate Oxidase (DUOX) and Biophysical
Characterisation107
form. The contents of the minimal media (Enfors) are described in Appendix A.
This section will discuss the following:
• Comparison of the expression and solubility of the protein in hydrogenated
minimal media (H-Enfors) with LB
• Comparison of the expression and solubility of the protein in deuterated min-
imal media (D-Enfors) with LB and H-Enfors
This enabled the identification of the best conditions for the production of the pro-
tein in deuterated conditions by fermentation.
Expression and Solubility Testing in Hydrogenated Minimal Media
A hydrogenated minimal medium, H-Enfors, was first tested to establish the effect
of minimal medium in comparison to nutrient rich LB medium. Solubility and
expression tests were conducted on two different overexpression times at 30 ◦C:
5 hours and overnight. This temperature was selected as it is consistent with the
fermenters optimal operational temperature.
After transformation, 50 mL of LB with kanR was inoculated with several colonies
and incubated overnight at 37 ◦C. 2 mL of this starter culture was used to inoculate
3 flasks of 15 mL LB and 3 flasks of 15 mL H-Enfors. All cultures were incubated
at 30 ◦C. Once each of the flasks reached an OD600 of ∼ 0.8, a sample of 500 µL
was removed to record the level of expression Before Induction (BI). Each flask was
then induced with 2 mM IPTG. After each expression time, an aliquot from each
sample was also taken to measure UOX expression After Induction (AI).

Chapter 3. Production of Perdeuterated Urate Oxidase (DUOX) and Biophysical
Characterisation108
LB, 5h H-Enfors, 5h H-Enfors, O/N
250 —150 —
75 —
50 —
37 —
25 —
20 —
15 —
10 —
100 —
BI AI P SNMW BI AI P SN BI AI P SN
DUOX
FIGURE 3.1: SDS-PAGE showing the expression and solubility of HUOX in H-Enfors, ahydrogenated minimal medium with comparison to expression in LB. The MW (kDa)lanes represent a molecular weight marker. Expression was conducted at 30 ◦C in both LBand H-Enfors. The different expression times are separated by a solid black line. BeforeInduction (BI) and After Induction (AI) samples show the level of protein expression. Thelevel of insoluble vs soluble protein is evaluated by comparing the Pellet (P) sample withthe Supernatant (SN). After visual inspection of the SDS-PAGE gel, it was concluded thatthe addition of minimal media shows little effect on the level of expression whencompared directly to LB media. However the quantity of soluble HUOX is higher in theovernight expression time than in the 5 hours culture.
The samples before induction and after induction were analysed to investigate the
effect of minimal media on the expression of HUOX. Cells were pelleted from all
before induction and after induction samples by centrifugation at 10,000 RPM for 5
minutes at 4 ◦C. The excess supernatant was removed and 100 µL of sample buffer
added and mixed.
The pellet (P) and supernatant (SN) samples were evaluated for the level of both
soluble and insoluble HUOX expressed in each condition. Testing the solubility
of the expressed protein required 15 mL of each of the final cultures. Cells were
collected by centrifugation at 5,000 RPM for 8 minutes at 4 ◦C. Each cell pellet was
then resuspended in 2 mL of lysis buffer (50 mM Tris-acetate pH 8.0). Cell lysis
was carried out using glass beads: 0.5 mL of glass beads were added to 1 mL of
the resuspended pellet. All samples were placed in the disruptor for 5 minutes at

Chapter 3. Production of Perdeuterated Urate Oxidase (DUOX) and Biophysical
Characterisation109
4 ◦C. 3 µL of sample buffer added to 15 µL of the supernatant and set aside for
the analysis of soluble protein. 50 µL of sample buffer was added directly to the
pelleted cells and heat shocked at 100 ◦C for 10 minutes for the analysis of insoluble
protein presence.
Equivalent quantities of cells from each sample were loaded onto an SDS-PAGE gel,
shown in Figure 3.1. The results from minimal media were directly compared with
HUOX in LB at 30◦C after 5 hours expression time. A band ∼ 34 kDa consistent
with the MW of the HUOX monomer is seen on the SDS-PAGE gel. The level of
expression seen in the H-Enfors samples, at both 5 hours and overnight expression
times, show a similar quantity of soluble protein to that observed in LB medium
at 30 ◦C. This indicates that there is very little effect of minimal medium on the
expression of HUOX. After visual inspection, the solubility test results between
the 5 hour and overnight expression times show that there is a larger quantity of
soluble protein present in the overnight expression time. This suggested that a
longer expression time is the preferred condition for the expression of HUOX in
minimal media.
Expression and Solubility Testing in Deuterated Minimal Media
For the production of perdeuterated protein, 100% of the components in the growth
medium must be deuterated. This is to prevent the inclusion of any hydrogen that
may be incorporated into the protein during expression. Prior to the fermentation
process, a further test of the expression and solubility of UOX in D-Enfors was also
conducted to assess the effect of deuterated minimal medium. The same parame-
ters as the H-Enfors tests were repeated and compared to LB expressed at 30 ◦C. Vi-
sual inspection of the SDS-PAGE shown in Figure 3.2 shows that level of expression
is higher in the D-Enfors overnight sample when compared to the 5 hour sample.
The quantity of soluble protein is also higher in the overnight sample and is similar
to that obtained from LB 30 ◦C with 5 hours expression time. This result is consis-
tent with what was observed in the H-Enfors expression and solubility tests. It was

Chapter 3. Production of Perdeuterated Urate Oxidase (DUOX) and Biophysical
Characterisation110
concluded that the expression conditions for the fermentation process should be 30
◦C, with overnight expression to obtain the largest quantity of DUOX. The results
from the tests of D-Enfors are described in Figure 3.2. Comparison of the expres-
sion and solubility of HUOX in LB media at different expression temperatures and
times can be found in Appendix A, Figure A.2 for reference.
D-Enfors, 5h D-Enfors, O/N LB, 5h
BI AI P SNMW BI AI P SN BI AI P SNMW250 —150 —
75 —
50 —
37 —
25 —
20 —
15 —
10 —
100 —
DUOX
FIGURE 3.2: SDS-PAGE showing the expression and solubility of DUOX in D-Enfors, adeuterated minimal medium and compared to expression in LB. The MW (kDa) lanesrepresent a molecular weight marker. Expression was conducted at 30 ◦C and differentexpression times are separated by a solid black line. The level of overnight (O/N)expression was more significant than in the sample that was overexpressed for 5 hoursfrom both the After Induction (AI) and supernatant (SN) samples. From these results itwas concluded that the most suitable conditions for DUOX expression in the fermenterwas 30 ◦C overnight.
3.2 The Production of Perdeuterated UOX (DUOX)
The process of fermentation is commonly used to produce High Cell Density Cul-
tures (HCDC). The HCDC allows the production of large amounts of biomass in a
minimal volume. This type of culture is ideal for deuterated conditions because the
cost of D2O and deuterated (d8) glycerol are high [131]. For example, it costs 380
EUR per litre of D2O: one fermentation typically uses ∼ 2 L in total. In addition,

Chapter 3. Production of Perdeuterated Urate Oxidase (DUOX) and Biophysical
Characterisation111
it costs 20 EUR per gram of d8-glycerol: one fermentation typically uses ∼ 50 g of
d8-glycerol in total.
Fermentation was chosen to produce perdeuterated UOX for 100% hydrogen to
deuterium replacement. The details of the fermentation process for the production
of perdeuterated protein are detailed in Chapter 2, Section 2.2.
3.2.1 Cell Adaptation for Growth in Deuterated Media
To enhance the growth of bacteria in deuterated media, an adaptation phase is
needed. This adaptation involves diluting a small culture of 10 mL each day for ∼
10 times. Chapter 2 describes the adaptation protocol in more detail.
Adapted cells can be used in the fermentation process immediately, or can be stored
on cryo-beads at -80 ◦C until required. During this study, both of these methods
were employed. To awaken the cells, several cryo-beads are removed and placed
in 10 mL D-Enfors with 30 µg/mL kanR and grown at 37 ◦C overnight. After
overnight growth, 1 mL of culture is inoculated into 10 mL fresh D-Enfors and the
process is repeated a minimum of three times before transferring to the fermenter
starter culture. The expression of these awoken cells was tested and results are de-
tailed in Figure 3.3, showing that the storage on cryo-beads had no effect on the
ability of the cells to express protein.

Chapter 3. Production of Perdeuterated Urate Oxidase (DUOX) and Biophysical
Characterisation112
250 —150 —
100 —
75 —
50 —
37 —
25 —
20 —
15 —
10 —
MW (kDa)
dUOX BIdUOX AI
MW BI AI250 —150 —100 —
75 —
50 —
37 —
25 —
20 —
10 —
DUOX
FIGURE 3.3: SDS-PAGE displaying the expression test on cells awoken after storage oncryo-beads after adaptation. The band in the After Induction (AI) lane is identified asDUOX when compared with the Before Induction (BI) sample and a MW standard (kDa),confirming the ability of cells to express DUOX after storage on cryo-beads.
3.2.2 Fermentation of DUOX
150 mL of starting culture is required to inoculate 1.2 L of D-Enfors in the fermenter.
This starting culture contains D-Enfors and 30 µg/mL kanR.
The advantage of the fermentation process is the control of important parameters
such as mass flow (d8-glycerol), pO2, pH, and stirrer speed. The OD600 is measured
by manually extracting small samples of the culture at regulated intervals in order
to monitor cell growth. The air flow of O2 (pO2) also gives an indication of cell
respiration. The value decreases from 100% as the cells utilise the O2 until a sharp
drop to 30%. At this point, the stirrer speed is adjusted to increase the O2 flow to the
system, answering the demand for O2 from the multiplying cells. A base solution
of 1 M NaOD is added to the fermenter culture to compensate for the increasing
acidity from the cellular byproducts, maintaining the pH at 6.9.
The fermentation consists of three phases: the batch phase, the fed-batch phase
and the induction phase. The batch phase is the primary phase in the growth of
deuterated cells, where the cells use the starting quantity of d8-glycerol present in
the fermenter (5 g/L). The fed-batch phase begins once this d8-glycerol has been

Chapter 3. Production of Perdeuterated Urate Oxidase (DUOX) and Biophysical
Characterisation113
feed
ing
sign
al O
D =
4.9
final
vol
ume
1.7
L, O
D =
17.
265
.5 g
cel
l pas
te
stir
rer
spee
d 35
0s
incr
ease
to 4
50s
sp22
ON
st
irre
r spe
ed 4
50s
indu
ctio
n at
OD
= 1
6, 2
mM
IPTG
O/N
30o
C
Batc
h Ph
ase
Fed-
Batc
h Ph
ase
Indu
ctio
n Ph
ase
FIG
UR
E3.
4:Fe
rmen
ter
profi
lew
ith
tim
ein
hour
son
the
xax
isan
dm
onit
ored
para
met
ers
onth
ey
axis
:sti
rrer
spee
d,ba
se,f
eed,
pH,p
O2
and
OD
.

Chapter 3. Production of Perdeuterated Urate Oxidase (DUOX) and Biophysical
Characterisation114
consumed in the growth of the cells and has to be supplemented by the 120 g/L
feeding solution. The beginning of this phase was observed by the drop of the
pO2 to 30%, indicating the lack of a carbon source. The feeding solution is added
exponentially until a sufficient amount of biomass has been produced. The last
phase is the induction phase. The induction was carried out at OD600 = 16 with
2 mM IPTG dissolved in D2O, with expression at 30◦C overnight. After 16 hours
overexpression the cells were collected by centrifugation at 8000 RPM at 4◦C for 25
minutes and stored at - 20 ◦C. The fermenter was stopped at an OD of 17.2 and 65.5
g of cells paste was obtained from 1.7 L of media. The fermenter profile is shown in
Figure 3.4 and details the parameters monitored during the fermentation process.
250 —150 —100 —
75 —
50 —
37 —
25 —
20 —
DUOX
MW BI AI
FIGURE 3.5: SDS-PAGE analysis of the samples Before Induction (BI) and After Induction(AI). With reference to the Molecular Weight marker (MW), a band at ∼34 kDa afterinduction confirms the successful over expression of UOX in controlled and fullydeuterated conditions.
The level of expression before and after induction was examined using the same
protocol as described in Section 3.1.2. As shown in Figure 3.5, a band located
around ∼34 kDa after induction confirms the overexpression of DUOX under the
controlled conditions of the fermenter. The band on the gel is weaker than previ-
ously seen in the expression of HUOX. However from the large mass of cell paste
obtained, it was expected that a sufficient mass of DUOX was expressed. This is
discussed in Section 3.3.1.

Chapter 3. Production of Perdeuterated Urate Oxidase (DUOX) and Biophysical
Characterisation115
3.3 Protein Purification of DUOX
The purification protocol for HUOX was an established protocol, employed by the
Steiner Research Group. An overview of the steps involved in this purification
protocol is given in Figure 3.6. During this research project, the purification of
HUOX was conducted to verify all steps. This protocol was then repeated with
DUOX. The following section discusses the purification of DUOX only.
FIGURE 3.6: The overview of the DUOX purification protocol. The individual steps andresults will be discussed in the following paragraphs.
Cell Lysis
Each DUOX purification was conducted with approximately 8 - 10 g pelleted cells.
This frozen pellet was thawed and resuspended in lysis buffer (50 mM Tris-HCl 5
mM KCl pH 8.0 - 5 mL/g of cell paste) at 4◦C, supplemented with an EDTA-free
protease inhibitor cocktail, benzonase, and lyzozyme. The resuspended cells were
sonicated for ∼ 22 minutes on ice, with sequential breaks to prevent overheating
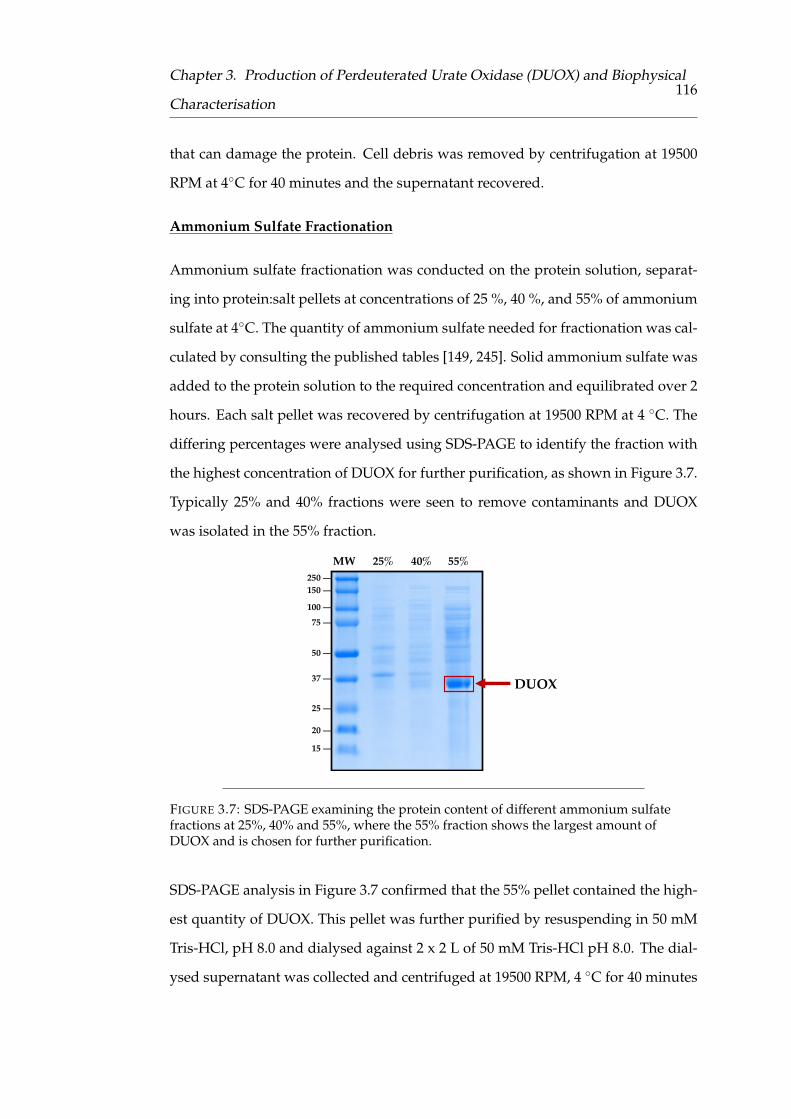
Chapter 3. Production of Perdeuterated Urate Oxidase (DUOX) and Biophysical
Characterisation116
that can damage the protein. Cell debris was removed by centrifugation at 19500
RPM at 4◦C for 40 minutes and the supernatant recovered.
Ammonium Sulfate Fractionation
Ammonium sulfate fractionation was conducted on the protein solution, separat-
ing into protein:salt pellets at concentrations of 25 %, 40 %, and 55% of ammonium
sulfate at 4◦C. The quantity of ammonium sulfate needed for fractionation was cal-
culated by consulting the published tables [149, 245]. Solid ammonium sulfate was
added to the protein solution to the required concentration and equilibrated over 2
hours. Each salt pellet was recovered by centrifugation at 19500 RPM at 4 ◦C. The
differing percentages were analysed using SDS-PAGE to identify the fraction with
the highest concentration of DUOX for further purification, as shown in Figure 3.7.
Typically 25% and 40% fractions were seen to remove contaminants and DUOX
was isolated in the 55% fraction.
250 —150 —
100 —75 —
50 —
37 —
25 —
20 —
15 —
MW 25% 40% 55%
DUOX
FIGURE 3.7: SDS-PAGE examining the protein content of different ammonium sulfatefractions at 25%, 40% and 55%, where the 55% fraction shows the largest amount ofDUOX and is chosen for further purification.
SDS-PAGE analysis in Figure 3.7 confirmed that the 55% pellet contained the high-
est quantity of DUOX. This pellet was further purified by resuspending in 50 mM
Tris-HCl, pH 8.0 and dialysed against 2 x 2 L of 50 mM Tris-HCl pH 8.0. The dial-
ysed supernatant was collected and centrifuged at 19500 RPM, 4 ◦C for 40 minutes

Chapter 3. Production of Perdeuterated Urate Oxidase (DUOX) and Biophysical
Characterisation117
in order to remove any precipitation.
DEAE and Q Sepharose Ion Exchange Chromatography
The protein solution was loaded onto a GE Healthcare HiTrap DEAE Sepharose
FastFlow column pre-equilibrated in 50 mM Tris-HCl, 5 mM KCl pH 8.0. The elu-
tion of the protein was followed at 280 nm and recorded on the chromatogram, see
Figure 3.8. Contaminants were then eluted at by 50 mM Tris-HCl, 600 mM KCl
pH 8.0 and discarded. The fractions corresponding to the first peak observed on
the chromatogram were pooled and immediately loaded onto a GE Healthcare Q-
Sepharose FastFlow column. The elution of the protein was again followed at 280
nm and recorded on the chromatogram, see Figure 3.8. Additional contaminants
were eluted using 50 mM Tris-HCl, 600 mM KCl pH 8 and discarded. Protein-
containing fractions were recorded by chromatogram and analysed by SDS-PAGE.
Fractions containing DUOX, confirmed by SDS-PAGE, were pooled together. Chro-
matograms from both DEAE and Q Sepharose ion exchange columns and the SDS-
PAGE analysis from the Q Sepharose column are shown in Figures 3.8 and 3.9.

Chapter 3. Production of Perdeuterated Urate Oxidase (DUOX) and Biophysical
Characterisation118
0 10 20 30 40 50 60 70 80Time (min)
0
250
500
750
1000
1250
1500
1750
2000
Abso
rpti
on(A
.U.)
0
20
40
60
80
100
%B
(a) DUOX DEAE Ion Exchange Chromatogram
Fractions
Contaminants
0 10 20 30 40 50Time (min)
0
100
200
300
400
Abso
rpti
on(A
.U.)
0
20
40
60
80
100
%B
DUOX Q-Sepharose Ion Exchange Chromatogram
Fractions
Contaminants
(b)
FIGURE 3.8: (a) Chromatogram from DEAE Ion Exchange column follows the elution ofDUOX. The elution of DUOX is indicated by the wide peak between Time 10 - 65 mins.Contaminants recorded by the secondary peak were discarded. These fractions werepooled and immediately loaded onto the Q Sepharose column. (b) Q Sepharosechromatogram shows a peak between 3 - 48 mins indicating the elution of DUOX.

Chapter 3. Production of Perdeuterated Urate Oxidase (DUOX) and Biophysical
Characterisation119
(a)
250 —150 —100 —
75 —
50 —
37 —
25 —
20 —
15 —
10 —
(c)MW F3 F4 F5 F6 F7 F8 F9 F10 F11 F12 F13 F14 F15 F16
DUOX
(b)
250 —150 —100 —
75 —
50 —
37 —
25 —
20 —
15 —
10 —
(d)MW F17 F18 F19 F20 F21 F22 F23 F24 F25 F26 F27 F28 F29
DUOX
FIGURE 3.9: (a) and (b), Flowthrough fractions from the Q-Sepharose column wereanalysed using SDS-PAGE and compared with a molecular weight standard (MW, kDa).
Phenyl Sepharose Hydrophobic Interaction Chromatography
Solid ammonium sulfate was then added gradually to the protein solution to a total
concentration of 1 M. The equilibrated solution was loaded onto a GE Healthcare
HiLoad 16/10 Phenyl Sepharose column pre-equilibrated in 1 M (NH4)2SO4, 30
mM KPi pH 8.0. The protein was eluted using a gradient of 30 mM KPi pH 8.0
and fractions were analysed using SDS-PAGE to assess purity. Chromatogram and
SDS-PAGE gel are described in Figure 3.10.

Chapter 3. Production of Perdeuterated Urate Oxidase (DUOX) and Biophysical
Characterisation120
0 50 100 150 200 250 300Volume (ml)
0
200
400
600
800
Abso
rpti
on(A
.U.)
Fractions E9 - H12
DUOX Hydrophobic Interaction Chromatogram
DUOX Loading Peak
(a)
250 —150 —100 —
75 —
50 —
37 —
25 —
20 —
15 —
10 —
MW E9 E12 F3 F6 F12 G3 G6 G9 G12 H3 H6 H9 H12F9
DUOX
(b)
FIGURE 3.10: (a) Chromatogram from Hydrophobic Interaction Chromatography. Peakindicating the elution of DUOX is seen from 185 mL - 250 mL. (b) Eluted fractions werecompared against a molecular weight standard (MW, kDa) and pure DUOX fractions wereidentified for use in the subsequent size exclusion step.
Size Exclusion Chromatography s75
Purest fractions were pooled and concentrated to < 5.0 mL before loading onto a
GE Healthcare HiLoad 16/60 Superdex75 prep grade Size Exclusion column pre-
equilibrated in 50 mM Tris-acetate pH 8.0. Fractions at an elution peak at ∼ 50 mL,
seen on the chromatogram, were analysed on SDS-PAGE: chromatogram and SDS-
PAGE are shown in Figure 3.11. The purest fractions were combined and used for
further experiments.

Chapter 3. Production of Perdeuterated Urate Oxidase (DUOX) and Biophysical
Characterisation121
0 20 40 60 80 100 120 140Volume (ml)
0
500
1000
1500
2000
Abso
rpti
on(A
.U.)
Fractions B9 - C12
DUOX Gel Filtration Chromatogram(a)
250 —150 —100 —75 —
50 —
37 —
25 —
20 —
15 —
10 —
5 —
MW (kDa)B9 B12 C1 C3 C5 C7 C9 C11 D1C2 C4 C6 C8 C10MW B9 B12 C1 C2 C3 C4 C5 C6 C7 C8 C9 C10 C11 D1
DUOX
(b)
X
FIGURE 3.11: (a) Size Exclusion chromatogram. Peak between 40 - 60 mL shows theelution of DUOX. (b) Eluted fractions were compared against a molecular weight standard(MW, kDa) and pure DUOX fractions pooled for exchange/concentration steps inpreparation for crystallisation experiments.
3.3.1 Comparison of HUOX and DUOX Expression
It was possible to probe the efficiency of the fermenter in producing DUOX by com-
paring the results from both HUOX and DUOX purifications. These statistics are
detailed in Table 3.1. Comparison of the respective yields of HUOX and DUOX
produced per gram of cell paste as 4.20 mg and 1.8 mg, indicates that the HUOX
is produced in greater quantities. However, directly comparing the mass of UOX

Chapter 3. Production of Perdeuterated Urate Oxidase (DUOX) and Biophysical
Characterisation122
TABLE 3.1: Statistics from HUOX and DUOX purifications. By comparing values obtainedbetween the two purifications, it is possible to evaluate the efficiency of the fermenter andcalculate the mass of protein expected from each expression: HUOX in flasks and DUOXfrom the fermenter. It is important to take into account the mass of materials used in eachprocess.* indicates protein yield before concentration for crystallisation.
HUOX in LB DUOX in D-Enfors
Cell paste massused in purification 10 g 10 g
Yield of UOX 42 mg* 18 mg*
mg protein/g 4.20 mg/g 1.8 mg/gcell paste
Volume of 4 L 1.7 Lmedia
g of cell paste/ 4.5 g/L 39 g/LL of media
Estimated 75.6 mg 119.34 mgtotal UOX
obtained from one purification, does not accurately represent the results of the fer-
menter. Extrapolation of these values to consider the total UOX produced shows
that the fermenter produces a higher quantity of cell paste relative to the volume
of media used 4.5 g/L of cell paste in LB compared to 39 g/L cell paste in the fer-
menter. From the information obtained from the purification, the calculations show
that the total yield of DUOX is higher than that calculated for HUOX. For HUOX,
the total is 75.6 mg per flask expression (of 4 L in total) vs DUOX, where the total
is 119.34 mg for one fermenter (1.7 L). As previously described, deuterated materi-
als are costly, so maximising the expression of the protein of interest whilst keeping
the quantity of material to a minimum is desirable. Therefore, we can conclude that
whilst the level of overexpression is not clear from SDS-PAGE analysis, quantify-
ing the level of protein produced proves that under fermenter conditions DUOX
has been overexpressed to a substantial level in comparison to typical HUOX ex-
pression.

Chapter 3. Production of Perdeuterated Urate Oxidase (DUOX) and Biophysical
Characterisation123
250—
150 —
75 —
50 —
37 —
25 —
20 —
15 —
100 —
MW DUOX HUOX
HUOXDUOX
FIGURE 3.12: SDS-PAGE gel showing pure fractions of DUOX and HUOX. The molecularweight (MW) difference is observed visually by a slight displacement in the band position,indicating that the MW of DUOX is higher than that of HUOX.
The difference in molecular weight between HUOX and DUOX was calculated to be
approximately 1,820 Da (as described in Section 3.4). A pure sample of both HUOX
and DUOX protein was analysed using SDS-PAGE, as shown in Figure 3.12. The
effect of perdeuteration on the mass of the protein is seen in differing migration
distances between the two samples.
The entire purification process is conducted in hydrogenated buffers, therefore the
perdeuterated protein contains only deuterium in the non-exchangable atoms of
the protein at this stage. After the purification procedure is completed the protein is
buffer exchanged into deuterated buffer to replace all the labile hydrogen positions
with deuteriums. This is done through a repetition of concentration:dilution steps.
A Merck KGaA 10 kDa millipore centrifugal unit was used to concentrate the pure
protein solution < 10 % starting volume. This was then diluted 10 fold using 50
mM Tris-acetate, 30 mM NaAc, pD 7.59, with the addition of salt to increase the
solubility of the protein. This process was repeated a minimum of 2 times before
finally concentrating the protein to > 20 mg/mL.

Chapter 3. Production of Perdeuterated Urate Oxidase (DUOX) and Biophysical
Characterisation124
3.4 Mass Spectrometry
The mass spectrometry measurements were conducted using Mass Spectrometry
Platform as part of the Partnership for Structural Biology, Grenoble. Mass spec-
trometry can be used assess the level of deuteration of proteins produced through
fermentation. Comparing measured masses to calculated values can establish the
number of hydrogens successfully substituted by deuteriums into non-exchangeable
positions in the protein. Both the masses of HUOX and DUOX were recorded and
compared. In the case of HUOX, the sample was concentrated to 2 mg/mL and
analysed in 50 mM Tris-acetate pH 8.0. For DUOX, the sample was concentrated to
2 mg/mL and analysed in 50 mM Tris-HCl pH 8.0, due to the increased solubility of
DUOX in halogenated buffers. For both of the samples, hydrogenated buffer was
used for instrumental reasons.
(a)hUOXHUOX
(b)dUOXDUOX
FIGURE 3.13: The deconvoluted spectra of both HUOX (a) and DUOX (b) giving themeasured molecular weights in kDa for the two isotopically different proteins.

Chapter 3. Production of Perdeuterated Urate Oxidase (DUOX) and Biophysical
Characterisation125
The expected molecular weights (MW) of both the hydrogenated and perdeuter-
ated protein can be calculated from the amino acid sequence in the protein: the
UOX sequence obtained from ProtParam is given in Appendix A, Figure A.1. Us-
ing an excel table and the amino acid sequence of UOX, it was possible to evaluate
the number of non-exchangeable hydrogen positions in the protein, and calculate
the overall expected mass. The table and calculated values are shown in Appendix
A, Table A.3 for reference. The MW of HUOX and DUOX was calculated to be
34,098 Da and 35,918 Da, respectively.
The deconvoluted spectra that were provided by Dr Luca Signor, IBS Grenoble,
show the experimentally measured mass of HUOX as 34,110 Da and of DUOX as
35,913 Da (Figure 3.13). Examination of the number of non-exchangeable sites and
their MW calculates that there should be a mass difference of 1,820 Da between the
HUOX and DUOX samples if all the sites are successfully replaced with deuterium
during protein biosynthesis. The MW difference between the experimentally mea-
sured masses of HUOX and DUOX is 1,803 Da. Calculating this as a percentage
of available sites is >99%, confirming the success of the fermentation process at
achieving high levels of deuteration. This is consistent with the level of perdeuter-
ation recorded in other projects that follow the protocol established by the Life
Sciences Group at the Institut Laue-Langevin (ILL) [131, 231, 235, 246, 247].
3.5 Thermofluor Assay
The thermal stabilities of HUOX and DUOX were compared using a Thermofluor
Assay. Thermofluor Assay experiments were conducted using the HTX Platform,
as part of the Partnership for Structural Biology, Grenoble. Both samples were mea-
sured in hydrogenated buffers containing 50 mM Tris-HCl at pH 8.0. Concentra-
tions of 0.8 mg/ml and 1.0 mg/ml were used for the HUOX and DUOX samples

Chapter 3. Production of Perdeuterated Urate Oxidase (DUOX) and Biophysical
Characterisation126
respectively. Normalised curves showing the fluorescence and melting point (Tm)
of the two proteins are shown in Figure 3.14.
The graphs show similar profiles with two features: in both cases there is a small
increase in fluorescence between 40 ◦C and 50 ◦C. This may be due to the dissoci-
ation of tetramer however, the amplitude of the peak is not substantial enough to
draw this conclusion. Further analysis may confirm a relationship between tem-
perature and multimer dissociation. The typical sigmoidal curve is shown for both
samples between 50 ◦C and 75 ◦C. The melting temperature (Tm) is calculated as
the midpoint of the sigmoidal curve, values for HUOX and DUOX are shown in
Table 3.2. It is observed that the Tm of DUOX is approximately 4 ◦C lower than that
of HUOX indicating a reduced stability.
0
0.2
0.4
0.6
0.8
1
1.2
0 10 20 30 40 50 60 70 80 90 100
Fluo
resc
ence
(Nor
mal
ised
)
Temperature (°C)
Thermofluor Assay DUOX
HUOX
Tm(D)
Tm(H)
62.2°C58.3°C
Tm (DUOX)
Tm (HUOX)
FIGURE 3.14: Normalised fluorescence data from thermofluor assay, identifying the Tm ofboth HUOX and DUOX samples. With increasing temperature, an increase in fluorescenceis seen due to the unfolding of the protein and the binding of the fluorescent dye. Thegreen curve shows the profile for DUOX and the red curve shows the profile for HUOX.The Tm for each protein is indicated in the legend.

Chapter 3. Production of Perdeuterated Urate Oxidase (DUOX) and Biophysical
Characterisation127
TABLE 3.2: Tm values for HUOX and DUOX, calculated from Thermofluor Assay data.
HUOX DUOX
Tm value (◦C) 62.2 58.3
This difference in Tm has been noted in other examples in literature suggesting
that deuterated proteins are commonly less stable to heat denaturation than the
hydrogenated counterparts [138, 243, 244]. For example, the deuterated Enzyme
INtr showed a reduction in thermal stability of ∼ 4 ◦C, in addition to enhanced
oligomerization propensity and an increased sensitivity to proteolysis in vivo [243].
Studies into the thermal stability of perdeuterated glutathione S-transferase and
P450cam also showed similar results with a reduced thermal stability of ∼ 3.8 ◦C
and ∼ 4 ◦C, respectively [138, 244]. It has been suggested that a reason for this
reduced thermal stability may be that by substituting backbone hydrogen atoms
with deuteriums, the activation barrier for unfolding is lowered. The C-D bond has
a decreased vibrational amplitude in comparison to C-H, as a result, this weakens
the strength of hydrophobic interactions and lowers the Tm [138].

128
Chapter 4
Joint Refinement of Perdeuterated
Urate Oxidase (DUOX) complexed
with 8-azaxanthine (AZA)
Abstract
This chapter presents the structural investigation of perdeuterated Urate Oxidase
(DUOX) complexed with the inhibitor 8-azaxanthine (AZA). The purpose of this
research was to examine the chemical environment and solvent structure in the
active site of the DUOX:AZA complex using neutron crystallography (NMX).
Previous X-ray studies have identified a solvent molecule (termed W1) that occu-
pies the cavity above the ligand binding site (the peroxohole) [65]. This solvent
molecule W1 has been observed in UOX complexes with the natural substrate uric
acid (UA), 9-methyl uric acid (9-MUA), and inhibitor AZA [65, 81, 82]. It is dis-
placed upon O2 binding in the oxidation reaction of UA. The proximity of the W1
solvent molecule to the C5 position of UA is thought to be important in the hydra-
tion reaction that forms 5-hydroxyisourate [68].

Chapter 4. Joint Refinement of Perdeuterated Urate Oxidase (DUOX) complexed
with 8-azaxanthine (AZA)129
The charge and bonding interactions of this W1 solvent molecule with active site
residues, Thr57* and Asn254, in the DUOX:AZA complex, are determined in this
study. The protonation states of active site residues, suggested to form a catalytic
triad consisting of Thr57*-Lys10*-His256, are also determined. These are then com-
pared with the results obtained with previous neutron studies by Oksanen et al. of
hydrogenated Urate Oxidase (HUOX) in complex with AZA and UA, inhibited by
a chlorine atom [80].
Key features in the experimental design, such as ligand choice and buffer composi-
tion, enabled this dataset to be collected at 298 K. Both neutron and X-ray datasets
were collected at this temperature on the same crystal. The two datasets were used
to perform joint refinement of DUOX:AZA complex. The experimental details and
results are given in this chapter. The analysis of these results in a mechanistic con-
text are also discussed herein.
4.1 Introduction
Urate Oxidase (UOX) is a widely studied enzyme and both its structure and func-
tion have been investigated using a wide range of techniques. X-ray crystallog-
raphy has been invaluable in providing insight into the structure of UOX with >
100 number of structures deposited in the PDB [75]. The first X-ray structure of
Apergillus flavus UOX by Colloch et al. studied UOX in complex with inhibitor 8-
azaxanthine (AZA) [65]. The structural differences between AZA and the natural
substrate uric acid (UA) are shown in Figure 4.1. In comparison to UA which con-
tains a carbonyl group at position C8, the AZA molecule contains an amide group.
The AZA inhibitor also cannot be oxidised and prevents the binding of O2 to the
active site.

Chapter 4. Joint Refinement of Perdeuterated Urate Oxidase (DUOX) complexed
with 8-azaxanthine (AZA)130
(a) (b)
FIGURE 4.1: (a) The structure of the natural substrate uric acid (UA). (b) The structure ofinhibitor 8-azaxanthine (AZA). The carbonyl group at position 8 on the purine ring in UAis replaced with an amide group in AZA.
Other studies of UOX in complex with natural substrate UA have been conducted
using X-ray crystallography [81, 82]. Samples were prepared under O2-free condi-
tions (anaerobic) and successfully trapped a solvent molecule, commonly referred
to as W1 in literature [65, 80, 81], located above the substrate in the initial stage of
the reaction as shown in Figure 4.2. This W1 solvent molecule is then displaced as
O2 binds to the same location. However, the proximity of this W1 solvent molecule
is thought to be important in the hydration reaction to form 5-hydroxyisourate (5-
HIU) [68]. However, due to the limitations of X-ray crystallography, previously
described in Chapter 2 (Sections 2.5.4 and 2.6), these studies did not provide any
information on the charge of this water molecule and the exact details of its bond-
ing interactions with active site residues.

Chapter 4. Joint Refinement of Perdeuterated Urate Oxidase (DUOX) complexed
with 8-azaxanthine (AZA)131
FIGURE 4.2: The natural substrate uric acid (UA) bound to hydrogenated Urate Oxidase(HUOX) under anaerobic conditions before the binding of O2. A solvent molecule (W1)occupies the peroxohole above UA and several conserved water molecules are detailedwith hydrogen bonding distances to active site residues. 2mFo-DFc electron density(green) contoured to 1 σ. Figure adapted from [81] c© 2014 The Authors. Published byWiley-VCH Verlag GmbH & Co. KGaA.
Neutron macromolecular crystallography (NMX) is a powerful technique that can
be used to locate hydrogen positions. A review of the NMX technique is described
in Chapter 2, Section 2.6. Previous neutron studies by Oksanen et al. [80] have
been conducted on hydrogenated UOX (HUOX) complexes. These included HUOX
complexed with inhibitor AZA (HUOX:AZA) and the natural substrate UA (HUOX:UA),
soaked in deuterated buffer [80]. The HUOX:UA complex suggested that UA binds
to UOX as the N3 deprotonated monoanion, before being rapidly tautomerised to
form 8-hydroxyxanthine (8-HX), therefore referred to as the HUOX:8-HX complex.
The HUOX:AZA complex showed that AZA also binds as the N3 monoanion. In
this case, halogenated crystallisation conditions had an inhibitory effect on the re-
action as a Cl- atom binds to the location of the W1 solvent molecule/O2 [65, 78, 80,
82]. The bonded negatively charged Cl- atom displaces the W1 solvent molecule
and prevents the binding of O2. Catalytic residues had previously been identified
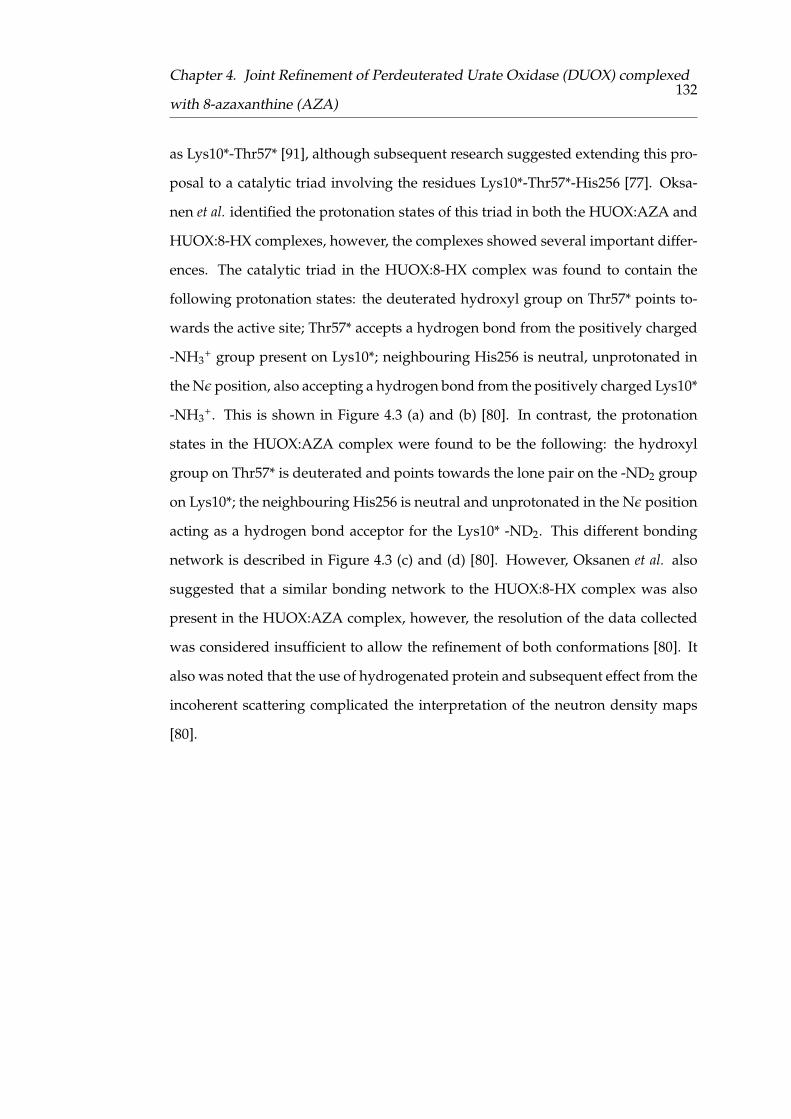
Chapter 4. Joint Refinement of Perdeuterated Urate Oxidase (DUOX) complexed
with 8-azaxanthine (AZA)132
as Lys10*-Thr57* [91], although subsequent research suggested extending this pro-
posal to a catalytic triad involving the residues Lys10*-Thr57*-His256 [77]. Oksa-
nen et al. identified the protonation states of this triad in both the HUOX:AZA and
HUOX:8-HX complexes, however, the complexes showed several important differ-
ences. The catalytic triad in the HUOX:8-HX complex was found to contain the
following protonation states: the deuterated hydroxyl group on Thr57* points to-
wards the active site; Thr57* accepts a hydrogen bond from the positively charged
-NH3+ group present on Lys10*; neighbouring His256 is neutral, unprotonated in
the Nε position, also accepting a hydrogen bond from the positively charged Lys10*
-NH3+. This is shown in Figure 4.3 (a) and (b) [80]. In contrast, the protonation
states in the HUOX:AZA complex were found to be the following: the hydroxyl
group on Thr57* is deuterated and points towards the lone pair on the -ND2 group
on Lys10*; the neighbouring His256 is neutral and unprotonated in the Nε position
acting as a hydrogen bond acceptor for the Lys10* -ND2. This different bonding
network is described in Figure 4.3 (c) and (d) [80]. However, Oksanen et al. also
suggested that a similar bonding network to the HUOX:8-HX complex was also
present in the HUOX:AZA complex, however, the resolution of the data collected
was considered insufficient to allow the refinement of both conformations [80]. It
also was noted that the use of hydrogenated protein and subsequent effect from the
incoherent scattering complicated the interpretation of the neutron density maps
[80].

Chapter 4. Joint Refinement of Perdeuterated Urate Oxidase (DUOX) complexed
with 8-azaxanthine (AZA)133
(a) HUOX:8-HX (b) HUOX:8-HX
↔
(c) HUOX:AZA (d) HUOX:AZA
↔
FIGURE 4.3: Protonation states of reactive site residues described in previous neutronstudies. (a) and (b) The protonation states of the Thr57*-Lys10*-His156 catalytic triad inhydrogenated Urate Oxidase:8-hydroxyxanthine complex (HUOX:8-HX). The8-hydroxyxanthine (8-HX) monoanion is also shown. (c) and (d) Different protonationstates of the Thr57*-Lys10*-His156 catalytic triad in the hydrogenated UrateOxidase:8-azaxanthine complex (HUOX:AZA). Adapted from [111] c© 2014 Oksanen et al.Distributed under CC-BY 4.0.
Presented in this chapter is the crystallisation, neutron and X-ray data collection,
and structure solution of perdeuterated UOX (DUOX) in complex with the inhibitor
AZA. The use of perdeuterated protein reduces the problems associated with hy-
drogenation, allows shorter NMX data collection times, and tends to enhance the
resolution of the data for well-diffracting samples [248, 249]. Protein perdeutera-
tion also facilitates data collection for smaller crystal volumes [143, 233, 234, 250].

Chapter 4. Joint Refinement of Perdeuterated Urate Oxidase (DUOX) complexed
with 8-azaxanthine (AZA)134
In addition, halogen-free crystallisation conditions enabled the conservation of the
W1 molecule [65]. The W1 molecule has been identified as an oxygen atom using
X-ray crystallography, however, its charged state had not been identified prior to
this study.
This study aims to identify the charged state of the W1 solvent molecule using
neutron crystallography, given that this technique is able to distinguish between
D2O, D3O+, and OD- molecules. We also consider whether the molecule located
above the AZA ligand affects the protonation states of active site residues, with
comparison to previous studies involving inhibition by chlorine [80]. The bonding
networks of functionally relevant amino acids and active site water molecules are
described in detail and discussed in the context of previously published structures.
4.2 Crystallisation of DUOX:AZA
The expression and purification of DUOX is described in Chapter 3. The prepa-
ration of the protein solution for crystallisation experiments is also described in
Chapter 3.
The batch crystallisation method was employed for the growth of DUOX:AZA crys-
tals. A mixture of 30 µL total volume with protein solution and crystallisation
buffer in a 2:1 ratio was prepared. The crystallisation buffer consisted of 50 mM
Tris-acetate, 8% PEG 8000, pD 7.59 in D2O. The DUOX:AZA crystals were produced
by co-crystallisation as the AZA ligand was added to the crystallisation buffer to a
concentration of 13mM. The ligand was added into the crystallisation solution by
agitating the solution on a bench-top shaker until visibly dissolved.
Sitting Drop plates (Hampton Research) were used for the crystallisation set-up
and sealed using crystallisation tape. The protein and buffer solution (30 µL) were

Chapter 4. Joint Refinement of Perdeuterated Urate Oxidase (DUOX) complexed
with 8-azaxanthine (AZA)135
mixed in the concave sitting drop post and the reservoir was left empty. The crys-
tallisation set-up for this experiment is shown in Figure 4.4 (a). These solutions
were left to crystallise at 18 ◦C. After ∼ 5 days nucleation was observed with crys-
tals reaching full size after ∼ 10 days.
(a) (b)
1
crystallisation tape
30 µL 2:1 protein : crystallisation buffer mix
empty sitting drop well
wax sealant
deuterated buffer plug
DUOX:AZA crystal
5 µL deuterated buffer
FIGURE 4.4: (a) Batch crystallisation set-up for producing perdeuterated UrateOxidase:8-azaxanthine (DUOX:AZA) crystals. A 30µL mixture containing 2:1 protein tocrystallisation buffer was prepared using Sitting Drop plates (Hampton Research) with anempty reservoir, sealed with crystallisation tape. (b) DUOX:AZA crystal mounted in a 3mm diameter quartz capillary for data collection.
FIGURE 4.5: A perdeuterated Urate Oxidase:8-azaxanthine (DUOX:AZA) crystal with avolume of 1.5 mm3 was used for neutron data collection and subsequent X-ray datacollection.
A fully deuterated single crystal of approximate volume 1.5 mm3 (1.4 mm x 1.2 mm

Chapter 4. Joint Refinement of Perdeuterated Urate Oxidase (DUOX) complexed
with 8-azaxanthine (AZA)136
x 0.9 mm) was selected for data collection and mounted in a quartz capillary with
an internal width of 3 mm, shown in Figures 4.4 (b) and 4.5. Mother liquor (∼ 5
µL) was added to the base of the capillary in order to keep the crystal hydrated
during data collection. Excess mother liquor surrounding the crystal was removed
to reduce the effect of the solvent on the scattering and to prevent crystal movement
during data collection. This capillary was then sealed with wax to prevent any
exchange with air and to prevent the dehydration of the crystal.
4.3 Quasi-Laue Data Collection on LADI-III
The DUOX:AZA crystal was mounted into the sample position of the LADI-III
beamline at the Insitut Laue-Langevin (ILL), Grenoble [164]. LADI-III is equipped
with a large cylindrical detector which surrounds the sample and is composed of
neutron-sensitive image-plates (diameter: 400 mm, height: 450mm) [164]. Quasi-
Laue neutron diffraction data was collected to 2.1 Å using a wavelength range of
3.12 - 4.2 Å, centered at 3.68 Å. The crystal was held in a stationary position during
data collection, with the angle of rotation changed by 10◦ between each image. The
crystal was rotated through a total of 100◦ and a total of 11 images were collected
with an exposure of 1.5 hours per image. This crystal was then recovered and sub-
sequently used for X-ray data collection. One neutron Laue diffraction image with
an exposure time of 1.5 h is shown in Figure 4.6.
The program LAUEGEN [172] was used in the reduction of the neutron data, fol-
lowed by wavelength normalisation using LSCALE [173]. All reflections were then
scaled and merged using SCALA [251] and converted to structure factors using the
program TRUNCATE [252, 253]. Neutron data acquisition statistics are detailed in
Table 4.1.

Chapter 4. Joint Refinement of Perdeuterated Urate Oxidase (DUOX) complexed
with 8-azaxanthine (AZA)137
FIGURE 4.6: A Quasi-Laue neutron diffraction pattern of the perdeuterated UrateOxidase:8-azaxanthine (DUOX:AZA) crystal with 1.5 h exposure time.
4.4 X-ray Data Collection on FIP
Protein crystals do not suffer from radiation damage during neutron data collec-
tion, therefore, it was possible to collect an X-ray dataset on the same DUOX:AZA
crystal. It is important to collect datasets on homologous crystals as the unit cell
parameters should be as similar as possible to facilitate the joint refinement of the
structure (see Section 2.5.9 in Chapter 2). The sample was measured at 293 K using
the FIP beamline at the ESRF at λ = 0.9800. A total of 240 images of 1◦ oscillation
with 5 s of exposure per image were recorded on an ADSC Q315 detector. The
intensities were indexed and integrated using the XDS package [169], and were
then merged and scaled using the CCP4 program AIMLESS [254]. The X-ray data
acquisition statistics are detailed in Table 4.1.
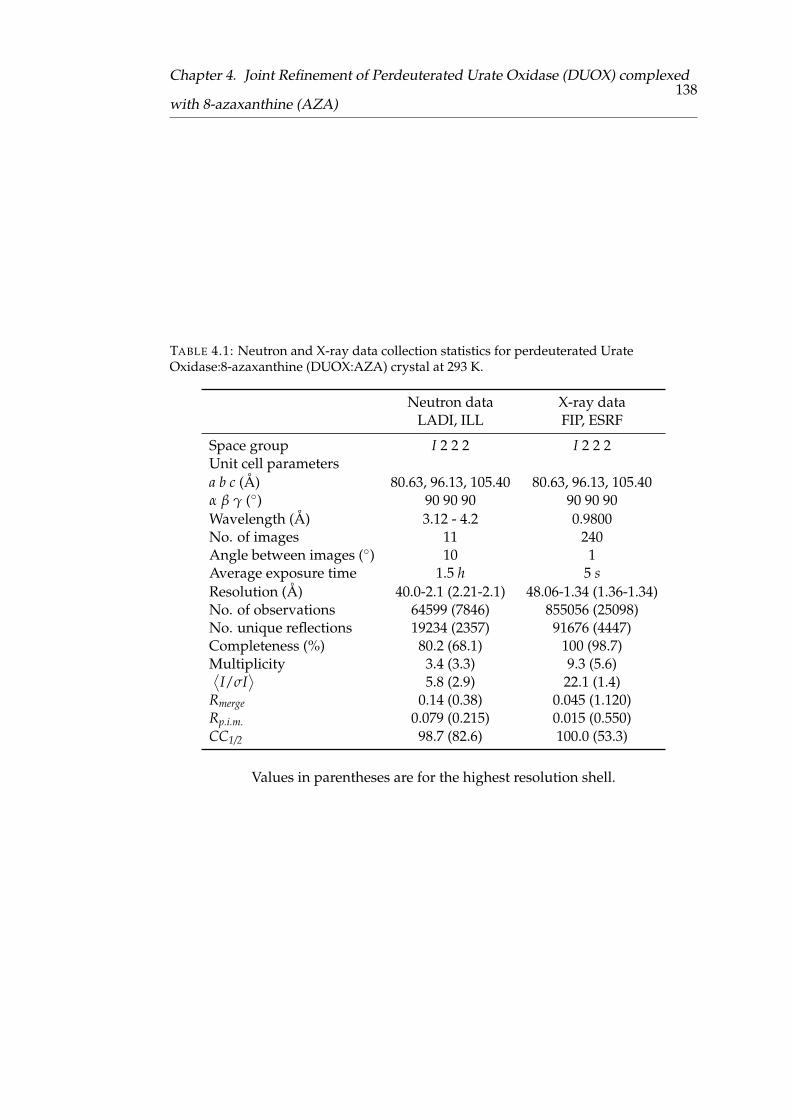
Chapter 4. Joint Refinement of Perdeuterated Urate Oxidase (DUOX) complexed
with 8-azaxanthine (AZA)138
TABLE 4.1: Neutron and X-ray data collection statistics for perdeuterated UrateOxidase:8-azaxanthine (DUOX:AZA) crystal at 293 K.
Neutron data X-ray dataLADI, ILL FIP, ESRF
Space group I 2 2 2 I 2 2 2Unit cell parametersa b c (Å) 80.63, 96.13, 105.40 80.63, 96.13, 105.40α β γ (◦) 90 90 90 90 90 90Wavelength (Å) 3.12 - 4.2 0.9800No. of images 11 240Angle between images (◦) 10 1Average exposure time 1.5 h 5 sResolution (Å) 40.0-2.1 (2.21-2.1) 48.06-1.34 (1.36-1.34)No. of observations 64599 (7846) 855056 (25098)No. unique reflections 19234 (2357) 91676 (4447)Completeness (%) 80.2 (68.1) 100 (98.7)Multiplicity 3.4 (3.3) 9.3 (5.6)⟨
I/σI⟩
5.8 (2.9) 22.1 (1.4)Rmerge 0.14 (0.38) 0.045 (1.120)Rp.i.m. 0.079 (0.215) 0.015 (0.550)CC1/2 98.7 (82.6) 100.0 (53.3)
Values in parentheses are for the highest resolution shell.

Chapter 4. Joint Refinement of Perdeuterated Urate Oxidase (DUOX) complexed
with 8-azaxanthine (AZA)139
4.5 Joint Neutron and X-ray Refinement
Structural refinement of DUOX:AZA was performed using PDB structure 1R51 as
a starting model. This model was modified in preparation for refinement by the
removal of all solvent molecules, ligand, and alternative conformers of residues
using PDB TOOLS [255]. In addition, all atoms were randomly shifted by 0.1 Å in
order to reduce any model bias. The N-terminus acylated serine residue was also
mutated to a serine residue.
Refinement of the model was conducted using the PHENIX suite and model build-
ing was carried out using the Coot program [185, 186]. Structure refinement and
model building were firstly conducted using the X-ray structure factors alone at
a resolution of 1.34 Å. Using this information, it was possible to locate the posi-
tions of heavier atoms in the protein (C, N, O, S). In the first step of the refinement
process a rigid body refinement was conducted, followed by multiple refinements
of the atomic coordinate positions, individual occupancies, and B-factors. In this
process the B-factor of all atoms were refined anisotropically. The AZA ligand was
modelled and refined using the geometry restraints generated using eLBOW [256].
In preparation for joint refinement using both the neutron data and X-ray data (pre-
viously used for this structure refinement), a single file containing X-ray and neu-
tron structure factors was generated using PHENIX.refine. A total of 10% and 5% of
reflections were assigned as Rfree flags from the X-ray and neutron datasets respec-
tively. Joint refinement identified the location of all atoms in the protein, the ligand
protonation state and the orientation of waters. As the protein was perdeuterated
and the crystal was grown under fully deuterated conditions, deuterium atoms
were added to all hydrogen atom positions on the protein using READYSET. The
ligand was deuterated accordingly, refined using deuterated geometry restraints
generated using eLBOW, and its occupancy refined as 1.0. The structure of the
deuterated AZA ligand is described in Figure 4.7.

Chapter 4. Joint Refinement of Perdeuterated Urate Oxidase (DUOX) complexed
with 8-azaxanthine (AZA)140
AZA monoanion
FIGURE 4.7: The protonation state of 8-azaxanthine (AZA) bound to perdeuterated UrateOxidase (DUOX), the same as was reported in previous neutron studies [80].
All solvent molecules fitted using the X-ray-only refinement were removed and
D2O molecules were added to positive peaks visible in both X-ray and neutron
mFo-DFc density maps with a value of σ > 3. These molecules were manually
orientated in Coot using the X-ray data to anchor the oxygen atom position and
the additional information from the neutron data to orientate the direction of the
deuterium atoms, respecting hydrogen bonding partners. In several of the D2O
molecules that were manually fitted to satisfy a sensible hydrogen bonding net-
work had their positions fixed during refinement. However, it was observed that
this resulted in a large increase in the RMSD of the bond angles, therefore, it was
decided that unrestrained refinement was more suitable for these D2O molecules,
leading to slightly different hydrogen bond geometry from expected values. Ad-
ditional water molecules that could be identified from the X-ray data only were
modelled as oxygen atoms, as there was no further information provided from the
neutron data. A total of 259 D2O molecules were fitted with an additional 87 mod-
elled as oxygen atoms only.
All side chains containing labile hydrogen positions were individually examined
and deuterated accordingly: deuterium atoms were added to positions showing
positive peaks in the mFo-DFc neutron density map σ > 3 and removed from neg-
ative peaks in the mFo-DFc neutron density map σ > -3. It was assumed that there

Chapter 4. Joint Refinement of Perdeuterated Urate Oxidase (DUOX) complexed
with 8-azaxanthine (AZA)141
was no contamination from hydrogen in the sample due to the perdeuteration of
the protein and the use of deuterated buffers.
The final structure had X-ray Rwork/Rfree values of 10.42% and 12.28% respectively,
and neutron Rwork/Rfree values of 21.75% and 24.19% respectively. Full refinement
statistics are detailed in Table 4.2.
TABLE 4.2: Model-refinement statistics for the joint refinement of DUOX:AZA.
Resolution(Å) X-ray 48.07 - 1.40
Resolution(Å) neutron 32.21 - 2.10
Number of reflections neutron 19083
Number of reflections X-ray 80589
Completeness (%) X-ray 99.95 (100.00)
Completeness (%) neutron 78.66 (67.00)
Rwork X-ray 0.1042
Rwork neutron 0.2175
Rfree X-ray 0.1128
Rfree neutron 0.2419
B factors (Å2)
Protein 25.24
Ligand 17.37
Solvent 48.28
R.M.S Deviations
Bond lengths (Å2) 0.013
Bond angles (Å) 1.390
No. of Waters (D2O, O) 259, 87

Chapter 4. Joint Refinement of Perdeuterated Urate Oxidase (DUOX) complexed
with 8-azaxanthine (AZA)142
4.6 Joint Refinement Results
Neutron and X-ray data were collected at RT on the same crystal at resolutions of
2.1 Å and 1.34 Å, respectively. The crystal space group was I 2 2 2, which is typically
seen in structures of UOX complexes deposited in the PDB [75].
4.6.1 UOX:AZA Bonding Interactions
In the ligand binding pocket, omit maps were calculated and a significant positive
peak in both the mFo-DFc electron density and neutron density maps was observed
in the active site. Omit maps were calculated in the absence of AZA using both the
X-ray data and X-ray/neutron data separately. The AZA molecule was modelled
with an occupancy of 1.0. The information on protonation states obtained from the
neutron data in the joint refinement was used to deuterate the ligand molecule. The
positive peak in the mFo-DFc neutron density map is shown in Figure 4.8.
FIGURE 4.8: Neutron omit map calculated in the absence of 8-azaxanthine (AZA),identifying a clear positive peak in the mFo-DFc neutron density map contoured at 3.0 σ(green). The 2mFo-DFc neutron density map is contoured at 1.5 σ (pink).
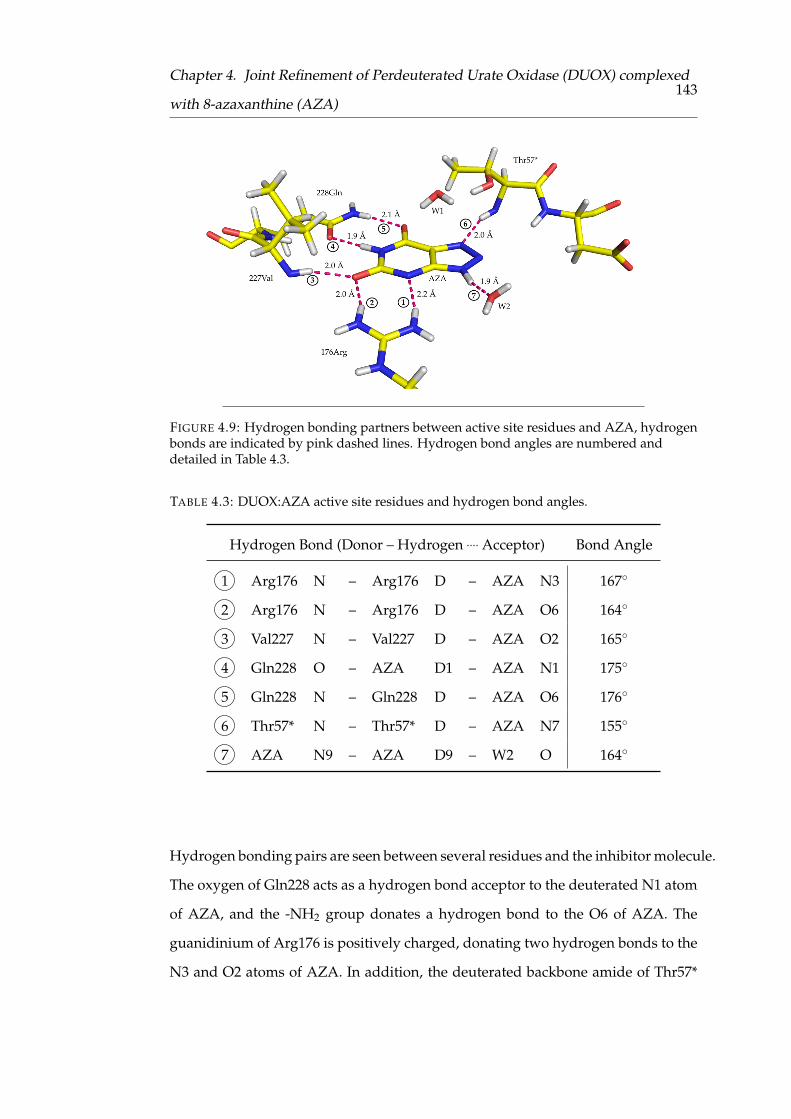
Chapter 4. Joint Refinement of Perdeuterated Urate Oxidase (DUOX) complexed
with 8-azaxanthine (AZA)143
FIGURE 4.9: Hydrogen bonding partners between active site residues and AZA, hydrogenbonds are indicated by pink dashed lines. Hydrogen bond angles are numbered anddetailed in Table 4.3.
TABLE 4.3: DUOX:AZA active site residues and hydrogen bond angles.
Hydrogen Bond (Donor – Hydrogen Acceptor) Bond Angle
1 Arg176 N – Arg176 D – AZA N3 167◦
2 Arg176 N – Arg176 D – AZA O6 164◦
3 Val227 N – Val227 D – AZA O2 165◦
4 Gln228 O – AZA D1 – AZA N1 175◦
5 Gln228 N – Gln228 D – AZA O6 176◦
6 Thr57* N – Thr57* D – AZA N7 155◦
7 AZA N9 – AZA D9 – W2 O 164◦
Hydrogen bonding pairs are seen between several residues and the inhibitor molecule.
The oxygen of Gln228 acts as a hydrogen bond acceptor to the deuterated N1 atom
of AZA, and the -NH2 group donates a hydrogen bond to the O6 of AZA. The
guanidinium of Arg176 is positively charged, donating two hydrogen bonds to the
N3 and O2 atoms of AZA. In addition, the deuterated backbone amide of Thr57*

Chapter 4. Joint Refinement of Perdeuterated Urate Oxidase (DUOX) complexed
with 8-azaxanthine (AZA)144
acts as a hydrogen bond donor to the N7 position of AZA. These three residues
are clearly identified as hydrogen bonding partners enabling the binding of the
inhibitor molecule. Similar to the anaerobic UOX:UA structure, W2 is shown to
hydrogen bond to the deuterated N9 position. The distance between the hydrogen
atom on N9 and the oxygen atom of the W2 solvent molecule is 1.9 Å. Bonding part-
ners and distances between AZA and UOX are shown in Figure 4.9 and hydrogen
bond angles are detailed in Table 4.3.
4.6.2 The Solvent Molecule, W1
The X-ray data implied that the atom present above the inhibitor molecule is most
likely an oxygen atom. The neutron data were used to determine the exact charge
of this molecule and its orientation. In an omit map modelling only the oxygen
atom, a large positive peak was observed in the mFo-DFc neutron density maps at
3.0 σ and spread across the W1 molecule, suggesting the presence of two deuterium
atoms. This is shown in Figure 4.10 (a). Individually calculating omit maps on both
D1 and D2 atoms, also presented strong evidence that the molecule was indeed a
D2O molecule, with localised positive peaks in the mFo-DFc neutron density maps
at 3.0 σ, at each side of the oxygen atom. These omit maps are also shown in Figure
4.10 (c) and (d). When deuterium atoms are added, the 2mFo-DFc neutron density
map shows a defined orientation of the W1 water molecule, as shown in Figure 4.10
(b). The W1 molecule adopts a perpendicular orientation above the C4-C5 bond of
AZA. The distance between oxygen atom of the W1 molecule and C5 atom of AZA
is 3.5 Å.

Chapter 4. Joint Refinement of Perdeuterated Urate Oxidase (DUOX) complexed
with 8-azaxanthine (AZA)145
(a) W1 - D1/D2 omit (b) W1 - D2O
(c) W1 - D1 omit (d) W1 - D2 omit
FIGURE 4.10: (a) Omit map in the absence of both deuterium atoms from the D2Omolecule, (b) Both deuterium atoms and oxygen atom of this D2O molecule modelled, (c)Omit map in the absence of the D1 atom, (d) Omit map in the absence of the D2 atom. The2mFo-DFc neutron density map is contoured at 2.0 σ (pink) and mFo-DFc neutron densitymap is contoured at 3.0 σ (green).
4.6.3 Catalytic Residues
The residues surrounding the active site are described in Figure 4.11, and Tables
4.4 and 4.5. The protonation states of the residues containing labile hydrogen sites
were determined by calculating omit maps.
The W1 solvent molecule is located above the AZA molecule in the active site,
forming hydrogen bonds with residues Thr57* and Asn254 [65, 68].
Upon closer examination of Asn254, and neighbouring residues, it was observed
that the residues Pro253-Asn254-Lys255 form an alternate conformation. Positive

Chapter 4. Joint Refinement of Perdeuterated Urate Oxidase (DUOX) complexed
with 8-azaxanthine (AZA)146
peaks in both the mFo-DFc electron density map and mFo-DFc neutron density map
at 3.0 σ was seen along the backbone of all three residues. This is shown in Figure
4.11 (a) and (b). This suggested that this chain of residues formed an alternate
conformation. The two conformations are described in Figure 4.11 (c) and (d). The
major conformation has an occupancy of 0.66 and is shown in yellow, and the minor
alternate conformation has an occupancy of 0.33 and is shown in pink (Figure 4.11
(c) and (d)).
Using the X-ray data alone, it was not possible to resolve the orientation of the
Asn254 polar sidechain, however, positive peaks in the mFo-DFc neutron density
map identified that the -ND2 points into the peroxohole, towards the W1 solvent
molecule, forming hydrogen bonds in both conformations. The distance between
the deuterium atom of Asn254 and the oxygen atom of the W1 solvent molecule in
the major conformation is 2.2 Å. In the minor conformation the hydrogen bonding
distance between the -ND2 group of Asn254 to the oxygen atom of W1 is 2.3 Å. The
hydrogen bonding distances between Asn254 and W1 are shown in Figure 4.12.
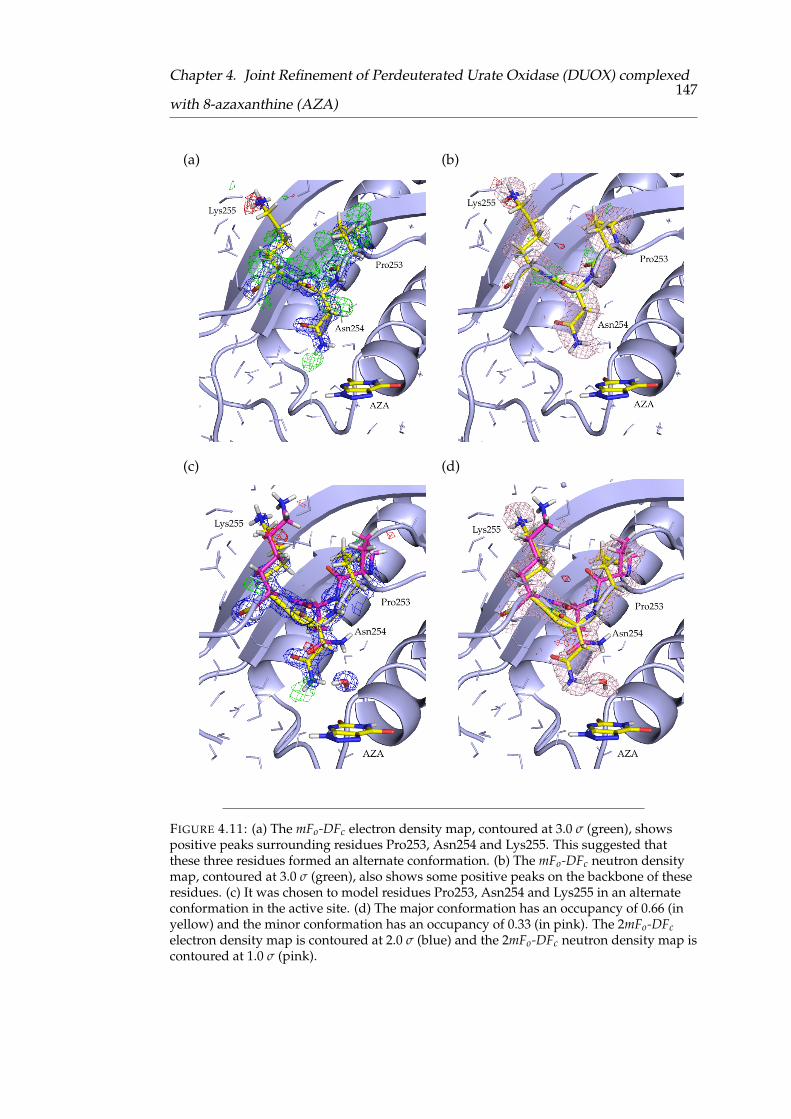
Chapter 4. Joint Refinement of Perdeuterated Urate Oxidase (DUOX) complexed
with 8-azaxanthine (AZA)147
(a) (b)
(c) (d)
FIGURE 4.11: (a) The mFo-DFc electron density map, contoured at 3.0 σ (green), showspositive peaks surrounding residues Pro253, Asn254 and Lys255. This suggested thatthese three residues formed an alternate conformation. (b) The mFo-DFc neutron densitymap, contoured at 3.0 σ (green), also shows some positive peaks on the backbone of theseresidues. (c) It was chosen to model residues Pro253, Asn254 and Lys255 in an alternateconformation in the active site. (d) The major conformation has an occupancy of 0.66 (inyellow) and the minor conformation has an occupancy of 0.33 (in pink). The 2mFo-DFcelectron density map is contoured at 2.0 σ (blue) and the 2mFo-DFc neutron density map iscontoured at 1.0 σ (pink).

Chapter 4. Joint Refinement of Perdeuterated Urate Oxidase (DUOX) complexed
with 8-azaxanthine (AZA)148
FIGURE 4.12: The -ND2 group of the Asn254 sidechain forms hydrogen bonds with theoxygen atom of W1 in both major and minor conformations. The hydrogen bonds areindicated by pink dashed lines.
Residue Thr57* has been found to play a role in the catalytic function of UOX [91],
and its hydroxyl sidechain is located next to the W1 solvent molecule/O2 binding
site. After calculating an omit map in the absence of the deuterium on the sidechain
hydroxyl group of Thr57*, no positive peak was seen in the mFo-DFc neutron den-
sity map at 3.0 σ. This is shown in Table 4.4 (a). The value of 3.0 σ was used as it
was the average level in which deuterium atoms could be seen on other threonine
residues in the protein. Reducing the contour level to 2.5 σ resulted in no signifi-
cant positive peaks in the mFo-DFc neutron density map next to the oxygen atom of
the Thr57* hydroxyl group, shown in Table 4.4 (b). However, a further reduction in
contour level to 2.0 σ showed a positive peak in the mFo-DFc neutron density map
attached to oxygen atom of the Thr57* hydroxyl group, as shown in Table 4.4 (c).
This is in addition to other positive peaks in the mFo-DFc neutron density map on
the carbon atoms of the sidechain, attributed to noise. Therefore, from our data we
are unable to provide convincing evidence that the Thr57* is deuterated. However,

Chapter 4. Joint Refinement of Perdeuterated Urate Oxidase (DUOX) complexed
with 8-azaxanthine (AZA)149
it is likely that Thr57* is indeed deuterated as threonine residues commonly have
neutral sidechains. At the resolution of this neutron data (2.1 Å), it has been pos-
sible to determine other important protonation states of the residues surrounding
the active site, therefore it can be suggested that the Thr57* sidechain is deuterated
and this deuterium atom is highly mobile. When the Thr57* is modelled with a
deuterium atom on the hydroxyl group and the occupancy refined, it shows a peak
in the 2mFo-DFc neutron density map at 1.5 σ and with an occupancy of 0.58. It was
chosen to model the deuterated hydroxyl group, with consideration to the most
likely chemical state. The final model is shown in Table 4.4 (d).
Residue Lys10* is also involved in UOX catalysis [91]. Calculating an omit map
of Lys10* in the absence of the three deuterium atoms on the sidechain nitrogen
atom, showed a positive peak in the mFo-DFc neutron density map at 3.0 σ, shown
in Table 4.4 (e). A positive peak located at the sidechain nitrogen atom was visible
at all three contour levels (3.0, 2.5, and 2.0 σ), shown in Table 4.4 (e), (f), and (g).
This provided evidence to suggest that this residue contains a charged ammonium
group -NH3+. Therefore, it was chosen to model three deuterium atoms on this
sidechain nitrogen atom: the final model is shown in Table 4.4 (h).

Chapter 4. Joint Refinement of Perdeuterated Urate Oxidase (DUOX) complexed
with 8-azaxanthine (AZA)150
Neu
tron
Om
itm
F o-D
F cM
apN
eutr
onO
mit
mF o
-DF c
Map
Neu
tron
Om
itm
F o-D
F cM
apN
eutr
on2m
F o-D
F cM
apan
dTe
stM
odel
(3.0
σ)
and
Test
Mod
el(2
.5σ
)an
dTe
stM
odel
(2.0
σ)
and
Fina
lMod
el(1
.0σ
)
(a)
Thr
57*
(b)
Thr5
7*(c
)Th
r57*
(d)
Thr5
7*
(e)
Lys1
0*(f
)Ly
s10*
(g)
Lys1
0*(h
)Ly
s10*
TAB
LE
4.4:
Om
itm
aps
and
final
mod
els
for
acti
vesi
tere
sidu
esTh
r57*
and
Lys1
0*.O
mit
map
sin
volv
edth
ere
mov
alof
-OD
from
Thr5
7*,(
a)-(
c),
and
-ND
3+in
Lys1
0*,(
e)-(
g).T
hepr
oton
atio
nst
ates
ofth
ese
resi
dues
wer
ein
vest
igat
edby
alte
ring
the
σle
velf
rom
2σ
to3
σin
the
mF o
-DF c
neut
ron
dens
ity
map
(gre
en).
The
prot
onat
ion
stat
esin
the
final
mod
els
for
Thr5
7*an
dLy
s10*
are
show
nin
(d)a
nd(h
),re
spec
tive
ly.T
he2m
F o-D
F cne
utro
nde
nsit
ym
apis
cont
oure
dat
1.0
σ(p
ink)
.
Chapter 4. Joint Refinement of Perdeuterated Urate Oxidase (DUOX) complexed
with 8-azaxanthine (AZA)151
Residue His256 also lies in the proximity of the active site and is proposed to play a
role in catalysis [77, 91]. When a deuterium atom bonded to His256 nearest Lys10*,
Nε2 was modelled, no peak was observed in the mFo-DFc neutron density map at
3.0 σ, shown in Table 4.5 (a). However, changing the contour level 2.5 σ resulted in
a negative peak in the mFo-DFc neutron density map at the deuterium atom bonded
to Nε2, described in Table 4.5 (b). This negative peak was also seen at contour level
2.0 σ, in addition to the appearance of positive peaks on the carbon atoms of the
histidine sidechain, shown in Table 4.5 (c). However, considering the negative peak
seen at 2.5 σ, and the proximity to the positively charged Lys10* -ND3+ group, it
was chosen to model this histidine residue as neutral. The final model is described
in Table 4.5 (d).
An additional observation was that the deuterium atom modelled at the Cδ2 posi-
tion of His256 showed no density in the 2mFo-DFc neutron density map of the final
model, shown in Table 4.5 (d). It is expected that this deuterium atom would be
seen in the 2mFo-DFc neutron density map as the protein is perdeuterated and the
high level of deuterium incorporation has previously been determined (Chapter 2,
Section 3.4) and found to be > 99%. Therefore, this lack of density is unlikely to
come from hydrogen incorporation in the sample, however, may be explained by
the level of completeness of the neutron data (∼ 80%).

Chapter 4. Joint Refinement of Perdeuterated Urate Oxidase (DUOX) complexed
with 8-azaxanthine (AZA)152
Neutron mFo-DFc Map Neutron mFo-DFc Map
and Test Model (3.0 σ) and Test Model (2.5 σ)
(a) (b)
His256 His256
Neutron mFo-DFc Map Neutron 2mFo-DFc Map
and Test Model (2.0 σ) and Final Model (1.0 σ)
(c) (d)
His256 His256
TABLE 4.5: A model containing a positively charged His256 shows no peak in themFo-DFc neutron density map at 3.0 σ (green). However, there is a negative peak in themFo-DFc neutron density map on the deuterium atom attached to -Nε2. This peak, shownat 2.5 σ and 2.0 σ (red), indicates an incorrectly modelled atom. Positive peaks in themFo-DFc neutron density map were also observed (green). The final model of a neutralHis256 is shown in (d). The 2mFo-DFc neutron density map is contoured at 1.0 σ (pink).

Chapter 4. Joint Refinement of Perdeuterated Urate Oxidase (DUOX) complexed
with 8-azaxanthine (AZA)153
Using the information from the omit maps calculated for each residue proposed
to play a role in catalytic activity, we present the following hydrogen bonding net-
work. Residue Thr57* is deuterated at the hydroxyl position -OD. This donates a
hydrogen bond to the oxygen atom of the W1 solvent molecule in the active site
with a hydrogen bond distance of 2.1 Å. Lys10* neighbours Thr57* and has a posi-
tively charged sidechain: -ND3+. This charged nitrogen atom donates a hydrogen
bond to the lone pair of the hydroxyl oxygen atom of Thr57* at a distance of 2.0
Å. Furthermore, Lys10* donates a second hydrogen bond to the neutral His256:
the unprotonated nitrogen atom of His256 acts as a hydrogen bond acceptor to the
positively charged group of Lys10*, at a distance of 2.2 Å. This hydrogen bonding
network is shown in Figure 4.13 with associated hydrogen bond angles detailed in
Table 4.6. The overall structure of the protonation states in the active site and the
2mFo-DFc neutron density maps are shown in Figure 4.14.
FIGURE 4.13: Hydrogen bonding network of active site residues. The relationshipbetween proposed catalytic residues Thr57*:Lys10*:His256 are shown in relation to the W1molecule. The distance between the major conformation of Asn254 and the W1 moleculeis also shown. Hydrogen bonding distances are shown by pink dashed lines.

Chapter 4. Joint Refinement of Perdeuterated Urate Oxidase (DUOX) complexed
with 8-azaxanthine (AZA)154
TABLE 4.6: DUOX:AZA active site residues and hydrogen bond angles (Donor –Hydrogen Acceptor).
Hydrogen Bond (Donor – Hydrogen Acceptor) Bond Angle
Lys10* N – Lys10* D His256 N 145◦
Lys10* N – Lys10* D Thr57* D 167◦
Thr57* O – Thr57* D W1 O 126◦
Asn254 N – Asn254 D W1 O 153◦
FIGURE 4.14: The determined protonation states in the active site of DUOX:AZA. The2mFo-DFc neutron density map is contoured at 1.0 σ (pink).
4.6.4 Active Site Water Network
As previously described, catalytically important solvent molecule W2 is hydrogen
bonded to the deuterated N9 atom of AZA. A chain of water molecules is seen to
provide a link between Lys10* and W2. One deuterium atom of -NH3+ on Lys10*
hydrogen bonds to solvent molecule W102 at a distance of 2.1 Å. The W102 has
an occupancy of 0.83 and hydrogen bonds to W64, occupancy 1.0, with a distance

Chapter 4. Joint Refinement of Perdeuterated Urate Oxidase (DUOX) complexed
with 8-azaxanthine (AZA)155
of 2.2 Å. It is solvent molecule W64 that is shown to hydrogen bond to the W2
molecule with a distance of 2.0 Å. This bonding network is described in Figure 4.15
and associated hydrogen bond angles are detailed in Table 4.7.
FIGURE 4.15: Hydrogen bonding network of D2O molecules surrounding the active site.A clear network of three D2O molecules link the Lys10* residue and the deuterated N9atom of the bound 8-azaxanthine (AZA) ligand. Dashed pink lines show hydrogenbonding distances. The 2mFo-DFc neutron density map is contoured at 1.0 σ (pink).
TABLE 4.7: Hydrogen bond angles for the W2 Lys10* water network (Donor –Hydrogen Acceptor).
Hydrogen Bond (Donor – Hydrogen Acceptor) Bond Angle
AZA N9 – AZA D9 W2 O 164◦
W2 O – W2 D1 W64 O 151◦
W64 O – W64 D1 W102 O 112◦
Lys10* N – Lys10* D W102 O 166◦
An additional water network is seen connecting W2 and His256, through W43.
One deuterium atom of W2 forms a hydrogen bond with the oxygen atom of W43
with a distance of 2.5 Å. In addition, the oxygen atom also forms a hydrogen bond

Chapter 4. Joint Refinement of Perdeuterated Urate Oxidase (DUOX) complexed
with 8-azaxanthine (AZA)156
with NεD2 of His256 at a distance of 2.1 Å. A pictorial description of this alterna-
tive hydrogen bonding network involving catalytically important W2 and His256
is shown in Figure 4.16 with details of hydrogen bond angles in Table 4.8.
FIGURE 4.16: Hydrogen bonding network of D2O molecules surrounding the active site.In addition to the network connecting Lys10* and the deuterated N9 atom of8-azaxanthine (AZA), another network of D2O molecules is seen to connect His256 andthe deuterated N9 atom of AZA. Dashed pink lines show hydrogen bonding distances.The 2mFo-DFc neutron density map is contoured at 1.0 σ (pink).
TABLE 4.8: Hydrogen bond angles for the W2 His256 water network (Donor –Hydrogen Acceptor).
Hydrogen Bond (Donor – Hydrogen Acceptor) Bond Angle
AZA N9 – AZA D9 W2 O 165◦
W2 O – W2 D2 W43 O 151◦
His256 N – His256 D W43 O 112◦
Chapter 4. Joint Refinement of Perdeuterated Urate Oxidase (DUOX) complexed
with 8-azaxanthine (AZA)157
4.7 Discussion
Examination of the neutron structure of perdeuterated Urate Oxidase (DUOX) in
complex with 8-azaxanthine (AZA) has allowed the identification of the protona-
tion states of the residues in the active site when the AZA ligand is bound. The
UOX:UA complex has previously been found to possess a solvent molecule termed
W1 in the active site, as identified by X-ray experiments [81]. This W1 solvent
molecule is seen to occupy the cavity above the ligand binding site, peroxohole, be-
fore its expulsion upon the binding of O2 [65]. However, from X-ray data alone, the
charge of the W1 solvent molecule and its interactions with surrounding residues
remains elusive. Whether the W1 solvent molecule exists as H2O, H3O+, or OH- has
not been seen using other techniques. The use of perdeuteration, and deuterated
buffers, remove the problems associated with hydrogenation such as the negative
coherent scattering length and large incoherent cross section. Therefore, it has been
possible to determine the charged state of the W1 molecule and visualise key water
networks surrounding the AZA inhibitor molecule.
The ligand binding position has been identified from previous X-ray structures and
is the same for both the natural substrate and other inhibitor molecules [68, 76, 78,
80]. Our data have confirmed all bonding interactions between AZA and active site
residues and that AZA binds as an N3 monoanion, described in previous studies
[76, 77, 80, 82, 83].
The X-ray and neutron data were able to confirm the presence of the W1 molecule
in the peroxohole located above the active site, as seen in other X-ray structures
[65, 81, 82]. In our structure, the X-ray data show that the distance between the
oxygen atom of the W1 molecule and C5 of AZA is 3.5 Å. This distance is slightly
longer than previously reported values in X-ray structures of UOX:AZA where the
distance is 3.3 Å [68] and in UOX:UA anaerobic complexes distances were shown
as 3.26 Å [82] and 3.19 Å [81], respectively. This may be due to the difference in

Chapter 4. Joint Refinement of Perdeuterated Urate Oxidase (DUOX) complexed
with 8-azaxanthine (AZA)158
temperature of data collection: 100K for the previously reported structures and
room temperature for the structures reported in this thesis.
The residues Thr57* and Asn254 both form hydrogen bonds with the W1 molecule,
holding it in position above the ligand or substrate molecule [68]. Our data strongly
suggests that residues 253-255 form alternate conformations. The Asn254 involved
in bonding adopts two visible positions; in both positions the amide -ND2 group of
Asn254 hydrogen bond to the oxygen atom of the W1 solvent molecule. The major
and minor conformations have hydrogen bonding distances of 2.2 Å and 2.3 Å,
respectively. With this information we suggest that there is an enhanced mobility
of this region compared to that observed in previous cryo-cooled structures.
Catalytically important Thr57* forms a hydrogen bond with the oxygen atom of the
W1 molecule. At the average threshold used to visualise the presence of deuterium
atoms of other threonine sidechains (3.0 σ in the mFo-DFc neutron density map),
there was no evidence for a deuterium atom on the hydroxyl group of Thr57*. By
altering the contour level to 2 σ in the mFo-DFc neutron density map, a positive
peak appears next to the oxygen atom of the Thr57* hydroxyl group. However, at
this threshold, additional positive peaks are observed on the carbon atoms of the
Thr57* sidechain. Therefore, the positive peak seen at the oxygen atom cannot be
considered as unambiguous evidence of a deuterium atom and, instead, may be
considered as noise. However, chemical knowledge suggests that a unprotonated
Thr57* sidechain is extremely unlikely. With this consideration, it was chosen to
model the Thr57* sidechain with a deuterium atom, forming a hydrogen bond with
the oxygen atom of the W1 solvent molecule at a distance of 2.1 Å.
It was determined that the sidechain of Lys10* contained a positively charged -
ND3+. An omit map showed a positive peak in the neutron mFo-DFc neutron den-
sity map surrounding the sidechain nitrogen atom. Modelling three deuterium
atoms showed agreement in the 2mFo-DFc neutron density map. Therefore, we

Chapter 4. Joint Refinement of Perdeuterated Urate Oxidase (DUOX) complexed
with 8-azaxanthine (AZA)159
propose the positively charged Lys10*-ND3+ group donates a hydrogen bond to
the lone pair of Thr57* with a bonding distance of 2.0 Å.
Neighbouring His256 was found to be in a neutral state. The charge of His256
was investigated by modelling both a neutral and positive residue. A negative
peak in the mFo-DFc neutron density map was seen at the deuterium atom attached
to the Nε2 atom, located at bonding distance to Lys10*. From this information,
also considering the positively charged Lys10*, it was chosen to model His156 as
neutral.
We compared the protonation states of the active site residues in our structure
to those in previously published neutron structures [80]. These studies identi-
fied the protonation states of active site residues with hydrogenated UOX (HUOX)
in complex with inhibitor AZA, HUOX:AZA, and natural substrate UA, forming
HUOX:8-HX. Both complexes were inhibited by the presence of a chloride atom,
occupying the binding site of the W1 solvent molecule/O2. Interestingly, the pro-
tonation states of the catalytic triad Thr57*-Lys10*-His256 in HUOX:AZA differed
from those of the HUOX:8-HX complex. This is described in more detail in sec-
tion 4.1, Figure 4.3. However, the study suggested that it is likely that the triad in
HUOX:AZA exists in two conformations: the one presented in the published model
containing a Lys10* -ND2 accepting a hydrogen bond from Thr57*, and a conforma-
tion identical to that seen in HUOX:8-HX where Lys10* is positively charged -ND3+
and the deuterated Thr57* hydroxyl group points towards the Cl- in the active site.
It states that due to the limited resolution of the neutron data, they were unable to
refine both conformations. In our structure DUOX:AZA, we have found that the
protonation states of the catalytic triad are different to those in the HUOX:AZA
complex. In fact, the protonation states of Thr57*-Lys10*-His256 that we have de-
termined are identical to those seen in HUOX:8-HX [80].
An extensive network of conserved water molecules surrounds the active site in

Chapter 4. Joint Refinement of Perdeuterated Urate Oxidase (DUOX) complexed
with 8-azaxanthine (AZA)160
many UOX complexes, as identified by X-ray studies [68, 76, 77, 81, 83]. In par-
ticular, the W1 and W2 solvent molecules have been proposed to be ideal candi-
dates as acid-base system terminators [78]. However, previous studies have been
unable to identify the relationship between this water network, including the W1
solvent molecule, and surrounding active site residues [78, 80, 81]. The W2 sol-
vent molecule positioned close to the deuterated N9 atom of AZA is shown to be
catalytically relevant as its absence in MUA complexes inhibits the reaction [81,
106, 257]. These positions are shown in both other UOX:AZA structures [80] and
also UOX:UA anaerobic structures [81]. This forms an ordered hydrogen bonding
network from the active site along Thr57*-Lys10*-His256, previously suggested to
have relationship in catalytic activity [77].
4.8 Conclusion
DUOX in complex with its inhibitor AZA has been crystallised and neutron data
collected to a resolution of 2.1 Å. In addition, X-ray data was collected on the same
crystal to a resolution of 1.34 Å. The structure of this complex has been solved using
the method of joint refinement. By employing the technique of neutron crystallog-
raphy, coupled with perdeuteration, hydrogen positions, and hydrogen bonding
networks have been identified.
In this DUOX:AZA complex, it has been possible to determine the charge of the W1
solvent molecule. Our data shows that the W1 solvent molecule exists as an D2O
in the AZA-bound active site, and not as D3O+ or OD-. It is held in the peroxohole
by hydrogen bonding to residues Thr57* and Asn254. The Asn254 residue forms a
hydrogen bond to the oxygen atom of the W1 molecule in both its conformations
in this model.

Chapter 4. Joint Refinement of Perdeuterated Urate Oxidase (DUOX) complexed
with 8-azaxanthine (AZA)161
The protonation states of residues surrounding the active site have also been deter-
mined. From our data, we present the Thr57*-Lys10*-His256 ’catalytic triad’ with
the W1 molecule in situ. Catalytically relevant Thr57* is shown to donate a hy-
drogen bond to the W1 molecule. Additionally, it accepts a hydrogen bond from
Lys10* which contains a positively charged sidechain -NH3+. Neighbouring His256
is neutral and positioned to accept a hydrogen bond from Lys10*. The finalised pro-
tonation states of this bonding network is shown in Figure 4.17. Conserved water
molecules were also investigated and hydrogen bonding networks established.
FIGURE 4.17: The perdeuterated Urate Oxidase:8-azaxanthine (DUOX:AZA) active site.Schematic of the DUOX:AZA active site and the protonation states of the catalytic triad:Thr57*-Lys10*-His256. It has been determined that the residues Thr57*, Lys10* and His256form a hydrogen bonding network, linking to the W1 solvent molecule held in the activesite in this DUOX:AZA complex.
The absence of chlorine as an inhibitor allows the preservation of the W1 solvent

Chapter 4. Joint Refinement of Perdeuterated Urate Oxidase (DUOX) complexed
with 8-azaxanthine (AZA)162
molecule. Building on previous neutron studies, we have provided additional in-
formation on UOX in complex with AZA, collecting a dataset of higher complete-
ness and neutron density maps with no cancellation effects observed from hydro-
gen contamination.

163
Chapter 5
Neutron Refinement of
Perdeuterated Urate Oxidase
(DUOX) complexed with 9-methyl
uric acid (9-MUA)
Abstract
This chapter describes a structural study of perdeuterated Urate Oxidase (DUOX)
in complex with the structural analogue of uric acid (UA), 9-methyl uric acid (9-
MUA). In aerobic conditions 9-MUA reacts with O2 and forms the 9-methyl-5-
peroxyisourate intermediate (5-PMUA). This research investigated the protonation
states of active site residues in the DUOX:5-PMUA complex and the structure of the
peroxide intermediate. The neutron structure of this complex is important for an
understanding of which active site residues are involved in the peroxide formation
and stabilisation.
9-MUA has a high structural similarity to the natural substrate of UOX, UA. The

Chapter 5. Neutron Refinement of Perdeuterated Urate Oxidase (DUOX)
complexed with 9-methyl uric acid (9-MUA)164
substitution of a hydrogen atom with a methyl group at the N9 atom position of
the purine ring enables the trapping of the peroxide intermediate by preventing
the expulsion of the H2O2 by-product. Neutron and X-ray datasets were collected
on the same crystal at 298 K. X-ray refinement, joint refinement, and neutron re-
finement were performed using these datasets. Experimental details and results
are described within this chapter. Further analysis of the implications of the results
presented are also discussed in the context of UOX reactivity.
5.1 Introduction
The structure of reactive intermediates in the UOX reaction pathway have been
widely investigated using a variety of techniques, as described in detail in Chapter
1 of this thesis [80, 81, 91, 104, 108, 115, 122, 123]. One particular area of interest was
the proposal of two different UOX catalytic pathways involving the reaction of UA
and O2. The presence of a peroxide intermediate, 5-(hydro)peroxyisourate (5-PIU),
had been suggested by Tipton and colleagues [106, 113, 115], generated from the
radical recombination reaction of the UA radical and a superoxide anion [81, 112].
In contrast, Altarsha et al. suggested the reaction mechanism was peroxide inde-
pendent, instead a dehydrourate intermediate (DHU) would form directly from the
N3N7 reactive dianion [108]. A mechanism, based on the results of neutron studies
by Oksanen et al., also suggested a peroxide-independent pathway, where the O2
molecule accepts two electrons: one from the UA radical anion and one from an
unidentified intermediate acceptor contained within the protein [80].
Bui et al used X-ray crystallography, in conjunction with in-crystallo Raman spec-
troscopy and quantum mechanics/molecular mechanics (QM/MM) calculations,
to unambiguously determine that the reaction proceeded via a peroxide interme-
diate [81]. In this study, two crystal structures were presented: UOX in complex
with 9-MUA, and UOX in complex with the natural substrate, UA. For clarity in

Chapter 5. Neutron Refinement of Perdeuterated Urate Oxidase (DUOX)
complexed with 9-methyl uric acid (9-MUA)165
the following discussion, these structures will be referred to as containing hydro-
genated UOX (HUOX). Bui et al. reasoned that the replacement of a labile hydrogen
atom with a methyl group at position N9 in 9-MUA could stabilise any peroxide
intermediate: it had been proposed that this hydrogen atom is abstracted during
the expulsion of H2O2 [81]. A structural comparison of 9-MUA and UA is shown
in Figure 5.1.
(a) (b)
FIGURE 5.1: Natural substrate uric acid (UA) (a) is shown in comparison to structuralanalogue 9-methyl uric acid (9-MUA) (b). The 9-MUA molecule is structurally different inthe N9 position where the labile hydrogen is replaced with a methyl group -CH3, this ishighlighted in green.
X-ray data was collected on a HUOX crystal complexed with 9-MUA, after ex-
posure to air/O2. The resultant electron density maps clearly showed that the
9-MUA ligand converts to the 9-methyl-5-(hydro)peroxyisourate intermediate (5-
PMUA) as shown in Figure 5.2 [81]. The C5 atom of 9-MUA forms a bond with
an oxygen atom of O2 (Op1). QM/MM calculations suggested that the experi-
mentally determined distance of the C5-Op1 of the 5-PMUA bond was consistent
with that of a hydroperoxide monoanion [81]. An additional structure consisting of
HUOX in complex with UA also showed the presence of a peroxide intermediate,

Chapter 5. Neutron Refinement of Perdeuterated Urate Oxidase (DUOX)
complexed with 9-methyl uric acid (9-MUA)166
5-(hydro)peroxyisourate (5-PIU), thus confirming that the UOX catalytic pathway
proceeded via a peroxide-dependant mechanism [81].
FIGURE 5.2: The 9-methyl-5-(hydro)peroxyisourate (5-PMUA) ligand bound tohydrogenated Urate Oxidase (HUOX) as determined by X-ray crystallographic studies.The C5 atom bonds to Op1 atom of O2. 2mFo-DFc electron density map is contoured at 1.0σ in brown. Figure adapted from [81] c© 2014 The Authors. Published by Wiley-VCHVerlag GmbH & Co. KGaA.
By comparing the structures of HUOX:5-PMUA and HUOX:5-PIU, differences in
the water network surrounding the active site were observed. The substitution of a
-CH3 group at position N9, disrupts the hydrogen bond between a hydrogen atom
on UA and the oxygen atom of the solvent molecule, W2. This solvent molecule
is central to a hydrogen bonding network of water molecules in the active site and
has been characterised as an end point of a low energy proton transfer pathway,
also involving solvent molecule W1, which is proposed to be involved in the UOX
catalytic activity [82, 83].
Bui et al. also found that the C5-Op1 bond was susceptible to radiolysis at low
X-ray doses [81]. It was proposed that a one-electron reduction, induced by X-
rays, caused the peroxide bond rupture and is supported by additional QM/MM
calculations [81]. Furthermore, the C5-Op1 bond of 5-PMUA was found to be more

Chapter 5. Neutron Refinement of Perdeuterated Urate Oxidase (DUOX)
complexed with 9-methyl uric acid (9-MUA)167
sensitive to radiolysis than in 5-PIU: it was suggested that this may be due to the
inductive effect of the methyl group [81].
A peroxide intermediate has also been proposed for a group of Flavin-dependent
monooxygenases [14, 116]. Flavin cofactors can exist in either a one- or two- elec-
tron reduced state, meaning that these molecules can both accept and donate elec-
trons. In reactions with O2, a reduced Flavin moiety can deliver one electron to
the O2 molecule, resulting in the generation of a radical pair: a Flavin semiquinone
and superoxide [14, 15]. These radicals can then undergo a ’spin allowed’ rad-
ical recombination reaction to form a C4a-(hydro)peroxyflavin intermediate [14,
15]. This C4a-(hydro)peroxyflavin intermediate shows structural similarities to the
5-PIU intermediate observed in UOX catalysis. More details on the reactions of
Flavin enzymes are given in Chapter 1 of this thesis.
Interestingly, a peroxide-dependent mechanism has also been proposed for cofactor-
independent dioxygenases [97, 119]. The substrates are thought to transfer a single
electron to O2 following an initial deprotonation, generating a radical pair that can
collapse to a peroxide species after a radical recombination. This has been sug-
gested for dioxygenases of different functions: HOD, QOD, and DpgC [97, 119].
These intermediates have not been structurally determined, however, this system
of deprotonation followed by peroxide formation is similar to that proposed for
UOX [112].
In the case of UOX, how the peroxide intermediate observed by Bui et al. is formed
and stabilised is still not understood [81]. The role that catalytically relevant residues
play in this process has also not yet been determined. Investigation into the proto-
nation states of these residues, particularly the catalytic triad Thr57*-Lys10*-His256,
may yield answers that can further our understanding of how this mechanism pro-
ceeds and provide additional information on cofactor-free catalysis.
This chapter presents the crystallisation, neutron and X-ray data collection, and

Chapter 5. Neutron Refinement of Perdeuterated Urate Oxidase (DUOX)
complexed with 9-methyl uric acid (9-MUA)168
subsequent structure solution of DUOX in complex with structural analogue 9-
MUA, forming 5-PMUA intermediate. This work builds on the X-ray studies by
Bui et al. that were able to unambiguously determine the existence of a peroxide-
intermediate [81]. The examination of the protonation states of important residues
in the active site may further the understanding of how this peroxide species is pro-
duced and stabilised. From this information it may be possible to try and identify
the role of UOX in this catalytic step.
5.2 Crystallisation of DUOX:5-PMUA
The expression and purification of DUOX is described in Chapter 3. In addition, the
process of exchanging the protein into fully deuterated conditions is also described
in Chapter 3, Section 3.3. The protein was concentrated to > 20 mg/ml in fully
deuterated conditions, 50 mM Tris-acetate, 30 mM NaAc at pD 7.59.
The batch crystallisation method was used for growing crystals of DUOX:5-PMUA.
Crystallisation conditions were optimised and found that a mixed solution, con-
taining both hydrogenated and deuterated buffers, produced higher quality crys-
tals. Mixtures measuring a total of 30 µL, consisting of 20 µL protein solution
(deuterated) and 10 µL crystallisation buffer (hydrogenated) were prepared. The
hydrogenated crystallisation buffer consisted of 50 mM Tris-acetate, 8% PEG 8000,
adjusted to pH 8.0 using 20 % acetic acid. DUOX:5-PMUA crystals were produced
by co-crystallisation. 9-MUA was added to the crystallisation buffer to a concen-
tration of 11mM and the solution was agitated overnight until fully dissolved.
Sitting Drop plates (Hampton Research) were used in the crystallisation set-up,
using the concave sitting drop post for the mixture and leaving the reservoir empty,
before sealing with crystallisation tape. The crystallisation set-up has previously
been shown in Chapter 4, Figure 4.4. The mixtures were left to crystallise at 18 ◦C.

Chapter 5. Neutron Refinement of Perdeuterated Urate Oxidase (DUOX)
complexed with 9-methyl uric acid (9-MUA)169
After ∼ 5 days nucleation was observed, with crystals reaching full size after ∼
10 days. Upon reaching full size ( > 1.0 mm3) crystals were immediately mounted
into a quartz capillary with an internal diameter of 3 mm in preparation for data
collection.
The crystal was added to the halfway point of the capillary with deuterated mother
liquor present at the bottom of the capillary. After mounting the crystal into the
capillary, a neutron dataset was collected. It was observed that although the crys-
tallisation conditions had an excess of deuterium, there was a level of hydrogen
contamination still present in the crystal. Therefore, a further buffer exchange into
100% deuterated conditions was required.
FIGURE 5.3: Method used for buffer exchanging the hydrogens incorporated into thecrystal to deuterium through systematic vapour diffusion. The buffer plug was replacedafter ∼ 1 hour diffusion times with fresh deuterated buffer, before removal for datacollection.
Buffer exchange into 100% deuterated conditions was conducted within the quartz
capillary in which the crystal was mounted. Approximately 5 µ L of deuterated
crystallisation buffer, 50 mM Tris-acetate 8% PEG 8000, pH 7.59 with 11 mM 9-
MUA, was added to the top of the capillary closest to the wax sealant. This sample
was left to buffer exchange for∼ 1 hour before replacement with fresh 100% deuter-
ated buffer. This process was repeated 3 times as shown in Figure 5.3. Compari-
son of the data collected before and after the buffer exchange via vapour diffusion
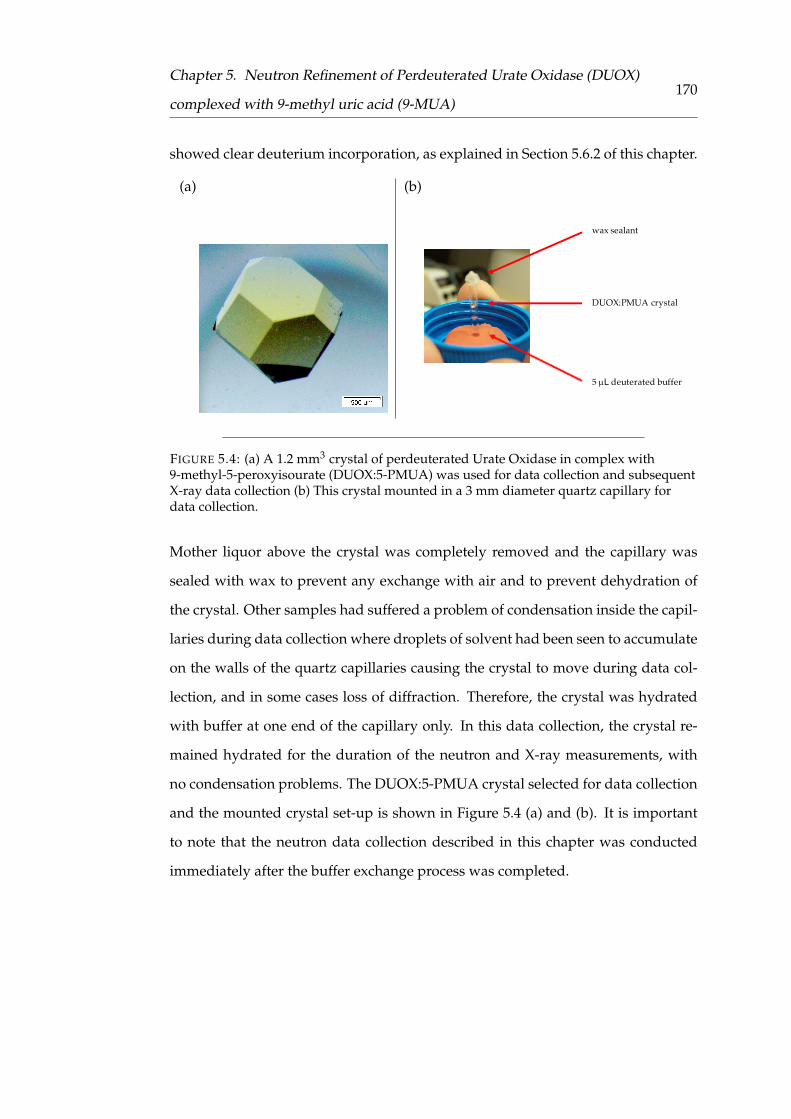
Chapter 5. Neutron Refinement of Perdeuterated Urate Oxidase (DUOX)
complexed with 9-methyl uric acid (9-MUA)170
showed clear deuterium incorporation, as explained in Section 5.6.2 of this chapter.
(a) (b)
wax sealant
DUOX:PMUA crystal
5 µL deuterated buffer
FIGURE 5.4: (a) A 1.2 mm3 crystal of perdeuterated Urate Oxidase in complex with9-methyl-5-peroxyisourate (DUOX:5-PMUA) was used for data collection and subsequentX-ray data collection (b) This crystal mounted in a 3 mm diameter quartz capillary fordata collection.
Mother liquor above the crystal was completely removed and the capillary was
sealed with wax to prevent any exchange with air and to prevent dehydration of
the crystal. Other samples had suffered a problem of condensation inside the capil-
laries during data collection where droplets of solvent had been seen to accumulate
on the walls of the quartz capillaries causing the crystal to move during data col-
lection, and in some cases loss of diffraction. Therefore, the crystal was hydrated
with buffer at one end of the capillary only. In this data collection, the crystal re-
mained hydrated for the duration of the neutron and X-ray measurements, with
no condensation problems. The DUOX:5-PMUA crystal selected for data collection
and the mounted crystal set-up is shown in Figure 5.4 (a) and (b). It is important
to note that the neutron data collection described in this chapter was conducted
immediately after the buffer exchange process was completed.
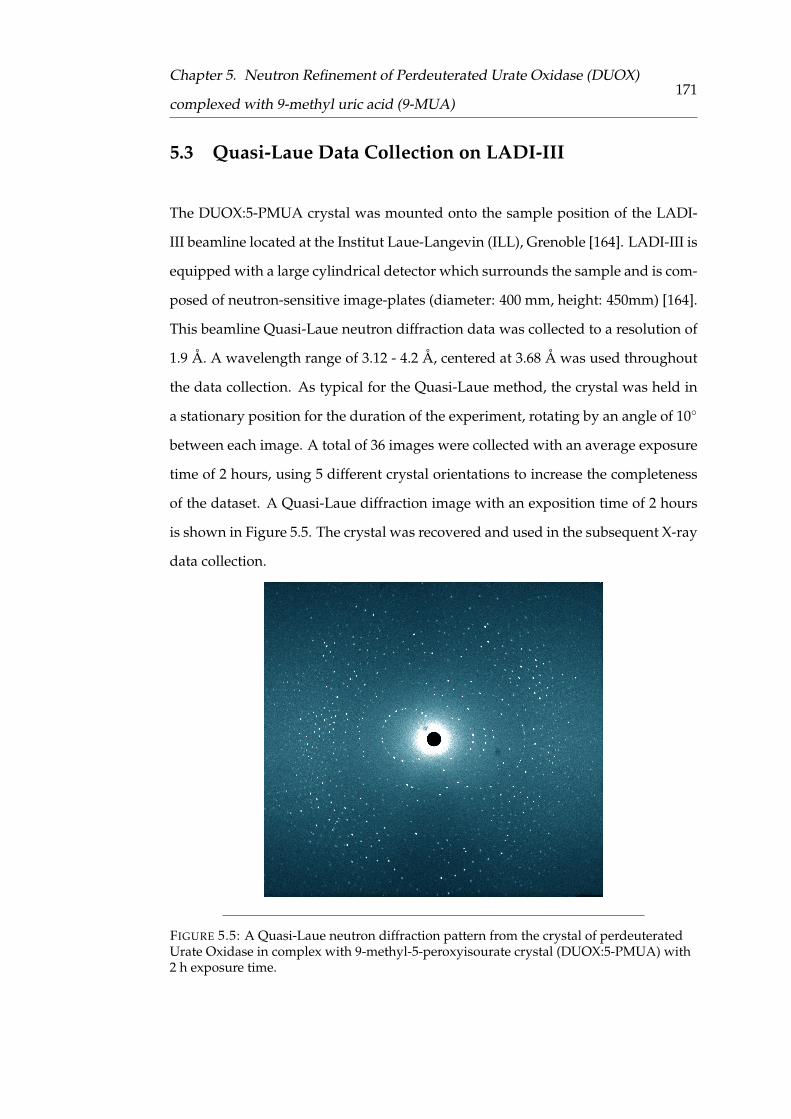
Chapter 5. Neutron Refinement of Perdeuterated Urate Oxidase (DUOX)
complexed with 9-methyl uric acid (9-MUA)171
5.3 Quasi-Laue Data Collection on LADI-III
The DUOX:5-PMUA crystal was mounted onto the sample position of the LADI-
III beamline located at the Institut Laue-Langevin (ILL), Grenoble [164]. LADI-III is
equipped with a large cylindrical detector which surrounds the sample and is com-
posed of neutron-sensitive image-plates (diameter: 400 mm, height: 450mm) [164].
This beamline Quasi-Laue neutron diffraction data was collected to a resolution of
1.9 Å. A wavelength range of 3.12 - 4.2 Å, centered at 3.68 Å was used throughout
the data collection. As typical for the Quasi-Laue method, the crystal was held in
a stationary position for the duration of the experiment, rotating by an angle of 10◦
between each image. A total of 36 images were collected with an average exposure
time of 2 hours, using 5 different crystal orientations to increase the completeness
of the dataset. A Quasi-Laue diffraction image with an exposition time of 2 hours
is shown in Figure 5.5. The crystal was recovered and used in the subsequent X-ray
data collection.
FIGURE 5.5: A Quasi-Laue neutron diffraction pattern from the crystal of perdeuteratedUrate Oxidase in complex with 9-methyl-5-peroxyisourate crystal (DUOX:5-PMUA) with2 h exposure time.

Chapter 5. Neutron Refinement of Perdeuterated Urate Oxidase (DUOX)
complexed with 9-methyl uric acid (9-MUA)172
TABLE 5.1: Neutron and X-ray data collection statistics for DUOX:5-PMUA crystal at 293K.
Neutron data X-ray dataLADI, ILL FIP, ESRF
Space group I 2 2 2 I 2 2 2Unit cell parametersa b c (Å) 80.08, 96.15, 105.36 80.08, 96.15, 105.36α β γ (◦) 90 90 90 90 90 90Wavelength (Å) 3.12 - 4.2 0.9800No. of images 36 240Angle between images (◦) 10 1Average exposure time 2 h 5 sResolution (Å) 40.0-1.90 (2.00-1.9) 40.04-1.39 (1.41-1.39)No. of observations 195714 (17813) 598501 (28822)No. unique reflections 29734 (3892) 81736 (3982)Completeness (%) 92.5 (83.9) 100 (100)Multiplicity 6.6 (4.6) 7.3 (7.2)⟨
I/σI⟩
9.2 (3.8) 17.2 (1.2)Rmerge 0.132 (0.349) 0.055 (1.925)Rp.i.m. 0.044 (0.157) 0.022 (0.766)CC1/2 99.4 (98.7) 99.9 (51.1)
Values in parentheses are for the highest resolution shell.
The reduction of the neutron data was conducted by the program LAUEGEN [172]
and followed by wavelength normalisation using LSCALE [173]. The scaling and
merging of recorded reflections was conducted using SCALA [251] before using
TRUNCATE [252, 253] to convert the intensities to structure factors. Full statistics
for the neutron data collection are described in Table 5.1.
5.4 X-ray Data Collection on FIP
An X-ray dataset was collected on the same crystal that was used in the neutron
data collection. The time between neutron data collection and X-ray data collec-
tion was two weeks, due to beamtime availability at the ESRF, Grenoble. It was
measured at 293 K using the FIP beamline at the ESRF at λ = 0.9800. A total of

Chapter 5. Neutron Refinement of Perdeuterated Urate Oxidase (DUOX)
complexed with 9-methyl uric acid (9-MUA)173
240 images of 1◦ oscillation and 5 s exposure per image were recorded on an ADSC
Q315 detector. The intensities were indexed and integrated using the XDS package
then were merged and scaled using the CCP4 program AIMLESS. The statistics are
shown in Table 5.1.
5.5 Refinement of DUOX:5-PMUA
The model 4CW6 was taken from the PDB and used as a starting model for the re-
finement. Firstly, alternate conformers, waters molecules, and the ligand molecule,
were removed from the model. The model was also converted to isotropic B-factors
and atomic positions were shifted by 0.1 Å to reduce model bias. This model con-
tained an acetylated serine residue that was mutated in the model to a terminal
serine residue as in our sequence.
Structure refinement using X-ray data alone was conducted using the PHENIX
suite and model building was done using the Molecular Graphics Package Coot
[185, 186]. By first refining the model using only the higher resolution X-ray data,
it was possible to locate the positions of the heavy atoms in the protein complex in
preparation for joint refinement with neutron data (C, N, O, S). The primary step
of refinement was to conduct a rigid body refinement. This was followed by iter-
ations of refinements of atomic coordinate positions, individual occupancies, and
B-factors. After 3 rounds of refinement, the models atomic B-factors were refined
anisotropically. The 5-PMUA ligand was modelled with an occupancy fixed at 1.00
and refined using the geometry restraints generated using eLBOW [256].
Structure factor amplitudes from both X-ray and neutron data collections were
combined in one .mtz file for joint refinement. The Rfree flags consisted of 5% and
10% of the reflections from the neutron and X-ray data, respectively. The model
built using the X-ray data was used as the starting model. All water molecules
Chapter 5. Neutron Refinement of Perdeuterated Urate Oxidase (DUOX)
complexed with 9-methyl uric acid (9-MUA)174
modelled as oxygen atoms only were removed. Deuterium atoms were added to
all hydrogen positions using the program READYSET, due to the use of perdeuter-
ation and vapour diffusion exchange into deuterated buffer. However, it was ob-
served that the X-ray and neutron data presented different features, particularly
surrounding the 5-PMUA ligand, causing problems with the interpretation of the
protonation states in the active site, see Sections 5.6.3 and 5.6.4. Therefore, a ’neutron-
only’ refinement strategy was used to finalise the model.
The jointly refined structure was used as a starting model and all ’X-ray only’ fea-
tures were removed. This included ’X-ray only’ water molecules (oxygen atoms)
and split conformers that were only visible in the electron density map. In addition,
all atoms were refined isotropically. The full statistics for this finalised neutron-only
structure are reported in Table 5.2. The Rwork value for this structure was 21.39%
and the Rfree value was 25.21%. The final refinement for which statistics are re-
ported in Table 5.2, used the best X-ray model as a reference model in the phenix
input parameters. We reasoned that this should improve the overall model as bond
lengths and angles should be better defined in the X-ray structure. We verified that
this approach did not influence the final protonation states, these were consistent
with and without the inclusion of the reference model. The addition of the reference
model resulted in a slight improvement in the Rfree, Rfactor, and the RMSD of bonds
and angles.
D2O molecules were manually fitted into positive density in the mFo-DFc neutron
density map at σ > 3.0. Coot was used to correctly orientate and model these D2O
molecules. Several mobile water molecules could be identified were modelled as
oxygen atoms only as their orientations were not clearly seen in the mFo-DFc neu-
tron density map.
Similarly to the method described in Chapter 4, labile hydrogen positions in side
chains were systematically checked. Deuterium atoms were added to positive
peaks seen in the mFo-DFc neutron density map and removed from negative peaks,

Chapter 5. Neutron Refinement of Perdeuterated Urate Oxidase (DUOX)
complexed with 9-methyl uric acid (9-MUA)175
both at levels of σ > 3.0. In this process it was assumed that there was minimal con-
tamination from hydrogen in the previous buffer and from atmospheric humidity.
TABLE 5.2: Model-refinement statistics for the neutron-only refinement of perdeuteratedUrate Oxidase in complex with 9-methyl-5-peroxyisourate (DUOX:5-PMUA).
Neutron only statistics
Resolution (Å) 38.39 - 1.9
Number of reflections 29360
Completeness (%) 90.61 (83.58)
Rwork 0.2139
Rfree 0.2521
B factors (Å2)
Protein 46.23
Ligand 39.51
Solvent 53.59
R.M.S Deviations
Bond lengths (Å2) 0.005
Bond angles (Å) 0.924
No. of Waters (D2O, O) 190, 12
5.6 Results
5.6.1 Deuterium Incorporation
The inclusion of deuterium atoms could be evaluated by comparing the neutron
density maps before and after the buffer exchange. The visualisation of D2O molecules,
and the lowering of the background scattering arising from hydrogen incoherent
scattering, provided evidence that the addition of deuterium from the exchange

Chapter 5. Neutron Refinement of Perdeuterated Urate Oxidase (DUOX)
complexed with 9-methyl uric acid (9-MUA)176
had been successful. A number of D2O molecules contained hydrogen atoms in
the initial dataset however after buffer exchange showed well defined 2mFo-DFc
neutron density. A sample of D2O molecules are shown before and after buffer
exchange in Figure 5.6. For each D2O molecule, the neutron density before buffer
exchange does not show a well-defined orientation and show negative peaks in the
mFo-DFc neutron density maps. It is likely that these negative peaks are attributed
to hydrogen contamination in the solvent. However, examining molecules in the
same positions after buffer exchange shows that the D2O molecules now adopt a
well-defined orientation and show no negative peaks in the mFo-DFc neutron den-
sity map. In addition to the visualisation of several new D2O molecules in the data
collected after buffer exchange, the neutron density maps also showed an overall
reduction in noise.

Chapter 5. Neutron Refinement of Perdeuterated Urate Oxidase (DUOX)
complexed with 9-methyl uric acid (9-MUA)177
Before buffer exchange After buffer exchange
DOD 7 DOD 7
DOD 38 DOD 38
DOD 1 DOD 1
FIGURE 5.6: The left hand column shows the 2mFo-DFc and mFc-DFc neutron densitymaps from the dataset collected before buffer exchange, contoured at 1.0 σ and 3.0 σ,respectively. Negative peaks in the mFo-DFc neutron density maps are shown in red,indicative of hydrogen atoms. In contrast, the right hand column shows the same D2Omolecules after buffer exchange. The 2mFo-DFc neutron density map shows a moredefined shape with no negative peaks in the mFo-DFc neutron density map.
To further evaluate the D:H incorporation in the structure, the number of amide
hydrogen atoms present in the protein backbone was investigated. Amide atoms
are usually tightly hydrogen bonded in the structure and the most difficult to ex-
change for deuterium in comparison to the dynamic active site. In these data, it was

Chapter 5. Neutron Refinement of Perdeuterated Urate Oxidase (DUOX)
complexed with 9-methyl uric acid (9-MUA)178
seen that of the 315 backbone amide atoms in the structure, 6 showed clear negative
peaks in the neutron mFo-DFc maps, indicative of hydrogen atoms. This represents
only ∼ 2% of amide backbone hydrogen atoms. These backbone hydrogen atoms
were distributed evenly amongst secondary structure elements: α-helices, β-sheets
and loops, showing no preference for a particular region of the protein. This in-
formation, in addition to the number of well defined D2O molecules, gives a high
level of confidence that the vapour diffusion exchange method was successful.
5.6.2 Peroxide Stability
It was observed that the lifetime of the peroxide was shortened in DUOX:5-PMUA
crystals grown in 100% deuterated conditions (Dr. S. Bui, personal communica-
tion, 24 September 2018). This was observed during X-ray experiments under cryo-
cooled conditions using a home X-ray source. Although the intermediate is stable
at 293 K, over several weeks the peroxide C5-Op1 bond is seen to break and crystals
begin to deteriorate. In the case of NMX studies where data collection can be on
the time scale of days, preserving the peroxide at high occupancy for the duration
of the experiment was vital. In comparison, in HUOX:5-PMUA crystals the per-
oxide lifetime can be over 5 weeks, as reported in previous experiments involving
HUOX:5-PMUA crystals in 100% hydrogenated conditions for X-ray experiments
(Dr. S. Bui, personal communication, 24 September 2018) [81]. The time between RT
neutron and X-ray data collection was approximately 2 weeks, however the length
of time between crystallisation set-up and X-ray data collection was a total of 4
weeks. The lifetime of the crystal used in this data collection and the total timescale
associated is shown in Figure 5.7. In mixed buffer solutions, such as the sample re-
ported in this chapter, the peroxide was seen to have a longer lifetime than in 100%
deuterated conditions (Dr. S. Bui, personal communication, 24 September 2018).

Chapter 5. Neutron Refinement of Perdeuterated Urate Oxidase (DUOX)
complexed with 9-methyl uric acid (9-MUA)179
FIGURE 5.7: Timeline describing the length of time between setting-up the crystallisationof DUOX:5-PMUA to when the crystal was harvested for data collection. It also describesthe length of time between crystal harvesting, the neutron data collection, and the X-raydata collection. These details must be considered, as the short lifespan of the crystal iscentral to our interpretation of the data collected.
In previous studies of the HUOX:5-PMUA complex, the peroxide bond (C5-Op1)
has been found to be susceptible to radiolysis [81]. Even at low X-ray doses, it was
observed that the C5-Op1 bond of 5-PMUA could be lysed, resulting in the regen-
eration of 9-MUA and O2. Therefore, RADDOSE-3D [258] was used to calculate
the dose received by the DUOX:5-PMUA crystal by synchrotron radiation, taking
the large crystal dimensions into account. The average dose received by the whole
crystal was 1.1 kGy and the average dose received by the exposed region was 5.0
kGy. This value was compared with those obtained in previous experiments moni-
toring the peroxide radiolysis [81]. In these studies, breakage of the peroxide bond
was observed at average dose values of 19 kGy, where the occupancy of UOX:5-
PMUA was calculated as 78% and liberated O2 was present at 22%. A higher per-
centage of peroxide bond lysis was observed in higher doses. From the same study,
an additional dataset was collected with a calculated dose of 2.5 kGy and observed
that peroxide bond had an occupancy of 100% [81]. The value of 2.5 kGy can be
considered as relatively similar to the value calculated from this experiment, 1.1
kGy, suggesting that the DUOX:5-PMUA intermediate should be intact.
With consideration to the calculated dose received by the DUOX:5-PMUA crystal in
this experiment, and in comparison with previous recorded values, it was expected
Chapter 5. Neutron Refinement of Perdeuterated Urate Oxidase (DUOX)
complexed with 9-methyl uric acid (9-MUA)180
that the peroxide would not suffer radiation-induced bond lysis and remain intact
during the X-ray data collection.
5.6.3 Results from ’X-ray only’ and Joint neutron/X-ray Refinement
The X-ray data alone were used to build the initial model before the addition of
deuterium atoms. The 5-PMUA ligand was fitted into a positive peak in the mFo-
DFc neutron density map. A characteristic of 5-PMUA is the pyrimidalization of the
carbon atom at position C5. The C5 atom is sp3 hybridized and adopts a tetrahedral
configuration, bonding to C4, C6 and N7 of 9-MUA, and Op1 of the peroxide [81].
However, in the ’X-ray only’ model where both Op1 and Op2 have occupancy 1.0,
a strong negative peak in the mFo-DFc electron density map was observed across
the C5-Op1 bond, shown in Figure 5.8 (b). This is indicative of the partial lysis of
the peroxide bond in the X-ray data. An additional negative peak at 3.0 σ was seen
in the mFo-DFc electron density map at the C5 atom, providing further evidence of
a non sp3 hybridized species at C5 and the appearance of a planar species, 9-MUA.

Chapter 5. Neutron Refinement of Perdeuterated Urate Oxidase (DUOX)
complexed with 9-methyl uric acid (9-MUA)181
(a) (b)
’X-ray only’ refinement ’X-ray only’ refinement
Op1/Op2 occ = 0.0 Op1/Op2 occ = 1.0
FIGURE 5.8: (a) An omit map calculated in the absence of Op1 and Op2 atoms. Positivepeaks in the mFo-DFc electron density map at 3.0 σ, shown in green, indicates the presenceof two oxygen atoms in the peroxide position. A further negative peak in the mFo-DFcelectron density map on the C5 atom is seen in red. (b) Electron density map calculatedwith 5-PMUA fixed to an occupancy of 1.0. A negative peak in the mFo-DFc electrondensity map at 3.0 σ is observed between the C5-Op1 bond, indicative of partial peroxidebond lysis. The 2mFo-DFc electron density maps are contoured at 2.0 σ.
An omit map excluding only the Op1 and Op2 atoms was conducted, shown in
Figure 5.8 (a). A positive peak in the mFo-DFc electron density map showed the
location of the two oxygen atoms of the peroxide. It is important to note that the
omission of Op1 and Op2 did not remove an additional negative peak in the mFo-
DFc electron density map located at the C5 position. The occupancies of each oxy-
gen atom were refined and found to be 0.65 and 0.85 for Op1 and Op2, respectively.
The occupancies, in conjunction with the strong negative peak in the mFo-DFc elec-
tron density map at 3.0 σ across the C5-Op1 bond indicate the loss of peroxide in
the X-ray data. It has been shown in previous literature that liberated O2 results
from the C5-Op1 bond lysis, therefore it can be suggested that the X-ray structure
represents a split state: DUOX:5-PMUA and DUOX:9-MUA + O2.
A joint refinement strategy was then used to gather further information on the

Chapter 5. Neutron Refinement of Perdeuterated Urate Oxidase (DUOX)
complexed with 9-methyl uric acid (9-MUA)182
DUOX:5-PMUA complex. However, as expected, similar problems were observed
concerning the X-ray data. The joint refinement results are shown in Figure 5.9.
Both Figure 5.9 (a) and (b) show the omit maps of Op1 and Op2 in the mFo-DFc
electron density and neutron density maps, respectively. However, Figure 5.9 (c)
and (d) shows the 5-PMUA ligand with Op1 and Op2 modelled with the occupan-
cies fixed at 1.0. In common with the previous observation, a large negative peak in
the mFo-DFc electron density map dominates the signal from the 5-PMUA ligand,
suggesting the partial lysis of the C5-Op1 peroxide bond in the mFo-DFc electron
density map (Figure 5.9 (c)). It is interesting to note that no negative peak is seen
across the C5-Op1 bond in the mFo-DFc neutron density map, as shown in Figure 5.9
(d). This provides evidence that the peroxide bond is intact in the neutron dataset,
whereas the C5-Op1 bonds suffers partial lysis as seen in the X-ray dataset.

Chapter 5. Neutron Refinement of Perdeuterated Urate Oxidase (DUOX)
complexed with 9-methyl uric acid (9-MUA)183
(a) (b)
X-ray Op1-Op2 occ = 0 Neutron Op1-Op2 occ = 0
(c) (d)
X-ray Op1-Op2 occ = 1.0 Neutron Op1-Op2 occ = 1.0
FIGURE 5.9: The structure of 5-PMUA from the joint refinement. The X-ray and neutronmaps have been shown separately for clarity. The omit maps seen in (a) and (b) showpositive peaks in the mFo-DFc electron density and neutron density maps and indicate thepresence of Op1 and Op2 (in green). (c) and (d) show 5-PMUA when Op1 and Op2 wereconstrained to occupancies of 1.0. A negative peak in the mFo-DFc electron density map at3.0 σ was observed across the peroxide bond (in red). This is absent in the mFo-DFcneutron density map. The 2mFo-DFc electron density maps are contoured to 2.0 σ, the2mFo-DFc neutron density maps are contoured to 1.0 σ, whereas all mFo-DFc maps arecontoured to 3.0 σ.
In the joint refinement, it was also observed that numerous D2O molecules showed
large B-factors, with values > 50 Å2. This effect was not observed for the individ-
ual X-ray or neutron refinements. When modelled as D2O, with occupancy values
fixed at 1.0, numerous water molecules showed density in 2mFo-DFc electron den-
sity and neutron density maps. However, many also showed additional strong
Chapter 5. Neutron Refinement of Perdeuterated Urate Oxidase (DUOX)
complexed with 9-methyl uric acid (9-MUA)184
positive peaks in the mFo-DFc electron density map at the same location with large
B-factors. It was often observed that the B-factors of the oxygen atoms differed sig-
nificantly from the B-factors of the adjacent deuterium atoms. Several approaches
were tested to rectify this problem, such as manually resetting B-factors and delet-
ing then re-adding the D2O molecules. Each method that was tested resulted in
the continued increase in B-factors for a number of D2O molecules after more than
one round of refinement. This effect was also seen in some residues in flexible loop
regions. The labile deuterium atoms on several sidechains such as asparagine, ly-
sine and glutamine amino acids reported B-factors of > 100 Å2. While it is expected
that atoms from this flexible region would show higher B-factors than those tightly
bound in secondary structure elements, these values were lower in the neutron
only refinement. These positive peaks in the mFo-DFc electron density maps and
large B-factors hampered the interpretation of the maps, and was suggestive that
the X-ray and neutron datasets were reporting different features.
From this information, the following can be seen: the electron density maps show
a partially lysed peroxide (5-PMUA) and the joint refinement strategy showed a
conflict between the X-ray and neutron data. Since the main focus of this structural
investigation is the locations of hydrogen atoms in the structure, it was considered
unreasonable to try to extract information on active site hydrogen positions using
these X-ray data. To prevent potential bias from the X-ray data, the structural re-
finement subsequently proceeded with the neutron data alone.
5.6.4 Results from Neutron-Only Refinement
The neutron dataset had a high overall completeness of 92.5%, whereas most Quasi-
Laue neutron datasets are less complete, averaging around 80% completeness [259].
The initial model was taken from the last joint refinement, with X-ray derived fea-
tures removed. As previously described, no negative peak in the mFo-DFc neutron
Chapter 5. Neutron Refinement of Perdeuterated Urate Oxidase (DUOX)
complexed with 9-methyl uric acid (9-MUA)185
density map was seen at the C5-Op1 bond or localised at the C5 position from the
jointly-refined model.
An omit map was calculated in the absence of Op1 and Op2 atoms using the neu-
tron data alone. This omit map is shown in Figure 5.10 (a). A strong positive peak
in the mFo-DFc neutron density map is shown located above the peroxide, indicat-
ing the position of the Op1 and Op2 atoms. The final model is shown in Figure 5.10
(b) with Op1 and Op2 modelled, both with occupancies fixed at 1.0. The 2mFo-DFc
neutron density map does not completely cover both Op1 and Op2 atoms. This
could be due to the lower signal-to-noise ratio, which may arise from the relatively
low fluxes of neutron beams. In addition, it is observed that the B-factors are higher
for Op1 and Op2 in the ’neutron only’ model than they are in both the ’X-ray only’
and jointly-refined models, as detailed in Table 5.3. However, the absence of a
negative peak provides strong evidence that the C5-Op1 bond is intact as derived
from the neutron data. Therefore, the final model of 5-PMUA from the neutron
only refinement is presented in Figure 5.10 (b). The oxygen atom occupancies and
B-factors calculated for each model are detailed in Table 5.3.

Chapter 5. Neutron Refinement of Perdeuterated Urate Oxidase (DUOX)
complexed with 9-methyl uric acid (9-MUA)186
TABLE 5.3: Occupancies of peroxide atoms Op1 and Op2 in X-ray, joint refinement andneutron models. *B-factors in ’X-ray only’ and joint refinement structures were refinedanisotropically for non D/H atoms.
Model Op1 occupancy Op2 occupancy
X-ray data only 0.65 0.85Joint refinement 0.64 0.71Neutron data only 0.69 1.00
Op1 B-factor Op2 B-factor
X-ray data only*Occupancy 1.0 25.62 27.22Occupancy refined 20.78 22.10Joint refinement*Occupancy 1.0 28.16 25.26Occupancy refined 23.83 20.33Neutron data onlyOccupancy 1.0 40.14 31.42Occupancy refined 35.68 30.81
(a) (b)
Neutron only refinement Neutron only refinement
Op1-Op2 occ = 0 Op1-Op2 occ = 1.0
FIGURE 5.10: (a) An omit map calculated in the absence of atoms Op1 and Op2. Thepositive green peak in the mFo-DFc neutron density map is contoured to 3.0 σ. (b) BothOp1 and Op2 atoms are modelled with an occupancy fixed at 1.0 and no negative peak isseen in the mFo-DFc neutron density map. The 2mFo-DFc neutron density maps arecontoured to 1.0 σ.

Chapter 5. Neutron Refinement of Perdeuterated Urate Oxidase (DUOX)
complexed with 9-methyl uric acid (9-MUA)187
The C5-Op1 bond length was found to be 1.5 Å and the Op1-Op2 bond length was
found to be 1.5 Å. These measurements are similar to previously reported values
for HUOX:5-PMUA [81]. All 5-PMUA bond angles involving the Op1-Op2 atoms
are detailed in Table 5.4.
TABLE 5.4: Bond angles of 5-PMUA, specifically the bonds connecting the peroxide andOp1-Op2 atoms.
Bonding atoms (A – B – C) Bond angle
C5 – Op1 – Op2 118◦
C6 – C5 – Op1 94◦
C4 – C5 – Op1 103◦
N7 – C5 – Op1 112◦
In the evaluation of the 5-PMUA structure using only the neutron data, the possi-
bility of a deuterium atom bonded to Op2 was investigated. This would define this
peroxide intermediate as a hydroperoxide species. The examination of numerous
omit maps found no evidence of an Op2-bonded deuterium atom. In the omit map
of Op1 and Op2 , shown in Figure 5.10 (a), a positive peak surrounds the positions
of the two oxygen atoms and no additional peak is observed in the vicinity of Op2
where a deuterium atom would be expected. Additionally, a deuterium atom was
modelled on Op2 and the occupancy refined to 0.16. This low value provides ev-
idence to suggest that there is no deuterium atom on this peroxide. In the final
model we present the peroxide as unprotonated, and therefore negatively charged
at Op2.
5.6.5 DUOX:5-PMUA Bonding Interactions
The 5-PMUA ligand binds in the same location as the AZA ligand presented in
Chapter 4. The bonding distances and angles were measured and described in
Figure 5.11 and Table 5.6.

Chapter 5. Neutron Refinement of Perdeuterated Urate Oxidase (DUOX)
complexed with 9-methyl uric acid (9-MUA)188
An additional interaction is seen between O8 of 5-PMUA and the backbone amide
on residue Asp58* with a hydrogen bonding distance of 2.1 Å between the two
atoms.
FIGURE 5.11: Hydrogen bonding partners between active site residues and 5-PMUA. Thehydrogen bonds are indicated by pink dashed lines. Hydrogen bond angles are numberedand detailed in Table 5.6.
TABLE 5.5: DUOX:5-PMUA active site residues and hydrogen bond angles.
Hydrogen Bond (Donor – Hydrogen Acceptor) Bond Angle
1 Arg176 N – Arg176 D – 5-PMUA N3 166◦
2 Arg176 N – Arg176 D – 5-PMUA O6 166◦
3 Val227 N – Val227 D – 5-PMUA O2 162◦
4 Gln228 O – AZA D1 – 5-PMUA N1 169◦
5 Gln228 N – Gln228 D – 5-PMUA O6 167◦
6 Thr57* N – Thr57* D – 5-PMUA N7 158◦
7 Asp58* N – Asp58* D – 5-PMUA O8 99◦

Chapter 5. Neutron Refinement of Perdeuterated Urate Oxidase (DUOX)
complexed with 9-methyl uric acid (9-MUA)189
5.6.6 Catalytic Residues
The protonation states of the residues surrounding the active site and the 5-PMUA
ligand were also investigated. The protonation states of the residues that will be
discussed in this section are shown in Figure 5.12, where the deuterium atoms of
relevance are highlighted in red, for reference.
FIGURE 5.12: The protonation states of active site residues of interest. The locations of thedeuterium atoms under investigation are shown in red.

Chapter 5. Neutron Refinement of Perdeuterated Urate Oxidase (DUOX)
complexed with 9-methyl uric acid (9-MUA)190
(a) (b)
-OD omit -OD modelled
FIGURE 5.13: Omit map and final model of residue Thr57*. (a) shows the omit mapcalculated in the absence of the deuterium atom of the hydroxyl sidechain -OD. A positivepeak in the mFo-DFc neutron density map is seen at 3.0 σ. (b) the final model shows thedeuterated hydroxyl group of Thr57*. The 2mFo-DFc neutron density maps are contouredto 1.0 σ.
The protonation state of catalytically important Thr57* is shown in Figure 5.13. The
removal of the deuterium atom attached to the sidechain hydroxyl group resulted
in a positive peak in the mFo-DFc neutron density map at 3.0 σ, shown in Figure 5.13
(a), providing strong evidence for the presence of a deuterium atom. Therefore the
final model of Thr57*, shown in Figure 5.13 (b), includes an -OD group where the
is deuterium atom is pointing towards the negatively charged Op2 atom of the
peroxide, forming a hydrogen bond with a distance of 2.0 Å. The occupancy of this
deuterium atom was refined as 0.84.
The neighbouring residue Lys10* is also catalytically important [91]. Modelling a
singular conformation in the absence of the three deuterium atoms attached to the
sidechain nitrogen atom, resulted in a large positive peak at 3.0 σ in the mFo-DFc
neutron density map, shown in Figure 5.14 (a). However, this positive peak was
also seen to extend along the aliphatic chain of Lys10*, suggesting that this residue

Chapter 5. Neutron Refinement of Perdeuterated Urate Oxidase (DUOX)
complexed with 9-methyl uric acid (9-MUA)191
adopts two conformations. The X-ray data were consulted and a positive peak was
also seen in the mFo-DFc electron density map at 3.0 σ at the same location, provid-
ing further evidence of a split. A second omit map was calculated using the model
in which Lys10* is in two conformations, with the removal of the three deuterium
atoms from both sidechain nitrogen atoms, as detailed in Figure 5.14 (b). A large
positive peak is seen in the mFo-DFc neutron density map surrounding the two
sidechain nitrogen atoms, however, the positive peak along the Lys10*sidechain
shows a reduction in size. The distance between the two Lys10* sidechain nitrogen
atoms was found to be 0.4 Å, and the occupancies were refined to 0.63 and 0.37. In
order to investigate the protonation states of this residue, a number of omit maps
were conducted, and different models were tested.
Both the single and alternate conformations of Lys10* were modelled to investigate
the protonation state of the sidechain nitrogen: using -ND3+ and -ND2 groups. The
models containing -ND3+ groups are detailed in Figures 5.14 (c) and (d). In the
singular conformation, Figure 5.14 (c), a positive peak remained in the mFo-DFc
neutron density map at the -ND3+ group position. However, in the alternate con-
formation, Figure 5.14 (d), a negative peak appears in the mFo-DFc neutron density
map. Interestingly, in Figures 5.14 (e) and (f), no significant positive or negative
peaks are seen: this suggested that -ND2 may be the more reasonable model for
both the singular and alternate conformations. It is important to note that in Fig-
ures 5.14 (a), (b), (c), and (d), His256 is unprotonated and in Figures 5.14 (e) and (f)
His265 is deuterated with a fixed occupancy of 1.0.
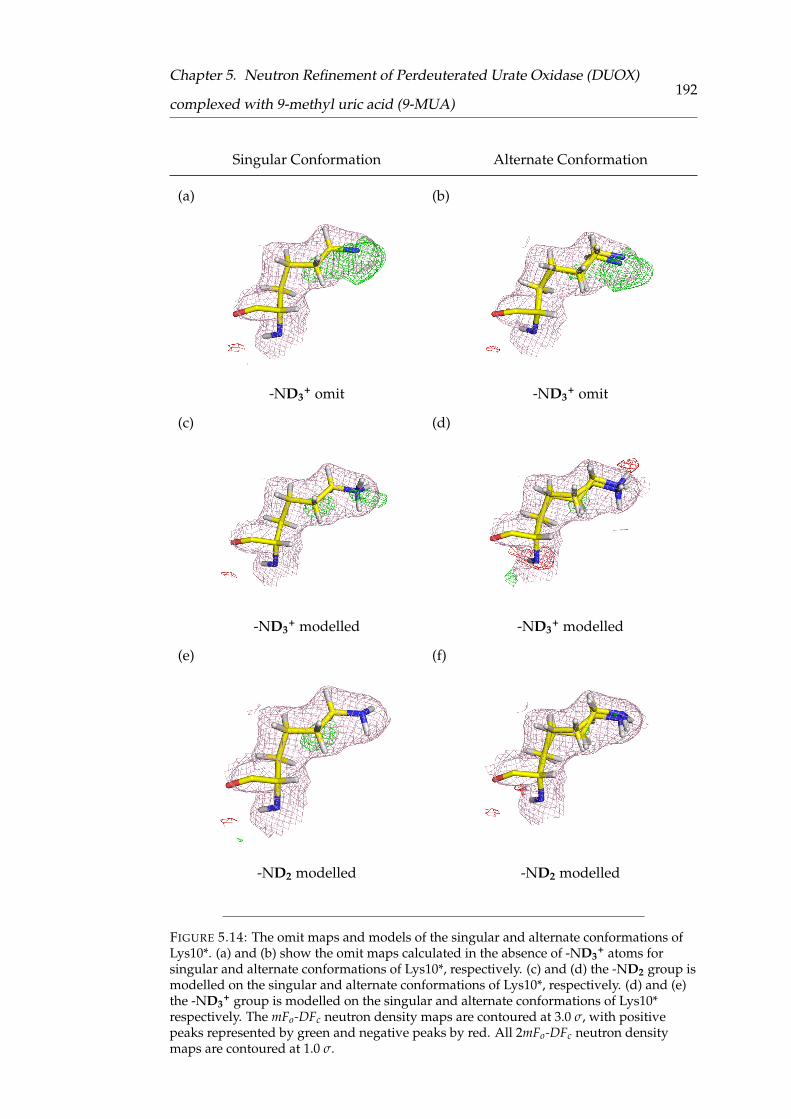
Chapter 5. Neutron Refinement of Perdeuterated Urate Oxidase (DUOX)
complexed with 9-methyl uric acid (9-MUA)192
Singular Conformation Alternate Conformation
(a) (b)
-ND3+ omit -ND3
+ omit
(c) (d)
-ND3+ modelled -ND3
+ modelled
(e) (f)
-ND2 modelled -ND2 modelled
FIGURE 5.14: The omit maps and models of the singular and alternate conformations ofLys10*. (a) and (b) show the omit maps calculated in the absence of -ND3
+ atoms forsingular and alternate conformations of Lys10*, respectively. (c) and (d) the -ND2 group ismodelled on the singular and alternate conformations of Lys10*, respectively. (d) and (e)the -ND3
+ group is modelled on the singular and alternate conformations of Lys10*respectively. The mFo-DFc neutron density maps are contoured at 3.0 σ, with positivepeaks represented by green and negative peaks by red. All 2mFo-DFc neutron densitymaps are contoured at 1.0 σ.

Chapter 5. Neutron Refinement of Perdeuterated Urate Oxidase (DUOX)
complexed with 9-methyl uric acid (9-MUA)193
The location of the positive peak in the mFo-DFc neutron density map in the pres-
ence of an -ND3+, described in Figure 5.14 (c), was adjacent to the unprotonated
His256 residue. In addition, a negative peak in the mFo-DFc neutron density map
was seen in the presence of two -ND3+ groups (Figure (5.14 (d)). Therefore, we
considered that a relationship may exist between the protonation states of these
neighbouring residues. To probe this relationship, a further set omit maps were
calculated: these are shown in Figure 5.15. However, the refinement of individual
atom occupancies cannot be obtained for residues adopting more than one con-
formation, due to the limitations of the refinement program used. This means all
atoms refine to the same occupancy as each conformer with a total occupancy of
1.0, where the total is the sum of all conformer occupancies. For example in this
case, all atoms from one Lys10* conformer have the occupancy of 0.69, whereas the
all atoms from the other conformer have an occupancy value of 0.31. Therefore,
in order to calculate the occupancy values for the individual deuterium atoms lo-
cated on the Lys10* sidechain, only the major conformation of Lys10* was included
in these models.
In the omit map where all three deuterium atoms are removed from the Lys10*
sidechain nitrogen atom, and His256 was also unprotonated at -NDε2, a posi-
tive peak in the mFo-DFc neutron density map was observed extending from the
sidechain of Lys10* to the sidechain of His256, as shown in Figure 5.15 (a). When
both -ND2 and -ND3+ groups were modelled on Lys10*, an additional positive peak
in the mFo-DFc neutron density map was seen between the Lys10* sidechain nitro-
gen atom and the nitrogen atom of the uncharged His256 (Figure 5.15 (b) and (c)).
When modelling both a charged Lys10* and His256, this positive peak in the mFo-
DFc neutron density map was seen to disappear (Figure 5.15 (e)). However, the
occupancies of each deuterium atom refined to values of 1.00, 0.91 and 0.06: the
lowest value was found on the deuterium atom nearest His256, whereas the deu-
terium atom on the charged His256 refined to an occupancy of 0.51 (Figure 5.15
(f)). It was not possible to conduct the same tests with the alternate conformation

Chapter 5. Neutron Refinement of Perdeuterated Urate Oxidase (DUOX)
complexed with 9-methyl uric acid (9-MUA)194
of Lys10* as detailed above.

Chapter 5. Neutron Refinement of Perdeuterated Urate Oxidase (DUOX)
complexed with 9-methyl uric acid (9-MUA)195
(a) Lys10*-NH3+
omit His256-NH
omit
(b) Lys10*-NH3+
His256-NH omit
(c) Lys10*-NH2
His256-NH omit
(d) Lys10*-NH3+
omit His256-NH
(e) Lys10*-NH3+
His256-NH
(f) Lys10*-NH2
His256-NH
FIGURE 5.15: Investigation into the protonation states of residues Lys10* and His256,where Lys10* is in a singular conformation. The 2mFo-DFc neutron density maps arecontoured to 1.0 σ and the mFo-DFc neutron density maps contoured to 3.0 σ. Positivepeaks are shown in green and negative peaks are shown in red.

Chapter 5. Neutron Refinement of Perdeuterated Urate Oxidase (DUOX)
complexed with 9-methyl uric acid (9-MUA)196
(a) Lys10*-NH3+
His256-NH omit
90 ◦ rotation
(b) Lys10*-NH2
His256-NH omit
90 ◦ rotation
FIGURE 5.16: Investigation into the protonation states of residues Lys10* and His256,where Lys10* is in a singular conformation. The 2mFo-DFc neutron density maps arecontoured to 1.0 σ and the mFo-DFc neutron density maps contoured to 3.0 σ. Positivepeaks are shown in green and negative peaks are shown in red.
The omit maps shown in Figure 5.15 suggest modelling His256 as positively charged.
However, despite removing the residual density between His256 and Lys10*, the
His256 -NDε2 only accounts for 50% of the deuterium atom. Figures 5.16 (a) and
(b) show a 90 ◦ rotation of Figures 5.15 (b) and (c), respectively. Inspection of these
maps indicates that the positive peak attributed to the His256 -NDε2 is not in a
favourable geometric position, pointing out of the plane of the His256 residue.
This result most likely indicates that the deuterium atom is in fact shared between
His256 and Lys10*, however, it is not easy to model this correctly.

Chapter 5. Neutron Refinement of Perdeuterated Urate Oxidase (DUOX)
complexed with 9-methyl uric acid (9-MUA)197
(a)
Top-down view
(b)
Side-on view
FIGURE 5.17: The model of residues Lys10* and His256 where the deuterium atom ispresent on both residues to a total occupancy of 1.0. Both residues are modelled in analternate conformation: Lys10* with an -ND2 group and positively charged His256 havean occupancy of 0.63 whereas Lys10* with an -ND3
+ group and neutral His256 have anoccupancy of 0.37. a) shows the top down view and (b) shows the side-on view. The2mFo-DFc neutron density map is contoured at 1.0 σ and the mFo-DFc neutron density mapis contoured at 3.0 σ.
Another approach to investigate these residues, involved splitting the Lys10* residue
to include each a -ND3+/-ND2 group on either nitrogen atom, with the correspond-
ing His256 coupled in either the absence or presence of a deuterium atom -Nε2.
The occupancies for this were set according to the occupancies of the two alternate
conformers of Lys10* (0.63 and 0.37). In Figure 5.17 (a) and (b), a model is shown

Chapter 5. Neutron Refinement of Perdeuterated Urate Oxidase (DUOX)
complexed with 9-methyl uric acid (9-MUA)198
describing this conformation. In this case, the deuterium atom is located mostly on
the His256, with an occupancy of 0.63. There is no residual positive peaks in the
mFo-DFc neutron density map seen in between the two residues. The deuterium
atom from His256 hydrogen bonds to the lone pair of the Lys10* -ND2 group with
a hydrogen bonding distance of 2.4 Å, conversely the deuterium atom from the
Lys10* -ND3+ group forms a hydrogen bond with the unprotonated nitrogen atom
of His256 at a distance of 2.2 Å. However, the fixing the occupancy at 0.63 artificially
increases the occupancy of the -NDε2 atom of His256, which previously refined at
0.51.
With this in consideration, we suggest that the simplest model would involve the
Lys10* residue in an alternate conformation with each nitrogen atom containing a
positively charged -ND3+ group, leaving the His256 unprotonated, shown in Fig-
ure 5.18. This model satisfies the evidence for a split Lys10* residue and accounts
for the total number of deuterium atoms between the two residues. In addition, as
the density present next to His256 is not in a favourable geometry to be satisfied by
modelling a deuterium atom on His256, it is chemically more likely that the deu-
terium atom is on the Lys10* -ND3+ sidechain. However, it is important to consider
that this deuterium atom may have a level of mobility that is not possible to model,
or may partially exist in between the two residues. The relationship between these
Lys10* and His256 residues has presented challenges in determining a final model,
however, may be indicative of the ability of these residues to transfer protons be-
tween each other, which may have implications in the reaction mechanism. In this
model, hydrogen bonding distance between the Lys10* -ND3+ and Thr57* -OD was
found to be 2.5 Å.

Chapter 5. Neutron Refinement of Perdeuterated Urate Oxidase (DUOX)
complexed with 9-methyl uric acid (9-MUA)199
(a)
(b)
FIGURE 5.18: With consideration to the location of the positive peak in the mFo-DFcneutron density map, it was chosen to model the Lys10* with an -ND3
+ group andunprotonated His256. (a) shows the top down view and (b) shows the side-on view. The2mFo-DFc neutron density map is contoured at 1.0 σ and the mFo-DFc neutron density mapis contoured at 3.0 σ.
Residue Asn254 is within bonding distance of the 5-PMUA peroxide Op2 atom.
An omit map was calculated in the absence of both the deuterium atoms on the
sidechain nitrogen atom. However, this omit map showed no evidence of deu-
terium atom positions as no positive peaks in the mFo-DFc neutron density map
were observed, shown in Figure 5.19 (a). To further investigate the orientation of
the Asn254 sidechain, the sidechain was flipped, swapping the location of the -ND2
and carbonyl groups. This resulted in the appearance of a positive peak in the mFo-
DFc neutron density map next to the oxygen atom (Figure 5.19 (b)), suggesting that

Chapter 5. Neutron Refinement of Perdeuterated Urate Oxidase (DUOX)
complexed with 9-methyl uric acid (9-MUA)200
this orientation is incorrect. The final model is shown in Figure 5.19 (c) with the
two deuterium atoms attached to the sidechain nitrogen atom. The occupancies of
each deuterium atom were also refined and found to have values of 0.20 and 0.29.
The hydrogen bonding distance between the Asn254 and Op2 is measured at 2.0 Å.
All bond angles from the active site residues are detailed in Table 5.6.
(a) (b) (c)
←→
-ND2 omit Sidechain flip -ND2 modelled
-ND2 modelled
FIGURE 5.19: Investigation into the orientation of residue Asn254. (a) This omit map wascalculated in the absence of both nitrogen-bound deuterium atoms (indicated by redcircles). (b) Flipping the residue orientation results in a positive peak in the mFo-DFcneutron density map next to the sidechain oxygen atom. (c) This final model presents the-NH2 group as shown. Positive and negative residual noise peaks are seen in both maps,shown in green and red respectively. The 2mFo-DFc neutron density maps are contouredat 1.0 σ whereas the mFo-DFc neutron density maps are contoured to 3.0 σ.

Chapter 5. Neutron Refinement of Perdeuterated Urate Oxidase (DUOX)
complexed with 9-methyl uric acid (9-MUA)201
TABLE 5.6: The hydrogen bond angles of residues in the active site.
Hydrogen Bond (Donor – Hydrogen Acceptor) Bond Angle
1 Thr57* O – Thr57* D – 5-PMUA Op2 143◦
2 Lys10* N – Lys10* D – Thr57* O 134◦
3 His256 N – His256 D – Lys10* N 124◦
4 Lys10* N – Lys10* D – His256 N 136◦
5 Asn254 N – Asn254 D – 5-PMUA Op2 143◦
5.6.7 Active Site Water Network
A comparison was made between the X-ray and neutron data and it was found that
there were a higher number of water molecules observed in the X-ray data.
Surrounding the active site there are several water molecules, observed as oxygen
atoms in the X-ray data. However, the positive peaks in the mFo-DFc electron den-
sity maps are not well defined, indicating a degree of mobility. In the mFo-DFc
neutron density map, the same D2O positions showed very weak peaks. It was not
possible from this information to determine the orientation of the D2O molecules.
Hence these D2O molecules were modelled as oxygen atoms only. As as result, it
was not possible to draw any reliable conclusions on the nature of this hydrogen
bonding network and the relationship between these molecules and the catalytic
residues in the active site.
The -CH3 group attached to the N9 position of 5-PMUA shows no density in the
2mFo-DFc neutron density map, as expected due to the cancellation effects caused
by the covalently bonded hydrogens (see Table 2.2 and Section 2.6 in Chapter 2).
Solvent molecule W2 does not form a hydrogen bond with NH9 of the ligand as
is the case in the DUOX:AZA complex, due to the N9-CH3 of 9-MUA. From the

Chapter 5. Neutron Refinement of Perdeuterated Urate Oxidase (DUOX)
complexed with 9-methyl uric acid (9-MUA)202
neutron data presented, it has not been possible to identify the location of solvent
molecule W2.
5.6.8 Final Structure of the DUOX:5-PMUA Active Site
Figure 5.20 shows the final structure of the DUOX:5-PMUA active site. The unpro-
tonated 5-PMUA molecule is surrounded by the active site residues that have been
discussed within this chapter. Residue Thr57* donates a hydrogen bond to the neg-
atively charged Op2 atom and accepts a hydrogen bond from the Lys10* -ND3+.
Residue His256 also accepts a hydrogen bond from the Lys10*. The Asn254 residue
also donates a hydrogen bond to the Op2 atom of the 5-PMUA, however, the po-
sitions of the two deuterium atoms are not well defined in the 2mFo-DFc neutron
density map.
FIGURE 5.20: The final structure of the DUOX:5-PMUA active site. The protonation statesof the active site residues surrounding the 5-PMUA ligand are shown. The 2mFo-DFcneutron density map is contoured to 1.0 σ.

Chapter 5. Neutron Refinement of Perdeuterated Urate Oxidase (DUOX)
complexed with 9-methyl uric acid (9-MUA)203
5.7 Discussion
The crystallisation of DUOX in complex with 9-MUA enabled the trapping of the
peroxide intermediate 5-PMUA. Examination of the neutron structure allowed the
investigation into the protonation states of residues surrounding the active site and
the peroxide. The purpose of this study was to try to understand the formation
and the stabilisation of the peroxide and investigate what role UOX plays in this
process by looking at the hydrogen positions.
The structural analogue 9-MUA differs from the natural substrate UA as it has a
methyl group attached to position N9 instead of a labile hydrogen atom. Previous
studies had shown that this substitution resulted in trapping the peroxide interme-
diate and resulted in the suggestion that this labile hydrogen atom is abstracted
during the expulsion of H2O2 and the formation of DHU intermediate [81]. There-
fore, it was possible to produce the crystals under aerobic conditions and conduct
neutron data collection at RT.
The crystal selected for data collection was grown in a mixed buffer solution with
a 2:1 ratio of D:H. This excess of deuterium is due to the fact that the protein was
initially fully exchanged against 100% D2O, with only the crystallisation solution
in hydrogenated conditions. It was reported that 100% deuterated crystallisation
conditions shortened the lifetime of the peroxide and resulted in partial lysis of
the C5-Op1 bond. It was also observed that the size of crystals grown in 100%
deuterated conditions was significantly smaller. However, mixed H/D conditions
were shown to extend the lifetime of the peroxide and resulted in larger crystals.
Following an initial data collection, a visible level of hydrogen contamination was
observed in the crystal structure, complicating the interpretation of the neutron
density maps. Therefore, further buffer exchange against a 100% deuterated solu-
tion was conducted by vapour diffusion inside the capillary where the crystal was

Chapter 5. Neutron Refinement of Perdeuterated Urate Oxidase (DUOX)
complexed with 9-methyl uric acid (9-MUA)204
mounted. The use of vapour diffusion may not be as effective for deuterium incor-
poration as initial crystal growth in 100% D2O, but it is a gentler method of buffer
exchange for crystals grown in non-deuterated conditions [260]. A typical method
for buffer exchange involves transferring the crystals into deuterated crystallisation
buffer, however, this was not possible in this case as the crystal had already been
mounted.
The use of vapour diffusion for buffer exchange after crystal mounting has been
successfully conducted in previous neutron experiments [261–263]. In all of these
cases the crystals were produced in 100% hydrogenated conditions and exchange
times were on the order of weeks. For the sample presented in this chapter, buffer
exchange over the course of weeks was not possible. Reasons for this include beam-
time availability and the short peroxide lifetime, previously discussed. The buffer
exchange strategy adopted in this case involved exchanging the deuterated buffer
plug multiple times within the capillary to encourage diffusion, rather than allow-
ing for long diffusion times. The ability to collect a dataset before and after the
vapour diffusion gave a unique insight into the efficacy of this exchange process.
The appearance of numerous water molecules and increased quality of the neutron
density maps showed evidence that the buffer exchange process had been success-
ful.
Both neutron and X-ray datasets were collected on the same crystal at RT. The use of
two complementary datasets has numerous benefits when used together in a joint
refinement. For example, there is a substantial increase in the number of observa-
tions, typically compensating for the increased number of parameters as a result
of including hydrogen and deuterium atoms in the refinement [186]. Joint refine-
ment also compensates for the lower completeness and the more limited resolution
typically seen for neutron data [186]. Furthermore, it can also aid the anisotropic re-
finement of C, N, O and S atoms in the structure. However, in this DUOX:5-PMUA
structure, it has been observed that the X-ray data shows notable differences to the

Chapter 5. Neutron Refinement of Perdeuterated Urate Oxidase (DUOX)
complexed with 9-methyl uric acid (9-MUA)205
neutron data. This is seen in the partial lysis of the C5-Op1 bond, as observed by
a large negative peak in the mFo-DFc electron density map, however, this feature
was not observed in the mFo-DFc neutron density map. We reasoned that the loss
of 5-PMUA may cause perturbations in the true protonation states of the peroxide-
bound complex. It has previously been reported that the breakdown of the perox-
ide results in a reorganisation of solvent in the active site, with the appearance of a
water molecule within hydrogen bonding distance to O8 [81]. Therefore, the pos-
sibility that the partial lysis of the C5-Op1 bond augments the proton arrangement
in the active site cannot be disregarded. The partial C5-Op1 bond lysis, seen only
in the X-ray data, led to a ’neutron only’ refinement strategy being conducted. This
removed any bias that may have been included from the split nature of 5-PMUA in
the X-ray data. A neutron only refinement was also considered possible due to the
high level of completeness of the neutron data collected (92.5%).
The true cause of the partial C5-Op1 bond lysis has not been identified in this study,
however, is it important to consider the following possibilities. In comparison to
HUOX, the perdeuteration of DUOX and the presence of deuterated buffer may
have had an effect on the lifetime of the peroxide bond. By collecting datasets of
DUOX:5-PMUA complexes on a home source at 100 K, it was observed that partial
C5-Op1 bond lysis was seen to occur more rapidly than previously reported for
HUOX:DUOX. However, it is also possible that even the low dose of X-rays calcu-
lated may have had an effect unlike that seen for HUOX. As a result, the perdeuter-
ated DUOX:5-PMUA complex may be more sensitive to radiation damage. The
lack of cryo-cooling of the DUOX sample reported in this chapter is also likely to in-
crease the susceptibility to radiation damage in comparison to cryo-cooled HUOX.
Hence, the RADDOSE-3D values that were used to evaluate the dose received by
the crystal may not be directly comparable to the previous published values for
HUOX complexes [81].
The X-ray and neutron data confirmed that the binding mode of 5-PMUA in this

Chapter 5. Neutron Refinement of Perdeuterated Urate Oxidase (DUOX)
complexed with 9-methyl uric acid (9-MUA)206
complex is similar to those described previously [76, 77, 80–83] and in Chapter
4. The neutron data confirms the presence of the trapped peroxide intermediate,
showing a bond between the C5 position of the 9-MUA substrate and the oxygen
molecule, previously seen in X-ray studies [81]. No evidence was found in the data
to suggest the presence of a deuterium atom on the peroxide Op2 atom, therefore,
the 5-PMUA intermediate that is presented in this chapter was determined as un-
protonated, with Op2 as negatively charged.
By comparing the DUOX:5-PMUA and HUOX:5-PMUA previously published, it
was found that the C5-Op1 and Op1-Op2 bond lengths are very similar, only dif-
fering by 0.01 Å [81]. Interestingly, QM/MM calculations conducted by Bui et al.
based on the HUOX:5-PMUA structure reported that these bond lengths are con-
sistent with the 5-PMUA hydroperoxide monoanion species [81]. However, the ex-
perimentally determined structure that we present is the 5-PMUA dianion. A struc-
tural comparison of the 5-PMUA peroxide dianion and the 5-PMUA hydroperoxide
monoanion is shown in Figure 5.21.
5-PMUA 5-PMUAperoxide dianion hydroperoxide
(charge = -2) (charge = -1)
FIGURE 5.21: Structural comparison of 5-PMUA peroxide dianion and 5-PMUAhydroperoxide.
The neutron data provided unambiguous evidence that the hydroxyl group of residue
Thr57* was present as -OD. This deuterium atom forms a hydrogen bond with the
negatively charged Op2 atom of the peroxide, at a bonding distance of 2.0 Å. The
close proximity of this residue to Op2 suggests that the proton located on Thr57*
may be important for stabilising the 5-PMUA species. In addition, to form H2O2

Chapter 5. Neutron Refinement of Perdeuterated Urate Oxidase (DUOX)
complexed with 9-methyl uric acid (9-MUA)207
the Op2 must become protonated, and the Thr57* hydroxyl deuterium atom is in
an ideal location to facilitate this. As this is not seen in this structure, we suggest
that this protonation of Op2 is likely to occur during the abstraction of the hydro-
gen atom at N9 of UA. This proton abstraction and resultant peroxide protonation
may involve the solvent network and residues Lys10* and His256, forming a proton
transfer system, connected via hydrogen bonds.
The protonation states of residues Lys10* and His256 were extensively investigated,
with a variety of possible states probed. There was strong evidence that the Lys10*
residue adopted an alternate conformation in both the X-ray and neutron data.
Many models were used to probe the exact protonation states of these residues.
From the information obtained from our tests, the most sensible model showed
the Lys10* in an alternate conformation, with a charged -ND3+ sidechain in both
conformations. While there is some evidence that the deuterium atom that was un-
der investigation exists between the two residues, we reasoned that the chemically
sensible model would be with the deuterium atom present on the Lys10* sidechain.
However, from our observations, we suggest that there is a link between these pro-
tonation states in this intermediate. The appearance of the shared proton between
Lys10* and His256, would result in a partial positively charged His256. This may
suggest that a proton transfer between these residues can occur in this interme-
diate. This may be have relevance to the proton transfer mechanism needed for
the deprotonation of N9, and formation of H2O2, previously described. However,
further experiments would need to be conducted to verify this hypothesis.
The protonation states presented in the DUOX:5-PMUA complex are similar to
those determined in previous NMX studies [80]. In both HUOX:8-HX and the
DUOX:AZA structure presented in Chapter 4 of this thesis, the His256 residue is
neutral, neighbouring a positively charged Lys10*.

Chapter 5. Neutron Refinement of Perdeuterated Urate Oxidase (DUOX)
complexed with 9-methyl uric acid (9-MUA)208
(a) (b)
(d) (c)
FIGURE 5.22: Proposed mechanism by Wei et al describing the protonation of theperoxide species. This mechanism suggests that the protonation of the peroxide occursbefore the radical recombination reaction to form 5-peroxyisourate. Adapted withpermission from [112]. Copyright 2017 American Chemical Society
In the theoretical paper by Wei et al., a mechanism was proposed using the UOX:8-
HX neutron structure by Oksanen et al as the substrate [112]. The detailed mech-
anism taken from Wei et al. involving the radical recombination resulting in the
formation of the peroxide is shown in Figure 5.22. The results of the QM/MM
calculations proposed that the superoxide becomes protonated prior to the rad-
ical recombination with the substrate. As shown in Figure 5.22, it is proposed
that the positively charged Lys9* (Lys10* in Aspergillus flavus) delivers a proton
to the superoxide via Thr56* (Thr57* in Aspergillus flavus), shown in Figure 5.22
(a). This protonated superoxide then undergoes a radical recombination to form
5-(hydro)peroxyisourate, shown in Figures 5.22 (b) and (c).

Chapter 5. Neutron Refinement of Perdeuterated Urate Oxidase (DUOX)
complexed with 9-methyl uric acid (9-MUA)209
In this mechanism, the expulsion of H2O2 is facilitated by the abstraction of a hy-
drogen atom from solvent by the peroxide species, resulting in the deprotonation of
N9, described in shown in Figure 5.22 (d). However, from the data that we present,
the peroxide is negatively charged and it is clear that Thr57* sidechain is -OD, is
pointing towards the 5-PMUA ligand. Therefore, we suggest that the protonation
of the peroxide does not occur before the radical recombination reaction, and is
facilitated by Thr57* after the peroxide intermediate has formed. This theoretical
model also does not consider the role of His256 in this process. It is possible that
His256 may play a role in either the stabilisation of 5-PMUA or in the next step
involving H2O2 expulsion.
Within this study it has not been possible to determine the nature of the water net-
work that surrounds the active site. These conserved water molecules have been
identified in previous UOX X-ray structures, with and without ligands, and at both
100 K and RT [68, 76, 77, 81, 83]. It has been suggested that water molecules W1
and W2 form two ends of a low energy proton transfer system [78, 82] however,
this has not been experimentally confirmed. It is interesting to note that the X-ray
structure of HUOX:5-PMUA conducted at 100 K reported that several of these ac-
tive site waters adopted an alternate conformation [81]. Therefore, it is reasonable
to suggest that even under cryo-cooled conditions, these waters are mobile and this
explains the difficulty that we had in locating these molecules in our neutron data
at RT.
5.8 Conclusion
The neutron structure that is presented within this chapter, builds on the informa-
tion obtained in the X-ray structure of HUOX:5-PMUA determined by Bui et al.
[81]. It has been possible to trap the 5-PMUA species in complex with DUOX and
collect a neutron dataset at 298 K. The 5-PMUA intermediate has been determined
Chapter 5. Neutron Refinement of Perdeuterated Urate Oxidase (DUOX)
complexed with 9-methyl uric acid (9-MUA)210
as unprotonated and, therefore, negatively charged at the Op2 atom. Due to the hy-
drogen bonding distance between residue Thr57* and the negatively charged Op2
atom of 5-PMUA, we suggest that this residue plays a role in stabilising this per-
oxide species. It is also likely that this proton is transferred to Op2 before H2O2
expulsion.
In addition, we have observed that there is a close relationship in the protona-
tion states of residues Lys10* and His256. After extensive testing, the most sensi-
ble model presented in this chapter has a positively charged Lys10* and a neutral
His256. However, it is reasonable to suggest that a proton may be partially shared.
The ability of these residues to exchange protons may indicate that a proton trans-
fer mechanism is possible, and this may have implications in the abstraction of the
hydrogen at N9 of UA and the protonation of the peroxide by Thr57*, involving the
solvent network connecting the two positions, in the true catalytic process.
A schematic of the protonation states is shown in Figure 5.23. We present the first
structure to determine the protonation states of catalytic residues in a reactive in-
termediate in the UOX catalytic pathway.

Chapter 5. Neutron Refinement of Perdeuterated Urate Oxidase (DUOX)
complexed with 9-methyl uric acid (9-MUA)211
FIGURE 5.23: The final structure of the DUOX:5-PMUA active site, showing theprotonation states of the catalytic triad Thr57*-Lys10*-His256 and the unprotonated5-PMUA intermediate.

212
Chapter 6
Concluding Remarks and Future
Perspectives
In this thesis, a structural study of the cofactor-free enzyme Urate Oxidase, (UOX),
is presented. The aim of this work was to investigate how this enzyme is able
to facilitate the reaction of uric acid (UA) with O2, in the absence of redox-active
metals or organic cofactors. This research was focused on understanding the role
that protons play in the catalytic process, and how the protein is able to form and
stabilise the structure of reactive intermediates.
6.1 Perdeuteration of UOX and Characterisation
The main focus of this work was to locate hydrogen positions in the active site and,
therefore, identify hydrogen-related interactions, including hydrogen bonding and
solvent networks. This information can be obtained using neutron macromolecular
crystallography (NMX). To maximise the quality of the data that can be collected
via this technique, UOX was perdeuterated (DUOX), i.e., both non-exchangeable
and exchangeable hydrogen positions are substituted with deuterium. The benefits

Chapter 6. Concluding Remarks and Future Perspectives 213
associated with the deuterium labelling of macromolecules is discussed in more
detail in Chapter 2.
Chapter 3 describes the perdeuteration protocol for DUOX, in addition to the bio-
physical characterisation. Mass spectrometry was employed to assess of the level of
perdeuteration achieved by this process. These results showed that the deuterium
content of DUOX was > 99%. An assessment into the thermal stability of DUOX
found that the perdeuterated protein was more susceptible to heat denaturation
than the hydrogenated counterpart. This observation has been reported in other
studies comparing the stabilities of hydrogenated and deuterated proteins. Fur-
ther studies could be conducted to identify any differences in reactivity between
HUOX and DUOX. This may prove interesting when investigating the comparison
between hydrogenated and deuterated macromolecules.
6.2 DUOX in complex with AZA
The structural study of DUOX in complex with 8-azaxanthine (AZA) is presented
in Chapter 4. AZA acts as an inhibitor by binding to the location of the natural
substrate, where it cannot be oxidised. Previous NMX studies used halogenated
crystallisation conditions, resulting in the addition of a chloride atom to the active
site. Our study involved the use of non-halogenated crystallisation conditions and
allowed the visualisation of solvent molecule W1, in the DUOX:AZA active site. It
was determined that solvent molecule W1 exists as D2O molecule in the presence
of AZA, rather than a charged species. The orientation of solvent molecule W1
and hydrogen bonding interactions involving residues Asn254 and Thr57* were
identified.
Our work focused on the residues known to be catalytically relevant, dyad Thr57*-
Lys10*, also residue His256, suggested to extend this network to a catalytic triad.

Chapter 6. Concluding Remarks and Future Perspectives 214
It was not possible to unambiguously determine the protonation state of Thr57*,
due to the lack of definitive evidence from the neutron density maps. However,
by employing intrinsic chemical knowledge, it was chosen to model deuterated
hydroxyl group pointing towards the active site, forming a hydrogen bond with
solvent molecule W1. The neighbouring residue Lys10* was found to contain a
positively charged -NH3, whereas the His256 residue was found to be neutral, un-
protonated at the nitrogen atom position adjacent to Lys10*. These protonation
states form a network of hydrogen donors: acceptors, connecting His256 to the
solvent molecule W1.
This structure builds on information obtained in previous NMX studies conducted
by Oksanen et al., where HUOX was complexed with AZA in the presence of a chlo-
ride anion, as previously mentioned [80]. The DUOX:AZA dataset discussed in this
thesis was collected to a slightly lower resolution (2.1 Åvs 1.9 Å) but is more com-
plete (80.2% vs 73.2%), and does not suffer the effects from the hydrogen contribu-
tion as noted in the previous study [80]. The protonation states of HUOX:AZA were
found to be different to those presented in our structure, DUOX:AZA. The hydroxyl
sidechain of Thr57* donates a hydrogen bond to the neutral Lys10* sidechain, con-
trasting with the DUOX:AZA structure. The residue His256 was found to be neu-
tral, similarly to that observed in DUOX:AZA. The authors suggested that a config-
uration identical to our findings also existed, however, the resolution of the previ-
ous neutron data meant that the two conformations were unable to be refined [80].
The protonation states in DUOX:AZA were found to be similar to those presented
in another structure by Oksanen et al.: HUOX in complex with UA using the same
chloride inhibitory method, forming HUOX:8-HX.

Chapter 6. Concluding Remarks and Future Perspectives 215
6.3 DUOX in complex with 9-PMUA
When DUOX is complexed with 9-methyl uric acid (9-MUA) under aerobic con-
ditions, 9-MUA rapidly converts to the 9-methyl-5-peroxyisourate intermediate (5-
PMUA). The DUOX:5-PMUA structure was able to provide information on the pro-
tonation states surrounding the active site with the peroxide intermediate in situ.
In Chapter 5, the challenges surrounding sample preparation of DUOX:5-PMUA
for NMX studies is described in detail. The lifetime of the peroxide species, cou-
pled with longer data collection times typical in NMX studies, needed carefully
timed crystal growth followed by buffer exchange. This was done using the gen-
tler method of vapour diffusion and it was possible to visualise the efficiency of
this process directly by comparing neutron density maps before and after buffer
exchange.
The susceptibility of the 5-PMUA peroxide bond to selective radiolysis by low X-
ray doses had been observed in previous X-ray studies of HUOX:5-PMUA [81].
This effect was observed in the case of DUOX:5-PMUA, after an X-ray dataset was
collected for use in joint refinement. It was not possible to identify the true cause
of this partial lysis, however, contributing factors are thought to include radia-
tion damage, exacerbated by RT data collection, and/or an undetermined effect of
deuteration. The partial lysis of the peroxide bond was not observed in the neutron
data, therefore, this structure was solved using a ’neutron-only’ refinement.
This research was able to determine that the 5-PMUA species bound to the active
site was unprotonated, with a negative charge located on the Op2 atom. Exam-
ination of the protonation states in the active site, showed strong evidence for a
deuterated Thr57* sidechain forming a hydrogen bond with the Op2 atom, sug-
gesting that this residue plays a role in stabilising the peroxide. In addition, the
proximity of this deuterium atom to the negative charge of Op2, makes Thr57* an
ideal candidate to transfer a hydrogen atom to the peroxide in the formation of
Chapter 6. Concluding Remarks and Future Perspectives 216
H2O2. We suggest that this may occur concurrently with the deprotonation of the
N9 hydrogen atom in UA, creating a proton relay system involving the solvent and
residues Lys10* and His256.
The protonation states of residues Lys10* and His256 were shown to be strongly
related. After extensive testing, the protonation states of these residues were de-
termined as a positively charged Lys10* and a neutral His256, as this was deemed
the most chemically sensible model. However, it cannot be discounted that there
may be a level of mobility in this region, and that this proton transfer may have
mechanistic implications. QM/MM calculations could be employed to verify this
relationship.
6.4 Future Work
The NMX structures of DUOX:AZA and DUOX:5-PMUA present previously unattain-
able information on the protonation states of active site residues in UOX. In future
work, methods for the further validation of the results presented could be con-
ducted. Quantum mechanics/molecular mechanics (QM/MM) calculations have
proven useful in supporting results from previous structural investigations into
UOX [80, 81]. Therefore, this technique could be employed to confirm the protona-
tion states determined experimentally, and can explore possible enzymatic mecha-
nisms using the structures described in this thesis as a starting model, as previously
conducted by Wei et al. [112].
The structures presented in this thesis also provide a solid foundation for further
neutron studies into the protonation states of reactive intermediates in UOX cataly-
sis. In order to relate the results we have determined to the true structure of the re-
active intermediates, it is important to conduct additional experiments with DUOX

Chapter 6. Concluding Remarks and Future Perspectives 217
in complex with the natural substrate UA. The methodology used to trap the anaer-
obic HUOX:UA and HUOX:PIU complexes, reported in the X-ray study by Bui et
al., would allow direct visualisation of the protonation states of the reactive inter-
mediates in complex with UA [81]. The study could be repeated exploiting the
neutron crystallographic technique with data collection at 100K. Trapping the UA
in complex with UOX in anaerobic conditions, would give an insight into the pro-
tonation state of UA in the primary reactive intermediate. This structure may yield
information on if an active site residue acts as a ’general base’ as previously pro-
posed. It would also clarify if solvent molecule W1 is involved in the same bond-
ing interactions with active site residues that are presented in this thesis and if its
charge is affected by UA, in contrast to AZA. A further study could be conducted
on the ligand-free UOX structure, to identify the protonation states of active site
residues and solvent molecules in the absence of any ligand. This may provide an
interesting structure for comparison to the primary reactive intermediate structure,
to identify which residues change protonation states upon UA binding. In addi-
tion, the DUOX:PIU structure, could visualise the 5-peroxyisourate intermediate
and discern whether the peroxide is indeed unprotonated in complex with the nat-
ural substrate, as is presented in this thesis. Data collection of this sample at 100K
may circumvent the radiation-damage observed in the DUOX:5-PMUA structure
presented in this thesis. It would also increase the length of time that the perox-
ide is stable for: this would also reduce the possibility that the length of the data
collection time resulted in the degradation of the peroxide seen in the X-ray data.
6.5 Conclusion
NMX, coupled with deuterium labelling, has allowed the examination of the pro-
tonation states of DUOX in two different complexes: with an inhibitor, AZA, and
with 9-MUA, forming the 5-PMUA peroxide intermediate.

Chapter 6. Concluding Remarks and Future Perspectives 218
The DUOX:AZA structure showed the AZA inhibitor-bound structure in the ab-
sence of O2. It was possible to draw comparisons between the DUOX:AZA struc-
ture and the HUOX:8-HX structure previously published as they showed the same
protonation states of active site residues [80]. The neutron dataset that is presented
in this thesis is of higher completeness than the HUOX:AZA neutron structure pre-
viously published, and has provided further details on the relationship between
active site solvent networks.
The neutron structure of DUOX:5-PMUA gave an insight into the active site struc-
ture in the peroxide-bound intermediate. This complex has revealed that 5-PMUA
intermediate is unprotonated when bound, and is stabilised by hydrogen bonding
to a catalytically relevant residue. In addition, the protonation states of other active
site residues were probed, and results have suggested some proton mobility. These
studies provide an interesting basis for further studies into the structure of reactive
intermediates in cofactor-free UOX catalysis.

219
Appendix A
Supplementary Information for
Chapter 3
FIGURE A.1: Aspergillus flavus UOX amino acid sequence obtained using ProtParam [264].

Appendix A. Supplementary Information for Chapter 3 220
TABLE A.1: Minimal media ingredients and masses. For H-Enfors the ingredients aremade up to 2 L of total media using dH2O and for D-Enfors using D2O.
(NH4)2SO4 13.72 gKH2PO4 3.12 gNa2HPO4 12.02 g(NH4)2-H-citrate 0.98 gd8-glycerol 10 g1 M MgSO4 0.46 gmetal salts 2 mL
*metal salts composition: 0.5g/l CaCl2.2H2O, 16.7 g/l FeCl3.6H2O, 0.18 g/lZnSO4.7H2O, 0.16 g/l CuSO4.5H2O, 0.15 g/l MnSO4.4H2O, 0.18 g/l CoCl2.6H2O,
20.1 g/l Na-EDTA.
TABLE A.2: Details of buffers used during the DUOX purification process.
Lysis Buffer 50 mM Tris-HCl, pH 8.0or 50 mM Tris-acetate, pH 8.0
Dialysis Buffer 50 mM Tris-HCl, pH 8.0
Ion Exchange ChromatographyBuffer A 50 mM Tris-HCl, 5 mM KCl, pH 8.0Buffer B 50 mM Tris-HCl, 0.6 M KCl, pH 8.0
Hydrophobic Interaction ChromatographyBuffer C 20 mM KPi, 1 M (NH4)2SO2, pH 8.0Buffer D 20 mM KPi, pH 8.0
Gel FiltrationBuffer E 50 mM Tris-HCl, pH 8.0
or 50 mM Tris-acetate, pH 8.0

Appendix A. Supplementary Information for Chapter 3 221
100 —
250 —150 —
75 —
50 —
37 —
25 —
20 —
15 —
10 —
100 —
18 °C 30 °C 37 °C
BI AI P SNMWBI AI P SNBI AI P SN
DUOX
FIGURE A.2: SDS-PAGE showing the expression and solubility of HUOX in LB medium.The MW (kDa) lanes represent a molecular weight marker. The different temperaturesand expression times are separated by solid black lines. The temperatures and expressiontimes were as follows: 18 ◦C and overnight; 30 ◦C and 5 hours; 37 ◦C and 3 hours. Thebefore induction and after induction samples across all temperatures show similar levelsof overexpression. The SN 37 ◦C lane shows the largest quantity of soluble HUOX,indicating the most favourable condition.

Appendix A. Supplementary Information for Chapter 3 222
TAB
LE
A.3
:Cal
cula
tion
ofex
pect
edhy
drog
enat
edm
ass
from
the
num
ber
ofam
ino
acid
san
dth
eir
resp
ecti
vem
olec
ular
wei
ghts
and
ofex
pect
edde
uter
ated
mas
sfr
omth
enu
mbe
rof
amin
oac
ids
and
thei
rre
spec
tive
mol
ecul
arw
eigh
tsin
clud
ing
the
num
ber
ofno
n-ex
chan
geab
lede
uter
ium
sin
corp
orat
edin
toth
eba
ckbo
ne.
Am
ino
Aci
dN
umbe
rof
AA
hAA
MW
hAA
MW
xN
bN
umbe
rof
non-
exch
ange
able
D
MW
ofno
n-ex
chan
geab
leD
per
AA
dAA
MW
dAA
Mw
xN
b
Ala
A19
71.0
7913
50.5
04
7675
.08
1426
.50
Arg
R12
156.
1918
74.2
57
8416
3.19
1958
.25
Asn
N14
114.
1015
97.4
53
4211
7.10
1639
.45
Asp
D17
115.
0919
56.5
13
5111
8.09
2007
.51
Cys
C3
103.
1530
9.44
39
106.
1531
8.43
Glu
E12
129.
1215
49.3
95
100
134.
1216
09.3
9G
lnQ
2012
8.13
2562
.62
560
133.
1326
62.6
2G
lyG
1557
.05
855.
782
3059
.05
885.
78H
isH
1113
7.14
1508
.55
555
142.
1415
63.5
5Il
eI
1811
3.16
2036
.87
1018
012
3.16
2216
.87
Leu
L20
113.
1622
63.1
910
200
123.
1624
63.1
9Ly
sK
2512
8.17
3204
.36
922
513
7.17
3429
.36
Met
413
1.20
524.
798
3213
9.20
556.
79Ph
eF
1014
7.18
1471
.77
880
155.
1815
51.7
7Pr
oP
997
.12
874.
057
6310
4.12
937.
05Se
rS
2387
.08
2002
.80
369
90.0
820
71.8
0T
hrT
2610
1.11
2628
.73
513
010
6.11
2758
.73
Trp
W7
186.
2113
03.4
98
5619
4.21
1359
.49
Tyr
Y10
163.
1816
31.7
67
7017
0.18
1701
.76
Val
V26
99.0
025
74.0
08
208
107.
0027
82.0
0
Tota
l:34
,098
kDa
Tota
l:1,
820
kDa
Tota
l:35
,918
kDa

223
Bibliography
(1) In Encycl. Ref. Genomics Proteomics Mol. Med. Springer Berlin Heidelberg:
Berlin, Heidelberg, 2006, p 408.
(2) Bugg, T. D. Dioxygenase enzymes: Catalytic mechanisms and chemical mod-
els. Tetrahedron 2003, 59, 7075–7101.
(3) Fetzner, S. Oxygenases without requirement for cofactors or metal ions.
Appl. Microbiol. Biotechnol. 2002, 60, 243–257.
(4) Whittaker, J. W. Oxygen reactions of the copper oxidases. Essays Biochem.
1999, 34, 155–172.
(5) Active oxygen in chemistry, 1st; Foote, C. S., Selverstone Valentine, J., Green-
berg, A., Liebman, J. F., Eds.; Blakie Academic and Professional: Bishop-
briggs, Glasgow, 1996.
(6) Active oxygen in biochemistry, 1st; S., V. J., Foote, C. S., Greenberg, A., Lieb-
man, J. F., Eds.; Springer Science and Business Media: Hong Kong, 1995,
p 463.
(7) Sawyer, D. T., Oxygen Chemistry, 1st; Oxford University Press: New York,
1991, p 240.
(8) Jones, R. D.; Summerville, D. A.; Basolo, F. Synthetic oxygen carriers related
to biological systems. Chem. Rev. 1979, 79, 139–179.
(9) Heme Peroxidases; Raven, E., Dunford, B., Eds.; Metallobiology; The Royal
Society of Chemistry: 2016, P001–366.
(10) Stephens, P. J.; Jollie, D. R.; Warshel, A. Protein control of redox potentials
of iron-sulfur proteins. Chem. Rev. 1996, 96, 2491–2513.

BIBLIOGRAPHY 224
(11) Pau, M. Y.; Lipscomb, J. D.; Solomon, E. I. Substrate activation for O2 reac-
tions by oxidized metal centers in biology. Proc Natl Acad Sci U S A 2007,
104, 18355–18362.
(12) Frerichs-Deeken, U.; Ranguelova, K.; Kappl, R.; Hüttermann, J.; Fetzner, S.
Dioxygenases without requirement for cofactors and their chemical model
reaction: Compulsory order ternary complex mechanism of 1H-3-hydroxy-
4- oxoquinaldine 2,4-dioxygenase involving general base catalysis by histi-
dine 251 and single-electron oxidation o. Biochemistry 2004, 43, 14485–14499.
(13) Palfey, B. A.; Ballou, D. P.; Massey, V. Oxygen Activation by Flavins and
Pterins. Act. Oxyg. Biochem. 1995, 37–83.
(14) Massay, V. Activation Of Molecular Oxygen By Flavins And Flavoproteins.
J. Biol. Chem. 1994, 269, 22459–22462.
(15) Bruice, T. C. Oxygen-Flavin Chemistry. Isreal J. Chem. 1984, 24, 54–61.
(16) Huijbers, M. M.; Montersino, S.; Westphal, A. H.; Tischler, D.; Van Berkel,
W. J. Flavin dependent monooxygenases. Arch. Biochem. Biophys. 2014, 544,
2–17.
(17) Van Berkel, W. J.; Kamerbeek, N. M.; Fraaije, M. W. Flavoprotein monooxy-
genases, a diverse class of oxidative biocatalysts. J. Biotechnol. 2006, 124, 670–
689.
(18) Entsch, B.; Van Berkel, W. J. H. Structure and mechanism of para-hydroxybenzoate
hydroxylase. FASEB J. 1995, 9, 476–483.
(19) Mattevi, A. To be or not to be an oxidase: challenging the oxygen reactivity
of flavoenzymes. Trends Biochem. Sci. 2006, 31, 276–283.
(20) Colette Daubner, S.; Lanzas, R. O. In Ref. Modul. Biomed. Sci. Elsevier: 2018.
(21) Biological Oxidation Systems; Reddy, C. C., Hamilton, G, A., Madyastha, K. M.,
Eds.; Academic Press Inc.: San Diego, USA, 1990, p 545.
(22) Fetzner, S.; Steiner, R. A. Cofactor-independent oxidases and oxygenases.
Appl. Microbiol. Biotechnol. 2010, 86, 791–804.

BIBLIOGRAPHY 225
(23) Christopherson, R. I. In Encycl. Ref. Genomics Proteomics Mol. Med. Springer
Berlin Heidelberg: Berlin, Heidelberg, 2006, pp 1333–1337.
(24) Maiuolo, J.; Oppedisano, F.; Gratteri, S.; Muscoli, C.; Mollace, V. Regulation
of uric acid metabolism and excretion. Int. J. Cardiol. 2016, 213, 8–14.
(25) Keilin, J. The biological significance of uric acid. Biol. Rev. 1958, 34, 265–294.
(26) Yeldandi, A. V.; Yeldandi, V.; Kumar, S.; Narasimha Murthy, C. V.; Wang,
X.; Keith, A.; Sambasiva Rao, M.; Reddy, J. K. Molecular evolution of the
urate oxidase-encoding gene in hominoid primates: nonsense mutations.
Gene 1991, 109, 281–284.
(27) Oda, M.; Satta, Y.; Takenaka, O.; Takahata, N. Loss of urate oxidase activ-
ity in hominoids and its evolutionary implications. Mol. Biol. Evol. 2002, 19,
640–653.
(28) Christen, P.; Peacock, W. C.; Christen, A. E.; Wacker, W. E. Urate Oxidase in
Primate Phylogenesis. Eur. J. Biochem. 1970, 12, 3–5.
(29) Friedman, T. B.; Polanco, G. E.; Appold, J. C.; Maylet, J. E. On The Loss Of
Uricolytic Activity During Primate Evolution - I. Silencing Of Urate Oxidase
In A Homonoid Ancestor. Comp. Biochem. Physiol. 1985, 81B, 653–659.
(30) Wu, X. W.; Lee, C. C.; Muzny, D. M.; Caskey, C. T. Urate oxidase: primary
structure and evolutionary implications. Proc. Natl. Acad. Sci. U. S. A. 1989,
86, 9412–9416.
(31) Yeldandi, A. V.; Wang, X.; Alvares, K.; Kumar, S.; Rao, M. S.; Reddy, J. K.
Human Urate Oxidase Gene: Cloning and Partial Sequence Analysis Reveal
A Stop Codon Within The Fifth Exon. Biochem. Biophys. Res. Commun. 1990,
171, 641–646.
(32) Orowan, E. The Origin Of Man. Nature 1955, 175, 683–684.
(33) Ames, B. N.; Cathcart, R.; Schwiers, E.; Hochstein, P. Uric acid provides an
antioxidant defense in humans against oxidant- and radical-caused aging
and cancer: a hypothesis. Proc. Natl. Acad. Sci. 1981, 78, 6858–6862.

BIBLIOGRAPHY 226
(34) Johnson, R. J.; Titte, S.; Cade, J. R.; Rideout, B. A.; Oliver, W. J. Uric acid,
evolution and primitive cultures. Semin. Nephrol. 2005, 25, 3–8.
(35) Kratzer, J. T.; Lanaspa, M. A.; Murphy, M. N.; Cicerchi, C.; Graves, C. L.;
Tipton, P. A.; Ortlund, E. A.; Johnson, R. J.; Gaucher, E. A. Evolutionary his-
tory and metabolic insights of ancient mammalian uricases. PNAS 2014, 111,
3763–3768.
(36) Wu, X.; Wakamiya, M.; Vaishnav, S.; Geske, R.; Montgomery, C.; Jones, P.;
Bradley, A.; Caskey, C. T. Hyperuricemia and urate nephropathy in urate
oxidase-deficient mice. Proc. Natl. Acad. Sci. U. S. A. 1994, 91, 742–746.
(37) Marchetti, M.; Liuzzi, A.; Fermi, B.; Corsini, R.; Folli, C.; Speranzini, V.; Gan-
dolfi, F.; Bettati, S.; Ronda, L.; Cendron, L.; Berni, R.; Zanotti, G.; Percudani,
R. Catalysis and Structure of Zebrafish Urate Oxidase Provide Insights into
the Origin of Hyperuricemia in Hominoids. Sci. Rep. 2016, 6, 1–13.
(38) Schrader, M.; Fahimi, H. D. Peroxisomes and oxidative stress. Biochim. Bio-
phys. Acta - Mol. Cell Res. 2006, 1763, 1755–1766.
(39) Terlecky, S. R.; Koepke, J. I.; Walton, P. A. Peroxisomes and aging. Biochim.
Biophys. Acta - Mol. Cell Res. 2006, 1763, 1749–1754.
(40) Proctor, P. Similar Functions of Uric Acid and Ascorbate in Man? Nature
1970, 228, 868.
(41) Waring, W. Uric acid: an important antioxidant in acute ischaemic stroke. Q
J Med An Int. J. Med. 2002, 95, 691–693.
(42) Simic, M. G.; Jovanovic, S. V. Antioxidation mechanisms of uric acid. J. Am.
Chem. Soc. 1989, 111, 5778–5782.
(43) Becker, B. F. Towards the physiological function of uric acid. Free Radic. Biol.
Med. 1993, 14, 615–631.
(44) Howell, R. R.; Wyngaarden, J. B. On the mechanism of peroxidation of uric
acids by hemoproteins. J. Biol. Chem. 1960, 235, 3544–3550.
(45) Maples, K. R.; Mason, R. P. Free radical metabolite of uric acid. J. Biol. Chem.
1988, 263, 1709–1712.
BIBLIOGRAPHY 227
(46) Mazzali, M.; Watanabe, S.; Johnson, R. J.; Rodriguez-Iturbe, B.; Feig, D.;
Kang, D.-H.; Kanellis, J.; Herrera-Acosta, J.; Kivlighn, S.; Tuttle, K. R. Is
There a Pathogenetic Role for Uric Acid in Hypertension and Cardiovas-
cular and Renal Disease? Hypertension 2003, 41, 1183–1190.
(47) Nimse, S. B.; Pal, D. Free radicals, natural antioxidants, and their reaction
mechanisms. RSC Adv. 2015, 5, 27986–28006.
(48) Skinner, K. A.; Parks, D. A.; Khoo, N. H. Uric Acid Metabolism. Encycl. Life
Sci. 2006, DOI: 10.1038/npg.els.0003910.
(49) Ragab, G.; Elshahaly, M.; Bardin, T. Gout: An old disease in new perspective
– A review. J. Adv. Res. 2017, 8, 495–511.
(50) Howard, S. C.; Jones, D. P.; Piu, C.-H. The tumor lysis syndrome [3]. N Engl
J Med. 2011, 364, 1844–1854.
(51) Wilson, F. P.; Berns, J. S. Tumor Lysis Syndrome: New Challenges and Recent
Advances. Adv Chronic Kidney Dis. 2014 2014, 21, 18–26.
(52) Legoux, R.; Delpech, B.; Dumont, X.; Guillemot, J. C.; Ramond, P.; Shire, D.;
Caput, D.; Ferrara, P.; Loison, G. Cloning and expression in Escherichia coli
of the gene encoding Aspergillus flavus urate oxidase. J. Biol. Chem. 1992,
267, 8565–8570.
(53) Leplatois, P.; Le Douarin, B.; Loison, G. High-level production of a peroxi-
somal enzyme: Aspergillus flavus uricase accumulates intracellularly and is
active in Saccharomyces cerevisiae. Gene 1992, 122, 139–145.
(54) Hochberg, J.; Cairo, M. S. Rasburicase: future directions in tumor lysis man-
agement. Expert Opin. Biol. Ther. 2008, 8, 1595–1604.
(55) Pacher, P.; Nivorozhkin, A.; Szabo, C. Therapeutic effecrs of xanthine oxi-
dase inhibitors: renaissance half a century after the discovery of allopurinol.
Pharmacol. Rev. 2008, 58, 87–114.
(56) Doniselli, N.; Monzeglio, E.; Dal Palù, A.; Merli, A.; Percudani, R. The iden-
tification of an integral membrane, cytochrome c urate oxidase completes
the catalytic repertoire of a therapeutic enzyme. Sci. Rep. 2015, 5, 1–12.

BIBLIOGRAPHY 228
(57) Hicks, K. A.; O’Leary, S. E.; Begley, T. P.; Ealick, S. E. Structural and Mecha-
nistic Studies of HpxO, a Novel FAD- dependent Urate Oxidase from Kleb-
siella pneumoniae. Biochemistry 2013, 52, 477–487.
(58) Michiel, M.; Perchat, N.; Perret, A.; Tricot, S.; Papeil, A.; Besnard, M.; De
Berardinis, V.; Salanoubat, M.; Fischer, C. Microbial urate catabolism: Char-
acterization of HpyO, a non-homologous isofunctional isoform of the flavo-
protein urate hydroxylase HpxO. Environ. Microbiol. Rep. 2012, 4, 642–647.
(59) Bongaerts, G. P. A.; Vogels, G. D. Mechanism of uricase action. BBA - Enzy-
mol. 1979, 567, 295–308.
(60) Mahler, H. R.; Hubscher, G.; Baum, H. Studies on Uricase I. Preparation,
Purification and Properties of a Cuproprotein. J. Biol. Chem. 1955, 216, 625–
642.
(61) Nishimura, H.; Matsushima, A.; Yoshida, K.; Inada, Y. Physicochemical of
Uricase from Properties Candida and States utilis of Sulfhydryl Groups of
uric with molecular oxygen serving as the electron acceptor , was first found
in bovine by Schittenhelm properties literature as to the metal ions and the
role of. 1982, 91, 41–48.
(62) Conley, T. G.; Priest, D. G. Non-classical inhibition of uricase by cyanide.
Biochem. J. 1980, 187, 733–738.
(63) Bergmann, H.; Preddie, E.; Verma, D. Nodulin-35: a subunit of specific uri-
case (uricase II) induced and localized in the uninfected cells of soybean
nodules. EMBO J. 1983, 2, 2333–2339.
(64) Kahn, K; Tipton, P. A. Kinetic mechanism and cofactor of soybean root nod-
ule urate oxidase. Biochemistry 1997, 36, 4731–4738.
(65) Colloc’h, N.; El Hajji, M.; Bachet, B.; L’Hermite, G.; Schiltz, M.; Prangé, T.;
Castro, B.; Mornon, J. P. Crystal structure of the protein drug urate oxidase-
inhibitor complex at 2.05 Å resolution. Nat. Struct. Biol. 1997, 4, 947–952.

BIBLIOGRAPHY 229
(66) Colloc’h, N.; Poupon, A.; Mornon, J. P. Sequence and structural features of
the T-fold, an original tunnelling building unit. Proteins Struct. Funct. Genet.
2000, 39, 142–154.
(67) https://www.ncbi.nlm.nih.gov/Structure/cdd/cl00263.
(68) Retailleau, P.; Colloc, N.; Vivare Ás, D.; Ëoise Bonnete Â, F.; Castro, B.; El Ha-
jji, M.; Mornon, J.-P.; Ârald Monard, G.; Prange Â, T. Complexed and ligand-
free high-resolution structures of urate oxidase (Uox) from Aspergillus flavus:
a reassignment of the active-site binding mode. Acta Cryst 2004, 60, 453–462.
(69) Wang, Y.; Li, Y.; Yan, H. Mechanism of dihydroneopterin aldolase: Func-
tional roles of the conserved active site glutamate and lysine residues. Bio-
chemistry 2006, 45, 15232–15239.
(70) Poupon, A.; Mornon, J. P. "Topohydrophobic positions" as key markers of
globular protein folds. Theor. Chem. Acc. 1999, 101, 2–8.
(71) Murzin, A. G.; Bateman, A. Distant Homology Recognition Using Struc-
tural. Proteins Struct. Funct. Genet. 1997, 112, 105–112.
(72) Orengo, C. A.; Jones, D. T.; Janet, B. Protein superfamilies and domain su-
perfolds. Nature 1994, 372, 2–5.
(73) Gouet, P.; Courcelle, E.; Stuart, D. I.; Métoz, F. ESPript: Analysis of multiple
sequence alignments in PostScript. Bioinformatics 1999, 15, 305–308.
(74) Robert, X.; Gouet, P. Deciphering key features in protein structures with the
new ENDscript server. Nucleic Acids Res. 2014, 42, 320–324.
(75) Berman, H. M.; Westbrook, J.; Feng, Z.; Gilliland, G.; Bhat, T. N.; Weissig,
H.; Shindyalov, I. N.; Bourne, P. E. The protein data bank. Nucleic Acids Res.
2000, 28, 235–242.
(76) Retailleau, P.; Colloc’h, N.; Vivarès, D.; Bonneté, F.; Castro, B.; El Hajji, M.;
Prangé, T. Urate oxidase from Aspergillus flavus: New crystal-packing con-
tacts in relation to the content of the active site. Acta Crystallogr. Sect. D Biol.
Crystallogr. 2005, 61, 218–229.

BIBLIOGRAPHY 230
(77) Gabison, L.; Chiadmi, M.; Colloc’h, N.; Castro, B.; El Hajji, M.; Prangé, T.
Recapture of [S]-allantoin, the product of the two-step degradation of uric
acid, by urate oxidase. FEBS Lett. 2006, 580, 2087–2091.
(78) Gabison, L.; Chiadmi, M.; El Hajji, M.; Castro, B.; Colloch, N.; Prangé, T.
Near-atomic resolution structures of urate oxidase complexed with its sub-
strate and analogues: The protonation state of the ligand. Acta Crystallogr.
Sect. D Biol. Crystallogr. 2010, 66, 714–724.
(79) Gabison, L.; Colloc’h, N.; Prangé, T. Azide inhibition of urate oxidase. Acta
Crystallogr. Sect. FStructural Biol. Commun. 2014, 70, 896–902.
(80) Oksanen, E.; Blakeley, M. P.; El-Hajji, M.; Ryde, U.; Budayova-Spano, M. The
neutron structure of urate oxidase resolves a long-standing mechanistic co-
nundrum and reveals unexpected changes in protonation. PLoS One 2014, 9,
1–10.
(81) Bui, S.; Von Stetten, D.; Jambrina, P. G.; Prangé, T.; Colloc’h, N.; De Sanc-
tis, D.; Royant, A.; Rosta, E.; Steiner, R. A. Direct evidence for a peroxide
intermediate and a reactive enzyme-substrate-dioxygen configuration in a
cofactor-free oxidase. Angew. Chemie - Int. Ed. 2014, 53, 13710–13714.
(82) Gabison, L.; Chopard, C.; Colloc’h, N.; Peyrot, F.; Castro, B.; Hajji, M. E.;
Altarsha, M.; Monard, G.; Chiadmi, M.; Prangé, T. X-ray, ESR, and quantum
mechanics studies unravel a spin well in the cofactor-less urate oxidase. Pro-
teins Struct. Funct. Bioinforma. 2011, 79, 1964–1976.
(83) Gabison, L.; Prangé, T.; Colloc’h, N.; El Hajji, M.; Castro, B.; Chiadmi, M.
Structural analysis of urate oxidase in complex with its natural substrate
inhibited by cyanide: Mechanistic implications. BMC Struct. Biol. 2008, 8, 1–
8.
(84) Gadda, G. Oxygen activation in flavoprotein oxidases: The importance of
being positive. Biochemistry 2012, 51, 2662–2669.
(85) Roth, J. P.; Wincek, R.; Nodet, G.; Edmondson, D. E.; McIntire, W. S.; Klin-
man, J. P. Oxygen isotope effects on electron transfer to O2 probed using
BIBLIOGRAPHY 231
chemically modified flavins bound to glucose oxidase. J. Am. Chem. Soc.
2004, 126, 15120–15131.
(86) Klinman, J. P. How Do Enzymes Activate Oxygen without Inactivating Them-
selves ? Acc. Chem. Res. 2007, 40, 325–333.
(87) Colloc’h, N.; Prangé, T. Functional relevance of the internal hydrophobic
cavity of urate oxidase. FEBS Lett. 2014, 588, 1715–1719.
(88) Colloc’h, N.; Gabison, L.; Monard, G.; Altarsha, M.; Chiadmi, M.; Maras-
sio, G.; Sopkova-de Oliveira Santos, J.; El Hajji, M.; Castro, B.; Abraini, J. H.;
Prangé, T. Oxygen Pressurized X-Ray Crystallography: Probing the Dioxy-
gen Binding Site in Cofactorless Urate Oxidase and Implications for Its Cat-
alytic Mechanism. Biophys. J. 2008, 95, 2415–2422.
(89) Gouet, P.; Jouve, H. M.; Dideberg, O. Crystal structure of Proteus mirabilis
PR catalase with and without bound NADPH. J. Mol. Biol. 1995, 249, 933–
954.
(90) Putnam, C. D.; Arvai, A. S.; Bourne, Y.; Tainer, J. A. Active and inhibited
human catalase structures: ligand and NADPH binding and catalytic mech-
anism. J. Mol. Biol. 2000, 296, 295–309.
(91) Imhoff, R. D.; Power, N. P.; Borrok, M. J.; Tipton, P. A. General base catalysis
in the urate oxidase reaction: Evidence for a novel Thr-Lys catalytic diad.
Biochemistry 2003, 42, 4094–4100.
(92) Trickey, P.; Wagner, M. A.; Jorns, M. S.; Mathews, F. S. Monomeric sarco-
sine oxidase : structure of a covalently flavinylated amine oxidizing enzyme.
Structure 1999, 315, 331–345.
(93) Juan, E. C. M.; Hoque, M. M.; Shimizu, S.; Hossain, M. T.; Yamamoto, T.;
Imamura, S.; Suzuki, K.; Tsunoda, M.; Amano, H.; Sekiguchi, T.; Takénaka,
A. Structures of Arthrobacter globiformis urate oxidase-ligand complexes.
Acta Crystallogr. Sect. D Biol. Crystallogr. 2008, 64, 815–822.
(94) Hibi, T.; Nago, T.; Nishiya, Y.; Oda, J. Crystal structure of urate oxidase from
Bacillus sp. TB-90 co-crystallized with 8-azaxanthine., DOI 10.2210/pdb1j2g/pdb.

BIBLIOGRAPHY 232
(95) Kendrew, S. G.; Hopwood, D. A. Identification of a Monooxygenase from
Streptomyces coelicolor A3 ( 2 ) Involved in Biosynthesis of Actinorhodin :
Purification and Characterization of the Recombinant Enzyme. J. Bacteriol.
1997, 179, 4305–4310.
(96) Roth, J. P.; Klinman, J. P. Catalysis of electron transfer during activation of O
2 by the flavoprotein glucose oxidase. 2003, 100, 2–7.
(97) Steiner, R. A.; Janssen, H. J.; Roversi, P.; Oakley, A. J.; Fetzner, S. Structural
basis for cofactor-independent dioxygenation of N-heteroaromatic compounds
at the alpha/beta-hydrolase fold. Proc. Natl. Acad. Sci. U. S. A. 2010, 107, 657–
62.
(98) Bugg, T. D. Diverse catalytic activities in the αβ-hydrolase family of en-
zymes: Activation of H2O, HCN, H2O2, and O2. Bioorg. Chem. 2004, 32, 367–
375.
(99) Nardini, M.; Dijkstra, B. W. α/β hydrolase fold enzymes: The family keeps
growing. Curr. Opin. Struct. Biol. 1999, 9, 732–737.
(100) Rauwerdink, A.; Kazlauskas, R. J. How the Same Core Catalytic Machinery
Catalyzes 17 Different Reactions: The Serine-Histidine-Aspartate Catalytic
Triad of alpha/beta-Hydrolase Fold Enzymes. ACS Catal. 2015, 5, 6153–6176.
(101) Keilin, D; Hartree, E. F. Uricase, Amino Acid Oxidase, and Xanthine Oxi-
dase. Proc. R. Soc. London. Ser. B - Biol. Sci. 1936, 119, 114–140.
(102) Laboureur, P; Langlois, C Urate oxidase of Aspergillus flavus. II. Metabolism,
inhibition, specificity. Bull. Soc. Chim. Biol. (Paris). 1968, 50, 827–41.
(103) Bergmann, F.; Dikstein, S. The Relationship between Spectral Shifts and Struc-
tural Changes in Uric Acids and Related Compounds. J. Am. Chem. Soc. 1955,
77, 691–696.
(104) Pfleiderer, W Synthese, Struktur und Eigenschaften der Harnsäure sowie
ihrer N-Methylderivate. Liebigs Ann. Chem. 1974, 2030–2045.

BIBLIOGRAPHY 233
(105) Goyal, R. N.; Mittal, A.; Agarwal, D. Electrochemical oxidation and kinetics
of the decay of UV-absorbing intermediate of uric acid oxidation at pyrolytic
graphite electrodes. Can. J. Chem. 1994, 72, 1668–1674.
(106) Kahn, K.; Serfozo, P.; Tipton, P. A. Identification of the true product of the
urate oxidase reaction. J. Am. Chem. Soc. 1997, 119, 5435–5442.
(107) Mandel, N. S.; Mandel, G. S. Monosodium Urate Monohydrate, the Gout
Culprit. J. Am. Chem. Soc. 1976, 98, 2319–2323.
(108) Altarsha, M.; Castro, B.; Monard, G. Intrinsic reactivity of uric acid with
dioxygen: Towards the elucidation of the catalytic mechanism of urate oxi-
dase. Bioorg. Chem. 2009, 37, 111–125.
(109) Glickman, M. H.; Klinman, J. P. Lipoxygenase reaction mechanism: Demon-
stration that hydrogen abstraction from substrate precedes dioxygen bind-
ing during catalytic turnover. Biochemistry 1996, 35, 12882–12892.
(110) Busi, E.; Terzuoli, L.; Basosi, R.; Porcelli, B.; Marinello, E. EPR spin trap-
ping of a radical intermediate in the urate oxidase reaction. Nucleosides, Nu-
cleotides and Nucleic Acids 2004, 23, 1131–1134.
(111) Oksanen, E; Blakeley, M. P.; Bonnete, F.; Dauvergne, M. T.; Dauvergne, F;
Budayova-Spano, M Large crystal growth by thermal control allows com-
bined X-ray and neutron crystallographic studies to elucidate the protona-
tion states in Aspergillus flavus urate oxidase. J. R. Soc. Interface 2009, 6,
S599–S610.
(112) Wei, D.; Huang, X.; Qiao, Y.; Rao, J.; Wang, L.; Liao, F.; Zhan, C. G. Cat-
alytic Mechanisms for Cofactor-Free Oxidase-Catalyzed Reactions: Reaction
Pathways of Uricase-Catalyzed Oxidation and Hydration of Uric Acid. ACS
Catal. 2017, 7, 4623–4636.
(113) Kahn, K.; Tipton, P. A. Spectroscopic characterization of intermediates in the
urate oxidase reaction. Biochemistry 1998, 37, 11651–11659.
(114) Hamilton, G, A. In Mol. Mech. Oxyg. Act. Hayaishi, O., Ed.; Academic Press:
New York, 1974, pp 405–451.

BIBLIOGRAPHY 234
(115) Sarma, A. D.; Tipton, P. A. Evidence for urate hydroperoxide as an interme-
diate in the urate oxidase reaction. J. Am. Chem. Soc. 2000, 122, 11252–11253.
(116) Chaiyen, P.; Fraaije, M. W.; Mattevi, A. The enigmatic reaction of flavins with
oxygen. Trends Biochem. Sci. 2012, 37, 373–380.
(117) Thierbach, S.; Bui, N.; Zapp, J.; Chhabra, S. R.; Kappl, R.; Fetzner, S. Substrate-
assisted O2 activation in a cofactor-independent dioxygenase. Chem. Biol.
2014, 21, 217–225.
(118) Machovina, M. M.; Usselman, R. J.; Du Bois, J. L. Monooxygenase substrates
mimic flavin to catalyze cofactorless oxygenations. J. Biol. Chem. 2016, 291,
17816–17828.
(119) Widboom, P. F.; Fielding, E. N.; Liu, Y.; Bruner, S. D. Structural basis for
cofactor-independent dioxygenation in vancomycin biosynthesis. Nature 2007,
447, 342–345.
(120) Felix, F.; Scheel, F.; Schuler, W. Die urikolyse. Hoppe-Seyl Z 1929, 180, 90–106.
(121) Modric, N.; Derome, A. E.; Ashcroft, S. J.; Poje, M. Tracing and identification
of uricase. Reaction intermediates. A direct 13C-NMR/isotope-labelling ev-
idence. Tetrahedron Lett. 1992, 33, 6691–6694.
(122) Goyal, R. N.; Brajter-Toth, A.; Dryhurst, G. Futher insights into the electro-
chemical oxidation of uric acid. J. Electroanal. Chem. 1982, 131, 181–202.
(123) Bentley, R; Neuberger, A The mechanism of the action of uricase. Biochem. J.
1952, 52, 694.
(124) Tipton, P. A. Urate to allantoin, specifically (S)-allantoin. Nat. Chem. Biol.
2006, 2, 124–125.
(125) Bergmans, H. E. N.; Van Die, I. M.; Hoekstra, W. P. M. Transformation in
Escherichia coli: stages in the process. J. Bacteriol. 1981, 146, 564–570.
(126) Froger, A.; Hall, J. E. Transformation of Plasmid DNA into E. Coli using the
heat shock method. J. Vis. Exp. 2007, 2007.
(127) Jeong, H. et al. Genome Sequences of Escherichia coli B strains REL606 and
BL21(DE3). J. Mol. Biol. 2009, 394, 644–652.

BIBLIOGRAPHY 235
(128) Baneyx, F. Recombinant protein expression in Escherichia coli. Curr. Opin.
Biotechnol. 1999, 10, 411–421.
(129) https://www.moleculardevices.com/sites /default/files/en/assets/app-note/br/measure-
long-term-cell-growth-using-a -discontinuous-kinetic-reading.pdf.
(130) Fujikawa, H.; Kai, A.; Morozumi, S. A new logistic model for Escherichia
coli growth at constant and dynamic temperatures. Food Microbiol. 2004, 21,
501–509.
(131) Haertlein, M.; Moulin, M.; Devos, J. M.; Laux, V.; Dunne, O.; Forsyth, V. T.
Biomolecular Deuteration for Neutron Structural Biology and Dynamics.
Methods Enzymol. 2016, 566, 113–157.
(132) Myles, D. A. Neutron protein crystallography: current status and a brighter
future. Curr. Opin. Struct. Biol. 2006, 16, 630–637.
(133) Liu, X.; Hanson, B. L.; Langan, P.; Viola, R. E. The effect of deuteration
on protein structure: A high-resolution comparison of hydrogenous and
perdeuterated haloalkane dehalogenase. Acta Crystallogr. Sect. D Biol. Crys-
tallogr. 2007, 63, 1000–1008.
(134) Meilleur, F.; Contzen, J.; Myles, D. A. A.; Jung, C. Structural stability and dy-
namics of hydrogenated and perdeuterated cytochrome P450cam (CYP101).
Biochemistry 2004, 43, 8744–8753.
(135) Hattori, A.; Crespi, H. L.; Katz, J. J. Effect of Side-Chain Deuteration on Pro-
tein Stability. Biochemistry 1965, 4, 1213–1225.
(136) Yee, A. W.; Moulin, M.; Breteau, N.; Haertlein, M.; Mitchell, E. P.; Cooper,
J. B.; Boeri Erba, E.; Forsyth, V. T. Impact of Deuteration on the Assembly
Kinetics of Transthyretin Monitored by Native Mass Spectrometry and Im-
plications for Amyloidoses. Angew. Chemie - Int. Ed. 2016, 55, 9292–9296.
(137) Piszczek, G.; Lee, J. C.; Tjandra, N.; Lee, C. R.; Seok, Y. J.; Levine, R. L.; Pe-
terkofsky, A. Deuteration of Escherichia coli Enzyme INtr alters its stability.
Arch. Biochem. Biophys. 2011, 507, 332–342.

BIBLIOGRAPHY 236
(138) Brockwell, D. Physicochemical consequences of the perdeuteriation of glu-
tathione S-transferase from S. japonicum. Protein Sci. 2001, 10, 572–580.
(139) Liu, X.; Hanson, B. L.; Langan, P.; Viola, R. E. The effect of deuteration
on protein structure: A high-resolution comparison of hydrogenous and
perdeuterated haloalkane dehalogenase. Acta Crystallogr. Sect. D Biol. Crys-
tallogr. 2007, 63, 1000–1008.
(140) White, J.; Heß, D.; Raynes, J.; Laux, V.; Haertlein, M.; Forsyth, V. T.; Jeyasing-
ham, A. The aggregation of “native” human serum albumin. Eur. Biophys. J.
2015, 44, 367–371.
(141) Gamble, T. R.; Clauser, K. R.; Kossiakoff, A. A. The production and X-ray
structure determination of perdeuterated Staphylococcal nuclease. Biophys.
Chem. 1994, 53, 15–25.
(142) Cooper, S. J.; Brockwell, D.; Raftery, J.; Attwood, D.; Barber, J.; Helliwell,
J. R. The X-ray crystal structures of perdeuteriated and protiated enzyme
elongation factor Tu are very similar. Chem. Commun. 1998, 1063–1064.
(143) Blakeley, M. P.; Langan, P.; Niimura, N.; Podjarny, A. Neutron crystallogra-
phy: opportunities, challenges, and limitations. Curr. Opin. Struct. Biol. 2008,
18, 593–600.
(144) Golden, E.; Attwood, P. V.; Duff, A. P.; Meilleur, F.; Vrielink, A. Produc-
tion and characterization of recombinant perdeuterated cholesterol oxidase.
Anal. Biochem. 2015, 485, 102–108.
(145) Fisher, S. J.; Helliwell, J. R. An investigation into structural changes due to
deuteration. Acta Crystallogr. Sect. A Found. Crystallogr. 2008, 64, 359–367.
(146) Green, A. A.; Hughes, W. L. Protein fractionation on the basis of solubility
in aqueous solutions of salts and organic solvents. Methods Enzymol. 1955, 1,
67–90.
(147) Duong-Ly, K. C.; Gabelli, S. B. Salting out of proteins using ammonium sul-
fate precipitation. Methods Enzymol. 2014, 541, 85–94.

BIBLIOGRAPHY 237
(148) Wingfield, P. T. Protein Precipitation Using Ammonium Sulfate HHS Public
Access. Curr Protoc Protein Sci 1994, 3, 3.
(149) Wood, W. I. Tables for the preparation of ammonium sulfate solutions. Anal.
Biochem. 1976, 73, 250–257.
(150) Budayova-Spano, M.; Dauvergne, F.; Audiffren, M.; Bactivelane, T.; Cusack,
S. A methodology and an instrument for the temperature-controlled opti-
mization of crystal growth. Acta Crystallogr. Sect. D Biol. Crystallogr. 2007, 63,
339–347.
(151) Protein Crystallisation, 2nd; Begfors, T. M., Ed.; International University Line:
La Jolla, California, 2009.
(152) Asherie, N. Protein crystallization and phase diagrams. Methods 2004, 34,
266–272.
(153) Nanev, C. N. On some aspects of crystallization process energetics, logistic
new phase nucleation kinetics, crystal size distribution and Ostwald ripen-
ing. J. Appl. Crystallogr. 2017, 50, 1021–1027.
(154) McPherson, A. In Methods Enzymol. Methods in Enzymology C, Vol. 114;
Academic Press: 1985, pp 112–120.
(155) Krauss, I. R.; Merlino, A.; Vergara, A.; Sica, F. An overview of biological
macromolecule crystallization. Int. J. Mol. Sci. 2013, 14, 11643–11691.
(156) McPherson, A.; Gavira, J. A. Introduction to protein crystallization. Acta
Crystallogr. Sect. F Struct. Biol. Commun. 2014, 70, 2–20.
(157) Chayen, N. E. Turning protein crystallisation from an art into a science. Curr.
Opin. Struct. Biol. 2004, 14, 577–583.
(158) Ducroix A. and R. Giegé Crystallization of nucleic acids and proteins: a prac-
tical approach. Acta Crystallogr. Sect. D Biol. Crystallogr. 1994, 50, 112–112.
(159) Wlodawer, A.; Minor, W.; Dauter, Z.; Jaskolski, M. Protein crystallography
for aspiring crystallographers or how to avoid pitfalls and traps in macro-
molecular structure determination. FEBS J. 2013, 280, 5705–5736.
(160) Clegg, W., X-ray Crystallography, Second Edi; Oxford University Press: 2015.

BIBLIOGRAPHY 238
(161) Bragg, W. H.; Bragg, W. L. The Reflection of X-rays by Crystals. Proc. R. Soc.
A Math. Phys. Eng. Sci. 1913, 88, 428–438.
(162) Ewald, P. P. Die Berechnung optischer und elektrostatischer Gitterpoten-
tiale. Ann. Phys. 1921, 369, 253–287.
(163) Arndt, Ulrich Wolfgang; Wonacott, A., The Rotation Method in Crystallogra-
phy: Data Collection from Macromolecular Crystals; 1; North-Holland Pub. Co.:
1977; Vol. 1, p 275.
(164) Blakeley, M. P.; Teixeira, S. C. M.; Petit-Haertlein, I.; Hazemann, I.; Mitschler,
A.; Haertlein, M.; Howard, E.; Podjarny, A. D. Neutron macromolecular
crystallography with LADI-III. Acta Crystallogr. Sect. D Biol. Crystallogr. 2010,
66, 1198–1205.
(165) Myles, D. A.; Bon, C.; Langan, P.; Cipriani, F.; Castagna, J. C.; Lehmann,
M. S.; Wilkinson, C. Neutron Laue diffraction in macromolecular crystallog-
raphy. Phys. B Condens. Matter 1997, 241-243, 1122–1130.
(166) Ren, Z.; Moffat, K. Deconvolution of Energy Overlaps in Laue Diffraction. J.
Appl. Crystallogr. 1995, 28, 482–494.
(167) Powell, H. R. X-ray data processing. Biosci. Rep. 2017, 37, 1–14.
(168) Leslie, A. G. W.; Powell, H. R. In Evol. Methods Macromol. Crystallogr. Read,
R. J., Sussman, J. L., Eds., 1st; Springer, Dordrecht: 2007; Chapter Processing,
pp 41–51.
(169) Kabsch, W. <i>XDS</i>. Acta Crystallogr. Sect. D Biol. Crystallogr. 2010, 66,
125–132.
(170) Otwinowski, Z.; Minor, W. Processing of X-ray diffraction data collected in
oscillation mode. Methods Enzymol. 1997, 276, 307–326.
(171) Winter, G.; Waterman, D. G.; Parkhurst, J. M.; Brewster, A. S.; Gildea, R. J.;
Gerstel, M.; Fuentes-Montero, L.; Vollmar, M.; Michels-Clark, T.; Young, I. D.;
Sauter, N. K.; Evans, G. DIALS: Implementation and evaluation of a new in-
tegration package. Acta Crystallogr. Sect. D Struct. Biol. 2018, 74, 85–97.

BIBLIOGRAPHY 239
(172) Campbell, J. W. Lauegen, an X-Windows-Based Program for the Processing
of Laue X-Ray-Diffraction Data. J. Appl. Crystallogr. 1995, 28, 228–236.
(173) Arzt, S.; Campbell, J. W.; Harding, M. M.; Hao, Q; Helliwell, J. R. LSCALE
- The new normalization, scaling and absorption correction program in the
Daresbury Laue software suite. J. Appl. Crystallogr. 1999, 32, 554–562.
(174) Diederichs, K. Some aspects of quantitative analysis and correction of radi-
ation damage. Acta Crystallogr. Sect. D Biol. Crystallogr. 2006, 62, 96–101.
(175) Weiss, M. S.; Hilgenfeld, R. On the use of the merging R factor as a quality
indicator for X-ray data. J. Appl. Crystallogr. 1997, 30, 203–205.
(176) Diederichs, K.; Karplus, P. A. Improved R-factors for diffraction data analy-
sis in macromolecular crystallography. Nature 1997, 4, 269–275.
(177) Weiss, M. S. Global indicators of X-ray data quality. J. Appl. Crystallogr. 2001,
34, 130–135.
(178) Winter, G. Xia2: An expert system for macromolecular crystallography data
reduction. J. Appl. Crystallogr. 2010, 43, 186–190.
(179) Karplus, P. A.; Diederichs, K. Assessing and maximizing data quality in
macromolecular crystallography., 2015.
(180) Tronrud, D. E. Introduction to macromolecular refinement. Acta Crystallogr.
Sect. D Biol. Crystallogr. 2004, 60, 2156–2168.
(181) Bernstein, F. C.; Koetzle, T. F.; Williams, G. J. B.; Meyer, E. F.; Brice, M. D.;
Rodgers, J. R.; Kennard, O.; Shimanouchi, T.; Tasumi, M. The Protein Data
Bank : A Computer-based Archival File for Macromolecular Structures. J.
Mol. Biol. 1977, 112, 535–542.
(182) Engh, R. A.; Huber, R. Accurate bond and angle parameters for X-ray pro-
tein structure refinement. Acta Crystallogr. Sect. A 1991, 47, 392–400.
(183) Steiner, R. A.; Tucker, J. A. Keep it together: restraints in crystallographic re-
finement of macromolecule–ligand complexes. Acta Crystallogr. Sect. D Struct.
Biol. 2017, 73, 93–102.

BIBLIOGRAPHY 240
(184) Headd, J. J.; Echols, N.; Afonine, P. V.; Grosse-Kunstleve, R. W.; Chen, V. B.;
Moriarty, N. W.; Richardson, D. C.; Richardson, J. S.; Adams, P. D. Use of
knowledge-based restraints in phenix.refine to improve macromolecular re-
finement at low resolution. Acta Crystallogr. Sect. D Biol. Crystallogr. 2012, 68,
381–390.
(185) Emsley, P.; Lohkamp, B.; Scott, W. G.; Cowtan, K. Features and development
of Coot. Acta Crystallogr. Sect. D Biol. Crystallogr. 2010, 66, 486–501.
(186) Afonine, P. V.; Mustyakimov, M.; Grosse-Kunstleve, R. W.; Moriarty, N. W.;
Langan, P.; Adams, P. D. Joint X-ray and neutron refinement with phenix.refine.
Acta Crystallogr. Sect. D Biol. Crystallogr. 2010, 66, 1153–1163.
(187) Hamilton, W. C. Significance tests on the crystallographic R factor. Acta
Crystallogr. 1965, 18, 502–510.
(188) Brünger, A. T. Free R value: A novel statistical quantity for assessing the
accuracy of crystal structures. Nature 1992, 355, 472–475.
(189) Ramachandran, G. N.; Ramakrishnan, C; Sasisekharan, V Stereochemistry
of Polypeptide Chain Configurations. J. Mol. Biol. 1963, 7, 95–99.
(190) Carugo, O.; Djinovic Carugo, K. Half a century of Ramachandran plots. Acta
Crystallogr. Sect. D Biol. Crystallogr. 2013, 69, 1333–1341.
(191) Evans, P.; McCoy, A. An introduction to molecular replacement. Acta Crys-
tallogr. Sect. D Biol. Crystallogr. 2007, 64, 1–10.
(192) Hersleth, H. P.; Andersson, K. K. How different oxidation states of crys-
talline myoglobin are influenced by X-rays. Biochim. Biophys. Acta - Proteins
Proteomics 2011, 1814, 785–796.
(193) Weiss, M. S.; Panjikar, S.; Mueller-Dieckmann, C.; Tucker, P. A. On the influ-
ence of the incident photon energy on the radiation damage in crystalline
biological samples. J. Synchrotron Radiat. 2005, 12, 304–309.
(194) Wilmot, C. M.; Sjögren, T.; Carlsson, G. H.; Berglund, G. I.; Hajdu, J. Defining
redox state of X-ray crystal structures by single-crystal ultraviolet-visible
microspectrophotometry. Methods Enzymol. 2002, 353, 301–318.

BIBLIOGRAPHY 241
(195) O’Neill, P.; Stevens, D. L.; Garman, E. F. Physical and chemical consider-
ations of damage induced in protein crystals by synchrotron radiation: A
radiation chemical perspective. J. Synchrotron Radiat. 2002, 9, 329–332.
(196) Wherland, S.; Pecht, I. Radiation chemists look at damage in redox proteins
induced by X-rays. Proteins Struct. Funct. Bioinforma. 2018, 86, 817–826.
(197) Garman, E. Cool data: Quantity AND quality. Acta Crystallogr. Sect. D Biol.
Crystallogr. 1999, 55, 1641–1653.
(198) Murray, J.; Garman, E. Investigation of possible free-radical scavengers and
metrics for radiation damage in protein cryocrystallography. J. Synchrotron
Radiat. 2002, 9, 347–354.
(199) Ravelli, R. B. G.; McSweeney, S. M. The ’fingerprint’ that X-rays can leave
on structures. Structure 2000, 8, 315–328.
(200) Burmeister, W. P. Structural changes in a cryo-cooled protein crystal owing
to radiation damage. Acta Crystallogr. Sect. D Biol. Crystallogr. 2000, 56, 328–
341.
(201) Weik, M.; Ravelli, R. B.; Kryger, G.; McSweeney, S.; Raves, M. L.; Harel, M.;
Gros, P.; Silman, I.; Kroon, J.; Sussman, J. L. Specific chemical and structural
damage to proteins produced by synchrotron radiation. Proc. Natl. Acad. Sci.
U. S. A. 2000, 97, 623–628.
(202) Pflugrath, J. W. Practical macromolecular cryocrystallography. Acta Crystal-
logr. Sect. F Struct. Biol. Commun. 2015, 71, 622–642.
(203) Carugo, O.; Carugo, K. D. When X-rays modify the protein structure: Radi-
ation damage at work. Trends Biochem. Sci. 2005, 30, 213–219.
(204) Beitlich, T.; Kühnel, K.; Schulze-Briese, C.; Shoeman, R. L.; Schlichting, I.
Cryoradiolytic reduction of crystalline heme proteins: Analysis by UV-Vis
spectroscopy and X-ray crystallography. J. Synchrotron Radiat. 2007, 14, 11–
23.

BIBLIOGRAPHY 242
(205) Van Thor, J. J.; Gensch, T.; Hellingwerf, K. J.; Johnson, L. N. Phototransfor-
mation of green fluorescent protein with UV and visible light leads to de-
carboxylation of glutamate 222. Nat. Struct. Biol. 2002, 9, 37–41.
(206) Garman, E. ’Cool’ crystals: Macromolecular cryocrystallography and radia-
tion damage. Curr. Opin. Struct. Biol. 2003, 13, 545–551.
(207) Zwart, P. H.; Banumathi, S.; Dauter, M.; Dauter, Z. Radiation-damage-induced
phasing with anomalous scattering: substructure solution and phasing. Acta
Crystallogr. Sect. D 2004, 60, 1958–1963.
(208) Ravelli, R. B.; Nanao, M. H.; Lovering, A.; White, S.; McSweeney, S. Phasing
in the presence of radiation damage. J. Synchrotron Radiat. 2005, 12, 276–284.
(209) Berglund, G. I.; Carlsson, G. H.; Smith, A. T.; Szöke, H.; Henriksen, A.; Ha-
jdu, J. The catalytic pathway of horseradish peroxidase at high resolution.
Nature 2002, 417, 463–468.
(210) Holton, J. M. A beginner’s guide to radiation damage. J. Synchrotron Radiat.
2009, 16, 133–142.
(211) Ravelli, R. B.; Garman, E. F. Radiation damage in macromolecular cryocrys-
tallography. Curr. Opin. Struct. Biol. 2006, 16, 624–629.
(212) Nave, C.; Garman, E. F. Towards an understanding of radiation damage in
cryocooled macromolecular crystals. J. Synchrotron Radiat. 2005, 12, 257–260.
(213) Garman, E. F. Radiation damage in macromolecular crystallography : what
is it and why should we care ? research papers. Acta Cryst 2010, 66, 339–351.
(214) Hajdu, J.; Neutze, R.; Sjögren, T.; Edman, K.; Szöke, A.; Wilmouth, R. C.;
Wilmot, C. M. Analyzing protein functions in four dimensions. Nat. Struct.
Biol. 2000, 7, 1006–1012.
(215) Halsted, T. P.; Yamashita, K.; Gopalasingam, C. C.; Shenoy, R. T.; Hirata,
K.; Ago, H.; Ueno, G.; Blakeley, M. P.; Eady, R. R.; Antonyuk, S. V.; Ya-
mamoto, M.; Hasnain, S. S. Catalytically important damage-free structures
of a copper nitrite reductase obtained by femtosecond X-ray laser and room-
temperature neutron crystallography. Int. Union Crystallogr. 2019, 6, 761–772.
BIBLIOGRAPHY 243
(216) Owen, R. L.; Axford, D.; Nettleship, J. E.; Owens, R. J.; Robinson, J. I.; Mor-
gan, A. W.; Dore, A. S.; Lebon, G.; Tate, C. G.; Fry, E. E.; Ren, J.; Stuart, D.;
Evans, G. Outrunning free radicals in room-temperature macromolecular
crystallography research papers. Biol. Crystallogr. 2012, D68, 810–818.
(217) Casadei, C. M.; Gumiero, A.; Metcalfe, C. L.; Murphy, E. J.; Basran, J.; Con-
cilio, M. G.; Teixeira, S. C.; Schrader, T. E.; Fielding, A. J.; Ostermann, A.;
Blakeley, M. P.; Raven, E. L.; Moody, P. C. Neutron cryo-crystallography
captures the protonation state of ferryl heme in a peroxidase. Science (80-.
). 2014, 345, 193–197.
(218) Howard, E. I.; Sanishvili, R; Cachau, R. E.; Mitschler, A; Chevrier, B; Barth,
P; Lamour, V; Van Zandt, M.; Sibley, E; Bon, C; Moras, D; Schneider, T. R.;
Joachimiak, A; Podjarny, A. Ultrahigh resolution drug design I: Details of
interactions in human aldose reductase-inhibitor complex at 0.66 Å. Proteins
Struct. Funct. Genet. 2004, 55, 792–804.
(219) Schoenborn, B. P. In Neutron Opt. Devices Appl. Ed. by Majkrzak, C. F.; Wood,
J. L., International Society for Optics and Photonics: 2005; Vol. 1738, pp 192–
198.
(220) Hoghoj, P.; Anderson, I.S.; Ebisawa, T.; Takeda, T. Fabrication and perfor-
mance of a large wavelength band multilayer monochromator. J. Phys. Soc.
Japa 1996, 65, 296–298.
(221) Niimura, N.; Podjarny, A., Neutron Protein Crystallography: Hydrogen, Pro-
tons, and Hydration in Bio-macromolecules, 2011, pp 1–252.
(222) https://www.ill.eu/users/instruments /instruments-list/ladi-iii/description
/instrument-layout/.
(223) Niimura, N.; Karasawa, Y.; Tanaka, I.; Miyahara, J.; Takahashi, K.; Saito, H.;
Tsuruno, A.; Matsubayashi, M. An imaging plate neutron detector. Nucl.
Instruments Methods Phys. Res. A 1994, 521–525.

BIBLIOGRAPHY 244
(224) Wilkinson, C.; Lehmann, M. S.; Meilleur, F.; Blakeley, M. P.; Myles, D. A. A.;
Vogelmeier, S.; Thoms, M.; Walsh, M.; McIntyre, G. J. Characterization of
image plates for neutron diffraction. J. Appl. Crystallogr. 2009, 42, 749–757.
(225) Meilleur, F. Characterization of image plates for neutron diffraction. J. Appl.
Crystallogr. 2009, 42, 749–757.
(226) Cipriani, F; Dauvergne, F; Gabriel, A; Wilkinson, C; Lehmann, M. S. Image
plate detectors for macromolecular neutron diffractometry. Biophys. Chem.
1994, 53, 5–13.
(227) De Hoffmann, E.; Stroobant, V., Mass Spectrometry Principles and Applications,
Third Ed.; 6; John Wiley & Sons, Ltd: Chichester, UK, 2007; Vol. 29, p 489.
(228) Fenn, J. B.; Mann, M.; Meng, C. K.; Wong, S. F.; Whitehouse, C. M. Electro-
spray ionization for mass spectrometry of large biomolecules. Science (80-. ).
1989, 246, 64–71.
(229) Brockwell, D; Yu, L; Cooper, S; McCleland, S; Cooper, A; Attwood, D; Gaskell,
S. J.; Barber, J Physicochemical consequences of the perdeuteriation of glu-
tathione S-transferase from S. japonicum. Protein Sci. 2001, 10, 572–80.
(230) Meilleur, F.; Dauvergne, M. T.; Schlichting, I.; Myles, D. A. Production and
X-ray crystallographic analysis of fully deuterated cytochrome P450cam.
Acta Crystallogr. Sect. D Biol. Crystallogr. 2005, D61, 539–544.
(231) Artero, J. B.; Härtlein, M.; McSweeney, S.; Timmins, P. A comparison of re-
fined X-ray structures of hydrogenated and perdeuterated rat γE-crystallin
in H2O and D2O. Acta Crystallogr. Sect. D Biol. Crystallogr. 2005, 61, 1541–
1549.
(232) Hanson, B. L.; Schoenborn, B. P.; Tomanicek, S. J.; Chen, J. C.-H.; Langan, P.;
John, H.; Blum, M.-M.; Rüterjans, H. X-ray structure of perdeuterated diiso-
propyl fluorophosphatase (DFPase): perdeuteration of proteins for neutron
diffraction. Acta Crystallogr. Sect. F Struct. Biol. Cryst. Commun. 2010, 66, 379–
385.

BIBLIOGRAPHY 245
(233) Howard, E. I.; Blakeley, M. P.; Haertlein, M.; Haertlein, I. P.; Mitschler, A.;
Fisher, S. J.; Siah, A. C.; Salvay, A. G.; Popov, A.; Dieckmann, C. M.; Petrova,
T.; Podjarny, A. Neutron structure of type-III antifreeze protein allows the
reconstruction of AFP-ice interface. J. Mol. Recognit. 2011, 24, 724–732.
(234) Weber, I. T.; Waltman, M. J.; Mustyakimov, M.; Blakeley, M. P.; Keen, D. A.;
Ghosh, A. K.; Langan, P.; Kovalevsky, A. Y. Joint X - ray/Neutron Crys-
tallographic Study of HIV - 1 Protease with Clinical Inhibitor Amprenavir:
Insights for Drug Design. J. Med. Chem. 2013, 56, 5631–5635.
(235) Manzoni, F.; Saraboji, K.; Sprenger, J.; Kumar, R.; Noresson, A. L.; Nilsson,
U. J.; Leffler, H.; Fisher, S. Z.; Schrader, T. E.; Ostermann, A.; Coates, L.;
Blakeley, M. P.; Oksanen, E.; Logan, D. T. Perdeuteration, crystallization,
data collection and comparison of five neutron diffraction data sets of com-
plexes of human galectin-3C. Acta Crystallogr. Sect. D Struct. Biol. 2016, 72,
1194–1202.
(236) Kelpšas, V.; Lafumat, B.; Blakeley, M. P.; Coquelle, N.; Oksanen, E.; von
Wachenfeldt, C. Perdeuteration, large crystal growth and neutron data col-
lection of Leishmania mexicana triose-phosphate isomerase E65Q variant.
Acta Crystallogr. Sect. F Struct. Biol. Commun. 2019, 75, 260–269.
(237) Huynh, K; Partch, C. L. Current Protocols in Protein Science: Analysis of
protein stability and ligand interactions by thermal shift assay. Curr Protoc
Protein Sci 2016, 1–19.
(238) Bai, N.; Roder, H.; Dickson, A.; Karanicolas, J. Isothermal Analysis of Ther-
moFluor Data can readily provide Quantitative Binding Affinities. Sci. Rep.
2019, 9, 1–15.
(239) Steinberg, T. H.; Jones, L. J.; Haugland, R. P.; Singer, V. L. SYPRO orange and
SYPRO red protein gel stains: One-step fluorescent staining of denaturing
gels for detection of nanogram levels of protein. Anal. Biochem. 1996, 239,
223–237.

BIBLIOGRAPHY 246
(240) Grøftehauge, M. K.; Hajizadeh, N. R.; Swann, M. J.; Pohl, E. Protein-ligand
interactions investigated by thermal shift assays (TSA) and dual polariza-
tion interferometry (DPI). Acta Crystallogr. Sect. D Biol. Crystallogr. 2015, 71,
36–44.
(241) Boivin, S.; Kozak, S.; Meijers, R. Optimization of protein purification and
characterization using Thermofluor screens. Protein Expr. Purif. 2013, 91, 192–
206.
(242) Dupeux, F.; Röwer, M.; Seroul, G.; Blot, D.; Márquez, J. A. A thermal sta-
bility assay can help to estimate the crystallization likelihood of biological
samples. Acta Crystallogr. Sect. D Biol. Crystallogr. 2011, 67, 915–919.
(243) Piszczek, G.; Lee, J. C.; Tjandra, N.; Lee, C. R.; Seok, Y. J.; Levine, R. L.; Pe-
terkofsky, A. Deuteration of Escherichia coli Enzyme INtralters its stability.
Arch. Biochem. Biophys. 2011, 507, 332–342.
(244) Meilleur, F.; Contzen, J.; Myles, D. A. A.; Jung, C. Structural stability and dy-
namics of hydrogenated and perdeuterated cytochrome P450cam (CYP101).
Biochemistry 2004, 43, 8744–8753.
(245) http://encorbio.com/protocols/AM-SO4.htm.
(246) Petit-Haertlein, I.; Blakeley, M. P.; Howard, E.; Hazemann, I.; Mitschler, A.;
Haertlein, M.; Podjarny, A. Perdeuteration, purification, crystallization and
preliminary neutron diffraction of an ocean pout type III antifreeze protein.
Acta Crystallogr. Sect. F Struct. Biol. Cryst. Commun. 2009, 65, 406–409.
(247) Di Costanzo, L.; Moulin, M.; Haertlein, M.; Meilleur, F.; Christianson, D. W.
Expression, purification, assay, and crystal structure of perdeuterated hu-
man arginase I. Arch. Biochem. Biophys. 2007, 465, 82–89.
(248) Munshi, P.; Chung, S. L.; Blakeley, M. P.; Weiss, K. L.; Myles, D. A.; Meilleur,
F. Rapid visualization of hydrogen positions in protein neutron crystallo-
graphic structures. Acta Crystallogr. Sect. D Biol. Crystallogr. 2012, 68, 35–41.

BIBLIOGRAPHY 247
(249) Cuypers, M. G.; Mason, S. A.; Blakeley, M. P.; Mitchell, E. P.; Haertlein, M.;
Forsyth, V. T. Near-atomic resolution neutron crystallography on perdeuter-
ated Pyrococcus furiosus rubredoxin: Implication of hydronium ions and
protonation state equilibria in redox changes. Angew. Chemie - Int. Ed. 2013,
52, 1022–1025.
(250) Hazemann, I.; Dauvergne, M. T.; Blakeley, M. P.; Meilleur, F.; Haertlein, M.;
Van Dorsselaer, A.; Mitschler, A.; Myles, D. A. A.; Podjarny, A. High-resolution
neutron protein crystallography with radically small crystal volumes: Ap-
plication of perdeuteration to human aldose reductase. Acta Crystallogr. Sect.
D Biol. Crystallogr. 2005, 61, 1413–1417.
(251) Evans, P. In Acta Crystallogr. Sect. D Biol. Crystallogr. International Union of
Crystallography: 2006; Vol. 62, pp 72–82.
(252) French, B. Y. S.; Wilson, K. On the Treatment of Negative Intensity Observa-
tions. Acta Cryst 1978, A34, 517–525.
(253) Collaborative Computational Project, N. The CCP4 suite: Programs for pro-
tein crystallography. Acta Crystallogr. Sect. D Biol. Crystallogr. 1994, 50, 760–
763.
(254) Evans, P. R.; Murshudov, G. N. How good are my data and what is the res-
olution? Acta Crystallogr. Sect. D Biol. Crystallogr. 2013, 69, 1204–1214.
(255) Adams, P. D. et al. PHENIX: A comprehensive Python-based system for
macromolecular structure solution. Acta Crystallogr. Sect. D Biol. Crystallogr.
2010, 66, 213–221.
(256) Moriarty, N. W.; Grosse-Kunstleve, R. W.; Adams, P. D. Electronic ligand
builder and optimization workbench (eLBOW): A tool for ligand coordinate
and restraint generation. Acta Crystallogr. Sect. D Biol. Crystallogr. 2009, 65,
1074–1080.
(257) Hurst, D. T.; Griffiths, E.; Vayianos, C. Inhibition of Uricase by Pyrimidine
and Purine Drugs. 1985, 18.

BIBLIOGRAPHY 248
(258) Zeldin, O. B.; Gerstel, M.; Garman, E. F. Optimizing the spatial distribution
of dose in X-ray macromolecular crystallography. J. Synchrotron Radiat. 2013,
20, 49–57.
(259) Liebschner, D.; Afonine, P. V.; Moriarty, N. W.; Adams, P. D. Evaluation of
models determined by neutron diffraction and proposed improvements to
their validation and deposition research papers. 2018, 800–813.
(260) O’Dell, W. B.; Bodenheimer, A. M.; Meilleur, F. Neutron protein crystal-
lography: A complementary tool for locating hydrogens in proteins. Arch.
Biochem. Biophys. 2016, 602, 48–60.
(261) Kovalevsky, A.; Gerlits, O.; Beltran, K.; Weiss, K. L.; Keen, D. A.; Blakeley,
M. P.; Louis, J. M.; Weber, I. T., Proton transfer and drug binding details re-
vealed in neutron diffraction studies of wild-type and drug resistant HIV-1 pro-
tease, 1st ed.; Elsevier Inc.: 2020, pp 1–23.
(262) Dajnowicz, S.; Seaver, S.; Hanson, B. L.; Fisher, S. Z.; Langan, P.; Kovalevsky,
A. Y.; Mueser, T. C. Visualizing the Bohr effect in hemoglobin: Neutron struc-
ture of equine cyanomethemoglobin in the R state and comparison with
human deoxyhemoglobin in the T state: Neutron. Acta Crystallogr. Sect. D
Struct. Biol. 2016, 72, 892–903.
(263) Gerlits, O.; Weiss, K. L.; Blakeley, M. P.; Veglia, G.; Taylor, S. S.; Kovalevsky,
A. Zooming in on protons: Neutron structure of protein kinase A trapped in
a product complex. Sci. Adv. 2019, 5, 1–11.
(264) https://web.expasy.org/protparam/.