MAX-lab Activity Report 2010 - Lund University Research Portal
602
-
Upload
khangminh22 -
Category
Documents
-
view
0 -
download
0
Transcript of MAX-lab Activity Report 2010 - Lund University Research Portal


ACTIVITY REPORT 2010
EDITED BY
U. JOHANSSON, K. LILJA, A. NYBERG, R. NYHOLM


It has been a very eventful year for MAX-lab. There have been many great research achievements and the development of the laboratory continues. 2010 also represents the start of the build-up of MAX IV. The number of annual users is now well over 800. Due to the increasing number of users, the expanding range of research activities and in particular due to the start-up of the MAX IV project there is presently a rapid increase of the personnel at the laboratory.
A new organization, the MAX IV laboratory, has been established which will operate the present facilities as well as build up the new ones. During the year the funding for the MAX IV facility has been released and several major parts of the accelerator systems have been ordered. A proposal to fund a fi rst set of beamlines was submitted to the Knut and Alice Wallenberg Foundation during 2010.
The 22nd of November there was a groundbreaking ceremony at the MAX IV site with among others the Swedish Deputy Prime Minister and Minister of Education Jan Björklund. Several important steps for the MAX IV building project have been taken during the year. One critical issue has been to ensure that the site is suffi ciently good in terms of stability towards vibrations. This is important due to the nearby road and the fact that there will be other building activities in the vicinity. There have been careful measurements at the site, a mockup has been built to test the foundation and theoretical modeling has been carried through. The result of this careful work has been very positive. There has also been a parallel commission to create the exterior of the building and the landscaping, and the result was presented in the autumn. The outcome of this process was that the architect companies Fojab and Snøhetta were asked to work together to produce the fi nal design concepts.
There is intense and fruitful collaboration with several other synchrotron radiation laboratories in connection with the MAX IV project. The Jagiellonian University has during the year got the decision to build the Polish synchrotron radiation source in Krakow. The Polish source will be a copy of the MAX IV 1.5 GeV storage ring. This is an excellent example of European collaboration and it is the fi rst case when two identical machines are built. Several persons from the Jagiellonian University are involved in the common project, some of which are stationed at MAX-lab at present.
Finally I want to acknowledge the support by VR, the Knut and Alice Wallenberg foundation (KAW), VINNOVA, the European Commission, Lund University, Region Skåne, the Swedish Foundation for International Cooperation in Research and Higher Education (STINT) as well as other funding organizations. I would also like to take this opportunity to thank all MAX-lab staff and all the users for their excellent work during all the years I have been the Director and for the good atmosphere that they have created at the laboratory. I would also like to thank all others who have contributed to the development of the laboratory as members of the Board, members of the PAC, SAC, and MAC expert committees, etc.
Lund 13 June, 2011
Nils MårtenssonDirector MAX-lab, 1997 – 2010
Preface


MAX-lab ACTIVITY REPORT 2010
Organisation and Staff ................................................................................................................1
General Information ....................................................................................................................9Introduction .............................................................................................................................9Organisation ..........................................................................................................................10Research ................................................................................................................................12User Associations ...................................................................................................................13Commercial utilisation of the MAX IV Laboratory ...................................................................14Workshops and Schools .........................................................................................................15
List of Users ................................................................................................................................21
Accelerator Physics and Machine Development ......................................................................39
Synchrotron Radiation ...............................................................................................................53
Beamline 41 ...........................................................................................................................80
Beamline 73 ...........................................................................................................................88
Beamline I311 ......................................................................................................................110
Beamline I411 ......................................................................................................................168
Beamline I511 ......................................................................................................................216
Beamline D611 ....................................................................................................................250
Beamline I711 ......................................................................................................................254
Beamline I811 ......................................................................................................................308
Beamline I911 ......................................................................................................................321
Beamline D1011 ..................................................................................................................392
Beamline I1011 ....................................................................................................................442
Beamline I3 ..........................................................................................................................462
Beamline I4 ..........................................................................................................................484
Energetic Electrons ..................................................................................................................510
Publications ..............................................................................................................................535
Theses .......................................................................................................................................562
Conference Contributions .......................................................................................................568
Contents

MAX-lab ACTIVITY REPORT 2010
The Machine Advisory Committee (MAC); Peter Kuske, Massimo Cornacchia, Klaus Balewski, Søren Pape Møller, and Lenny Rivkin, at the meeting that took place 1 September 2010. Photo: Annika Nyberg
Photos: Annika Nyberg
MAX IV site, 5 October 2010
Vibration tests, 5 October 2010
Soil stabilization, 15 October 2010
Soil stabilization, 15 October 2010
Drilling tests, 27 October 2010
Soil tests, 15 October 2010

MAX-lab ACTIVITY REPORT 2010 1
ORGANISATION AND STAFF
Org
anis
atio
n D
ecem
ber
201
0 –
an o
verv
iew
Bo
ard
Dir
ecto
r
Mac
hin
e D
irec
tor
Scie
nce
Dir
ecto
r
Acc
eler
ato
r Ph
ysic
s
Pro
gra
m A
dvi
sory
Co
mm
itte
esSc
ien
ce A
dvi
sory
Co
mm
itte
e
Mac
hin
e A
dvi
sory
Co
mm
itte
es
Co
ord
inat
ors
Mac
hin
eB
eam
lines
Eng
inee
rin
gA
dm
inis
trat
ion
Syn
chro
tro
n R
adia
tio
n
Inst
rum
enta
tio
n
Safe
ty
MA
X A
sso
ciat
ion
s fo
r U
sers
Plea
se n
ote
:Th
is is
the
org
anis
atio
n ch
art
for
2010
. Dur
ing
2011
, a r
eorg
anis
atio
n of
the
MA
X IV
La
bora
tory
will
be
mad
e to
mee
t th
e ne
w d
eman
ds im
pose
d by
the
MA
X IV
pro
ject
. A
n up
-to-
date
org
anis
atio
n ch
art
will
be
mad
e av
aila
ble
at w
ww
.max
lab.
lu.s
e.

2 MAX-lab ACTIVITY REPORT 2010
ORGANISATION AND STAFF
Department of Accelerator Physics
Position Name Area of responsibilitiesProfessor Mikael Eriksson Head of the accelerator physics department
Professor Sverker Werin Research and development in accelerator physics
Lecturer Lars-Johan Lindgren Research and development in accelerator physics(Universitetslektor) and coordinator for accelerator physics research, until 31 July 2010
Researcher Erik Wallén Research and development in accelerator physics(Forskare)
Ph.D. student Nino Cutic’(Doktorand)
Ph.D. student Anders Hansson(Doktorand)
Department of Synchrotron Radiation Instrumentation
Position Name Area of responsibilitiesProfessor Ralf Nyholm Head of the synchrotron radiation instrumentation department
Lecturer Rami Sankari Research and development of beamlines (Universitetslektor) and instrumentation
Research Associate Sophie Canton Research and development of time-resolved (Forskarassistent) X-ray methods
Ph.D. student Jörg Schwenke(Doktorand)
Operating Staff
BeamlinesPosition Name Area of responsibilitiesProfessor Jesper Andersen Science director
Professor Ralf Nyholm Manager and coordinator for user operations
Research engineer Ulf Johansson Deputy manager (Forskningsingenjör)
Research engineer Kurt Hansen Head of the user support group (Forskningsingenjör)
Researcher Johan Adell Maintenance of beamlines and experimental stations,(Forskare) especially beamline I4
Research engineer Thiagaraian Coordinator for low energy beamlines, (73, I3, I4)(Forskningsingenjör) Balasubramanian
Researcher Matts Björck Design, installation and maintenance of beamlines,(Forskare) especially beamline I1011
Researcher Jason Brudvik Tagging facility MAX I(Forskare)
Researcher Stefan Carlsson Design, installation and maintenance of beamlines,(Forskare) especially beamline I811
MAX-lab PersonnelFrom January 2010 – December 2010

MAX-lab ACTIVITY REPORT 2010 3
ORGANISATION AND STAFF
Operating Staff, cont.
Beamlines, cont.Position Name Area of responsibilitiesProject coordinator Yngve Cerenius Coordinator for beamline projects, MAX IV(Projektsamordnare)
Researcher Jeppe Christensen Design, installation and maintenance of beamlines,(Forskare) especially beamline I711
Research engineer Anders Engdahl Maintenance of beamlines and experimental stations,(Forskningsingenjör) especially beamline 73
Researcher Henrik Enquist Design of the short-pulse facility for MAX IV(Forskare)
Researcher Johan Forsberg Design of the new beamline I511(Forskare)
Researcher Yury Gaponov Software development for hard X-ray beamlines(Forskare) until 31 December 2010
Researcher Carsten Gundlach Design, installation and maintenance of beamlines,(Forskare) especially I711, I811, and I911 Postdoctor until January 2011
Research engineer Dörthe Haase Maintenance of hard X-ray beamlines and (Forskningsingenjör) experimental stations
Researcher Franz Hennies Design, installation and maintenance of beamlines,(Forskare) especially beamline I511
Researcher Lennart Isaksson Coordinator for Nuclear physics research and(Forskare) radiation safety
Research engineer Mikael Johansson Electronics for the experiments (Forskningsingenjör)
Research engineer Mats Leandersson Maintenance of beamlines and experimental stations,(Forskningsingenjör) especially on beamline I3
Research engineer Filip Lindau FEL test experiments and laser safety(Forskningsingenjör)
Research engineer Magnus Lundin Computers for the experiments and radiation safety(Forskningsingenjör)
Research engineer Anders Månsson Maintenance of vacuum and cryo systems (Forskningsingenjör)
Research engineer Björn Nilsson Nuclear physics (Forskningsingenjör)
Researcher Katarina Norén Coordinator for Hard X-ray (I711, I811, and I911) (Forskare) and chemical safety
Engineer Anders Olsson Beamline engineer at I311 and I511(Ingenjör)
Researcher Annette Pietzsch Design, installation and maintenance of beamlines,(Forskare) especially I511. Postdoctor until August 2010
Researcher Tomás Plivelic Design, installation and maintenance of beamlines, (Forskare) especially I911-4. Postdoctor until May 2010
Researcher Alexei Preobrajenski Maintenance of beamlines and experimental stations,(Forskare) especially beamline D1011
Researcher Janusz Sadowski MBE system since 1 June 2010(Forskare)
Research engineer Peter Sondhauss Design and simulation of X-ray optics(Forskningsingenjör)

4 MAX-lab ACTIVITY REPORT 2010
ORGANISATION AND STAFF
Operating Staff, cont.
Beamlines, cont.Position Name Area of responsibilitiesEngineer Bertil Svensson Maintenance of hard X-ray beamlines and (Ingenjör) experimental stations
Project manager Christer Svensson Software development for hard X-ray beamlines(Projektledare)
Researcher Maxim Tchaplyguine Design, installation and maintenance of beamlines,(Forskare) especially beamline I411
Researcher Karina Thånell Schulte Coordinator for soft X-ray beamlines (I311, I411, (Forskare) I511, D1011, and I1011) Postdoctor until March 2010
Research engineer Johan Unge Design installation and maintenance of beamlines, (Forskningsingenjör) especially I911. Postdoctor until May 2010
Research engineer Thomas Ursby Design, installation and maintenance of beamlines,(Forskningsingenjör) especially beamline I911
Research engineer Stefan Wiklund Maintenance of beamlines, (Forskningsingenjör) experimental stations; safety manager
Researcher Alex Zakharov Maintenance of beamlines and experimental stations,(Forskare) especially the SPELEEM at I311
Researcher Gunnar Öhrwall Design, installation and maintenance of beamlines,(Forskare) especially beamline I1011
MachinePosition Name Area of responsibilitiesProfessor Mikael Eriksson Machine director
Lecturer Lars-Johan Lindgren Deputy manager and coordinator for accelerator(Universitetslektor) physics research until 31 July 2010
Researcher Åke Andersson Deputy machine director(Forskare)
Project manager Pedro Fernandes Tavares Project manager for storage rings at MAX IV(Projektledare)
Research engineer Lars-Gösta Johansson High-tension current systems for the accelerators and(Forskningsingenjör) coordinator for electronics and electrical installations
Project engineer Martin Johansson Design and construction of magnets MAX IV(Projektingenjör)
Research engineer Dionis Kumbaro Maintenance and operation of accelerators (Forskningsingenjör)
Researcher Simon Leemann Beam dynamics(Forskare)
Research engineer Per Lilja Maintenance and operation of accelerators (Forskningsingenjör)
Research engineer Lars Malmgren Micro-wave electronics for the accelerator system (Forskningsingenjör)
Project coordinator Jonas Modéer MAX IV accelerator coordinator(Projektsamordnare)
Research engineer Robert Nilsson RF and diagnostics (Forskningsingenjör)
MAX-lab ACTIVITY REPORT 2010 5
ORGANISATION AND STAFF
Operating Staff, cont.
Machine, cont.Position Name Area of responsibilitiesResearch engineer Jerry Schmidt Development and maintenance of the accelerator (Forskningsingenjör) system, especially insertion devices
Researcher Magnus Sjöström Beam dynamics(Forskare)
Researcher Sara Thorin Project manager for the LINAC at MAX IV(Forskare)
EngineeringPosition Name Area of responsibilitiesResearch engineer Magnus Berglund Head of Engineering group(Forskningsingenjör)
Research engineer Jonny Ahlbäck Vacuum system design, MAX IV(Forskningsingenjör)
Technician Robert Andersson Workshop, mechanics(Instrumentmakare)
Constructor Anders Bjermo Design and construction(Konstruktör)
Technician Lars Christiansson Workshop, mechanics(Instrumentmakare)
Constructor El Sayed El Afi fi Design and construction(Konstruktör)
Engineer Pawel Garsztka Alignment and installations(Ingenjör)
Electrical technician Fredrik Hägneryd Electrical installations (Eltekniker)
Research engineer Brian N. Jensen Stability, tolerances and vibrations; (Forskningsingenjör) stability group manager
Electrical engineer Claes Lenngren Responsible for electrical installations (Elingenjör)
Technician Jonas Lindkvist Automation/PLC(Tekniker)
Technician Martin Nilsson Workshop, mechanics (1:e instrumentmakare)
Technician Bo Persson Workshop, mechanics, retired 31 October 2010(1:e instrumentmakare)
Research engineer Bengt Sommarin Alignment and installations(Forskningsingenjör)
Research engineer Håkan Svensson Design and construction(Forskningsingenjör)
Research engineer Johan Thånell Automation/PLC since 28 January 2010(Forskningsingenjör)
Technician Bengt-Erik Wingren Maintenance, service(Tekniker)
Computing Services and Control SystemsPosition Name Area of responsibilitiesResearch engineer Krister Larsson Head of computing services and control systems(Forskningsingenjör)

6 MAX-lab ACTIVITY REPORT 2010
ORGANISATION AND STAFF
Operating Staff, cont.
Computing Services and Control Systems, cont.Position Name Area of responsibilities
Ph.D. student Thilo Friedrich MAX-lab and KTH(Doktorand)
Software developer Mirjam Lindberg Software development(Programutvecklare)
Web developer Tobias Lundquist Web development(Webbutvecklare)
Research engineer Mats Nilsson Computers for the accelerator system (Forskningsingenjör)
Software developer Andreas Persson Software development(Programutvecklare)
Project manager Darren Spruce Software development coordinator(Projektledare)
Research engineer Jüri Tagger Accelerator control system developer(Forskningsingenjör)
Computer engineer András Váncsa Computer support (IT-tekniker)
Administration
Position Name Area of responsibilities
Procurement advisor Göran T Andersson Procurements(Upphandlingssamordnare)
Administrative offi cer Ann Barthel Offi ce work, invoicing (Ekonomiadministratör)
Administrative offi cer Elisabeth Dahlström Offi ce work(Enhetsadministratör)
Administrative offi cer Carolina Ingvander Offi ce work, reception(Enhetsadministratör)
Project assistant Markus Johannesson IRUVX-PP project(Projektassistent)
Communication manager Karin Lilja Communication(Kommunikationsansvarig)
Custodian Catarina Nilsson Cleaning(Lokalvårdare)
Information offi cer Annika Nyberg Communication (Informatör)
Custodian Lisbeth Olsson Cleaning(Lokalvårdare)
HR offi cer Therese Oppliger Human resources(Personalsamordnare)
Janitor Johan Rosdahl Janitor’s offi ce(Vaktmästare)
Financial manager Mats Roxendal Finances (Ekonomichef)
Administrative coordinator Helena Ullman Executive support, meetings coordinator(Administrativ koordinator)

MAX-lab ACTIVITY REPORT 2010 7
ORGANISATION AND STAFF
Personnel with Administrative Assignments at MAX-lab
Position Name Area of responsibilities
Professor Jesper Andersen Science director since 1 October 2010
Professor Mikael Eriksson Machine director
Guest Professor Åke Kvick Senior advisor
Professor Ingolf Lindau Senior advisor
Project coordinator Caj Lundquist MAX IV building project
Professor Nils Mårtensson Director until February 2011
Professor Bent Schröder Senior advisor
Professor Svante Svensson Deputy director until 31 December 2010
Expert Sten Wennerström Administrative director
Postdoctors and Visiting Scientists
Position Name Beamline Affi liationResearcher Marcus Agåker I511 Uppsala University, 1 July-31 (Forskare) December 2010
Ph.D. student Tomas Andersson I411 Uppsala University(Doktorand)
Researcher Olle Björneholm I411 Uppsala University(Forskare)
Researcher Kevin Fissum Nuclear physics Lund University, (Forskare) Faculty of Technology
Visiting scientist Piotr Goryl Accelerators Jagiellonian University(Gästforskare)
Postdoctor Maher Harb D611 Lund University, Faculty of Technology
Research engineer Maria Håkansson Protein crystallization SARomics Biostructures AB(Forskningsingenjör) facility
Ph.D. student Andrius Jurgilaitis D611 Lund University, (Doktorand) Faculty of Technology
Postdoctor Brian Kennedy I511 MAX-lab
Postdoctor Iwona Kowalik I1011 MAX-lab until 14 January 2010
Postdoctor Rajesh Kushwaha Rebecca Project From November 2010
Researcher Ana Labrador I911-4 MAX-lab since 1 November 2010(Forskare)
Researcher Jörgen Larsson D611 Lund University, (Forskare) Faculty of Technology
Researcher Andreas Lindblad IRUVX-PP Uppsala University (Forskare)
Researcher Derek Logan I911 Lund University and MAX-lab(Forskare)
Researcher Bengt Nelander 73 MAX-lab(Forskare)
Ph.D. student May Ling Ng D1011 Uppsala University, (Doktorand) Thesis defence 5 November 2010
Ph.D. student Ralf Nüske D611 Lund University, (Doktorand) Faculty of Technology

8 MAX-lab ACTIVITY REPORT 2010
ORGANISATION AND STAFF
Postdoctors and Visiting Scientists, cont.
Position Name Beamline Affi liationPh.D. student Jesper Nygaard I711 and I911 University of Copenhagen and (Doktorand) MAX-lab
Postdoctor Prabir Pal I3 Uppsala University
Researcher Pål Palmgren I3 October-December 2010(Forskare)
Project manager Christian Riekel Nanofocus beamline Until 31 July 2010(Projektledare)
Research Engineer Conny Såthe I511 Uppsala University(Forskningsingenjör)
Research engineer Keld Theodor I911 University of Copenhagen and (Forskningsingenjör) MAX-lab
Researcher Marjolein Thunnissen I911 Lund University and MAX-lab
Postdoctor Wimal Ubhayasekera I911 University of Copenhagen
Ph.D. student Intikhab Ulfat MBE at 41 and I3 Chalmers University of Technology(Doktorand)
Postdoctor Samuli Urpelainen I3 and I411 Oulu University and MAX-lab
Researcher Per Uvdal 73 Lund University and MAX-lab(Forskare)
Visiting scientist Adriana Wawrzyniak Accelerators Jagiellonian University(Gästforskare)
Ph.D. student Nikolay Vinogradov D1011 Uppsala University(Doktorand)
Ph.D. student Chaofan Zhang I411 Uppsala University(Doktorand)

MAX-lab ACTIVITY REPORT 2010 9
GENERAL INFORMATION
IntroductionMAX IV Laboratory is a Swedish National Laboratory for research using synchrotron radiation and high-energy electrons and for research in accelerator physics. The organisation is comprised of the present MAX-lab and the MAX IV project. MAX-lab is based upon a linac injector, a storage/pulse-stretcher ring – MAX I – and two third generation storage rings: MAX II and MAX III.
During 2010 MAX-lab has accommodated about 820 scientists representing scientifi c groups from 130 industry, academic and government laboratories from 35 countries.
Synchrotron radiation based research at MAX I, MAX II and MAX III is done in a large variety of dis-ciplines including surface science, semiconductor physics, materials science, atomic and molecular physics, chemistry, biology, medicine and environmental science.
At the 550 MeV MAX I storage ring there are four beamlines for synchrotron radiation research in the infra-red through VUV photon energy range using various spectroscopic techniques. At the 1.5 GeV MAX II storage ring thirteen beamlines are now in operation. Three planar undulators and one EPU for the VUV and soft X-ray regions are used for various spectroscopic techniques. Three multi-pole wigglers, two of which have superconducting magnets, are used for absorption and diffraction experiments in the X-ray region. In addition to these insertion device beamlines also two bend-ing magnet ports are utilized. At the MAX III ring one planar undulator and one EPU are used for spectroscopy in the UV and VUV regions.
In the pulse-stretcher mode the MAX I ring is used for experiments in nuclear and hadron physics. The electron energy range available is at present 145 to 200 MeV, resulting in monochromatic photons from 15 to 185 MeV. The program used 18 weeks of beam time in 2010.
General Information
Prof. Sine Larsen Prof. Mikael Eriksson Prof. Jesper AndersenDirector Machine Director Science DirectorPhone: +46-(0)46-222 47 33 Phone: +46-(0)46-222 76 96 Phone: +46-(0)46-222 95 [email protected] [email protected] [email protected]
ReceptionPhone: +46-(0)46-222 98 72Fax: +46-(0)46-222 47 10e-mail: [email protected]
Postal address: MAX IV Laboratory Lund University P.O. Box 118 SE-221 00 Lund SWEDEN
Visiting address: Ole Römers väg 1, Lund, SWEDEN
Web site: www.maxlab.lu.se
Contact Persons MAX IV Laboratory

GENERAL INFORMATION
OrganisationMAX IV Laboratory is operated by Lund University under a contractual agreement with the Swedish Research Council (Vetenskapsrådet). The Research Council is responsible for the main operating budget, the scientifi c programs and periodic reviews of the activities. As host university, Lund University is responsible for employee relations and the conventional facilities.
From 1 March 2004 until 28 February 2009, MAX-lab was a part of the Integrated Infrastruc-ture Initiative (I3) “Integrating Activity on Synchrotron and Free Electron Laser Science” (IA-SFS). Since 1 March 2009, this program has been followed by the I3 program “European Light Sourc-es Activity” (ELISA). This means that a number of European projects within synchrotron radiation research are sponsored, including support for travel and subsidiary costs for users from EU and other associated countries.
An outline of the internal organisation of MAX IV Laboratory is found on page 1 in this report.
MAX IV Laboratory is governed by a Board, consisting of eight members and a chairperson since October 2010. The Board is appointed by Lund University in consultation with the Research Council and Vinnova. The Board appoints the Director and a Managerial group of MAX IV Laboratory.
The members of the Board during 2010 are listed in table I a-c.
The Board of MAX IV Laboratory is charged with the responsibility of working towards national and international use of the laboratory, to prepare and monitor the operating budget, to prioritize the research programs and facility developments, to appoint personnel, and to promote the overall growth and development of the laboratory. The MAX IV Laboratory Board also decides how to divide the operating time between research with synchrotron radiation, energetic electrons, accelerator physics research and system maintenance and development. To facilitate these decisions the Board has appointed program advisory committees (PACs), a machine advisory committee (MAC), and a scientifi c advisory committee (SAC) to guide it on matters connected with the scientifi c programs and facility developments at the laboratory. The committees consist of national and international scientists whose backgrounds encompass the various areas of research which are possible at MAX-lab.
The members of the program advisory committees are listed in table IIa and b, the members of the scientifi c advisory committee in table III, and the members of the machine advisory committee in table IV.
10
Board of MAX-labJuly 2007 – June 2010Member RepresentingI. Skogö ChairpersonA. Borg Research CouncilL. Kloo Research CouncilM. Fahlman UsersS. Svensson UsersB. Söderström Lund UniversityS. Sörensen Lund University
Interim Board of MAX IV LaboratoryJuly – September 2010Member RepresentingL. Börjesson Chalmers University of Technology, ChairpersonP. Eriksson Lund University
Board of MAX IV LaboratoryOctober 2010 – Member RepresentingL. Börjesson Chalmers University of Technology, ChairpersonH. Dosch DESY, Hamburg, GermanyK. Edström Uppsala University, SwedenL. Hultman Linköping University, SwedenS. Larsen University of Copenhagen, Denmark (until Feb 2011)A. l’Huiller Lund University, SwedenI. Reineck Sandvik Tooling AB, SwedenG. Schneider Karolinska Institutet, SwedenS. Sörensen Lund University, Sweden
Table Ia Table Ib
Table Ic

GENERAL INFORMATION
11
MAX IV Laboratory Programme Advisory CommitteesSynchrotron Radiation (in 2010)B. Johansson Uppsala, Sweden, ChairpersonH. Aksela Oulu, FinlandM.C. Asensio Paris, FranceD. Chandesris Paris, FranceR. Feidenhans’l Copenhagen, DenmarkR. Fourme Paris, FranceM. Gajhede Copenhagen, DenmarkÅ. Kvick Lund, SwedenC. Miron Paris, France L.H. Tjeng Köln, GermanyK. Wilson York, UKD.P. Woodruff Warwick, UK
Energetic Electrons (in 2010)B. Höistad Uppsala, Sweden, ChairmanJ. Ahrens Mainz, GermanyD. Phillips Athens, Ohio, USAD. Watts Edinburg, UK
MAX IV Laboratory Programme Advisory Committees Synchrotron Radiation (from 2011)L. Johansson Karlstad, Sweden, ChairpersonA. Borg Trondheim, NorwayN. Brookes Grenoble, FranceJ. Daillant Paris, FranceA.N. Fitch Grenoble, FranceM. Gajhede Copenhagen, DenmarkC. Hirschmugl Milwaukee, USAK. Horn Berlin, GermanyB. Hunter Dundee, Scotland UKM. Kiskinova Trieste, ItalyE. Kukk Turku, FinlandÅ. Kvick Lund, Sweden (spring meeting 2011)R. Mathiesen Trondheim, NorwayC. Miron Paris, FranceL. Patthey Villigen, SwitzerlandH. Friis Poulsen Roskilde, DenmarkW. Wurth Hamburg, Germany
Table IIa Table IIb
MAX IV Laboratory Scientifi c Advisory Committee until end of 2010S. Lidin Stockholm, Sweden, ChairpersonL. Braicovich Milano, ItalyC. Nave Daresbury, UKB. Schoch Bonn, GermanyA. Wrulich Villigen, Switzerland
Table IIIa
MAX IV Laboratory Machine Advisory CommitteeL. Rivkin Villigen, Switzerland, ChairpersonK. Balewski Hamburg, GermanyM. Cornacchia Palo Alto, California, USA (during 2010)P. Kuske Berlin, GermanyS. Pape Møller Aarhus, DenmarkR. Walker Didcot, UK (from 2011)
Table IV
MAX IV Laboratory Scientifi c Advisory Committee from end of 2010B. Johansson Uppsala, Sweden, ChairpersonH. Aksela Oulu, FinlandM.A. Carrondo Lisbon, PortugalW. Eberhardt Berlin, GermanyG. Margaritondo Lausanne, SwitzerlandL. McCusker Zürich, SwitzerlandA. Molenbroek Lyngby, DenmarkH. Reichert Grenoble, FranceI. Robinson London, UKP. Woodruff Warwick, UK
Table IIIb

12 MAX-lab ACTIVITY REPORT 2010
GENERAL INFORMATION
ResearchMAX IV Laboratory supports three distinct areas of research: Accelerator physics, research based on the use of synchrotron radiation, and nuclear physics research using energetic electrons. The use of the facility is shared by the groups working in these three research areas as is the responsibility for different aspects of the facility.
The laboratory is operated primarily in a user oriented fashion. Those interested in making experi-ments using synchrotron radiation or the electron-beam facility should obtain more information from the coordinators (see table V) about requirements for experiments and available equipment. Technical information on beamlines and experimental stations can also be found on the MAX IV Laboratory web site, www.maxlab.lu.se.
MAX-lab Research CoordinatorsSynchrotron Radiation Energetic Electrons Accelerator PhysicsProf. Ralf Nyholm Lennart Isaksson Prof. Mikael ErikssonPhone: +46-(0)46-222 44 52 Phone: +46-(0)46-222 77 15 Phone: +46-(0)46-222 76 [email protected] [email protected] [email protected]
Postal address: MAX-lab, Lund University, P.O. Box 118, SE-221 00 Lund, SWEDENVisiting address: Ole Römers väg 1, Lund, SWEDEN
Table V
Those who wish to make experiments using synchrotron radiation or energetic electrons should apply in the form of a research proposal to the appropriate coordinator. Proposals are periodically reviewed by the MAX IV Laboratory Program Advisory Committees (see Table II), and scheduling of time on beamlines is made by the research coordinators based upon user requests.
Most of the beamlines are equipped with experimental chambers, analysers and detectors available to all users. In addition some user groups provide their own experimental set-ups. More informa-tion about the storage ring parameters and the beamlines may be found in the introductions to the sections on accelerator physics research, synchrotron radiation research and research with energetic electrons in this report.
The machines are usually operated 24 hours per day, six days per week. Each week one day is devoted to machine maintenance and development of storage ring instrumentation.
The users should take full responsibility for carrying out their research projects and thus should become familiar with the experimental equipment and data-taking systems which are available at the laboratory before they begin the experiments in order to optimize the use of beam time. User equipment which is used in the ultra-high vacuum environment required for connection to the storage ring and monochromators must be checked and approved by the laboratory.
Safety guidelines pertaining to samples and experimental procedures must also be followed by users. Prior to experiments all participating researchers must register their beamtime through our web-server. Also a declaration of substances and hazardous equipment has to be submitted to the MAX IV Laboratory for approval.
Much of the design of monochromators and experimental equipment is the result of collaborations with research groups outside MAX IV Laboratory. If a user group is seeking funding for equipment which is intended for use the laboratory, the proposal should be discussed with the MAX IV Labora-tory so that planning can be made together with the laboratory personnel. Funding organizations in Sweden may appeal to the laboratory staff for information on the feasibility of projects connected to the laboratory. This ensures that new equipment will be compatible with the standards of the laboratory and with the existing beamline structure.

MAX-lab ACTIVITY REPORT 2010 13
GENERAL INFORMATION
User AssociationsMAX Association for Synchrotron Radiation Users at MAX-lab – FASM
The 23rd annual meeting of “Föreningen för Användare av Synkrotronljuset vid MAX-laboratoriet” (The association for Synchrotron Radiation Users at MAX-lab), FASM, took place on 8 November, 2010, at hotel Scandic Star in Lund, in connection with the Annual User Meeting. A new FASM board for the up-coming three years was elected, see below.
More information on the Annual User Meeting is presented on page 17.
All users of the MAX-lab facility are by defi nition members of the FASM organization, which aims to have a broad participation involving all parts of the user community and effi cient communication with the MAX-lab board and management. It is thereby possible to communicate current and future needs within the user community and the MAX-lab Board. At the same time the association disseminates infor-mation to the users about MAX-lab plans and pros-pects. FASM’s mission is increasingly important as the user community is growing rapidly and more scien-tifi c disciplines are actively using the MAX-lab facility. In view of this, FASM will introduce a number of proposals aimed to strengthen the activities at MAX-lab and be of further aid to new users.
MAX-lab users who want to bring up ideas to im-prove MAX-lab as scientifi c tool and organization are welcome to contact:
Professor Ingmar PerssonDepartment of ChemistrySwedish University of Agricultural SciencesP.O. Box 7015SE-750 07 UppsalaSwedene-mail: [email protected]
Board of Association for Synchrotron Radiation Users (FASM)I. Persson Uppsala, Sweden, ChairpersonK. Børve Bergen, NorwayR. Feifel Uppsala, SwedenK. Mortensen Copenhagen, DenmarkR. Neutze Göteborg, SwedenB.-M. Steenari Göteborg, Sweden
Table VI
Ingmar Persson at the FASM meeting, 2010.Photo: Annika Nyberg

14 MAX-lab ACTIVITY REPORT 2010
GENERAL INFORMATION
MAX Association for Nuclear Physics Users
The Association of Nuclear Physics Users at MAX-lab met on 8-9 November at a combined PAC and User meeting in conjunction with the MAX-lab Annual User Meeting at Hotel Scandic Star in Lund. Four new proposals and letters of intent were presented, as well as status reports from ongoing experiments, facility-related reports and talks from invited speakers. The detailed program of the meeting is found on http://www.maxlab.lu.se/usermeeting/2010/sessions/nuclear_pac_meeting.html
Election of the board of the Association resulted in the following composition:
Board of MAX Association for Nuclear Physics UsersJ.R.M. Annand Glasgow, UK, Chairperson
W. Briscoe Washington DC, USA
P. Grabmayr Tübingen, Germany, Election coordinator
L. Isaksson Lund, Sweden
Table VII
Commercial Utilisation of the MAX IV LaboratoryThe MAX IV Laboratory is selling synchrotron radiation beamtime as well as consulting services in connection to this. Several companies are regular customers at the laboratory. The Laboratory can furthermore provide consulting services in accelerator technology and synchrotron radiation instrumentation. Further information can be obtained from our director Sine Larsen.
A macromolecular crystallization facility is available at tha lab. The facility is operated under a contractual agreement with SARomics Biostructures AB and is at present used approximately equally for commercial and academic projects.
Lothar Tiator, University of Mainz, 10 November 2010.Photo: Annika Nyberg

MAX-lab ACTIVITY REPORT 2010 15
GENERAL INFORMATION
Workshops and SchoolsBeamlines at MAX IV, Workshop, Lund, 22-23 February. This workshop gathered over 170 users of Synchrotron Radiation from Sweden, the Nordic/Baltic countries, Poland and Europe. The program of the workshop can be found at www.maxlab.lu.se.
Prof. Ulf Karlsson held an introduction, where he explained the application process of the MAX IV beamlines from the Swedish Research Council’s point of view. After presenta-tions of the MAX IV project from Prof. Nils Mårtensson and Prof. Mikael Eriksson two talks were given on subjects of great importance for the future MAX IV facility:
• Dr. Christian Riekel, MAX-lab, gave a presentation on nanobeams, where the unique properties of the ultra-brilliant radiation from MAX IV was discussed in context with international research.
• Dr. Anders Madsen, ESRF, gave a presentation of X-ray coherence where the ultra-low emittance of the MAX IV facility will open unique possibilities.
After this the meeting was divided into three parallel sessions:1. VUV, IR and Soft X-rays2. Hard X-rays3. Life Sciences
In all these fi elds there has been a strong activity from the User Community and a large number of beamline proposals were put forward.
The discussions were very fruitful and refl ected the strong user community around the MAX labora-tory. Several cases of synergy were found and it was possible to fi nd opportunities where the different user groups can make a consorted effort to make use of the most ultra-brilliant facility in the world.
Second Workshop on High Harmonic Seeding for Present and Future Short Wavelength Free-Electron Lasers (FELs), Lund, 5-7 May. Hosted by MAX-lab, the Lund Laser Centre, Sincrotrone Trieste, ENEA, INFN-LNF and University of Rome, this second workshop was held in Lund, Sweden, 5-7 May 2010. The fi rst workshop, held in December 2008 in Frascati, Rome, brought together the accelerator and high power laser com-munities. This second workshop permitted both continued interactions of participants as well as an expanded participation roster to focus upon the need in the free-electron laser community for coher-ent, short wavelength seed pulses.
During the workshop results from High Harmonic Generation (HHG) laser seeding at SCSS (Japan) and SPARC (Rome) were reported. Also the status of the seeding projects at sFLASH (DESY) and Fermi@Elettra were reported. The main results of the workshop lay in the area of stating the require-ments and the need for development of the HHG source. Issues on intensity, pulse length, polari-zation, position and pointing, timing and stability were addressed. Another urgent fi eld was how the APT (Attosecond Pulse Train) will infl uence the seeding effi ciency and also the tuneability of the HHG source.
The workshop attracted over 50 participants from all the European FEL laboratories involved in seeding of FELs.
Ulf Karlsson, 22 February 2010.Photo: Annika Nyberg

16 MAX-lab ACTIVITY REPORT 2010
GENERAL INFORMATION
Lärardagar på MAX-lab, Lund, 14-16 June. Encouraged by the feedback from the study day arranged for local high-school teachers in August 2009, a three-day workshop was organized 14-16 June 2010 in collaboration with MAX-lab and National Centre for Education in Physics.
A total of 30 physics teachers (29 from Sweden and 1 from Finland) came to MAX-lab in order to learn how synchrotron radiation is produced and what kind of studies can be done with it. The teach-ers also got an opportunity to perform experiments on beamlines with MAX-lab’s staff, and they presented their results the last day.
Debra Belsey – from Lloydminster Comprehensive High School in Lloydminster, Canada – was also invited to tell the participants about her experiences from working with high-school students at Canadian Light Source, and this the participants considered particularly inspiring. The feedback col-lected afterwards from participants was outstanding and detailed plans to continue outreach activi-ties aimed for high-school teachers and students are underway.
FEL 2010, Malmö, 23-27 August. The 32nd International Free Electron Laser conference was organized by MAX-lab in Malmö 23-27 August 2010. Over 300 registered participants gathered for fi ve days at Hilton Malmö City to hear and follow the latest development on Free Electron Lasers. 63 presentations were held, half of them by invited speakers and also including four tutorials on focus area in the fi eld. Highlights included reports of the fi rst lasing of FELs around the globe during the past year, reports from the key projects such as LCLS, FLASH, SPring8, SwissFEL and Fermi including their upgrade programs. Other areas that were covered included synchronization issues, diagnostics, low charge operation and much more. The previous conference was held in Liverpool, UK, and after Malmö the event will move to fi rst Shanghai in 2011 and Kyoto 2012.
Proceedings from the conference are available at:http://fel2010.maxlab.lu.se/FEL2010_proceedings/index.htm
Participants at the workshop, 14-16 June 2010.Photo: Annika Nyberg

MAX-lab ACTIVITY REPORT 2010 17
GENERAL INFORMATION
The 23rd MAX-lab Annual user meeting, Lund, 8-10 November. The 23rd Annual User Meeting for MAX-lab users was held at Scandic Star Hotel in Lund on 8-10 Novem-ber 2010. The meeting was as previ-ous years jointly organized by MAX-lab and the MAX-lab Association for Synchrotron Radiation Users (FASM). This year there was a new record of 342 registered participants and 26 commercial exhibitors.
The fi rst day of the user meeting was primarily dedicated to the present activities at the lab, and in-cluded status reports, user highlights and two plenary lectures. Prof. Peter Schurtenberger from Lund University gave a talk on Responsive Colloids – From Model Atoms to Novel Hybrid Nanomaterial, while the Director of SOLEIL, Prof. Michel van der Rest, talked about Current Status and Future plans for SOLEIL. In the evening a poster session was held at MAX-lab. At the latter, a Best Student Poster Award sponsored by SPECS GmbH, was rewarded to Mr. Mo Segad at the Department of Theoretical Chemistry, Lund University. The title of his poster was: Structure and swelling properties: experimen-tal studies of bentonite (MX-80)-Water Systems.
The next two days were very much focused on MAX IV. The current status of the project was pre-sented in several talks. In addition there were two more plenary lectures; Dr. Rolf Follath from Helm-holtz-Zentrum Berlin talked about Beamlines for Low Emittance Rings, a subject of greatest relevance for MAX IV. Prof. Marek Stankiewicz, at the Jagiellonian University in Kraków talked about the new Synchrotron Radiation Facility in Poland. This storage ring will have the same design as the 1.5 GeV storage ring of the MAX IV facility.
After the common session the meeting was divided into several parallel workshops related to issues of importance for MAX IV. A majority of these workshops were focused on some of the different sug-gested fi rst phase beamlines on MAX IV. In addition two more general workshops were organised. A workshop titled Pixel Detectors for MAX IV covered different aspects of position sensitive detectors for synchrotron radiation applications. A second session was the IDMAX2010 workshop, with the heading Insertion Devices for Rings and Linacs.
Further information: www.maxlab.lu.se, search for User Meeting
oto a ybe g
IDMAX2010, Insertion Devices for Rings and Linacs, Lund, 9-10 November. A workshop called IDMAX2010 about insertion devices for synchrotron radiation production was organised 9-10 November 2010 in connection with the MAX-lab Annual User Meeting.
The workshop was a success and the list of speakers included in total 23 experts from world leading laboratories in Asia, Europe and the USA. There were also presentations from 5 different companies manufacturing insertion devices during the workshop.
Among the topics discussed during the workshop were existing insertion devices, plans for future installations, research and development activities on novel insertion devices, fast polarization switch-ing, chicanes and canted undulators, operational aspects, and manufacturing aspects of insertion devices.
The presentations given at the workshop can be found on http://www.maxlab.lu.se/usermeet-ing/2010/sessions/IDmax2010/index.html

Outreach ActivitiesConstruction Inauguration Ceremony22 November 2010 was a great day in the history of the MAX IV Laboratory. On that day, an opening ceremony for the construction site of the MAX IV building was held.
Among others, the Swedish deputy prime minister, Mr Jan Björklund, gave a speech. He stressed that MAX IV is of huge importance for the city of Lund, Southern Sweden, and Sweden. He said in his speech that MAX IV is the largest research infrastructure project in Sweden so far.
After the celebration at the building site – where the vibrations in the ground were tested by one hundred twelve-year-olds, jumping at the same time, instructed by children’s TV star Ola Selmén – the festivities con-tinued at the University Hall with a light lunch, more speeches and open lectures.
Photos: Bengt-Erik Wingren and Annika Nyberg


20 MAX-lab ACTIVITY REPORT 2010
Mikko-Heikki Mikkelä, University of Oulu, and Samuli Urpelainen, fi ne tuning the evaporation oven of the exchange metal cluster source at beamline I411, 11 October 2010.Photo: Annika Nyberg

MAX-lab ACTIVITY REPORT 2010 21
LIST OF USERS
University of Aarhus, Denmark
Department of ChemistryM. Andersen J. Becker H. Birkedal E.D. Bøjesen T. Cao M. Christensen P.R. Christensen J.R. Eltzholtz U. Filsø V. Gavrilov L. Houkjær Sørensen C. Ibsen B. Iversen P. Javadian E. Jensen K.M.Ø. Jensen T.R. Jensen M. Kirdan Hjortshøj N. Lock P. Nørby C.H. Olesen J. Olsen D. Ravnsbæk C. Tyrsted
Department of Inorganic ChemistryB.R.S. Hansen T.N. Jensen L. Jepsen S. Kastbjerg H. Leemreize J. Skovgaard S. Tolborg
Department of Molecular Biology K. Bjerregaard-Andersen T. Boesen P. Gourdon R. Kidmose M. Laursen N. Laursen X. Liu L. Malinauskaite J.P. Morth M. Nyblom M. Primo O. Sitsel S. Thirup A.-M.L. Winther
Department of Physics and AstronomyM. Abu-samha E. Lira F. Song
Interdisciplinary Nanoscience Center (iNANO)F. Besenbacher J.Ø. Hansen T. Kollin M.B. Ley S. Porsgaard L.H. Rude R. Streber
Swedish University of Agricultural Sciences, Alnarp, Sweden
Agriculture – Farming Systems, Technology and Product QualityR. Kuktaite
Hellenic Pasteur Institute, Athens, Greece
Department of BiochemistryP. Giastas
National Hellenic Research Foundation, Athens, Greece
Institute of Organic and Pharmaceutical ChemistryA. Kantsadi M. Keramioti D. Leonidas V. Skamnaki S. Zographos
Structural Biology and Chemistry GroupC. Drakou
List of Users at MAX-labJanuary 2010 – December 2010

22 MAX-lab ACTIVITY REPORT 2010
LIST OF USERS
Georgia Institute of Technology, Atlanta, GA, USA
Nuclear EngineeringM. Litwack
Novo Nordisk A/S, Bagsværd, Denmark
E. Johansson S. Runge G. Schluckebier
NeuroSearch A/S, Ballerup, Denmark
P. Ahring
Indian Institute of Science, Bangalore, India
Solid State and Structural Chemistry UnitD. Das Sarma A. Hazarika S. Mukherjee
ALBA-CELLS, Barcelona, Spain
M. Brzhezinskaya
ICMAB-CSIC, Barcelona, Spain
Quimica OrganicaF. Vera
Institute for Research in Biomedicine, Barcelona, Spain
Structural and Computational BiologyP. Bernado
Chinese Academy of Sciences, Beijing, China
Institute of PhysicsH. Ding Y. Huang X. Wang
University of Bergen, Norway
Department of ChemistryK. Børve J. Harnes A. Holme V. Myrseth L.J. Sæthre M. Winkler M. Wøien Håland
Fritz-Haber-Institut der Max-Planck-Gesellschaft, Berlin, Germany
Department of Molecular PhysicsS. Böttcher Y. Dedkov M. Weser
Bielefeld University, Germany
Department of PhysicsA. Helmstedt F. Merschjohann
University of Bordeaux 2, France
C. Petibois

MAX-lab ACTIVITY REPORT 2010 23
LIST OF USERS
Boston University, MA, USA
Department of Physics
J. Laverock A. Preston K. Smith
University of Bristol, United Kingdom
Department of Physics
A. Seddon
MTA - MFA, Budapest, Hungary
Thin Film and Nanosystems Laboratory
C.S. Daroczi G. Peto
Universitat Autònoma de Barcelona, Cerdanyola, Spain
Faculty of Medicine
O. Klementieva
Université de Cergy-Pontoise, France
Laboratoire de Physique des Matériaux et des Surfaces
K. Hricovini W. Ndiaye H. Olivier C. Richter
Chiba University, Japan
Graduate School of Advanced Integration Science
T. Kuzumaki B. Mueller K. Sakamoto Y. Yamamoto
University of Coimbra, Portugal
Department of Chemistry
H. Burrows T. Costa R. Evans D. Lundberg
University of Copenhagen, Denmark
Department of Basic Sciences and Environment
L. Arleth R. Hoeiberg-Nielsen S. Kynde L. Malik H. Munch J. Nygaard S. Roi Midtgaard N. Skar-Gislinge
Department of Biomolecular Sciences
J.G. Olsen
Department of Chemistry
I. Allen N. Bovet S. Christoffersen J.A. Cuesta-Seijo R. Forecast P. Galberg S. Hakim S.F. Husted K. Håkansson J.L. Jensen C.E. Jessen M.S. Johnson S. Jorgensen V. Karlsson K. Krarup Sand L. Lo Leggio H. Otten J.-C. Poulsen K.K. Rasmussen J. Schmidt E. Shkondin H.O. Sørensen E. Thaysen M. Thymark K. Usbeck D. Welner A.G. Wielandt R. Wugt Larsen

24 MAX-lab ACTIVITY REPORT 2010
LIST OF USERS
Department of Medicinal ChemistryS. Andersen L.S. Christensen K. Frederiksen K. Frydenvang M. Gajhede J.S. Kastrup C. Krintel J. Kristensen L.H. Kristensen O. Kristensen A.E. Langkilde I.R. Møller L. Thomsen C. Ussing R. Venskutonyte B. Vestergaard T.S. Wind T. Vognsen
Department of Neuroscience and Pharmacology M. Karlsen M. Rathje T. Thorsen
Department of PhysicsC. Birkelind M. Michieletto R. Mooiweer R. Tanta
Institute of Plant Biology and BiotechnologyP. Naur
Niels Bohr InstituteD.W. Breiby R. Feidenhansl M. Glyvradal J. Jacobsen S. Labaysse M.M. Nielsen E. Pedersen K. Theodor M. Thomsen C.M. Thygesen
Oregon State University, Corvallis, OR, USA
Department of ChemistryD. Thomas
Leibnitz Institute for Solid State and Materials Research, IFW, Dresden, Germany
Institute fof Solid State ResearchV. Aristov O. Molodtsova
Dublin City University, Ireland
Biomedical Diagnostics InstituteC. Charlton
School of Electronic EngineeringS. Krishnamurthy
School of Physical SciencesA. Cafolla H.L. Lee S. Singh
Trinity College, Dublin, Ireland
School of PhysicsD. Cockburn J. Cunniffe M. Duignan S. Krasnikov O. Luebben N. McAlinden C. McGuinness N. Sergeeva
Duke University, Durham, NC, USA
TUNL/Physics DepartmentL. Myers
Eindhoven University of Technology, The Netherlands
Applied PhysicsA. Dzwilewski

MAX-lab ACTIVITY REPORT 2010 25
LIST OF USERS
University of Twente, Enschede, The Netherlands
Electrical Engineering, Mathematics and Computer ScienceP.K.J. Wong
MESA+ Institute for NanotechnologyD. Atac M. de Jong Y. Lee L. Tran
Svensk Kärnbränslehantering AB, Figeholm, Sweden
DjupförvarsteknikD. Svensson
GKSS Research Centre Geesthacht, Germany
Institute of Materials ResearchG. Barkhordarian C. Bonatto Minella M. Dornheim R. Gosalawit F. Karimi C. Pistidda I. Saldan K. Suarez Alcantára
Hagedorn Institute, Gentofte, Denmark
Receptor Systems Biology LaboratoryN. Kulahin
Justus-Liebig-Universität Gießen, Germany
Physikalisch-Chemisches InstitutB. Herd J.P. Hofmann S. Zweidinger
SOLEIL Synchrotron, Gif sur Yvette, France
D. Céolin
University of Glasgow, United Kingdom
Physics and AstronomyJ.R.M. Annand
School of Physics and AstronomyR. “Seian” Al Jebali
Karl-Franzens University, Graz, Austria
Department of Experimental PhysicsL. Gragnaniello T. Ma F.P. Netzer S. Surnev
ESRF, Grenoble, France
Y. Filinchuk A. Labrador
EMBL Grenoble, France
A. Round
University of Groningen, The Netherlands
KVI Atomic and Molecular PhysicsS. Bari M. Door O. Gonzalez Magaña G. ReitsmaT. Schlathölter

26 MAX-lab ACTIVITY REPORT 2010
LIST OF USERS
Göteborg University and Chalmers University of Technology, Sweden
Department of Applied PhysicsL. Ilver J. Kanski I. Ulfat
Department of Applied Surface ChemistryM. Andersson W. He
Department of Cell and Molecular BiologyK. Rödström
Department of ChemistryM. Ekvall G. Fischer R. Friemann M. Järvå R. Neutze E. Svensson S. Törnroth-Horsefi eld P. Uzdavinys A. Vincent
Department of Nuclear ChemistryA. Hedström A. Larsson
Department of Physical ChemistryL. Öhrström
Department of PhysicsH. Starnberg L. Walldén S. Vuckovic
Environmental Inorganic Chemistry and Industrial Materials RecyclingB.-M. Steenari
Max-Planck-Institute for Biophysical Chemistry, Göttingen, Germany
NMR-based Structural BiologyF. Munari N. Rezaei-Ghaleh
Martin-Luther-Universität Halle-Wittenberg, Halle, Germany
Institute of PhysicsR. Kunjuveettil Govind K.-M. Schindler M. Trautmann
EMBL Hamburg, Germany
BioSAXSC. Blanchet A. Kikhney A. Shkumatau
Helmholtz Centre for Infection Research, Hamburg, Germany
Centre for Structural Systems BiologyM. Chatterjee I. Kursula
Universität Heidelberg, Germany
Angewandte Physikalische ChemieH. Hamoudi J. Zhao M. Zharnikov
University of Helsinki, Finland
Institute of BiotechnologyT. Kajander

MAX-lab ACTIVITY REPORT 2010 27
LIST OF USERS
Yeditepe University, Istanbul, Turkey
Chemical Engineering
S. Bucak E. Yenigul
Forschungszentrum Jülich, Germany
IFF 6 – Elektronische Materialien
A. Köhl
Karlstad University, Sweden
Department of Physics
J. Hirvonen Grytzelius L. Johansson E. Moons K. Svensson H. Zhang
University of Silesia, Katowice, Poland
Institute of Physics
D. Kajewski J. Kubacki J. Szade
Keuka College, Keuka Park, NY, USA
Department of Chemistry
T. Carroll
Universität Kiel, Germany
Institut für Experimentelle und Angewandte Physik
E. Kröger
Kiev National T. Shevchenko University, Ukraine
Department of Physics
I. Doroshenko V. Pogorelov
Institute for Energy Technology, Kjeller, Norway
Department of Physics
M. Knaapila H. Mauroy
Indian Association for the Cultivation of Science, Kolkata, India
Department of Materials Science
T. Chakraborty S. Jana A.K. Puri S. Ray
Saha Institute of Nuclear Physics, Kolkata, India
Surface Physics Division
S. Mahatha K. Menon
Jagiellonian University, Kraków, Poland
Institute of Physics
B. Penc P. Starowicz

28 MAX-lab ACTIVITY REPORT 2010
LIST OF USERS
Universität zu Köln, Germany
II. Physikalisches InstitutT. Gerber P. Stratmann
Universität Leipzig, Germany
Wilhelm-Ostwald-Institut für Physikalische & Theoretische ChemieV.H. Babu R. Denecke M. Welke
University of Kentucky, Lexington, KY, USA
Department of PhysicsM. Kovash K. Shoniyozov
Linköping University, Sweden
Department of Physics, Chemistry and Biology (IFM)L. Axelsson S. Braun M. Fahlman Z. Hu L. Johansson E. Larsson M. Magnuson L. Olsson J. Osiecki C. Skoglund H.M. Sohail R. UhrbergK. Uvdal C. Vahlberg C. Virojanadara S. Watcharinyanon Y. Zhan
University of Ljubljana, Slovenia
Department of Physical ChemistryM. Tomšic
ESS Scandinavia, Lund University, Sweden
Physical ChemistryS. Botegard
Colloidal Resource AB, Lund, Sweden
A. Stenstam
Lund University, Sweden
Department of Accelerator PhysicsN. Cutic’ M. Eriksson A. Hansson S. Leemann L.-J. Lindgren M. Sjöström S. Thorin E. Wallén S. Werin
Department of Atomic PhysicsH. Enquist M. Harb P. Johnsson A. Jurgilaitis J. Larsson R. Nüske C. von Korff-Schmising
Department of Biochemistry and Structural BiologyO. Aurelius
Department of Cell and Organism BiologyA.R. Clausen
Department of Chemical EngineeringA. Andersson R. Häggblad M. Massa
Department of Chemical PhysicsP. Uvdal
MAX-lab ACTIVITY REPORT 2010 29
LIST OF USERS
Department of Combustion Physics
F. Ossler L. Vallenhag
Department of Experimental Medical Science
G. Svensson
Department of Geology
J. Lindgren
Department of Molecular Biophysics
S. Al-Karadaghi C. Helgstrand S. Kadhirvel D. Logan S. Rajan J. Sprenger C. Söderberg M. Thunnissen R. Yengo
Department of Nuclear Physics
K. Alselo V. Avdeichikov U. Forsberg P. Golubev B. Jakobsson A. Thelin M. Wong
Department of Organic Chemistry
M. Johnson N. Loganathan S. Raman J. van Rensbug O. Wendt
Department of Physical Chemistry 1
M. Asad Ayoubi O. Besset A. Bilalov S. Björklund J. Carlstedt C. Cenker C. Evers M. Fonjang A. Franzén M. Fuchs C. Gudmundsson A.M. Iqbal J. Janiak T. Kjellman G. Lazzara I. Nasir T. Nylander U. Olsson M. Reda N.V. Reichhardt S. Santos K. Schillén B. Silva
Department of Polymer and Materials Chemistry
C. Dicko S. Hansen W. Hermes S. Lidin
Department of Synchrotron Radiation Instrumentation
S. Canton R. Nyholm R. Sankari J. Schwenke
Department of Synchrotron Radiation Research
J. Andersen E. Ataman S. Blomberg E. Erdogan M. Gisselbrecht J. Gustafson E. Hilner M. Hjort C. Isvoranu N. Johansson J. Knudsen J. Laksman J. Lilliestrale E. Lundgren N. Martin A. Mikkelsen E. Månsson A. Sankari J. Schnadt S. Sörensen R. Timm
Department of Theoretical Chemistry
A. Kurut M. Segad
Division of Solid Mechanics
H. Levin G. Lindberg P. Ståhle
Division of Solid State Physics
S. Lehmann
Lund Observatory
R. Blackwell-Whitehead H. Hartman S. Huldt T. Lennartsson H. Nilsson

30 MAX-lab ACTIVITY REPORT 2010
LIST OF USERS
MAX-labJ. Ahlbäck Å. Andersson T. Balasubramanian M. Björck J. Brudvik S. Carlson Y. Cerenius A. Engdahl D. Haase K. Hansen F. Hennies L. Isaksson B. Jensen B. Kennedy P. Lilja F. Lindau M. Lundin L. Malmgren B. Nelander B. Nilsson R. Nilsson K. Norén A. Pietsch T. Plivelic A. Preobrajenski J. Sadowski K. Schulte P. Sondhauss M. Tchaplyguine J. Unge T. Ursby S. Wiklund A. Zakharov G. Öhrwall
SARomics Biostructures AB, Lund, Sweden
M. Håkansson
Haldor Topsoe A/S, Lyngby, Denmark
P. Beato R. Christensen T.V.W. Janssens P. Kjær Nielsen L. Lundegaard A. Molenbroek A. Puig-Molina
Technical University of Denmark, Lyngby, Denmark
Department of ChemistryJ. Boesen H.E.M. Christensen C. Frankær C. Grundahl H. Hartmann P. Harris C.B. Oehlenschlæger K. Ståhl M. Vad Knudsen
Department of Systems BiologyM. Møller
AstraZeneca, Macclesfi eld, United Kingdom
D. Ogg
Universidad Autónoma de Madrid, Spain
Departamento de Fisica de la Materia CondensadaJ.J. de Miguel L. Walczak
Laboratorio de Haces MolecularesF.J. Luque Gutiérrez
Malmö University, Sweden
BML/BMT; Faculty of Health and SocietyJ. Engblom
Faculty of Health and SocietyP. Nilsson Y. Znamenskaya L. Pedersen
Materials ScienceW. Reheman
University of Manchester, United Kingdom
PSI Alan Turing BuildingK. Pogson
School of Physics and AstronomyD. Cant W. Flavell D. Graham S. Hardman P. Lunt K. Syres A. Thomas

MAX-lab ACTIVITY REPORT 2010 31
LIST OF USERS
Novo Nordisk A/S, Måløv, Denmark
M. Norrman C.S. Stenvang A. Svensson
University of Ulster, Newtownabbey, United Kingdom
Nanotechnology and Integrated BioEngineering Centre
A. Ganguly P. Papakonstantinou S. Sharma
University of Massachusetts Dartmouth, North Dartmouth, MA, USA
Department of Physics
C. Allen K. England D. Kelleher G. O’Rielly
University of East Anglia, Norwich, United Kingdom
School of Chemistry
P. Coxon
University of Nottingham, United Kingdom
School of Physics and Astronomy
A. Britton J.N. O’Shea M. Weston
University of Southern Denmark, Odense, Denmark
MEMPHYS - Center for Biomembrane Physics
A. González-Pérez
Université d’Orléans, France
Centre de Recherche sur la Matière Divisée
S. Guillot S. Serieye
Institute for Nuclear Studies, Otwock, Poland
Plasma Physics and Technology
R. Nietubyc
University of Oulu, Finland
Department of Biochemistry
A. Haapalainen K. Koski I. Kursula P. Kursula M. Lehtimaki M. Myllykoski G.U. Onwukwe B. Saligram Prabhakar R. Wierenga
Department of Physical Sciences
H. Aksela S. Aksela D. Anin M. Huttula S.-M. Huttula K. Jänkälä A. Kettunen M.-H. Mikkelä A. Mäkinen J. Niskanen L. Partanen M. Patanen P. Turunen

32 MAX-lab ACTIVITY REPORT 2010
LIST OF USERS
ESPCI ParisTech, France
PMMHK. Roger
Université Pierre et Marie Curie – Paris VI, France
Institut des Nanosciences de ParisI. Bidermane S. Boudet N. Witkowski
Laboratoire de Chimie Physique Matière RayonnementC. Bomme M. Bonato F. Bournel J.-J. Gallet A. Khaliq P. Lablanquie J.-M. Mariot J. Palaudoux F. Penent D. Pierucci M. Simon
University of Portsmouth, United Kingdom
Biological SciencesC. Henderson
Adam Mickiewicz University, Poznan, Poland
Department of Macromolecular PhysicsM. Balcerzak M. Kozak Z. Pietralik M. Taube
Department of Materials ChemistryP. Piszora
Institute of Physics, Prague, Czech Republic
Physics of SurfacesI. Bartos M. Cukr P. Jiricek
University of Pretoria, South Africa
BiochemistryM. Williams
University of Reading, United Kingdom
Department of ChemistryS. Akbar K.A. Asghar S. Baldanza A. Cornish I. Hamley G. Held G. Lotze C. Moulton R. Nicklin A. Shavorskiy M.T. Silvi A. Squires D. Watson
Weizmann Institute of Science, Rehovot, Israel
Computing CenterM. Taragin
University of Iceland, Reykjavik, Iceland
Department of PhysicsS. Olafsson B.C. Qi
Latvian Biomedical Research and Study Centre, Riga, Latvia
J. Rumnieks K. Tars

MAX-lab ACTIVITY REPORT 2010 33
LIST OF USERS
CNR, Roma, Italy
ISMP. De Padova
Risø National Laboratory – DTU, Roskilde, Denmark
Solar Energy Programme (SOL)J.W. Andreasen M.V. Madsen B. Pauw T. Tromholt
University of St. Petersburg, Russia
Institute of PhysicsK. Simonov
Dongguk University, Seoul, South Korea
Quantum-functional Semiconductor Research CenterH.C. Jeon
University of Sherbrooke, Canada
Nuclear Medicine and RadiobiologyM. Huels R. Wagner
Karolinska Institutet, Stockholm, Sweden
Department of Medical Biochemistry and BiophysicsJ. Guy M. Moche
Structural Genomics ConsortiumM. Welin
Royal Institute of Technology (KTH), Stockholm, Sweden
BiotechnologyT.C. Tan
Department of Material PhysicsB. Agnarsson S. Ahmadi M. Berntsen W. Chow O. Götberg M. Göthelid D. Stoltz P. Tabib Zadeh Adibi O. Tjernberg J. Weissenrieder M. Yazdanfar S. Yu A. Önsten
Nuclear ChemistryM. Holmboe
Surface and Corrosion ScienceO. Krivosheeva
Stockholm University, Sweden
Department of Biochemistry and BiophysicsC. Andersson D. Martinez Molina
Department of Materials and Environmental Chemistry
B. Aziz D. Gebauer N. Hedin S. Huang

34 MAX-lab ACTIVITY REPORT 2010
LIST OF USERS
Department of Physics
E. Bäckström L. Gerén J. Gurell O. Lundberg S. Mannervik K. Marcks von Würtemberg P.-E. Tegnér
Department of Structural Chemistry
A. Inge J. Sun X. Zou
YKI, Institute for Surface Chemistry, Stockholm, Sweden
E. Chauvet R. Corkery D. Kalnin
Max Planck Institutefor Solid State Research, Stuttgart, Germany
Interface Analysis Group
C. Coletti K. Emtsev S. Forti A. Kuester U. Starke
The Andrzej Soltan Institute for Nuclear Studies, Swierk, Poland
Department of Plasma Physics and Materials Engineering
K. Nowakowska-Langier
University of Szeged, Hungary
Department of Inorganic and Analytical Chemistry
E. Bajnoczi D.F. Sranko
Tampere University of Technology, Finland
Institute of Physics / Surface Science Laboratory
H. Ali-Löytty M. Hirsimäki P. Jussila K. Lahtonen M. Valden
University of Tartu, Estonia
Institute of Physics
E. Feldbach U. Joost A. Kikas K. Kooser I. Kuusik T. Käämbre H. Mägi V. Nagirnyi E. Nõmmiste R. Pärna S. Vielhauer
Università degli Studi di Torino, Italy
Chimica IFM
O. Zavorotynska
CNR-IOM, Trieste, Italy
TASC Laboratory
A. Kivimäki
Sincrotrone Trieste, Italy
M. Nino

MAX-lab ACTIVITY REPORT 2010 35
LIST OF USERS
Norwegian University of Science and Technology, Trondheim, Norway
Department of Physics
C. Coutant M. Esmaeili D. Fonseca J.O. Fossum H. Granlund C.B. Hansen H. Hemmen E. Lindbo Hansen Å. Monsen Z. Rozynek E. Wahlström L.E. Walle J. Wells
National Food Research Institute, Tsukuba, Japan
S. Kaneko
University of Turku, Finland
Department of Physics
J. Dahl K.D.T. Ha M. Heinonen E. Itälä L. Järvinen E. Kukk M. Kuzmin P. Laukkanen J. Leiro J. Lång M. Tuominen V. Tuominen
Universität Tübingen, Germany
Physikalisches Institut
D. Middleton
Swedish Army Research Agency, Umeå, Sweden
Department of Threat Assesment
F. Ekström
Umeå University, Sweden
Department of Chemistry
A. Edwin L. Edvinsson T. Karlsson A. Linusson G. Merilainen U.H. Sauer E. Sauer-Eriksson
Department of Odontology
K. Persson
Department of Physics
A. Talyzin
Swedish University of Agricultural Sciences, Uppsala, Sweden
Department of Chemistry
A. Herrmann I. Persson
Department of Molecular Biology
G. Askarieh A. Digre M. Gudmundsson M. Haddad Momeni H. Hansson T. Ishida S. Karkehabadi N. Mikkelsen M. Wu
Department of Anatomy, Physiology and Biochemistry
M. Hedhammar

36 MAX-lab ACTIVITY REPORT 2010
LIST OF USERS
Uppsala University, Sweden
Department of Biochemistry and Organic Chemistry
M. Webb
Department of Cell and Molecular Biology
C. Björkelid D. Ericsson A. Jansson T.A. Jones M. Persson M. Sandgren T. Unge
Department of Engineering Sciences
J. Andersson P. Svedlindh
Department of Materials Chemistry
Y. Brandt Andersson K. Ciosek K. Edström R. Eriksson T. Gustafsson M. Hahlin K. Maher S. Malmgren G. Oltean M. Ottosson C. Pay Gomez B. Philippe M. Sahlberg A. Sobkowiak S. Tan J. Ångström
Department of Medical Biochemistry and Microbiology
M.C. Juergens
Department of Pharmacy
J. Gråsjö P. Hansson
Department of Photochemistry and Molecular Science
J. Davidsson M. Marcellini A. Nasedkin
Department of Physical and Analytical Chemistry
U. Cappel A. Hagfeldt S. Kaufmann J. Unga
Department of Physics and Astronomy
M. Agåker D. Arvanitis O. Björneholm K. Fransson E. Göthelid E. Johansson T. Johansson O. Karis R. Knut H. Levard M.L. Ng N. Ottosson P. Pal P. Palmgren A. Persson M.N. Piancastelli S. Plogmaker W. Pokapanich C. Puglia D. Ragazzon J. Rausch H. Rensmo A. Sandell A. Schaefer R. Schölin M.N. Shariati H. Siegbahn S. Svensson J. Söderström E. Thomé P. Warnicke J. Vegelius M. Wolke
VG Scienta AB, Uppsala, Sweden
J. Åhlund
University of Illinois, Urbana, USA
Department of Physics
L. Myers
Carlsberg Laboratory, Valby, Denmark
A. Henriksen R. Jorgensen

MAX-lab ACTIVITY REPORT 2010 37
LIST OF USERS
Polish Academy of Science, Warsaw, Poland
Institute of Physics
O. Ermakova E. Guziewicz K. Jablonska D. Jaroslaw M. Klepka K. Kopalko I. Kowalik B. Kowalski W. Paszkowicz M. Pietrzyk A. Siusys L. Wachnicki E. Werner-Malento A. Wolska
George Washington University, Washington DC, USA
Department of Physics
W. Briscoe H. Caceres K. Dibenedetto J. Feldman J. Kuczynski S. Lipschutz B. Smith
Vienna University of Technology, Austria
Institute for Applied Physics
A. Buchsbaum
Université Claude Bernard Lyon 1, Villeurbanne, France
Laboratoire de Spectrométrie Ionique et Moléculaire
C. Cauchy F. Lépine
Institute of Biochemistry, Vilnius, Lithuania
Department of Bioanalysis
J. Barauskas M. Jankunec E. Voitechovic
Vilnius University, Lithuania
General Physics and Spectroscopy
R. Bariseviciute J. Ceponkus M. Pucetaite V. Sablinskas S. Strazdaite
University of York, United Kingdom
Electronics
W. Zhang
Örebro University, Sweden
School of Science and Technology
E. Grahn

38 MAX-lab ACTIVITY REPORT 2010
Knut Børve, Leif Sætre’s colleague from University of Bergen, is switching on the pumps on the cluster source, with which they produce and study hydrogen-bonded clusters of simple inorganic and organic molecules.Photo: Annika Nyberg
Leif J. Sætre, from the University of Bergen, setting up a cluster experiment at beamline I411, 11 October 2010.Photo: Annika Nyberg

MAX-lab ACTIVITY REPORT 2010 39
ACCELERATOR PHYSICS AND MACHINE DEVELOPMENT
ACCELERATOR PHYSICS
AND
MACHINE DEVELOPMENT

40 MAX-lab ACTIVITY REPORT 2010
ACCELERATOR PHYSICS AND MACHINE DEVELOPMENT
Caj Lundquist (MAX-lab), Göran Hellqvist (Fojab), Janis Kursis (Fojab), and Sara Thorin (MAX-lab) discussing fi nal adjustments on the Linac building at a project group meeting at ML4, 6 December 2010. Photo: Annika Nyberg

MAX-lab ACTIVITY REPORT 2010 41
ACCELERATOR PHYSICS AND MACHINE DEVELOPMENT
Machine and Accelerator Physics
There are three storage rings at MAX-lab; MAX I, MAX II and MAX III. All three rings are used for synchrotron radiation production and the MAX I ring is also used for experiments in nuclear physics, working as a pulse-stretcher. All three rings are fed by the 400 MeV MAX injector.
A test-FEL is placed inside the MAX II storage ring which also uses the MAX injector as the electron source.
The construction of the MAX IV facility has started in the fall of 2010. A necessary condition for this was the fi nalization of the fi rst version of the Detailed Design Report (http://www.maxlab.lu.se/maxlab/max4/DDR_public/index.html ) which defi nes the accelerator complex. The Machine group and the department of Accelerator Physics have been heavily involved in the construction work of the MAX IV facility.
The characterization of the electron gun in the FERMI (Trieste) project has been fi nalized.
The MAX injector is of recirculated linac type and is primarily used for injection into the three storage rings and for free electron laser (FEL) experiments.
The MAX I ring is injected at 190 MeV and the MAX II and MAX III rings at 380 MeV.
This injector consists of an RF gun and two S-band linac sections 5.2 m long equipped with SLED cavities. A recirculation magnet system is used to double the electron energy. These linacs are now conditioned to a little more than 100 MeV energy gain each and the maximum energy gain for both linacs is 210 MeV. By recirculating the electron beam once through the linacs, a maximum electron energy of 420 MeV can be reached.
The RF electron gun used for injection is equipped with a thermal cathode. This gun is quite reliable, but the beam quality is rather poor, due to space-charge effects during the early acceleration in the gun. The performance of this thermionic gun is however quite suffi cient for injection into the rings.
For the FEL runs, the thermionic BaO cathode is used as a laser-driven photo-cathode.
The MAX injector has been quite reliable and negligible time is lost due to malfunctioning of this accelerator.
The MAX I ring is aging and suffers from reduced beam life-time in the storage mode due to vacuum problems. Since most of the SR experiments now have been transferred to the MAX III ring and also due to man-power limitations, a vacuum upgrade is of lower priority.
In the pulse-stretching mode for nuclear physics, the deterioration of the vacuum system is of no importance and the properties of the electron beam in this application are now rather close to the design values and both the ring and injector are working under stable conditions.
The MAX II ring was working as well as a low-energy injected storage ring can do until November 2010 with a down-time around 2%. In mid November, we had a break-down of the transformer in the dipole power supply, which stopped operation for fi ve weeks until a new transformer could be delivered and installed.
The electron beam stability is in the micrometer range, 300 mA can be injected twice a day and with a beam life-time of 5-6 Ah, some 160 mA remains at the next injection. The mean current is now typically 180-200 mA. 8% of the total time is spent on injection and ramping of the lattice magnets, undulators and the superconducting wigglers.
The MAX III ring is now operating with two beamlines. Typically over the year the availability was around 95%, where 3% of the total time were taken away by injections and 2% by down-time. However, during two weeks in October the availability was down to 50% due to a tricky vacuum leak. The beam life-time has improved to some 1-1,5 Ah, due to an active blow-up of the vertical emittance. Work is in progress increasing the longitudinal emittance as well.

42 MAX-lab ACTIVITY REPORT 2010
ACCELERATOR PHYSICS AND MACHINE DEVELOPMENT
The test Free Electron Laser at MAX-lab has produced fi rst light. The system is built around the 400 MeV linac injector utilizing two undulators placed inside of the MAX II storage ring. The system is seeded by a 263 nm Ti:Sapphire laser and can produce fully coherent radiation in harmonics of the seed. During 2010 coherent harmonics up to 6th order (42 nm) have been produced in linear mode and up to 4th order (65 nm) in circular mode. Photon pulse lengths are in the order of 500 fs. The peak intensities in the harmonics exceed the spontaneous emission by more than an order of magnitude and a signifi cant line width narrowing is observed.
References: First Results of Coherent Harmonic Generation at the MAX-lab Test FEL, S. Werin et al, Proceedings FEL2010, Malmö, Sweden (2010).On-Line Arrival Time and Jitter Measurements Using Electro-Optical Spectral Decoding, N. Cutic et al, Proceedings FEL2010, Malmö, Sweden (2010).
Machine Parameters
Injector LinacMax. energy 420 MeVPulse current 50 mAPulse length 50 nsEnergy spread Not verifi edEmittance Not verifi ed
MAX I RINGStorage modeMax. energy 550 MeVMax. circ. current 300 mA Hor. emittance 40 nm radRF 500 MHzBunch length (FWHM) 80 psBeam lifetime 4 h (now decreased to some 2 h)
Pulse-stretcher modeElectron energy 144, 188 MeVDuty factor 75 %Stretched pulse current 20 nA
MAX II RINGMax. energy 1.5 GeVMax. circ. current 290 mA Hor. emittance 8.8 nm radRF 100 MHzBeam lifetime 5-6 Ah (25-30 h at 200 mA)
MAX III RINGMax. energy 700 MeVMax. circ. current 300 mAHor. emittance 14 nm radRF 100 MHzBeam lifetime 1-1.5 Ah

MAX-lab ACTIVITY REPORT 2010 43
ACCELERATOR PHYSICS AND MACHINE DEVELOPMENT
Reports from Accelerator Physics
Coherent harmonic generation at the MAX-lab test FEL N. Cutic, F. Lindau, S. Thorin, S. Werin, C. Erny, A. L’Huillier, E. Mansten, J. Bahrdt, and K. Holldack ...... 44
On-line arrival time and jitter measurements using electro-optical spectral decoding N. Cutic, F. Lindau, S. Werin, and E. Mansten ........................................................................................ 48
Upgrade of the magnetic structure of undulator I311 E. Wallén ............................................................................................................................................. 50

44 MAX-lab ACTIVITY REPORT 2010
ACCELERATOR PHYSICS AND MACHINE DEVELOPMENT
C. N. uti , F. Li
Erny, A. L’HuillJ. Bahr
indau, S. Thorinlier, E. Manstenrdt, K. Holldack
n, S. Werin, Max, Dep. of Atomic
k, Helmholtz Zen
-lab, Lund Univc Physics, Lund Untrum Berlin, G
versity, Sweden, University, Swedermany
den,
The test FELMAX-lab andZentrum Berlknowledge onelectron lasersis used as thoperated in containing 25duration shorte
Two undulamagnetic chicafirst undulator,the acceleratedpulse with a wundulator - thecan emit coheseed wavelenghorizontally fspectrometer (nitrogen cooleCHG signal.
See [1] for d
Operation Coherent Ha
up in a mulradiation fromradiator undul
Figure 1. Cohlinear and circundulator radiline).
INTRODUCTL is a collaborad BESSY (nlin) to study, n seeding as a. The existing
he electron souRF photocath
5-40 pC and er than 1 ps are ators, providedane form an opt, an energy modd electrons withwavelength of 2e radiator - is oferent radiation gth with variafocusing collec(2400 l/mm grd CCD array ar
details on the se
RESULT
armonic Generlti-step processm the modulalator was reco
herent 4th harmcular mode witiation in circul
TION ation project benow the Helm
develop and a technique forinjector at MAurce, with the
hode mode. Pcompressed
normally used.d by BESSY, atical Klystron. dulation is seedh a 0.5 ps long263 nm. The sef APPLE II typeat harmonics o
able polarizatioction mirror arating) with a re used to recor
etup.
S
ration (CHG) ws. The spontaator undulatororded to assur
monic signal inth fitted spontalar mode (red
tween mholtz
build r free
AX-lab e gun Pulses to a
. and a In the
ded on g laser econd e, and of the on. A and a liquid rd the
was set aneous r and re the
propewaveelectThe best transplacescreeunduElectsignatempline. CHGUnfoout tempsignaphaserematroub
CoheCH
(1st h(45nm2nd aalso
(figurradiaexactthe rwaveharmharm
Thcalcu
n both aneous
solid
Figursigna(Radthus 2
er gap settingselength. This tron beam energelectron beam spectrometer s
sverse overlap ed on top of thens placed befulator. Temporatro Optical systal was sought wporal overlap b
This was folloG signal by adjortunately, the sof overlap ov
poral feed-backal partly curese drifts betwee
ain though, whiblesome withou
erent HarmonicHG has been reharmonic at 2m) in linear mand 4th harmonbeen recorded
re 1). The spation backgrountly the harmoniradiator undulatelength of 133
monic of the undmonic of the seedhe spontaneouulated using SPE
re 2: Linear cal with fitted spiator set to 132nd and 3rd of th
s calibrated to was necessary
gy calibration worbit was also
signal. This wawhere the s
he electron beamfore and after al overlap was atem (EO). Afterwith small adjuy use of the sewed by an optiusting the transystem has a tever a 10 mink system bases the problemen the RF gunch makes prolo
ut tuning.
c Generation ecorded from th63 nm) to the
mode (see figurenics (133 nm &
in circular pol
pectra show thnd and the CHGic of the seed lator was put to 3 nm where thdulator equalledd.
us undulator ECTRA [3] wh
oherent 4th andontaneous undu
31 nm and the he radiator wav
the seed lasery as a precisewas not at hando optimised foras followed byeed laser wasm on two YAGthe modulator
adjusted via ther this the CHG ustments to theeed laser delayimisation of thensverse overlapendency to driftnute period. Aed on the EO
m [2]. Relativen and the linaconged operation
he fundamentae 6th harmonices 3 & 4). The
& 66 nm) havelarization mode
he spontaneousG peak placed ataser. In figure 2
a fundamentahe 2nd and 3rd
d the 4th and 6th
radiation washere the gap and
d 6th harmoniculator radiation
harmonics areelength).
r e
d. r y s
G r e
e y e .
ft A O e c n
l c e e e
s t 2 l d h
s d
c n. e
Coherent Harmonic Generation at the MAX-lab test FEL

MAX-lab ACTIVITY REPORT 2010 45
ACCELERATOR PHYSICS AND MACHINE DEVELOPMENT
opening anglerecorded spontcould be calcu4th harmonic (per pulse (at corresponds to
A modulato(figure 3) and harmonic (13signal is presenundulator linewthe modulationon a shorter increased linew
Laser energy aThe laser
system strengthmicrobunchinglaser energy polariser. It is spread by the energy spread induced energychicane will bneeded. Also Theoretically sensitive knobHowever instmakes these ki
In figure 4 tscans are showreaches higheris increased. Tis further inoverbunching.
A lower chilaser energy tolaser was not system.
The interm
Figure 4: Scundulator) fomicrobunching
es where fitttaneous signal.ulated. The resu(66 nm) we ha
25 pC in ciro 1.1 pJ/pulse. or undulator gthe resulting C3 nm) was rent within a largwidth which can is efficient ev
part of the width.
and modulationenergy and th were scannedg in the CHGcan be adjusfavourable to inseed laser comin the electrony spread the m
be quicker and over bunchingthe chicane s
b to optimiseabilities and dind of optimisatthe qualitative r
wn. A stronger cr CHG signal w
The signal then ncreased, whi
icane setting (1o microbunch tintense enough
mediate chica
can of the laor different g chicane.
ed to achieve Thus the CHGults show that ave 390.000 phrcular mode) w
gap scan was CHG signal at thecorded. The er range than than be explaineven if it only wundulator, thu
the chicane md. This influenc
G process. Thested by a rotnduce a large e
mpared to the n beam. With a
microbunching d a lower streng will occur qusetting should e the CHG odrift in the stions difficult.results of this kchicane (3 A) quwhen the laser e
drops when thech is a sig
1.3 A) requires the electrons, bh to over bunc
ane settings
ser energy (inexcitations of
e the G flux in the
hotons which
made he 2nd CHG
he full d that works us an
magnet ces the e seed tatable energy natural larger in the
ngth is uickly.
be a output. ystem
kind of uickly energy e laser gn of
more but the ch the
give
intermTh
signaindiclimiti
ThHZBcommCohesystemodeand modepolarbeen
Thachiegoalswas tand FFEL
[1]
[2]
[3]
Figurfunctn the
f the
mediate results,here is no defal using moreation that the ning factor at the
She collaboratio/Bessy has
missioned the erent Harmonicm has been ue in the 1-6th ha4th harmonic (e has been achirised coherent robserved from
he main goalseved and soms. One of the mto gain experieFEL technologyfacility within t
RES.Werin et al., Malmö, SwedeN. Cutic et al, Malmö, SwedeT. Tanaka and 8(2001)1221
re 3. Coherention of modulat
, but only qualifinite sign of e laser energynatural energy e 2nd harmonic
UMMARY on between
successfully test FEL at
Generation. Aupgraded and armonic (263-4(133 and 66 nieved. We belieradiation at 66an accelerator
s of the systee features evemain purposes ence of operatiy to build a bathe MAX IV pr
EFERENCESProc. of the FE
en, 2010. Proc. of the FE
en, 2010. H. Kitamura, J
nt 2nd harmontor gap.
tatively. a higher CHGy. This is anspread is not a(133 nm).
MAX-lab andbuilt and
MAX-lab forAn existing linac
CHG in linear42 nm) and (2nd
nm) in circulareve that circular6 nm has neversource before.
em have beenen beyond the
of the facilityion, diagnosticsase for a futureroject.
EL10, WEOA4
EL10, THOA4
J. Synchr. Rad
nic signal as a
G n a
d d r c r d r r r
n e y s e
,
,
d.
a

46 MAX-lab ACTIVITY REPORT 2010
ACCELERATOR PHYSICS AND MACHINE DEVELOPMENT

MAX-lab ACTIVITY REPORT 2010 47
ACCELERATOR PHYSICS AND MACHINE DEVELOPMENT
The 32nd International Free Electron Laser conference gathered more than 300 participants at Hilton in Malmö, 23-27 August 2010. The program covered FEL presenta-tions, seminars, an Industrial Exhibition, Poster sessions and dinner parties. Guillaume Lambert, Laboratoire d’optique appliquée, was awarded the Young Scientist FEL Award Check 2010.Sven Reiche, Paul Scherrer Institut was the winner of the FEL Price 2010. Photos: Annika Nyberg, Erik Wallén, and Helena Ullman

48 MAX-lab ACTIVITY REPORT 2010
ACCELERATOR PHYSICS AND MACHINE DEVELOPMENT
ON-LINE ARRIVAL TIME AND JITTER
MEASUREMENTS USING
ELECTRO-OPTICAL SPECTRAL DECODING
Nino Cutic, Filip Lindau, Sverker Werin, MAX-lab, LundErik Mansten, Department of Physics, Lund University, Sweden
INTRODUCTIONA crucial component of the test-FEL is a device based
on electro-optical spectral decoding (EOSD) which al-lows on-line monitoring of the bunch compression andthe electron bunch arrival time relative to the seed laserpulse. Since the electron bunch and the seed laser pulseare of subpicosecond duration a technique that allowstiming measurements with better precision than whatcan be achieved with photodiodes ( 200 ps) is needed.Electro-optical schemes using the interaction of a tera-hertz eld created by the traveling electron bunch and alaser pulse passing through a crystal have been developed( rst in laser based sources of THz radiation) and latermodi ed and applied for measurements of bunch arrivaltime and duration at accelerators [1, 2]. These techniquehave shown to be robust enough and comparatively cheapsince a required laser pulse for seeded facilities is readilyavailable without major extra costs.
EXPERIMENTAL SETUPThe EOSD system consists of 3 major parts and oper-
ates using a small sample (< 1 μJ) of the ampli ed seedlaser pulse (before it is tripled to UV). The rst part of thesystem is in the seed laser hutch and it consists of a sep-arate stretcher built for IR pulses, focusing optics (tele-scope focusing onto the crystal inside the EOSD cham-ber, 6.5 m focus), delay stages (a main delay stage con-trolling the delay of both pulses relative to the electronbunch, and a UV delay stage shifting the UV pulse rela-tive to the IR pulse) and a UV-IR overlap monitor basedon difference frequency generation (DFG). The secondpart is the EOSD chamber which is the only part of theEOSD system placed in vacuum. The chamber holds thecrystal(1 mm thick ZnTe cut in the (100) plane), mirrorand photodiode (for rough timing) on a translation stage(used to position the crystal transversally arbitrarily closeto the passing electron bunch). The third part is the EOSDdetector consisting of polarization optics and a spectrom-eter which is placed outside of the vacuum system rightnext to the chamber. Figure 1 shows what is described asthe EOSD chamber and EOSD detector.
To stabilize the drifts a feedback routine is built thatcontrols the position of the peak of the signal so that itis always on desired position (the laser pulse is at de-sired timing relative to the electrons). This is done witha PI controller moving the main delay stage (Thorlabs150 mm).
from LINAC
Figure 1: The EOSD chamber and detector. The IRchirped pulse (3.3 ps FWHM, 5 nm FWHM bandwidth,790 nm central wavelength) passes through the crystaland is re ected out of the chamber to the detector. Thedetector consists of polarization optics (Quarter-waveplate, half-wave plate and Glan-laser polarizer) which
lters the polarization of interest and the spectrometer.Based on the position of the peak in the signal on spec-trometer it is possible to determine the arrival time of theelectron bunches relative to the IR pulse and estimate thelength of the electron bunch from the width.
To reduce jitter caused by the 50 Hz grid frequency,the triggering of devices should be synchronized to thisfrequency. The synchronization is done by a microcon-troller sending a trigger pulse every 5 grid cycles to obtainthe desired 10 Hz pulse rate for the laser.
MEASUREMENT AND RESULTSJitter measurements and feedback Figure 2 onleft shows three images each showing a series of spectrathrough time. The frequencies on the right span to 1 Hzbecause the repetition (sampling) frequency is 2 Hz. Thetop two images belong to measurement done without anyfeedback. The middle two are with the 50 Hz lock is ac-tive. And the lower two are with 50 Hz lock active anda PI controller controlling the position of the peak at cer-tain point. Noticeable improvement in stability is visible.Turning on the 50 Hz lock reduces the RMS jitter from915 fs to 425 fs. It also removes the 0.45 Hz peak whichwas an in uence of the power grid to the system probablyon higher frequencies that was undersampled. This still

MAX-lab ACTIVITY REPORT 2010 49
ACCELERATOR PHYSICS AND MACHINE DEVELOPMENT
5 10 15 20 25
0
2
4
6
Time (minutes)
Tim
e (
ps)
5 10 15 20 25
0
2
4
6
Time (minutes)
Tim
e (
ps)
5 10 15 20 25
0
2
4
6
Time (minutes)
Tim
e (
ps)
Figure 2: Measurements of the long term drifts and jitter (left) and the corresponding power spectra of the arrivaltime (right). On the left side each spectrum captured (about 3300 of them, corresponding to 25 minutes) is converted totime and shown vertically using the false coloring of the signal’s intensity. The central position is calculated and shownin red overlaid curve. The right side shows power spectra of these red curves. Top - without feedback; middle - with50 Hz lock; bottom - with EOSD feedback and 50 Hz lock.
leaves majority of long term drifts below 0.05 Hz whichare lowered 10 dB more by the delay stage feedback giv-ing nal RMS jitter of 300 fs.
Drifts and bunch length Measurements of thebunch length are done simply by determining the width ofthe EOSD signal. Their main limitation is the large thick-ness of the ZnTe crystal. Larger thickness of the crystalin uences the effective cutoff frequencies of the system(makes the EOSD “slower” due to mismatch between thepropagation of the THz and optical pulses through thecrystal) but improves the signal strength (larger thicknessmeans more polarization rotation).
Figure 3: Correlation between the arrival time of elec-tron bunches and the width of the EOSD signal (approxi-mately bunch length, see text). This correlation points tothe accelerator as the main cause of drifts.
Figure 3 shows the correlation between the measuredpulse width and arrival time for the case without any feed-backs (overlaid red curve from top left in Fig. 2). Assum-ing the Gaussian shape of the bunch, simulations showthat our setup overestimates the real bunch length by 6%for shorter measurements (1 ps) and 3% for longer (im-plying the bunch width to be ranging from 0.95 ps to1.26 ps FWHM). Obvious correlation between the arrivaltime of electrons and their compression is a sign that thedrifts are coming from the linac and not the laser system.If the laser system was the main cause of drifts the com-pression would not correlate so good with the drifts.
REFERENCES[1] I. Wilke et. al., Phys. Rev. Lett. 88, 124801
(2002).[2] B. Steffen, PhD thesis “Electro-Optic Methods
for Longitudinal Bunch Length Diagnostics atFLASH”, (2007).
[3] S. Werin et. al., Proc. of the FEL10, Malmo,Sweden, WEOA4, 2010.
[4] S. Werin et. al., Proc. of the FEL09, Liverpool,UK, TUPC034, 2009.

50 MAX-lab ACTIVITY REPORT 2010
ACCELERATOR PHYSICS AND MACHINE DEVELOPMENT
Upgrade of the magnetic structure of undulator I311
Erik Wallen
INTRODUCTIONIn the summer of 2010 the original hybrid type magnet
arrays of the I311 undulators were replaced by pure per-
manent magnet arrays. Figure 1 shows the upgraded I311
undulator. The minimum gap has been reduced from 22
mm to 16 mm and the period length reduced from 66 mm
to 54.4 mm.
Figure 1: The I311 undulator with the upgraded magnetic
structure in July 2010.
THE ORIGINAL MAGNETICSTRUCTURE OF I311
The I311 undulator [1] at the the 1.5 GeV MAX II stor-
age ring [2] was installed in 1995-1996. The original I311
undulator was of hybrid type with a period length of 66 mm
and total total length of 2.6 m. The magnetic blocks have
shown signs of cracking and some steel shims have either
fallen off or moved during the last few years.
The I311 undulator was removed from the MAX II ring
tunnel on July 5, 2010 and set up at the magnet measuring
benches to be measured before the old magnet assemblies
are removed to document the status of the undulator after
15 years of operation. Measurements were done at 23, 30,
85 and 66 mm gap as reported in [3]. Figure 2-6 contain the
measured phase errors and multipoles of the original mag-
netic structure. Figure 2-6 also include the case when the
first and second field integrals are removed by correction
coils in front of and behind the undulator in order to better
represent the way the undulator was used in the MAX II
ring.
Figure 2: The phase errors for the original and upgraded
I311 undulator.
THE UPGRADED MAGNETICSTRUCTURE OF I311
The upgraded I311 undulator is of pure permanent mag-
net type to avoid the non-linearities of the iron poles in a
hybride type undulator. The size of the magnetic blocks
have been adjusted to get the same forces at minimum gap
in the new and original configuration [4]. The minimum
gap is 16 mm and the period length is 54.4 mm with the
upgraded magnetic structure . The main parts of the sup-
port structure has not been changed. The total number of
poles is 98 and the fundamental harmonic of the emitted
synchrotron radiation covers the energy range 40-350 eV.
Figure 3: The dipole field integrals for the original and up-
graded I311 undulator.
The shimming process was carried out in July 2010. Af-

MAX-lab ACTIVITY REPORT 2010 51
ACCELERATOR PHYSICS AND MACHINE DEVELOPMENT
ter the shimming the undulator properties at 17, 19, 21,
25, 30, 40, 50 and 60 mm gap were measured as reported
in [5]. Figure 2-6 contain the measured phase errors and
multipoles of the upgraded magnetic structure. The phase
angle error is below 3 at all gaps. The fundamental photon
energy at 17 mm gap is 42.68 eV calculated with a fila-
ment electron beam and with the gap lowered to 16 mm the
fundamental photon energy will be below 40 eV.
Figure 4: The quadrupole strength for the original and up-
graded I311 undulator.
Figure 5: The sextupole strength for the original and up-
graded I311 undulator.
Figure 6: The octupole strength for the original and up-
graded I311 undulator.
PHOTON FLUX AT THE EXPERIMENTALSTATION AT BEAMLINE 311
The photon flux at the sample at the experimental station
at beamline 311 with the original and upgraded magnetic
structure is shown in Figure 7 [6]. As can be seen in Figure
7, the flux at the sample has increased an order of magni-
tude over a wide range of the spectrum with the upgraded
compared to the original magnetic structure.
1st order 3rd order 5th order 7th order
corr. for photodiode response. meas. after exit slitcorr. to slit 116 um (meas. 60 um)c = 2.25M3 baffles 6.5 18.52010-08-26
Old
Figure 7: Flux at the sample at the experimental station at
beamline 311[6].
ACKNOWLEDGEMENTSI would like to thank Ingvar Blomqvist for the exten-
sive and highly appreciated help and advice during the
work with the magnetic and mechanical design, shimming,
and software development during the work at the magnetic
measurement system.
I would like to thank Hakan Svensson for advice on the
mechanical design, help with drawings, contact with com-
panies, and taking care of orders, deliveries, and transports
during the project.
I also would like to thank Bengt Sommarin for mount-
ing 400 magnet blocks in magnet holders and mounting the
holders on the girders with high precision.
REFERENCES[1] T. Meinander, H. Ahola, M. Ryynanen, J. Tahvanainen, G.
LeBlanc, and S. Werin, TECHNICAL DESCRIPTION OFTHE MAX II UNDULATORS, Proceedings of EPAC 1996.
[2] A. Andersson, et al., Nucl. Instr. andMeth. A 343 (1994) 644.
[3] E. Wallen, and I. Blomqvist, Measurements on the existingI311 undulator, July 7, 2010.
[4] E. Wallen, Design report for the new BL311 undulator, Au-gust 26, 2009.
[5] E. Wallen, and I. Blomqvist, Measurements on the upgradedI311 undulator, July 23, 2010.
[6] K. Schulte, BL-311 MAX-lab, Private communication
november 2010.
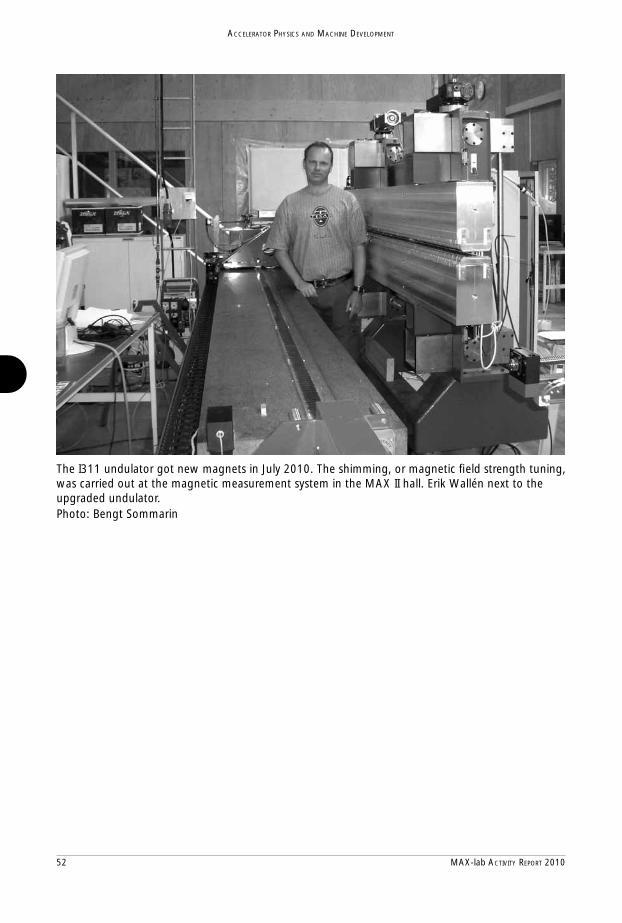
52 MAX-lab ACTIVITY REPORT 2010
ACCELERATOR PHYSICS AND MACHINE DEVELOPMENT
The I311 undulator got new magnets in July 2010. The shimming, or magnetic fi eld strength tuning, was carried out at the magnetic measurement system in the MAX II hall. Erik Wallén next to the upgraded undulator. Photo: Bengt Sommarin

MAX-lab ACTIVITY REPORT 2010 53
SYNCHROTRON RADIATION
SYNCHROTRON
RADIATION

54 MAX-lab ACTIVITY REPORT 2010
SYNCHROTRON RADIATION
MAX-lab ACTIVITY REPORT 2010 55
SYNCHROTRON RADIATION
Synchrotron Radiation Research
GeneralDuring 2010 the MAX I, MAX II and MAX III storage rings have been operated for synchrotron radiation research for 22, 40 and 40 weeks, respectively. About 760 scientists have been performing experiments during this time period. Of these about 60 % came from abroad. The scientifi c projects include experiments in atomic and molecular physics, solid state physics, surface physics, material science, chemistry, life science and environmental science. Reports from the users on recent experi-mental results are given on the following pages.
Most beamlines on MAX I utilize radiation from bending magnets which provide radiation with a critical energy of 300 eV. In addition a hybrid undulator (period length 75 mm) covering the photon energy range 15 to 150 eV is used for a spectromicroscopy beamline. In total there are four beam-lines in operation. The characteristics of the beamlines are summarized in the table on page 59 and a short description of each beamline is given below.
The MAX II storage ring is equipped with three planar undulators and one EPU for the VUV and soft X-ray regions and three multi-pole wigglers for the X-ray region. One conventional multi-pole wiggler beamline is used for small molecule crystallography and powder diffraction. Of the two superconducting multi-pole wigglers, one is used for a materials science beamline for absorption and diffraction experiments and one is used for a system of fi ve independent beamlines mainly for pro-tein crystallography and small angle X-ray scattering. The undulators serve beamlines with a variety of spectroscopic techniques such as X-ray absorption (including circular dichroism), X-ray emission, X-ray photoelectron spectroscopy and photoemission electron microscopy in the VUV and soft X-ray regions. A fourth spectroscopy beamline is installed on a bending magnet port where circularly polarized radiation can be used. A bending magnet beamline is also used for time resolved X-ray diffraction.
Two undulator beamlines are operational at the 700 MeV MAX III storage ring; one EPU covers the low energy region 5 – 50 eV and planar undulator covers the energy range 13 – 200 eV. The undula-tors serve beamlines for angular and spin resolved photoelectron spectroscopy. A third beamline for infra-red microspectroscopy, utilizing bending magnet radiation, is under construction.
More detailed descriptions of these beamlines are found at the end of this chapter and in the tables on pages 60 - 62.
The synchrotron radiation research program is fi nancially supported by Lund University, and the Swedish Research Council (VR). Also many private foundations contribute with substantial grants for investments in experimental equipment, among these are the Knut & Alice Wallenberg Foundation, the Crafoord Foundation, the Carl Tryggers Foundation, and Kungl. Fysiografi ska Sällskapet i Lund.

56 MAX-lab ACTIVITY REPORT 2010
SYNCHROTRON RADIATION
MAX-lab ACTIVITY REPORT 2010 57
SYNCHROTRON RADIATION
MAX I Beamlines(see www.maxlab.lu.se for more details).
Beamline 31 utilizes undulator radiation in the energy range 15 to 150 eV for scanning photoelec-tron microscopy with a lateral resolution in the micrometer range.
The experimental system consists of separate analyzer and preparation chambers accessible via a transfer arm. The analyzer chamber, which also holds an ellipsoidal focusing mirror, is equipped with a hemispherical sector electron energy analyzer (VG CLAM2) and a piezo-driven sample scanning stage. The preparation chamber is equipped with LEED, ion sputtering gun, sample storage magazine and a number of optional ports for user owned sample preparation accessories.
Beamline 41 is used for angle resolved photoelectron spectroscopy on solids in the photon energy range from 15 to 200 eV using a toroidal grating monochromator (TGM). The beamline is suited for measurements of both valence bands and shallow core levels.
The experimental station consists of an analyzer chamber with a goniometer mounted electron energy analyzer (VSW HA50), a sample storage chamber and a sample introduction chamber. The analyzer chamber is equipped with LEED, ion sputtering gun, gas-inlet system and a number of optional ports for user owned sample preparation accessories.
In addition to this basic set-up a molecular-beam epitaxy (MBE) system with six Knudsen cells and a RHEED optics is available for the growth and in situ studies of III-V compound semiconductors.
Beamline 52 consists of a normal incidence monochromator working in the photon energy range 5 to 30 eV. The beamline is equipped with a differential pumping stage that makes it useful for measurements on gases as well as on solids. During 2010 no user projects have been carried out on this beamline, they have migrated to the new I3 beamline on MAX III. Instead beamline 52 has been used for outreach activities for high-school teachers and students.
Beamline 73 is used for spectroscopy and microscopy in the far, mid and near infrared region (10-12 000 cm-1). It is equipped with two different Fourier transform spectrometers.
A Bruker HR 120 is used for high resolution, 0.001 cm-1, spectroscopy. The set up has several options for introducing gases, liquids and solid samples. A gas cell, usable between 90 and 300 K, with a variable optical path length (maximum 120 m) is connected to the spectrometer.
A Bruker 66v/S spectrometer along with a Hyperion 3000 microscope is used for chemical imaging and mapping with a spatial resolution down to the diffraction limit. A 128x128 element focal plane array detector is available. The microscope can operate both in transmission and refl ection mode. Additional objectives for gracing angle and ATR measurements are available as well.

58 MAX-lab ACTIVITY REPORT 2010
SYNCHROTRON RADIATION
MAX II Beamlines(see http://www.maxlab.lu.se for more details).
Beamline I311 is an undulator based VUV, soft X-ray beamline for high resolution X-ray Photoemis-sion Spectroscopy (XPS) and X-ray Absorption Spectroscopy (XAS) and photoemission electron microscopy. The monochromator is a modifi ed SX-700 type PGM with spherical optics and a movable exit slit, which allows a high fl exibility concerning the interplay between photon fl ux, resolving power and higher order suppression. In summer 2010 the twelve year old magnetic structures in the undula-tor were replaced by new ones with 45 periods and a period length of 54.4 mm. The undulator now covers the energy range from 43 eV up to about 1500 eV.
The main experimental station consists of separate analyzer and preparation chambers accessible via a long-travel manipulator. The preparation chamber includes the usual equipment for preparation and characterization of surfaces (ion sputtering gun, LEED optics etc.). A hemispherical electron ener-gy analyzer (SCIENTA SES200) is used for photoelectron spectroscopy and XAS in Auger yield mode.
A SPELEEM instrument for photoemission electron microscopy is installed downstream from the main experimental station. This microscope has a spatial resolution better than 10 nm in the LEEM mode and 30 nm in the PEEM mode. It can also perform energy fi ltered XPEEM with a bandwidth of 300 meV in imaging mode, routinely achieving a lateral resolution of 30 nm.
Beamline I411 is based on an SX-700 type PGM and an undulator source (43-period, 59 mm period length) that covers the photon energy range 40 eV to about 1500 eV. The end-station has the unique versatility of being able to handle solid, liquid and gaseous samples. Thus the beamline is well suited for high-resolution electron spectroscopy on free atoms and molecules as well as for studies of liquids and non-UHV compatible solids.
The experimental system consists of separate analyzer and preparation chambers accessible via a long-travel manipulator. The analyzer chamber is equipped with a hemispherical electron energy analyzer (SCIENTA R4000) which can be rotated around the incoming beam for polarization depend-ent measurements. In front of the experimental station a one-meter long section of the beamline can host other types of equipment for atomic and molecular spectroscopy, e.g. ion-electron coincidence detectors.
A laser system for two-colour experiments is also available.
Beamlines I511/1 and I511/3 are used for XAS, XPS, and X-ray Emission Spectroscopy (XES) in the VUV and soft X-ray range. The two beamlines utilize a common undulator and monochromator with a fl ip-mirror placed immediately after the exit slit to direct the radiation alternately into two experi-mental stations. The undulator has 49 periods and a 52 mm period length originally giving a photon energy range of 50 to about 1500 eV. The monochromator is the same type of modifi ed SX-700 monochromator as used on beamline I311.
During 2010 beamline I511/1 has been used for surface studies under UHV using an end station equipped with a hemispherical electron energy analyzer (SCIENTA R4000) for XPS and an electron yield detector for XAS measurements. In December 2010 this end station was replaced by a new station aimed at surface studies under near-ambient pressure conditions. The new station is equipped with a SPECS Phoibos 150 NAP analyzer for XPS, and XAS in Auger yield mode. Experiments at pressures up to some mbar are carried out using a dedicated high pressure cell, which can be moved in and out of the analysis UHV chamber.
Beamline I511/3 is equipped with a grazing incidence grating spectrometer for XES and can handle non-UHV compatible solids. The analysis chamber can be rotated around the incoming beam which makes it possible to utilize the linear polarization of the radiation.
Beamline D611 is a bending magnet beamline dedicated to time-resolved studies. We are exploiting the fact that MAX II is a pulsed source operating at 100 MHz. The duration of the pulses has been measured to be approximately 350 ps using a streak camera. The beamline has a toroidal focusing mirror and a double crystal mononchromator. A laser providing pulses with durations of 20-30 fs has

MAX-lab ACTIVITY REPORT 2010 59
SYNCHROTRON RADIATION
been synchronised to the ring, and a streakcamera yielding a temporal resolution of about 500 fs is available. The temporal resolution in the experiments does not depend on the relative jitter between the laser and the synchrotron (10 ps) but mainly on the jitter between the streak camera and the laser. The laser operates at a maximum repetition rate of 10 kHz which sets the data accumulation rate. Experiments can be performed in air or in vacuum (10-6 mbar). More information about these activities can be found at: http://www.atomic.physics.lu.se/research/ultrafast_x_ray_science/
Beamline I711 has been used for powder diffraction and small angle X-ray scattering (SAXS) during 2010. It utilizes a 13-period, 1.8 T, multipole-wiggler and is designed to operate in the 0.8 Å (15.5 keV) to 1.6 Å (7.8 keV) region. The beamline has a vertical focusing mirror and a focusing single crystal monochromator working in the horizontal plane. This design sacrifi ces easy tunability and high energy resolution for high fl ux at the sample.
In autumn 2010 a new experimental station was installed. This se-tup includes a 4-circle diffractom-eter with kappa geometry, capable of doing both single crystal and powder diffraction using a large area CCD detector. The SAXS experiments have been moved to a new set-up on beamline I911-4 with user operation starting in spring 2011.
Beamline I811 is intended for materials science research using X-ray absorption spectroscopy (XAS) and X-ray diffraction (XRD). It is based on a super-conducting multi-pole wiggler insertion device that produces high-fl ux photons in the energy range 2.4 - 20 keV (0.6 - 5 Å). The design is based on adaptive optics where the beam is collimated and focused vertically by cylindrical bendable fi rst and second mirrors, respectively. Horizontal focusing is obtained by sagittal bending of the second monochromator crystal. The typical fl ux in a 1 x 1 mm2 beam spot on the sample is 5 x 10¹¹ photons/sec. One experimental station is used for XAS research with detectors for transmission and fl uores-cence yield techniques. A second station is equipped with a diffractometer for surface, interface and thin-fi lm crystallography.
Beamlines I911/1-5 are used mainly for macromolecular crystallography and small-angle X-ray scat-tering (SAXS) but also some other diffraction experiments and for courses. The beamlines use a superconducting multi-pole wiggler. The central beamline I911-3 is tunable in the range 0.75 – 2.0 Å and is optimized for MAD experiments. The beam is vertically collimated by a Rh-coated mirror, monochromatized by a Si(111) double-crystal monochromator and focused by a Rh-coated toroidal mirror. The optics for the four side stations consists of horizontally focusing monochromator crystals and vertically focusing curved multilayer mirrors providing fi xed wavelength beams. I911-3 has a new experiment set-up since 2010 with a microdiffractometer, a mini-kappa, a large-capacity automatic sample changer and a 225 mm CCD detector. Two of the side stations, I911-2 (wavelength 1.04 Å) and I911-5 (wavelength 0.97 Å) are equipped with single axis diffractometers and 165 mm CCD detectors. The new SAXS station, I911-4, has a fi xed wavelength beam (0.91 Å) and is equipped with a mar165 detector.
Beamline D1011 is a bending magnet beamline covering the energy range 30 to 1500 eV. An adjustable local bump of the electron beam provides out of plane radiation. This makes magnetic circular dichroism (MCD) possible in addition to photoemission and photoabsorption using linearly polarized light.
The monochromator is a modifi ed SX-700 PGM of the same design as the monochromator on beam-line I411. The experimental system consists of separate analyzer and preparation chambers accessible via a long-travel manipulator. The analyzer chamber is equipped with a SCIENTA SES200 electron energy analyzer (with a lens of SES2002 type) and an MCP detector for electron yield measurements. The preparation chamber is equipped with LEED, ion sputtering guns, gas-inlet system and a number of optional ports for user owned sample preparation accessories.
A second experimental station receives radiation that is let through the fi rst station and re-focused by a KB mirror system. This station is specifi cally designed for NEXAFS, XMCD and soft X-ray refl ectivity experiments. Measurements can be performed under static magnetic fi elds of up to 500 G. One of the unique features of the station is to offer element specifi c refl ection-based hysteresis measurements.

60 MAX-lab ACTIVITY REPORT 2010
SYNCHROTRON RADIATION
Beamline I1011 is used for studies of magnetic materials using magnetic circular dichroism and related techniques. An elliptically polarizing undulator (EPU), with variable polarization (linear and circular), in the energy range 200 to 2000 eV is the source of the soft X-rays.
The undulator radiation is monochromatized by an SX-700-type of PGM with vertical collimation and focused into an experimental chamber for magnetic circular dichroism measurements.
There are currently two different chambers available to users. One being a chamber equipped with an octupole magnet allowing for work under applied magnetic fi elds in an arbitrary direction in space with, presently, a fi eld of 0.5 T. The chamber is also designed to conduct soft x-ray magnetic refl ec-tivity measurements. The second experimental system consists of separate preparation and analysis chambers. The analysis chamber is equipped with an UHV electromagnet providing a peak fi eld of 0.1 T in pulsed mode and 35 mT with a continuous fi eld. The preparation chamber is equipped with a LEED and an ion sputter gun as well as a number of extra ports for user supplied auxiliary equipment
MAX III Beamlines(see http://www.maxlab.lu.se for more details).
Beamline I3 is an undulator beamline for the low energy region (5 - 50 eV). It is equipped with a normal incidence monochromator with a very high energy resolution (resolving power greater than 105). The undulator is of the “apple-type” providing variable polarization. There are two branch-lines, one with a fi xed end-station for high resolution angle- and spin-resolved photoemission on sol-ids, equipped with a rotatable Scienta R4000 analyzer and a Scienta 2D spin detector. Angle resolved photoemission can be made in ±15, ±7 and ±3.5 degree mode. An on-line MBE system provides the possibility for studying in situ grown samples. The second branch-line, with a differential pumping stage, is designed for an easy exchange of end-stations for atomic and molecular spectroscopy and luminescence measurements.
Beamline I4 is an undulator beamline used for angle resolved photoemission. It is equipped with a spherical grating monochromator covering the energy range 13 to 200 eV.
The end station analyzer chamber hosts two electron energy analyzers: An in vacuum rotatable VG ARUPS 10 analyzer and a fi xed mounted PHOIBOS 100 mm CCD analyzer from SPECS.
The SPECS analyzer has an ultimate resolution of less than 3 meV. There are three angular dispersion modes namely MAD (medium angular dispersion), LAD (low angular dispersion) and WAM (wide angular dispersion). The MAD mode has angular acceptance of ± 3 deg with angular resolution of less than 0.1 deg. The LAD mode has angular acceptance of ± 6 deg with angular resolution of about 0.15 deg. The WAM mode has angular acceptance of ± 10.5 deg with angular resolution of about 0.4 deg.
Beamline D7 is an infrared microspectroscopy beamline presently under construction. It will receive radiation from a bending magnet port. During the design and construction work for the beamline the microscope is used at the existing infrared beamline, 73, at MAX I.

MAX-lab ACTIVITY REPORT 2010 61
SYNCHROTRON RADIATION
Bea
m p
ort
So
urc
e ty
pe
Bea
mlin
e/M
on
och
rom
ato
r En
erg
y o
r w
avel
eng
th r
ang
e Ex
per
imen
tal t
ech
niq
ues
31
Und
ulat
or
PGM
with
Kirk
patr
ick-
Baez
obj
ectiv
e 15
– 1
50 e
V
Scan
ning
pho
toel
ectr
on m
icro
scop
y.
an
d el
lipso
idal
foc
usin
g m
irror
. 41
Be
ndin
g m
agne
t 4.
7m-T
GM
, 162
° 15
– 2
00 e
V
Ang
ular
res
olve
d ph
otoe
mis
sion
.
18 m
rad
On-
line
MBE
sys
tem
.
52
Bend
ing
mag
net
1m N
IM
5 –
30 e
V
Pres
ently
use
d fo
r ed
ucat
ion/
20
mra
d
te
st s
tatio
n.
73
Bend
ing
mag
net
Two
ellip
soid
al m
irror
s, 1
:1
1200
0 –
10 c
m-1
Infr
ared
mic
rosp
ectr
osco
py.
60
* 1
00 m
rad2
Infr
ared
spe
ctro
scop
y us
ing
a hi
gh
re
solu
tion
FTIR
spe
ctro
met
er.
NP
Tagg
ed p
hoto
n be
am
Tagg
ing
spec
trom
eter
15
– 1
85 M
eV
Nuc
lear
phy
sics
.
Bea
mlin
es a
t M
AX
I

62 MAX-lab ACTIVITY REPORT 2010
SYNCHROTRON RADIATION
Bea
m p
ort
So
urc
e ty
pe
Op
erat
ion
al s
tatu
s B
eam
line/
Mo
no
chro
mat
or
Ener
gy
or
wav
elen
gth
ran
ge
Exp
erim
enta
l tec
hn
iqu
es
I311
U
ndul
ator
O
pera
tive
PGM
(mod
ifi ed
SX
-700
, with
43
– ~
150
0 eV
H
igh
reso
lutio
n X
PS.
sp
heric
al f
ocus
ing
mirr
or).
X
-ray
abs
orpt
ion
spec
tros
copy
.
Phot
oem
issio
n m
icro
scop
y, P
EEM
.
I411
U
ndul
ator
O
pera
tive
PGM
(mod
ifi ed
SX
-700
with
40
– ~
150
0 eV
H
igh
reso
lutio
n X
PS.
pl
ane-
ellip
tical
foc
usin
g m
irror
).
X-r
ay a
bsor
ptio
n sp
ectr
osco
py.
C
oinc
iden
ce s
pect
rosc
opy.
I511
/1
Und
ulat
or
Ope
rativ
e
PGM
(mod
ifi ed
SX
-700
, with
50
– ~
150
0 eV
H
igh
reso
lutio
n X
PS.
New
end
sta
tion
for
sp
heric
al f
ocus
ing
mirr
or).
X
-ray
abs
orpt
ion
spec
tros
copy
.
hi
gh p
ress
ure
XPS
N
ew e
nd s
tatio
n ai
med
at
unde
r co
mm
issi
onin
g.
stud
ies
unde
r ne
ar-a
mbi
ent
pres
sure
con
ditio
ns
I511
/3
Und
ulat
or
Ope
rativ
e PG
M (m
odifi
ed S
X-7
00, w
ith
50 –
~1
500
eV
X-r
ay a
bsor
ptio
n sp
ectr
osco
py.
sp
heric
al f
ocus
ing
mirr
or).
X
-ray
em
issi
on s
pect
rosc
opy.
N
on-U
HV
com
patib
le.
D61
1 Be
ndin
g m
agne
t O
pera
tive
Be-w
indo
ws,
2
– 10
keV
Ti
me
reso
lved
X-r
ay d
iffra
ctio
n.
Dou
ble-
crys
tal m
onoc
hrom
ator
.
I711
M
ulti-
pole
wig
gler
O
pera
tive
Be-w
indo
w,
0.8
– 1.
6 Å
Sm
all m
olec
ule
crys
tallo
grap
hy.
Be
nt S
i(111
) cry
stal
.
Pow
der
diff
ract
ion.
I811
Su
perc
ondu
ctin
g
Ope
rativ
e D
oubl
e-cr
ysta
l mon
ochr
omat
or.
2.4
– 20
keV
EX
AFS
, XA
NES
.
mul
ti-po
le w
iggl
er
Ex
chan
gabl
e Si
(111
) & S
i(311
)
Surf
ace,
inte
rfac
e an
d th
in fi
lm
crys
tals
.
crys
tallo
grap
hy.
Bea
mlin
es a
t M
AX
II

MAX-lab ACTIVITY REPORT 2010 63
SYNCHROTRON RADIATION
Bea
m p
ort
So
urc
e ty
pe
Op
erat
ion
al s
tatu
s B
eam
line/
Mo
no
chro
mat
or
Ener
gy
or
wav
elen
gth
ran
ge
Exp
erim
enta
l tec
hn
iqu
es
I911
/1
Supe
rcon
duct
ing
Pr
esen
tly t
est
stat
ion
Dia
mon
d cr
ysta
l,
Qua
si-fi
xed
wav
elen
gth,
1.2
Å
Pres
ently
use
d fo
r ed
ucat
ion/
m
ulti-
pole
wig
gler
mul
ti-la
yer
mirr
or.
te
st s
tatio
n.
I911
/2
Supe
rcon
duct
ing
Ope
rativ
e Be
nt S
i cry
stal
, mul
ti-la
yer
mirr
or.
Fixe
d w
avel
engt
h, 1
.04
Å
Prot
ein
crys
tallo
grap
hy.
m
ulti-
pole
wig
gler
I911
/3
Supe
rcon
duct
ing
O
pera
tive
Col
limat
ing
mirr
or
0.75
– 2
.0 Å
Pr
otei
n cr
ysta
llogr
aphy
.
mul
ti-po
le w
iggl
er
D
oubl
e-cr
ysta
l mon
ochr
omat
or.
M
AD
tec
hniq
ue.
Fo
cusi
ng t
oroi
dal m
irror
.
I911
/4
Supe
rcon
duct
ing
SA
XS
stat
ion
unde
r Be
nt S
i cry
stal
, mul
ti-la
yer
mirr
or.
Fixe
d w
avel
engt
h, 0
.91
Å
Smal
l Ang
le X
-ray
Sca
tter
ing.
m
ulti-
pole
wig
gler
co
mm
issi
onin
g 20
10.
In u
ser
oper
atio
n A
pril
2011
I911
/5
Supe
rcon
duct
ing
O
pera
tive
Dia
mon
d cr
ysta
l, m
ulti-
laye
r m
irror
. Fi
xed
wav
elen
gth,
0.9
7 Å
Pr
otei
n cr
ysta
llogr
aphy
and
m
ulti-
pole
wig
gler
othe
r sc
atte
ring
expe
rimen
ts.
I101
1 U
ndul
ator
with
O
pera
tive
Col
limat
ed P
GM
. 20
0 –
200
0 eV
M
CD
and
rel
ated
tec
hniq
ues
va
riabl
e po
lariz
atio
n
for
stud
ies
of m
agne
tic m
ater
ials
.
D10
11
Bend
ing
mag
net
Ope
rativ
e PG
M (m
odifi
ed S
X-7
00 w
ith
40 –
~1
500
eV
Hig
h re
solu
tion
XPS
.
plan
e-el
liptic
al f
ocus
ing
mirr
or).
X-r
ay a
bsor
ptio
n sp
ectr
osco
py.
O
ff-p
lane
rad
iatio
n fo
r ci
rcul
ar
C
ircul
ar d
ichr
oism
.
pola
rized
rad
iatio
n.
Bea
mlin
es a
t M
AX
II, c
on
t.

64 MAX-lab ACTIVITY REPORT 2010
SYNCHROTRON RADIATION
Bea
m p
ort
So
urc
e ty
pe
Op
erat
ion
al s
tatu
s B
eam
line/
Mo
no
chro
mat
or
Ener
gy
or
wav
elen
gth
ran
ge
Exp
erim
enta
l tec
hn
iqu
es
I3
Und
ulat
or w
ith
Ope
rativ
e 6.
65 m
Off
-axi
s Ea
gle
Type
NIM
. 5
– 50
eV
H
igh
reso
lutio
n (m
eV) a
ngle
-
varia
ble
pola
rizat
ion.
and
spin
-res
olve
d ph
otoe
mis
sion
on
sol
ids,
ato
mic
and
mol
ecul
ar
sp
ectr
osco
py, a
nd lu
min
esce
nce.
O
n-lin
e M
BE s
yste
m.
I4
Und
ulat
or
Ope
rativ
e 5.
5 –
5.8m
-SG
M, 1
62°
13 –
200
eV
A
ngle
-res
olve
d ph
otoe
mis
sion
.
D7
Bend
ing
mag
net
Und
er c
onst
ruct
ion
Tran
sfer
opt
ics,
FTI
R sp
ectr
omet
er
1200
0 –
10 c
m-1
Infr
ared
mic
rosp
ectr
osco
py.
an
d IR
mic
rosc
ope.
Bea
mlin
es a
t M
AX
III

MAX-lab ACTIVITY REPORT 2010 65
SYNCHROTRON RADIATION
Yiqiang Zhan, Fudan University, and Mats Fahlman, Linköping University, preparing their experiment on hybrid organic spintronic interfaces at the beamline I1011, 25 October 2010. Photo: Annika Nyberg

66 MAX-lab ACTIVITY REPORT 2010
SYNCHROTRON RADIATION
MAX IBeamline 41
Electronic structure of Ge1-x-yMnxEuyTe epilayers B.J. Kowalski, R. Nietubyc, K. Nowakowska-Langier, J. Sadowski, W. Knoff, and T. Story ...................... 80
Tin-stabilized (1×2) and (1×4) reconstructions on GaAs(100) and InAs(100) studied by scanning tunneling microscopy, photoelectron spectroscopy, and ab initio calculations J.J.K. Lång, P. Laukkanen, M.P.J. Punkkinen, M. Ahola-Tuomi, M. Kuzmin, V. Tuominen, J. Dahl, M. Tuominen, R.E. Perälä, K. Schulte, J. Adell, J. Sadowski, J. Kanski, M. Guina, M. Pessa, K. Kokko, B. Johansson, L. Vitos, and I.J. Väyrynen ............................................................................... 82
Photoelectric Properties of ion Implantation Induced Ge-Mn Layer Regrown at 400 and 600 °C on Ge(100) G. Pető, Cs.S. Daróczi, B. Pécz, L.F. Kiss, and T. Kemény ....................................................................... 84
Beamline 73
Studies of Carbon Microparticles by Raman and Infrared Microscopy in an Electrodynamic Balance V.A. Alekseev, E.J.K. Nilsson, A.A. Konnov, A. Engdahl, P. Uvdal, and M.S. Johnson .............................. 88
Studies of Small Water Complexes in Inert Matrices at Low Temperatures 2.8 K, by Infrared Vibrational Spectroscopy J. Ceponkus, P. Uvdal, and B. Nelander................................................................................................. 90
FTIR spectra of propanol and isopropanol in gas phase I. Doroshenko, V. Pogorelov, P. Uvdal, J. Ceponkus, and V. Sablinskas ................................................... 92
Continuous-wave laser annealing of Si-rich oxide: A microscopic picture of macroscopic Si--SiO2 phase separation L. Khriachtchev, T. Nikitin, M. Räsänen, A. Domanskaya, S. Boninelli, F. Iacona, A. Engdahl, J. Juhanoja, and S. Novikov .................................................................................................................. 94
Microspectroscopic analysis of potential bone proteins from the Cretaceous of Angola J. Lindgren, P. Uvdal, and A. Engdahl .................................................................................................... 96
Investigation of the spectroscopic properties of combustion generated particles in the mid infrared region using synchrotron radiation at MAX-lab, beamline 73 F. Ossler, L. Vallenhag, S.E. Canton, A. Engdahl, and P. Uvdal................................................................ 98
Collagen contents changes in vascular endothelial cells deprived of copper as revealed by SR-FTIR imaging C. Petibois and A. Engdahl ................................................................................................................. 100
Colloidal Resource. User report at MAX-lab 2010 A. Stenstam ....................................................................................................................................... 102
High Resolution Far-Infrared Absorption Spectroscopy of Halogenated Hydrocarbons: Rovibrational Analysis for the 4 Band of CH79BrF2 P. Stoppa, A. Pietropolli Charmet, N. Tasinato, A. Baldacci, A. Baldan, S. Giorgianni, and R. Wugt Larsen ... 104
Reports from Synchrotron Radiation Research

MAX-lab ACTIVITY REPORT 2010 67
SYNCHROTRON RADIATION
Infrared absorption spectra of conformational mixture of 1-butene SOZ in gas and in non-equilibrated nitrogen matrices S. Strazdaite, M. Pucetaite, R. Bariseviciute, J. Ceponkus, and V. Sablinskas ........................................ 106
Diffusion in mechanically stressed bone using infrared microspectroscopy P. Ståhle, I. Svensson, W. Rehman, L. Banks-Sills, and G. Lindberg ...................................................... 108
MAX IIBeamline I311
High quality graphene layers on commercial available cubic-SiC(001)/Si wafers: A perspective for mass production of graphene-based electronic V.Yu. Aristov, A.A. Zakharov, O.V. Molodtsova, O. Vilkov, D.V. Vyalikh, S. Danzenbächer, C. Laubschat, V.V. Kveder, and M. Knupfer ......................................................................................... 110
Unconventional zwitterionic state of cysteine E. Ataman, K. Schulte, C. Isvoranu, J.N. Andersen, and J. Schnadt ..................................................... 112
XPS study of Rh bulkoxide on Rh(111) and 21 nm Rh nanoparticles S. Blomberg, J. Gustafson, N.M. Martin, R. Westerström, J.N. Andersen, M.E. Messing, K. Deppert, M.E. Grass, Z. Liu, H. Bluhm, and E. Lundgren ................................................................. 114
Production and characterization of PdAg aerosol nanoparticles on SiOx S. Blomberg, N.M. Martin, J. Gustafson, J.N. Andersen, E. Lundgren, L.E. Walle, A. Borg, M.E. Messing, K. Deppert, and H. Grönbeck ...................................................................................... 116
Large area quasi-free standing monolayer graphene on 3C-SiC(111) C. Coletti, K.V. Emtsev, A.A. Zakharov, T. Ouisse, D. Chaussende, and U. Starke ................................. 118
Large area quasi-free standing trilayer graphene on SiC(0001) C. Coletti, S. Forti, K.V. Emtsev, K.M. Daniels, B.K. Daas, M.V.S. Chandrashekhar, A.A. Zakharov, and U. Starke ............................................................................................................. 120
Adsorption and decomposition of Alanine on Ni{111} A. Cornish, R.E.J. Nicklin, A. Shavorskiy, K. Schulte, and G. Held ........................................................ 122
Microscopic study of quasi-free standing epitaxial graphene and graphene p-n junctions formed on SiC by atomic intercalation of germanium K. Emtsev, A. Zakharov, C. Coletti, S. Forti, and U. Starke ................................................................... 124
Oxidation of metal nanoparticle arrays L. Gragnaniello, S. Surnev, T. Ma, and F.P. Netzer ................................................................................ 126
Gas adsorption on Pt clusters supported by graphene E. Grånäs, J. Knudsen, T. Gerber, P.J. Feibelman, K. Schulte, P. Stratman, C. Busse, T. Michely, and J.N. Andersen ............................................................................................................. 128
The effect of Au particles on the morphology and Ga droplet dynamics on the GaP(111)B surface E. Hilner, A.A. Zakharov, E. Mårsell, R. Timm, J.N. Andersen, E. Lundgren, and A. Mikkelsen .............. 130
nin-InP nanowires studied by X-ray photoelectron emission microscopy M. Hjort, A.A. Zakharov, M.T. Borgström, J. Wallentin, L. Samuelson, J.N. Andersen, E. Lundgren, and A. Mikkelsen ........................................................................................................... 132
Formation of Carbonyl Complexes by CO Adsorption on Monolayers of Iron Phthalocyanine on Au(111) C. Isvoranu, E. Ataman, J. Knudsen, K. Schulte, J.N. Andersen, and J. Schnadt ................................... 134
Spin Change and Adsorbate-Substrate Decoupling as a Consequence of NO Adsorption on Iron Phthalocyanine Monolayers C. Isvoranu, E. Ataman, J. Knudsen, K. Schulte, J.N. Andersen, and J. Schnadt ................................... 136

68 MAX-lab ACTIVITY REPORT 2010
SYNCHROTRON RADIATION
Evolution of surface compounds during the initial stages of high temperature oxidation of FeCr alloys P. Jussila, H. Ali-Löytty, M. Hirsimäki, and M. Valden ........................................................................... 138
Carbonate formation on p(4x4)-O/Ag(111) J. Knudsen, N.M. Martin, E. Grånäs, S. Blomberg, J. Gustafson, J.N. Andersen, E. Lundgren, S. Klacar, A. Hellman, and H. Grönbeck.............................................................................................. 140
Surface versus interface composition by element specific microscopy: Co doped ZnO I.A. Kowalik, M.A. Niño, M. Łukasiewicz, A.A. Zakharov, E. Guziewicz, M. Godlewski, T. Dietl, and D. Arvanitis ..................................................................................................................... 142
High resolution core level spectroscopy study of the ultrathin aluminum oxide film on NiAl(110) N.M. Martin, S. Blomberg, J. Gustafson, E. Lundgren, J.N. Andersen, J. Knudsen, H. Härelind Ingelsten, P.-A. Carlsson, M. Skoglundh, A. Stierle, and G. Kresse ...................................................................... 144
Lowering the Barrier for Graphene Formation by Alloying Transition Metal Carbides P. Palmgren, E. Lewin, R. Knut, A. Zakharov, P. Pal, A. Sandell, U. Jansson, and O. Karis ...................... 146
Spectroscopic photoemission and low-energy electron microscopy study of nitridation of aluminum nanopatterns B. Qi, S. Ólafsson, A.A. Zakharov, B. Agnarsson, H.P. Gíslason, and M. Göthelid ................................. 148
Investigation of TiOx phases grown on Au(111) by chemical vapor deposition D. Ragazzon, A. Schaefer, L.E. Walle, M.H. Farstad, A. Zakharov, A. Borg, and A. Sandell ................... 150
Cleaning and oxidation of nanoporous gold. A detailed photoemission study A. Schaefer, D. Ragazzon, L.E. Walle, A. Wittstock, A. Borg, M. Bäumer, and A. Sandell ..................... 152
Resonant photoemission study of functional materials for terabit resistive switching memories J. Szade, D. Kajewski, J. Kubacki, A. Köhl, Ch. Lenser, R. Dittmann, R. Waser, and K. Schulte ............. 154
Interface composition of atomic layer deposited HfO2 and Al2O3 thin films on InAs studied by XPS R. Timm, M. Hjort, E. Lind, C. Thelander, L.-E. Wernersson, J.N. Andersen, and A. Mikkelsen ............. 156
Charge transfer dynamics of several Ru(II) complexes which could form the charge transfer centre of a multi-centre water splitting dye complex M. Weston, A.J. Britton, and J.N. O’Shea ........................................................................................... 158
Towards graphene on Fe(110) N.A. Vinogradov, A. Zakharov, M.L. Ng, N. Mårtensson, and A.B. Preobrajenski ................................. 160
Constant energies imaging of -cones from a buffer layer and after intercalation C. Virojanadara, S. Watcharinyanon, A.A. Zakharov, R. Yakimova, and L.I. Johansson ......................... 162
Micro LEED on Single Micro Crystal of Anatase TiO2 S. Yu, S. Ahmadi, A. Zakharov, C. Sun, and M. Göthelid ..................................................................... 164
Nano-scale 3D(E,kx,ky) band structure imaging by XPEEM A.A. Zakharov, C.Virojanadara, S. Watcharinyanon, and L.I. Johansson............................................... 166
Beamline I411
Photoelectron spectroscopy studies of the 5s and 4d bands in free silver clusters T. Andersson, C. Zhang, M.-H. Mikkelä, D. Anin, K. Jänkälä, M. Tchaplyguine, G. Öhrwall, M. Huttula, N. Mårtensson, S. Svensson, and O. Björneholm .............................................................. 168
Auger parameter in free nanoscale metal clusters: Does the old approach hold? I. Bradeanu, A. Rosso, G. Öhrwall, S. Svensson, N. Mårtensson, O. Björneholm, and M. Tchaplyguine .... 170
Investigating the solid electrolyte interphase with functional electrolytes K. Ciosek, S. Malmgren, M. Hahlin, H. Rensmo, and K. Edström ........................................................ 172

MAX-lab ACTIVITY REPORT 2010 69
SYNCHROTRON RADIATION
Effects of solvation in the fragmentation of ammonia molecules M. Gisselbrecht, C. Grunewald, E. Månsson, J. Laksman, A. Sankari, M. Tchaplyguine, O. Björneholm, and S.L. Sörensen ...................................................................................................... 174
Soft X-ray photofragmentation of free protonated leucine enkephalin O. González-Magaña, G. Reitsma, M. Door, S. Bari, R. Hoekstra, J.R. Wagner, M.A. Huels, and T. Schlathölter .......................................................................................................... 176
Soft X-ray photofragmentation of free protonated oligonucleotides O. González-Magaña, G. Reitsma, M. Door, S. Bari, R. Hoekstra, J.R. Wagner, M.A. Huels, and T. Schlathölter .......................................................................................................... 178
Atom-solid binding energy shifts for K 2p and Rb 3d sublevels M. Holappa, S. Aksela, M. Patanen, S. Urpelainen, and H. Aksela ....................................................... 180
Molecular fragmentation of pyrimidine derivatives following site-selective carbon core-ionization E. Itälä, D.T. Ha, K. Kooser, E. Rachlew, E. Nõmmiste, U. Joost, M.A. Huels, and E. Kukk..................... 182
Valence Photoionization of Neutral Metal Clusters K. Jänkälä, M.-H. Mikkelä, M. Huttula, M. Tchaplyguine, and O. Björneholm ...................................... 184
An XPS study of dolomite L. Järvinen, J.A. Leiro, and M. Heinonen ............................................................................................. 186
Electron-ion coincidence study of photofragmentation of the CdCl2 molecule J.A. Kettunen, J. Niskanen, M. Huttula, M. Vapa, S. Urpelainen, and H. Aksela ................................... 188
Dissociation of C60 fullerenes studied with a linear momentum coincidence spectrometer J. Laksman, E. Månsson, C. Stråhlman, A. Sankari, M. Gisselbrecht, and S. Sorensen .......................... 190
Depth Profiling the Li-ion Battery Solid Electrolyte Interphases S. Malmgren, K. Ciosek, M. Hahlin, T. Gustafsson, M. Gorgoi, C.O. Olsson, H. Rensmo, and K. Edström ............................................................................................................... 192
C1s photoelectron spectroscopy and modeling of ethane clusters V. Myrseth, J. Harnes, L.J. Sæthre, and K.J. Børve ............................................................................... 194
Evaluating the binding energy shifts on iron group atoms A. Mäkinen, M. Patanen, and H. Aksela ............................................................................................. 196
Photoelectron spectroscopy of solvated salts in water clusters L. Partanen, M.-H. Mikkelä, D. Anin, M. Huttula, H. Aksela, M. Tchaplyguine, Ch. Zhang, T. Andersson, and O. Björneholm ....................................................................................................... 198
4d-1 photoelectron and subsequent N4,5OO Auger electron spectra of Sb M. Patanen, S. Heinäsmäki, S. Urpelainen, S. Aksela, and H. Aksela ................................................... 200
XPS study of the electrode/electrolyte interface on silicon electrodes for Li-ion batteries and formation of the Li-Si alloy B. Philippe, R. Dedryvère, D. Gonbeau, H. Rensmo, and K. Edström ................................................... 202
Final electronic state dependence of fragmentation pathways in water molecules during the O 1s 4a1 resonant Auger decay A. Sankari, S.L. Sorensen, J. Laksman, M. Gisselbrecht, E. Månsson, L. Partanen, J.A. Kettunen, R. Sankari, and E. Kukk ...................................................................................................................... 204
Understanding the role of water at the ZnO/N719 interface R. Schölin, M. Quintana, E.M.J. Johansson, M. Hahlin, H. Siegbahn, A. Hagfeldt, and H. Rensmo ....... 206
Insulator to metal transition in Sb clusters studied using core-level and valence photoelectron spectroscopy S. Urpelainen, M. Tchaplyugine, M.-H. Mikkelä, M. Huttula, K. Kooser, E. Kukk, and O. Björneholm ....... 208

70 MAX-lab ACTIVITY REPORT 2010
SYNCHROTRON RADIATION
Is there a Simple Relationship between C1s Ionization Energies and Hybridization? M.G. Zahl, V. Myrseth, A. Holme, L.J. Sæthre, and K.J. Børve ............................................................. 210
Size dependent properties and interactions in free nanoscale potassium halide clusters as seen by XPS Ch. Zhang, T. Andersson, S. Svensson, O. Björneholm, M. Huttula, M.-H. Mikkelä, D. Anin, M. Tchaplyguine, and G. Öhrwall ....................................................................................................... 212
Solvent-mediated inter-molecular Coster-Kronig decays in aqueous ions G. Öhrwall, N. Ottosson, W. Pokapanich, S. Legendre, S. Svensson, and O. Björneholm ..................... 214
Beamline I511
Charge transfer and chemical interaction of ZnPc and FePc on Au(111) and Au(111)-I S. Ahmadi, S. Yu, N. Shariati, and M. Göthelid ................................................................................... 216
Electronic Properties of Lutetium Phthalocyanine Thin Films I. Bidermane, S. Boudet, N. Witkowski, and N. Shariati....................................................................... 218
The grafting of styrene on water-saturated Si(001)–2×1: Evidences for a radical chain reaction induced by isolated silicon dangling bond F. Bournel, J.-J. Gallet, D. Pierucci, A. Khaliq, F. Rochet, and A. Pietzsch .............................................. 220
Bi-isonicotinic acid on rutile TiO2 (110): resonant inelastic X-ray spectroscopy A. Britton, M. Weston, and J.N. O’Shea ............................................................................................. 222
The valence band electronic structure of the distorted rutile-like WO2 – a study of chemical bonding via resonant soft X-ray emission at the O K edge D. Cockburn, B. Kennedy, C. McGuinness, R.G. Egdell, A. Pietzsch, and F. Hennies ............................ 224
Electronic and Surface Structure of Light-harvesting Quantum Dots D.M. Graham, P. Lunt, K.L. Pogson, S.J.O. Hardman, W.R. Flavell, J.M. Smith, S.M. Fairclough, and F. Hennies .......................................................................................................... 226
Energy level alignment at organic semiconductor interfaces by intramolecular degrees of freedom: Transition metal phthalocyanines M. Grobosch, V.Yu. Aristov, O.V. Molodtsova, C. Schmidt, B.P. Doyle, S. Nannarone, and M. Knupfer .... 228
XAS and RIXS measurements of aqueous micelle solutions of Dodecyl trimethyl ammonium chloride J. Gråsjö, J. Forsberg, A. Pietzsch, J.-E. Rubensson, and P. Hansson ..................................................... 230
Polarization dependent RXES at the O K-edge of anatase-TiO2 B. Kennedy, D. Cockburn, and C. McGuinness ................................................................................... 232
RIXS in Li6YB3O9 and Li6GdB3O9 I. Kuusik, T. Käämbre, A. Kikas, V. Pustovarov, and V. Ivanov ............................................................... 234
Passivation and stability of infrared photodetectors based on type-II GaAs quantum dots in InAs matrix X. Li, Q. Wang, A.Z.Z. Zhang, S. Almqvist, O. Gustafsson, S. Yu, Z. Besharat, M. Göthelid, L. Höglund, A. Karim, B. Noharet, A. Gromov, M. Hammar, and J.Y. Andersson ................................. 236
Hybrid systems comprising Au nanoparticles in organic matrix O.V. Molodtsova, I.M. Aristova, M. Knupfer, V.V. Kveder, C. Laubschat, and V.Yu. Aristov ................... 238
Investigations of valence band electronic structure of Pr0.5Sr0.5MnO3 P. Pal, M.K. Dalai, and I. Ulfat ............................................................................................................. 240
Investigating the local partial density of states in swelling clay in dry and humid environments A. Pietzsch, B. Kennedy, J.-E. Rubensson, and F. Hennies .................................................................... 242

MAX-lab ACTIVITY REPORT 2010 71
SYNCHROTRON RADIATION
Photoemission studies of a single-centre water splitting complex and chlorine containing analog adsorbed on rutile TiO2(110) M. Weston, T.J. Reade, A.J. Britton, N.R. Champness, and J.N. O’Shea ............................................... 244
Interaction of Zinc Phthalocyanine thin films with TiO2(110) S. Yu, S. Ahmadi, P.T.Z. Adibi, W. Chow, A. Pietzsch, and M. Göthelid ................................................ 246
Beamline D611
Time resolved X-ray diffraction from semiconductor nanostructures A. Jurgilaitis, M. Harb, H. Enquist, R. Nüske, G. Astromskas, M. Borg, H. Linke, and J. Larsson ........... 250
Formation of nanoscale diamond by femtosecond laser-driven shock R. Nüske, A. Jurgilaitis, H. Enquist, M. Harb, Y. Fang, U. Håkanson, and J. Larsson ............................. 252
Beamline I711
Nanostructural features of lipid-based liquid crystal drug delivery systems J. Barauskas, M. Jankunec, D. Tauraite
., L. Adamonyte
., M. Johnsson, and F. Tiberg .............................. 254
Investigation of the dehydrogenation of Ca(BH4)2 as potential hydrogen storage material C. Bonatto Minella, G. Barkhordarian, C. Pistidda, K. Suarez, I. Saldan, T.R. Jensen, Y. Cerenius, T. Klassen, R. Bormann, and M. Dornheim.......................................................................................... 256
Peptide Self-Assembly S. Bucak, C. Cenker, and U. Olsson .................................................................................................... 258
Towards understanding peptide self-assembly C. Cenker, S. Bucak, and U. Olsson .................................................................................................... 260
Silk assembly in acoustically levitated droplets C. Dicko and S. Nilsson ...................................................................................................................... 262
Cubic phases in the dops/dope/water system J. Engblom, L. Pedersen, P. Nilsson, and V. Kocherbitov ...................................................................... 264
Structural dynamics of the LiFePO4 lithium-ion battery cathode material R. Eriksson, T. Gustafsson, and K. Edström ......................................................................................... 266
Clay delamination in saline water during heating E.L. Hansen, H. Hemmen, D.d.M. Fonseca, C. Coutant, K.D. Knudsen, T. Plivelic, and J.O. Fossum ..... 268
Alizarin red S modifies apatite nanocrystal size and formation kinetics C.J.S. Ibsen and H. Birkedal ................................................................................................................ 270
Soluble complex salts of surfactant ions and polymeric counterions: Composite macromolecular self-assembly J. Janiak, L. Piculell, G. Olofsson, and K. Schillén ................................................................................ 272
Anisotropic crystal growth kinetics of anatase TiO2 nanoparticles synthesized in a non-aqueous medium G.V. Jensen, M. Bremholm, N. Lock, G.R. Deen, T.R. Jensen, B.B. Iversen, M. Niederberger, J. Skov Pedersen, and H. Birkedal ....................................................................................................... 274
High pressure X-ray scattering experiments of polyfluorenes at I711 M. Knaapila, D. Haase, S. Carlson, Y. Cerenius, and S. Guha .............................................................. 276
Structural analysis of wheat gluten biomaterials containing urea and nanoclays using SAXS R. Kuktaite, T.S. Plivelic, S.-W. Cho, H. Türe, M.S. Hedenqvist, M. Gällstedt, S. Marttila, R. Ignell, and E. Johansson ................................................................................................................. 278

72 MAX-lab ACTIVITY REPORT 2010
SYNCHROTRON RADIATION
SAXS studies on insulin self-association L. Malik, J. Nygaard, R. Hoiberg-Nielsen, T. Hoeg-Jensen, K.J. Jensen, and L. Arleth ............................ 280
Improved hydrogen storage kinetics of nanoconfined NaAlH4 catalyzed with TiCl3 nanoparticles T.K. Nielsen, M. Polanski, D. Zasada, P. Javadian, F. Besenbacher, J. Bystrzycki, J. Skibsted, and T.R. Jensen ................................................................................................................ 282
SAXS studies of DMPC and DPPC-dimeric surfactant lipoplexes Z. Pietralik, M. Taube, M. Balcerzak, A. Skrzypczak, and M. Kozak ..................................................... 284
SAXS studies of zwitterionic surfactants interactions with DMPC Z. Pietralik, M. Taube, A. Kozak, D. Wieczorek, R. Zielinski, and M. Kozak .......................................... 286
Effect of NaH/MgB2 ratio on the absorption kinetics of the system NaH-MgB2 C. Pistidda, G. Barkhordarian, C. Bonatto Minella, S. Garroni, K. Suarez, I. Saldan, T.R. Jensen, Y. Cerenius, T. Klassen, R. Bormann, and M. Dornheim ...................................................................... 288
Novel metal borohydrides: Studies of synthesis, crystal chemistry and thermal decomposition D.B. Ravnsbæk and T.R. Jensen .......................................................................................................... 290
Tailoring the properties of lithium tetrahydridoboranate by anion substitution L.H. Rude, L.M. Arnbjerg, Y. Cerenius, and T.R. Jensen ....................................................................... 292
Hydrogen absorption and desorption properties of ScNiAl, a novel material for hydrogen storage M. Sahlberg, A. Sobkowiak, J. Ångström, T. Kollin Nielsen, Y. Cerenius, and T.R. Jensen ..................... 294
When do water-insoluble polyion-surfactant ion complex salts “redissolve” by added excess surfactant? S. dos Santos, C. Gustavsson, C. Gudmundsson, P. Linse, and L. Piculell ............................................. 296
Phase diagrams come alive: Understanding how to create, destroy or change ordered surfactant structures by polymerization reactions S. dos Santos, L. Piculell, O.J. Karlsson, and M. Grac,a Miguel ............................................................. 298
Investigation of the hydrogen reaction mechanism in CaF2+3CaH2+4MgB2 composites K. Suarez, I. Saldan, C. Pistidda, C Bonatto Minella, T.R. Jensen, Y. Cerenius, T. Klassen, R. Bormann, and M. Dornheim .......................................................................................................... 300
Freezing of montmorillonites in brine studied by synchrotron X-ray powder diffraction D. Svensson and S. Hansen ................................................................................................................ 302
Project report – MAX-lab Activities 2010 at I711 In situ synchrotron radiation studies of inorganic nanomaterials syntheses C. Tyrsted, K.M.Ø. Jensen, J. Mi, N. Lock, J. Becker, M. Christensen, and B.B. Iversen ......................... 304
Effect of Hydration on Structural and Thermodynamic Properties of Mucin Y. Znamenskaya, J. Engblom, J. Sotres, T. Arnebrant, and V. Kocherbitov ............................................ 306
Beamline I811
Probing the local structure of ZrO2:Yb3+,Er3+ up-conversion luminescence materials by X-ray Absorption Spectroscopy I. Hyppänen, J. Hölsä, J. Kankare, M. Lastusaari, L.A.O. Nunes, L. Pihlgren, and T. Soukka .................. 308
XANES characterization of Fe(3-x)(1-z/3)Vx(1-z/3)□zO4 catalysts for methanol oxidation R. Häggblad, S. Hansen, L.R. Wallenberg, and A. Andersson .............................................................. 310
Characterization of metals (Cu and As) in mine tailings T. Karlsson, T. Hedlund, and L. Lövgren .............................................................................................. 312

MAX-lab ACTIVITY REPORT 2010 73
SYNCHROTRON RADIATION
Extended X-ray absorption fine structure of prussian blue analogues I.A. Kowalik, F.J. Luque, H. Prima García, J.P. Prieto, F. Romero, M. Makarewicz, J.J. de Miguel, R. Miranda, E. Coronado, and D. Arvanitis ......................................................................................... 314
Speciation of sulfur compounds in natural matrices using sulfur K edge XANES I. Persson ........................................................................................................................................... 316
Structural characterization metal complexes in applied and fundamental systems I. Persson ........................................................................................................................................... 317
XANES investigation of iron redox chemistry in the ABM and TBT experiments at the Äspö hard rock laboratory D. Svensson and S. Hansen ................................................................................................................ 318
Beamline I911
Structural basis for receptor recognition of vitamin-B12-intrinsic factor complexes C.B.F. Andersen, M. Madsen, T. Storm, S.K. Moestrup, and G.R. Andersen ......................................... 321
Structural studies of an Hfq orthologue from the cyanobacterium, Synechocystis sp A. Bøggild, M. Overgaard, A. Feddersen, W. Ubhayasekera, P. Valentin-Hansen, and D.E. Brodersen ...... 322
In-situ XRD studies on ceramic bone substitutes O. Börjesson, V. Karlsson, and D. Haase ............................................................................................. 324
Structural analysis of mycobacterial branched-chain aminotransferase: Implications for inhibitor design A. Castell, C. Mille, and T. Unge ......................................................................................................... 325
The structure of a GH13_31 α-glucosidase from the probiotic bacterium Lactobacillus acidophilus NCFM F. Fredslund, M.S. Møller, M.A. Hachem, B. Svensson, and L. Lo Leggio .............................................. 326
Crystal structure of the copper pump P. Gourdon, X.-Y. Liu, J.P. Morth, B Panyella Pedersen, and P. Nissen ................................................... 327
Optimization of SR beamline alignment Yu. A. Gaponov, Y. Cerenius, J. Nygaard, T. Ursby, K. Larsson ............................................................. 328
Two novel layered germanates with extra-large rings B. Guo, A. Ken Inge, C. Bonneau, J. Sun, K.E. Christensen, Z.-Y. Yuan, and X. Zou ............................. 330
Structural studies on the human mitochondrial acetoacetyl-CoA thiolase (T2) A.M. Haapalainen and R.K. Wierenga ................................................................................................ 332
The macromolecular crystallisation facility at MAX-lab M. Håkansson and D.T. Logan ............................................................................................................ 334
E. coli aldehyde dehydrogenase in the apo form and in complex with NAD+ M. Håkansson, D.T. Logan, R.K. Purana, and R. Hatti-Kaul .................................................................. 336
Non-specific CBM4-2 variant X-2 L110F – apo, xylopentaose, cellopentaose structures M. Håkansson, D.T. Logan, L. von Schantz, E. Nordberg Karlsson, and M. Ohlin ................................. 338
Crystallography and microsecond multiple molecular dynamics simulation in concert: Structure of an intrinsically disordered nerve agent antidote in complex with sarin-AChE A. Hörnberg, Y.-P. Pang, and F. Ekström ............................................................................................. 340
Flexibility and communication within the structure of the Mycobacterium smegmatis methionyl-tRNA synthetase (metRS) H. Ingvarsson and T. Unge .................................................................................................................. 342
Zebra fish interferons O. Jensen Hamming and R. Hartmann ................................................................................................ 344

74 MAX-lab ACTIVITY REPORT 2010
SYNCHROTRON RADIATION
High-resolution crystal structures of the flavoprotein NrdI in oxidised and reduced states: an unusual flavodoxin R. Johansson, E. Torrents, D. Lundin, J. Sprenger, M. Sahlin, B.-M. Sjöberg, and D.T. Logan ................ 346
Structural and mechanistic basis for new modes of inhibition of glycosyltransferases R. Jørgensen, M.M. Palcic, T. Pesnot, and G.K. Wagner ...................................................................... 348
Crystal structure of the DEAD-domain of human RNA helicase DDX10/Dbp4 T. Karlberg, P. Schütz, H. Berglund, R. Collins, S. Flodin, A. Flores, S. Gräslund, M. Hammarström, I. Johansson, T. Kotenyova, M. Moche, T.K. Nielsen, P. Nordlund, T. Nyman, C. Persson, M.I. Siponen, L. Svensson, A.G. Thorsell, L. Tresaugues, M. Welin, J. Weigelt, and H. Schüler................................... 350
Human poly (ADP-ribose) polymerase family, member 14 - macro domain 2 T. Karlberg, P. Schütz, H. Berglund, R. Collins, S. Flodin, A. Flores, S. Gräslund, M. Hammarström, I. Johansson, T. Kotenyova, M. Moche, T.K. Nielsen, P. Nordlund, T. Nyman, C. Persson, M.I. Siponen, L. Svensson, A.G. Thorsell, L. Tresaugues, M. Welin, J. Weigelt, and H. Schüler................................... 352
Structural studies of human prolyl 4–hydroxylases (P4Hs) M.K. Koski, P. Kursula, J. Anantharajan, R. Hieta, J. Myllyharju, and R.K. Wierenga ............................. 354
Histone demethylases as targets for cancer therapy L.H. Kristensen, J.B.L. Kristensen, C. Helgstrand, J.S. Kastrup, and M. Gajhede ................................... 356
Structure of the dimeric form of CTP synthase from Sulfolobus solfataricus I. Lauritsen, M. Willemoës, K.F. Jensen, E. Johansson, and P. Harris ..................................................... 358
Temperature-responsive Inclusion complex of cationic PNIPAAM diblock copolymer and -cyclodextrin G. Lazzara, G. Olofsson, V. Alfredsson, K. Zhu, B. Nyström, and K. Schillén ........................................ 360
In situ XRD characterization of carbon-coated Ni0.5TiOPO4 electrode material K. Maher, K. Edström, I. Saadoune, T. Gustafsson, and M. Mansori .................................................... 362
Characterization of a new crystal form of the B.subtilis YkuD protein S.F. Midtgaard, T. Boesen, S. Thirup, and M. Blaise ............................................................................. 364
Structure determination of cellulase Cel7A – The major secreted protein of the tree-killing fungus Heterobasidion annosum (Rotticka) M.H. Momeni, H. Hansson, N.E. Mikkelsen, M. Sandgren, and J. Ståhlberg ........................................ 365
Enzymatic Starch Hydrolysis M.S. Møller, M. Abou Hachem, B. Svensson, and A. Henriksen........................................................... 366
Structural studies of the surface Adhesin SpaP from Streptococcus mutans Å. Nylander, N. Forsgren, and K. Persson ............................................................................................ 368
Structural studies of a fimbrial Sortase from Actinomyces oris K. Persson .......................................................................................................................................... 370
Solving the structure of the A1 protein from bacteriophage Qβ J. Rumnieks and K. Tars ...................................................................................................................... 372
The binding of 1-(β-D-glucopyranosyl) pyrimidine derivatives to Glycogen phosphorylase b V.T. Skamnaki, A. Katsandi, S. Manta, E. Tsoukala, S.E. Zographos, M. Kontou, P. Zoumpoulakis, D. Komiotis, and D.D. Leonidas .......................................................................................................... 374
Colloidal resource user report at MAX-lab 2010 A. Stenstam ....................................................................................................................................... 376
Structural studies of glutathione transferases A2-2 and A3-3 K. Tars, B. Olin, and B. Mannervik ...................................................................................................... 378
Acetylcholine binding protein as a model system for nicotinic acetylcholine receptors L.A.H. Thomsen, C. Ussing, C. Helgstrand, C. Krintel, T. Balle, M. Gajhede, and J.S. Kastrup .............. 380

MAX-lab ACTIVITY REPORT 2010 75
SYNCHROTRON RADIATION
Crystal structure of odorant binding protein 4 from Anopheles gambiae complexed with N -Phenyl-1-naphthylamine K.E. Tsitsanou, C.E. Drakou, M. Keramioti, and S.E. Zographos ........................................................... 382
I911-3 Upgrade: A new state-of-the-art experimental set-up J. Unge, C. Svensson, K. Theodor, H. Svensson, A. Månsson, C. Lenngren, F. Hägneryd, R. Andersson, B. Svensson, B. Sommarin, D. Logan, M.M.G.M. Thunnissen, and T. Ursby ................... 384
X-ray structure studies of potent inhibitors against the drug resistance due to the mutations V82T and I84V of HIV-1 Protease T. Unge, H. Wallberg, B. Samuelsson, A. Hallberg, and M. Larhed ...................................................... 386
Structural fundament for structure-based design of ligands for ionotropic glutamate receptors R. Venskutonyte, C. Krintel, K. Frydenvang, M. Gajhede, and J.S. Kastrup .......................................... 388
Structural studies of the G3BP1 and Rin NTF2-like domains T. Vognsen, I.R. Möller, and O. Kristensen........................................................................................... 390
Beamline D1011
Synthesis and NEXAFS characterization of Gd2O3 nanoparticles M. Ahrén, L. Selegård, L. Axelsson, C. Vahlberg, and K. Uvdal ........................................................... 392
Probing vertical phase separation in the surface region in spincoated films of polymer: PCBM blends – a NEXAFS study A.S. Anselmo, A. Dzwilewski, K. Svensson, and E. Moons .................................................................. 394
Materials and interfaces in organic electronics and spintronics S. Braun, P. Sehati, Y. Zhan, and M. Fahlman ...................................................................................... 396
The evolution of the electronic properties for FeHal@SWNT (Hal=I, Br, Cl) during filler decomposition studied by core-level spectroscopies M. Brzhezinskaya, A. Eliseev, and M. Kharlamova ............................................................................... 398
Adsorption of water and ammonia on graphene/Ni(111) S. Böttcher, M. Weser, K. Horn, E.N. Voloshina, B. Paulus, and Yu.S. Dedkov ...................................... 400
Monomolecular films of perfluoroterphenyl-substituted alkanethiols: Molecular conformation and odd-even effects F. Chesneau, B. Schüpbach, K. Szela‚gowska-Kunstman, N. Ballav, P. Cyganik, A. Terfort, and M. Zharnikov .............................................................................................................. 402
Preliminary XPS results on alkylated silicon nanocrystals produced at two different etching current densities P.R. Coxon, S. Krishnamurthy, Q. Wang, A. Preobrajenski, C. Charlton, and Y. Chao .......................... 404
In-situ metalation of free-base porphyrins by substrate atoms C.M. Doyle, S.A. Krasnikov, A.B. Preobrajenski, N.N. Sergeeva, N.A. Vinogradov, Y.N. Sergeeva, M.O. Senge, and A.A. Cafolla ............................................................................................................ 406
Fabrication of a mixed aminopropyltriethoxy and mercaptopropyltrimethoxy silane layer with biofunctional properties on hydroxylated stainless steel M. Hirsimäki, L. Kanninen, R. Pärna, H. Ali-Löytty, P. Jussila, E. Nõmmiste, and M. Valden ................... 408
Thin ferromagnetic Mn-germanide film on Ge(111) J. Hirvonen Grytzelius, H.M. Zhang, and L.S.O. Johansson .................................................................. 410
Femtosecond dynamics of the charge transfer in alkanethiolate self-assembled monolayers via resonant Auger electron spectroscopy P. Kao, S. Neppl, P. Feulner, D.L. Allara, and M. Zharnikov ................................................................... 412
Pulsed laser deposition of gold nitride: Photoemission spectroscopic study of its electronic structure S. Krishnamurthy, P.R. Coxon, C. Charlton O’Mahony, Y. Chao, and J.-P. Mosnier ............................... 414
76 MAX-lab ACTIVITY REPORT 2010
SYNCHROTRON RADIATION
The structure and magnetic properties of Fe nanoclusters grown on the Ge(001) surface O. Lübben, S.A. Krasnikov, A.B. Preobrajenski, B.E. Murphy, and I.V. Shvets........................................ 416
Adsorbed graphene as a non-volatile platform for chemical reactions M.L. Ng, N. Vinogradov, K. Simonov, N. Mårtensson, and A.B. Preobrajenski ...................................... 418
Electronic structure of graphene grown on copper P. Palmgren, E. Lewin, M.J. Webb, P. Pal, U. Jansson, and O. Karis ...................................................... 420
Room temperature deposition of self-assembled Al nanoclusters on stepped sapphire (0001) surface and subsequent nitridation B. Qi, B. Agnarsson, S. Ólafsson, H.P. Gíslason, and M. Göthelid ........................................................ 422
Electronic structure of Zn doped copper chloride probed by soft X-ray spectroscopies K.V. Rajani, S. Daniels, P.J. McNally, and S. Krishnamurthy .................................................................. 424
Single molecule magnets on a Au(111) surface: In-situ electrospray deposition and a comparison of different ligand shells A. Saywell, A.J. Britton, N. Taleb, M. Gimenex-Lopez, N.R. Champness, P.H. Beton, and J.N. O’Shea ...... 426
Oxidation of h-BN monolayer on Ir(111) studied by core-level spectroscopies K.A. Simonov, N.A. Vinogradov, M.L. Ng, A.S. Vinogradov, N. Mårtensson, and A. Preobrajenski ....... 428
Growth of the first water layer on rutile TiO2(110) L.E. Walle, M. Amft, D. Ragazzon, A. Borg, P. Uvdal, N. Skorodumova, and A. Sandell ....................... 430
Mixed dissociative and molecular water adsorption on anatase TiO2(101) L.E. Walle, A. Borg, E.M.J. Johansson, S. Plogmaker, H. Rensmo, P. Uvdal, and A. Sandell ................... 432
X-ray magnetic circular dichroism studies of the graphene/Fe/Ni(111) intercalation-like system M. Weser, E.N. Voloshina, K. Horn, and Yu.S. Dedkov ........................................................................ 434
The impact of atomic oxygen on graphene weakly bound to metal substrates N.A. Vinogradov, K. Schulte, M.L. Ng, A. Mikkelsen, E. Lundgren, N. Mårtensson, and A.B. Preobrajenski ....................................................................................................................... 436
The hBN nanowaves on the Fe(110) surface N.A. Vinogradov, A. Zakharov, M.L. Ng, A. Mikkelsen, E. Lundgren, N. Mårtensson, and A.B. Preobrajenski ....................................................................................................................... 438
Electronic Structure of PTCDA on Pb/Si(111)3×3 H.M. Zhang and L.S.O. Johansson ...................................................................................................... 440
Beamline I1011
Soft X-ray spectroscopy on (Ga,Mn)N/GaN digital ferromagnetic heterostructures: First results at MAX-lab H. Chang Jeon, T. Won Kang, D. Arvanitis, and R. Ahuja .................................................................... 442
Investigation of magnetism in a solid solution of two antiferromagnets: -Fe2O3 and FeTiO3 D. Choudhury, R. Knut, M. Björck, O. Karis, and D.D. Sarma .............................................................. 444
Probing the proposed half-metallic antiferromagnetism in LaSrVMoO6 S. Jana, V. Singh, S.D. Kaushik, C. Meneghini, P. Pal, R. Knut, O. Karis, I. Dasgupta, V. Siruguri, and S. Ray ........................................................................................................................ 446
Structural and magnetic characterization of Co2MnGe/Rh2CuSn Heusler multilayers R. Knut, O. Mryasov, M. Björck, P. Warnicke, D. Arena, M. Wikberg, R. Bejhed, P. Svedlindh, and O. Karis ................................................................................................................... 448
X-ray absorption and magnetic circular dichroism on prussian blue analogues I.A. Kowalik, F.J. Luque, H. Prima García, J.P. Prieto, F. Romero, M. Makarewicz, D. Arvanitis, J.J. de Miguel, R. Miranda, and E. Coronado ...................................................................................... 450

MAX-lab ACTIVITY REPORT 2010 77
Linear X-ray dichroism at BL I1011: First results on bcc Fe I.A. Kowalik, F. Luque, and D. Arvanitis .............................................................................................. 452
Interfacial effects in the magnetism of metastable fcc FeCu alloy thin films F.J. Luque, M.Á. Niño, A. Persson, I. Kowalik, D. Arvanitis, R. Miranda, and J.J. de Miguel .................. 454
Time resolved XMCD combined with FMR study on a Fe20Ni80 single film P. Warnicke, O. Karis, R. Knut, M. Björck, and D. Arena ...................................................................... 456
Investigation of magnetic properties of the multiferroic layer system cobalt on bariumtitanate M. Welke, R.K. Govind, M. Trautmann, V.H. Babu, K.-M. Schindler, and R. Denecke ........................... 458
XMCD studies of the MnSb inclusions formed in GaSb matrix A. Wolska, K. Lawniczak-Jablonska, M.T. Klepka, and J. Sadowski ...................................................... 460
MAX IIIBeamline I3
Creation of long-lived Frenkel defects via hot electron-hole recombination in pure NaCl crystals at 12 K E. Feldbach, A. Lushchik, Ch. Lushchik, V. Nagirnyi, E. Shablonin, and S. Vielhauer ............................. 462
Absorption cross section measurements of CO2 isotopologues 13CO2 and C18O2 in the wavelength range 150-187 nm R. Forecast, J.A. Schmidt, H. Hartman, H. Nilsson, S. Huldt, and M.S. Johnson ................................... 464
Investigation of VUV transitions of iron group elements for astrophysical applications using I3 at MAX III H. Hartman, H. Nilsson, S. Huldt, R. Blackwell-Whitehead, T. Lennartsson, E. Bäckström, J. Gurell, S. Mannervik, and S.R. Sörensen .......................................................................................... 466
Top of the valence band of the GaAs(100)-c(4x4) surface P. Jirícek, M. Cukr, I. Bartoš, J. Sadowski, M. Leandersson, and T. Balasubramanian ............................ 468
UV-induced photofragmentation of 1,1,1,2-tetrafluoroethane (CF3-CH2F) J.A. Kettunen, L. Partanen, A. Sankari, S. Urpelainen, A. Kivimäki, M. Huttula, and H. Aksela ............. 470
Size selective study of the Se microclusters induced by direct vacuum evaporation K. Kooser, D.T. Ha, E. Itälä, J. Laksman, S. Urpelainen, and E. Kukk..................................................... 472
Angle-resolved electron momentum imaging in the vicinity of the surface Plasmon resonance of C60 F. Lépine, C. Cauchy, P-A. Hervieux, J. Laksman, E. Månsson, K. Hansen, S. Canton, S.L. Sörensen, P. Johnson, and M. Gisselbrecht ................................................................................... 474
Angle- and spin-resolved photoemission on ferromagnetic Mn5Ge3(0001) thin films grown on Ge(111) W. Ndiaye, M.C. Richter, O. Heckmann, P. De Padova, J.-M. Mariot, T. Balasubramanian, M. Leandersson, and K. Hricovini ....................................................................................................... 476
In situ diagnostics of the thermal decomposition of partially hydrated hafnium tetrachloride by time-of-flight mass spectrometry R. Ruus, R. Pärna, K. Kooser, E. Kukk, S. Urpelainen, and E. Nõmmiste ............................................... 478
Dissociation of Sb4 clusters following 4d core excitation and the subsequent resonant Auger decay S. Urpelainen, K. Kooser, D.T. Ha, E. Nõmmiste, and E. Kukk .............................................................. 480
Spin resolved photoemission spectroscopy at MAX; the detector upgrade and first data from a 1D topological surface J.W. Wells, J.E. Wahlström, T. Balasubramanian, and M. Leandersson ................................................. 482

78 MAX-lab ACTIVITY REPORT 2010
SYNCHROTRON RADIATION
Beamline I4
Surface structure, charge transfer and core level shifts on fcc(111)-I 3 and 7 surfaces S. Ahmadi, S.Yu, M. Leandersson, J. Weissenrieder, and M. Göthelid ................................................. 484
Photoemission from graphene on SiC: Asymmetry of replicas T. Balasubramanian, M. Leandersson, J. Adell, J. Osiecki, L.I. Johansson, C. Virojanadara, R. Yakimova, and L. Wallden .............................................................................................................. 486
Electronic structure of the thallium induced 2×1 reconstruction on Si(001) P.E.J. Eriksson, K. Sakamoto, and R.I.G. Uhrberg................................................................................. 488
Photoemission study of (Zn,Co)O films with uniform Co distribution E. Guziewicz, M.I. Łukasiewicz, L. Wachnicki, K. Kopalko, and M. Godlewski ..................................... 490
Self-organized trimesic-acid nanomesh on Cu(100): Adsorption geometry of the TMA molecules M. Hirsimäki, R. Pärna, H. Ali-Löytty, P. Jussila, E. Nõmmiste, and M. Valden ....................................... 492
Combined experimental and theoretical study of surface core-level shifts on Ge(111)-c(2×8) M. Kuzmin, M.J.P. Punkkinen, P. Laukkanen, J.J.K. Lång, J. Dahl, V. Tuominen, M. Tuominen, R.E. Perälä, T. Balasubramanian, J. Adell, K. Kokko, and I.J. Väyrynen ................................................. 494
Unoccupied electronic structure of graphite probed by angle-resolved photoemission spectroscopy S.K. Mahatha, K.S.R. Menon, and T. Balasubramanian ....................................................................... 496
Software development for analysis of 2-D ARPES data at BL I4 J.R. Osiecki ......................................................................................................................................... 498
Chemical doping of epitaxial graphene on SiC P. Palmgren, M.J Webb, P. Pal, R. Yakimova, H. Grennberg, and O. Karis ............................................ 500
High-resolution core-level photoelectron spectroscopy of the Bi/Si(110)-(2x3) surface K. Sakamoto, B. Müller, K. Miki, J. Osiecki, and R.I.G. Uhrberg ........................................................... 502
Electronic structure of Ce2TSi3 systems; magnetic Kondo lattice (T=Rh) and a Fermi liquid (T=Co) P. Starowicz, Ł. Walczak, B. Penc, M. Szlawska, J. Adell, D. Kaczorowski, and A. Szytuła ..................... 504
Li intercalation on epitaxial graphene on 6H-SiC C. Virojanadara, S. Watcharinyanon, A.A. Zakharov, and L.I. Johansson.............................................. 506
Band structures of Ag films on Sn/Si(111)3×3 H.M. Zhang and L.S.O. Johansson ...................................................................................................... 508

MAX-lab ACTIVITY REPORT 2010 79
SYNCHROTRON RADIATION
Mats Leandersson is discussing ideas with Jan-Olof Forsell at the Poster Session during the MAX-lab Annual User Meeting at MAX-lab, 8 November 2010. Photo: Annika Nyberg

80 MAX-lab ACTIVITY REPORT 2010
SYNCHROTRON RADIATION – BEAMLINE 41
Electronic structure of Ge1-x-yMnxEuyTe epilayers B.J. Kowalski1, R. Nietuby 2, K. Nowakowska-Langier2, J. Sadowski1,3, W. Knoff1, T. Story1
1Institute of Physics, Polish Academy of Sciences, Al. Lotników 32/46, 02-668 Warsaw, Poland
2The Andrzej Soltan Institute for Nuclear Studies, 05-400 Swierk/Otwock, Poland
3 MAX-lab, Lund University, Box 118, SE-22100 Lund, Sweden
GeTe-based diluted magnetic semiconductors attract considerable interest due to recently discovered features advantageous in view of spintronic applications. The highest Curie temperature of Ge1-xMnxTe reported in the literature strongly depends on Mn contents or carrier concentration and it can be as high as 1900 K.1 This inspired extensive investigations of this system and related materials. Among others, Ge1-x-yMnxEuyTe was considered as a system with ferromagnetism promoted by introduction of Eu, presumably reducing number of antiferromagneticaly coupled pairs of Mn atoms.2 The band structure of Ge1-x-yMnxEuyTe was studied by the angle-integrated photoemission only for Ge1-x-yMnxEuyTe polycrystals and the Ge1-x-yMnxEuyTe surface alloy (prepared by deposition of Mn on the surface of a Ge1-
xEuxTe layer and annealing of the system).3 For the polycrystals grown by a Bridgman method, some features corresponding to precipitates of other phases were detected. The formation of a Ge1-x-yMnxEuyTe surface alloy on Ge1-xEuxTe was followed during the Mn deposition and spectral features corresponding to Mn and Eu were observed at subsequent stages of the system preparation. However, corresponding data from a crystal with manganese and europium ions built during the growth into the proper sites in the crystal lattice were still missing.
The reported experiments consisted in
photoemission measurements of epitaxial layers of Ge0.88Mn0.1Eu0.02Te, doped with both manganese and europium during the growth process. The samples were grown by an MBE technique on BaF2 substrates. The crystalline quality was assessed by XRD measurements. The clean surface, suitable for the photoemission experiments was prepared by repeated cycles of Ar+ ion sputtering and annealing at 2500C.
0 2 4 6 8 10 120.00
0.05
0.10
0.15
0.20
0.25
0.30
0.35
0.40
0.45
0.50
51eV
49.5eV49eV
48eV
137eV139eV141eV
Ge0.88Mn0.1Eu0.02Te
hν=143eV
Ge0.88Mn0.1Eu0.02TeIn
tens
ity (a
rb. u
nits
)
Binding Energy (eV)Fig. 1. The photoemission spectra taken for Ge0.88Mn0.1Eu0.02Te at the photon energies close to Mn 3p-3d (48-51 eV) and Eu 4d-4f (137-141 eV) resonances.

MAX-lab ACTIVITY REPORT 2010 81
SYNCHROTRON RADIATION – BEAMLINE 41
The photoemission experiments were carried out for two photon-energy ranges corresponding to the Fano-type4 resonances of two open-shell constituents of the system – Mn and Eu. The range of 31-55 eV covered the Mn 3p-3d resonance, the range of 131-150 eV – Eu 4d-4f. The selected curves, taken for the photon energies close to the resonances are shown in Fig. 1. Since the Fano resonance leads to strong increase of the emission from the open shell (Mn 3d or Eu 4f) electronic states, the comparison of the spectrum taken at the resonance with that measured for the anti-resonance allows us to reveal the spectral features related to these states. The difference curves for both resonances are shown in Fig. 2. They represent the Mn 3d and Eu 4f contributions to the photoemission from the valence band of Ge0.88Mn0.1Eu0.02Te. They show that Eu is built into the system as Eu2+ ions, as expected for a IV-VI compound5.The weak feature of Eu3+ can be ascribed to Eu-related defects, in particular to those created on the surface during the cleaning process.
The Mn 3d-related feature (Fig. 2)
corresponds well to that found for the Ge1-xMnxTe epilayers grown by the same technique as the investigated Ge0.88Mn0.1Eu0.02Te sample.6 The shape of this feature enables us to interpret it as the emission from the manganese ion bound to the ligands with the octahedral coordination. These observations indicate, within the sensitivity limits of the method, that the presence of Eu ions in the layer does not change markedly the charge state of the manganese ions and their interaction with the surrounding crystal as compared with those in Ge1-xMnxTe.
The research leading to these results has received funding from the European
Community's Seventh Framework Programme (FP7/2007-2013) under grant agreement nº 226716.
0 2 4 6 8 100.0
0.1
0.2
0.3
Mn2+3d
Eu3+4f
Eu2+4f
Ge0.88Eu0.02Mn0.1Te
Inte
nsity
(arb
.u.)
Binding Energy (eV)Fig. 2. The difference curves obtained by subtraction of the anti-resonance spectrum from the resonance one for Mn 3p-3d and Eu 4d-4f.
__________________________ 1 Y. Fukuma, H.Asada, S. Miyawaki, T. Koyanagi, S. Senba, K. Goto and H. Sato, Appl. Phys. Lett. 93, 252502 (2008) 2 W. Dobrowolski, M. Arciszewska, B. Brodowska, V. Domukhovski, V.K. Dugaev, A. Grz da, I. Kuryliszyn-Kudelska, M. Wójcik, E.I. Slynko, Sci. Sintering 38, 109 (2006) 3 M. Pietrzyk, PhD Theses, Warsaw 2010 4 U. Fano, Phys. Rev. 124, 1866 (1961) 5 B.J. Kowalski, Z. Go acki, E. Guziewicz, A. Kozanecki, B.A. Or owski J. Ghijsen R.L. Johnson, J. Alloys and Compounds 286, 121 (1999) 6 M.A. Pietrzyk, B.J. Kowalski, B.A. Orlowski, W. Knoff, T. Story, W. Dobrowolski, V.E. Slynko, E.I. Slynko, R.L. Johnson, Acta Phys. Pol. A 117, 293 (2010)

82 MAX-lab ACTIVITY REPORT 2010
SYNCHROTRON RADIATION – BEAMLINE 41

MAX-lab ACTIVITY REPORT 2010 83
SYNCHROTRON RADIATION – BEAMLINE 41
[1] C.-A. Chang, M. Heiblum, R. Ludeke, and M. I. Nathan, Appl. Phys. Lett. 39, 229 (1981). [2] G. S. Petrich, A. M. Dabiran, and P. I. Cohen, Appl. Phys. Lett. 61, 162 (1992). [3] M. B. Panish, R. A. Hamm, and L. C. Hopkins, Appl. Phys. Lett. 56, 2301 (1990). [4] J. J. K. Lång, P. Laukkanen, M. P. J. Punkkinen, M. Ahola-Tuomi, M. Kuzmin, V. Tuominen, J. Dahl, M. Tuominen, R. E. Perälä, K. Schulte, J. Adell, J. Sadowski, J. Kanski, M. Guina, M. Pessa, K. Kokko, B. Johansson, L. Vitos, and I. J. Väyrynen, Accepted for publication in Surface Science.
broadening of the Sn peak arises from the co-existence of the (1×2) and (1×4)-areas (Table1) Similar Sn4d spectra (not shown) were obtained for the InAs(100)(1×2)/(1×4)-Sn surface. The both Ga3d and As3d include at least one shifted component separated by +0.22 eV and +0.18 eV, respectively, from the bulk emission. The comparison of measured and calculated core-level shifts, calculated for energetically most favourable atomic models from the first principles, is shown in Table 1. Calculated core-level shifts were obtained within the initial state model by calculating the average electrostatic potential at core and averaging from different group V and III atomic layers of the slab to obtain the bulk reference values. From Table 1 it can be seen that the calculated shifts for Ga-As (In-As) and Sn-As dimer models are too large compared to the experimental shifts. This is especially true for Sn-As model. However the existence of Sn-Ga (Sn-In) dimer model is nicely supported by the comparison of experimental and theoretical shifts.
In summary, we have studied the GaAs(100)- and InAs(100)(1×2)/(1×4)-Sn surfaces by LEED, photoelectron spectroscopy, STM/S, and ab initio calculations. Calculations demonstrate the stability of the Sn-Ga and Sn-As dimer models on the GaAs-Sn. For the InAs-Sn, only the Sn-In model is stable at 0 K. A new (1×4) reconstruction was found in which the filled dangling bonds are closer to each other than in the (1×2). The comparison of measured and calculated STM images supports the presence of energetically favoured Sn-III models on the considered surfaces. Furthermore, the measured and calculated surface core-level shifts support the Sn-III model and allow the exclusion of III-As and Sn-As models.
We would like to thank the MAX-lab staff for all support.
-1.5 -1.0 -0.5 0.0 0.5 1.0 1.5
hν = 74 eV
GaAs(100)(1x2)/(1x4)-Sn
S1B
θe=70o
θe=0o
As3d
Nor
mal
ized
PE
inte
nsity
Relative binding energy (eV)
-1.0 -0.5 0.0 0.5 1.0 1.5
hν = 60 eV
GaAs(100)(1x2)/(1x4)-Sn
S1B
θe=0o
θe=70o
Ga3d
Nor
mal
ized
PE
inte
nsity
Relative binding energy (eV)
(c)
(b)
(a)
-1.5 -1.0 -0.5 0.0 0.5 1.0 1.5 2.0
hν = 60 eV
GaAs(100)(1x2)/(1x4)-Sn
Sn4dθe=70o
θe=0o
Nor
mal
ized
PE
inte
nsity
Relative binding energy (eV)
GaAs(100)(1×2)/(1×4)-Sn Ga3d As3d Sn4d Calculated (1×2)SnGa +0.11, +0.06 +0.03, -0.08, +0.07 0 Calculated (1×2)GaAs +0.41, -0.30 +0.12, +0.13 0 Calculated (1×2)SnAs -0.24, +0.10 +0.24, +0.55, -0.19 0.07 Calculated (1×4)SnGa +0.11, -0.09, +0.20 -0.10, +0.14 -0,02 Calculated (1×4)GaAs +0.43, -0.30, +0.32 -0.04, +0.17, +0.25 -0.03 Calculated (1×4)SnAs -0.24, +0.20, -0.05 +0.27, +0.60, -0.22, +0.17 -0.02
Measured +0.22 +0.18 0 InAs(100)(1×2)/(1×4)-Sn In4d As3d Sn4d
Calculated (1×2)SnIn +0.12, +0.07 0.08 0 Calculated (1×2)InAs +0.38, -0.20 +0.16, +0.14 -0.05 Calculated (1×2)SnAs -0.23, +0.11 +0.19, +0.40 0.1 Calculated (1×4)SnIn +0.13. +0.18 0.14 -0.02 Calculated (1×4)InAs +0.40, -0.21, +0.31 +0.13, +0.18, +0.26 -0.08 Calculated (1×4)SnAs -0.16, +0.14, +0.22 +0.54, +0.13, +0.19, +0.10 -0.2
Measured +0.17 +0.17 0
Figure 2. Fitted (a) Sn4d, (b) Ga3d and (c) As3d core-level spectra of the GaAs(100)(1×2)/(1×4)-Sn surface, measured with different emission angles (0° and 70°). Photon energy was 60 eV for Sn4d and Ga3d and 74 eV for As3d. All the spectra are normalized to their maxima.

84 MAX-lab ACTIVITY REPORT 2010
SYNCHROTRON RADIATION – BEAMLINE 41
°
-1 0 1 2 3 4 5 6 7 8
0,06
0,08
0,10
0,12
0,14
0,16
-1 0 1 2 3 4 5 6 7 8
0,06
0,08
0,10
0,12
0,14
0,16
Ge-Mn5.012, 49eV
Rel
ativ
e In
tens
ity
Binding Energy [eV]
Ge-Mn5.019, 51eV
-1 0 1 2 3 4 5 6 7 8
0,020,040,060,080,100,120,140,160,180,200,220,24
-1 0 1 2 3 4 5 6 7 8
0,020,040,060,080,100,120,140,160,180,200,220,24
Ge-Mn6.008, 49eV
Rel
ativ
e In
tens
ity
Binding Energy [eV]
Ge-Mn6.007, 51eV
Figure 1. The valence band of Ge-Mn having polycrystalline structure. The resonance photo-emission excitation of Mn 3d states were measured at 51 eV and 49 eV excitations.
Figure 2. The valence band of Ge-Mn having single crystal structure. The resonance photo-emission excitation of Mn 3d states were measured at 51 eV and 49 eV excitations.
Photoelectric Properties of ion Implantation Induced Ge-Mn Layer Regrown at 400 and 600 °°C on Ge(100)
G. Pet *, Cs. S. Daróczi*, B. Pécz*, L. F. Kiss**, and T. Kemény** *Research Inst. for Technical Physics and Materials Science, H-1525 Budapest, P.O. Box 49, Hungary **Research Inst. for Solid State Physics and Optics, H-1525 Budapest, P.O. Box 49, Hungary
°
Introduction: Our work is the continuation of a previous one presented in this book series [1]. We use Mn as transition metal (TM) impurity in Ge(100) in order to obtain diluted magnetic semiconductor (DMS). In Ge the solubility is much better, than in III-V semiconductors. For DMS applications the relatively high concentrations (1-10 at%) of Mn are promising, substituting some Ge atoms by Mn. For the DMS fabrication we use Mn implantation into Ge. In this case the surface regrowth from the implantation induced radiation damage is the critical point, similarly to the doped semiconductor devices. On the other hand, the regrowing with the required high doping concentration must be careful, as we have to avoid intermetallic formation. The elevated temperature during the regrowth process may result in more ordered, or even single crystalline and reconstructed surface. Experimental: The undoped Ge(100) wafers were implanted with Mn at 100 keV, 8x10¹⁶ ion/cm2 at room temperature (at Institute of Ion Beam Physics and Material Research, Dresden-Rossendorf, Germany). The regrowth process at the surface was in situ investigated in UHV by photoemission and LEED techniques at BL41 in MAX-lab (Lund University, Sweden), with special attention to the damaged-undamaged interface. This case the temperature of the heat treatment (HT) was higher, namely 400 °C and 600 °C. After the regrowthing, the crystalline structure was investigated by Transmission Electron Microscopy-Electron Diffraction, while the magnetic properties were measured by SQUID. Photoemission Results: In the spectrum of the as received samples the oxidized state of Ge 3d was seen together with some oxygen and carbon 2s contamination. After a short Ar+ bombardment (15 min, 0.5 keV), the Ge 3d and the valance band levels were clean, and strong reduction of the oxidized Ge 3d has appeared. After a longer sputtering (60 min, 0.5 keV) the Ge 3d emission was not changed further. It is well known, that there is a resonance photoemission at 51 eV photon energy of the Mn 3d valence state. Now, similarly, after the HT at lower temperature (400 °C) the photoemission spectra show the resonance photoemission of Mn 3 d states [Fig. 1], but surprisingly, after a higher temperature (600 °C) annealing the Mn 3d states could not be identified [Fig. 2].

MAX-lab ACTIVITY REPORT 2010 85
SYNCHROTRON RADIATION – BEAMLINE 41
Figure 3. Poly-crystalline Ge sample, heat treated at 400 °C temperature.
Figure 4. Fully crystallized Ge sample regrown at 600 °C as single crystal to the substrate.
According to the TEM crystal patterning, after the lower temperature heat treatment (at 400 °C) a polycrystalline film was formed (Fig. 3), with rather large polycrystallites. The effect of the interface regrowth could be neglected, which is rather unusual in the regrowth of ion implantation damaged surface layers. Moreover, there is some nucleation in the damaged layer. The relatively high defect concentration may be responsible for the blocked atomic regrowth and relaxation/reconstruction. At higher temperature (at 600 °C) the regrowth was found (Fig. 4.), possibly regulated by the damaged/undamaged interface. The growth mechanism of this layer can be similar to the one generally accepted for the epitaxial regrowth of the implantation damaged surface layers. The solid phase epitaxy resulted dominantly single crystal, though, the quality of this single crystal is far from being high. The magnetic properties of the Mn implanted and regrown Ge are interesting, because these materials have a rather new atomic structure, therefore it can suggest new magnetic metal systems.
Figure 5. (A): Polycrystalline sample with small ferromagnetic clusters and with a blocking temperature of about 270 K (B): Single crystalline sample with ferromagnetic phase with a Curie point of about 160 K (The negative magnetization at higher fields is the consequence of the diamagnetic contribution of Ge.)
According to TEM measurements, the structure of the Mn implanted Ge was amorphous after the implantation and the surface cleaning. The annealing of this structure produced some grains in the amorphous background. The magnetic properties could be characterized by super-paramagnetic clusters in the as-implanted case. After the annealing at 400 °C some ferromagnetic component and crystalline clusters were observed. The LEED pattern was not apparent, nor the ARUPS spectrum. Probably the annealing temperature of the thermal budget was too low, and the crystallization has only started. The pre-crystallization process was not localized to the damaged-undamaged interface, instead the whole damaged layer was involved. This indicates an unusual regrowing mechanism.
Acknowledgements: We would like to acknowledge the help from MAX-lab staff and wish to thank the financial support from ARI. Reference: [1] G. Pet , and Cs. S. Daróczi: “Photoelectric Properties of Ge-Mn Layer Induced by Mn ion Implantation onto Ge(100)”, in: MAX-lab Activity Report 2009, Lund, Sweden, Eds: U. Johansson, A. Nyberg, R. Nyholm, Synchrotron Radiation – BeamLine 41, pp.88-89, (2010)

86 MAX-lab ACTIVITY REPORT 2010
SYNCHROTRON RADIATION
Katarina Norén, Adriana Wawrzyniak, and Janusz Sadowski at the December dinner party at Grand Hotel in Lund, 1 December 2010.Photo: Bengt-Erik Wingren

MAX-lab ACTIVITY REPORT 2010 87
SYNCHROTRON RADIATION
Mikael Eriksson is congratulating Bo Persson to his retirement after impressively 26 years at MAX-lab, 16 December 2010.Photo: Bengt-Erik Wingren

88 MAX-lab ACTIVITY REPORT 2010
SYNCHROTRON RADIATION – BEAMLINE 73
A feasibility study concerning the use of Raman and Fourier Transform Infrared (FTIR) spectroscopy in studies of activated carbon particles levitated in an Electrodynamic Balance (EDB) is presented. Activated carbon particles treated with different substances (O3, HNO3, NOx, H2SO4) were studied in bulk samples, as single particles on a glass plate, and levitated using the EDB. FTIR of motionless particles on a glass plate showed a presence of different functional groups on the surface of the particles. Spectra taken on levitated particles were disturbed by oscillating motion of the particle. The obtained results and experimental challenges are discussed. The use of Raman technique did not reveal any difference between the samples, and it is therefore discarded as a possible technique for the studied particles.
The growing demand for energy production is a strong motivation behind research concerning more efficient and less emissive ways of fuel combustion. One strategy to achieve this goal is oxy-fuel combustion, a field of research that have seen intense activity during the last few years. In this type of combustion the oxidizing atmosphere consists of O2 preliminary separated from air and mixed with recycled flue CO2. This means that at the end of the coal combustion process CO2 will be the only exhaust gas. It enables efficient post-combustion capture and storage of CO2 and also increases the combustion efficiency in comparison to combustion in air. Moreover, coal fuels, which are mostly planned to use in this type of processes, could be replaced by for example biochar particles. Neither gas phase nor surface chemistry occurring during combustion of coal and biomass are well understood, especially for the case of O2+CO2 atmosphere. Thus there is a particular interest in studies aimed to advance the knowledge of single coal or biochar particle combustion under oxy-fuel conditions. Observing the properties of solid phase particles under laboratory conditions presents two major challenges: particles need to be isolated from the influence of any supporting surfaces and the measurement techniques should not disturb the processes of interest. When considering single particle studies the former might be provided by using a levitation method while the latter can be solved by implementing light scattering or absorbing techniques.
In the present research the Electrodynamic Balance (EDB) method was used to suspend a carbon particle in air. In an EDB the levitation force originates in the electrical field, and this requires the particle to be charged. But it does not require for example non-absorbance or transparency like in optical levitators. This makes the EDB suitable for the study of carbon particles. Two non-intrusive spectroscopic methods which may provide extensive information about the presence of different functional groups in a studied sample are Raman and Fourier Transform Infrared (FTIR) microspectroscopy. In case of combustion studies they could be used to determine chemical composition of the particle surface before and after oxidation; this will result in a better understanding of the process in terms of its kinetics. Experimental
The particles used were Norit CA3 activated carbon particles. This carbon was prepared by phosphoric acid activation and has a size distribution in the range of 7-100 m with a median in 35 m.
Prior to measurements 5 glass flasks with samples were prepared. First pair was exposed to a flow of ozone and nitrogen oxides respectively for several minutes and stored in flasks in air. Second pair was dissolved in concentrated nitric and sulphuric acids and treated for 24 hours. The samples exposed to liquids were filtered and washed with methanol, then dried overnight and stored in air. One sample was left untreated and used as reference. The untreated sample is hereafter denoted as AC, and treated samples as AC-O3, AC-NOx, AC-HNO3 and AC-H2SO4 respectively.
FTIR measurements were performed using a Bruker IFS66V/S spectrometer coupled to a Bruker Hyperion 3000 microscope with 15x objective at Maxlab, Lund, Sweden. The microscope works either in optical or infrared regime. Raman spectra were collected at the University of Copenhagen, Denmark, by illuminating the particle by a 633 nm laser beam focused with a 100x Olympus microscope objective and collecting backscattered light.
For trapping the particle an EDB setup developed at the University of Copenhagen was used. The EDB chamber has classical configuration with three hyperbolic-shaped electrodes – two cap electrodes to which DC voltage is applied and one ring electrode which generates AC field. The two main features of the present setup are: (a) it has eight windows in horizontal plane and two in vertical that allows for optical access in all directions, and (b) the whole chamber can be isolated from ambient air, which makes it possible to change the oxidizing atmosphere to for example O2+CO2.
In the present experiments the main source of periodic oscillations of the particle was the AC field in the chamber. The field needed to be strong enough in order to prevent any other motions of the particle due to laser irradiation,
Studies of Carbon Microparticles by Raman and Infrared Microscopy in an Electrodynamic Balance
V. A. Alekseev1*, E. J. K. Nilsson1, A. A. Konnov1, A. Engdahl2, P. Uvdal3 and M. S. Johnson4
1Division of Combustion Physics, Department of Physics, Lund Institute of Technology, Lund, Sweden 2Maxlab, Lund, Sweden
3Chemical Physics, Department of Chemistry, Lund University, Lund Sweden 4Copenhagen Center for Atmospheric Research, Department of Chemistry, University of Copenhagen, Denmark

MAX-lab ACTIVITY REPORT 2010 89
SYNCHROTRON RADIATION – BEAMLINE 73
Conclusions
The main conclusion of this feasibility study is that synchrotron FTIR microscopy is a promising technique in identifying different functional groups on treated activated carbon samples. Nitrogen or oxygen containing groups are distinguishable in the spectra of the treated particles. The particles can easily be injected to the EDB and once a particle is trapped it can be kept levitated for as long time as needed. Combining the electrodynamic levitation and FTIR microscope techniques seems to be a promising approach for studies of single particles. The main challenge ahead is to increase the particle stability in the electrical field. When particles can be kept levitated with small or no oscillation, it is expected that FTIR spectra with a quality similar to that for single particle on a glass plate will be obtained. Using the Raman technique the difference between samples could not be confirmed.
displacement from the null-point etc. It is believed that increase of the particle charge-to-mass ratio could provide better stability which should result in better spectral information from its surface.
Upper left: Normalized Raman spectra of a variety of samples. Upper right: FTIR spectra of bulk samples. Lower left: FTIR microscopy spectra of single particles on a window. Lower right: FTIR microscopy of single particles suspended in the electrodynamic balance.

90 MAX-lab ACTIVITY REPORT 2010
SYNCHROTRON RADIATION – BEAMLINE 73
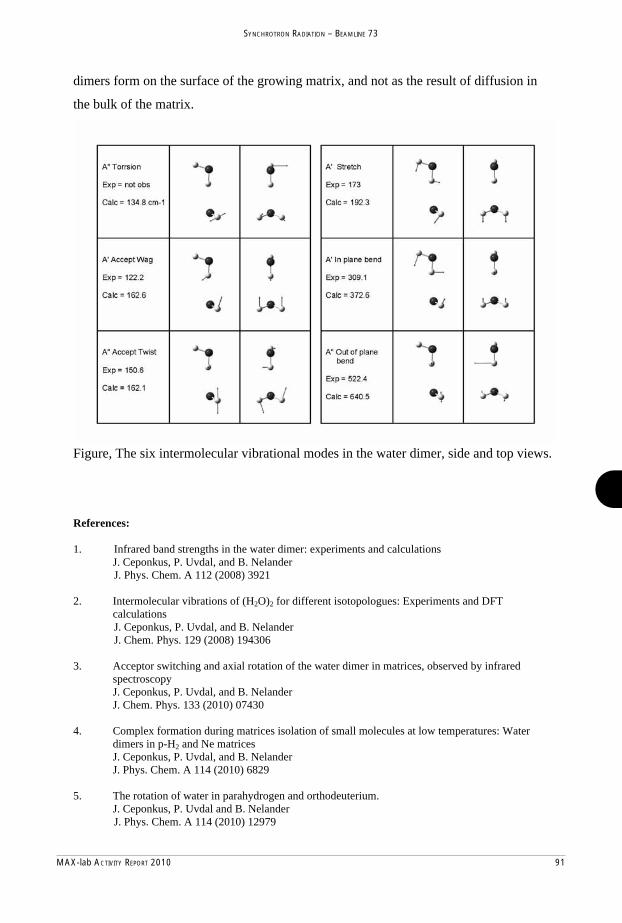
MAX-lab ACTIVITY REPORT 2010 91
SYNCHROTRON RADIATION – BEAMLINE 73
dimers form on the surface of the growing matrix, and not as the result of diffusion in
the bulk of the matrix.
Figure, The six intermolecular vibrational modes in the water dimer, side and top views.
References: 1. Infrared band strengths in the water dimer: experiments and calculations
J. Ceponkus, P. Uvdal, and B. Nelander J. Phys. Chem. A 112 (2008) 3921 2. Intermolecular vibrations of (H2O)2 for different isotopologues: Experiments and DFT
calculations J. Ceponkus, P. Uvdal, and B. Nelander
J. Chem. Phys. 129 (2008) 194306 3. Acceptor switching and axial rotation of the water dimer in matrices, observed by infrared
spectroscopy J. Ceponkus, P. Uvdal, and B. Nelander
J. Chem. Phys. 133 (2010) 07430 4. Complex formation during matrices isolation of small molecules at low temperatures: Water
dimers in p-H2 and Ne matrices J. Ceponkus, P. Uvdal, and B. Nelander J. Phys. Chem. A 114 (2010) 6829 5. The rotation of water in parahydrogen and orthodeuterium. J. Ceponkus, P. Uvdal and B. Nelander J. Phys. Chem. A 114 (2010) 12979

92 MAX-lab ACTIVITY REPORT 2010
SYNCHROTRON RADIATION – BEAMLINE 73
FTIR spectra of propanol and isopropanol in gas phase I.Doroshenko1, V.Pogorelov 1, P.Uvdal2, J.Ceponkus3, V.Sablinskas3
1Department of Physics, Kyiv National Taras Shevchenko University, Kiev, UKRAINE
2MAX-lab, Lund University, Lund, SWEDEN 3Department of Physics, Vilnius University, Vilnius, LITHUANIA
The clustering phenomena and structural peculiarities of partially ordered liquids are of great interest in the scientific community. This interest is even growing in context of recent trends and developments in studies on modern multifunctional materials, heterogeneous systems and nanotechnologies. Monohydric alcohols, that usually build broad variety of H-bond aggregates, are quite simple and convenient models to investigate properties of molecular systems sized over the mezoscopic scale (∼1 – 100 nm). The importance of the problems connected with the alcohol clustering, structure and, in particular, with the mechanisms of the diffuse absorption band formation reflects in the great number of experimental [1, 2], theoretical [3 - 5] and combined works [6, 7] published in the recent years.
The most part of the investigations is naturally devoted to the simplest monohydric alcohol – methanol. In the present contribution we report the infrared absorption spectra of two isomers of propyl alcohol – n-propanol or propan-2-ol CH3CH2CH2OH and isopropanol or propan-2-ol (CH3)2CHOH in gas phase. The spectra were recorded with the Bruker 120 FTIR HR spectrometer and the infrared synchrotron radiation component offered by the MAX-I storage ring. Spectra were registerd in the spectral region from 500 to 400 cm-1 with resolution 1 cm-1. In Fig. 1 the recorded spectrum of propanol is presented.
1000150020002500300035004000Wavenumber cm-1
0.0
0.5
1.0
1.5
2.0
Abso
rban
ce U
nits
Fig. 1 The registered infrared absorption spectrum of propanol in gas phase

MAX-lab ACTIVITY REPORT 2010 93
SYNCHROTRON RADIATION – BEAMLINE 73
The registered FTIR spectrum of isopropanol in gas phase is presented in Fig.2.
1000150020002500300035004000Wavenumber cm-1
0.0
0.5
1.0
1.5
2.0
2.5
3.0
3.5
Abso
rban
ce U
nits
Fig. 2 The registered infrared absorption spectrum of isopropanol in gas phase
As it is seen from Figs.1 and 2, in the both isomers there is rather intense absorbtion at about 3660 cm-1 corresponding to the vibrations of the free hydroxyl group. In the spectrum of isopropanol there is a broad band near 3200 cm-1, which in absent in the spectrum of n-propanol. This band usually indicates the existence of the intermolecular hydrogen bonding. It means that in the case of isopropanol the individual molecules begin to aggregate into the larger association – so called clusters. This fact may be considered as the first step towards the formation of the cluster structure which is typical for the monohydric alcohols in the condenced state.
Thus, the direction of the farther investigations is obvious – the increasing of the pressure should increase the probability of the cluster formation in the studied objects and the process of the aggregation of the individual alcohol molecules into the hydrogen-bonded clusters during the phase transition from the gas phase to the liquid one can be traced.
[1] X. Wu, Y. Chen, T. Yamaguchi, J. Mol. Spectr. 246, 187 (2007) [2] R. Wugt Larsen, P. Zielke, M.A. Suhm, J. Chem. Phys. 126, 194307 (2007) [3] E.F. Fileti, M. Castro, S. Canuto, Chem. Phys. Lett. 452, 54 (2008) [4] S. Boyd, R. Boyd, J. Chem. Theory Comput. 3, 54 (2007) [5] K.Bloch, C.P.Lawrence. J.Phys.Chem.B, 114, 293 (2010) [6] F.H. Tukhvatullin, V.E. Pogorelov, A. Jumabaev, H.A. Hushvaktov, A.A. Absanov, A.
Shaymanov, J. Mol. Struct. 881, 52 (2008) [7] K.Takahashi, M.Sugawara, S.Yabushita. J.Phys.Chem.A. 107, 11092 (2003)

94 MAX-lab ACTIVITY REPORT 2010
SYNCHROTRON RADIATION – BEAMLINE 73
Continuous-wave laser annealing of Si-rich oxide: A microscopic picture of macroscopic Si--SiO2 phase separation. Leonid Khriachtchev,1,a_ Timur Nikitin,1 Markku Räsänen,1 Alexandra Domanskaya,1 Simona Boninelli,2 Fabio Iacona,2 Anders Engdahl,3 Jyrki Juhanoja,4 and Sergei Novikov5
1Laboratory of Physical Chemistry, University of Helsinki, P.O. Box 55, FIN-00014, Finland 2MATIS IMM CNR, Via Santa Sofia 64, I-95123 Catania, Italy 3MAX-lab, Lund University, P.O. Box 118, 22100 Lund, Sweden 4Top Analytica, Ruukinkatu 4, FIN-20540 Turku, Finland 5Electron Physics Laboratory, Aalto University, P.O. Box 3000, FIN-02015 HUT, Finland
Received 11 August 2010; accepted 28 October 2010; published online 17 December 2010 We report on the first observation of the macroscopic (long-range) Si--SiO2 phase separation in Si-rich oxide SiOx (x<2)obtained by continuous-wave laser annealing of free-standing SiOx films. The effect is analyzed by a unique combination of microscopic methods _Raman, transmission, photoluminescence, and infrared spectroscopy, transmission electron microscopy, electron energy loss spectroscopy, and x-ray photoelectron spectroscopy_. Three regions can be distinguished on a SiOx free-standing film after 488 nm laser annealing at intensities above ~104 W cm 2: central spot, ring around the central spot, and pristine film outside the irradiated area. In the pristine SiOx material, small Si nanocrystals (Si-nc) (diameters of a few nanometer) are surrounded by SiO2 with an addition of residual suboxides, the Si-nc being produced by annealing at 1100 °C in a furnace. The central spot of the laser-annealed area (up to ~30 m wide in these experiments) is practically free of Si excess and mainly consists of amorphous SiO2. The ring around the central spot contains large spherical Si-nc (diameters up to ~100 nm) embedded in amorphous SiO2 without the presence of suboxides. Laser-induced temperatures in the structurally modified regions presumably exceed the Si melting temperature. The macroscopic Si--SiO2 phase separation is connected with extensive diffusion in temperature gradient leading to the Si concentration gradient. The present work demonstrates the advantages of high spatial resolution for analysis in materials research. © 2010 American Institute of Physics. (doi:10.1063/1.3520673) For the FTIR measurements, a free-standing sample was placed on a 2-mm-thick KBr window in the focal point of a Bruker Hyperion 3000 microscope with a condenser and objective both with 15x magnification giving a total visible magnification of 215x. In the microscope, a fixed square 5 x 5 m aperture was used for the measurements. The microscope was coupled to a Bruker IFS 66 v/s FTIR instrument which used synchrotron light from the MAX-I ring , beamline 73, at MAX-lab in Lund. 2048 scans were coadded with a resolution of 4 cm 1. These studies were performed with a 0.5 m SiOx free-standing film exposed to ~110 mW of power through a lens with a 150 mm focal length. The investigated laser-annealed areas are about 40 m wide so that the spatial resolution of 5 m is sufficient to study selectively absorption at different key positions.

MAX-lab ACTIVITY REPORT 2010 95
SYNCHROTRON RADIATION – BEAMLINE 73
The optical transmission picture of two laser spots and spectra measured at different positions. Measured in an Hyperion 3000 microscope with an aperture of 5x5 m and a spectral resolution of 4 cm-1 at beamline 73 MAX-lab by Anders Engdahl.

96 MAX-lab ACTIVITY REPORT 2010
SYNCHROTRON RADIATION – BEAMLINE 73
1 Dept. of Earth and Ecosystem Sciences, GeoBiosphere Science Centre, Lund University, Sölvegatan 12, SE-223 62 Lund, Sweden
1. D. A. Russell, Peabody Mus. Nat. Hist., Bull. 23, 1 (1967). 2. F. R. O’Keefe, Acta Zool. Fennica 213, 1 (2001). 3. L. L. Jacobs et al., J. Paleont. Soc. Korea 22, 91 (2006) 4. M. H. Schweitzer et al., Science 324, 626 (2009).
Microspectroscopic analysis of potential bone proteins from the Cretaceous of Angola
J. Lindgren1, P. Uvdal2 and A. Engdahl2
2 MAXLAB, Lund University, P. O. Box 118, SE-221 00 Lund, Sweden
During the summer of 2009 limb elements and vertebrae from mosasaurs1 and plesiosaurs2 were collected for molecular and biochemical analyses at Bentiaba3 (Cretaceous: Maastrichtian), south-western Angola, using a protocol4 to optimize the chances of recovery of potential primary biomolecules while minimizing the risk of introducing contaminants. Under sterile conditions small bone tissue samples were decalcified using ethylenediaminetetraacetic acid (EDTA). In some cases the acid-resistant residues contained fragmented, vessel-like structures associated with a fibrous substance that, in modern bone, would represent the organic phase of the extracellular matrix (the osteoid). The fibrous organization of the partially organic matter was demonstrated by optical and scanning electron microscopy. Additionally, under transmission electron microscopy regions of cross-striated, fibril-like structures were observed. To test the possibility of endogenous biomolecular preservation, isolated fibre bundles recovered from a plesiosaur propodial were examined using infrared microspectroscopy at beamline 73, MAX-lab, Lund University. The majority of the absorbance spectra obtained showed peaks corresponding to carboxylic acid and carboxylate groups (Fig. 1A), to suggest that the bulk of the organic matter was oxidized. However, a few fibre bundles also exhibited peaks indicating the possible presence of amino acid containing molecules (Fig. 1B). Putative amide bands were found at the frequencies of 1651–1647 (Amide I), 1558 (Amide II), and 1255 (Amide III) cm-1, respectively. In modern proteins these bands are associated with stretching and bending vibrations of the peptide (CO–NH) bonds, and their positions and heights are sensitive to structural changes of the three-dimensional conformation of the molecule. Vibrational bands corresponding to inorganic materials were also indentified, and ascribed to, among other things, A-B carbonate of hydroxyapatite. These results are somewhat ambiguous and additional analyses are required in order to establish whether or not any endogenously derived organics remain in the fossil bones from the Cretaceous of Bentiaba.
Figure. 1. A, Infrared spectra of isolated fibrous tissues from a plesiosaur propodial. Note presence of bands attributed to COO- and carbonate groups. B, Infrared spectra of isolated fibrous tissues from a plesiosaur propodial. Note presumptive amide bands.

MAX-lab ACTIVITY REPORT 2010 97
SYNCHROTRON RADIATION – BEAMLINE 73
Johan Lindgren, department of Earth and Ecosystem Sciences, Lund University, is holding a piece of fossilized bone from a Mosasaur.Photo: Annika Nyberg

98 MAX-lab ACTIVITY REPORT 2010
SYNCHROTRON RADIATION – BEAMLINE 73
1(2)
Investigation of the spectroscopic properties of combustion generatedparticles in the mid infrared region using synchrotron radiation atMAX lab, beamline 73.
Frederik Ossler1, Linda Vallenhag1, Sophie E. Canton2, Anders Engdahl2, PerUvdal31Division of Combustion Physics, Department of Physics, Lund University, LUND, Sweden; 2MAXlab, Lund University, LUND, Sweden; 3Department of Chemical Physics ,Lund University, LUND, Sweden
The project is a study of carbon-based particles formed under different conditions of combustion and their interaction with the environment, radiation and biological systems. Structural and chemical information is obtained from the identification and composition of spectral signatures, which are related to different types of bonds, e.g., C-C, C-H, and C-O. In combustion it is mostly accepted that soot precursors are dominated by PAH, but more recent results also suggest that particle formation may be induced by more polymeric heterogeneous structures including elements of aliphatic and aromatic units and experiments have shown interesting results [1,3]. Thus the C/H ratio can be a significant indicator of the history of the soot particles. The oxidation of soot particles in the atmosphere is also important to understand. The level and the types of bonds oxygen makes to the carbon can tell us about the aging history of the soot particles. The first implications on the level of toxicity can also be obtained from a chemical analysis based on the IR-spectral properties.
4000 3500 3000 2500 2000 1500 1000 500
0.0
0.5
1.0
Abs
orba
nce
(a.u
.)
Energy (cm-1)
C B A

MAX-lab ACTIVITY REPORT 2010 99
SYNCHROTRON RADIATION – BEAMLINE 73
Experiments have been performed on diffusion-like propane Bunsen and ethylene flames. The species produced were metal plates inserted at different heights of the flames. The plates were exposed to the flame gases for different periods of time ranging from 30 seconds to 2 minutes. Samples were then extracted and cooled before being inserted into the Bruker IFS 66 spectrometer and then analyzed. Data from these measurements is currently being analyzed and will be presented during 2011. Examples of spectra obtained for different soot-related particles are shown in the figure below. One can observe the different aromatic/aliphatic content, polarity and types of oxygen bonds present. A variety of spectra are thus obtained that reflects the specific chemical and physical path that the group of molecules and particles has been subjected to in the flame. We have much more data to evaluate. More targeted experiments directed towards the understanding of the correlation between local combustion conditions and spectral properties will be performed during 2011.
References1. H. Bockhorn (Editor), “Soot formation in Combustion Mechanisms and models”,
Springer, Berlin 1994. 2. J. T. McKinnon, E. Meyer, J. B. Howard, “Infrared analysis of flame-generated PAH
samples”, Combust Flame, 105, 161, 1996. 3. G. Rusciano, G. Cerrone, A. Sasso, A. Bruno, P. minutolo, “Infrared analysis of nano
organic particles produced in laminar flames”, Appl. Phys. B, 82, 155, 2006.
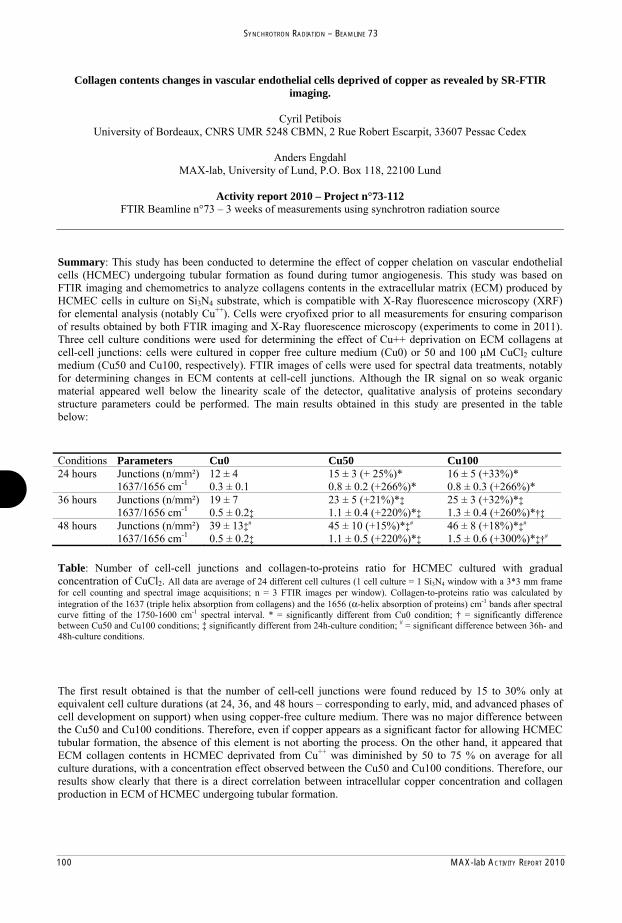
100 MAX-lab ACTIVITY REPORT 2010
SYNCHROTRON RADIATION – BEAMLINE 73
Conditions Parameters Cu0 Cu50 Cu100 24 hours Junctions (n/mm²) 12 ± 4 15 ± 3 (+ 25%)* 16 ± 5 (+33%)* 1637/1656 cm-1 0.3 ± 0.1 0.8 ± 0.2 (+266%)* 0.8 ± 0.3 (+266%)* 36 hours Junctions (n/mm²) 19 ± 7 23 ± 5 (+21%)*‡ 25 ± 3 (+32%)*‡ 1637/1656 cm-1 0.5 ± 0.2‡ 1.1 ± 0.4 (+220%)*‡ 1.3 ± 0.4 (+260%)*†‡ 48 hours Junctions (n/mm²) 39 ± 13‡# 45 ± 10 (+15%)*‡# 46 ± 8 (+18%)*‡# 1637/1656 cm-1 0.5 ± 0.2‡ 1.1 ± 0.5 (+220%)*‡ 1.5 ± 0.6 (+300%)*‡†#
Collagen contents changes in vascular endothelial cells deprived of copper as revealed by SR-FTIR imaging.
Cyril Petibois
University of Bordeaux, CNRS UMR 5248 CBMN, 2 Rue Robert Escarpit, 33607 Pessac Cedex
Anders Engdahl MAX-lab, University of Lund, P.O. Box 118, 22100 Lund
Activity report 2010 – Project n°73-112
FTIR Beamline n°73 – 3 weeks of measurements using synchrotron radiation source Summary: This study has been conducted to determine the effect of copper chelation on vascular endothelial cells (HCMEC) undergoing tubular formation as found during tumor angiogenesis. This study was based on FTIR imaging and chemometrics to analyze collagens contents in the extracellular matrix (ECM) produced by HCMEC cells in culture on Si3N4 substrate, which is compatible with X-Ray fluorescence microscopy (XRF) for elemental analysis (notably Cu++). Cells were cryofixed prior to all measurements for ensuring comparison of results obtained by both FTIR imaging and X-Ray fluorescence microscopy (experiments to come in 2011). Three cell culture conditions were used for determining the effect of Cu++ deprivation on ECM collagens at cell-cell junctions: cells were cultured in copper free culture medium (Cu0) or 50 and 100 M CuCl2 culture medium (Cu50 and Cu100, respectively). FTIR images of cells were used for spectral data treatments, notably for determining changes in ECM contents at cell-cell junctions. Although the IR signal on so weak organic material appeared well below the linearity scale of the detector, qualitative analysis of proteins secondary structure parameters could be performed. The main results obtained in this study are presented in the table below:
Table: Number of cell-cell junctions and collagen-to-proteins ratio for HCMEC cultured with gradual concentration of CuCl2. All data are average of 24 different cell cultures (1 cell culture = 1 Si3N4 window with a 3*3 mm frame for cell counting and spectral image acquisitions; n = 3 FTIR images per window). Collagen-to-proteins ratio was calculated by integration of the 1637 (triple helix absorption from collagens) and the 1656 (α-helix absorption of proteins) cm-1 bands after spectral curve fitting of the 1750-1600 cm-1 spectral interval. * = significantly different from Cu0 condition; † = significantly difference between Cu50 and Cu100 conditions; ‡ significantly different from 24h-culture condition; # = significant difference between 36h- and 48h-culture conditions.
The first result obtained is that the number of cell-cell junctions were found reduced by 15 to 30% only at equivalent cell culture durations (at 24, 36, and 48 hours – corresponding to early, mid, and advanced phases of cell development on support) when using copper-free culture medium. There was no major difference between the Cu50 and Cu100 conditions. Therefore, even if copper appears as a significant factor for allowing HCMEC tubular formation, the absence of this element is not aborting the process. On the other hand, it appeared that ECM collagen contents in HCMEC deprivated from Cu++ was diminished by 50 to 75 % on average for all culture durations, with a concentration effect observed between the Cu50 and Cu100 conditions. Therefore, our results show clearly that there is a direct correlation between intracellular copper concentration and collagen production in ECM of HCMEC undergoing tubular formation.

MAX-lab ACTIVITY REPORT 2010 101
SYNCHROTRON RADIATION – BEAMLINE 73
Figutruncafitting Thesmigrcompbetwanti-cell j Thesmicr
ure: FTIR imated at 32*32 g of spectrum c
se results rarating vascupletely the c
ween intracel-angiogenic junction and
se results wiroscopy mea
maging of hpixels, a 15X
corresponding
aise fundamular endothecell-cell juncllular coppestrategy for
d anti-MMP
ill be presenasurements w
human cerebX magnification
to the cell-cell
ental questielial cells unction and ther concentratbrain tumoragents alone
nted for pubwill have con
bral microvan (3*3 μm resl junction locat
ons about inder angioge productiontion and extrs since cope cannot abo
blication in tnfirm the abs
ascular endoolution), 256 tion as found in
nitial steps genic stress. n of ECM, btracellular mper chelatin
ort the proces
the journal Asence of Cu+
othelial cellsscans at 8 cmn the image in
of angiogenCopper de
but just delaymatrix produng agents canss of ECM p
Analytical C++ at cell-cell
s. HCMEC imm-1 spectral reso
the center.
nesis, i.e., teprivation isy the proces
uction is thunnot abort aproduction.
Chemistry ol junctions in
mages using aolution. Right,
the tubular fs not sufficiss. The correus likely to ralone the pro
once X-Ray n copper-fre
a FPA detecto, spectral curv
formation oient to aborelation foundre-define theocess of cell
fluorescenceee cultures.
or e
f rt d e -
e

102 MAX-lab ACTIVITY REPORT 2010
SYNCHROTRON RADIATION – BEAMLINE 73
Colloidal Resource
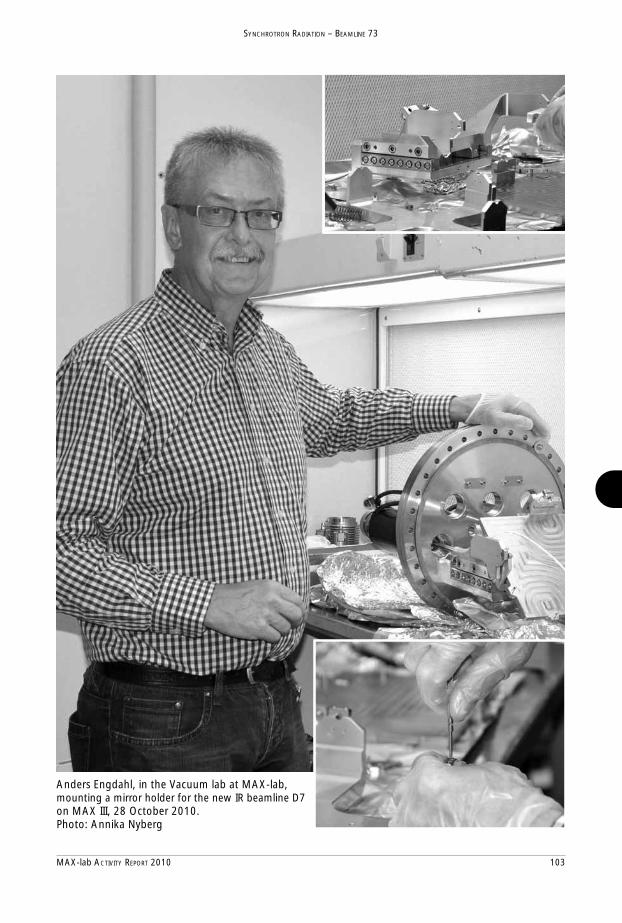
MAX-lab ACTIVITY REPORT 2010 103
SYNCHROTRON RADIATION – BEAMLINE 73
Anders Engdahl, in the Vacuum lab at MAX-lab, mounting a mirror holder for the new IR beamline D7 on MAX III, 28 October 2010.Photo: Annika Nyberg

104 MAX-lab ACTIVITY REPORT 2010
SYNCHROTRON RADIATION – BEAMLINE 73
REFERENCES [1] G. Cazzoli, L. Cludi, C. Puzzarini, P. Stoppa, A. Pietropolli Charmet, N. Tasinato, A. Baldacci, A. Baldan, S. Giorgianni, R.Wugt Larsen, S. Stopkowicz and J. Gauss. J. Phys. Chem. A. 115, 453 459 (2011)
High Resolution Far-Infrared Absorption Spectroscopy of Halogenated Hydrocarbons: Rovibrational Analysis for the 4 Band of CH79BrF2
Paolo Stoppa1, Andrea Pietropolli Charmet1, Nicola Tasinato1, Agostino Baldacci1,Alessandro Baldan1, Santi Giorgianni1 and René Wugt Larsen2
1Dipartimento di Chimica Fisica, Università Ca’ Foscari Venezia, Italy 2Department of Chemistry, University of Copenhagen, Denmark
Halogenated hydrocarbons play important roles in stratospheric ozone depletion and global warming. Since rotational and rovibrational spectroscopy are among the most widely applicable and accurate methods for remote sensing, highly accurate spectroscopic data of halocarbons in the atmospheric windows are crucial for atmospheric modeling studies. Reliable spectroscopic data for many halocarbons are still missing in the literature in particular for those involving bromine. One important species is CHBrF2 (halon 1201) which has been proposed as an interim replacement of fully halogenated halons due to its short atmospheric lifetime and good fire-suppression properties.
The infrared spectrum of CHBrF2 exhibits an extremely dense rotational structure due to both the very small rotational constants and absorption originating from cold as well as hot bands of the two abundant bromine isotopes in the natural sample (50.7/49.3% of 79/81Br). The present contribution reports the first infrared absorption spectrum of an isotopically enriched CH2D79Br sample (purity >95%). This spectrum has been obtained with a spectral resolution of 0.0025 cm 1 employing the Bruker IFS 120 HR Fourier transform infrared spectrometer with the highly brilliant MAX-I storage ring as the external radiation source. The upper far-infrared spectral region contains the fundamental band 4 at 718.77 cm 1 corresponding to the HCBr deformation mode.
The observed spectrum reveals that the 4 band is composed mainly by a-type transitions. The spectrum shows a scarcely structured Q-branch degrading towards lower wavenumbers with a noticeable line density in the P- and R-branches. In these dense P- and R-branches the spectrum shows distinct band heads separated by about 2B approximately equal to 0.20 cm 1. These absorptions consist of series of lines differing by one unit in J and each involving the almost degenerate levels with Ka
+ and (Ka + 1) , where the + and – signs correspond to even (Ka + Kc = J)and odd (Ka + Kc = J + 1) components, respectively. A typical rovibrational structure is depicted in Fig. 1, where a portion of the P-branch near 705.5 cm 1 shows the resolved lines in the qPK (J = 74
76) band heads.
The majority of assigned transitions is a-type and the maximum J and Ka values are 98 and 22, respectively. The assigned rovibrational transitions have been fitted to the A-reduced Watson-type Hamiltonian in the Ir representation, keeping the ground-state constants fixed at the values determined from the complementary microwave study of the present work [1]. The obtained rotational and centrifugal distortion constants, along with those derived for the ground state, are listed in Table 1.

MAX-lab ACTIVITY REPORT 2010 105
SYNCHROTRON RADIATION – BEAMLINE 73
Fig. 1: Rotational P-branch assignment for the 4 band of CH79BrF2 near 705.5 cm 1 showing the resolved transitions in the qPK (J = 74 – 76) band heads. The lines from degenerate levels with different values of Ka
+ and (Ka + 1) are labelled; the + and – signs of Ka refer to (Ka + Kc = J) and (Ka + Kc = J + 1), respectively.
Table 1: Spectroscopic constants (cm 1) of the ground and v4 = 1 states of CH79BrF2a.
Ground state v4 = 1
0 718.771191(120) A 0.34022500986(117) 0.34012333(173)B 0.09684740828(103) 0.096430882(163) C 0.07872615218(100) 0.078451420(92)
J 107 0.2225513(43) 0.220306(160) JK 107 0.964875(29) 0.9928(31) K 106 0.2455442(40) 0.2403(49) J 108 0.445420(20) 0.43698(98) K 106 0.1044172(87) 0.10483(37)
J 1014 0.4400(60) 0.4400 b
JK 1012 0.1538(33) 0.1538 b
KJ 1012 0.1017(120) 0.1017 b
K 1012 0.1938(93) 0.1938 b
J 1014 0.2091(30) 0.2091 b
JK 1013 0.8446(160) 0.8446 b
K 1011 0.2879(67) 0.2879 b
No. of Data 658 4225
103 0.00045 0.749 aThe quoted errors in parenthesis are one standard deviation in units of the last significant digit. bConstrained to ground-
state values.

106 MAX-lab ACTIVITY REPORT 2010
SYNCHROTRON RADIATION – BEAMLINE 73
Infrared absorption spectra of conformational mixture of 1-butene SOZ in gas and in non-equilibrated nitrogen matrices
S. Strazdaite1, M. Pucetaite1, R. Bariseviciute2, J. Ceponkus1, and V. Sablinskas1
1Department of General Physics and Spectroscopy, Vilnius University,
Universiteto str. 3, Vilnius-01513, Lithuania 2Lithuanian National Center of Physical and Applied Sciences, Savanoriu pr. 231, Vilnius-02300,
Lithuania
Secondary ozonides (SOZ) are intermediate products of ozonization reaction of alkenes,
which constantly occurs in the troposphere. The final fate of the reaction depends on several factors:
conditions of the reaction and particularly on the alkene structure. The ozonization reaction pro-
ceeds in a few steps and various unstable intermediate products of the reaction is formed. Some of
the products are not characterized yet. This is particularly true for the primary and secondary ozo-
nides, because of the short life times of these molecular species [1-2]. The intermediate products are
chemically highly reactive and actively participate in photochemical smog formation.
The intermediate products
can be stabilized carrying out ozoni-
zation reaction in laboratory condi-
tions at low temperature (T = 60 –
75 K). From the previous works at
Max-lab, we have made a conclu-
sion that gaseous 1-butene ozonide
sample consists from 4 conformers,
which slightly differ in geometry.
Present experiments are carried out
in order to find some additional ar-
guments for assigning the spectral
vibrational bands to the different
conformers of 1-butene SOZ. For
this purpose hot nozzle technique
was used. This technique allows to
form matrices with conformational equilibrium corresponding different temperatures in 300-800 K
range. The matrix spectra were combined with corresponding spectra of gaseous 1-butene SOZ.
In 1040 – 860 cm-1 spectral region of gaseous 1-butene SOZ spectral bands at 986, 977 and
965 cm-1 are clearly visible and some spectral bands are partly hidden in the slopes of these three
bands (see fig. 1). Comparison of the matrix isolation and gaseous spectra allows to assign the
Fig. 1. FTIR absorption spectra of 1-butene secondary ozonide in gaseous state (a) and in N2 solid matrix prepared using hot nozzle technique: (b) – 800 K and (c) – room temperature 300 K. Notation of the bands belonging to the different conformations is the same as in table 1. * - denotes ethene secondary ozonide spectral bands, d - denotes the bands of the decomposition products. The matrix spectra is corrected for the matrix effects by red shifting of the spectra by 18 cm-1.
880 900 920 940 960 980 1000 1020
Wavenumber, cm-1
a)
b)
c)
* III
d ?II +IV
d
I
I
n
IV II
d I
I
II +III+IV I
I
* I+II +III
Abs
orba
nce
→

MAX-lab ACTIVITY REPORT 2010 107
SYNCHROTRON RADIATION – BEAMLINE 73
References
1. R. Atkinson and J. Arey, Chem. Rev. 103, 4605-4638 (2003).
2. R. Bariseviciute, J. Ceponkus, V. Sablinskas, L. Kimtys, Journal of Molecular Structure v. 844-
845, 186-192 (2007).
Fig. 2. 1-butene secondary ozonide structures corresponding to three most stable staggered conformers found by DFT calculations performed at B3LYP 6-311++G(3df, 3pd) theory level. (a) equatorial I, τOCCC = -66.1°; (b) equatorial II, τOCCC = -177.5°; (c) equatorial III, τOCCC = 56.2°.
(a) (b)
(c)
bands to four different conformers. The assignment is in a good agreement with the results of the
theoretical calculations (see Table 1).
The calculated structures of the four conformers are presented in fig. 2. From the theoretical
calculations and from matrix experiments it can be concluded that 965 cm-1 spectral band consists
of two conformers spectral bands – the most stable conformer equatorial I and axial IV. Spectral
band 977 cm-1 belongs to second stable conformer – equatorial II and spectral band 986 cm-1 – to
third conformer equatorial III.
Table 1. DFT calculated B3LYP 6-311++G(3df, 3pd) positions (scaling factor – 0.994) and intensities of the strongest infrared spectral bands in the spectral region of the five membered ring vibrations (860 – 1040 cm-1) for four most stable staggered structures of 1-butene secondary ozonide.
equatorial gauche (≈ -60o)
I
equatorial anti II
equatorial gauche (≈ 60o)
III
axial IV Appr. vibra-
tional mode νsc*,
cm-1 I, m3*mol-1 νsc*,
cm-1 I, m3*mol-1 νsc*,
cm-1 I, m3*mol-1 νsc*,
cm-1 I, m3*mol-1
931 13 918 5 915 16 917 11 ν CO asym-metric
958 24 980 49 948 28 997 55 ν COp sym-metric
1022 24 997 12 990 59 998 7 ν CCt

108 MAX-lab ACTIVITY REPORT 2010
SYNCHROTRON RADIATION – BEAMLINE 73
Diffusion in mechanically stressed bone using infrared microspectroscopy
The interaction between mechanical load and bone growth in mammals is investigated. It is well known repeated mechanical load increases the mass and changes the morphology of the bone. Various experiments show that mechanical load directly or indirectly promote bone growth. Detailed clinical studies have been made by, e.g., Lanyon and Rubin1, and Isaksson et al.2. Models of the phenomena based on an assumed direct influence of load sometimes lead to confusing results and unexpected load rate dependences. The conclusion has been that the interplay between mechanical load and transport of nutrients and signal substances play an important role which is not covered in the existing models. In the proposed project an indirect mechanical influence is suggested (cf. Banks-Sills et al.3). The model is based on the hypothesis that the primary condition leading to bone growth is a change of the chemical environment caused by stress driven diffusion.
The most important substances that are believed to be transported through stress driven diffusion are the prostaglandins, e.g. prostaglandin E2 (PGE2), which according to results from in vivo studies stimulate osteoblast activity. An alternative could be nitric oxide (NOS) is a strong inhibitor of bone resorption through processes which decrease the recruitment of osteoclasts.
The role of stress gradients as driving forces of diffusion or other mechanisms of mass transport is studied in the present project. The long term goal is to improve medical treatment of skeletal bone fractures and disorders like e.g. osteoporosis. Nutrients and signal substances are known to move through the bone, via a system of canals, i.e., via Haversian canals and canaliculi to segments of compact bone. The motion is supposed to be a combined convective flow and diffusion, where both are belie-ved to be affected by mechanical straining. Thus, experimentally determined diffusivity and its stress sensitivity is required. In a previous study unaffected diffusion was studied using infrared microspectroscopy operating in ATR mode. As then, heavy water was selected for its visibility in the infrared spectrum. The samples were around 2.5 to 3 mm thick cross-sections of the ulna long-bone of a sheep. Three different experiments were performed. A typical series of spectra is shown in Fig. 1. First, the evaporation rates from the sample surfaces were studied for water and heavy water. The water and heavy water content at the surface was followed for fully saturated samples, that were placed
P. Ståhle1,2, I. Svensson1, W. Rehman2, L. Banks-Sills1,3, and G. Lindberg1
1 Div. of Solid Mechanics, Lund Institute of Technology, Lund University SE 221 00 Lund Sweden
2 Div. of Materials Science, Malmö University
SE 205 06 Malmo, Sweden
3 Dept. of Mechanical Engieering, Tel Aviv University Tel Aviv, Israel
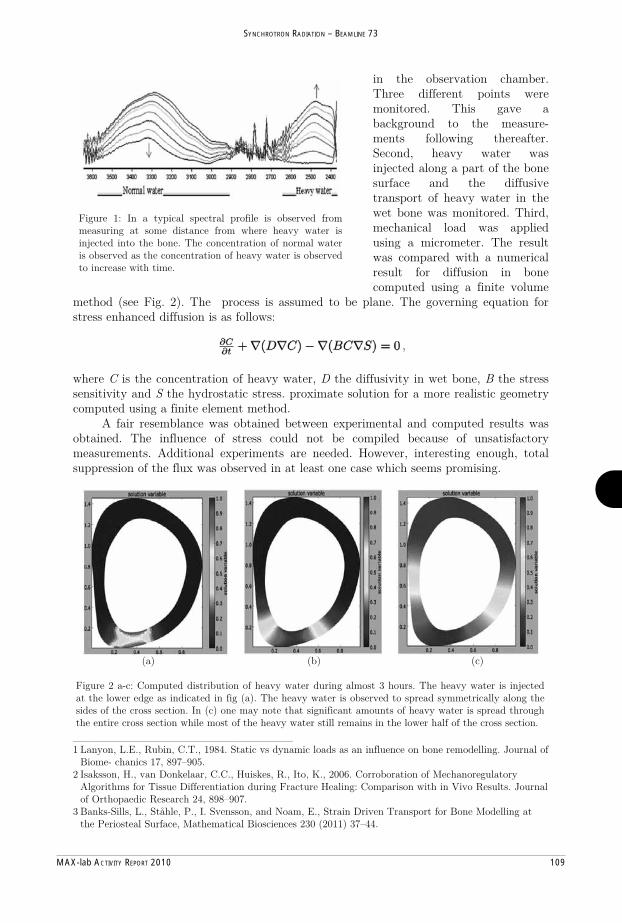
MAX-lab ACTIVITY REPORT 2010 109
SYNCHROTRON RADIATION – BEAMLINE 73
_____________________________ 1 Lanyon, L.E., Rubin, C.T., 1984. Static vs dynamic loads as an influence on bone remodelling. Journal of
Biome- chanics 17, 897–905. 2 Isaksson, H., van Donkelaar, C.C., Huiskes, R., Ito, K., 2006. Corroboration of Mechanoregulatory
Algorithms for Tissue Differentiation during Fracture Healing: Comparison with in Vivo Results. Journal of Orthopaedic Research 24, 898–907.
3 Banks-Sills, L., Ståhle, P., I. Svensson, and Noam, E., Strain Driven Transport for Bone Modelling at the Periosteal Surface, Mathematical Biosciences 230 (2011) 37–44.
in the observation chamber. Three different points were monitored. This gave a background to the measure-ments following thereafter. Second, heavy water was injected along a part of the bone surface and the diffusive transport of heavy water in the wet bone was monitored. Third, mechanical load was applied using a micrometer. The result was compared with a numerical result for diffusion in bone computed using a finite volume
method (see Fig. 2). The process is assumed to be plane. The governing equation for stress enhanced diffusion is as follows:
, where C is the concentration of heavy water, D the diffusivity in wet bone, B the stress sensitivity and S the hydrostatic stress. proximate solution for a more realistic geometry computed using a finite element method. A fair resemblance was obtained between experimental and computed results was obtained. The influence of stress could not be compiled because of unsatisfactory measurements. Additional experiments are needed. However, interesting enough, total suppression of the flux was observed in at least one case which seems promising.
(a) (b) (c) Figure 2 a-c: Computed distribution of heavy water during almost 3 hours. The heavy water is injected at the lower edge as indicated in fig (a). The heavy water is observed to spread symmetrically along the sides of the cross section. In (c) one may note that significant amounts of heavy water is spread through the entire cross section while most of the heavy water still remains in the lower half of the cross section.
Figure 1: In a typical spectral profile is observed from measuring at some distance from where heavy water is injected into the bone. The concentration of normal water is observed as the concentration of heavy water is observed to increase with time.

110 MAX-lab ACTIVITY REPORT 2010
SYNCHROTRON RADIATION – BEAMLINE I311
High quality graphene layers on commercial available cubic-SiC(001)/Si wafers: a perspective for mass production of graphene-based electronic
V.Yu. Aristov1,2, A.A. Zakharov3, O.V. Molodtsova4, O. Vilkov5, D.V. Vyalikh4, S. Danzenbächer4, C. Laubschat4, V.V. Kveder1, M. Knupfer2
1 ISSP, Russian Academy of Sciences, Chernogolovka, Moscow District 142432, Russia
2 IFW Dresden, Postfach 270116, D-01171 Dresden, Germany y
3 MAX-lab Uni Lund, Lund, Sweden
4 IFP, TU Dresden, D-01069 Dresden, Germany
5Helmholtz-Zentrum Berlin für Materialien und Energie GmbH, BESSY II, D-12489 Berlin, Germany Astonishing electronic properties of graphene make it the most promising candidate for replacing silicon in future electronic devices. A best method of graphene preparation so far, i.e. annealing of alpha-SiC bulk substrate in an inert atmosphere of argon at 900 mbar, has a dramatic improving influence on domain size and film homogeneity [1, 2]. However such graphene production on the surface of bulk alpha-SiC, although resulting in high quality graphene layers, does not meet the requirements of industrial mass-production because of the limited size and the costly nature of alpha-SiC wafers sliced from the single crystal ingots. Indeed, so far there are commercially available only alpha-SiC wafers with small size (about 2 inches in diameter), which are very expensive (about 2000 US dollars per wafer). If instead of using a bulk SiC crystal one can fabricate a graphene film onto a thin SiC film grown on a large-diameter Si wafer (SiC virtual substrate), its industrial impact would be enormous. SiC has more than 200 polytypes. However, the only polytype that grows on Si wafer is the cubic-SiC. It is their strong belief that one must utilize a proper orientation of the cubic-SiC surface in order to accommodate with the 6-fold symmetry of the graphene crystal. In this context, the 3C-SiC(111) surface is definitely the best choice, however there are no commercial available 3C-SiC(111) films on Si substrate so far. We have demonstrated already the feasibility of graphene synthesis on the surface of cubic-SiC(001) thin film (about 1 m) deposited on standard Si wafer in UHV conditions [3]. The later serves so far as the basis (substrates) for integrated circuits in microelectronics. The cubic-SiC(001) thin films (about 1 m) deposited on standard Si wafer are commercially available up to 300 mm in diameter, not expensive, are wide gap (2.3 eV) single crystal semiconductor. Therefore, such cubic-SiC(001)/Si wafer is the perfect substrate for graphene layers and graphene/cubic-SiC(001)/Si wafer could be easily adapted for graphene-based electronic technologies and thus could be directly patterned by standard Si-electronic lithographic processes. However it is well known that decomposition of SiC during annealing in UHV conditions yields graphene layers with small grains, typically 30-100 nm in diameter [1, 2]. Using LEEM we have observed similar result for graphene grown in vacuum on SiC(001) substrate. The small domain size and inhomogeneous distribution of film thickness self-evidently result from the fact that the annealing process in UHV conditions is taking place far from equilibrium. A few recent publications shows that the flak size of graphene grown in UHV on a SiC surface could not be bigger than one-two hundred nanometers [4] because the strong sublimation rate of Si in vacuum conditions prevents the carbon atoms from proper rearrangement, leading to the heterogeneity and formation of small graphene domains. Taking into account these conclusions, we have covered the outer surface by a thin film, which strongly prevent the Si sublimation in UHV annealing and have managed to substantially improve the graphene layers grown in vacuum at high temperature. The high quality of the graphene was proved by number of techniques like LEEM, PEEM, AR-PES, NEXAFS and Raman spectroscopy. Some of the results are presented in Figs 1-4.

MAX-lab ACTIVITY REPORT 2010 111
SYNCHROTRON RADIATION – BEAMLINE I311
References: [1] K.V. Emtsev et al., Nat. Mater. 8, 203 (2009). [2] M. Sprinkle et al., Phys. Rev. Lett. 103, 226803 (2009). [3] V.Yu. Aristov et al., Nano Letters 10, 992. (2010). [4] J. Hass et al., Journal of Physics: Condensed Matter, 20, 323202 (2008).
Finally we believe that our results represent a realistic way of bridging the gap between the outstanding graphene properties and their technological applications. Acknowledgements: This work was supported by the DFG under grants KN393/9 and KN393/14, by the RFBR under grant 11-02-01253. We are grateful to T. Chassagne, M. Zielinski and M. Portail (CRHEA-CNRS, Sophia Antipolice, France) for providing SiC samples.
Finally we believe that our results represent a realistic way of bridging the gap between the outstanding graphene properties and their technological applications. Acknowledgements: This work was supported by the DFG under grants KN393/9 and KN393/14, by the
Fig. 1. Electronic states in graphene on cubic-SiC(001) surface: overview ARPES intensity map taken along the K direction.
Fig. 2. Electronic states in graphene on cubic - SiC(001) surface: ARPES intensity map taken at the K point along the black dotted line.
Fig. 3. -LEED pattern from graphene on cubic-SiC(001)surface; sampling area is 1
m, electron energy is 54eV.
Fig. 4. C1s photoelectron spectrum (photon energy is h = 330eV) collected from a 10 m graphene area on cubic-SiC(001) surface.
K in etic E n erg y (eV )32 36 40 44 48
Inte
nsity
(arb
. uni
ts)
1 .0
1 .5
2 .0
2 .5
3 .0

112 MAX-lab ACTIVITY REPORT 2010
SYNCHROTRON RADIATION – BEAMLINE I311
Unconventional zwitterionic state of cysteine
Introduction: Amino acids form a particularly inter-esting class of adsorbates from a surface science pointof view. Typically, they are sufficiently small to besublimated by standard thermal methods in ultrahighvacuum (UHV), but at the same time they offer alarge chemical variability. In addition to the amineand carboxylic acid groups other chemically relevantsidegroups (OH, SH, aromatic rings) subtly influencethe properties of the molecules. This variability leadsto a large number of possible bonding geometries. Andindeed, in structural biochemistry the 20 universal aminoacids form the building blocks of an endless variety ofproteins, as their funtional groups allow them to link toone another aided by the easy formation of hydrogenbonds. The different moieties can act either as acceptorsor donors, depending on the chemical environment.
L-cysteine (HS-CH2-CH(NH2)-COOH, Fig. 1, top)offers a high degree of chemical complexity due to thepresence of three different functional groups. Furthercomplexity is added by the fact that L-cysteine mayassume both the neutral and zwitterionic forms. In thegas phase the non-ionic form is the most stable formof L-cysteine1,2, while both in aqueous solution and inthe solid state it is found in the zwitterionic state withthe carboxylic group deprotonated3,4 (Fig. 1, left). Twopolymorphs have been found for the crystal at adiabaticpressure4, and phase transitions at 70K (orthorombic)5
and 150K (monoclinic)6 have been observed. Bothtransitions are subtle and smeared out over a largertemperature range. The use of different experimentalmethods has shown that a series of small changes indihedral angles involving, amongst others, the -CH2SHsidechain can affect the hydrogen bonding network andhence the crystal structure6,7. Similarly, they report adependence on the thermal history of the crystals andon the heating/cooling velocity during experiments.
Recently, Tian and coworkers presented hydrogen-deuterium exchange and gas phase acidity measurementsalongside calculations which indicate that the thiol groupshould actually be more acidic than the carboxylic groupby 3.1 kcal/mol. Deprotonation of cysteine wouldtherefore most likely lead to a thiolate ion, even thoughthey predicted that a zwitter ion involving the thiolgroup (see Fig. 1, right) should be more unfavourableby 10.1 kcal/mol8. Multilayers grown at RT and around200 K show only the normal zwitter ion, and a ratioof zwitter ion/neutral molecule that increases withthickness, being close to 9:1 for the thickest multilayers9.
�
�
FIG. 1: Neutral and zwitterionic forms of cysteine.
Experimental: L-cysteine molecules (powder, 99.5%pure, Sigma-Aldrich) were sublimated at ∼ 120◦C for2 h, after degassing up to 120◦C for 12 h. Duringdeposition the pressure in the preparation chamberincreased to around 5×10⁻⁹ mbar (from low tens).Deposition onto a cleaned TiO2 substrate held at 100 Kwas employed to ensure a thick layer growth. After-wards, no signal from the substrate could be observed,and the layer was determined to be at least 40 A thick.All spectra were calibrated with respect to the positionof the carboxylate O 1s peak at 531.9 eV obtained forthicker films deposited at 200 K9. During measure-ments the sample was kept moving at a speed, suchthat no difference between succesive scans (of around 30sec each) was observed due to x-ray irradiation damage12.
Results: Figure 2 displays the O 1s, C 1s, N1s,and S 2p x-ray photoelectron spectra for a multilayerof L-cysteine deposited onto the TiO2(110) surface at100 K. The best fit for the C 1s spectrum is obtained byusing four components, the carboxylic carbon contribu-tion denoted by the label c, that of the amino carbonby α. The two remaining peaks imply the presenceof both carbon atoms related to hydrogen dissociatedthiol groups (Cd), as well as those bound to intactthiol groups (Cβ)
9. In the S 2p region two doublets areobserved. The high and low binding energy componentsare attributed to thiol and deprotonated thiol groups,respectively. Both carbon and sulphur spectra indicatethat 45% of the thiol groups are deprotonated.
The O 1s spectrum was curve fitted with threecomponents, which, in order from low to higher binding
E. Atamana, K. Schulteb, C. Isvoranua, J. N. Andersena,b, and J. Schnadta
a Department of synchrotron radiation research, Lund University, Swedenb MAX-lab, Lund University, P.O box 118, 22100 Lund, Sweden

MAX-lab ACTIVITY REPORT 2010 113
SYNCHROTRON RADIATION – BEAMLINE I311
FIG. 2: a) Oxygen, b) carbon, c) nitrogen and d) sulphur x-ray photoelectron spectra with component fits as indicated. Forcarbon labels, see Fig. 1.
energies, are attributed to deprotonated carboxylic,carbonyl, and hydroxyl oxygen atoms, respectively.From the intensity ratio we deduce that only 13% of allcarboxylic groups were deprotonated. We find a bindingenergy (BE) difference of 0.6 eV between the carbonyland hydroxyl oxygen peaks. In literature somewhatlarger values are reported: from 1.8 eV (amino acidmolecules, gas phase10) to 0.8 eV for glycine on Si(111)11.Hydrogen bonding, where the hydroxyl and carbonylgroups act as donors and acceptors, respectively, couldcontribute to a lowering of the BE difference. We didconsider the inclusion of a significant amount of watermolecules in the grown layer as an explanation, but theintensity ratio of the oxygen peaks to that of nitrogen,measured at the same photon energy and corrected for
flux and cross-sections, is entirely conform stoichiometry.
The low and high binding energy peaks observedin the N 1s spectrum can be attributed to photoemissionfrom the amino and protonated amino groups, respec-tively. The intensity ratio shows that the amino groupsof 57% of the molecules were protonated. When we nowlook at all the relevant percentages deduced from thesemeasurements (45% S−, 13% COO− and 57% NH+
3 )we find that a much larger fraction of the thiol groupsthan of the carboxylic groups is deprotonated. Thethiol groups must therefore act as the primary donors ofprotons to the amino groups.This means that, surprisingly, the unconventional
zwitter ion is the favoured state in this case!
1 A. Fernandez-Ramos et al., J. Mol. Struct. (Theochem)498, 191 (2000)
2 J. C. Dobrowolski, et al., J. Mol. Struct. (Theochem) 810,129 (2007).
3 E. Grunwald, et al., J. Phys. Chem 80, 1425 (1976).4 S. A. Moggach, et al., Acta Cryst. E 61, 02739 (2005).5 I. E. Paukov, Y. A. Kovalevskaya, E. V. Boldyreva,J. Therm. Anal. Cal. 93, 43 (2008).
6 H. N. Bordallo, et al., Biophys. Chem. 148, 34 (2010).7 B. A. Kolesov, V. S. Minkov, E. V. Boldyreva, and
T. N. Drebushchak, J. Phys. Chem. B 112, 12827 (2008).8 Z. Tian, A. Pawlow, J. C. Poutsma, and S. R. Kass,J. Amer. Chem. Soc. 129, 5403 (2007).
9 E. Ataman, C. Isvoranu, J. Knudsen, K. Schulte, J. N. An-dersen, J. Schnadt, Surf. Sci. 605, 179 (2011).
10 O. Plekan, et al., J. Phys. Chem. A 111, 10998 (2007).11 L. Zhang, A. Chatterjee, M. Ebrahimi, K. T. Leung,J. Chem. Phys. 130, 121103 (2009).
12 A. Cossaro, et al., J. Phys. Chem. 114, 15011 (2010).
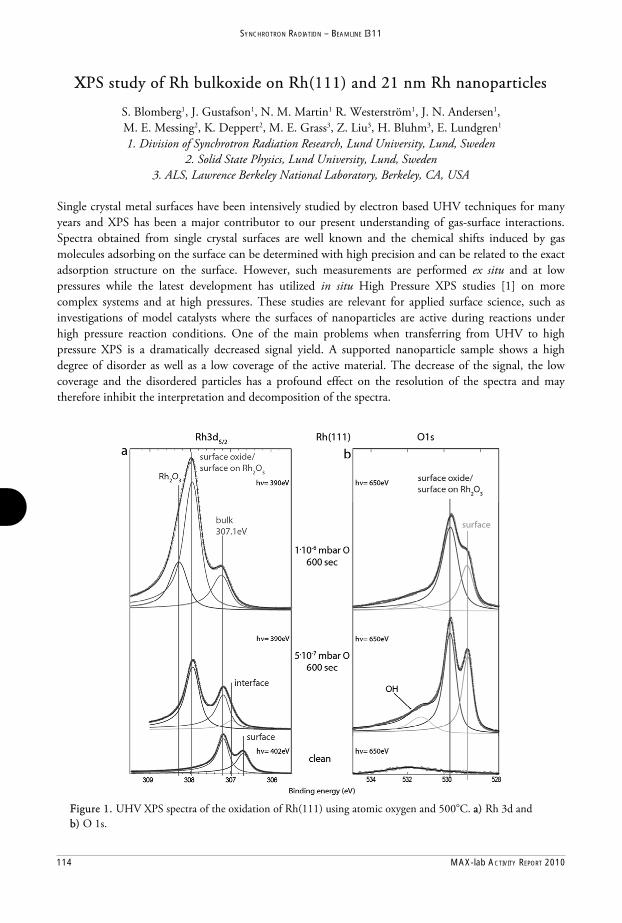
114 MAX-lab ACTIVITY REPORT 2010
SYNCHROTRON RADIATION – BEAMLINE I311
XPS study of Rh bulkoxide on Rh(111) and 21 nm Rh nanoparticles
FFigure 1. UHV XPS spectra of the oxidation of Rh(111) using atomic oxygen and 500°C. aa) Rh 3d and bb) O 1s.
XXPS study of Rh bulkoxide on Rh(111) and 21 nm Rh nanoparticles
S. Blomberg1, J. Gustafson1, N. M. Martin1 R. Westerström1, J. N. Andersen1, M. E. Messing2, K. Deppert2, M. E. Grass3, Z. Liu3, H. Bluhm3, E. Lundgren1
1. Division of Synchrotron Radiation Research, Lund University, Lund, Sweden 2. Solid State Physics, Lund University, Lund, Sweden
3. ALS, Lawrence Berkeley National Laboratory, Berkeley, CA, USA
Single crystal metal surfaces have been intensively studied by electron based UHV techniques for many years and XPS has been a major contributor to our present understanding of gas-surface interactions. Spectra obtained from single crystal surfaces are well known and the chemical shifts induced by gas molecules adsorbing on the surface can be determined with high precision and can be related to the exact adsorption structure on the surface. However, such measurements are performed ex situ and at low pressures while the latest development has utilized in situ High Pressure XPS studies [1] on more complex systems and at high pressures. These studies are relevant for applied surface science, such as investigations of model catalysts where the surfaces of nanoparticles are active during reactions under high pressure reaction conditions. One of the main problems when transferring from UHV to high pressure XPS is a dramatically decreased signal yield. A supported nanoparticle sample shows a high degree of disorder as well as a low coverage of the active material. The decrease of the signal, the low coverage and the disordered particles has a profound effect on the resolution of the spectra and may therefore inhibit the interpretation and decomposition of the spectra.
Figure 1. a)b)

MAX-lab ACTIVITY REPORT 2010 115
SYNCHROTRON RADIATION – BEAMLINE I311
RReferences [1] D.F. Ogletree, H. Bluhm, E.B. Hebenstreit, M. Salmeron, Nucl. Instrum. Methods A, 151, 6601, (2009). [2] M. E. Messing, K. A. Dick, L. R. Wallenberg and K. Deppert, Gold Bull., 20, 442, (2009). [3] J. Gustafson et al., Phys. Rev. Lett. 992 (2004) 126102
Figure 2.
In this report we compare results from UHV XPS from a Rh(111) single crystal and HPXPS from 21nm Rh nanoparticles [2]. We show that a consistent interpretation of the spectra from nanoparticles exposed to high pressure can be obtained using input from UHV based measurements and a well ordered single crystal surface.
The ex situ UHV experiments have been performed on beamline I311 at Maxlab using atomic oxygen produced by a gas cracker. Fig. 1 shows UHV XPS results from the oxidation of Rh(111). When the crystal is exposed to 5·10-7 mbar O at 500°C, the LEED pattern shows the characteristic moiré pattern, and the spectra reveal the formation of the well-known trilayer surface oxide [3]. At higher oxygen coverage the moiré pattern disappears in LEED and the Rh 3d5/2 spectrum develops a clear shoulder
towards higher binding energy indicating the formation of a Rh bulk oxide. The surface core level shifts for the surface oxide is 0.75 eV and for the bulkoxide 1.12 eV with respect to the Rh bulk. Concurrently, the overall appearance of the O 1s spectrum is broadened. The high resolution of the UHV spectra makes it possible to distinguish between these two stages of the oxidation.
The above information has been of significant importance for the interpretation of the 21 nm Rh nanoparticels spectra measured in situ at 0.1 mbar O2, see figure 2. The High Pressure XPS experiments were performed at beamline 9.3.2 at the ALS. By increasing the temperature stepwise, the oxidation of the particles can be followed. The appearance of two components in the Rh 3d5/2 spectrum shifted by 0.75 eV and 1.12 eV from the bulk Rh 3d5/2 component shows that the particles start to form a thicker oxide already at 140°C at 0.1mbar O2. Further, a well-ordered surface oxide is never observed for the particles. At a temperature of 340°C, the metal bulk component has almost disappeared and the oxide is at least a couple of layers thick.
To conclude, the information gained by the UHV high resolution XPS has been used for the decomposition of spectra obtained at higher pressures and for more complex model systems. We show that
the oxidation of the 21nm Rh particles is similar to the Rh(111) single crystal, although the bulk oxidation appears to happen at lower temperatures for the nanoparticles.
References 601
4292
FFigure 2. The Rh 3d5/2 spectra measured in-situ in0.1 mbar O2 as the temperature is increasing.
116 MAX-lab ACTIVITY REPORT 2010
SYNCHROTRON RADIATION – BEAMLINE I311
Production and characterization of PdAg aerosol nanoparticles on SiOx
S. Blomberg(1), N. M. Martin(1), J. Gustafson(1), J. N. Andersen, E. Lundgren(1), L. E. Walle(2),A. Borg(2), M. E. Messing(3), K. Deppert(3) and H. Grönbeck(4)
(1 )Div. of Synchrotron Radiation Research, Institute of Physics, Lund University, Sweden (2) Dept. of Physics, Norwegian University of Science and Technology (NTNU), Norway
(3) Div. of Solid State Physics, Lund University, Lund, Sweden (4) Competence center for catalysis, Chalmers University, Göteborg, Sweden
Due to the huge economic and environmental rewards, one major goal in catalysis related research is to create cheaper catalysts. As catalysis happens on the surface of the catalyst, one possible way to realize this would be to dilute the more expensive active material with a less costly one, providing that the active material stays at the surface. This could be achieved by using a material which is less prone to interact with the reactant gases, such as a noble metal. In most catalysts, the active material is dispersed in a high area complex oxide support as nanoparticles. In order to maintain the high activity, it would be necessary to ensure that the active material is at the surface of the nanoparticle. We have initiated a project to investigate whether this approach towards cheaper catalysts is viable. In the present contribution we report on our initial findings from attempts to produce PdAg alloy particles using an aerosol deposition technique [1, 2]. The use of PdAg is motivated by the fact that Pd segregates to the surface in the presence of a reactive gas while Ag segregates in UHV and that Ag is considerably less expensive than Pd. In Fig. 1(a) we show a Scanning Electron Microscope (SEM) image from aerosol produced PdAg particles with a diameter of 10 nm deposited on an etched SiOx substrate. To produce the PdAg particles, one Pd rod and one Ag rod were used as electrodes for the discharge sublimation of both materials with the aim to produce fully alloyed nanoparticles. It can be seen from the SEM image that the particles all have the same size, however obviously no information on the composition can be obtained. In Fig. 1(b) we show a Transmission Electron Microscope (TEM) image from a PdAg particle with a diameter of 15 nm. It can be seen that the particle has an approximately hexagonal shape as indicated, however it can also be seen that part of the particle is less well ordered marked in the upper right corner of Fig.1(b). The distance between the rows correspond to the distances between (111) planes. Unfortunately these distances are very similar for Pd and Ag (2.24 vs 2.35Å), making it difficult to distinguish wether the particle is Pd, Ag or a PdAg alloy which would have a value in between the Ag and Pd distances. The X-ray Energy Dispersive Spectroscopy (XEDS) analysis indicates that approximately 66-75% of each particle consists of Pd. However XEDS do not reveal whether the particle is an alloy or a mixed metal particle with separate Pd and Ag phases.In order to gain further information we turn to High Resolution Core Level Spectroscopy performed at I311 at Max-lab and the HPXPS beamline 9.3.2 at ALS, Berkeley. In Fig. 1(c) we show the aerosol PdAg nanoparticles (top) after oxidation using 1 mbar of O2 and reduction by CO following the cleaning procedure in Ref. [3]. For comparison is also the Ag 3d5/2 spectra from a clean Ag(110) single crystal surface (bottom), the clean Pd75Ag25(100)surface (middle) shown. The Ag 3d5/2 bulk binding energy displays a shift of almost 0.5 eV between the pure metal and the Pd75Ag25 alloy. Density Functional Theory (DFT) calculations confirm the large alloy induced Ag 3d5/2 shift. Comparing the Ag 3d5/2 bulk binding energy in Pd75Ag25(100) with the bulk Ag 3d5/2 binding energy from the PdAg particles, it is immediately clear that they are almost identical. From this observation, we therefore conclude that the aerosol PdAg alloy particles consist of a proper alloy and not Ag and Pd in separate

MAX-lab ACTIVITY REPORT 2010 117
SYNCHROTRON RADIATION – BEAMLINE I311
Referen[1] M. E[2] M. E[3] R. W
nces: E. Messing,E. Messing Westerström
K. A. Dicket al, J. Phy
m et al, Phys
k, L. R. Walys. Chem. Cs. Rev. B. In
llenberg, K.C. 114 (2010n press.
. Deppert, G0) 9257 .
Gold Bull. 442 (2009) 200.
phases.that no of CO. Pd75Ag2bulk binlevel, hoobservaPdAg pmetal. FindicatinobservaTo concwith a hcompariPd75Ag2indicatepresenc
FigureTEM imindicatePd75Ag2energyPd75Ag2
Although tsignificant Turning to
25(100) (minding energowever the
ation confirmparticles coiFurther, mong that Pd
ations from tclude we hahigh degreeison of the25(100) alloe that indeee of reactan
1 (a) SEMmage of a ed as well 25(100) andof the pur
25(100) and
the resolutioamount of AFig. 1(d) wddle) and fgy of the psurface cormed by theincides withst of the intd segregatethe Pd75Ag2ave shown e of alloyine Ag 3d5/2ows for signed the activnt gases.
M image fro15 nm largas a disor
d the aerosore metal anthe aerosol
on is lower,Ag is prese
we show thefrom the Pdure metal are level shifeory. Againh that fromtensity fromes to the 25(100) singthat it is p
ng by an aerbulk bindi
nificant conve Pd is p
m 10 nm lge PdAg padered regiol PdAg par
nd the alll PdAg parti
, the Ag 3dent at the sue Pd 3d5/2 cdAg nanopaand the alloft of the allon, the bulk m the Pd75Am the spectr
surface in gle crystal suossible to prosol dischaing energy nfidence in present at th
large aerosoarticle on aon. (c) Ag rticles. Noteoy. (d) Pdicles.
d5/2 spectra furface of thecore level farticles (topoy is less poy is opposibinding en
Ag25(100) ara originates
the preseurface. produce sizarge deposifrom the the charac
he surface
ol depositeda TEM gri
3d5/2 core e the large sd 3d5/2 core
from the pae PdAg partfrom the Pdp). Here therominent thite to that oergy of thend deviatess from a surence of CO
e selected Pition techniparticles anterization. Fof the PdA
d PdAg pard. The hex
level specshift betweee level spec
articles also ticle in the pd(100) (botte shift betwhan in the A
of the pure me Pd 3d5/2 fs from the rface relateO, consiste
PdAg nanoique. In parnd a singleFurther, ouAg particle
rticles on Sxagonal structra from Aen the bulkctra from P
indicatepresence om), the
ween the Ag 3d5/2metal, an from the pure Pd d signal, ent with
particlesrticular a e crystal ur results es in the
iOx. (b)ucture is Ag(110),k binding Pd(100),
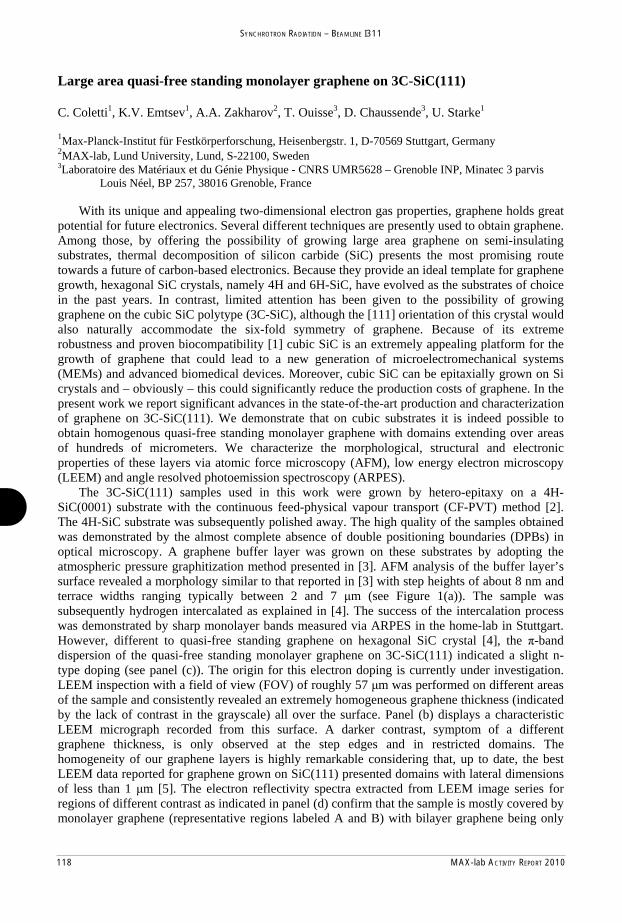
118 MAX-lab ACTIVITY REPORT 2010
SYNCHROTRON RADIATION – BEAMLINE I311
Large area quasi-free standing monolayer graphene on 3C-SiC(111) C. Coletti1, K.V. Emtsev1, A.A. Zakharov2, T. Ouisse3, D. Chaussende3, U. Starke1 1Max-Planck-Institut für Festkörperforschung, Heisenbergstr. 1, D-70569 Stuttgart, Germany 2MAX-lab, Lund University, Lund, S-22100, Sweden 3Laboratoire des Matériaux et du Génie Physique - CNRS UMR5628 – Grenoble INP, Minatec 3 parvis
Louis Néel, BP 257, 38016 Grenoble, France
With its unique and appealing two-dimensional electron gas properties, graphene holds great potential for future electronics. Several different techniques are presently used to obtain graphene. Among those, by offering the possibility of growing large area graphene on semi-insulating substrates, thermal decomposition of silicon carbide (SiC) presents the most promising route towards a future of carbon-based electronics. Because they provide an ideal template for graphene growth, hexagonal SiC crystals, namely 4H and 6H-SiC, have evolved as the substrates of choice in the past years. In contrast, limited attention has been given to the possibility of growing graphene on the cubic SiC polytype (3C-SiC), although the [111] orientation of this crystal would also naturally accommodate the six-fold symmetry of graphene. Because of its extreme robustness and proven biocompatibility [1] cubic SiC is an extremely appealing platform for the growth of graphene that could lead to a new generation of microelectromechanical systems (MEMs) and advanced biomedical devices. Moreover, cubic SiC can be epitaxially grown on Si crystals and – obviously – this could significantly reduce the production costs of graphene. In the present work we report significant advances in the state-of-the-art production and characterization of graphene on 3C-SiC(111). We demonstrate that on cubic substrates it is indeed possible to obtain homogenous quasi-free standing monolayer graphene with domains extending over areas of hundreds of micrometers. We characterize the morphological, structural and electronic properties of these layers via atomic force microscopy (AFM), low energy electron microscopy (LEEM) and angle resolved photoemission spectroscopy (ARPES).
The 3C-SiC(111) samples used in this work were grown by hetero-epitaxy on a 4H-SiC(0001) substrate with the continuous feed-physical vapour transport (CF-PVT) method [2]. The 4H-SiC substrate was subsequently polished away. The high quality of the samples obtained was demonstrated by the almost complete absence of double positioning boundaries (DPBs) in optical microscopy. A graphene buffer layer was grown on these substrates by adopting the atmospheric pressure graphitization method presented in [3]. AFM analysis of the buffer layer’s surface revealed a morphology similar to that reported in [3] with step heights of about 8 nm and terrace widths ranging typically between 2 and 7 m (see Figure 1(a)). The sample was subsequently hydrogen intercalated as explained in [4]. The success of the intercalation process was demonstrated by sharp monolayer bands measured via ARPES in the home-lab in Stuttgart. However, different to quasi-free standing graphene on hexagonal SiC crystal [4], the -band dispersion of the quasi-free standing monolayer graphene on 3C-SiC(111) indicated a slight n-type doping (see panel (c)). The origin for this electron doping is currently under investigation. LEEM inspection with a field of view (FOV) of roughly 57 m was performed on different areas of the sample and consistently revealed an extremely homogeneous graphene thickness (indicated by the lack of contrast in the grayscale) all over the surface. Panel (b) displays a characteristic LEEM micrograph recorded from this surface. A darker contrast, symptom of a different graphene thickness, is only observed at the step edges and in restricted domains. The homogeneity of our graphene layers is highly remarkable considering that, up to date, the best LEEM data reported for graphene grown on SiC(111) presented domains with lateral dimensions of less than 1 m [5]. The electron reflectivity spectra extracted from LEEM image series for regions of different contrast as indicated in panel (d) confirm that the sample is mostly covered by monolayer graphene (representative regions labeled A and B) with bilayer graphene being only

MAX-lab ACTIVITY REPORT 2010 119
SYNCHROTRON RADIATION – BEAMLINE I311
References [1] C. Coletti, M. J. Jaroszeski, et al., Conf Proc IEEE Eng Med Biol Soc. 2007, 5850-3 (2007). [2] D. Chaussende et al., Materials Science Forum Vols. 483-485 (2005) pp 225-228. [3] K.V. Emtsev et al., Nat. Mater. 8, 203 (2009). [4] C.Riedl, C. Coletti et al., Phys. Rev. Lett. 103, 246804 (2009). [5] A. Ouerghi et al, Appl. Phys. Lett. 97, 161905 (2010).
Figure 1. (a) AFM micrograph with lateral dimension of 15 m showing the morphology of a buffer layer graphene grown on SiC(111). (b) LEEM micrograph with FOV of ca. 57 m recorded with an electron energy of 19 eV. (c) Dispersion of the -bands measured with ARPES perpendicular to the K direction of the graphene Brillouin zone for quasi-free standing monolayer graphene. (d) LEEM micrograph with FOV of ca. 23 m recorded with an electron energy of 4 eV and labeled representative region A, B and C. (e) Electron reflectivity spectra measured for A, B and C (note that the curves are shifted on the y-axis for better display). In conclusion, we demonstrate that large-area quasi-free standing monolayer graphene can be produced on 3C-SiC(111) substrates and investigate its morphological, structural and electronic properties. The high quality of the graphene obtained suggests that 3C-SiC(111) might be an appealing and cost effective platform for the future development of graphene technology.
present at the step edges (region C). Notably, in the present case of graphene grown on 3C-SiC(111), the minimum indicative of quasi-free standing monolayer graphene is positioned at an energy that is roughly 2 eV lower than that characteristic of graphene grown on 4H- or 6H-SiC(0001). Also an additional peak is visible at around 6 eV, possibly imputable to the different substrate layer stacking. The areas of lighter gray contrast that are running along certain crystal orientations (region B) are clearly identified as monolayer graphene also by the LEEM intensities. Hence, the contrast difference could be caused by defects in the substrate, which might be mediated by strain.

120 MAX-lab ACTIVITY REPORT 2010
SYNCHROTRON RADIATION – BEAMLINE I311
Large area quasi-free standing trilayer graphene on SiC(0001) C. Coletti1, S. Forti1, K.V. Emtsev1, K.M. Daniels2, B.K. Daas2, M.V.S. Chandrashekhar2, A.A. Zakharov3, U. Starke1 1Max-Planck-Institut für Festkörperforschung, Heisenbergstr. 1, D-70569 Stuttgart, DE 2University of South Carolina, 301 S. Main St, Columbia, SC 29208, USA 3MAX-lab, Lund University, Lund, S-22100, SE
Graphene epitaxially grown on SiC substrates is an appealing candidate for a wide variety of electronic applications, provided that large area, charge neutral layers can be produced. We have recently reported that hydrogen intercalation can be used to obtain technologically promising undoped quasi-free standing monolayer and bilayer graphene [1]. The growth of large area homogenous domains of trilayer graphene on SiC(0001) is indeed challenging as evident from the scarce amount of experimental data that can be found literature. At present steps required aim towards the production of high quality trilayer graphene so that its electronic properties can be experimentally investigated. In this work we demonstrate that by intercalating hydrogen we can obtain large-area undoped quasi-free standing trilayer graphene on SiC(0001). The structural and electronic properties of these layers are studied via low energy electron microscopy (LEEM) and angle resolved photoemission spectroscopy (ARPES). Bilayer graphene was initially grown on semi-insulating hexagonal SiC(0001) substrates using the process described in [2]. The morphology of the obtained graphene was monitored via atomic force microscopy: well-ordered atomically flat surfaces not affected by step-bunching and presenting terraces as large as a few hundreds of nanometers could be observed. Subsequently, H-intercalation was performed at the home-lab in Stuttgart as described in [1]. The structural properties of the intercalated sample were studied via LEEM using the ELMITEC3 instrument at the end-station of beamline I311 at MAX-LAB. Figure 1(a) shows a characteristic LEEM micrograph with a field of view (FOV) of 15 m for a hydrogen intercalated bilayer. At the reported energy of 1.2 eV, regions of different graphene thickness can be distinguished by the differences in reflected intensity. Even if surface domains with three different grayscale contrasts can be identified, the sample is highly homogeneous with light-gray and dark-gray domains occupying only a small amount of the overall area. The number of dips in the electron reflectivity spectra in panel (d) identifies the dark-gray and the light-gray regions as bilayer and tetralayer graphene, respectively [3]. The majority of the area is indeed covered by quasi-free standing trilayer graphene. Subsequently the sample was annealed in a stepwise fashion to gradually remove the hydrogen and hence gain insight on the desorption dynamics. After annealing above 900 °C the hydrogen starts to desorb at the edges of the atomic steps of the surface. In panel (b) the terrace structure of the surface is drastically emphasized by the additional dark-grey contrast present at the step edges which indicates how these regions have already transformed into as-grown bilayer graphene. By annealing at temperatures higher than 1100 °C the hydrogen completely desorbs as suggested by the reversed contrast in the LEEM micrograph in panel (c). The electron reflectivity spectra reported in panel (e) confirm that the sample is now for a large percentage covered by bilayer graphene.
The same sample was again hydrogen intercalated and measured via ARPES at the end-station of the SIS beamline at the Swiss Light Source synchrotron facility. The ARPES spectra reported in Figure 2 were measured perpendicular to the K direction of the graphene Brillouin zone with a photon energy of 90 eV. An extremely sharp electronic band structure could be measured for the quasi-free standing trilayer graphene after outgassing between 400 °C and 600 °C (Figure 2(a)). Similar to what observed for hydrogen intercalated mono- and bilayer graphene, also quasi-free standing trilayer graphene appears to be initially slightly p-type doped. The high quality of the measured band structure allows for a precise identification of the trilayer stacking sequence. By comparing the experimental bands with those theoretically calculated for graphene trilayer [4] it can be concluded that in this sample

MAX-lab ACTIVITY REPORT 2010 121
SYNCHROTRON RADIATION – BEAMLINE I311
both domains with Bernal (ABA) and rhombohedral (ABC) stacking are present. As reported in [1], also in this case subsequent annealing at higher temperatures yields charge neutrality within a few meV (see panel (b)). Complete desorption of hydrogen reveals sharp bilayer bands (panel (c)) confirming that the small percentage of domains of different thicknesses observed via LEEM does not cause significant contributions to the measured band structure.
Figure 1. LEEM micrographs with FOV of 15 m recorded with an electron energy of 1.2 eV for the same area of (a) quasi-free standing trilayer graphene annealed at 400 °C, (b) annealed at above 900 ° and (c) at above 1100 °C. The electron reflectivity spectra measured for the regions of different contrast labeled in panel (a) and (c) are reported in panels (d) and (e), respectively. In conclusion, we report on the structural and electronic properties of quasi-free standing trilayer graphene. LEEM analysis shows homogenous trilayer domains on areas of tens of squared micrometers and yields to the estimate that at least 90% of the sample is covered by three layers of graphene. High resolution ARPES provides evidence that quasi-free standing trilayer graphene can reach, upon UHV annealing, charge neutrality within a few meV. Moreover, thanks to the high homogeneity of the sample, the electronic structure of Bernal and rhombohedral stacking could be experimentally measured with high resolution.
Figure 2. Dispersion of the -bands measured with ARPES perpendicular to the K direction of the graphene Brillouin zone for (a) quasi-free standing trilayer graphene after annealing at 600 ° , (b) at 700 °C and (c) after complete hydrogen desorption. References [1] C.Riedl, C. Coletti et al., Phys. Rev. Lett. 103, 246804 (2009). [2] http://arxiv.org/ftp/arxiv/papers/1010/1010.4080.pdf [3] H. Hibino, H. Kageshima et al., Phys. Rev. B 77, 075413 (2008). [4] http://arxiv.org/PS_cache/arxiv/pdf/0806/0806.2792v4.pdf

122 MAX-lab ACTIVITY REPORT 2010
SYNCHROTRON RADIATION – BEAMLINE I311
Adsorption and decomposition of Alanine on Ni{111}
A. Cornish1, R. E. J. Nicklin1, A. Shavorskiy1, K. Schulte2, G. Held1 1 Department of Chemistry, University of Reading, Whiteknights Campus, Reading, RG6 6AD, UK.
2MAXLAB, Lund University,P.O. Box 118, S-221 00 Lund, Sweden
The ability to selectively produce just one enantiomer of product is very desirable industrially, especially in the area of pharmaceuticals where two enantiomers can have vastly different therapeutic properties. Enantioselective catalysis allows the multiplication of chirality; large quantities of a chiral product can be synthesised using a catalytic amount of a chiral source. Stereochemical control can be induced on a non-chiral metal surface by the adsorption of a chiral auxiliary. For example the hydrogenation of -ketoesters over nickel catalysts can be stereochemically controlled by modifying the catalyst with alanine [1]. These reactions have been optimised to give enantiomeric excess values near to 100% [2]. Several mechanisms have been suggested to account for the observed stereoselectivity but none have been proven.
In this experiment L-alanine was evaporated in UHV onto a clean Ni{111} single crystal. By performing this experiment in UHV the adsorption behaviour of alanine on this surface can be closely monitored unlike more complicated solution based studies. The Ni{111} surface was chosen because this is the most abundant surface termination found on supported Ni nanoparticles used in catalysis.
This experiment was performed on beamline I311 on MAX II. XPS (X-ray photoemission spectroscopy) was used to determine the coverage and to investigate the adsorption. The resolution of the spectra was calculated to be 0.6 eV. TP-XPS (temperature programmed XPS) was used to monitor changes in the structure and bonding and ultimately the desorption/decomposition routes of alanine. NEXAFS (near edge X-ray absorption fine structure) at the oxygen and nitrogen K-edges was recorded at three angles of incidence to determine the geometry with respect to the surface.
Alanine was found to adsorb onto Ni{111} (sample held at 250 K) as an intact molecule, as indicated by the XPS spectra in figure 1. In the O1s region, figure 1(b), only one peak is present indicating that both oxygen atoms are in the same chemical environment and hence that the carboxylate group is deprotonated. Both oxygen atoms make bonds to the Ni surface. The larger peak at 285.8 eV in the C1s XPS spectrum, figure 1(c), is due to the two alkyl carbon atoms and the smaller peak at higher binding energy is due to the carboxylate carbon. At this temperature, two peaks are observed in the N1s region with approximately equal intensity (1.00:1.05 on the lower binding energy side). For lower coverages, two peaks are also observed but the peak at lower binding energy is more intense. This suggests that there are two alanine species on the surface that differ only by the state of the N atom. The signal at 399.3 eV is due to a neutral NH2 group whereas the signal at 401.5 eV is due to the zwitterionic form of the molecule, which involves an NH3
+ group. Upon heating this layer, figure 1(a), there is some conversion from the zwitterionic form to the neutral NH2 form. After 345 K, there is no zwitterionic form left on the surface and a new peak appears at a binding energy of 397.5 eV. This peak is due to a decomposition product of alanine, most likely a CNHx species. This signal disappears after annealing to 700 K at which point the O1s and C1s signals have also disappeared. On

MAX-lab ACTIVITY REPORT 2010 123
SYNCHROTRON RADIATION – BEAMLINE I311
Figure 2
[3-6]. Astarting O-C-O t
[1] [2] [3] [4] [5] [6]
NEXAFS spe
Oxygen NEA sharp *-res
at 535 eV. Btriangle with
C. J. BaddelM. Keane, LG. Jones, L. M. J. GladysT. Eralp, A. T. Eralp, A.
ectra at the O
XAFS allowsonance can
By measuringrespect to th
ley, Topics inLangmuir, 19
B. Jones, et s, A. V. StevShavorskiy,Shavorskiy,
K-edge at two
ws us to detebe seen in f
g the angularhe surface wa
n Catalysis, 2994. 10: 4560
al. (2006). Svens, et al. (2 et al. (2010) et al. (2010)
o angles of in
ermine the ofigure 2 at 53r dependenceas calculated
2003. 25(1-40-4565. Surface Scien2007). Journa). Langmuir). Langmuir
cidence after
orientation of32 eV, and ae of the *-red to be appro
4): 17-28.
nce 600(9): 1al of Physica26(13): 109126(24): 1884
a low dose of
f the carboxya broad peaksonance inteximately 55
1924-1935. al Chemistry 18-10923. 41-18851.
f L-alanine on
ylate O-C-Ok due to -reensity the ang
.
B 111: 8331
Ni{111}
O triangle sonances gle of the
1-8336.
Inte
nsity
/ Arb
. uni
ts
2.5
2.0
1.5
1.0
0.5
0.0
53530P
54035Photon ene
06
545ergy/ eV
° Normal 5° Grazing
55550
incidenceincidence
55
the Cu{NH2 gro
Figure 1layer on N
110} and {53oup [3,4].
(a) TP-XPS inNi{111} at a s
31} surfaces
n the N1s regsample tempe
, alanine was
ion (b) XPS serature of 250
s only found
spectrum in thK. All record
d to exist in a
he O1s regionded at normal e
a deprotonate
(c) C1s regionemission.
ed state with
n of a saturate
a neutral
ed alanine

124 MAX-lab ACTIVITY REPORT 2010
SYNCHROTRON RADIATION – BEAMLINE I311
Konstantin Emtsev, Alexei Zakharov*, Camilla Coletti, Stiven Forti and Ulrich Starke
Max Planck Institute for Soild State Research, Heisenbergstr. 1, 70569 Stuttgart, Germany
*MAX-Lab, Lund University, Lund, S-22100, Sweden
Epitaxial graphene (EG) grown on SiC single crystal wafers appears to be a suitable candidate for graphene based electronics [1-3]. For further implementations it is, however, required to be able to control the electronic and structural properties of EG which are predominantly governed by the heterointerface with the substrate. Generally, solid heterointerfaces are quite difficult to influence since they remain inaccessible after growth. The heterointerface graphene-SiC(0001) is unique as its electronic properties can be manipulated on an atomic scale. For example, hydrogen can be used to passivate interface states [4]. Alternatively, the interface can be modified by atomic intercalation. We prepared quasi-free standing epitaxial graphene on SiC(0001) by intercalating atomically thin germanium film underneath the (6 3×6 3)R30°-reconstructed interface layer. The latter consists of a carbon layer with graphene-like topology and bond lengths but with strong covalent bonds to the SiC substrate [5]. These bonds are broken upon in-diffusion of Ge atoms to the interface so that the C-layer is structurally decoupled from the SiC surface. This leads to a complete recovery of the electronic structure of graphene (compare Fig. 1(a) and (b)). Depending on the annealing temperature graphene exhibits moderate p- or n-doping (Fig. 1(b-d)). Interestingly, an intermediate stage shown in Fig 1(c) is characterized by the coexistence of the p- and n-doped graphene regions, i.e. at this stage the surface splits into lateral graphene p-n junctions. In the present work the formation of graphene p-n junctions was studied in situ by low energy electron microscopy (LEEM) and photoelectron microscopy (PEEM) at the beamline I311.
In Fig. 2(a) we show the LEEM micrograph of the initial quasi-free standing graphene layer (p-phase, see Fig. 1(b)) obtained after intercalation of germanium. The graphene layer is quite homogeneous and covers the entire surface. Graphene domains are determined by the size of the SiC substrate terraces, that is, of the order of 3-5 μm in width.
Initial and later stages of the n-doped graphene phase formation are presented in Fig. 2(b) and in Fig. 3, respectively. The corresponding PEEM image in Fig. 3(b) reveals a significant contrast in intensity of the Ge 3d core level signal for the two graphene phases. Contrast in PEEM is determined by the concentration of Ge atoms located beneath the epitaxial graphene layer and coincides with the contrast obtained in LEEM. Apparently, the n-phase is induced upon a partial desorption of germanium from under the surface, i.e. partial deintercalation. Surprisingly, the process is not initiated at the step edges but rather on the terraces (see Fig. 2(b)). This leads to the formation of n-doped induced graphene islands with the size as small as 100 nm embedded into the p-doped graphene sheet. With further annealing the islands grow in size and coalesce forming extended n-doped graphene areas. We would like to comment that Ge atoms are mobile at quite low temperatures and the eventual pattern of p-n areas might depend on the cooling speed.
Microscopic study of quasi-free standing epitaxial graphene and graphene p-n junctions formed on SiC by atomic intercalation of germanium

MAX-lab ACTIVITY REPORT 2010 125
SYNCHROTRON RADIATION – BEAMLINE I311
[1] P.N. First et al., MRS Bulletin, 35, 296 (2010) [2] Y.-M. Lin, et al. Science, 327, 662 (2010) [3] K.V. Emtsev, A. Bostwick, K. Horn, et al. Nature Materials 8, 203-207 (2009). [4] C. Riedl, C. Coletti, T. Iwasaki, et al. Phys. Rev. Lett. 103, 246804 (2009). [5] K.V. Emtsev, F. Speck, Th. Seyller, L. Ley, J.D. Riley, Phys. Rev. B 77, 155303 (2008).
Fig. 1. Photoemission valence band maps (energy vs electron momentum) in the vicinity of the K-point (k=0) of the graphene Brillouin zone taken from: (a) the (6 3×6 3)R30° surface and after deposition of 5 ML of Ge followed by vacuum annealing at (b) T=720°C, (c) 820°C, and (d) 920°C. The photon energy was 90 eV.
(a)
(b)
Fig. 2. LEEM micrographs of the quasi-free standing graphene layer obtained by intercalation of Ge atoms at the interface with SiC(0001) surface: (a) homogeneous p-doped graphene phase, and (b) initial stage of the graphene p-n junction formation. Dark inclusions in (b) correspond to the n-doped graphene islands embedded into the p-doped graphene.
(a)
(b)
Fig. 3. (a) - LEEM micrograph and (b) - PEEM Ge3d intensity map of the graphene p-n coexistence stage (see also Fig. 1(c)). Bright (dark) regions in (a) correspond to p-doped (n-doped) quasi-free standing graphene regions.

126 MAX-lab ACTIVITY REPORT 2010
SYNCHROTRON RADIATION – BEAMLINE I311
Oxidation of metal nanoparticle arrays
Luca Gragnaniello, Svetlozar Surnev, Teng Ma, Falko P. Netzer
Institute of Physics, Surface and Interface Physics, Karl-Franzens University Graz, A-8010 Graz, Austria
The emergent phenomena in ordered arrays of surface supported oxide quantum dots represent a new challenge in nanoscience. An equally challenging endeavour is the fabrication of such nanodot model systems. Here we report the successful creation of a system of ordered oxide nanodots by using the directed assembly of metallic nanodots on a nanostructured surface followed by a morphology conserving oxidation process. The system of study has been Ni-oxide nanodots on an alumina thin film substrate. The ultra-thin alumina substrate has been prepared by controlled high-temperature oxidation of a Ni3Al(111) single crystal surface, following the recipe detailed in the literature [1-3]. The complex AlOx structure [1] provides an ordered lattice of hole sites, which act as anchoring sites for the Ni nanodots condensing them into a regular superlattice with 4.2 nm dimensions. The oxide nanoparticle superlattices have been prepared according to a two step process: (i) self-assembly of metal nanoparticles on the AlOx/Ni3Al(111) substrate; (ii) oxidation of the metal nanoparticles under preservation of their nanoscale ordering. Nanodot arrays of Ni clusters have been formed by PVD at 473K on to the alumina template, using a “seeding” procedure [1, 3], in which Pd seeds promote metal cluster nucleation. The final and crucial step in the preparation is the oxidation of the metal nanoparticles under preservation of their ordered nanoscale morphology. Using Scanning Tunneling Microscopy, we have demonstrated in our laboratories that a morphology conserving oxidation procedure is possible and that the resulting NiOx nanodots form a highly regular superlattice. This is illustrated in Fig. 1. In the panel (a) a STM image of the Ni clusters on AlOx/Ni3Al(111), after exposure to 1x10⁻⁶ mbar O2 partial pressure at 470K for 15 min, is presented. The regular periodicity of the clusters is highlighted by the auto-correlation image depicted in the panel (b). The nanodots form a hexagonal superlattice with a periodicity of 4.2 nm. The chemical identity of the oxidation products in terms of oxidation state has been investigated by high-resolution X-ray photoemission spectroscopy (HR-XPS) with the use of synchrotron radiation at MAX-Lab, beamline I311. Fig. 2 shows the core level spectra of Ni 2p3/2 from 0.1nm Ni clusters (nominal deposition amount) on the alumina film on Ni3Al(111) after the exposure to 180L of oxygen at 470K. The top spectrum represents the measurement
at normal emission. Besides the metallic Ni0 peak, an oxide Ni2+ component is present with its satellite S, indicating a NiO stoichiometry [4]. In order to explore whether the metal nanoparticles can be converted completely into oxide particles or whether a metallic core remains, we have performed measurements as a function of the emission angle with respect to the normal direction. Increasing the angle, the contribution of the surface with respect to the bulk rises. In the present case, the oxide component significantly increases with
Fig.1: (a) STM image (100x100 nm2) of Ni clusters on the alumina film on Ni3Al(111) after exposure to 1x10⁻⁶ mbar O2 partial pressure at 470K for 15 min; (b) auto-correlation plot of the image (a) to highlight the order of the clusters, with a periodicity of 4.2 nm.
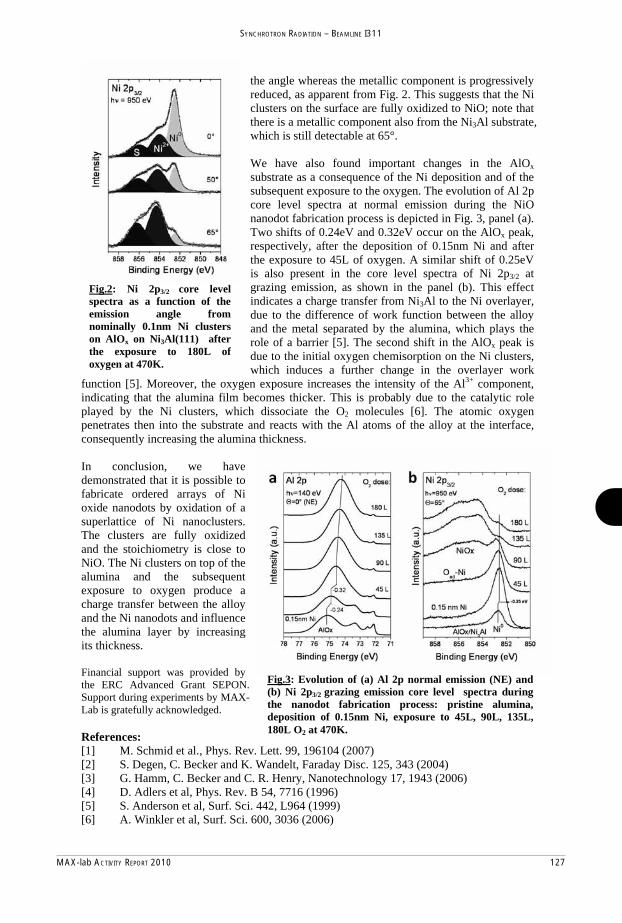
MAX-lab ACTIVITY REPORT 2010 127
SYNCHROTRON RADIATION – BEAMLINE I311
the angle whereas the metallic component is progressively reduced, as apparent from Fig. 2. This suggests that the Ni clusters on the surface are fully oxidized to NiO; note that there is a metallic component also from the Ni3Al substrate, which is still detectable at 65°. We have also found important changes in the AlOx substrate as a consequence of the Ni deposition and of the subsequent exposure to the oxygen. The evolution of Al 2p core level spectra at normal emission during the NiO nanodot fabrication process is depicted in Fig. 3, panel (a). Two shifts of 0.24eV and 0.32eV occur on the AlOx peak, respectively, after the deposition of 0.15nm Ni and after the exposure to 45L of oxygen. A similar shift of 0.25eV is also present in the core level spectra of Ni 2p3/2 at grazing emission, as shown in the panel (b). This effect indicates a charge transfer from Ni3Al to the Ni overlayer, due to the difference of work function between the alloy and the metal separated by the alumina, which plays the role of a barrier [5]. The second shift in the AlOx peak is due to the initial oxygen chemisorption on the Ni clusters, which induces a further change in the overlayer work
function [5]. Moreover, the oxygen exposure increases the intensity of the Al3+ component, indicating that the alumina film becomes thicker. This is probably due to the catalytic role played by the Ni clusters, which dissociate the O2 molecules [6]. The atomic oxygen penetrates then into the substrate and reacts with the Al atoms of the alloy at the interface, consequently increasing the alumina thickness. In conclusion, we have demonstrated that it is possible to fabricate ordered arrays of Ni oxide nanodots by oxidation of a superlattice of Ni nanoclusters. The clusters are fully oxidized and the stoichiometry is close to NiO. The Ni clusters on top of the alumina and the subsequent exposure to oxygen produce a charge transfer between the alloy and the Ni nanodots and influence the alumina layer by increasing its thickness. Financial support was provided by the ERC Advanced Grant SEPON. Support during experiments by MAX-Lab is gratefully acknowledged. References: [1] M. Schmid et al., Phys. Rev. Lett. 99, 196104 (2007) [2] S. Degen, C. Becker and K. Wandelt, Faraday Disc. 125, 343 (2004) [3] G. Hamm, C. Becker and C. R. Henry, Nanotechnology 17, 1943 (2006) [4] D. Adlers et al, Phys. Rev. B 54, 7716 (1996) [5] S. Anderson et al, Surf. Sci. 442, L964 (1999) [6] A. Winkler et al, Surf. Sci. 600, 3036 (2006)
Fig.2: Ni 2p3/2 core level spectra as a function of the emission angle from nominally 0.1nm Ni clusters on AlOx on Ni3Al(111) after the exposure to 180L of oxygen at 470K.
Fig.3: Evolution of (a) Al 2p normal emission (NE) and (b) Ni 2p3/2 grazing emission core level spectra during the nanodot fabrication process: pristine alumina, deposition of 0.15nm Ni, exposure to 45L, 90L, 135L, 180L O2 at 470K.

128 MAX-lab ACTIVITY REPORT 2010
SYNCHROTRON RADIATION – BEAMLINE I311
Gas adsorption on Pt clusters supported by graphene
E. Grånäs1, J. Knudsen1, T. Gerber2, P J. Feibelman3, K. Schulte4, P. Stratman2, C. Busse2, T. Michely2, and J. N. Andersen1
1Division of Synchrotron Radiation Research, Department of Physics, Lund University, Box 118, 221 00 Lund, Sweden
2II. Physikalisches Institut, Universität zu Köln, 50937 Köln, Germany3Sandia National Laboratories, Albuquerque, New Mexico 87185-1415, USA
4MAX-lab, Lund University, Box 118, 221 00 Lund, Sweden
Single crystal surface studies do not fully capture the complexity of supported nanoparticles found in real catalysts. For example the adsorption properties can depend on both the size and shape of the active nanoparticle. To bridge this material gap more complex model systems such as well-characterized in-situ deposited nanoparticles can be used, but with these systems new problems arise. Often, the particles have a broad distribution of size and shape, making it difficult to correlate the adsorption properties unambiguously to the atomic structure of the nanoparticles with averaging techniques. Metal nanoparticles grown on a graphene/Ir(111) moiré film, however, show exceptionally well ordered arrays with a narrow size distribution [1, 2], thus making them an ideal model system for adsorption studies.
Here we present the first results of our studies of the interaction between Pt-cluster and the supporting graphene layer, and the effects of CO adsorption using photoemission X-ray spectroscopy (XPS) and density functional theory (DFT) calculations [3].
Figure 1 shows the C 1s spectra for the pristine graphene (black), after deposition of 0.18 ML Pt (dark grey), and after adsorption of 10 L CO (light grey). For the pristine graphene film a single peak at 284.15 eV is observed. After Pt-deposition we observe a broad shoulder shifted 0.3-1.1 eV with respect to the C 1s peak from pristine graphene. DFT calculations reveal that this shoulder is due to carbon atoms displaced towards the Ir(111) surface and positioned below and in the vicinity of the clusters. Aschematic drawing of the graphene film before (a) and after Pt-deposition (b) is shown in figure 2 with the atoms assigned to the shoulder component highlighted.
Upon CO adsorption the Pt-induced shoulderdiminishes in the C 1s spectrum (light grey curve in figure 1). We interpret this as
Figure 1: The C 1s photoemission spectra for thepristine graphene film (black), after deposition of 0.18ML of Pt (gray), and after adsorption of 10 L CO (lightgrey). Notice the log-scale!

MAX-lab ACTIVITY REPORT 2010 129
SYNCHROTRON RADIATION – BEAMLINE I311
References:
[1] A. T. N'Diaye, S. Bleikamp, P. J. Feibelman, et al., Physical Review Letters 97 (2006)[2] A. T. N'Diaye, T. Gerber, C. Busse, et al., New Journal of Physics 11 (2009)[3] J. Knudsen, P. J. Feibelman, T. Gerber, E. Grånäs et al. (in manuscript)[4] Wang et al. PRL 95, 256102 (2005) [5] Björnholm et al., Surf. Sci. 315 L983 (1994)
unpinning of the graphene film when CO adsorbs on the clusters. We also observe a newfeature at 286.3 eV, coinciding with the peak position reported for CO adsorbed atop of stepson Pt(322) [4].
Consistent with atop CO adsorption the O 1s spectrum after CO exposure, shown in fig. 3, has its main peak positioned at 532.4 eV, agreeing well with the position reported for a top adsorption of CO on Pt(111) [5]. A schematic drawing of the unpinning and CO adsorption is shown in figure 2 c.
Figure 3: The O 1s spectrum after deposition of 0.2ML Pt and subsequent adsorption of 10 L CO.
Figure 2: Schematic drawings of a) pristine graphene on Ir(111), b) Pt-cluster on graphene,and c) CO adsorption on the Pt-clusters.

130 MAX-lab ACTIVITY REPORT 2010
SYNCHROTRON RADIATION – BEAMLINE I311
The effect of Au particles on the morphology and Ga droplet dynamics on the
GaP(111)B surface
Emelie Hilner1, Alexei A. Zakharov2, Erik Mårsell1, Rainer Timm1, Jesper N. Andersen1,
Edvin Lundgren1 and Anders Mikkelsen1
1Department of Physics, Lund University, Box 118, 22100 Lund, Sweden
2MAX-lab, Lund University, Box 118, 22100 Lund, Sweden
We have found that Au nano particles (50-100 nm diam., 0.1-1/μm2) affects the surface morphology of GaP(111)B. This changes the dynamics of the self-propelled Ga droplets that form on the surface when annealing above the maximum temperature for congruent evaporation.
After deoxidation at around 600°C and cooling down of GaP(111)B with Au particles, patches that appear bright for certain electron beam energies in low energy electron microscopy (LEEM) are observed (fig. 1A). Low energy electron diffraction patterns from micrometer sized areas (μ-LEED) within and outside the patches were recorded. The μ-LEED pattern from the dark area outside the patches indicates a high density of pyramid shaped crystallites (fig 1B) which we have seen also on the clean GaP(111)B surface after oxide desorption [1]. The μ-LEED pattern from the bright patches is that of the so called Hattori reconstruction which indicates a low density of crystallites (fig 1C). In each bright patch there is at least one Au particle which appears as bright spots in UV-PEEM (inset of fig 1A). We therefore believe that the Au particles enhance the evaporation of pyramid shaped crystallites in their close vicinity.
Further annealing above the temperature for congruent evaporation leads to the formation of Ga droplets. On the clean surface these self-propelled droplets move all in the same direction up the steps introduced by the wafer miscut [2]. It is energetically favourable for the droplets to cover as many step sites as possible and the droplets will become pinned to the steps. The steps move faster under the droplet as the rate of evaporation is enhanced there and the droplet will follow as the steps move. When the steps are arranged along a particular direction across the sample the droplets will all move in this direction. The pyramid shaped crystallites also evaporate faster under the droplets and a trail of smooth well ordered surface is found where the droplets have passed.
On the surface with Au particles where the density of pyramid shaped crystallites is not homogenous as on the clean surface it is more energetically favourable for the droplets to sit on an area with many pyramids. If a droplet is sitting on the boundary between an area with few and an area with many pyramids it will feel a force towards the area with more pyramids. The balance between the force from the moving steps and the force towards areas with a
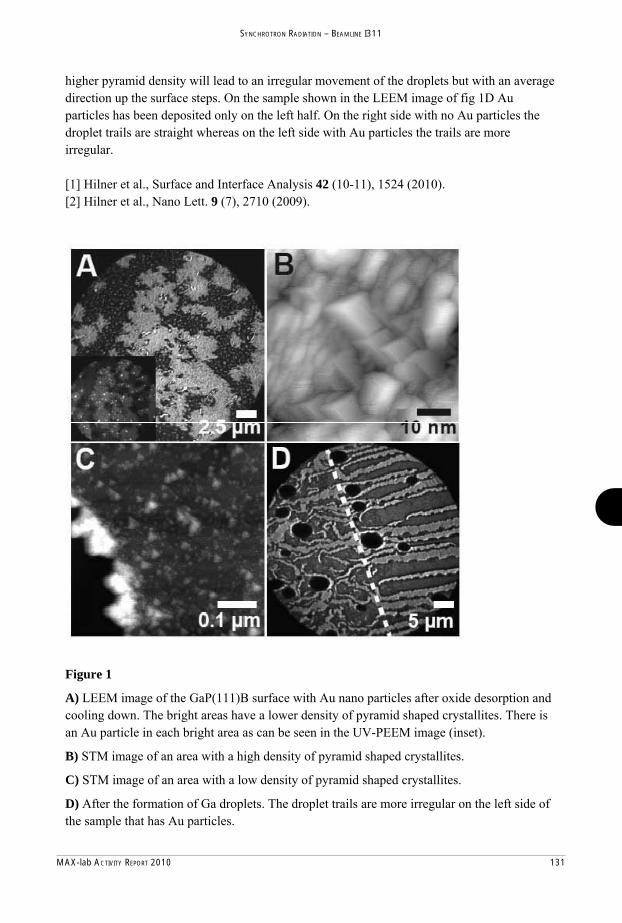
MAX-lab ACTIVITY REPORT 2010 131
SYNCHROTRON RADIATION – BEAMLINE I311
higher pyramid density will lead to an irregular movement of the droplets but with an average direction up the surface steps. On the sample shown in the LEEM image of fig 1D Au particles has been deposited only on the left half. On the right side with no Au particles the droplet trails are straight whereas on the left side with Au particles the trails are more irregular.
[1] Hilner et al., Surface and Interface Analysis 42 (10-11), 1524 (2010).[2] Hilner et al., Nano Lett. 9 (7), 2710 (2009).
Figure 1
A) LEEM image of the GaP(111)B surface with Au nano particles after oxide desorption and cooling down. The bright areas have a lower density of pyramid shaped crystallites. There is an Au particle in each bright area as can be seen in the UV-PEEM image (inset).
B) STM image of an area with a high density of pyramid shaped crystallites.
C) STM image of an area with a low density of pyramid shaped crystallites.
D) After the formation of Ga droplets. The droplet trails are more irregular on the left side of the sample that has Au particles.
132 MAX-lab ACTIVITY REPORT 2010
SYNCHROTRON RADIATION – BEAMLINE I311
nin-InP nanowires studied by x-ray photoelectron emission microscopy
M. Hjort1, A.A. Zakharov2, M.T. Borgström1, J. Wallentin, L. Samuelson1, J.N. Andersen1, E. Lundgren1, A. Mikkelsen1
1Department of Physics, Lund University 2MAX-lab, Lund University
III-V semiconductor nanowires (NWs) have long been proposed as future key components within a wide range of areas, e.g. sensing, (opto)electronics and photovoltaics. Because the nanowires allow integration of III-V materials directly with the existing Si platform used in industry, they enable high performance at low cost. Much of the research performed so far has been focused on growing perfect single crystal nanowires, but a prerequisite for most devices is the ability to in a controlled manner, both spatially and magnitude wise, dope the structures.
We have performed x-ray photoelectron emission microscopy (XPEEM) on doped InP nanowires at beamline I311 at MAX-lab. The nanowires were grown using Metal Organic Vapor Phase Epitaxy (MOVPE) and an Au-seed particle was used to define the size of the wires. The precursors for the growth were trimethylindium (TMI) and phosphine (PH3) while H2S was used as precursor for n-type dopants. During growth the supply of dopants was switched rendering a segment stacking of n-type – intrinsic – n-type (nin) as can be seen in the schematic in figure 1 a. After growth the nanowires were transferred to a HF-etched Si-wafer and put into vacuum. The nanowires were cleaned in an atomic hydrogen atmosphere at 400°C for 8 min, removing most of the native oxide.
In fig 1 b. a mirror electron micrograph of the nin-NWs can be seen. In mirror mode, the sample is illuminated by low energy electrons that are reflected before they reach the surface. This mode is mainly used in order to get a (fast) overview of the NWs and to inspect the surface for possible contaminants. In fig 1 c. x-ray photons are incident on the sample and it is immediately observed that dopant induced contrast can be observed along the NW when secondary electrons are collected. It was found that the intrinsic segment did emit more secondary electrons than the n-parts at all photoelectron energies tested (0-3 eV) and at both photon energies tuned in (70 and 130 eV). The contrast can be explained using a model first proposed by Sealy et al. assuming a locally varying vacuum level potential just outside the sample surface [1]. If the ionization potential is equal in both the n and i-parts (En=Ei), which would be fair to assume due to the low amount of dopants incorporated in the lattice, then the vacuum potential as it appears just outside the sample has to vary, reaching a uniform level (Edetector) first at a macroscopic distance. In order for an electron from the n-type side to not only leave the sample surface but also to reach the detector it requires an energy equal to , that is more energy than a corresponding electron from the intrinsic side would need. This causes a higher secondary electron flux from the intrinsic part since those electrons generally need less energy to surmount the barrier and reach the detector.
With the SPELEEM one can also tune in and make spatial maps of different elements in the sample. In fig 1 d. electrons from the In4d core level has been tuned in and shows were In can be found in the sample.
[1] C.P. Sealy et al., J. Electron Microsc. 49 (2000) 311
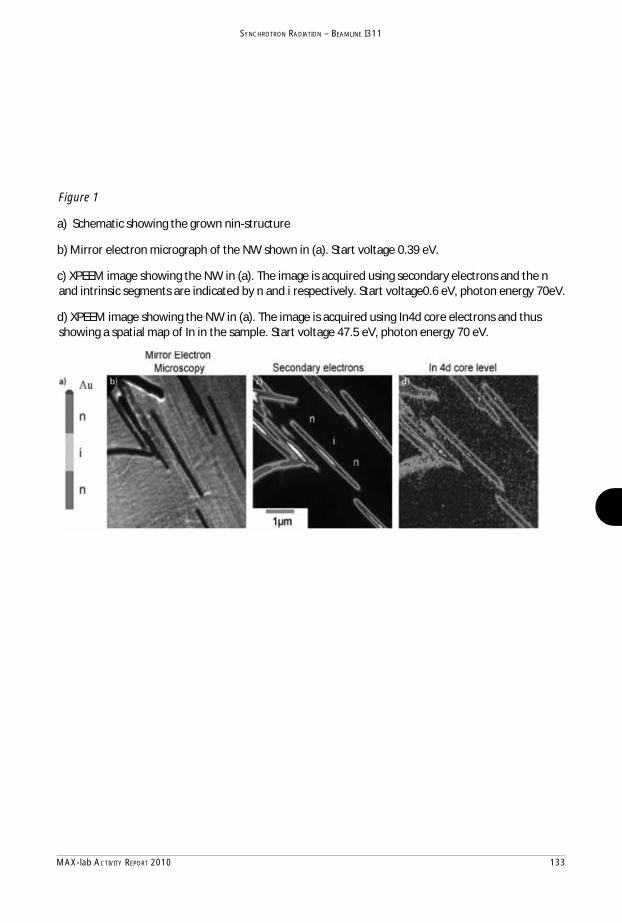
MAX-lab ACTIVITY REPORT 2010 133
SYNCHROTRON RADIATION – BEAMLINE I311
Figure 1
a) Schematic showing the grown nin-structure
b) Mirror electron micrograph of the NW shown in (a). Start voltage 0.39 eV.
c) XPEEM image showing the NW in (a). The image is acquired using secondary electrons and the n and intrinsic segments are indicated by n and i respectively. Start voltage0.6 eV, photon energy 70eV.
d) XPEEM image showing the NW in (a). The image is acquired using In4d core electrons and thus showing a spatial map of In in the sample. Start voltage 47.5 eV, photon energy 70 eV.

134 MAX-lab ACTIVITY REPORT 2010
SYNCHROTRON RADIATION – BEAMLINE I311
Formation of Carbonyl Complexes by CO Adsorption on Monolayers of
Iron Phthalocyanine on Au(111)
Cristina Isvoranu1, Evren Ataman1, Jan Knudsen1, Karina Schulte2, Jesper N. Andersen1, and
Joachim Schnadt1
1Division of Synchrotron Radiation Research, Department of Physics, Lund University, Box 118,
221 00 Lund, Sweden 3MAX-lab, Lund University, Box 118, 221 00 Lund, Sweden
The interaction between monolayers of iron phthalocyanine on a Au(111) support and carbon
monoxide (CO) molecules is studied by photoelectron spectroscopy. The CO molecule is a
very common ligand in coordination chemistry and the Metal-CO complexes are most often
of extreme biological importance. Since the formation of such biologically active complexes
involves the interaction between the CO ligand molecules and the metal centre of the
metalloprotein cofactor, it is important to develop a fundamental understanding of such
interactions.
The adsorption results in the formation of several carbon monoxide adsorbate species, as can
be seen from the Figure 1 (a) and (b) showing the C 1s and O 1s spectra at saturation. Among
these species of central importance for the present study is the formation of the FePc-carbonyl
complex (peak labeled P1, showing up at ~287 eV in the C 1s spectrum and at ~533 eV in the
O 1s spectrum). It has to be mentioned that the saturation represents the gas dose at which all
the iron centers are coordinated to CO molecules (this we are able to show by comparing the
Fe 2p spectra with increasing the amount of gas; from saturation onwards there is no change
in the shape of the Fe 2p line shape). The formation of FePc-carbonyl complexes is
particularly important, because it leads to a redistribution of the electrons in the iron 3d levels
resulting in a change of spin state, as can be seen from a comparison of the Fe 2p
photoelectron spectra before and after adsorbing CO at saturation (Figure 1 (c)). It is well
known that the broad structure in the Fe 2p spectrum is caused by the open shell structure of
the iron ion.1-4 The decrease in the width of the Fe 2p line upon ligand adsorption is a
consequence of reduction of the valence spin. The increase in the binding energy of the low
binding energy Fe 2p component also shows that the formation of FePc-carbonyl bonds leads
to a decrease of electron density on the iron ion. Since the metal-CO bond formation is known
to involve both direct electron donation from the ligand to the metal and back donation from

MAX-lab ACTIVITY REPORT 2010 135
SYNCHROTRON RADIATION – BEAMLINE I311
References: 1 Weissenrieder, J.; Göthelid, M.; Månsson, M.; Schenck, von H.; Tjernberg, O.; Karlsson, U. O. Surf. Sci. 2003,
527, 163-172. 2 Sirotti, F.; Santis, M. D.; Rossi, G. Phys. Rev. B 1993, 48, 8299-8306. 3 Sirotti F.; Rossi, G. Phys. Rev. B 1994, 49, 15682-15687. 4 Fadley, C. S.; Shirley, D. A. Phys. Rev. A 1970, 2, 1109-1120.
the metal orbitals of appropriate symmetry to empty ligand orbitals, this implies that in the
case of CO adsorption the back-donation is stronger than the direct donation.
(a) (b)
(c)
Figure 1. (a) C 1s photoelectron spectra before and after CO adsorption on a monolayer of FePc on Au(111); (b) O 1s photoelectron spectra after adsorption of CO at saturation (4 Langmuirs); Fe 2p3/2 photoelectron spectra before and after CO adsorption at saturation on a monolayer of FePc.

136 MAX-lab ACTIVITY REPORT 2010
SYNCHROTRON RADIATION – BEAMLINE I311
Spin Change and Adsorbate-Substrate Decoupling as a Consequence of NO Adsorption
on Iron Phthalocyanine Monolayers
Cristina Isvoranu1, Evren Ataman1, Jan Knudsen1, Karina Schulte2, Jesper N. Andersen1, and Joachim
Schnadt1
1Division of Synchrotron Radiation Research, Department of Physics, Lund University, Box 118,
221 00 Lund, Sweden
3MAX-lab, Lund University, Box 118, 221 00 Lund, Sweden
The NO molecule is a very reactive, free radical species. It is a signalling molecule in many
physiological processes in the human body (neurotransmitter, cytoprotective molecule,
regulation of cardiovascular function),1 being one of the smallest biologically active
molecules. The adsorption of nitric oxide (NO) molecules on iron phthalocyanine (FePc)
monolayer networks on Au(111) and their influence on both the iron’s valence spin and the
FePc-Au(111) coupling was investigated by means of photoelectron spectroscopy.
The NO molecules were adsorbed on the FePc monolayer in increasing amounts. The Fe 2p3/2
spectra before and after adsorption of increasing amounts of NO are shown in Figure 1. Two
major changes can be observed in the evolution of the spectra: first, the lines become
significantly narrower, and second they shift in binding energy. More quantitatively, the
broad, multiplet structure the Fe 2p spectrum of the monolayer with a FWHM of 3.7 eV
narrows down 1.3 eV for NO at “iron saturation dose”. This dose corresponds to the point
where any increase in the amount of adsorbed gas does not lead to any further changes in the
shape of the Fe 2p spectrum. At the iron saturation dose all the iron centres are bound to NO
ligand molecules and there are no more binding sites available on the iron. Figure 2 shows the
results of least square fitting for the Fe 2p3/2 photoemission spectrum of the clean FePc
monolayer, as well as the corresponding spectrum at saturation (4 Langmuirs), after NO
adsorption. The monolayer spectrum was fitted by two main multiplet lines (P1 and P2) and a
satellite (P3), while the spectrum after NO adsorption was fitted by one main line only (P2)
and a satellite (P3). We assign the low binding energy line (P1) of the FePc/Au(111) to a
component arising from charge transfer from the Au(111) substrate to the Fe atom in either
the initial or final state. The fact that the low binding energy P1 peak is vanished after NO
adsorption is a clear indication for the NO induced FePc-Au(111) decoupling. The middle
component P2 shows up at 708.28 eV for FePc/Au(111) and it has a FWHM of 2.39 eV,

MAX-lab ACTIVITY REPORT 2010 137
SYNCHROTRON RADIATION – BEAMLINE I311
while after NO adsorption P2 is shifted to 708.81 eV and narrowed down to 1.25 eV.
Concerning the decrease in width, it is known from the literature that the broad structure in
the Fe 2p spectrum is caused by the open shell structure of the iron ion.2-5 We attribute the
decrease in width of P2 to a decrease in the spin state on the iron atom, while the increase in
P2 binding energy basically indicates that the electronic density on the iron atom is decreased
by the adsorption of NO ligands.
Figure 1. Fe 2p3/2 photoemission spectra with increasing amounts of NO. The spectra become narrower with increasing the amounts of NO gas. The NO amount of 4 Langmuirs represents the saturation dose.
(a) (b)
Figure 2. Fe 2p3/2 photoemission lines (experimental data and fit) for (a) monolayer FePc/Au(111), (b) NO adsorption on monolayer FePc/Au(111) at saturation.
References: 1 Ignarro, L. J. Nitric Oxide – Biology and Pathology: Academic Press: San Diego, 2000. 2 Weissenrieder, J.; Göthelid, M.; Månsson, M.; Schenck, von H.; Tjernberg, O.; Karlsson, U. O. Surf. Sci. 2003,527, 163-172. 3 Sirotti, F.; Santis, M. D.; Rossi, G. Phys. Rev. B 1993, 48, 8299-8306. 4 Sirotti F.; Rossi, G. Phys. Rev. B 1994, 49, 15682-15687. 5 Fadley, C. S.; Shirley, D. A. Phys. Rev. A 1970, 2, 1109-1120.

138 MAX-lab ACTIVITY REPORT 2010
SYNCHROTRON RADIATION – BEAMLINE I311
Evolution of surface compounds during the initial stages of high temperature oxidation of FeCr alloys
P. Jussila, H. Ali-Löytty, M. Hirsimäki, and M. Valden
Surface Science Laboratory, Tampere University of Technology, P.O. Box 692, FIN-33101 Tampere, Finland (www.orc.tut.fi/surfsci)
FeCr-based alloys with low Ni content (ferritic stainless steels) have gained recent interest due to their excellent thermal properties, mechanical strength, and corrosion resistance, which make them an attractive choice for many energy applications ranging from exhaust systems of combustion engines to solar thermal collectors and fuel cells. The enhanced properties of advanced ferritic grades are often achieved through careful optimization of the alloy composition, even at parts-per-million level for certain minor elements.1 The influence of minor alloying elements is particularly crucial at the surface of the material, where they may become enriched through segregation and oxidation phenomena under corrosive or high temperature conditions. Better understanding of these phenomena is essential for developing novel surface treatment methods for stainless steels and improving their performance under demanding application environments. In the present work, we studied segregation phenomena and formation of surface compounds on Fe-17Cr alloy at temperatures up to 800 °C upon annealing in UHV and during kinetically controlled oxidation by O2 and H2O. We performed high-resolution PES and XAS measurements, which provided information on the chemical states of the segregating elements and their behavior in high temperature surface phenomena in much greater detail than any preceding work based on XPS and AES measurements. In particular, we obtained previously unavailable2 spectroscopic information on the evolution of the CrN surface compound and its electronic properties. The Fe-17Cr surface was initially cleaned in situ by cycles of 2.0 keV Ar+ ion sputtering and subsequent annealing at 800 °C. Surface segregation was induced by annealing the sputter-cleaned sample in UHV at selected temperatures up to 800 °C for 5 min, and then allowing it to cool freely (within 1 h) to 50 °C. Isochronal oxidation experiments of 10 – 100 Langmuirs were performed on the pre-annealed surfaces by backfilling the UHV chamber with 5.3 × 10⁻⁸ – 5.3 × 10⁻⁷ mbar of either O2 or H2O while maintaining the sample at the oxidation temperature for 250 s. Chemical composition of the surface was subsequently analyzed by PES employing photon energies of 494 eV and 700 eV for the main part. Relative atomic concentrations and chemical states of elements were determined from the spectra by least-squares fitting of asymmetric Gaussian-Lorentzian lineshapes to the photoelectron peaks after subtracting a Shirley background.
1 K.H. Lo, C.H. Shek, and J.K.L. Lai, Recent developments in stainless steels, Materials Science and Engineering R 65 (2009) 39-104. 2 C. Müller, C. Uebing, M. Kottcke, C. Rath, L. Hammer, and K. Heinz, The structure of the surface compound CrN formed by cosegregation on a Fe–15%Cr–N(100) single crystal surface, Surface Science 400 (1998) 87-94.

MAX-lab ACTIVITY REPORT 2010 139
SYNCHROTRON RADIATION – BEAMLINE I311
3 H. Ali-Löytty, P. Jussila, M. Hirsimäki, and M. Valden, Influence of CrN surface compound on the initial stages of high temperature oxidation of ferritic stainless steel, Applied Surface Science, under preparation.
Figure 1 shows the complex evolution of surface compounds on the Fe-17Cr alloy resulting from annealing under UHV conditions. At 527 °C and above, the outermost surface consists mainly of CrN compounds, although minor alloy constituents such as Sn also produce strong signals due to their relatively high photoelectric cross-sections. The high-resolution PES data allows for the differentiation of surface and subsurface N species, thus facilitating the study of chemical bonding and compound formation on Fe-17Cr.
Figure 1. Evolution of surface compounds on the free Fe-17Cr alloy surface resulting from thermally induced segregation at 327 °C – 800 °C. The PES measurements were carried out by utilizing photon energies of (a) 700 eV and (b) 494 eV, which reveals many features that could not be detected by conventional XPS employing Al K radiation. In particular, the high-resolution spectra of N 1s (c) can be utilized for identification of different N species: two-dimensional CrN surface compound (CrN,s), CrN precipitates (CrN,b), and interstitial N in solid solution (N in sol.).3 Subsequent oxidation experiments (not shown) indicate that upon O2 exposure at 327 °C, an Fe-rich mixed oxide layer develops on the surface, whereas at 800 °C, the oxide consists of protective Cr2O3- and SiO2-type oxides instead. In addition, the formation of protective oxide species is initially enhanced by the cosegregation of Cr and N, and by adsorption of H2O. N remains at the oxide/metal interface as the oxidation proceeds, which calls for further investigation due to possible effects on the growth kinetics of oxides and their adhesion to the alloy surface. These phenomena are of great importance in processing and application environments involving low pO2 conditions, such as surface finishing of FeCr alloys under reducing atmospheres (bright annealing).

140 MAX-lab ACTIVITY REPORT 2010
SYNCHROTRON RADIATION – BEAMLINE I311
Figur 1: CC 1s, O1s, andd Ag 3d5/2 aftter the p(4x4)--O/Ag(111) suurface oxide hhas been saturrated with CO
at 100 K
J
Divisi
One waconditiobased th(N2) andremovalunburneAg in thstate duof the cNO on catalystIn this rknown high reswe wiltempera
Jan Knudsen
ion of Synch
ay to reduceons with a hhree Way Cd other catal in an oxed hydrocarhe working
ue to the oxicatalytic actoxidized si
ts. report we fto form onsolution pholl show thatures, resem
Carbon
n, Natalia MJesp
hrotron Rad
Simon KlaComp
University
e fuel conshigh air to fCatalysts arealysts have txidizing envrbons (HC) g catalyst is idizing enviivity of the ilver surface
focus on COn the Ag(11otoemission
hat carbonambling the h
nate forma
M. Martin, Eper N Ande
diation Rese118, 22
acar, Anderpetence Cenof Technolo
umption anfuel ratio. Ue unable to to be used ivironment, from the exnot known
ironment. AAg/Al2O3
es represen
O adsorptio11) surface n spectroscoates are fohigh pressur
ation on p
Elin Grånäsersen, and Eearch, Depa21 00 Lund,
rs Hellman, nter for Catogy, SE-412
nd CO2 emiUnder such efficiently
instead. Agsince it is
xhaust gas n, but it is lAs a first stsystem we
nting extrem
on on the punder oxidopy (HR-Xormed on res in the re
p(4x4)-O/
, Sara BlomEdvin Lundgartment of P
Sweden
and Henriktalysis, Cha2 96 Götebo
issions is tooxidizing creduce nitr
g/Al2O3 is os able to sas reducinglikely that sep towards initiated a s
mely simplif
(4x4)-O/Agdizing condiXPS) and de
the p(4x4eal catalysts
/Ag(111)
mberg, Johangren Physics, Lun
k Grönbeck almers org, Sweden
o operate econditions togen oxide
one promisiselectivelyg agent. Thsilver is prean atomic s
study of adfied model
g(111) surfaitions. Usiensity funct4)-O/Ag(111s.
n Gustafson
nd Universit
n
ngines at othe traditions (NOx) to ng catalyst reduce NO
he oxidationesent in an oscale under
dsorption of systems of
ace [1, 2], wing the intetional theory1) surface
n,
ty, Box
oxidizing nal Pt/Pd nitrogen for NOx
Ox using n state of oxidized standing
f CO and f the real
which is erplay of y (DFT)
at low

MAX-lab ACTIVITY REPORT 2010 141
SYNCHROTRON RADIATION – BEAMLINE I311
Referen
[1] M. S
[2] J. Sc
[3] T.E.
nces
Schmid, et a
chnadt, et al
. Felter, et a
al., Phys. Re
l. Phys. Rev
al. Surf. Sci.
ev. Lett., 96
v. Lett., 96 (
., 118 (1982
6 (2006) 146
(2006) 1461
2) 369-386
6102
101
Figure Ag 3d5/
has beenC 1s pepeak acarbonaassignedstructur
indicatinbonded experimreact wcorrespostructur
Using thof severwith themodel cAg atomfig. 2) aatoms ashown iratio of
In conttemperato formpressureatmosphstructuratmosphformatiocompare
1 shows the/2 recorded n saturated eak at 287.9at 530.2 ates [3]. Thd to oxygere almost d
ng that all in carbona
ments suggeith two oxyonds to 0.6re.
his informaral model se lowest totacomes fromms bound toare shifted -as referencein fig. 1, w9:3:1 and s
trast to theature exposu
mation of COe close to Uheric pressure is therefoheric pressuon already ed to tempe
e XP-spectrafter the pwith CO at
9 eV and theV are che O 1s pen in the pdisappears
O-atoms oate molecuest that eaygen atoms 6 ML, whic
ation as inpustructures ofal energy in
m the calculo one (1-9 -0.41 eV, -0. These val
which can bhifted -0.30
e carbonateure leads toO2 , which
UHV is thermure. The proore not at aure. In thi
at 100 K,eratures in th
ra C 1s, O p(4x4)-O/At 100 K. Bhe dominancharacteristipeak at 528p(4x4)-O/Aupon CO
on the surfales. Furth
ach CO mo on the sur
ch should b
ut for extenf the carbonn the set of ated Ag 3din fig. 2), tw
0.68 eV, andlues are in g
be deconvol0 eV, -0.58
e formationo titration o
directly demodynamicoposed atomall unrealists respect, i clearly inhe Ag/Al2O
1s and Ag(111)
oth the nt O 1s ic for 8.2 eV
Ag(111) dosing
ace are her, our olecule rface, sincee compared
nsive DFT cnate structutested struc
d5/2 core levwo (10-12 d -0.95 eV, good agreemluted into 3eV, and -0.8
n observedof surface oxesorbs to thcally equivamic scale strtic for oxidit is interes
ndicating thO3 catalyst c
FigstrCo
the total Od with 0.4 M
calculation ure. Figurectures. Furtvel shifts (Cin fig. 2), arespectivel
ment with th3 surface co85 eV, resp
d upon COxygen in p(he gas phasalent to worructure of c
dized silver sting to nothat the carbconnected to
gur 2: Proposructure with olorcode: C gr
O 1s intensiML for the
we calculate 2 shows thther validatiCLS), whichand three oxly, using thehe measure
omponents ectively.
O exposure(4x4)-O/Agse. Low terking at highcarbonate fo
surfaces exte that we obonate reaco the exhaus
sed structural 1 monolaye
ray, O red, Ag
ity after COe p(4x4)-O/A
ted the totahe structuraion of our sh show thatxygen atome value for
ed Ag3d5/2 shaving an i
e at 100 Kg(111) strucemperature h temperatu
ormed on thxposed to Cobserved cation barrierst gas.
model of theer of CO3
2- g blue.
O dosing Ag(111)
al energy al model tructural t surface
ms (13 in Ag bulk
spectrum intensity
K, room cture due and low
ures near e p(4x4) CO near arbonate r is low
e carbonateadsorbed.
Figur 2: Proposed structural model of the carbonate structure with 1 monolayer of CO3
2- adsorbed. Colorcode: C gray, O black, Ag light gray.

142 MAX-lab ACTIVITY REPORT 2010
SYNCHROTRON RADIATION – BEAMLINE I311
Surface versus interface composition by element specific microscopy: Co doped ZnO
I.A. Kowalik1, M.A. Niño2, M. ukasiewicz1, A.A. Zakharov3, E. Guziewicz1, M. Godlewski1,4, T. Dietl1, D. Arvanitis5
1 Inst. of Physics, Polish Academy of Sciences, Al Lotnikow 32/46, 02-668 Warszawa, Poland 2 IMDEA, Facultad de Ciencias Módulo C-IX, 3ª planta Avda. Fco. Tomás y Valiente, 7
Ciudad Universitaria de Cantoblanco, ES-28049 Madrid, Spain 4 MAX-lab, Lund University, S-221 00 Lund, Sweden
4 Dept. of Mathematics and Natural Sciences, UKSW, Dewajtis 5, 01-815 Warsaw, Poland 5 Dept. of Physics and Astronomy, Uppsala University, Box 516, 75120 Uppsala, Sweden
ZnO doped with transition metal ions is the most studied oxide dedicated to spintronics
applications. Zinc oxide doped with Co was the first diluted magnetic semiconductor (DMS) for which room temperature (RT) ferromagnetism (FM) was reported [1]. However, the reports from different research groups, contradict each other and despite the intensive studies of this material room temperature ferromagnetism in (Zn,Co)O is far from being fully understood. Despite the controversy on the magnetic response of (Zn,Co)O, a direct element specific mapping of this materials composition is lacking in the literature. We therefore, present here some X-ray Photo Electron Emission Microscopy (X-PEEM) and spectro-microscopy results with the associated Low-energy Electron Emission Microscopy (LEEM) micrographs. This experiment is performed at the I311 beam line of MAX-lab.
The samples presented in this report were grown on silicon substrates by means of the
Atomic Layer Deposition (ALD) technique at the IF PAN (Warsaw, Poland) [2]. Prior to the X-PEEM work, the samples have been characterized by means of SQUID magnetometry and electron microscopy (SEM). The samples were chosen at various ALD external growth control parameters, and are exhibiting different magnetic properties. In order to best exploit
12
10
8
6
4
2
0
Pho
to C
urre
nt (
arb
.u.)
810800790780770Photon Energy ( eV )
surface region interface regionZnCoO film
Co L-edge
(c)
500
400
300
200
100
Inte
nsity
(ar
b. u
.)
14 12 10 8 6 4 2 Binding Energy ( eV )
Zn3dZnCoO film
surface region(d)
Figure 1. (a) LEEM micrograph taken in the mirror mode on ZnCoO film. The Field of View (FOV) is indicated. In the interface region needles of about 2000 nm long and 200 nm wide are observed. (b) LEEM micrograph of the surface region. The sample appears homogeneous in the 10 micron range. (c) The Co L3,2-edge measured with XAS (BL I1011) varies between surface and interface region. At the surface the shape of Co edge is typical for DMS ZnCoO films. At the interface we observe metallic Co, which exhibits also dichroic magnetic contrast. (d) The Zn3d states are homogenously distributed in the surface region probed.

MAX-lab ACTIVITY REPORT 2010 143
SYNCHROTRON RADIATION – BEAMLINE I311
[1] K. Ueda, H. Tabata, T. Kawai, Appl. Phys. Lett. 79, 988 (2001). [2] M.I. ukasiewicz, B. Witkowski, M. Godlewski, E. Guziewicz, M. Sawicki, W. Paszkowicz, R. Jakie a, T.A. Krajewski, G. uka, Phys. Stat. Sol. B 247, no. 7, 1666 (2010) [3] M. Godlewski, E. Guziewicz, M.I. ukasiewicz, I.A. Kowalik, M. Sawicki, B.S. Witkowski, R. Jakie a, W. Lisowski, J.W. Sobczak, M. Krawczyk, EMRS 2010 Proceedings, Physica Status Solidi B to be published.
the surface sensitivity of X-PEEM, but also to study the inner of the material, some (Zn,Co)O films were Ar ion etched at the PAN under well defined conditions. The etching process allows to create samples with a variable and well defined (Zn,Co)O thickness profile, ideal for soft x-ray X-PEEM investigations. First results on the etched samples have been recently presented [3]. Prior to the work at I311, X-ray Absorption Spectroscopy data were taken at the I1011 beam line of MAX-lab. Based on several laboratory based techniques at IFPAN, such as a combination of SEM, SIMS, cathodo-luminescence, SQUID and XPS a model for the element specific profile as a function of film thickness for the ALD grown samples was proposed, according to which, Co rich regions are forming at the “inner” (Zn,Co)O/Si interface of the films [3]. X-PEEM experiments in combination with spectro-microscopy and XAS can probe directly the element specific profile of the etched films.
We studied both, as grown, as well as etched samples. For the etched samples a variable
thickness profile is obtained across the sample surface, allowing to investigate the (Zn,Co)O films as a function of the layer thickness. The XAS results at I1011 are in agreement with this model. Some XAS spectra are shown in Figure 1(c). The spectra taken at the “outer” surface region exhibit much stronger white lines at the Co L-edges. The various ALD growth conditions do not appear to influence the elemental composition of the near surface region as probed by XAS using the sample photo-current. At the “inner” interface, the much lower white line intensity and the higher inter peak region are indicative of Co in close to a pure metallic state. The topography of the samples is characterized in the LEEM and X-PEEM modes. At the surface, for several samples probed no clear topological fine structure is identified in this mode, within 50 nm. For a few samples, in mirror mode (MEM) some features are visible in the 100 nm range, in agreement with the SEM results. For the non-etched samples all elements, Zn Co and O were identified in the micro-XPS mode. An example is shown for the Zn 3d states in Figure 1 (d). The samples appear homogeneous in the 50 microns range. Finally, for the etched samples the elemental composition is found to vary close to the inner interface region. Quasi circular islands of up to 4.5 μm in diameter, as well as needles up to 12 μm long and 4 μm wide, are clearly imaged. A micrograph is shown in Figure 1 (a). Depending on the precise etching process, some of the islands identified in our study, appear to contain Zn in two different chemical states. Some other nano crystals appear to be Co rich in agreement with the XAS results of Figure 1(c).
In conclusion, we provide by means of LEEM and X-PEEM direct evidence of topological
micro-structure for the “inner” interface of ALD grown (Zn,Co)O films on Si. The reported measurements provide microscopic data which allow to explain some conflicting results in the literature, and support a novel interpretation of the magnetic properties for this material [3]. For some of the samples quasi metallic Co islands appear to form in the “inner” interface in agreement with XAS measuremets at I1011 on the same samples.
This work is partially supported by the European Research Council through the FunDMS Advanced Grant within the “Ideas” 7th Framework Programme of the EC. We benefitted from the ELISA FP7 MAX-lab travel support program for these measurements.

144 MAX-lab ACTIVITY REPORT 2010
SYNCHROTRON RADIATION – BEAMLINE I311
High resolution core level spectroscopy study of the ultrathin aluminum oxide film on NiAl(110)
N.M. Martin1, S. Blomberg1, J. Gustafson1, E. Lundgren1, J. N. Andersen1, J. Knudsen,1 H. Härelind Ingelsten2, P. -A. Carlsson2, M. Skoglundh2, A. Stierle3 and G. Kresse4
1 Division of Synchrotron Radiation Research, Lund University, Box 118, SE-22100, Sweden 2 Competence Center for Catalysis, Chalmers University of Technology, SE-412 96, Göteborg,
Sweden 3 Max-Planck Institut fur Metallforschung, Heisenbergstr.3, D-70569 Stuttgart, Germany
4 Institut fur Materialphysik, Universität Wien, A-1090 Wien, Austria
Well-ordered oxide films grown on single crystal substrates have attracted considerable attention in the past 20 years mainly because of various applications in microelectronics, catalysis, anticorrosion, nanotemplates, coatings and sensors [1-7]. One of the most common model substrate for model catalysts is a thin aluminum oxide film grown on NiAl(110). It has previously been shown that well-ordered ultrathin oxide layers of about 0.5 nm thickness may be grown by oxidation of NiAl(110) [8-14]. The thin aluminum oxide film grown on NiAl(110) has been extensively studied in the literature but its structure has only recently been solved by Kresse et al.[1], and so far no independent experimental study in the literature supports the model by Kresse et al. in its entire complexity. According to several previous studies and the model by Kresse et al. [1] the ultrathin aluminum oxide film grown on NiAl(110) consists of a double oxide layer with NiAl-Ali-Oi-Als-Os stacking.
We have studied the ultrathin aluminum oxide film on NiAl(110) by a combination of high resolution core level spectroscopy (HRCLS) and density functional theory calculations (DFT).
In Fig. 1a we show the Al 2p and O 1s core levels recorded at normal emission with photon energy of 130 eV and 900 eV, respectively, from the ultrathin aluminum oxide on NiAl(110). It is immediately clear that the broad appearance of the core level spectra related to the oxidized Al atoms is due to a large number of shifted components originating from Al atoms in the oxide film with slightly different local environment. The Al 2p recorded with a photon energy of 130 eV is presented in Fig 1a right. The spectrum can be decomposed into 4 components as shown in Fig. 1a, each of them splitted by 0.4 eV and with a ratio of 1/2. The component at the lowest binding energy (72.4 eV, grey) is the so-called interface component, electron emission from the Al atoms in the NiAl(110) surface directly below the ultrathin Al oxide. The two Al 2p components shifted 1.00 eV and 2.27 eV are assigned to photoemission from Al atoms in the Al10O13 film. To distinguish the photoemission from Ali and Als atoms we used energy dependent photoemission measurements, as shown in Fig. 1b and d. It can be seen that at higher energies, the 2.27 eV shifted component is decreasing more rapidly in intensity as compared to 1.00 eV shifted component which is also decreasing but not so fast. The measurements reveal that the 1.00 eV shifted component should be assigned to Al atoms from the interface of the oxide layer Ali and the 2.27 eV shifted component to the Al atoms at the surface of the oxide Als.
The O 1s spectrum recorded with photon energy of 900 eV is presented in Fig. 1a left. It can be seen that the emission is broad and asymmetric and exhibits a shoulder on the high binding energy side. The spectrum can be decomposed into two components. The energy dependent measurements shown in Fig. 1 c and e reveal strong diffraction effects at lower kinetic energies, however at higher energies, the smaller component decreases more rapidly in intensity as compared to the larger component suggesting that the small component is from the atoms in the Os layer. However, it is clear that not all of the oxygen atoms in the Os layer can contribute to the intensity, since a significant higher intensity would in that case be

MAX-lab ACTIVITY REPORT 2010 145
SYNCHROTRON RADIATION – BEAMLINE I311
expectesmall cundernethe surfallows f
Figure 1a) Al 2p0.4 eV sNiAl bu(grey), Arecordedand the componreside vlevel binb) the Ae) the O
d. By compcomponent eath and do face oxygenfor a correct
1: High resop spectrum (spin-orbit spulk (blue), AAl in the Ald at 900 eVO atoms in
nent is due tvery close tonding energ
Al 2p level aO 1s compon
paring our ecould be anot reside v
n atoms. Thet assignmen
olution core(right) recorplit with the
Al at the inteli layer (viol
V. The more n the surfaceto O atoms io another oxgies are indiand c) the Onents.
experimentaassigned tovery close toe present Hnt of the diff
e level spectrded at 130 e ratio of 1/2erface betwlet) and Al intense com
e layer whicin the Os layxygen surfacicated by fil
O 1s level. T
al findings to surface oo another ox
HRCLS studfferent HRC
tra from theeV. Four c
2. The comween the Al o
in the Als lamponent orich reside veryer which hce atom (selled spheres
The integrate
o the calculxygen atomxygen atom
dy supports CL compone
e ultra thin aomponents
mponents canoxide film aayer (orangeiginates fromry close to a
have the Alie inset and
s. Energy deed area from
lated bindinms which d
m correspondthe model b
ents to speci
aluminum oare clearly
n be identifiand the NiAe). O 1s spem the O atoanother Os aatoms undetext). The c
ependent mem d) the Al
ng energy shdo have Ading to onlyby Kresse eific atomic s
oxide on NiAvisible, eac
ied as Al in Al(110) subsectrum (left)oms in the Oatom. The werneath andcalculated ceasurement2p compon
hifts the Ali atoms y 30% of et al. and sites.
Al(110). ch with a
the strate )
Oi layer weaker d do not ore s from
nents and
[1] G. K[2] C.T.[3] C. R[4] H. Iw[5] E. L[6] M. S[7] H. -J[8] H. Is[9] R. M[10] J. L[11] A. [12] M. [13] N. [14] M.
Kresse et al.. Campbell,
R. Henry, Suwasaki, and
Lundgren et Schmid, et aJ. Freund, asern, and G
M. Jaeger et Libuda et alStierle et al Kulawik etNilius et al Schmid et
, Science 30 Surf. Sci. R
urf. Sci. Repd K. Sudoh, al., J. Phys
al., Phys. Reand G. Pacch. R. Castro,al., Surf. S
l., Surf. Sci.l., Science 3t al., Phys. R., Phys. Reval.,, Phys. R
08, 1440 (2Rep. 27, 1 (p. 31, 231 (Jpn. J. App
. Cond. Matev. Lett. 99 hioni, Chem, Surf. Sci. 2ci. 259,235 318, 61 (19
303, 1652 (2Rev. Lett. 9v. B 69, 121Rev. Lett. 9
005). (1997). 1998). pl. Phys. 41tter 18, R48196104 (20
m. Soc. Rev211/212, 86(1991).
994). 2004).
91, 256101 (1401(R) (207, 046101 (
, 7496 (20081 (2006). 007).
v. 37, 2224 (65 (1989).
(2003). 004). (2006).
02).
(2008).

146 MAX-lab ACTIVITY REPORT 2010
SYNCHROTRON RADIATION – BEAMLINE I311

MAX-lab ACTIVITY REPORT 2010 147
SYNCHROTRON RADIATION – BEAMLINE I311

148 MAX-lab ACTIVITY REPORT 2010
SYNCHROTRON RADIATION – BEAMLINE I311
Spectroscopic photoemission and low-energy electron microscopy study of nitridation of aluminum nanopatterns
B. Qi1, S. Ólafsson1, A. A. Zakharov2, B. Agnarsson1, H. P. Gíslason1, M. Göthelid3
1 Physics Department, Science Institute, University of Iceland, Dunhaga 3,107 Reykjavík, Iceland 2 Maxlab, Lund University, S-22100 Lund, Sweden
3 Materialfysik, ICT, KTH, ELECTRUM 229, 16440 Kista, Sweden
In recent years, the interest in growth of III-nitrides quantum structure using AlN anostructures as assembling templates by selective area molecular-beam epitaxy technique has been increasing1-3. In this contribution, the spectroscopic photoemission and low-energy electron microscope (SPELEEM) instrument at beamline I311 at MAX II was applied to study the spatial resolved effects of nitridation on the chemical, topographic and crystalline structural property of the aluminum nanopatterns (~100 x100 nm2 ) fabricated by e-beam lithography. The nitridation was carried out in the preparation chamber with NH3 gas around 5.0 x10⁻⁴ Pa through three consequential stages: first at 680 °C for about 1.5 hour, then 730 °C for about 2 hours and finally around 800 °C for 45 minutes. All the SPELEEM measurements were carried out in the analysis chamber which holds the ultra high vacuum conditions. Fig.1 shows the mirror-mode images (MEM) of the nanopatterns at a field of view (FOV) of 10 m (a) before and (b) after nitridation. The contrast in mirror-mode was the contributions of sample surface work function difference and topography. The bright dots arranged in a hexagonal pattern in Fig.1a represent the individual Al nanopatterns, with the gray background representing the native SiO2 layer on the Si substrate. In addition, some dark ring perpetuated nano-dots indicate there exist either some topographic peculiarity4 or a sharp work function difference between the nanopatterns and their immediate surroundings. After nitridation, as shown in Fig.1b, the nanopatterned surface appeared more corrugated, with the individual nanopetterns becoming sharpened and previous black rings transformed into black holes or simply disappeared. The results in Fig.1 as a whole indicate that both the work function difference between the nanopatterns and their immediate surroundings was reduced and some perpetual topographic peculiarities of the nanopatterns were diminished by nitridation.

MAX-lab ACTIVITY REPORT 2010 149
SYNCHROTRON RADIATION – BEAMLINE I311
Fig.2 shows the x-ray photo-emission electron microscopy (xPEEM) images of the nanopatterns at a FOV of 20 m and illumination photon energy of 130 eV (a) before and (b) after nitridation. In xPEEM, both topographic and chemical/element contrast can be resolved. As shown in Fig.2a, the nanopatterns appeared as clearly separated, bright parallel lines (owing to an off-normal illumination of the sample surface by x-ray) over the dark background of native SiO2 layer, indicating the Al nanopatterns were geometrically well confined by the naopatterned SiO2 mask layer. After nitridation, the line patterns were broken into elongated nano-bars or desecrated nano-dots. In consistent with the MEM image in Fig.1b, the surface as a whole appeared more corrugated, the contrast between the bright nano-bars and the surrounding background was of less regularity5, with some black holes/structure vacancies frequently seen among the bright nano-features and gray background. This indicates that the nanopatterns became less regularity after nitridation. Fig.3 shows the core level Al2p and N1s photo-emission spectroscopy (PES) of the nanopatterns before (0) and after (1) nitridation. The results clearly show that two major Al compounds presented in the nanopatterns before nitridation, with Al2p peak at binding energy (BE) of 75.9 eV representing AlO compound and the Al2p peak at BE of 78.8 eV representing AlF compound. After nitridation, the AlF compound disappeared, the AlO compound was converted to a mixture of AlN (Al2p BE 75.4 eV) and AlON (Al2p BE 76.3 eV) compound. Fig. 4 shows the low-energy electron microscope (LEEM) image of the nitridated nanopatterns at FOV of 20 um and electron energy of 1.9 eV. In LEEM mode the incoming electrons experience diffraction (if the surface is ordered) and based on the intensity distribution of (0,0) diffracted spot the LEEM image is conformed. In LEEM differently ordered areas have different I (V) curves and by tunning SV, the optimized contrast between the differently ordered structures can be obtained. The bright nano-dots in LEEM image in Fig.4a indicates that surfaces of the majority nitridated nanopatterns were ordered. The -LEED pattern in Fig.4b recorded from the probing area of 0.4 m (approximately 1-2 nanopatterns) at electron energy of 7.9 eV suggests that the surface of nitridated nanopatterns was structurally ordered, but consisting of very small (less then 100 nm) grains differently oriented.

150 MAX-lab ACTIVITY REPORT 2010
SYNCHROTRON RADIATION – BEAMLINE I311
Investigation of TiOx phases grown on Au(111) by chemical vapordeposition
Davide Ragazzona, Andreas Schaefera, Lars Erik Walleb, Mari Helene Farstadb, AlexeiZakharovc Anne Borgb, Anders Sandella
aUppsala University, Department of Physics and Astronomy, P.O. Box 516, SE-751 20 Uppsala,Sweden
bNorwegian University of Science and Technology, Department of Physics, NO-7491 Trondheim,Norway.
cMAX-lab, SE-223 63 Lund, Sweden.
Titania on gold is a widely studiedsystem for its interesting properties,e.g. as an inverse catalyst1. We arecurrently investigating titania loadingof nanoporous gold to enhance andmodify its catalytic properties2. Forthis purpose chemical vapor deposition(CVD) is a promising techniquebecause the gaseous precursor canefficiently penetrate the pores. Inparallel, we are conducting studies oftitania deposition on Au(111) by wayof CVD to gain a deeper understandingof the properties of that system. As itturns out, titania CVD on Au(111) isan interesting system in its own right.
We have begun to investigateCVD of titania on Au(111). Theexperiments have been carried out atI311. In the first attempt, wediscovered that it is possible to form anatomically ordered structure with (2x2)periodicity vs. the substrate aswitnessed by LEED. Furthermore, X-ray photoemission spectroscopy (XPS)showed a component at a bindingenergy (BE) of 459.0 eV indicative offully oxidized Ti (Ti4+) along with (atleast) two additional components atlower binding energies, assigned toreduced forms of Ti. The results thussuggest an inhomogeneous situation.
The studies were continued inour home laboratories in Uppsala,using Scanning Tunneling Microscopy(STM), LEED and XPS. It soon stoodclear that also other ordered structureswere possible to form. Our aim was tocharacterize the phases in more detail
at I311 in November last year.However, photoemission was notpossible as MAX was “down” duringthis period. Still, we could use Low-Energy Electron Microscopy (LEEM)and -LEED, which proved to beextremely informative and helpful tounderstand the nature of the TiOxphases.
At present we have been able topinpoint and characterize at least 3phases:
2x2: a monolayer thick phase witha honeycomb structure. Its latticeparameter is twice the one ofAu(111);
wagon-wheel: the overlayer has acoincidence relationship with thesubstrate. This gives rise to a
Figure 1. Ti 2p spectrum for TiOx onAu(111).

MAX-lab ACTIVITY REPORT 2010 151
SYNCHROTRON RADIATION – BEAMLINE I311
Moiré pattern that resembles awagon wheel; “star”: most likely made ofthree–dimensional islands with arectangular unit cell. Its LEEDpattern looks like a David’s star,therefore the name. Its precisenature is not fully understood yet.
Ongoing and future work aims at adetailed description on how to preparethe various phases. Of importance withrespect to studies at I311 is to optimizethe growth parameters in order toobtain larger islands (at least 100 nm x100 nm) to be able to use LEEM toinvestigate the growth of the differentphases.
Once the nature of theseultrathin phases will be clarified wewill study their interaction with small“probe” molecules (e.g. CO, CH3OH)and the CVD growth process.
References1 T. T. Magkoev, Surf. Sci. 601, 3143
(2007).2 A. Wittstock, V. Zielasek, J. Biener, C.
M. Friend, M. Bäumer, Science 327, 319(2010).
Figure 2. High resolution STM picturesof (a) the 2x2 phase and (b) the wagon-wheel phase.
Figure 3. -LEED pattern of the“star” phase.

152 MAX-lab ACTIVITY REPORT 2010
SYNCHROTRON RADIATION – BEAMLINE I311
Cleaning and oxidation of nanoporous gold.
A detailed photoemission study.
A. Schaefera, D. Ragazzona, L. E. Walleb, A. Wittstockc, A. Borgb, M. Bäumerc, A. Sandella
a Uppsala University, Department of Physics and Astronomy, P.O.Box 516, SE-751 20 Uppsala, Sweden
b Norwegian University of Science and Technology, Department of Physics, NO-7491 Trondheim, Norway
c University of Bremen, Institute of Applied and Physical Chemistry, P.O.Box 33 04 40, D-28359 Bremen, Germany
Nanoporous gold (np-Au) is a fascinating class of bulk-nanostructured material. It is made up of a three-dimensional mesh of ligaments which can be between some tens of a nanometer up to several microns depending on the preparation conditions chosen1. This material is coined by its extended metallic surface and its high surface to volume ratio. Many of the unique properties of this material are a direct consequence of its sponge like morphology making its entire surface accessible to fluids and gases. In recent years several applications of this material in optics, sensors, and heterogeneous catalysis have been deployed and only a few studies are cited in the following. The key to many of these applications is the extended metallic surface being reversibly oxidized by molecular oxygen or ozone. As for example the oxidation of the surface by ozone was shown to alter the macroscopic dimensions of np-Au2. Recent studies covering the thermal stability of np-Au showed that surface oxygen plays a crucial role in stabilizing its structure and prevent coarsening3. Besides its impact on the mechanical properties of np-Au surface bonded oxygen can also be used as a reactant in heterogeneous catalysis4-5. As for example np-Au was shown to be an excellent catalyst for low temperature oxidation of CO and highly selective oxidation of alcohols such as methanol4, 6-7. Though all these applications are strongly linked to the reversible oxidation of the np-Au surface the picture derived so far remains elusive. Silver which is still contained in the material of preparation seems to play an important role especially when using molecular oxygen as a source for surface oxygen. 8-9 Further on, different oxide species present at the beginning of oxide formation as for higher coverages have been revealed in surface science studies of gold single crystals. However, a detailed chemical characterization of possible oxide species present at the np-Au surface is missing. The aim of the studies conducted at beamlines I411 and I311 was to investigate in detail a typical np-Au sample after dealloying by free corrosion in nitric acid. Additionally another sample was subjected to heat treatment and a cleaning procedure employing an O2/O3 gas stream admitted through a gas doser [~7-10 vol% O3, 2x10⁻⁷ mbar background pressure]. For the sample measured at I411 two weeks after dealloying in nitric acid (pristine sample) the existence of a “native” oxidic gold species could be proven for the first time (fig. 1a). Moreover, a detailed spectrum of the
carbon 1s region (not shown) revealed the presence of different oxidized (hydro-) carbon species, containing hydroxyls and carbonates amongst others. Heating such a sample to 140 °C for 19h decomposed the oxidic gold species and lead to desorption of the oxidized carbon species. A broadening of the Au 4f signal to lower BE values indicates a slightly higher amount of free low-coordinated Au atoms (fig. 1b). However, a significant amount of carbon was still detected. In an attempt to clean the surface ozone treatment was applied. Indeed the carbon impurities at the surface could be removed. Additionally the gold surface was oxidized, as is evidenced in fig 1c). Interestingly the nature of the oxide generated by ozone treatment seems to be different from the initially observed oxidic gold since the BE of the oxide signal in the Au 4f spectrum appears to be 0.41 eV lower. A further broadening towards lower BE values is a result of further cleaning and exposition of under-coordinated Au atoms from terraces and steps (kinks). A new signal appears at even lower BE values in the Au4f spectrum. Since the low BE regionhas not been investigated with high resolution so far no report of that signal is found in literature.
Fig. 2: Au4f7/2 core level spectra a) pristine sample b) after heating c) after oxidation by ozone d) after three days in UHV

MAX-lab ACTIVITY REPORT 2010 153
SYNCHROTRON RADIATION – BEAMLINE I311
It is likely that the signal is caused by Au atoms at the interface to a 2D gold surface oxide probably in similarity to Rh(111) substrates10. More detailed considerations are under way to substantiate this conclusion. The observed oxide is not stable in UHV for a longer period of time as was revealed after measuring the Au4f region again after storing the sample three days in UHV (fig. 1d). The oxide signals has disappeared as has the low BE signal, providing further evidence that those two signals are related. Additional insight into the nature of the gold oxide is provided by oxygen 1s core level spectra. At first, a spectrum from the pristine sample was recorded as shown in fig. 2a. At least two contributions can be discerned, which most likely are caused by oxidized carbon and hydrocarbon species (around 531.75 eV) and hydroxylated components. However, no significant intensity of a signal corresponding to the “native” gold oxide observed in the Au 4f spectrum is present. Such a signal would be expected around 530 eV BE and below. The oxygen spectrum of the heated sample (2b) also consists of two contributions but a shift to lower BE (530.69 and 532.97 eV) occurred compared to the spectrum of the pristine sample (2a). If now the ozone cleaning procedure described above is applied to the heated sample spectrum 2c) results. The signal at highest BE has disappeared and only a small contribution at 530.6 eV is left. The more striking change is the appearance of two new and sharp components at 529.08 eV and 529.94 eV, respectively. In literature three different oxygen species on single crystal gold existing after different oxidation treatments have been suggested: a mobile chemisorbed oxygen species without long range order, a surface oxide forming ordered two-dimensional structures and a bulk oxide forming crystallites with three-dimensional networks11. In our case we can identify the low BE signal as caused from chemisorbed oxygen and the signal at 529.94 eV as caused by oxygen atoms bond in a surface oxide structure. By heating annealing experiments (not shown) we got strong indication that there is an equilibrium between chemisorbed oxygen and the surface oxide, and that the rate limiting step for oxygen desorption is the transformation from surface oxide to chemisorbed species which then desorb. This behaviour has been suggested for single crystal surfaces earlier. Finally, as mentioned in the introduction the np-Au structures contain roughly 1 atm% of residual silver. At the surface, this content is higher, up to ~10%, as has been revealed by XPS in the past6 Upon the ozone cleaning procedure the silver is oxidized as well and enriched at the surface while the silver concentration decreases again upon reduction (heat + CO treatment and UHV storage) as shown in fig. 3. This can have implication on catalytic reactions during which atomic oxygen can be present since residual Ag is supposed to have important influence on the overall catalytic behaviour of np-Au. Further combined studies on the pre-cleaning and modification of np-Au in UHV and ex-vacuo are in progress.
1 A. Hodge, J. Hayes, J. Caro, J. Biener, and A. Hamza, Adv.
Eng. Mat. 8, 853 (2006). 2 J. Biener, et al., Nature Materials 8, 47 (2009). 3 J. Biener, A. Wittstock, M. M. Biener, T. Nowitzki, A. V.
Hamza, and M. Bäumer, Langmuir 26, 13736 (2010). 4 A. Wittstock, V. Zielasek, J. Biener, C. M. Friend, and M.
Bäumer, Science 327, 319 (2010). 5 T. A. Baker, X. Liu, and C. M. Friend, Phys. Chem. Chem.
Phys. 13, 34 (2011). 6 V. Zielasek, B. Jürgens, C. Schulz, J. Biener, M. M. Biener,
A. V. Hamza, and M. Bäumer, Angew. Chem. Ed. 45, 8241 (2006).
7 C. Xu, J. Su, X. Xu, P. Liu, H. Zhao, F. Tian, and Y. Ding, J. Am. Chem. Soc. 129, 42 (2006).
8 A. Wittstock, et al., J. Phys. Chem. C 113, 5593 (2009). 9 A. Wittstock, J. Biener, and M. Bäumer, Phys. Chem. Chem.
Phys. (2010). 10 J. Gustafson, et al., Phys. Rev. Lett. 92, 126102 (2004). 11 B. K. Min, A. R. Alemozafar, D. Pinnaduwage, X. Deng, and
C. M. Friend, J. Phys. Chem. B 110, 19833 (2006).
Fig. 3: Silver content at the np-Au surface as obtained from curve fitting of the Ag3dAu4d region
Fig. 2: O 1s core level spectra a) pristine sample b) after heating c) after oxidation by ozone

154 MAX-lab ACTIVITY REPORT 2010
SYNCHROTRON RADIATION – BEAMLINE I311
704 706 708 710 712 714 716 718
Inte
nsity
(arb
.un.
)
Photon energy (eV)
2 %Fe doped SrTiO3 filmXAS at the Fe L3 edge
Fig.1 Fig. 2
455 460 465
1% Fe doped SrTiO3 thin filmXAS at the Ti L2,3edge
Photon energy (eV)
Inte
nist
y (a
rb. u
n.)
Resonant photoemission study of functional materials for terabit
resistive switching memories
J. Szade1, D. Kajewski1, J. Kubacki1, A. Köhl2, Ch. Lenser2, R. Dittmann2,
R. Waser2, K. Schulte3
1A Che kowski Institute of Physics, University of Silesia, Katowice, Poland, 2Institute of Solid State Research, Forschungszentrum Juelich, 52425
Juelich, Germany 3 MAXlab, Lund University, P.O. Box 118, 221 00 Lund, Sweden
A large class of binary and ternary oxides shows the resistive switching effect. By applying an appropriate threshold voltage one can reversibly switch between low and high resistance states. Doped ABO3-perovskites are suitable functional materials for storage devices with a density in the terabit range since extended defects such as dislocations or defect clusters with nanoscale dimensions are considered to be the single resistive switching units [1,2]. One of the main goals of the project was to recognize the nature of conductance within the filaments and processes accompanying electroforming and switching for the samples of thin films of Fe doped SrTiO3 deposited on the Nb doped SrTiO3 single crystalline substrate. The resonant photoemission studies performed at the I311 beamline were aimed at clarifying the nature and origin of the states in the electronic gap which can be related with the well conducting filaments. Three samples were studied - epitaxial thin films of SrTiO3 doped with 1 % Fe, 2 % Fe and the undoped SrTiO3 film. The samples were annealed in UHV prior to studies. XAS spectra were obtained for all samples at the Ti, O and Fe low energy thresholds.

MAX-lab ACTIVITY REPORT 2010 155
SYNCHROTRON RADIATION – BEAMLINE I311
Fig. 3 of the F
Fig. 1same knowintensregionenhan4 eV We foHowebe coknowthat dFor thvoltagsampelectrby theThis MAT
Refer
[1] Kfilms[2] Kindiv[3] R“RealSrTiO[4] YOhas
Photoelectron Fe 2p-3d resona
1 shows the as reported f
wn Fe contaisity maps wen for the 2ncement of pand 6 eV. So
found clear coever, the effeonfronted wi
wledge about dopant in resihe 2 % Fe samge applied tole indicatingroformed same electroformwork was
TERA/3/2009
rences
K. Szot, R. D”, Physica S
K. Szot, W.vidual dislocaR. Münstermlization of reO3”, Appl. PY. Ishida, R.
hi, H. Ohta,
intensity map oance.
spectrum obfor the bulk Sining perovsere obtained 2% Fe film hotoemission
ome enhancemontributions
ect is differenith the calcuthe Fe contrisitive switchimple we perf
o a retractableg the proper mple. They emation proces
partly supp9
Dittmann, W.Status Solidi –. Speier, G.ations in sing
mann, R. Ditegular arrays
Phys. Lett. 93,Eguchi, M.
S. Shin, Phy
of the valence ba
btained for thSrTiO3. The Xskites. The for the interein the photo
n is visible inment of the infrom Ti, Fe
nt to that desclations (partiibution to theing behaviouformed electre Al foil elec
formation pxhibited verys.
ported by th
. Speier, R. –Rapid Rese. Bihlmayergle-crystallinttmann, K. s of nanoscal, 023110 (20. Matsunamiys. Rev. Lett.
and for the 2 %
he 1% Fe dopXAS spectrumbinding ene
esting resonaon energy ra
n the main pantensity in thand O states cribed recentlial densities e valence ban
ur. roformation ictrode. We coprocess. They slight but
he NCBiR
Waser, “Nanarch Letters , R. Waser,
ne SrTiO3”, NSzot, S. Mile resistive s008) i, K. Horiba100, 056401
Fe doped SrTiO
ped film. Thm at the Fe L
ergy versus ance regions. ange of the
art of the valehe energy gap
to the variouly for Nb dopof states) o
nd should en
in the preparaould observe
e selected spclear variatio
within the
noscale resis1, R86 (200
, “SwitchingNature Matei, C. L. Jia,witching blo
, M. Taguch1 (2008)
O3 thin film in th
he shape of thL3-edge (Fig.
photon enerFig. 3 showFe 2p-3d re
ence band – ap was also detus regions ofped SrTiO3 [4f the electro
nable us to el
ation chambee increasing cpectra were oon of the val
project N
stive switchin07). g the electrerials 5, 312 , P. Meuffeocks in thin f
hi, A. Chain
he photon energ
he spectrum 2) differs fro
rgy photoems the valenceesonance. A
at energies of tected. f the valence 4]. The resul
onic structurelucidate the r
er with the uscurrent througobtained fromlence states c
NCBiR/ERA-
ng in SrTiO
ical resistan(2006) ls and R. Wfilms of Nb-d
nani, Y. Senb
gy range
is the om the
mission e band
A clear f about
band. ts will e. The role of
se of a gh the m the caused
-NET-
3 thin
nce of
Waser, doped
ba, H.

156 MAX-lab ACTIVITY REPORT 2010
SYNCHROTRON RADIATION – BEAMLINE I311
Interface composition of atomic layer deposited HfO2 and Al2O3 thin films on InAs studied by XPS
R. Timm, M. Hjort, E. Lind, C. Thelander, L.-E. Wernersson, J. N. Andersen, and A. Mikkelsen
Department of Physics, The Nanometer Structure Consortium, Lund University
Thin high- oxide films on InAs, formed by atomic layer deposition (ALD), are the key to achieve high-speed metal-oxide-semiconductor devices [1]. Thereby the quality of the interface between the semiconductor and the high- material is crucial for the device performance for bulk InAs substrates [2] as well as for InAs nanowires [3]. X-ray photoemission spectroscopy (XPS) is a well-suited tool to investigate the chemical composition of the interface between III-V semiconductors and high- thin films, as has been shown in many cases for GaAs and InGaAs [4]. However, although InAs has an even higher electron mobility and is an important binary reference material, only a few XPS studies on high- thin films on InAs(100) substrates have been reported yet [5].
We have performed a detailed XPS investigation on the interface between InAs and 2-nm-thick Al2O3 or HfO2 layers, deposited by ALD at different temperatures, for InAs substrates with different surface orientations as well as for InAs nanowires with different crystal structure. From XPS core-level spectra we can reveal the composition of the native oxide and obtain how the high- layer deposition reduces the different oxide components.
Planar InAs(100) substrates have been prepared by a heat treatment in an As-rich environment to remove the epi-ready layer, followed by 30 s dip in HF and rinse in isopropanol. Al2O3 and HfO2 layers were deposited in a Cambridge NanoTech Savannah 100 ALD reactor, except for reference samples containing only a native oxide layer. XPS was performed at beamline I311, taking In 3d, In 4d, As 3d, O 1s, Hf 4f, and Al 2p core-level spectra at photon energies between 70 and 1330 eV. Spectra from several samples and various photon energies were fitted in a self-consistent way with the FITXPS package assuming a Doniach-Sunjic line form, with obtained peak parameters agreeing nicely with literature data [5].
Figures 1 and 2 show As 3d and In 3d spectra of an InAs reference sample compared with InAs/Al2O3 and InAs/HfO2 samples, demonstrating the strong oxide reduction. Two arsenic oxidation states (As+3 and As+5) can be distinguished, and their peaks in both high- samples have typically less than 10% the size of the corresponding peak in the reference sample. The In-oxide peak is only reduced to about half of its reference size in InAs/HfO2 samples of various depositions temperatures [Fig. 2(b)]. The
Figure 1: Fitted As 3d spectra of (a) an InAs reference, (b) an InAs/HfO2, and (c, d) two InAs/Al2O3
samples with different deposition temperatures. In (b), a constant part of the actually larger background is subtracted for clarity.

MAX-lab ACTIVITY REPORT 2010 157
SYNCHROTRON RADIATION – BEAMLINE I311
same is valid for InAs/Al2O3 samples with an ALD tempe-rature of 350°C [Fig. 2(c)], while for temperatures of 250°C or lower an In-oxide reduction down to 10% of the reference peak size is achieved [Fig. 2(d)]. In this case, however, the correspon-ding As 3d spectrum shows evidence of a thin AlAs film at the interface [Fig. 1(d)]. By simulating the relative oxide and bulk peak sizes for different samples and photon energies, the thickness of the native oxide film on the reference samples is obtained, which can then be compared with the reduced thickness of the oxide interface, as it is shown in Fig. 3. It should be noted that the native oxide film is not completely homogeneous, but that some sub-Oxide components seem to be located closer to the InAs material and others closer to the surface, as is discussed in more detail in reference [6].
The effectiveness of the oxide reduction upon high- deposition depends on the substrate surface orientation: We have compared InAs(100), InAs(111)A, and InAs(111)B samples with and without Al2O3 or HfO2 layers. InAs reference samples have the largest oxide peak for the (100) surface and smaller peaks for (111) surfaces, with more In-oxide at the In-rich (111)A surface and more As-oxide at (111)B. The strongest oxide reduction upon depo-sition of HfO2 or Al2O3 is obtained for (100) samples, while both In- and As-oxides are less effectively re-duced on (111)A or (111)B surfaces.
Beside planar InAs samples, even the interfaces of HfO2 and Al2O3 layers on InAs nanowires were studied. Typically, nanowire samples exhibit larger oxide peaks than the corresponding bulk samples, which can only partly be explained by the different geometry of planar surfaces and nanowires in the XPS experiment. Importantly, also for the InAs nanowires, a significant reduction of the native oxide upon depo-sition of HfO2 and especially Al2O3 is obtained.
[1] C. Thelander, L. E. Fröberg, C. Rehnstedt, L. Samuelson, and L.-E. Wernersson, IEEE Electron
Device Lett. 29, 206 (2008). [2] E. Lind, Y.-M. Niquet, H. Mera, and L.-E. Wernersson, Appl. Phys. Lett. 96, 233507 (2010). [3] S. Roddaro, K. Nilsson, G. Astromskas, L. Samuelson, L.-E. Wernersson, O. Karlström, and
A. Wacker, Appl. Phys. Lett. 92, 253509 (2008). [4] R. M. Wallace, P. C. McIntyre, J. Kim, and Y. Nishi, MRS Bulletin 34, 493 (2009). [5] R. Timm, A. Fian, M. Hjort, C. Thelander, E. Lind, J. N. Andersen, L.-E. Wernersson, and
A. Mikkelsen, Appl. Phys. Lett. 97, 132904 (2010). [6] R. Timm, M. Hjort, A. Fian, C. Thelander, E. Lind, J. N. Andersen, L.-E. Wernersson, and
A. Mikkelsen, Microelectron. Engineering, submitted.
Figure 3: Average thickness of the surface or interface oxide layer, respectively, ofInAs(100) reference samples, InAs/HfO2
samples, and InAs/Al2O3 samples withdifferent deposition temperatures.
Figure 2: Fitted In 3d spectra of (a) an InAs reference, (b) an InAs/ HfO2, and (c, d) two InAs/Al2O3 samples with different deposition temperatures.

158 MAX-lab ACTIVITY REPORT 2010
SYNCHROTRON RADIATION – BEAMLINE I311

MAX-lab ACTIVITY REPORT 2010 159
SYNCHROTRON RADIATION – BEAMLINE I311

160 MAX-lab ACTIVITY REPORT 2010
SYNCHROTRON RADIATION – BEAMLINE I311
N. A. Vinogradov1, 2, A. Zakharov2, May Ling Ng,1, 2 N. Mårtensson1, 2, and A. B. Preobrajenski2 1Department of Physics, Uppsala University, Box 530, 75121 Uppsala, Sweden 2MAX-lab, Lund University, Box 118, 22100 Lund, Sweden
One of the most serious technological challenges on the way towards graphene-based electronics is the process of inexpensive fabricating the large scale areas of high-quality graphene. Both monolayer and multilayer graphene can be grown by thermal decomposing hydrocarbons on hot d-metal surfaces like Ni(111) or Co(0001), and even on polycrystalline foils. In the context of high technological relevance of inexpensive routes towards large-scale graphene it is highly attractive to try graphene synthesis on iron. It has been shown recently that hexagonal BN can grow as a single monolayer on Fe(110) [1]. A close structural similarity between graphene and h-BN allows one to expect a similar (graphitic) growth mode for carbon at certain conditions, although a very rich C/Fe phase diagram is a challenge here, as it implies an easy formation of different carbides. Here we present first results showing the crystalline structure of carbon films formed on Fe(110), as obtained by micro-LEED and LEEM.
All measurements were performed in situ at the beamline I311, MAX-Lab, on the electron microscopy end station. The Fe(110) substrate was prepared by epitaxial growth of iron films (thickness ca. 20 nm) on the W(110) surface. The W single crystal was cleaned by several cycles of Ar+-sputtering, annealing in oxygen atmosphere and subsequent flashing in UHV. The cleanliness of the substrate was checked by LEED. After iron deposition the sample was gently annealed to improve the quality of the resultant Fe(110) surface, which was controlled by LEED [2,3] and LEEM. Carbon films were grown by thermal cracking of vaporized propene (C3H6) in contact with the hot metal surface at the temperature of ~630oC in the propene partial pressure of 5×10 8 mbar, the quality of the sample was verified by the homogeneity of the LEED pattern over the sample surface.
Figure 1 shows a typical LEEM image of the Fe/W(110) surface ensuring the high structural quality of the iron film. This can be deduced from the visibility of atomic steps of iron film imaged as horizontal stripes, as well as from a low amount of randomly scattered electrons which typically create a strong background.
Figure 2 shows the LEED pattern of the C/Fe(110) surface. Analogically to the hBN/Fe(110) interface [1], a number of spots attributed to the similar moir surface structure is observed. However, the LEED pattern of C/Fe(110) is much more complex than that of hBN/Fe(110). We attribute it to the poor quality of the sample probably due to both too high temperature of graphene growth which led to formation of multiple domains of carbidic C/Fe phase with random orientations instead of graphene and to
Figure 1. LEEM image of Fe/W(110) sample demonstrating high quality of the epitaxial iron film. The field of view is 15 μm.
Figure 2. A LEED pattern from the C/Fe(110) sample. Ep=102 eV.

MAX-lab ACTIVITY REPORT 2010 161
SYNCHROTRON RADIATION – BEAMLINE I311
References: [1] N.A. Vinogradov, M.L. Ng, A. Zakharov, E. Lundgren, N. Mårtensson, A. Preobrajenski, ECOSS27 abstract book, SDG-M2-119, 2010 [2] H. Bethge, D. Heur, Ch. Jensen, K. Reshört, U. Köhler, Surface Science 331 (1995) 878 [3] J. Ko aczkiewicz and E. Bauer, Surface Science 450 (2000) 106
the stress in the iron film due to the noticeable mismatch between Fe(110) and W(110) lattices. Nevertheless primary orientations of carbidic structures are still defined by the crystallographic directions of lattice match between graphene and Fe(110) as in the case of hBN/Fe(110).
Figure 3 shows μLEED patterns from different domain areas of the surface. Since the illumination aperture size is 10 μm and no spots of differently oriented domains could be detected on the successive μLEED patterns, the size of a single domain can be estimated as at least 10 μm. As can be seen from the LEEM image in the mirror mode (not shown) C/Fe domains with single orientation tend to occupy one or more terraces of Fe(110) surface, however boundaries of these domains perfectly match to the step edges.
Figure 4 shows a typical dark field mode image of domains with two different orientations. These domains tend to spread along the atomic steps on the iron surface. The LEEM image shows a rather high crystallographic quality of the C/Fe phase; however LEED and LEED patterns suggest that the sample is rather iron carbide than graphene on iron. More studies are planned for the determination of exact structure of carbon adsorbed on Fe(110), as well as for revealing the prospects for the growth of real graphene on Fe.
Figure 3. μLEED patterns from two different domain orientations of the C/Fe(110) sample.
Figure 4. A LEEM image of two differently oriented C/Fe domains taken in the dark field mode. Field of view is 20 m.

162 MAX-lab ACTIVITY REPORT 2010
SYNCHROTRON RADIATION – BEAMLINE I311
Constant energies imaging of ππ-cones from a buffer layer and after intercalation
C. Virojanadara, S. Watcharinyanon, A. A. Zakharov1, R. Yakimova and L. I. Johansson
Department of Physics, Chemistry and Biology, Linköping University, S-58183,
Linköping, Sweden
1Max Maxlab, Lund University, S-22100, Lund, Sweden An X-ray Photoelectron emission microscope (XPEEM) equipped with a hemispherical energy analyzer is capable of fast acquisition of momentum resolved photoelectron angular distribution patterns in a complete cone. We applied this technique to observe the 3D (E,kx,ky) electronic band structure from 0 and 1 ML graphene samples on SiC(0001) before and after Li intercalation [1]. For 0 ML samples no π-cones (bands) were detected close to the Fermi level, see Figs. 1 (a)-(b), while after Li deposition and heating clearly resolved π-cones appear at the K-points in the BZ, see Figs. 1 (c)-(d). The 0 ML graphene sample less wrinkles/cracks were observed to form on the surface after Li deposition and heating compared to on 1 ML samples. The observed deterioration in quality of the graphene upon Li intercalation may be connected to an explanation why the efficiency in fuel cell reduces with usage.
Fig. 1. Photoelectron angular distribution patterns (E,kx,ky) collected from 0 ML graphene at an initial state energy of (a) 1.2 eV and (b) 0.2 eV below the Fermi level, using a photon energy of 35 eV. (c)-(d) Patterns collected from the 0 ML graphene sample after Li deposition and heating at 350°C at the same initial state energies as in (a)-(b), respectively.

MAX-lab ACTIVITY REPORT 2010 163
SYNCHROTRON RADIATION – BEAMLINE I311
Reference 1. C. Virojanadara, A. A. Zakharov, S. Watcharinyanon, R. Yakimova and L. I.
Johansson, “A LEEM and XPEEM study of Li intercalated into graphene on SiC(0001)”, New J. Phys. 12, 125015(2010)

164 MAX-lab ACTIVITY REPORT 2010
SYNCHROTRON RADIATION – BEAMLINE I311
Micro LEED on Single Micro Crystal of Anatase TiO2
Shun Yu1, Sareh Ahmadi1, Alexei Zakharov2, Chenghua Sun1,3, Mats Göthelid1
1 Materials Physics, ICT, Royal Institute of Technology, Electrum 229, SE-16440 Stockholm, Sweden 2 Max-lab, Lund University, Box 118, SE- 22100 Lund, Sweden
3 The University of Queensland, ARC Centre of Excellence for Functional Nanomaterials and Centre for Computational Molecular Science, Australia Institute for Bioengineering and Nanotechnology, The
University of Queensland, Qld 4072, Australia
Shape-controlled nanostructures are of great interest due to their often new physico-chemical propertiesi,ii,iii. Among metal oxides, anatase TiO2 is of special importance in the field of energyiv and catalysis v due to their outstanding photoelectrochemcial properties. Theoretical calculations predict that the (001) surface should be the most active one because of the low atomic coordination numbers and the wide Ti-O-Ti bond angle. However, it is thermodynamically less stable than (101) which naturally dominates over (001). Recently Lu’s group has successfully developed a method to synthesize nanoplates with up to 64% (001) plane, using fluorine to stabilize this surfacevi,vii,viii.
The fluorine-based synthesis method utilizes the fact that F effectively lowers the surface energy making (001) and (101) growth rates comparable. In addition, on the (001) surface a (1x4) reconstruction further lowers the surface energy compared to pristine (1x1) surfaces ix . However, it is not clear if the reconstruction is created at high F concentrations. Theoretically it is predicted that formation of O-F and Ti-F bond may pin the atomic movement on the surface and consequently quench the reconstructionvi. The completely removal of F can be realized by thermal treatment at 600 oC for 90 min. Whether desorption of F facilitates the (1x4) reconstruction or not will be a significant evidence to justify the theoretical interpretation.
The TiO2 microcrystals were suspended in an aqueous solution only by deionized water to avoid further organic contamination, dipped by droplets on natural silica covered Si(100) substrates and dried in air. After being transferred into the UHV system, the crystal was first outgassed at 150 oC for around 15 min. Micro LEED pattern was taken on the same crystal at round 60 oC after each 5 min annealing. For 150 oC, 250 oC and 500 oC, the start voltage is around 48 V; for 600 oC, the start voltage is around 28 V.
After outgassing, LEED showed a clear 1×1 pattern, which is bulk related. By increasing the annealing temperature, surface related spots become clearer. However,

MAX-lab ACTIVITY REPORT 2010 165
SYNCHROTRON RADIATION – BEAMLINE I311
until 500 oC, no well resolved surface pattern can be resolved. A greatly improved LEED pattern was observed after 600 oC annealing for 5 min when a sharp two domain (1×4/4×1) pattern was collected. However, even though the LEED pattern evolution matches the theoretical prediction and other experimental evidence that fluorine desorption might induce a 1×4 recontruction, other aspects should also be taken into account. For example, surface contaminations due to the ex-situ preparation method. In that case, the contamination covered surface will either modify the surface structure or simply block the signal from the surface, leaving only the bulk contribution. This type of influence should be minimized in the future by improving sample preparation condition.
i (a) Tian, N.; Zhou, Z. Y.; Sun, S. G.; Ding, Y.; Wang, Z. L. Science 2007, 316, 732. (b) Yin, Y.; Alivisatos, A. P. Nature 2005, 437, 664. ii Wang, C.; Daimon, H.; Onodera, T.; Koda, T.; Sun, S. Angew.Chem., Int. Ed. 2008, 47, 3588. iii Jun, Y.; Choi, J.; Cheon, J. Angew. Chem., Int. Ed. 2006, 45, 3414. iv O’Regan, B.; Grätzel, M. Nature 1991, 353, 737 v Fujishima, A.; Honda, K. Nature 1972, 238,37 vi Yang, H. G.; Sun, C. H.; Qiao, S. Z.; Zou, J.; Liu, G.; Smith, S. C.; Cheng, H. M.; Lu, G. Q. Nature 2008, 453, 638. vii Gang Liu, Hua Gui Yang, Xuewen Wang, Lina Cheng, Haofeng Lu, Lianzhou Wang, Gao Qing (Max) Lu, and Hui-Ming Cheng, J. Phys. Chem. C, 2009, 113, 21784-21788 viii Yang, H. G.; Liu, G.; Qiao, S. Z.; Sun, C. H.; Jin, Y. G.; Smith, S. C.; Zou, J.; Cheng, H. M.; Lu, G. Q. J. Am. Chem. Soc. 2009, 131, 4078–4083. ix Lazzeri, M. & Selloni, A. Phys. Rev. Lett. 87, 266105 (2001).

166 MAX-lab ACTIVITY REPORT 2010
SYNCHROTRON RADIATION – BEAMLINE I311
Nano-scale 3D(E,kx,ky) band structure imaging by XPEEM A.A.Zakharov1, C.Virojanadara2, S. Watcharinyanon2, L.I.Johansson2 1MAX-lab, Lund University, S-22100, Lund, Sweden, 2Dept. of Physics, Chemistry and Biology, Linköping University, S-58183, Linköping, Sweden
Mapping of the electron band structure or the Fermi surface of a solid using angle
resolved photoelectron spectroscopy is commonly quite tedious and time consuming. The
technique requires the mechanical scanning of the sample at least in one direction and many
photoelectron spectra have typically to be collected in order to fully determine the energy and
momentum of the electron states in the Brillouin Zone. Here we show that an energy filtered
X-ray Photoelectron emission microscope (XPEEM) is capable of fast acquisition of
momentum resolved photoelectron angular distribution patterns. By imaging the diffraction
plane of the objective lens1 an energy slice of the photoelectron angular distribution pattern
from a very small (<1μm) area on the surface can be collected in a complete cone in one shot
and projected on the screen. To restrict the aberrations we use an extremely small selected
area aperture and probe a sub-micrometer (800nm) area of the sample. We apply this
technique to observe the 3D (E,kx,ky) electronic band structure of 0, 1 and 2 monolayer
graphene grown ex-situ on 6H-SiC(0001) substrates where a carbon buffer layer (0ML) forms
underneath the graphene layer(s). Fig.1a shows a typical LEEM image from such a surface.
Diffraction patterns (micro-LEED) originating from 1 and 2ML areas (Fig.1b,d,
correspondingly) show distinct decrease in spot intensities around the main graphene spots for
a 2ML island. Area selected azimuthal distributions of the photoelectron intensity can be
recorded by placing the selected area aperture (SAA) either on the 1ML surface or a 2ML
island. In Fig.1c,e two-dimensional momentum resolved photoelectron angular distribution
patterns shown at a 2.5eV binding energy from a small (800nm) area for 1ML (Fig.1c) and
2ML(Fig.1e) island. For 2ML island the second π-band in the electronic band structure
becomes clearly observable (Fig.1e). In Fig.2 two dimensional (kx,ky) photoelectron angular
distributions are shown as a function of electron energy down to 4eV below the Fermi level.
The shape of the well known graphene band structure with the Dirac points approximately
0.4eV below the Fermi level is clearly reproduced. The results presented demonstrate the
uniqueness and the versatility of high energy and momentum resolved XPEEM and broadens
the applicability and impact of this technique within surface science and nanotechnology.
1 Th.Schmidt, et al. Surface Review and Letters, vol.5, no.6, pp.1287-1296, 1998.

MAX-lab ACTIVITY REPORT 2010 167
SYNCHROTRON RADIATION – BEAMLINE I311
μ
Fig.2. Energy resolved 2D (kx,ky) maps for 1ML graphene given by the angular distribution of photoelectrons. The binding energy is indicated at each image. The images are collected from an area of 800nm diameter on the surface.
c
1ML
2ML
2μμm
a b
c
a
b
e
b
d
Fig.1. a): LEEM image from an ex-situ grown sample of 1ML graphene with 2ML islands; electron energy is 4.6eV. b) and d) Electron diffraction: μ-LEED images (400nm sampling area) acquired at 60eV electron energy from 1ML (b) and 2ML (d) areas. c) and e) Photoelectron diffraction: high energy resolution 2D (kx,ky) maps for 1ML (c) and 2ML (e) graphene taken at an electron binding energy of 2.5eV below the Fermi level. Two π bands are clearly seen from the 2ML island. Photon energy is 35eV.

168 MAX-lab ACTIVITY REPORT 2010
SYNCHROTRON RADIATION – BEAMLINE I411
Photoelectron spectroscopy studies of the 5s and 4d bands in free silver clusters T. Andersson1, C. Zhang1, M.-H. Mikkelä2, D. Anin2, K. Jänkälä2, M. Tchaplyguine3,
G. Öhrwall3, M. Huttula2, N. Mårtensson1,3, S. Svensson1, O. Björneholm1
1Dept of Physics and Astronomy, Uppsala University, Box 530, 751 20 Uppsala, Sweden 2Dept of Physical Sciences, University of Oulu, Box 3000, 90014 Oulu, Finland
3MAX-lab, Lund University, Box 118, 223 63 Lund, Sweden We have probed the 5s and 4d valence bands of free Ag clusters using photoelectron spectroscopy. The clusters were produced in two different ways, 1) with a gas aggregation source[1] where silver was first vaporized using magnetron-based sputtering[2], and the vapour atoms were then condensed to clusters in a liquid nitrogen-cooled cryostat, and 2) with a pick-up source[3] (a.k.a. EXMEC source) where argon clusters were sent through silver vapour created in an oven with induction heating. Photoelectron spectra recorded with 40 and 60.5 eV photon energies are presented in figure 1 (gas aggregation source) and 2 (pick-up source) below.
Figure 1. Photoelectron spectra of the 5s and 4d valence bands in free silver clusters, produced by a gas aggregation source, recorded with 40 and 60.5 eV photon energies. Absolute calibration was done using the water peak at 12.62 eV binding energy. Apart from the higher intensity of the 5s band for the 40 eV spectrum, one can also see differences in the 4d feature between the two spectra. The relative intensity between the two maxima is clearly different, and also the lower-energy maximum is shifted towards lower binding energies in the 40 eV spectrum by more than half an eV. With the gas aggregation source, we typically produce clusters with a number of constituent atoms at least in the ~103 range. As the cluster on-set of the 5s band is indistinguishably close to the solid state on-set, the clusters are probably quite large (possibly in the ~105 range).

MAX-lab ACTIVITY REPORT 2010 169
SYNCHROTRON RADIATION – BEAMLINE I411
Figure 2. Photoelectron spectra of the 5s and 4d valence bands in free silver clusters, produced by a pick-up source, recorded with 40 and 60.5 eV photon energies. Absolute calibration was done using the argon 3p peaks. Also in this case the 5s signal is stronger for the 40 eV photon energy. The difference in the 4d feature is also similar to the case of larger clusters, the relative intensity between the two maxima is clearly different, and also the lower-energy maximum is shifted towards lower binding energies in the 40 eV spectrum, but this time by less than half an eV. From the difference of the 5s band on-sets for the clusters and solids, we can estimate the clusters to have a mean radius of ~1 nm and to contain a few hundred atoms. A noticeable dependence of the spectral shape on the photon energy has been observed also for free copper clusters containing ~103-104 atoms [4], where the lower binding energy part of the valence density of states was gaining in relative intensity with the photon energy increase from 60 eV up to 130 eV. In ref. 4 this was, at least partially, assigned to the photon energy dependence of the electron escape depth, facilitating the response of the bulk density of states at certain photon energies. References 1. S. Peredkov, G. Öhrwall, J. Schulz, M. Lundwall, T. Rander, A. Lindblad, H. Bergersen, A. Rosso, W. Pokapanich, N. Mårtensson, S. Svensson, S. L. Sorensen, O. Björneholm, and M. Tchaplyguine, Phys. Rev. B 75, 235407 (2007) 2. M. Tchaplyguine, S. Peredkov, H. Svensson, J. Schulz, G. Öhrwall, M. Lundwall, T. Rander, A. Lindblad, H. Bergersen, S. Svensson, M. Gisselbrecht, S. L. Sorensen, L. Gridneva, N. Mårtensson, O. Björneholm, Rev. Sci. Instr. 77, 033106 (2006) 3. M. Huttula, M.-H. Mikkelä, M. Tchaplyguine, O. Björneholm, J. Electron Spectrosc. Relat. Phenom. 181, 145–149 (2010) 4. M. Tchaplyguine, S. Peredkov, A. Rosso, J. Schulz, G. Öhrwall, M. Lundwall, T. Rander, A. Lindblad, H. Bergersen, W. Pokapanich, S. Svensson, S. L. Sorensen, N. Mårtensson, O. Björneholm, Eur. Phys. J. D 45, 295 (2007)

170 MAX-lab ACTIVITY REPORT 2010
SYNCHROTRON RADIATION – BEAMLINE I411
Fig.1 K 2p cluster (<N>~103) spectrum recorded at 320 eV photon energy. K 2p1/2 “line” overlaps with a plasmon-loss feature due to the kinetic energy loss of the 2p3/2
photoelectrons
Auger parameter in free nanoscale metal clusters: Does the old approach hold?
I.Bradeanu1, A.Rosso1, G.Öhrwall2, S.Svensson2, N.Mårtensson2, O.Björneholm2, M.Tchaplyguine2
1Department of Physics and Astronomy, Uppsala University, Box 516 , 75 120 Uppsala, Sweden 2Max-lab, Lund University, Box 118, 22100 Lund, Sweden
In early days of electron spectroscopy C.D.Wagner proposed a method to characterize the changes in the chemical environment of a certain element in different compounds using the so-called Auger parameter [1,2]. This magnitude is calculated as a sum of the core-electron binding energy Eb and of the subsequently emitted Auger-electron kinetic energy Ek: = Eb + Ek. The advantage of such a characteristic is that the Auger-parameter value is free of the energy-reference problem - in contrast to either core-ionization energy or Auger energy treated separately. In numerous studies it has been shown that for the same core levels in different compounds the largest
has been the case for the free-electron substances - metals, and the smallest -in the compounds where the screening of the core-vacancy should be the weakest. Within reasonable assumptions based on electrostatics the difference between the Auger parameters for two chemical states, a free atom and a solid compound, gives the extra-atomic (ea) relaxation/screening energy[1] in the corresponding solid: 2R
ea. In the present work the authors have attempted to consider the Auger parameter method for free metallic nanoparticels/clusters, at the dimension scale when the number of constituent atoms (and thus of free electrons) is finite and relatively small.
For such particles with a countable number of free electrons the task has been to determine the Auger parameter, and to analyze the consistency of the experimental cluster Auger spectrum and the expected extra-atomic relaxation energy extracted from the so-called XPS-shift for free clusters and from the Auger parameter difference cl-at. Experimentally the task has been realized in a study on a beam of unsupported potassium clusters containing several thousand atoms, by measuring binding energies for two core levels – 2p and 3p - and recording the corresponding Auger spectrum due to the transition between them. Using a beam of free nanoparticles allows avoiding uncertainties introduced by the substrate, the interaction with which changes nanoparticle geometry and energy-levels. The so-called gas-aggregation cluster source [3] creating a cluster beam propagating in vacuum, has been attached to the
permanent experimental station of the I411 beamline. The x-ray photoelectron spectra and Auger spectra have been recorded with an electrostatic energy analyzer Scienta R4000 placed at 90 degrees to the horizontal polarization plane of the beamline radiation. Photon energies have been chosen to combine the
highest possible ionization cross-sections of the 2p and 3p potassium core-levels under investigation and the more intense regions of the beamline radiation: 320-330 eV for the K 2p and 100 eV for the K 3p. In the clusters created in the present work the K 2p response with two main “lines” centered at 296.6 eV and 299.3 eV (Fig.1) has practically reproduced that of solid potassium [4], being just 0.2 eV above the latter. Also a similar layout of the solid/cluster spectrum and the atomic one[5]-with two main lines due to the 2p3/2 and 2p1/2 states- justifies the estimation of the atom-solid energy shift - in the core-ionization transition- by just subtracting the corresponding energies from each other. This gives Ea-c=Eat-Ecl 4 eV. Since both cluster and atom energies are measured relative to the same, vacuum level this difference is then the change in the binding energy mainly due to the core-hole extra-atomic screening [6], and should be the same as Rea. (For the 3p cluster states with the cluster feature at
21 eV [3] one gets the same 4 eV separation as for the 2p level between the atom and the cluster responses in the spectra. The cluster Auger spectrum recorded in the present work and shown in Fig.2 has a continuous shape, with at least three distinct maxima - at around 245 eV, at 247, and 249 eV. The cluster spectrum practically reproduces the shape of the solid-case spectrum from C.D.Wagner’s Handbook of X-ray Photoelectron Spectroscopy [7]. The solid K spectrum has its maximum at 247.7 eV kinetic energy with the Fermi edge as a zero

MAX-lab ACTIVITY REPORT 2010 171
SYNCHROTRON RADIATION – BEAMLINE I411
Fig.2 a- Cluster Auger spectrum due to 2p-13p64s 2p63p-24s transition, four maxima are seen- at 245, 247, 249, 252 eV; b- K 2p Auger spectrum for solid KCl; c-free-atom spectrum due to the same transition- shifted up in energy by 8 eV; d - free-atom Auger spectrum shifted up in energy by 12 eV
point in the original spectrum [7], and thus 245.4 eV relative to vacuum. The Auger parameter sol calculated for the p state with the values of Wagner, occurs to be equal to 542 eV. In order to interpret the cluster and solid Auger spectra it is helpful to look at the results for the K 2p
-1 level decay in crystalline potassium halides [8]. Due to the 4s-electron absence in K ions in alkali-halide crystals the K 2p
Auger decay occurs to be analogous to the Ar-atom 2p core-vacancy decay [8]: the same as in Ar final doubly ionized states 1S, 1
D, and 3P of the K3+ 3p
4 configuration are populated. The experimental Auger kinetic energy spectrum of solid KCl [8], has practically the same spectral shape and even the same absolute energy position as the K metal cluster spectrum. Also in free K atoms the Auger spectrum layout is very similar to that of K salts and metal/cluster - probably because of the weak coupling of the 4s electron to the ionic core. It is tempting then to relate the most intense atomic Auger line at 236.7 eV -due to the 2p3/2
3p4(
1D)4s
2D5/2,3/2 transition [9]- and the cluster feature
maximum at 245 eV. There are three additional arguments for that: 1) 245 eV is also the solid Auger energy [7]; 2)K 3p
4 state with the same 1
D ionic-core term in the solid KCl is at 245 eV; 3)Since the cluster and solid 2p binding energies are also very similar, the cluster Auger parameter would be very close to that reported for the solid [2], as it should be. The correspondence assumed for the atomic and cluster Auger spectra would mean the shift for the atomic Auger lines for 8eV up in kinetic energy (Fig.2). The other atomic lines when shifted up for 8 eV would also match well the overall cluster profile. For the most intense atomic Auger L3,2-3p
4(
1D)4s
2D5/2,3/2 lines
one calculates: at p )=300.6 eV+236.7 eV=537.3 eV, at p ) =303.4 eV+239.5 eV=542.9 eV. Within the 8 eV-shift
assumption for the cluster transitions corresponding to the above used atomic ones, the Auger parameter for two- 2p3/2 and 2p3/2 - initial states are obtained as: cl p ) =296.5 eV + EAug
p )= 541.2 eV, and cl p ) = 299.2 eV + EAug
p )=546.6eV. The difference between the atom and cluster parameter cl-at would
be 3.9 and 3.7 eV, respectively. As mentioned above, the cluster cl p ) value occurs to be very close to Wagner’s 542 eV for solid K, what gives sol-at p ) 4.7 eV. However, cl-at and sol-at estimated within the assumption of 8 eV Auger shift are too small to be twice the screening energy Rea, which is shown above to be about 4 eV. Indeed, the derivation of sol-at assumes the two times larger charge of the final-state ion giving a 4 times larger energy of interaction with the surrounding electron density: R
ea(3p-2)=4Rea(2p
-1). Then the difference between Rea(3p
-2) and Rea(2p
-1) is 3Rea(2p
-1). This relation would mean a 12 eV atom-solid Auger shift and correspondingly different cluster Auger spectrum interpretation. The most intense atomic Auger line at 236.7 eV due to 2p3/2 3p
4(
1D)4s
2D5/2,3/2 transition would
correspond to the cluster maximum at 249 eV, the latter being then due to the 3p4(
1D) final state. I assignment oft
is this assignment of the cluster Auger spectral features which would be consistent with the electrostatic considerations. A lot of intensity below 245 eV one can try explaining as due to the Auger electrons experiencing inelastic losses –in plasmon excitations and valence –electron excitations.
1 C.D.Wagner, J.Joshi. J.El.Spectr. Rel.Phen. 47 (1988) 283. 2 G.Moretti. J.El.Spectr.Rel. Phen. 95 (1998) 95. 3 A.Rosso. G. Öhrwall, I. L. Bradeanu, S. Svensson, O. Björneholm, M.Tchaplyguine. Phys.Rev. A 77 (2008) 043202.4 P.M.Blass, X.-L- Zhou, J.M.White. Surf. Sci. 215 (1989) 74. 5 K. Jänkälä, R. Sankari, J. Schulz, et al. Phys. Rev. A 73 (2006) 022720. 6 O. Björneholm, G. Öhrwall, M. Tchaplyguine, Nucl. Instr. Methods A 609 (2009) 161. 7 Handbook of x-ray photoelectron spectroscopy, edited by C.D.Wagner et al. 1979, Perkin-Elmer Corporation. 8 E.Kukk, M.Huttula, H.Aksela, S.Aksela, E. Nommiste, A.Kikas. J.Phys.B 36 (2003) L85. 9 S.Aksela, M.Kellokumpu, H.Aksela, and J.Väyrynen. Phys.Rev. A 23 (1980) 2374.

172 MAX-lab ACTIVITY REPORT 2010
SYNCHROTRON RADIATION – BEAMLINE I411
Vinylene carbonate (VC)
Lithium bis(oxalato)borate (LiBOB)
Propargyl methanesulfonate (PMS)
Fig. 1 Electrolyte additives used in our study.
When the battery operates, a surface layer is formed on the electrodes: it is called the Solid Electrolyte Interphase (SEI). This layer causes some capacity lost due to irreversible electrolyte reduction. However, the formation of a thin and stable SEI is needed to maintain passivation of graphite and protect it from, e.g., solvent co-intercalation. Electrolyte additives are being reduced prior to other electrolyte components; they change the composition of the SEI and the battery performance (Fig. 2).
Fig. 2 Capacity retention in a LiFePO4/graphite cell studied without additives and with VC, LiBOB and PMS.
The changes at electrode-electrolyte interfaces are studied with photoelectron spectroscopy (PES). Ion etching is commonly used to obtain depth profiling, however it can lead to decomposition of unstable surface products [1]. Here, synchrotron radiation at Max IV in Lund and Bessy in Berlin is used to obtain a unique non-destructive PES depth profiling. Four different excitation energies, in the 260-6900 eV range, are used. The excitation energy for
O O
O O
B-
OO
OOO
OO
Li+ O O
CH3
O
SCH
Room temperature
0
20
40
60
80
100
0 5 10 15 20 25 30 35 40
Cycle number
Dis
char
ge c
apac
ity re
tent
ion
/ %
No additive
2% VC
2% VC + 1% LiBOB
1% PMS
60 oC
0
20
40
60
80
100
1 3 5 7 9
Cycle number
Dis
char
ge c
apac
ity re
tent
ion
/ %
No additive
2% VC
2% VC + 1% LiBOB
1% PMS
Investigating the solid electrolyte interphase with functional electrolytes
Katarzyna Ciosek1, Sara Malmgren1, Maria Hahlin1, Håkan Rensmo2, Kristina Edström1
1 The Ångström Advanced Battery and Fuel Cell Centre Department of Materials Chemistry, Uppsala University
2 Department of Physics and Astronomy, Uppsala University Electrolyte additives are one of the cheapest and most effective ways to improve safety and performance of the Li-ion battery. A small amount of an additive is added to the electrolyte to improve its characteristics. Here, film forming additives are investigated: vinylene carbonate (VC), lithium bis(oxalato)borate (LiBOB) and propargyl methane-sulfonate (PMS) (Fig. 1).

MAX-lab ACTIVITY REPORT 2010 173
SYNCHROTRON RADIATION – BEAMLINE I411
References [1] A.M. Andersson, A. Henningson, H. Siegbahn, U. Jansson, K. Edström, Journal of Power Sources 119–121 (2003) 522
Fig. 3 Depth profiles of delithiated graphite measured without additives (A) and with PMS (B) at 4 different kinetic energies.
different core levels is varied for most surface sensitive measurements in order to obtain similar mean free path. In figure 3 depth profiles of delithiated graphite cycled without additives and with PMS are shown. The bulk graphite peak is observed at 1200 eV for the non-additive sample and at 2000 eV for the PMS sample, which indicates that the battery cycled with the additive has thinner SEI. It has also more LiF, which in unwanted element of SEI due to low lithium permeability.
Fig. 4 Comparison of lithiated graphite spectra measured at 120 eV.
In figure 4 spectra measured for lithiated graphite at 120 eV (the most surface sensitive measurement) are compared. VC and LiBOB additives lead to formation of LiF in the surface film, however when they are added together to one electrolyte the formation of LiF decreases significantly. Surface film formed on an electrode cycled with PMS shows more ether and carbonate containing products.

174 MAX-lab ACTIVITY REPORT 2010
SYNCHROTRON RADIATION – BEAMLINE I411
Effects of solvation in the fragmentation of ammonia molecules
M. Gisselbrecht1, C. Grunewald1, E. Månsson1, J. Laksman1, A. Sankari1, M Tchaplyguine2, O. Björneholm3, S.L. Sörensen1
1 Dept. of Synchrotron Radiation Research, Institute of Physics, Lund University
P.O. Box 118, S-221 00 Lund, Sweden2 MAXlab, Lund University, P.O. Box 118, S-221 00 Lund, Sweden
3 Department of Physics, Uppsala University, P.O. Box 534, S-75121 Uppsala, Sweden
The last decades Van der Waals clusters have been subject of growing interest to investigate matter in soft X-ray regime (e.g [1-2]). Ammonia (and water) molecular clusters are prototypes for studying the transition from isolated ions to solvation in the liquid phase [3]. The inter atomic/molecular forces encountered in the bonding of these clusters such as, the dispersion interaction, the dipole-dipole interaction and hydrogen interaction are expected to play a major role in redistributing internal energies.
“Coulomb explosion” of multiply charged clusters enables examining the various channels of energy dissipation in matter. Our results on atomic clusters demonstrate that nuclear motion takes actively part in thermo-cooling [4]. Such a mechanism in molecular clusters would activate vibrational modes resulting in new fragmentation pathways. To our knowledge experimental and theoretical studies on multiply charged ammonia molecular clusters are scarce. Only recently, delayed Coulomb fission of doubly charged stable ammonia cluster has been studied [5], and the fission mechanism is found to be well described within the framework of a dielectric liquid drop model.
Control of the fragmentation dynamics requires knowing the initial conditions that lead mother clusters to undergo fragmentation. This can be partially achieved by photo-ionization in the vicinity of the N-1s edge.
Experiment part
Figure 1: Fragmentation spectra at 420 eV. (Upper Panel) Ammonia clusters fragments time-of-flight. (Lower panel) Transverse momentum of the fragment. The dash line indicates the momentum drift due to the initial velocity in the cluster beam.
The experiment was carried out in the 1-meter section of the beam line I411 with a 3D imaging momentum spectrometer capable of high mass resolving power (m/ m 1500). We access the complete kinetics of ionic fragments by measuring individual ions in coincidence using a Position Sensitive Detector (PSD) to derive their momenta from the time of flight and positions. The clusters were produced with an adiabatic expansion source that allows changing cluster size from a few molecules to more than fifty molecules. With this

MAX-lab ACTIVITY REPORT 2010 175
SYNCHROTRON RADIATION – BEAMLINE I411
References [1] T. Jahnke et al 2010 Nat. Phys. 6, 139 [2] M. Hoerner et al 2008 Phys. Rev. A. 78, 021201-R [3] A. Lindbald et al 2011 Phys. Chem. Chem. Phys 2009, 11 1758 [4] M. Gisselbrecht et al submitted at PRA [5] G. Wu et al 2011 J. Chem. Phys. 134, 031103 [6] H. Shinohara et al 1985 J. Chem Phys. 83, 1939 [7] H. Nakai et al 2000 Chem Phys. 262, 201
method of production, neutral clusters have an initial velocity in the order of 900 m/s that leads to an increasing drift of the momentum for larger fragments as can be seen in figure 1.
Results In contrast to free molecules, the fragmentation of ammonia clusters does not produce
small fragments such as H+, N+, NH+. All modes of fragmentation in the molecule are inhibited due to solvation. At 390 and 420 eV photon energies, singly and multiply charged clusters undergo fragmentation and mass spectra exhibit a simple pattern with only protonated (NH3)nNH4
+ species in comparison to homogeneous species (NH3)n+ observed at 10 eV
photon energy [6]. These protonated species are attributed to a fast intra-cluster proton transfer with subsequent neutral evaporation.
There is a relatively high abundance of small fragments up to (NH3)4NH4+, where the first
closed shell system with a charged ammonium molecule is in the center the cluster fragment. The four ammonia molecules are relatively tightly bound due to the hydrogen bonding interaction [7]. The intensity of fragments continuously decreases for larger fragments, without noticeable change when the second shell, (NH3)16NH4
+, is closed. This suggests that interaction energy between the first-second shells and second-third shells, due to dispersion interaction and dipole-dipole interactions, are comparable with the internal energy left in nuclear motion. Figure 2 shows an average angular correlation diagram between protonated fragments measured in coincidence. This diagram shows a preferential back-to-back emission, i.e. ions repel each other during the fragmentation. It suggests that the dissociation is fast and Coulomb repulsion is a primary driving force. This behavior is quite general and does not depend on the photon energy and the fragment sizes. A very efficient charge
Figure 2: Angular correlation diagram between two protonated fragments. The arrow indicates the emission of the first fragments.
migration mechanism must occur. This (ultra) fast migration/delocalization of the charges before break up is further supported by the decrease of the kinetic energy released when the fragment size increases. Indeed this decrease means that charges are getting further away when the fragment size increases. However, the angular correlation diagram is comparable to that of neon van der Waals clusters where the high mobility of ionic atoms is assumed to be the reason for charge migration [2]. Therefore a comparison with molecular clusters having heavier atoms is under progress to examine the interplay between these two competing factors, namely the charge delocalization and mobility of the ions.
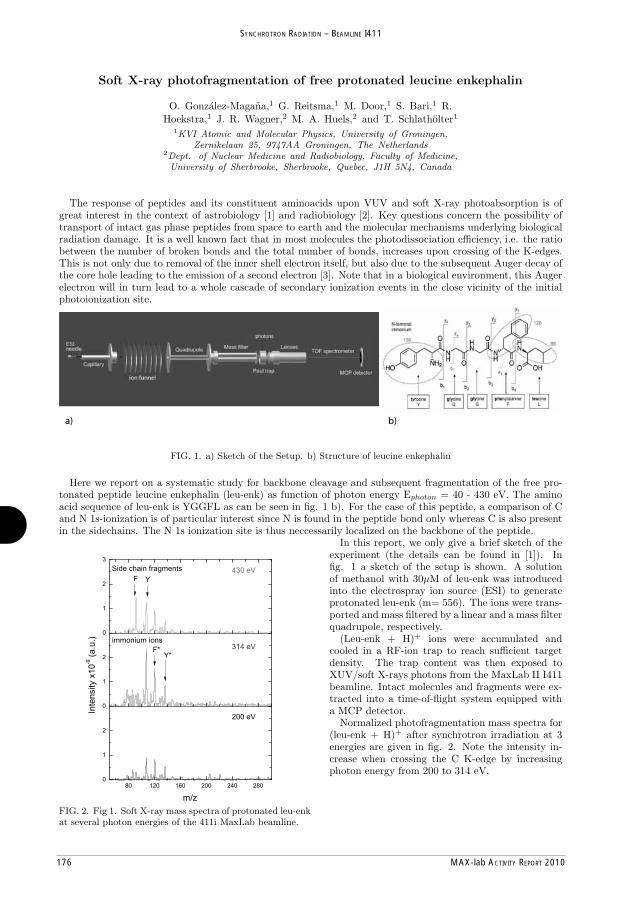
176 MAX-lab ACTIVITY REPORT 2010
SYNCHROTRON RADIATION – BEAMLINE I411
Soft X-ray photofragmentation of free protonated leucine enkephalin
O. Gonzalez-Magana,1 G. Reitsma,1 M. Door,1 S. Bari,1 R.
Hoekstra,1 J. R. Wagner,2 M. A. Huels,2 and T. Schlatholter1
1KVI Atomic and Molecular Physics, University of Groningen,
Zernikelaan 25, 9747AA Groningen, The Netherlands2Dept. of Nuclear Medicine and Radiobiology, Faculty of Medicine,
University of Sherbrooke, Sherbrooke, Quebec, J1H 5N4, Canada
The response of peptides and its constituent aminoacids upon VUV and soft X-ray photoabsorption is ofgreat interest in the context of astrobiology [1] and radiobiology [2]. Key questions concern the possibility oftransport of intact gas phase peptides from space to earth and the molecular mechanisms underlying biologicalradiation damage. It is a well known fact that in most molecules the photodissociation efficiency, i.e. the ratiobetween the number of broken bonds and the total number of bonds, increases upon crossing of the K-edges.This is not only due to removal of the inner shell electron itself, but also due to the subsequent Auger decay ofthe core hole leading to the emission of a second electron [3]. Note that in a biological environment, this Augerelectron will in turn lead to a whole cascade of secondary ionization events in the close vicinity of the initialphotoionization site.
a) b)
FIG. 1. a) Sketch of the Setup. b) Structure of leucine enkephalin
Here we report on a systematic study for backbone cleavage and subsequent fragmentation of the free pro-tonated peptide leucine enkephalin (leu-enk) as function of photon energy Ephoton = 40 - 430 eV. The aminoacid sequence of leu-enk is YGGFL as can be seen in fig. 1 b). For the case of this peptide, a comparison of Cand N 1s-ionization is of particular interest since N is found in the peptide bond only whereas C is also presentin the sidechains. The N 1s ionization site is thus neccessarily localized on the backbone of the peptide.
FIG. 2. Fig 1. Soft X-ray mass spectra of protonated leu-enkat several photon energies of the 411i MaxLab beamline.
In this report, we only give a brief sketch of theexperiment (the details can be found in [1]). Infig. 1 a sketch of the setup is shown. A solutionof methanol with 30μM of leu-enk was introducedinto the electrospray ion source (ESI) to generateprotonated leu-enk (m= 556). The ions were trans-ported and mass filtered by a linear and a mass filterquadrupole, respectively.(Leu-enk + H)+ ions were accumulated and
cooled in a RF-ion trap to reach sufficient targetdensity. The trap content was then exposed toXUV/soft X-rays photons from the MaxLab II I411beamline. Intact molecules and fragments were ex-tracted into a time-of-flight system equipped witha MCP detector.Normalized photofragmentation mass spectra for
(leu-enk + H)+ after synchrotron irradiation at 3energies are given in fig. 2. Note the intensity in-crease when crossing the C K-edge by increasingphoton energy from 200 to 314 eV.
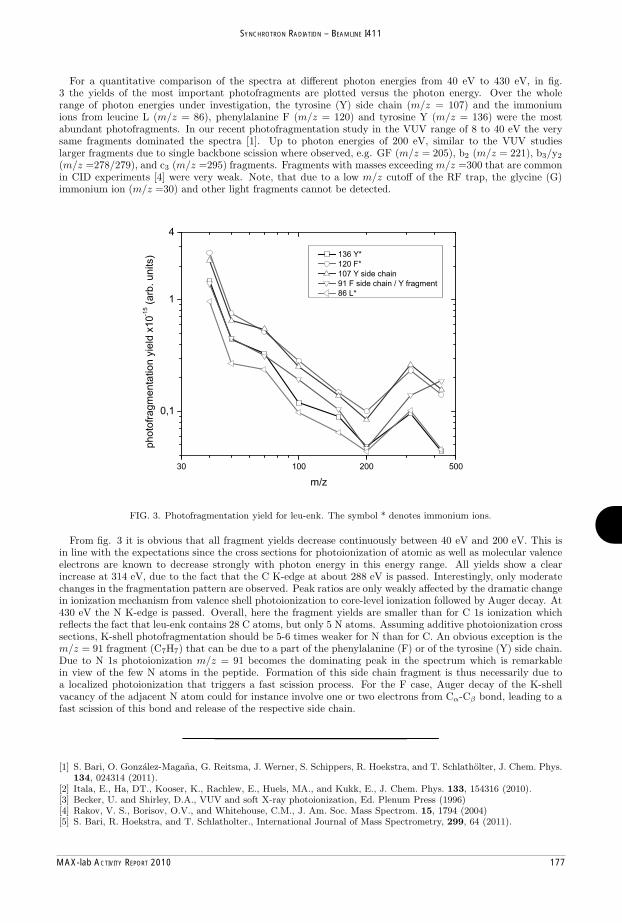
MAX-lab ACTIVITY REPORT 2010 177
SYNCHROTRON RADIATION – BEAMLINE I411
FIG. 3. Photofragmentation yield for leu-enk. The symbol * denotes immonium ions.
From fig. 3 it is obvious that all fragment yields decrease continuously between 40 eV and 200 eV. This isin line with the expectations since the cross sections for photoionization of atomic as well as molecular valenceelectrons are known to decrease strongly with photon energy in this energy range. All yields show a clearincrease at 314 eV, due to the fact that the C K-edge at about 288 eV is passed. Interestingly, only moderatechanges in the fragmentation pattern are observed. Peak ratios are only weakly affected by the dramatic changein ionization mechanism from valence shell photoionization to core-level ionization followed by Auger decay. At430 eV the N K-edge is passed. Overall, here the fragment yields are smaller than for C 1s ionization whichreflects the fact that leu-enk contains 28 C atoms, but only 5 N atoms. Assuming additive photoionization crosssections, K-shell photofragmentation should be 5-6 times weaker for N than for C. An obvious exception is them/z = 91 fragment (C7H7) that can be due to a part of the phenylalanine (F) or of the tyrosine (Y) side chain.Due to N 1s photoionization m/z = 91 becomes the dominating peak in the spectrum which is remarkablein view of the few N atoms in the peptide. Formation of this side chain fragment is thus necessarily due toa localized photoionization that triggers a fast scission process. For the F case, Auger decay of the K-shellvacancy of the adjacent N atom could for instance involve one or two electrons from Cα-Cβ bond, leading to afast scission of this bond and release of the respective side chain.
[1] S. Bari, O. Gonzalez-Magana, G. Reitsma, J. Werner, S. Schippers, R. Hoekstra, and T. Schlatholter, J. Chem. Phys.134, 024314 (2011).
[2] Itala, E., Ha, DT., Kooser, K., Rachlew, E., Huels, MA., and Kukk, E., J. Chem. Phys. 133, 154316 (2010).[3] Becker, U. and Shirley, D.A., VUV and soft X-ray photoionization, Ed. Plenum Press (1996)[4] Rakov, V. S., Borisov, O.V., and Whitehouse, C.M., J. Am. Soc. Mass Spectrom. 15, 1794 (2004)[5] S. Bari, R. Hoekstra, and T. Schlatholter., International Journal of Mass Spectrometry, 299, 64 (2011).
For a quantitative comparison of the spectra at different photon energies from 40 eV to 430 eV, in fig.3 the yields of the most important photofragments are plotted versus the photon energy. Over the wholerange of photon energies under investigation, the tyrosine (Y) side chain (m/z = 107) and the immoniumions from leucine L (m/z = 86), phenylalanine F (m/z = 120) and tyrosine Y (m/z = 136) were the mostabundant photofragments. In our recent photofragmentation study in the VUV range of 8 to 40 eV the verysame fragments dominated the spectra [1]. Up to photon energies of 200 eV, similar to the VUV studieslarger fragments due to single backbone scission where observed, e.g. GF (m/z = 205), b2 (m/z = 221), b3/y2(m/z =278/279), and c3 (m/z =295) fragments. Fragments with masses exceeding m/z =300 that are commonin CID experiments [4] were very weak. Note, that due to a low m/z cutoff of the RF trap, the glycine (G)immonium ion (m/z =30) and other light fragments cannot be detected.

178 MAX-lab ACTIVITY REPORT 2010
SYNCHROTRON RADIATION – BEAMLINE I411
Soft X-ray photofragmentation of free protonated oligonucleotides
O. Gonzalez-Magana,1 G. Reitsma,1 M. Door,1 S. Bari,1 R.
Hoekstra,1 J. R. Wagner,2 M. A. Huels,2 and T. Schlatholter1
1KVI Atomic and Molecular Physics, University of Groningen,Zernikelaan 25, 9747AA Groningen, The Netherlands
2Dept. of Nuclear Medicine and Radiobiology, Faculty of Medicine,University of Sherbrooke, Sherbrooke, Quebec, J1H 5N4, Canada
Most biological effects of ionizing radiation are triggered by direct and indirect DNA damage. The latter ismainly due to DNA interaction with free radicals from radiolysis of nearby water molecules. Direct damage toDNA on the other hand can either be due to the primary quanta of radiation themselves or due to secondaryparticles such as electrons and ions. The interaction of soft X-rays with DNA in the condensed phase hasbeen studied recently by Ptasinska et al. [1] who applied X-ray photoelectron spectroscopy to investigatedchemical DNA modifications such as dehydrogenation and oxygen loss. However, the assignment of suchreaction pathways to a particular damage mechanism remains ambiguous because of the interplay of direct andindirect damage.In order to study the direct effect, only, over the last decade, numerous studies have been devoted to the
investigation of ionization and fragmentation dynamics of isolated gas phase DNA building blocks upon interac-tion with energetic photons [2, 3], low energy electrons [4, 5] and keV ions [6, 7]. The gas phase studies have ledto a much better understanding of the molecular mechanims underlying biological radiation damage. However,a major drawback of the gas phase studies was the fact that in order to reach sufficient density, effusive targetsproduced by evaporation were employed.
100 200 300 400 5000.00.30.60.91.21.51.80.00.30.60.91.21.51.8
(C+H)+
(GCAT+2H)2+
m/q (amu)
(GTAT+2H)3+
(GCAT+2H)3+
(G+H)+
(T+H)+
(A+H)+
PO3H+
2
inte
nsity
(GTAT+2H)2+G
C
A
T
FIG. 1. a) Structure of GCAT. b) Photofragment mass spectra of (GCAT+2H)2+ and (GTAT+2H)2+ at 70 eV photonenergy.
More complex biomolecules such as proteins and oligonucleotides already decompose thermally upon verymoderate heating. To overcome this limitation we have recently commissioned an apparatus based on an in-house built electrospray ionization (ESI) source, used to produce a beam of protonated biomolecules. Afterpassing a radiofrequency (RF) ion funnel and a collisionally focussing quadrupole RF ion guide, the doublyprotonated tetranucleotides GCAT and GTAT were mass selected by an RF quadrupole mass filter. Eventuallya target of the selected biomolecular ions was accumulated in a 3D RF ion trap. A pulse of He buffer gas wasinjected to collisionally cool the trapped ions. The trap was interfaced with the MAXLab II I411 beamline.The trap content was exposed to soft X-ray photons for several 100 ms, before the trap content was extractedinto a time-of-flight (TOF) mass spectrometer. The ions were detected by a silhouette-type micro-channel-plate detector (El-Mul) operated in analog mode and interfaced with a 1 GHz digitizer (Z-Tec). To removecontributions of buffer gas and neutral molecules from the ESI source to the mass spectra a cycling techniquewas used. Mass spectra obtained for ESI source off and ion beam off were subtracted from the inclusive spectrasequentially.A typical photofragmentation spectrum with sufficient statistics required acquisition of about 1000 acquisition
cycles. A typical mass spectrum obtained after 70 eV photoionization of the doubly protonated oligonucleotidesGCAT and GTAT is shown in figure 2. In both cases, the strongest peak is due to PO3H
+2 from the sugar-
phosphate backbone. In cellular DNA the loss of such a phosphate group will induce the formation of a

MAX-lab ACTIVITY REPORT 2010 179
SYNCHROTRON RADIATION – BEAMLINE I411
0 100 200 300 400 500
0.1
1
10
phot
ofra
gmen
tatio
n yi
eld
(arb
. uni
ts)
photon energy (eV)
81 PO3H+2
127 (T+H)+
136 (A+H)+
152 (G+H)+
0 100 200 300 400 500
0.1
1
10
phot
ofra
gmen
tatio
n yi
eld
(arb
. uni
ts)
photon energy (eV)
81 PO3H+2
112 (C+H)+
127 (T+H)+
136 (A+H)+
152 (G+H)+
single strand break. Pan et al [8] observed desorption of OH− from solid NaH2PO4 upon low energy electronirradiation, which are expected to arise from POH bond cleavage by dissociative electron attachment, givingrise to the same fragment. Note, that while the RF-trap has a cutoff for m/z < 70 , we do not observe (moreor less) intact sugar fragments from the backbone, viz fragments in the 99 to 115 amu range, which most likelydisintegrate and contribute to the unobservable fragment signal. This supports the notion that in DNA thesugar moiety is the most fragile, as noted elsewhere [9, 10]. At higher masses, strong peaks due to protonatednucleobases are found. For GCAT, the intensities follow the sequence C, A, G, T - for GTAT the cytosinemoiety is obviously absent. We note, however that while for GTAT the intensities scale as T = A > G, forGCAT A > T. A more salient aspect of the present measurements is that while the molecular mass of thebases in the oligo is 1 amu less than the mass of the canonical free base (due to the glycosidic bond), here wealways observe a base+1 amu cation. This means that base release following photoinization involves not justmere proton pickup from within the parent oligo (e.g. the original proton from electrospray ionization thatoften localizes on the bases), which would lead to the observation of a molecular mass equal to a base cation.Instead it is found that it involves both concerted hydrogen abstraction and proton transfer from within theoligo during dissociation, namely the observation of a base+1 amu cation. (GCAT+2H)3+ and (GTAT+2H)3+
due to non-dissociative photoionization can be clearly identified. In general, we must note that for all photonenergies no larger fragments such as intact nucleosides, nucleotides, or half oligos, etc., are observed, whichsuggests that the protonated oligos are very sensitive to fragmentation.
FIG. 2. Photofragment yields for the dominant dissociation products from GCAT (left) and GTAT (right) as a functionof photon energy
In figure 2, the yields of PO3H+2 and protonated nucleobases as a function of photon energy are plotted
for both GCAT and GTAT. With increasing energy, the yields first decrease strongly, reflecting the decreasingphotoionization cross sections for electrons from the valence band. The decrease continues up to photon energiesof 250 eV, crossing P 2s and 2p absorption edges at 142 eV and 199 eV. At higher photon energies, the K-edgesof C (≈288 eV) and N (≈410 eV) are crossed. It is obvious that photoionization of P does not contributestrongly to the yields whereas for K-shell photoinization of C and N, a clear increase in yield is observed for allfragment ions under study.For all fragments under study, the photon energy dependence is similar. This finding implies that the location
of the ionization site (P is only found in the backbone, N is only found in the nucleobases) is not affectingfragmentation. Such an independence could be due to relatively long fragmentation time scales. If all excitationenergy deposited in the molecule by the photoionization process would distribute over the entire molecule byinternal vibrational redistribution, the fragmentation would be site-independent. However, another explanationfor our observation could be the fact that protonated oligonucleotides are relatively unstable, as obvious from thesmall fragments observed. Possible site effect would then be more pronounced in de-protonated oligonucleotides.
[1] S. Ptasinska, A. Stypczynska, T. Nixon, N. J. Mason, D. V. Klyachko, and L. Sanche. J. Chem. Phys. 129,065102 (2008).
[2] H.-W. Jochims, M. Schwell, H. Baumgartel, and S. Leach. Chem. Phys. 314, 263 (2005).[3] G Vall-llosera, M. A. Huels, M. Coreno, A. Kivimki, K. Jakubowska, M. Stankiewicz, and E. Rachlew.
ChemPhysChem 9, 1020 (2008).[4] G. Hanel, B. Gstir, S. Denifl, P. Scheier andM. Probst, B. Farizon, M. Farizon, E. Illenberger, and T. D. Mark.
Phys. Rev. Lett. 90, 188104 (2003).[5] H. Abdoul-Carime, S. Gohlke, and E. Illenberger. Phys. Rev. Lett. 92, 168103 (2004).[6] J. de Vries, R. Hoekstra, R. Morgenstern, and T. Schlatholter. Phys. Rev. Lett. 91, 053401 (2003).[7] T. Schlatholter, R. Hoekstra, S. Zamith, Y. Ni, H. G. Muller, and M. J. J. Vrakking. Phys. Rev. Lett. 94,
233001 (2005).[8] X. Pan and L. Sanche. Chem. Phys. Lett. 421, 404 (2006).[9] K. Fujii, K. Akamatsu, and A. Yokoya. Surf. Sci. 528, 249254 (2003).
[10] Z. Deng, I. Bald, E. Illenberger, and M. A. Huels. Phys. Rev. Lett. 95, 153201 (2005).

180 MAX-lab ACTIVITY REPORT 2010
SYNCHROTRON RADIATION – BEAMLINE I411
Atom-solid binding energy shifts for K 2p and Rb 3d sublevels
M. Holappaa, S. Akselaa, M. Patanena, S. Urpelainena,b, and H. Akselaa
a Department of Physical Sciences, P.O. Box 3000, 90014 University of Oulu, Finland
b MAX-lab, Lund University, Box 118, SE-22100 Lund, Sweden
Binding energy shifts between free and solid state atoms for K 2p and Rb 3d photolines have been determined by measuring the vapor and solid state spectra simultaneously in similar experimental conditions applying synchrotron radiation excited photoelectron spectroscopy. This method has the important benefit that the work function is not needed to correct for different reference energy levels, therefore much more accurate values for binding energy shifts are obtained.
The measurements were carried out at the I411 beamline of the MAX II synchrotron radiation storage ring. A resistively heated oven was used to evaporate the solid samples. The 2p photoelectron spectra of K were measured with the photon energy of 365 eV and the 3d photoelectron spectra of Rb with the photon energy of 200 eV. In these measurements a needle like surface was located into the vapor beam and the spectra from the vapor around the tip and from the condensed solid layer were simultaneously observed. The vapor atoms in the vicinity of the solid tip are very accurately in the potential of the solid surface which form the joint reference potential. The needle was made from a copper wire which was covered with the tantalum wire wrapped around the aluminium oxide tube. Using this experimental setup both vapor and solid state spectra could be observed simultaneously in identical experimental conditions. No work function correction is needed because the spectra have the same reference energy level (work function potential).
K 2p and Rb 3d photoelectron spectra from simultaneous measurements are shown in figures 1 and 2. In the 2p photoelectron spectrum of K also bulk plasmons are seen, the plasmon satellites are broad features centered at 300.0 eV and 302.8 eV. The obtained energy values for the plasmons energies are 3.72 eV. The binding energy shifts between atom and solid for K 2p photolines is 4.2 eV and for Rb 3d photolines 3.7 eV. Photolines of solid K and Rb are thus several eV in lower binding energies relative to photolines of vapor. This is mainly done by the extra atomic relaxation (screening) of the ionized final state, which lowers the total energy of the

MAX-lab ACTIVITY REPORT 2010 181
SYNCHROTRON RADIATION – BEAMLINE I411
emitting system and thus increases the kinetic energy of the emitted electron (decreaces the binding energy). The second contribution to the observed shifts arises from the initial state chemical shift of atoms in solids. This is however much smaller in elemental solids. The solid photolines are separated into surface and bulk components because the atoms are in two different chemical environments. Bulk sites experiences a stronger screening than surface sites and therefore binding energy of a core electron is smaller in bulk region than in surface region.
Accurate binding energy shifts between atoms and solids for 2p photolines of K and 3d photolines of Rb are reported. Vapor and solid measurements were carried out simultaneously in the same potential and determination of work function is not needed.
Fig. 1. K 2p PES taken simultaneously from vapor and solid sample. Blue lines corresponds to 2p1/2 and 2p3/2 vapor lines. Red line for solid is the surface and black line the bulk peak. Green lines correspond the bulk plasmons. Red circles are measured data points, solid black line is the total fitted spectrum and dashed black line is the Shirley background.
Fig. 2. Rb 3d PEs taken simultaneously from vapor and solid sample. Blue lines corresponds to 3d3/2 and 3d5/2 vapor lines. Red line for solid is the surface and black line the bulk peak. Red circles are measured data points, solid black line is the total fitted spectrum and dashed black line is the Shirley background.
8000
6000
4000
2000
0
Inte
nsity
(arb
. uni
ts)
306304302300298296294Binding energy (eV)
K 2psolid 2p3/2 solid 2p1/2
vapor 2p3/2 vapor 2p1/2
10x103
8
6
4
2
0
Inte
nsity
(arb
. uni
ts)
120118116114112Binding energy (eV)
Rb 3d
solid 3d5/2 solid 3d3/2
vapor 3d5/2
vapor 3d3/2

182 MAX-lab ACTIVITY REPORT 2010
SYNCHROTRON RADIATION – BEAMLINE I411
Molecular fragmentation of pyrimidine derivatives following site-selective carbon core-ionization E. Itäläa, b, D. T. Haa, b, K. Koosera, c, E. Rachlewd, E. Nõmmistec, U. Joostc, M. A. Huelse and E. Kukka, f
a Dept. of Physics and Astronoy, University of turku, FIN-20014 Turku, Finland b Graduate School of Materials Research (GSMR), FIN-20500 Turku, Finland c Atomic and Molecular Physics, Royal Institute of Technology KTH, S-106 91 Stockholm, Sweden d Institute of Physics, University of Tartu, Riia 142, 51014 Tartu, Estonia e Dept. of Nuclear Medicine and Radiobiology, Faculty of Medicine, University of Sherbrooke, Sherbrooke, J1H 5N4 Quebec, Canada f Turku University Centre for Materials and Surfaces (MatSurf), FIN-20014 Turku, Finland Site-dependent fragmentation of three cyclic biomolecules - uracil, 5-bromouracil and thymine - into pairs of cations has been studied using electron-energy-resolved photoelectron-photoion-photoion coincidence (PEPIPICO) spectroscopy [1-3]. Previous studies concerning ionization site dependent fragmentation have mainly been carried out with linear molecules. We found out that all studied molecules have dicationic fragmentation channels whose intensity depends on the initial core-ionization site, although these channels cover only a relatively small fraction of the total fragment yield. The present study shows on one hand, that it is often the surrounding bond(s) of the ionized atom that will break following the initial core ionization, and on the other hand, that some specific fragmentation channels can display strong site-dependency where there is no direct correlation between the ionization site and the bond breakage locations. The apparatus for the present PEPIPICO measurements consists of a modified Scienta SES-100 electron energy analyzer and a home-made Wiley-Mclaren type ion time-of-flight detector. More detailed description about the PEPIPICO method and the measurement equipment has been described in detail in Ref. [4]. The C 1s photoelectron spectra measured in coincidence with all photoions are presented in Fig 1. The peak positions are in good agreement with earlier measurements of thymine [5] and uracil [6], and their assignment is according to these works. As seen, different carbon sites are well resolved in all cases except for the overlapping C5 and C9 peaks in thymine.
Inte
nsity
(Arb
itrar
y un
its)
296 294 292 290Binding energy (eV)
C2C4
C6C5, C9
C2C4 C6 C5
Thymine
5-BrUracil
C2 C4
C6 C5Uracil
Figure 1. C 1s photoelectron spectrum (background subtracted) of thymine and 5-bromouracil measured with 330eV and of uracil measured with 315eV photon energy. Solid lines represent a least-squares curve-fitting decomposition of the spectrum. Structures of the studied molecules are shown next to the spectra.

MAX-lab ACTIVITY REPORT 2010 183
SYNCHROTRON RADIATION – BEAMLINE I411
As the data analysis is explained and results can be found in more detail in Ref. [7], only a brief description is given here. In order to extract the site selective effects, so called PEPIPICO maps [8], where the ion pairs appear as tilted patterns, are used. For each photoline, also a PEPIPICO map is made, which allows one to see possible site selective effects as intensity variations between the same patterns in different maps. In Figure 2 there is an example of a significant and non-existent site selectivity.
Figure 2. PEPIPICO patterns of the fragmentation of Thymine. Top row: fragment pair (HNCOH+, C4H4ON+), bottom row: fragment pair (HNCH+, HNCO+). Columns A-D correspond to the core-ionization of carbons C2, C4, C6 and C5 + C9, respectively.
Our study shows the suitability of electron energy resolved PEPIPICO for investigating the initial ionization site-dependent fragmentation in cases where individual atoms are separable by sufficient chemical shifts in the XPS spectra. All three molecules exhibit site-dependent fragmentation effects, which are, however, restricted to the weaker fragmentation channels. This is quite understandable, as the dominant pathways are likely to involve a multitude of electronic states thus being not sensitive to their exact population distribution by Auger transitions, whereas for the minor pathways the role of the ionization site and the population of specific dicationic states can be much more important. Some of the channels where site-dependency was observed involved light fragments such as C+ and/or CO+. In these cases the results indicate that the bonds adjacent to the core-ionized atom tend to weaken, enhancing the production of the corresponding fragments. The most interesting pathway was observed in thymine and uracil, producing large fragments in two-body fragmentation ((HNCOH+, C4H4ON+) for thymine and (HNCOH+, C3H3ON+) for uracil). It is a clear example that even relatively complex cyclic molecules can exhibit strong site-dependent behavior in specific cases. According to our interpretation, in this particular case the site-dependent enhancement appears clearly, since (a) the Auger decay populates selectively a particular dicationic state only at certain core-hole sites and (b) due to low excess energy in that state, the variety of available fragmentation pathways is much restricted. [1] C. J. Danby, J. H. D. Eland, Int. J. of Mass Spectrom. and Ion Phys. 8, 153 (1972). [2] M. Simon, T. LeBrun, P. Morin, M. Lavollee, J.L. Marechal, Nucl. Instr. Methods B 62, 167 (1991). [3] J. H. D. Eland, Laser Chem. 11, 259 (1991). [4] E. Kukk, R. Sankari, M. Huttula, A. Sankari, H. Aksela and S. Aksela, J. Electron Spectrosc. Relat. Phenom. 155
141 (2007). [5] O. Plekan, V. Feyer, R. Richter, M. Coreno, M. de Simone, K.C. Prince, A.B. Trofimov, E.V. Gromov, I.L.
Zaytseva, J. Schirmer, Chem. Phys. 347, 360 (2008). [6] V. Feyer, O. Plekan, R. Richter, M. Coreno, G. Vall-llosera, K. C. Prince, A. B. Trofimov, I. L. Zaytseva, T. E.
Moskovskaya, E. V. Gromov, J. Schirmer, J. Phys. Chem. A, 113, 5736 (2009). [7] E. Itälä, D. T. Ha, K. Kooser, E. Rachlew, E. Nõmmiste, M. A. Huels, E. Kukk, J. Electron Spectrosc.
RelaPhenom. "VUVX2010 Special Issue" (2010). [8] E. Itälä, E. Kukk, D. T. Ha, S. Granroth, A. Caló, L. Partanen, H. Aksela, S. Aksela; J. Chem. Phys. 131, 114314 (2009).

184 MAX-lab ACTIVITY REPORT 2010
SYNCHROTRON RADIATION – BEAMLINE I411
Valence Photoionization of Neutral Metal Clusters
K. Jankala1, M.-H. Mikkela1, M. Huttula1, M. Tchaplyguine2 and O. Bjorneholm3
1Department of Physical Sciences, University of Oulu, Finland2MAX-lab, Lund University, Sweden
3Department of Physics and Materials Science, Uppsala University, Sweden
Clusters are nanometer scale objects that contain few to few thousand atoms or molecules.These objects pose peculiar properties from gaseous and solid states of matter that vary as afunction of cluster size. Therefore, for some time clusters have been of keen interest in studies ofbasic as well as applied physics. Since the 80’s numerous studies of ionization of vapor phase clustersusing laser sources have been published, but only recently cluster sources providing target densitiesthat are sufficient for photoionization studies using synchrotron radiation have been developed.The use of synchrotron radiation allows one to probe the energy regions that are free from variousvalence excitations that hinder the data analysis. VUV and X-ray energy region photons may alsoionize clusters from core levels, thus opening Auger decay channels.
In a recent study [1], our lately constructed exchange metal cluster source (EXMEC) [2] wasused to study valence ionization of initially neutral K and Rb alkali-metal clusters. The experimentwas carried out at MAX-lab at beamline I411. The ionizing photon energy used was 40 eV and thesize range of the clusters varied from 30 to 650 atoms. This allowed us to study for the first timevalence ionization of medium sized initially neutral metal clusters in the photon energy region freefrom any disturbing resonances.
1.2
1.0
0.8
0.6
0.4
0.2
0.0
Inte
nsity
(arb
. uni
ts)
5.0eV4.54.03.53.02.52.01.5Binding Energy
Rb Cluster signal
Atomic Rb
Figure 1: Valence photoelectron spectrum of medium sized (∼ 500) Rb clusters. The spectrumshows also signal from 5s valence ionization of atomic Rb.
As an example, figure 1 shows an experimental valence photoelectron spectrum of initially neu-tral Rb clusters measured at MAX-lab. The average size of the clusters in this case is approximately500 atoms. The photon energy was used 40 eV. The cluster signal is seen between the atomic va-lence ionization energy of about 4.18 eV and the bulk work function of 2.16 eV. The position of themost intensive point of the cluster signal was seen to move towards the atomic line as a function ofdecreasing cluster size. In addition, in the case small clusters (size < 100 atoms) the photoelectronspectrum start to show discrete structures due to less dense array of occupied valence energy levels.On the other hand, the photoelectron spectra obtained from large clusters was seen to approachthe shape expected for solid Rb [1].
Theoretical ab initio description of photoionization of clusters is a very demanding problem. Thesize of the calculation increases exponentially as a function of cluster size, and reliable description

MAX-lab ACTIVITY REPORT 2010 185
SYNCHROTRON RADIATION – BEAMLINE I411
of photoelectron wavefunctions even for the smallest clusters is far from a trivial task. Thereforeone need to rely on approximative descriptions of different levels. In our recent study we appliedso-called jellium model to describe the experimental results [1, 3]. In this simple model the cluster’svalence electrons are assumed to move independently in a spherically symmetric potential createdby the other electrons and nuclei. Figure 2 shows the result from an example calculation for Rb58cluster together with two continuum wavefunctions.
Figure 2: Calculated Rb58 cluster’s valence jellium orbitals in a spherical potential well and twocontinuum partial wavefunctions.
The model was used to simulate our experimental findings. As a result we found that thevalence ionization of molten alkali-metal clusters can be qualitatively described surprisingly wellusing such a simple model. Our approach allowed the calculation of continuum wavefunctionsand the ionization dipole matrix elements. From these calculations we found that the use ofcontinuum wavefunctions in the description of valence ionization in clusters is crucial. The resultthus demonstrated that the commonly used density of states approximation for relative ionizationprobabilities may yield misleading results due to lack of proper description of matrix elements.Figure 3 depicts example calculations for photoelectron spectra of three different sizes of Rb clusters.Comparing the largest size (Rb558) to the experiment shown in figure 1 a very nice agreement canbe seen.
1.5 2.0 2.5 3.0 3.5 4.0 4.5 5.00.0
0.2
0.4
0.6
0.8
1.0
Binding Energy eV
Inte
ntity
arb.
units
Figure 3: Simulated valence photoelectron spectrum of Rb40 (dotted), Rb58 (solid) and Rb558(dashed) clusters.
References
[1] K. Jankala, M.-H. Mikkela and M. Huttula, Europhysics Letters, Submitted (2011).
[2] M. Huttula, M.-H. Mikkela, M. Tchaplyguine and O. Bjorneholm, J. Electron Spectrosc. Relat.Phenom. 181, 145 (2010).
[3] M. Koskinen and M. Manninen, Phys. Rev. B 54, 14796 (1996).
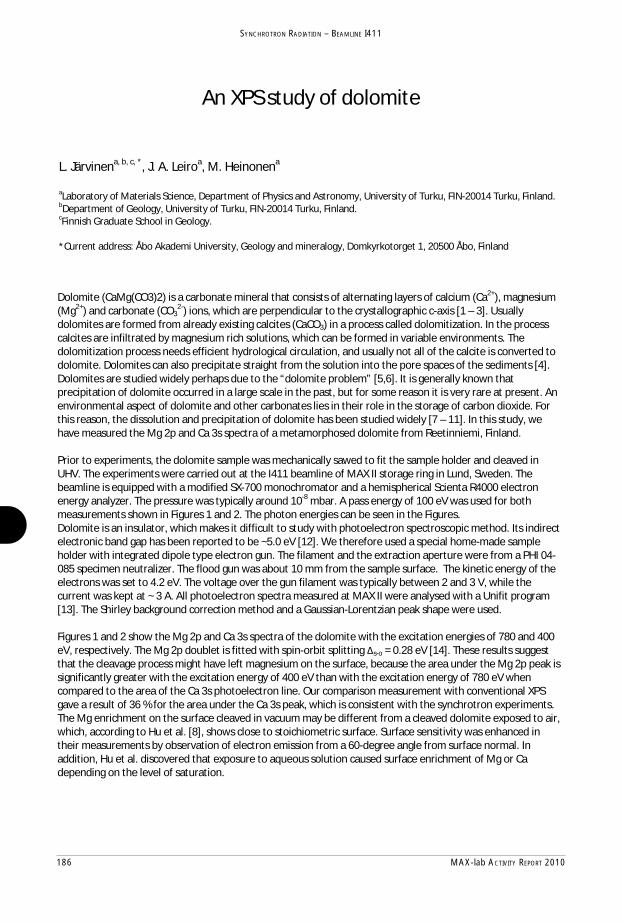
186 MAX-lab ACTIVITY REPORT 2010
SYNCHROTRON RADIATION – BEAMLINE I411
An XPS study of dolomite
L. Järvinena, b, c, *, J. A. Leiroa, M. Heinonena aLaboratory of Materials Science, Department of Physics and Astronomy, University of Turku, FIN-20014 Turku, Finland. bDepartment of Geology, University of Turku, FIN-20014 Turku, Finland. cFinnish Graduate School in Geology. *Current address: Åbo Akademi University, Geology and mineralogy, Domkyrkotorget 1, 20500 Åbo, Finland
Dolomite (CaMg(CO3)2) is a carbonate mineral that consists of alternating layers of calcium (Ca2+), magnesium (Mg2+) and carbonate (CO3
2-) ions, which are perpendicular to the crystallographic c-axis [1 – 3]. Usually dolomites are formed from already existing calcites (CaCO3) in a process called dolomitization. In the process calcites are infiltrated by magnesium rich solutions, which can be formed in variable environments. The dolomitization process needs efficient hydrological circulation, and usually not all of the calcite is converted to dolomite. Dolomites can also precipitate straight from the solution into the pore spaces of the sediments [4]. Dolomites are studied widely perhaps due to the “dolomite problem” [5,6]. It is generally known that precipitation of dolomite occurred in a large scale in the past, but for some reason it is very rare at present. An environmental aspect of dolomite and other carbonates lies in their role in the storage of carbon dioxide. For this reason, the dissolution and precipitation of dolomite has been studied widely [7 – 11]. In this study, we have measured the Mg 2p and Ca 3s spectra of a metamorphosed dolomite from Reetinniemi, Finland. Prior to experiments, the dolomite sample was mechanically sawed to fit the sample holder and cleaved in UHV. The experiments were carried out at the I411 beamline of MAX II storage ring in Lund, Sweden. The beamline is equipped with a modified SX-700 monochromator and a hemispherical Scienta R4000 electron energy analyzer. The pressure was typically around 10-8 mbar. A pass energy of 100 eV was used for both measurements shown in Figures 1 and 2. The photon energies can be seen in the Figures. Dolomite is an insulator, which makes it difficult to study with photoelectron spectroscopic method. Its indirect electronic band gap has been reported to be ~5.0 eV [12]. We therefore used a special home-made sample holder with integrated dipole type electron gun. The filament and the extraction aperture were from a PHI 04-085 specimen neutralizer. The flood gun was about 10 mm from the sample surface. The kinetic energy of the electrons was set to 4.2 eV. The voltage over the gun filament was typically between 2 and 3 V, while the current was kept at ~ 3 A. All photoelectron spectra measured at MAX II were analysed with a Unifit program [13]. The Shirley background correction method and a Gaussian-Lorentzian peak shape were used. Figures 1 and 2 show the Mg 2p and Ca 3s spectra of the dolomite with the excitation energies of 780 and 400 eV, respectively. The Mg 2p doublet is fitted with spin-orbit splitting s-o = 0.28 eV [14]. These results suggest that the cleavage process might have left magnesium on the surface, because the area under the Mg 2p peak is significantly greater with the excitation energy of 400 eV than with the excitation energy of 780 eV when compared to the area of the Ca 3s photoelectron line. Our comparison measurement with conventional XPS gave a result of 36 % for the area under the Ca 3s peak, which is consistent with the synchrotron experiments. The Mg enrichment on the surface cleaved in vacuum may be different from a cleaved dolomite exposed to air, which, according to Hu et al. [8], shows close to stoichiometric surface. Surface sensitivity was enhanced in their measurements by observation of electron emission from a 60-degree angle from surface normal. In addition, Hu et al. discovered that exposure to aqueous solution caused surface enrichment of Mg or Ca depending on the level of saturation.

MAX-lab ACTIVITY REPORT 2010 187
SYNCHROTRON RADIATION – BEAMLINE I411
Figure 1. Mg 2p and Ca 3s spectra of the dolomite from Reetinniemi, Finland.
Figure 2. Mg 2p and Ca 3s spectra of the dolomite from Reetinniemi, Finland. The portion of magnesium has increased with surface sensitivity. References [1] H.-R. Wenk and A. Bulakh, Minerals: Their constitution and origin, Cambridge University Press, Cambridge, 2008. [2] B. Mason and L. G. Berry, Elements of Mineralogy, W. H. Freeman and Company,San Francisco, 1968. [3] J. O. Titiloye, N. H. de Leeuw and S. C. Parker, Atomistic simulation of the differences between calcite and dolomite surfaces, Geochimica et Cosmochimica Acta 62 (1998) 2637-2641. [4] H. G. Machel, Dolomites, Sedimentary rocks / Dolomites, in: R. C. Selley, L. R. M. Cocks and I. R. Plimer (Eds.), Encyclopedia of Geology, Elsevier Ltd., 2005, pp. 79-94. [5] S. J. Burns, J. A. McKenzie and C. Vasconcelos, Dolomite formation and biogeochemical cycles in the Phanerozoic, Sedimentology 47 (2000) 49-61. [6] P. V. Brady, J. L. Krumhansl and H. W. Papenguth, Surface complexation clues to dolomite growth, Geochimica et Cosmochimica Acta 60 (1996) 727-731. [7] S. R. Higgins and X. Hu, Self-limiting growth on dolomite: Experimental observations with in situ atomic force microscopy, Geochimica et Cosmochimica Acta 69 (8) (2005) 2085-2094. [8] X. Hu, P. Joshi, S. M. Mukhopadhyay and S. R. Higgins, X-ray photoelectron spectroscopic studies of dolomite surfaces exposed to undersaturated and supersaturated aqueous solutions, Geochimica et Cosmochimica Acta 70 (2006) 3342-3350. [9] C. M. Pina, C. Pimentel and M. García-Merino, High resolution imaging of the dolomite (104) cleavage surface by atomic force microscopy, Surface Science 604 (2010) 1877-1881. [10] E. Busenberg and L. N. Plummer, The kinetics of dissolution of dolomite in CO2·H2O systems at 1.5 to 65 °C and 0 to 1 atm PCO2, American Journal of Science 282 (1982) 45-78. [11] J. W. Morse and R. S. Arvidson, The dissolution of major sedimentary carbonate minerals, Earth-Science Reviews 58 (2002) 51-84. [12] F. M. Hossain, B. Z. Dlugogorski, E. M. Kennedy, I. V. Belova and G. E. Murch, First-principles study of the electronic, optical and bonding properties in dolomite, Computational Materials Science 50 (2011) 1037-1042. [13] R. Hesse, T. Chassé, R. Szargan, Peak Shape analysis of core level photoelectron spectra using UNIFIT for WINDOWS, Fresenius Journal of Analytical Chemistry 365 (1999) 48-54. [14] V. Karpus, A. Suchodolskis, U. O. Karlsson, G. Le Lay, L. Giovanelli, W. Assmus, S. Brühne and E. Uhrig, Mg 2p shallow core-level and local atomic structure of i-ZnMgRE quasicrystals, Applied Surface Science 2252 (2006) 5411-5414.

188 MAX-lab ACTIVITY REPORT 2010
SYNCHROTRON RADIATION – BEAMLINE I411
Electron-ion coincidence study of photofragmentation of the CdCl2 molecule
J.A. Kettunen1, J. Niskanen1, M. Huttula1, M. Vapa1, S. Urpelainen2, and H. Aksela1
1 Department of Physics, University of Oulu, P.O. Box 3000, FIN-90014 University of Oulu, Finland
2 MAX-lab, Lund University, Box 118, SE-22100 Lund, Sweden
Electron-ion coincidence (PEPICO) methodology is nowadays often employed for studies of various molecular systems [1-2], as it provides means to separate electronic processes via their link to specific ions. The combined measurement of electron spectra and ion production can be used to obtain high resolution information about molecular processes. The ion data may be used to correlate fragments and, depending on the detection method, gain additional information about the dissociative processes. These experimental studies are also applicable to many theoretical studies such as the verification of molecular modeling calculations, and relevant applications exist among different fields of research such as atmospheric sciences, where breakdown of molecules can have large scale effects. The electron spectroscopy group of University of Oulu and collaborators, especially at University of Turku, have performed several PEPICO studies [3-5] with synchrotron radiation provided by MAX-lab, in UV and soft X-ray regimes.
Cadmium is a group 12 metal, sharing chemical properties with other metals of this group, zinc and mercury. Cadmium has previously been heavily used in applications such as batteries. Nowadays cadmium’s use is discouraged due to its toxicity to human health and the environment [6] – for example the European Union has negotiated a directive in 2006 banning the sale of batteries, which contain more than trace amounts of mercury and cadmium. Cadmium, alike to mercury, is typically found in +2 oxidation state so it forms, among others, the linear cadmium dichloride (CdCl2) molecule.
In this work, we studied the UV-induced photodissociation of CdCl2 with UV lamp (He I , h = 21.218 eV) and synchrotron excitation at beamline I411 [7] in MAX-lab (h = 40 eV), for molecular valence and 4d, respectively. The electron spectra for valence and Cd4d are well-known from previous studies. [8,9] The photoionized molecule, its photoelectrons and photofragments were observed, and the connection between the ionized states and produced fragments were made. The energetics and possible fragmentation pathways were examined with ab initio Multi-configurational self-consistent field (MCSCF) and Coupled Cluster (CC) calculations. The calculated results are in qualitative agreement with the observed data.
Figs. 1 and 2 depict the recorded data in an overview style. These maps are extracted from the coincidence data – the horizontal axis represents the observed electrons, and the vertical axis represents the flight time of the cations. The total electron and TOF spectra are displayed on top and right sides, respectively, of both figures. The actual extraction of parameters such as appearance energies was done by inspecting the coincident ion yields (CIYs), which contain the ion-specific yields as a function electron binding energy, linking the internal energy changes by photoemission to fragment yields [10]. The vertical black bars of Fig. 1 represent the fragment energies from CC calculations.
The inspection of the appearance energies of the fragments reveals which photoionized states are energetic enough to allow for different fragments to be produced. The results are in agreement with the traditional, tentative view of the linear molecules and their and bonding – it can be seen that the bonds, due to their non-axis orientated charge distribution, can be essentially seen as non-bonding as a contrast to bonds. The -1 ionized states were found to be competing between production of CdCl+ and Cd+. The 4d-1 photofragmentation was found to be dominated by production of Cl+, which suggests that some charge-transfer process takes place. The observed appearance energies are in agreement with the calculated fragment energies.

MAX-lab ACTIVITY REPORT 2010 189
SYNCHROTRON RADIATION – BEAMLINE I411
Fig 1. PEPICO map for CdCl2 valence photoionization. [11]
Fig 2. PEPICO map of photoionized Cd4d-1 states for CdCl2. [11]
References
[1] R.E. Continetti. Ann. Rev. Phys. Chem. 52 (2001) [2] C. Miron, P. Morin. Nucl. Instr. Methods A 601 (2009) [3] S. Urpelainen, A. Caló, L. Partanen, M. Huttula, J. Niskanen, E. Kukk, S. Aksela, and H. Aksela. Phys. Rev. A 80 (2009) [4] E. Kukk, R. Sankari, M. Huttula, A. Sankari, H. Aksela and S. Aksela. J. Electron Spectrosc. Relat. Phenom. 155 (2007) [5] E. Kukk ,R. Sankari, M. Huttula, S. Mattila, E. Itälä, A. Sankari, b, H. Aksela and S. Aksela. I. J. Mass. Spec. 279 (2009) [6] L. Järup, M. Berglund, C. Elinder, G. Nordberg, M. Vahter. Scand. J. Work Environ. Health 24 suppl 1 (1998) [7] M. Bässler, A. Ausmees, M. Jurvansuu, R. Feifel, J. -O. Forsella, P. de Tarso Fonseca, A. Kivimäki, S. Sundin, S. L. Sorensen, R. Nyholm, O. Björneholm, S. Aksela, S. Svensson. Nuclr. Instr. Meth. Phys. Res. Sec. A 469 (2001) [8] J. Berkowitz. J. Chem. Phys. 61 (1974) [9] D.J. Bristow, G.M. Bancroft, J.S. Tse. Chem. Phys. 75 (1983) [10] E. Kukk, K. Kooser, D.T. Ha, S. Granroth, E. Nõmmiste. J. Phys. B: At. Mol. Opt. Phys. 43 (2010) [11] J.A. Kettunen, J. Niskanen, M. Huttula, M. Vapa, S. Urpelainen, H. Aksela. Submitted to J. Mass. Spec.

190 MAX-lab ACTIVITY REPORT 2010
SYNCHROTRON RADIATION – BEAMLINE I411
Dissociation of C60 fullerenes studied with a linear momentum coincidence spectrometer
J. Laksman1, E. Månsson1, C. Stråhlman1, A. Sankari1, M. Gisselbrecht1 and S. Sorensen1
1 Dept. of Synchrotron Radiation Research, Institute of Physics, Lund University
P.O. Box 118, S-221 00 Lund, Sweden
attracted
Figur 1. (a) C 1s- * state at 286.2 eV. Up to tetracationic ions are detected of both complete and fragmented fullerenes. (b) For undissociated fullerenes, we can even resolve the isotopeshift.
(a)
(b)
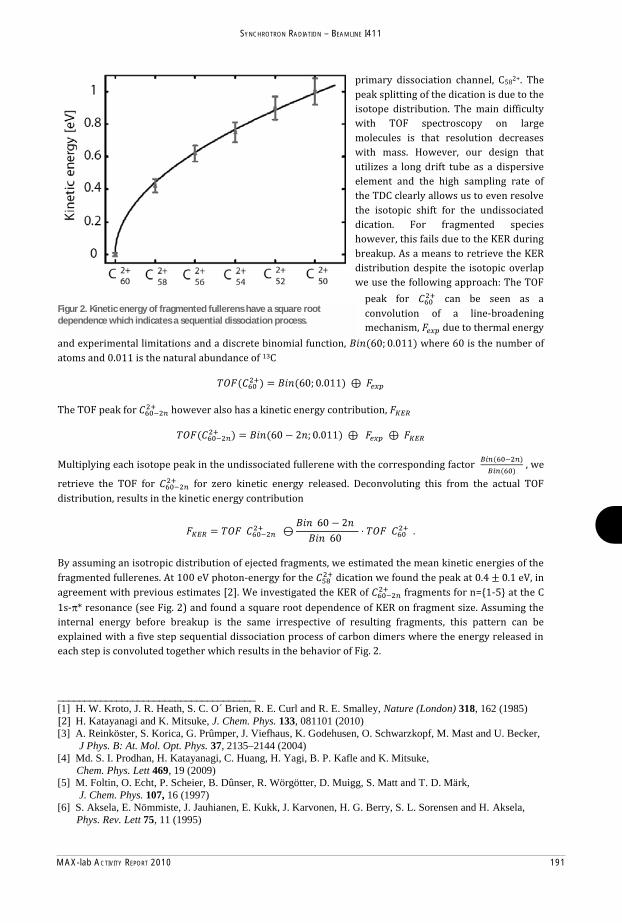
MAX-lab ACTIVITY REPORT 2010 191
SYNCHROTRON RADIATION – BEAMLINE I411
_____________________________________ [1] H. W. Kroto, J. R. Heath, S. C. O´ Brien, R. E. Curl and R. E. Smalley, Nature (London) 318, 162 (1985)
H. Katayanagi and K. Mitsuke, J. Chem. Phys. 133, 081101 (2010) [3] A. Reinköster, S. Korica, G. Prûmper, J. Viefhaus, K. Godehusen, O. Schwarzkopf, M. Mast and U. Becker, J Phys. B: At. Mol. Opt. Phys. 37, 2135–2144 (2004) [4] Md. S. I. Prodhan, H. Katayanagi, C. Huang, H. Yagi, B. P. Kafle and K. Mitsuke, Chem. Phys. Lett 469, 19 (2009) [5] M. Foltin, O. Echt, P. Scheier, B. Dûnser, R. Wörgötter, D. Muigg, S. Matt and T. D. Märk, J. Chem. Phys. 107, 16 (1997) [6] S. Aksela, E. Nömmiste, J. Jauhianen, E. Kukk, J. Karvonen, H. G. Berry, S. L. Sorensen and H. Aksela, Phys. Rev. Lett 75, 11 (1995)
Figur 2. Kinetic energy of fragmented fullerens have a square root dependence which indicates a sequential dissociation process.

192 MAX-lab ACTIVITY REPORT 2010
SYNCHROTRON RADIATION – BEAMLINE I411
Depth Profiling the Li-ion Battery Solid Electrolyte Interphases
S. Malmgren a, K. Cioseka, M. Hahlina, T. Gustafssona, M. Gorgoic, C. O. Olssona, H. Rensmob and K. Edströma
a Department of Materials Chemistry, Uppsala University, Box 538, SE-751 21 Uppsala,
Sweden b Department of Physics and Materials Science, Uppsala University, Box 534, SE-751 21
Uppsala, Sweden c The Helmholtz Center Berlin, BESSY II, 124 89, Berlin, Germany
The Solid Electrolyte Interphase (SEI) [1] is a passivating layer of electrolyte reaction products deposited on lithium-ion battery electrodes. It is believed to play an important part in the ageing of lithium-ion batteries which is one among many reasons to aim for a more complete understanding of the composition, morphology and thickness of the SEI. The focus of this work has been to develop the method of non-destructive PES depth profiling for the study of the lithium-ion battery SEI.
LiFePO4/graphite batteries with 1 M LiPF6 EC:DEC 2:1 electrolyte cycled for 3 or 3.5 cycles and left in discharged or charged state, respectively, were examined at the I411 beamline at the MAXLAB synchrotron, Lund, the KMC1 beamline at the BESSY synchrotron, Berlin, as well as at an in house PHI 5500 XPS system equipped with an AlK 1486.6 eV x-ray source. At the MAXLAB synchrotron, the excitation energies were varied so that the kinetic energy of emitted electrons was approximately the same for all probed core levels, 135 eV ± 15 eV. At the BESSY synchrotron, fixed excitation energies of 2300 eV and 6900 eV were used. The batteries were dismantled in an argon filled glovebox and transferred to the XPS system vacuum without exposure to air using specially built transfer equipment. The resulting depth profiles of lithiated anodes and cathodes are shown in figure 1. Figure 1 shows that the intensity of the bulk electrode peaks increase with probing depth. This is clearly seen in the anode C1s and cathode P2p/P1s spectra by that as the probing depth increases, so does the intensity of the lowest binding energy core level peaks interpreted as lithium intercalated graphite and phosphate, respectively. The depth profiles were used to calculate the SEI thicknesses which were found to be 10 nm on a delithated and 30 nm on a lithiated anode. The cathode SEI thickness was found to be a few nm, only. The charged anode SEI was found to be richer in ether bonds and phosphorous-fluorine bonds than the discharged anode SEI. Acknowledgements This work was funded by the VINNOVA/Swedish Green Car project, the Swedish Hybrid Vehicle Centre, and VINNOVA/FFI. StandUp for Energy is acknowledged.

MAX-lab ACTIVITY REPORT 2010 193
SYNCHROTRON RADIATION – BEAMLINE I411
692 688 684Binding energy [eV]
F1s
536 532Binding energy [eV]
O1s
290 285 280Binding energy [eV]
C1s
692 688 684Binding energy [eV]
F1s
536 532Binding energy [eV]
O1s
290 285 280Binding energy [eV]
C1s
140 136 132Binding energy [eV]
P2p/P1s
Figure 1. Deconvoluted PES depth profiles of a) a lithiated LiFePO4 cathode and b) a lithiated graphite anode. The most surface sensitive measurements were made with approximately the same kinetic energy, Ek, of electrons emitted from all probed core levels. The more depth sensitive measurements were performed with fixed excitation energies, Eexc. The phosphorous depth profile shows both P2p (black) and P1s (grey) spectra, though only the P2p binding energy scale is shown in the picture.
135 eVk 1487 eVexc 2300 eVexc
6900 eVexc
a)
Incr
easi
ng p
robi
ng d
epth
140 136 132Binding energy [eV]
P2p/P1s
Incr
easi
ng p
robi
ng d
epth
b) 135 eVk 1487 eVexc
2300 eVexc 6900 eVexc

194 MAX-lab ACTIVITY REPORT 2010
SYNCHROTRON RADIATION – BEAMLINE I411

MAX-lab ACTIVITY REPORT 2010 195
SYNCHROTRON RADIATION – BEAMLINE I411

196 MAX-lab ACTIVITY REPORT 2010
SYNCHROTRON RADIATION – BEAMLINE I411

MAX-lab ACTIVITY REPORT 2010 197
SYNCHROTRON RADIATION – BEAMLINE I411

198 MAX-lab ACTIVITY REPORT 2010
SYNCHROTRON RADIATION – BEAMLINE I411
Photoelectron spectroscopy of solvated salts in water clusters
L. Partanen, M.-H. Mikkela, D. Anin, M. Huttula, H. AkselaDepartment of Physics, P.O. Box 3000, 90014 University of Oulu, Finland
M. TchaplyguineMAX-Laboratory, Lund University, P.O. Box 118, 22100 Lund, Sweden
Ch.Zhang, T. Andersson, and O. BjorneholmDepartment of Physics and Astronomy, Uppsala University, P.O. Box 530, 75181 Uppsala, Sweden
In this work, the large water clusters doped with alkali halides were studied by the photoelectronspectroscopy technique. Clusters were produced by recently developed Exchange Metal Cluster Source(EXMEC) which was preliminary designed for electron-spectroscopic studies of neutral metal clusters1.Previous studies with the EXMEC set-up show its capability for cluster production in the size regimefrom few tens to few hundred of atoms per cluster1. This study shows that the set-up is able to producealso water clusters which are doped by salt molecules vaporized in the oven system. A schematic viewof the cluster source is shown in Fig. 1. Liquid water is evaporated inside the cluster source in the firstoven. High pressure He gas is let through the water oven to take water vapor out via a conical nozzleand to facilitate water cluster formation. In the nozzle the water clusters are formed via an adiabaticexpansion process. The water cluster beam is skimmed downstream by a copper skimmer. Furtherdownstream the water clusters are doped by alkali halide monomers which are created inside the secondresistively heated oven with entrance and exit orifices on the axis of the water cluster beam. Leavingthe second oven the clusters are ionized by synchrotron radiation and the photoelectrons emitted arerecorded by a hemispherical electron analyzer, mounted in 90◦ angle with respect to the polarizationdirection of the radiation.
Figure 1: Schematic view ofexperiment:(1) water storage,(2) water oven,(3) nozzle, (4) skimmer,(5) oven and interactionregion, (6) Scienta R4000hemispherical electron ana-lyzer and (7) liquid nitrogencooled cold trap.
When alkali halides are dissolved in water, the molecule dissociates as anions and cations. There areboth experimental and theoretical evidence that large polarizable anions are more attracted by waterliquid/vapor interface whereas the cations are enhanced just below the surface in bulk water (see e.g.2 and references therein). Thus, the surface-sensitive method like low-kinetic energy photoelectronspectroscopy, used in this work, suites particularly well in studies of anions and cations in water.Alkali halides studied here are NaBr, NaCl, NaF, KBr, KCl, and KI. The valence region photoelectronspectrum in the binding energy region of 6–45 eV was measured for salt-water clusters using a photonenergy of 79.6 eV. Additionally, the Br 3d region was measured with 156.7 eV, Cl 2p region with227.7 eV and 234.0 eV (for NaCl and KCl, respectively), and I 4d region with 79.4 eV photon energies.The photoelectron spectral features of salt-water clusters were separated from those originated frompure alkali halides, water molecules, and water clusters without dissolved salt by measuring also thecorresponding photoelectron spectra separately. The Na 2p region photoelectron spectra of NaCl andNaBr are shown in Fig. 2. The spectra show the Na+ 2p photoline of salt-water clusters, the Na 2p

MAX-lab ACTIVITY REPORT 2010 199
SYNCHROTRON RADIATION – BEAMLINE I411
Table 1: Binding energies of anions and cations in water clusters Ecl and in aqueous ions Eaq. The bindingenergies of different spin-orbit states are separated by slash.
ion Ecl Eaaq
K+ 3p 22.3± 0.08 22.2± 0.06Na+ 2p 35.5± 0.06 35.4± 0.04Cl− 2p 203.02/204.66± 0.05 202.1/203.6b
Br− 3d 73.3/74.4± 0.05 74.3± 0.09/73.2± 0.07I− 4d 54.3/56.0± 0.05 53.8/55.8
aFrom ref. 3, bFrom ref. 5
photolines from a pure alcali halide molecule and the He 1s photoline. A broad structure between theHe and cluster lines is from water molecule and water clusters.
In table 1 the measured binding energies of core electrons for alkali and halide parts of salts in waterclusters are given. In addition the corresponding binding energies of the ions in aqueous solutions aregiven. A remarkable result is that the obtained binding energies of salt-water clusters are very close tothe binding energies of aqueous solutions reported earlier by Winter et al. 3, 4. Some discrepancies mayarise from the different binding energy calibration. Helium 1s photoline serves as a reliable calibrationpeak in our spectra of cations, but the binding energy calibration for the higher binding energy spectraof anions may contain some uncertainties due to the lack of reported photoelectron spectra for puremolecular salt vapors. The binding energy data reveals that when a salt molecule is picked up by awater cluster, the salt molecule dissolves in water, and it is dissociated. The ions are then solvated anddispersed like in liquid water. The same Ecl and Eaq binding energies mean that the water surroundingof anions and cations is very similar both in liquids and clusters.
4000
3000
2000
1000
0
(a) NaCl
He 1s
Na+ 2p (cl)
Na 2p (mol)
3000
2000
1000
0
4540353025
(b) NaBr
He 1s
Na+ 2p (cl)
Na 2p (mol)
Inte
nsity
(arb
. uni
ts)
Binding energy (eV)
Figure 2: The photoelectron spectra of NaCl and NaBr mea-sured at Na 2p region.
1Huttula M., et al., J. Electron Spectrosc. Relat. Phenom., 181, 145-149 (2010)2Ghosal S., et al., Science 307, 563-566 (2005)3Winter B., et al., J. Am Chem. Soc. 127, 7203-7214 (2005)4Winter B., et al., J. Am. Chem. Soc. 130, 7130-7138 (2008)5Weber R., et al., J. Phys. Chem. 108, 4729–4736 (2004)

200 MAX-lab ACTIVITY REPORT 2010
SYNCHROTRON RADIATION – BEAMLINE I411
4d-1 photoelectron and subsequent N4,5OO Auger electron spectra of Sb
M. Patanen1, S. Heinäsmäki1, S. Urpelainen2, S. Aksela1, and H. Aksela1
1Department of Physics, University of Oulu, P. O. Box 3000, FIN-90014 University of Oulu, Finland
2MAX-lab, Lund University P.O. Box 118, SE-221 00 Lund, Sweden
Synchrotron radiation excited 4d-1 photoelectron and subsequent N4,5OO Auger electron spectrum of Sb have been measured [1] at beamline I411. An inductively heated oven was used to evaporate the solid-phase Sb, which evaporates predominantly as Sb4 molecules, which can be further fragmented to Sb2 and Sb by strongly increasing the temperature of the upper part of the specially designed oven system [2]. The electron configuration of Sb is [Kr]4d95s25p3 and complex features in the spectra created by an open shell electronic structure have been interpreted using multiconfigurational Dirac-Fock calculations utilizing GRASP92 and GRASP2K packages [3]. The photoelectron spectrum (PES) (in Fig. 1) was interpreted satisfactorily by a single non-relativistic configuration and 26 lines was identified. For the subsequent Auger electron spectrum (AES) (in Fig. 2) both single and multiconfigurational Dirac-Fock calculations were carried out. Previously published optical data of the Auger final states was also used for interpreting the structure of the Auger spectrum. The N4,5O1O2,3 transitions lie in low kinetic energy region, which caused some challenges to the data handling, mainly because of the exponentially increasing background towards zero kinetic energy and non-linearly behaving transmission. It was found that
despite of complex 4d-1 PES displaying a lot of transitions, the most intense structures in the N4,5OO AES are created by transitions from the initial states 5D4,5D3, 5D2, and 3D1 (configuration [Kr]4d95s25p3) to final states 4P1/2, 4P3/2,and 4P5/2 (configuration [Kr]4d105s15p2). It was also noticed that correlative configurations having 5d and 6s orbitals occupied do not mix with the 4P final states.
The comparison to the previously published corresponding Sb4 study by Urpelainen et al. [4] was made, and it was noticed that the final states of the N4,5OOAuger transitions are very differently populated in Sb4 compared to the atomic Sb. In the case of Sb4, the transitions to the final states, having one hole in the molecular orbital with significant contribution of the 5s atomic orbital and one hole in the MO with significant contribution of the 5p AO, were as
important as the transitions to the final states, having two holes in the MOs with significant contribution of 5p AO. In atomic Sb, the final states having 5s5p2 configuration (region B in Fig. 2) were much more populated than the states with 5s25p configuration (region A in Fig. 2). A tentative explanation to this was offered by counting the number of possible single configuration final states:
Figure 1. (a) Experimental (hv=90eV) and (b) calculated 4dphotoelectron spectrum of Sb.
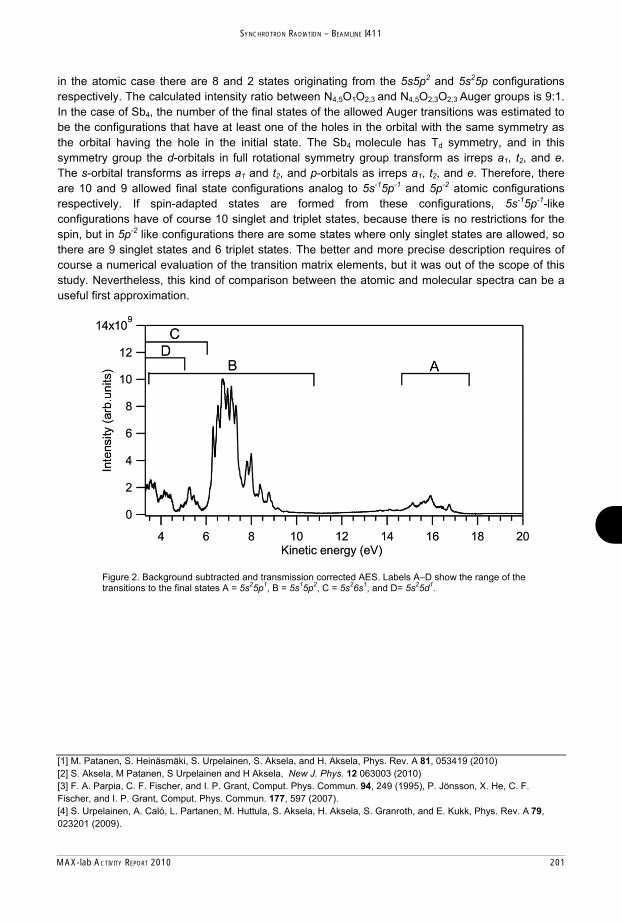
MAX-lab ACTIVITY REPORT 2010 201
SYNCHROTRON RADIATION – BEAMLINE I411
[1] M. Patanen, S. Heinäsmäki, S. Urpelainen, S. Aksela, and H. Aksela, Phys. Rev. A 81, 053419 (2010)[2] S. Aksela, M Patanen, S Urpelainen and H Aksela, New J. Phys. 12 063003 (2010) [3] F. A. Parpia, C. F. Fischer, and I. P. Grant, Comput. Phys. Commun. 94, 249 (1995), P. Jönsson, X. He, C. F. Fischer, and I. P. Grant, Comput. Phys. Commun. 177, 597 (2007). [4] S. Urpelainen, A. Caló, L. Partanen, M. Huttula, S. Aksela, H. Aksela, S. Granroth, and E. Kukk, Phys. Rev. A 79,023201 (2009).
in the atomic case there are 8 and 2 states originating from the 5s5p2 and 5s25p configurations respectively. The calculated intensity ratio between N4,5O1O2,3 and N4,5O2,3O2,3 Auger groups is 9:1. In the case of Sb4, the number of the final states of the allowed Auger transitions was estimated to be the configurations that have at least one of the holes in the orbital with the same symmetry as the orbital having the hole in the initial state. The Sb4 molecule has Td symmetry, and in this symmetry group the d-orbitals in full rotational symmetry group transform as irreps a1, t2, and e.The s-orbital transforms as irreps a1 and t2, and p-orbitals as irreps a1, t2, and e. Therefore, there are 10 and 9 allowed final state configurations analog to 5s-15p-1 and 5p-2 atomic configurations respectively. If spin-adapted states are formed from these configurations, 5s-15p-1-likeconfigurations have of course 10 singlet and triplet states, because there is no restrictions for the spin, but in 5p-2 like configurations there are some states where only singlet states are allowed, so there are 9 singlet states and 6 triplet states. The better and more precise description requires of course a numerical evaluation of the transition matrix elements, but it was out of the scope of this study. Nevertheless, this kind of comparison between the atomic and molecular spectra can be a useful first approximation.
Figure 2. Background subtracted and transmission corrected AES. Labels A–D show the range of the transitions to the final states A = 5s25p1, B = 5s15p2, C = 5s26s1, and D= 5s25d1.

202 MAX-lab ACTIVITY REPORT 2010
SYNCHROTRON RADIATION – BEAMLINE I411
XPS study of the electrode/electrolyte interface on silicon electrodes for Li-ion batteries and formation of the Li-Si alloy
B. Philippe1,2, R. Dedryvère1, D. Gonbeau1, H. Rensmo3, K. Edström2
1 IPREM/ECP (UMR 5254), University of Pau, Hélioparc, 2 av. P. Angot, 64053 Pau cedex 9, France 2 Dept. of Materials Chemistry, Ångström Lab., Uppsala University, Box 538, SE-75121 Uppsala, Sweden
3 Dept. of Physics and Astronomy, Uppsala University, P.O. Box 530, SE-75121, Uppsala, Sweden Metals and semimetals that can electrochemically form alloys with lithium are interesting alternative materials to replace the carbonaceous materials currently used as the negative electrode in lithium-ion batteries. New emerging applications require higher performance in terms of rechargeable capacity, energy density, power and safety. Silicon appears to be an ideal candidate for the next generation of negative electrodes. At room temperature it can alloy with 3.75 Li atoms per Si atom, resulting in a maximum capacity of 3579 mAh.g-1 (compared to 372 mAh.g-1 for graphite)1. Silicon is also inexpensive and environmentally friendly.
During the 1st cycle, the surface of the negative electrode is passivated with a layer which is composed of the decomposition products of liquid electrolyte. The stability of this layer named SEI (Solid Electrolyte Interphase) is crucial for good battery performance. Electrode/electrolyte interface reactivity has been widely studied mainly for carbon electrodes, but less attention has been directed to the SEI formation in silicon electrodes, and to the understanding of the limitations due to the interface phenomena.
Non-destructive depth-resolved analysis by varying the energy of the X-ray beam instead of using destructive argon ion etching was used here to allow us to investigate the Li-Si alloying process and the passivation layer formation occurring upon lithiation/delithiation. A step by step study of the 1st cycle of Si/Li electrochemical cells was performed at the I-411 beamline at the MAXIV laboratory in Lund. Soft X-ray was used to analyze the outermost surface of our system by selecting two fixed kinetics energies (variation of the excitation energies for each analyzed core peak); 130 and 610 eV. The kinetic energy is directly linked to the mean free path of the electrons which gives the depth of the analysis (Figure 2, a-b).
A similar study has been done with an in-lab XPS, Kratos Axis Ultra spectrometer using a focused monochromatized Al Kα radiation (hν = 1486.6 eV) and to complete the results obtained with the synchrotron radiation (MAX-lab) and AlKα radiation (in-lab XPS), experiments were carried out with hard X-ray (hν = 2300 and 6900eV) at the KMC-1 beamline of the Helmoltz-Zentrum Berlin, Bessy II allowing a deeper analysis than could be obtained at the other used facilities. Figure 2, c shows the evolution of the Si2p peak of our starting electrode for the 5 photon energies. The evolution of the ratio [SiO2(surface)/Si-Si(bulk)] is linked to the depth of the analysis. This study allowed us to follow the formation of the Li-Si alloying process, step by step, upon the first lithiation thanks to the high energy photons. The variation of the analysis depth is probing the nature and composition of the SEI as a function of its thickness. We have determined that the main species of the SEI was formed during the 1st part of the 1st discharge and a stable composition and thickness seems to be reached after the 1st charge/discharge cycle. Acknowledgements This work was carried out within Alistore-ERI (European Research Institute). (1) M. N. Obrovac, L. Christensen Electrochem. Solid-State Lett. 7 (2004) A93

MAX-lab ACTIVITY REPORT 2010 203
SYNCHROTRON RADIATION – BEAMLINE I411
Analyzer
Analysis chamber
Opening device of the transfer cup
Insertion rod of the sampleinto the analysis chamber
Manual valve(between transfer/analysis
chamber)
Figure 1: Experimental facilities used in MAXlab.
(a)
10000
(b)
(c)
Kinetic energy (hνν used) Depth of the analysis ( 3 λ)
130 eV ( 230 eV) 1.5 nm
610 eV (710 eV) 3 nm
1386 eV ( 1486 eV) 5 nm
2200 eV (2300 eV) 7 nm
6800 eV (6900 eV) 11 nm
Figure 2 : a, Mean free path of the electrons as a function of the kinetic energy.
b, Depth of the analysis for the Si2p peak for 5 photon energies c, Evolution of the Si2p peak for this 5 photon energies (starting electrode). Surfacic SiO2 and Si-Si from the
bulk
Surface Bulk

204 MAX-lab ACTIVITY REPORT 2010
SYNCHROTRON RADIATION – BEAMLINE I411

MAX-lab ACTIVITY REPORT 2010 205
SYNCHROTRON RADIATION – BEAMLINE I411
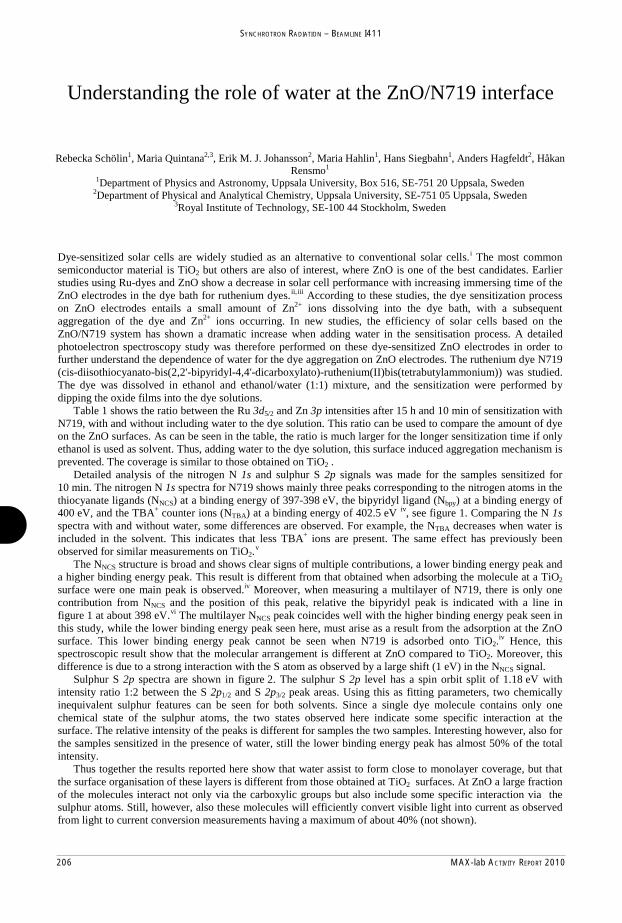
206 MAX-lab ACTIVITY REPORT 2010
SYNCHROTRON RADIATION – BEAMLINE I411
Rebecka Schölin1, Maria Quintana2,3, Erik M. J. Johansson2, Maria Hahlin1, Hans Siegbahn1, Anders Hagfeldt2, Håkan Rensmo1
1Department of Physics and Astronomy, Uppsala University, Box 516, SE-751 20 Uppsala, Sweden2Department of Physical and Analytical Chemistry, Uppsala University, SE-751 05 Uppsala, Sweden
3Royal Institute of Technology, SE-100 44 Stockholm, Sweden
Dye-sensitized solar cells are widely studied as an alternative to conventional solar cells.i The most common semiconductor material is TiO2 but others are also of interest, where ZnO is one of the best candidates. Earlier studies using Ru-dyes and ZnO show a decrease in solar cell performance with increasing immersing time of the ZnO electrodes in the dye bath for ruthenium dyes.ii,iii
Table 1 shows the ratio between the Ru 3d5/2 and Zn 3p intensities after 15 h and 10 min of sensitization with N719, with and without including water to the dye solution. This ratio can be used to compare the amount of dye on the ZnO surfaces. As can be seen in the table, the ratio is much larger for the longer sensitization time if only ethanol is used as solvent. Thus, adding water to the dye solution, this surface induced aggregation mechanism is prevented. The coverage is similar to those obtained on TiO2 .
According to these studies, the dye sensitization process on ZnO electrodes entails a small amount of Zn2+ ions dissolving into the dye bath, with a subsequent aggregation of the dye and Zn2+ ions occurring. In new studies, the efficiency of solar cells based on the ZnO/N719 system has shown a dramatic increase when adding water in the sensitisation process. A detailed photoelectron spectroscopy study was therefore performed on these dye-sensitized ZnO electrodes in order to further understand the dependence of water for the dye aggregation on ZnO electrodes. The ruthenium dye N719 (cis-diisothiocyanato-bis(2,2'-bipyridyl-4,4'-dicarboxylato)-ruthenium(II)bis(tetrabutylammonium)) was studied. The dye was dissolved in ethanol and ethanol/water (1:1) mixture, and the sensitization were performed by dipping the oxide films into the dye solutions.
Detailed analysis of the nitrogen N 1s and sulphur S 2p signals was made for the samples sensitized for 10 min. The nitrogen N 1s spectra for N719 shows mainly three peaks corresponding to the nitrogen atoms in the thiocyanate ligands (NNCS) at a binding energy of 397-398 eV, the bipyridyl ligand (Nbpy) at a binding energy of 400 eV, and the TBA+ counter ions (NTBA) at a binding energy of 402.5 eV iv, see figure 1. Comparing the N 1sspectra with and without water, some differences are observed. For example, the NTBA decreases when water is included in the solvent. This indicates that less TBA+ ions are present. The same effect has previously been observed for similar measurements on TiO2.v
The NNCS structure is broad and shows clear signs of multiple contributions, a lower binding energy peak and a higher binding energy peak. This result is different from that obtained when adsorbing the molecule at a TiO2surface were one main peak is observed.iv Moreover, when measuring a multilayer of N719, there is only one contribution from NNCS and the position of this peak, relative the bipyridyl peak is indicated with a line in figure 1 at about 398 eV.vi
iv
The multilayer NNCS peak coincides well with the higher binding energy peak seen in this study, while the lower binding energy peak seen here, must arise as a result from the adsorption at the ZnOsurface. This lower binding energy peak cannot be seen when N719 is adsorbed onto TiO2. Hence, this spectroscopic result show that the molecular arrangement is different at ZnO compared to TiO2. Moreover, this difference is due to a strong interaction with the S atom as observed by a large shift (1 eV) in the NNCS signal.
Sulphur S 2p spectra are shown in figure 2. The sulphur S 2p level has a spin orbit split of 1.18 eV with intensity ratio 1:2 between the S 2p1/2 and S 2p3/2 peak areas. Using this as fitting parameters, two chemically inequivalent sulphur features can be seen for both solvents. Since a single dye molecule contains only one chemical state of the sulphur atoms, the two states observed here indicate some specific interaction at the surface. The relative intensity of the peaks is different for samples the two samples. Interesting however, also for the samples sensitized in the presence of water, still the lower binding energy peak has almost 50% of the total intensity.
Thus together the results reported here show that water assist to form close to monolayer coverage, but that the surface organisation of these layers is different from those obtained at TiO2 surfaces. At ZnO a large fraction of the molecules interact not only via the carboxylic groups but also include some specific interaction via the sulphur atoms. Still, however, also these molecules will efficiently convert visible light into current as observed from light to current conversion measurements having a maximum of about 40% (not shown).
Understanding the role of water at the ZnO/N719 interface
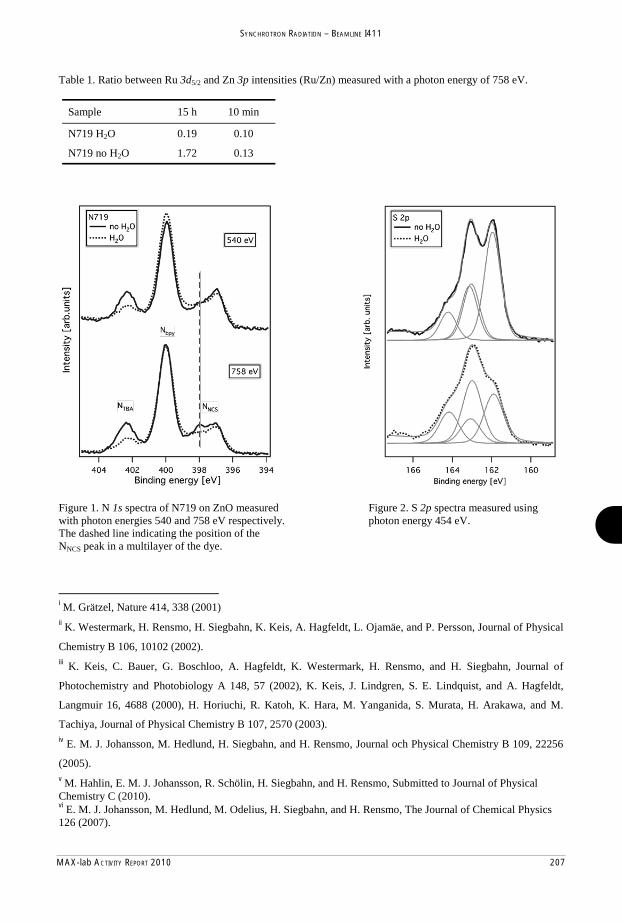
MAX-lab ACTIVITY REPORT 2010 207
SYNCHROTRON RADIATION – BEAMLINE I411
i M. Grätzel, Nature 414, 338 (2001)ii K. Westermark, H. Rensmo, H. Siegbahn, K. Keis, A. Hagfeldt, L. Ojamäe, and P. Persson, Journal of Physical
Chemistry B 106, 10102 (2002). iii K. Keis, C. Bauer, G. Boschloo, A. Hagfeldt, K. Westermark, H. Rensmo, and H. Siegbahn, Journal of
Photochemistry and Photobiology A 148, 57 (2002), K. Keis, J. Lindgren, S. E. Lindquist, and A. Hagfeldt,
Langmuir 16, 4688 (2000), H. Horiuchi, R. Katoh, K. Hara, M. Yanganida, S. Murata, H. Arakawa, and M.
Tachiya, Journal of Physical Chemistry B 107, 2570 (2003). iv E. M. J. Johansson, M. Hedlund, H. Siegbahn, and H. Rensmo, Journal och Physical Chemistry B 109, 22256
(2005). v M. Hahlin, E. M. J. Johansson, R. Schölin, H. Siegbahn, and H. Rensmo, Submitted to Journal of Physical Chemistry C (2010).vi E. M. J. Johansson, M. Hedlund, M. Odelius, H. Siegbahn, and H. Rensmo, The Journal of Chemical Physics 126 (2007).
Table 1. Ratio between Ru 3d5/2 and Zn 3p intensities (Ru/Zn) measured with a photon energy of 758 eV.
Sample 15 h 10 min
N719 H2O 0.19 0.10
N719 no H2O 1.72 0.13
Figure 1. N 1s spectra of N719 on ZnO measured Figure 2. S 2p spectra measured using with photon energies 540 and 758 eV respectively. photon energy 454 eV.The dashed line indicating the position of the NNCS peak in a multilayer of the dye.

208 MAX-lab ACTIVITY REPORT 2010
SYNCHROTRON RADIATION – BEAMLINE I411
Insula
S. Urpela
4Departm
The transstudied photoelecwith twocollabora(GAS) bR4000 eSES-100core-leverespectivvarying photoelec
ator to met
ainen1,2, M. T
1MA
3Dep
ent of
sition from lfor clustersctron spectro different ation betweebuilt in Turklectron anal electron an
el and valenve cluster sou
the temperctron spectra
tal transitio
Tchaplyugine1
AX-lab, Lund
2Departm
partment of P
Physics
large band gs of Grouposcopy. Thecluster sou
en the univeku. For the lyzer was usnalyzer [2,3] nce photoelurce. In the rature of ta with the pa
on in Sb clphotoelect
, M.-H. Mikk
University, P
ment of Physic
Physics and As
and Mate
ap insulators VA elemee experimenurces: the eersities of O
experimentsed and for was employ
lectron specEXMEC ex
the resistivarent Sb4 clu
lusters studtron spectr
kelä2, M. Hutt
P.O. Box 118,
cs, University
stronomy, Un
erial Scien
s to metallicent antimon
nts were perfxchange me
Oulu and Upts with the the experim
yed. In bothctra were rexperiments thve heated eusters are pre
died using roscopy
tula2, K. Koo
SE-221 00 L
y of Oulu, Fin
niversity of Tu
nce, Upps
c properties any (Sb) usiformed at thetal cluster
ppsala [1] anEXMEC so
ments with th the EXMEecorded at he size of thevaporation esented in Fi
core-level
ser3, E. Kukk
Lund, Sweden
nland
urku, Finland
sala Univ
as a functioning core-levhe undulator
source (EXnd a gas ag
ource the pethe GAS a m
EC and GASidentical c
he clusters woven. The
ig. 1.
and valen
k3, O. Björneh
d
versity, Sw
n of size hasvel and var beam line XMEC) bui
ggregation soermanent Scmodified Sc
S experimentonditions o
was controllee 4d core-
ce
holm4
weden
been alence
I411 ilt in ource cienta cienta ts the f the ed by -level
Figure 1. Thare from th
he 4d core-level e parent Sb4 clu
photoelectron susters of which t
spectra of variothe antimony va
ous sized Sb clusapor consists.
sters. The large llines reaching oover the intensitty scale
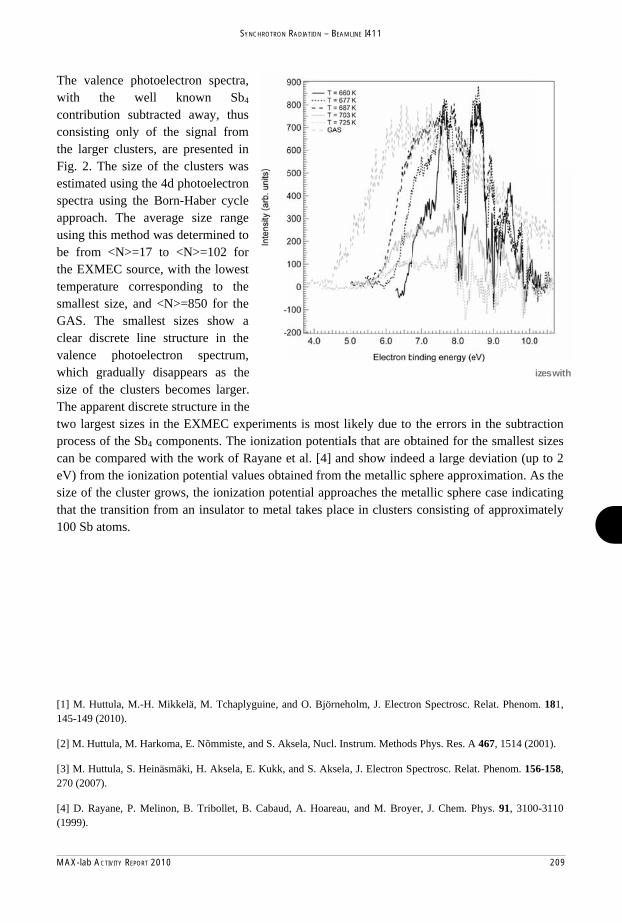
MAX-lab ACTIVITY REPORT 2010 209
SYNCHROTRON RADIATION – BEAMLINE I411
[1] M. Hut145-149 (2
[2] M. Hut
[3] M. Hut270 (2007)
[4] D. Ray(1999).
ttula, M.-H. M2010).
ttula, M. Harko
ttula, S. Heinä).
yane, P. Melin
Mikkelä, M. Tc
oma, E. Nõmm
smäki, H. Aks
non, B. Triboll
chaplyguine, an
miste, and S. Ak
sela, E. Kukk,
let, B. Cabaud
nd O. Björneh
ksela, Nucl. Ins
and S. Aksela
d, A. Hoareau,
holm, J. Electro
strum. Method
, J. Electron S
and M. Broy
on Spectrosc. R
ds Phys. Res. A
pectrosc. Rela
yer, J. Chem. P
Relat. Phenom
A 467, 1514 (20
at. Phenom. 15
Phys. 91, 3100
m. 181,
001).
6-158,
0-3110
The valewith tcontributconsistinthe largeFig. 2. Testimatedspectra uapproachusing thibe from the EXMtemperatusmallest GAS. Thclear disvalence which gsize of tThe appatwo largeprocess ocan be coeV) fromsize of ththat the t100 Sb at
ence photoethe well tion subtrac
ng only of ter clusters, aThe size of td using the 4using the Boh. The avers method wa<N>=17 to
MEC source, ure correspsize, and <Nhe smallestscrete line s
photoelectradually dishe clusters
arent discreteest sizes in tof the Sb4 coompared wit
m the ionizatihe cluster grtransition frotoms.
electron speknown
cted away, the signal fare presentethe clusters 4d photoelecorn-Haber crage size raas determineo <N>=102with the low
ponding to N>=850 fort sizes showstructure in tron spectrsappears as becomes lare structure inthe EXMEComponents. th the work ion potentialrows, the ionom an insula
ctra, Sb4
thus from ed in
was ctron cycle ange ed to 2 for west
the r the w a
the rum,
the rger. n the
C experimenThe ionizatiof Rayane e
l values obtanization poteator to meta
Figure 2the Sb4
ts is most liion potentialet al. [4] andained from thential approal takes place
2. The valence p4 contribution su
ikely due to ls that are obd show indehe metallic saches the mee in clusters
photoelectron subtracted.
the errors ibtained for t
eed a large dsphere approetallic spher
s consisting
pectra for the v
in the subtrathe smallest deviation (upoximation. Are case indicof approxim
various cluster si
action sizes
p to 2 As the cating
mately
izes with

210 MAX-lab ACTIVITY REPORT 2010
SYNCHROTRON RADIATION – BEAMLINE I411
Is there a Simple Relationship between C1s Ionization Energies and Hybridization?
Maria G. Zahl a, Velaug Myrseth b, Alf Holme a, Leif J. Sæthre a, and Knut J. Børve a.
a Department of Chemistry, University of Bergen, NO-5007 Bergen, Norwayb Department of Physics and Technology, University of Bergen, NO-5007 Bergen, Norway
Introduction When assigning spectra of adsorbed states, it is frequently assumed that carbon 1s (C1s) ionization energies group according to the hybridization state of the carbon atom and, moreover, that saturated (sp3 hybridized) carbons have lower ionization energies than do unsaturated (sp2, sp hybridized) carbons.1 We argue that this is an unjustified assumption. Here, we present the analysis of the gas-phase photoelectron spectrum of cyclopentene as an example. The results are backed by a large number of accurately measured C1s ionization energies.
Experimental and Results The C1s photoelectron spectrum of gaseous cyclopentene was measured at beamline I411 at an instrumental resolution of 72 meV and a photon energy of 332 eV, c.f. Fig 1. The spectrum was fitted using atom-specific theoretical lineshapes. Since the two sp2 carbons (C1 and C2) are equivalent and also C3 and C5, cyclopentene has three inequivalent carbon atoms. The agreement between the fit and the experimental spectrum leaves no doubt about the assignment.
The measured adiabatic ionization energies are 289.988 eV (C1,C2), 290.372 eV (C3,C5) and 290.318 eV (C4). 2
Our interpretation of the spectrum is in strong contradiction to how several authors interpret the photoelectron spectrum of cyclopentene physisorbed on various semiconducting surfaces 1,3,4. As stated above, it seems common to assume that C1s ionization energies group according to hybridization, and moreover, that unsaturated (sp2, sp) carbons have higher ionization energies than do saturated (sp3). This assumption seems to have been motivated by gas-phase measurements of the three C2 hydrocarbons, namely ethane (H3C CH3), ethene (H2C=CH2) and ethyne (HC CH).
Since physisorption leads only to a small perturbation of the molecule, there is no reason to believe that this would radically change the internal positions of the ionization energies measured in the gas phase. Hence, it is relevant to look to high-resolution gas phase ionization energies when assigning physisorption spectra.
Firstly, albeit the ionization energies of the two sp3-carbons of cyclopentene have similar ionization energies, this is not a rule applicable for hydrocarbons in general. E. g. in propene 5
(H2C=CH-CH3), the central sp2 carbon and the sp3 carbon have very similar ionization energies, while the terminal sp2 carbon has about 0.5 eV lower energy. Secondly, in both cyclopentene and propene (and also many other unsaturated hydrocarbons), the lowest ionization energy within the molecule is found to be that of an unsaturated carbon atom.

MAX-lab ACTIVITY REPORT 2010 211
SYNCHROTRON RADIATION – BEAMLINE I411
1 H. Liu and R. Hamers, Surf. Sci. 416 (1998) 354-362. 2 M. G. Zahl et al., J. Phys. Chem. C 114 (2010) 15383-153933 Lee et al., Surf. Sci. 462 (2000) 6-18. 4 R. Passmann et al., Phys. Status Solidi B, 246 (2009) 1504-1509. 5 T. D. Thomas et al., J. Phys. Chem. A 109 (2005) 5085-5092.
Figure 2. C1s ionization energies for 25 hydrocarbons. The ionization energies are grouped according to the hybridization of the ionized carbon. Long bars represent saturated compounds, i.e. compounds having only sp3 carbons.
Fig. 2 shows how C1s ionization energies of 25 hydrocarbons group according to the hybridization of the ionized carbon atom. The compounds included are methane, ethane, ethene, ethyne, propane, propene, propyne, butane, 1,3-butadiene, 1-butyne, 2-butyne, cyclopentene, 1-pentyne, 2-pentyne, 1,3-pentadiene, trans-3-hexene, 3-hexyne, cyclohexane, cyclohexene, 1,3-cyclohexadiene, 1,4-cyclohexadiene, benzene, toluene, 1,3-dimethylbenzene (m-xylene), and 1,4-dimethylbenzene (p-xylene). For each hybridization state, we see that the ionization energies are distributed over a fairly wide energy range (1-1.5 eV) which largely is overlapping with the energy regions for other hybridization states. Evidently, the choice of ethane, ethene and ethyne as model compounds is not justified since their ionization energies are not typical for their hybridization states. In fact, both ethene and ethyne have the highest ionization energy within their respective groups. A more thorough discussion of this topic can be found in Ref. 2.
Conclusions Photoelectron spectra of hydrocarbons physisorbed to semiconducting surfaces cannot be assigned using simple rules based on the hybridization of the ionized carbon. However, since physisorption only to a small extent will influence relative shifts, one possible solution is to use ionization energies obtained in the gas phase for the very same compound as a tool in the assignment.
Acknowledgments We would like to thank Maxim Tchaplyguine and MAX-lab staff for their assistance during the beamtime. The Nordic Research Board (NORDFORSK), Transnational Access to Research Infrastructure within the 7th Framework Programme (ELISA) and the Norwegian High Performance Computing Consortium NOTUR are also gratefully acknowledged.

212 MAX-lab ACTIVITY REPORT 2010
SYNCHROTRON RADIATION – BEAMLINE I411
Figure 1. K 2p core level photoelectron spectra of varied size KCl clusters recorded at 70eV photon energy.
Geometric structure and chemical properties of alkali halide clusters have been extensively investigated by various methods, also because these clusters are good models for studying ionic bonding in compounds. Mass spectroscopic results suggest that this kind of clusters is formed with a similar crystalline structure as their solid counterpart and shaped as cubes or cuboids. Photoelectron spectroscopy is an established tool to directly investigate the evolution of
formation of clusters before their fragmentation. Core level photoelectron spectroscopy of clusters provides insight into the interactions inside clusters revealing the information on the size dependent bonding mechanism.
The EXMEC cluster source in a junction with an adiabatic-
expansion argon-cluster source has succeeded earlier in producing the metal clusters, and in the present work it was
employed to produce the ionic-bonding clusters out of alkali-halide salts. A detailed description of the EXMEC-source is given in Ref [1]. All the experimental apparatuses were mounted at the permanent end-station of the I411 soft x-ray undulator beamline at Max-lab. The core level photoelectron spectra were recorded using Scienta R4000 hemispherical analyzer fixed at 90 degrees to the polarization plane of the beamline radiation. By changing the temperature of the crucible with the solid salt inside, different sizes of salt clusters were produced, and K 2p spectra were recorded at 70eV photon energy for each cluster-size produced (Fig.1). Figure 1 shows the K 2p monomer signal at around 25eV binding energy with two spin-orbit components
overlapped. At four different clustering conditions, as the crucible was heated up from 370 C to
Chaofan Zhang, Tomas Andersson, Svante Svensson, Olle Björneholm Department of Physics and Astronomy, Box 516, 751 20 Uppsala, Sweden
Marko Huttula, Mikko-Heikki Mikkelä, Dmitri Anin Department of Physics, University of Oulu, P.O. Box 3000, 90014 University of Oulu, Finland
Maxim Tchaplyguine and Gunnar Öhrwall MAX-lab, Lund University, Box 118, 22100 Lund, Sweden
Size dependent properties and interactions in free nanoscale potassium halide clusters as seen by XPS

MAX-lab ACTIVITY REPORT 2010 213
SYNCHROTRON RADIATION – BEAMLINE I411
References
[1] M. Huttula, M. –H. Mikkela, M. Tchaplyguine, and O. Bjorneholm, J. Electron Spectrosc. Relat. Phenom. 181 (2010) 145–149
[2] Anthony W. Potts and Terence A. Williams, J. Chem. Soc., Faraday Trans. 2, 1976, 72, 1892-1900.
[3]C.Zhang, T. Andersson, S. Svensson, O. Björneholm, M. Huttula, M. –H. Mikkela, M. Tchaplyguine,and Gunnar Öhrwall. (submitted to J. Chem. Phys.) , 2011.
445 C, unambiguous cluster peaks were obtained at 2.5 to 2.8 eV lower binding energy relative
to the monomer.
The K 2p spectra of KI clusters were also recorded using the same setup but in a different series of experiments. The difference in binding energies of K 2p between KCl and KI monomer is only 0.2eV, which matches very well the experimental results obtained by A. W. Potts in 1970s [2]. Inspection of figure 2 discloses the difference in the monomer-cluster shift between KI and KCl of around 0.8eV.
In our former studies on NaCl clusters [3], an ionic model was employed for interpreting the big binding energy shift (from monomers to clusters) both at the metal and halogen sites. The calculated values have satisfactorily matched the experimental results. It has been found that the Coulomb interaction and polarization interaction are vital contributions to the shift. When the clusters became bigger, the steps of shifts became smaller. This phenomenon has also been found for the other kinds of clusters like rare gas clusters and metal clusters. From the experimental and model studies on the electronic structures of Na and K halide clusters, it becomes clear that the interatomic distance and polarizability of halogen ions do affect substantially the energy structure of the clusters.
Figure 2. K 2p core level photoelectron spectra of KCl and KI clusters recorded at 70eV and 40eV respectively.

214 MAX-lab ACTIVITY REPORT 2010
SYNCHROTRON RADIATION – BEAMLINE I411
Solvent-mediated inter-molecular Coster-Kronig decays in aqueous ions
G. Ohrwall,1 N. Ottosson,2 W. Pokapanich,2 S. Legendre,2 S. Svensson,2 and O. Bjorneholm2
1MAX-lab, Lund University, P.O. Box 118, SE-221 00 Lund, Sweden2Dept. of Physics and Astronomy, Uppsala University, P.O. Box 516, SE-751 20 Uppsala, Sweden
The degree of association between a cation and solvent molecules in a solution can be probed in various ways.One characteristic that conceivably could be affected by chemical interaction between the ion and the solvent, andprovide an experimental observable, is the lifetime of a vacancy in the outermost core orbital, which decays primarilyvia radiationless Auger decay, in which the core hole is filled by one outer electron while another outer electron isemitted. The influence of the surrounding on the valence electrons can affect the rate of core-valence-valence Augerdecays, which indeed has been observed in free small molecules [1]. An extreme situation occurs when all the valenceelectrons of a solvated cation has been donated to the counterion, which in principle would prevent an Auger decayfrom the outermost core level. Auger-like decays involving orbitals from the surrounding solvent molecules will stillbe possible, however. An example of such a decay has been found in aqueous solutions of KCl, where Auger signalfrom final states involving orbitals on water molecules surrounding the K+ ion has been observed after ionization ofthe L2,3 edges [2]. In the case of the aqueous ions Na+, Mg2+, and Al3+, the 3s and 3p orbitals are usually consideredempty, and the 2s and 2p levels are the outermost ones. In the corresponding metals, which can be described asconsisting of such ions surrounded by delocalized valence electrons in s- and p-bands, a 2p vacancy will predominantlyrelax by Auger decay. A 2s hole predominantly relaxes by Coster-Kronig decay, which is much faster than normalAuger decay. For the corresponding free ions, these decays are forbidden, due to the lack of available valence electronsto fill the 2p hole, and for energy reasons for the 2s vacancy. One can compare to the situation in solid sodiumhalides, where it is known that interatomic Auger and Coster-Kronig processes occur after Na 2p and 2s ionization,respectively, and the electrons that take part in the relaxation originate from the neighboring halide ions [3]. Thiscould also be expected for crystalline magnesium and aluminum salts, but in a solution, where the interaction betweenthe cation and the solvent molecules is weaker than in an ionic compound, the situation is by no means self evident.We have therefore made an investigation of the widths of the cation 2s and 2p photoelectron lines from solutions ofNaCl, MgCl2, and AlCl3, using a liquid micro-jet setup, to see whether a difference in lifetime related to the differention-solvent interaction of the three differently charged ions can be observed [4].The measurements were performed at the undulator beamline I411. Aqueous solutions of sodium chloride, magne-
sium chloride, and aluminum trichloride were prepared by mixing commercially obtained salts with de-ionized water.The concentrations were 3.0, 3.0, and 0.5 m (mol / kg solvent) for NaCl, MgCl2, and AlCl3, respectively. The exper-imental setup used has been described in detail in Ref. [5]. Briefly, the sample was introduced into vacuum as a jetformed by a nozzle with a diameter of 15 μm, backed by a HPLC pump. The jet was injected into a differentiallypumped compartment, with a 1 mm diameter hole to allow the synchrotron radiation into the ionization region, andwith a skimmer with a 0.5 mm diameter opening towards the electron spectrometer. After passing the soft X-rayradiation, the liquid was collected by a liquid nitrogen-cooled trap. The measurements were performed at a distanceof 2–3 mm downstream from the nozzle, at a point before the jet spontaneously breaks into a train of droplets.The jet propagation axis was perpendicular to the exciting radiation and to the detection axis of the spectrometer.The spectrometer was mounted with the lens axis at an angle of 54.7◦ relative to the plane of polarization from theundulator radiation, to minimize angular distribution effects.In Fig. 1, example photoelectron spectra of the Mg 2p and 2s levels from an aqueous solution of MgCl2 are shown
A direct comparison shows that the 2s line is significantly broader than the 2p feature, even though the latter issplit by the spin-orbit interaction in the final state. This was also the case for Na and Al from aqueous NaCl andAlCl3 [4]. We have attempted to determine the lifetime of the 2p and 2s vacancies from the spectral widths using curvefitting of symmetric Voigt profiles. In our fittings, we have fixed the spin-orbit splitting to values for metallic sodium,magnesium and aluminium: 0.169, 0.28 and 0.40 eV, respectively [6, 7]. We have assumed a zero contribution to theLorentzian width for the 2p lines, and under this assumption, the Gaussian widths in the fitting of the 2p spectra willbe maximized. Using the same Gaussian widths when fitting the 2s spectra will then give a minimum for the lifetimewidth of the 2s vacancies. From such fits, we obtain Lorentzian widths Γ2s of 0.21, 0.45, and 0.67 eV for the 2s linesof aqueous sodium, magnesium and aluminum ions, respectively. These lifetime widths show the same trend and areactually quite similar to those found in the metallic cases, 0.28, 0.46, and 0.78 eV, respectively [6, 7].The reason for the larger lifetime width of the 2s compared to the 2p level in the metals is the fast Coster-Kronig
decay of the 2s hole, involving a 2p electron filling the 2s vacancy, and a 3s or 3p electron being ejected, on a timescale in the femtosecond range. In free ions, this decay would be impossible, as there are no 3s or 3p electrons tocarry away the excess energy. A super-Coster-Kronig decay, involving two 2p electrons, one filling the 2s core holeand one being ejected, is impossible for energetic reasons in the metals as well as for the free or solvated ions. The

MAX-lab ACTIVITY REPORT 2010 215
SYNCHROTRON RADIATION – BEAMLINE I411
FIG. 1: Photoelectron spectra of the 2p (upper) and 2s (lower) levels from an aqueous solution of MgCl2 . The solid lines(black) correspond to the total intensities of the fits, and the dot-dashed lines (blue) represent the residues. The data pointsare represented by filled circles (red). A linear background has been subtracted in the spectra. In the 2p spectrum, the dashedlines (black) represent the Voigt profiles of the 2p spin-orbit components. Γ and G refer to the Lorentzian lifetime width ofthe lines and the corresponding Gaussian width obtained from curve fitting. The scale on the vertical axis differs between thespectra, but the scale of the energy axis is the same.
most obvious explanation of the Lorentzian width of the 2s lines for the solvated ions is that an intermolecular Coster-Kronig process takes place, where instead of the 3s or 3p electron, an electron from the surrounding water moleculesor an associated anion is emitted after the 2s vacancy has been filled by an electron from the 2p shell. This processis similar to ICD, in which a vacancy in an inner valence shell of an atom or molecule in a weakly bound complex isfilled by an outer valence electron, while a valence electron from a neighboring site in the complex is emitted into thecontinuum [8].The observed widths correspond to lifetimes of the (2s)−1 inner valence state of 3.1, 1.5 and 0.98 fs for Na+, Mg2+,
and Al3+ respectively. The decrease of the lifetime from Na+ to Al3+ correlates well with the increased ion-waterinteraction. This interaction is dominated by the first solvation shell, which contains approximately the same amountof water molecules (5.4 for Na+, 6 for Mg2+ and Al3+ [9], but the ion-water distance decreases with increasing ioniccharge ( 2.4 A for Na+, 2.1 A for Mg2+, and 1.9 A for Al3+ [9]). First of all, a smaller ion-water distance means a largeroverlap between the ion and water orbitals, which would facilitate this ICD-like Coster-Kronig process. Secondly, thesolvent polarization induced by the positive ions, where the increased charge in the core-ionized intermediate stateshould be considered, increases the electron density in the vicinity of the ion with the core hole. Since the degree ofwater polarization in the first solvation shell is very much dependent on the charge of the ion the discussed ICD-likedecay processes should be more efficient for the more highly charged ions, just as observed. These polarization effects,and, particularly for the case of Al3+, the possibility of hybridization between the outer water valence orbitals andthose of the ions, are thus certainly factors that determine the decay transition rates. To make quantitative estimatesof the transition rates to gain insight into these phenomena would most likely require a very complex and mostdemanding theoretical treatment, but would be an exciting issue to investigate further.
[1] Coville, M.; Thomas, T. D. Phys. Rev. A 1991, 43, 6053.[2] Pokapanich, W.; Bergersen, H.; Bradeanu, I. L.; Marinho, R. R. T.; Lindblad, A.; Legendre, S.; Rosso, A.; Svensson, S.;
Bjorneholm, O.; Tchaplyguine, M.; Ohrwall, G.; Kryzhevoi, N. V.; Cederbaum, L. S. J. Am. Chem. Soc. 2009, 131, 7264.[3] Wertheim, G. K.; Rowe, J. E.; Buchanan, D. N. E.; Citrin, P. H. Phys. Rev. B 1995, 51, 13669.
[4] Ohrwall, G.; Ottosson, N.; Pokapanich, W.; Legendre, S.; Svensson, S.; Bjorneholm, O. J. Phys. Chem. B 2010, 114, 17057.
[5] Bergersen, H.; Marinho, R. R. T.; Pokapanich, W.; Lindblad, A.; Bjorneholm, O.; Sæthre, L. J.; Ohrwall, G. J. Phys.Condens. Matter 2007, 19, 326101.
[6] Citrin, P. H.; Wertheim, G. K.; Baer, Y. Phys. Rev. Lett. 1975, 35, 885.[7] Citrin, P. H.; Wertheim, G. K.; Baer, Y. Phys. Rev. B 1977, 16, 4256.[8] Cederbaum, L. S.; Zobeley, J.; Tarantelli, F. Phys. Rev. Lett. 1997, 79, 4778.[9] Marcus, Y. Chem. Rev. 2009, 109, 1346.
58 57 56 55 54 53
97 96 95 94 93 92Binding Energy (eV)
Mg2+(aq)hν=140 eV
2pG=1.10 eV(Γ=0 eV)
2sΓ=0.45 eV
Inte
nsity
(arb
. uni
ts)
Inte
nsity
(arb
. uni
ts)

216 MAX-lab ACTIVITY REPORT 2010
SYNCHROTRON RADIATION – BEAMLINE I511
Charge transfer and chemical interaction of ZnPc and FePc
on Au(111) and Au(111)-I
S.Ahmadia, S.Yua, N.Shariatib, and M. Göthelida
aMaterial Physics, ICT, Royal Institute of Technology, Electrum 229, SE-164 40 Stockholm, Sweden
bDepartment of Physics, Uppsala University, Box 530, S-751 21 Uppsala, Sweden
The dye-sensitized solar cell, also known as the Grätzel cell contains many components whose mutual interaction determines transfer of photo-excited electrons, current and voltage from the cell, and thus efficiency of the cell. The detailed interaction and energy level alignment at each interface will affect the output from the cell.
Phthalocyanines have been widely used in photo-electronic devices and are potential candidates for solar cell applications. In this work we have studied two different phthalocyanines; FePc and ZnPc adsorbed on Au(111) and iodated Au(111).
Iodine modified Au is used to represent the cathodic part of the solar cell [1]. Two different surface structures occur on Au(111)-I, a ( 3x 3) reconstruction at 1/3 monolayer coverage and a ( 7x 7)R19 reconstruction just below ½ monolayer coverage.
The charge transfer across the weakly interacting gold-organic interface (both magnitude and direction) was shown to depend on the d-filling of the metallic center (Co, Ni, Cu) in the molecule [2]. We have extended their study to include ZnPc and FePc monolayers on Au(111). The presence of iodine at the interface modifies the bonding and charge transfer situation. This depends both on the metal center atom and the iodine reconstruction.
At monolayer coverage there is a substrate mediated interaction between phthalocyanine molecules and Au substrate which is mixture of molecular and metal states.
In figure 1, spectra from the “near Fermi level” region are shown. MPc induced structures are clearly seen whose energy distribution depends on the central metal atom.
Figure 1. Photoemission spectra (hv=110eV)for clean
Au(111),FePc/ZnPc on Au(111), monolayer and thick film
The structures at about 0.8eV for monolayer (ML) spectra are due to the interface HOMO which possesses the highest intensity at 1 ML. At higher coverage these interface structures decrease in intensity while the bulk like molecular HOMO appears at higher binding.
In monolayer of FePc we also observe a state close to Fermi level at about 0.15 eV. This state decreases at higher coverage after ML and disappears in thick molecular film. It probably is related to central metal atom states interacting with Au. Being very close to the Fermi level, this state is said to be due to charge transfer from metal states to formerly LUMO.

MAX-lab ACTIVITY REPORT 2010 217
SYNCHROTRON RADIATION – BEAMLINE I511
References:
1. M. Grätzel. Nature 414 (338-344) 2001
2. J. Xiao; P. A. Dowben. Journal of Physics: Condensed Matter 21, 2009
3. P. Gargiani; M. Angelucci; C. Mariani and M. G. Betti. Physical Review B 81, 2010
Figure2. Photoemission spectra (hv=110eV) for monolayer of a)FePc and b) ZnPc on clean Au(111), Au-I ( 7x 7)R19 and Au-I
This work was supported by the Swedish Research Council (VR) and the Göran Gustafsson Foundation.
This state is absent in the ML film of ZnPc which has filled 3d metal orbitals in the centre. This is in agreement with literature where this state exists for FePc and CoPc but disappears by increasing the number of electrons in 3d-metal atom [3].
Figure 2a and b present valence band spectra of one monolayer of FePc and ZnPc on Au(111), Au-I ( 7x 7)R19 and Au-I ( 3x 3). Iodine in the ( 7x 7)R19 structure reacts with Zn in ZnPc and oxidize the molecule while this reaction is not visible on the ( 3x 3) structure. The chemical interaction between iodine and FePc is weaker. The different interactions affect the energy level alignment, the HOMO position with respect to the Fermi level are different.

218 MAX-lab ACTIVITY REPORT 2010
SYNCHROTRON RADIATION – BEAMLINE I511
Electronic Properties of Lutetium Phthalocyanine Thin Films
In a preoccupation with a reduction of the production costs as well as to decrease the environmental impact during manufacture; many hybrid devices containing active macromolecules, such as phthalocyanine, made their appearance since the year 2000. These hybrid devices have real potentialities of development in industrial sectors such as environmental protection 1,2. Lutetium phthalocyanine (LuPc2) molecules is of interest for gas sensors based on field effect transistor system and related devices, where these molecules are used as an active medium sensitive to polutant exposures (NO2, NH3). However the processes that govern the
reactivity are not well understood yet, motivating the interest to investigate these processes. In this experiment we examined the organization of LuPc2 on one of the technologically most largly used electronic’s base materials – namelly Si(100) reconstructed 2x1 substrate. We compared the organization of LuPc2 on clean silicon (clean Si) substrate and on a passivated Si (Si-H) substrate by means of fully polarized Near Egde Absorption Fine Structure (NEXFAS) carried out at the nitrogen K edge. The Si(100) reconstructed 2x1 surface was performed by removing the native oxyde layer by flashing the substrate
to 1050°C for 15s. The passivation of Si substrate was performed by exposing the reconstructed 2x1 silicon surface to atomic hydrogen while keeping the sample at 300°C. During that process the atomic hydrogen
bonds to Si dangling bonds making the substrate surface less reactive and therefore allowing the self-organization of the adsorbed molecules. The evaporation of LuPc2 was performed in situ under ultra high vacuum conditions and varying the thickness of the evaporated layer from few layers to multi-layer sample. We performed Near Edge X-ray Absorption Fine structure (NEXAFS) measurements in two geometries with respect to the polarization of the incoming light – paralel to the substrate and perpendicular to the substrate; allowing us to get information on organization of the molecules on
Figure 1 Polarization dependent N1s NEXAFS on thin layer of LuPc2 adsorbed on vicinal Si(001)-(2x1) surfaces . Spectra on Si-H (left, a,b) and clean Si (right, c,d) at two different sample positions with respect to the polarization of the incoming light which are shown by arrows.
I.Bidermane, S.Boudet, N.Witkowski
Institut des NanoSciences de Paris (INSP), UMR-CNRS 7588, 4 Place Jussieu, 75005 Paris, France. Université Pierre & Marie Curie (Paris 6)
N.Shariati
Ångströmlaboratoriet, Department of Physics and Astronomy, Surface and Interface Science Lägerhyddsvägen 1, 751 20 Uppsala, Sweden.

MAX-lab ACTIVITY REPORT 2010 219
SYNCHROTRON RADIATION – BEAMLINE I511
[1] M.Bouvet, G.Guillaud, A.Leroy, A.Maillard, S.Spirkovitch, F.-G Tournilhac. Sens.Act. B Chem. Vol. 73(1), 63-70 (2001). [2] M.Bouvet Anal Bional Chem. 384: 366-373 (2006)
the surfaces. The graphs shown in figure1 represent NEXAFS spectra for thin layer of LuPc2 evaporated on clean Si (c,d) and on Si-H(a,b) for the two geometries. All the spectra show sharp peaks at lower energy which correspond to pi transitions perpendicular to the plane whereas at high energy broad features represent sigma transitions happening in the plane of the molecule. On both substrates an intense sigma transition is observed in geometry when the light polarization is in the
surface plane, together with weak signal from pi transitions; opposite behavior is seen for out of plane polarization indicating a rather flat orientation of the molecules on both surfaces One can notice an additional feature at 399eV for graph c on clean Si which is not present in the same thickness sample on Si-H. The same feature is slightly observed also when the light polarization is perpendicular to sample surface. This clearly indicates the presence of a Si-N bond when LuPc2 is deposited on the clean surface whereas to bound are present on the hydrogenated surface. Additionally in figure2 where we
compare the two substrates at large thicknesses one can observe that the additional peak at 399 eV is not present any more, corroborating that this contribution comes from the interactions between the first layer of molecules and the substrate.
Now if one compares the spectra from samples with thick layer of LuPc2 (figure2) one can observe that spectra for both orientations on clean Si (figure2, c,d) have practically the same structure which gives us an indications that the molecules are oriented in an angle close to 45° with respect to substrate. However the case for Si-H (figure2, a,b) is slightly different where they seem to be more lying down with two deckers paralel to substrate. However for more precise understanding of orientation shift with increasing thickness additional experiments are needed.
Figure 2 Polarization dependent N1s NEXAFS on thick layer of LuPc2 adsorbed on vicinal Si(001)-(2x1) surfaces . Spectra on Si-H (left, a,b) and clean Si (right, c,d) at two different sample positions with respect to the polarization of the incoming light which are shown by arrows.
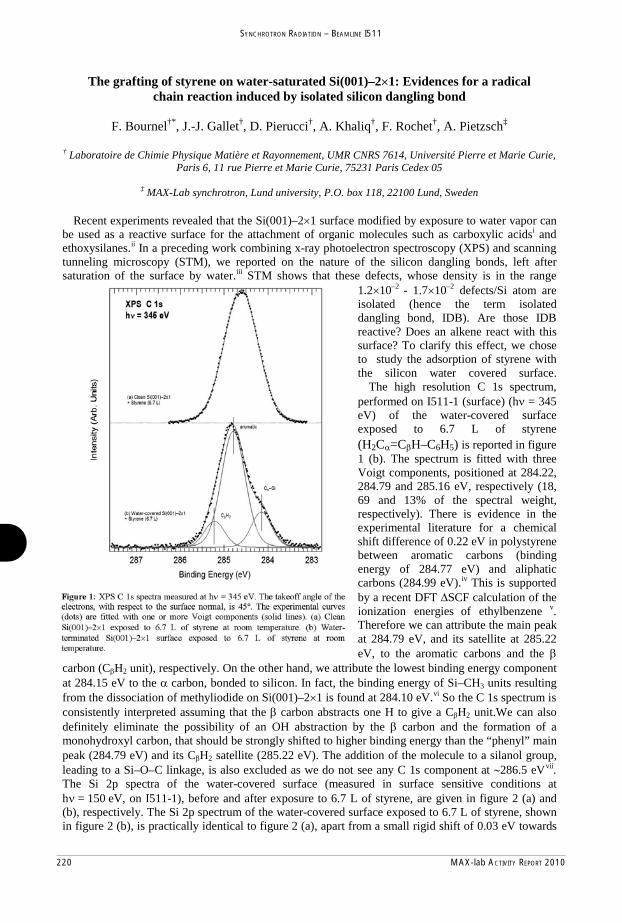
220 MAX-lab ACTIVITY REPORT 2010
SYNCHROTRON RADIATION – BEAMLINE I511
The grafting of styrene on water-saturated Si(001)–2 1: Evidences for a radical chain reaction induced by isolated silicon dangling bond
F. Bournel†*, J.-J. Gallet†, D. Pierucci†, A. Khaliq†, F. Rochet†, A. Pietzsch‡
† Laboratoire de Chimie Physique Matière et Rayonnement, UMR CNRS 7614, Université Pierre et Marie Curie, Paris 6, 11 rue Pierre et Marie Curie, 75231 Paris Cedex 05
‡ MAX-Lab synchrotron, Lund university, P.O. box 118, 22100 Lund, Sweden
Recent experiments revealed that the Si(001)–2 1 surface modified by exposure to water vapor can be used as a reactive surface for the attachment of organic molecules such as carboxylic acidsi and ethoxysilanes.ii In a preceding work combining x-ray photoelectron spectroscopy (XPS) and scanning tunneling microscopy (STM), we reported on the nature of the silicon dangling bonds, left after saturation of the surface by water.iii
The high resolution C 1s spectrum,performed on I511-1 (surface) (h = 345 eV) of the water-covered surface exposed to 6.7 L of styrene(H2C =C H–C6H5) is reported in figure 1 (b). The spectrum is fitted with three Voigt components, positioned at 284.22, 284.79 and 285.16 eV, respectively (18, 69 and 13% of the spectral weight, respectively). There is evidence in the experimental literature for a chemical shift difference of 0.22 eV in polystyrene between aromatic carbons (binding energy of 284.77 eV) and aliphatic carbons (284.99 eV).
STM shows that these defects, whose density is in the range 1.2 10–2 - 1.7 10–2 defects/Si atom are isolated (hence the term isolated dangling bond, IDB). Are those IDB reactive? Does an alkene react with this surface? To clarify this effect, we chose to study the adsorption of styrene with the silicon water covered surface.
iv This is supported by a recent DFT SCF calculation of the ionization energies of ethylbenzene v.Therefore we can attribute the main peak at 284.79 eV, and its satellite at 285.22 eV, to the aromatic carbons and the
carbon (C H2 unit), respectively. On the other hand, we attribute the lowest binding energy component at 284.15 eV to the carbon, bonded to silicon. In fact, the binding energy of Si–CH3 units resulting from the dissociation of methyliodide on Si(001)–2 1 is found at 284.10 eV.vi So the C 1s spectrum is consistently interpreted assuming that the carbon abstracts one H to give a C H2 unit.We can also definitely eliminate the possibility of an OH abstraction by the carbon and the formation of a monohydroxyl carbon, that should be strongly shifted to higher binding energy than the “phenyl” main peak (284.79 eV) and its C H2 satellite (285.22 eV). The addition of the molecule to a silanol group, leading to a Si–O–C linkage, is also excluded as we do not see any C 1s component at 286.5 eVvii.The Si 2p spectra of the water-covered surface (measured in surface sensitive conditions at h = 150 eV, on I511-1), before and after exposure to 6.7 L of styrene, are given in figure 2 (a) and (b), respectively. The Si 2p spectrum of the water-covered surface exposed to 6.7 L of styrene, shown in figure 2 (b), is practically identical to figure 2 (a), apart from a small rigid shift of 0.03 eV towards

MAX-lab ACTIVITY REPORT 2010 221
SYNCHROTRON RADIATION – BEAMLINE I511
i Ihm, K.; Kang, T.-H.; Moon, S.; Hwang, C. C.; Kim, K.-J.; Hwang, H -N.; Jeon, C.-H.; Kim, H.-D.; Kim, B.; Park, C. -Y. J. of Electron Spectrosc. Relat. Phenom.2005, 144-147, 397-400.
ii Fan, C.; Lopinski, G. P. Surf. Sci. 2010, 604, 996-1001.
iii Gallet, J.-J.; Bournel, F.; Pierucci, D.; Rochet, F.; Silly, M. G.; Sirotti, F.; J. Phys. Chem. C, accepted 2011, jp-2011-01262.
iv Beamson, G.; Clark, D. T.; Kendrick, J.; Briggs, D. J. of Electron Spectrosc. Relat. Phenom.1991, 57, 79-90.
v Kolczewski, C.; Püttner, R.; Martins, M.; Schlachter, A. S.; Snell, G.; Sant’Anna, M. M.; Hermann, K. J. Chem. Phys.2006, 124, 034302.
vi Cao, X.; Hamers, R. J. J. Am. Chem. Soc. 2001, 123, 10988.
viiMischki, T. K.; Donkers, R. L.; Eves, B. J.; Lopinsky, G. P.; Wayner, D. D. M. Langmuir 2006, 22, 8359-8365.
higher binding energy. We do not see the appearance of a distinct line related to the formation of a Si–C bond. This is not surprising as the Si–C component has a SCLS of +0.26 eV. The Si1+ (SiOH) peak weight does not vary appreciably (it remains at ~10% of the spectral weight), which is consistent with the C 1s spectrum indicating that surfaces hydroxyls are not abstracted. The main information provided by the Si 2p spectra concerns the surface band bending, directly related to the areal density of surface acceptor states in the case of the water-covered n+-doped Si(001)–2 1surface.iii The bands are bent upward by 0.45 eV in regards of the clean surface. The above-mentioned rigid shift in binding energy indicates that the band bending slightly diminishes (by 0.03 eV) after styrene absorption. This means that the overall negative surface charge,viii and hence the areal density of negatively charged IDB, is only slightly decreased (by ~5%) after exposure to 6.7 L styrene.
Stimulated by recent observations (Ref. iii) that isolated dangling bonds have an analogous structure on H–terminated
Si(001)–2 1 and water-covered Si(001)–2 1 surfaces, we have examined if chain reaction schemes may also induce the grafting of alkenes on the latter surface. Choosing styrene as a test molecule, and core-level photoemission as a spectroscopic tool, we have observed that the molecule does react with the water-covered n+-doped Si(001)–2 1 surface at room temperature. The C 1s spectrum of the resulting product is significantly different from that of the adduct di- bonded to a silicon dimer of the clean surface. In particular, it exhibits a clear, low binding energy component, characteristic of the Si–C bond. The C 1s spectral shape also excludes the formation of a C–OH bond (OH abstraction by the radical adduct) or of a Si–O–C bond (OH addition to a surface silanol). Therefore we have gathered evidences that styrene makes a single bond with a silicon surface atom via the -carbon, and that the
-carbon captures a nearby H atom, as it is the case for defective H–terminated surfaces. Due to the intensity of the Si–C component in the C 1s spectrum, the oligomerization of the molecule via a chain reaction is also excluded.
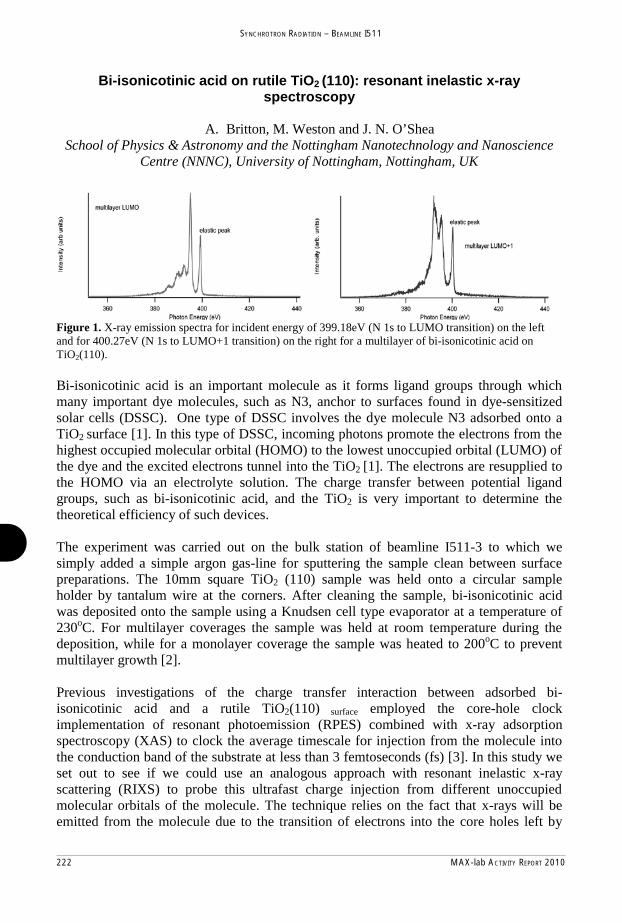
222 MAX-lab ACTIVITY REPORT 2010
SYNCHROTRON RADIATION – BEAMLINE I511
Bi-isonicotinic acid on rutile TiO2 (110): resonant inelastic x-ray spectroscopy
A. Britton, M. Weston and J. N. O’Shea
School of Physics & Astronomy and the Nottingham Nanotechnology and Nanoscience Centre (NNNC), University of Nottingham, Nottingham, UK
Figure 1. X-ray emission spectra for incident energy of 399.18eV (N 1s to LUMO transition) on the left and for 400.27eV (N 1s to LUMO+1 transition) on the right for a multilayer of bi-isonicotinic acid on TiO2(110). Bi-isonicotinic acid is an important molecule as it forms ligand groups through which many important dye molecules, such as N3, anchor to surfaces found in dye-sensitized solar cells (DSSC). One type of DSSC involves the dye molecule N3 adsorbed onto a TiO2 surface [1]. In this type of DSSC, incoming photons promote the electrons from the highest occupied molecular orbital (HOMO) to the lowest unoccupied orbital (LUMO) of the dye and the excited electrons tunnel into the TiO2 [1]. The electrons are resupplied to the HOMO via an electrolyte solution. The charge transfer between potential ligand groups, such as bi-isonicotinic acid, and the TiO2 is very important to determine the theoretical efficiency of such devices. The experiment was carried out on the bulk station of beamline I511-3 to which we simply added a simple argon gas-line for sputtering the sample clean between surface preparations. The 10mm square TiO2 (110) sample was held onto a circular sample holder by tantalum wire at the corners. After cleaning the sample, bi-isonicotinic acid was deposited onto the sample using a Knudsen cell type evaporator at a temperature of 230oC. For multilayer coverages the sample was held at room temperature during the deposition, while for a monolayer coverage the sample was heated to 200oC to prevent multilayer growth [2]. Previous investigations of the charge transfer interaction between adsorbed bi-isonicotinic acid and a rutile TiO2(110) surface employed the core-hole clock implementation of resonant photoemission (RPES) combined with x-ray adsorption spectroscopy (XAS) to clock the average timescale for injection from the molecule into the conduction band of the substrate at less than 3 femtoseconds (fs) [3]. In this study we set out to see if we could use an analogous approach with resonant inelastic x-ray scattering (RIXS) to probe this ultrafast charge injection from different unoccupied molecular orbitals of the molecule. The technique relies on the fact that x-rays will be emitted from the molecule due to the transition of electrons into the core holes left by

MAX-lab ACTIVITY REPORT 2010 223
SYNCHROTRON RADIATION – BEAMLINE I511
electrons excited to the unoccupied molecular orbitals. Previous studies have firmly established that in the core-excited state the LUMO of the molecule here lies below the conduction band and therefore cannot take part in the tunnelling process to the substrate as it lies energetically within the band gap. The LUMO+1 however, overlaps with the conduction band and is the level from which we are expecting ultrafast charge transfer to occur. We used x-ray absorption spectroscopy to determine the position of the LUMO and LUMO+1 of the molecule and measured the RIXS at these two energies for both the multiayer and monolayer of bi-iso on the surface. The spectra were calibrated using the positions of several elastic peaks.
Figure 2. X-ray emission spectra for N 1s to LUMO transition (top) and N 1s to LUMO+1 transition (bottom) photon energies for the monolayer of bi-isonicotinic acid on TiO2(110). The solid line shows the expected position of the elastic peaks. Figure 1 shows the RIXS for the multilayer showing clearly the elastic peak for both the photon energies of the LUMO and LUMO+1 transitions from the N 1s core level. The elastic peak represents electrons that have been promoted to the LUMO (or LUMO+1 depending on the incident photon energy) and consequently fell straight back into the core hole that they created and so losing no energy in the process. Unlike the multilayer case, the monolayer spectra in figure 2 showed a much larger elastic peak for the LUMO transition than for the LUMO+1. The most likely explanation for this large reduction is that the electron which has been promoted to the LUMO+1 has consequently tunnelled into the TiO2(110) substrate from the LUMO+1 and so can not drop back into the core state. We are currently investigating these effects on larger dye molecules such as organometallic dye complexes which have the bi-isonicotinic acid binding ligand in order to develop of photons-in-photons-out implementation of the core-hole clock applicable to the study of dye-sensitised solar cells. References [1] Molecular Photovoltaics, A. Hagfeldt and M. Grätzel, Acc. Chem. Res., 2000, 33 (5), pp 269–277 [2] Charge-Transfer Dynamics at Model Metal-Organic Solar Cell Surfaces, J. B. Taylor et al, J.
Phys. Chem., 111, 16646 (2007) [3] Experimental evidence for sub-3-fs charge transfer from an aromatic adsorbate to a semiconductor
J. Schnadt et al, Nature 418, 620 (2002)

224 MAX-lab ACTIVITY REPORT 2010
SYNCHROTRON RADIATION – BEAMLINE I511
The valence band electronic structure of the distorted rutile-like WO2 – a study of chemical bonding via resonant soft x-ray emission at the O K edge.
D. Cockburn1, B. Kennedy1, C. McGuinness1, R. G. Egdell2, A. Pietzsch3 and F. Hennies3 1School of Physics, Trinity College Dublin, College Green, Dublin 2, Ireland.
2Department of Chemistry, Inorganic Chemistry Laboratory, South Parks Road, Oxford, UK OX1 3QR.
3MAXLAB, Lund University, P. O. Box 118, S-221 00, Lund, Sweden.
Rutile and rutile-like transition metal dioxide MO2 compounds are interesting from both fundamental and technological viewpoints, encompassing TiO2 and SnO2 (wide bandgap semiconductor oxides suitable for transition metal doping to obtain ferromagnetic semiconductors); as well as the ferromagnetic half-metallic CrO2. WO2 is an example of a rutile-“like” monoclinic metal oxide. It differs from the rutile shape along its would-be rutile c-axis (monoclinic a-axis), here the metal-metal bonds dimerise with alternating bond lengths in a similar fashion to the well known VO2 at room temperature. It is these metal-metal bonds that give rise to the dimerisation, specifically where the W ion has a 5d2 occupation. The inherent structural repeat units of edge-sharing WO6 octahedra and W3O planes, a feature of all rutile systems, persists in the monoclinic structure with octahedral edge sharing along the monoclinic a-axis. Of importance for these spectroscopic measurements are the W3O planes or trigonal planar coordination of the oxygen atom; this results in oxygen sp2 hybridisation. All these planes have central oxygen atoms that form the corners of every WO6 octahedra and thus the W3O planes common to the apical oxygens are at 90° to the W3O planes arising from any and all of the oxygen atoms around the waist of the octahedron. Nevertheless each W3O plane shares the monoclinic a-axis within their planes.
Previously, WO2 has been studied by UPS [1, 2], core level photoemission, EELS [3] as well as W L2,3 XAS and O K-edge non-resonant x-ray emission [4] but no study has yet exploited the linear dichroism at the O K edge which is expected due to the arrangement of W3O planes. The electronic structure of WO2 and of similar distorted rutile-like oxides such as MoO2, NbO2 and VO2, are of interest due to the variety of the metal-metal interactions and metal-insulator transitions that these materials exhibit. To understand the electronic structure and chemical bonding within this system we have applied a combination of x-ray absorption spectroscopy (XAS) and resonant x-ray emission spectroscopy (RXES) at the O K edge to a single oriented bulk crystal of WO2. These measurements occurred at the I511 soft x-ray undulator beamline, specifically the I511-3 bulk branch at MAX-lab.
All measurements were carried out on a single crystal of WO2. The crystal was grown by the vapour transport method [5] from commercially available WO2 powder and this crystal had previously been characterised by ultraviolet photoemission spectroscopy, LEED and STM [1, 2]. The crystal itself measures approximately 4 x 5 x 2.5 mm and has a single flat smooth growth face which experimental Laue x-ray back reflection supported by LEED and STM has identified as the (012) plane [2]. All the measurements shown here are recorded in an “out-of-plane” scattering geometry with the XES spectrometer rotated so that the plane of scattering is at 90° to the plane of polarisation of the incident excitation.
Like rutile compounds, the local planar coordination of oxygen atoms in the W3O planes result in planes containing a common axis, in this case the monoclinic a-axis [6]. In general the sp2 hybridised oxygen 2p states are separated into - and -like molecular orbitals involving the metal cation, perpendicular to the W3O plane or within the plane respectively, giving rise to a natural linear dichroism. In the case of WO2, due to the monoclinic distortion and W-W dimerisation along the monoclinic a-axis due to the 5d2 configuration, there now arises two inequivalent oxygen sites O1 and O2, where O2 is centred in a W3O triangular plane with the longer W-W distance along one-edge and where the average W-O bondlength is increased by about 3.3%. Thus the O 2p -like orbital on O2 is essentially non-bonding, whereas the equivalent O 2p orbital ( local W3O plane) is much more effectively hybridised with W 5d orbitals. When the monoclinic a-axes of WO2 is oriented parallel to the linearly polarised incident synchrotron radiation, it then excites into primarily
* states, when oriented perpendicular to the a-axis then a combination of * and * are selected thus giving a symmetry selected oxygen 2p conduction band partial density of states (PDOS) although averaging over the O1 and O2 sites. Exploiting polarisation dependent resonant soft x-ray emission spectroscopy (RXES) at the oxygen K-edge can then probe the occupied oxygen 2p and states to measure the symmetry and site selected oxygen 2p valence band PDOS.
The figure shows the oxygen K-edge x-ray absorption spectrum of WO2 where the electric field vector is parallel to the a-axis (blue lines) and parallel to the a-axis (red lines). Two sets of oxygen K-edge RXES spectra are similarly compared at these two orientations of, where the excitation energies are respectively 531.4 and 537.3 eV as indicated by the orange lines. The difference in the RXES propagating

MAX-lab ACTIVITY REPORT 2010 225
SYNCHROTRON RADIATION – BEAMLINE I511
References: 1. Gulino, A., et al., Influence of metal-metal bonds on electron spectra of MoO2 and WO2. Journal of
the Chemical Society-Faraday Transactions, 1996. 92(12): p. 2137-2141. 2. Jones, F.H., et al., Surface structure and spectroscopy of WO2(012). Surface Science, 1997. 374(1-
3): p. 80-94. 3. Jiang, N. and J.C.H. Spence, Electron energy-loss spectroscopy of the OK edge of NbO2, MoO2, and
WO2. Physical Review B, 2004. 70(24). 4. Khyzhun, O.Y., XPS, XES and XAS studies of the electronic structure of tungsten oxides. Journal of
Alloys and Compounds, 2000. 305(1-2): p. 1-6. 5. Bendor, L. and L.E. Conroy, Similarity between Tungsten Bronzes and Dioxides of W and Mo. Israel
Journal of Chemistry, 1969. 7(5): p. 713-&. 6. Sorantin, P.I. and K. Schwarz, Chemical Bonding in Rutile-Type Compounds. Inorganic Chemistry,
1992. 31(4): p. 567-576.
along the monoclinic a-axis in each instance can be attributed directly to the dichroism present or anisotropy in bonding around the oxygen sites.
As observed, the leading edge of the dominant O 2p portion of the valence band emission in the E || a spectrum trails significantly behind that of E_|_a spectrum; this occurs both at the threshold excitation energy of 531.4eV and at the higher excitation energy of 537.3 eV but to a lower degree. A difference spectrum at the threshold energy essentially reveals the O2 2p -like PDOS as more holes are created on the O2 site at these excitation energies while at the higher energy this difference spectrum has transformed to a more equal linear combination of the O1 and O2 2p -like PDOS. This is evident in the context of density functional theory calculations which are not shown here for brevity. In addition, a dispersion of the features in this difference spectrum can be observed as the excitation energy increases. These RXES tools allow for further insight into the W-O bonding as well as into the W 5d-O2p hybridisation and the W–W bonding along the monoclinic a-axis.
Figure 1: Out of plane O K-edge XAS and RXES spectra of metallic WO2. Two orthogonal crystal orientations are compared for a near threshold excitation and one higher excitation energy. The excitation energies for each set of spectra are indicated by the orange lines.

226 MAX-lab ACTIVITY REPORT 2010
SYNCHROTRON RADIATION – BEAMLINE I511
Electronic and Surface Structure of Light-harvesting Quantum Dots
Figure 1: Schematic diagram of Type I and Type IIquantum dots. In Type II, the hole is localised inthe core, while the electron is trapped in the shell.
There is an urgent requirement both to improve the efficiency of solar cells and to produce astep change in the cost of solar technology. Promising candidates for ‘next-generation’ celltechnology include colloidal semiconductor quantum dots (QDs) that harvest the incidentlight, creating an electron-hole pair (exciton), and n-type and p-type conductors that separatethe charge. These QDs have the advantages of a cheap, wet chemical synthesis1, and a bandgap that may be tuned to match the solar spectrum. Of particular interest are so-called ‘Type
II’ systems (Figure 1), that have ‘core-shell’structure with a staggered band gap thatallows the electron and hole to be localizedin different regions. The result is a greaterdegree of control over the excitonicproperties, such as the recombinationlifetime. Crucial to the exploitation of theseQDs is control over the surface chemistry ofthe QD, as carriers may be trapped there. Itis also essential to establish that the required‘core-shell’ structure has been synthesized –and there are few techniques capable ofdoing this. Using beamline I511/1 at MAXII, we have used the tunability of the SR
radiation to carry out depth-profiling XPS of core-shell Type II ZnTe/ZnSe/ZnS andZnTe/ZnSe QDs, aimed at investigating the internal structure of the QDs.The synthesis of the ZnTe QD cores (of around 2.2 nm diameter) follows a modified hotinjection method using zinc oleate and tellurium trioctylphosphine (TOP) precursors2. TheZnSe shell structure (in this case, of 4 monolayers’ thickness) is added by the SILARprocedure (successive ionic layer adsorption and reaction)3 giving an overall diameter of 4.5nm. A further ZnS capping layer can be added to reduce oxygen sensitivity, and in this casethe resulting ZnTe/ZnSe/ZnS dots had a diameter of 5.0 nm. For photoemissionmeasurements, the initial oleic acid/TOP ligands were exchanged with the shorter butylamineto prevent sample charging. The butylamine-capped QD samples were deposited from hexanesolution onto conducting glass slides.
Figure 2 shows the Se 3d and Te 4d core level spectra obtained from a ZnTe/ZnSe/ZnSsample, as a function of photon energy sampling electron kinetic energies of approximately200 eV – 700 eV, and thus sampling depths of around 2.2 – 5.0 nm (assuming a sampling
D M Graham1, P Lunt1, K L Pogson1, S J O Hardman1, W R Flavell1, J M Smith2, S MFairclough2 and F Hennies3
1 The Photon Science Institute, the University of Manchester, Alan Turing Building, Oxford Road,Manchester M13 9PL, UK
2Department of Materials, University of Oxford, Parks Rd, Oxford, OX1 3PH, UK
3 Dept. of Synchrotron Radiation Research, Institute of Physics, Lund University, PO Box 118, S-221 00Lund, Sweden

MAX-lab ACTIVITY REPORT 2010 227
SYNCHROTRON RADIATION – BEAMLINE I511
Figure 3: Te 3d/Se 3d core level intensity ratios(normalised for photoelectron cross-section) forZnTe/ZnSe/ZnS and ZnTe/ZnSe Type II QDs asa function of photon energy.
Figure 2: Se 3d and Te 4d core level peaks for aZnTe/ZnSe/ZnS Type II QD as a function ofphoton energy. For convenience, the spectra arenormalised to a constant height at Se 3d.
depth of 3 , where is the inelastic mean freepathlength.) We thus expect the spectrumtaken at 255 eV photon energy to probe mainlythe ZnSe shell (of estimated thickness 1.1 nm),as confirmed by the low intensity of the Te 3dsignals.On increasing the sampling depth to around 5nm (similar to the dot diameter), the Te:Seelemental ratio increases markedly from 2.5 to4.7, providing unambiguous confirmation thatthe core of the dot is markedly more Te-richthan the shell (Figure 3). As the flux ofphotoelectrons is attenuated according to theBeer-Lambert law as it emerges from thesample, it is possible to use a simple ‘two-layer’ model to obtain an effective shell
thickness. This gives a value of 1.3 nm for the ZnSe shell thickness, in excellent agreementwith the shell thickness estimated from TEM, and provides strong evidence for production ofa ‘core-shell’ structure with little alloying ofthe phases within the dot. We also observethe presence of a second Se component at thesurface, to higher binding energy than theZnSe signal, that may be due to oxidation4,and some surface-localised P, due toincompletely-exchanged TOP ligands. For the‘core-shell-shell’ ZnTe/ZnSe/ZnS QDs, wefind that S is, as expected, localized at thesurface of the QDs, and a second Zn species ispresent, that may again be associated withsurface oxidation (to ZnSO4). Thisinformation about the surface and corecomposition of the QDs is important in deviceoptimization, and is not easy to extract byother means. This work is in preparation for publication.During this beamtime allocation, we were also able to obtain similar data from aged InP/ZnSQDs, previously studied in a pristine state during experiment 1511/1-129; this allows us tocomplete a paper on surface oxidation of these QDs. We also attempted studies if polymer-shelled QDs with catalyst grafts in connection with the use of these dots in artificialphotosynthesis, but we were unable to solve sample charging problems during the beamtime.
1 J Akhtar, M A Malik, P O’Brien, K G U Wijayantha, R Dharmadasa et al., J. Mater. Chem., 20, 2336 (2010); JAkhtar, M Afzaal, M Banski, A Podhorodecki, M Syperek et al., J. Am. Chem. Soc., in press (DOI:10.1021/ja200750s).2 J Zhang, K Sun, A Kumbhar and J Fang, J. Phys. Chem. C, 112,5454 (2008).3 J J Li, Y A Wang, W Guo, J C Keay, T D Mishima et al., J. Am. Chem. Soc., 125, 12567 (2003).4 M Sykora, A Y Koposov, J A McGuire, R K Schulze, O Tretiak et al., ACS Nano, 4, 2121 (2010).

228 MAX-lab ACTIVITY REPORT 2010
SYNCHROTRON RADIATION – BEAMLINE I511
Energy level alignment at organic semiconductor interfaces
by intramolecular degrees of freedom: transition metal phthalocyanines
M. Grobosch1, V. Yu. Aristov1,2, O. V. Molodtsova3, C. Schmidt1, B. P. Doyle4, S. Nannarone5, and M. Knupfer1
1IFW Dresden, D-01069 Dresden, Germany
2ISSP, Russian Academy of Sciences, Chernogolovka, 142432, Russia
3ISSP, TU Dresden, D-01069 Dresden, Germany
4University of Johannesburg, P.O. Box 524, Auckland Park, 2060, Republic of South Africa
5 TASC-INFM Laboratory, Area Science Park, Basovizza, I-34012 Trieste, Italy
Engineering of the energy level alignment at organic semiconductor interfaces is of tremendous importance for the performance of the corresponding devices. Means to control and adjust the energy levels at particular interfaces have been put forward, among them the introduction of additional interfacial layers, appropriate pretreatments of the metal contact surfaces, and doping of the organic semiconductor. These procedures in common increase the complexity of the device fabrication process which, among other aspects, is unfavorable in view of the anticipated low-cost of organic electronic devices. In this study, we demonstrate using photoemission spectroscopy (PES) studies that an intramolecular degree of freedom, the type of transition metal (TM: Mn, Fe, Co, Ni, Cu, Zn) in TM-phthalocyanines (TMPc’s), can be successfully used to adjust the energy level alignment at interfaces to Au without having to increase the number of fabrication steps of the contacts.
In our study we take advantage of the fact that the electronic properties of the TM-Pc’s near the energy gap is increasingly influenced by the metal 3d states of the central TM. While for the late TM-Pc’s (ZnPc, CuPc, NiPc) important properties such as the ionization energy or the character of the highest occupied molecular orbital (HOMO), which forms the valence band in an organic film or crystal, are exclusively determined by the ligand states, the metal 3d states come very close to the energy of the HOMO and the
Fig. 1. Valence-band photoemission data of MnPc deposited onto polycrystalline gold as a function of the MnPc film thickness. The data were taken with a photon energy of 21.2 eV.
Fig. 2. Evolution of the interface dipole , the ionization energy IP, and the hole injection barrier bh at TM-Pc/Au interfaces.

MAX-lab ACTIVITY REPORT 2010 229
SYNCHROTRON RADIATION – BEAMLINE I511
lowest unoccupied molecular orbital (LUMO) when going to CoPc, FePc, and MnPc, and there is also an increasing hybridization of the ligand and TM wave functions. A direct consequence of this variation is a decrease of the oxidation potential (ionization energy) as probed via electrochemistry, and the first oxidation states of MnPc and FePc for instance have been assigned to metal oxidation. One now can expect that such changes of the ionization energy are also reflected in the interfacial electronic properties of the materials when in contact to metals because of the equivalency of the TM-Pc’s in many other respects.In Fig. 1, we show the evolution of the valence band spectra of MnPc deposited on polycrystalline Au as a function of film thickness. Equivalent data have been measured for all TM-Pc’s discussed here. From these data one can derive important interface parameters shown in Fig. 2. The ionization energies and in particular the hole injection barriers as determined using PES vary significantly. While for ZnPc, CuPc, NiPc, and FePc this hole injection barrier is rather large and quite similar (0.8-1.1 eV), it is substantially reduced in the case of CoPc and MnPc (0.2-0.35 eV), i.e. via the choice of the transition metal, the energy level alignment can be adjusted. Our results suggest that it is much easier to inject holes into MnPc and CoPc as compared to the other TM-Pc’s.In the following, we demonstrate that the first ionization state of CoPc is indeed of almost pure Co 3d character and thus strongly localized in the center of the CoPc molecule, while the situation is different with respect to the photoemission for MnPc. Fig. 3 shows, that using potential energy surfaces (PESs) it is possible to discriminate between different orbital contributions to a molecular level due to the photoemission cross section variation of the orbital contributions as a function of the applied photon energy
Fig. 3 clearly shows the difference for the first ionization states of the three phthalocyanines. For CoPc the photoemission intensity from this state is negligible at a photon energy of 21.21 eV but reaches about 2/3 of that of the a1u ligand orbital at h = 110 eV. The situation is very different for MnPc, where the lowest ionization state is clearly visible for both photon energies, but grows with increasing photon energy. For FePc however, intensity changes are observed at the high binding energy side of the first emission feature in direct agreement to what has been published previously. Consequently, while for FePc the electronic states at lowest binding energy can be assigned to ligand a1u states, the situation is quite different for MnPc and CoPc.
Finally, our results demonstrate that the transition metal center has a strong influence on the electronic properties of the phthalocyanine films as well as their interfaces with gold. In particular, the energy level alignment, which has direct consequences for the contact resistance of these interfaces, can be chosen in a large energy range by the choice of the appropriate TM-Pc, and the interfaces CoPc/Au and MnPc/Au are characterized by rather small hole injection barriers. These are directly related to the presence of metal 3d states closest to the chemical potential; a fact that is also reflected in smaller ionization potentials for MnPc and CoPc as compared to other phthalocyanines. Further, we have discussed the nature of the molecular orbitals (metal 3d or ligandlike), that form the states closest to the chemical potential, and it results that they differ between MnPc and CoPc.
Fig. 3. Comparison of the valence band photoemission spectra of MnPc, FePc, and CoPc taken with photon energies of 21.2 and 110 eV (MnPc, CoPc) or 100 eV (FePc). The thickness of the TM-Pc films was about 70 Å.
Acknowledgements: This work was supported by the EC Transnational Access to Research Infrastructure via MaxLab, by the DFG under grant 436RUS17/52/06, by the SMWK, and by the RFBR under grant 10-02-00269. We are grateful to MaxLab staff and personally Franz Hennies and Annette Pietsch for help during the experiment.

230 MAX-lab ACTIVITY REPORT 2010
SYNCHROTRON RADIATION – BEAMLINE I511
XAS and RIXS measurements of aqueous micelle solutions of Dodecyl trimethyl ammonium chloride
Dodecyl trimethyl ammonium chloride/water mixtures can be seen as simple models of surfactant/lipid self-assemblies (micelles) [1-4] or proteins [5]. Identifying the factors controlling the formation and dissolution of such complexes and describing water confined in these systems are of fundamental importance for understanding biological processes such as DNA condensation in the chromosome and protein secretion. The state-of-the-art theory is that, in the absence of specific interactions, the complexes are stabilized by attractive electrostatic ion-ion correlation or polyion bridging forces [6]. However, there is very little experimental data showing how the degree of dissociation of polyacids and how polyions and small ions are distributed in the aqueous domains between the particles.
Our experiments were carried out at Beamline 511-3 with a flow cell described in [7]. XAS and RIXS spectra at the O K-edge were measured on dodecyltrimethyl ammonium chloride/water mixtures at rather high water content (70% water), where the system is forming micelle solution (Fig 1). These measurements were compared to the results of an earlier XAS and RIXS study [8] of water-poor dodecyltrimethyl ammonium chloride/water mixture (25% and 10% water respectively) where the system is forming liquid crystalline gels and where the water is more confined in the liquid crystalline lattice. In figure 1 spectra measured on the aqueous liquid crystalline system, micelle solution and pure water are shown. A distinct peak is seen around 532 eV was earlier noted on the liquid crystalline system and is still remaining in the micelle solution system. This reflects the interaction between the water molecules and the ions of the system. Further comparing the RIXS spectra excited at 537 eV, the emission peak at 526 eV is more or less identical to the pure water spectra while it in the liquid crystalline system is narrower and has by quantum chemical calculation been attributed to surrounding trimethyl ammonium groups and chlorine ions. Comparing these three systems the different surrounding of water molecules are reflected in the local electronic structure.
Johan Gråsjö1, Johan Forsberg2, Annette Pietzsch3, Jan-Erik Rubensson2 and Per Hansson1
1Department of Pharmacy, Uppsala University, Box 580, 751 23 Uppsala, Sweden 2Department of Physics and Astronomy, Uppsala University, Box 530, 751 23 Uppsala, Sweden 3MAX Lab, Box 188, 221 23 Lund, Sweden

MAX-lab ACTIVITY REPORT 2010 231
SYNCHROTRON RADIATION – BEAMLINE I511
References:1. Ion-Exchange Controls the Kinetics of Deswelling of Polyelectrolyte Microgels in Solutions of
Oppositely Charged Surfactant, P. Nilsson, P. Hansson, J. Phys. Chem. B 2005, 109, 23843-23856 2. Interaction between polyelectrolyte gels and surfactants of opposite charge, P. Hansson
Current Opinion in Colloid and Interface Science, 2006, 11, 351-362 (Review) 3. Phase separation in polyelectrolyte gels interacting with surfactants of opposite charge, P. Hansson, S.
Schneider, B. Lindman , J. Phys. Chem. B 2002, 106, 9777-9793 4. Electrostatic interaction between DNA and cationic surfactant aggregate. The screening effect of salt, C.
Leal, E. Moniri, L. Pedago, H. Wennerström, J. Phys. Chem B, 2007, 111, 5999 5. Interaction between lysozyme and poly(acrylic acid) microgels. C. Johansson, P. Hansson, M.
Malmsten, J. Colloid and Interface Sci. 2007, 316, 350-359 6. Polyelectrolyte mediated forces between macromolecules, J Forsman, Curr. Opin. Colloid Interface
Sci., 2006, 11, 290 7. J. Forsberg, L Duda, A. Olsson, T Schmidt, J.Andersson, J. Nordgren, J. Hedberg, C. Leygraf, T.
Aastrup, D Wallinder,and J-H Guo, Rev Sci Instrum, 2007 78, 083110 8. Electronic structure of water molecules confined in a micelle lattice, J. Gråsjö, E. Andersson, J.
Forsberg, E. F. Aziz, B. Brena, C. Johansson, J. Nordgren, L. Duda, J. Andersson, F.Hennies, J-E. Rubensson, and P. Hansson, J. Phys. Chem B, 2009, 113, 8201
Figure 3: Oxygen K edge spectra of C12TAC liquid crystalline gel (green) and solution (red). The FY spectra are shown in the upper right, and the excitation energies used for the SXE spectra are indicated. The spectra of bulk liquid water (blue) are shown for comparison.

232 MAX-lab ACTIVITY REPORT 2010
SYNCHROTRON RADIATION – BEAMLINE I511
Anatase TiO2 posesses a M3O strutural unit, where each oxygen is trigonally coordinated by three metal cations,similar to the rutile structure, but with different bond lengths and angles compared to the rutile TiO2 M3O unit. Thedifferences in the O 2p partial density of states in TiO2 , between anatase and rutile TiO2 related to these structuralchanges has been studied using O K-edge XAS and RXES at MAXlab beamline I511-3. Figure 1 includes a diagramof the anatase structure that highlights the M3O plane for both the anatase and rutile structure, indicating theincreased metal-metal distances in the anatase M3O unit. The spatial anisotropy of the charge density in rutile-typetransition metal dioxides gives rise to a natural linear dichroism in the absorption of radiation, and combining thisdichroism with the geometric selectivity of the dipole emission, essentially by switching the scattering plane uponrotation of the spectrometer axis with respect to the incident x-ray polarization, allows the polarization dependenceof the O K-edge RXES to be described for the rutile oxides for the first time. The approach to the bonding inrutile oxides that we adopt in the present study is based on the description by Sorantin and Schwarz [1].
Compared to rutile, anatase TiO2 has surfaces that are more photocatalytically active, with a higher surfaceenergy than the rutile TiO2 surfaces. In its pure and doped form it is the focus of research towards this end: bothphotocatalytic decomposition of molecules and photolytic production of hydrogen gas. For further discussion of theproperties of anatase TiO2 see Chen et al. [2]
In previous experiment at ALS beamline 7.0.1, which formed part of the current study, Ti L-edge and O K-edgeXAS and RIXS was measured from samples of nanostructured anatase TiO2, with a predominant surface area forthe (001) surface, which has been found to have the highest surface energy. Details of the nanostructured anataseTiO2 samples have published by our collaborators who produced them [3].
Fig. 1: O K-edge XAS from anatase TiO2 and the calcu-lated O 2p crystalline axes-projected PDOS in theconduction band showing the excitation energiesfor the experimental and simulated RXES.
We acquired a bulk single crystal of anatase TiO2
from SurfaceNet GmbH, the main surface of which wasalso (001) and performed a polarization dependent OK-edge XAS and RIXS study on it. The out-of-planemeasurements were obtained at MAXlab beamline I511-3 in March and April 2010.
The RXES spectra were compared to simulatedspectra based on the results of electronic structure cal-culations for anatase TiO2 carried out by Dr. CormacMcGuinness using the Wien2k formulation of densityfunctional theory. In general there was excellent agree-ment between the experimental and simulated spectrawith particular respect to the development of the k-selective features in the RXES spectra.
The octahedral crystal field experienced by the Tiion at the centre of the TiO6 octahedron lifts the de-generacy of its 3d orbitals with the eg levels higher inenergy than the t2g levels by an amount referred to atthe crystal field splitting.
The further distortion of the TiO6 octahedronpresent in anatase, where the oxygen anions are dis-placed such that they lie, consecutively, both above andbelow the equatorial plane in turn lifts the degeneracy
of the Ti 3d t2g orbitals. This distortion is visible at the centre of the unit cell depicted in the inset to figure 1.As mentioned previously, the experiments at MAXlab I511-3 were performed in the out-of-plane orientation
Polarization dependent RXES at the O K-edge of
anatase-TiO2
Brian Kennedy, Declan Cockburn, Cormac McGuinness
School of Physics, Trinity College Dublin, Dublin 2, Ireland

MAX-lab ACTIVITY REPORT 2010 233
SYNCHROTRON RADIATION – BEAMLINE I511
References
[1] P. I. Sorantin and K. Schwarz. Chemical bonding in rutile-type compounds. Inorg. Chem., 31(4):567–576–,1992.
[2] Xiaobo Chen and Samuel S. Mao. Titanium dioxide nanomaterials: Synthesis, properties, modifications, andapplications. Chemical Reviews, 107(7):2891–2959, JUL 2007.
[3] Hua Gui Yang, Cheng Hua Sun, Shi Zhang Qiao, Jin Zou, Gang Liu, Sean Campbell Smith, Hui Ming Cheng, andGao Qing Lu. Anatase tio2 single crystals with a large percentage of reactive facets. Nature, 453(7195):638–U4,MAY 29 2008.
of the analysis chamber with respect to the polarization of the synchrotron beam. The anatase TiO2 crystal wasmounted such that for a grazing angle of incidence in the out of plane geometry, the polarization of the excitingphotons were parallel to the one of the crystalline a axes. The axis of the emission spectrometer was parallelto the crystalline c axis, and sampled the emission from the O 2p PDOS projected in the plane defined by thetwo crystalline a axes. In this scattering geometry the states formed by non-bonding or metal-oxygen (M-O) π-bonding O 2py orbitals oriented perpendicular to the M3O planes are populated upon absorption, as well as theM-O σ-bonding states due to the O 2px and 2pz orbitals lying within the M3O planes.
The O K-edge XAS was carried out with an experimental monochromator resolution of 0.1 eV, while theresolution of the monochromator was set to a calculated value of 0.4 eV for the RXES spectra.
Figure 1 shows the results of the O K-edge XAS for E||a and E||c excitation geometries, alongside the projectionof the calculated O 2p conduction band PDOS along the same crystalline axes. The features in the conductionband associated with the selected RXES excitation energies labeled a-f are also shown in figure 1.
Fig. 2: Experimental and simulated OK-edge RXES fromanatase TiO2 for the excitation energies indicatedin figure 1.
Figure 2 presents the results of the both the in-planeand out-of-plane RXES, for both the experimental andsimulated spectra.
The comparison of the experimental and simulatedspectra (with the aid of the calculated band structurecharacter plots which are not shown here) allow the k-dependence of the RXES spectra to be observed quiteclearly, at least for the resonant energies a-d inclusive.
The simulated spectra for energies higher above res-onance do not reproduce the trends in the experimentalspectra as agreeably as those with excitation energiescloser to resonance. This may indicate that the cal-culated electronic structure preserves the k-dependencetoo far above the absorption threshold, compared to thek-states that are selected by the combination of exper-imental geometry and excitation bandwidth which thesimulated spectra approximate. A more accurate treat-ment of the valence hole broadening applied to the sim-ulated spectra, which is modeled in the present spectraas a linear dependence with valence hole binding en-ergy, may also produce a better agreement between theexperimental and simulated spectra.
One set of RXES spectra remain to be measuredfrom anatase TiO2 in the out-of-plane geometry atMAXlab I511-3. These are the spectra with an E||cexcitation geometry, and XES along a spectrometer-alignment. At this point a detailed comparison betweenthe rutile and anatase TiO2 polarization-dependent O
K-edge XAS and RXES will be complete, and the polarization-dependent study of the XAS and RXES at the TiL-edge will also be attempted. This, in turn, forms part of a systematic polarization-dependent soft x-ray spec-troscopic study of the electronic structure of rutile transition metal oxides and fluorides by the present authors,including SnO2, RuO2, WO2, IrO2, MnF2 and MgF2.

234 MAX-lab ACTIVITY REPORT 2010
SYNCHROTRON RADIATION – BEAMLINE I511
RIXS in Li6YB3O9 and Li6GdB3O9
I.Kuusik1, T. Käämbre1, A. Kikas1, V. Pustovarov2, V. Ivanov2 1Institute of Physics, University of Tartu, Tartu, Estonia
2Ural State Technical University-UPI, Yekaterinburg, Russian Federation
We report resonant X-ray inelastic scattering (RIXS) spectra of Li6YB3O9 (LYBO) and Li6GdB3O9 (LGBO). Borate crystals are widely used for non-linear optical, isolation, luminescence and phosphorescence
purposes. High efficiency of borate crystals as scintillation materials as well as in neutron detection has been demonstrated [1, 2].
Recently special attention has been given to complex alkali rare-earth borates, which have anion groups consisting of boron and oxygen. LYBO doped with rare earth ions is considered to be a promising laser medium [3]. LYBO crystals have a band gap of 7.04eV and are transparent in 176–900 nm region [4].
Experimentally the electronic structure of borates has been studied by X-ray photoelectron spectroscopy. However the standard methods based on electron emission (resonant and nonresonant photoemission and Auger spectroscopies) suffer due to the strong charging effects in the wide band gap crystals. In case of the insulating materials it is timely to apply a charge neutral spectroscopic probe. Resonant inelastic x-ray scattering is a photon-only technique performed at soft x-ray absorption resonances, making it atomic and orbital symmetry specific, bulk sensitive and thus complementary in many respects to electron spectroscopies.
The experiments were performed at the “bulk” branch of the beamline I511 (I511-3) of MAX-lab’s synchrotron MAX II, Sweden. The resolution of the beamline monochromator was set to better than 25 meV at the B 1s threshold absorption measurements. The X-ray spectrometer had 0.2 eV resolution at the B 1s edge. The absorption spectra were measured in TFY (total fluorescence yield) mode using an MCP detector with a repulsive field for electrons. The samples were monocrystals.
The absorption spectra of the crystals (top panels of Fig. 1.-2.) display strong sharp peaks at 193.55 and 193.7 eV. These peaks can be attributed to boron core exciton states.
The RIXS spectra excited in the vicinity of the B 1s core resonance (bottom panels of Fig. 1.-2.) show two principal features. The first feature is the emission in the energy region 174-187 eV and it is quite wide. The second feature - the elastic peak with the energy loss shoulder to its low energy side - occurs at about 193 eV.
There are two main radiative decay channels in the core exciton state of boron: the “participator” channel, where the electron that was excited by absorbing the X-ray photon decays back to the core level and the “spectator” emission channel where a valence electron fills the empty core orbital and the previous core electron remains in an excited state.
The first feature (approx. 174-187 eV) arises from the scattering on a valence excitation, which at higher excitation energies verges into the characteristic K emission. Until the excitation energy is in resonance with core exciton level, this emission band is the spectator emission.
210
210
205
205
200
200
195
195
190
190
Excitation energy (eV)
Li6YB3O9
192.8
193.0
193.2
193.55
193.75
194.0194.2
194.4
195.0
201.5203.5
200
200
196
196
192
192
188
188
184
184
180
180
176
176
172
172
Emission energy (eV)
192.8
193.0
193.2
193.55
193.6
193.75
194.0
194.2194.4
195.0201.5203.5
220.0
Fig. 1. XAS spectrum of Li6YB3O9 measured in TFY mode (top). RIXS spectra of Li6YB3O9 (bottom). The RIXS spectra have been normalized to equal spectator emission maxima and the top of the elastic emission peak has been cut to prevent the overlapping of the spectra.

MAX-lab ACTIVITY REPORT 2010 235
SYNCHROTRON RADIATION – BEAMLINE I511
References
[1] J. P. Chaminade, O. Viraphong, F. Guillen, C. Fouassier, and B. Czirr, IEEE Trans. Nucl. Sci. 48 (2001) 1158.
[2] J. B. Czirr, G. M. MacGillivray, R. R. MacGillivray, and P. J. Seddon, Nuclear Instruments and Methods in Physics Research A 424 (1999) 15.
[3] J. Sablayrolles, V. Jubera, F. Guillen, R. Decourt, M. Couzi, J. P. Chaminade, and A. Garcia, Opt. comm. 280 (2007) 103.
[4] R. P. Yavetskiy, A. V. Tolmachev, E. F. Dolzhenkova, and V. N. Baumer, Journal of Alloys and Compounds 429 (2007) 77.
[5] T. Käämbre, A. Kikas, K. Kooser, V. Kisand, M. Kirm, A. Saar, E. Nõmmiste, V. Ivanov, V. Pustovarov, and M. Martinson, J. Electron Spectrosc. Relat. Phenom. 156-158 (2007) 299.
[6] Y. Ma, P. Skytt, N. Wassdahl, P. Glans, D. C. Mancini, J. Gou, and J. Nordgren, Phys. Rev. Lett. 71 (1993) 3725.
[7] E. F. Dolzhenkova, V. N. Baumer, A. V. Tolmachev, and R. P. Yavetsky, Materials Research Bulletin 41 (2006) 530.
been normalized to equal spectator emission ma ima and the top of the elastic emission peak has been cut to prevent the overlapping of the spectra.
The emission around 193 eV arises from elastic scattering and also from inelastic scattering on the exciton state. The proposed origin of the energy loss shoulder to the elastic peak is lattice relaxation in the absorption site, similar to BeO [5]. This process was first observed by Ma et al. [6] in the emission spectra of graphite and diamond, while in the absorption spectrum only a relatively sharp core exciton peak was observed. The authors suggested that strong vibronic coupling leads to a local lattice distortion and to the corresponding shifts of the potential energy in the excited electron state.
The participator emission process is only possible when the core excited electron remains bound to the absorbing atom — in the case of the crystals considered here the participator process is possible when a core exciton is created. At higher excitation energies, when the excitation is no longer in resonance with the core exciton level, the energy loss shoulder disappears and only a elastic scattering peak is observed.
The participator emission band reappears when the excitation energy is increased further (hv > 203 eV) although its intensity then is much weaker. This is a second threshold phenomena, where a core exciton together with a valence band hole are created by an X-ray photon directly or indirectly.
The absorption spectra of LYBO and LGBO are quite similar. There is a difference at which energy the excitation of the core electron to the conduction band has the highest intensity – LYBO has a maximum at 203 eV, while LGBO has nearly constant intensity at 199-204 eV.
The RIXS spectra of both crystals are also similar. The low energy cut-off of the low energy tail to the elastic peak is at nearly constant photon energy - 190.5 eV in both crystals. In both cases the energy loss tail extends up to the elastic peak.
The similarity of the spectra can be explained because of the fact that the structures of the crystals and the local symmetries of boron sites are similar in both crystals [7].
References
210
210
205
205
200
200
195
195
190
190
Excitation energy (eV)
Li6GdB3O9
193.1
193.3
193.5
193.7
193.9
194.1
194.3
194.7199.2
201.5
203.0
200
200
196
196
192
192
188
188
184
184
180
180
176
176
172
172
Emission energy (eV)
193.1
193.3
193.5
193.7
193.9
194.1
194.3
194.7
199.2
201.5
203.0
220.0
Fig. 2. XAS spectrum of Li6GdB3O9 measured in TFY mode (top). RIXS spectra of Li6GdB3O9 (bottom). The RIXS spectra have been normalized to equal spectator emission maxima and the top of the elastic emission peak has been cut to prevent the overlapping of the spectra.

236 MAX-lab ACTIVITY REPORT 2010
SYNCHROTRON RADIATION – BEAMLINE I511
Passivation and stability of infrared photodetectors based on type-II GaAs quantum dots in InAs matrix
Xun Li,1 Qin Wang,1,a) Andy Z. Z. Zhang,1 Susanne Almqvist,1 Oscar Gustafsson,2 Shun Yu,2 Zahra Besharat,2 Mats Göthelid,2 Linda Höglund,1 Amir Karim,1 Bertrand Noharet,1 Andrey Gromov,1 Mattias Hammar,2 and Jan Y. Andersson1 1Department of Nanoelectronics, Acreo AB, Electrum 236, S-16440 Kista, Sweden, a)[email protected] 2School of Communication and Information Technology (ICT), Royal Institute of Technology (KTH), Electrum 229, S-16440 Kista, Sweden
Infrared (IR) photodetectors and focal plane arrays with operating temperatures above 77 K are highly requested since it allows simpler, more reliable and lower-cost cryogenic cooling systems. The longer-term goal is thermo-electric cooling or even operation at room-temperature which will enable very cost-effective and ultra-compact IR systems. IR detector systems presently under intense development are type-I InAs/GaAs quantum dot photodetectors (QDIP) and type II In(Ga)As/GaSb strain layer superlattices (SLS) photodetectors. They have both been demonstrated to be promising for operation at moderately high temperatures.1-4 However, there are still challenges in their realization that have hampered their development. For instance, it is difficult to obtain high response from QDIPs due to the limited quantum dot (QD) density and numbers of QD layers, while the antimony-based SLS photodetectors are very challenging from an epitaxial growth standpoint and also suffer from high surface leakage current in mesa-etched devices.
In this work, different passivation techniques of photodetectors based on GaAs quantum dots embedded in an InAs matrix have been investigated with the target on long wavelength IR (8-12 μm; LWIR) imaging.5 In such structure, a type-II band alignment is created between the highest valence band energy level in the GaAs QD and the conduction band edge of the surrounding InAs material. The operating wavelength can then be tuned by adding Al or Sb incorporation into the GaAs QDs.5 As compared to the extensively investigated type-I QDIPs, there has only been a few reports on type-II QDs for IR detection, for example in the InSb/InAsSb, InSb/InGaAs and Ge/Si systems.6-8 A key advantage of this device is that it enables a longer carrier lifetime due to the spatial separation of the different types of carriers, and possibly higher operating temperatures.5,6
However, the matrix material InAs is a narrow band gap semiconductor where the surface Fermi level is pinned in the conduction band due to large density of surface states, resulting in a high conductive n-type surface layer.9-11 In the present study, the dark current (that could be directly related to the surface leakage current) of the detectors treated by various surface passivations was evaluated using current-voltage (I-V) measurements at 77 K and room-temperature (RT), respectively. In particular, device stability was observed during eight months after the devices were passivated. X-ray photoelectron spectroscopy (XPS) was used to study the surface chemical composition before and after the passivation step.
The device structure consisted of five stacked undoped GaAs QD layers embedded in the InAs matrix grown on undoped (100) InAs substrates by metal-organic vapor phase epitaxy. The QD layers were separated by 50 nm InAs spacer. A 0.5 m InAs p-contact layer (2.5×1018 cm-3) was first grown on the substrate, followed by the growth of a 200 nm undoped InAs buffer layer. The nominal growth rate for GaAs QDs was 0.03 nm/s with V/III ratio of 10, while the InAs layers were grown at a growth rate of 0.37 nm/s under the V/III ratio of 150. The QD layers were finally terminated by a 300 nm n-doped (5×1017 cm-3) InAs contact layer.
The devices were fabricated using standard photolithography, inductively coupled plasma (ICP) etching, metal deposition, and lift-off procedures. The mesas were etched using ICP with Cl2/H2/CH4 plasma at powers of ICP=1 kW, RF=80 W followed by a citric acid-based wet etch to remove etching damage and residues.
As fabricated devices showed extremely high dark current, and rather behaved as typical conductors. Their I-V characteristics at 77 K show a typical Ohmic behavior. Furthermore, the I-V characteristics of the unpassivated devices were nearly size and temperature insensitive. It indicates that the surface leakage (shunt current) is dominating the high dark current, otherwise the dark current should be lower in smaller size devices.
In order to resolve the surface-leakage problem, different surface passivation treatments were carried out and investigated. Although the dark current of the devices improved slightly after these treatments, the expected pin diode characteristics were still not obtained. However, it was discovered that a simple annealing step at a temperature higher than 180°C for longer than 5 minutes in vacuum can reduce the dark current dramatically. To further optimize the thermal passivation approach, a series of heat treatments were explored as varying temperature from 180°C to 400°C. The results showed that the dark current decreases with about two orders of magnitudes when the annealing temperature increases from 180°C to 330°C.
To investigate the stability of the passivated devices, the I-V characteristic of several selected devices was measured at both RT and 77 K every second weeks for eight months. During the whole period, the devices were kept in atmospheric ambient conditions. Encouragingly, the I-V characteristic remained almost identical during the entire investigation period, indicating an excellent stability. The good device stability in atmospheric ambient condition is a somewhat surprising finding considering what is known about performance degradation induced by oxides for InAs and
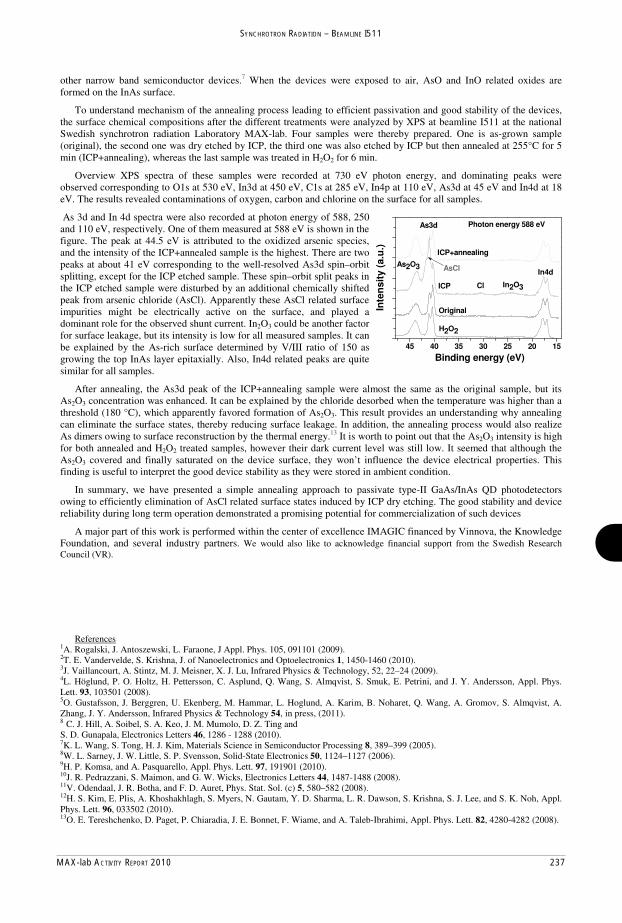
MAX-lab ACTIVITY REPORT 2010 237
SYNCHROTRON RADIATION – BEAMLINE I511
References 1A. Rogalski, J. Antoszewski, L. Faraone, J Appl. Phys. 105, 091101 (2009). 2T. E. Vandervelde, S. Krishna, J. of Nanoelectronics and Optoelectronics 1, 1450-1460 (2010). 3J. Vaillancourt, A. Stintz, M. J. Meisner, X. J. Lu, Infrared Physics & Technology, 52, 22–24 (2009). 4L. Höglund, P. O. Holtz, H. Pettersson, C. Asplund, Q. Wang, S. Almqvist, S. Smuk, E. Petrini, and J. Y. Andersson, Appl. Phys. Lett. 93, 103501 (2008). 5O. Gustafsson, J. Berggren, U. Ekenberg, M. Hammar, L. Hoglund, A. Karim, B. Noharet, Q. Wang, A. Gromov, S. Almqvist, A. Zhang, J. Y. Andersson, Infrared Physics & Technology 54, in press, (2011). 8 C. J. Hill, A. Soibel, S. A. Keo, J. M. Mumolo, D. Z. Ting and S. D. Gunapala, Electronics Letters 46, 1286 - 1288 (2010). 7K. L. Wang, S. Tong, H. J. Kim, Materials Science in Semiconductor Processing 8, 389–399 (2005). 8W. L. Sarney, J. W. Little, S. P. Svensson, Solid-State Electronics 50, 1124–1127 (2006). 9H. P. Komsa, and A. Pasquarello, Appl. Phys. Lett. 97, 191901 (2010). 10J. R. Pedrazzani, S. Maimon, and G. W. Wicks, Electronics Letters 44, 1487-1488 (2008). 11V. Odendaal, J. R. Botha, and F. D. Auret, Phys. Stat. Sol. (c) 5, 580–582 (2008). 12H. S. Kim, E. Plis, A. Khoshakhlagh, S. Myers, N. Gautam, Y. D. Sharma, L. R. Dawson, S. Krishna, S. J. Lee, and S. K. Noh, Appl. Phys. Lett. 96, 033502 (2010). 13O. E. Tereshchenko, D. Paget, P. Chiaradia, J. E. Bonnet, F. Wiame, and A. Taleb-Ibrahimi, Appl. Phys. Lett. 82, 4280-4282 (2008).
other narrow band semiconductor devices.7 When the devices were exposed to air, AsO and InO related oxides are formed on the InAs surface.
To understand mechanism of the annealing process leading to efficient passivation and good stability of the devices, the surface chemical compositions after the different treatments were analyzed by XPS at beamline I511 at the national Swedish synchrotron radiation Laboratory MAX-lab. Four samples were thereby prepared. One is as-grown sample (original), the second one was dry etched by ICP, the third one was also etched by ICP but then annealed at 255°C for 5 min (ICP+annealing), whereas the last sample was treated in H2O2 for 6 min.
Overview XPS spectra of these samples were recorded at 730 eV photon energy, and dominating peaks were observed corresponding to O1s at 530 eV, In3d at 450 eV, C1s at 285 eV, In4p at 110 eV, As3d at 45 eV and In4d at 18 eV. The results revealed contaminations of oxygen, carbon and chlorine on the surface for all samples.
As 3d and In 4d spectra were also recorded at photon energy of 588, 250 and 110 eV, respectively. One of them measured at 588 eV is shown in the figure. The peak at 44.5 eV is attributed to the oxidized arsenic species, and the intensity of the ICP+annealed sample is the highest. There are two peaks at about 41 eV corresponding to the well-resolved As3d spin–orbit splitting, except for the ICP etched sample. These spin–orbit split peaks in the ICP etched sample were disturbed by an additional chemically shifted peak from arsenic chloride (AsCl). Apparently these AsCl related surface impurities might be electrically active on the surface, and played a dominant role for the observed shunt current. In2O3 could be another factor for surface leakage, but its intensity is low for all measured samples. It can be explained by the As-rich surface determined by V/III ratio of 150 as growing the top InAs layer epitaxially. Also, In4d related peaks are quite similar for all samples.
After annealing, the As3d peak of the ICP+annealing sample were almost the same as the original sample, but its As2O3 concentration was enhanced. It can be explained by the chloride desorbed when the temperature was higher than a threshold (180 °C), which apparently favored formation of As2O3. This result provides an understanding why annealing can eliminate the surface states, thereby reducing surface leakage. In addition, the annealing process would also realize As dimers owing to surface reconstruction by the thermal energy.13 It is worth to point out that the As2O3 intensity is high for both annealed and H2O2 treated samples, however their dark current level was still low. It seemed that although the As2O3 covered and finally saturated on the device surface, they won’t influence the device electrical properties. This finding is useful to interpret the good device stability as they were stored in ambient condition.
In summary, we have presented a simple annealing approach to passivate type-II GaAs/InAs QD photodetectors owing to efficiently elimination of AsCl related surface states induced by ICP dry etching. The good stability and device reliability during long term operation demonstrated a promising potential for commercialization of such devices
A major part of this work is performed within the center of excellence IMAGIC financed by Vinnova, the Knowledge Foundation, and several industry partners. We would also like to acknowledge financial support from the Swedish Research Council (VR).
45 40 35 30 25 20 15
Inte
nsi
ty (
a.u
.)
H2O2
Original
ICP
ICP+annealing
In4d
In2O3Cl
As3d
AsCl
Photon energy 588 eV
As2O3
Binding energy (eV)

238 MAX-lab ACTIVITY REPORT 2010
SYNCHROTRON RADIATION – BEAMLINE I511
Hybrid systems comprising Au nanoparticles in organic matrix
O.V. Molodtsova1, I.M. Aristova2, M.Knupfer3, V.V. Kveder2, C. Laubschat1, and V.Yu. Aristov2,3
1ISSP, TU Dresden, D-01069 Dresden, Germany
2ISSP, Russian Academy of Sciences, Chernogolovka, 142432, Russia 3IFW Dresden, Postfach 270116, D-01171 Dresden, Germany
There are enormous worldwide efforts to develop new memory devices, which would bring together the best characteristics of today’s principal technologies: dynamic random access memory, flash memory and hard-disk drives and would get over the disadvantages of those. Such a “storage class memory” would revolutionize the information technology industry as outlined in [1, 2]. A number of physical effects have been proposed to serve as a basis for new memory elements of future technologies. New devices based on switchable resistive materials are commonly ranked as resistive random-access memory (RRAM). One type of RRAM are hybrid organic–inorganic systems, mainly consisting of nanoparticles (NP) blended into an organic matrix.
Fig. 1 shows possible memory architecture is obtained if the organic thin film containing metal nanoparticls is sandwiched between a cross-point array of electrodes – that consist of narrow metal stripes, running in perpendicular directions above and below the film. The resistivity at “crosspoints” can be switched either a high- or low-conductivity state by applying a voltage, suitable to write or erase. The resistivity in the high- and low conductivity states can differ by 6-8 orders of
magnitude. The corresponding state can then be probed by measuring the current across the crosspoints at some lower voltages. New devices based on switchable resistive materials are commonly ranked as RRAM. One type of RRAM are hybrid organic–inorganic systems, mainly consisting of inorganic nanoparticles (NP) blended into an organic matrix.
Fig. 2. Electron micrograph of nano-composite thin-film composed of gold particles embedded in molecular large gap crystal CuPc for nominal Au deposition of 4 Å (left panel). Electron diffraction patterns for corresponding depositions are presented as insets. Histogram showing size distribution of gold nanoparticles from electron micrograph (right panel).
1 2 3 4 5 6 705
101520253035
Perc
enta
ge fr
eque
ncy
Equivalent circle diameter, nm
Substrate
Top electrodes Bottom electrodes
Organic matrix with embedded NP
Substrate
Top electrodes Bottom electrodes
Organic matrix with embedded NP
Fig. 1. Crosspoint memory architecture.

MAX-lab ACTIVITY REPORT 2010 239
SYNCHROTRON RADIATION – BEAMLINE I511
Acknowledgements: This work was supported by the DFG under grant KN393/14, and by the RFBR under grant 10-02-00269.
References: [1 ] Z. Liu, A.A. Yasseri, J.S. Lindsey, D.F. Bocian, Science 302, 1543 (2003). [2 ] J.C. Scott, Science 304, 62 (2004); J.C. Scott and L.D. Bozano, Adv. Mater. 19, 1452 (2007).
The embedded nanoparticles were self-assembled from gold atoms deposited on the outer surface of the organic film due to surface and bulk diffusion, resulting in a three-dimensional nanoparticle distribution in the bulk of the organic semiconductor. The evolution of microstructure, i.e. the size, concentration, bulk- and size-distribution of the resulting nanoparticles as a function of nominal metal content was studied using transmission electron microscopy (TEM) with a JEOL JEM 100 CX operated at 100 kV, while the evolution of electronic structure of the hybrid organic-inorganic system was studied by surface- and bulk sensitive spectroscopic methods. It was found that at a nominal coverage of 4 Å gold the averaged diameter of the particles amounts to <d> = 3 nm with a standard deviation of 0.7 nm (see Fig. 2). This nanoparticle size distribution (psd) corresponds to an average cluster nuclearity of about 950. It is amazing that for nominal Au deposition of 4 Å the diameter distribution of the gold NP's in the CuPc film is very narrow. For nominal coverage of 16 Å gold the averaged diameter of the particles amounts to <d> = 6.3 nm and for 32 Å the averaged diameter amounts to <d> = 9.8 nm. We also provide evidence that the Au particles do not agglomerate near the surface but their diffusion through the entire CuPc film occurs.
The results presented in Fig. 3 mean, that the Au concentration in the bulk is higher than in the subsurface region as a result of strong diffusion processes of individual Au atoms or whole clusters within the organic matrix. In order to verify that the gold atoms/clusters diffuse deep inside the organic matrix we also compared valence-band spectra taken at different photon energies (Fig.4). The more bulk sensitive VB spectrum (h =1100 eV) is practically characteristic of a Au bulk sample, which means that in this wider thickness region of our hybrid organic- inorganic system, the gold is assembled in large nanoparticles, which show metallic properties, including the formation of a distinct Fermi-level step and probably demonstrate some percolation. Finally, we should emphasize that there is no formation of a continuous metallic film on top of organics up to large nominal coverage of about 130 Å considered in the present study. The gold is assembled in well defined NP’s with metallic properties.
110 115 120 310 315 320 325
Au 4fC 1s
h = 400 eV
Au = 4Å
Nor
mal
ized
Inte
nsity
Kinetic energy (eV)
-e h-e h
Fig. 3. C 1s and Au 4f core-level spectra, measured for two different emission angles from CuPc film after nominal gold coverage of about 4 Å. All spectra were normalized
Fig. 4. The VB spectra acquired using soft x-ray h =110eV (black line) and hard x-ray h =1100 eV (grey line) photon energies on the Au/CuPc system for nominal gold coverage of about 64 Å.

240 MAX-lab ACTIVITY REPORT 2010
SYNCHROTRON RADIATION – BEAMLINE I511
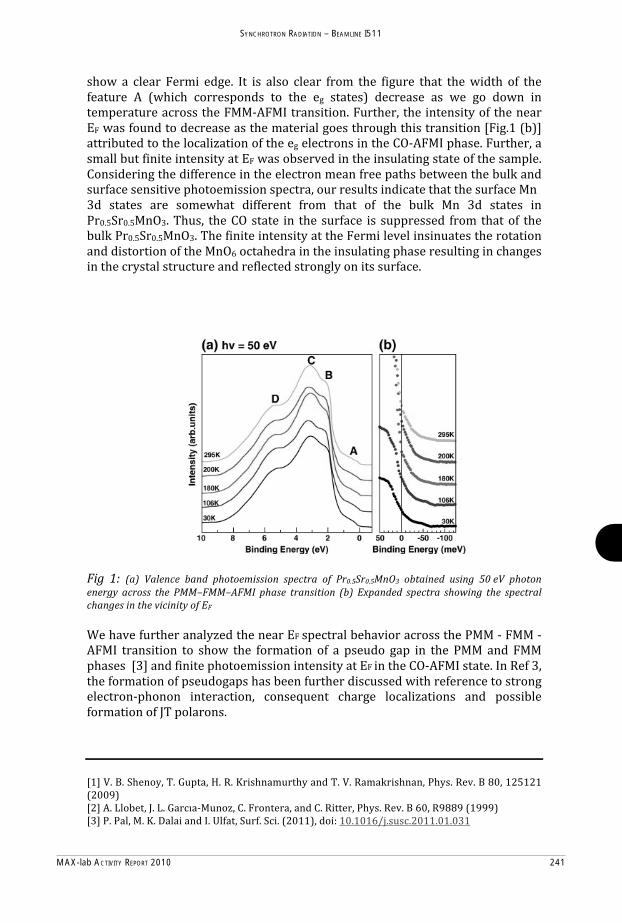
MAX-lab ACTIVITY REPORT 2010 241
SYNCHROTRON RADIATION – BEAMLINE I511

242 MAX-lab ACTIVITY REPORT 2010
SYNCHROTRON RADIATION – BEAMLINE I511
Figure 1: Schematic structure of swelling clay [2]
Investigating the local partial density of states in swelling
clay in dry and humid environments
A. Pietzsch1, B. Kennedy1, J.-E. Rubensson2, F. Hennies1,2
1MAX-lab, Lunds Universitet, Lund, Sweden2Department of Physics and Astronomy, Uppsala University, Box 516, 75120 Uppsala, Sweden
Clay is an interesting material in many fields such as geosciences, pharmacy, andbiology. Swelling clay consists of sandwiched SiO2/Al2O3 sheets carrying a net negativelayer charge which in turn are electrostatically bound by cations, see Fig. 1. When theclay is soaked in water, the water molecules enter between these sheets, the layers separateand the material swells. Due to this, large amounts of water can be stored in the clay.
The valency and the hydration properties of the cations between the sheets controlboth swelling and colloidal behavior of the clay [1]. Interaction between the water andthe interlayer is affected by changes in the ion concentration in the water and by changesin the mineral structure of the clay. Thus, the behavior of the clay material in water willalso yield information about the interaction of water with metal oxide interfaces.
Near edge x-ray absorption fine structure (NEXAFS)measurements in photon-in/photon-out mode and Resonant inelastic soft x-ray scattering (RIXS) have unique features whichmake them an ideal tool for the investigation of complex samples as they yield infor-mation about the local electronic structure at specific atomic sites and thus reflect thelocal chemical environment of the probed atom. Additionally, they can be applied for theinvestigation of matter in humid environments since the large penetration depth of softx-ray photons of this photon-in/photon-out technique allows insitu investigation of theproperties of gases, liquids and suspensions enclosed behind ultrathin windows.
The experiments were performed at the beamline I511-3 at MAX-lab in Lund, Swedenusing a button cell with a 100 nm thin Si3N4 membrane window. Both the incidence andemission angle were 45 deg.
NEXAFS and RIXS spectra of natural swelling clay are shown in Fig. 2 together witha reference spectrum of clean de-ionized water. The clay has been measured as dry sampleas well as soaked in de-ionized water. In the NEXAFS spectrum, the low energy shoulder

MAX-lab ACTIVITY REPORT 2010 243
SYNCHROTRON RADIATION – BEAMLINE I511
Inte
nsity
(arb
. uni
ts)
520
Photon energy (eV)
soaked in water anhydrous excitation water
O 1s NEXAFS on swelling clay
545540535530525
Inte
nsit
y (a
rb. u
nits
)
-40 -30 -20 -10 0Energy loss (eV)
O1s RIXSsoaked and dryswelling clay
hν = 548.00 eV
hν = 536.90 eV
hν = 534.60 eV
hν = 531.75 eV
hν = 531.00 eV
dark lines: dry samplelight lines: soaked sample
Figure 2: NEXAFS (left) and RIXS (right) measurements on dry and humid naturalswelling clay show clear differences originating from changes in the electronic structure ofthe oxygen atoms due to gelation of the clay.
around 531 eV is characteristic for clay materials and is associated with quasi-free O2
molecules in amorphous alumina and silicate [3].In the dry sample, the oxygen signal originates from OH inside the layers. The pre-peak
at 525.25 eV is assigned to an amorphous defect which is temporally healed by interactionwith water. In the soaked sample, an additional signal from water stored in the clay isobserved at 534.6 eV which corresponds with the OH bond signal from the water referencespectrum.
We acknowledge support from the MAX-lab staff.
References
[1] Bihannic et al., Langmuir 17, 4144 (2001).
[2] J.-E. Rubensson et al., Mater. Res. Soc. Symp. Proc. Vol., 1124, Q05-03 (2009).
[3] C. Arhammar et al., PNAS, in press (2011).

244 MAX-lab ACTIVITY REPORT 2010
SYNCHROTRON RADIATION – BEAMLINE I511

MAX-lab ACTIVITY REPORT 2010 245
SYNCHROTRON RADIATION – BEAMLINE I511

246 MAX-lab ACTIVITY REPORT 2010
SYNCHROTRON RADIATION – BEAMLINE I511
Interaction of Zinc Phthalocyanine thin films with TiO2(110)
Shun Yu1, Sareh Ahmadi1, Pooya T. Z. Adibi1, Winnie Chow1, Annette Pietzsch2, Mats Göthelid1
1 Materials Physics, ICT, Royal Institute of Technology, Electrum 229, SE-16440 Stockholm, Sweden 2 Max-lab, Lund University, Box 118, SE- 22100 Lund, Sweden
The development of novel phthalocyanine (Pc) based organic devices demands a better understanding on the interaction between molecules and other components, like electrode and buffer layer, etc, in order to improve the performance. Previously, tremendous work has been devoted into the characterization of Pc/metal interface. However, as the functionality of oxide becomes more and more intriguing, the study on Pc/oxide system is of great necessity.
In this work, we investigate the adsorption of zinc phthalocyanine (ZnPc) on top of rutile TiO2(110). The molecule usually behaves like non-transition metal-phthalocyanine but with a
filled d-orbital center atom. TiO2 is one of the most well characterized oxide materials with wide applications in catalysis, solar cell and electronic devices. In figure 1 both C1s and N1s spectra are present as the coverage of ZnPc increase on top of TiO2. The thick film spectra display the typical Pc line profile: C1s consists of three peaks which are assigned to Benzene carbon (B, 284.4 eV), pyrrole carbon (P) with B related shake-up structure (286.0 eV) and P
related shake-up structure (287.8 eV); N1s shows a single dominant peak at 389.8 eV and shake-up around 400.6 eV. However, in the monolayer region, the spectra display a completely different structure. At low coverage, the dominant peak of C1s is located around 285.3 eV with a shoulder on the lower binding energy side at 284.5 eV and another broad feature around 287.5 eV. As the coverage increases, the shoulder eventually develops into a distinct peak which is assigned to the thick film related feature, while the dominant feature becomes smeared, which should come from the interface layer. For N1s, double peaks are recorded at low coverage, a stronger peak at 400.7 eV and a weak one at 398.8 eV. The coverage dependent development is similar as C1s: the weak feature gradually evolves into the thick film peak, while the peak at 400.7 eV vanishes. The different peak shifts of core level spectra, 0.8 eV for C1s and 1.9 eV for N1s, on one hand indicates that probable different the electronic densities are distributed around benzene carbons and nitrogen atoms (mainly the pyrrole part) after adsorption. On the other hands, it might also indicate a possible
Figure 1 C1s (left) and N1s (right) of ZnPc on TiO2(110)

MAX-lab ACTIVITY REPORT 2010 247
SYNCHROTRON RADIATION – BEAMLINE I511
1 P. Palmgren, K. Nilson, S. Yu, F. Hennies, T. Angot, C.I. Nlebedim, J.-M. Layet, G. LeLay, and M. Gothelid, Journal Of Physical Chemistry C 112, 5972-5977 (2008).
molecular plane bending with the carbon towards the surface while nitrogen part further out. Subsequently, the nitrogen atom will have less efficient screening from the substrate than the carbon counterparts.
The observation of core level change can be well supported by the counterparts of highest occupied molecular orbital (HOMO) in Figure 2. The HOMO structure cannot be clearly observed until the coverage reaches 1.9 ML. The shoulder at the higher binding side of the defects states of TiO2 gradually develops into the HOMO peak. This fact suggests that the HOMO electron is depleted from the interfacial ZnPc into the substrate. Similar discovery has been found on FePc/TiO2 system1. This also explains that the big shift of core level is most likely due to the molecular oxidation.
NEXAFS spectra at nitrogen K-edge are shown in Figure 3. Two types of polarizations have been used to probe the empty orbital of molecule and help to determine the molecular configuration. Clearly, it requires more photon energy to excite the
N1s electron of ZnPc in the interfacial layer into the lowest unoccupied molecular orbital (LUMO) since N1s orbital has been pulled to higher binding energy due to oxidation. Meanwhile, the transition from N1s to LUMO+1 is barely seen at low coverage, which might indicate that the molecular symmetry has been broken in this case. As the coverage increases, p polarization can resolve more contributions from the ZnPc adlayer, where the N1s LUMO transition needs 0.7 eV less photon energy. However, almost no such resonance can be observed at s polarization be 2 ML,
indicating that the second layer adopts a very flat geometry.
To summarize, we have characterized the initial steps of the adsorption of ZnPc on TiO2. A strong charge transfer was found from the first layer molecule to the substrate. The changes in NEXAFS also support this observation and point to a possible molecule symmetry change.
Figure 3 NEXAFS at N K-edge of ZnPc on TiO2 under p polarization (left) and s polarization (right)
Figure 2 HOMO structure of ZnPc on TiO2

248 MAX-lab ACTIVITY REPORT 2010
SYNCHROTRON RADIATION – BEAMLINE I511
New Endstation at Beamline I511Olesia Snezhkova, Franz Hennies, Joachim Schnadt, Niclas Johansson, Jan Knudsen, and Annette Pietzsch are all part of the team behind the new HP-XPS Endstation at the beamline I511, 5 October 2010. Photos: Annika Nyberg

MAX-lab ACTIVITY REPORT 2010 249
SYNCHROTRON RADIATION – BEAMLINE I511

250 MAX-lab ACTIVITY REPORT 2010
SYNCHROTRON RADIATION – BEAMLINE D611
Time resolved X-ray diffraction from semiconductor nanostructures
A. Jurgilaitis1, M.Harb1, H. Enquist2, R. Nüske1, G. Astromskas3, M. Borg3, H. Linke3
and J. Larsson1
1Atomic Physics Division, Department of Physics, Lund University, P.O. Box 118, SE-221 00 Lund, Sweden
2MAX-lab, P.O. Box 118, SE-221 00 Lund, Sweden
3Division of Solid State Physics/The Nanometer Structure Consortium at Lund University (nmC@LU), P.O. Box 118, S-221 00 Lund, Sweden
We have investigated propagation of laser induced strain and heat in InSb nanowires
grown on an InAs substrate. The strain was measured with time-resolved X-ray
diffraction. The scattering from the excited sample was measured using a streak
camera. The observed oscillatory reflectivity pattern was attributed to coherent
acoustic phonons in the InSb nanowires.
The experiment was carried out at beam line D611. It has a double-crystal InSb
monochromator with a bandwidth of ΔE/E = 4·10-4, which operates in the spectral
range between 1.8 and 8 keV. A 400
× 200 m2 X-ray focal spot size can
be obtained with 7 × 0.7 mrad2
divergence (horizontal × vertical).
The Bragg angle for the experiment
was chosen to be 59 deg ((111)
crystal planes for InSb nanowires,
were parallel to the surface of the
substrate), while the laser excitation
was normal The geometry is
illustrated in Fig.1. At this geometry
the X-ray reflectivity from the
sample was optimized for the
experiment. The whole volume of the nanowires is probed. Short laser pulses were
generated by a passively mode-locked, titanium-doped sapphire oscillator followed by
a cryogenically cooled Ti:Al2O3 multipass laser amplifier. The amplifier was operated
at 4.25 kHz and an average power of 2.5 W. The wavelength was 800 nm. The laser
system was synchronized to a single electron bunch in the MAX II storage ring with a

MAX-lab ACTIVITY REPORT 2010 251
SYNCHROTRON RADIATION – BEAMLINE D611
jitter of less than 50ps.. The diffracted signal from the sample was sent to a streak
camera, equipped with a CsI photocathode and triggered by the laser via a GaAs
photoconductive switch. The investigated InSb nanowires had a length of 1.7 m and
a width of 80 nm. These nanowires were grown by MOVPE using trimethylindium,
trimethylantimony and arsine precursors on an InAs (111) substrate prepared with Au
nanoparticles. The density of the grown nanowires on the surface was 5 nanowires per
m2.
Fig.2 Coherent acoustic phonons in InSb nanowires. The solid line is a guide to the
eye.
The frequency of the coherent acoustic phonons as function of detuning from the ideal
Bragg condition can produce part of the dispersion curve for the acoustic branch and
enable determination of the sound speed of materials [1,2]. Mingo et. al [3] calculated
lattice thermal conductivity in various materials and found a reduction in speed of
sound, that is following the diameter of the wire. The observed frequency of 17 GHz
for 5 eV detuning supports the fact that the velocity of the longitudinal acoustic mode
is different from that of the bulk material.
1. A. M. Lindenberg et al. Physical Review Letters 84, 111 (2000)
2. J. Larsson et al. Applied Physics A, 75, 467 (2002)
3. N. Mingo and D. A. Broido, Physical Review Letters 93, 246106 (2004)
252 MAX-lab ACTIVITY REPORT 2010
SYNCHROTRON RADIATION – BEAMLINE D611
Formation of nanoscale diamond by femtosecond laser-driven shock
R. Nüske1, A. Jurgilaitis1, H. Enquist2, Maher Harb1, Yurui Fang3, Ulf Håkanson2, J. Larsson1. 1Atomic Physics Division, Department of Physics, Lund University, P.O. Box 118, SE-221 00 Lund, Sweden
2MAX-lab, P.O. Box 118, SE-221 00 Lund, Sweden
3Division of Solid State Physics/The Nanometer Structure Consortium at Lund University (nmC@LU), P.O. Box 118, S-221 00 Lund, Sweden
Formation of cubic diamond from graphite following irradiation by a single, intense, ultra-short laser pulse
has been studied. Highly oriented pyrolithic graphite (HOPG) samples were irradiated by 100 fs pulses at a
wavelength of 800 nm. Following laser exposure the highly oriented pyrolythic graphite samples have been
studied using Raman spectroscopy of the sample surface. In the laser-irradiated areas nanoscale cubic
diamond crystals have been formed. We have studied the exposed areas using grazing incidence powder
diffraction at beamline D611. We observed a restacking of planes from hexagonal graphite to rhombohedral
graphite. The intensity of the rhombohedral graphite powder peaks get more pronounced as the fluence is
increased due to restacking at larger depths.
An HOPG sample (12× mm * 12× mm * 2 mm, ZYA grade with mosaic spread of 0.4° was used in this
study. It was irradiated by a single laser pulse. The laser was a titanium-sapphire laser with wavelength
centered around 800 nm. The duration of the laser pulses were 100 fs. The laser radiation was focused to a
peak intensity of up to 2.1×*1015 W/cm2. The fluence range 80-210 J/cm2 was investigated. To increase the
effective spot size for the x-ray measurements, an array of non-overlapping spots were irradiated by a single
pulse each. After laser irradiation, the crystal structure was analyzed using grazing incidence x-ray powder
diffraction performed at beamline D611 at the MAX-laboratory synchrotron radiation facility in Lund. The
X-ray spot size on the sample was 0.2*2.5 mm2 at the incidence angle of 0.8° used in the experiment. This
footprint is comparable to the spatial extent of the array of single laser pulse irradiated spots which has a size
of 0.15*3.0 mm2. Each individual laser spot size was 0.15*0.15 mm2. The separation between the laser spots
was 0.25 mm. The laser spot-size was measured by a knife-edge scan whereas the X-ray spot was measured
using a phosphor and a CCD camera. The photon energy of the X-rays was 9 keV and the bandwidth
E/E=0.1%. Scattered X-rays incident on a phosphor screen were imaged onto a CCD camera. The images
were recorded and analyzed in order to produce the powder patterns. The set-up was calibrated with silicon
powder. The set-up allowed for coverage of a q-range from (2.9-4.4 Å-1) with a q-resolution of (0.02 Å-1).
The result can be seen in figure 1 where we show powder diffraction data from laser-exposed areas as well as
from areas with pristine HOPG. As can be seen, all peaks can be identified as reflections from either
hexagonal or rhombohedral graphite. The rhombohedral modification of graphite can be found only after the
laser irradiation. The structure of rhombohedral graphite (ABCABC) can be understood as an extended
stacking fault of the hexagonal configuration (ABAB), and is known to be generated when hexagonal
graphite is deformed
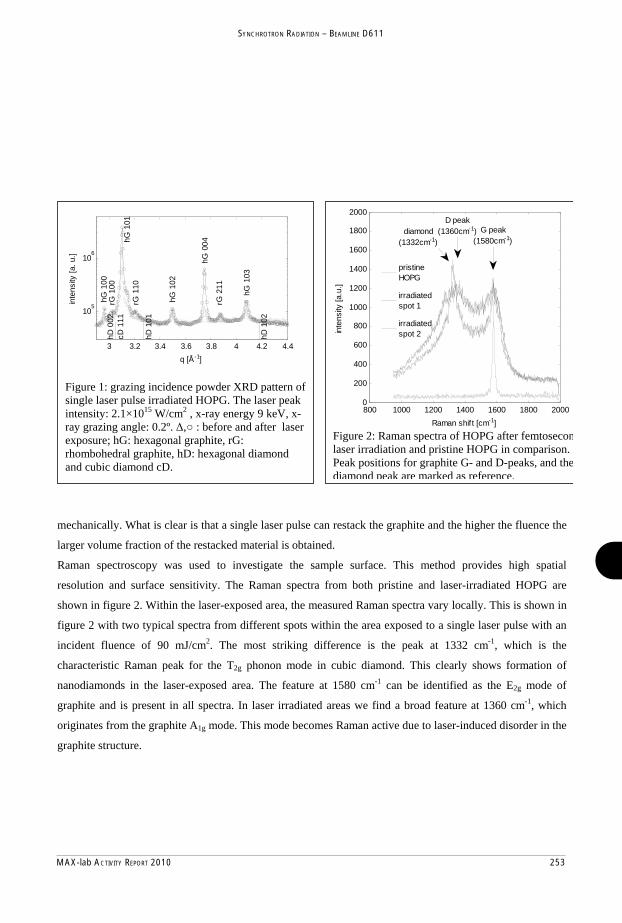
MAX-lab ACTIVITY REPORT 2010 253
SYNCHROTRON RADIATION – BEAMLINE D611
3 3.2 3.4 3.6 3.8 4 4.2 4.4
105
106
q [Å-1]
inte
nsity
[a. u
.]
hG 1
00rG
100
hG 1
01rG
110
hG 1
02
hG 0
04
rG 2
11
hG 1
03
hD 0
02cD
111
hD 1
01
hD 1
02
Figure 1: grazing incidence powder XRD pattern of single laser pulse irradiated HOPG. The laser peak intensity: 2.1×10¹⁵ W/cm2 , x-ray energy 9 keV, x-ray grazing angle: 0.2º. , : before and after laser exposure; hG: hexagonal graphite, rG: rhombohedral graphite, hD: hexagonal diamond and cubic diamond cD.
800 1000 1200 1400 1600 1800 20000
200
400
600
800
1000
1200
1400
1600
1800
2000
Raman shift [cm-1]
inte
nsity
[a.u
.]
pristineHOPG
irradiatedspot 1
irradiatedspot 2
G peak(1580cm-1)
D peak(1360cm-1)diamond
(1332cm-1)
Figure 2: Raman spectra of HOPG after femtoseconlaser irradiation and pristine HOPG in comparison. Peak positions for graphite G- and D-peaks, and thediamond peak are marked as reference.
mechanically. What is clear is that a single laser pulse can restack the graphite and the higher the fluence the
larger volume fraction of the restacked material is obtained.
Raman spectroscopy was used to investigate the sample surface. This method provides high spatial
resolution and surface sensitivity. The Raman spectra from both pristine and laser-irradiated HOPG are
shown in figure 2. Within the laser-exposed area, the measured Raman spectra vary locally. This is shown in
figure 2 with two typical spectra from different spots within the area exposed to a single laser pulse with an
incident fluence of 90 mJ/cm2. The most striking difference is the peak at 1332 cm-1, which is the
characteristic Raman peak for the T2g phonon mode in cubic diamond. This clearly shows formation of
nanodiamonds in the laser-exposed area. The feature at 1580 cm-1 can be identified as the E2g mode of
graphite and is present in all spectra. In laser irradiated areas we find a broad feature at 1360 cm-1, which
originates from the graphite A1g mode. This mode becomes Raman active due to laser-induced disorder in the
graphite structure.

254 MAX-lab ACTIVITY REPORT 2010
SYNCHROTRON RADIATION – BEAMLINE I711
Nanostructural features of lipid-based liquid crystal drug delivery systems
Justas Barauskas1, Marija Jankunec1, Daiva Taurait 1, Laura Adamonyt 1, Markus Johnsson2, Fredrik Tiberg2
1 Institute of Biochemistry, Mokslinink 12, LT-08662 Vilnius, Lithuania
2 Camurus AB, Sölvegatan 41, Ideon Science Park Gamma 1, SE-22370 Lund, Sweden
Depending on various molecular and ambient conditions lipids can form a variety of
different liquid crystalline (LC) phases, where the lamellar phase is simplest and the most common in lipid systems. In contrast, nanostructural architecture of reversed non-lamellar phases (like hexagonal and cubic) is much more complex possessing fascinating two- and three-dimensional periodicity. Due to their unique key property to exist in excess water, non-lamellar reversed LC have recently gained an increasing interest in medical uses, e.g. in the delivery of active substances. In this respect, nanoporous lipid LCs have very large interfacial inner area and serve as a matrix for the incorporation (loading), protection and controlled release of drug molecules.
The nanostructural changes as a function of lipid composition of two novel drug delivery systems, SPC/GDO and SPC/VitE in both water and saline solutions have been investigated. The results have shown that a common feature of both lipid systems is that they form non-lamellar liquid crystals over a broad compositional range which exist in excess water solutions. Both systems form reversed hexagonal and reversed micellar cubic LCs at high and low SPC content range, respectively. NaCl and temperature on the phase behavior in excess water conditions have been investigated. From the obtained results it may be concluded that 0.9% of NaCl strongly affects the phase transition boundary between hexagonal and cubic phases. Thus, with NaCl the phase transition boundary for both lipid systems is shifted towards lower SPC content by almost 10 wt% (in respect to SPC/oily lipid ratio). Temperature effects on the phase behavior and the LCs nanostructure have been studied in the physiologically relevant interval (25 – 42 ºC). It may be concluded that increased temperature have practically no effect on the reversed hexagonal LCs. Contrary, in both lipid systems reversed micellar cubic LCs are rather unstable and transforms into reversed micellar solution at 37 ºC. Non-equilibrium phase behavior of SPC/GDO/saline mixtures has been also investigated in order to get more information about swelling kinetics of different SPC/GDO mixtures. The aim was to determine the swelling profiles of various SPC/GDO depot pre-formulations as a function of lipid composition and time. To this end, mixtures of different SPC/GDO composition were prepared by filling liquid lipid pre-formulation into approx. 1 mm (i.d.) and about 6 cm in length glass capillaries and slowly adding saline solution on top of the air/lipid interface. The capillaries were immediately flame sealed and left to equilibrate for various periods of time at room temperature before examination by SAXS. The swelling profile of the mixtures was determined by measuring X-ray diffraction patterns as a function of beam position along the swelling direction relative to the lipid/saline interface. Figure 1 shows typical results of the obtained swelling profiles as a function of time. Altogether, the data are being complemented with the in vitro release studies of the small molecular weight compounds from both lipid LC systems.

MAX-lab ACTIVITY REPORT 2010 255
SYNCHROTRON RADIATION – BEAMLINE I711
Figure 1. An example of the swelling profiles and the phases identified of SPC/GDO pre-formulation of 50/50 lipid composition as a function of swelling (left) distance and (right) time studied by SAXS at I711.
For the further utilization of novel lipid-based LC delivery systems it is of utmost
importance to optimize and control the LC nanostructure for better performance as drug delivery system. We have started to investigate new synthetic lipids suitable to serve as drug delivery matrices. At this stage of the project we have synthesized 4 novel oleyl- and linoleyl-amide derivatives: derivatives (N-(2,3-propanediol)-oleylamide (Compound 1), N-(1,3-propanediol)-oleylamide (Compound 2), N-(2,3-propanediol)-linoleylamide (Compound 3), and N-(1,3-propanediol)-linoleylamide and investigated their temperature-composition phase behavior. Although Compounds 1-3 did not form non-lamellar liquid crystals in excess water conditions, the phase transitions between Lβ and Lα appears to be rather complicated with the formation of intermediate lipid aggregates (Figure 2). Investigations in this direction are still very much in progress; new lipid derivatives are being synthesized.
Figure 2. Temperature induced phase transitions of aqueous dispersions of Compounds 1-3 studied by SAXS at I711.

256 MAX-lab ACTIVITY REPORT 2010
SYNCHROTRON RADIATION – BEAMLINE I711
Investigation of the dehydrogenation of Ca(BH4)2 as potential hydrogen storage material
Christian Bonatto Minella1, Gagik Barkhordarian1, Claudio Pistidda1, K. Suarez1, I. Saldan1, Torben R. Jensen3, Yngve Cerenius4, Thomas Klassen1, Rüdiger Bormann1, Martin Dornheim1. 1 Institute of Materials Research, Materials Technology, Helmholtz-Zentrum Geesthacht, Max-Planck-Straße
1, D-21502 Geesthacht, Germany. Email:[email protected]
2 Departament de Física, Universitat Autònoma de Barcelona, 08193 Bellaterra, Spain 3 Interdisciplinary Nanoscience Centre (iNANO) and Department of Chemistry, University of Aarhus,
Langelandsgabe 140, DK-8000. Denmark 4 MAX-lab, Lund University, S-22100 Lund, Sweden
Light metal borohydrides are considered as promising materials for solid state hydrogen storage. Among them, Ca(BH4)2 represents a potential candidate, due to its high gravimetric (11.5 wt. %) and volumetric (~130 kg m-3) hydrogen content.1 Furthermore, the dehydrogenation enthalpy is calculated to be 32 kJ mol-1H2, if CaH2 and CaB6 are the decomposition products, which is within the optimal range for mobile applications.2,3
The formation of Ca(BH4)2 was shown to be partially reversible by using suitable additives.4-6 In-situ SR-PXD was employed to obtain a better understanding of the reactions involved in the samples with NbF5 and TiF4. The experiments were carried out at the Synchrotron MAX II, Lund, Sweden, at the beamline I711 with a MAR165 CCD detector. For comparison, all XRD data are reported referring to the scattering vector 4 sin / . The results are reported in Figure 2 and Figure 3 respectively. X-ray diffraction patterns for all the milled materials are presented in Figure 1. All the samples indicate presence of -Ca(BH4)2 and -Ca(BH4)2 in different abundance. The spectra (a) and (b), related to the samples milled with TiF4 and NbF5, besides the two polymorphs ( and ), show reflections of CaF2 (PDF # 35-819).
Fig. 1: XRD of the samples after ball milling: Ca(BH4)2 + TiF4 (a), Ca(BH4)2 + NbF5 (b), Ca(BH4)2 + VF3 (c), Ca(BH4)2 + TiF3 (d), Ca(BH4)2 + VF4 (e). -Ca(BH4)2 ( ); -Ca(BH4)2 ( ); CaF2 ( ); TiF3 ( ). Its presence hints to a reaction between the TM-fluoride and the borohydride already during milling. In contrast, in pattern (d) we can still find peaks of TiF3 (ICSD # 28783), indicating that no reaction has taken place in the vial. Patterns (c) and (e), with VF3 and VF4 respectively, present
neither traces of CaF2 nor of the TM-fluorides. Desorption reactions were studied under static vacuum by heating from room temperature up to 450 °C. Rietveld refinement of the pattern collected at 30 °C indicates that the initial powder is composed of 72 wt. % low temperature polymorph -Ca(BH4)2, 24 wt. % high temperature -Ca(BH4)2 and 4 wt. % CaF2 (PDF # 35-819). The latter one must have been formed by a reaction between Ca(BH4)2 and NbF5. This might partly explain why the total amount of hydrogen desorbed from the samples with additives is lower than in case of the

MAX-lab ACTIVITY REPORT 2010 257
SYNCHROTRON RADIATION – BEAMLINE I711
pure calcium borohydride. The pattern measured at 282 °C shows that there are no traces of -phase anymore, since it is already transformed into -phase. At this temperature another calcium borohydride polymorph appears, called -phase in a previous work.7 In that study, it was reported that hydrogen desorption from -Ca(BH4)2 occurs in the range of 330 °C to 380 °C, whereas -Ca(BH4)2 releases hydrogen at higher temperature, in the range of 380-500 °C.7 When TM-fluorides are added to calcium borohydride, its kinetics of desorption is modified and the thermal events are shifted. As can be seen in Figure 2, the first hydrogen desorption step takes place between 282 °C and 361 °C and involves only the -phase. In this range, most of the hydrogen is desorbed with some residual being present inside the -phase. This phase fraction grows continuously up to 361 °C, as can be inferred from the increase of the intensity of its diffraction peaks. At this temperature, CaF2 is still present and coexists with the -Ca(BH4)2 phase. The residual hydrogen is released in the 361-450 °C temperature range. CaH2 should be formed after the first desorption event, however, our measurements do not show its formation up to 361 °C. At 450 °C CaO and an unidentified phase form. The latter decomposes after a short time. Later on, the last recorded XRD pattern at 450 °C shows an increase of the peak intensity at the scattering vector value of 2.23. This peak corresponds to the (200) peak of the CaF2-xHx phase8 which is formed by a reaction of CaH2 and CaF2 and can explain the absence of any CaH2 reflections. The ICSD database matches those peaks with an exact stoichiometry CaF0.76H1.24, however, the current experimental results are not conclusive, since not all of the peaks are present.
Fig. 2 SR-PXD patterns of Ca(BH4)2 milled with NbF5. The experiment was carried out by heating in vacuum from RT up to 450 °C with 5 K/min as heating rate and 10 minutes isotherm (at 450 °C). -Ca(BH4)2 ( ); -Ca(BH4)2 ( ); CaF2 ( ); -Ca(BH4)2 ( ); unidentified phase ( ); CaO ( ); CaF2-xHx ( ). This study showed that when TM-fluorides were added to Ca(BH4)2, CaF2 was formed as side product contributing to reduce the hydrogen content of the mixtures.
Formation of CaF2-xHx was detected in the decomposition products due to the reaction between CaH2 and CaF2. Furthermore, in-situ XRD represented a key investigation tool for the understanding of the multistep decomposition reaction of the calcium borohydride/TM-fluoride system. Bibliography
1. Buchter, F.; odziana, Z.; Remhof, A.; Friedrichs, O.; Borgschulte, A.; Mauron, Ph.; Züttel, A.; Sheptyakov, D.; Barkhordarian, G.; Bormann, R.; Ch opek, K.; Fichtner, M.; Sørby, M.; Riktor, M.; Hauback, B.; Orimo, S. J. Phys. Chem. B 2008, 112, 8042-8048.
2. Miwa, K.; Aoki, M.; Noritake, T.; Ohba, N.; Nakamori, Y.; Towata, S.; Züttel, A.; Orimo, S. Phys. Rev. B 2006, 74, 155122.
3. Frankcombe, T. J. J. Phys. Chem. C 2010, 114, 9503-9509. 4. Rönnebro, E.; Majzoub, E. H. J. Phys.Chem. B Letters 2007, 111, 12045-12047 5. Kim, J.-H.; Jin, S.-A.; Shim, J.-H.; Cho, Y. W. Scr. Mater. 2008, 58, 481-483. 6. Kim, J.-H.; Shim, J.-H.; Cho, Y. W. J. Power Sources 2008, 181, 140-143 7. Riktor, M. D.; Sørby, M. H.; Ch opek, K.; Fichtner, M.; Buchter, F.; Züttel, A.;
Hauback, B. C. J. Mater. Chem. 2007, 17, 4939-4942. 8. Brice, J.-F.; Courtois, A.; Chem. 1978, 24, 381-387.

258 MAX-lab ACTIVITY REPORT 2010
SYNCHROTRON RADIATION – BEAMLINE I711
The self-assembly and aggregation of peptides have been widely studied in recent years.1-3 Much of the interest can be traced to the fact that many neurodeseases are consequences of protein or peptide aggregation. As the bottom-up approach through e.g. self-assembly appears to be most reasonable route for the fabrication of nanostructures, peptides self-assembly is also considered in the design of nanomaterials of desired functionality.4, 5
In this study, we demonstrate our results for the study of self-assembly structures of short synthetic oligopeptides A8K and A10K in water over a wide range of concentrations. In our previous work6, we studied the self-assembly structures, including the formation of nematic ordering. SAXS data show that the thickness of the nanotube wall, , is less than 1 nm indicating that the peptides form a monolayer in the nanotube wall. The nanotubes have a very large aspect ratio and form an ordered phase nematic or hexagonal phase. Following that work over high concentrations7, it was shown that because of the low /R ratio, the nanotube volume fraction grows very rapidly with increasing peptide concentration,
, and reaches close packing already at =0.15. When increasing the concentration further, there is a phase transition to a novel lamellar phase where the peptide molecules form bilayers consisting of two, presumably oppositely oriented, monolayers.
In this part of the work, the studies were extended to peptides that are slightly more hydrophobic. Two peptides, A8K and A10K are explored over a range of concentrations and the self-assembly structures were investigated using cryo-transmission electron microscopy (Cryo-TEM) and small angle X-ray scattering (SAXS). Small-angle X-ray scattering experiments were conducted on beamline I711 at the MAX II storage ring in Lund, Sweden, using a sample-to-detector distance of 1.5 m and a wavelength,
1.025 Å. As expected from hydrophobicity, the apparent critical aggregation concentrations for these
peptides are also much lower than that of A6K. SAXS patterns of A8K obtained at peptide concentrations from = 0.1 to 0.25 are measured.
The observed pattern can be modeled with an elliptic cylinder form factor where an elliptic cross-section with dimensions of 2.0 nm and about 4.5 nm is suitable for concentrations up to 10% as presented in Figure 2. It is noteworthy that within this range, the size of the cross-section remains constant.
Figure 1. Theoretical Model showing the scattering pattern of a system with elliptic cylinders (green) and the the
actual data of 7% (blue).
Peptide Self-Assembly
S. Bucak1, C. Cenker2, U. Olsson2
1 Dept. of Chemical Engineering, Yeditepe University, Istanbul, Turkey 2 Physical Chemistry, Lund University, Box 124, SE-221 00 Lund, Sweden

MAX-lab ACTIVITY REPORT 2010 259
SYNCHROTRON RADIATION – BEAMLINE I711
References 1. E. Gazit, Chem. Soc. Rev., 2007, 36, 1263. 2. I. W. Hamley, Angew. Chem. Ind. Ed., 2007, 46, 8128. 3. S. Scanlon and A. Aggeli, Nano Today, 2008, 3, 22. 4. K. Rajagopal and J. P. Schneider, Curr. Opin. Struct. Biol., 2004, 14, 480. 5. R. V. Ulijn and D. N. Woolfson, Chem. Soc. Rev., 2010, 39, 3349. 6. Bucak S; Cenker CC; Nasir I; Olsson U; Zackrisson M, Peptide Nanotube Nematic Phase. Langmuir 2009, 25, 4262-4265. 7. C. C. Cenker, S. Bucak, U. Olsson, Soft Matter, submitted.
The length of the tubes are not distinguishable in this q-range which suggest a length longer than
about 40 nm, which gives a high aspect ratio for the cylinders. These results are in good agreement with cryo-TEM for concentrations that can be imaged.
SAXS patterns of A10K obtained at peptide concentrations from = 0.1 to 0.15, are also measured. This data can also be modeled using an elliptic cylinder form factor where an elliptic cross-section with dimensions of 2.0 nm and about 4.5 nm is suitable for concentrations up to 10%.
This data, coupled with cryo-TEM, reveal that both A8K and A10K form elliptic cylinders with a finite size, yet high aspect ratio; exhibiting behavior very different from the previously investigated peptide, A6K. Although different only with a slight increase in the hydrophobicity, the self assembly structures assumed by these peptides are totally different from the infinitely long hallow nanotubes observed previously by A6K or any other structure peptides assume such as twisted ribbons or fibrils that are commonly seen in the literature.
In summary, we have investigated self assembly of oligopeptides with varying hydrophobicities and have shown that this plays an important role in the type of self assembly structure that forms. This simple system lends itself for systematic investigations of peptide self-assembly including e.g. investigation of slightly different peptides such as A6R (R: Argenine; cationic) and A6D (D:Aspartate; anionic) where the end charge is varied.
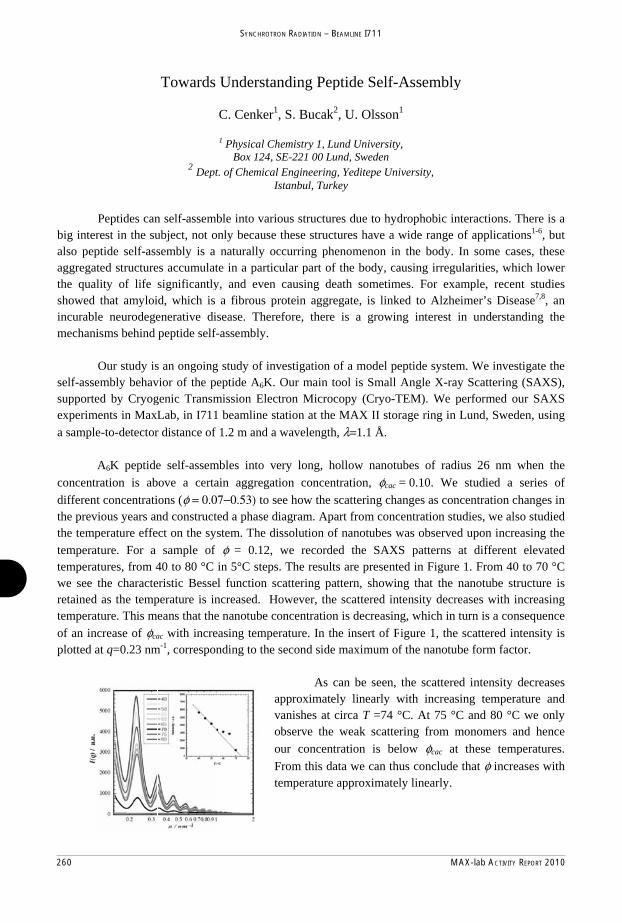
260 MAX-lab ACTIVITY REPORT 2010
SYNCHROTRON RADIATION – BEAMLINE I711
big interalso pepaggregatthe qualshowed incurablmechani
self-assesupporteexperima sample
concentrdifferentthe prevthe temptemperattemperatwe see retained temperatof an incplotted a
Peptides canrest in the suptide self-assted structurelity of life that amyloi
le neurodegeisms behind Our study is
embly behaved by Cryog
ments in MaxLe-to-detector A6K peptideration is abt concentrati
vious years anperature effeture. For a tures, from 4the characteas the temp
ture. This mcrease of φca
at q=0.23 nm
n self-assembubject, not onsembly is a es accumulatsignificantlyd, which is enerative dispeptide self-
s an ongoingvior of the pegenic TransmLab, in I711r distance of
e self-assembove a certaons (φ = 0.07nd constructect on the syssample of
40 to 80 °C ieristic Besselperature is ineans that theac with incre
m-1, correspon
ble into varionly because naturally oc
te in a particy, and even
a fibrous prsease. There-assembly.
study of inveptide A6K.
mission Elect beamline st1.2 m and a
mbles into veain aggregat7−0.53) to seed a phase distem. The diφ = 0.12,
in 5°C stepsl function scncreased. Hoe nanotube coasing tempernding to the s
avooFte
ous structurethese structu
ccurring pheular part of causing dea
rotein aggregefore, there
vestigation oOur main totron Microcotation at the wavelength,
ery long, hoion concentee how the sciagram. Apaissolution of we recorded. The resultscattering patowever, the oncentration rature. In thesecond side m
As caapproximatelvanishes at cobserve the our concentrFrom this datemperature a
es due to hydures have a wenomenon inthe body, caath sometimgate, is linkis a growin
of a model peool is Small opy (Cryo-TMAX II stor λ=1.1 Å.
ollow nanotutration, φcac =cattering chart from concnanotubes w
d the SAXSs are presentettern, showinscattered intis decreasin
e insert of Fmaximum of
an be seen, ly linearly wcirca T =74 °weak scatterration is belta we can thuapproximatel
drophobic inwide range o
n the body. Iausing irregu
mes. For exaed to Alzhe
ng interest i
eptide systemAngle X-ray
TEM). We prage ring in L
ubes of radi= 0.10. We anges as conccentration stuwas observedS patterns aed in Figure ng that the ntensity decreg, which in tigure 1, the f the nanotub
the scatteredwith increasi°C. At 75 °Cring from mlow φcac at us conclude ly linearly.
teractions. Tof applicationIn some cas
ularities, whiample, recenimer’s Diseain understan
m. We investy Scattering performed ouLund, Swede
us 26 nm wstudied a s
centration chudies, we alsod upon increaat different 1. From 40
nanotube strueases with inturn is a consscattered int
be form facto
d intensity ding tempera
C and 80 °C monomers an
these tempthat φ increa
There is a ns1-6, but es, these ch lower
nt studies ase7,8, an
nding the
tigate the (SAXS),
ur SAXS en, using
when the series of hanges in o studied asing the elevated to 70 °C ucture is
ncreasing sequence tensity is or.
decreases ature and
we only nd hence peratures. ases with
Towards
2 Dept
Understan
C. Cenker1
1 Physical ChBox 124, S
t. of Chemical Is
nding Pep
, S. Bucak2,
hemistry 1, LuSE-221 00 LunEngineering,
Istanbul, Turke
ptide Self-A
, U. Olsson
nd Universitynd, Sweden Yeditepe Uniey
Assembly1
y,
iversity,
y

MAX-lab ACTIVITY REPORT 2010 261
SYNCHROTRON RADIATION – BEAMLINE I711
WAXS oÅ but thwhich wresults wthe UK.machineable to appropri
Another inteon a sample
he sample to would providwith X-ray D. We simplye at 4000 rpm
show that iate experime
eresting resuof φ = 0.13. detector dis
de informatioDiffraction (Xy centrifugedm. The result
we could pental set-up.
ult was obtaiWe worked
stance was 2on on the p
XRD) method a capillaryts we obtaineperform diff
ined when wat the same s
25.5 cm. By eptide orien
od9, which wy, filled withed were veryffraction exp
we attemptedstation; I711this approac
ntation withinas performedh our samply similar to Xperiments at
Figure 2. from the cBy alignincentrifugiinformatithe peptid
d to align ou with the sam
ch, we aimedn the nanotud in the Unive, for 2 min
XRD results. t I711 statio
2D image ofcentrifuged sng the nanoting, we wereon about the
des within th
ur nanotubesme wavelengd to get Bragube. We alreversity of Renutes in a ceAs a result,
on in MaxL
f WAXS resusample of φ =tubes with e able to get e local orientahe nanotube w
s and do gth of 1.1 gg peaks, eady had eading in entrifuge we were
Lab with
ult = 0.13.
ation of wall.
References1. Wilcoxen K2. of Autodeli3. injectable s4. 5. 6. Association7. Switch-pep8.
9. Flow Align
s: Fernandez-Lopez
KM; Ghadiri MRPertinhez TA; Coivering TherapeuHsieh PCH; Dav
self-assembling pMatsui, H.; Pan, Yu, L. T.; BanerjReches M; Gazit
n and Potential UTuchscherer G; C
ptides as folding pCastelletto V; HAmyloid Beta PeCastelletto, Valer
ning X-Ray Diffra
z S; Kim HS; C, Antibacterial Agonti S; Ferrari E;tic Peptides. Mol
vis ME; Gannon eptide nanofibersS.; Gologan, B.; jee, I. A.; Shima,t E, Molecular Se
Uses. Current NanChandravarkar Aprecursors in self-
Hamley IW; Harreptide Fragment. ria; Nutt, David; action, ChemCom
Choi EC; Delgadgents Based on th Magliani W; Sp
l. Pharmaceutics J; MacGillivray
s. J Clin Invest. 2Jonas, S. H., J. P M.; Rajan, K.; M
elf-Assembly of Pnoscience 2006, 2; Camus MS; Ber
f-assembling peptris PJF; Olsson UI. MorphologicalHamley, Ian; Ols
mm, 2010, 46, 627
do M; Granja JRhe Cyclic D,L-"-Pisni A; Polonelli 2009, 6, (3), 103C; Lee RT, Cont006, 116, (1), 23
Phys. Chem. B. 20Matsui, H., Adv. MPeptide Nanostruc2, 105-111. rard J; Murat K; Sides and amyloidU; Spencer N, Inl Investigation. J.sson, Ulf; Cenker70-6272
R; Khasanov A; Peptide ArchitectL, Reversible Se6-1039. trolled delivery o7-248. 000, (104), 9576.Mat. 2004, (16), 7ctures: Mechanism
Schmid A; Mimnd fibrillogenesis. Bnfluence of the S Phys. Chem. B 2r, Celen, Structur
Kraehenbuehl Kture. Nature 2001elf-Assembly: A K
of PDGF-BB for
709. m of
na R; Lashuel HABiopolymers 2007Solvent on the S2009, 113, (29), 9re of Single-Wall
K; Long G; Wein1, 412, 452–455. Key Feature for a
myocardial prote
A; Mutter M, 7, 88, (2), 239-25elf-Assembly of
9978-9987. Peptide Nanotub
nberger DA;
a New Class
ection using
52 f a Modified
bes: In situ

262 MAX-lab ACTIVITY REPORT 2010
SYNCHROTRON RADIATION – BEAMLINE I711
Silk assembly in acoustically levitated droplets
Cedric Dicko,1 Staffan Nilsson1 1 Dept. of Pure and Applied Biochemistry, Chemical Center, Lund University
P.O. box 118, S-221 00 Lund, Sweden
At the heart of protein’s aggregation are specific molecular events; and how they are modulated by changes in solvent conditions is key to our understanding and control of fibrillogenesis. A certain class of structural fibrous proteins may provide the answer. Indeed, spider silk and silkworm silk proteins have evolved to readily form ‘insoluble’ ordered structures. But, to date little is known about the series of association steps involved in the nucleation and growth of silk protofilaments. To characterise this process we must clearly establish silk proteins inter- and intra-molecular behaviour in solution. One major hurdle to achieve this goal is the handling difficulty inherent to silk. We therefore, turn our attention to acoustically levitated droplets.1 Suspending a low concentration silk droplet and leaving it to gently dry provides the perfect setup to monitor silk association and assembly in solution. In the present contribution we demonstrate that in-situ SAXS on levitated silk proteins is possible and that silk proteins as a function of concentration can assemble into well ordered structures.
Acoustic levitation is a proven technology and has found numerous areas of application in recent years. In figure 1 we show the working principle of an acoustic levitator, at the pressure nodes droplets can be suspended and maintained stable for at least 20min in air. To standardize the SAXS-Levitator we used the protein lysozyme as a model. Figure 2 shows the scattering intensity of a drying drop of lysozyme. The intensity was comparable to the known and reported lysozyme scattering intensities. Note in figure 2, the appearance and shift of the structure peak in the middle q range.
Figure 1. A standing acoustic wave with frequency range of 15 to 100kHz.
Figure 2. Standard protein, lysozyme, used to test the levitation setup. SAXS intensities of the drying drop show the emergence of a structure peak in the middle q range as the concentration of protein increases (bottom to top).
Figure 3. Typical drying and concentration plot for lysozyme. A concentrating factor of 25 was calculated by estimating the drop volume during the experiment (decaying curve). Additionally the drop anisotropy was monitored (flat curve)
We further monitored the levitated drop morphology by filming it during the experiment. Figure 3 shows a composite plot of the estimated drop volume (red curve) and its anisotropy (black curve) as a function of time. In the inset, an image of the starting drop is shown. We found that the drop volume decreased by a factor of 20-30 fold whilst retaining its shape. This meant a progressive increased to final concentration 20-30 times higher than the initial one. Having determined the working conditions for the levitator on the I711 beamline, we investigated the behaviour of silk protein solutions. For this experiment we used regenerated silk proteins from silkworm cocoons prepared as in reference 2. Sample proteins were extensively dialysed to remove ionic species.

MAX-lab ACTIVITY REPORT 2010 263
SYNCHROTRON RADIATION – BEAMLINE I711
1. J. Leiterer, F. Delißen, F. Emmerling, A. Thünemann, U. Panne, 391, 1221 (Jun 30, 2008). 2. I. Greving, C. Dicko, A. E. Terry, P. Callow, F. Vollrath, 6, 4389 (2010). 3. H. J. Jin, D. L. Kaplan, Nature 424, 1057 (Aug 28, 2003). 4. S. Rammensee, U. Slotta, T. Scheibel, A. R. Bausch, 105, 6590 (2008). 5. C. Dicko, J. Kenney, F. Vollrath, beta-silks: Enhancing and controlling aggregation. (2006), vol. 73,
pp. 17-53. 6. F. Vollrath, D. P. Knight, Nature 410, 541 (Mar 29, 2001).
In figure 4 we show the radial averaging of a drying droplet of silk proteins. Under normal circumstances such a plot would suffice to examine the association and assembly. We found, however, that as the concentration increased silk proteins adopted an anisotropic alignment. Figure 5 summarises the drying kinetics, this time seen from the 2D scattering images.
Figure 4. Radial averaging plot of the SAXS intensities of a silk droplet drying over a 20min period.
Figure 5. 2D SAXS images of the same silk droplet drying over 20min as in figure 4. Frame 7 to 9 show a likely edge effect from the drop relatively to the beam size. Overall, it is clear that upon increasing concentration silk molecules go from an isotropic distribution to an anisotropic ordered assembly at high concentration.
A closer look at the drop shape (anisotropy) showed a slight flattening in the horizontal plane. This change in shape can be correlated to an anisotropic alignment in the vertical plane of the 2D images (figure 5, frame 10 to 12). Interestingly, this alignment of silk proteins suggest an inbuilt concentration driven mechanism that allows silk proteins to organise themselves prior to spinning.
The results presented will shed some light on two central questions of in silk research: (i) what are silk storage structures and shapes; and (ii) what is the mechanism of silk fibre formation. It is interesting to note that until now it was believed that to process silk one needed ‘colloidal aggregate’. 3, 4 The results we present suggest a liquid crystalline phase to promote fibre formation.
Ultimately, the mechanism of silk fibrillogenesis is not clear.5 The two current views, one involving liquid crystallinity 6 and the second involving micellar assembly 3 rather than being conflicting can be reconciled by the present results. It is indeed conceivable that oriented domains exist within larger micellar assemblies.

264 MAX-lab ACTIVITY REPORT 2010
SYNCHROTRON RADIATION – BEAMLINE I711
Lα
Lc?
HΙΙ
Pδ?
Ia3d
Pn3m
DOPS
H2O DOPE
CUBIC PHASES IN THE DOPS/DOPE/WATER SYSTEM
Johan Engblom, Lina Pedersen, Peter Nilsson, Vitaly Kocherbitov
Faculty of Health and Society, Malmö University, SE-20506 Malmö, Sweden
The project aims at mapping the lyotropic and thermotropic phase behavior of the DOPS/DOPE/water system, with particular focus on finding and characterizing any potential bicontinuous mesophases.
Dioleyl phosphatidyl ethanolamine (DOPE) is known to form mostly an inverted hexagonal structure (HII) in aqueous systems (lamellar liquid crystalline (L ) at low temperatures and medium hydration)1-3 , but reports also exist of cubic phases at low temperatures.2-4 No cubic phases at room temperature have been reported so far. Dioleyl phosphatidyl serine (DOPS) is less studied, but is known to form L structures upon hydration.
Synchrotron SAXS and light microscopy with crossed polarizers have been used to construct a tentative phase diagram, see Figure 1. Two bicontinuous cubic phases, Pn3m and Ia3d, have been identified, the position of which have tentatively been calculated from a swelling analysis of the cubic parts of the 2-phase samples. The Pn3m resides close to the DOPE side and at medium hydration, while the Ia3d is closer to DOPS/DOPE 35/65, also at medium hydration. Unfortunately, no single phase cubic samples have been identified so far.
For DOPS/water a L phase with a maximum swelling above 80% water is found, and for DOPE/water a HII phase with a maximum swelling at 32% water.
Figure 1. Tentative phase diagram for the DOPS/DOPE/water system at 25°C. Samples indicated are L (grey squares); Lc (grey circles); HII (open squares); P (open circles); 3-phase Ia3d + HII + L (black triangle); Ia3d + HII (open triangle); HII + weak cubic, insufficiently indexed, likely Pn3m (open diamonds), Pn3m + HII (grey diamond); and Pn3m +water + non-equilibrated traces of HII (black diamonds).
_______________________ 1 Shalaev E.Y., Steponkus, P.L., Biochim Biophys Acta 1419 (1999) 229-47 2 Gawrisch K. et al., Biochemistry 31 (1992) 2856-64 3 Rand R. P., Fuller N.L., Biophys J 66 (1994) 2127-38 4 Shyamsunder E. et al., Biochemistry 27 (1988) 2332-36

MAX-lab ACTIVITY REPORT 2010 265
SYNCHROTRON RADIATION – BEAMLINE I711
During the autumn a new four circle diffractometer was installed at I711. This caries a large area CCD detector and has the possibility to mount a point detector and analyser crystal for high resolution powder diffraction. This new instrument covers the needs for single crystal diffraction, in-situ powder diffraction and high resolution powder diffraction. The picture shows the new setup with the detector at 2theta 90. 25 October 2010.Photo: Annika Nyberg
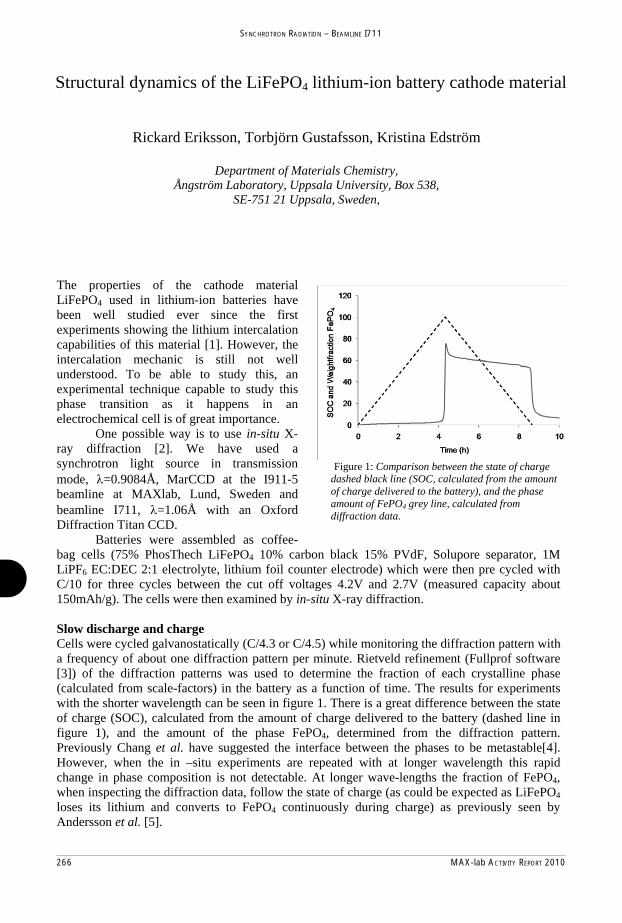
266 MAX-lab ACTIVITY REPORT 2010
SYNCHROTRON RADIATION – BEAMLINE I711
The properties of the cathode material LiFePO4 used in lithium-ion batteries have been well studied ever since the first experiments showing the lithium intercalation capabilities of this material [1]. However, the intercalation mechanic is still not well understood. To be able to study this, anexperimental technique capable to study this phase transition as it happens in an electrochemical cell is of great importance.
One possible way is to use in-situ X-ray diffraction [2]. We have used a synchrotron light source in transmission mode, =0.9084Å, MarCCD at the I911-5beamline at MAXlab, Lund, Sweden and beamline I711, =1.06Å with an Oxford Diffraction Titan CCD.
Batteries were assembled as coffee-bag cells (75% PhosThech LiFePO4 10% carbon black 15% PVdF, Solupore separator, 1M LiPF6 EC:DEC 2:1 electrolyte, lithium foil counter electrode) which were then pre cycled with C/10 for three cycles between the cut off voltages 4.2V and 2.7V (measured capacity about 150mAh/g). The cells were then examined by in-situ X-ray diffraction.
Slow discharge and charge Cells were cycled galvanostatically (C/4.3 or C/4.5) while monitoring the diffraction pattern with a frequency of about one diffraction pattern per minute. Rietveld refinement (Fullprof software [3]) of the diffraction patterns was used to determine the fraction of each crystalline phase (calculated from scale-factors) in the battery as a function of time. The results for experiments with the shorter wavelength can be seen in figure 1. There is a great difference between the state of charge (SOC), calculated from the amount of charge delivered to the battery (dashed line in figure 1), and the amount of the phase FePO4, determined from the diffraction pattern. Previously Chang et al. have suggested the interface between the phases to be metastable[4]. However, when the in –situ experiments are repeated with at longer wavelength this rapid change in phase composition is not detectable. At longer wave-lengths the fraction of FePO4,when inspecting the diffraction data, follow the state of charge (as could be expected as LiFePO4loses its lithium and converts to FePO4 continuously during charge) as previously seen by Andersson et al. [5].
Figure 1: Comparison between the state of charge dashed black line (SOC, calculated from the amount of charge delivered to the battery), and the phase amount of FePO4 grey line, calculated from diffraction data.
Rickard Eriksson, Torbjörn Gustafsson, Kristina Edström
Department of Materials Chemistry,Ångström Laboratory, Uppsala University, Box 538,
SE-751 21 Uppsala, Sweden,
Structural dynamics of the LiFePO4 lithium-ion battery cathode material

MAX-lab ACTIVITY REPORT 2010 267
SYNCHROTRON RADIATION – BEAMLINE I711
AcknowledgementsThis work was supported by the Swedish Energy Agency and the Swedish Research Council.
References[1] A. K. Padhi, K. S. Nanjundaswamy, and J. B. Goodenough. Journal of the Electrochemical Society,
144(4):1188–1194, 1997.[2] M. Morcrette, Y. Chabre, G. Vaughan, G. Amatucci, J.-B. Leriche, S. Patoux, C. Masquelier, and J-M.
Tarascone. Electrochimica Acta, 47:3137–3149, 2002.[3 ]J. Rodriguez-Carvajal, Physica B: Condensed Matter, 192(1-2):55-69, 1993. [4] H-H. Chang, C-C. Chang, H-C. Wu, M-H. Yang, H-S. Sheu, and N-L. Wu. Electrochemistry Communications,
10:335–339, 2008.[5] A. Andersson, B. Kalska, L. Haggstrom and J. Thomas. Solid State Ionics, 130:41-52, 2000.
Fast discharge and chargeExperiments were also done by applying constant potential to the cells while monitored the current response and diffraction on the I911-5 beamline. Fully charged cells were discharged under a 2.7Vpotential and fully discharged cells were charged by applying 4.2V). To diffraction patterns were recorded with a frequency of about 4 each minute. Almost all of the material change phase during the first few minutes of the potential step. A selection of the diffraction patterns from this time period are seen in figure 2. The difference between the peak width changes of both phases can be seen as an indication the difference between the lithiation and delithiationprocesses. The broad peaks of the growing LiFePO4 phase during discharge can be explained by larger strains in the materials than during the charge or by multiple nucleation of the new phase and thus the creation of many small LiFePO4 domains instead of one big in each crystallite.
ConclusionsThere is an interesting difference between the measurements done at different wavelengths. This is previously not reported in the literature and might together with computational chemistry give better understanding of the properties of the LiFePO4 cathode material. We are also currently investigating how rapid charge and discharge of the batteries can best be examined by in-situ X-ray diffraction and how to fully utilize the new Oxford Diffraction Titan CCD on the I711, as it can easily circumvent the limitations of the MAR system when used on highly textured and high background samples as fully functionally batteries.
Figure 2. Diffraction pattern for potential step to 2.7V, discharging the battery (upper) and potential step to 4.2V, charging (lower) for a LiFePO4
electrode. The axis in the figure are2 with peak indices marked (L=LiFePO4, F=FePO4) andintensity. The difference in peak width during the charge and discharge is clearly visible and also that the peak width for the two phases are different. Most notable are the broad peaks of the growing LiFePO4during discharge, as compared to the growing FePO4during charge.

268 MAX-lab ACTIVITY REPORT 2010
SYNCHROTRON RADIATION – BEAMLINE I711
1 Department of Physics, Norwegian University of Science and Technology, Trondheim, Norway 2 UFR Structure et Propriétés de la Matière, Université de Rennes 1, Rennes, France 3 Department of Physics, Institute for Energy Technology, Kjeller, Norway 4 MAX-lab, Lund University, Lund, Sweden
Clay mineral particles in the form of layered, plate-shaped smectites receive attention in areas
ranging from geology and petrology to material science and basic physics. A central property
of smectites is their capacity for uptake of water and other species into the nanopores that are
formed when several unit clay layers stack to form lamellar particles. Because smectite clays
are hydrated at ambient temperature, pressure and humidity conditions – and also often in
geological environments – the interaction of smectites with water is crucial. The present
report concerns x-ray scattering studies conducted at I711 on delamination and swelling of the
synthetic smectite Na-fluorohectorite suspended in saline water as a function of temperature.
When subjected to an atmosphere of sufficient water vapor content, or to direct contact with
liquid water, layered smectite particles intercalate water molecules, causing the particles to
swell in the stacking direction. This water uptake is associated with a stepwise increase in the
spacing of layers, giving rise to a nomenclature where hydration states are referred to as
intercalating zero, one, two or three water-layers [1]. However, when clay is dispersed in
water, a point may eventually be reached beyond which no well-defined hydration states are
stable. At this point the system transitions into the regime of osmotic swelling, as stacked
particles delaminate and their unit layers become separate colloids surrounded by double
layers of counter-ions. In the current project, changes to hydration state and structure in 10 mM NaCl aqueous
dispersions of Na-fluorohectorite were investigated in situ by transmission mode diffraction
as a function of temperature. Figure 1 shows the changes in scattered intensity obtained upon
heating from 25 to 78 . o C
Clay delamination in saline water during heating E. L. Hansen1, H. Hemmen1, D. d. M. Fonseca1, C. Coutant1,2, K. D. Knudsen3, T. Plivelic4, J.
O. Fossum1

MAX-lab ACTIVITY REPORT 2010 269
SYNCHROTRON RADIATION – BEAMLINE I711
1 D. A. Laird, Applied Clay Science 34, 74 (2006). 2 E. DiMasi, J. O. Fossum, T. Gog, and C. Venkataraman, Physical Review E 64, 061704 (2001). 3 H. Hemmen, L. R. Alme, J. O. Fossum, and Y. Meheust, Physical Review E 82 (2010). 4 B. Ruzicka, L. Zulian, E. Zaccarelli, R. Angelini, M. Sztucki, A. Moussaid, and G. Ruocco, Physical
Review Letters 104, 085701 (2010).
Figure 1: Azimuthally integrated scattering recorded at 25 and 78 : a) the effects of heating at small scattering angles, and b) the changes in the two water-layer 001 Bragg reflection that originates from the structural periodicity along the stacking direction of layered particles.
o C
From Figure 1b), it is evident that the overall 001 Bragg diffraction intensity has decreased as
the sample was heated. The position of the 001 peak, at at 25 , corresponds
to the two water-layer hydration state [2, 3]. The disappearance of this peak with temperature
could either result from a change in the hydration state of the clay particles or from a
degradation of particle crystallinity.
-14.152 nmq o C
An approximate structure factor can be obtained by dividing the overall intensity by a fitted xAq form factor contribution found for . Preliminary analysis indicate a
structure factor characteristic of a ‘dense’ system with repulsive interactions [4], especially at
the highest temperatures. We interpret the loss of two water-layer 001 peak intensity along
with the relaxation of the scattering curves for towards a behaviour, as
evidence of particle delamination at elevated temperatures. The significant structural changes
in the dispersions accompanying delamination shows characteristics associated with a
repulsive Wigner glass. We are currently continuing the study of this temperature induced
transition with scattering at smaller angles and rheological studies.
-10.4 nmq
0.4 nq -1m 2q

270 MAX-lab ACTIVITY REPORT 2010
SYNCHROTRON RADIATION – BEAMLINE I711
AAlizarin redd S modiffies apatite
C. J. S. I
e nanocrys
Ibsen1, H. B
stal size an
Birkedal1*
nd formation kineticcs
1 Departm
The hard pgeological form of nanm is parathetic apatiwhere addhow the dyto dye bon Na3PO4/Na
10
giving a fining. The fiThe resultiFTIR whilwere probmeasuremechrotron Pbe found in
sis, an amofirst, whileading to crystal aPXRD shduced the tals. Thesethe size, Rietveld ressentially concentrati1B. Abovamorphousshowed thaly functionin situ time
mm diame
ent of Chem
parts of the apatite with
anocrystallinllel to the hite nanoparitives are uye moleculee and/or cal
The nanaOH accord
CaCl2(aq)
nal CaCl2 cinal concenting powdersle the reactibed by inents and inXRD. Full n reference
During torphous gelch then ca suspensio
aggregates. howed that
size of thee are rod-sfound by efinement,
linearly ion as showve 5% ARs powder aat the sampns by inhibie resolved s
The in ster single cr
mistry & IntLange
* Corre
human bodh the idealizne plates of
hexagonal articles for usused to conte alizarin relcifications noparticles ding to3
+ 6 Na3PO4
oncentratiotration of As were charon kinetics
n situ pH n situ syn-details can 2. the synthe-l is formed crystallizes on of nano-
Ex situ ARS re-
e nanocrys-shaped and full-patternis reducedwith ARS
wn in FigureRS led toafter 24 h les eventuaiting crystalsynchrotron situ PXRD mrystal sapph
terdisciplinaelandsgade,
espondance
dy, bone anzed formulaf roughly 4
a-axis of these in biomatrol the crysed S (ARS) in vitro andwere synt
4(aq) + 2 Na
n of 0.2 M.ARS will beracterized by
n d S e o reaction tim
ally became l nucleationPXRD mea
measuremenhire capillar
Figure 1 AliAlizarin redrefinement c- (squares)crystal size.
ary Nanosci, DK-8000 A
email: hbir
nd teeth, cona Ca10(PO4)5×20×3 nm
e bioapatite.aterials. Thestal formatimodifies ap
d in vivo in thesized by
aOH(aq)
ARS was ae reported ay in house p
me at roomnanocrysta
n rather thanasurements.nts were pery as reactor
izarin red S md S sodium saltof ex situ in ho
) and a-axes (ci.
ience CenteAarhus, De
rkedal@che
ntain an ino)6(OH)2. In b
m1. The extr. There is a erefore we hion and crypatite formaexperiment
y mixing a
Ca10(PO4)6
added to theas a percentpowder X-r
m temperatualline. This sn hindering. erformed at r. The solut
modifies the sizet. B. Nanocrysouse X-ray powircles) is shown
er (iNANO),nmark
m.au.dk
organic biombone, the mremely thin large interehave initiat
ystallite sizeation2. ARSal animals.
aqueous sol
6(OH)2 (s) +
e phosphateage of the cray diffracti
ure but prosuggested th growth. Th
ID7-11 at Mtions were p
e of apatite nanstal dimensionswder diffraction. The boxes g
, University
minerals remineral is pr
dimension est in syntheted a researce. Herein wS, see Figur
lutions of
+ 20 NaCl (
e solution prcalcium conion (PXRD)
olonged reahat ARS prherefore we
MAXLAB pumped by a
nocrystals. A. s derived fromon data. The sizgive sketches of
y of Aarhus,
lated to theresent in the
of only ~3esis of syn-ch program
we report one 1, is used
CaCl2 and
(aq)
rior to mix-ncentration.), TGA and
action timeredominant-e undertook
using a 0.7a peristaltic
Sketch of m Rietveld
ze along the f the average
e e
-m n d
d
-. d
e -k
7 c
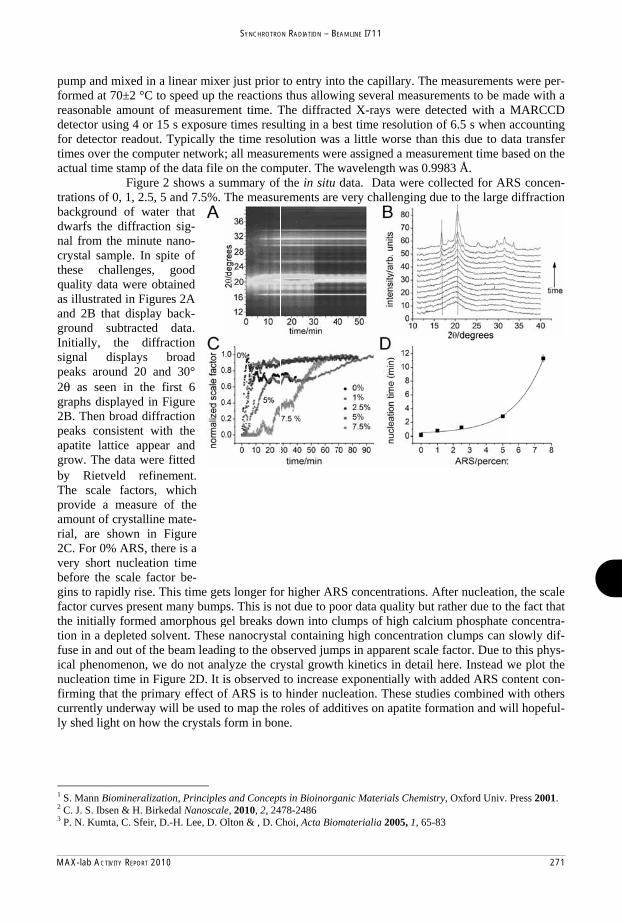
MAX-lab ACTIVITY REPORT 2010 271
SYNCHROTRON RADIATION – BEAMLINE I711
1 S. Mann Bi2 C. J. S. Ibse3 P. N. Kumt
iomineralizatien & H. Birketa, C. Sfeir, D
on, Principles
edal Nanoscal.-H. Lee, D. O
s and Conceptle, 2010, 2, 24Olton & , D. C
ts in Bioinorg478-2486 Choi, Acta Bio
ganic Material
omaterialia 20
ls Chemistry,
005, 1, 65-83
Oxford Univ. Press 2001.
pump and formed at 7reasonabledetector usfor detectotimes over actual time
trations of backgroundwarfs thenal from thcrystal samthese chaquality datas illustrateand 2B thground sInitially, signal dpeaks arou2θ as seengraphs disp2B. Then bpeaks conapatite lattgrow. The by RietveThe scale provide a amount of rial, are s2C. For 0%very short before the gins to rapfactor curvthe initiallytion in a dfuse in andical phenomnucleation firming thacurrently uly shed ligh
mixed in a 70±2 °C to
e amount ofsing 4 or 15or readout. T
the compute stamp of th
Figure 20, 1, 2.5, 5 d of water
e diffractionhe minute n
mple. In spiallenges, ta were obted in Figureat display bubtracted the diffra
displays bund 20 andn in the fiplayed in Fbroad diffra
nsistent withtice appeardata were
eld refine factors, wmeasure ocrystalline
shown in F% ARS, ther
nucleationscale facto
idly rise. Thves present my formed amepleted solv
d out of the menon, we time in Fig
at the primaunderway wht on how th
linear mixespeed up th
f measurem5 s exposureTypically thter networkhe data file
2 shows a suand 7.5%.
r that n sig-nano-ite of good
tained es 2A back-data.
action broad d 30° irst 6
Figure action h the r and fitted
ement. which of the mate-
Figure re is a
n time or be-his time getmany bumpmorphous gvent. Thesebeam leadindo not ana
gure 2D. It iary effect of
will be used the crystals
FiguContcursoat 0.the mmumfactotractard u
er just prior he reactions
ment time. Te times resuhe time reso
k; all measuron the comummary of The measur
ts longer forps. This is ngel breaks de nanocrystang to the ob
alyze the cryis observed f ARS is toto map the form in bon
ure 2 In situ diftour plot of baor observed at17, 0.3, 0.6, 1.2maximum intenm diffraction pors as a functioted from refineuncertainty is
to entry ints thus allowThe diffractulting in a bolution wasrements wer
mputer. The f the in situ rements are
r higher ARnot due to podown into cal containinbserved jumystal growtto increase
o hinder nucroles of add
ne.
ffraction data rackground corrt short times. (B2, 1.9, 2.6, 3.3, nsity of the ameaks that are ion of time for ved scale factorsmaller than t
to the capillwing severalted X-rays
best time ress a little wore assigned wavelengthdata. Data
e very challe
RS concentroor data qualumps of hi
ng high concmps in apparth kinetics ie exponentiacleation. Thditives on ap
recorded at 70rected intensityB) Background3.9, 4.6, 5.2, 6.
morphous precuindicated by thvarying ARS cs; when error he symbol. Th
lary. The ml measuremewere detec
solution of orse than tha measurem
h was 0.9983a were colleenging due
rations. Afteality but ratigh calciumcentration crent scale fain detail herally with adhese studies patite forma
0 °C for variouy for 5% ARSd corrected dif2, 19.97 min (bursor does not
he two vertical concentrations.bars are not ve full line repr
measurementents to be m
cted with a 6.5 s when
his due to dment time b3 Å. ected for ARto the large
er nucleatiother due to t
m phosphateclumps can actor. Due tore. Instead w
dded ARS ccombined
ation and w
us ARS concent; note the amoffraction data bottom to top).t coincide with lines. (C) Refi. (D) Nucleatioisible the estim
resents an expo
ts were per-made with a
MARCCDaccounting
data transferbased on the
RS concen-e diffraction
on, the scalethe fact thate concentra-
slowly dif-o this phys-we plot theontent con-with others
will hopeful-
trations. (A) orphous pre-for 5% ARS . Note how the maxi-
ined scale on time ex-mated stand-onential fit.
-a
D g r e
-n
e t ---e -s -
272 MAX-lab ACTIVITY REPORT 2010
SYNCHROTRON RADIATION – BEAMLINE I711
Soluble Complex Salts of Surfactant Ions and Polymeric Counterions: Composite Macromolecular Self-Assembly
John Janiak, Lennart Piculell, Gerd Olofsson and Karin Schillén Division of Physical Chemistry, Lund University, P.O. Box 124, SE-221 00 Lund, Sweden
The aim of this project is to understand the physical chemistry of soluble complex salts in aqueous solution and to gain information about how the balance of the intermolecular interactions will affect the structures, the packing and the water miscibility of the resulting mixed surfactant aggregates. A complex salt is defined as the neutral salt of surfactant ions (aggregated into highly charged micelles) that interact with a polyelectrolyte chain, which in turn acts as a large counterion (a polyion). The complex salts studied in this work consist of polyacrylate (PA-
y) and cationic C16TA+ surfactant ions aggregated into micelles [1]. They are denoted C16TAPAy, where y is the degree of polymerization (y=25 or 6000). Both are insoluble in water. To make these complex salts soluble, poly(ethylene oxide) (PEO)-containing nonionic surfactants of the type CiEj (E stands for PEO) are added and C16TA+/CiEj mixed micelles surrounded by PA-
y chains are formed. Phase studies on systems containing C16TAPAy complex salts in water mixed with either C12E5 or C12E8 have been carried out by visual inspection of the samples and small-angle X-ray scattering (SAXS) at the beam line I711 at MAX II been employed to characterize the different structures found in the ternary phase diagrams [2]. We used a wavelength of 1.1 Å and a 2D CCD camera. At I711 we had several different measurement sessions and the sample to detector distance varied somewhat, 1403 mm and 1245 mm respectively. All measurements were performed at 25 °C and under vacuum. Typical measurement times were 300-600 seconds. The data obtained analyzed using the software FIT2D [3].
The results revealed that decreasing polyion length and increasing the PEO-chain length of the nonionic surfactant were important factors for increasing the solubility of the complex salt [2]. We also found that the curvature effects are quite small at low water content when gradually exchanging C12E8 with either one of the complex salts while there is a gradual change in curvature for the systems containing C12E5. Another interesting observation was the possibility for relatively large amounts of complex salt to be incorporated into a V1 (Ia3d, bicontinuous) phase in the C12E8-containing systems. In the dilute regime several different liquid crystalline phases were found in equilibrium with a dilute liquid phase containing the nonionic surfactant. The C16TAPA25/C12E8/H2O ternary phase diagram is given in Figure 1. Figure 2 presents a SAXS curve showing the hexagonal structure in a two-phase sample of the same system.

MAX-lab ACTIVITY REPORT 2010 273
SYNCHROTRON RADIATION – BEAMLINE I711
Figure 2. SAXS data demonstrating the hexagonal structure from the H1 + L1’ two-phase area in the C16TAPA25/C12E8/H2O system. Compositions in wt %: (20.1 : 10.0 : 69.9). [1] Svensson, A.; Piculell, L.; Cabane, B.; Ilekti, P. J. Phys. Chem. B 2002, 106, 1013. [2] Janiak, J.; Piculell, L.; Olofsson, G.; Schillén, K. Phys. Chem. Chem. Phys. 2011, 13, 3126. [3] Hammersley, A. P.; Svensson, S. O.; Hanfland, M.; Fitch, A. N.; Husermann, D. High Press. Res. 1996, 14, 235.
Figure 1. Ternary phase diagram of C16TAPA25/C12E8/H2O. One-phase areas (bold lines), boundaries to three-phase areas (full lines), boundaries not exactly determined (dashed lines). Compositions in wt %. Notations: liquid phases (L1 and L1’), liquid micellar phase (L1’’), hexagonal phase (H1), bicontinuous) phase (V1), micellar cubic phase (I1) and lamellar phase (L ).

274 MAX-lab ACTIVITY REPORT 2010
SYNCHROTRON RADIATION – BEAMLINE I711
G. V
1 Departm
2 Depar
V. Jensen1, M
ent of Chem
rtment of Ma
M. BremhoNieder
mistry & IntLange
Materials, ET
* Corre
lm1, N. Locrberger2, J. S
terdisciplinaelandsgade,TH Zürich, W
espondance
ck1, G. R. DSkov Peder
ary Nanosci, DK-8000 AWolfgang-P
email: hbir
Deen1, T. R. sen1, H. Bir
ience CenteAarhus, De
Pauli-Strass
rkedal@che
Jensen1, B.rkedal1*
er (iNANO),nmark e 10, 8093 Z
m.au.dk
. B. Iversen
, University
Zürich, Swi
1, M.
y of Aarhus,
itzerland
Titania nanwealth of salcohol as general andcrystallizatalcohol usiand turbidirefer to ref
addition toThis was othe hydrolleads to thevidenced Thus, the factors govex situ dicrystals walong the plane.
beamline Iwas placedheated to employingbeam wasMAR165 C30 s, the tiwhen accdiffraction refinementframes thdiffraction scale factbackgrouninduction
noparticles synthetic m
the solvend of non-aqtion and aging in situ sity measureference 3 fo
The syno benzyl alcoriginally dlysis reactiohe formatio
by both Tpresent stu
verning anisffraction d
were anisotrc-axis bein
We perI7-11 at Md in a 1 m
85 °C ug a hot air s employeCCD detectime resoluticounting fo
patterns ct with the hat essenti
informatitor refinemd substract
time, cry
are the subjmethods yieldnt1,2. To imqueous metaggregation synchrotronements3. Her full detailthesis was p
cohol and thdone to reduon4. The pron of anisoTEM4 andudy allowssotropy in c
data clearlyropic in shng larger tha
rformed inMAXLAB. Tmm borosiliusing a hostream. An
ed in comtor. With anion was 34.or detectorcould be re
exception ially did on therefoment. Figuted raw datystals nuc
ject of intending titania
mprove our al oxide synkinetics o
n powder diferein we wils. performed b
hen formatiouce the violresence of otropic crys
d ex situ Ps insights icrystal growy showed tape with tan that in t
n situ PXThe liquid icate capillaome-built n 1.1072 Å
mbination wn exposure .3 s per datar read ouefined by R
of the finot conta
ore only aure 1A dta. After anleate and
nse investiga nanoparticunderstandintheses in pf anatase tffraction, inll discuss th
by pre-hydron of the telence of ethanol stals as
PXRD3. nto the
wth. The that the the size the a,b-
XRD at sample
ary and furnace
Å X-ray with a time of a frame
ut. The Rietveld rst few
ain any allowing displays n initial
grow.
FiAlenregrsethat
gation due tocles. One coing of the particular, wtitania nanon situ laborahe powder d
rolyzing Tietragonal an
igure 1 In situ. Background nt data quality
efinement. Afterow. After the een around 220he capillary. C.t first and only
o their use onvenient mmechanism
we have undoparticles satory small diffraction (
Cl4 in anhynatase form
X-ray diffractsubstracted ra
y. B. Scale facter an initial laggrowth spurt,
0 min. This is c. Crystallite siz
y after ~125 mi
in catalystsmethod emplms of crystadertaken stusynthesizedangle X-ray(PXRD) da
ydrous ethanof TiO2 up
tion data and faw data displaytor extracted bg time, crystalsa drop in the s
caused by sedimze: crystallites in, size anisotro
. There is aloys benzyl
allization inudies of the
d in benzyly scattering
ata only and
nol prior topon heating.
fitting results. ying the excel-
by Rietveld s nucleate and scale factor is mentation in are spherical opy sets in.
a l n e l g d
o .
Anisotrropic crystal growthh kinetics non-a
of anataseaqueous m
e TiO2 nanmedium
noparticless synthesizzed in a

MAX-lab ACTIVITY REPORT 2010 275
SYNCHROTRON RADIATION – BEAMLINE I711
1 M. Niederb2 M. Niederb3 G. V. JenseBirkedal Che
berger, M. H. Bberger, M. H. Ben, M. Bremhoem. Mater. 20
Bartl & G. D. Bartl & G. D. olm, N. Lock,10, 22, 6044.
Stucky J. AmStucky Chem G. R. Deen, T
m. Chem. Soc.m. Mater. 2002T. R. Jensen, B
2002, 124, 132, 14, 4364. B. B. Iversen,
3642.
, M. Niederbeerger, J. S. Peddersen & H.
Rietveld rescale factoAfter the nsedimentatinterestingas shown inafter the twhereafterneedle shap
spherical wonder wthis behaviof the ladeformatiothe a-axisexpected faxis displrelaxes exthe maturec/a, shownthan in butowards the
along the cpay for thshape and related to This is conthe two axwhich is shto literatuDuring theare sphericanisotropy situation isinitial isotrdriving forlikely to bdifferent pr
chemical scan be obta
efinement alor, which renucleation tition of partily the Rietvn Figure 1Ctime point r the size in ped.
The obsto needle
what drivingior. Figure attice con
on (with ress displays for nanopaays a pos
xponentiallye crystals. Tn in Figure ulk anatasee bulk value
The surpc-axis sugghe initial that relaxathe onset o
nfirmed by xes as a funhown in Fig
ure reference initial stacal with siis very clo
s recapitularopic crystarce for crystbe governedreference to
The insisyntheses ofained by tim
llowed for eeflects the aime it increaicles in the
veld refinemC. The cryst
where crythe a,b-plan
ervation of crystal sh
g forces ar2A shows t
nstants plospect to lon
a comprarticles. Intesitive and y towards aThe unit cel
2B, starts e and relaxe as the cry
prisingly larests that theessentially
ation of thisof anisotropconsiderin
nction of thgure 2C (plce lattice ages of groize anisotroose to the
ated in Figuals and thetal shape an
d by the preo the (001) aights obtainf nanocrystame resolved
extraction oamount of mases steeplycapillary c
ment also gatallites are inystallite sizene essential
f a transitionhape makee responsibthe time evotted as r
ng times). Inressive straerestingly, large strai
a stable valll anisotropbeing ~4%xes exponestals grow.
rge positiveere is a penspherical
s positive stpic crystal
ng the strainhe size anislotted with constant v
owth, the popy close tcross-over
ure 2C that e large strainisotropy is esence of twand {100} pned throughalline materin situ sync
of very detaimaterial in y and reachecaused by thave detailednitially sphee informatilly stops inc
n from es one ble for olution relative nitially ain as the c-
in that lue for y ratio larger
entially
e strain nalty to crystal train is shape.
n along otropy, respect
values). articles to zero andfrom positischematicain reductionfound to b
wo solventsplanes. h these sturials and bechrotron po
Figlattfunto tvalcry(coaniin t(mlen
iled informathe crystalles a plateauhe onset of
d informatioerical (noteion could bcreasing and
d large straive to nega
ally illustratn seen whee related tos ethanol an
udies highliautifully illwder X-ray
gure 2 Lattice stice strain. B. Unction of time. the data while lue for bulk anystallite size anompressive) c-aisotropies (neethe start of theature). Arrow
ngth) of the latt
ation on theline state, isu. Thereafter
aggregationn on the cry that Figurebe refined)
d the crystal
ains. The oative strain tes the largeen the crys lattice strand benzyl a
ight the roustrates how
y diffraction
strain. A. TimUnit cell anisotThe full line rthe dashed ho
natase. C. Absonisotropy. Noteaxis strains areedle shape). D. e synthesis (inis indicate the dtice strain.
e growth behs shown in r it falls slign of crystalystallite sizee 1C only di) but after ls become in
onset of poalong the c
e positive sstals maturein. The lattialcohol that
le of solvew mechanisn.
e dependence otropy ratio (c/a
represents an eorizontal line inolute strain as e how negativee obtained for Sketch of crystial) and in thedirection and s
havior. TheFigure 1B.
ghtly due tollites. Moree and shapeisplays data
~125 minncreasingly
ositive sizec-axis. Thetrain in the
e. Thus theice strain ist bind with
ents in wetstic insights
of the relative a) shown as a
exponential fit ndicates the a function of
e positive size
stallite shapes e end size (by their
e . o e e a n y
e e e e s h
t s

276 MAX-lab ACTIVITY REPORT 2010
SYNCHROTRON RADIATION – BEAMLINE I711
High pressure X-ray scattering experiments of polyfluorenes at I711
M. Knaapila1, D. Haase2, S. Carlson2, Y. Cerenius2, and S. Guha3
1 Institute for Energy Technology (IFE), NO-2027 Kjeller, Norway
2 MAX-lab, Lund University, SE-22100 Lund, Sweden
3 Department of Physics & Astronomy, University of Missouri-Columbia, MO 65211 USA
We carried out on an X-ray scattering experiment of bulk poly[9,9-bis(2-ethylhexyl)fluorene] under quasi-hydrostatic pressure from 1 to 11 GPa at room temperature1. We found that the scattering pattern of high molecular weight (HMW) polyfluorene (>10 kg/mol) undergoes significant changes between 2 and 4 GPa in bulk phase (Fig. 1). The 110 reflection of the hexagonal unit cell disappears, indicating a change in equatorial intermolecular order. The intensity of the 00 21 reflection drops, with a sudden move towards higher scattering angles. Beyond these pressures, the diminished 00 21 reflection tends to return towards lower angles. These changes may be interpreted as a transition from crystalline hexagonal to glassy nematic phase (perceiving order only in one direction) and rationalized by density arguments and underlying theory of phase behavior of hairy-rod polyfluorene. Also the possible alteration of the 21-helical main chain towards more planar main chain conformation can be discussed. We find, moreover that the scattering of low molecular weight polyfluorene (<10 kg/mol), which is glassy nematic in ambient pressure, is reminiscent with that of HMW polymer above 2-4 GPa. The transition is concomitant with the previously reported transition seen by Raman scattering2.
0.2 0.4 0.6 0.8 1.0 1.2 1.4
0
0.01
0.02
0.03
0.04
0.05
Sca
tterin
g In
tens
ity (a
rb. u
nits
)
q (Å-1)
100,
101
7.4 GPa
00 2
1 11
0
39/58-PF2/6
9.1 GPa
1.8 GPa
1.3 GPa
Figure. 1. Scattering patterns of PF2/6 for selected pressures measured on 711 beamline.
1 M. Knaapila, R. Stepanyan, D. Haase, S. Carlson, M. Torkkeli, Y. Cerenius, U. Scherf, and S. Guha, Phys. Rev. E., 82 051803 (2010). 2 C. M. Martin, S. Guha, M. Chandrasekhar, H. R. Chandrasekhar, R. Güntner, S. de Freitas, and U. Scherf, Phys. Rev. B., 68 115203 (2003).
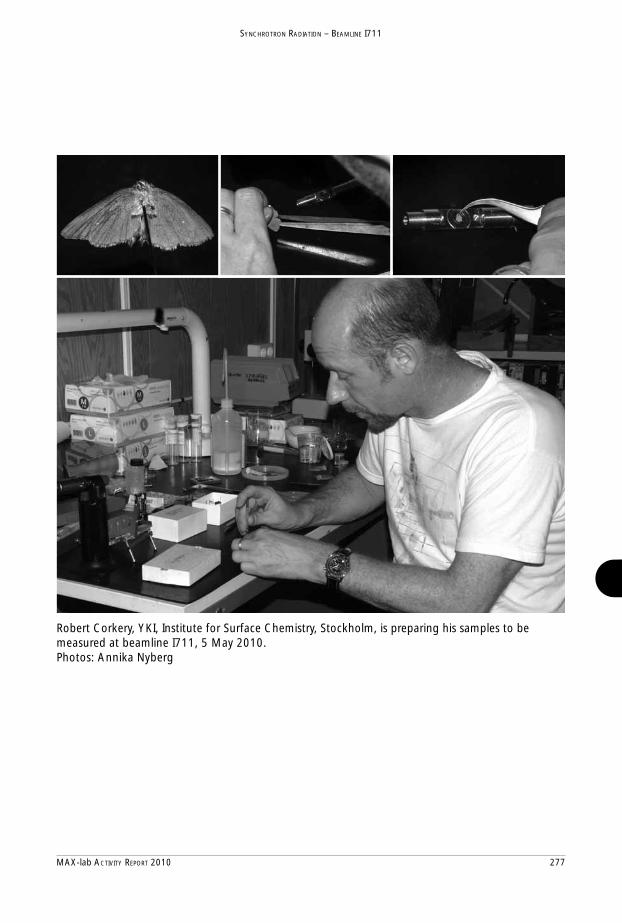
MAX-lab ACTIVITY REPORT 2010 277
SYNCHROTRON RADIATION – BEAMLINE I711
Robert Corkery, YKI, Institute for Surface Chemistry, Stockholm, is preparing his samples to be measured at beamline I711, 5 May 2010.Photos: Annika Nyberg

278 MAX-lab ACTIVITY REPORT 2010
SYNCHROTRON RADIATION – BEAMLINE I711
Structural Analysis of Wheat Gluten Biomaterials containing Urea and Nanoclays using SAXS
R. Kuktaite1, T. S. Plivelic2, S.-W. Cho3, H. Türe4, M. S. Hedenqvist4, M. Gällstedt5, S. Marttila6, R. Ignell6 and E. Johansson1 1Dept. of Agriculture- Farming systems, Technology and Product Quality, The Swedish University of Agricultural Sciences, P.O. Box 104, SE-230 53 Alnarp, Sweden 2MAX-lab, Lund University, P.O. Box 118, SE-221 00 Lund, Sweden 3Textilhögskolan, Bryggaregatan 17, 501 90, Borås, Sweden 4Dept. Fibre and Polymer Technology, Royal Institute of Technology (KTH), SE-10044 Stockholm, Sweden 5Innventia, Box 5604, SE-11486 Stockholm, Sweden 6Dept. of Plant Protection Biology, The Swedish University of Agricultural Sciences, P.O. Box 102, SE-230 53 Alnarp, Sweden
Wheat gluten (WG), a biobased polymer, in blend with glycerol and other additives, i.e. clays, showed a number of advantages to be used in biomaterials1,2, which are good alternative to synthetic polymers in i.e. packaging applications. Additives, sodium hydroxide3 and ammonium hydroxide4, as well as temperature and mechanical energy input5 have been shown to affect molecular interactions and polymerisation of the WG proteins, and end use quality of biomaterials. Also, natural montmorillonite (MMT) clays (Cloisite® Na+) slightly increased stiffness and strength of the materials2, while urea (protein denaturant) is known to be an effective pH regulator for preparation of protein films. The aim of our study was to study protein polymerization and structure in WG films containing urea, nanoclays and urea-nanoclays. In this report we show the structural characterization of WG materials produced in various temperatures and containing the following additives: 1) urea (10%, 15% and 20%) produced by extrusion (Fig.1a); 2) natural and organically modified MMT clays, Na+ and Cloisite 15A, respectively, (5%) wt (Fig.1b) and 3) 10% urea+5% of each natural and organically modified MMT clays (Fig. 1c) produced by injection moulding. The small angle X-ray scattering (SAXS) was performed at the beamline I711 at MAX-lab Synchrotron. The wavelength was 1.1 Å and the sample to detector distance was 1403 mm. All 2D SAXS images for the WG-urea samples, extruded at 130° C, were found being isotropic, while one dimensional intensity plots were influenced by the urea concentration in the sample: higher urea concentration correlated with greater inter-domain distance a, 10% urea with 68Å, while 20% urea with 72Å, respectively (Fig. 1a). We have found the specific WG protein assemblies in urea containing films which seemed to present a well defined supramolecular structure. The film morphologies could be well fitted with a hexagonal close packed (HCP) structure (Fig. 1a, three reflections indicated by arrows). For the WG-clay injection moulded composites (Fig. 1b, black line) with natural MMT clay, anisotropic SAXS pattern was observed indicating the preferential orientation of the silicate layers due to the processing conditions (i.e. injection moulding). However, no temperature effect on the composite structure was observed. Similar SAXS patterns were also obtained for the WG-modified clay samples (Fig. 1b, red line). Clay containing samples (Na+ and Cloisite 15A series) present characteristic peaks, which can easily be associated with an intercalated gluten/clay stacking morphology (red and black arrows in the Iq2 vs q plot for the first order reflection). The d-spacing, a distance between silicate layers, was estimated 17 and 48 Å for the WG/Na+ and WG/Cloisite 15A samples respectively. SAXS pattern of Cloisite 15A presented a more regular and spaced structure

MAX-lab ACTIVITY REPORT 2010 279
SYNCHROTRON RADIATION – BEAMLINE I711
1 I. Olabarr2 S.-W. Cho3 M. Gällste4Gaellstedt2010030235A. Redl, M
rieta, M. Gällstedo, M. Gällstedt, edt, A. Mattozzit, M.; Ullsten, H34 A1 20100318M. H. Morel, J. B
dt, I. Ispizua, J.-E. Johansson, M
i, E. Johansson, .; Johansson, E.
8 CAN 152:3592Bonicel, B. Verg
-R. Sarasua, and M.S. Hedenqvist,
and M. S. Heden; Hedenqvist, M
236 AN 2010:33gnes, and S. Guil
M. S. Hedenqvi, International Jnqvist, Biomacr
M. S. Patent. PCT0607. lbert, Cereal Ch
ist, J. Agric. FooJ. of Biolog. Macromolecules, 5, 2T Int. Appl. (201
hem., 76 (3), 361
od Chem., 54, 12cromolecules, 482020 (2004). 0), 25pp. CODE
(1999).
283 (2006). 8, 146 (2011).
EN: PIXXD2 WOO
morpholarger incomplexmodifie
In Fig. WG/uresamplesto emphintensity15A) inhexagonintercalabe highl With thin urea conditioseems toThe finWG/ureprogressbiomate
a)
Figure scatteriurea cmodifi5% nmodifi
ology for thentercalated xity seems
ed MMT cla
1c are prea/Na+ ands with 5% chasize the y curves are
ndicate the fnal structurated structuly dependen
his study wecontaining
ons temperao be greatly
nal structureea/Cloisite s in order erials for sp
1. SAXS ing data of
containing; bed Cloisite 1
natural Na+ ed Cloisite 1
e intercalatidistances cto be rela
ay composit
resented SAd WG/ureclay in Iq2 vpeaks struc
e plotted in first reflectire, peaks foure of glutennt on the sam
e conclude tg samples ature effecty influencede morpholog15A compto underst
ecific end u
profiles off the WG fib) natural N15A clays; c
and urea 15A clays.
ion of glutecomparing wated with gtes comparin
AXS profilea/Cloisitevs q plot incture. Addiinset. The aon of an intor this strun/clays. Themple compo
that the obsis due to
t. The WG/d by the natgy seems tosite comptand WG p
uses.
f X-ray films: a) Na+ and c) urea +
+ 5%
n, and this with a natugood mechang with WG
les of
15A n order itional arrows (blutercalated g
ucture are oe SAXS proosition.
served a parurea and i/urea/Cloisiture of Cloiso be better
paring to thprotein pro
c)
b)
indicated aural unmodianical propG samples2.
ue - the WGgluten/clay sobserved toofile intens
rtially organits concentrite 15A comsite 15A, anr dispersed he WG/ureoperties in
greater ordfied clay (N
perties of t
G/Na+ and pustructure. Siogether withity of both
nized WG pration, as wmposite strnd urea effeand more h
ea/Na+. Furturea/clay
der of structNa+). This sthe WG co
urple - WGince, urea inh the peakstructures s
protein arranwell as pro
ructure morect on WG phomogenouther studiesystems an
tures and structure
ontaining
/Cloisite nduces a
ks of the seems to
ngement ocessing rphology proteins. us in the s are in nd tailor
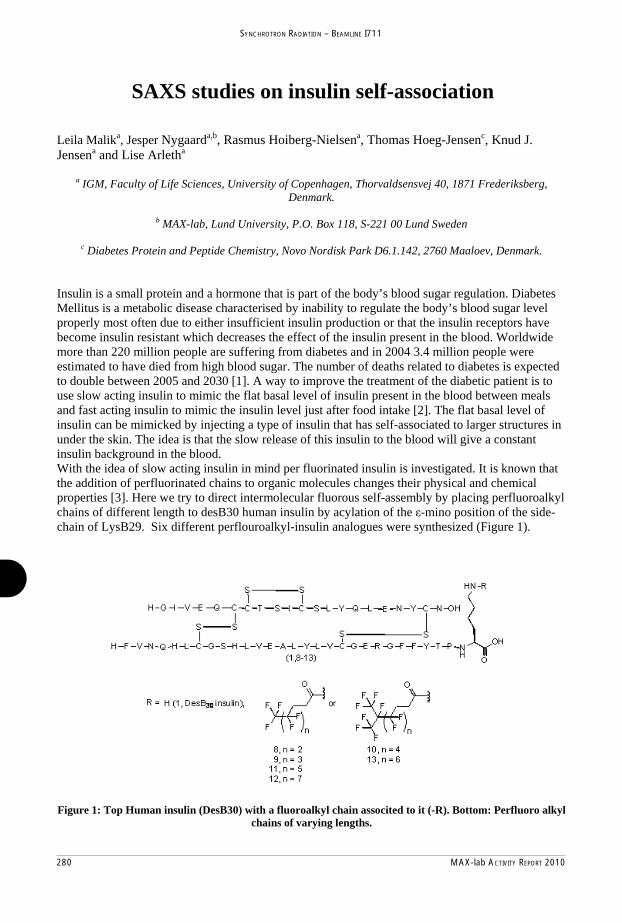
280 MAX-lab ACTIVITY REPORT 2010
SYNCHROTRON RADIATION – BEAMLINE I711
SAXS studies on insulin self-association Leila Malika, Jesper Nygaarda,b, Rasmus Hoiberg-Nielsena, Thomas Hoeg-Jensenc, Knud J. Jensena and Lise Arletha
a IGM, Faculty of Life Sciences, University of Copenhagen, Thorvaldsensvej 40, 1871 Frederiksberg, Denmark.
b MAX-lab, Lund University, P.O. Box 118, S-221 00 Lund Sweden
c Diabetes Protein and Peptide Chemistry, Novo Nordisk Park D6.1.142, 2760 Maaloev, Denmark.
Insulin is a small protein and a hormone that is part of the body’s blood sugar regulation. Diabetes Mellitus is a metabolic disease characterised by inability to regulate the body’s blood sugar level properly most often due to either insufficient insulin production or that the insulin receptors have become insulin resistant which decreases the effect of the insulin present in the blood. Worldwide more than 220 million people are suffering from diabetes and in 2004 3.4 million people were estimated to have died from high blood sugar. The number of deaths related to diabetes is expected to double between 2005 and 2030 [1]. A way to improve the treatment of the diabetic patient is to use slow acting insulin to mimic the flat basal level of insulin present in the blood between meals and fast acting insulin to mimic the insulin level just after food intake [2]. The flat basal level of insulin can be mimicked by injecting a type of insulin that has self-associated to larger structures in under the skin. The idea is that the slow release of this insulin to the blood will give a constant insulin background in the blood. With the idea of slow acting insulin in mind per fluorinated insulin is investigated. It is known that the addition of perfluorinated chains to organic molecules changes their physical and chemical properties [3]. Here we try to direct intermolecular fluorous self-assembly by placing perfluoroalkyl chains of different length to desB30 human insulin by acylation of the -mino position of the side-chain of LysB29. Six different perflouroalkyl-insulin analogues were synthesized (Figure 1).
Figure 1: Top Human insulin (DesB30) with a fluoroalkyl chain associted to it (-R). Bottom: Perfluoro alkyl
chains of varying lengths.

MAX-lab ACTIVITY REPORT 2010 281
SYNCHROTRON RADIATION – BEAMLINE I711
References 1 World Health Organisation. Diabetes Mellitus Fact Sheet 312 [web page]. Available from: http://www.who.int/mediacentre/factsheets/fs312/en/ Accessed 2011-02-07 2 J. Brange, L. Langkjær, Insulin formulation and delivery, in: L.M. Sanders, R.W. Hendren (Eds.), Protein Delivery—Physical Systems, Plenum Publishing Corp., New York, NY, 1997, pp. 343–410. 3 Gladysz, J. A.; Curran, D. P.; Horváth, I. T. In Handbook of fluorous chemistry; Wiley-VCH 4 L. Malik, J. Nygaard, R. Hoiberg-Nielsen, L. Arleth, T. Hoeg-Jensen, K. J. Jensen, Controlled Self-assembly of Perfluoroalkyl-insulin Analogues: Synthesis and Biophysical Evaluation, in preparation
Figure 2: Left: 1-D background subtracted scattering profiles of the 6 types of perfluoroalkyl-insulin compared
with the scattering from DesB30 (human insulin) hexamers. Right: the p(r) function, of same measurements.
Our investigation of the perfluoroalkyl-insulin analogues is performed by use of SAXS to estimate their degree of self-assembly and analysed the way they self-associate. As can be seen from figure 2(left) the scattering from samples 8, 9, 11 (see figure 1 for nomenclature) and to some extend sample 10 corresponds well with the scattering from the hexamer human insulin (DesB30). Thus the structure of these four insulin analogues is made up of perfluoroalkyl-insulin hexamers that self-associates to form larger structures. From the pair distribution function, p(r), in figure 2(right) it can be seen that samples 8 and 9 have a Dmax of 54 Å. The scattering from samples 12 and 13 does not resemble the scattering from DesB30. It is therefore likely that samples 12 and 13 do not form hexamers but rather (in the case of sample 12) self-associates as monomers. The p(r) function for both samples 12 and 13 show large degree of self-assembly. For both samples 12 and 13 the Dmax is larger than what is measurable at I711. A full analysis of the data sets is in progress [4] and will be described in the scientific literature shortly.

282 MAX-lab ACTIVITY REPORT 2010
SYNCHROTRON RADIATION – BEAMLINE I711
Thomas K. Nielsen,1 Marek Polanski,2 Dariusz Zasada,2 Payam Javadian,1 Flemming Besenbacher,3 Jerzy Bystrzycki,2 Jørgen Skibsted,4 Torben R. Jensen1*
1Center for Energy Materials, Interdisciplinary Nanoscience Center (iNANO), and Department of Chemistry, Aarhus University, DK-8000 Aarhus, Denmark. 2Faculty of Advanced Technology and Chemistry, Military University of Technology, 2 Kaliskiego Str., 00-908 Warsaw, Poland.3 Interdisciplinary Nanoscience Center (iNANO) and Department of Physics and Astronomy, Aarhus University, DK-8000 Aarhus C, Denmark.4 Instrument Centre for Solid-State NMR Spectroscopy, Department of Chemistry, and Interdisciplinary Nanoscience Center (iNANO), Aarhus University, DK-8000 Aarhus C, Denmark
Increasing energy demands, the depletion of fossil fuels in the 21st century and increasing levels of
atmospheric carbon dioxide, which may induce global climate changes, call for a transition towards
utilization of renewable and sustainable energy sources.1 One of the major problems in a society based on
sustainable energy sources, such as solar, wind and water, where the temporal energy production varies
significantly, is to develop a robust, efficient, inexpensive energy storage scheme. Hydrogen has indeed been
suggested as a carrier of renewable energy in a future carbon free energy system, but a requirement is that
hydrogen can be stored with high gravimetric and volumetric density to reach sufficiently high energy
capacities, e.g. for mobile applications.2 To date, no material simultaneously fulfills all of the above
mentioned requirements.3
Nanoconfinement is a new concept where nanoparticles of hydrides can be synthesized or melt-infiltrated in
a nanoporous inert scaffold material where the metal hydride particle size is limited by the average pore size
of the scaffold allowing for the direct synthesis of small nanoparticles. The scheme of nanoconfinement has
several advantages: (i) increased surface area of the reactants, (ii) nanoscale diffusion distances, and (iii)
increased number of grain boundaries, which all facilitate the release and uptake of hydrogen and enhance
the reaction kinetics.4 Furthermore, particle growth and agglomeration of the nanoparticles may be hindered
by the compartmentalization within the scaffold template. The design of new nanomaterials is expected to
have a major impact on the development of novel sustainable energy and especially efficient energy storage
technologies.5-7
In this work, Nanoparticles of NaAlH4 have been embedded in nanoporous carbon aerogel with TiCl3
nanoparticles (sample Na-Ti-X) in order to explore possible favorable synergetic effects between
nanoconfinement and a functionalized catalytic scaffold. Resorcinol-formaldehyde carbon aerogels with an
average pore size of 17 nm and total pore volume of 1.26 g/mL were infiltrated with TiCl3 dissolved in
acetone to obtain an aerogel doped with 2.5 wt% TiCl3 nanoparticles. NaAlH4 was melt-infiltrated into the
functionalized carbon aerogel at 189 °C and p(H2) ~ 186-199 bar. Energy-dispersive spectrometry (EDS)
combined with focused ion beam (FIB) techniques has revealed the presence of Na, Al, Ti and Cl inside the
Improved Hydrogen Storage Kinetics of Nanoconfined NaAlH4 Catalyzed with TiCl3 Nanoparticles

MAX-lab ACTIVITY REPORT 2010 283
SYNCHROTRON RADIATION – BEAMLINE I711
References1. Liu, C. J.2. Schlapba3. Graetz, J4. Bérubé, V5. Nielsen, ACS Nano 26. Nielsen, 3528. 7. Nielsen, T
s .; Burghaus, ach, L.; Zütte. Chem. Soc.V.; Radtke, GT. K.; Bösen2010, 4, 3903T. K.; Man
T. K.; Besen
U.; Besenbael, A. Nature Rev. 2009, 3
G.; Dresselhanberg, U.; Go3-3908. ickam, K.; H
nbacher, F.; J
acher, F.; Wa2001, 414, 3
38, 73-82. aus, M.; Cheosalawit, R.;
Hirscher, M.
Jensen, T. R.
ang, Z. L. AC353-358.
en, G. Int. J. E; Dornheim,
.; Besenbach
NanoScale 2
CS Nano 201
Energy. Res.M.; Cereniu
her, F.; Jense
2011, DOI:1
0, 4, 5517-55
. 2007, 31, 6us, Y.; Besen
en, T. R. AC
0.1039/C0N
526.
37-663. nbacher, F.; J
CS Nano 200
NR00725K
Jensen, T. R.
09, 3, 3521-
.
-
Figure 1. (a
melt infiltra
(b) Normal
(solid lines)
a) Synchrotr
ation of NaA
ized Sieverts
) cycle (1) an
ron radiation
AlH4 at T ~ 1
s’ hydrogen
nd (4), Na-X
n powder X-r
90-200 and p
desorption p
(dashed line
ray diffractio
p(H2) ~ 150-
profiles. The
e), and Na-Ti
on diagrams
-160 bar, =
e hydrogen r
i-BM (dotted
of samples N
= 0.93813 Å
release kineti
d line) are co
Na-X and N
. Maxlab bea
ics for samp
ompared.
Na-Ti-X after
amline I711.
ples Na-Ti-X
r
.
X
aerogel scaf
angle spinn
programme
significantly
compared t
samples of
hydrogen re
maximum v
catalyst add
ffold materia
ning (MAS)
d desorptio
y improved
to nanoconfi
f NaAlH4-Ti
elease was c
value at 125
dition.
al. The infiltr
NMR spectr
on mass sp
hydrogen de
ined NaAlH
Cl3 (sample
close to room
°C, which d
rated NaAlH
roscopy con
pectroscopy
esorption kin
H4 without th
Na-Ti-BM)
m temperatur
demonstrates
H4 was X-ray
nfirmed the p
(TPD-MS)
netics for thi
he catalysts
), see Figur
re (Tonset =
s favorable s
amorphous,
presence of n
) and Siev
is new nano
TiCl3 (sam
re 1B. We f
33 °C) and
synergetic ef
, see Figure
nanoconfine
verts’ measu
confined Na
mple Na-X)
find that the
the hydroge
ffects betwee
1A, whereas
ed NaAlH4. T
urements d
aAlH4-TiCl3
and to bulk
e onset tem
en release ra
en nanoconf
27Al magic-
Temperature
demonstrated
materials as
k ball-milled
mperature for
ate reached a
finement and
-
e
d
s
d
r
a
d
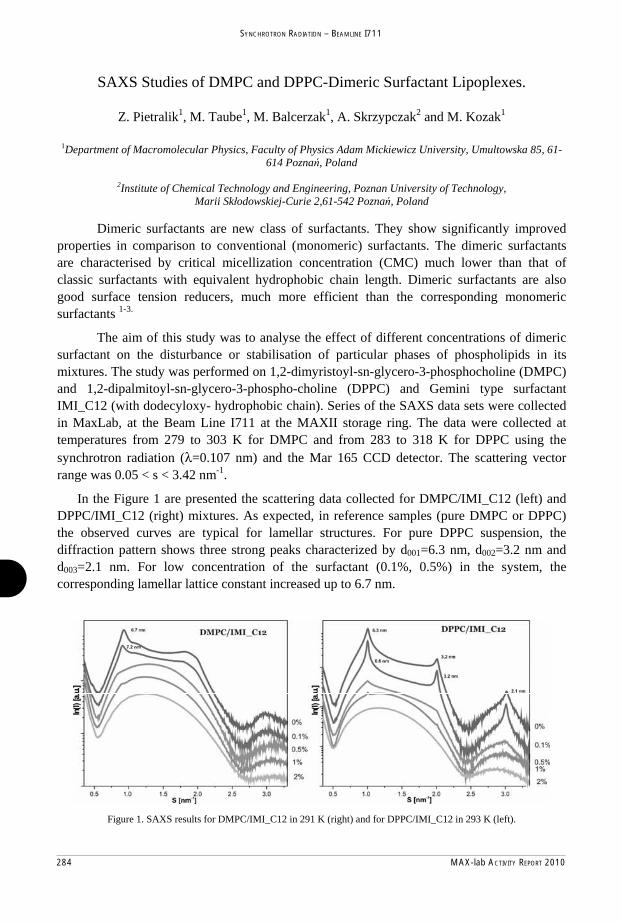
284 MAX-lab ACTIVITY REPORT 2010
SYNCHROTRON RADIATION – BEAMLINE I711
Figure 1. SAXS results for DMPC/IMI_C12 in 291 K (right) and for DPPC/IMI_C12 in 293 K (left).
SAXS Studies of DMPC and DPPC-Dimeric Surfactant Lipoplexes.
Z. Pietralik1, M. Taube1, M. Balcerzak1, A. Skrzypczak2 and M. Kozak1
1Department of Macromolecular Physics, Faculty of Physics Adam Mickiewicz University, Umultowska 85, 61-614 Pozna , Poland
2Institute of Chemical Technology and Engineering, Poznan University of Technology,
Marii Sk odowskiej-Curie 2,61-542 Pozna , Poland
Dimeric surfactants are new class of surfactants. They show significantly improved properties in comparison to conventional (monomeric) surfactants. The dimeric surfactants are characterised by critical micellization concentration (CMC) much lower than that of classic surfactants with equivalent hydrophobic chain length. Dimeric surfactants are also good surface tension reducers, much more efficient than the corresponding monomeric surfactants 1-3.
The aim of this study was to analyse the effect of different concentrations of dimeric surfactant on the disturbance or stabilisation of particular phases of phospholipids in its mixtures. The study was performed on 1,2-dimyristoyl-sn-glycero-3-phosphocholine (DMPC) and 1,2-dipalmitoyl-sn-glycero-3-phospho-choline (DPPC) and Gemini type surfactant IMI_C12 (with dodecyloxy- hydrophobic chain). Series of the SAXS data sets were collected in MaxLab, at the Beam Line I711 at the MAXII storage ring. The data were collected at temperatures from 279 to 303 K for DMPC and from 283 to 318 K for DPPC using the synchrotron radiation (λ=0.107 nm) and the Mar 165 CCD detector. The scattering vector range was 0.05 < s < 3.42 nm-1.
In the Figure 1 are presented the scattering data collected for DMPC/IMI_C12 (left) and DPPC/IMI_C12 (right) mixtures. As expected, in reference samples (pure DMPC or DPPC) the observed curves are typical for lamellar structures. For pure DPPC suspension, the diffraction pattern shows three strong peaks characterized by d001=6.3 nm, d002=3.2 nm and d003=2.1 nm. For low concentration of the surfactant (0.1%, 0.5%) in the system, the corresponding lamellar lattice constant increased up to 6.7 nm.

MAX-lab ACTIVITY REPORT 2010 285
SYNCHROTRON RADIATION – BEAMLINE I711
Presented in the Figure 2 pair distribution functions, calculated for DMPC and DPPC/IMI_C12 systems, also reveal significant differences in size of formulated nanostructures. For example for DPPC/1%IMI_C12 the maximal size (Dmax) was 65 nm and for DPPC/2%IMI_C12 Dmax=58 nm .
Also the temperature range of the main phase transition of DMPC and DPPC was shifted towards lower temperatures. The observed scattering patterns of both phospholipid/surfactant systems are very similar to the SAXS patterns reported for the bicelar DMPC/DHPC systems5. The surfactants studied induce changes of the DPPC and DMPC phase transition temperatures and promote a gradual disappearance of the lamellar phase of DMPC and a probable formation of the bicellar phase
This research was supported in part by research grant (No N N202 248935) from the Ministry of Science and Higher Education (Poland). The data collection (SAXS studies at MaxLab Lund, Sweden) leading to these results has also received funding from the European Community's Seventh Framework Programme (FP7/2007-2013) under grant agreement nº 226716. 1 R. Zana, Advances in Colloid and Interface Science 97 205 (2002). 2 P. Tyagi, R. Tyagi, Tenside Surfactants Detergents 46 373 (2009). 3 S.K. Hait, S.P. Moulik, Current Science 82 1101 (2002). 4 J. Bolze, T. Fujisawa, T. Nagao, K. Norisada, H. Saito, A. Naito, Chem. Phys. Lett. 329, 215 (2000). 5 J. Katsaras, T.A. Harroun, J. Pencer, M.P. Nieh, Naturwissenschaften 92 355 (2005).
With the increased surfactant concentration in the systems (0.5% and 1% IMI_C12) the gradual disappearance of the lamellar structure can be observed. For DMPC/2% IMI_C12 system the SAXS data shows the characteristic broad maximum, which is typical for single bilayers in the absence of stacking4. Similar very broad peak is observed also in scattering patterns of DMPC with 2% concentration of IMI_C12.
The SAXS results implied a gradual disappearance of the lamellar phase typical for DMPC and DPPC and probable formation of the mixed liposomes. In case of DMPC we can notice that the phase change occurs in lower surfactant concentration, so we can that their phase behaviour is more dependent on presence of surfactant IMI_C12.
Figure 2. The pair distribution function calculated for DMPC/IMI_C12 (right) and for DPPC/IMI_C12 (left).

286 MAX-lab ACTIVITY REPORT 2010
SYNCHROTRON RADIATION – BEAMLINE I711
SAXS Studies of Zwitterionic Surfactants Interactions with DMPC
Z. Pietralik1, M. Taube1, A. Kozak2, D. Wieczorek3, R. Zielinski3, M. Kozak1
1Department of Macromolecular Physics, Faculty of Physics, A. Mickiewicz University, ul. Umultowska 85, 61-614 Pozna , Poland;
2Department of Water Protection, Faculty of Biology, A. Mickiewicz University,
ul. Umultowska 89, 61-614 Pozna , Poland;
3Department of Technology and Environmental Protection, Faculty of Commodity Science, Pozna University of Economics, Aleja Niepodleg o ci 10, 60 - 967, Pozna , Poland,
Sulfobetaines (also known as sultaines) are sulphur analogs of betaines. Sulfobetaines with long hydrophobic chains adsorb at charges surfaces in the wide range of pH without forming hydrophobic films. They are also good lime soap dispersants and are widely used in cosmetic formulations. It should be noted, however, that a little skin irritation attributed to sulfobetaines was also reported1.
In this work we studied the effect of two novel zwitterionic surfactants (Figure 1), prepared in our laboratory, with the sulfobetaine structure (4-(N-hexylmorpholine)-1-butansulfonate - HMBS and 4-(N-dodecylmorpholine)-1-butansulfonate - DDMBS), on the stability of the model system of biological membrane based on DMPC.
Figure 1 Chemical structures of 4-(N-dodecylmorpholine)-1-butansulfonate (left) and 4-(N-hexylmorpholine)-1-
butansulfonate (right) The small angle X-ray scattering data were collected on the beam line I7112,3 at the
MAXII storage ring using the synchrotron radiation (λ=0.107 nm). The phospholipid-surfactant mixtures (with molar ratio 100:1, 50:1, 10:1, 5:1 and 3:1) were placed in thermostated flow-cell with quartz capillary. The sample-to-detector distance was 1.76 m, which leads to the scattering vector range 0.1 < s < 3.42 nm-1 (where s=4πsinθ/λ, 2θ was the scattering angle). .The transmission SAXS measurements were performed at temperatures ranging from 279 – 303 K. The background scattering was collected before and after data collection for all samples.

MAX-lab ACTIVITY REPORT 2010 287
SYNCHROTRON RADIATION – BEAMLINE I711
1 M.J. Rosen, Surfactants and Interfacial Phenomena. 3rd ed., John Wiley & Sons Inc., Hoboken, New Jersey (2004). 2 Y. Cerenius, K.Stahl, L.A. Svensson, T. Ursby, A. Oskarsson, J. Albertsson, A. Liljas, J. Synchrotron Rad. 7, 203 (2000). 3 M. Knaapila, C. Svensson, J. Barauskas, M. Zackrisson, S.S. Nielsen, K.N. Toft, B. Vestergaard, L. Arleth, U. Olsson, J.S. Pedersen, Y. Cerenius, J. Synchrotron Rad. 16, 498 (2009). 4 P.V. Konarev, V.V. Volkov, A.V. Sokolova, M.H.J. Koch, D.I. Svergun, J. Appl. Crystallogr. 2003, 36, 1277-1282.
The SAXS data sets were normalized to the incident beam intensity, corrected for detector response and integrated using SAXS data collection and processing software Bli7113. The final scattering curve was obtained after subtraction of the buffer scattering using the program package PRIMUS4.
Figure 2. SAXS data recorded for DMPC/DDMBS systems at 287 K
The zwitterionic sulfobeitaine derivatives interacting with DMPC disrupted the
formation of stable lamellar phases. 4-(N-hexylmorpholine)-1-butansulfonate (HMBS) with shorter hydrophobic group only induced small changes in d-spacing characterising the lamellar phases. The second surfactant - 4-(N-dodecylmorpholine)-1-butansulfonate (DDMBS) promote a formation of the stable cubic Pn3m phase at temperatures below main phase transition of DMPC(in DMPC:DDMBS molar ratio 10:1). For higher concentrations of DDMBS (5:1 and 3:1) probably the bicellar phase is formed. The exemplary scattering curves recorded for DMPC/DDMBS systems are presented in Figure 2. This research was supported in part by research grant (No N N202 248935) from the Ministry of Science and Higher Education (Poland). The data collection (SAXS studies at MaxLab Lund, Sweden) leading to these results has also received funding from the European Community's Seventh Framework Programme (FP7/2007-2013) under grant agreement nº 226716.

288 MAX-lab ACTIVITY REPORT 2010
SYNCHROTRON RADIATION – BEAMLINE I711
1 Institute of Materials Research, Materials Technology, Helmholtz-Zentrum Geesthacht, Max-Planck-
Straße 1, D-21502 Geesthacht, Germany. Email:[email protected]
2 Departament de Física, Universitat Autònoma de Barcelona, 08193 Bellaterra, Spain 3 Interdisciplinary Nanoscience Centre (iNANO) and Department of Chemistry, University of Aarhus,
Langelandsgabe 140, DK-8000. Denmark 4 MAX-lab, Lund University, S-22100 Lund, Sweden
Recently, based on the inspected kinetic effect of the MgB2, Barkhordarian et al.[1] and Vajo et al.[2] reported on the possibility of reversibly store hydrogen in tetrahydroborates when mixed with MgH2. As confirmed by the numerous works published in the last years, this discovery ignited new interest in the tetrahydroborates as potential material for hydrogen storage. In particular, the systems LiBH4-MgH2, Ca(BH4)2-MgH2 and NaBH4-MgH2 have been subject to intensive investigations. Among these mixed hydride systems NaBH4-MgH2 in the molar ratio of 2NaBH4/MgH2 is considered as a model system for the study of the hydrogen sorption properties. This system is expected to reversibly exchange an amount of hydrogen equal to 7.8 wt.% according to the following reaction: 2NaBH4+MgH2 ↔ 2NaH+MgB2+4H2. The overall reaction enthalpy for this reaction is calculated to be 62 kJmol-1H2.[3] This enthalpy value entails for the system 2NaBH4+MgH2 an equilibrium hydrogen pressure of 1 bar at 350°C. Lately, the reaction mechanism of the hydrogen absorption for the composition 2NaBH4/MgH2 has been investigated in detail.[3, 4] It was reported that the reaction paths of the hydrogen absorption take place in several single steps. Hereunder the hydrogenation reaction for the composition 0.5NaBH4/MgH2 is described. The measurement was carried out at 50 bar of hydrogen pressure, in scanning temperature from RT to 350 °C and than keeping the system under isothermal conditions at 350 °C for several hours (Figure 1). During heating at roughly 230 °C the appearance of an unknown crystalline phase is observed. Later on at 270 °C the appearance of this phase is followed by the formation of NaMgH3. With the appearance of the NaMgH3 phase the NaH phase disappears completely. At 325 °C the formation of NaBH4 and little later of MgH2 is observed together with the simultaneous disappearance of both the NaMgH3 and the unknown crystalline phase. In contrast to the system 2NaH/MgB2 [3] the system 0.5NaH/MgB2 (figure 1) does not show the formation of an amorphous background. In addition, for the composition 0.5NaH/MgB2 the formation of MgH2 was achieved.
Effect of NaH/MgB2 ratio on the absorption kinetics of the system NaH-
MgB2 Claudio Pistidda1, Gagik Barkhordarian1, Christian Bonatto Minella1, Sebastiano
Garroni2, K. Suarez1, I. Saldan1, Torben R. Jensen3, Yngve Cerenius4, Thomas
Klassen1, Rüdiger Bormann1, Martin Dornheim1.

MAX-lab ACTIVITY REPORT 2010 289
SYNCHROTRON RADIATION – BEAMLINE I711
This work shows that in situ SR-PXD at variable temperatures and gas pressures is a powerful tool for studying gas/solid reactions. These investigations prove the dependency of the hydrogen absorption reaction in the NaBH4-MgH2 on the NaBH4/MgH2 ratio and help to reveal the reaction mechanisms in these new and rather complex class of hydrogen storage materials.
References [1] G. Barkhordarian, T. Klassen, R. Bormann, Internetional patent pending ed., WO
2006/063627 A1. [2] J. J. Vajo, S. L. Skeith, F. Mertens, Journal of Physical Chemistry B 2005, 109,
3719. [3] C. Pistidda, S. Garroni, C. B. Minella, F. Dolci, T. R. Jensen, P. Nolis, U.
Bosenberg, Y. Cerenius, W. Lohstroh, M. Fichtner, M. D. Baro, R. Bormann, M. Dornheim, Journal of Physical Chemistry C, 114, 21816.
[4] S. Garroni, C. Pistidda, M. Brunelli, G. B. M. Vaughan, S. Surinach, M. D. Baro, Scripta Materialia 2009, 60, 1129.
Figure 1: Series of SR-PXD patterns of the 2NaH+MgB2 system heated at 50 bar hydrogen pressure from RT to 350 °C and kept under isothermal condition (5 °C/min, wavelength = 1.097 Å).

290 MAX-lab ACTIVITY REPORT 2010
SYNCHROTRON RADIATION – BEAMLINE I711
The world today is facing increasing energy demands and a simultaneous demand for cleaner and more environmentally friendly energy technologies. Hydrogen is recognized as a possible renewable energy carrier, however its large-scale utilization is mainly hampered by insufficient hydrogen storage capabilities.1 Complex metal hydrides, such as metal borohydrides, is an interesting class of materials for hydrogen storage, since they exhibit high gravimetric hydrogen densities and a variety of decomposition temperatures. Unfortunately, no single material has yet been found, which fulfil all the criteria for mobile hydrogen storage.2 Therefore, there is an urgent need for discovery and studies of novel classes of materials, such as transition metal-based or mixed metal borohydrides as potential future hydrogen storage materials. The past few years have seen a significant increase in the number of new borohydrides and of experimental and theoretical studies on their structural and solid-state chemistry.3,4 In our lab we have synthesized and characterized a wide range of novel borohydride materials based on alkali metals and alkali earth or transition metals e.g. MZn2(BH4)5 (M = Li or Na), NaZn(BH4)3, KZn(BH4)Cl2, Y(BH4)3, NaY(BH4)2Cl2 and MSc(BH4)4 (M = Na or K).5-10 Here, we will show selected results from in situ SR-PXD studies on KSc(BH4)4.8 Samples were prepared from KBH4 and ScCl3 mixed in molar ratios of 2:1, 3:1 and 4:1 and ball milled for 120 min under argon atmosphere. In-situ time-resolved SR-PXD was measured at the MAX II Synchrotron in Lund, Sweden, at Beamline I711 using a MAR165 CCD detector system.11 Samples were mounted in sapphire single-crystal tubes (1.09 mm o.d., 0.79 mm i.d., Al2O3), which were attached on a specially designed sample cell for studies of gas/solid reactions at elevated temperature and pressure. The temperature was controlled with a thermocouple placed in the sapphire tube next to the sample.12 All sample handling was perform in an argon-filled glove box (p(O2, H2O) < 0.3 ppm). The selected wavelength was 1.097 Å and the X-ray exposure time was 30 s per powder diffraction pattern. The FIT2D program was used to transform raw data to powder patterns. After synthesis the KBH4-ScCl3 samples all contain two sets of unidentified Bragg peaks. One of these is assigned to a new metal borohydride, KSc(BH4)4, and the other to a new ternary potassium
Fig. 1 In situ synchrotron radiation powder X-ray diffraction measured for KBH4-ScCl3 (2:1) heated from RT to 770 K
with a heating rate of 7 K/min and p(H2) 2.5 bar ( = 1.097 Å). Only peaks which are at least partly resolved are marked by
the symbols: KSc(BH4)4, | K3ScCl6, O KBH4, and KCl.
Novel metal borohydrides: Studies of synthesis, crystal chemistry and thermal decomposition
D. B. Ravnsbæk1 and T. R. Jensen1
1 Center for Materials Crystallography, Interdisciplinary Nanoscience Center (iNANO) and
Department of Chemistry, University of Aarhus, Denmark
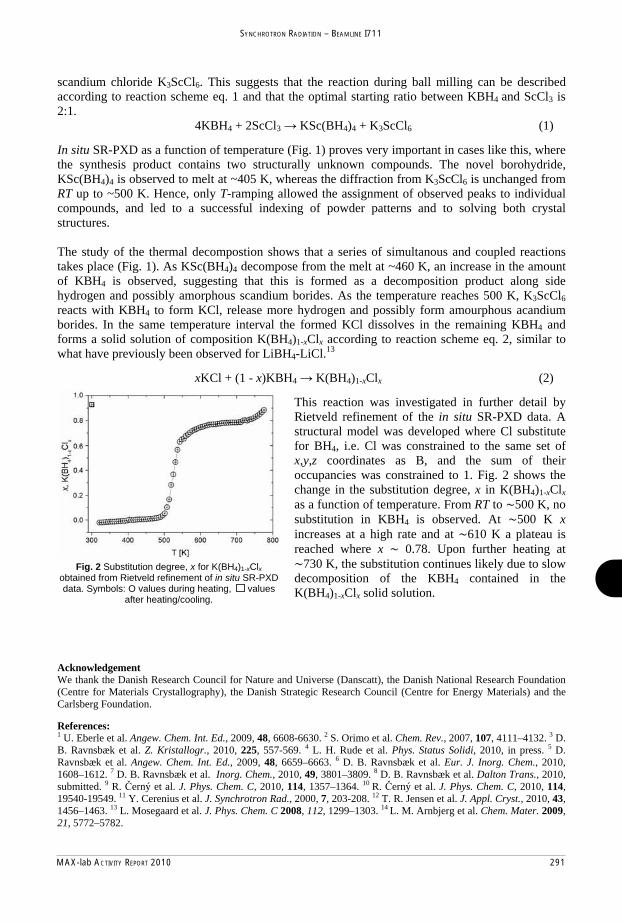
MAX-lab ACTIVITY REPORT 2010 291
SYNCHROTRON RADIATION – BEAMLINE I711
Acknowledgement We thank the Danish Research Council for Nature and Universe (Danscatt), the Danish National Research Foundation (Centre for Materials Crystallography), the Danish Strategic Research Council (Centre for Energy Materials) and the Carlsberg Foundation. References: 1 U. Eberle et al. Angew. Chem. Int. Ed., 2009, 48, 6608-6630. 2 S. Orimo et al. Chem. Rev., 2007, 107, 4111–4132. 3 D. B. Ravnsbæk et al. Z. Kristallogr., 2010, 225, 557-569. 4 L. H. Rude et al. Phys. Status Solidi, 2010, in press. 5 D. Ravnsbæk et al. Angew. Chem. Int. Ed., 2009, 48, 6659–6663. 6 D. B. Ravnsbæk et al. Eur. J. Inorg. Chem., 2010, 1608–1612. 7 D. B. Ravnsbæk et al. Inorg. Chem., 2010, 49, 3801–3809. 8 D. B. Ravnsbæk et al. Dalton Trans., 2010, submitted. 9 R. erný et al. J. Phys. Chem. C, 2010, 114, 1357–1364. 10 R. erný et al. J. Phys. Chem. C, 2010, 114, 19540-19549. 11 Y. Cerenius et al. J. Synchrotron Rad., 2000, 7, 203-208. 12 T. R. Jensen et al. J. Appl. Cryst., 2010, 43, 1456–1463. 13 L. Mosegaard et al. J. Phys. Chem. C 2008, 112, 1299–1303. 14 L. M. Arnbjerg et al. Chem. Mater. 2009, 21, 5772–5782.
scandium chloride K3ScCl6. This suggests that the reaction during ball milling can be described according to reaction scheme eq. 1 and that the optimal starting ratio between KBH4 and ScCl3 is 2:1. 4KBH4 + 2ScCl3 KSc(BH4)4 + K3ScCl6 (1) In situ SR-PXD as a function of temperature (Fig. 1) proves very important in cases like this, where the synthesis product contains two structurally unknown compounds. The novel borohydride, KSc(BH4)4 is observed to melt at ~405 K, whereas the diffraction from K3ScCl6 is unchanged from RT up to ~500 K. Hence, only T-ramping allowed the assignment of observed peaks to individual compounds, and led to a successful indexing of powder patterns and to solving both crystal structures. The study of the thermal decompostion shows that a series of simultanous and coupled reactions takes place (Fig. 1). As KSc(BH4)4 decompose from the melt at ~460 K, an increase in the amount of KBH4 is observed, suggesting that this is formed as a decomposition product along side hydrogen and possibly amorphous scandium borides. As the temperature reaches 500 K, K3ScCl6 reacts with KBH4 to form KCl, release more hydrogen and possibly form amourphous acandium borides. In the same temperature interval the formed KCl dissolves in the remaining KBH4 and forms a solid solution of composition K(BH4)1-xClx according to reaction scheme eq. 2, similar to what have previously been observed for LiBH4-LiCl.13
xKCl + (1 - x)KBH4 K(BH4)1-xClx (2) This reaction was investigated in further detail by Rietveld refinement of the in situ SR-PXD data. A structural model was developed where Cl substitute for BH4, i.e. Cl was constrained to the same set of x,y,z coordinates as B, and the sum of their occupancies was constrained to 1. Fig. 2 shows the change in the substitution degree, x in K(BH4)1-xClx as a function of temperature. From RT to 500 K, no substitution in KBH4 is observed. At 500 K x increases at a high rate and at 610 K a plateau is reached where x 0.78. Upon further heating at
730 K, the substitution continues likely due to slow decomposition of the KBH4 contained in the K(BH4)1-xClx solid solution.
Fig. 2 Substitution degree, x for K(BH4)1-xClx obtained from Rietveld refinement of in situ SR-PXD data. Symbols: O values during heating, values
after heating/cooling.
292 MAX-lab ACTIVITY REPORT 2010
SYNCHROTRON RADIATION – BEAMLINE I711
Tailoring the properties of lithium tetrahydridoboranate by anion substitution.
Line H. Rude,1 Lene M. Arnbjerg,1 Yngve Cerenius,2 and Torben R. Jensen1
1 iNANO and Department of Chemistry, University of Aarhus, Denmark 2 MAX-lab, Lund University, S-22100 Lund, Sweden
Borohydrides are considered interesting materials for hydrogen storage in mobile applications due to their theoretical high hydrogen content, 1,2 e.g. 18.5 weight percent (wt.%) for lithium tetrahydridoboranate, LiBH4. Unfortunately, the borohydrides are either too stable or unstable for practical hydrogen storage systems. LiBH4 release hydrogen at a temperature of 410 °C (p(H2) = 1 bar) but the system can be modified by adding suitable compounds,3 e.g. SiO2, TiF3 or TiCl3, or by substitution of ions aiming to destabilize the structure.4
The aim for this investigation is to alter the properties of LiBH4 by substitution of the anion BH4¯ with Br¯ in LiBH4 which is feasible due to the similar size in radii.5 The substitution is explored by in situ synchrotron radiation powder X-ray diffraction (SR-PXD) and by differential scanning calorimetry (DSC) on a sample of LiBH4 + LiBr (1:1) synthesized by a mechano-chemical method, e.g. ballmilling for 2 hours effectively.
In situ time-resolved SR-PXD data was measured at the MAXII synchrotron beamline I711 at MAX-lab, Lund, Sweeden ( = 1.07200 Å) with a MAR165 CCD detector system.6 The samples were mounted in sapphire single crystal tubes (1.09 mm o.d., 0.79 mm i.d., Al2O3) in an argon filled glovebox (p(O2, H2O) < 0.5 ppm). The sample holder was constructed so that hydrogen pressures from vacuum up to 200 bar and temperatures from RT to 800 °C can be used during the experiment.7 The system was flushed with argon and evacuated three times before the valve to the sample was opened prior to the X-ray experiment. The X-ray exposure time was 30-60 s per powder diffraction pattern. This in situ SR-PXD experiment was conducted with a constant hydrogen pressure of p(H2) = 1 bar and with a steadily increasing temperature (rate of 5 °C/min) from RT-427 °C.
Differential scanning calorimetry (DSC) and thermogravimetric analysis (TGA) was measured simultaneously with a Netzsch STA449C Jupiter instrument at heating rate of v = 2.0 °C/min from RT to 420 °C in a flow of He (50 mL/min). The samples were mounted in Al2O3 crucibles.
The in situ SR-PXD-data of a sample of LiBH4 + LiBr ballmilled in the ratio 1 : 1 and preheated to 245 °C for 3 days is shown in Figure 1 in the temperature range RT – 420 °C. There is no indication of substitution at RT. At 300 °C the substitution of LiBr initializes and the intensity of LiBr decreases. At 360 °C a reaction of LiBr with the h-LiBH4 phase is observed with the formation of a new hexagonal structure, denoted Li(BH4)1-xBrx. The new phase must consist of an approx. equal amount of Br and BH4 anions since the LiBr diffraction disappears with the formation of the Li(BH4)1-xBrx phase.

MAX-lab ACTIVITY REPORT 2010 293
SYNCHROTRON RADIATION – BEAMLINE I711
Further experiments with TGA and DSC reveals a stabilization of the hexagonal phase of LiBH4 by approximately 90 °C altering the melting point of LiBH4 at T = 286 °C (pure LiBH4) to T = 378 °C (Li(BH4)1-xBrx), see Figure 2. However, the stabilization of the hexagonal phase has no apparent impact on the hydrogen release temperature determined by sieverts measurements to be unchanged (not shown here).
The next step will be the investigation of the reversibility of the material upon hydrogen release and uptake.
Aknowledgements
The European Commission (contract NMP-2008-261/FLYHY) and the Danish Natural Science Research Council (DanScatt program) is thanked for financial support.
References
(1) Eberle, U.; Felderhoff, M.; Schüth, F. Angew. Chem. Int. Ed. 2009, 48, 6608-6630. (2) Schlapbach, L.; Zuttel, A. Nature 2001, 414, 353–8. (3) Mosegaard, L.; Moller, B.; Jorgensen, J.; Filinchuk, Y.; Cerenius, Y.; Hanson, J. C.; Dimasi,
E.; Besenbacher, F.; Jensen, T. R. J. Phys. Chem. C 2008, 112, 1299-1303. (4) Arnbjerg, L. M.; Ravnsbæk, D. B.; Filinchuk, Y.; Vang, R. T.; Cerenius, Y.; Besenbacher, F.;
Jørgensen, J.; Jakobsen, H. J.; Jensen, T. R. Chem. Mater. 2009, 21, 5772-5782. (5) Filinchuk, Y.; Hagemann, H. Eur. J. Inorg. Chem. 2008, 2008, 3127-3133. (6) Cerenius, Y.; Stahl, K.; Svensson, L. A.; Ursby, T.; Oskarsson, A.; Albertsson, J.; Liljas, A.
J. Synchrotron Radiat. 2000, 7, 203–208. (7) Mosegaard, L.; Møller, B.; Jørgensen, J.; Bösenberg, U.; Dornheim, M.; Hanson, J. C.;
Cerenius, Y.; Walker, G.; Jakobsen, H. J.; Besenbacher, F.; Jensen, T. R. J. Alloys Compd. 2007, 446-447, 301-305.
Figure 1 In situ SR-PXD on LiBH4 + LiBr (1:1) preheated to 245 °C for 3 days, sample S4. The sample was heated from RT to 427 °C with a heating rate of 5 °C/min ( = 1.07200 Å). Symbols: the crosses (X) represents the LiBr; the filled squares ( ) represents h-LiBH4; the empty diamonds ( ) represents the new phase, Li(BH4)1-
xBrx. At T 185 °C the beam was cut for a minute. At T 420 °C no crystalline materials was left in the sample due to melting.
Figure 2 Differential scanning calorimetry shown in the temperature range from 60 to 400 °C. The reference sample of LiBH4 is represented with a broken line and the sample of LiBH4 + LiBr (1 : 1), S3, is represented by the solid line.

294 MAX-lab ACTIVITY REPORT 2010
SYNCHROTRON RADIATION – BEAMLINE I711
Hydrogen absorption and desorption properties of ScNiAl, a novel material for hydrogen storage
Martin Sahlberg1*, Adam Sobkowiak1, Jonas Ångström1, Thomas Kollin Nielsen2, Yngve Cerenius3 and Torben R. Jensen2
The potential use of hydrogen as energy carrier in carbon-free energy systems have been extensively studied in the past 20 years. Due to promising properties, such as high capacities and good reversibility, metal hydrides are claimed to be among the most suitable hydrogen storage materials and considerable research efforts have been devoted to these compounds[1]. Scandium is interesting from a fundamental point of view by combining the rare-earth-metal properties with a low weight. Many scandium-based alloys, such as Mg0.65Sc0.35 [2-3] and ScAl1-xMgx [4], have shown promising hydrogen storage properties. ScNiAl crystallises in the hexagonal MgZn2-type structure, P63/mmc [5], and here we present this compound as a hydrogen storage material. In situ synchrotron radiation powder X-ray diffraction (SR-XRD) measurements were performed at the MAX-II synchrotron in Lund, Sweden, using the instrument at beamline I711 [6]. The wavelength was determined to be = 0.94608 Å. A Mar165 CCD detector was used for intensity measurement of the diffracted beams. The X-ray exposure was 30 s/scan. The sample holder consisted of a single crystal sapphire tube connected to a vacuum pump and pressurized hydrogen gas source, due to X-ray absorption problems the sample was placed in a thinner capillary inside the sapphire tube. The sample was heated by resistive heating (tungsten wire) and the temperature was measured with a thermocouple placed inside the sapphire tube. ScNiAl was hydrogenated in situ at 5 MPa and a linear temperature increase of 5 °C/min up to 180 °C, the temperature was then kept constant at 180 °C for the rest of the experiment. In situ SR-XRD showed that ScNiAl absorbs hydrogen at temperatures below 180 °C, shown in Figure 1. Hydrogen absorption started at ~140 °C. After hydrogenation the pressure was released to vacuum whereupon the material instantly desorbed virtually all the hydrogen. A second hydrogenation cycle was performed by resetting the hydrogen pressure to 5 MPa followed by another release to vacuum. No significant changes of the hydrogen absorption behaviour could be seen during cycling.
1Department of Materials Chemistry, Uppsala University, Uppsala Sweden 2 Center for Energy Materials, Interdisciplinary Nanoscience Center (iNANO) and Department of Chemistry, University of Århus, Aarhus C, Denmark 3MAX-lab, Lund University, S-22100 Lund, Sweden * Fax: +4618513548, E-mail: [email protected]
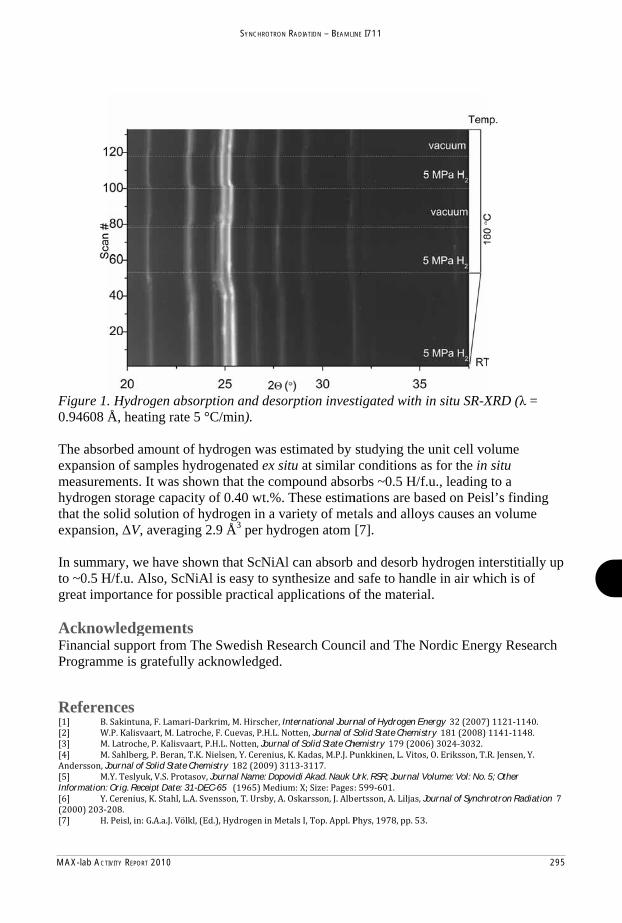
MAX-lab ACTIVITY REPORT 2010 295
SYNCHROTRON RADIATION – BEAMLINE I711
AckFinanProgr
Refe
Informa
nowledgemncial supportramme is gra
erences
Journal of So
ation: Orig. Receip
ments t from The Satefully ackn
olid State ChemistrJou
pt Date: 31-DEC-6
Swedish Resnowledged.
In
Journa
ry urnal Name: Dopo65
earch Counc
nternational JournJournal of S
l of Solid State Ch
ovidi Akad. Nauk U
cil and The N
nal of Hydrogen ESolid State Chemi
hemistry
Urk. RSR; Journal
Nordic Ener
Energy istry
Volume: Vol: No.
Journal of Synchr
rgy Research
5; Other
rotron Radiation
h
Figur0.946 The aexpanmeashydrothat texpan In sumto ~0great
re 1. Hydrog608 Å, heatin
absorbed amnsion of samurements. Itogen storagehe solid solunsion, V, av
mmary, we h0.5 H/f.u. Als
importance
gen absorpting rate 5 °C/
mount of hydrmples hydrogt was shown e capacity ofution of hydrveraging 2.9
have shown so, ScNiAl ifor possible
on and deso/min).
rogen was esgenated ex si
that the comf 0.40 wt.%.rogen in a va9 Å3 per hyd
that ScNiAls easy to syn
e practical ap
orption inves
stimated byitu at similarmpound abso
These estimariety of metrogen atom
l can absorb nthesize andpplications o
stigated with
studying ther conditions aorbs ~0.5 H/f
mations are btals and allo[7].
and desorb d safe to handof the materi
h in situ SR-X
e unit cell voas for the in f.u., leading ased on Peis
oys causes an
hydrogen indle in air whal.
XRD ( =
olume situ to a
sl’s finding n volume
nterstitially uhich is of
up

296 MAX-lab ACTIVITY REPORT 2010
SYNCHROTRON RADIATION – BEAMLINE I711
When do Water-Insoluble Polyion-Surfactant Ion Complex Salts
"Redissolve" by Added Excess Surfactant?
Salomé dos Santos, Charlotte Gustavsson, Christian Gudmundsson, Per Linse,
and Lennart Piculell
Division of Physical Chemistry, Department of Chemistry, Lund University, P.O. Box
124, SE-22100 Lund, Sweden
Oppositely charged polymer-surfactant systems are used as rheology modifiers, gelling agents, colloidal stabilizers and surface deposition agents in a wide range of applied contexts, including pharmaceutics, foods, personal care products and waste water treatment [1-7]. The fundamental feature of the system that is utilized in all these contexts is the strong attraction between the charged polyions and the oppositely charged surfactant ion aggregates, both containing multiple charges, which leads to extensive association in the system. Obviously, an essential property to control is the phase behaviour of the mixture. Typically, a concentrated polyion-surfactant ion phase separates out under mixing conditions when a stoichiometric, neutral polyion-surfactant ion complex is formed. However, the situation for off-stoichiometric mixtures may vary widely, depending on the system, as will be amply exemplified below. Certain off-stoichiometric systems produce single-phase solutions, whereas other systems remain phase separated at practically all mixing ratios. These differences are widely utilized. In some applications off-stoichiometric single-phase solutions are desired, for instance in the form of highly viscous physical networks. Under other circumstances one may want a complex that remains insoluble, for instance as a surface coating, for wide variations of the system composition. Indeed, important applications, such as hair care products or laundry detergents, use formulations that effectively switch from one-phase mixtures to phase-separated mixtures by a simple operation such as a dilution of the system [6]. Typically, the initial one-phase formulation in the latter applications contains a large excess of surfactant. The above background serves to justify why the present study focuses on the phenomenon that we will refer to as "surfactant redissolution", that is, when the addition an excess of surfactant to an associatively phase-separated stoichiometric polyion-surfactant ion complex leads to its transformation into a single-phase solution. As we have indicated, the capability for the surfactant to redissolve the complex varies greatly from system to system, but the underlying physics is poorly understood. The ability to understand and control this variation is of considerable interest for applications, such as those mentioned above. The phase behaviour of polymer-surfactant mixtures is also a problem of fundamental importance in polymer and colloid science. The purpose of the work presented here was to gain further insight in the phenomenology and the mechanism of surfactant redissolution. We have in this study determined additional phase diagrams for mixtures of complex salt containing linear polyions based on polyacrylate that are either very long or very short homopolyions, or long copolyions (PA--co-NIPAM or PA--co-DAM, containing N-isopropylacrylamide or N,N-dimethylacrylamide comonomers, respectively), in mixtures with CnTAX
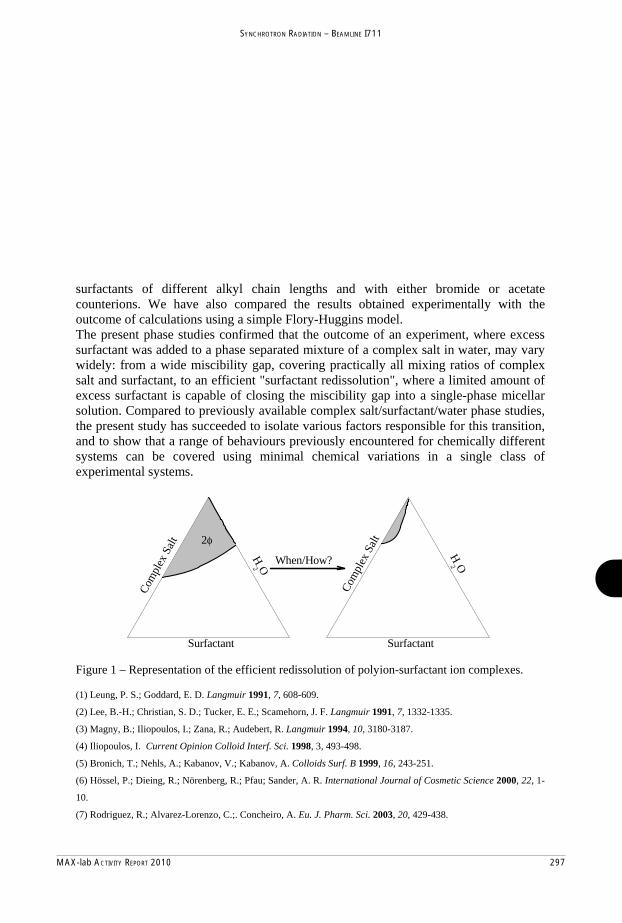
MAX-lab ACTIVITY REPORT 2010 297
SYNCHROTRON RADIATION – BEAMLINE I711
surfactants of different alkyl chain lengths and with either bromide or acetate counterions. We have also compared the results obtained experimentally with the outcome of calculations using a simple Flory-Huggins model. The present phase studies confirmed that the outcome of an experiment, where excess surfactant was added to a phase separated mixture of a complex salt in water, may vary widely: from a wide miscibility gap, covering practically all mixing ratios of complex salt and surfactant, to an efficient "surfactant redissolution", where a limited amount of excess surfactant is capable of closing the miscibility gap into a single-phase micellar solution. Compared to previously available complex salt/surfactant/water phase studies, the present study has succeeded to isolate various factors responsible for this transition, and to show that a range of behaviours previously encountered for chemically different systems can be covered using minimal chemical variations in a single class of experimental systems.
H2 O
Com
plex
Salt
Surfactant
H2 O
Com
plex
Salt
Surfactant
2φ
When/How?
Figure 1 – Representation of the efficient redissolution of polyion-surfactant ion complexes. (1) Leung, P. S.; Goddard, E. D. Langmuir 1991, 7, 608-609.
(2) Lee, B.-H.; Christian, S. D.; Tucker, E. E.; Scamehorn, J. F. Langmuir 1991, 7, 1332-1335.
(3) Magny, B.; Iliopoulos, I.; Zana, R.; Audebert, R. Langmuir 1994, 10, 3180-3187.
(4) Iliopoulos, I. Current Opinion Colloid Interf. Sci. 1998, 3, 493-498.
(5) Bronich, T.; Nehls, A.; Kabanov, V.; Kabanov, A. Colloids Surf. B 1999, 16, 243-251.
(6) Hössel, P.; Dieing, R.; Nörenberg, R.; Pfau; Sander, A. R. International Journal of Cosmetic Science 2000, 22, 1-
10.
(7) Rodriguez, R.; Alvarez-Lorenzo, C.;. Concheiro, A. Eu. J. Pharm. Sci. 2003, 20, 429-438.

298 MAX-lab ACTIVITY REPORT 2010
SYNCHROTRON RADIATION – BEAMLINE I711
Phase diagrams come alive: understanding how to create, destroy or
change ordered surfactant structures by polymerization reactions
Salomé dos Santos1, Lennart Piculell1, Ola J. Karlsson1, and M. Graça
Miguel2
1 Division of Physical Chemistry, Center for Chemistry and Chemical Engineering,
Lund University, P.O.Box 124, SE-22100 Lund, Sweden 2 Chemistry Department, University of Coimbra, 3004-535 Coimbra, Portugal
There is a strong and long-standing interest in concentrated associating polymer-surfactant mixtures. The associative phase separation that gives rise to concentrated mixtures in aqueous polymer-surfactant systems of opposite charge is particularly well documented1-8. Owing to the self-association of the surfactant component, the concentrated phases that separate out from such mixtures often feature ordered liquid crystalline structures5,6,9-14. Important applications that stimulate the research on concentrated associating polymer-surfactant mixtures include templating for preparation of mesoporous ordered materials, surface deposition of concentrated polymer-surfactant layers, and the creation of soft structured particles15-18. Materials based on associating polymer-surfactant pairs can differ in structure, water uptake and mechanical properties depending on factors such as the lengths of the polymer and surfactant chains and the overall compositions. The materials can be produced using different routes, e.g. chemical synthesis, sequential addition of components, dilution and simple mixing. An important question is to what extent different routes of preparation give the same results, indicating that the systems have reached equilibrium. Of particular concern here are systems produced by polymerization reactions. Most approaches to polymerization reactions in surfactant systems so far seems to have been based on trial and error, and the resulting structures have often been found to be different from the original surfactant template19,20. That is, polymerization changes the equilibrium structure of system. One reason for such changes is the development of a repulsive depletion interaction between the formed polymers and the surfactant aggregates19. In fact, not much attention has been given to the fact that, as it happens for silica and its templates in hard mesoporous materials, the interaction between the different components in the system should be attractive in order to create long-ranged ordered structures containing polymer and surfactant21. The situation is further complicated since many systems, and certainly inorganic mesoporous materials, become kinetically arrested at some point during the polymerization. Specifically, equilibrium phase diagrams have been established for associating polymer-surfactant systems involving aqueous cationic alkyltrimethylammonium surfactant ions with two different counterions (C16TAAc, C12TAAc and C16TABr) (Ac=acetate) mixed with the respective complex salts C16TAPA30, C16TAPA6000 and C12TAPA30, C12TAPA6000 (PA=polyacrylate)22,23,24. In the complex salts, the counterions to the surfactant ions were polyacrylate polyions of either very high or very low degrees of polymerization (25, 30 or 6000). Interestingly, the obtained ternary phase diagrams illustrate what happens, at equilibrium, when monomeric counterions to the surfactant are gradually replaced by polymeric counterions - a process closely analogous to a polymerization reaction. In the present work, we built on and extended our previous studies by investigating

MAX-lab ACTIVITY REPORT 2010 299
SYNCHROTRON RADIATION – BEAMLINE I711
1 K. Thalberg, B. Lindman, G. Karlström, J. Phys. Chem., 1991, 95, 6004-6011. 2 K. Thalberg, B. Lindman, K. Bergfeldt, Langmuir, 1991, 7, 2893-2898. 3 J. O. Carnali, Langmuir 1993, 9, 2933-2941. 4 S. Ranganathan and J. C. T. Kwak, Langmuir, 1996, 12, 1381-1390. 5 P. Ilekti, L. Piculell, F. Tournilhac, and B. Cabane, J. Phys. Chem. B, 1998, 102, 344. 6 L. Piculell, B. Lindman and G. Karlström, in Polymer-Surfactant Systems (J. C. T. Kwak, ed.), Marcel Dekker,
New York, 1998, Chapter 3, pp. 65-141. 7 P. Ilekti, T. Martin, B. Cabane and L. Piculell, J. Phys. Chem. B, 1999, 103, 9831-9840. 8 R Dias, S Mel’nikov, B Lindman and M da Graça Miguel, Langmuir, 2000, 16, 9577-9583. 9 Yu. V. Khandurina, V. L. Alexeev, G. A. Evmenenko, A. T. Dembo, V. B. Rogacheva and A. B. Zezin, J. Phys. II
France, 1995, 5, 337-342. 10 H. Okuzaki, Y. Osada, Macromolecules, 1995, 28, 380-382. 11 F. Yeh, E. L. Sokolov, A. R. Khokhlov and B. Chu, J. Am. Chem. Soc., 1996, 118, 6615-6618. 12 S. Zhou, F. Yeh, C. Burger and B. Chu, J. Phys. Chem., 1999, 103, 2107-2112. 13 J. Merta, M. Torkkeli, T. Ikonen, R. Serimaa and P. Stenius, Macromolecules, 2001, 34, 2937-3946. 14 K. Kogej, E. Theunissen and H. Reynaers, Langmuir, 2002, 18, 8799-8805. 15 R. Atluri, Y. Sakamoto and A. E. Garcia-Bennett, Langmuir, 2009, 25 3189-3195. 16 O. Santos, E. S. Johnson, T. Nylander, R. K. Panandiker, M. R. Sivik and L. Piculell, Langmuir, 2010, 26, 9357-
9367. 17 A. V. Svensson, L. Huang, E. Johnson, T. Nylander and Lennart Piculell, Appl Mater Interfaces, 2009, 11, 2431-
2442. 18 G. Nizri, A. Makarsky, S. Magdassi and Y. Talmon, Langmuir, 2009, 25, 1980-1985. 19 M. Antonietti, C. Göltner and H.-P. Hentze, Langmuir, 1998, 14, 2670. 20 H.-P. Hentze and E. W. Kaler, Curr. Opin. Colloid. Interf. Sci., 2003, 8, 164. 21 L. Piculell, A. Svensson, J. Norrman, J. S. Bernardes, L. Karlsson and W. Loh, Pure Appl. Chem. 2007, 79, 1419-
1434. 22 A. Svensson, L. Piculell, B. Cabane and P. Ilekti, J. Phys. Chem. B, 2002, 106, 1013. 23 A. Svensson, J. Norrman and L. Piculell, J. Phys. Chem. B, 2006, 110,10332-10340. 24 S. dos Santos, C. Gustavsson, C. Gudmundsson, P. Linse and L. Piculell, Langmuir 2011, 27, 592-603.
polymerization reactions in systems of similar minimum complexity, by the use of alkyltrimethylammonium surfactants with polymerizable acrylate counterions. Two aspects made our approach to polymerization in surfactant media unique: i) it is based on our a priori knowledge of the phase behavior of ionic surfactants with monomeric versus polymeric counterions and ii) the synthesis was done under conditions where the surfactant aggregates are the sole counterions to the growing polyion chains. The latter is a strong constraint for the structure resulting from the polymerization. The present investigation indeed showed that the results of the polymerization reactions were predicted by the relevant equilibrium phase diagrams. The results also indicate general principles relevant for more complex systems, such as mesoporous silicates.
1,2,3 - Polymerization Routes
3
2
Hex
CubMic H
2 O
C 16TA
PA30
C16TAAc
Cub+Aq
Mic+Mic
1
0,00 0,09 0,18 0,27 0,36 0,45
0 5 10 15 20 250.0000
0.0005
0.0010
0.0015
0.0020
0.0025
(q/2
π)2
(h2+k2+l2)
1
Inte
nsity
(a.u
.)
q (Å-1)
Concentrated Phase
241/2221/2211/2201/2
181/2171/2161/2
121/2101/281/2
61/251/2
41/2
21/2
Figure 1 – Left: equilibrium phase diagram of C16TAPA30/C16TAAc/H2O; Right: SAXS profiles of a micellar phase (bottom profile - before reaction) and a cubic phase (top profile – after reaction) of a two phase sample, ascribed as pathway number 1 in the left figure.

300 MAX-lab ACTIVITY REPORT 2010
SYNCHROTRON RADIATION – BEAMLINE I711
Investigation of the hydrogen reaction mechanism in CaF2+3CaH2+4 MgB2 composites
Karina Suarez1, I. Saldan1, C. Pistidda1, Christian Bonatto Minella1, Torben R. Jensen3, Yngve
Cerenius4, Thomas Klassen1, Rüdiger Bormann1, Martin Dornheim1.
1 Institute of Materials Research, Materials Technology, Helmholtz-Zentrum Geesthacht, Max-Planck-Straße
1, D-21502 Geesthacht, Germany. Email: [email protected]
3 Interdisciplinary Nanoscience Centre (iNANO) and Department of Chemistry, University of Aarhus,
Langelandsgabe 140, DK-8000. Denmark 4 MAX-lab, Lund University, S-22100 Lund, Sweden
The reactive hydride composite (RHC) CaF2+3CaH2+4MgB2 was selected to perform synchrotron radiation powder X-ray diffraction (SR-PXD, beamline I711) experiments during the first cycle of hydrogenation/ dehydrogenation. These experiments are suitable to investigate the reaction pathways and structural features of RHC for hydrogen storage. In the hydrogenation setup, the sample was heated at 5 K min-1 from room temperature to 350°C and kept isothermal for 4 hours under 130bar of hydrogen pressure. For dehydrogenation reaction, a previously hydrogenated sample was heated at 5 K min-1 from room temperature to 350°C and kept isothermal for 1 hour under dynamic vacuum. Figure 1 presents the characterization of the first hydrogenation of CaF2+3CaH2+4MgB2 RHC. The peaks observed at room temperature correspond to the raw materials CaF2, CaH2 and MgB2 in addition to an unidentified peak at 3.09 Å -1. The first change observed with heating is the increase of peak intensity due to recrystallization or coarsening of the micro/nano-particles. It is particularly clear for CaF2. The evolution of two unidentified peaks at 1.56 Å -1 and 2.55 Å -1 was observed at 280°C. As the temperature increased, these peaks shifted to higher q [Å -1] values and two changes in intensity were observed in those peaks. The first of them was an increase in peak intensity as the temperature reaches 350°C and then a decrease in peak intensity until a complete depletion after some time under isothermal (350°C) conditions. Those peaks suggest the formation of reaction intermediaries, however none of the proposed intermediates or phase changes for the hydrogenation/ dehydrogenation reactions in the related Ca(BH4)2 [1, 2, 3, 4, 5, 6] or Ca(BH4)2 + MgB2 [2] composites fit them. The formation of - Ca(BH4)2 phase started at 300°C as indicated by the most clear peak at 1.27 Å -1. As indicated by SR-PXD patterns the hydrogenation products show a complex mixture of phases. In addition to the identified products MgH2 and - Ca(BH4)2, there was the formation of unidentified phase(s) with peak positions at 1.68, 1.90, 2.28, 2.53, 2.83, 3.36 and 3.52 Å -1; most of them disappeared after cooling. The subsequent dehydrogenation reaction is presented in Figure 2. At room temperature it can be observed the predominance of - Ca(BH4)2, MgH2, unreacted CaF2 and unidentified peak at 1.60 Å -1. At about 140°C the to Ca(BH4)2 phase transition is observed. At about 275°C, subtle changes in the peak intensity of Ca(BH4)2 phases occur indicating the beginning of the dehydrogenation reaction. The Ca(BH4)2 peaks vanish before reaching 350° C while the unidentified peak at 1.60 Å -1 disappears under isothermal conditions at 350°C. Finally, peaks corresponding to CaH2, MgB2, CaF2, and Mg are observed indicating the reversibility of the system. Conclusions: The hydrogenation and dehydrogenation reaction of the CaF2+3CaH2+4MgB2 composite was demonstrated by means of in-situ SR-PXD. The hydrogenation reaction proceeds by means of a still unknown intermediate. For the dehydrogenation reaction there is no clear evidence of an intermediate, a direct reaction pathway is proposed.

MAX-lab ACTIVITY REPORT 2010 301
SYNCHROTRON RADIATION – BEAMLINE I711
1 E. Ronnebro, E.H. Majzoub, J. Phys. Chem. B Letters 111 (2007) 12045-12047. 2 M.D. Riktor, M.H. Sorby, K. Chlopek, M. Fichtner, B.C. Hauback, J. Mater. Chem. 19 (2009) 2754-2759. 3 Y. Filinchuk, E. Ronnebro, D. Chandra, Acta Materialia 57 (2009) 732-738. 4 F. Buchter, Z. Lodziana, A. Remhof, O. Friedrichs, A. Borgschulte, Ph. Mauron, A. Zuttel, D. Sheptyakov, G. Barkhordarian, R. Bormann, K. Chlopek, M. Fichtner, M. Sorby, M. Riktor, B. Hauback. S. Orimo, J. Phys. Chem. B 112 (2008) 8042-8048. 5 F. Buchter, Z. Lodziana, A. Remhof, O. Friedrichs, A. Borgschulte, Ph. Mauron, A. Zuttel, J. Phys. Chem. 113 (2009) 17223-17230. 6 M.D. Riktor, M.H. Sorby, K. Chlopek, M. Fichtner, F. Buchter, A. Zuttel, B.C. Hauback, J. Mater. Chem. 17 (2007) 4939-4942.
Fig. 1. In situ SR-PXD patterns of as milled
CaF2+3CaH2+4MgB2 composite, hydrogenation at 130 bar and heating from room temperature to 350°C (5 K
min-1, =0.979Å, Max Lab Synchrotron).
Fig. 2. In situ SR-PXD patterns of first dehydrogenation of CaF2+3CaH2+4MgB2 (pre-
hydrogenated) composite, dehydrogenation at dynamic vacuum and heating from room temperature to 350°C
(5 K min-1, =0.979Å, Max Lab Synchrotron).

302 MAX-lab ACTIVITY REPORT 2010
SYNCHROTRON RADIATION – BEAMLINE I711
Introduction
The Swedish repository for high-level radioactive waste will be located in Forsmark. The current KBS-3 approach [1] includes several barriers: (i) the ceramic fuel itself, (ii) the copper canister, (iii) compressed rings of smectite-rich, swelling clay, and (iv) a suitable rock. The clay barrier functions as mechanical support for the copper canister and protects it from movements in the rock. It also functions as a diffusion barrier for ions and water. It is of fundamental importance that the clay retains its properties over a period of time as long as 100 000 years. A deep repository is not expected to freeze during glacial periods, while levels closer to the surface can be affected by freeze-thaw cycles [1]. This will be of importance for back-filled shafts and sealed bore holes, when swelling clay is used as a sealing material. The aim of our project is to study fundamental processes of importance in this context [2,3], for example variations in the salt content of the ground water is one factor that is expected to have great influence [1]. Experimental and results
The freezing and thawing of smectite in different aqueous salt solutions was further studied after our initial study with pure water [3]. Na-montmorillonite was frozen in aqueous solutions of NaCl of varying concentration (0-3 M) and Ca-montmorillonite was frozen in CaCl2 solutions (0-3 M). Samples containing 70 wt% salt solution and 30 wt% montmorillonite powder were put into glass capillaries. Before mixing with the aqueous solution, the montmorillonite was present as a mono-layer hydrate (Na) and a two-layer hydrate (Ca). The stationary capillaries were cooled from + 20 oC to -50 oC using a stream of flowing nitrogen with adjustable temperature (Cryojet, Oxford Instruments). X-ray powder diffraction data was collected on the beam-line I711 or I911-5 at MAX-lab using a Mar system with a flat CCD detector (Mar 165, 2048 x 2048 pixels). Each frame was monitored for 20 seconds and the integrated intensity, scattering angle and width of the recorded diffraction rings were evaluated using the software Fit2d (A. P. Hammersley, ESRF).
The presence of a strong 001 basal reflection at around 2 = 3o in the diffraction patterns in Fig. 1, showed that crystalline hydrates were present in all cases except for the Na-montmorillonite at the lowest salt concentrations (0 and 0.25 M). For the latter, osmotic swelling occurred and the basal spacing was too large to be observed in the present experiments (though it was measured in a separate SAXS experiment). At -50 oC, the presence of ice was indicated by the two intense peaks at 2 = 13-14.5o. In the Na-montmorillonite-case, the basal basing decreased both when the salt concentration increased and the temperature decreased. As expected, lower hydrates formed when the water vapour pressure of the system was lowered. In the Ca-case, the basal spacing at room temperature decreased in a similar way with increased salt
FREEZING OF MONTMORILLONITES IN BRINE STUDIED BY SYNCHROTRON X-RAY POWDER DIFFRACTION
Daniel Svensson1,2, Staffan Hansen2
1Swedish Nuclear Fuel and Waste Management Co (SKB), Äspö Hard Rock Laboratory, P.O. Box 929, SE-572 29 Oskarshamn, Sweden
2Center for Analysis and Synthesis, Department of Chemistry, Lund University, P.O. Box 124, SE-221 00 Lund, Sweden

MAX-lab ACTIVITY REPORT 2010 303
SYNCHROTRON RADIATION – BEAMLINE I711
[1] SKB, 2010. RD&D Programme 2010. Programme for Research, Development and Demonstration of Methods for the Management and Disposal of Nuclear Waste. SKB, Stockholm. [2] Svensson, P.D. & Hansen, S.: Intercalation of Smectite with Liquid Ethylene Glycol – Resolved in Time and Space by Synchrotron X-Ray Diffraction. Applied Clay Science 48, 358-367 (2010). [3] Svensson, P.D. & Hansen, S.: Freezing and Thawing of Montmorillonite – A Time Resolved Synchrotron X-ray Diffraction Study. Applied Clay Science 49, 127-134 (2010). [4] Birgersson, M. & Karnland, O.: Ion Equilibrium between Montmorillonite Interlayer Space and External Solution – Consequences for Diffusional Transport. Geochimica et Cosmochimica Acta 73, 1908-1923 (2009).
concentration, while it unexpectedly increased at -50 oC. In a frozen system, the water vapour pressure will be that of pure ice at the specific temperature and this indicated that there was a change in the properties of the Ca-mineral taking place with increasing concentration of salt. An interesting possibility was that the phenomenon was related to the occlusion of neutral CaCl2 into the montmorillonite according to the Gibbs-Donnan effect [4].
Fig.1. Diffraction data for Na-montmorillonite (left column) and Ca-montmorillonite (right column). X-ray powder diffraction patterns recorded at + 20 oC (top row) and at -50 oC (central row). Basal spacing 001 at different temperatures and concentrations of salt (bottom row).

304 MAX-lab ACTIVITY REPORT 2010
SYNCHROTRON RADIATION – BEAMLINE I711
In
Prositu synch
C. Tyrsted
Center for
oject rephrotron rad
d, K. M. Ø. Je
Materials Cr
port – MAdiation stu
nsen, J. Mi, N
rystallographLangelandsg
AX-lab Actudies of in
N. Lock, J. Be
hy, Departmegade 140, 80
tivities 2norganic na
ecker, M. Ch
ent of Chem000 Aarhus C
2010 at I7anomateri
ristensen, B.
istry, AarhusC
711
ials synthe
. B. Iversen
s University,
eses
In Situ S
Materialanodes the last receivedpossessecapacityboth chwith Limarket, productisynthesiHydrothcontinuooption, benign a(2001) nanostruthis wayhigh cowhich hthe finalLi-diffusPXRD mof the c
In Situ Nanopa
The solimaterialceramicssupercritnanopartproductinormal state syn
Study of the
ls for Li-iohave attractdecade.1 O
d enormous es promisiny, cycle life aheap and noiFePO4 cathbut there is
ion methodis costs and hermal synous mode, since it is
and easily scwere the
uctured LiFey. However, ncentration
have a large l battery duesion channemethods we hompound “l
Synchrotroarticles Synt
id solution ols properties s and cataltical synthesticles facilion of the mprocedure o
nthesis.7
e Defect For
on battery ted much at
One compouinterest is L
ng propertieand safety, asontoxic.3 Lhodes are alstill a need t
ds in ordeimprove pro
nthesis, inconstitutes a cheap, en
calable methoe first to ePO4 could bthe compounof Li-Fe animpact of t
e to a blockel.5 By meahave studiedive”. Rietve
on Radiatiothesized in S
of CeO2 and applicable fo
lysis amongsis of crystalllitates fastmaterial andof high-tem
rmation Dur
cathodes attention duriund which hLiFePO4
2 as
es in terms s well as bei
Li-ion batterilready on tto develop neer to reduoduct contro
n batch an interesti
nvironmentalod. Yang et
show thbe synthesiznd containednti-site defeche capacity
king of the 1ans of in sd the formatild refinemen
on Study oSupercritical
d ZrO2 exhibfor many areag others.6 Tline CexZr1-x
t and ead obviates t
mperature sol
ring Hydroth
and ng
has it
of ng ies the ew uce ol4.
or ng lly al. hat zed d a cts of
1D itu on nts
ofnadebransuofanne
Fifoco
f Formatiol Water
bits as,
The O2
asy the lid
Inthsoprcrinco
hermal Synt
f the data anoparticles efects. Orderought aboutnd/or the teupercritical sf the compoun important ew synthesis
igur 1: Contoormation of onditions
n and Gro
n situ studiehe effect ofolution on throduct. Therystalline sizn size formedonditions of w
thesis of LiF
clearly showcontain a la
ering of thet by increasinemperature. synthesis conund takes sevpiece of ins
s methods for
our plot of df LiFePO4
owth of Cry
es where perthe doping-
he formatione in situ se-stable part
d within 5 mwater (P=25
Fe1-xMnxPO4
w that the arge concente anti-site dng the reside
However, nditions, the veral minutesight when dr the compou
data obtained under hyd
ystalline Ce
rformed to -level x of tn reactions atudies show
ticles less thain at the sup0bar, T=375
4
primary tration of defect is ence time
even at ordering s. This is
designing und.
from the drothermal
exZr1-xO2
elucidate the solid and final wed that an 10 nm
percritical oC).

MAX-lab ACTIVITY REPORT 2010 305
SYNCHROTRON RADIATION – BEAMLINE I711
1 Tarascon2 Padhi, A3 Whitting4 Jugovic, 5 Yang, S.6 Kaspar, J7 Yashima8Rao, C. N9 Poudel, B10 Zhang, G11 Lu, Q.;
n, J. M., ArmanA.K., Nanjundasgham, M. S. Che
D. & Uskokov F., Zavalij, P. YJ.; Fornasiero, Pa, M.; MorimotoN. R.; Muller, AB.; Hao, Q.; MaG.; Wang, W.; Gao, F.; Komar
nd, M. Nature, swamy, K. S. &emical Reviews
vic, D. Journal oY. & WhittinghP.; Graziani, Mo, K.; Yoshimu
A.; Cheetham, Aa, Y.; Lan, Y.; eLu, X.; Li, X. Crneni, S. Adv. M
414, 359-367, (& Goodenough, s (Washington, of Power Sourcham, M. S. Elec
M. Catal. Today,ura, M. J. Am. CA. K.; Nanomatet al. Science, 3Cryst. Growth DMater., 16, 1629
(2001). J. B.. Journal oDC, United Sta
ces, 190, 538-54ctrochemistry C50, 285–298, (
Ceram. Soc., 76terials Chemistr320, 634–638, (Des., 9, 145–159–1632, (2004)
of the Electrochates), 104, 427144, (2009). Communication(1999). 6, 1745–1750, (ry;Wiley-VCH2008).
50, (2009). ).
hemical Society,1-4301, (2004)
ns, 3, 505-508, (
1993). Verlag GmbH:
, 144, 1188-119.
(2001).
: Germany, (200
94, (1997).
07).
The dopon the pon the growth oand expdiffusionthe partiwith a hdifferentnanopart
FormatSynchro
Alloys materialcommonnanostruon toxicor DMFapproachalginic measureelementaintermedBiCl3 antheories kinetics very depthe finaconditioinfluencnegligib
ping-level haphase of the
morphologof the nanopplained as n in the solvicles.8 It washigh Ce (x >t reactionticles with a
ion and Gotron Radia
based on Bls for thermon chemical rouctured Bi2Tc reductants sF.10 In this sh was used,acid as a
ements gaval Te (andiate in the nd Te(OH)6
on the reaof the part
pendent on tal size of thons, on the oce on the stabble effect on t
ad a marked crystal stru
y of the pparticles coul
being limitvent or surfacs shown that> 0.5) conten mechanhigh Zr cont
Growth of ation Study
Bi2Te3 are oelectric appoutes for the Te3-based cosuch as hydrstudy, a che utilizing th
reductant. ve direct nd not Bi
synthesis o6, which disaction mechticle growthtemperature, he particles.other hand, hble particle sthe kinetics.
effect not oncture but, alparticles. Tld be modellted by eithce reactions t nanoparticlent followednisms thtent (x < 0.5
Bi2Te3 in
state-of-the-aplications.9 T
preparation ompounds rerazine, NaBHemical “greehe biomolecu
The in sievidence
i), beingof Bi2Te3 frosmisses earlihanisms.11 Th, while bei
did not affe The alkali
had a profousizes but had
nly lso
The led her on les
d a han ).
Fifo
Biomolecule
art The
of ely H4, en” ule itu of an
om ier
The ng ect ine
und d a
Fifroco
igure 2: Growormed under
e-Assisted N
igure 3: 3D pom the formonditions
wth curves ofsupercritical c
Near-Critic
plot of X-ray smation of Bi2T
f CexZr1-xO2
conditions
al Water:
scattering dataTe3 under ne
particles
In Situ
a obtained ear-critical

306 MAX-lab ACTIVITY REPORT 2010
SYNCHROTRON RADIATION – BEAMLINE I711
Effect of Hydration on Structural and Thermodynamic Properties of Mucin
Yana Znamenskaya, Johan Engblom, Javier Sotres,
Thomas Arnebrant and Vitaly Kocherbitov
Faculty of Health and Society, Malmö University, SE-20506 Malmö, Sweden
The mucus barrier and its transport properties are essential for proper functioning of the digestive, respiratory and reproductive systems of vertebrates, including humans. The principal components of mucus are the glycoprotein mucin1 and water. Mucin forms the macromolecular matrix of mucus and dominates its rheological properties. From an engineering point of view, mucin is an outstanding water-based lubricant.
Mucin molecules obtained from different sources have different structures that can be described by models ranging from bottle brush to dumbbell type. It is known from literature that mucin can form liquid crystalline phases and that the phase behavior of mucin is dependent on the hydration level. However, the exact phase behavior of mucin at different temperatures and hydration levels has yet to be determined.
We studied hydration of mucin using several experimental techniques. Samples were prepared from porcine gastric mucin (PGM), from bovine submaxillary gland mucin (BSM) (both from Sigma) and from a recently slaughtered pig. To characterize the molecular structure of PGM, we used atomic force microscopy (AFM) operated in the tapping mode. AFM indicates the presence of a dumbbell structure as well as a fiberlike structure at higher concentrations. Synchrotron SAXS measurements indicate the presence of lamellar structure at concentrations of mucin higher than 15 wt% and show that repeat distance is dependent on mucin concentration. A phase transition was observed at temperatures above 60ºC. A slight birefringence was observed in most samples, but polarized light microscopy discovered that birefringence arises mostly from insoluble particles of PGM. Strongly increased birefringence was observed close to the fluid – air interface which indicates that the presence of interfaces induces structuring of mucin. To observe the phase behavior of the mucin – water system differential scanning calorimetry (DSC) and isothermal sorption calorimetry were used. To characterize the glass transition of mucin at isothermal conditions, the water content and the change of the partial molar enthalpy of mixing of water at the transition point were measured. Sorption calorimetric results suggest that at low water contents mucin is in a glassy state and at higher water contents mucin is in an elastic state. Using DSC data we calculated the amount of non-freezing water as a function of concentration. Combining results obtained with different techniques we constructed a phase diagram of mucin covering a wide range of mucin concentrations and temperatures.
1 Bansil R., Turner B.S. Curr. Opin. Colloid Interface Sci., 11, 164-170, (2006).

MAX-lab ACTIVITY REPORT 2010 307
SYNCHROTRON RADIATION – BEAMLINE I711
Redesign of the hutches around and at the beamline I711 itself. The present experimental hutch was raised 30cm and an additional offi ce area was built on top of the redesigned beamline. Katarina Norén and Anders Månsson outside the hutch, 7 July 2010.Photos: Jeppe Christensen

308 MAX-lab ACTIVITY REPORT 2010
SYNCHROTRON RADIATION – BEAMLINE I811
One of the most sophisticated and complex applications of the lanthanide luminescence is in medical diagnostics. There are, however, major problems in the use of photoluminescence based on the UV excitation in immunoassays [1], since human blood absorbs strongly the UV radiation and the emission of the phosphor in the visible [2]. A promising manner to overcome these problems is to use red up-conversion luminescence [3] resulting from the absorption of two (or more) low energy photons followed by the emission of a higher energy photon [4].
ZrO2:Yb3+,Er3+ is one of the best up-converting materials providing red emission. Moreover, it shows considerable red afterglow, i.e. persistent up-conversion luminescence [5], due to the trapping of the excitation energy to lattice defects and its subsequent delayed release [6]. This suggests great potential for in vivo imaging without the need for any damaging excitation.
In this work, the valences and surroundings of Yb3+ and Er3+ in ZrO2:Yb3+,Er3+ up-conversion luminescence materials prepared by combustion synthesis were studied with room temperature XANES and EXAFS measurements using the beamline I811 at MAX-lab (Lund, Sweden). The measurements were carried out in the fluorescence mode using an energy dispersive solid state detector (Vortex, Si Nano Technology USA). The extraction of interatomic distances from the EXAFS data was carried out with the EXAFSPAK program package [7].
The XANES results show only the trivalent form for both the Yb and Er dopants (Fig.). This indicates that charge compensation must take place as the dopants enter a tetravalent site. Most probably, oxygen vacancies are created for this purpose according to the following scheme (using the Kröger-Vink notation): 2 ZrZr 2 ZrR + OV .
The distance distributions calculated from EXAFS correspond well (Fig.) to those calculated from the structural data [8] for the cubic rare earth stabilized ZrO2. The similarity of the Zr-Zr, Yb-Zr/Er/Yb and Er-Zr/Yb/Er distances (3.63 Å for each) confirms that Er3+ and Yb3+ occupy the ZrIV sites in the structure. The R-O and R-M distributions are rather broad partly due to the high measuring temperature and partly to the multisite nature of the R positions, i.e. the slightly different spatial positions of the oxygen vacancies created by the charge compensation induce several slightly different ZrR sites [9].
The observed Yb-O (2.30) and Er-O (2.26 Å) distances are too short when compared with the calculated Zr-O distance (2.23 Å) when taking into account the ionic radii (Zr: 0.84, Yb: 0.985, and Er: 1.004; CN: 8 [9]). This indicates the rigidity of the structure but also the presence of oxygen vacancies around Er3+ and Yb3+. The oxygen vacancies ( OV ) resulting from the charge
Iko Hyppänen1, Jorma Hölsä1,2,3, Jouko Kankare1, Mika Lastusaari1,3, Luis A.O. Nunes4,Laura Pihlgren1,5, and Tero Soukka6
Probing the Local Structure of ZrO2:Yb3+,Er3+ Up-Conversion Luminescence Materials by X-Ray Absorption Spectroscopy
1University of Turku, Department of Chemistry, Turku, Finland2Universidade de São Paulo, Instituto de Química, São Paulo-SP, Brazil
3Turku University Centre for Materials and Surfaces (MatSurf), Turku, Finland 4Universidade de São Paulo, Instituto de Física de São Carlos, São Carlos-SP, Brazil
5Graduate School of Materials Research (GSMR), Turku, Finland 6University of Turku, Department of Biochemistry and Food Chemistry, Turku, Finland

MAX-lab ACTIVITY REPORT 2010 309
SYNCHROTRON RADIATION – BEAMLINE I811
References: 1. Mathis, G., Clin. Chem. 39 (1993) 1953. 2. Zijlstra, W.G., Buursma, A., and Meeuwsen-van der Roest, W.P., Clin. Chem. 37 (1991) 1633. 3. Soini, E., Meltola, N.J., Soini, A.E., Soukka, J., Soini, J.T., and Hänninen, P.E., Biochem. Soc. Trans. 28 (2000)
70. 4. Auzel, F., Chem. Rev. 104 (2004) 139. 5. Hyppänen, I., Hölsä, J., Kankare, J., Lastusaari, M., Malkamäki, M., and Pihlgren L., J. Lumin. 129 (2009)
1739. 6. Aitasalo, T., Hölsä, J., Jungner, H., Lastusaari, M., and Niittykoski, J., J. Phys. Chem. B 110 (2006) 4589. 7. George, G.N. and Pickering, I.J., EXAFSPAK, A Suite of Computer Programs for Analysis of X-ray Absorption
Spectra, SSRL, Stanford University, Stanford, CA, 1993. 8. Martin, U., Boysen, H., and Frey, F., Acta Cryst. B. 49 (1993) 403. 9. Tuilier, M.H., Dexpert-Ghys, J., Dexpert, H., and Lagarde, P., J. Solid State Chem. 69 (1987) 153. 10. Shannon, R.D., Acta Cryst. A 32 (1976) 751.
compensation are expected to agglomerate with ZrR due to electrostatic reasons. This effectively reduces the coordination number 8 around Zr to 7 (or even 6) around R3+. In terms of the R-O distances, this decrease in the coordination number by one unit, corresponds to ca. 0.06 Å [9]. The R-O distances calculated from the ionic radii should be 2.375 and 2.394 Å for Yb3+ and Er3+,respectively. Thus, the average coordination number of the R3+ ions in ZrO2 is not lower than 7. It may be even higher if the rigidity of the lattice is taken into account.
Finally, according to the ionic radii, the Yb-O distance should be shorter than Er-O, but the opposite is observed. This is serendipitous, since the higher charge density of Yb3+ should attract more the oxide ions. Thus, the reason could be that there are more oxygen vacancies around Er3+
than Yb3+. On the other hand, taking into account the persistent luminescence exhibited by these materials this may be explained as follows: the persistent luminescence seems to require the (at least virtual) change of the oxidation state of one of the species involved. In the Yb3+,Er3+
system, the only change possible at ambient conditions, is the formation of the divalent Yb2+ (or Yb3+-e-) species which both demand more space than the simple Yb3+ ion.
Unfortunately, during the latest (May and October 2010) beamtimes at the I811 no measurements could be carried out due to the malfunction of the beamline monochromator. The present data is thus from an earlier beamtime.
Acknowledgments: The help of Dr. Katarina Norén and Dr. Stefan Carlson (MAX-lab) during the measurements is gratefully acknowledged. This work was supported by the European Community Research Infrastructure Action under the FP6 "Structuring the European Research Area" Programme (through the Integrated Infrastructure Initiative "Integrating Activity on Synchrotron and Free Electron Laser Science") as well as The Academy of Finland and the Conselho Nacional de Desenvolvimento Científico e Tecnológico (CNPq), Brazil.
Figure. XANES spectra of the Er(LIII) and Yb(LII) edges (left) and distance distributions calculated from EXAFS data (right), in ZrO2:Yb3+,Er3+.
8400 8600 8800
0
1x10⁵
2x10⁵
3x10⁵
4x10⁵
5x10⁵
10000 10200 104000.0
5.0x10⁴
1.0x10⁵
1.5x10⁵
2.0x10⁵
Er(LIII) edgeFluorescence modeEr(L ) emission
ZrO2:Yb3+,Er3+
xYb: 0.10, xEr: 0.04Combustion methodSemi-carbazide + NH4NO3
Abs
orba
nce
/ Arb
. Uni
ts
Energy / eV
Yb(LII) edgeFluorescence modeYb(L ) emission
Abs
orba
nce
/ Arb
. Uni
ts
1 2 3 4 50.0
0.4
0.8
1.2
1.6
Cubic ZrO2
Yb-Zr/Er/Yb
ZrO2:Yb3+,Er3+
xYb: 0.10, xEr: 0.04Combustion methodSemi-carbazide+ NH4NO3
Tran
sfor
m M
agni
tude
Distance / Å
Er-O
Er-Zr/Yb/Er
Yb-O
Zr-O Zr-Zr

310 MAX-lab ACTIVITY REPORT 2010
SYNCHROTRON RADIATION – BEAMLINE I811
XANES characterization of Fe(3-x)(1-z/3)Vx(1-z/3) zO4 catalysts for methanol oxidation
Robert Häggblad1, Staffan Hansen2, L. Reine Wallenberg2, and Arne Andersson1
1Department of Chemical Engineering, Lund University, P.O. Box 124, SE-221 00 Lund, Sweden 2Division of Polymer and Materials Chemistry, Department of Chemistry, Lund University, PO Box
124, SE-221 00 Lund, Sweden In the metal oxide catalyzed process for industrial production of formaldehyde from methanol the catalyst is a mixture of MoO3 and Fe2(MoO4)3. The catalyst is superb in many aspects, showing very high selectivity to formaldehyde (>93%) at high methanol conversion. However, in operation the molybdenum is volatile limiting the lifetime of the catalyst [1]. Consequently, alternative more stable catalysts are of potential interest provided they show comparable selectivity to formaldehyde. It is known that also vanadium based catalysts are selective for this reaction [2], but since vanadia is toxic, low volatility is required. In previous studies we have shown that the presence of iron causes stabilization of vanadia towards volatilization [3] and, moreover, FeVO4 transforms into a Fe1.5V1.5O4 spinel-type phase when being used in methanol oxidation [2]. Considering our previous results, we prepared a series of cation vacant Fe(3-x)(1-z/3)Vx(1-z/3) zO4 spinel-type catalysts with different Fe:V ratios, which are denoted Fe3-xVx for short.
Fig. 1. a) V K-edge and b) Fe K-edge XANES spectra for FeVO4, Fe1.5V1.5 and Fe2.8V0.2 as measured in situ after 0, 2 and 150 minutes and ex situ after five days on stream in methanol oxidation at 300°C (feed: 10% O2 and 10% CH3OH in N2).
XANES spectra were recorded both before and after use of the samples in methanol oxidation, as well as in situ during methanol oxidation using a home-made reaction cell. Figure 1 displays V K- and Fe K-edge spectra recorded in situ immediately before (0 min) and after (2 min) the catalytic
0
1
0
1
7110 7120 7130 71400
1
5460 5470 5480 5490 55000
1
0
1
0
1
Fe2.8V0.2
Fe1.5V1.5
FeVO4
Nor
mal
ized
abs
orba
nce
Energy (eV)
0 min 2 min 150 min 5 days (ex-situ)
0 min 2 min 150 min 5 days (ex-situ)
Energy (eV)
Fe2.8V0.2
Fe1.5V1.5
Nor
mal
ized
abs
orba
nce
FeVO4
Fe K-edge
V K-edge

MAX-lab ACTIVITY REPORT 2010 311
SYNCHROTRON RADIATION – BEAMLINE I811
reaction started as well as after 150 min on stream. In addition, to give information about the changes occurring over a longer period of time, ex situ spectra recorded after five days in methanol oxidation are shown for Fe2.8V0.2 and Fe1.5V1.5. At the start of the in situ experiment (0 min), the V K-edge positions (E1/2) for Fe2.8V0.2, Fe1.5V1.5 and FeVO4 are 5477.1, 5476.6 and 5480.8 eV, respectively and the Fe K-edge (E1/2) positions are 7121.4, 7121.7 and 7124.3 eV, respectively, showing that both V and Fe in the spinel phase catalysts are less oxidized than in FeVO4. During methanol oxidation, both Fe2.8V0.2 and Fe1.5V1.5 show a shift of the V and Fe main edge positions towards higher energies, revealing that both catalysts are oxidized during the reaction. As shown by the ex situ spectra, after five days on stream both V and Fe in the spinels have become even more oxidized. However, for FeVO4 only negligible adjustments of the edge positions are observed after 150 min, indicating that the initial reduction of the catalyst is slower than the oxidation of the more reduced spinel phase catalysts. Extended V K pre-edge analysis was performed following the procedure described in the literature [4,5]. In Fig. 2 are plotted the centroid position and the pre-edge intensity as obtained from the normalized and background subtracted V K pre-edge spectra together with data for several reference compounds with known coordination and valence. Since the spinel-type phase has four and six coordinated cation positions only, five coordinated positions are not likely to be found. Hence, the results suggest that trivalent vanadium in octahedral positions [VI]V3+ is oxidized to predominantly tetravalent vanadium [VI]V4+ during the reaction. The lower initial value of both the centroid energy (5468.9 eV) and the intensity (0.10) for Fe2.8V0.2 compared to the values for Fe1.5V1.5 (5469.4 eV and 0.19, respectively) reveals that V is less oxidized in the former catalyst. However, after five days in methanol oxidation vanadium in Fe2.8V0.2 has been oxidized to a slightly larger extent (+0.5 eV) than is the case in Fe1.5V1.5 (+0.3 eV), and the oxidation states have become more similar.
Fig. 2. Correlation between the intensity and the peak centroid energy of the background subtracted V K pre-edge spectra for Fe2.8V0.2 and Fe1.5V1.5. The data encircled by dashed lines are for reference compounds with V in different oxidation states and coordinations (see ref. [6] for references). The notations 1, 2 and 3 represent the centroid position and the intensity obtained in situ after 0, 2 and 150 minutes in methanol oxidation, respectively.
5468 5469 5470 54710,0
0,2
0,4
0,6
0,8
1,0
321
32
[V]V5+
[V]V4+
[IV]V5+
[VI]V4+
Fe1.5V1.5 In-situ Fe2.8V0.2 In-situ Fe1.5V1.5 after 5 days Fe2.8V0.2 after 5 days
Pre-
edge
inte
nsity
(a.u
.)
Peak Centroid Energy (eV)
[VI]V3+
1
[1] A. Andersson, M. Hernelind, O. Augustsson, Catal. Today 112 (2006) 40. [2] R. Häggblad, J.B. Wagner, S. Hansen, A. Andersson, J. Catal. 258 (2008) 345. [3] R. Häggblad, M. Massa, A, Andersson, J. Catal. 266 (2009) 218. [4] G. Giuli, E. Paris, J. Mungall, C. Romano, D. Dingwell, Am. Mineral. 89 (2004) 1640. [5] P. Chaurand, J. Rose, V. Briois, M. Salome, O. Proux, V. Nassif, L. Olivi, J. Susini, J. L. Hazemann, J.Y.
Bottero, J. Phys. Chem. B 111 (2007) 5101. [6] R. Häggblad, S. Hansen, L.R. Wallenberg, A. Andersson, J. Catal. 276 (2010) 24.

312 MAX-lab ACTIVITY REPORT 2010
SYNCHROTRON RADIATION – BEAMLINE I811
Characterization of metals (Cu and As) in mine tailings
T. Karlsson, T. Hedlund and L. Lövgren Department of Chemistry, Umeå University, 90183 Umeå, Sweden
During the processing of the ores the mining industry produces large quantities of mine waste/tailings that can contain relatively high concentrations of metals (Cu, As, Zn etc.). The mobility of metals in these systems is dependent on the chemical speciation, which in turn is greatly influenced by the mineralogical composition and the physical and geochemical conditions prevailing in the mine waste. However, the knowledge about the specific forms of metals that occurs in mine tailings of different mineralogical composition and age is limited. The aim of this project is to use X-ray Absorption Fine Structure (XAFS) Spectroscopy to investigate the local structure and oxidation state of metal ions (Cu, As and Zn) associated with mine tailings, and secondary iron minerals, of different age collected at different mining sites. Materials and methods Cores of tailings were collected at three different mines in northern Sweden (Kristineberg, Aitik and Zinkgruvan) with varying mineralogical composition. At Kristineberg secondary iron mineral samples were also collected. In addition fresh tailings were sampled in the concentrator in Boliden. The tailings deposited in Kristineberg contain high concentrations of sulphide minerals in contrast to the sulphide poor tailings at Aitik. The tailings deposited at Zinkgruvan are characterized by substantial concentrations of carbonate minerals. Unmanipulated tailing and secondary iron mineral samples and manipulated tailing samples were analyzed. The manipulated samples were prepared by adding metals (Cu and As) to the tailings, to reach concentrations of ca. 15 80 μmol Me g-1 on a dry mass basis. Solid phase reference compounds for Cu and As (e.g. CuS, As2O3) were diluted with an appropriate amount of powdered boron nitride before analysis.
As and Cu K-edge XAFS data were collected at the superconducting beam line i811 at MAX-lab. For the mine tailings data were collected on moist samples in fluorescence mode (If/I0 against energy), using a Lytle detector, in the energy range from 150 eV before the edge to ca. 800 eV after the edge. However, due to problems with the beam line we only got usable data for the XANES region, which mainly gives information about the oxidation state of the metals and some information/indications about the speciation. Results and discussion Our Cu XANES data show that the unmanipulated sample from Boliden is dominated by CuS (Figure 1. A). In the other unmanipulated samples, both the tailing samples and the secondary iron minerals, the concentrations of both Cu and As were below the detection limit. The tailing samples with added Cu (15 80 μmol Cu g-1; pH 5.5–8.9) probably contain a mixture of CuS and Cu(OH)2 (Figure 1 A). For arsenic the XANES data indicates that the unmanipulated sample from Boliden is dominated by arsenopyrite, FeAsS (As0), or arsenic sulfide, As2S3 (As[III]) [1, 2]. In the manipulated samples there is either a mixture between FeAsS (or As2S3) and AsO4
3- (As[V]) adsorbed to goethite/gibbsite or as a precipitate e.g. scorodite (FeAsO4 2H2O) as in the sample from Boliden (50 μmol As g-1) or only As(V) (adsorbed or as a precipitate) as in the sample from Kristineberg (Figure 1 B). Thus, for the mine tailing sample from Boliden our XANES results clearly shows that the added metal

MAX-lab ACTIVITY REPORT 2010 313
SYNCHROTRON RADIATION – BEAMLINE I811
References (1) Foster A. L., Brown Jr. G. E., Tingle T. N. and Parks G. A. 1998. Quantitative arsenic
speciation in mine tailings using X-ray absorption spectroscopy. Am. Mineral. 83, 553–568.
(2) Slowey A. J. Johnson S. B. Newville M. and Brown Jr. G. E.. 2007. Speciation and colloid transport of arsenic from mine tailings. Appl. Geochem. 22, 1884–1898.
(Cu and As) occurs in a different form than the metal originally present in the tailing. Furthermore, our results indicate that all the tailing samples contain CuS to some degree. The speciation for arsenic in the unmanipulated tailings seems to differ more. The sample from Boliden, a fresh tailing directly from the concentrator, is dominated by FeAsS while the aged tailing from Kristineberg probably is dominated by As(V) (adsorbed or as a precipitate).
The XAFS data we have collected show that it should be possible to collect usable EXAFS data for these samples with a functioning beam line. Good quality EXAFS data is needed in order to determine the solid phase speciation of Cu and As in these mine tailing samples, e.g. it is not possible to distinguish between scorodite and As(V) adsorbed to goethite or gibbsite based on data from the XANES region alone [1, 2]. Determining the speciation of Cu and As in mine waste is of great importance because the mobility and toxicity is different for different species of the metals. For example, As bound in precipitates are considered to be less bioavailable than As adsorbed to mineral surfaces [1].
8,95 8,96 8,97 8,98 8,99 9,00 9,01 9,02
Energy (keV)
Nor
mal
ized
Abs
orba
nce
CuS
Boliden, unmanipulated
Cu(OH)2
Boliden, 80 μmol Cu g-1 , pH 7.2
11,84 11,85 11,86 11,87 11,88 11,89
Energy (keV)
Nor
mal
ized
Abs
orba
nce
As2IIIO3
Boliden, unmanipulated
As(V)-Goethite
Boliden, 50 μmol As g-1, pH 5.6
Kristineberg, 50 μmol As g-1, pH 4.3
A B
As(0
Figure 1. X-ray absorption near edge structure (XANES) spectra for (A) copper and (B) arsenic in reference compounds and in mine tailings from Boliden and Kristineberg. Spectra for unmanipulated mine tailings (Boliden) and for mine tailing samples where Cu and As (80 and 50 μmol) has been added are shown.
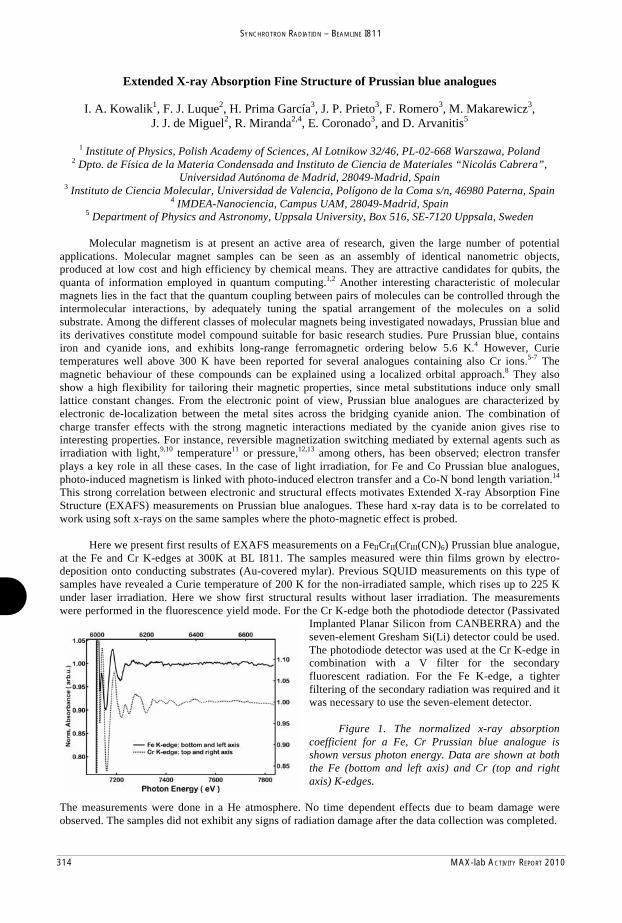
314 MAX-lab ACTIVITY REPORT 2010
SYNCHROTRON RADIATION – BEAMLINE I811
Extended X-ray Absorption Fine Structure of Prussian blue analogues
I. A. Kowalik1, F. J. Luque2, H. Prima García3, J. P. Prieto3, F. Romero3, M. Makarewicz3, J. J. de Miguel2, R. Miranda2,4, E. Coronado3, and D. Arvanitis5
1 Institute of Physics, Polish Academy of Sciences, Al Lotnikow 32/46, PL-02-668 Warszawa, Poland 2 Dpto. de Física de la Materia Condensada and Instituto de Ciencia de Materiales “Nicolás Cabrera”,
Universidad Autónoma de Madrid, 28049-Madrid, Spain 3 Instituto de Ciencia Molecular, Universidad de Valencia, Polígono de la Coma s/n, 46980 Paterna, Spain
4 IMDEA-Nanociencia, Campus UAM, 28049-Madrid, Spain 5 Department of Physics and Astronomy, Uppsala University, Box 516, SE-7120 Uppsala, Sweden
Molecular magnetism is at present an active area of research, given the large number of potential
applications. Molecular magnet samples can be seen as an assembly of identical nanometric objects, produced at low cost and high efficiency by chemical means. They are attractive candidates for qubits, the quanta of information employed in quantum computing.1,2 Another interesting characteristic of molecular magnets lies in the fact that the quantum coupling between pairs of molecules can be controlled through the intermolecular interactions, by adequately tuning the spatial arrangement of the molecules on a solid substrate. Among the different classes of molecular magnets being investigated nowadays, Prussian blue and its derivatives constitute model compound suitable for basic research studies. Pure Prussian blue, contains iron and cyanide ions, and exhibits long-range ferromagnetic ordering below 5.6 K.4 However, Curie temperatures well above 300 K have been reported for several analogues containing also Cr ions.5-7 The magnetic behaviour of these compounds can be explained using a localized orbital approach.8 They also show a high flexibility for tailoring their magnetic properties, since metal substitutions induce only small lattice constant changes. From the electronic point of view, Prussian blue analogues are characterized by electronic de-localization between the metal sites across the bridging cyanide anion. The combination of charge transfer effects with the strong magnetic interactions mediated by the cyanide anion gives rise to interesting properties. For instance, reversible magnetization switching mediated by external agents such as irradiation with light,9,10 temperature11 or pressure,12,13 among others, has been observed; electron transfer plays a key role in all these cases. In the case of light irradiation, for Fe and Co Prussian blue analogues, photo-induced magnetism is linked with photo-induced electron transfer and a Co-N bond length variation.14 This strong correlation between electronic and structural effects motivates Extended X-ray Absorption Fine Structure (EXAFS) measurements on Prussian blue analogues. These hard x-ray data is to be correlated to work using soft x-rays on the same samples where the photo-magnetic effect is probed.
Here we present first results of EXAFS measurements on a FeIICrII(CrIII(CN)6) Prussian blue analogue,
at the Fe and Cr K-edges at 300K at BL I811. The samples measured were thin films grown by electro-deposition onto conducting substrates (Au-covered mylar). Previous SQUID measurements on this type of samples have revealed a Curie temperature of 200 K for the non-irradiated sample, which rises up to 225 K under laser irradiation. Here we show first structural results without laser irradiation. The measurements were performed in the fluorescence yield mode. For the Cr K-edge both the photodiode detector (Passivated
Implanted Planar Silicon from CANBERRA) and the seven-element Gresham Si(Li) detector could be used. The photodiode detector was used at the Cr K-edge in combination with a V filter for the secondary fluorescent radiation. For the Fe K-edge, a tighter filtering of the secondary radiation was required and it was necessary to use the seven-element detector.
Figure 1. The normalized x-ray absorption
coefficient for a Fe, Cr Prussian blue analogue is shown versus photon energy. Data are shown at both the Fe (bottom and left axis) and Cr (top and right axis) K-edges.
The measurements were done in a He atmosphere. No time dependent effects due to beam damage were observed. The samples did not exhibit any signs of radiation damage after the data collection was completed.

MAX-lab ACTIVITY REPORT 2010 315
SYNCHROTRON RADIATION – BEAMLINE I811
1 M. N. Leuenberger and D. Loss, Nature 410, 789 (2001). 2 S. Hill et al., Science 302, 1015 (2003). 3 http://www.chemblink.com. 4 A. N. Hoden et al., Phys. Rev. 102, 1463 (1956). 5 S. Ferlay et al., Nature 378, 701 (1995). 6 S. M. Holmes and G. S. Girolami, J. Am. Chem. Soc. 121, 5593 (1999). 7 Ø. Hatlevik et al., Adv. Mater. 11, 914 (1999). 8 M. Verdaguer, Polyhedron 20, 1115 (2001). 9 A. Goujon et al., Eur. Phys. J. B 14, 115 (2000). 10 H. Tokoro et al., J. Appl. Phys. 97, 508 (2005). 11 S. Ohkoshi, H. Tokoro and K. Hashimoto, Coord. Chem. Rev. 249, 1830 (2005). 12 V. Ksenofontov et al., Phys Rev. B 68, 024415 (2003). 13 E. Coronado et al., J. Am. Chem. Soc. 130, 15519 (2008). 14 Christophe Cartier dit Moulin et al. J. Am. Chem. Soc. 122, 6653 (2000)
The normalized EXAFS oscillations after spline subtraction are shown in Figure 1 for both the Fe and Cr K-edges. The quality of the data allows resolving features much smaller than in the per cent range of the absorption coefficient. The next step of the EXAFS analysis is shown in Figure 2, where the normalized EXAFS oscillations are shown versus photoelectron wave vector (or k-vector). Interestingly, the amplitude of the EXAFS at the Fe K-edge is smaller versus the one at the Cr K-edge. This amplitude reduction appears to be in particularly pronounced at high k values, not allowing to have a clear EXAFS signal beyond k=10 Å-
1. In contrast for the Cr K-edge one can obtain data up to k=13 Å-1. A possible explanation for the reduction of the EXAFS at the Fe K-edge is an increased Debye Waller factor in this case.
Figure 2. Left: k3weighted EXAFS oscillations versus photoelectron wave vector after normalization
and spline subtraction at both the Fe and Cr K-edge. Right: Fast Fourier Transform modulus for the data shown in the left panel in real space.
The Fourier transform of the EXAFS data is also shown in Figure 2. Three main peaks can be
identified in real space, in agreement to earlier EXAFS work13. The peaks around 1.8-2 Å are due to N or O. The peak around 2.5 Å is due to the C atoms. Finally the peak around 4.5 Å is due to the Cr or Fe neighbour atoms. There is good agreement in the position of the nearest neighbour atom peaks for the Fe and Cr atoms but not for the more distant neighbour atom shells. Despite the fact that the noise level is higher for the Fe K-edge data, the present data set indicates that the local environment of the Fe and Cr atoms present measurable differences. Further analysis and simulations will allow confirming these preliminary observations.
In conclusion, the present set of data indicates that it is possible to obtain high quality EXAFS on
molecular magnet films. This is the first step in making further investigations in view of correlating structural effects with the electronic structure and the magnetic properties of these materials.
This research has been supported in part by the European Community's Seventh Framework Programme
(FP7/2007-2013) under grant agreement nº 226716, by the Swedish Research Council and also by a Grant from the Swedish STINT Foundation.

316 MAX-lab ACTIVITY REPORT 2010
SYNCHROTRON RADIATION – BEAMLINE I811
Speciation of sulfur compounds in natural matrices using sulfur K edge XANES
Ingmar Persson
Department of Chemistry, Swedish University of Agricultural Sciences,
P.O.Box 7015, SE-750 07 Uppsala, Sweden. Sulfur XANES as an analytical tool Sulfur K edge XANES (X-ray Absorption Near Edge Structure) spectroscopy is an excellent tool to quantitatively determine the speciation of sulfur compounds in complex matrices using internally calibrated reference spectra of model compounds [Almkvist et al., J. Synchrontron Rad. 17, 683-688, 2010]. Due to significant self-absorption of the formed fluorescence radiation in the sample itself the fluorescence signal displays a non-linear correlation with the sulfur content in a wide concentration range. Self-absorption is a problem at low total absorption of the sample when the sulfur compounds are present as particles. Particles of elemental sulfur need to be smaller than 2 μm to be give a signal linear to the concentration [Morgan et al, J. Phys.: Conf. Ser. 190, 012144, 2009]. This method developed by measurements at MAX-lab, beam-line I811, is published, and ready to be used. As beam-line I811 has not been available for users during 2010, the planned experiments in the projects “Sulfur speciation in preserved water-logged archaeological wood from the Vasa” and ”Sulfur mineralization in arable soils” has been postponed.

MAX-lab ACTIVITY REPORT 2010 317
SYNCHROTRON RADIATION – BEAMLINE I811
Structural characterization metal complexes in applied and fundamental systems
Ingmar Persson
Department of Chemistry, Swedish University of Agricultural Sciences,
P.O.Box 7015, SE-750 07 Uppsala, Sweden. Structure of N,N-dimethylthioformamide solvated gallium(III) and indium (III) complexes The structure of the N,N-dimethylthioformamide (DMTF) solvated gallium(III) ion has been determined in solution by means of extended X-ray absorption fine structure (EXAFS) spectroscopy. The gallium-(III) ion is four-coordinate in tetrahedral fashion with a mean Ga–S bond distance of 2.233(2) Å in DMTF solution. At the dissolution of indium(III) perchlorate or trifluoromethanesulfonate in DMTF coordinated solvent molecules are partly reduced to sulfide ions, and a tetrameric complex with the composition [In4S4(SHN(CH3)2)12]4+ is formed. The structure of the solid tetrameric complex in the perchlorate salt was solved with single crystal X-ray diffraction. Four indium(III) ions and four sulfide ions form a highly symmetric heterocubane structure where each indium binds three bridging sulfide ions and each sulfide ion binds three indium(III) ions with a mean In–S bond distance of 2.584(1) Å, and S–In–S angles of 90.3(1)o. Each indium(III) additionally binds three DMTF molecules at significantly longer mean In–S bond distance, 2.703(1) Å; the S–In–S angles are in the range 80.3–90.4o. Large angle X-ray scattering data on a DMTF solution of indium(III) trifluoromethanesulfonate show that the same tetrameric species characterized in the solid state is also present in solution, whereas the EXAFS measurements only give information about the In–S bond distances due to the short core hole lifetime. Publication Ö. Topel, I. Persson, D. Lundberg and A.-S. Ullström, Reactions and Structures in the Gallium(III)/Indium(III)-N,N-dimethylthioformamide Systems. Inorg. Chim. Acta 365, 220-224, 2011.

318 MAX-lab ACTIVITY REPORT 2010
SYNCHROTRON RADIATION – BEAMLINE I811
XANES INVESTIGATION OF IRON REDOX CHEMISTRY IN THE ABM AND TBT EXPERIMENTS AT THE ÄSPÖ HARD ROCK LABORATORY
Daniel Svensson1,2, Staffan Hansen2
1Swedish Nuclear Fuel and Waste Management Co (SKB), Äspö Hard Rock Laboratory, P.O. Box 929, SE-572 29 Oskarshamn, Sweden
2Center for Analysis and Synthesis, Department of Chemistry, Lund University, P.O. Box 124, SE-221 00 Lund, Sweden
Introduction
Clay barriers, rich in swelling smectite minerals, will be utilized in repositories for high level radioactive waste. The properties of the smectite are affected by the oxidation state of iron in the mineral [1]. In the field experiment Alternative Buffer Material (ABM) [2], started at Äspö Hard Rock Laboratory during November 2006, eleven clays in the form of compacted rings with an outer diameter of 0.3 m were placed in contact with metallic iron at a temperature of up to 130 °C at the -450 m level. In some cases iron cages with pellets were used and the height of the stacked rings was 3 m. The first package, of totally three, was excavated in May 2009. The field experiment Temperature Buffer Test (TBT) was started at Äspö Hard Rock Laboratory in March 2003. Compacted blocks (outer diameter 1.8 m) of MX80 clay were placed in contact with metallic iron at a temperature of up to 150 °C at the -420 m level. The hole was of full size KBS-3 type and 8 m deep. The experiment was excavated in 2010. Experimental and results
During the whole chain consisting of excavation, transport, storage, specimen preparation and measurement, effort was put into avoiding the exposure of the clay to air. The clay was sampled radially from the iron heater towards the rock and studied using FeK XANES at beamline I811, in order to obtain spatially resolved information about the Fe redox chemistry in the deposition holes. Some results obtained on the MX80 clay in the ABM test have been summarized in Fig. 1 and in the TBT test in Fig. 2.
The position of the FeK edges in Fig. 1(a) indicated that the clay samples collected close to the heater had been reduced in the ABM test, while the samples further out were similar to the clay before deposition. The Fe pre-edge peak, which can yield useful information concerning both oxidation state and coordination, was not well defined for the excavated samples, see Fig. 1(c), and the pre-edge peak was not evaluated in the present study. Instead, the position of the edges were used to determine the relative amount of divalent iron in the samples, see Fe(II)/Fe-tot in Fig. 1(b). The degree of water saturation was determined by thermogravimetry and the total amount of iron by ICP analysis. The results indicated that the samples were fully water saturated and that anaerobic corrosion of the iron heater had caused an increase in the amount of Fe(II) about a centimeter into the clay close to the heater in the ABM test. Further out, the oxidation state of the clay was unaffected.
The situation was different in the TBT test, where no highly reduced samples were observed, cf. Figs 2(a) and 2(b). Instead, the samples close to the heater contained no Fe(II) at all, while the original clay (reference) contained at least a small amount of Fe(II). The clay close to the heating element was black, and magnetic particles could be collected using a permanent

MAX-lab ACTIVITY REPORT 2010 319
SYNCHROTRON RADIATION – BEAMLINE I811
magnet. The X-ray absorption spectrum of the separated particles in Fig. 2(c), indicated a pure Fe(III) compound, possibly maghemite ( -Fe2O3) considering the magnetic properties. This indicated aerobic oxidation of the iron heater in the TBT test, which is compatible with the much larger scale of the clay blocks containing pores filled with air in their dry state.
Fig. 1. The ABM test [left]. (a) FeK edges as a function of distance from the heater with the original clay as the reference. (b) Radial characteristics of the clay ring. (c) Pre-edge features of the FeK edge. Fig. 2. The TBT test [right]. (a) FeK edges of clay samples and standard compounds. (b) Radial characteristics of the clay ring with the original clay as the reference. (c) FeK edges of magnetic particles collected from clay close to the heater and standard compounds.
[1] Stucki, J. W., Lee, K., Zhang, L., Larson, R. A. (2002): Effects of iron oxidation state on the surface and structural properties of smectites. Pure and Applied Chemistry 74, 2081-2094. [2] SKB (2007) RD & D Programme. Programme for research, development and demonstration of methods for the management and disposal of nuclear waste. SKB Technical Report, TR-07-12, SKB, Stockholm. [3] Sandén, T., Goudarzi, R., Combarieu, M. Åkesson, M., Hökmark, H. (2007): Temperature buffer test – design, instrumentation and measurements. Physics and Chemistry of the Earth 32, 77-92.
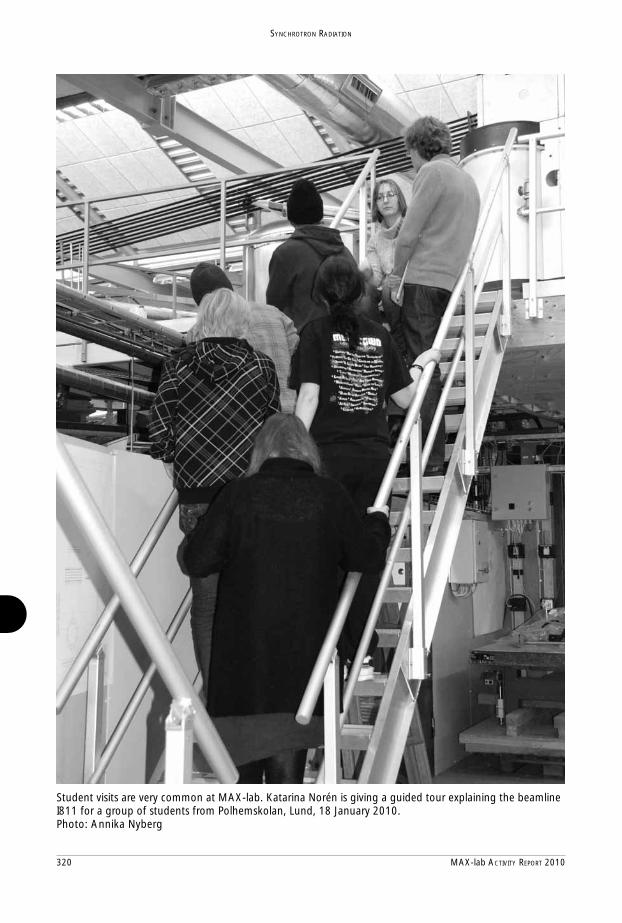
320 MAX-lab ACTIVITY REPORT 2010
SYNCHROTRON RADIATION
Student visits are very common at MAX-lab. Katarina Norén is giving a guided tour explaining the beamline I811 for a group of students from Polhemskolan, Lund, 18 January 2010.Photo: Annika Nyberg

MAX-lab ACTIVITY REPORT 2010 321
SYNCHROTRON RADIATION – BEAMLINE I911
Structural Basis for Receptor Recognition of Vitamin-B12-Intrinsic Factor Complexes.
C.B.F. Andersen1,2 , M. Madsen2, T. Storm, S.K. Moestrup, and G.R. Andersen 1Department of Molecular Biology, Aarhus University, Denmark
2Department of Medical Biochemistry, Aarhus University, Denmark.
Cobalamin (Cbl, vitamin B12) is an essential coenzyme in mammals taken up from the diet by combined action of the gastric intrinsic factor (IF) and the ileal endocytic cubam receptor formed by the 460 kDa protein cubilin and the 45 kDa transmembrane protein amnionless. We have determined the crystal structure of the complex between IF-Cbl and the cubilin IF-Cbl-binding region (CUB5-8) at 3.3 Å resolution. The structure provides the first insight into how multiple CUB domains collectively function as modular ligand-binding regions and how two distant CUB domains in a Ca2+ dependent fashion bind the two IF domains embracing the vitamin B12 molecule. This dual-point model provides a likely explanation of how vitamin B12 indirectly induces ligand-receptor coupling. Anomalous data collected at MAX-lab 911-3 was essential for confirming the presence of calcium ions in each of the four CUB domains of the receptor fragment used in this study. The comparison of Ca2+-binding CUB domains and the LDL receptor-type A modules suggests that the electrostatic pairing of a basic ligand arginine/lysine residue with Ca2+ coordinating acidic aspartates/glutamates is a common theme of Ca2+ dependent ligand-receptor interactions.
Andersen, C.B.F, Madsen, M., Storm, T., Moestrup, S.K., and Andersen, G.R. (2010) Nature , 464, 445-8. Structural Basis for Receptor Recognition of Vitamin-B12-Intrinsic Factor Complexes.

322 MAX-lab ACTIVITY REPORT 2010
SYNCHROTRON RADIATION – BEAMLINE I911
Structural studies of an Hfq orthologue from the cyanobacterium, Synechocystis sp.
Andreas Bøggild1,2, Martin Overgaard1,3, Ane Feddersen1,2, Wimal Ubhayasekera3, Poul Valentin-Hansen1,3, and Ditlev E. Brodersen1,2
1Centre for mRNP biogenesis and metabolism, 2Department of Molecular Biology, University of Aarhus, Denmark, Gustav Wieds Vej 10c, DK-8000 Aarhus C, Denmark, 3Department of Biochemistry and Molecular Biology, University of Southern Denmark, Campusvej 55, DK-
5230 Odense M, Denmark, and 3MAX-lab, Lund University, SE-221 00 Lund, Sweden.
Hfq proteins are common in many species of enterobacteria where they participate in RNA folding and translational regulation through pairing of small RNAs and messenger RNAs. The proteins share the distinctive Sm-fold and form ring-shaped structures similar to the Sm/Lsm proteins regulating mRNA turnover in eukaryotes. Bacterial Hfq proteins are usually homohexameric while eukaryotic Sm/Lsm proteins are heteroheptameric. Recently, an Hfq orthologue was identified in the freshwater cyanobacterium Synechocystis sp. PCC 6803, here termed Syn-Hfq1. We have determined the crystal structure of Syn-Hfq at 1.3 Å resolution, and analysed RNA binding using synchrotron radiation at MAX-lab2.
Syn-Hfq appears as stable hexamer in solution as determined by gel filtration during purification of the protein. The crystals obtained belong to the face-centred space group F222 and diffract beyond 1.3 Å. The structure was determined by molecular replacement using poly-alanine models of the known bacterial Hfq structures and refined iteratively with manual rebuilding resulting in R/Rfree = 15.2%/20.1%. The high resolution electron density map for Syn-Hfq is exceptionally clear, except in the loop region 51-53, which appears to have an alternate, un-modelled
conformation and therefore contributes to the R factors being slightly on the high side for a 1.3 Å structure. The final model has three monomers of the hexamer in the A.S.U. and covers residues 5 to 69 in chain A and residues 5 to 70 in chains B and C. In the crystals, Syn-Hfq packs in double layers of two hexamers, with the proximal sides against each other. Between the layers, the hexamers are shifted and interact with their distal sides. Hfq proteins bind RNA and are implicated in RNA remodelling and pairing of mRNAs with anti-sense regulating RNAs. We are currently studying the RNA binding of Syn-Hfq by soaking specific RNA oligos into the crystals and collecting synchrotron diffraction data.

MAX-lab ACTIVITY REPORT 2010 323
SYNCHROTRON RADIATION – BEAMLINE I911
References:
1. Valentin-Hansen P, Eriksen M & Udesen C (2004) “The bacterial Sm-like protein Hfq: a key player in RNA transactions”, Mol Microbiol 51, 1525-1533.
2. Bøggild, A., Overgaard, M., Valentin-Hansen, P., and Brodersen, D. E. (2009) ”Cyanobacteria contain a structural homologue of the Hfq protein with altered RNA binding properties”, FEBS J, 276: 4328-39.

324 MAX-lab ACTIVITY REPORT 2010
SYNCHROTRON RADIATION – BEAMLINE I911
In-situ XRD studies on Ceramic Bone Substitutes
O. Börjesson1,2, V. Karlsson 2, D. Haase3
1 Pharmaceutical Technology, Department of Food Technology, Faculty of Engineering,
Lund University, SE-22100 Lund, Sweden
2 Bone Support AB, SE-223 70 Lund, Sweden
3 MAX-lab, Lund University, SE-22100 Lund, Sweden
In-situ X-ray scattering experiments on CSH/HA bone cement were carried out at beam line 911-5 at the MAX-laboratory in Lund. The aim was to expand earlier work 1,2 and study the setting of the cement with and without vancomycin. The underlying assumption was that studying the phase transitions over time would reveal what step of the reaction vancomycin affects.
The results of the studies are presented and discussed in the Master of Science Thesis with the title “Addition of Vancomycin to a Ceramic Bone Substitute – the Impact on Gypsym Setting” by Oskar Börjesson.
Figure. 1. 2d-plot of one series of measured samples, representing 46 single scans. [1] E. Lautenschläger, J. Harcourt, L. Ploszaj, Journal of Dental Research 48 (1969) [2] M.V.Cabanas, L.M. Rodriguez-Lorenzo, M.Vallet-Regi, Chemistry of Materials 14 (2002)

MAX-lab ACTIVITY REPORT 2010 325
SYNCHROTRON RADIATION – BEAMLINE I911
Structural analysis of mycobacterial branched-chain aminotransferase: implications for inhibitor design
Alina Castell, Christian Mille and Torsten Unge
Stereoview of the structural differences between the active sites of Ms-BCAT (gold) and the
mitochondrial Hs-BCAT (green; PDB code 1ekf). At the position of Gly243 in the M.
smegmatis enzyme the human BCATenzymes contain a threonine residue. This difference in
turn has an effect on the orientation of the side chain of Tyr209, which binds to the PLP
pyridine plane on the Si face in Ms-BCATand on the Re face in Hs-BCATs. Gly243 is one of
the substrate pocket-lining residues.
Department of Cell and Molecular Biology, Uppsala University, Uppsala Biomedical Center,
Uppsala, Sweden
The structure studies were based on data collected at MAX-lab beam lines 911. Data from
ESRF were aslo used. The structures, apo and holo forms, were refined to 1.9 and 2.2 Å
resolution. An intermediate binding site for an inhibitor was indicated. Mean I/σ(I) were 5.3
and 4.9. The structures were refined with Rwork/Rfree values of 0.19/0.24 and 0.20/0.23.

326 MAX-lab ACTIVITY REPORT 2010
SYNCHROTRON RADIATION – BEAMLINE I911
T
Folmer
1Enzyme2800 K
Probiotichealth efNCFM (Lgenome GH fampotential LaNCFM
The structur
r Fredslund1
e and ProteiKongens Lyn
cs are live mffect on theLaNCFM), cof LaNCFM
milies2 (http:of this bact
M, among w
re of a GHLa
, Marie Sofi
in Chemistryngby, Denma
Univers
microorganisme host. Mancommerciall
M revealed t//www.cazy
terium. Ninehich two ge
a(i
Tb(pRsurOas
R
234K5
SHpR
H13_31 -gctobacillus
e Møller1, M
y, DTU Systark - 2Biophysity of Copen
ms that adminy beneficially available the presencey.org), thus e genes classenes encode as oligo- -1(G16G), wisomaltoolig
The O16G fby optimizin(20% glyceprecipitant).Replacemenstatistics (froused for Mrefinement One of the sa loop the Nshown in the
References 1) Sanders M. E2) Altermann, E3) Kabsch, W. (4) Hondoh, H.,Kimura, A. (2005) Adams, P. D.
Supported by aHealth and Nutprebiotics/probiResearch Counc
glucosidases acidophi
Maher Abou Leggio2
tems Biologyysical Chemnhagen, DK
inistered in al effects of since the 19
e of 37 glycreflecting t
sifiable undeputative int
1,6-glucosidawhich aregosaccharide
from LaNCFng initial screrol, 16% The stru
nt (MR) usinom XDS3) a
MR was thstatistics (frstructural feaN-terminal pe figure.
E. and KlaenhamE., W. M. Russell1993). J. Appl. C, Saburi, W., M
08) J.Mol.Biol. 3, Afonine, P. V.
a grant from thtrition to the protics systems. F
cil for Natural Sc
e from the plus NCFM
Hachem1, B
y, Technical mistry Group,K-2100, Denm
adequate amthe probiot
970’s, have boside hydrothe signific
er GH13 wertracellular enase (O16G) e believede (IMO) cata
FM (LaGH1reening conPEG8000,
ucture was ng data colleas shown in he G16G frrom PHENIXatures is a capart of the s
mmer T. R. (2001l, et al. (2005) PCrystallogr. 26, Mori, H., Okuy378, 911-920
et al. (2010). Ac
he Danish Stratroject “Gene diFocus on carbcience.
probiotic bM
Birte Svensso
University o, Departmen
mark
mounts will ctic Lactobacbeen reportelases (GHs)
cant carbohyre identifiednzymes, tenand glucan-
d to be abolism.
3_31A) hasditions from
0.1 M Mdetermined
ected at beamthe Table b
from S. muX5) are shoalcium bindistructure (res
) J. Diary Sci. 8PNAS 102, 3906-
795-800. yama, M., Naka
cta Crystallogr.
tegic Research iscovery and moohydrate prebio
bacterium
on1 and Leila
of Denmark,nt of Chemis
confer a benecillus acidoped1. The ann) assigned inydrate catab
d in the genontatively iden
-1,6-glucopart of
s been crystam a JCSG+ sMES pH 6d by Molmline I911-2below. The mutans4. The own in the Ting site stabisidues 20-28
84, 319-331. -3912.
ada, T., Matsuu
D66, 213-221.
Council, Commolecular interacotics” and the
a Lo
DK-try,
eficial philus otated nto 13 bolism ome of ntified sidase
f the
allized screen
6.5 as ecular
2, with model
final Table. ilizing 8) and
ura, Y.,
mittee of ctions in
Danish

MAX-lab ACTIVITY REPORT 2010 327
SYNCHROTRON RADIATION – BEAMLINE I911
Crystal structure of the copper pump
Pontus Gourdon, Xiang-Yu Liu, J. Preben Morth, Bjørn Panyella Pedersen & Poul Nissen. Centre for Structural Biology, Aarhus University, Gustav Wieds Vej 10C, DK-8000 Aarhus C, Denmark.
Paradoxically some metals such as copper are essen-tial for our bodies while being poisonous at elevat-ed concentrations. As a consequence, heavy metal homeostasis and detoxifi-cation is crucial for cell viability. Class IB P-type ATPases play an essential role in these processes through the active extru-sion of heavy metal ions from cells. Humans have two such pumps, ATP7A and ATP7B that both two transport Cu(I) ions across our cellular membranes and when defect these give rise to the rare
but severe Menkes and Wilson diseases, respectively.
Using X-ray crystallography, we have determined the first high-resolution (3.2 Å) structure of the entire protein family: a Cu(I) Class IB P-type ATPase from the bacterium Legionella pneumophila caugh in a copper-free conformation (Figure) (Gourdon et al., Nature, accepted for publication). MAXLAB allowed for most of the screening of (optimised) crystals as well as for collection of some of the data sets used for solving the structure (Table).
The structure displays the three cytoplasmic domains that are common to all P-type ATPases associated the transmembrane domain. The latter contains only eight transmembrane helices of which the two most N-terminal are unique to the class IB P-type ATPAses. In addition, electron density derived from experimental phases indicate the approximate position of the so-called heavy-metal-binding-domain; a characteristic feature of the protein class. In addition, the structure suggests a putative copper transport pathway that allows the ions to be transported through the membrane. Ions are initially captured by so-called protein-chaperones that bind almost all free copper in the cell. We propose that the copper then may be transported through the protein in three stages with 1) an ion entry site (for ions from the protein-chaperones) including a conserved Asp-Met pair on the inside of the cell, 2) ion binding sites in the membrane spanning part of the protein and 3) a subsequent extracellular exit site. In addition to the mechanistic insights that our structure has yielded, the structure provides a unique framework for understanding the molecular mechanisms behind new as well as previously described missense mutations in the human ATP7A and ATP7B.
Data statistics for a sub-set of the data sets collected to solve the reported structure.
Architecture of the copper pump. The transmembrane spanning part, with eight helices, is displayed under the characteristic P-type ATPase head piece com-posed of the soluble do-mains. Electron density maps shown at =2 (black),
=1 (blue) and =0.5 (pur-ple) are derived from experi-mental phases. Orange elec-tron density peaks demon-strate anomalous SeMet positions at =4.
hi f h

328 MAX-lab ACTIVITY REPORT 2010
SYNCHROTRON RADIATION – BEAMLINE I911
Optimization of SR beamline alignment
Yu. A. Gaponov1, Y. Cerenius1, J. Nygaard2, T. Ursby1, K. Larsson1
1 MAX-lab, Lund University, P.O.B. 118 SE-221 00 Lund, Sweden 2 Faculty of Life Sciences, University of Copenhagen, DK-1871 Frederiksberg C, Denmark
Based on Synchrotron Radiation (SR) beamline optical element-by-element alignment with analysis of the alignment results an optimized beamline alignment algorithm has been designed and developed.
The alignment procedures have been designed and developed for the MAX-lab I911-4 fixed energy beamline. It has been shown that the intermediate information received during the monochromator alignment stage can be used for the correction of both monochromator and mirror without the next stages of alignment of mirror, slits, sample holder, etc. Such an optimization of the beamline alignment procedures decreases the time necessary for the alignment and becomes useful and helpful in the case of any instability of the beamline optical elements, storage ring electron orbit or the wiggler insertion device, which could result in the instability of angular and positional parameters of the SR beam.
Fig.1 The general layout of beamline I911-4. The layout, drawn by dotted lines, shows the
mirror when it is not aligned with the slit system. 2 mirr is the angle between the aligned and misaligned beams. S' is the SR source image at aligned position. The plot represents the functional dependency between the changes of the monochromator tilting and the mirror Bragg angle .
The I911-4 fixed energy beamline (Fig.1) is a SAXS side station beamline with a
horizontally focusing monochromator (in a tilted vertical plane) and a vertically focusing curved multilayer mirror with longitudinally graded d-spacing and with several beam shaping and anti-scatter slits [1]. At the first beamline alignment all slits should be opened to let the beam pass through the complete beamline unaffected. The first approximations of the parameters for the monochromator and the mirror are calculated from the beamline geometry. The monochromator theta is used to adjust the beam in the horizontal plane. The monochromator tilting together with the mirror angle and z-position are used to adjust the beam in the vertical plane. During the monochromator tilting scan the beam cone (cone-shaped diverging SR beam with the source image S') is turned around the -axis (which is perpendicular to tilting axis and which lies in the horizontal plane). The angles of beam cones with the fitted source images might be different, which means that only common part of beam cones can pass through the slit system. The monochromator is bent so that the focus of the SR beam is at the area detector plane. Afterwards all slits, sample holder and beam stopper are adjusted to fit the center of the beam. After finishing

MAX-lab ACTIVITY REPORT 2010 329
SYNCHROTRON RADIATION – BEAMLINE I911
References [1] C.B. Mammen, T.Ursby, Y.Cerenius, M.Thunnissen, J.Als-Nielsen, S.Larsen and A.Liljas,
Proceedings of the Symposium on Synchrotron Crystallography, Krynica, Poland, 2001, Acta Physica Polonica, Vol .101, N5 (2002) 595-602.
http://przyrbwn.icm.edu.pl/APP/PDF/101/A101Z504.pdf [2] Yu.A.Gaponov, N.Matsugaki, N.Honda, K.Sasajima, N.Igarashi, M.Hiraki, Y.Yamada,
S.Wakatsuki, AIP Conf. Proc., 879 (2007) 1932-1935.
the first beamline alignment all corrected optical element parameters are stored for the selected beamline setup.
Due to different reasons (unstable temperature or high heat load of optical element, unstable storage ring orbit, not stable mechanical properties of optical element) it is necessary to realign the beamline time-by-time. At least three types of realignment procedure can be identified: a) a-type - complete beamline element-by-element alignment with adjustment of all optical elements; b) b-type - adjustment of the SR beam to the slit system (sample-holder and beam stopper); c) c-type - adjustment of the slit system (sample-holder and beam stopper) to the SR beam.
The monochromator and the mirror at I911-4 cannot be considered as independent optical elements. The angle of the mirror is defined by the incident beam, which depends on the tilting angle of the monochromator, which ultimately depends on the incident beam angle in the vertical plane at the front-end. Within the rocking curve of the mirror the reflected beam passes through the aligned slit system and can be monitored. During the monochromator tilting scan monitor M2 (see Fig.1) monitors the intensity after the slit system. The functional dependence between the monochromator tilting and the mirror Bragg angle is approximately linear at small values of monochromator tilting angle. So, for deviations one can write: ~ 2 mirr k· or /k. For I911-4 the linear coefficient k is about k 1.64 (Fig.1). After completing the monochromator tilting scan the mirror correction value is calculated using the measured and used to move the mirror to the calculated Bragg angle position. In such a way the beamline can be realigned without the realignment of all optical elements downstream the mirror (optimized b-type realignment).
A general purpose software package for manual, semi-automatic and automatic SR beamline alignment has been designed and developed using the developed algorithm. Multi-processing with Unix Interprocess Communications and RunEngines were used to make software safe to access in parallel to the beamline equipment and being protected from human mistakes and equipment failures [2]. The TANGO control system [3] is used as the middle-ware between the standalone beamline control applications BLTools (Fig.2), BPMonitor and the beamline equipment.
Fig.2 The view of the BLTools application during the optimized b-type realignment
procedure.
[3] Chaize, J.-M., A. Götz, W.-D. Klotz, J. Meyer, M. Perez, E. Taurel, “TANGO – An Object Oriented Control System Based on CORBA”. Proceedings of the International Conference on Accelerator and Large Experimental Physics Control Systems (ICALEPS ’99), Trieste, Italy, (2000) 663-665.

330 MAX-lab ACTIVITY REPORT 2010
SYNCHROTRON RADIATION – BEAMLINE I911
Two Novel Layered Germanates with Extra-Large Rings
Bing Guo1,2, A. Ken Inge2, Charlotte Bonneau2, Junliang Sun2, Kirsten E. Christensen3, Zhong-Yong Yuan1, and Xiaodong Zou2
1Institute of New Catalytic Materials Science, College of Chemistry, Nankai University, Tianjin 300071, People’s Republic of China
2Inorganic and Structural Chemistry and Berzelii Center EXSELENT on Porous Materials, Department of Materials and Environmental Chemistry, Stockholm University, SE-106 91
Stockholm, Sweden 3Diamond Light Source Ltd., Diamond House, Chilton, Didcot, Oxfordshire, OX11 0DE, UK
Porous oxide materials with uniform pores and channels have been of continuous interest for
applications regarding size and shape selective adsorption, ion exchange, separation, and catalysis.1 From the assembly of large clusters such as Ge7X19 (Ge7), Ge9X26-m (Ge9) and Ge10X28 (Ge10) (X = O, OH, F, m = 0-1) a growing number of germanium oxide structures have been discovered with extra-large rings (>18-membered rings). Here we report the synthesis and crystal structures of two layered germanates, entitled SU-63 and SU-64,2 prepared under related conditions as ASU-21.3 Varying the water and/or HF content of the starting mixture resulted in the formation of the three phases. The phases each formed under well defined phase boundaries, and each phase consists of various germanate clusters.
SU-63, SU-64, and ASU-21 were prepared by hydrothermal synthesis from a gel of germanium dioxide, water, pyridine, 1,6-diaminohexane (DAH), and HF (40 wt%) with a molar ratio 1:x:39.1:20.0:y. The range of water/GeO2 and HF/GeO2 ratios for each phase are indicated on the phase diagram in figure 1. The mixtures were stirred for two hours, placed in 22mL Teflon-lined autoclaves, and then heated at 160°C for seven days. All product crystals were filtered, washed with distilled water, and dried at room temperature overnight.
Single crystal X-ray diffraction data
of SU-63 were collected on a MarCCD at 100(2) K using a synchrotron radiation ( =0.91Å) at the Beam line I911:5, Max Lab, Lund University, Sweden. Data reduction and numerical absorption correction were applied by the TwinSolve software.4 Single crystal X-ray diffraction data of SU-64 were collected on a Saturn 724+ detector at 150(2) K using a synchrotron radiation ( =0.69Å) at the Beam line I19 (EH1), Diamond Light Source, UK. Data reduction and numerical absorption correction were applied with d*TREK within CrystalClear.5 The structures were solved and refined by SHELX.
Crystal data for SU-63 (|1.5H2DAH|[Ge7O14(OH)3]·2H2O): P63cm, a = 28.794(2) Å, c = 20.603(4) Å, V = 14793(3) Å3. 150 80 20 m3. A total of 51182 reflections, of which 8692 are unique. Rint = 0.0954, R1 = 0.0851 and wR2 = 0.2163 for reflections with I > 2 (I). Crystal data for SU-64 (|11H2DAH|[Ge9O18OH4][Ge7O14(OH)3]6·16H2O): P-1, a = 12.101(4) Å, b = 18.113(6) Å, c = 22.444(8) Å, = 87.86(1) °, = 89.50(2) °, = 83.17(1) °, V = 4881(3) Å3. 30 8 2 m3. A total of 42228 reflections, of which 15210 are unique. Rint = 0.1435, R1 = 0.1296 and wR2 = 0.3363 for reflections with I > 2 (I).
Figure 1 The phase diagram of SU-63, SU-64, and ASU-21 with water content and HF as variables. Polyhedral representations of the clusters that compose the various phases are illustrated with octahedral GeO6 in red, trigonal bipyramidal GeO5 in yellow, and tetrahedral GeO4 in green. Gray points indicate absence of a porous crystalline product.

MAX-lab ACTIVITY REPORT 2010 331
SYNCHROTRON RADIATION – BEAMLINE I911
___________________________________1. ejka J.; van Bekkum, H.; Corma, A.; Schüth, F. (eds) Introduction to Zeolite Science and Practice 3rd ed; Stud.
Surf. Sci. Catal., 2007, 168, Elsevier, Amsterdam. 2. Guo, B.; Inge, A.K.; Bonneau, C.; Sun, J.L.; Christensen, K.E.; Yuan, Z.Y. and Zou, X.D. Inorg. Chem., 2010, 50,
201–207. 3. Bonneau, C.; Sun, J.; Sanchez-Smith, R.; Guo, B.; Zhang, D.L.; Inge, A. K.; Edén, M.; Zou, X.D. Inorg. Chem.,
2009, 48, 9962-9964. 4. TwinSolve (2006) A Program for the Decovolution and Processing of Rotational Twins, Rigaku Inc. and Prekat
AB 1998-2006. 5. Rigaku Americas and Rigaku Corporation (2009). CrystalClear (Version 2.0). Rigaku Americas, 9009 TX, USA
77381-5209.
SU-63 is built of stacked layers of Ge7 clusters decorating a 3.6.3.6 Kagomé lattice. The clusters form 6 and 18-membered rings in the ab-plane. 18-rings of neighboring layers stack resulting in one-dimensional channels. DAH was disordered between the layers with their presence confirmed by CHN elemental analysis and thermogravimetric analysis. SU-64 is a slab structure with strips of Ge7 clusters joined by Ge9 clusters. Intersecting 10 and 18-ring channels run through the lengths of the slab. DAH was located within the 18-ring channels and between slabs. In situ XRPD revealed changes in the unit cell angle from 88.21 to 79.57° at 30°C and 200°C respectively suggestive of a shift in the stacking of layers.
As indicated in the phase diagram, within this system the rough concentration of HF affected the
type of cluster building unit used to fabricate the resulting crystalline phase. Low concentrations of HF lead to ASU-21, a 3D Ge10 framework built from hexagonal packing of rigid cylinders. High concentrations lead to SU-63 with Ge7 clusters, while relatively intermediate HF concentrations lead to SU-64 combining Ge7 and Ge9 clusters.
We have presented two novel germanate structures that have been prepared by modifying the
synthesis conditions of ASU-21. Linking synthesis conditions with the final crystalline product may lead to better control over the formation of germanate clusters and consequently lead to the discovery of other novel structures.
Acknowledgement We thank M. Peskov for his initial topology analysis of SU-63 and SU-64. C. Bonneau and J.-L. Sun were supported by post doctoral grants from the Wenner-Gren and Carl-Trygger Foundations, respectively. This project is supported by VR and VINNOVA through the Berzelii Center EXSELENT and Göran Gustafsson Foundation.
Fig. 2 Polyhedral representations of (a) SU-63 and (b) SU-64.

332 MAX-lab ACTIVITY REPORT 2010
SYNCHROTRON RADIATION – BEAMLINE I911
Structural studies on the human mitochondrial
acetoacetyl-CoA thiolase (T2)
A.M. Haapalainen and R.K. Wierenga
Biocenter Oulu and Department of Biochemistry, University of Oulu, P.O. Box 3000, FIN-90014 University of Oulu, Finland
Thiolases have many important roles in different biochemical pathways. Depending on subcellular locations they participate either in the degradative or biosynthetic pathways. Currently, in humans, six different thiolases have been identified. Three of those are mitochondrial enzymes, two can be found within peroxisomes, and one is a cytosolic thiolase. The peroxisomal thiolases are homodimeric enzymes; the rest are homotetrameric enzymes, except the mitochondrial protein complex which is composed of four and four subunits; the subunit is thiolase. Two of the characterised thiolases, mitochondrial acetoacetyl-coenzyme A (CoA) thiolase (T2) and cytosolic acetoacetyl-CoA thiolase (CT), are short-chain specific acetoacetyl-CoA thiolases and are classified as biosynthetic thiolases (EC 2.3.1.9).1 Enzymatically T2 can be distinguished from the other thiolases by its requirement for potassium ions for full activity2. The kinetic measurements showed that in the presence of K+ the catalytic efficiency of T2 increased approximately six fold3. Furthermore, T2 degrades 2-methyl-acetoacetyl-CoA exclusively.
The biosynthetic thiolases catalyse the nondecarboxylating Claisen condensation of two acetyl-CoAs to form acetoacetyl-CoA4; this involves the catalytic triad of Cys-Cys-His. In the first half of the reaction, one of the active site cysteine becomes acetylated (Figure 1). In the second half of the reaction another acetyl-CoA molecule enters the active site and the above mentioned Claisen condensation reaction, the formation of C-C bond, takes place (Figure 1). Finally, acetoacetyl-CoA is released.5
Figure 1: The Claisen condensation reaction, as catalysed by T2. In the first part of the reaction cycle (the top panel) the catalytic cysteine, Cys126, becomes acetylated. During the second part of the cycle another acetyl-CoA enters the active site and acetoacetyl-CoA is released (the bottom panel).
Even though the reaction mechanism of bacterial biosynthetic thiolase (bCT) has been
studied extensively, the reaction mechanism is not yet fully understood5,6. Our ultimate aim is to understand the fine details of these reaction mechanisms which will give us more information on how these enzymes work. Especially, we are interested in reaction intermediates and transition state intermediates of the reactions catalysed by thiolases. This would then allow us to design new inhibitors of these enzymes, for instance.

MAX-lab ACTIVITY REPORT 2010 333
SYNCHROTRON RADIATION – BEAMLINE I911
References: 1 T. Fukao in “Wiley Encyclopedia of Molecular Medicine” vol 5, 3125-3129 (John Wiley & Sons, Inc.
2002). 2 T. Fukao in “Wiley Encyclopedia of Molecular Medicine” vol 5, 6-9 (John Wiley & Sons, Inc. 2002). 3 A.M. Haapalainen, G. Meriläinen, P.L. Pirilä, N. Kondo, T. Fukao, and R.K. Wierenga, Biochemistry,
46, 4305-4321, (2007). 4 R.J. Heath and C.O. Rock, Nat. Prod. Rep. 19, 581-596, (2002). 5 P. Kursula, J. Ojala, A.-M. Lambeir, and R.K. Wierenga, Biochemistry 41, 15543-15556, (2002). 6 S.F. Williams, M.A. Palmer, O.P. Peoples, C.T. Walsh, A.J. Sinskey, and S. Masamune, J. Biol.
Chem. 267, 16041-16043, (1992).

334 MAX-lab ACTIVITY REPORT 2010
SYNCHROTRON RADIATION – BEAMLINE I911
The macromolecular crystallisation facility at MAX-lab
Maria Håkansson1 & Derek T. Logan1,2
1SARomics Biostructures AB, Box 724, 222 07 Lund, Sweden2Dept. of Biochemistry and Structural Biology, Lund University, Box 124, 221 00 Lund,
Sweden
An efficient facility for low-volume screening of crystallisation conditions has been in operation at MAX-lab for five years. The facility is open for all academic users and is run by SARomics Biostructures AB on behalf of MAX-lab. The equipment consists of a TECAN Freedom EVO 150 robot for general liquid handling, a Mosquito nanolitre pipettor from TTP Labtech that is used to set up the crystallisation drops, and a CrystalPro imaging system from Tritek Corporation for photographic documentation and database storage of the experiments. We also have a Stratagene Mx3500p qPCR machine for differential scanning fluorimetry. The Stratagene equipment is used to find stabilising buffer conditions and additives.
During 2010 the facility was used by 23 scientists from 14 research groups: 11 at Lund University (including the Departments of Biochemistry and Structural Biology, Pure and Applied Biochemistry, Biophysical Chemistry, Organic Chemistry, Cell and Organism Biology, Glycobiology and Biotechnology), one from Copenhagen University, one from the Carlsberg Laboratory in Copenhagen and one from Uppsala University. In addition SARomics Biostructures has carried out 6 academic projects (in collaboration with the Departments of Immunotechnology, Biotechnology, BMC, Clinical Chemistry and Pure and Applied Biochemistry at Lund University, as well as researchers from the University of Hannover in Germany), resulting in many new crystallisation conditions and five new crystal structures.
Results from the macromolecular facility have been presented in four publications (Diehl et al. 2010, Helgstrand et al. 2010, Johansson et al. 2010 and Leinartaité et al. 2010) and two dissertations (G. Svensson, 2011 and R. Yengo, 2011). The generally long lag time between crystallisation and publication of crystal structures means that several more publications are in the pipeline.
In late 2010 the crystallisation facility received a grant of 3.4 MSEK from the Swedish Research Council in order to undertake a major upgrade of the equipment. In the first hand the grant will be used to improve the experimental imaging system to include a “plate hotel” that will improve throughput. We also aim to extend the range of biophysical characterisation techniques that we offer to include high-throughput dynamic light scattering. With these improvements the facility will take important steps to becoming a national laboratory integrated with the structural biology beamlines at MAX IV and with a pipeline for protein production within Lund University.
PublicationsC. Diehl, O. Engström, T. Delaine, M. Håkansson, S. Genheden, K. Modig, H. Lef er, U. Ryde, U. J. Nilsson, and M.
Akke. Protein flexibility and conformational entropy in ligand design targeting the carbohydrate recognition domain of galectin-3. J. Am. Chem. Soc. 132, 14577–14589, 2010.
C. Helgstrand, M. Hasan, H. Uysal, J.Z. Haeggström & M.M.G.M. Thunnisen A leukotriene A4 hydrolase-related aminopeptidase from yeast undergoes induced fit upon inhibitor binding. J. Mol. Biol. 406, 120-134, 2011.
R. Johansson, E. Torrents, D. Lundin, J. Sprenger, M. Sahlin, B-M. Sjöberg and D. T. Logan. High-resolution crystal structures of the flavoprotein NrdI in oxidized and reduced states - an unusual flavodoxin. FEBS J, 277, 4265–4277, 2010.
L. Leinartaité, K. Saraboji, A. Nordlund, D. T. Logan, and M. Oliveberg. Folding catalysis by transient coordination of Zn2+ to the Cu ligands of the ALS-associated enzyme Cu/Zn superoxide dismutase 1. J. Am. Chem. Soc. 132, 13495–

MAX-lab ACTIVITY REPORT 2010 335
SYNCHROTRON RADIATION – BEAMLINE I911
Our annual Christmas card
13504, 2010.
R. Yengo, Structural and functional studies of the Wilms’ Tumour 1 protein (WT1) in interaction with nucleic acids.,Ph.D. thesis, Department of Biochemistry and Structural Biology, Lund University, Lund, Sweden, ISBN 978-91-7422-260-9, 2011.G. SvenssonCharacterization and Crystallization of Anchorless Glypican-1. Ph.D. thesis, Department of Experimental Medical Science, Lund University, Lund, Sweden, ISBN 978-91-86671-51-8, 2011.

336 MAX-lab ACTIVITY REPORT 2010
SYNCHROTRON RADIATION – BEAMLINE I911

MAX-lab ACTIVITY REPORT 2010 337
SYNCHROTRON RADIATION – BEAMLINE I911
Current status: manuscript on structure is in preparation
D’Ambrosio, K., Pailot, A., Talfournier, F., Didierjean, C,. Benedetti, E., Aubry, A., Branlant, G. and Corbier, C. (2006). Biochemistry 45, 2978-2986.
McCoy A. J., Grosse-Kunstleve R. W., Adams P. D., Winn M. D., Storoni L. C., Read R. J.J Appl Crystallogr. (2007) Aug 1;40(Pt 4):658-674
The NAD+ form of ALDH was formed by soaking crystals over night in stabilising solution containing 2 mM NAD+ and 2 mM CaCl2. In this way full occupancy of Ca2+ sites and NAD+
sites was achieved. Data on the NAD+ form were collected at I911-2 to 1.75 Å resolution. The reactive cysteine, Cys302, changes conformation upon NAD+ binding since its apo conformation collides with the nicotinamide ring of NAD+. With NAD+ bound the side chain of Cys302 has the appropriate conformation to readily form the thioacyl intermediate (step 2 in figure 1) since it is in close proximity to NAD+ and Asn168, which probably stabilises the intermediate, as has been shown for a homologous enzyme (D’Ambrosio et al., 2006).
Figure 2) The dimer in the asymmetric unit, binding one NAD molecule per monomer

338 MAX-lab ACTIVITY REPORT 2010
SYNCHROTRON RADIATION – BEAMLINE I911
Non-specific CBM4-2 variant X-2 L110F - apo, xylopentaose, cellopentaose structures
Maria Håkansson1, Derek T. Logan1, Laura von Schantz2, Eva Nordberg Karlsson3
& Mats Ohlin2 1SARomics Biostructures AB, Box 724, 222 07 Lund, Sweden
2Department of Immunotechnology, Lund University, BMC D13, 221 84 Lund, Sweden 3Department of Biotechnology, Lund University, Box 124, 221 00 Lund, Sweden
Carbohydrate binding modules can be used for developement of specific binders for use e.g. in bioanalysis. A key aspect of the use of carbohydrate-specific probes in a variety of applications is their ability to differentiate between the many different carbohydrates that exist in biological samples. Specific antibodies are often used as probes to detect biomolecules in complex samples but they are often not that specific for individual carbohydrates (Pattathil et al., 2010). The carbohydrate-binding module CBM4-2 derived from Rhodothermus marinus, has also been explored to develop carbohydrate-specific probes (Cicortas Gunnarsson et al., 2004) for use in a variety of applications (Filonova et al., 2007; von Schantz et al., 2009; Sandquist et al., 2010). In the work presented here we have elucidated at the molecular level features of carbohydrate recognition of highly similar specific and cross-reacting probes. A single amino acid mutation L110F turns the specific xylose binding CBM4-2 variant X-2 (Cicortas Gunnarsson et al., 2007) into a more non-specific binder of not just xylose oligomers but also linear glucose oligomers as well as branched carbohydrates, such as xyloglucan (von Schantz et al., in preparation). The structures of X-2 alone and in complex with xylose oligomers have been determined previously (Håkansson et al., 2009; von Schantz et al., in preparation) within this project. The structures of the apo variant, the xylopentaose and cellopentaose co-crystal structures of X-2 L110F were now determined to 1.1, 1.4 and 1.3 Å resolution respectively. Crystals were made in MRC plates or NEXTAL plates at the macromolecular crystallization facility at MAX-lab. Diffraction data were collected at beamline I911-2. The structures were determined using molecular replacement using the previously determined structure of the X-2 variant of CBM4-2 (von Schantz et al., in preparation). The overall structure of X-2 L110F and X-2 is the same (r.m.s. deviation of C = 0.17 Å for 152 positions compared). The mutation L110F that confers cross-reactive binding properties to the module is situated in the central cavity of the carbohydrate binding cleft. The larger hydrophobic surface of the phenylalanine (compared to a leucine) in combination with plasticity of side chains in the carbohydrate binding cleft allows it to accommodate sugar oligomers based on monomers other than xylose, see figure 1. However only two or three out of five sugar rings are visible in the cellopentaose-containing structure probably due to absence of surface complementarity and clashing side chains.

MAX-lab ACTIVITY REPORT 2010 339
SYNCHROTRON RADIATION – BEAMLINE I911
Figure 1L110F. Tare sandL110F aphenylal Current Cicortasand M. OFilonovaCicortasNordberHåkanssReport toPattathil Davis RHR., O'NeSandqui796-807von SchG, Nordb
) XylopentaThe three sdwiched beand is thereflanines (all
status: man
s GunnarssoOhlin. (2004a, L. Cicortas Gunnarssorg Karlsson son M., Logo MAX-LabS, Avci U,
H, Chennareil M., York st D, Filono. antz L, Gulberg-Karlss
aose boundsugar rings tween F110for not so dfive xylose
nuscript on
on L, E. No4) Protein Eas Gunnarson L., C. ME. and Oh
gan, D.T., vb 2009.
Baldwin D,reddy C., DW.S., Hahn
ova L, von S
lfot F, Scheson E, Brum
d to X-2 L11(out of five)0 and F69. dependent oe rings visib
structures
ordberg KarEng Des Sesson, G. Daontanier, Rlin M. (2007
von Schantz
, Swennes Dong R., O'Sn M.G. (201Schantz L,
eer S, Filonmer H and O
10F aligned) possible tThe xylose
on the sandle).
is in prepa
rlsson, A-S el 17: 213-2aniel and MR.B. Tunnicl7) Biochemz L., Nordbe
AG, McGillShea B., Ro10) Plant POhlin M. an
nova L, CicoOhlin M. (20
d with cellopo model in e makes modwich intera
ration
Albrecht, M221. . Ohlin. (20liffe, M.P. W
m J 406, 209erg Karlsso
l JA, Poppeossi R., Leo
Physiol 153,nd Daniel G
ortas Gunn009) BMC
pentaose bthe elcetroore interactaction betw
M. Andersso
007) Plant BWilliamson, 9-214. on E. and O
er Z, Bootteoff C., Fres, 514-525 G. (2010) B
arsson L, FBiotechnol
bound to X-2on density mtions to X-2
ween the
on, O. Hols
Biol 7, 54. Gilbert H.J
Ohlin M. (20
en T, Albertshour G., N
BioResource
Flint JE, Da9, 92.
2 maps 2
st
J.,
009)
t A, arra
es 5,
aniel

340 MAX-lab ACTIVITY REPORT 2010
SYNCHROTRON RADIATION – BEAMLINE I911
Crystallography and microsecond multiple molecular dynamics simulation in concert: Structure of an intrinsically disordered nerve agent antidote in complex with sarin-AChE
Andreas Hörnberg1,Yuan-Ping Pang2, Fredrik Ekström1 1FOI CBRN Defence and Security, S 901-82, Umeå, Sweden. 2 Mayo Clinic, Rochester,
United States of America Email; [email protected]
Organophosphorous (OP) nerve agents and insecticides are some of the most poisonous chemicals known to mankind. They inhibit the essential enzyme acetylcholinesterase (AChE) by a rapid phosphylation of the catalytic serine residue. Compounds such as fenamiphos and methamidophos are widely used in modern agriculture, and the nerve agents continue to be a threat in the world due to their possible use in terrorist acts. The OP insecticides is estimated to cause between 2 to 5 million intoxications per year, of which around 300 000 are fatal. Design of effective nerve agent antidotes to various OP compunds requires information on how the reactivators interact with the phosphonylated AChEs. However, antidotes (i.e. reactivators), are preferably are flexible or mobile to be able to convert from the ground state to the transition state for reactivation. This mobility makes reactivators intrinsically disordered in crystal structures. Moreover, complexes of nerve agents and antidotes are chemically unstable, further complicating crystallographic studies.
Figure 1. The 2.2 Å crystal structure of sarin-AChE in complex with HI-6. Sarin is shown in yellow while the ordered and disordered portion of HI-6 is shown in orange and magenta, respectively. The reactive part of HI-6 could not be built in the electron density map, but was analysed using MMDS.
A strategy to address the challenges associated with structural studies of reactivators is exemplified in our work with a ternary complex of acetylcholinesterase (AChE), inhibited by the nerve-agent sarin in complex with the reactivator HI-61. In this study, the ordered portion of HI-6 was determined by X-ray crystallography (Figure 1). The crystal structure was used as a starting structure in a Multiple Molecular Dynamics Simulation (MMDS) where the reactive (disordered) portion of HI6 was investigated. In addition, enzyme kinetics was employed to cross-validate the structural data. Based on these studies, we suggest that the nucleophilic part of the reactivator (i.e. the oxime moiety) enters the active site gorge of AChE in its neutral (protonated) form and that a hydrogen bonding network among a tetrad (Glu334-His447-wat-oxime) is necessary to deprotonate the oxime prior to reactivation. The importance of a hydrogen bonding network between Glu334, His447 and the oxime is supported by the complex between AChE, the insecticide fenamiphos and the reactivator ortho-72. The study of fenamiphos also implicates that entrapment of the reactivator at the ground state may contribute to a low reaction rate by preventing the oxime to reach the transition-state for reactivation. In our opinion, these studies show that mobility or flexibility is as important as affinity for reactivator design.

MAX-lab ACTIVITY REPORT 2010 341
SYNCHROTRON RADIATION – BEAMLINE I911
1. F. Ekström, A. Hörnberg, E. Artursson, L-G. Hammarström, G. Schneider,
Y-P. Pang, Structure of HI-6•sarin-acetylcholinesterase determined by X-ray crystallography and molecular dynamics simulation: reactivator mechanism and design. PLoS One,4, e5957, 2009
2. A. Hörnberg, E. Artursson, R. Wärme, Y-P. Pang, F. Ekström, Crystal
structures of oxime-bound fenamiphos-acetylcholinesterases: reactivation involving flipping of the His447 ring to form a reactive Glu334-His447-oxime triad. Biochem Pharmacol.,79, 507-15. Epub 2009 Sep 2, 2009

342 MAX-lab ACTIVITY REPORT 2010
SYNCHROTRON RADIATION – BEAMLINE I911
Flexibility and communication within the structure of the
Mycobacterium smegmatis methionyl-tRNA synthetase (metRS)
Henrik Ingvarsson, Torsten Unge
Department of Cell and Molecular Biology, Uppsala University, Uppsala Biomedical Center,
Uppsala, Sweden
The structure studies were based on diffraction data collected at the 911 beam lines at
MAX-lab in Lund. Two complexes of the enzyme were included in the study; metRS in
complex with the substrates methionine (alone) and the methionine and adenosine. Data were
collected with a beam wavelength of 1.038 Å, and the diffraction pattern are obtained to 2.3
and 2.8 Å resolution. Mean I/σ(I) were 11.8 and 17.8 for the two data sets and Rp.i.m 5.1 and
3.3. The structures were solved with molecular replacement and could be refined to the limits
of the data collections. The structures demonstrate the flexibility of the multidomain enzyme.
A new conformation of the structure has been identified in which the connective peptide
domain binds closer to the catalytic domain than described earlier. The potential use of the
adenosine binding site for inhibitor binding has been evaluated and a potential binding site for
a specific allosteric inhibitor has been identified.
Overall structure of metRS from Mycobacterium smegmatis

MAX-lab ACTIVITY REPORT 2010 343
SYNCHROTRON RADIATION – BEAMLINE I911
Ana Labrador presenting the new multipurpose SAXS station for Marc Obiols-Rabasa, Lund University, at the poster session during the Annual User Meeting, 8 November 2010.Photo: Annika Nyberg

344 MAX-lab ACTIVITY REPORT 2010
SYNCHROTRON RADIATION – BEAMLINE I911
Table 1: Details of data collected on Zebra fish interferon crystal.
Data collection Beam line Lund I-911 Soak - Anomalous signal (f´´) - Wavelength (Å) Space group P21 Cell dimensions a/b/c (Å ) 48.834/62.247/51.306 Cell angels / / ( ) 90.000/91.424/90.000 Resolution (A ) 2.10 Reflections 60560 Completeness (outer shell) (%) 96.3 (78.9) Data redundancy (outer shell) 3.5 (2.4) Mean I/ I (outer shell) 2.1 (2.7) Rsym (outer shell) (%) 9.1 (32.4) Resolution range used (A ) 48.818-2.086 R (%) 23.72 Rfree (%) 18.13 Number of atoms/solvent molecules/ions
2776/179/2
Zebra fish interferons
Ole Jensen Hamming and Rune Hartmann
Centre for Structural Biology, Department of Molecular Biology, Aarhus University, Denmark
Cells respond to viral infections by producing hormone-like compounds called interferon’s (IFNs), which are danger signals that warn surrounding cells of the approaching danger (the virus). We are investigating how these cytokines interact with their cognate receptor and induce signalling across the cell membrane. We are currently engaged in an effort to determine the evolutionary relationship between the interferons of mammals and zebra fish. The zebra fish has homologs all the internal signalling and transcriptions factors involved in interferon signalling in mammals. It is however not known if the interferons of zebra fish corresponds to mammalian type I or III interferons. Determining this will help to establish to what extend the zebra fish can be used as a model organism of interferon action. During 2009 we collected data on zebra fish IFN-1, (IFN 1). We managed to get a dataset with a resolution of 2.1. For further details see table 1. The structure was solved (Figure 1) using molecular replacement with a model of zebra fish interferon 2 that was solved using data collected at maxlab in 2008. Both these structures form part of my PhD thesis (1). A paper of the structures of the Zebra fish interferons is currently being written.

MAX-lab ACTIVITY REPORT 2010 345
SYNCHROTRON RADIATION – BEAMLINE I911
Figur 1: Structure of zebra fish interferon 1. The structure of Zebra fish interferon 1 solved to 2.1 Å. The structure shows the classicaltype II cytokine fold with 5 long and 1 short helix forming an elongated “American football” type structure.
Based on the structure of the Zebra fish interferons we determined that the zebrafish interferon system is closly related to the mammalian type I interferons. This means that the zebrafish is a convinient modelorganism for the mammalian type I interferon system. 1: Hamming, O.J PhD thesis:”The Interferon System of Humans and Fish – A Structural Point of View”.

346 MAX-lab ACTIVITY REPORT 2010
SYNCHROTRON RADIATION – BEAMLINE I911
High-resolution crystal structures of the flavoprotein NrdI in oxidised and reduced states: an unusual flavodoxin
Renzo Johansson1, Eduard Torrents2, Daniel Lundin3, Janina Sprenger1, Margareta Sahlin3, Britt-Marie Sjöberg3 & Derek T. Logan1
1Dept. of Biochemistry and Structural Biology, Lund University, Box 124, 221 00 Lund, Sweden; 2Cellular Biotechnology. Institute for Bioengineering of Catalonia. Baldiri Reixac 15-21. 08080 Barcelona. Spain; 3Dept. of Molecular Biology and Functional Genomics, Stockholm University,
S-106 91 Stockholm, Sweden
The small flavoprotein NrdI is an essential component of the class Ib ribonucleotide reductase system in many bacteria . NrdI interacts with the class Ib radical generating protein NrdF. It is suggested to be involved in rescue of inactivated diferric centres or generation of active dimanganese centres in NrdF . Though NrdI bears a superficial resemblance to flavodoxin, its redox properties have been demonstrated to be strikingly different . In particular NrdI is capable of two-electron reduction, while flavodoxins are exclusively one-electron reductants. Biochemical studies
on NrdI from Escherichia coli led to the conclusion that these unusual redox properties depended on a lesser destabilisation of the negatively charged hydroquinone state of the FMN cofactor than what is common in flavodoxins, as NrdI was predicted to be much less negatively charged than flavodoxin . We have determined the crystal structures of NrdI from Bacillus anthracis, the causative agent of anthrax, in the oxidised and semiquinone forms, at resolutions of 0.96 Å and 1.4 Å respectively, using data from stations I911-3 and I911-5 at MAX-lab respectively (Table 1).
The structure of NrdI revealed an unusually compact flavodoxin fold, defining a new structural subfamily within the flavodoxins (Fig. 1). The conformational behaviour of NrdI in response to FMN reduction is very similar to that of flavodoxins, involving a peptide flip in a loop near the N5 atom of the flavin ring. NrdI from B. anthracis is indeed much less negatively charged than flavodoxins, which can be expected to affect its redox properties significantly. However analysis of 199 NrdI sequences demonstrated a remarkable spread in the predicted isoelectric points (pI) of NrdIs, from approximately pH 4–10, whereas the pI values of classical flavodoxins almost all lie between pH 4.0–4.5. The reason for this is not
oxidised reduced
Unit cell dimensions (Å) a = 42.8b = 45.6 c = 56.3
a = 42.83 b = 45.26 c = 55.66
Data collectionX-ray wavelength (Å) 0.7300 0.9077
Resolution range (Å) 23.9–0.96 (0.98–0.96)
23.7–1.4 (1.44–1.4)
Completeness (%) 97.3 (77.8) 99.3 (98.7)
Rmerge (%) 3.9 (60.1) 9.3 (74.4)
<I>/<σ(I)> 17.1 (2.0) 9.1 (1.5)
No. of observations 283726 102202
No. of unique reflections 65490 21820
Wilson B-factor (Å2) 11.1 21.5
Refinement
Resolution range (Å) 25–0.96 (1.0–0.96)
26.7-1.4 (1.46–1.40)
Rmodel (%) 12.5 (25.9) 14.7 (23.8)
Rfree (%) 15.2 (–) 19.2 (32.5)
Mean isotropic B-factor (Å2) 13.4 (protein)7.3 (FMN)34.2 (water)
14.3 (protein),10.5 (FMN)39.2 (water)
Rms deviations from ideal geommetry
Bond length (Å) 0.016 0.024
Bond angles 0.035 Å1 1.99°

MAX-lab ACTIVITY REPORT 2010 347
SYNCHROTRON RADIATION – BEAMLINE I911
Bibliography
(1) Roca, I.; Torrents, E.; Sahlin, M.; Gibert, I.; Sjoberg, B. M. J Bacteriol 2008, 190, 4849. (2) Stubbe, J.; Cotruvo, J. A., Jr. Curr Opin Chem Biol 2011. (3) Cotruvo, J. A., Jr.; Stubbe, J. Proc Natl Acad Sci U S A 2008, 105, 14383. (4) Johansson, R.; Torrents, E.; Lundin, D.; Sprenger, J.; Sahlin, M.; Sjoberg, B. M.; Logan, D.
T. FEBS J 2010, 277, 4265.
known, but the results imply that the redox chemistry of NrdI is not as simple as one might expect from analysis of the E. coli protein alone.
Fig. 1: Comparison of the overall structures of a) NrdI and b) the most structurally homologous standard flavodoxin, the short chain protein from D. desulfuricans (PDB ID 3F6R). Secondary structure elements are labelled.
Fig. 2: Electron density for the FMN cofactor in NrdI at 0.96 Å resolution. Difference electron density (lighter shade) can clearly be seen for several non-exchangeable protons on the cofactor.

348 MAX-lab ACTIVITY REPORT 2010
SYNCHROTRON RADIATION – BEAMLINE I911
Structural and mechanistic basis for new modes of inhibition
of glycosyltransferases
To understand the molecular basis for the enzymological behavior of these inhibitors we chose a mutant of the ABO(H) blood group A and B glycosyltransferases which catalyze the final step in the synthesis of the A and B antigens. This mutant is a cis-AB mutant capable of transferring both Gal and GalNAc to the H-antigen with equal efficiency. We have solved high-resolution crystal structures of several of the for inhibitors bound to the cis-AB mutant, which crystallizes particularly well, and for direct comparison, structures of the enzyme in its unliganded apo form and in complex with UDP. Several of the data sets for these structures were collected at beamline I911 at MAX II of which many
Rene Jørgensen1, Monica M Palcic1, Thomas Pesnot2, Gerd K Wagner2
1Carlsberg Research Centre, Copenhagen, Denmark
2School of Pharmacy, University of East Anglia, Norwich, UK.
Glycosyltransferases (GTs) are a large class of enzyme, encoded by 1-2% of the genes in all genomes sequenced to date (www.cazy.org). They are responsible for the biosynthesis of all glycosidic linkages in Nature- in polysaccharides, oligosaccharides and glycoconjugates which are carbohydrates linked to non-carbohydrate molecules. Complex glycoconjugate biosynthesis requires the concerted action of numerous of glycosyltransferase enzymes that catalyze the transfer of a mono- or oligosaccharide from a glycosyl donor (most frequently a sugar-nucleotide) to an acceptor. Acceptors are carbohydrates, lipids, proteins, DNA, natural products (antibiotics, flavonols, sterols etc) and unnnatural compounds such as drugs and xenobiotics 1-4. GTs produce the three most abundant biopolymers, cellulose, chitin and starch. GTs play a key role in many fundamental biological processes underpinning human health and disease, such as cell signaling, cellular adhesion, carcinogenesis and cell wall biosynthesis in human pathogens5-8. The development of small-molecule GT inhibitors is therefore of considerable scientific interest in chemical glycobiology and drug discovery9,10. We have developed several new, base-modified UDP-Gal derivatives with an aromatic or heteroaromatic substituent in position 5 of the uracil base as chemical tools for the investigation of glycosyltransferases and other UDP-Gal dependent glycoprocessing enzymes (Figure 1)11. The most potent of these new derivatives with a formylthienyl substitutent, acts on five different GTs, as an inhibitor of glycosyl transfer, with Ki values in the low micromolar to nanomolar range. Other substituents (phenyl, furanyl, 4-MeO-phenyl) are not as potent11.

MAX-lab ACTIVITY REPORT 2010 349
SYNCHROTRON RADIATION – BEAMLINE I911
of the crystals diffracted to near-atomic resolution (1.2–1.4 Å resolution). Surprisingly the inhibitors block the closure of a flexible loop in the active site of a human blood group GT by preventing the stacking of two amino acid residues where one is placed in the flexible loop and one in the C-terminus. This is a new mode of inhibition for GTs that, given the strong mechanistic similarities between many GTs1-4,12, and should be applicable to other GTs. The differential potency of inhibitors with various substituents is attributed to the extent to which loop closure is blocked or by abortive interactions with the loop to give non-productive complexes. 1 Weadge, J.T. & Palcic, M.M. Wiley Encyclopedia of Chemical Biology Vol. 2. 198-211 (2009). 2 Lairson, L.L., Henrissat, B., Davies, G.J. & Withers, S.G. Annu. Rev. Biochem. 77, 521–555 (2008). 3 Schuman, B., Alfaro, J.A. & Evans, S.V. Top. Curr. Chem. 272, 217–257 (2008). 4 Breton, C., Snajdrova, L., Jeanneau, C., Koca, J. & Imberty, A. Glycobiology 16, 29R–37R (2006). 5 Marth, J.D. & Grewal, P.K. Nat. Rev. Immunol. 8, 874–887 (2008). 6 Rexach, J.E., Clark, P.M. & Hsieh-Wilson, L.C. Nat. Chem. Biol. 4, 97–106 (2008). 7 Dube, D.H. & Bertozzi, C.R. Nat. Rev. Drug Discov. 4, 477–488 (2005). 8 Berg, S., Kaur, D., Jackson, M. & Brennan, P.J. Glycobiology 17, 35R–56R (2007). 9 Qian, X. & Palcic, M.M. in Carbohydrates in Chemistry & Biology Vol. 3, 293-312. 293–328 (2000). 10. Kajimoto, T. & Node, M. Synthesis 3179-3210 (2009.) 11. Pesnot, T., Palcc, M.M. & Wagner, G.K. ChemBioChem 11, 1392-1398 (2010. 12 Qasba, P.K., Ramakrishnan, B. & Boeggeman, E. Trends Biochem. Sci. 30, 53–62 (2005).

350 MAX-lab ACTIVITY REPORT 2010
SYNCHROTRON RADIATION – BEAMLINE I911
Crystal Structure of the DEAD-Domain of Human RNA Helicase DDX10/Dbp4 Karlberg, T., Schütz, P., Berglund, H., Collins, R., Flodin, S., Flores, A., Gräslund, S., Hammarström, M., Johansson, I., Kotenyova, T., Moche, M., Nielsen, T.K., Nordlund, P., Nyman, T., Persson, C., Siponen, M.I., Svensson, L., Thorsell, A.G., Tresaugues, L., Welin, M., Weigelt, J. and Schüler, H.
Structural Genomics Consortium, Karolinska Institutet, 171 77 Stockholm, Sweden Correspondence to: [email protected]
PDB Code: 2PL3 Introduction RNA helicases of the DExD/H-box superfamily are critically involved in all RNA related processes. DDX10 is critically involved in ribosome assembly, likely by assisting the folding of RNA constituents of the ribosome. DDX10 gene fusion with the nucleoporin NUP98 causes leukemia by an unknown mechanism. Many human DEAD-box helicases are considered drug targets for cancer treatment, since their inhibition affects general cell growth. Some DEAD-box proteins are involved in the processing of viral and other pathogen RNA, and these are considered drug targets for infectious disease. As a consequence, understanding the structures and functions of human DEAD-box helicases is of explicit medical importance, as it will guide the development of selective drug therapies.
Figure 1. Human DDX10 in complex with magnesium and ADP. Results We solved a crystal structure of the conserved domain-1 of the human RNA helicase DDX10. It consists of a RecA-like core, and contains the DEAD-box motif with the nucleotide binding site occupied by magnesium and ADP. The crystal structure shows how a divergent tyrosine in the active site contributes to nucleotide binding. Together with crystal structure of 10 other DEAD-box domains, the structure of DDX10 enabled us to carry out a structural analysis of the events associated with ATP hydrolysis and RNA remodeling (Ref. 1). We propose that consensus -helix 8 in the DEAD-domain partially blocks the RNA binding site, and that ATP binding releases this blockage by pulling consensus -helix 8 out of the RNA binding site.

MAX-lab ACTIVITY REPORT 2010 351
SYNCHROTRON RADIATION – BEAMLINE I911
Materials and Methods Protein Expression and Purification The cDNA encoding full length human DDX10 was retrieved from the Mammalian Gene Collection (BC093656). E. coli strain BL21(DE3) R3 pRARE cells transfected with expression vector encoding human DDX1047-280 including a TEV protease cleavable N-terminal hexahistidine tag were grown in TB medium supplemented with 8 g/l glycerol and 50 μg/ml kanamycin. After induction with 0.5 mM IPTG, culture were grown at 18°C for 20 h. Cell pellets were resuspended in 50 mM HEPES pH 7.8, 500 mM NaCl, 10 mM imidazole, 10 % glycerol, 0.5 mM TCEP, and Complete EDTA-free Protease Inhibitor (Roche Biosciences). Protein was purified using IMAC (HisTrap HP, GE Healthcare), gel filtration (HiLoad Superdex-200, GE Healthcare) and the hexahistidine tag was removed by TEV cleavage. Protein was concentrated using Vivaspin (Sartorius) cartridges and stored as aliquots at -80°C. Crystallography Crystals of DDX1047-280 were obtained by vapor diffusion in sitting drops at 4°C (for details, see Ref. 1). Diffraction data were collected at MAXlab II beamline I911-2. Data were indexed and integrated in space group P6122. The structure was solved by molecular replacement with MOLREP, using PDB entry 2gxs as search model. Refinement was done using Refmac5, and Coot was used for model building. Key reference
1. P. Schütz et al. (2010) Comparative Structural Analysis of Human DEAD-Box RNA Helicases. PloS ONE 5(9), e12791
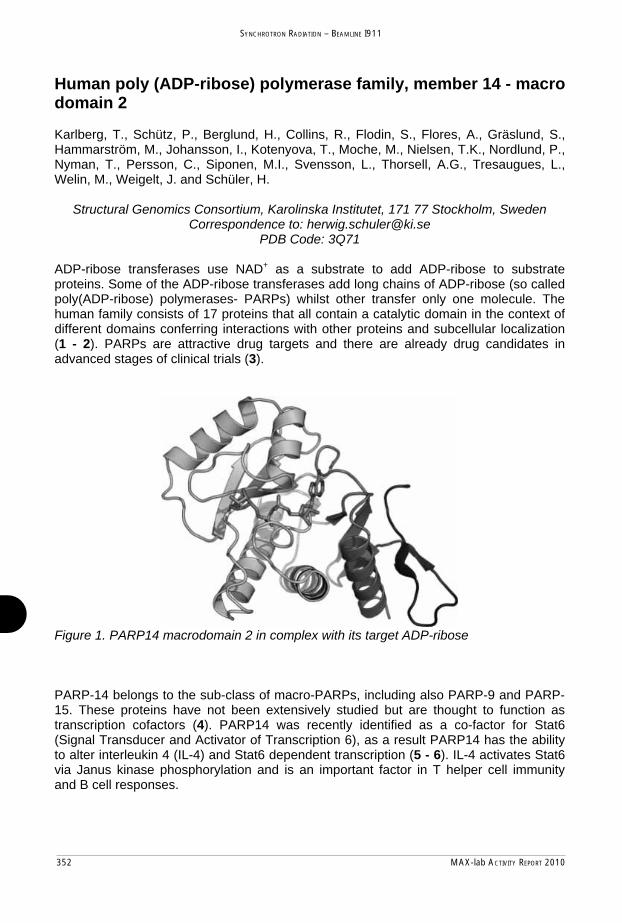
352 MAX-lab ACTIVITY REPORT 2010
SYNCHROTRON RADIATION – BEAMLINE I911
Human poly (ADP-ribose) polymerase family, member 14 - macro domain 2 Karlberg, T., Schütz, P., Berglund, H., Collins, R., Flodin, S., Flores, A., Gräslund, S., Hammarström, M., Johansson, I., Kotenyova, T., Moche, M., Nielsen, T.K., Nordlund, P., Nyman, T., Persson, C., Siponen, M.I., Svensson, L., Thorsell, A.G., Tresaugues, L., Welin, M., Weigelt, J. and Schüler, H.
Structural Genomics Consortium, Karolinska Institutet, 171 77 Stockholm, Sweden Correspondence to: [email protected]
PDB Code: 3Q71 ADP-ribose transferases use NAD+ as a substrate to add ADP-ribose to substrate proteins. Some of the ADP-ribose transferases add long chains of ADP-ribose (so called poly(ADP-ribose) polymerases- PARPs) whilst other transfer only one molecule. The human family consists of 17 proteins that all contain a catalytic domain in the context of different domains conferring interactions with other proteins and subcellular localization (1 - 2). PARPs are attractive drug targets and there are already drug candidates in advanced stages of clinical trials (3).
Figure 1. PARP14 macrodomain 2 in complex with its target ADP-ribose PARP-14 belongs to the sub-class of macro-PARPs, including also PARP-9 and PARP-15. These proteins have not been extensively studied but are thought to function as transcription cofactors (4). PARP14 was recently identified as a co-factor for Stat6 (Signal Transducer and Activator of Transcription 6), as a result PARP14 has the ability to alter interleukin 4 (IL-4) and Stat6 dependent transcription (5 - 6). IL-4 activates Stat6 via Janus kinase phosphorylation and is an important factor in T helper cell immunity and B cell responses.

MAX-lab ACTIVITY REPORT 2010 353
SYNCHROTRON RADIATION – BEAMLINE I911
In addition to a catalytic PARP domain these proteins have up to three macro-domains in sequence at their N-terminal. Macro-domains are small globular domains found in more than 200 bacterial and viral proteins as well as in histone macro H2A-protein in mammals (7 - 8). Macro-domains bind ADP-ribose with high affinity and selectivity (9) and are recruited to sites of PARP1 activation following DNA damage (10). Here, the crystal structure of the second macrodomain of human PARP-14 is presented in complex with ADP-Ribose at 2.2Å resolution (Figure 1). The structure consists of a seven-stranded mostly parallel -sheet, except for 1 and 7 that are anti-parallel (strand-order 1- 2- 7- 6- 3- 5- 4), and a total of six -helices, three on each side of the -sheet. The overall structure is globular and measures approximately 35Å × 35Å × 50Å. ADP-ribose was clearly seen in the electron density located in a binding cleft mainly made up from two seemingly flexible loops, 3-loop- 2 and 6-loop- 5.
1. Hottiger MO et al. (2010) Toward a unified nomenclature for mammalian ADP-ribosyltransferases. Trends Biochem. Sci.
2. Amé JC et al. (2004) The PARP superfamily. Bioessays. 3. Mangerich A, Bürkle A. (2011) How to kill tumor cells with inhibitors of poly(ADP-
ribosyl)ation. Int. J. Cancer. 4. Hakmé A et al. (2008) The macroPARP genes Parp-9 and Parp-14 are developmentally
and differentially regulated in mouse tissues. Develop. Dynam. 5. Goenka S, Cho SH, Boothby M. (2007) Collaborator of Stat6 (CoaSt6)-associated
poly(ADP-ribose) polymerase activity modulates Stat6-dependent gene transcription J. Biol. Chem.
6. Mehrotra P et al. (2011) PARP-14 functions as a transcriptional switch for Stat6-dependent gene activation. J. Biol. Chem.
7. Gorbalenya AE, Koonin EV and Lai MM-C. (1991) Putative papain-related thiol proteases of positive-strand RNA viruses. FEBS Lett.
8. Pehrson JR and Fried VA. (1992) MacroH2A, a core histone containing a large nonhistone region. Science.
9. Karras GI et al. (2005) The macro domain is an ADP-ribose binding module. EMBO J. 10. Timinszky G et al. (2009) A macrodomain-containing histone rearranges chromatin upon
sensing PARP1 activation. Nature Struct. Mol. Biol.

354 MAX-lab ACTIVITY REPORT 2010
SYNCHROTRON RADIATION – BEAMLINE I911
STRUCTURAL STUDIES OF HUMAN PROLYL 4–HYDROXYLASES (P4Hs)Koski MK1, Kursula P1,3, Anantharajan J1, Hieta R2, Myllyharju J2 & Wierenga RK1
1Department of Biochemistry and, 2Collagen Research Unit, Biocenter of Oulu and Department of Medical Biochemistry and Molecular Biology, University of Oulu, FIN-90014 Oulu, FINLAND
3Centre for Structural Systems Biology (CBS), DESY, Hamburg
Prolyl 4-hydroxylases (P4Hs) play central roles in two important processes in biology and medicine, the synthesis of collagens and the response of cells to hypoxia [1]. They are 2-oxoglutarate dioxygenases and require Fe2+, 2-oxoglutarate, O2 and ascorbate. The 2-oxoglutarate is decarboxylated during hydroxylation, with one atom of the O2 being incorporated into 2-oxoglutarate (producing CO2 + succinate) and the other into the hydroxy group of the peptidyl 4-hydroxyproline [1].
Collagen prolyl 4-hydroxylases (C-P4Hs), enzymes residing within the lumen of the ER, catalyze the formation of 4-hydroxyproline in collagens and more than 20 other proteins with collagen-like sequences by the hydroxylation of -X-Pro-Gly- triplets. The 4-hydroxyproline residues formed are essential for the formation of collagen molecules with stable triple helices. All known vertebrate C-P4Hs are 2 2 tetramers. The subunit has the catalytic activity but is highly insoluble. Therefore it needs for solubility the subunit, which is identical to the enzyme and chaperone protein disulphide isomerase [1].
Detailed knowledge of the properties and structures of the P4Hs will be valuable for the development of inhibitors that may have a major impact on the treatment of fibrotic and ischemic diseases, respectively. Because the X-ray data obtained from large protein complexes can be initially at relatively low-resolution, the high-resolution crystal structures of the individual subunits or domains of such enzymes become crucial during the structure determination. Therefore, while working with the full-length C-P4H, we have also expressed and purified some of its -subunit domains / domain homologues for structural studies (Figure 1). We have solved the high resolution crystal structures of a peptide-substrate-binding (P-S-B) domain [2], and a homolog to the catalytic domain, namely a P4H from green alga Chlamydomonas reinhardtii (referred to as Cr-P4H) [3,4].
The function and the structure of the N-domain region of the -subunit is still unknown, but we have managed to crystallize a truncated construct consisting the N-domain and the P-S-B domain of the C-P4H -subunit (referred to as double domain). These crystals have an additionally value, because they have been obtained in the presence of peptide-substrate (Pro-Pro-Gly)3. Crystals were
Figure 1. The -subunit of human C-P4Hwith its domain assignments. The active site residues of the -chain important for the prolyl hydroxylation reaction are also indicated. The crystal structures of the peptide-substrate-binding ( P-S-B) domain (PDB code 1TJC) showing the 5 -helices, which form the tetratricopeptide repeat fold, and the Cr-P4H (PDB code 3GZE), showing the mode of binding the proline-rich (Ser-Pro)5peptide to the jelly-roll core structure, are also shown.

MAX-lab ACTIVITY REPORT 2010 355
SYNCHROTRON RADIATION – BEAMLINE I911
References
[1] J. Myllyharju, Matrix. Biol. 22, 15 (2003)[2] M. Pekkala, R. Hieta, U. Bergmann, K. I. Kivirikko, R. Wierenga and J. Myllyharju, J. Biol. Chem.
279,52255 (2004).[3] M. K. Koski, R. Hieta, C. Böllner, K. I. Kivirikko, J. Myllyharju and R. Wierenga, J. Biol. Chem. 282,
37112 (2007)[4] M. K. Koski, R. Hieta, M. Hirsilä, A. Rönkä, J. Myllyharju and R. Wierenga, J. Biol. Chem. 284, 25290
(2009)[5] Y. Cerenius, K. Ståhl, L. A. Svensson, T. Ursby, A. Oskarsson, J. Albertsson and A. Liljas, J
Synchrotron Radiat. 7, 203 (2000)[6] D.I. Svergun, Biophys. J. 76,2879 (1999).
subunit.
tested using the in-house diffractometer at Oulu, and they revealed to belong to the space group P21212 with most probable two molecules per asymmetric unit. More data were collected usingsynchrotron radiation at beamline I911-3 MAX-lab, Lund. We managed to collect a high resolution data set to 1.98 Å, as well as a highly redundant (=24) data set to 3 Å (using 1.5 Å wavelength). By using these two data sets we have initiated a structure solution determination process of the double domain. Our aim is solve the phases using the molecular replacement technique using crystal structure of the P-S-B domain as a model, and/or a single anomalous dispersion method using the weak anomalous signal from the natural sulphur atoms.
Meanwhile, while doing the X-ray crystallographic analysis, we have recently also collected synchrotron-SAXS data from the different C-P4H constructs and complexes. Most of the SAXS data have been collected at I711 [5], MAX-lab, Lund. Soluble double domain concentrated to 8 mg/ml has been one of our samples, but we have also managed to collect SAXS data from the full-length C-P4H-1. The SAXS data has revealed, for example, that the double domain is an elongated molecule with longest dimension of 18 nm (Figure 2). The volume of the map corresponds to a dimeric protein with a molecular weight estimation of 60 kDa.
R f
Figure 2.The experimental Ab inito model (made by DAMMIN program [6]) of the double domain construct of C-P4H -subunit.
Using all the structural information obtained using different techniques, we can, for the first time, to construct a complete model for the domain
2ß2 C-P4H complex. The preliminary model of C-P4H, mainly based on the SAXS maps and the high-resolution crystal structures of its domains/subunits, will be very useful for the subsequent crystal structure determination of the complete assembly.Furthermore, SAXS experiments have indicated that the complete C-P4H tetramer is a rigid and stable molecule. This is the ultimate requirement for the crystallization of the full C-P4H-1, which we hope to happen in near future.

356 MAX-lab ACTIVITY REPORT 2010
SYNCHROTRON RADIATION – BEAMLINE I911
Histone demethylases as targets for cancer therapy Line H. Kristensen, Jan B. L. Kristensen, Charlotte Helgstrand, Jette S. Kastrup &
Michael Gajhede
Biostructural Research, Department of Medicinal Chemistry, University of Copenhagen,
Universitetsparken 2, 2100 Copenhagen Ø, Denmark.
An important mechanism in the dynamic regulation of all gene expression is the
reversible posttranslational modification of the N-terminal tails of histones
(Mosammaparast & Shi, 2010). The modifications include acetylations, phosphorylation,
methylations, hydroxylations, ubiquitination, SUMOylation, and biotinylation. There are
many possible modifications on each of the four H3 and H4 tails of the approximately 20
million nucleosomes in human chromatin. Considering only methylation of lysines there
are five major modification sites: H3K4, H3K9, H3K27, H3K36 and H4K20. These can be
unmodified, mono-, di- and tri-
methylated, giving a total of 1024
different labels. Combination with the
other modifications makes unique
labels for each nucleosome possible.
The total set of such labels of a
genome is often referred to as the
epigenetic code. A given set of
modifications then determine whether
a gene is silenced or actively
transcribed. The state of chromatin is
then maintained by enzymes that can
write and erase the modifications. In
addition binding domains that can recognize (read) modifications are known. They often
guide the writers and erasers to the correct genetic loci.
Histone demethylase (HDM) enzymes consequently appear to play a central role in the
regulation of known oncogenes (Chi et al., 2010). These enzymes are strong candidate
anti-cancer drug targets (Lohse et al., 2011). One family of histone demethylases (HDM)
is characterized by containing a catalytic Jumonji C (JmjC) domain with specificity for
methylated lysines on histone 3. The first member was discovered in 2006 (Tsukada,
2006) and today the 28 members shown in figure 1 are known.
MAX-lab ACTIVITY REPORT 2010 357
SYNCHROTRON RADIATION – BEAMLINE I911
The structure of the JmjC domain of KDM4A has been determined previously in apo
form (Chen et al, 2006) and in complex with various substrates (Ng, et al., 2007).
During the last year we have established a pipeline for expression, purification and
crystallization of the human JmjC enzymes, and we have established methods to
optimize co-crystallization. In summer 2010 , we collected the first data set to 2.7 Å
resolution at MAX-lab (I911-2) of a complex of KDM4A with an peptide substrate with
previously uninvestigated covalent modifications. Although the peptide could be
recognized in the electron density we are currently optimizing co-crystallization
conditions to achieve more information about the binding mode.
Chen, Z., Zang, J., Whetstine, J., Hong, X., Davrazou, F., Kutateladze, T. G., et al.
(2006). Structural insights into histone demethylation by JMJD2 family members.
Cell, 125(4), 691-702.
Chi, P., Allis, C. D., & Wang, G. G. (2010). Covalent histone modifications--miswritten,
misinterpreted and mis-erased in human cancers. Nature reviews. Cancer, 10(7),
457-69.
Lohse, B., Kristensen, J. L., Kristensen, L. H., Agger, K., Helin, K., Gajhede, M., et al.
(2011). Inhibitors of histone demethylases. Bioorganic & Medicinal Chemistry, in
press.
Mosammaparast, N., & Shi, Y. (2010). Reversal of Histone Methylation: Biochemical and
Molecular Mechanisms of Histone Demethylases. Annual review of biochemistry,
79, 155-79.
Ng, S. S., Kavanagh, K. L., McDonough, M. A., Butler, D., Pilka, E. S., Lienard, B. M. R.,
et al. (2007). Crystal structures of histone demethylase JMJD2A reveal basis for
substrate specificity. suppl. Nature, 448(7149), 87-91. doi: 10.1038/nature05971.
Tsukada, Y., Fang, J., Erdjument-bromage, H., Warren, M. E., Borchers, C. H., Tempst,
P., et al. (2006). Histone demethylation by a family of JmjC domain-containing
proteins. Nature, 439, 811-816.

358 MAX-lab ACTIVITY REPORT 2010
SYNCHROTRON RADIATION – BEAMLINE I911
Structure of the dimeric form of CTP synthase from Sulfolobus solfataricus Iben Lauritsen,a Martin Willemoës,a Kaj Frank Jensen,a Eva Johanssonbc and Pernille Harrisd
aDepartment of Biology, University of Copenhagen, Ole Maaløes Vej 5, Copenhagen, DK-2200, Denmark, bDepartment of Chemistry, University of Copenhagen, Universitetsparken 5, Copenhagen, DK-2100, Denmark, cDiabetes Protein Engineering, Novo Nordisk A/S, Novo Nordisk Park, Måløv, DK-2760, Denmark, and dDepartment of Chemistry, Technical University of Denmark, Kemitorvet B207, Kgs. Lyngby, DK-2800, Denmark
CTP synthase catalyzes the last committed step in de novo pyrimidine nucleotide biosynthesis. Active CTP synthase is a tetrameric enzyme composed of a dimer of dimers. In the presence of the substrate nucleotides, ATP and UTP, the tetramer is favoured. The crystal structure of a dimeric form of the CTP synthase from Sulfolobus solfataricus enzyme has been determined to 2.5 Å resolution [1]. All previous crystal structures of CTP synthase are fairly similar and showed a homotetramer, independent of whether there were nucleotides bound. The tetramer interacts through the N-terminal synthase domain with the C-terminal amidotransferase domains located far from the tetramer interfaces. The ATP binding site and CTP binding site in the synthase domain are located at the tetramer interface. A comparison of the dimeric interface of S. s. CTP synthase with the intermolecular interfaces in the tetrameric structures of Thermus thermophilusCTP synthase [2] and Escherichia coli CTP synthase [3,4] shows that the dimeric interfaces are almost identical in the three systems and that the residues forming the tetramer interfaces are moving substantially.
Figure 1
The overall fold of the S.s. protein is similar to the fold found in the CTP synthases from E. coli (pdb-entries: 1S1M, 2AD5 and T. Thermophilus (pdb-entries 1VCN, 1VCM and 1VCO).The subunit of E. coliapo CTP synthase is shown in Fig. 1a and the S. solfataricusstructure is shown in Fig. 1b. The most
pronounced difference is the change in the loop going from residues 11-16, the loop+helix from residues 180-200 and the helix formed by residues 215-230.
a b

MAX-lab ACTIVITY REPORT 2010 359
SYNCHROTRON RADIATION – BEAMLINE I911
We have superposed the tetramer formed by E. coli CTP synthase (pdb-entry 1S1M) with two copies of the S. solfataricus CTP synthase model to form a pseudo-tetramer of the S. solfataricusstructure. The pseudo-tetramer is shown in Fig. 2.
Figure 2
In the S. solfataricus pseudo-tetramer the helix from 190-200 clashes with the same helix from the other dimer; the loop from 180-190 also clashes with the loop from 11-16 from the other dimer. It is therefore clear that these regions have to move substantially to facilitate tetramerization.
Figure 3
In Fig. 3 we have superposed the E. coli2AD5 structure with the S. solfataricuspseudo-tetramer and zoomed in on the ADP binding site. Only the peptide chain from S. solfataricus is shown in the figure. The loop from residues 11-16 would indeed clash with ADP leading to a reposition of this loop to displace the loop and helix that runs from residues 180-200, which in turn would reposition the neighbouring helix spanning residues 215-230.
References
1. I. Lauritsen, M. Willemoës, K.F. Jensen, E. Johansson, P. Harris. Acta Crystallographica. F67 (2011), 201-208.
2. Goto, M., Omi, R., Nakagawa, N., Miyahara, I. & Hirotsu, K. (2004). Structure, 12, 1413–1423.
3. Endrizzi, J. A., Kim, H., Anderson, P. M. & Baldwin, E. P. (2004). Biochemistry, 43, 6447–6463.
4. Endrizzi, J. A., Kim, H., Anderson, P. M. & Baldwin, E. P. (2005). Biochemistry, 44, 13491–13499.
360 MAX-lab ACTIVITY REPORT 2010
SYNCHROTRON RADIATION – BEAMLINE I911
Temperature-Responsive Inclusion Complex of Cationic PNIPAAM Diblock Copolymer
and -Cyclodextrin Giuseppe Lazzara,1 Gerd Olofsson,1 Viveka Alfredsson,1 Kaizheng Zhu,2
Bo Nyström2 and Karin Schillén*,1
1 Division of Physical Chemistry, Lund University, P.O. Box 124, SE-221 00 Lund, Sweden 2 Department of Chemistry, University of Oslo, P.O. Box 1033, Blindern, N-0315 Oslo, Norway
Pseudopolyrotaxanes are supramolecular assemblies formed by a linear molecule (e.g. a polymer chain) and ring shaped molecules such as cyclodextrin (CD) [1]. Pseudopolyrotaxanes are widely studied because the structure of the assembly can readily be tuned by using external stimuli as well as the molecular architecture. A precise control of such supramolecular structures is a challenge for designing smart nanomaterials and for development of applications based on molecular recognition, e.g. drug delivery [2]. CDs are cyclic oligosaccharides formed by glucopyranose units. They have a truncated cone shape with a hollow cavity, which may incorporate more or less hydrophobic solutes such as surfactants or polymer chains to form an inclusion complex. Several CDs rings can thread a polymer chain assuming either a compact or loose structure depending on the nature of the CD.
In this project, we investigate the inclusion complex formation between -CD and polymers containing poly(N-isopropylacrylamide) (PNIPAAM) chains in solid state and in aqueous solution. PNIPAAM belongs to the class of temperature-responsive polymers. The characteristic feature of such polymers is that they undergo a physical change when exposed to external temperature-stimuli. PNIPAAM possesses an inverse solubility in water upon heating with a lower critical solution temperature (LCST) between 32-38 °C. Both a cationic diblock copolymer, PNIPAAM-b-poly((3-acrylamidopropyl)trimethyl ammonium chloride (PNIPAAM24-b-PAMPTAM(+)18) and a PNIPAAM homopolymer (PNIPAAM47) have been investigated using various experimental methods, such as 1H-NMR, Fourier transform infrared spectroscopy, synchrotron radiation powder X-ray diffraction (SR-PXD), steady-state fluorescence spectroscopy, differential scanning calorimetry, dynamic and static light scattering and cryo-transmission electron microscopy [3]. The NMR measurements performed on -CD-polymer mixtures in D2O demonstrated that the threaded -CD molecules form a close-packed structure over the PNIPAAM chains and that the bulky cationic block of the copolymer is not incorporated into the -CD cavity. The fluorescence experiments using pyrene as a fluorescent probe showed that increasing the temperature to 40 °C (above the LCST of PNIPAAM) causes the CD molecules to dethread.

MAX-lab ACTIVITY REPORT 2010 361
SYNCHROTRON RADIATION – BEAMLINE I911
Solid -CD–polymer inclusion complexes form at ambient temperature in fairly concentrated CD solutions. The formation of a precipitate can be considered as an evidence of the formation of crystalline pseudopolyrotaxanes. The SR-PXD spectra of the solid inclusion complexes (Figure 1) indicate a compact columnar structure of CD molecules threaded onto the PNIPAAM chains, which corroborate the NMR results.
The SR-PXD data were collected at beamline I911-5 at MAX II. The X-ray exposure time was 10 s and the wavelength was 0.9077 Å. All raw images were analyzed using the FIT2D program [4]. Calibration measurements were carried out using a LaB6 sample. Sample-to-detector distances of 50, 100, 200, 300, 380 mm were used to cover a wide range of the scattering vector q = 4 -1sin( /2), where denotes the wavelength and the scattering angle.
Figure 1. Synchrotron radiation X-ray diffraction spectra of -CD and pseudopolyrotaxanes in the solid state. The arrows indicate the peaks that appear in the presence of the polymer and which are related to a columnar structure of -CD.
[1] Wenz, G. Han, B. H.; Muller, A. Chem. Rev. 2006, 106, 782. [2] Yuen, F.; Tam, K. C. Soft Matter 2010, 6, 4613. [3] Lazzara, G.; Olofsson, G.; Alfredsson, V.; Zhu, K.; Nyström, B.; Schillén, K., submitted. [4] Hammersley, A. P.; Svensson, S. O.; Hanfland, M.; Fitch, A. N.; Husermann, D. High Pres. Res. 1996, 14, 235.

362 MAX-lab ACTIVITY REPORT 2010
SYNCHROTRON RADIATION – BEAMLINE I911
In situ XRD characterization of carbon-coated Ni0.5TiOPO4 electrode material
Kenza Maher1, Kristina Edström2, Ismael Saadoune1, Torbjörn Gustafsson2, Mohammed Mansori1
1) University Cadi Ayyad, ECME, FST Marrakech, Av. A. Khattabi, BP549, Marrakech, Morocco
2) Department of Materials Chemistry, Ångström Laboratory, Uppsala University, Box 538, SE-751 21 Uppsala, Sweden
Extensive research is devoted to understanding and improving existing anode materials for today’s lithium ion (Li-ion) batteries. For commercial Li-ion batteries, the most commonly used negative electrode material is graphite. There are, however, many incentives to find new negative electrode materials that can store more lithium or function more safely than graphite. One example is the spinel Li4Ti5O12 which has become an attractive alternative due to the insertion of lithium above the potential of lithiated graphite, thereby improving safety. The experimental discharge capacity of this material is ~160mAh/g. For the positive electrode, lithium transition metal phosphates are mainly used. The framework of Mn(PO4)y provides an excellent stability and long term cycling compared to lithium transition metal oxides. Indeed, the oxygen–phosphorous bond is more covalent in nature than polar oxygen–metal bonds. Thus, no loss of oxygen occurs from the framework and the reactivity with the electrolyte is low. Also for the negative electrode an enhanced safety could be achieved by using the Mn(PO4)y framework tuned for low potentials vs. Li/Li+.
In this study the structure and the lithiation process of negative electrode material Ni0.5TiOPO4has been studied in situ at MAX IV-laboratory beam-line 711. The compound crystallizes in the monoclinic system with the space group P21/c as shown in Fig. 1. A carbon-coated sample and a non-carbon coated sample were synthesized using a co-precipitation method.
The electrochemical reactions for a carbon-coated sample showed better battery cycling stability than a non-coated sample. Cyclic voltammetry showed that during the lithiation process lithium is expected to first insert at a potential 1.2 V vs. Li/Li+
and a second phase at 1.07 V vs. Li/Li+. The cycling curve for the carbon-coated sample is shown in Fig. 2.
Fig. 1. The crystal structure of Ni0.5TiOPO4.
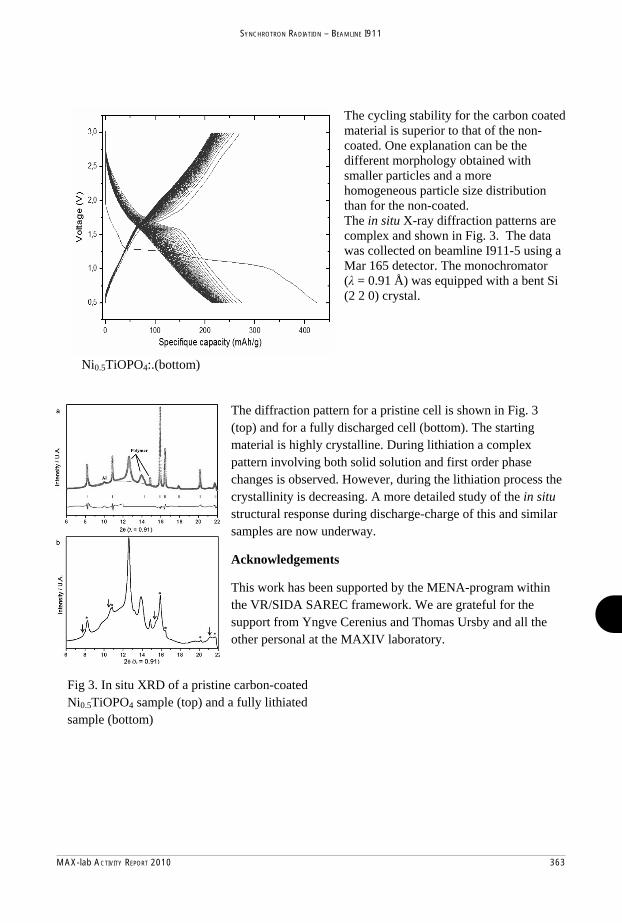
MAX-lab ACTIVITY REPORT 2010 363
SYNCHROTRON RADIATION – BEAMLINE I911
The cycling stability for the carbon coated material is superior to that of the non-coated. One explanation can be the different morphology obtained with smaller particles and a more homogeneous particle size distribution than for the non-coated.The in situ X-ray diffraction patterns are complex and shown in Fig. 3. The data was collected on beamline I911-5 using a Mar 165 detector. The monochromator ( = 0.91 Å) was equipped with a bent Si (2 2 0) crystal.
The diffraction pattern for a pristine cell is shown in Fig. 3 (top) and for a fully discharged cell (bottom). The starting material is highly crystalline. During lithiation a complex pattern involving both solid solution and first order phase changes is observed. However, during the lithiation process the crystallinity is decreasing. A more detailed study of the in situstructural response during discharge-charge of this and similar samples are now underway.
Acknowledgements
This work has been supported by the MENA-program within the VR/SIDA SAREC framework. We are grateful for the support from Yngve Cerenius and Thomas Ursby and all the other personal at the MAXIV laboratory.
Fig. 2. Cycling data for carbon coated Ni0.5TiOPO4:.(bottom)
Fig 3. In situ XRD of a pristine carbon-coated Ni0.5TiOPO4 sample (top) and a fully lithiated sample (bottom)

364 MAX-lab ACTIVITY REPORT 2010
SYNCHROTRON RADIATION – BEAMLINE I911
Characterization of a new crystal form of the B.subtilis YkuD protein.
S. F. Midtgaard, T. Boesen, S. Thirup, M. Blaise
CARB Centre, Dept of Molecular Biology, Aarhus University, Gustav Wiedsvej 10C, DK 8000 Aarhus C, Denmark
The protein YkuD has been suggested to be involved in redesign of cell walls based on the presence of an N-terminal LysM domain and an L,D-transpeptidase catalytic domain in the C-terminal. The structure has previously been determined to high resolution as part of a structural genomics project. In order to investigate possible substrate binding we have screened for crystallization conditions both in the absence of ligands and presence of mono-, tetra-, and penta-N-acetyl-glucosamine. Crystallization conditions similar to the previously reported conditions for the apoform yielded plate like crystals whereas three dimensional crystals were obtained in the presence of carbohydrate.
Left: Cluster of thin plate crystals of YkuD formed in absence of carbohydrate. Right: Bipyramidal crystal of YkuD formed in presence of carbohydrate.
The very thin crystals obtained in the absence of carbohydrate were soaked in excess N-acetyl-glucosamine and flash frozen prior to data collection at I911-3. A nearly complete dataset was collected to 3.8 Å resolution. The space group of the crystals is P21, a = 58.1Å , b = 82.7Å c = 74.3Å, = 99.1° and 4 molecules per asymmetric unit in contrast to the previously reported crystals of YkuD, which belong to space group P212121 , a = 56.3Å, b = 63.9Å , c = 93.7Å with two molecules per asymmetric unit (Bielnicki et al., Proteins, 62, p144-51, 2006). Phasing of the data was done by Molecular Replacement and revealed a different packing of YkuD molecules. Even when symmetry related molecules were examined the interface observed in the orthorhombic crystal form could not be found in the monoclinic form. Unfortunately no electron density was observed, which could be interpreted as the presence of carbohydrate.
A B C
A): the four molecules of YkuD in the P21 asymmetric unit. B): The two molecules of YkuD in the P212121 asymmetric unit (PDB:1Y7M). C): Overlay of molecules in A and B.

MAX-lab ACTIVITY REPORT 2010 365
SYNCHROTRON RADIATION – BEAMLINE I911
Structure determination of cellulase Cel7A - The major secreted protein of the tree-killing fungus Heterobasidion annosum (Rotticka)
Majid Haddad Momeni, Henrik Hansson, Nils Egil Mikkelsen, Mats Sandgren, Jerry
Ståhlberg*
Department of Molecular Biology, Swedish University of Agricultural Sciences, Box 590, SE-751 24 Uppsala, Sweden. *E-mail: [email protected]
Fungal cellobiohydrolases of glycoside hydrolase family GH7 are key players in cellulose degradation, in nature as well as in industrial applications. Structure-function studies form the basis for protein engineering and discovery of new enzymes with enhanced performance. In connection with the recent sequencing of the genome of the Root-rot fungus, Heterobasidion annosum, the most serious pathogen in our forests in economic terms [1], we have identified major proteins in cultures on spruce wood powder. The most abundant protein was unambiguously identified as a product of the only gene in the genome that codes for a GH7 enzyme. The protein, named Ha_Cel7A, was purified from culture broth and initial crystals were obtained with the JSCG+ Suite sparse matrix screen (Qiagen). The structure was solved by molecular replacement using Phanerochaete chrysosporium Cel7D (1GPI; [2]; 69% sequence identity) as search model. Using X-ray difraction data from MAX-lab beamlines I911-2 and I911-5, the structure of the apo enzyme (space group P21; unit cell 60.5, 84.1, 75.9 Å) and that of a ligand complex after soaking with -thio-xylopentaose (space group C2; unit cell 134.8, 49.5, 73.5 Å; =118.8°) have been refined at 1.8 and 1.6 Å resolution, respectively (manuscript in preparation). Ha_Cel7A is clearly a cellobiohydrolase rather than an endoglucanase, and has a cellulose-binding tunnel that is more closed than in P. chrysosporium Cel7D and more open than that of Hypcorea jecorina Cel7A (eg. 6CEL; [3]) suggesting intermediate properties between these extremes; something that we are now investigating further. The figure shows the surface of Ha_Cel7A, superimposed with a cellulose chain modelled in H. jecorina Cel7A (8CEL; [3]). [1] Woodward et al., In: S. Woodward, J. Stenlid, R. Karjalainen and A. Hüttermann, Eds. Heterobasidion annosum - Biology, Ecology, Impact and Control. CAB International, Wallingford, UK (1998), p. 589, (1998). [2] Muñoz IG, Ubhayasekera W, Henriksson H, Szabó I, Pettersson G, Johansson G, Mowbray SL, Ståhlberg J. J Mol. Biol. 314, 1097-111, (2001) [3] Divne C, Ståhlberg J, Teeri TT, Jones TA. J. Mol Biol. 275, 309-325, (1998)

366 MAX-lab ACTIVITY REPORT 2010
SYNCHROTRON RADIATION – BEAMLINE I911
Enzymatic Starch Hydrolysis
M.S. Møller1, M. Abou Hachem1, B. Svensson1 & A. Henriksen2
1Enzyme and Protein Chemistry, Department of Systems Biology, Technical University of Denmark, Kgs. Lyngby, Denmark
2The Protein Chemistry Group, Carlsberg Laboratory, Copenhagen, Denmark.
Starch is by far the most common storage carbohydrate in plants. Globally, starch crops are more important than all other industrial and food crops, and starch crops cover fifty percent of the world's average daily calorie intake. Starch is used by the plants themselves, but also by micro- and higher organisms, which need to hydrolyze the starch to simple sugar molecules by means of enzymatic catalysis to make use of the carbon. Chemically, the major components of starch are amylose to amylopectin. Both molecules are -1,4-linked glucose polymers, but amylopectin is unique by having
-1,6-linked glucose branches decorating the -1,4-linked glucose backbone. Different plant species have different ratios of amylose to amylopectin content; most commonly, 20-25% amylose and 75- 80% amylopectin. The amylose and amylopectin are packed in starch granules, which vary markedly in size and morphology between plant species.
Of the two starch components, amylopectin presents the largest challenge to hydrolytic enzyme systems due to the -1,6-glycosidic branch points that are found on 4- 6% of the glucose units. Most hydrolytic enzymes are specific for -1,4-glucosidic links, but to get a complete conversion of amylopectin to glucose also the -1,6-glucosidic bonds must be cleaved.
Barley limit dextrinase (HvLD) catalyses hydrolysis of the -1,6-glycosidic linkages of amylopectin derived limit dextrins in germinating barley1, but the enzyme is also involved in starch biosynthesis. Absence of limit dextrinase or debranching activity can give rise to changed starch grain morphology and even abolished starch grain synthesis. HvLD catalyses hydrolysis via a general acid catalysis. This mechanism requires a catalytic nucleophile and a catalytic acid/base proton donor to interact with the substrate. Hydrolysis results in the retention of the anomeric conformation through a double displacement mechanism characteristic of the glycoside hydrolase 13 family, to which HvLD belong. We previously determined the crystal structure of HvLD (Figure 1)2.
Figure 1. Crystal structure of HvLD, the hydrolytic enzyme responsible for catalysis of -1,6-glycosidic bond cleavage in germinating barley2.

MAX-lab ACTIVITY REPORT 2010 367
SYNCHROTRON RADIATION – BEAMLINE I911
Besides the role in germination and starch synthesis, HvLD is critical for the malting and mashing steps in beer production. Here, limit dextrins are hydrolysed to fermentable sugars for ethanol production. In malt, LD is present in a free, active form and in an inactive form, bound to its endogenous proteinaceous inhibitor, HvLDI. To understand the molecular basis for the substrate specificity of HvLD and its activation, HvLD has been recombinantly expressed in Pichia pastoris3 for crystallisation. Crystals of LD in complex with carbohydrate ligands and inhibitory ligands have been obtained and diffraction data have been collected to 2.0 Å and 4 Å, respectively at the I911-2 beam line at MAX-lab II. 1 M. Kristensen, F. Lok, V. Planchot, I. Svendsen, R. Leah, & B. Svensson, Biochim. Biophys. Acta 1431, 538-546 (1999), 2M.B. Vester-Christensen, M. Abou Hachem, B. Svensson & A. Henriksen. J. Mol. Biol. 403, 739-750 (2010), 3M.B. Vester-Christensen, M.A. Hachem, H. Næsted & B. Svensson, Prot. Expres. Purif. 69, 112-119 (2010).

368 MAX-lab ACTIVITY REPORT 2010
SYNCHROTRON RADIATION – BEAMLINE I911
Structural Studies of the Surface Adhesin SpaP from Streptococcus mutans
Åsa Nylander, Nina Forsgren and Karina Persson
Dept. of Odontology, Umeå University, SE-901 87 Umeå, Sweden
Streptococcus mutans is the major causative agent of caries and its surface adhesin SpaP is
important for its incorporation into the oral biofilm. SpaP is a member of the Antigen I/II
(AgI/II) family of proteins that are expressed on the surfaces of oral streptococci. The
AgI/II proteins are key molecules for networking with other microorganisms and host cells
in the oral biofilm. AgI/II proteins are approximately 1500 residues and consist of several
domains. The structure of AgI/II is unique in the sense that a proline-rich region and an
alanine-rich region wrap around each other forming an elongated fibrillar structure,
presenting a putative adhesin at the tip (1). The structure further consists of a C-terminal
domain which contains an LPXTG motif that anchors the protein to the cell-wall. We have
previously solved the crystal structure of the major part of the SspB (AgI/II) C-terminal
domain from the commensal bacteria, Streptococcus gordonii (2). It has been shown that
the SspB C-terminal domain, but not S. mutans SpaP, functions as an adherence site for the
oral pathogen Porphyromonas gingivalis, associated with adult periodontitis. The region
that functions as an attachment site for P. gingivalis constitutes a helix that protrudes like a
handle. This region is also where the sequence differences comparing SspB and SpaP is the
largest. In order to compare the S. mutans SpaP to the previously known structure of SspB
from S. gordonii, we determined the crystal structure of the SpaP C-terminal domain
(residues 1136-1489). The structure was solved and refined to 2.2 Å resolution with six
molecules in the asymmetric unit. Similar to the related AgI/II structure, SpaP is stabilized
by isopeptide bonds between lysine and asparagine side chains (3). The structure is overall
very similar, as is the secondary structure of the helix corresponding to the P. gingivalis
recognition handle. However, the amino acid composition in the helix results in a very
different recognition surface. The SspB helix represents a very promising template for the
design of substances to exclude P. gingivalis from dental plaque.

MAX-lab ACTIVITY REPORT 2010 369
SYNCHROTRON RADIATION – BEAMLINE I911
1. Larson, M. R., Rajashankar, K. R., Patel, M. H., Robinette, R. A., Crowley, P. J., Michalek, S., Brady, L. J., and Deivanayagam, C. (2010) Elongated fibrillar structure of a streptococcal adhesin assembled by the high-affinity association of alpha- and PPII-helices, Proc Natl Acad Sci U S A 107, 5983-5988.
2. Forsgren, N., Lamont, R. J., and Persson, K. (2010) Two intramolecular isopeptide bonds are identified in the crystal structure of the Streptococcus gordonii SspB C-terminal domain, Journal of Molecular Biology 397, 740-751.
3. Nylander, A., Forsgren, N., and Persson, K. (2011) Structure of the C-terminal domain of the surface antigen SpaP from the caries pathogen Streptococcus mutans, Acta Crystallogr Sect F Struct Biol Cryst Commun 67, 23-26.

370 MAX-lab ACTIVITY REPORT 2010
SYNCHROTRON RADIATION – BEAMLINE I911
Structural Studies of a Fimbrial Sortase from Actinomyces oris.
Karina Persson
Deptartment of Odontology, Umeå University SE-901 87 Umeå, Sweden
The oral bacteria Actinomyces oris, is one of the first colonizers of the oral cavity. As such,
it is important in the formation of the oral biofilm. The bacteria is Gram-positive and can
express two forms of fimbriae, type-1 and type-2 (1). Type-1 mediates adhesion of the
bacteria to salivary proteins that coat the surface of the tooth enamel (2). Type-2 fimbriae
contribute to biofilm formation by binding to carbohydrate structures on oral streptococci
and host cells (3). The two fimbriae are encoded by two separate operons, both encoding an
adhesin, a fimbrial shaft protein, followed by a fimbriae-specific sortase (4, 5). The sortase
is responsible for the covalent polymerization of the shaft protein. Sortases are cysteine
transpeptidases and can be divided into two classes; housekeeping (SrtA) and pilus sortases
(SrtC), both of which catalyze related but distinct reactions. Housekeeping sortases are
membrane-associated transpeptidases that recognize and cleave proteins between the
threonine and glycine of their peptidoglycan anchor motif LPXTG (6). During the reaction
the threonine of the surface protein becomes covalently bound to the nucleophilic cysteine
of the sortase after which the protein is transferred to the peptidoglycan of the cell-wall.
The polymerization of fimbriae requires specific sortases that catalyze a similar reaction by
cleaving the fimbrial shaft protein at its LPXTG motif and linking the threonine to a
conserved lysine of another subunit. This results in a stepwise polymerization of the
fimbriae. We have solved the structure of the type-1 associated sortase, AcSrtC-1, to 2.4 Å
resolution (7). The structure comprise an eight stranded -barrel with three helices on one
side. The active site, containing a His-Cys-Arg catalytic triad, is protected by a flexible lid
held in a closed position by the presence of a calcium ion.

MAX-lab ACTIVITY REPORT 2010 371
SYNCHROTRON RADIATION – BEAMLINE I911
1. Cisar, J. O., Vatter, A. E., Clark, W. B., Curl, S. H., Hurst-Calderone, S., and Sandberg, A. L. (1988) Mutants of Actinomyces viscosus T14V lacking type 1, type 2, or both types of fimbriae, Infect Immun 56, 2984-2989.
2. Gibbons, R. J., Hay, D. I., Cisar, J. O., and Clark, W. B. (1988) Adsorbed salivary proline-rich protein 1 and statherin: receptors for type 1 fimbriae of Actinomyces viscosus T14V-J1 on apatitic surfaces, Infect Immun 56, 2990-2993.
3. Palmer, R. J., Jr., Gordon, S. M., Cisar, J. O., and Kolenbrander, P. E. (2003) Coaggregation-mediated interactions of streptococci and actinomyces detected in initial human dental plaque, J Bacteriol 185, 3400-3409.
4. Chen, P., Cisar, J. O., Hess, S., Ho, J. T., and Leung, K. P. (2007) Amended description of the genes for synthesis of Actinomyces naeslundii T14V type 1 fimbriae and associated adhesin, Infect Immun 75, 4181-4185.
5. Yeung, M. K., Donkersloot, J. A., Cisar, J. O., and Ragsdale, P. A. (1998) Identification of a gene involved in assembly of Actinomyces naeslundii T14V type 2 fimbriae, Infect Immun 66, 1482-1491.
6. Ton-That, H., Marraffini, L. A., and Schneewind, O. (2004) Protein sorting to the cell wall envelope of Gram-positive bacteria, Biochim Biophys Acta 1694, 269-278.
7. Persson, K. (2011) Structure of the sortase AcSrtC-1 from Actinomyces oris, Acta Cryst D67, 212-217.

372 MAX-lab ACTIVITY REPORT 2010
SYNCHROTRON RADIATION – BEAMLINE I911
Solving the structure of the A1 protein from bacteriophage Q
Janis Rumnieks1 and Kaspars Tars1
1 Dept. of Protein Engineering, Latvian Biomedical Research and Study Centre, LV-1067, Riga, Latvia
Bacteriophage Q is a small RNA virus that infects E.coli bacteria. The virion consists of a single RNA molecule about 4200 nucleotides long and an icosahedral protein shell of T=3 symmetry. In addition to the coat protein, the virion contains a single copy of the maturation (A2) protein and a few copies of the minor coat protein A1, which is a C-terminally prolonged version of the coat protein and is formed when ribosomes occasionally read-through the leaky stop codon of the coat protein1. Both A1 and A2 proteins are required for infectivity, although their exact functions are not known2.
The read-through domain of the A1 protein was crystallized and the crystals diffracted to 1.8 Å resolution. The amino acid sequence of the A1 extension is not similar to any other protein, except some closely related phages, and the three-dimensional structure of none of them was known at the time. Therefore, to solve the structure, it was necessary to collect additional diffraction data from heavy atom derivatives of the crystals. To employ our method of choice, MIRAS (multiple isomorphous replacement with anomalous scattering), crystals were soaked in different iodine, mercury, platinum and gold-containing compounds and their diffraction data at different wavelengths were collected at MAX-Lab beamline I911-3. The mercury derivatives turned out to be too non-isomorphous to be useful, in platinum and gold-containing soaks there were no heavy atoms bound, and only the iodine derivative was of value for phasing and subsequent solving of the structure.
The solved structure revealed a rather heavily deformed five-stranded -barrel at one end of the protein and two anti-parallel sheets at the other (Fig.1). The N-terminal part of the protein contains a prominent polyproline type II helix. Several short -helices and well ordered loops are also present throughout the protein. The overall fold of the domain is not similar to any published structure in the Protein Data Bank. Although the structure of the A1 domain does not provide immediate answers about its function, our work provides a good starting point for further studies that could eventually lead to the understanding of the molecular mechanism by which the RNA of the phage enters the bacterial cell.
1 Weiner, A.M., Weber, K., 1971. Natural read-through at the UGA termination signal of Q coat protein cistron. Nature New Biol. 234, 206-209.
2 Hofstetter, H., Monstein, H.J., Weissmann, C. 1974. The readthrough protein A1 is essential for the formation of viable Q particles. Biochim. Biophys. Acta. 374, 238-251.
Figure 1. The three-dimensional structure of the A1 domain

MAX-lab ACTIVITY REPORT 2010 373
SYNCHROTRON RADIATION – BEAMLINE I911
The new automatic sample changer at I911-3. The central part is an industrial robot that can move with 10 m/s and 30 m precision and automatically mount anyone out of 90 prepared samples. The robot will help the users finding the best crystal, which can be the decisive point in elucidating unknown biological functions by determining molecular structures, 20 October 2010.Photo: Annika Nyberg
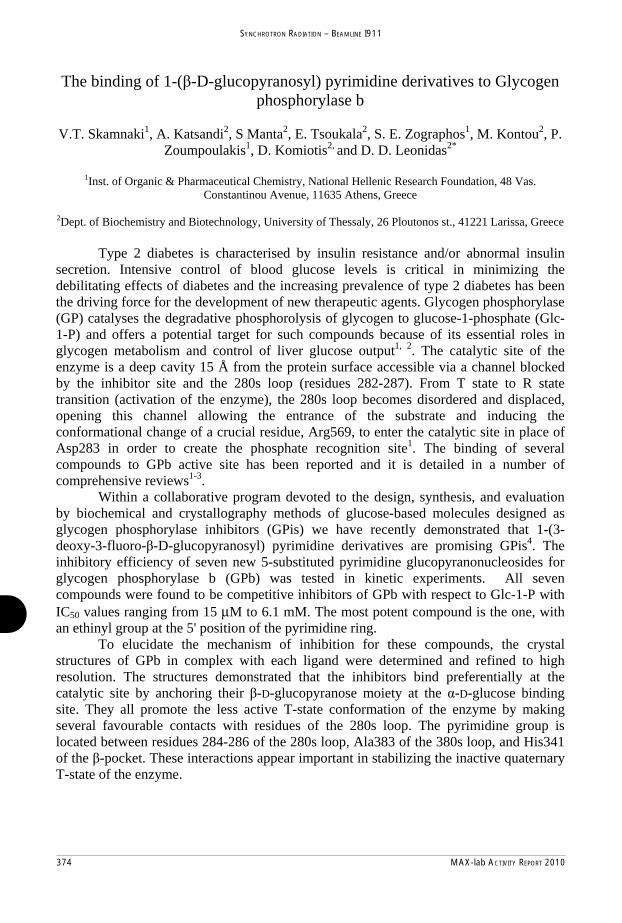
374 MAX-lab ACTIVITY REPORT 2010
SYNCHROTRON RADIATION – BEAMLINE I911
The binding of 1-( -D-glucopyranosyl) pyrimidine derivatives to Glycogen phosphorylase b
V.T. Skamnaki1, A. Katsandi2, S Manta2, E. Tsoukala2, S. E. Zographos1, M. Kontou2, P.
Zoumpoulakis1, D. Komiotis2, and D. D. Leonidas2*
1Inst. of Organic & Pharmaceutical Chemistry, National Hellenic Research Foundation, 48 Vas.
Constantinou Avenue, 11635 Athens, Greece
2Dept. of Biochemistry and Biotechnology, University of Thessaly, 26 Ploutonos st., 41221 Larissa, Greece
Type 2 diabetes is characterised by insulin resistance and/or abnormal insulin secretion. Intensive control of blood glucose levels is critical in minimizing the debilitating effects of diabetes and the increasing prevalence of type 2 diabetes has been the driving force for the development of new therapeutic agents. Glycogen phosphorylase (GP) catalyses the degradative phosphorolysis of glycogen to glucose-1-phosphate (Glc-1-P) and offers a potential target for such compounds because of its essential roles in glycogen metabolism and control of liver glucose output1, 2. The catalytic site of the enzyme is a deep cavity 15 Å from the protein surface accessible via a channel blocked by the inhibitor site and the 280s loop (residues 282-287). From T state to R state transition (activation of the enzyme), the 280s loop becomes disordered and displaced, opening this channel allowing the entrance of the substrate and inducing the conformational change of a crucial residue, Arg569, to enter the catalytic site in place of Asp283 in order to create the phosphate recognition site1. The binding of several compounds to GPb active site has been reported and it is detailed in a number of comprehensive reviews1-3.
Within a collaborative program devoted to the design, synthesis, and evaluation by biochemical and crystallography methods of glucose-based molecules designed as glycogen phosphorylase inhibitors (GPis) we have recently demonstrated that 1-(3-deoxy-3-fluoro- -D-glucopyranosyl) pyrimidine derivatives are promising GPis4. The inhibitory efficiency of seven new 5-substituted pyrimidine glucopyranonucleosides for glycogen phosphorylase b (GPb) was tested in kinetic experiments. All seven compounds were found to be competitive inhibitors of GPb with respect to Glc-1-P with IC50 values ranging from 15 μM to 6.1 mM. The most potent compound is the one, with an ethinyl group at the 5' position of the pyrimidine ring.
To elucidate the mechanism of inhibition for these compounds, the crystal structures of GPb in complex with each ligand were determined and refined to high resolution. The structures demonstrated that the inhibitors bind preferentially at the catalytic site by anchoring their -D-glucopyranose moiety at the -D-glucose binding site. They all promote the less active T-state conformation of the enzyme by making several favourable contacts with residues of the 280s loop. The pyrimidine group is located between residues 284-286 of the 280s loop, Ala383 of the 380s loop, and His341 of the -pocket. These interactions appear important in stabilizing the inactive quaternary T-state of the enzyme.

MAX-lab ACTIVITY REPORT 2010 375
SYNCHROTRON RADIATION – BEAMLINE I911
1. N.G. Oikonomakos, Curr Protein Pept Sci, 3, 561-86 (2002) 2. L. Somsak, K. Czifrak, M. Toth, E. Bokor, E.D. Chrysina, K.M. Alexacou, J.M. Hayes, C. Tiraidis, E.
Lazoura, D.D. Leonidas, S.E. Zographos, and N.G. Oikonomakos, Curr Med Chem, 15, 2933-83 (2008) 3. N.G. Oikonomakos and L. Somsak, Curr Opin Investig Drugs, 9, 379-395 (2008) 4. V.G. Tsirkone, E. Tsoukala, C. Lamprakis, S. Manta, J.M. Hayes, V.T. Skamnaki, C. Drakou, S.E.
Zographos, D. Komiotis, and D.D. Leonidas, Bioorg Med Chem, 18, 3413-25 (2010)

376 MAX-lab ACTIVITY REPORT 2010
SYNCHROTRON RADIATION – BEAMLINE I911
Colloidal Resource

MAX-lab ACTIVITY REPORT 2010 377
SYNCHROTRON RADIATION – BEAMLINE I911
Janina Sprenger from department of biochemistry and structural biology, Lund University, and her colleague, are discussing their project during beamtime at the beamline I911-2, 20 October 2010.Photo: Annika Nyberg
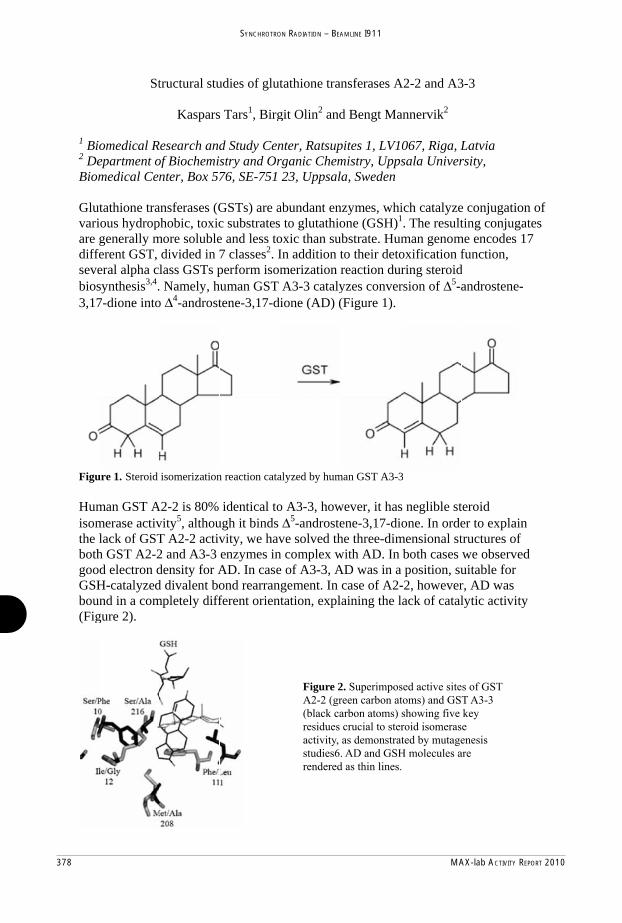
378 MAX-lab ACTIVITY REPORT 2010
SYNCHROTRON RADIATION – BEAMLINE I911
1 Bi2 DeBiom Gluvariare diffsevebios3,17
Figu Humisomthe bothgooGSHbou(Fig
St
iomedical Repartment ofmedical Cen
utathione traious hydropgenerally m
ferent GST, eral alpha csynthesis3,4.7-dione into
ure 1. Steroid
man GST Amerase activlack of GSTh GST A2-2d electron dH-catalyzed
und in a comgure 2).
tructural stu
Kaspars
Research andof Biochemisnter, Box 5
ansferases (Gphobic, toxicmore soluble
divided in 7lass GSTs p. Namely, ho Δ4-androst
isomerization
A2-2 is 80% vity5, althouT A2-2 activ2 and A3-3 density for Ad divalent bompletely diff
udies of glut
s Tars1, Birg
d Study Censtry and Or76, SE-751
GSTs) are ac substratese and less to7 classes2. Iperform isom
human GST tene-3,17-d
n reaction cata
identical tough it binds vity, we havenzymes inAD. In caseond rearranferent orien
tathione tran
git Olin2 and
nter, Ratsuprganic Chem23, Uppsal
abundant en to glutathio
oxic than suIn addition tmerization rA3-3 catalyione (AD) (
alyzed by hum
o A3-3, howΔ5-androste
ve solved thn complex we of A3-3, Agement. In tation, expl
Figure 2.SA2-2 (gree(black carbresidues cractivity, asstudies6. Arendered a
nsferases A
d Bengt Ma
pites 1, LV1mistry, Uppsla, Sweden
nzymes, whione (GSH)1
ubstrate. Humto their detoreaction duryzes conver(Figure 1).
man GST A3-3
wever, it hasene-3,17-dihe three-dimwith AD. In AD was in a
case of A2-aining the l
Superimposeen carbon atobon atoms) srucial to steros demonstrat
AD and GSH as thin lines.
A2-2 and A3
annervik2
067, Riga, Lsala Univer
ich catalyze1. The resultman genomoxification fring steroidrsion of Δ5-a
3
s neglible stone. In orde
mensional stboth cases
a position, su-2, howeverlack of catal
d active sitesoms) and GShowing five oid isomerased by mutagmolecules a
3-3
Latvia rsity,
e conjugatioting conjuga
me encodes 1function,
d androstene-
teroid er to explaintructures of we observeuitable for r, AD was lytic activity
s of GST ST A3-3
key se genesis are
on of ates 17
-
n fed
y
Figure 2. Superimposed active sites of GST A2-2 (green carbon atoms) and GST A3-3 (black carbon atoms) showing five key residues crucial to steroid isomerase activity, as demonstrated by mutagenesis studies6. AD and GSH molecules are rendered as thin lines.

MAX-lab ACTIVITY REPORT 2010 379
SYNCHROTRON RADIATION – BEAMLINE I911

380 MAX-lab ACTIVITY REPORT 2010
SYNCHROTRON RADIATION – BEAMLINE I911
Acetylcholine binding protein as a model system for nicotinic acetylcholine receptors
L.A.H. Thomsen, Christine Ussing, C. Helgstrand, C. Krintel, T. Balle,
M. Gajhede and J.S. Kastrup Biostructural Research, Department of Medicinal Chemistry, Faculty of Pharmaceutical Sciences, University of Copenhagen, Universitetsparken 2, DK-2100 Copenhagen, Denmark Nicotinic acetylcholine receptors (nAChRs) form ligand-gated ion channels and are directly linked to an ion channel. nAChRs are activated by binding of the neurotransmitter acetylcholine. nAChRs are present in many tissues and are some of the best studied ionotropic receptors. The neuronal receptors are found in the central nervous system and the peripheral nervous system, whereas the neuromuscular receptors are found in the neuromuscular junctions of somatic muscles. The nAChR family comprises 17 different subunits in humans and the assembly of combinations of subunits results in a large number of different receptors.
Therapeutic intervention in receptor signaling has proven beneficial in several neurological and psychiatric disorders. In addition to being targeted by marketed smoking
cessation aids, the acetylcholine receptors constitute promising targets for the treatment of a wide range of neurodegenerative and psychiatric disorders, such as Alzheimer’s disease, Parkinson’s disease, schizophrenia and depression. Therefore, much effort has been and needs to be directed toward understanding the structure, function and basis for subtype selective drug targeting of these receptors.
3D-structural information are available from a low resolution cryo-electron microscopy image of a
torpedo electric ray nAChR (1), a high resolution X-ray structure of the mouse alpha1 nAChR monomer (2), two different species of distantly related bacterial ion channels (3,4) as well as from the acetylcholine binding proteins from the water snails Lymnaea stagnalis (5), Bulinus truncatus (6) and Aplysia californica (7). Although not ion
Figure 1. Structure of a complex of LS-AChBP with an agonist from NeuroSearch A/S

MAX-lab ACTIVITY REPORT 2010 381
SYNCHROTRON RADIATION – BEAMLINE I911
channels, the snail proteins have the dimension and shape of the N-terminal domain of the nAChRs and furthermore, they have been shown to reproduce the relative binding affinities of a number of nAChR ligands. Despite more than 25 AChBP-ligand co-crystal structures deposited in the Protein Data Bank, there is a need for structures addressing e.g. the differences between a good binder and a good agonist, subtype selectivity and binding sites for allosteric modulators.
We have established a pipeline for expression, purification and crystallization of the AChBPs from Lymnaea stagnalis (LS) and Applysia californica, as well as screening assays to guide the selection of ligands for co-crystallization. In 2010, we have collected full data sets of LS-AChBP with four compounds synthesized at NeuroSearch A/S and two in-house synthesized compounds. Of these six data sets, four have been collected at MAX-lab (beamlines I911-2 and I911-3). The resolution of the data sets ranges from 2.3-2.7 Å. All structures have been solved by molecular replacement and contain 2 or 4 pentamers (ca. 2000 or 4000 amino acid residues) within the asymmetric unit of the crystal (figure 1). The structures unravel important details of ligand binding.
We consider LS-AChBP to be the best surrogate of nAChRs for studying binding of agonists and partial agonists, due to a high sequence identity and good correlation between binding affinities when compared to nAChRs.
------------------------------------------------------------------------------------------------------------
References
1. N. Unwin, Refined structure of the nicotinic acetylcholine receptor at 4A resolution, J. Mol. Biol. 346, 967, 2005.
2. C.D. Dellisanti, Y. Yao, J.C. Stroud, Z.Z. Wang, and L Chen, Crystal structure of the extracellular domain of nAChR alpha1 bound to alpha-bungarotoxin at 1.94 A resolution, Nat. Neurosci. 10, 953, 2007.
3. N. Bocquet, H. Nury, M. Baaden, C. Le Poupon, J.P. Changeux, M. Delarue, and P.J. Corringer, X-ray structure of a pentameric ligand-gated ion channel in an apparently open conformation, Nature 457, 111, 2009.
4. R.J. Hilf and R. Dutzler, Structure of a potentially open state of a proton-activated pentameric ligand-gated ion channel, Nature 457, 115, 2009.
5. K. Brejc, W.J. van Dijk, R.V. Klaassen, M. Schuurmans, J. van Der Oost, A.B. Smit, and T.K. Sixma, Crystal structure of an ACh-binding protein reveals the ligand-binding domain of nicotinic receptors, Nature, 411, 269, 2001.
6. P.H. Celie, R.V. Klaassen, S.E. van Rossum-Fikkert, R. van Elk, P. van Nierop, A.B. Smit, and T.K. Sixma, Crystal structure of acetylcholine-binding protein from Bulinus truncatus reveals the conserved structural scaffold and sites of variation in nicotinic acetylcholine receptors, J. Biol. Chem. 280, 26457, 2005.
7. Hansen SB, Sulzenbacher G, Huxford T, Marchot P, Taylor P, Bourne Y., Structures of Aplysia AChBP complexes with nicotinic agonists and antagonists reveal distinctive binding interfaces and conformations, EMBO J. 24, 3635, 2005.

382 MAX-lab ACTIVITY REPORT 2010
SYNCHROTRON RADIATION – BEAMLINE I911
Crystal structure of odorant binding protein 4 from Anopheles gambiae complexed with N -Phenyl-1-naphthylamine
Katerina E. Tsitsanou1, Christina E. Drakou1, Maria Keramioti1 and Spyros E. Zographos1*
1Institute of Organic and Pharmaceutical Chemistry, The National Hellenic Research Foundation, 48, Vas. Constantinou Ave. Athens 11635, Greece.
*e-mail: [email protected]
Malaria is the most common parasitic tropical disease, caused by the parasite Plasmodium falciparum which is transmitted to humans by female mosquitoes, particularly Anopheles gambiae, during blood feeding. Hydrophobic odor molecules that enter in the sensillum lymph cavity from the outside air space are captured by the odorant-binding proteins (OBPs), present in the olfactory sensilla of mosquito antenna, which facilitate to the odor transportation to the odorant receptors. OBPs may serve as molecular targets for the rational development of better, environmentally-friendly repellents thus preventing mosquitoes from identifying their human hosts and transmitting the malaria parasite in the process. Only 2 of the 60 odorant binding proteins of A. gambiae mosquito [1], AgamOBP1 [2] and AgamOBP4 [Tsitsanou et al., in preparation] (Figure 1) have been crystallised until today. The structure of AgamOBP4 in complex with the fluorescence probe N-Phenyl-1-naphthylamine (1-NPN), determined at 1.6 Å resolution and refined to an R-factor of 0.191 (Rfree = 0.229). Single crystal diffraction data were collected on the MaxLab-ID911-2 station. Data collection statistics are summarized in Table 1.
Table 1. Data collection and refinement statistics
Experiment AgamOBP4 1-NPN
Space group P212121
Unit cell dimensions (Å, o) 59.95, 60.13, 67.26, 90.0, 90.0, 90.0
Resolution range (Å) 20.24-1.60 (1.69-1.60)
No. of observations 129,721
No. of unique reflections 31,053
<I/ (I)> 18.9 (8.8)
Completeness (%) 95.5 (98.9)
Rmerge 0.058 (0.14)
Redundancy 4.2 (4.0)
Molecules/asymmetric unit 2
Figure 1. AgamOBP4 crystals
Values in parenthesis correspond to the highest resolution shell.

MAX-lab ACTIVITY REPORT 2010 383
SYNCHROTRON RADIATION – BEAMLINE I911
AgamOBP4 binding site is a hydrophobic cavity located in the center of the molecule and is accessible to the solvent through a narrow opening between 4 and 5 helices. A PEG molecule, present in the crystallisation reagent, occupies the remaining area of the cavity and interacts with 1-NPN. AgamOBP4 1-NPN complex structure analysis revealed the location of the binding site and provided insight into the role of the amino acids that participate in ligand recognition.
[1] Biessmann, H., Nguyen, Q.K., Le, D., Walter, M.F. Microarray-based survey of a subset of putative olfactory genes in the mosquito Anopheles gambiae. Insect Molecular Biology 14(6): 575-589, 2005. [2] Wogulis M., Morgan T., Ishida Y., Leal W. S. and Wilson D. K. The crystal structure of an odorant binding protein from Anopheles gambiae: Evidence for a common ligand release mechanism. Biochem Biophys Res Commun 339, 157-164, 2006.

384 MAX-lab ACTIVITY REPORT 2010
SYNCHROTRON RADIATION – BEAMLINE I911
I911-3 Upgrade: A new State-of-the-art Experimental Set-up
J. Unge1, C. Svensson1, K. Theodor2,3, H. Svensson1, A. Månsson1, C. Lenngren1, F. Hägneryd1, R. Andersson1, B. Svensson1, B. Sommarin1, D. Logan1,2,
M.M.G.M. Thunnissen1,2, and T. Ursby1
1 MAX IV Laboratory, Lund University, P.O.Box 118, S-221 00 Lund, Sweden 2 Biochemistry and Structural Biology, Center for Chemistry and Chemical Engineering, Lund University
P.O.Box 124, S-221 00 Lund, Sweden 3 Niels Bohr Institute, H.C. Ørsted Institute, Universitetsparken 5, DK-2100 Copenhagen, Denmark
The I911-3 beamline1 is one of five experimental stations at the I911 (or Cassiopeia) beamline. In 2010 the experiment set-up of the I911-3 beamline was completely rebuilt. The beamline was closed during March-May and opened again for users in June 2010 though not all features of the upgrade were yet available for the users. The new set-up together with on-going software developments includes standards that can be expected of a state-of-the-art MX beamline even in the perspective of MAX IV. At MAX IV the beam qualities will be much higher allowing e.g. to work with micro-crystals but already at present we have taken important steps towards handling smaller crystals and allowing screening of large number of crystals to the benefit of our users but also preparing and learning for the MAX IV beamlines. This is in particular true for the software environment we are developing and implementing, which should be transferable to MAX IV.
The new set-up includes a EMBL/ESRF MD2 micro-diffractometer that reduces the x-ray background significantly and therefore delivers a much better signal to noise ratio for weak diffraction. In addition, the MD2 is equipped with a triple aperture allowing the user to select a 50 um, 100 um or a 200 um beam defining aperture. For small crystals (50 um or below) this combination dramatically improves the signal to noise ratio. The on-line crystal and beam viewing is an additional important tool for working with small crystals.
The MD2 is equipped with a mini-kappa allowing to orient the sample specifically which can be important for e.g. optimizing the
Figure 2: Sample holder on the mini-kappa (lower left) with sample changer tool (upper right), cryo nozzle (top), on-line viewing and sample illumination (upper left) with the triple aperture in the centre of the lens.
Figure 1: MD2 with single-axis head (left), fluorescence detector (top), cryo (top right) and beam stop (centre).

MAX-lab ACTIVITY REPORT 2010 385
SYNCHROTRON RADIATION – BEAMLINE I911
anomalous signal and for optimally completing the data from radiation sensitive crystals. The new sample changer CATS2 is based on an industrial robot. It can select and mount
one of 90 pre-frozen samples from EMBL/ESRF standard sample containers stored in a liquid nitrogen dewar. The sample changer can also handle crystallization plates, which allows screening of crystals before any sample manipulation helping in the optimisation of the
crystallization conditions and the sample handling.
The HC13 is a device that can control the humidity around crystal samples. It has been developed at EMBL-Grenoble and is now further developed in collaboration with EMBL-Grenoble, Diamond Light Source and MAX-lab4. HC1 will be added as a user option at the I911-3 beamline. The HC1 can in some cases improve the diffraction quality of crystals but it is also important in allowing room-temperature tests without difficult sample handling and is in this way complementing the crystallization plate handling of the sample changer robot.
The new experiment set-up also includes additional slits, new intensity detectors, a new fast shutter, a BPM positioned close to the sample and a new Leica microscope. The fluorescence detector has been upgraded while the area detector is the same marmosaic225 as before the upgrade.
Unfortunately, the water-cooled crystal of the double crystal monochromator cracked during the summer shutdown 2010 causing the beamline to be closed during the autumn. Now in Februrary 2011 the beamline is again open for users. We expect the full implementation of the upgrade to be in place later during the spring, including making the sample changer available for users, while the work on improving the beamline, especially concerning software, will continue in the autumn and beyond.
The beamline has obtained funding from the Knut and Alice Wallenberg foundation, the Danish Biotechnology Instrument Center DABIC, the Swedish Research Council VR, the Swedish Foundation for Strategic Research, Danscatt, Bioxhit, IA-SFS and from AstraZeneca and Novo Nordisk A/S. We would like to acknowledge the generous support by the MAX-lab personnel. For further information and updates please see the beamline homepage5.
Figure 3: The new I911-3 experiment set-up with the robot of the sample changer in the centre. The area detector can be seen to the left on its granite support.
1 T. Ursby, C.B. Mammen, Y. Cerenius, C. Svensson, B. Sommarin, M.N. Fodje, Å. Kvick, D.T. Logan, J. Als-Nielsen, M.M.G.M. Thunnissen, S. Larsen, and A. Liljas, AIP Conference Proceedings 705, 1241 (2004). 2 J. Ohana, L. Jacquamet, J. Joly, A. Bertoni, P. Taunier, L. Michel, P. Charrault, M. Pirocchi, P. Carpentier, F. Borel, R. Kahn, and J.L. Ferrer, J Appl. Crystallogr. 37, 72 (2003). 3 J. Sanchez-Weatherby M.W. Bowler, J. Huet, A. Gobbo, F. Felisaz, B. Lavault, R. Moya, J. Kadlec, R.B.G. Ravelli, and F. Cipriani, Acta Cryst. D65, 1237 (2009). 4 W. Ubhayasekera, T. Ursby, and M.M.G.M Thunnissen, MAX-lab Activity Report 2009, 376 (2009). 5 http://www.maxlab.lu.se/beamlines/bli911

386 MAX-lab ACTIVITY REPORT 2010
SYNCHROTRON RADIATION – BEAMLINE I911
X-ray Structure Studies of potent inhibitors agains the drug
resistance due to the mutations V82T and I84V of HIV-1
Protease
Torsten Unge,‡ Hans Wallberg,§ Bertil Samuelsson,§ Anders Hallberg,† and
Mats Larhed*†
‡Department of Cell and Molecular Biology, Structural Biology, BMC, Uppsala University,
Box 596, SE-751 24 Uppsala, Sweden,†Department of Medicinal Chemistry, Organic
Pharmaceutical Chemistry, BMC, Uppsala University, Box 574, SE-751 23 Uppsala, Sweden,
and §Medivir AB, Lunastigen 7, SE-141 44, Huddinge, Sweden
A new generation of HIV-1 protease inhibitors with potency against the drug
resitance mutations V82T and I84V has been developed. This study includes
inihibitors base on new synthetic methods and also the effects of different lengths of
the central core of the inhibitors. X-ray data were collected at the beam lines 911.1-3.
Crystal of HIV-1 protease were produced in complex with a number of inhibitor
compounds under optimization development. In this work 3 data sets were collected
of the complexes with three different inhibitors. Data were collected at highest
resolutions of 1.5 to 1.7 Å resolution. The crystal space group was P21212, which
contains the entire protease dimer in the asymmetric unit.
Binding mode of one the inhibitors in the active site of HIV-1 protease. The catalytic residues are Asp25/Asp125.

MAX-lab ACTIVITY REPORT 2010 387
SYNCHROTRON RADIATION – BEAMLINE I911
During the summer months the new hutch of I911-4 SAXS beamline was put into place. The commisioning activities were under development in 2010. 24 June 2010.Photo: Annika Nyberg

388 MAX-lab ACTIVITY REPORT 2010
SYNCHROTRON RADIATION – BEAMLINE I911
Structural fundament for structure-based design of ligands for ionotropic glutamate receptors
Raminta Venskutonyte, Christian Krintel, Karla Frydenvang,
Michael Gajhede and Jette S. Kastrup Biostructural Research, Department of Medicinal Chemistry, Faculty of Pharmaceutical Sciences, University of Copenhagen, Universitetsparken 2, DK-2100 Copenhagen, Denmark Ionotropic glutamate receptors (iGluRs) are responsible for the major part of the fast excitatory synaptic transmission in the mammalian brain. The iGluRs are divided into 2-amino-3-(3-hydroxy-5-methyl-4-isoxazolyl)propionic acid (AMPA), kainic acid and N-methyl-D-aspartic acid (NMDA) receptors based on selective agonist-binding properties and sequence similarity of the receptor subunits. The three classes of iGluRs each consist of a number of subunits: GluA1-4 for AMPA receptors, GluK1-5 for kainate receptors and GluN1, GluN2A-D and GluN3A-B for NMDA receptors. The iGluRs share a similar tetrameric structure where the subunits assemble as a set of two dimers. Each subunit contains a bi-lobed ligand-binding domain attached to the transmembrane regions
forming the ion channel pore.
Since the first crystal structure of the genetically engineered form of the GluA2 ligand-binding domain (LBD) was reported (1), several structures of this protein and other subunits have been determined. The majority of the structures are co-crystals of the ligand-binding domains with agonists, antagonists and positive allosteric modulators. Even though a representative structure has been reported for all classes of iGluRs, structures of several iGluR subunits are still lacking. The crystal structure of the rat full-length homotetrameric GluA2 receptor was recently determined to 3.6 Å resolution in complex with the competitive antagonist ZK 200775 (2). A comparison of the full-length GluA2 structure with the GluA2-LBD structure
Fig.1 Structure of the ligand binding domain of the AMPA receptor GluA2 in complex with the agonist 7-HPCA (pdb code 3PD8). Data were collected at I911.
MAX-lab ACTIVITY REPORT 2010 389
SYNCHROTRON RADIATION – BEAMLINE I911
References 1. N. Armstrong, E. Gouaux, Neuron 28, 165, 2000.
2. A.I. Sobolevsky, M.P. Rosconi, E. Gouaux, Nature 462, 745, 2009.
3. K. Frydenvang, D.S. Pickering, J.R. Greenwood, N. Krogsgaard-Larsen, L. Brehm, B. Nielsen, S.B. Vogensen, H. Hald, J.S. Kastrup, P. Krogsgaard-Larsen, R.P. Clausen. J. Med. Chem. 2010 Nov 10.
in complex with the antagonist UBP282 shows that the soluble LBD is a good model system of the full length-receptor for studying binding of agonists and antagonists binding at the glutamate binding site as well as allosteric modulators binding at the LBD dimer interface as the dimeric unit is very similar.
In 2010, we have successfully worked on this project at MAX-Lab (I911). The studies have focused on the LBDs of GluA2, GluA4, GluK1 and GluK3. We have succeeded to determine four new structures. Structures of the GluA2 LBD have been determined in complex with two allosteric modulators from NeuroSearch A/S and the GluK1 LBD in complex with an in-house antagonist. Also, in 2010 we have established a method for expression and purification of the GluK3 LBD for which no structures have been reported. Data were successfully collected at I911 to 2.3 Å resolution which allowed structure determination. Data have recently been optimized to 1.7 Å resolution elsewhere. Furthermore, the structures of the in-house synthesized agonists 5-HPCA and 7-HPCA (fig. 1) in complex with GluA2 LBD have been published (3).
The iGluR project work is heavily dependent on the use of synchrotron radiation.

390 MAX-lab ACTIVITY REPORT 2010
SYNCHROTRON RADIATION – BEAMLINE I911
Structural Studies of the G3BP1 and Rin NTF2-like domains.
Tina Vognsen, Ingvar Rúnar Möller and Ole Kristensen
Biostructural Research, Faculty of Pharmaceutical Sciences, University of CopenhagenUniversitetsparken 2, DK-2100 Copenhagen, Denmark.
Being over-expressed in breast cancer tumours (French et al., 2002), Ras-GTPase activating Protein
SH3 domain Binding Protein (G3BP) is considered a significant cancer marker protein. It was identified
in a screen for proteins binding to the SH3 domain of Ras-GTPase activating protein (RasGAP) (Parker et
al., 1996). Initially, multiple PxxP motifs found in a proline rich region of the protein was thought to be
responsible for binding to the RasGAP SH3 domain (Parker et al., 1996), but later the binding site has
been located to the N-terminal Nuclear Transport Factor 2 (NTF2)-like domain of G3BP (Kennedy et al.,
2002). Besides binding to RasGAP, G3BP is managing multiple tasks: it takes part in c-myc mRNA
turnover (Gallouzi et al., 1998), interacts with ubiquitin specific proteases (Soncini et al., 2001), and is
involved in NF- et al., 2000) and stress granule assembly (Tourrier et al., 2003).
The NTF2-like domain of human G3BP1 was sub-cloned, overexpressed in Escherichia coli, purified
and crystallized. Diffraction data was collected to 3.6 Å resolution using synchrotron radiation (Vognsen
et al., 2010). The crystals belonged to the hexagonal space group P6322 with unit cell dimensions a=b=
89.84 Å, and c=70.02 Å. Initial phases were obtained by molecular replacement (MR) and by
experimental heavy-atom substitution (Figure 1). Preliminary data, to a resolution of 2.8 Å, were also
collected from a weakly diffracting crystal of the orthologue Drosophila Rin NTF2-like domain. The
structure was solved by MR in space group C2 and with unit cell parameters of a=38.08, b=71.33,
c=79.75 Å and =90.27 .
Recently, a molecular model of the NTF2-like domain of G3BP in complex with the RasGAP SH3
domain has been published (Cui et al. 2010). Cui and co-workers based their model on a combination of
homology modelling, protein-protein docking, and molecular dynamics simulations. However, obtaining
an experimental structure of the NTF2-like domain is important in order to increase the reliability of
molecular modelling attempts and to investigate the potential of G3BP as a drug target.

MAX-lab ACTIVITY REPORT 2010 391
SYNCHROTRON RADIATION – BEAMLINE I911
References
French, J., Stirling, R., Walsh, M. & Kennedy, H.D. (2002). The Histochemical Journal, 34, 223-31
Parker, F., Maurier, F., Delumeau, I., Duchesne, M., Faucher, D., Debussche, L., Schweighofer, F. & Tocque, B. (1996). Molecular and Cellular Biology, 16, 2561–2569
Gallouzi, I., Parker, F., Chebli, K., Maurier, F., Labourier, E., Barlat, I., Capony, J.P., Tocque, B. & Tazi, J. (1998). Molecular and Cellular Biology, 18, 3956–3965
Soncini, C., Berdo, I. & Draetta, G. (2001). Oncogene, 20, 3869-3879
Prigent, M., Barlat, I., Langen, H., Dargemont, C. (2000). Journal of Biological Chemistry, 275, 36441-36449
Tourrière, H., Chebli, K., Zekri, L., Courselaud, B., Blanchard, J.M., Bertrand, E., & Tazi, J. (2003). The Journal of Cell Biology, 160, 823-831
Cui, W., Wei, Z., Chen, Q., Cheng, Y., Geng, L., Zhang, J., Chen, J., Hou, T. & Ji, M. (2010). J. Chem. Inf. Model., 50, 380–387
Tina Vognsen, Ingvar Rúnar Möller and Ole Kristensen (2010). Acta Cryst F, 67, 48-50.
Figure 1. Experimental electron density map for the G3BP1 NTF2-like domain partly derived from phases obtained using data collected at the MaxLab beamline I911-2. Model building and refinement is in progress.

392 MAX-lab ACTIVITY REPORT 2010
SYNCHROTRON RADIATION – BEAMLINE D1011
Synthesis and NEXAFS characterization of Gd2O3 nanoparticles
Maria Ahrén, Linnéa Selegård, Linnéa Axelsson Cecilia Vahlberg and Kajsa Uvdal1
Division of Molecular Surface Physics and Nanoscience, Department of Physics, Chemistry
and Biology (IFM), Linköping University, SE-581 83 Linköping, Sweden Approximately 50 % of the Magnetic Resonance Imaging (MRI) exams are today performed with different kinds of contrast agents to enhance the resolution and increase the ability to discriminate between diseased and healthy tissues in the body. Among the most frequently used contrast agents are Gd complexes, in which the Gd ion is bound to a chelating agent, for example DOTA or DTPA. To further increase the sensitivity, contrast agents based on for example nanoparticles are studied. The main advantage of using a nanoparticle based system instead of ion based chelates is that the former is expected to yield a considerably higher relaxivity due to a higher density of magnetic ions1,2.
Figure 1. A schematic figure showing the general purpose of the project. The image of the MRI scanner is used with permission from Philips. The aim of this project is to design new nanoparticle based contrast agents with for MRI signal enhancement The material presented in this work is synthesized at room temperature and the end product after centrifuge washing is highly crystalline and shows an extraordinary solubility and stability in water solution. Characterization of the nanoparticles
were done at beamline D1011, MaxLab, Lund using X-ray Photoelectron Spectroscopy and Near -Edge X-ray Absorption Fine Structure (NEXAFS) spectroscopy. The C K-edge spectra of Gd acetate and Gd2O3 nanoparticles are shown in Figure 2 A and B, respectively. The spectrum for the Gd2O3 nanoparticles shows two major peaks originating from acetate- and carbonate groups and several minor features. The very sharp peak at 288.3 eV is assigned to C1s
* C=O transitions in the acetate unit in consistence with the main peak in Gd acetate spectrum.
Figure 2 NEXAFS C K-edge spectra of Gd acetate (A) and Gd2O3 nanoparticles (B). Complex binding of the acetate unit to metal ions have earlier shown to alter the NEXAFS spectra of the acetate group3,4. Complexation is thought to induce an intensity decrease in the main peak at 288.3 and at the same time a shoulder appears at slightly lower energy. Our results show a small feature observed as a shoulder
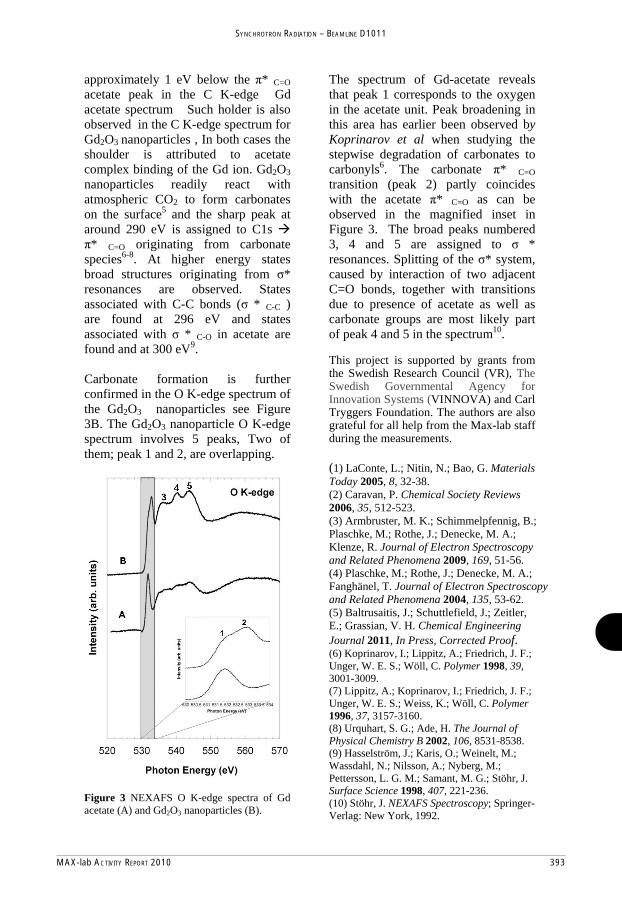
MAX-lab ACTIVITY REPORT 2010 393
SYNCHROTRON RADIATION – BEAMLINE D1011
approximately 1 eV below the * C=O acetate peak in the C K-edge Gd acetate spectrum Such holder is also observed in the C K-edge spectrum for Gd2O3 nanoparticles , In both cases the shoulder is attributed to acetate complex binding of the Gd ion. Gd2O3 nanoparticles readily react with atmospheric CO2 to form carbonates on the surface5 and the sharp peak at around 290 eV is assigned to C1s
* C=O originating from carbonate species6-8. At higher energy states broad structures originating from * resonances are observed. States associated with C-C bonds ( * C-C ) are found at 296 eV and states associated with * C-O in acetate are found and at 300 eV9. Carbonate formation is further confirmed in the O K-edge spectrum of the Gd2O3 nanoparticles see Figure 3B. The Gd2O3 nanoparticle O K-edge spectrum involves 5 peaks, Two of them; peak 1 and 2, are overlapping.
Figure 3 NEXAFS O K-edge spectra of Gd acetate (A) and Gd2O3 nanoparticles (B).
The spectrum of Gd-acetate reveals that peak 1 corresponds to the oxygen in the acetate unit. Peak broadening in this area has earlier been observed by Koprinarov et al when studying the stepwise degradation of carbonates to carbonyls6. The carbonate * C=O transition (peak 2) partly coincides with the acetate * C=O as can be observed in the magnified inset in Figure 3. The broad peaks numbered 3, 4 and 5 are assigned to * resonances. Splitting of the * system, caused by interaction of two adjacent C=O bonds, together with transitions due to presence of acetate as well as carbonate groups are most likely part of peak 4 and 5 in the spectrum10. This project is supported by grants from the Swedish Research Council (VR), The Swedish Governmental Agency for Innovation Systems (VINNOVA) and Carl Tryggers Foundation. The authors are also grateful for all help from the Max-lab staff during the measurements. (1) LaConte, L.; Nitin, N.; Bao, G. Materials Today 2005, 8, 32-38. (2) Caravan, P. Chemical Society Reviews 2006, 35, 512-523. (3) Armbruster, M. K.; Schimmelpfennig, B.; Plaschke, M.; Rothe, J.; Denecke, M. A.; Klenze, R. Journal of Electron Spectroscopy and Related Phenomena 2009, 169, 51-56. (4) Plaschke, M.; Rothe, J.; Denecke, M. A.; Fanghänel, T. Journal of Electron Spectroscopy and Related Phenomena 2004, 135, 53-62. (5) Baltrusaitis, J.; Schuttlefield, J.; Zeitler, E.; Grassian, V. H. Chemical Engineering Journal 2011, In Press, Corrected Proof. (6) Koprinarov, I.; Lippitz, A.; Friedrich, J. F.; Unger, W. E. S.; Wöll, C. Polymer 1998, 39, 3001-3009. (7) Lippitz, A.; Koprinarov, I.; Friedrich, J. F.; Unger, W. E. S.; Weiss, K.; Wöll, C. Polymer 1996, 37, 3157-3160. (8) Urquhart, S. G.; Ade, H. The Journal of Physical Chemistry B 2002, 106, 8531-8538. (9) Hasselström, J.; Karis, O.; Weinelt, M.; Wassdahl, N.; Nilsson, A.; Nyberg, M.; Pettersson, L. G. M.; Samant, M. G.; Stöhr, J. Surface Science 1998, 407, 221-236. (10) Stöhr, J. NEXAFS Spectroscopy; Springer-Verlag: New York, 1992.
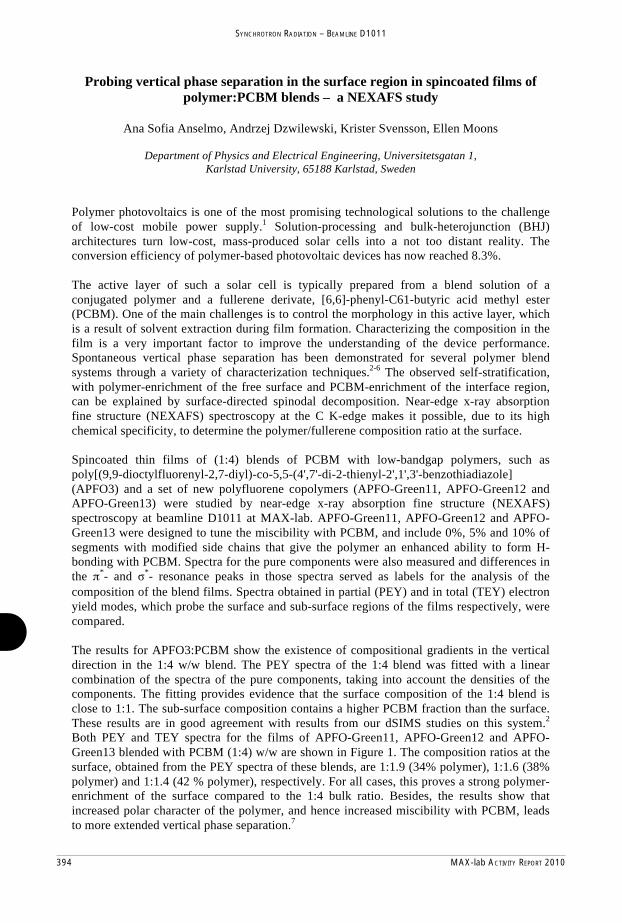
394 MAX-lab ACTIVITY REPORT 2010
SYNCHROTRON RADIATION – BEAMLINE D1011
Probing vertical phase separation in the surface region in spincoated films of
polymer:PCBM blends – a NEXAFS study
Ana Sofia Anselmo, Andrzej Dzwilewski, Krister Svensson, Ellen Moons
Department of Physics and Electrical Engineering, Universitetsgatan 1, Karlstad University, 65188 Karlstad, Sweden
Polymer photovoltaics is one of the most promising technological solutions to the challenge of low-cost mobile power supply.1 Solution-processing and bulk-heterojunction (BHJ) architectures turn low-cost, mass-produced solar cells into a not too distant reality. The conversion efficiency of polymer-based photovoltaic devices has now reached 8.3%. The active layer of such a solar cell is typically prepared from a blend solution of a conjugated polymer and a fullerene derivate, [6,6]-phenyl-C61-butyric acid methyl ester (PCBM). One of the main challenges is to control the morphology in this active layer, which is a result of solvent extraction during film formation. Characterizing the composition in the film is a very important factor to improve the understanding of the device performance. Spontaneous vertical phase separation has been demonstrated for several polymer blend systems through a variety of characterization techniques.2-6 The observed self-stratification, with polymer-enrichment of the free surface and PCBM-enrichment of the interface region, can be explained by surface-directed spinodal decomposition. Near-edge x-ray absorption fine structure (NEXAFS) spectroscopy at the C K-edge makes it possible, due to its high chemical specificity, to determine the polymer/fullerene composition ratio at the surface. Spincoated thin films of (1:4) blends of PCBM with low-bandgap polymers, such as poly[(9,9-dioctylfluorenyl-2,7-diyl)-co-5,5-(4',7'-di-2-thienyl-2',1',3'-benzothiadiazole] (APFO3) and a set of new polyfluorene copolymers (APFO-Green11, APFO-Green12 and APFO-Green13) were studied by near-edge x-ray absorption fine structure (NEXAFS) spectroscopy at beamline D1011 at MAX-lab. APFO-Green11, APFO-Green12 and APFO-Green13 were designed to tune the miscibility with PCBM, and include 0%, 5% and 10% of segments with modified side chains that give the polymer an enhanced ability to form H-bonding with PCBM. Spectra for the pure components were also measured and differences in the *- and *- resonance peaks in those spectra served as labels for the analysis of the composition of the blend films. Spectra obtained in partial (PEY) and in total (TEY) electron yield modes, which probe the surface and sub-surface regions of the films respectively, were compared. The results for APFO3:PCBM show the existence of compositional gradients in the vertical direction in the 1:4 w/w blend. The PEY spectra of the 1:4 blend was fitted with a linear combination of the spectra of the pure components, taking into account the densities of the components. The fitting provides evidence that the surface composition of the 1:4 blend is close to 1:1. The sub-surface composition contains a higher PCBM fraction than the surface. These results are in good agreement with results from our dSIMS studies on this system.2 Both PEY and TEY spectra for the films of APFO-Green11, APFO-Green12 and APFO-Green13 blended with PCBM (1:4) w/w are shown in Figure 1. The composition ratios at the surface, obtained from the PEY spectra of these blends, are 1:1.9 (34% polymer), 1:1.6 (38% polymer) and 1:1.4 (42 % polymer), respectively. For all cases, this proves a strong polymer-enrichment of the surface compared to the 1:4 bulk ratio. Besides, the results show that increased polar character of the polymer, and hence increased miscibility with PCBM, leads to more extended vertical phase separation.7

MAX-lab ACTIVITY REPORT 2010 395
SYNCHROTRON RADIATION – BEAMLINE D1011
References (1) Dennler, G. et al Advanced Materials 2009, 21, 1323 – 1338; (2) Björström, C.M. et al J. Phys.: Condens. Matter 2005, 17, L529 – L534; (3) Campoy-Quiles, M. et al Nature Materials 2008, 7,158 – 164; (4) Germack, D.S. et al Applied Physics Letters 2009, 94, 233303-1 – 233303-3; (5) Kiel, J.W. et al. Soft Matter 2010, 6, 641 – 646; (6) Yan, Y. et al Adv. Funct. Mater. 2008, 18, 1783 – 1789. (7) Anselmo, A.S., et al., Chemistry of Materials, submitted.
Figure 1. NEXAFS spectra of thin films of APFO-Green:PCBM blends in 1:4 w/w ratios collected in PEY and TEY modes: (a) for APFO-Green11: PCBM (b) for APFO-Green12: PCBM (c) for APFO-Green13: PCBM.

396 MAX-lab ACTIVITY REPORT 2010
SYNCHROTRON RADIATION – BEAMLINE D1011
1. L. E. Walle, A. Borg, P. Uvdal and A. Sandell, Phys. Rev. B, 80 (2009) 235436
Materials and interfaces in organic electronics and spintronics
S. Braun. P. Sehati, Y. Zhan and M. Fahlman
Department of Physics, Chemistry and Biology, Linköping University, SE-581 83 Linköping, Sweden In the fields of organic electronics and spintronics, there is a need for a multiscale theoretical approach to model organic-organic and hybrid-organic interfaces, ranging from the atomistic to mesoscopic scale (using a combination of quantum-chemical and force-field calculations, solid-state physics and coarse-grained approaches, and classical microelectrostatic models). The EU FP7 project MINOTOR is focused on this issue and we are pursuing experimental characterization of a number of model interfaces to assist in the model development. In one set of experiments we first prepared clean rutile TiO2 following the procedure described in literature [1]. We then deposited in situ a monolayer of 2,3,5,6-Tetrafluoro-7,7,8,8-tetracyanoquinodimethane, F4-TCNQ, a strong acceptor molecule. Strong bonding interaction with the cyano nitrogens and the TiO2 surface was observed with resulting charge transfer from the TiO2 to the F4-TCNQ monolayer causing the formation of an interface dipole. Finally, angle-dependent NEXAFS measurements were performed to determine the molecular orientation at the interface.
Fig.1 Geometrical structure of F4-TCNQ. Fig.2 C K-edge NEXAFS of F4-
TCNQ/TiO2 In a separate project, carried out in a collaboration led by M.P. de Jong (University of Twente), we assisted in a study of the electronic and magnetic properties of the interface between C60 molecules and a Fe(001) surface. X-ray absorption spectroscopy and x-ray magnetic circular dichroism of C60 monolayers on Fe(001) surfaces showed that hybridization between the frontier orbitals of C60 and continuum states of Fe leads to a significant magnetic polarization of C60 *-derived orbitals.
320310300290280
Normal
15 deg
30 deg
45 deg
60 deg
75 deg
C K-edge
Photon energy (eV)320310300290280
Normal
15 deg
30 deg
45 deg
60 deg
75 deg
C K-edge
Photon energy (eV)
C K-edge
Photon energy (eV)

MAX-lab ACTIVITY REPORT 2010 397
SYNCHROTRON RADIATION – BEAMLINE D1011
Nikolay Vinogradov mounting the current feedthrough on the UHV manipulator at beamline D1011, 18 October 2010.Photo: Annika Nyberg

398 MAX-lab ACTIVITY REPORT 2010
SYNCHROTRON RADIATION – BEAMLINE D1011
M. Brzhezinskaya1, A. Eliseev2, M. Kharlamova2
1 ALBA Synchrotron Light Source, 08290 Barcelona, Spain
2 Department of Material Science, Moscow State University, Moscow 142432, Russia
Encapsulated single-walled carbon nanotubes (SWNTs) with inner channels filled by different compounds present the new class of composite materials. Such CNTs are of a big interest because of an opportunity to form 1D nanocrystals as well as quantum nanowires with new physical and chemical properties inside the tubes. Electronic properties of modified CNTs determine substantially the field of their application. Therefore, the main goal of the present project was to perform studies of electronic structure for new materials formed by encapsulation of iron halides FeHal (FeCl, FeBr, FeI) into SWNTs, using x-ray absorption and photoelectron
spectroscopies, and of possibilities for formation of Fe nanowires during filler decomposition.
All measurements have been performed at beamline D-1011 at MAX II. The FeHal@SWNT nanocomposites were produced by the filling of metallic single-walled carbon nanotubes with inner diameter of 1.1-1.4 nm by FeHal nanocrystals using capillary technique [1]. Approximate loading value of FeHal equals ~70 wt. %.
The C 1s absorption spectra of FeHal2@ SWNT composites (Fig. 1) demonstrate the existence of the interaction between FeHal and nanotube walls. This is evidenced by the appearance of the low-energy absorption band A (284.1 eV) in the spectra of FeHal@SWNT. The band A is caused by the appearance of a new vacant state, which is probably a result of a substantial Fermi level downshift caused by the doping [2]. Relative intensity of A
285 290 295 300 305 310 315
fedcb
Fig. 1. C 1s absorption spectra of FeHal@SWNT and pristine SWNTs.
FeBr@SWNT
Abs
orpt
ion
(Tot
al E
lect
ron
Yiel
d)
a
Pristine SWNT
FeCl@SWNT
Photon Energy (eV)
FeI@SWNT
A
C 1s XAS
The evolution of the electronic properties for FeHal@SWNT (Hal=I, Br,
Cl) during filler decomposition studied by core-level spectroscopies.

MAX-lab ACTIVITY REPORT 2010 399
SYNCHROTRON RADIATION – BEAMLINE D1011
increases in the row FeI2@SWNTs FeBr2@SWNTs FeCl2@SWNTs. This means the increasing of charge transfer upon switching from FeI2@SWNT to FeCl2@SWNT.
In the course of the annealing of the FeBr2@SWNT composite the band A in C 1s spectra decreases initially in intensity and then disappears totally. Such a behavior of the band A is indicative of the gradual weakening of the chemical bonding between FeBr2 and SWNT in the nanocomposite and the separation of the latter into individual phases of FeBr2 and SWNTs. The practically complete disappearance of the band A occurs after annealing at T ~ 600 °C.
Further vacuum annealing leads to decomposition of the FeBr2 with the
formation of metallic Fe. Indeed after the final annealing the C 1s spectrum is practically identical to that of the pristine SWNTs and the Fe 2p spectrum coincides with that of metallic iron. C 1s core-level PE spectra during annealing of FeBr2@SWNT were measured also. Evidently these findings are caused by the changes of the nanocomposite during the annealing.
The research leading to these results has received funding from the European Community's Seventh Framework Program (FP7/2007-2013) under grant agreement nº 226716 and Russian Foundation for Basic Research (project no. 09-02-01278).
We would like to thank A. Preobrajenski and N. Vinogradov (MAX-lab) for help during experiments. ________________________________ 1. M.V. Chernysheva, A.A. Eliseev, A.V. Lukashin, et al. Physica E 37, 62 (2007). 2. X. Liu, T. Pichler, M. Knupfer, and J. Fink, Phys. Rev. B 70, 205405 (2004).
282 283 284 285 286 287
Fig. 2. C 1s absorption spectra near π-resonance for FeBr2@SWNT during annealing.
2 350 0C1 350 0C
10 750 0C
Abs
orpt
ion
(Tot
al E
lect
ron
Yiel
d)
a
a''
a'
a
Pristine SWNT
8 700 0C9 700 0C
7 600 0C6 550 0C5 500 0C4 450 0C3 400 0C
Photon Energy (eV)
Initial
A
C 1s XAS
700 705 710 715 720 725
Fig. 3. Fe 2p absorption spectra for FeBr2@SWNT during annealing.
4
2
10
1 Abs
orpt
ion
(Tot
al E
lect
ron
Yiel
d)
a*FeBr2
9
3
765
8
Photon Energy, eV
Initial
Fe 2p XAS

400 MAX-lab ACTIVITY REPORT 2010
SYNCHROTRON RADIATION – BEAMLINE D1011
Graphene is a single layer of carbon atoms arranged in a honeycomb lattice with two crystallographically equivalent atoms (C1 and C2) in its primitive unit cell [1]. The and * bands of graphene touch in a single point at the Fermi energy (EF) at the corner of the hexagonal graphene’s Brillouin zone, and close to this so-called Dirac point the bands display a linear dispersion and form perfect Dirac cones. Thus, undoped graphene is a semimetal (“zero-gap semiconductor”). The linear dispersion of the bands results in quasiparticles with zero mass, so-called Dirac fermions. The unique “zero-gap” electronic structure of graphene, however, leads to some limitations for application of this material in real electronic devices. In order, for example, to prepare a practical transistor, one has to have a graphene layer where energy band gap is induced via application of electric field or via modification of its electronic structure by means of functionalization. There are several ways of the modification of the electronic structure of graphene with the aim of gap formation. Here we present an attempt to modify the electronic structure of graphene via contact of this material with metal (ferromagnetic Ni substrate) and via adsorption of polar molecules (H2O, NH3) on top of the graphene/metal system. These studies of water and ammonia adsorption on graphene/Ni(111) were performed via combination of experimental [angle-resolved photoelectron spectroscopy (ARPES), x-ray absorption spectroscopy (XAS)] and theoretical methods [density-functional theory (DFT) calculations]. These studies were performed at the BESSY UE56/2-PGM-1 and UE56/2-PGM-2 beam-lines and MAX-lab D1011 beam-line. Details of experiments and calculations can be found elsewhere [2,3]. In order to study the growth modes of water or ammonia, the time sequences of the photoemission maps around the point of the Brillouin zone (sampling angle of ±10o with respect to the normal emission) were recorded. The extracted photoemission intensity map showing the modification of the valence band at the point of the graphene/Ni(111) system upon adsorption of water molecules (t is the deposition time) is shown in Fig. 1 (central panel). Photoemission intensity profiles for several time-points demonstrating the main photoemission features of spectra [Ni 3d states, graphene states, and water induced states (I and II)] as well as intensity profiles as a function of water deposition time (t) taken at particular binding energies (red solid line, blue solid circles, and green open squares show intensity profiles at 7 eV, 8.3 eV, and 10 eV of the binding energy, correspondingly) are shown in the upper and right panels, respectively. The behavior of the water-related photoemission features, I and II, allows to conclude that islands-type growth of water on graphene/Ni(111) takes the place: (i) these features start to grow simultaneously at t = 130 sec, but slopes of the intensities growth are different; (ii) after t = 170 sec the intensity of feature I decreases via the exponential law and there is a small plateau for the feature II (1st ML is complete); (iii) at t = 230 sec, when the thickness of deposited water is more than 2ML,
* Corresponding author. E-mail: [email protected]
Fig. 1. (Central panel) Photoemission intensity map shows the modification of the valence band of the graphene/Ni(111) system at the point upon adsorption of water molecules (partial water-pressure p=5×10⁻⁸ mbar; t is the deposition time). (Upper panel) Photoemission intensity profiles are shown for several time-points demonstrating the main photoemission features. (Right panel) Photoemission intensity profiles as a function of water deposition time (t) taken at particular binding energies: red solid line, blue solid circles, and green open squares show intensity profiles at 7 eV, 8.3 eV, and 10 eV of the binding energy.
Adsorption of water and ammonia on graphene/Ni(111) S. Böttcher,1 M. Weser,1 K. Horn,1 E. N. Voloshina,2 B. Paulus,2 and Yu. S. Dedkov1,*
1Fritz-Haber Institut der Max-Planck Gesellschaft, 14195 Berlin, Germany 2Institut für Chemie und Biochemie, Freie Universität Berlin, 14195 Germany

MAX-lab ACTIVITY REPORT 2010 401
SYNCHROTRON RADIATION – BEAMLINE D1011
Fig. 1. Angular dependence of the C K-edge XAS spectra of (a) graphene/Ni(111) and this system after adsorption of one-half of the molecular layer of (b) H2O and (c) NH3, respectively. ( =90o corresponds to the normal incidence of the linearly polarized light).
probably, the structural phase transition takes the place – formation of ice. Due to the fact that ice is an insulator, the rapid decrease of the photoemission intensities of the Ni-related features and the shift of some states to higher binding energies can be explained by the formation of an insulating thin film of ice on top of the graphene/Ni(111) system. The general trend in the observation of the ammonia-related photoemission features in the similar experiments is the same. In further XAS and ARPES experiments we chose the thickness of water and ammonia layers to be 1/3-1/2 ML (see discussion about the structure earlier in the text). The effect of the possible orbital mixing of the valence band states of the graphene layer on Ni(111) and orbitals of water and ammonia molecules was studied by XAS (Fig. 2). This figure shows the angular dependence of the C K-edge XAS spectra of (a) graphene/Ni(111) and this system after adsorption of 1/2 of the molecular layer of (b) H2O and (c) NH3, respectively ( =90o corresponds to the normal incidence of the linearly polarized light). These results demonstrate the controllable way of the graphene functionalization by water and ammonia and the corresponding adsorbate-induced states in the region of the unoccupied valence band states were detected (Fig. 2: the photon energies region of 280-290 eV corresponds to the C 1s * transitions; the photon energies region of 290-320 eV corresponds to the C 1s * transitions). Here we would like to emphasize that the presented x-ray absorption spectra were recorded at the C K absorption edge and reflect (to some extent) the partial density of states of the carbon atoms in the system and they are clearly demonstrate the appearance of the orbital hybridization of the graphene- and water- and ammonia- related states, respectively. The absence of the strong angular variation of the water- and ammonia-induced XAS signal might be explained by a statistically uniform distribution of the orientations of H2O and NH3 molecules on graphene/Ni(111). The interpretation of the XAS spectra measured after water or ammonia adsorption can be performed on the basis of the peak-assignment, which is discussed on Ref. [2]. For water adsorbate the new structure in the XAS spectra appears at the photon energy range corresponding to the hybrid state in the electronic structure of graphene/Ni(111) involving both carbon atoms in the unit cell of graphene and interface Ni atom. This leads to the assumption that water molecules are adsorbed either in the center or in the on-bond position on graphene/Ni(111). Ammonia-induced spectral features in the C K XAS spectra are observed in the photon energy range corresponding to the hybrid state which is a result of hybridization of the pz orbital of the C-top atom and the 3dz2 state of the Ni interface atom. On the basis of this analysis one can conclude that ammonia molecules are placed in the on-top position on graphene/Ni(111) with the lone-pair toward carbon atoms and N-H bonds along C-C bond of the graphene layer. Our DFT analysis of these systems supports these experimental observations. [1] A. K. Geim, Science 325, 1530 (2009). [2] Yu. S. Dedkov and M. Fonin, New J. Phys. 12, 125004 (2010). [3] S. Böttcher et al., Nanoscale Res. Lett., accepted (2011).

402 MAX-lab ACTIVITY REPORT 2010
SYNCHROTRON RADIATION – BEAMLINE D1011
Monomolecular films of perfluoroterphenyl-substituted alkanethiols: molecular conformation and odd-even effects
Frederick Chesneau1, Björn Schüpbach2, Katarzyna Szel gowska-Kunstman3, Nirmalya
Ballav1, Piotr Cyganik3, Andreas Terfort2, and Michael Zharnikov1
1Angewandte Physikalische Chemie, Universität Heidelberg, 69120 Heidelberg, Germany
2 Institut für Anorganische und Analytische Chemie, Universität Frankfurt, Max-von-Laue-Straße 7, 60438 Frankfurt, Germany
3 Faculty of Physics, Astronomy, and Applied Computer Science, Jagiellonian University, Reymonta 4, 30-059 Kraków, Poland
The integrity, chemical identity, packing density, and molecular structure of self-assembled monolayers (SAMs) formed by perfluoroterphenyl-substituted alkanethiols (FTPn) with variable length of the aliphatic linker (n = 2 or 3 methylene units) on Au(111) and Ag(111) were studied by a combination of several complementary spectroscopic and microscopic techniques. The FTPn molecules were found to form well-defined and highly ordered SAMs on these substrates. A characteristic feature of these SAMs is the helical conformation of the FTP moieties (see Figure 1) - in contrast to the planar and close-to-planar conformations of oligophenyl moieties in the analogous non-fluorinated systems. In spite of the helical conformation and larger atomic volume of fluorine as compared to hydrogen, FTPn SAMs exhibit very high packing densities, which are 3.9 1014 cm-2 in FTP3/Au and FTP2/Ag, in particular. Such densities are close to the values for the analogous non-fluorinated systems ( 4.6 1014 cm-2) and can only be possible at a correlated twist of the FTP helices of the neighboring molecules.
The FTPn SAMs exhibit pronounced odd-even effects, i.e. dependence of the molecular orientation and packing density on the length of the aliphatic linker in
the target molecules, with the parity of n being the decisive parameter (as e.g. follows from the NEXAFS spectra in Figures 2 and 3 and from the STM-derived molecular structures in Figures 4 and 5). The relation between the properties of the FTPn films and the parity of n is on Au opposite to that on Ag. FTP3 SAMs on Au and FTP2 SAMs on Ag exhibit a smaller molecular inclination and a higher packing density than those in FTP2/Au and FTP3/Ag - by
12% if one compares the ordered domains only and by 15-30% if one compares overall packing densities. Note that FTP2/Au is characterized by a small portion of the ordered domains due to competitive balance of structure-building interactions in this system.
The odd-even behavior of the FTPn SAMs correlates precisely with the analogous performance of non-fluorinated oligophenylalkanethiolates and -selenolates and, similar to
Figure 1. A schematic drawing of the FTP3 molecule. The aromatic backbone has a helical conformation. The orientation of the backbone is given by the tilt angle , twist angle , and torsion angle . The torsion results in different values of for the inner ring and outer rings.

MAX-lab ACTIVITY REPORT 2010 403
SYNCHROTRON RADIATION – BEAMLINE D1011
the latter systems, can be explained by the presence of a strong substrate headgroup C bending potential, which is different on Au and Ag. This quite “rigid” bending potential favors a certain substrate headgroup C bonding angle, which is transferred to the substituent moiety by the sufficiently rigid aliphatic linker. A difference of the FTPn system as compared to the non-fluorinated case is the helical conformation of the FTP moiety, characteristic of the molecular state and persistent in the dense phase, what excludes a variation of the intramolecular torsion and molecular twist as the mechanism behind the odd-even effects.
The high quality of the FTPn SAMs makes them promising candidates for use as semiconductor SAMs or for controlling energy barriers between organic semiconductors and metal electrodes. In addition, aromatic SAMs, such as FTPn films, generally should provide an even more efficient charge transport through the molecular backbone than the aliphatic films, which are frequently used for this purpose. This work has been supported by DFG (ZH 63/10-1).
Figure 2. Carbon K-edge NEXAFS spectra of FTPn/Au and FTPn/Ag acquired at an X-ray incident angle of 51°. The most prominent absorption resonances are marked. The most prominent iresonances are marked by numbers.
Figure 3. Difference between the carbon K-edge NEXAFS spectra of FTPn/Au and FTPn/Ag acquired at X-ray incident angles of 90° and 20°. The most prominent difference peaks are marked by numbers. Dashed lines correspond to zero.
Figure 4. A schematic illustration of the adsorption structure of FTP3 on Au(111) derived on the basis of the STM data. The respective area per molecule is about 26 Å2, which corresponds to a packing density of 3.9 1014 cm-2.
Figure 5. A schematic illustration of the adsorption structure of FTP2 on Au(111) derived on the basis of the STM data. The respective area per molecule of 28.7 Å2, which corresponds to a packing density of 3.44 1014 cm-2.

404 MAX-lab ACTIVITY REPORT 2010
SYNCHROTRON RADIATION – BEAMLINE D1011
Preliminary XPS results on alkylated silicon nanocrystals produced at two different etching current densities
P.R. Coxon1, S. Krishnamurthy2, Q. Wang1, A. Preobrajenski3, C. Charlton4, Y. Chao1
1 School of Chemistry, University of East Anglia, Norwich, Norfolk, NR4 7TJ, United Kingdom 2 School of Dublin City University, Dublin 9, Ireland 3 MAX-lab, Lund University, S-22100 Lund, Sweden
4 Biomedical Diagnostics Institute, Dublin City University, Dublin 9, Ireland
Over the past twenty years room temperature optical emission from the nanostructures contained within porous silicon (PSi) layers has attracted considerable interest owing to its potential for use in applications within silicon-based optoelectronic devices [1, 2]. However the source of PSi luminescence remains under debate. Extensive studies upon the silicon nanocrystals (SiNCs) obtained from porous silicon have been geared towards greater understanding of the nature of the efficient photoluminescence (PL) [3, 4] where it is believed that the physical and electronic structure of the PSi surface plays a strong role in determining the photoluminescence wavelength range. PL from porous silicon is observable over wavelengths across the optical spectrum from blue to red [5].
Although it is generally accepted that the visible luminescence originates from the defects in silicon oxide compounds on PSi surface, the band gap enlargement due to quantum confinement effect, or surface defects states, the wavelength range of PL from porous silicon had been shown to be closely determined by the initial etching parameters [6]. In this study, we have studied the effect of etching current density on the photoluminescence of alkylated SiNCs.
Alkylated SiNCs were formed by refluxing porous silicon chips in solutions of undecene at 230 °C for five hours according to the procedure described in [7]. We prepared SiNCs from porous silicon chips with current densities of 400 mA/cm-2 and 10 mA/cm-2 with diameters of approximately 2.2 nm. SiNCs from PSi etched at the higher current density display luminescence at 600 nm (‘orange’) and those at the lower density show luminescence at 380 nm (‘blue’). The SiNCs were dispersed in dichloromethane and drop cast in separate films onto the experimental chamber sample holder. Photoemission spectra were collected over the silicon 2p, carbon 1s and oxygen 1s edges at beamline D1011 (MAX II) with an incident photon energy of 150 eV and a spectrometer pass energy of 50 eV.
While the results are still undergoing analysis, preliminary results from the Si2p core level region are shown in Figure 1. Although the samples were in good electrical contact with the sample holder, the thickness of the films meant that the samples suffered from the effects of progressive charge trapping over time during X-ray irradiation. For thick films of SiNCs as in this case, it becomes difficult for electrons to leave the sample and as a result, the spectrum is shifted towards higher binding energies. Thus the data presented are shifted to a lower binding energy by 10 eV in order to bring spectral features to into energy ranges expected for these samples.

MAX-lab ACTIVITY REPORT 2010 405
SYNCHROTRON RADIATION – BEAMLINE D1011
1.
2.
3. 4.
5. 6. 7.
8.
Figna
Fig. 2for ‘bsilico
Zhuravle73(20): pAverkiev339. CanhamCullis, A.965. M'GhaïeZhao, Y.,Lie, L. ElectroaHu, Y., Phenom
g. 1 Photoelectrnocrystals at 1
2 Near edge abblue’ and ‘oranon for comparis
ev, K.S., A.Mp. 2962-2964v, N.S., L.P. K
, L.T., Physica.G., Canham,
eth, R., et al., , et al., Solid-H., Duerdin,nalytical CheBoukherrou
ena, 2004, 13
ron spectra on 50 eV
bsorption spectnge’ silicon nanson.
M. Gilinsky, A.
Kazakova, an
a Status SolidL.T. and Calc
MicroelectroState Electro, M., Tuite,mistry, 2002,
ub, R. & Sh35: p. 143-14
'blue' and 'ora
ra (partial elecocrystals. Show
A.M. and Kob
d Smirnova,
i (b), 1995. 1cott, P.D.J. Jo
onics Journal,nics, 2010. 54 E. M., Ho, 538: p. 183-ham, Journa47.
ange' silicon
ctron yield) wn with bulk
Thfrom SiNCetched at
101.46 shoulder oeV. In conspectrum fat 101.9at 99.5 elower bindto samplethrough ex
Ne
profiles inmode withthe silicon for the alongside tfor compafor both identical t105.0 eV, latter two for an oxiddoublet feclose to 1within poro
bitsky, A.Y.,
N.N., Semico
90(1): p. 9-14urnal of Appl
1999. 30(7):4(4): p. 452-4
oulton, A. &-190. al of Electro
e photoemCs obtained 400 mA/cm-
eV with evon the leadintrast, the from the ‘bl5 eV with a eV. This addding energy e oxidationxposure to th
ear edge adsn partial eleh a retarding
L-edge are ‘blue’ andthe equivalerison. The a
samples oto each oth
105.7 eV afeatures are
de-related coeatures hav05 eV and ous silicon su
Applied Phy
onductors, 2
4. lied Physics, 1
p. 695-698.456.
& Horrocks,
on Spectrosc
mission spefrom PSi w
-2 shows a pidence of ang edge at main peak ue’ nanocrysclear seconditional peak may be attr
n brought he X-ray sour
sorption (NEectron yield bias of -20 Vshown in Fig ‘orange’
ent for bulk bsorption feof SiNCs a
her with pend 106.5 eV
e typical signomponent. S
ve been obsidentified asurfaces [8].
ysics Letters,
002. 36(3): p
1997. 82(3):
B. R., Jour
copy and R
ectrum wafers
peak at small
99.5 in the stals is d peak at the
ributed about
rce.
EXAFS) (PEY)
V over gure 2 SiNCs
silicon eatures appear aks at V. The atures Similar served s such
1998.
p. 336-
p. 909-
rnal of
Related

406 MAX-lab ACTIVITY REPORT 2010
SYNCHROTRON RADIATION – BEAMLINE D1011
In-situ metalation of free-base porphyrins by substrate atoms
C. M. Doyle1, S. A. Krasnikov2, A. B. Preobrajenski3, N. N. Sergeeva4, N. A. Vinogradov3, Y. N. Sergeeva4, M. O. Senge4 and A. A. Cafolla1
1 School of Physical Sciences, Dublin City University, Glasnevin, Dublin 9, Ireland;
2School of Physics, Trinity College Dublin, Dublin 2, Ireland; 3 MAX-lab, Lund University, Box 118, S-22100 Lund, Sweden;
4School of Chemistry, Trinity College Dublin, Dublin 2, Ireland. Metalloporphyrins are common in biological systems, with chlorophyll, haem and vitamin
B12 as typical examples. These molecules provide essential cofactors in a vast number of proteins and enzymes, while their interesting structural, optical, and electrical properties have led to important applications in fields ranging from biology to sensors to materials chemistry [1]. Since 1960 many papers dealing with metalloporphyrin formation have appeared and several reviews are available [2, 3]. An important step in the formation of these molecules is the insertion of the metal ion into the metal-free porphyrin core. This step has been studied extensively in solution, in biological systems, and more recently on metal surfaces where it has been demonstrated that the metalloporphyrins can be synthesized directly on a surface by metalation of an adsorbed metal free porphyrin with vapour-deposited metal atoms, for example Fe, Co, and Zn [3]. For some metals the metalation reaction proceeds at room temperature (Fe, Co) while others require elevated temperatures (Zn) [3].
Here we report the in situ metalation of a free-base porphyrin by metal atoms extracted from the supporting metal surface instead of a vapour deposited metal. We also provide direct evidence for the existence of an intermediate complex formed between surface atoms and the molecule. We apply X-ray absorption (XA) and X-ray photoemission spectroscopy (XPS) to study the mechanism of in situ metalation of the free-base 5,10,15,20-tetra(4-bromophenyl)porphyrin (H2TBrPP) on the Cu(111) surface.
XA and XPS measurements were performed at the D1011 beamline at the MAX II storage ring in Lund, Sweden. The XPS spectra were measured with a Scienta SES-200 electron energy analyzer. The kinetic energy resolution was set to 150 meV for the N 1s spectra. The photon energy resolution was set to 100 meV at the N K-edge (~400 eV). The XA spectra were recorded in the partial electron yield mode (U = -100 V) by a multichannel plate detector and normalized to the background curves recorded from the clean substrate. The H2TBrPP was evaporated onto the clean Cu(111) surface at a rate of about 0.1 monolayer (ML) per minute.
The H2TBrPP molecule contains two chemically different types of nitrogen atom, two pyrrolic (-NH-) and two iminic (=N–) nitrogens. Fig. 1a shows the N 1s photoemission spectra from ~5 ML of H2TBrPP on the Cu(111) surface recorded at room temperature. Fitting of the spectrum was carried out using a deconvolution with the minimum number of peaks. The respective signals appear at 400.0 eV
402 400 398 396
(c)
(b)
(a)
-NH-
A0
A2 A1
=N-
Inte
nsity
(a.u
.)
Binding energy (eV)
395 400 405 410
(c)
(b)
(a)
A0
A2
A1
Inte
nsity
(a.u
.)
Photon energy (eV)
Figure 1. N 1s XPS of (a) 5 ML, (b) 2 ML of H2TBrPP on the Cu(111) after deposition at room temperature and (c) after annealing at 420 K.
Figure 2. N 1s XA spectra of (a) 5 ML, (b) 2 ML of H2TBrPP on the Cu(111) after deposition at room temperature and (c) after annealing at 420 K.

MAX-lab ACTIVITY REPORT 2010 407
SYNCHROTRON RADIATION – BEAMLINE D1011
(-NH-) and 397.9 eV (=N-) and the ratio of the peak intensities is 1:1 in agreement with the stoichiometry of the molecule. Fig. 1b shows the N 1s XPS from ~2 ML of H2TBrPP deposited on clean Cu(111). The iminic peak now appears broader and deconvolution confirms the presence of a third peak at an intermediate binding energy of 398.7 eV. We attribute this third peak to the formation of an intermediate complex in which surface Cu atoms are coordinated with the iminic nitrogen atoms, while the pyrrolic nitrogen atoms are not involved in the bonding with the surface. The fact that not all iminic nitrogen atoms are coordinated to Cu atoms in the surface, as evidenced by the presence of two iminic peaks in the spectrum, is attributed to the existence of second layer molecules which do not interact with the Cu(111) surface. In this intermediate state the planar configuration of the porphyrin is distorted into a saddle conformation with the two iminic nitrogen atoms displaced downwards towards the surface while the two pyrrolic nitrogen atoms are bent away from the surface. This distorted geometry represents an intermediate state of the metalation reaction which cannot be completed at room temperature due to unfavourable energetics. Such intermediate sitting atop (SAT) complexes have been observed during porphyrin metalation in solution [4]. Full copper metalation of the porphyrin is achieved by heating the 2 ML system to 420 K, which also results in the desorption of the second layer. After full metalation the porphyrin has four chemically identical nitrogen atoms which produce a single N 1s peak at 398.5 eV (Fig. 1c).
Evidence for the formation of the intermediate complex is also provided by X-ray absorption. In the N 1s XA spectrum of ~5ML of H2TBrPP, shown in Fig. 2a, there are two
strong low-energy absorption structures A1 and A2 that are related to the molecular orbitals and arise due to the two different N sites in the centre of the free-base porphyrin macrocycle. The structure A1 observed at a photon energy of 397.8 eV is produced by the iminic (=N-) nitrogens, while the structure A2 at 400.0 eV results from the pyrrolic (-NH-) nitrogens [5]. The corresponding XA spectrum from 2 ML of H2TBrPP (Fig. 2b) shows a reduction in the iminic nitrogen peak (A1) relative to the pyrrolic peak (A2) and the appearance of an additional absorption feature at 398.5 eV. The XA spectrum recorded after heating to 420 K shows an absorption structure (A0) at 398.6 eV (Fig. 2c), and loss of the features associated with the iminic and pyrrolic nitrogen atoms. The intensities and positions of the observed structures correlate well with the N 1s XPS data presented above.
To extend and strengthen these findings scanning tunnelling microscopy (STM) measurements were performed. Fig. 3 shows an STM image of a sub-monolayer coverage of H2TBrPP molecules deposited on the Cu(111) surface and reveal that the molecules are stable on the Cu(111) surface. The STM image shows that the molecules are distorted having a rectangular rather than the expected square shape. The distortion of the molecules arises from the formation of Cu-Br bonds between the porphyrin and the surface. This bonding also induces a stress in the Cu(111) resulting in a local (2 2) reconstruction of the surface which produces the protrusions observed on opposite sides of each porphyrin molecule, as indicated by the arrow in Fig. 3. The Cu-Br bonding has the combined effect of distorting both the molecule and the surface resulting in a configuration that favours the formation of the intermediate complex.
This work was supported by Science Foundation Ireland, the Irish Research Council for Science, Engineering and Technology and by the Swedish Research Council. [1] K.M. Kadish, K.M. Smith, R. Guilard (Eds.), The Porphyrin Handbook, Academic Press, 2000. [2] S. Funahashi, et.al., Analytical Sciences, 17, (2001) 917. [3] J.M. Gottfried and H. Marbach, Z. Phys. Chem. 233 (2009) 53. [4] G. De Luca, et.al. Inorg. Chem. 48 (2009), 8493. [5] S.A. Krasnikov, N.N. Sergeeva, et al. J. Phys. Condens. Matter 20 (2008) 235207.
Figure 3. STM image of 0.3 ML of H2TBrPP after deposition at room temperature on clean Cu(111)

408 MAX-lab ACTIVITY REPORT 2010
SYNCHROTRON RADIATION – BEAMLINE D1011
1P. Jussila, H. Ali-Löytty, M. Hirsimäki, and M. Valden, Surf. Interf.
Anal. 42 (2010) 157-164.
employing the theory developed by Tougaard
Fabrication of a mixed aminopropyltriethoxy and mercaptopropyltrimethoxy silane layer with biofunctional properties on hydroxylated stainless steel
M. Hirsimäki1, L. Kanninen1, R. Pärna2, H. Ali-Löytty1, P. Jussila1, E. Nõmmiste2, and M. Valden1
1Surface Science Laboratory, Tampere University of Technology (TUT), P.O. Box 692, FIN-33101 Tampere, Finland (www.tut.fi/surfsci)
2Institute of Physics, University of Tartu, Riia 142, 51014 Tartu, Estonia
Biofunctionality of surfaces and surface coatings plays a critical role in biomedical applications involving biomedical implants, biosensors and aerosol based drug delivery techniques. Stainless steel is a low-cost and durable material that is to an extent inherently biocompatible. In this investigation, we fabricated a nanoscale, covalently bound mixed silane layer on stainless steel and bind fluorine labeled maleimide (MAL-F) to it. We employed (3-mercaptopropyl)trimethoxysilane (APS) and (3-aminopropyl)trimethoxy-silane (MPS). MAL-F binds preferentially to the thiol groups. Eventually maleimide terminated biotin molecules will be used to bind avidin proteins to the surface. The activity of the surface can be controlled by varying the concentration of MPS. The majority of the surface is covered by APS which will act as a spacer between MPS sites, thus facilitating unhindered adsorption of large proteins.
In our previous investigations we have found that the deposition of high quality silane films on stainless steel requires a high pre-coverage of hydroxyl species.1 In this study, we have employed a chemically and mechanically cleaned ASTM 201 (Fe-18Cr-6Mn-4Ni) sample that was subsequently passivated electrochemically as described in Ref. 1. APS and MPS were deposited ex situ from EtOH:H2O solution after 60 s hydrolysis. Several samples were prepared by varying the relative concentration of APS and MPS in the solution. After the deposition the surface was dried of excess solution with dry N2 and annealed at 373 K for 10 min (Figure 1).
Figure 1: A schematic overview of the formation of the mixed silane layer from hydrolysed solution. Hydroxyl groups covalently bind the silane (gray/light blue) compounds to the surface leaving the amino (blue) and thiol (yellow) termini free. Annealing the surface results in a uniform, high quality silane layer.
1P. Jussila, H. Ali-Löytty, M. Hirsimäki, and M. Valden, Surf. Interf.
For the adsorption of biotin, and subsequently avidin protein, it is essential that the layer is uniform and that the amino and, in particular, the thiol termini of the silane layer are free and perpendicular to the surface plane. It is also important to confirm that the concentration of MPS on the surface correlates with MPS concentration in the solution.
Figure 2: Morphology of the APS/MPS layer after annealing as a function of MPS concentration in the solution.
Figure 2 shows the morphology of selected samples. The morphology was determined from the inelastic electron background by employing the theory developed by Tougaard
Amino Thiol

MAX-lab ACTIVITY REPORT 2010 409
SYNCHROTRON RADIATION – BEAMLINE D1011
et. al.2 At all MPS concentrations, approximately 80% of the surface area is covered by a thin, uniform APS/MPS layer.
Figure 3: S 2p signal measured after silane deposition from a 0.1 V-% APS / 0.05 V-% MPS solution as a function of photon energy. The inset shows the ratio of SH and SO4 peaks.
The preferential orientation of the thiol groups (SH) was deducted from the dependence of S 2p photoelectron spectra on the photon energy. Figure 3 shows high resolution photoelectron spectra of S 2p transition measured at photon energies of 300 eV, 494 eV, 900 eV and 1100 eV. As can be seen, the signal originating from the thiol groups is significantly enhanced in comparison to the sulfate signal as the photon energy is decreased and the surface sensitivity
is increased. This indicates that the thiol groups are, indeed, pointing away from the surface.
Figure 4: MAL-F uptake as a function of APS and MPS concentrations in the solution. TCEP treatment significantly enhanced the MAL-F uptake.
The uptake of MAL-F as a function of the APS/MPS concentration ratio in the solution is shown in Figure 4. Surprisingly, the MAL-F uptake was initially relatively low. One of our major findings was that in a mixed APS/MPS layer, adjacent sulphur tends to form disulphide bonds that deactivate the thiol groups. Treating the surface with 0.05 M Tris(2-carboxyethyl)-phosphinehydrochoride (TCEP) solution breaks the disulphide bonds, leading to significantly enhanced MAL-F uptake. The results indicate that the optimal silane layer is obtained with a solution of 0.1 vol-% APS and 0.01-0.1 vol-% MPS.
We have shown that a mixed silane layer can be covalently bound to stainless steel in a way that results in a relatively uniform layer. Furthermore, we find that the silane layer can be functionalized with maleimide. In the future investigations, MAL-F will be replaced by maleimide terminated biotin to facilitate experiments on avidin protein adsorption kinetics.
170 168 166 164 162
300 500 700 900 1100
0.4
0.5
0.6
0.7
0.8
SH/S
O4
h (eV)
SH
2p 1/
2
SH
2p 3/
2
SOx 2
p 1/2
SOx 2
p 3/2
SO4 2
p 1/2
h = 300 eV
h =494 eV
h =900 eV
Binding energy (eV)
0.1 V-% APS0.05 V-% MPSS 2p
h =1100 eV
SO4 2
p 3/2
2S. Tougaard, J. Electron Spectrosc. Rel. Phenomena 178-179 (2010)
128-153.
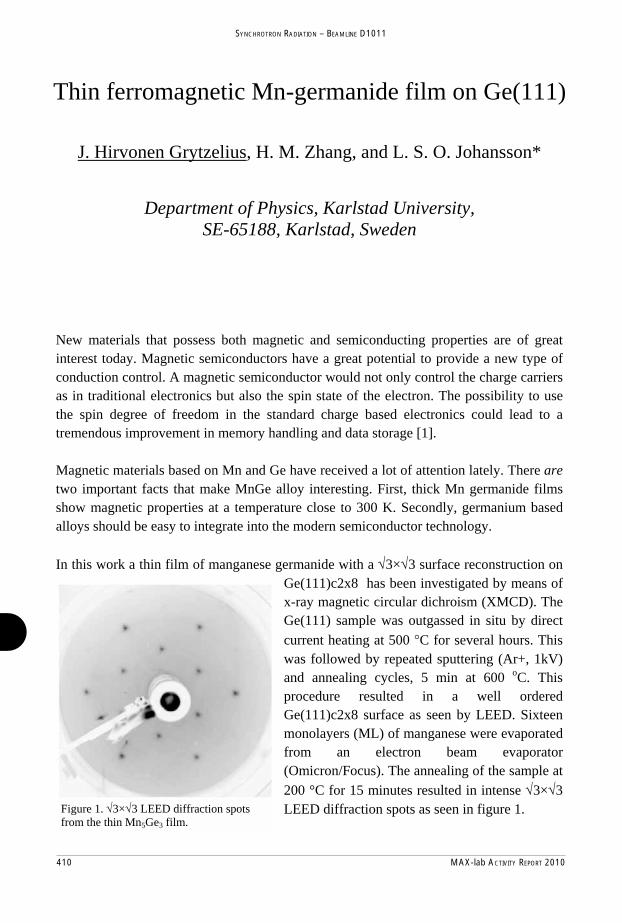
410 MAX-lab ACTIVITY REPORT 2010
SYNCHROTRON RADIATION – BEAMLINE D1011
New materials that possess both magnetic and semiconducting properties are of great interest today. Magnetic semiconductors have a great potential to provide a new type of conduction control. A magnetic semiconductor would not only control the charge carriers as in traditional electronics but also the spin state of the electron. The possibility to use the spin degree of freedom in the standard charge based electronics could lead to a tremendous improvement in memory handling and data storage [1]. Magnetic materials based on Mn and Ge have received a lot of attention lately. There are two important facts that make MnGe alloy interesting. First, thick Mn germanide films show magnetic properties at a temperature close to 300 K. Secondly, germanium based alloys should be easy to integrate into the modern semiconductor technology. In this work a thin film of manganese germanide with a √3×√3 surface reconstruction on
Ge(111)c2x8 has been investigated by means of x-ray magnetic circular dichroism (XMCD). The Ge(111) sample was outgassed in situ by direct current heating at 500 °C for several hours. This was followed by repeated sputtering (Ar+, 1kV) and annealing cycles, 5 min at 600 oC. This procedure resulted in a well ordered Ge(111)c2x8 surface as seen by LEED. Sixteen monolayers (ML) of manganese were evaporated from an electron beam evaporator (Omicron/Focus). The annealing of the sample at 200 °C for 15 minutes resulted in intense √3×√3 LEED diffraction spots as seen in figure 1. Figure 1. √3×√3 LEED diffraction spots
from the thin Mn5Ge3 film.
Thin ferromagnetic Mn-germanide film on Ge(111)
J. Hirvonen Grytzelius, H. M. Zhang, and L. S. O. Johansson*
Department of Physics, Karlstad University, SE-65188, Karlstad, Sweden
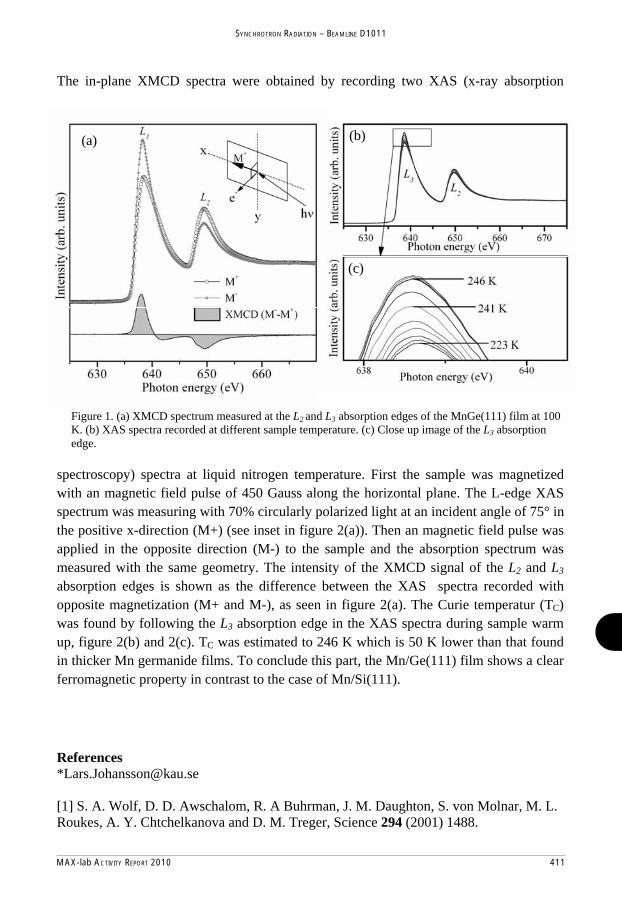
MAX-lab ACTIVITY REPORT 2010 411
SYNCHROTRON RADIATION – BEAMLINE D1011
References *[email protected] [1] S. A. Wolf, D. D. Awschalom, R. A Buhrman, J. M. Daughton, S. von Molnar, M. L. Roukes, A. Y. Chtchelkanova and D. M. Treger, Science 294 (2001) 1488.
The in-plane XMCD spectra were obtained by recording two XAS (x-ray absorption
spectroscopy) spectra at liquid nitrogen temperature. First the sample was magnetized with an magnetic field pulse of 450 Gauss along the horizontal plane. The L-edge XAS spectrum was measuring with 70% circularly polarized light at an incident angle of 75° in the positive x-direction (M+) (see inset in figure 2(a)). Then an magnetic field pulse was applied in the opposite direction (M-) to the sample and the absorption spectrum was measured with the same geometry. The intensity of the XMCD signal of the L2 and L3 absorption edges is shown as the difference between the XAS spectra recorded with opposite magnetization (M+ and M-), as seen in figure 2(a). The Curie temperatur (TC) was found by following the L3 absorption edge in the XAS spectra during sample warm up, figure 2(b) and 2(c). TC was estimated to 246 K which is 50 K lower than that found in thicker Mn germanide films. To conclude this part, the Mn/Ge(111) film shows a clear ferromagnetic property in contrast to the case of Mn/Si(111).
(a) (b)
(c)
Figure 1. (a) XMCD spectrum measured at the L2 and L3 absorption edges of the MnGe(111) film at 100 K. (b) XAS spectra recorded at different sample temperature. (c) Close up image of the L3 absorption edge.
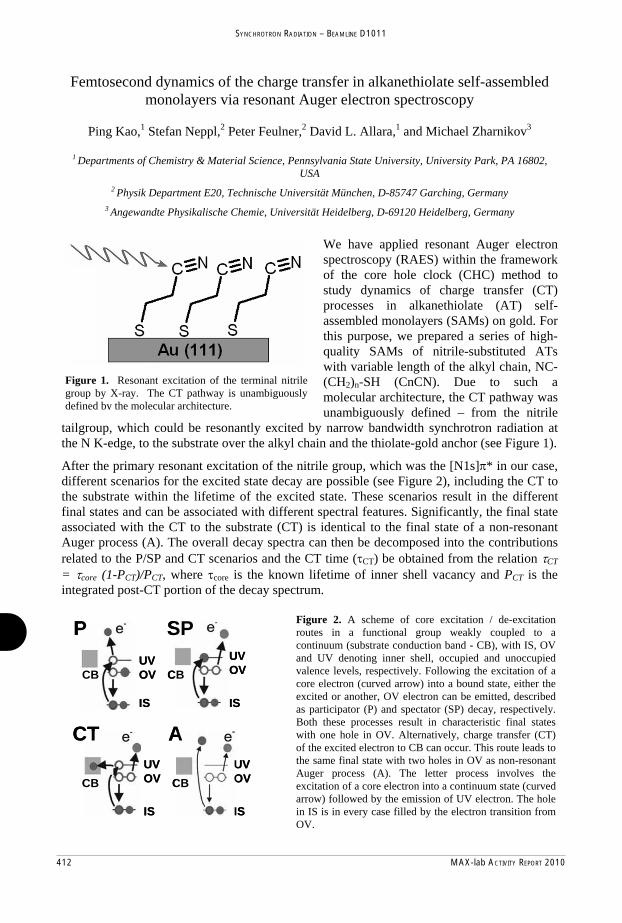
412 MAX-lab ACTIVITY REPORT 2010
SYNCHROTRON RADIATION – BEAMLINE D1011
Femtosecond dynamics of the charge transfer in alkanethiolate self-assembled monolayers via resonant Auger electron spectroscopy
Ping Kao,1 Stefan Neppl,2 Peter Feulner,2 David L. Allara,1 and Michael Zharnikov3
1 Departments of Chemistry & Material Science, Pennsylvania State University, University Park, PA 16802, USA
2 Physik Department E20, Technische Universität München, D-85747 Garching, Germany 3 Angewandte Physikalische Chemie, Universität Heidelberg, D-69120 Heidelberg, Germany
We have applied resonant Auger electron spectroscopy (RAES) within the framework of the core hole clock (CHC) method to study dynamics of charge transfer (CT) processes in alkanethiolate (AT) self-assembled monolayers (SAMs) on gold. For this purpose, we prepared a series of high-quality SAMs of nitrile-substituted ATs with variable length of the alkyl chain, NC-(CH2)n-SH (CnCN). Due to such a molecular architecture, the CT pathway was unambiguously defined – from the nitrile
tailgroup, which could be resonantly excited by narrow bandwidth synchrotron radiation at the N K-edge, to the substrate over the alkyl chain and the thiolate-gold anchor (see Figure 1).
After the primary resonant excitation of the nitrile group, which was the [N1s] * in our case, different scenarios for the excited state decay are possible (see Figure 2), including the CT to the substrate within the lifetime of the excited state. These scenarios result in the different final states and can be associated with different spectral features. Significantly, the final state associated with the CT to the substrate (CT) is identical to the final state of a non-resonant Auger process (A). The overall decay spectra can then be decomposed into the contributions related to the P/SP and CT scenarios and the CT time ( CT) be obtained from the relation CT= core (1-PCT)/PCT, where core is the known lifetime of inner shell vacancy and PCT is the integrated post-CT portion of the decay spectrum.
Figure 1. Resonant excitation of the terminal nitrile group by X-ray. The CT pathway is unambiguously defined by the molecular architecture.
SP
A
P
CTUVOV
IS
CB
CBCB
CB
UVOV
IS
UVOV
IS
UVOV
IS
SP
A
P
CTUVOV
IS
CB
CBCB
CB
UVOV
IS
UVOV
IS
UVOV
IS
Figure 2. A scheme of core excitation / de-excitation routes in a functional group weakly coupled to a continuum (substrate conduction band - CB), with IS, OV and UV denoting inner shell, occupied and unoccupied valence levels, respectively. Following the excitation of a core electron (curved arrow) into a bound state, either the excited or another, OV electron can be emitted, described as participator (P) and spectator (SP) decay, respectively. Both these processes result in characteristic final states with one hole in OV. Alternatively, charge transfer (CT) of the excited electron to CB can occur. This route leads to the same final state with two holes in OV as non-resonant Auger process (A). The letter process involves the excitation of a core electron into a continuum state (curved arrow) followed by the emission of UV electron. The hole in IS is in every case filled by the electron transition from OV.

MAX-lab ACTIVITY REPORT 2010 413
SYNCHROTRON RADIATION – BEAMLINE D1011
Within this framework, we measured the RAES spectra of the target SAMs (see Figure 3) and decomposed them into the contribution related to the P/SP and CT scenarios. On the basis of the relative weights of theses two processes, we determined the characteristic CT time to the substrate (see Figure 4). It was found that, similar to the static conductance, the dependence of the CT time on the number of methylene units in the alkyl chain can be coarsely described by exponential function with an attenuation factor of 0.93 per the unit, which corresponds to 0.72 Å-1 with respect to the length. As a result, the CT time is quite long even for a relatively short alkyl chain; it particular, it is ca. 100 fs for the chain consisting of only four CH2 units. In contrast, the CT time associated with the thiolate headgroup anchor was found to be quite short, viz. 2.3 fs, which suggests that thiolate-gold anchor provides an efficient interfacial electronic coupling between the aliphatic backbone and the substrate.
The advantages of CHC method in its specific application to SAMs are, except for the direct access to the dynamic characteristics of CT, a clear knowledge of the number of molecules participating in CT and the lack of contact problem. Nitrile, as used here, is seen to be a good candidate for CHC studies because of a suitable core hole lifetime and the large contrast between resonant and non-resonant core decay spectra, in particular the large spectator shift.
This work has been supported by DFG (ZH 63/9-3 and ZH 63/14-1).
Figure 3. [N1s] * RAES spectra of C2CN/Au, C3CN/Au, C4CN/Au, and C16CN/Au (black curves), along with non-resonant AES spectra of C2CN/Au (representative of C3CN/Au and C4CN/Au as well) and C16CN/Au (gray curves). P, SP1, and SP2 denote the participator and two spectator features, respectively. A1 and A2 denote twocharacteristic features in the non-resonant spectra. The kinetic energy ranges where a contribution from these features (CT trace) in the RAES spectra can be expected are highlighted by light gray.
Figure 4. CT time (top panel) from the excited nitrile group to the substrate and its natural logarithm (bottom panel) versus the number (n) of the CH2 units in the aliphatic chain of CnCN/Au (black filled circles). The gray solid line in the bottom panel represents the best fit. The slope and intercept points corresponding to this fit are 0.93 (0.72 Å-1; a tunneling along the chain was assumed) and 0.83 respectively.

414 MAX-lab ACTIVITY REPORT 2010
SYNCHROTRON RADIATION – BEAMLINE D1011
Figure 1 comparison of Au4f photoemission of gold (solid line) and gold nitride (dotted lines) thin films deposited on silicon substrates
Pulsed laser deposition of gold nitride: Photoemission spectroscopic study of its electronic structure
S. Krishnamurthy1, P.R. Coxon2, C. Charlton O'Mahony3, Y. Chao2 and Jean-Paul Mosnier1
1National Centre for Plasma Science and Technology, Dublin City University, Glasnevin, Dublin 9, Ireland
2 School of Chemistry, University of East Anglia, Norwich, Norfolk, NR4 7TJ, United Kingdom
3Biomedical Diagnostics Institute, Dublin City University, Glasnevin, Dublin 9, Ireland
Gold nitride is of great interest as a material with properties which potentially offer practical applications. Incorporation of gold nitride into gold films makes them 50% harder without losing it’s metallicity [1,4]. Gold nitride containing films promised to be a better material for electrical contacts in electronic circuits and for gold coatings. The first clear observation of the formation of solid gold nitride was made with nitride formation detected upon nitrogen ion implantation of the Au (11 0) surface using ions with an incident ion energy of 500 eV [2, 3]. More recently, techniques based on nitrogen reactive ion sputtering (RIS) and low energy plasma processing have been developed [5]. Both these methods are based on the interaction of low energy nitrogen ions with gold. The RIS technique allows the production gold films containing gold nitride in the bulk. Despite these simplicities there is a remarkable lack of information on the electronic properties of these materials, which are significantly dependant on the preparation conditions of these gold nitride films. Thin films of gold and gold nitride were produced by pulsed laser deposition (PLD) in an ultra high vacuum chamber. Films were deposited on Silicon, ITO and Sapphire substrates maintained at 450 °C during deposition in a nitrogen atmosphere with a varying pressure between 10-7 Torr to 10-`1 Torr. A Nd:YAG laser 266nm, 10 Hz repetition rate, and fluence of 1.8 Jcm-2 was used to ablate the metal target. All the films are approximately 120 nm thick. In seeking to verify the chemical bond formation and electronic structure of this material in detail, we used soft x-ray absorption and high resolution photoemission spectroscopy to understand the element specific conduction band density of states and to study the valence and core level photoemission. We report here the first measurements of this group on the gold nitride preformed at D1011 beamline, Max-lab.
Shown in Figure 1 is the comparison of gold and gold nitride thin films grown on silicon substrates. The Au 4f spectrum shows a marked difference in structure. The solid line represents the gold thin film of Au 4f7/2 and Au 4f 5/2spin orbit splitting represented as (A) and (C) respectively. In the case of gold nitride films there is a new feature (B) around 85.8 and 88.7 eV have been observed previously but not resolved [4] started to appear. This new feature is the signature of chemically bonded nitrogen on gold. However, this feature

MAX-lab ACTIVITY REPORT 2010 415
SYNCHROTRON RADIATION – BEAMLINE D1011
B, varies in intensity with varying growth conditions (not presented here) In Figure 2 N1s spectra obtained from gold nitride thin films taken at 500 eV excitation energy. The intense peak at 398.5 ± 0.1 eV corresponds to the nitrogen chemically bonded to gold. This is in agreement with our previous results [2,3]. The lineshape shows inhomogeneous broadening and there may be a peak at 397.5 eV.
The intensity of N1s lines varies with varying preparatory conditions. Hence the formation of gold nitride is very sensitive to the growth conditions
In Figure 3 we report the changes in the valence band features of the gold nitride thin films with respect to gold thin films. It can be clearly seen that there is a tail appearing between 0.1 to 2.8 eV and considerable broadening features of d bands. This could be attributed to the incorporation of defects or vacancies induced as a function of nitrogen incorporation in gold. More studies have to be done in order to understand the nature of defects.
References:
[1] "Gold film with gold nitride—A conductor but harder than gold", L. Šiller, N. Peltekis, S. Krishnamurthy, Y. Chao, S. J. Bull and M. R. C. Hunt, Applied Physics Letters 86, 221912 (2005), [2] "Photoemission spectroscopy of clean and potassium-intercalated carbon onions", M. Montalti, S. Krishnamurthy, Y. Chao, Yu. V. Butenko, V. L. Kuznetsov, V. R. Dhanak, M. R. C. Hunt and L. Šiller, Physical Review B, 67,113401 (2003) [3] “Nitrogen ion irradiation of Au(110): formation of gold nitride”, Siller L, Hunt MRC, Brown JW, Coquel JM, Rudolf P, Surface Science, 513, 78 (2002) [4] “Electrical properties of AuN thin films “,J H Quintero, R Ospina, O O Cárdenas, G I Alzate and A Devia, Phys. Scr. T131, 014013 (2008) [5] Patent: "Method of making Gold Nitride", WO2005121395 A1,L. Siller, S. Krishnamurthy, Y. Chao (2004) University of Newcastle upon Tyne, UK
Figure 2 show the N1s photoemission from the gold nitride thin film
Figure 3 show the N1s photoemission comparison of gold and the gold nitride thin films on silicon substrates
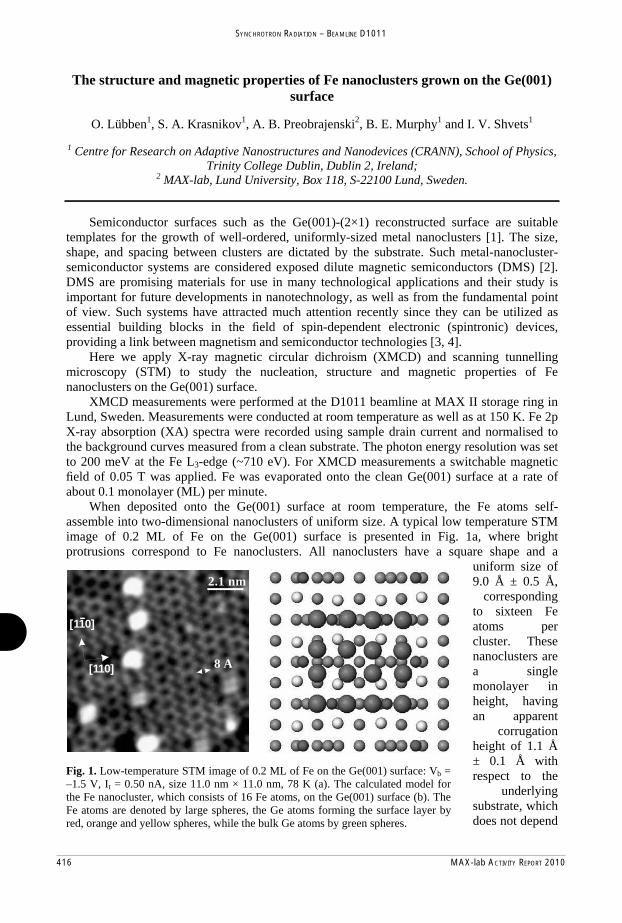
416 MAX-lab ACTIVITY REPORT 2010
SYNCHROTRON RADIATION – BEAMLINE D1011
The structure and magnetic properties of Fe nanoclusters grown on the Ge(001) surface
O. Lübben1, S. A. Krasnikov1, A. B. Preobrajenski2, B. E. Murphy1 and I. V. Shvets1
1 Centre for Research on Adaptive Nanostructures and Nanodevices (CRANN), School of Physics,
Trinity College Dublin, Dublin 2, Ireland; 2 MAX-lab, Lund University, Box 118, S-22100 Lund, Sweden.
Semiconductor surfaces such as the Ge(001)-(2×1) reconstructed surface are suitable templates for the growth of well-ordered, uniformly-sized metal nanoclusters [1]. The size, shape, and spacing between clusters are dictated by the substrate. Such metal-nanocluster-semiconductor systems are considered exposed dilute magnetic semiconductors (DMS) [2]. DMS are promising materials for use in many technological applications and their study is important for future developments in nanotechnology, as well as from the fundamental point of view. Such systems have attracted much attention recently since they can be utilized as essential building blocks in the eld of spin-dependent electronic (spintronic) devices, providing a link between magnetism and semiconductor technologies [3, 4].
Here we apply X-ray magnetic circular dichroism (XMCD) and scanning tunnelling microscopy (STM) to study the nucleation, structure and magnetic properties of Fe nanoclusters on the Ge(001) surface.
XMCD measurements were performed at the D1011 beamline at MAX II storage ring in Lund, Sweden. Measurements were conducted at room temperature as well as at 150 K. Fe 2p X-ray absorption (XA) spectra were recorded using sample drain current and normalised to the background curves measured from a clean substrate. The photon energy resolution was set to 200 meV at the Fe L3-edge (~710 eV). For XMCD measurements a switchable magnetic
eld of 0.05 T was applied. Fe was evaporated onto the clean Ge(001) surface at a rate of about 0.1 monolayer (ML) per minute.
When deposited onto the Ge(001) surface at room temperature, the Fe atoms self-assemble into two-dimensional nanoclusters of uniform size. A typical low temperature STM image of 0.2 ML of Fe on the Ge(001) surface is presented in Fig. 1a, where bright protrusions correspond to Fe nanoclusters. All nanoclusters have a square shape and a
uniform size of 9.0 Å ± 0.5 Å,
corresponding to sixteen Fe atoms per cluster. These nanoclusters are a single monolayer in height, having an apparent
corrugation height of 1.1 Å ± 0.1 Å with respect to the
underlying substrate, which does not depend
2.1 nm
8 A
[110]
[110]
Fig. 1. Low-temperature STM image of 0.2 ML of Fe on the Ge(001) surface: Vb = –1.5 V, It = 0.50 nA, size 11.0 nm × 11.0 nm, 78 K (a). The calculated model for the Fe nanocluster, which consists of 16 Fe atoms, on the Ge(001) surface (b). The Fe atoms are denoted by large spheres, the Ge atoms forming the surface layer by red, orange and yellow spheres, while the bulk Ge atoms by green spheres.

MAX-lab ACTIVITY REPORT 2010 417
SYNCHROTRON RADIATION – BEAMLINE D1011
[1] K. Jordan, I.V. Shvets, Appl. Phys. Lett. 88 (2006) 193111. [2] J.M. Sullivan, G.I. Boishin, L.J. Whitman, A.T. Hanbicki, B.T. Jonker, S.C. Erwin,
Phys. Rev. B 68 (2003) 235324. [3] S. Wolf, D. Awschalom, R. Buhrman, J. Daughton, S. Von Molnar, M. Roukes, A.
Chtchelkanova, D. Treger, Science 294 (2001) 1488. [4] I. Žuti , J. Fabian, S. Das Sarma, Rev. Mod. Phys. 76 (2004) 323. [5] M. Cantoni, M. Riva, G. Isella, R. Bertacco, F. Ciccacci, J. Appl. Phys. 97 (2005)
093906. [6] D. Cox, D. Trevor, R. Whetten, E. Rohlfing, A. Kaldor, Phys. Rev. B 32 (1985) 7290.
on the bias voltage. These two-dimensional nanoclusters follow the [1–10] direction of the substrate dimer rows, although the separation between the clusters varies throughout the image.
In order to confirm the number of Fe atoms in the nanoclusters formed on the Ge(001) surface, DFT calculations were performed using the Vienna Ab-initio Simulation Package. Fe clusters with different numbers of atoms were simulated. The cluster with sixteen atoms was found to have the lowest energy and a size of 9.0 Å × 9.0 Å, which is in excellent agreement with the experimental data. The resulting model of the Fe nanocluster on the Ge(001) surface is shown in Fig. 1b.
To study the magnetic properties of the Fe nanoclusters, XMCD measurements were carried out. The X-ray absorption (XA) spectra, measured at 150 K from the 0.5 ML of Fe on the Ge(001) surface with the magnetic field of 0.05 T applied in two opposite directions are shown in Fig. 2. The XA spectra have a metallic shape, indicating that no signi cant intermixing occurs at the Fe/Ge(001) interface, which is in agreement with previous studies [1, 5]. The XMCD spectrum shown in Fig. 2 is a result of subtraction of the XA spectrum taken at the maximum magnetic eld (+Bmax) applied in one direction (blue curve) from the other spectrum taken at the maximum magnetic eld (–Bmax) applied in the opposite direction (red curve). The XMCD spectrum taken at
150 K shows a prominent difference between the two opposite magnetic directions. In turn, XMCD measurements taken from the same Fe/Ge(001) system at room temperature show almost no difference between the spectra obtained for a magnetic eld applied in opposite directions. This indicates a superparamagnetic behaviour of the Fe nanoclusters (consisting of sixteen Fe atoms) grown on the Ge(001) surface. Free Fe clusters of similar size were also shown to exhibit superparamagnetism [6].
Thus, by applying XMCD and STM to Fe nanoclusters grown on the Ge(001) surface, it was found that the nanoclusters consist of sixteen Fe atoms and show superparamagnetic behaviour.
This work was supported by Science Foundation Ireland and by the Swedish Research Council.
700 705 710 715 720 725 730 735 740 745
Fe XAS at -Bmax
Fe XAS at +Bmax
XMCD difference x10
Fe L2
Fe L3
photon energy, eV
Fig. 2. Fe 2p XA spectra measured from 0.5 ML of Fe on the Ge(001) surface at 150 K with the magnetic field of 0.05 T applied in opposite directions (–Bmax and +Bmax).

418 MAX-lab ACTIVITY REPORT 2010
SYNCHROTRON RADIATION – BEAMLINE D1011
Adsorbed graphene as a non-volatile platform for chemical reactions M. L. Ng1, N. Vinogradov1,2, K. Simonov3, N. Mårtensson2 and A. B. Preobrajenski1 1 MAX-lab, Lund University, 22100 Lund, Sweden 2 Department of Physics, Uppsala University, 75121 Uppsala, Sweden 3V. A. Fock Institute of Physics, St. Petersburg State University, 198504 St. Petersburg, Russia A non-volatile thin film platform is the fundamental requirement for chemical sensing. Conversely, the system must be chemically, physically and thermally stable. In addition, chemical reactions taking place on the sensors must result in detectable property changes and these reactions have to be reversible. Calculations [1] have shown that the band structure (gap size) of carbon nanotubes (an allotrope of graphene) changes uniquely/specifically upon interaction with chemical functional groups (-CH, -C-O, -C-OH and –C=O). Experimental studies [2] have proven that there is a profound conductance change when graphene oxide is reduced. Previously, we have demonstrated that monolayer graphite (MG) adsorbed on transition metal (TM) such as Ir and Pt is more susceptible for chemical reaction with atomic H and the adsorption process is reversible upon soft annealing, i.e. the perfect MG surface can be recovered. [3] However, not all chemical processes on such systems are perfectly reversible by thermal treatment due to the strong chemical bonds, e.g. -C-O-C- that can rip off and cause defects in the MG layer. [2,4] Here, our preliminary x-ray spectroscopic studies indicate that MG adsorbed on Ir can be reduced and oxidized reversibly and repeatedly by atomic H and O respectively at room temperature (RT). All samples were prepared and characterized in-situ at Beamline D1011. The MG/Ir(111) sample was prepared and hydrogenated to saturation according to the description in Ref. [3]. This system was oxygenated stepwise with atomic oxygen and then with atomic hydrogen, whereby the exposure time is as described in Fig. 1. Fig. 1 shows the C 1s and O 1s PE spectra recorded from the clean and various treated MG/Ir. The evolution of chemical states of the overlayer due to the stepwise chemical treatments occurs in the following sequence.
• A single component C 1s represents the pristine C-C bond in graphene (Fig. 1[left,a]). • Triple components C 1s (Fig. 1[left,b]) where two components are due to the H
adsorption on pores and wires of the slightly corrugated MG/Ir surface while the third is the chemically intact graphene. These results are published in Ref. [3].
• After 1 min (Fig. 1[left,c]) of exposure to atomic O, O atoms adsorb on the H adsorption sites while H atoms desorb from the surface. This plausible inteterpretation is based on the increasing intensity of the epoxy-related components and the decreasing of the H adsorption related components in relation to the O exposure (Fig. 1[left,d]). The epoxy (-C-O-C-) related features are also observed in the O core level (Fig. 1[right,a-b]).
• After the second hydrogenation treatment, the hydrogen atoms first form hydroxyl groups (-OH) with adsorbed O, as observed in Fig. 1[left,e] and subsequently form water molecules and desorb away when more H atoms arrive on the surface (Fig. 1[left,f]). The system gradually recovers back to the state of the hydrogenated one (Fig. 1[left,g]. These statements are in agreement with the O 1s spectra (Fig. 1[right,c-e]), where the hydroxyl component appears and the intensity of the epoxy and

MAX-lab ACTIVITY REPORT 2010 419
SYNCHROTRON RADIATION – BEAMLINE D1011
Referen
[1] H[2] J
V[3] M
M[4] N
B[5] G[6] A
C
nces H. Park, J. ZJ. T. RobinVol. 8, No. M. L. Ng, MårtenssonN. VinograB. PreobrajG. M. PsofoA. Bagri, CChem., 201
Zhao, J. P. Lson, F. K. P10, 3137. R. Balog,
n, K. Schulteadov, K. Schenski, submogiannakis, C. Mattevi, 0, vol. 2, 58
Lu, NanotecPerkins, E. S
, L. Hornee, JPCC 20hulte, M. L
mitted to JPCG. E. FroudM. Acik, Y
81.
chnology, 2S. Snow, Z
ekaer, A. B10, 114, 185. Ng, A. MiCC 2011. dakis, JACSY. J. Chaba
2005, 16, 63. Wei, P. E.
B. Preobraje559. ikkelsen, E.
S, 2009, 13al, M. Chh
35. . Sheehan, N
enski, N. A
. Lundgren,
1, 15133. owalla, V.
Nano Letter
A. Vinogra
, N. Mårten
B. Shenoy
rs, 2008,
adov, N.
nsson, A.
y, Nature
ct
Figure oxygena
carbonyl cothe results i
1: C 1s [lation treatm
omponents fin Ref. [5,6]
left] and Oments of M
falls upon h].
O 1s [rightMG/Ir(111).
hydrogenati
] PE spect.
on. This ob
tra of the
bservation is
stepwise h
s also confi
hydrogenat
irmed by
ion and
It is plabecausetreatmen It can breactionare uniqgraphenRT.
ausible to se the total int (spectra n
be concludens at RT. Thque to the ne, the O ad
state that thintensity ofnot shown h
ed that adsohe system a
adsorptiondsorption p
he graphenef C 1s relhere).
orbed graphlso exhibits
n of each furocess can
e layer is slative to Ir
hene is indes signature pfunctional g
be reversed
stable throu4d remain
eed a non-vproperties (group. By ad by simply
ughout all cns almost th
volatile placore level cadsorbing Oy exposing
chemical trehe same af
atform for cchemical shO on hydrothe system
eatments fter each
chemical ifts) that ogenated
m to H at

420 MAX-lab ACTIVITY REPORT 2010
SYNCHROTRON RADIATION – BEAMLINE D1011

MAX-lab ACTIVITY REPORT 2010 421
SYNCHROTRON RADIATION – BEAMLINE D1011

422 MAX-lab ACTIVITY REPORT 2010
SYNCHROTRON RADIATION – BEAMLINE D1011

MAX-lab ACTIVITY REPORT 2010 423
SYNCHROTRON RADIATION – BEAMLINE D1011

424 MAX-lab ACTIVITY REPORT 2010
SYNCHROTRON RADIATION – BEAMLINE D1011
Figure 1: Cu 2p core level spectra of the (a) undoped and (b) 3 wt % Zn doped CuCl films
Electronic structure of Zn doped copper chloride probed by soft x-ray spectroscopies
K.V. Rajani 1, S. Daniels 1 P. J. McNally1 and S. Krishnamurthy 2
1 School of Electronic Engineering, Dublin City University, Dublin 9, Ireland 2 School of Physical Sciences, Dublin City University, Dublin 9, Ireland
CuCl is a wide, direct band gap (3.39 eV), zincblende compound semiconductor with great potential in linear and non-linear optical applications due to its large free excitonic binding energy (190 meV) [1]. In order to make use of the potentially strong luminescence properties of CuCl in photonic device applications, there should be a reliable technique for doping of this material system. Since, Zn acts as an n-type dopant for CuCl, the electronic and optical properties of CuCl varies significantly as a function of percentage of Zn doping in the copper lattice.
So far, there are several reports on the electronic band structure of CuCl [2, 3]. Kono et al. investigated the valence band spectra of CuCl using x-ray photoelectron spectroscopy and reported that it consists of two branches [4]. Furthermore, the s, p, and d valence states of CuCl have been reported by Goldmann et al. [5]. The electronic structure and energy gap have been studied by comparing the valence band of CuCl with band structure calculations [3]. It was reported by Novakov that satellites are formed when the emission of a 2p photoelectron takes place in parallel with a valence band-conduction band excitation in CuCl [6]. The K emission and K absorption spectra of Cl in CuCl have already been discussed in terms of the energy band structure [7].
However, there is no report on the changes in the electronic structure under the influence of Zn doping in CuCl. In order to verify the chemical bond formation and electronic structure of this material in detail, we used soft x-ray absorption and high resolution photoemission spectroscopy to understand the element specific conduction band density of states and to study the valence and core level photoemission of various Zn doped γ-CuCl samples.
Thin films of CuCl:Zn were deposited onto Si substrates by pulsed dc magnetron sputtering of CuCl/Zn target, with the weight percentage of Zn varying from 0-5%. The doped films exhibit maximum n-type carrier concentration of the order of ~ 1018 cm-3 (3 wt % Zn doped). We report here the first measurements of Zn doped γ-CuCl performed at the D1011 beamline, Max-lab, Sweden. Figure 1 shows the comparison of Cu 2p1/2 and 2p3/2 core level spectra of undoped CuCl and 3% Zn doped CuCl. In figure 1(a) there is evidence of satellite peaks in the undoped CuCl, which has been reported as being due to the presence of cupric species on the surface of the sample as a result of exposure to oxygen or moisture [8]. Moreover, shoulder peaks are also observed on the higher binding energy side of the 2ppeaks. These can also be considered as supporting information for the existence of cupric species in the pristine sample. In Figure 1(b) the 2p line shape varies significantly under the influence of Zn doping, the intensity of satellite peaks and shoulder peaks decreases, although
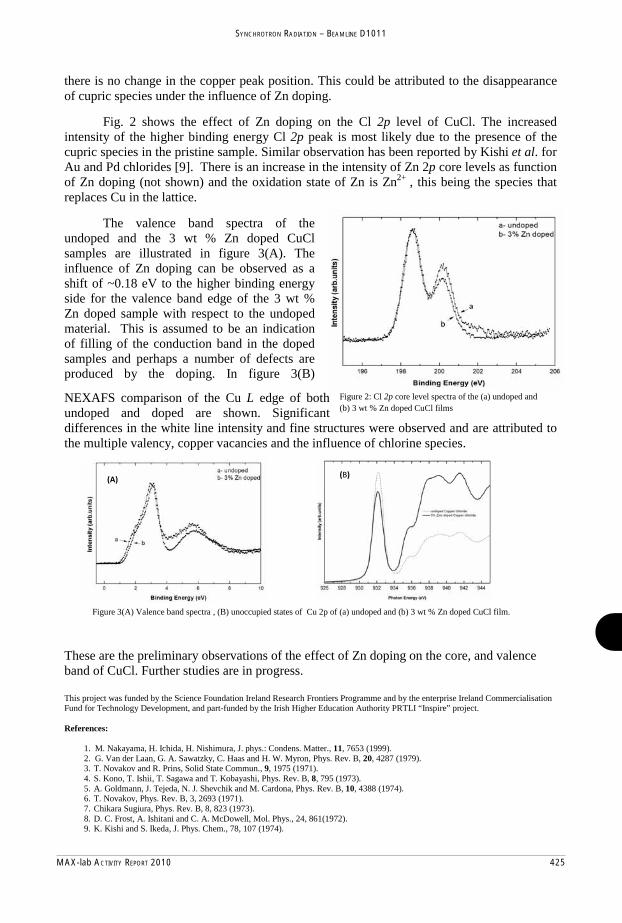
MAX-lab ACTIVITY REPORT 2010 425
SYNCHROTRON RADIATION – BEAMLINE D1011
Figure 2: Cl 2p core level spectra of the (a) undoped and (b) 3 wt % Zn doped CuCl films
there is no change in the copper peak position. This could be attributed to the disappearance of cupric species under the influence of Zn doping.
Fig. 2 shows the effect of Zn doping on the Cl 2p level of CuCl. The increased intensity of the higher binding energy Cl 2p peak is most likely due to the presence of the cupric species in the pristine sample. Similar observation has been reported by Kishi et al. for Au and Pd chlorides [9]. There is an increase in the intensity of Zn 2p core levels as function of Zn doping (not shown) and the oxidation state of Zn is Zn2+ , this being the species that replaces Cu in the lattice.
The valence band spectra of the undoped and the 3 wt % Zn doped CuCl samples are illustrated in figure 3(A). The influence of Zn doping can be observed as a shift of ~0.18 eV to the higher binding energy side for the valence band edge of the 3 wt % Zn doped sample with respect to the undoped material. This is assumed to be an indication of filling of the conduction band in the doped samples and perhaps a number of defects are produced by the doping. In figure 3(B)
NEXAFS comparison of the Cu L edge of both undoped and doped are shown. Significant differences in the white line intensity and fine structures were observed and are attributed to the multiple valency, copper vacancies and the influence of chlorine species.
These are the preliminary observations of the effect of Zn doping on the core, and valence band of CuCl. Further studies are in progress.
This project was funded by the Science Foundation Ireland Research Frontiers Programme and by the enterprise Ireland Commercialisation Fund for Technology Development, and part-funded by the Irish Higher Education Authority PRTLI “Inspire” project.
References:
1. M. Nakayama, H. Ichida, H. Nishimura, J. phys.: Condens. Matter., 11, 7653 (1999). 2. G. Van der Laan, G. A. Sawatzky, C. Haas and H. W. Myron, Phys. Rev. B, 20, 4287 (1979).
3. T. Novakov and R. Prins, Solid State Commun., 9, 1975 (1971). 4. S. Kono, T. Ishii, T. Sagawa and T. Kobayashi, Phys. Rev. B, 8, 795 (1973). 5. A. Goldmann, J. Tejeda, N. J. Shevchik and M. Cardona, Phys. Rev. B, 10, 4388 (1974). 6. T. Novakov, Phys. Rev. B, 3, 2693 (1971). 7. Chikara Sugiura, Phys. Rev. B, 8, 823 (1973). 8. D. C. Frost, A. Ishitani and C. A. McDowell, Mol. Phys., 24, 861(1972). 9. K. Kishi and S. Ikeda, J. Phys. Chem., 78, 107 (1974).
Figure 3(A) Valence band spectra , (B) unoccupied states of Cu 2p of (a) undoped and (b) 3 wt % Zn doped CuCl film.

426 MAX-lab ACTIVITY REPORT 2010
SYNCHROTRON RADIATION – BEAMLINE D1011
Single molecule magnets on a Au(111) surface: in-situ electrospray deposition and a comparison of different ligand shells
A. Saywell1, A. J. Britton1, N. Taleb2, M. Gimenex-Lopez2, N. R. Champness2, P. H. Beton1 and J. N. O’Shea1
1 School of Physics & Astronomy and the Nottingham Nanotechnology and Nanoscience Centre (NNNC), University of Nottingham, Nottingham, UK
1 School of Chemistry, University of Nottingham, Nottingham, UK
Figure 1. (top) Chemical structure of Mn12(acetate)16 viewed from above and from the side, (bottom) Structure of Mn12(benzoate)16 as viewed from above and the side.
Single molecule magnets (SMMs) represent an example of a self-contained molecular building block, with magnetic properties, which has the potential to be incorporated as an active component within nano-scale devices. The intrinsic magnetic properties of these fascinating and complex molecules arise from the specific oxidation states of the metal atoms at their core. SMMs are so-called as they exhibit a range of magnetic properties which originate from a purely molecular basis [1] and it is their potential use as components within quantum computation devices which has caused great interest. Some of the more widely studied molecular architecture, and the focus of this experiment, are those based on the mixed valence dodecamanganese (III, IV) cluster which contains four Mn4+ ions within the core and eight Mn3+ ions around the periphery. The magnetic core of such SMMs is protected by an organic shell, with one of the simplest examples using acetate ligands (Mn12(acetate)16) molecule. An obstacle to the formation of well defined monolayers or network-isolated clusters however is that SMMs tend to be non-volatile and therefore cannot be sublimed onto a surface under UHV conditions. In order to overcome this hurdle and to facilitate the study of non-volatile molecules with high resolution synchrotron-based spectroscopy, we developed, a few years ago, a novel in-situ UHV deposition system, based on electrospray ionisation. Essentially, the system forms nanoscale droplets of a liquid solution at the tip of a high voltage capillary. These droplets undergo a succession of Coulomb fission events and solvent evaporation to leave a beam of desolvated molecular ions which are transported through 4 stages of differential pumping before arriving at the sample surface at pressures in the 10-8 mbar range [2-4]. In this experiment we successfully deposited the Mn12(acetate)16 and Mn12(benzoate)16 single molecule magnet molecules shown in figure 1 in-situ onto atomically clean Au(111) surfaces under UHV conditions at beamline D1011. The purpose of this experiment was to find out if a
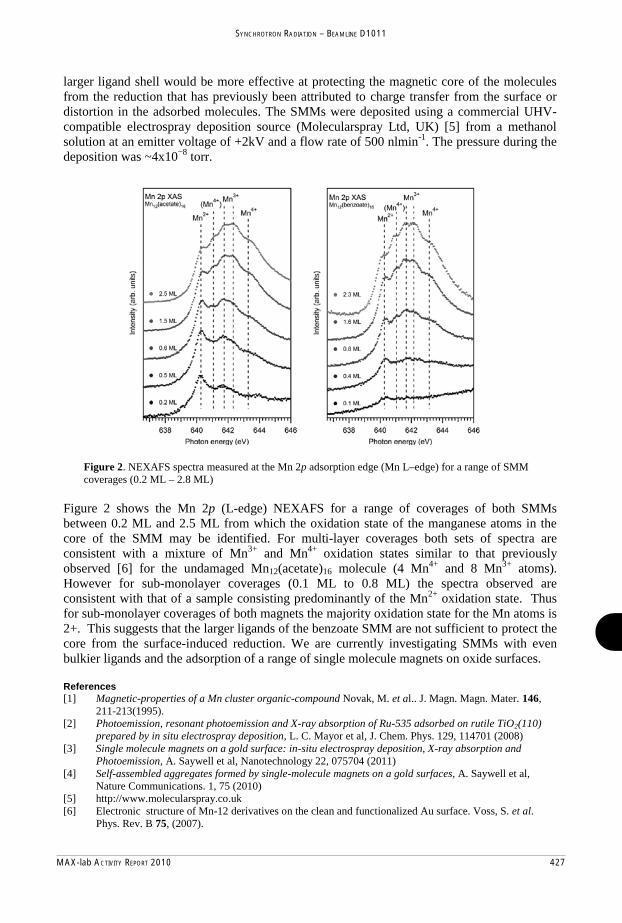
MAX-lab ACTIVITY REPORT 2010 427
SYNCHROTRON RADIATION – BEAMLINE D1011
larger ligand shell would be more effective at protecting the magnetic core of the molecules from the reduction that has previously been attributed to charge transfer from the surface or distortion in the adsorbed molecules. The SMMs were deposited using a commercial UHV-compatible electrospray deposition source (Molecularspray Ltd, UK) [5] from a methanol solution at an emitter voltage of +2kV and a flow rate of 500 nlmin-1. The pressure during the deposition was ~4x10 8 torr.
Figure 2. NEXAFS spectra measured at the Mn 2p adsorption edge (Mn L–edge) for a range of SMM coverages (0.2 ML – 2.8 ML)
Figure 2 shows the Mn 2p (L-edge) NEXAFS for a range of coverages of both SMMs between 0.2 ML and 2.5 ML from which the oxidation state of the manganese atoms in the core of the SMM may be identified. For multi-layer coverages both sets of spectra are consistent with a mixture of Mn3+ and Mn4+ oxidation states similar to that previously observed [6] for the undamaged Mn12(acetate)16 molecule (4 Mn4+ and 8 Mn3+ atoms). However for sub-monolayer coverages (0.1 ML to 0.8 ML) the spectra observed are consistent with that of a sample consisting predominantly of the Mn2+ oxidation state. Thus for sub-monolayer coverages of both magnets the majority oxidation state for the Mn atoms is 2+. This suggests that the larger ligands of the benzoate SMM are not sufficient to protect the core from the surface-induced reduction. We are currently investigating SMMs with even bulkier ligands and the adsorption of a range of single molecule magnets on oxide surfaces. References [1] Magnetic-properties of a Mn cluster organic-compound Novak, M. et al.. J. Magn. Magn. Mater. 146,
211-213(1995). [2] Photoemission, resonant photoemission and X-ray absorption of Ru-535 adsorbed on rutile TiO2(110)
prepared by in situ electrospray deposition, L. C. Mayor et al, J. Chem. Phys. 129, 114701 (2008) [3] Single molecule magnets on a gold surface: in-situ electrospray deposition, X-ray absorption and
Photoemission, A. Saywell et al, Nanotechnology 22, 075704 (2011) [4] Self-assembled aggregates formed by single-molecule magnets on a gold surfaces, A. Saywell et al,
Nature Communications. 1, 75 (2010) [5] http://www.molecularspray.co.uk [6] Electronic structure of Mn-12 derivatives on the clean and functionalized Au surface. Voss, S. et al.
Phys. Rev. B 75, (2007).
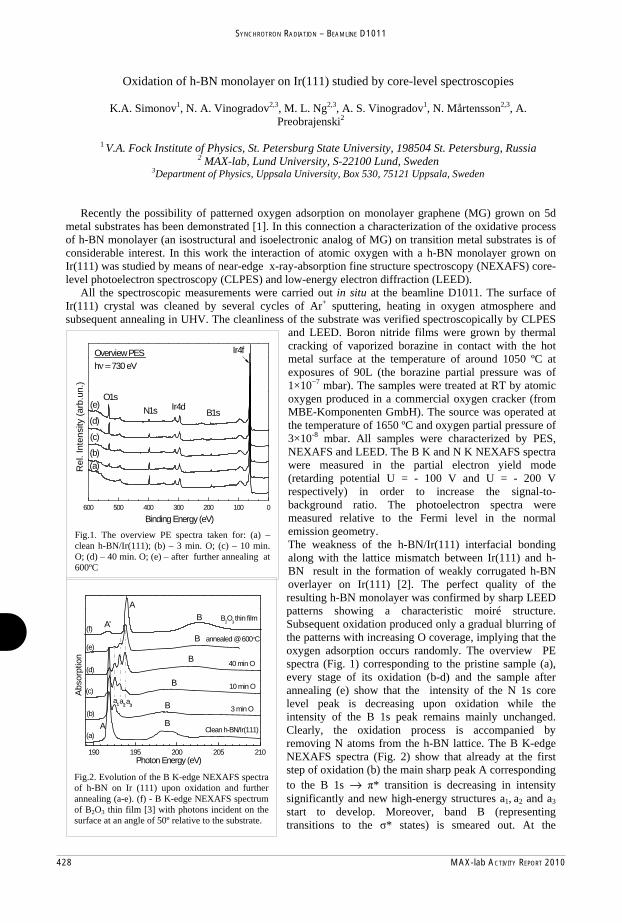
428 MAX-lab ACTIVITY REPORT 2010
SYNCHROTRON RADIATION – BEAMLINE D1011
Oxidation of h-BN monolayer on Ir(111) studied by core-level spectroscopies
K.A. Simonov1, N. A. Vinogradov2,3, M. L. Ng2,3, A. S. Vinogradov1, N. Mårtensson2,3, A. Preobrajenski2
1 V.A. Fock Institute of Physics, St. Petersburg State University, 198504 St. Petersburg, Russia
2 MAX-lab, Lund University, S-22100 Lund, Sweden 3Department of Physics, Uppsala University, Box 530, 75121 Uppsala, Sweden
Recently the possibility of patterned oxygen adsorption on monolayer graphene (MG) grown on 5d
metal substrates has been demonstrated [1]. In this connection a characterization of the oxidative process of h-BN monolayer (an isostructural and isoelectronic analog of MG) on transition metal substrates is of considerable interest. In this work the interaction of atomic oxygen with a h-BN monolayer grown on Ir(111) was studied by means of near-edge x-ray-absorption fine structure spectroscopy (NEXAFS) core-level photoelectron spectroscopy (CLPES) and low-energy electron diffraction (LEED).
All the spectroscopic measurements were carried out in situ at the beamline D1011. The surface of Ir(111) crystal was cleaned by several cycles of Ar+ sputtering, heating in oxygen atmosphere and subsequent annealing in UHV. The cleanliness of the substrate was verified spectroscopically by CLPES
and LEED. Boron nitride films were grown by thermal cracking of vaporized borazine in contact with the hot metal surface at the temperature of around 1050 ºC at exposures of 90L (the borazine partial pressure was of 1×10 7 mbar). The samples were treated at RT by atomic oxygen produced in a commercial oxygen cracker (from MBE-Komponenten GmbH). The source was operated at the temperature of 1650 ºC and oxygen partial pressure of 3×10⁻⁸ mbar. All samples were characterized by PES, NEXAFS and LEED. The B K and N K NEXAFS spectra were measured in the partial electron yield mode (retarding potential U = - 100 V and U = - 200 V respectively) in order to increase the signal-to-background ratio. The photoelectron spectra were measured relative to the Fermi level in the normal emission geometry. The weakness of the h-BN/Ir(111) interfacial bonding along with the lattice mismatch between Ir(111) and h-BN result in the formation of weakly corrugated h-BN overlayer on Ir(111) [2]. The perfect quality of the resulting h-BN monolayer was confirmed by sharp LEED patterns showing a characteristic moiré structure. Subsequent oxidation produced only a gradual blurring of the patterns with increasing O coverage, implying that the oxygen adsorption occurs randomly. The overview PE spectra (Fig. 1) corresponding to the pristine sample (a), every stage of its oxidation (b-d) and the sample after annealing (e) show that the intensity of the N 1s core level peak is decreasing upon oxidation while the intensity of the B 1s peak remains mainly unchanged. Clearly, the oxidation process is accompanied by removing N atoms from the h-BN lattice. The B K-edge NEXAFS spectra (Fig. 2) show that already at the first step of oxidation (b) the main sharp peak A corresponding to the B 1s → * transition is decreasing in intensity significantly and new high-energy structures a1, a2 and a3 start to develop. Moreover, band B (representing transitions to the * states) is smeared out. At the
190 195 200 205 210
A'
A
A
B
B
B
B
B
B
a3a2
a1
(f)
(e)
(d)
(c)
(b)
B2O
3 thin film
annealed @ 600°C
10 min O
Abs
orpt
ion
Clean h-BN/Ir(111)
3 min O
40 min O
Photon Energy (eV)
(a)
Fig.2. Evolution of the B K-edge NEXAFS spectra of h-BN on Ir (111) upon oxidation and further annealing (a-e). (f) - B K-edge NEXAFS spectrum of B2O3 thin film [3] with photons incident on the surface at an angle of 50º relative to the substrate.
600 500 400 300 200 100 0
(e)
(d)
(c)
(b)
Overview PES hν = 730 eV
Binding Energy (eV)
Rel
. Int
ensi
ty (a
rb.u
n.)
(a)
O1sN1s B1s
Ir4d
Ir4f
Fig.1. The overview PE spectra taken for: (a) – clean h-BN/Ir(111); (b) – 3 min. O; (c) – 10 min. O; (d) – 40 min. O; (e) – after further annealing at 600ºC

MAX-lab ACTIVITY REPORT 2010 429
SYNCHROTRON RADIATION – BEAMLINE D1011
following oxidation steps (c-d) a further decay of the peak A intensity occurs, while structures a1, a2 and a3 are enhanced non-equivalently. The B K-edge spectrum of the saturated O/h-BN/Ir(111) sample is characterized by the dominant a3 and a2 structures. An annealing at 600ºC (e) results in the suppression of peaks A, a1, a2 and the domination of peak a3. The spectrum of an annealed sample (e) is very similar
to that of B2O3 (f) [3]. The B 1s-1 * core excitations in B2O3 are of a quasi-molecular nature, being determined by the BO3 planar units of the D3h symmetry [3]. It is plausible to suggest that peak a3 corresponds to the B atoms for which all of the neighboring nitrogens are replaced by oxygen.
The rapid growth of peak a3 points at an active process of embedding O atoms into the h-BN lattice by replacing N atoms in agreement with PES data. We believe that this process has to proceed through the intermediate stages corresponding to a replacement of either one (a1) or two (a2) N atoms in the BN3 unit of h-BN. That is why at initial steps of oxidation the appearance of peaks a1 and then a2 precedes the development of a3. An analysis of the B 1s NEXAFS spectra of the h-BN/Ir(111) (not shown) upon the Ar+ ion treatment reveals only a smearing of band A, thus excluding defects as an origin of peaks a1, a2 and a3. From the angle-dependent B 1s spectra (Fig. 3) it is
apparent that the states corresponding to peaks a1, a2 and a3 are of the * symmetry, being caused by the B 2pz - O 2pz covalent bonding. An incomplete suppression of peaks a1, a2 and particularly a3 in going from the grazing to the normal incidence (for both oxidation steps) can be due to strong atomic buckling at the corresponding BN3-xOx (x = 1,2,3) sites. This fact is easy to understand taking into account a difference between the B-N and B-O bond lengths. The main trends in the evolution of N 1s spectra with oxidation (Fig.4) are their decrease in intensity and a considerable suppression of band A associated with the * states of pristine h-BN overlayer. This suppression is a direct consequence of destroying the B-N bands due to the replacement of N atoms by oxygen.
In conclusion, the adsorption of atomic oxygen on h-BN/Ir(111) occurs mainly through the embedding of O atoms into the h-BN lattice. This is different from the case of MG/Ir(111), for which oxidation occurs predominantly through the formation of epoxy groups [1]. On the other hand, the simultaneous formation of epoxy-like B-O-N chains at the initial oxidation stages (as proposed in [4]) cannot be excluded.
190 195 200 205 210
Exposition = 18L
B
900
500
200
(a)
a3
a2
Abso
rptio
n
Photon Energy (eV)
A a1
θ =
190 195 200 205 210
Exposition = 72L
θ =
900
500
200
Photon Energy (eV)
Abs
orpt
ion
(b)a3
a2
A
a1
B
Fig. 3. Angle-dependent B 1s NEXAFS spectra of oxidized BN overlayer on Ir(111) where is an angle between the light polarization vector and the substrate surface normal. (a) exposure of 18L , (b) exposure of 72 L (oxygen saturated) sample.
390 395 400 405 410 415 420
A'
A''(e)
(d)
(c)
(b)
Photon Energy (eV)
Abs
orpt
ion
A''A
A'
annealing @ 600 °C
10 min O
Clean hBN/Ir
3 min O
40 min O
(a)
Fig. 4. Evolution of the N K-edge NEXAFS spectra of h-BN on Ir (111) upon oxidation and further annealing (a-e) with photons incident on the surface at an angle of 50º relative to the substrate.
_________________________________________________ 1. N.A. Vinogradov et. al. in print 2. A.B. Preobrajenski et. al. Chem. Phys. Lett., 446, 119 (2007). 3. A.B. Preobrajenski et.al. Physica Scripta., T115, 1071 (2005). 4. C. Ataca and S. Ciraci , Phys. Rev. B, 82, 165402 (2010).
θ = θ =

430 MAX-lab ACTIVITY REPORT 2010
SYNCHROTRON RADIATION – BEAMLINE D1011
Growth of the first water layer on rutile TiO2(110)
L. E. Walle1, M. Amft2, D. Ragazzon2, A. Borg1, P. Uvdal3, N. Skorodumova2, and A. Sandell2
1 Dept. of Physics, Norwegian University of Science and Technology (NTNU),
NO-7491 Trondheim, Norway 2 Dept. of Physics and Astronomy, Uppsala University, P. O. Box 530,
SE-751 21 Uppsala, Sweden 3 Chemical Physics, Dept. of Chemistry, P.O. Box 124, and MAX-lab, P.O. Box 113, Lund
University, SE-221 00 Lund, Sweden
In this work we address a most central and straightforward question in surface science: How does the very first layer of water form on a defect free metal oxide surface? With respect to fundamental studies, water adsorption on single crystalline rutile TiO2(110) can be considered as the prototype system, and the H2O/TiO2(110) system has indeed received more attention than any other comparable system [1-3]. So far, experimental studies addressing the formation of a water monolayer on the defect free TiO2(110) surface have been lacking, while addressed frequently in the literature by theory. Early studies predicted dissociative adsorption at all coverages while more recent studies suggest a delicate balance between dissociated, partial dissociated and molecular configurations, a balance that most probably depends on the coverage, e.g. [4,5]. Recently we presented the first experimental work to give a conclusive answer to the long-standing question whether water dissociates or not on a surface free from oxygen vacancies [6]. Using the set-up at beamline D1011, we found evidence for mixed molecular and dissociative water adsorption at monolayer coverage on the stoichiometric rutile TiO2(110) surface. At monolayer coverage the OH:H2O ratio is close to 0.5 and reducing the coverage by heating was found to result in an increased OH:H2O ratio. The OH species of the monolayer recombines and leaves the surface at much lower temperatures than OH formed by water dissociation on oxygen vacancies. In this contribution we present new data on the H2O/TiO2(110) system, also collected at D1011. The formation of the first layer of water on the stoichiometric rutile (110) surface is here unraveled in real-time measurements of O 1s photoelectron spectra, giving a detailed picture of how the OH:H2O ratio depend on the coverage. The O 1s spectra were measured during water uptake at 210 K. Figure 1 (left) shows a 2D plot of the O 1s spectral intensity vs. elapsed time (=exposure) attained at a pressure of 1.5⋅10-10 mbar. Each one of the spectra was delineated into components from TiO2, OH and H2O. Figure 1 (right) gives an example of a fitted spectrum.
Figure 2 shows H2O and OH coverages as a function of time for growth at (a) 3⋅10-10 mbar, (b) 1.5⋅10-10 mbar and (c) 5⋅10-11 mbar (background pressure), respectively. The coverage is obtained by first adding the O 1s intensities as 0.5⋅[O 1s(OH)]+[O 1s(H2O)] and then normalize these values to the monolayer intensity, defined as that attained by heating a water multilayer to 210 K [6]. For the two higher pressures, saturation was observed. The growth at background pressure had to be terminated before saturation due to time limitations.

MAX-lab ACTIVITY REPORT 2010 431
SYNCHROTRON RADIATION – BEAMLINE D1011
Fig. 1. Left: Real-time O1s spectra for water adsorption on TiO2(110). Right: decomposition of one of the spectra.
At 3⋅10-10 mbar we reach saturation coverages of 0.82±0.05 ML H2O and 0.35±0.05 ML OH and at 1.5⋅10-10 mbar the saturation coverages are 0.80±0.05 ML H2O and 0.40±0.05 ML OH. It is also important to note that the composition is very similar to that reached by either heating of a multilayer to 210 K or by dosing 5 L at a pressure of 5.5⋅10-8 mbar at 210 K. The composition found for these two preparations is 0.79±0.05 ML H2O and 0.42±0.05 ML OH. This gives strong support to the absence of radiation induced effects since the same composition is observed under very different preparation conditions and measuring times. This also demonstrates that the composition of the complete first layer is not significantly affected by kinetic effects.
The three growth series show that both H2O and OH are formed from a very early stage. Particularly intriguing is that Figs. 2 (b) and (c), i.e. the two lowest pressures investigated, show very similar growth rates of the H2O and OH coverages from 0.04 ML up to about 0.40 ML total coverage. A constant H2O:OH ratio during growth is a strong indication of cluster formation with a specific composition. In all three series it is observed that the OH coverage levels out well before the H2O coverage does. The point at which this happens is rather similar for all three situations, suggesting a critical total coverage of 0.40±0.05 ML. That is, this coverage corresponds to the maximum coverage of the characteristic mixed water-hydroxyl clusters. Above this coverage, water only adsorbs intact. Ongoing ab initio calculations on the formation of H2O-OH complexes at a series of coverages will help to understand the growth mechanism up to the critical point of 0.4 ML.
Fig. 2. Coverage of H2O (filledcircles), OH (filled squares) andtotal H2O uptake (open circles)as function of esposure time.
_____________________________ 1. U. Diebold, Surf. Sci. Rep. 48, 53 (2003). 2. C. L. Pang, R. Lindsay, and G. Thornton, Chem. Soc. Rev. 37, 2328 (2008). 3. M. A. Henderson, Surf. Sci. Rep. 46, 1 (2002).
4. P. J. D. Lindan, N. M. Harrison, and M. J. Gillan, Phys. Rev. Lett. 80, 762 (1998). 5. P. M. Kowalski, B. Meyer, and D. Marx, Phys. Rev. B 79, 115410 (2009). 6. L. E. Walle, A. Borg, P. Uvdal, A. Sandell, Phys. Rev. B 80, 235436 (2009)

432 MAX-lab ACTIVITY REPORT 2010
SYNCHROTRON RADIATION – BEAMLINE D1011
Mixed dissociative and molecular water adsorption on anatase TiO2(101)
L. E. Walle1, A. Borg1, E. M. J. Johansson2, S. Plogmaker2, H. Rensmo2, P. Uvdal3 and A. Sandell2
1 Dept. of Physics, Norwegian University of Science and Technology, NO-7491 Trondheim, Norway 2 Dept. of Physics and Materials Science, Uppsala University, P. O. Box 530,
SE-751 21 Uppsala, Sweden 3 Chemical Physics, Dept. of Chemistry, Lund University, P.O. Box 124, SE-221 00 Lund, Sweden
The adsorption of water on a metal oxide surface defines a scientific problem of high general importance [1]. The archetypical system in this respect is water on the (110) surface of rutile titanium dioxide (TiO2) [2]. The adsorption state of water (molecular vs. dissociated) on a rutile (110) surface free from defects has been highly controversial over the years [3-5]. Very recently, we demonstrated for the first time that the first water layer on rutile (110) contains a significant fraction of dissociated species, even in a total absence of surface oxygen vacancies [6].
In this contribution, we present another study, also conducted at beamline D1011, that addresses water adsorption on a related system, the (101) surface of anatase TiO2. Again a set of O 1s photoemission spectra optimized for maximum surface sensitivity is used to unravel the temperature dependent adsorption state of water on the stoichiometric surface.
Figure 1 shows O 1s spectra obtained after adsorption and subsequent annealing of a multilayer of water. The spectra have been delineated into individual contributions from the TiO2 substrate, OH and H2O. After adsorption of water at 120 K followed by heating to 160 K in order to desorb multilayer water two O 1s features are observed apart from the TiO2 substrate peak at 530.5 eV: The state at 531.5 eV, assigned to OH, and the state at 534 eV, assigned to H2O [6,7]. Thus, the first layer of water consists of both molecular and dissociated species. The amount of OH is far too high to be attributed to oxygen vacancies. OH recombination and desorption of the dissociated species on the stoichiometric surface is furthermore found to occur at much lower temperature than expected for water dissociated on oxygen vacancies [8]. This observation suggests the formation of a pseudo-dissociated form of water [9].
The water and hydroxyl coverages are shown in Fig. 2a. For comparison the corresponding results for rutile (110) are
shown in Fig. 2b. For both anatase (101) and rutile (110), one monolayer (1 ML) corresponds to a density of 5.2·1014 cm-2, that is, the density of 5-fold-coordinated Ti [Ti(5)] ions on the surface.
The temperature dependences of the H2O and OH coverages are qualitatively very
Figure 1. O 1s spectra for water adsorption on the anatase TiO2(101)-(1x1) surface. The spectra show the results after progressive heating of a multilayer of water.

MAX-lab ACTIVITY REPORT 2010 433
SYNCHROTRON RADIATION – BEAMLINE D1011
References 1. U. Diebold, Surf. Sci. Rep. 48, 53 (2003). 2. M. A. Henderson, Surf. Sci. Rep. 46, 1 (2002). 3. P. J. D. Lindan, N. M. Harrison and M. J. Gillan, Phys. Rev. Lett. 80, 762 (1998). 4. H. Perron, J. Vandenborre, C. Domain, R. Drot, J. Roques, E. Simoni, J.-J. Ehrhardt and H. Catalette, Surf.
Sci. 601, 518 (2007). 5. P. M. Kowalski, B. Meyer and D. Marx, Phys. Rev. B 79, 115410 (2009). 6. L. E. Walle, A. Borg, P. Uvdal and A. Sandell, Phys. Rev. B 80, 235436 (2009). 7. G. Ketteler, S. Yamamoto, H. Bluhm, K. Andersson, D. E. Starr, F. Ogletree, H. Ogasawara, A. Nilsson and
M. Salmeron, J. Phys. Chem. C 111, 8278 (2007). 8. G. S. Herman, Z. Dohnálek and N. Ruzycki, U. Diebold, J. Phys. Chem. B 107, 2788, (2003). 9. U. Aschauer, Y. B. He, H. Z. Cheng and S.-C. Li, U. Diebold, A. Selloni, J. Phys. Chem. C 114, 1278
(2010). 10. Y. B. He, A. Tilocca, O. Dulub, A. Selloni, U. Diebold, Nat. Mater. 8, 585 (2009).
similar for the two surfaces with a decrease in the H2O coverage that is more rapid than the decrease in the OH coverage. By comparing to the O 1s intensity at the monolayer point for rutile (110), we interpolate that a coverage of 1 ML on anatase (101) is attained at about 220 K. This is close to the monolayer temperature of 210 K found for rutile. The composition of the water monolayer on anatase (101) is estimated to be 0.77±0.05 ML H2O and 0.47±0.05 ML OH. This composition is within the error bars identical to that found on rutile (110) [6]. In conclusion, we find clear evidence for a water monolayer that comprises comparable amounts of molecular and dissociated species. The behavior is essentially the same as that found on rutile (110), with a similar H2O/OH ratio of the monolayer and a H2O/OH ratio that decreases with decreasing coverage. The finding of a mixed hydroxyl-molecular water layer is in stark contrast to previous work, e.g. [10]. The previous studies advocate molecular adsorption only, a view that is based on STM in conjunction with DFT calculations and standard XPS. Our new results demonstrate convincingly that high-quality spectroscopic input is necessary in order to obtain a correct picture.
Figure 2. Estimates of the OH and H2O coverages in monolayers on the (a) anatase TiO2(101)-(1x1) and (b) rutile TiO2(110) surface as a function of temperature.
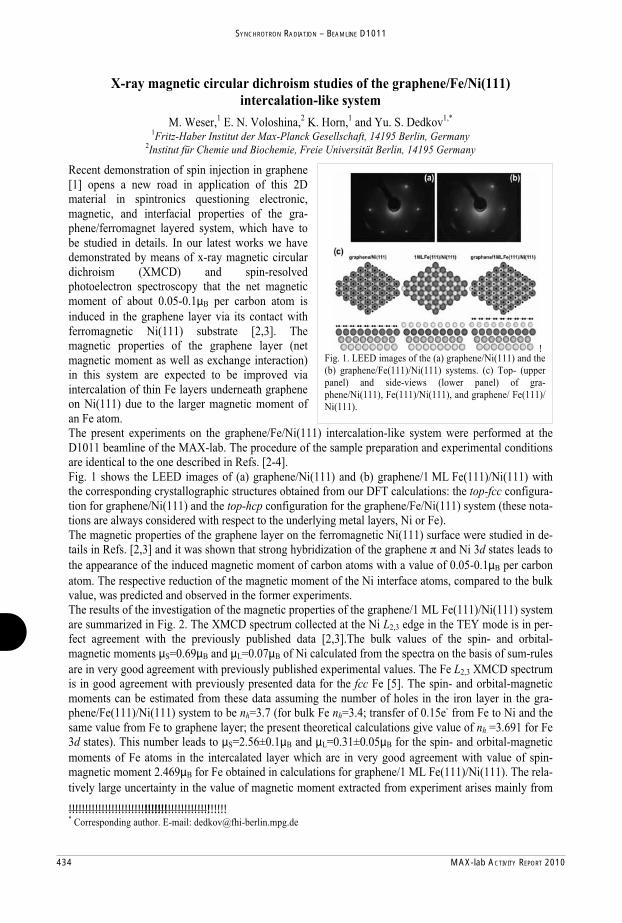
434 MAX-lab ACTIVITY REPORT 2010
SYNCHROTRON RADIATION – BEAMLINE D1011

MAX-lab ACTIVITY REPORT 2010 435
SYNCHROTRON RADIATION – BEAMLINE D1011

436 MAX-lab ACTIVITY REPORT 2010
SYNCHROTRON RADIATION – BEAMLINE D1011
The impact of atomic oxygen on graphene weakly bound to metal substrates
N. A. Vinogradov1, 2, K. Schulte2, May Ling Ng,1, 2 A. Mikkelsen3, E. Lundgren3, N. Mårtensson1, 2, and A. B. Preobrajenski2
1Department of Physics, Uppsala University, Box 530, 75121 Uppsala, Sweden
2MAX-lab, Lund University, Box 118, 22100 Lund, Sweden 3Division of Synchrotron Radiation, Institute of Physics,
Lund University, Box 118, 22100 Lund, Sweden
The oxygen adsorption on the monolayer graphite (MG or graphene) grown on the metal substrates has been investigated by X-ray core level photoelectron spectroscopy (CLPES or CLS), near-edge x-ray adsorption spectroscopy (NEXAFS) and scanning tunneling microscopy (STM)[1]. The goal of the study was to provide deeper insight into the mechanism of graphene’s interaction with active adsorbates such as atomic oxygen and give information about a possibility of fine tuning of graphene’s electronic structure by patterned adsorption of oxygen, which was recently reported for hydrogen [2,3]. The Ir(111) and Pt(111) single crystals were used as substrates for graphene growth since both of them provide periodically corrugated graphene due to the lattice mismatch between the latter and the substrate, and shows a well-known moir superstructure [4,5]. The highly oriented pyrolitic graphite (HOPG) sample was used as a reference to model freestanding graphene with no corrugation.
All the spectroscopic measurements were carried out in situ at the beamline D1011. The surface of Ir(111) and Pt(111) crystals was cleaned by several cycles of Ar+-sputtering, annealing in oxygen atmosphere and subsequent flashing in UHV. The cleanliness of the substrate was checked by CLS and low energy electron diffraction (LEED). Graphene was grown by thermal cracking of propylene (C3H6) in contact with the hot metal surface at the temperature of ~1000oC in the propylene partial
pressure of 1×10 7 mbar, the quality of the sample was verified by CLS and LEED. Cleaning of the HOPG sample was performed by cleaving it in situ with subsequent annealing in UHV to 600oC. The samples were treated at RT by atomic oxygen produced in a commercial oxygen cracker (from MBE-Komponenten GmbH). The cracker was operated at the temperature of 1650oC and oxygen partial pressure of 1×10⁻⁷ mbar. All samples were characterized by CLS, NEXAFS and LEED. The C K-edge NEXAFS spectra were measured in the partial electron yield mode (retarding potential U = - 100 V). The photon energy resolution of the C 1s NEXAFS spectra was set to 75 meV, the resolution of the C 1s PE spectra was 125 meV, at h =350 eV. The STM measurements were performed at RT on the samples prepared in a separate chamber equipped with a commercial UHV STM (STM1 from Omicron GmbH), in the Division of Synchrotron Radiation, Institute of Physics, Lund University.
Figure 1 shows the C 1s photoelectron spectra of saturated oxidation of samples, i.e. no changes in the spectra were detected upon further oxidation. The spectrum from pristine HOPG can be fitted with just one peak (C1) at the binding energy (BE) of 284.42 eV, while at low and intermediate O coverage an additional peak (C2) develops at the BE of 286.22 eV (relative shift +1.8 eV). The detail C2 is assigned to the formation of epoxy groups on
C2
Complete oxidationC 1shν = 350 eV
(a) O/ HOPG
C1
(shifted 0.3 eV)
C3
(b) O/ MG/ Pt
C4
289 288 287 286 285 284 283 282
Binding energy (eV)
(c) O/ MG/ Ir
Figure 1. Impact of atomic oxygen on C 1s PE spectra from O-HOPG (a) and and O-MG on Pt(111) (b) and Ir(111) (c). All spectra correspond to saturated oxidation. The spectrum from HOPG is shifted by 0.3 eV to lower BE to facilitate the comparison.
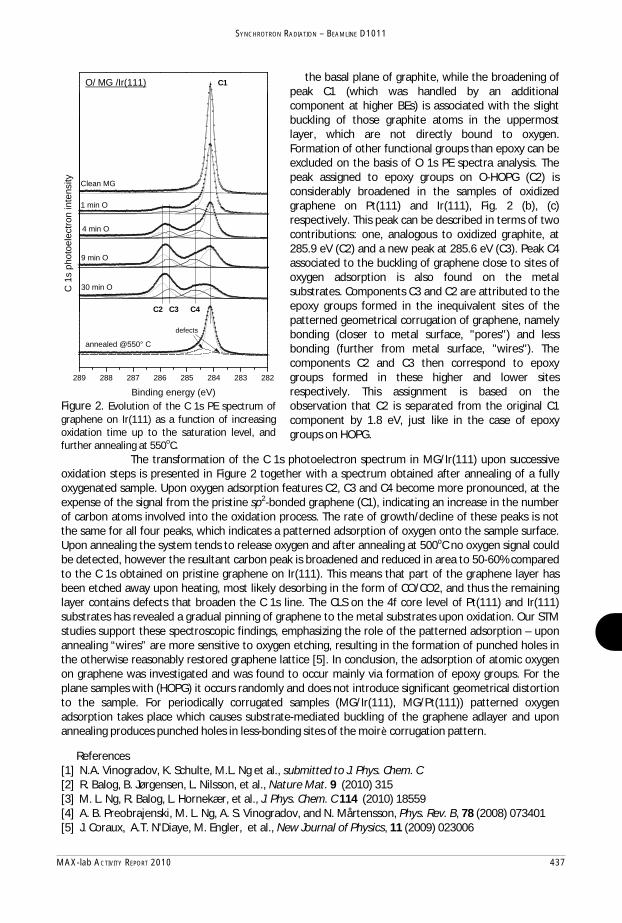
MAX-lab ACTIVITY REPORT 2010 437
SYNCHROTRON RADIATION – BEAMLINE D1011
the basal plane of graphite, while the broadening of peak C1 (which was handled by an additional component at higher BEs) is associated with the slight buckling of those graphite atoms in the uppermost layer, which are not directly bound to oxygen. Formation of other functional groups than epoxy can be excluded on the basis of O 1s PE spectra analysis. The peak assigned to epoxy groups on O-HOPG (C2) is considerably broadened in the samples of oxidized graphene on Pt(111) and Ir(111), Fig. 2 (b), (c) respectively. This peak can be described in terms of two contributions: one, analogous to oxidized graphite, at 285.9 eV (C2) and a new peak at 285.6 eV (C3). Peak C4 associated to the buckling of graphene close to sites of oxygen adsorption is also found on the metal substrates. Components C3 and C2 are attributed to the epoxy groups formed in the inequivalent sites of the patterned geometrical corrugation of graphene, namely bonding (closer to metal surface, "pores") and less bonding (further from metal surface, "wires"). The components C2 and C3 then correspond to epoxy groups formed in these higher and lower sites respectively. This assignment is based on the observation that C2 is separated from the original C1 component by 1.8 eV, just like in the case of epoxy groups on HOPG.
The transformation of the C 1s photoelectron spectrum in MG/Ir(111) upon successive oxidation steps is presented in Figure 2 together with a spectrum obtained after annealing of a fully oxygenated sample. Upon oxygen adsorption features C2, C3 and C4 become more pronounced, at the expense of the signal from the pristine sp2-bonded graphene (C1), indicating an increase in the number of carbon atoms involved into the oxidation process. The rate of growth/decline of these peaks is not the same for all four peaks, which indicates a patterned adsorption of oxygen onto the sample surface. Upon annealing the system tends to release oxygen and after annealing at 500oC no oxygen signal could be detected, however the resultant carbon peak is broadened and reduced in area to 50-60% compared to the C 1s obtained on pristine graphene on Ir(111). This means that part of the graphene layer has been etched away upon heating, most likely desorbing in the form of CO/CO2, and thus the remaining layer contains defects that broaden the C 1s line. The CLS on the 4f core level of Pt(111) and Ir(111) substrates has revealed a gradual pinning of graphene to the metal substrates upon oxidation. Our STM studies support these spectroscopic findings, emphasizing the role of the patterned adsorption – upon annealing “wires” are more sensitive to oxygen etching, resulting in the formation of punched holes in the otherwise reasonably restored graphene lattice [5]. In conclusion, the adsorption of atomic oxygen on graphene was investigated and was found to occur mainly via formation of epoxy groups. For the plane samples with (HOPG) it occurs randomly and does not introduce significant geometrical distortion to the sample. For periodically corrugated samples (MG/Ir(111), MG/Pt(111)) patterned oxygen adsorption takes place which causes substrate-mediated buckling of the graphene adlayer and upon annealing produces punched holes in less-bonding sites of the moir corrugation pattern.
References [1] N.A. Vinogradov, K. Schulte, M.L. Ng et al., submitted to J. Phys. Chem. C [2] R. Balog, B. Jørgensen, L. Nilsson, et al., Nature Mat. 9 (2010) 315 [3] M. L. Ng, R. Balog, L. Hornekær, et al., J. Phys. Chem. C 114 (2010) 18559 [4] A. B. Preobrajenski, M. L. Ng, A. S. Vinogradov, and N. Mårtensson, Phys. Rev. B, 78 (2008) 073401 [5] J. Coraux, A.T. N'Diaye, M. Engler, et al., New Journal of Physics, 11 (2009) 023006
Clean MG
O/ MG /Ir(111) C1
C4C3C2
1 min O
4 min O
C 1
s ph
otoe
lect
ron
inte
nsity
9 min O
30 min O
289 288 287 286 285 284 283 282
annealed @550° C
Binding energy (eV)
defects
Figure 2. Evolution of the C 1s PE spectrum of graphene on Ir(111) as a function of increasing oxidation time up to the saturation level, and further annealing at 550oC.

438 MAX-lab ACTIVITY REPORT 2010
SYNCHROTRON RADIATION – BEAMLINE D1011
N. A. Vinogradov1, 2, A. Zakharov2, May Ling Ng,1, 2 A. Mikkelsen3, E. Lundgren3, N. Mårtensson1, 2, and A. B. Preobrajenski2
1Department of Physics, Uppsala University, Box 530, 75121 Uppsala, Sweden
2MAX-lab, Lund University, Box 118, 22100 Lund, Sweden 3Division of Synchrotron Radiation, Institute of Physics,
Lund University, Box 118, 22100 Lund, Sweden
A detailed experimental study of growth and structure of the single layer hexagonal boron nitride (hBN) grown on the Fe(110) surface was performed by means of core level photoelectron spectroscopy (CLPES or CLS), near-edge x-ray adsorption fine structure (NEXAFS), low energy electron diffraction (LEED), low energy electron microscopy (LEEM) and scanning tunneling microscopy (STM) [1]. It was found that a monolayer of hBN forms on the Fe(110) surface a ribbed superstructure of strips lifted above the surface, “waves” and regions lying close to the surface, “grooves”. This structure arises from a strong interfacial interaction between iron substrate and hBN adlayer and the lattice mismatch between those in the certain direction, similarly to the “nanomesh” hBN/Rh(111) [2].
All spectroscopic measurements were carried out in situ at the beamline D1011. The surface of Fe(110) was prepared by epitaxial growth of iron films (thickness ca. 20 nm) on the surface of W(110) single crystal. The W(110) single crystal was cleaned by several cycles of Ar+-sputtering, annealing in oxygen atmosphere and subsequent flashing in the UHV. The cleanliness of the substrate was checked by
CLS and low energy electron diffraction (LEED). After deposition of iron the sample was gently annealed to improve the quality of the resultant Fe(110) surface, which was controlled by the LEED pattern [3,4]. hBN adlayer was grown by thermal cracking of vaporized borazine (B3N3H6) in contact with the hot metal surface at the temperature of ~750oC in the borazine partial pressure of 1×10 7 mbar, the quality of the sample was verified by CLS and LEED. All samples were characterized by CLS, NEXAFS and LEED. The N and B K-edge NEXAFS spectra were measured in the partial electron yield mode (retarding potential U = - 100 V). The photon energy resolution of the N 1s NEXAFS spectra was set to 125 meV, the resolution of the N 1s PE spectra was 150 meV, at h =470 eV. The LEEM measurements were performed in situ at the beamline I311. The STM measurements were performed at RT on the samples prepared in a separate chamber equipped with a commercial UHV STM (STM1 from Omicron GmbH), in the Department of Synchrotron Radiation, Institute of Physics, Lund University. Base pressure in the STM preparation chamber was better than 5×10 10 mbar and in the analytical chamber about 1×10 10 mbar.
Figure 1. NEXAFS N K-edge (a) and PE N 1s (b) spectra of hBN/Fe(110) . The same spectra of hBN/Rh(111) and hBN/Ni(111), the top and bottom curves on both figures, correspondingly are shown for comparison.
395 400 405 410 415
h-BN/Ni(111)
h-BN/Rh(111)
h-BN/Fe(110)
Photon energy, eV
N 1s XA spectraθ = 50o normal emission
A'A''A
"waves""grooves"
Part
ial e
lect
ron
yiel
d, a
.u.
(a)

MAX-lab ACTIVITY REPORT 2010 439
SYNCHROTRON RADIATION – BEAMLINE D1011
References 1. N.A. Vinogradov, M.L. Ng, A.Zakharov, et al., ECOSS 27 Book of abstracts, SDG-M2-119, 2010 2. M. Corso, W. Auwärter, M. Muntwiler et al., Science 303 (2004) 217 3. H. Bethge, D. Heur, Ch. Jensen, K. Reshört, U. Köhler, Surface Science 331 (1995) 878 4. J. Ko aczkiewicz and E. Bauer, Surface Science 450 (2000) 106 5. A. B. Preobrajenski, A. S. Vinogradov, May Ling Ng, et al., Phys. Rev. B, 75 (2007) 245412 6. A. B. Preobrajenski, A. S. Vinogradov and N. Mårtensson, J. El. Spec. Rel. Phen., 148 (2005) 59
The Figure 1 shows NEXAFS (a) and PE (b) spectra of nitrogen in hBN/Fe(110), compared to those of hBN/Rh(111) and hBN/Ni(111). The NEXAFS spectrum of N K-edge in the hBN/Fe(110) shows the two
bands, A and A” in the region of *-resonance. The A band is characteristic for the regions of an hBN adlayer lifted above the surface as seen in hBN/Rh(111) [5], and the A” band is attributed to the strong interfacial coupling of an hBN adlayer and the substrate similar to the case of hBN/Ni(111) [6]. Thus it is natural to suggest strong corrugation of a hBN monolayer on the iron surface i.e. co-existence of both lifted and down regions, i.e. “waves” and “grooves”. The LEEM studies in the dark field mode shown in the Figure 2, have revealed two major orientations of hBN domains, corresponding to the directions of lattice match between the hBN and Fe(110) lattices, namely [I I] and [ I I] directions. However due to the considerable misfit between surface W(110) and Fe(110) lattices the surface of epitaxial iron film might be stressed, which could lead to the formation of hBN domains slightly misoriented respectively to the major growth directions, or stretched/shrunk with respect to the lattice constant of the relaxed hBN film.
The STM studies confirm the suggested model of a single hBN layer corrugated in a wavy pattern. Figure 3 represents an STM image of hBN/Fe(110) sample which shows a wavy corrugation pattern. The mean corrugation of the adlayer i.e. the mean difference between highest and lowest point of the relief is ca. 1 Å, the period of structure is 2.6 nm.
In conclusion we report on a growth of hexagonal boron nitride on the Fe(110) surface. Due to the strong
interaction between Fe and h-BN and a lattice matching in only one direction of the surface unit cell, h-BN monolayer grows in the form of strongly corrugated one-dimensional waves in two domain orientations. The corrugation pattern of hBN/Fe(110) can make it a good template for the nanowire growth or self-assembling of linear structures.
Figure 2. An island of the hBN on the Fe(110) surface imaged with the dark field LEEM imaging mode, which allows discrete imaging of structures with different spatial orientations or different symmetry. Domains with two primary spatial orientation are shown. The field of view is 20 m, the scale bar is 2 m.
Figure 3. A typical STM image of hBN/Fe(110). The image size is 100x100nm, the scale bar is 19nm.

440 MAX-lab ACTIVITY REPORT 2010
SYNCHROTRON RADIATION – BEAMLINE D1011
×
References [1] J. B. Gustafsson, H. M. Zhang, E. Moons, and L. S. O. Johansson, Phys. Rev. B, in press. [2] J.B. Gustafsson, E. Moons, S.M. Widstrand, L.S.O. Johansson, Surf. Sci. 572, 23 (2004).
Electronic Structure of PTCDA on Pb/Si(111) 3× 3
H.M. Zhang and L.S.O. Johansson
Department of Physics, Karlstad University, SE-651 88 Karlstad, Sweden
×
Molecular systems that are interesting for molecular electronics applications have attracted an attention in the fields of the surface and solid-state physics. Recently, we have studied the electronic structure of PTCDA (3,4,9,10-perylene tetracarboxylic dianhydride) on the Ag/Si(111) 3× 3, Sn/Si(111) 3× 3, and Pb/Si(111) 3× 3 surfaces by near edge X-ray absorption fine structure (NEXAFS) and core-level photoelectron spectroscopy. Contrary to Ag/Si(111) 3× 3 [1], we found that PTCDA strongly interacts with the Sn/Si(111) 3× 3 surface. Because of the large interaction strength, the molecules no longer lie parallel to the substrate to form a layer-by-layer structure, as shown in the Ag/Si(111) 3× 3 case. Instead the PTCDA molecules grow in a random fashion and form low-ordered phases on the Sn/Si(111) ) 3× 3 substrate. However, on the other hand, we found that sub-monolayers (ML) of PTCDA weakly interact with the Pb/Si(111) 3× 3 surface and gradually cover the whole substrate with increasing PTCDA coverages. The molecules lie parallel to the substrate and form a self-assembled thin film. A deposition of 1.5 ML Pb on the Si(111)7×7, following by 340 °C annealing, resulted in a nice Pb/Si(111) 3× 3 surface, evidenced by a sharp 3× 3 LEED (low-energy electron diffraction) pattern. A series of coverages (0.3-10) of PTCDA were evaporated on the Pb/Si(111) 3× 3 surface at room temperature. As shown in Fig. 1, there is an interesting change in the LEED pattern just after 0.3 ML deposition of PTCDA. The LEED pattern shows a multiple ring-structure at a low electron energy. The ring-structure is quite common in the cases of PTCDA on Ag(111), Au (111), and Ag/Si(111) 3× 3. It originates from the herringbone phase of PTCDA molecules. Thus LEED patterns clearly points to a highly-ordered growth model. Only the ring-structure could be observed in LEED after 1 ML evaporation of PTCDA. Figure 2 shows high-resolution C K-edge NEXAFS spectra recorded from the 2 ML PTCDA on the Pb/Si(111) 3× 3 surface with three incidence angles. The Pb/Si(111) 3× 3 surface has a high coverage of Pb (1 ML), resulting in an incommensurate phase. This surface is very much different from the 1/3 ML 3× 3 phase with dangling bonds. The high-coverage Pb/Si(111) 3× 3 surface is quite inert. Under such interaction strength, one could expect that PTCDA molecules might grow into a layer-by-layer structure. Indeed, NEXAFS measurements from the normal, 40° and 70° incidence angles show clear spectral differences in the - and -resonance region. The -resonance peaks located between 283-290 eV are very strong at 70° incidence angle; while they decrease in intensity very much at 40°, and become very weak at the normal incidence angle. On the other hand, the -resonance peaks located between 290-300 eV remain almost the same at three different geometries. These findings clearly indicate that the -orbitals of PTCDA molecules are perpendicular to the surface. Thus PTCDA molecules are flat-lying on the surface, and form a thin film with layer-by-layer structure.

MAX-lab ACTIVITY REPORT 2010 441
SYNCHROTRON RADIATION – BEAMLINE D1011
Fig. 2 High-resolution C K-edge NEXAFS spectra recorded from the 2 ML PTCDA on the Pb/Si(111) 3× 3 surface with three incidence angles: 0°, 40°, and 70°.
(a) (b)
Fig. 1 LEED patterns of 0.3 ML PTCDA on the Pb/Si(111) 3× 3 surface at room temperature. (a) 35.7 eV; (b) 11.7 eV.
0°
40°
70°

442 MAX-lab ACTIVITY REPORT 2010
SYNCHROTRON RADIATION – BEAMLINE I1011
Hee Chang Jeon1, Tae Won Kang1, Dimitri Arvanitis2, Rajeev Ahuja2
1 Quantum-functional Semiconductor Research Center, Dongguk University, Seoul 100-715, Korea. 2 Department of Physics and Astronomy, Uppsala University, Box 516, SE-751 20 Uppsala, Sweden.
Recently, extensive efforts have been undertaken to increase the Curie temperature (Tc) of diluted magnetic semiconductor (DMS) materials due to their potential applications for many promising spintronic devices operating at high temperatures. As alternative DMS materials with high Tc, (Ga,Mn)N materials are of current interest because their Tc values can be as high as room temperature, based on theoretical calculations [1]. Theory predicts that the ferromagnetic properties observed in a (Ga,Mn)N material system depend on the occupancy of the Mn energy band in (Ga,Mn)N and the position of the Fermi level relative to this band. Carriers (holes) in the Mn energy band are needed to mediate the ferromagnetic interaction: the depletion and enhancement of the carrier concentration in the band will change the ferromagnetic properties of (Ga,Mn)N. GaN-based DMSs have attracted particular interest because the GaN host has been considered as a promising host material for DMS having high Tc based on theoretical predictions [2]. Although (Ga,Mn)N random alloy thin films were grown by molecular-beam epitaxy (MBE), a high concentration of Mn atoms cannot be incorporated into the GaN host because nitrogen defects and/or ferromagnetic precipitates are inevitably created in the crystals. Therefore, doping high concentration Mn into the GaN host without degrading its quality has been desired to realize Mn-doped GaN having a high Tc.
The samples with various composition of Mn to be used in this study are a multiple hetero-structure of GaN/(Ga,Mn)N of multi periods grown on the sapphire substrate with a GaN buffer layer by the rf-plasma assisted MBE [3]. The thickness of each (Ga,Mn)N layer and GaN layer is 5 and 15 nm, respectively. On top of it, a thin GaN capping layer (1 nm) is deposited to prevent oxidations of the top (Ga,Mn)N layer. An interesting and promising route to realize high Tc is to synthesize DMS embedded in two-dimensional hetero-structures by digital doping such as digital ferromagnetic hetero-structures (DFH) which consist of nonmagnetic semiconductor layers and highly doped thin magnetic semiconductor layers. This allows the doping of high concentration transition-metal ions into spatially localized regions in the semiconductor host without degrading its quality. We adopted the DFH technique to the growth of (Ga,Mn)N to enhance the local Mn concentration and reported that a considerable enhancement of magnetization and Tc was achieved compared with those of the (Ga,Mn)N random alloy.
The X-ray Absorption Spectroscopy (XAS) measurements were carried out in the electron yield mode measuring the photocurrent of the sample at BL I1011 of MAX-lab. For these first
Soft x-ray spectroscopy on (Ga,Mn)N/GaN digital ferromagnetic heterostructures: first results at MAX-lab

MAX-lab ACTIVITY REPORT 2010 443
SYNCHROTRON RADIATION – BEAMLINE I1011
[1] T. Dietl, H. Ohno, F. Matsukura, J. Cibert, and D. Ferrand, Science 287, 1019 (2000).
[2] H. C. Jeon, T. W. Kang, T. W. Kim, and Y. H. Cho, Solid State Commun., 138, 444 (2006).
[3] H. C. Jeon, T. W. Kang, and T. W. Kim, Solid State Commun., 132, 63 (2004).
experiments we focus on linearly polarized x-rays and attempt a characterization of sample stoichiometry and of the symmetry of electronic states probed by XAS. The samples exhibit as inserted in the Ultra High Vacuum chamber traces of surface contamination, which are removed by Ar ion sputtering. The typical spectra obtained at the N K-edge and the Mn L-edges are shown in Figure 1 (left). We observe the typical features of GaN in the N K-edge XAS spectra. Furthermore, the strong angle dependence obtained as the angle of polar incidence is varied testifies of a high degree of crystallinity for these samples. A strong XAS absorption signal is also obtained at the Mn L-edges. The observation of a strong Mn XAS signal testifies of the successful Mn incorporation within the GaN lattice. For the Mn XAS, in Figure 1 (right), we observe both typical multiplet features on the Mn L-edge white lines, as well as a high inter-peak intensity. Multiplet features are characteristic of the localized part for the final 3d states in XAS, a high inter-peak continuum also testifies of the existence of strong delocalized character as well. Theoretical calculations will allow us to interpret the XAS spectra and eventually assign these spectral features to specific locations of the Mn atoms with the DFH.
Figure 1. X-ray absorption spectroscopy spectra for (Ga,Mn)N/GaN digital ferromagnetic
heterostructures. Left: N K-edge data with linear x-rays. A strong angle dependent absorption intensity is
found, the difference spectrum between the two angles is also shown. Right: Mn L-edge spectra.
Interestingly, here no strong angle dependence is found.
This work is supported by the Swedish STINT Foundation, the Korean Research Council and the Swedish Research Council.

444 MAX-lab ACTIVITY REPORT 2010
SYNCHROTRON RADIATION – BEAMLINE I1011
Investigation of magnetism in a solid solution of two antiferromagnets: -Fe2O3 and FeTiO3
D. Choudhury1, R. Knut2, M. Bjorck3, O. Karis2, D. D. Sarma1
1 Indian Institute of Science, Bangalore, India; 2Uppsala University, Sweden; 3Maxlab, Lund University, Sweden.
There is a huge scientific and industrial interest in magnetic semiconductors with magnetic transition temperatures above room temperature. One way to achieve this is through doping of transition metal ions into traditional semiconductors, such as Mn doped in GaAs, however, this route has not met with success so far. One unconventional way of achieving this was realized in the solid solution of two antiferromagnets, -Fe2O3 and FeTiO3 [1], which were found to be strongly magnetic with high transition temperatures.
-Fe2O3 has a space group of R-3c and is an antiferromagnet with a high Neel temperature of 950 K, and FeTiO3 has a space group of R-3 and is an antiferromagnet with a Neel temperature of 55 K. The origin of magnetism is intriguing in this solid solution series. Magnetization of this solid solution series is supposedly dictated by the Fe ions, with the relative ratio of Fe2+ and Fe3+
expected to play a deciding role, however, there has been no systematic study to determine these relative ratios. Further, the role of Ti in the magnetization of this solid solution series cannot be ruled out, especially with the recent observation of Ti XMCD in FeTiO3, arising from the presence of Ti3+ in FeTiO3 [2].
We have performed detailed x-ray absorption spectroscopic (XAS) studies and x-ray magnetic circular dichroism (XMCD) studies under an applied magnetic field of 0.3 Tesla on carefully prepared single phase samples of solid solution members of (x) Fe2O3 – (1-x) FeTiO3 series with x = 0, 0.05, 0.2, 0.3, 0,5, 0.7, 1at the I1011 beamline in MAXLAB, Sweden. The Fe L2,3 XAS line-shapes are very characteristic of the valency of Fe ions, with Fe L3 exhibiting a shoulder to the left for Fe3+ ions and having a shoulder to the right for Fe2+ ions, and thus can be used to characterize the Fe valencies very effectively. We find a gradual evolution of Fe ion valencies from (2+) to (3+) as a function of x across the solid solution series, as shown in Fig. 1. We also find Ti ions to remain as Ti4+
throughout the solid solution series, as shown in Fig. 2. One of the characteristic XMCD spectra at the Ti L2,3 edge is shown in Fig. 3 for two circularly polarized photon beams + and - and clearly shows the absence of any Ti related XMCD,

MAX-lab ACTIVITY REPORT 2010 445
SYNCHROTRON RADIATION – BEAMLINE I1011
thus clearly establishing that magnetism in this solid solution series is only mediated by Fe ions. Further, we observe a clear XMCD at the Fe L2,3 XAS edge, shown in Fig. 4 for x=0.30, thus providing a direct evidence of the role of Fe in magnetization in this solid solution series [3].
Fig. 1 Fig.2
Fig. 3 Fig. 4
References:
[1] Y. Ishikawa et al. J. Phys. Soc. Japan 12, 1083 (1957); [2] T. Fujii et al. J. Mag. Magnetic Mater. 310, e555 (2007) ; [3] Ph.D thesis of D. Choudhury, Department of Physics, Indian Institute of Science, 2010.
710 720 730
705 710 715 720
L3 edgeFe3+Fe2+
Inte
nsity
Photon Energy (eV)
Fe L2,3 XMCD
Inte
nsity
Photon Energy (eV)
+
-
460 465 470
Ti 2p XMCD
Inte
nsity
Photon Energy (eV)
+
-
715 720 725 730 735 740
L2L3Fe L2,3 XAS
x = 1.0
x = 0.7
x = 0.5
x = 0.3
x = 0.2
x = 0.05
x = 0.0
Inte
nsity
Photon Energy (eV)465 470 475
Ti L2,3 XAS x = 0.70
x = 0.30
x = 0.20
x = 0.0In
tens
ity
Photon Energy (eV)

446 MAX-lab ACTIVITY REPORT 2010
SYNCHROTRON RADIATION – BEAMLINE I1011
Probing the proposed half-metallic antiferromagnetism in LaSrVMoO6
Somnath Jana,1 Vijay Singh,2 S. D. Kaushik,3 Carlo Meneghini,4 Prabir Pal,5 Ronny Knut,5 Olof Karis,5
Indra Dasgupta,1,2 Vasudeva Siruguri,3 and Sugata Ray1,6
1Centre for Advanced Materials, Indian Association for the Cultivation of Science, Jadavpur, Kolkata 700 032, India 2Solid State Physics, Indian Association for the Cultivation of Science, Jadavpur, Kolkata 700 032, India 3UGC-DAE-Consortium for Scientific Research Mumbai Centre, R5 Shed, Bhabha Atomic Research Centre, Mumbai 400085, India 4Dipartimento di Fisica, Universitá di “Roma Tre,” Via della vasca navale 84, I-00146 Roma, Italy 5Department of Physics and Astronomy, Uppsala University, SE-75121 Uppsala, Sweden 6Department of Materials Science, Indian Association for the Cultivation of Science, Jadavpur, Kolkata 700 032, India
Half-metallic antiferromagnets (HMAFM) proposed by van Leuken and de Groot, have attracted enormous attention in recent times as they offer an unique possibility of realizing an exotic state that has large degree of spin polarization of conduction electrons but vanishing macroscopic magnetic moment. Unlike a conventional antiferromagnet, in a HMAFM the nullification of magnetic moment occurs between the antiparallel spins of same magnitude, residing on different ions of distinct symmetry, and as a result a perceptible exchange splitting between the up- and down-spin channels is observed. Due to this unusual situation, HMAFM materials are also sometime termed as “compensated half-metals.” However, existence of a true HMAFM appeared elusive until Uehara et al.1 proposed the curious case of LaSrVMoO6 (LSVMO). LSVMO has been suggested to be a HMAFM system by considering antiparallel alignment of alternately occupied V3+(3d2) and Mo4+ (4d2) spins at the B site of the perovskite structure. Although ab-initio calculations always predicted LSVMO to be a half-metallic ferrimagnet, based on the magnetic and transport measurements, it was claimed that the system can indeed become HMAFM for a perfectly B-site ordered state.2 Our samples showed identical magnetic and electrical transport behaviours, as can be seen in Figure 1.3 Following this we have attempted to check the proposed half-metallic antiferromagnetic behaviour of the sample using neutron powder diffraction (NPD), x-ray absorption (XAS), and x-ray magnetic circular dichroism (XMCD) measurements. As is seen from the magnetization measurements, there is a weak peak at around 125 K, which was identified as a clear antiferromagnetic transition in earlier works.1,2 However, in our 300 K and 2 K NPD
measurements, no indication of any
antiferromagnetic ordering was obtained. Further, in order to understand the
‘half-metallicity’ of the compound better, XAS and
XMCD measurements
have been

MAX-lab ACTIVITY REPORT 2010 447
SYNCHROTRON RADIATION – BEAMLINE I1011
performed on LSVMO. XAS of V L and O K-edges collected at room temperature with finer structures, clearly establishes that vanadium is in 3+ oxidation state. The Mo M-edge XAS spectrum is featureless and does not provide useful information
regarding the Mo charge state. Now, for a true HMAFM state in
LSVMO, compensation of spin moments could only be realized by considering AFM coupling between ferromagnetic V3+ and ferromagnetic Mo4+ sublattices,
and therefore, clear XMCD signal from the polarized V L-edge spectra can be expected. But surprisingly, no XMCD signal at vanadium L edge with reverse polarizations at 100 K with a field of 0.3 Tesla was observed (see Fig. 2). This observation is in accord with the disordered structure and clearly refutes the HMAFM model proposed for a perfectly ordered structure. In order to achieve insight about the local chemical structure, which might be critical, XAFS measurements were performed on LSVMO. However, the XAFS results revealed an unusual segregation of every Mo (V) ion toward another Mo (V) ion as
�the nearest neighbor and toward Sr (La) ion as its next-nearest neighbor. Thus, a picture of an intrinsic chemical fluctuation within very small spatial domains, giving rise to very local LaVO3 and SrMoO3-like regions could be evoked in this case, which along with ab initio calculations based on this chemically inhomogeneous structure succeeded to explain all the unusual electronic and magnetic properties of this compound. Reference:
1. M. Uehara, M. Yamada, and Y. Kimishima, Solid State Commun. 129, 385 (2004).
2. H. Gotoh, Y. Takeda, H. Asano, J. Zhong, A. Rajanikanth, and K. Hono, Appl. Phys. Express 2, 013001 (2009).
3. Somnath Jana, Vijay Singh, S. D. Kaushik, Carlo Meneghini, Prabir Pal, Ronny Knut, Olof Karis, Indra Dasgupta, Vasudeva Siruguri, and Sugata Ray, Phys. Rev. B: Rapid Comm. 82, 180407(R) (2010).

448 MAX-lab ACTIVITY REPORT 2010
SYNCHROTRON RADIATION – BEAMLINE I1011
Structural and magnetic characterization of Co2MnGe/Rh2CuSn Heusler multilayers
R. Knut,1 O. Mryasov,2 M. Bjorck,3 P. Warnicke,4 D. Arena,4
M. Wikberg,5 R. Bejhed,5 P. Svedlindh,5 and O. Karis1
1Department of Physics and Astronomy, Uppsala University, Box 516, SE-751 20 Uppsala, Sweden2MINT Center, University of Alabama, Tuscaloosa, AL, USA3Lund University, MAX-lab, Box 118, 221 00 Lund, Sweden
4NSLS, Brookhaven National Lab, Upton, NY, USA5Department of Engineering Sciences, Uppsala University, Box 534, SE-75121, Uppsala, Sweden
It is well known that the performance of electroniccomponents has increased rapidly during the last fourdecades. The exponential increase in computationalpower is described by Moore’s law. The basic schemeis to decrease the size of electronic components in or-der the enhance the performance. While this has beenvery successful in the past, we are now approachingthe atomic scale in device engineering, which couldseverely limit the possibility for further increase inperformance. Within magnetic read heads technol-ogy several changes has occurred during the last 15years, the first anisotropic magnetoresistance (AMR)read heads were surpassed by giant magnetoresistance(GMR) in 1996 after which tunneling magnetoresis-tance (TMR) took over the after 2005. The TMRstructure used today has an MgO tunnel barrier whichis about 1 nm thick and further substantial decreaseis not realistic. It has been suggested that current-perpendicular-to-plane (CPP) GMR structures, as op-posed to current-in-plane (CIP) used in the first gener-ation GMR, are candidates to become the next type ofmagnetoresistance (MR) sensors.
Half metallic ferromagnets1 which have a 100% spinpolarized conduction band have been suggested for re-alizing high performance CPP-GMR where Heuslercompounds have shown to be strong candidates.2,3
The Co based compounds are of especial interest dueto their high Curie temperatures. Full-Heuslers arewell ordered ternary compounds with the compositionX2YZwhere, in the case of an half metallic compound,X and Y are two different transition metal atoms. Spinvalve structures composed of Co2MnGe (CMG) andvarious non-magnetic layer has been reported whereMR values of 3.6% at room temperature have beenachieved4. The half metallic character has been theo-retically predicted for perfect crystals while for realis-tic compounds a certain amount of disorder is expectedwhich are detrimental for the high spin polarization5.Ambrose and Mryasov6,7 proposed a combination offerromagnetic (FM) and non-magnetic (NM) Heusleralloys to maximize the spin asymmetry at the FM/NMinterface, giving a high spin polarization even if a per-fect half metallic character is not obtained. Nikolaevet al.8 constructed an all Heusler CPP-GMR structureaccording to this scheme using Rh2CuSn (RCS) as theNM layer and CMG as the FM layer. An MR of 6.7%at RT was achieved which is higher than what has been
TABLE I: Samples annotation according to the ratiobetween thickness of CMG and RCS layers.
Annotation CMG (A) RCS (A) x (repetitions)
S0.66 12 18 16S1 18 18 13
S1.33 24 18 11S1.5 18 12 16
reported for transition metal CPP-GMR but lower thanfor TMR structures which might be an effect of inter-mixing at the NM/FM interface, a few percent of Cu,Rh or Sn can severely lower the spin polarization inCMG.5
We have studied the Heusler compound Co2MnGe(CMG) as the magnetic layer between non-magneticlayers of the full Heusler Rh2CuSn (RCS) in a mul-tilayer structure. The samples were grown usinga commercial magnetron sputtering system (CanonAnelva C7100). The aim of this study is to under-stand the effects of annealing and its dependence onlayer thicknesses. The magnetic properties and inparticular the quality of the interfaces are studied us-ing x-ray magnetic circular dichroism (XMCD). Wehave also conducted experiments using x-ray resonantmagnetic scattering (XRMS) and ferromagnetic res-onance (FMR), these results will be presented else-where. The XMCD experiments were performed atbeamline I1011 using total electron yield with 90% cir-cularly polarized light, incident on the sample at anangle of 45◦. The samples were magnetized in-planewith a magnetic field of 630 Oe, which is far abovethe coercive field of these samples, after which theywere measured in remanence at room temperature. Thedichroic difference was obtained after measuring theCo and Mn L2,3 edges with both left and right circu-larly polarized light. The samples are presented in Ta-ble I and are denoted according to the ratio betweentheir CMG and RCS thicknesses. The number of layerrepeats (x) is varied so that the total thickness is ap-proximately equal. The samples were heated up be-tween room temperature (RT) and 400◦ C, after whichthey were cooled down to RT before the measurementswere performed.
In Fig. 1 we show the dichroic difference obtainedat Co L3 for sample S1.5 which has the highest ratio of

MAX-lab ACTIVITY REPORT 2010 449
SYNCHROTRON RADIATION – BEAMLINE I1011
FIG. 1: XMCD difference spectra of Co L3 obtained afterannealing at various temperatures. The vertical lines
corresponds to the energies plotted in Fig. 2.
CMG. A shift in the peak position is observed wheretwo peak energies appears to have the strongest inten-sities, shown by dashed vertical lines. A similar shiftis not found for the Mn L3 edge. The two sampleswith the smallest ratio of CMG, S0.66 and S1, have noremanence at RT after annealing to 310◦C as evidentfrom Fig. 2. In Fig. 2, we have plotted the magnitudeof the dichroic difference at two energies (marked withvertical dashed lines in Fig. 1) at the Co L3 edge andalso difference at the Mn L3. The Co intensities (leftaxis) are shifted by 0.3 between samples for clarity andthe Mn (right axis) is shifted by 0.45. It is readily seenthat the Mn intensity follows the Co 777.4 eV inten-sity which would suggest that this peak corresponds tothe bulk of the CMG layers. The intensity at this en-ergy for sample S1.33, which has the thickest CMGlayer, is 57% larger than for sample S0.66, which hasthe thinnest CMG layer. Sample S1 is intermediate be-tween S1.33 and S0.66. Note that all three sampleshave 18 A RCS. This discrepancy can be explained bya 6 - 8 A magnetically dead layer in the CMG. SampleS1.5 which has a thinner RCS (12 A) appears to have1 nm thicker magnetically dead layer. This is well inaccordance with XPS data recorded at several keV ki-netic energy (not shown) which show a clear increaseof intermixing of the RCS layer as it becomes thinner.Also, a sample with CMG(6 A)/RCS(18 A) showed no
dichroism by XMCD. In the overview spectra of allsamples (not shown) it is observed that the Co and Mnintensities increase compared to the Cu lines for an-nealing temperatures of 310◦ C and higher, which in-dicates a migration of Co and Mn to the surface. Thiseffect occurs at a surprisingly low temperature and itis confirmed by XRMS where the multilayer structureis practically destroyed after annealing to 400◦C. Thismakes it difficult to analyze the Co component at 776.6eV after annealing at high temperatures. After anneal-ing to 250◦ C this component increases for the sam-ples which become non-magnetic while decreases for
FIG. 2: Dichroic difference of both Co (left) and Mn(right). The intensities are obtained at the energies indicated
by the vertical dashed lines in Fig. 1.
the other two. This could be due to a partially inter-mixed region near the interfaces where the Co is stillferromagnetically ordered.
1 R. A. de Groot et al., Phys. Rev. Lett. 50, 2024 (1983).2 M. I. Katsnelson et al., Rev. Mod. Phys. 80, 2315 (2008).3 S. Picozzi et al., Phys. Rev. B 66, 094421 (2002).4 K. Aoshima et al., J. Magn. Magn. Mater. 310, 2018(2007).
5 M. Carey et al., Phys. Rev. Lett. 85, 4442 (2004).6 T. Ambrose and O. Mryasov, U.S. Patent No. 6,876,522 (5April 2005).
7 T. Ambrose and O. Mryasov, Half-Metallic Alloys: Fun-damentals and Applications, Lecture Notes in Physics,Vol.676, edited by Galanakis and P. Dederichs, Springer,Berlin-New York (2005).
8 K. Nikolaev, P. Kolbo, T. Pokhil, X. Peng, Y. Chen, T. Am-brose and O. Mryasov, Appl. Phys. Lett. 94 222501 (2009).

450 MAX-lab ACTIVITY REPORT 2010
SYNCHROTRON RADIATION – BEAMLINE I1011

MAX-lab ACTIVITY REPORT 2010 451
SYNCHROTRON RADIATION – BEAMLINE I1011

452 MAX-lab ACTIVITY REPORT 2010
SYNCHROTRON RADIATION – BEAMLINE I1011
Linear x-ray dichroism at BL I1011: first results on bcc Fe
I.A. Kowalik1, F. Luque2, D. Arvanitis3
1 Inst. of Physics, Polish Academy of Sciences, Al Lotnikow 32/46, 02-668 Warszawa, Poland 2 Laboratorio de Superficies, Dpto. Física de la Materia Condensada, C-III, Universidad
Autónoma de Madrid, 28049, Madrid, Spain 3 Dept. of Physics and Astronomy, Uppsala University, Box 516, 75120 Uppsala, Sweden
An element specific characterization of the magnetic properties is often based on X-
ray Magnetic Circular Dichroism (XMCD) spectroscopy in the x-ray absorption mode. Using XMCD one obtains an element specific measure of the spin and orbital moment on a per atom basis. At MAX-lab routine XMCD work has been possible since the late 1990’s at the BL D1011 of MAX II using out of plane bending magnet radiation delivering sufficient circular x-ray flux in the soft x-ray range, in combination with a plane grating monochromator based beamline. Recently at the new BL I1011 it has been possible to perform XMCD experiments on a variety of systems both concentrated as well as dilute. This beam line uses a different concept, the x-ray source is an Elliptically Polarizing Undulator (EPU) which produces bright circular x-rays of variable helicity. [1] Here still a plane grating monochromator is used. [1] One advantage of using an EPU instead of out of plane bending magnet radiation is a better control of the x-ray polarization state. The EPU produces both σ(+) and σ(-) x-rays of a high degree of circular polarization. In the soft x-ray range of interest here, between 0.5 and 1 keV to cover the L-edges of the 3d transition metals, given the energy of the stored electron beam at the MAX II storage ring, the third harmonic is used, reaching a degree of circular polarization of order 80-90%. [1]
Furthermore, using the EPU as an x-ray source allows for still a different type of
experiment, for which we present here first results. The EPU allows the user to produce linearly polarized x-rays with a variable polarization plane. Here we use linearly polarized x-rays in the plane of the storage ring and perpendicular to it. By comparing the x-ray absorption upon rotation of the electric field plane, by keeping the magnetic geometry of the sample fixed one can perform X-ray Linear Magnetic Dichroism (XLMD) experiments.
0.4
0.2
0.0
-0.2
No
rm. D
ich
roic
Dif
f. (
arb
.u.)
760750740730720710700690Photon Energy ( eV )
15
10
5
0
-5
Ph
oto
Cu
rren
t ( arb
.u.)XLMD difference
dichroic pair
bcc Fe filmFe L3,2 edge
1.5
1.0
0.5
0.0
-0.5
No
rm. D
ich
roic
Dif
f. (
arb
.u.)
760750740730720710700690Photon Energy ( eV )
4
3
2
1
0
-1
Ph
oto
Cu
rren
t ( arb
.u.)
XMCD difference
dichroic pair
bcc Fe filmFe L3,2 edge
Figure 1. Dichroic pair obtained for Fe L3,2 edge for bcc Fe film (right axis). Here linear light is used, the sample photocurrent is measured. The sample is at normal x-ray incidence, the electric field is rotated to be parallel and perpendicular to the magnetization. The XMLD difference (left axis) is normalized to the edge jump ratio for a comparison with the literature.
Figure 2. Dichroic pair obtained for Fe L3,2 edge for bcc Fe film (right axis). Here circular light is used, with an angle of x-ray incidence of 45 degrees. The sample photocurrent is measured. The XMCD difference is plotted versus the left axis and the original spectra are plotted versus the right axis.

MAX-lab ACTIVITY REPORT 2010 453
SYNCHROTRON RADIATION – BEAMLINE I1011
XLMD effects in the x-ray absorption mode are much smaller which makes them much harder to measure. Earlier studies of this small effect in x-ray absorption often settled for the geometry at normal incidence for the sample and rotated the sample magnetization by keeping the electric field fixed. [2] Using this geometry for bulk Fe the normalized XLMD effect was found to be of order 8% for bcc Fe as compared to the XMCD effect which was found of order of 150%. [2] Despite its small intensity, the XLMD effect is worth measuring, as it is non-zero for anti-ferromagnets, scaling with the square of the magnetization. In comparison, XMCD scales linearly versus the sample magnetization and vanishes for an anti-ferromagnet. For ferromagnetic systems, it has furthermore been suggested that the XLMD signal also allows one to measure the orbital moment anisotropy. [3,4]
Here we focus on data taken on a bcc Fe film, sputtered in situ to remove surface contamination. The data of Figure 1, following earlier work in the literature, show that also at BL I1011, it is possible to obtain a non zero XLMD difference for a bcc Fe standard. To make sure that the small XLMD signal is not an artifact we fixed, as suggested earlier, the sample geometry at normal incidence and rotated both the sample magnetization as well as the plane of linear polarization using the EPU. One obtains in such a manner four spectra to compare in pairs and determine eventual experimental artifacts. Such a combination of experimental parameters is not easily obtainable using bending magnet radiation. In Figure 2 we show on the same sample an XMCD pair and the associated difference. Also here, four pairs of spectra at least were obtained, reverting both the magnetization and the light helicity by means of the EPU x-ray source. From the XMCD difference, in Figure 2, using the spin sum rule, a degree of circular polarization of 0.90(5) is obtained.
To allow for a comparison with the available literature data on Fe, we have normalized the XLMD difference by means of the high energy signal to background (the spectrum edge jump). We observe that the maximum XLMD difference is about 15 times less than the maximum XMCD difference once normalized to the spectrum edge jump. In the literature for Fe the correspondent figure is about 18 as given earlier [2]. Given the fact that this estimate is qualitative and does not take into account the differences in degrees of helicity or linear polarization between the present setup and literature values the agreement can be judged as satisfactory. The spectral shape of the XLMD difference obtained is not exactly the same as the one published earlier [2], however the literature data refer to Fe in multilayer structures which does not have the same local atom environment as the bcc Fe sample investigated here, so that differences in the spectral shape can be expected, as the local distortions will affect the XLMD signal [3,4].
In conclusion, we demonstrate here the possibility to measure the XLMD of bcc Fe. The small XLMD signal exploits fully the possibilities offered by the EPU at I1011 and allows for investigations also in anti ferromagnets. This work is supported by the Swedish STINT Foundation, the ELISA FP7 EC contract for access to Research Infrastructures, and the Swedish Research Council.
[1] I. A. Kowalik, G. Öhrwall, B. N. Jensen, R. Sankari, E. Wallén, U. Johansson, O. Karis, D. Arvanitis, Journal of Physics Conf. Series, 211, [2] M. M. Schwickert, G. Y. Guo. M. A. Tomaz, W. L. O’ Brian, G. R. Harp, Phys. Rev. B 58, R4290 (1998) [3] Gerrit van der Laan, Phys. Rev. Lett. 82, 640(1999) [4] S. S. Dhesi, G. van der Laan, E. Dudzik, App. Phys. Lett. 80, 1613 (2002)

454 MAX-lab ACTIVITY REPORT 2010
SYNCHROTRON RADIATION – BEAMLINE I1011
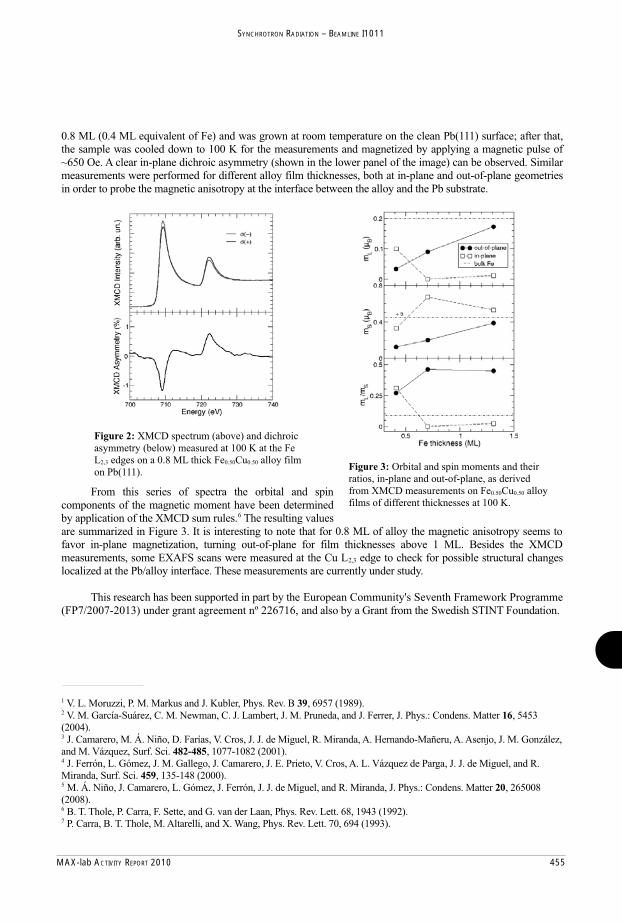
MAX-lab ACTIVITY REPORT 2010 455
SYNCHROTRON RADIATION – BEAMLINE I1011

456 MAX-lab ACTIVITY REPORT 2010
SYNCHROTRON RADIATION – BEAMLINE I1011
Time resolved XMCD combined with FMR study on a Fe20Ni80 single lm
Peter Warnicke1, Olof Karis2, Ronny Knut2, Matts Björck3, Dario Arena1
1 Brookhaven National Laboratory, Upton NY 11973, US2 Department of Physics and Astronomy, Uppsala University, Sweden
3 MAX-lab, Lund University, Sweden
INTRODUCTIONSpin dynamics in magnetic materials plays an increasingly important role in the study of spintronic devices [1]. Ferromagnetic resonance (FMR) has been employed for several decades to investigate important fundamental phenomena in magnetism such as gyromagnetic ratios, damping, relaxation, and anisotropy energies. In modern magnetic materials, e.g. magnetic thin lms and multilayers, this method has been developed to study collective spin reorientation transitions and interlayer coupling. FMR provides information on the dynamical properties of a material. Complimentary information can be obtained by X-ray magnetic circular dichroism (XMCD), a core-level spectroscopic technique that provides information on the chemical constituents. Stroboscopic probing of the magnetization using XMCD gives access to the time domain and by combining this with FMR a versatile technique has been obtained that allows time resolved measurements on the forced magnetization precession in a Permalloy thin lm with element speci city.
METHODSA 20 nm lm of polycrystalline Permalloy was deposited onto 100 nm thick SiN membrane supported by a 0.5 mm thick Si frame. The frame is adhered to a coplanar waveguide (CPW). The CPW is made of Au-plated laminate with a 0.500 mm wide conductor for the RF-signal and a clearance hole of 0.250 mm in the center conductor. The CPW is designed with a shorted end, allowing for measurements of the re ected RF-signals.This study was carried out at MAX-II, MAX-Lab, at the soft x-ray beam line I1011. The beam line is equipped with an octupole magnet end-station designed to generate elds up to approximately 1 T in arbitrary directions. The time resolved measurements rely on harmonic generation of microwaves that are phase locked to the electron bunches of the synchrotron ring. The timing is controlled by passing signals from the bunch clock through a delay generator. A comb generator generates a harmonic spectrum of the 100 MHz input signal and a sequentially connected tunable band pass lter (BPF) is used to select a suitable harmonic. This output signal is ampli ed and passed through a directional coupler, which directs the signal to co-planar waveguide onto which the sample is mounted. The re ected signal is passed to an RF diode for conventional FMR measurements. The harmonic microwaves are used to excite the precession of the magnetization in the sample. X-rays are transmitted through the sample as well as the tailored membrane and detected by photodiodes. The octupole vector electromagnets produce a bias eld HA, oriented orthogonal to both the driving eld Hdriv and the incident light.
RESULTSA phase locked RF signal with frequency of 1.1 GHz was used to excite magnetic precession in the Permalloy sample. Figure 1 (top) shows in-situ FMR. A magnetic bias eld was scanned between 0 and 1 A (horizontal axis) and the re ected differential response from the sample was measured (vertical axis). A clear resonance is indicated by the zero crossing about 0.35 A. This zero crossing increases linearly with the square of the frequency. The bottom part shows a single time-resolved measurement at the resonance point, using x-rays at the Fe L3 edge. Oscillations are observed, with a period of 910 ps. Despite the fact that the beam line was not fully operational due to misalignment

MAX-lab ACTIVITY REPORT 2010 457
SYNCHROTRON RADIATION – BEAMLINE I1011
[1] S.A. Wolf, D.D. Awschalom, R.A. Buhrman et al., Science 294, 1488 (2001).
during our rst dynamic measurement, we were still able to use the bunch clock of the synchrotron ring to generate a phase locked RF-signal to drive precession of the spins in a Permalloy lm.
FIGURE 1: (Top) Conventional FMR measurement, performed in-situ at the i1011 beamline, MAX-Lab on a Permalloy thin lm, 20 nm thick deposited on a SiN membrane. The excitation frequency is 1.1 GHz and phase locked to the synchrotron bunch clock. The graph shows the differential re ectivity response of the RF-signal (vertical axis) as a function of applied current to the electromagnet (horizontal axis). The resonance can be found at the zero-crossing, occurring at about 0.35 A. (Bottom) A time resolved scan showing the intensity of the transmitted photons at the Fe L3 edge (vertical axis) versus the time delay.
-2
-1
0
1
2
Lock
-in s
igna
l (ar
b. u
nits
)
1.00.80.60.40.20.0
Field (arb. units)
6
4
2
0
-2
-4
-6
Mx
(arb
. uni
ts)
543210
Time delay (ns)
Measured Fit

458 MAX-lab ACTIVITY REPORT 2010
SYNCHROTRON RADIATION – BEAMLINE I1011
770 780 790 800 8100
2
4
6
8
10
12
Inte
nsity
in a
rb.u
.
Energy in eV
sum curve for 6 ML Co
Co L3
Ba M5
Co L2
Ba M4
Figure 1: Raw XAS at the Co L2,3-edges and the Ba M4,5-edges for 6 ML Co on BaTiO3(001).
Investigation of Magnetic Properties of the Multiferroic Layer System Cobalt on Bariumtitanate
M. Welke1, R. K. Govind2, M. Trautmann2, V. H. Babu1, K.-M. Schindler2, R.
Denecke1
1 Wilhelm-Ostwald-Institut für Physikalische und Theoretische Chemie, Universität Leipzig, Linnéstr.2, 04103 Leipzig, Germany
2 Institut für Physik, Martin-Luther-Universität Halle-Wittenberg,
Von-Danckelmann-Platz 3, 06120 Halle, Germany
Systems with multiferroic properties are of interest for research since the 1960s. [1]
In the beginning single phase multiferroics were in the focus of research, whereas nowadays systems with a ferroelectric and a ferromagnetic component are investigated. [2] The work reported here covers the layer system Cobalt on Bariumtitanate (001) within SFB 762. In particular, XAS measurements of 3, 6, 9, 12, and 21 monolayer thick Co films prepared by e-beam evaporation were taken into account. The films show in-plane magnetization starting from 6 ML.
At the Co L-edge X-ray magnetic circular dichroism (XMCD) experiments had been performed at beamline I1011 at MAX II to determine the magnetic properties.
In Fig. 1 we show a raw sum spectrum of 6 monolayers Cobalt on Bariumtitanate. It becomes obvious that the calculation of the magnetic properties applying the sum
rules cannot be perfomed easily by using the integral of the sum curve since there is a great influence of the Barium. In Fig. 2 the difference curve for the same system resulting from measurements with opposite helicity is shown. In this signal there is no influence of the Barium peak leaving the opportunity to integrate it directly for the calculation of the magnetic
moments.

MAX-lab ACTIVITY REPORT 2010 459
SYNCHROTRON RADIATION – BEAMLINE I1011
[1] M. R. Koblischka, Physik in unserer Zeit 40 132 (2009).
[2] H. Zheng et al., Science 303 661 (2004).
[3] Eriksson et al., Phys. Rev. B 42 2707 (1990).
[4] Guo et al., Phys. Rev. B 50 3861 (1994).
[5] W. Kuch et al., J. App. Phys. 87 119 (2000).
[6] P. Gambardella et al., Phys. Rev. Lett. 88 047202 (2002).
Figure 2: Difference curve for 6 ML Co on BaTiO3(001).
In order to resolve the problem with the sum spectrum the thickest film of Cobalt was used as starting point. There is no Barium signal anymore so that this spectrum can be used in a scaling procedure. The sum curve of the 21 monolayers is normalized to the intensity of the sum curve at the certain film thicknesses and integrated after subtracting a step background. In Fig. 3 the quality of this scaling procedure is shown.
After the described steps it was possible to calculate the magnetic moments. These calculations gave total magnetic moments in the range of known values for Co (hcp) bulk reported in literature, which are around 1,63 μB to 1,78 μB. [3], [4]
However, there are increased angular magnetic moments for all observed film thicknesses. In literature, there are several cases – even for other elements – where this increase is observed in thin films. [5], [6]
Changes to the Bariumtitanate substrate by heating in vacuum up to 600 °C prior to Co deposition, resulting in O vacancies and increased conductivity, do not yield significant differences for themagnetic moments.
770 780 790 800 810
-6
-5
-4
-3
-2
-1
0
1
2
Diff
eren
ce in
arb
.u.
Energy in eV
difference curve for 6 ML Co
770 780 790 800 810
0
2
4
6
8
10
Inte
nsity
in a
rb.u
.
Energy in eV
sum curve for 6 ML Co scaled sum curve of 21 ML Co
Figure 3: Sum curve for 6 ML Co and scaled sum curve for 21 ML Co on BaTiO3(001) to demonstrate the vaildity of the scaling procedure.

460 MAX-lab ACTIVITY REPORT 2010
SYNCHROTRON RADIATION – BEAMLINE I1011
XMCD studies of the MnSb inclusions formed in GaSb matrix
A. Wolska1, K. Lawniczak-Jablonska1, M.T. Klepka1, J. Sadowski1,2
1Institute of Physics PAS, al. Lotników 32/46, 02-668, Warsaw, Poland 2Lund University, MAX-Lab, Lund SE-221 00, Sweden
In the pursuit of novel ferromagnetic materials, which can be used in spintronic devices, heterostructures created by introducing ferromagnetic inclusions in a semiconductor matrix became promising. In this kind of material, small ferromagnetic nanoparticles are immersed in the semiconductor host lattice providing a built-in local magnetic field. Main advantage of MnSb as a material to form such precipitations is its high Curie temperature (TC). For the Mn1-xSbx layers grown on GaAs substrate a TC can reach 620 K [1]. What's more, studies on the MBE grown thin layers showed that already in pure material MnSb does not form smooth surface but tends to form big islands or columns [2]. This leads to the other advantage which is possibility to form the hexagonal MnSb precipitates directly during the MBE process without subsequent annealing.
The MnSb hexagonal
inclusions were formed directly during the epitaxial growth procedure without the post growth annealing. The GaSb(100) and GaAs(111)A substrates were used for the MBE growth of the GaSb:MnSb layers. In order to check how the type of substrate influences the dots' formation, the samples on both substrates were grown in the same process. First, the GaSb buffer of 40-45 nm was grown and then the GaMnSb layer. The samples were grown at 450°C with different nominal Mn content.
The X-ray Magnetic Circular Dichroism (XMCD) experiment was performed at the beamline I1011. X-ray absorption spectra were collected in the Total Electron Yield (TEY) mode by recording the sample photocurrent. Since the TEY detection mode is sensitive to the near surface region, the samples were Ar+ sputtered in situ in order to remove oxides and other impurities from the surface. The measurements were carried out on the remanently magnetized
635 640 645 650 655-0.02
-0.01
0.00
1
1.1
1.2
1.3
1.4
1.5
1.6
100 K, 30o
(-) (+)
GaMnSb on GaSb(100) 8% Mn
XM
CD
Abs
orpt
ion
Energy (eV)
Fig. 1) The XMCD and signal XANES spectra of Mn L3,2 edges measured at the LN2 temperature for opposite polarities of magnetic field with X-ray beam at 30°.

MAX-lab ACTIVITY REPORT 2010 461
SYNCHROTRON RADIATION – BEAMLINE I1011
samples. The magnetic field used to magnetize samples was around 0.035 T and it was oriented along the X-ray path. The samples were measured at room temperature (RT) and at 100K (LN2). At the RT the magnetic field was too weak to order the domains. The dichroic signal was registered at LN2 only.
In case of the samples grown on the GaAs(111)A substrate, the obtained XMCD signal was very weak, probably due to the large blocking energy and weak magnetic field available at the station which was not sufficient to magnetically order the sample.
For the samples grown on the GaSb(100) substrate the obtained XMCD signal was more pronounced. The results for the GaSb:MnSb sample with nominal Mn concentration equal to 8% are presented in Figs. 1 and 2. The signal shown in Fig. 1 was measured in the grazing incidence, with the X-ray beam at 30° to the sample surface. The spectra gathered from the same part of the sample but measured in the normal incidence, with the X-ray beam perpendicular to the sample surface, are shown in Fig. 2. In both cases the scale was left the same in order to facilitate the comparison. It can be noticed that the XMCD signal shows the angular dependence. This observation agrees with the measurements carried out with a superconducting quantum
interference device magnetometer which revealed that for this kind of samples the easy magnetization axis is in the sample surface plane. The results of performed studies are summarized in the paper [3].
This work was partially supported by national grant of Ministry of Science and High Education N202-052-32/1189. The research leading to these results has received funding from the European Community's Seventh Framework Programme (FP7/2007-2013) under grant agreement n° 226716. ---------------------------------------
[1] H. Akinaga, K. Tanaka, K. Ando, T. Katayama, J. Cryst. Grow. 150, 1144 (1995). [2] K. Lawniczak-Jablonska, A. Wolska, J. Bak-Misiuk, E. Dynowska, P. Romanowski, J.Z. Domaga a, R. Minikayev, D. Wasik, M.T. Klepka, J. Sadowski, A. Barcz, P. Dluzewski, S. Kret, A. Twardowski, M. Kami ska, A. Persson, D. Arvanitis, E. Holub-Krappe, A. Kwiatkowski, J. Appl. Phys. 106, 083524 (2009). [3] K. Lawniczak-Jablonska, A. Wolska, M.T. Klepka, S. Kret, J. Gosk, A. Twardowski, D. Wasik, A. Kwiatkowski, B. Kurowska, B.J. Kowalski, J. Sadowski, J. Appl. Phys. 109 (2011) - in press.
635 640 645 650 655-0.02
-0.01
0.00
1
1.1
1.2
1.3
1.4
1.5
1.6
100 K, 90o
(-) (+)
GaMnSb on GaSb(100) 8% Mn
XM
CD
Abs
orpt
ion
Energy (eV)
Fig. 2) The XMCD and signal XANES spectra of Mn L3,2 edges measured at the LN2 temperature for opposite polarities of magnetic field with X-ray beam at 90°.

462 MAX-lab ACTIVITY REPORT 2010
SYNCHROTRON RADIATION – BEAMLINE I3
Creation of long-lived Frenkel defects via hot electron-hole recombination in pure NaCl crystals at 12 K
E. Feldbach, A. Lushchik, Ch. Lushchik, V. Nagirnyi, E. Shablonin, and S. Vielhauer
Institute of Physics, University of Tartu, Riia 142, 51014 Tartu, Estonia
High radiation resistance of many wide-gap materials (WGMs) on the basis of binary and complex metal oxides can be explained by the fact that the adiabatic formation energy (EFD)of a pair of Frenkel defects (FD) significantly exceeds the energy gap, EFD > Eg. In such WGMs, the energy released at the recombination of holes and cold (relaxed to the bottom of a conduction band) electrons is insufficient for FD creation. However, the recombination of hot (non-relaxed) conduction electrons with holes can tentatively cause the creation of FD even in WGMs with EFD > Eg [1]. This hypothesis is experimentally confirmed for highly pure NaCl single crystals. The creation spectrum of long-lived F-H pairs has been measured at 12 K using synchrotron radiation of h = 7 40 eV at the undulator beamline I3 at MAX-III.
The sample was irradiated perpendicular to the (100) plane by a prescribed number of photons at each of several energies. The reference signal for normalization to equal quantum irradiation dose was recorded from a sodium salicylate coated mesh. The irradiated crystal was then stimulated through a double prism monochromator by 2.7-eV photons along the [ 001 ] direction in the maximum of the absorption band of radiation-induced F centres (an electron in a field of an anion vacancy). At 12 K, the 2.7-eV photons cause the excitation (not ionization!) of F centres. In thirty seconds after the end of NaCl irradiation, the time dependence of photostimulated luminescence (PSL) selected through a combination of optical filters (3 5 eV) was recorded. The light sum of this rapidly damping PSL was taken as a measure of F-H pairs formed by SR. This low-temperature luminescent method was elaborated at the Institute of Physics (Tartu) [2] and later used for the measuring of the creation spectra of F and centres (an anion vacancy) in KBr and KCl crystals at beamline BL52, MAX-I [3]. In highly pure KBr and KCl crystals with EFD < Eg, FDs are efficiently created at both room temperature and at 4-10 K due to the decay of anion excitons or the recombination of relaxed conduction electrons with self-trapped holes. The first creation spectrum of F centres by VUV-radiation in pure NaCl at 300 K was measured already in 1964 [4]. Selective photo-formation of either anion excitons or separated electrons and holes via interband transitions causes the creation of F centres. The annealing of these F centres occurs in the same temperature region as that of F and V2 centres induced in similar samples by X-rays or fast fission neutrons [4]. However, the creation efficiency of FDs decreases by dozens of times at 10 K, thus impeding the detection of long-lived F-H pairs in highly pure NaCl crystals at low temperatures.
According to our experimental results (see figures 1 and 2), the exciting photons in the region of exciton absorption (7.8 8.4 eV) do not cause the creation of F centres. A very weak PSL (probably impurity-related) is detected in the spectral region slightly above the energy gap (Eg = 8.9 eV), when s-conduction electrons are formed. However, a sharp rise of the PSL light sum takes place when the exciting photons of h = 12 16 eV form already hot d-conduction electrons, but do not yet cause the formation of secondary anion excitons via the

MAX-lab ACTIVITY REPORT 2010 463
SYNCHROTRON RADIATION – BEAMLINE I3
________________________________________1 A. Lushchik, Ch. Lushchik, M. Kirm, V. Nagirnyi et al., Nucl. Instr. and Meth. B 250, 330 (2006) 2 Ch. Lushchik, J. Kolk, A. Lushchik, N. Lushchik et al., " Phys. stat. solidi (b) 114, 103 (1982). 3 A.Lushchik, I.Kudryavtseva, Ch.Lushchik et al., Phys. Rev. B 52, 10069 (1995). 4 Ch.B. Lushchik, G.G. Liidya, M.A.Elango, Sov. Phys. Solid State 61789 (1965). 5 E.Feldbach, M.Kirm, A.Lushchik, Ch.Lushchik, I.Martinson, J. Phys: Condens. Matter 12, 1991 (2000). 6 F.-J. Himpsel, W. Steinmann, Phys. Rev. B 17, 2537 (1978).
multiplication process [5,6]). Therefore, the energy released at the recombination of d-conduction electrons and p-valence holes is sufficient for the creation of stable F-H pairs with a relatively large interdefect separation. The PSL arises via the following reaction F....H + h stim F ....H ...I + h emis , while an -I pair, formed during this recharging process, undergoes non-radiative recombination with the reconstruction of a perfect lattice. The number of F-H pairs (i.e. PSL light sum) changes only slightly with the rise of the exciting photon energy from 12.5 to 27 eV (see figs. 1 and 2), while the creation efficiency of FDs doubles at 28-33 eV. According to our previous data on the multiplication of electronic excitations in a number of alkali halides, such photons can form up to three electron-hole pairs in NaCl [5]. However, only two hot e-h pairs contribute to the creation of stable F-H pairs.
7.0 7.4 7.8 8.2 8.6 9.0 10 12 14 16 18 20
Ref
lect
ivity
Photon energy (eV)
NaCl 12 KN
umbe
r of
F ce
nter
s
Photon Energy (eV)25 30 35
Ref
lect
ivity
NaCl 12 K
2.4 2.6 2.8 3.0
80 K
F
Num
ber o
f F
cent
ers
Figs. 1 and 2. The reflection spectra and creation spectra of F-H pairs measured at 12 K for a highly pure NaCl single crystal. Inset shows the stimulation spectrum of PSL at 80 K.
Of particular interest is the creation of F centres by 33-34 eV photons that form cation excitons. It was shown earlier [5] that a cation exciton (~33.4 eV) decays into an anion exciton and several e-h pairs. The energy excess of about 24 eV remained after the formation of an anion exciton is enough to form two e-h pairs, but only one of them will be sufficiently hot for the creation of a pair of FDs. A deep dip of the creation efficiency of F-H pairs is observed in the region of cation exciton absorption. This dip remains even if the reflection losses (narrow reflection peak at 33.4 eV see figure 2) are taken into account. So, only a hot e-h pair, formed together with an anion exciton and a cold e-h pair at the decay of a cation exciton, is able to create an F-H pair at 12 K. Concluding, the recombination of a hot conduction electron with a hole causes the creation of a pair of anion FDs in a NaCl crystal with EFD > Eg (as it was already suggested for WGMs in [1]).
The research leading to these results has received funding from the European Community's Seventh Framework Programme (FP7/2007-2013) under grant agreement nº 226716 and the Estonian Science Foundation (Grant No. 7825).

464 MAX-lab ACTIVITY REPORT 2010
SYNCHROTRON RADIATION – BEAMLINE I3
Absorption cross section measurementsof CO2 isotopologues 13CO2 and C18O2
in the wavelength range 150-187 nm
Roslyn Forecast∗, Johan A. Schmidt∗, Henrik Hartman†,
Hampus Nilsson†, Sven Huldt† & Matthew S. Johnson∗∗Department of Chemistry, University of Copenhagen, Denmark
†Lund Observatory, Lund University, Sweden
IntroductionVUV photolysis of CO2 is important for planetary atmospheres. Preferential photolysis of
one isotopic species over another leads to isotopic enrichment. We conducted measurements
of the absorption cross-sections of isotopically enriched samples, 13CO2 and C18O2, in the
wavelength range 150–187nm.
It has been suggested that (nuclear) spin (electronic) orbit coupling may give rise to pref-
erential photo-dissociation of isotopic species with non-zero nuclear spin, such as 17O (5/2) or13C (−1/2). Photo-dissociation experiments, CO2 + hν→ CO + O, conducted with a mercury
lamp (185nm) led to products with 17O enrichment of more than 100� [1]. A similar effect
could, however, arise from a weak vibronic structure in the absorption cross-section. We aim
to investigate the mechanism responsible for the anomalous enrichment.
Experimental Set-UpMeasurements were performed on the gas phase branch of the I3 beamline. The beam was
passed through a pressure-monitored sample cell and collected at a PMT detector. Back-
ground measurements were collected on the evacuated cell. Commercially produced isotopi-
cally enriched samples, 13CO2 produced by Fluka (99% atom 13C) and C18O2 from ICON
(85% atom 18O), were used at pressures between 2–150 mbar. As background and sample
could not be measured simultaneously, measurements were conducted in 10nm blocks alter-
nating between background and sample.
Preliminary ResultsRecorded sample and background intensities, I and I0 respectively, were corrected for decay-ing beam current. The absorption cross-section, σ, was calculated following,
σ=log10(I0/I)
n · l (1)
where n represents the gas concentration [molecules·cm−3] and l the length of the sample cell
[cm]. Where multiple measurements were available, the average intensities were calculated

MAX-lab ACTIVITY REPORT 2010 465
SYNCHROTRON RADIATION – BEAMLINE I3
for each isotopologue. Drift between measurement regions was corrected for each measure-
ment interval: calculated cross-sections were multiplied by a factor to give the same slope
as a linear fit to CO2 reference data [2, 3], and then shifted to give the same mean. Weak
vibronic structure is seen that shifts in a regular way with isotopic substitution, Fig. 1.
AcknowledgementsWe thank the MAX-lab staff for their support and assistance.
References[1] S. K. Bhattacharya, J. Savarino, M. H. Thiemens, Geophysical Research Letters 27, 1459
(2000).
[2] K. Yoshino, et al., Journal of Quantitative Spectroscopy and Radiative Transfer 55, 53(1996).
[3] W. H. Parkinson, J. Rufus, K. Yoshino, Chemical Physics 290, 251 (2003).
Figure 1: Absorption cross-sections. Reference CO2 (bottom) [2, 3]; measured 13CO2 (mid-
dle) and C18O2 (top). The upper spectra have been offset from CO2 (bottom) for clarity.

466 MAX-lab ACTIVITY REPORT 2010
SYNCHROTRON RADIATION – BEAMLINE I3
Investigation of VUV transitions of iron group elements for astrophysical applications using I3 at MAX III
Henrik Hartman, Hampus Nilsson, Sven Huldt, Richard Blackwell-Whitehead, Thomas LennartssonLund Observatory, Lund University, Box 43, SE-221 00 Lund, Sweden
Erik Bäckström, Jonas Gurell, Sven MannervikDepartment of Physics, Stockholm UniversitySE-106 91 Stockholm, Sweden
Stacey Ristinmaa SörensenSynchrotron Radiation Physics, Department of Physics, Lund University, Box 118, SE-221 00 Lund, Sweden
Abstract We are developing an experimental station at the gas-phase branch line at the 6.65 m normal incidence beam line at I3, MAX III. It is used to investigate free metal atoms and ions in plasma phase. The sample ions are produced in a hollow cathode discharge lamp, which is illuminated by the synchrotron radiation producing absorption when in resonance with the atomic lines. The synchrotron light is scanned in energy building up an absorption spectrum. Contributions from intrinsic light of the discharge are minimized through geometrical, spectral and temporal filters.
The project’s major goal is to measure transition rates for specific lines in the spectrum of ionized iron, Fe II lines, at vacuum UV wavelengths, 100-130 nm. These transitions are important for many astrophysical applications, e.g. in objects where line fluorescence is prominent, as well as stars observed in the ultraviolet FUSE and HST/STIS region. In this wavelength region many other iron-group element ions have important transitions, which will be measured in future projects.
Iron lines are of great importance in analyses of stars and nebulae, not only for abundance studies, but also for diagnostics of the plasma conditions and derivation of physical properties such as temperature, electron density and radiation field.
We describe the experimental setup at the I3 beam line at MAX III, and the early results.
Introduction In spectroscopic studies of astrophysical objects iron is an important tracer, and its relatively high cosmic abundance and complex atomic structure result in many spectral lines. Iron is often used as a probe of metal abundance in distant objects, such as quasars and Active Galactic Nuclei (AGNs). Many stars and nebulae have representative temperatures around 10 000 K, and for this temperature the favored ionization stage is singly-ionized iron, Fe+, whose spectrum is denoted FeII. The lines of FeII are thus of great importance in analyses of stars and nebulae.
Fluorescence lines can be used to probe active plasma regions. Since these lines are optically thin, they offer more possibilities for plasma diagnostics than most other lines, which in general are low-excitation lines and therefore optically thick. To model the radiative pumping process, a number of atomic parameters need to be known, among them the transition rates (A-values) or oscillator strengths (f-values).
The present project aims at measuring the intrinsic line strengths for these transitions by letting the synchrotron light pass through a plasma hosting the ions. When proved successful this technique will enable us to measure a wealth of lines important for several astrophysical applications.
Experimental setup Synchrotron light from MAX-III is used as a background source to study the absorption from gas-phase iron atoms. The plasma responsible for the absorption is produced in a hollow-cathode (HC) discharge, which is run with neon as carrier gas. The electronic transitions in iron produce narrow absorption lines in the continuous light from the synchrotron. Comparisons of different absorption lines from a common lower level give the relative internal strengths for the lines,

MAX-lab ACTIVITY REPORT 2010 467
SYNCHROTRON RADIATION – BEAMLINE I3
and the values are put on an absolute scale by using known reference lines. The 6.65m high spectral resolution (R>100,000) normal incidence monochromator (NIM) on the I3 beamline is used to produce monochromatic light, and with its performance in terms of resolution and photon intensity ideal for the purpose. The energy of the monochromator is scanned over the transition to obtain the absorption line. Since the intrinsic width of the absorption line, determined by the thermal motion of the atoms in the plasma, is of the same order magnitude we need the full resolution to obtain reliableand accurate results.
The HC producing the plasma is a source of strong line emission in the same spectral region, which is orders of magnitudes stronger than the synchrotron light studied. This emission light is removed by modulating the synchrotron light with a frequency of up to 1000 Hz. The signal from the photomultiplier tube (PMT) and the chopping frequency are fed into a Lock-In amplifier to extract the absorption signal in the synchrotron light. In addition, geometrical and low-resolution spectral filters are used to suppress the light from the discharge.
Figure 1: left: Absorption line from ionized iron, Fe II, at 160.85 nm.right: Dependence of the absorption as a function of current through the discharge for two Fe I lines from the same lower level but with different intrinsic line strengths (f-values). The behavior is clearly non-linear, and the ratio of the two lines depends on the current.
Early results. We are pushing the measurements into the VUV region. Absorption originating from the ground level of Fe II at 160 nm (Fig1a) has been measured at different currents. Lines from the same lower level a6D9/2 at shorter wavelengths (120 nm) are however not observed. Measurements under changing experimental conditions are important for the investigation of saturation effects, and the correction for the same in the derivation of the true intrinsic line strengths. Figure 1b shows the dependence of the absorption as a function of current through the discharge, fortwo transitions, from the same lower level but with different strength. The saturation is clearly observed as a non-linear dependence. The saturation is dependent of the strength of the line, and variesbetween the lines.
Acknowledgment: We are grateful to the MAX-lab personnel, in particular Mats Leandersson and Balu Thiagarajan, for providing superior experiment environment and excellent user support. We acknowledge the support from the Swedish Science Council through grant 621-2006-3085, and the financial support from Royal Physiographical Society (Fysiografen) in Lund.
Reference on first setup: ‘VUV oscillator strengths for iron lines of astrophysical importance’, Hartman, H.; Nilsson, H.; Huldt, S.; Johansson, S.; Sörensen, S.; Johnson, M. S.; von Hessberg, P., (2008) Journal of Physics: Conference Series, 130, 012010

468 MAX-lab ACTIVITY REPORT 2010
SYNCHROTRON RADIATION – BEAMLINE I3
Top of the valence band of the GaAs(100)-c(4x4) surface
P. Ji í ek1, M. Cukr1, I. Bartoš1, J. Sadowski2, M. Leandersson2, T. Balasubramanian2
1Institute of Physics, Academy of Sciences of the Czech Republic, Cukrovarnicka 10, 162 53 Prague 6, Czech Republic 2 Max-lab, Lund University, SE-221 00 Lund, Sweden Numerous surface reconstructions can be prepared on GaAs(100) surface by molecular beam epitaxy (MBE). Among others, the c(4x4) reconstruction represents a stable, technologically important atomic arrangement and its surface properties has been investigated for many years [1-4]. In spite of it, there are still unclear points between theoretical and experimental results. One of them is the existence of a surface state around 0 eV of binding energy, i.e. in proximity to the valence band top. To clear it, we have studied the GaAs(100)-c(4x4) surface state near the top of the valence band using enhanced both energy and angular resolution at BL I3. In the same time, this measurement could provide a necessary testing on known sample surface. To this aim, the GaAs(100)-c(4x4) reconstruction was prepared in SVT MBE growth chamber attached to the BL I3. After UHV sample transport and a LEED check, the photoelectron spectra have been measured by the VG Scienta R4000 electron analyzer. Experimental conditions for recording the photoelectron spectra were the following: energy of
synchrotron radiation 21.2 eV and angle of incidence of the synchrotron light 73o with respect to the surface normal. Photoelectrons were collected from the acceptance angle +/- 15o. The photoelectron spectra were recorded with a step of 1o in the [1-10] direction.
Fig.2 Density of electronic states at point for GaAs(100)-c(4x4) with resolved orbital contributions (thin lines) from four topmost atomic layers. Thick lines are for total DOS [5].
- 2 . 0 - 1 . 5 - 1 . 0 - 0 . 5 0 . 0
θ = 3
θ = 2
θ = 1
θ = - 1
Inte
nsity
[a.u
.]
B i n d i n g e n e r g y [ e V ]
G a A s ( 1 0 0 ) - c ( 4 x 4 )
θ = 0
B
A X
Fig.1 Photoemission spectra measured in direction [1-10] round about surface normal. Energy of the synchrotron radiation was 21.2 eV.
¯

MAX-lab ACTIVITY REPORT 2010 469
SYNCHROTRON RADIATION – BEAMLINE I3
[1] P. Ji í ek, M. Cukr, I. Bartoš, J. Sadowski Surf. Sci. 603 3088 – 3093 (2009). [2] C. Hogan, E. Placidi, R. Del Sole, 2005 Phys. Rev. B71 041308 (2005). [3] P. K. Larsen, J. H. Neave, J. F. van der Veen, P. J. Dobson, B. A. Joyce, Phys. Rev. B27 4966 (1983). [4] A. Ohtake, J. Nakamura, S. Tsukamoto, N. Koguchi, A. Natori, Phys. Rev. Lett. 89 206102 (2002). [5] T. Strasser, C. Solterbeck, W. Schattke, I. Bartos, M. Cukr, P. Jiricek, Phys. Rev. B63, (2005) 085309 (2001).
Fig. 1 presents the photoemission spectra near the top of the valence band around normal direction, showing two shoulders (A) and (X). The shoulder at around 0.6 eV corresponds to the position of surface state, detected in previous experiments [1,3], and is also found theoretically [5]. The other shoulder at ~0.2 eV below the top of the valence band has not
been experimentally observed before and can well be assigned to a position in DOS spectrum in Fig. 2, marked by oblique arrows. According to this calculation the signal may be composed of contributions from pz orbitals on As atoms in surface (As dimers) and on As atoms in subsurface layer. However, the intensity of the measured surface state around 0.6 eV is not so clear as compared with earlier experiment [1] (Fig. 3). In this connection it is to mention that the studied GaAs(100)-c(4x4) sample was the very first growth performed in
the new MBE apparatus and the quality of the prepared surface might be influenced by this fact, in spite of perfect RHEED and LEED patterns taken during and after the growth. To verify the existence of the surface state near 0 eV of binding energy, supplementary experiments have to be done at BL I3.
-2.0 -1.5 -1.0 -0.5 0.0
Nor
mal
ised
inte
nsity
[a.u
.]
Binding energy [eV]
GaAs(001)-c(4x4) BL I3 BL 41
B
XA
Fig. 3 Comparison of the normal photoemission spectra of the GaAs(100)-c(4x4) surface, measured at BL I3, and BL41 [1]. Excitation energy 21.2 eV.
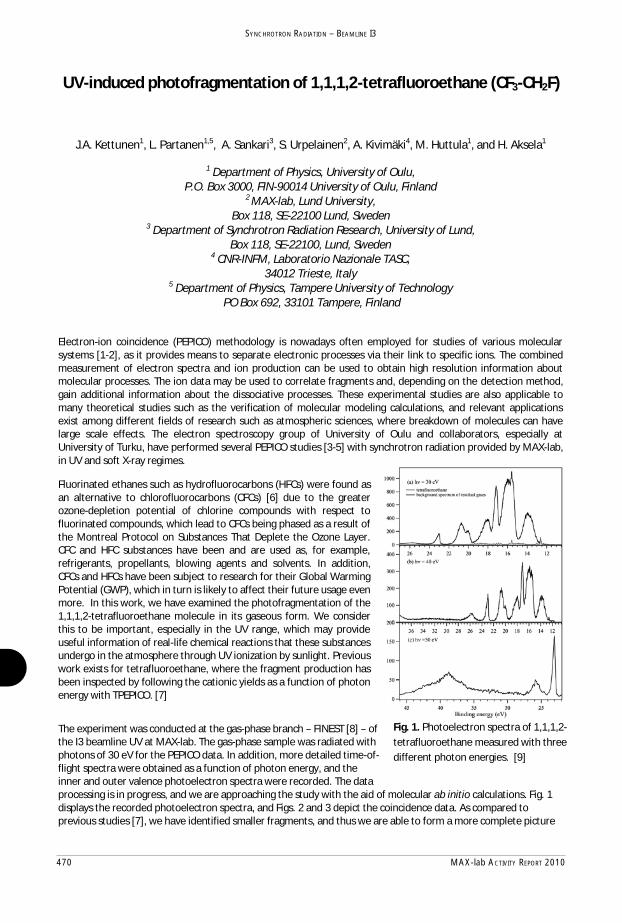
470 MAX-lab ACTIVITY REPORT 2010
SYNCHROTRON RADIATION – BEAMLINE I3
UV-induced photofragmentation of 1,1,1,2-tetrafluoroethane (CF3-CH2F)
J.A. Kettunen1, L. Partanen1,5, A. Sankari3, S. Urpelainen2, A. Kivimäki4, M. Huttula1, and H. Aksela1
1 Department of Physics, University of Oulu, P.O. Box 3000, FIN-90014 University of Oulu, Finland
2 MAX-lab, Lund University, Box 118, SE-22100 Lund, Sweden
3 Department of Synchrotron Radiation Research, University of Lund, Box 118, SE-22100, Lund, Sweden
4 CNR-INFM, Laboratorio Nazionale TASC, 34012 Trieste, Italy
5 Department of Physics, Tampere University of Technology PO Box 692, 33101 Tampere, Finland
Electron-ion coincidence (PEPICO) methodology is nowadays often employed for studies of various molecular systems [1-2], as it provides means to separate electronic processes via their link to specific ions. The combined measurement of electron spectra and ion production can be used to obtain high resolution information about molecular processes. The ion data may be used to correlate fragments and, depending on the detection method, gain additional information about the dissociative processes. These experimental studies are also applicable to many theoretical studies such as the verification of molecular modeling calculations, and relevant applications exist among different fields of research such as atmospheric sciences, where breakdown of molecules can have large scale effects. The electron spectroscopy group of University of Oulu and collaborators, especially at University of Turku, have performed several PEPICO studies [3-5] with synchrotron radiation provided by MAX-lab, in UV and soft X-ray regimes.
Fluorinated ethanes such as hydrofluorocarbons (HFCs) were found as an alternative to chlorofluorocarbons (CFCs) [6] due to the greater ozone-depletion potential of chlorine compounds with respect to fluorinated compounds, which lead to CFCs being phased as a result of the Montreal Protocol on Substances That Deplete the Ozone Layer. CFC and HFC substances have been and are used as, for example, refrigerants, propellants, blowing agents and solvents. In addition, CFCs and HFCs have been subject to research for their Global Warming Potential (GWP), which in turn is likely to affect their future usage even more. In this work, we have examined the photofragmentation of the 1,1,1,2-tetrafluoroethane molecule in its gaseous form. We consider this to be important, especially in the UV range, which may provide useful information of real-life chemical reactions that these substances undergo in the atmosphere through UV ionization by sunlight. Previous work exists for tetrafluoroethane, where the fragment production has been inspected by following the cationic yields as a function of photon energy with TPEPICO. [7]
The experiment was conducted at the gas-phase branch – FINEST [8] – of the I3 beamline UV at MAX-lab. The gas-phase sample was radiated with photons of 30 eV for the PEPICO data. In addition, more detailed time-of-flight spectra were obtained as a function of photon energy, and the inner and outer valence photoelectron spectra were recorded. The data processing is in progress, and we are approaching the study with the aid of molecular ab initio calculations. Fig. 1 displays the recorded photoelectron spectra, and Figs. 2 and 3 depict the coincidence data. As compared to previous studies [7], we have identified smaller fragments, and thus we are able to form a more complete picture
Fig. 1. Photoelectron spectra of 1,1,1,2-tetrafluoroethane measured with three different photon energies. [9]

MAX-lab ACTIVITY REPORT 2010 471
SYNCHROTRON RADIATION – BEAMLINE I3
Fig 2. A PEPICO map of 1,1,1,2-tetrafluoroethane’s valence region. [9]
Fig 3. Coincident ion yields (CIYs) for the fragment cations observed with valence photoionization (h = 30 eV). [9]
References
[1] R.E. Continetti. Ann. Rev. Phys. Chem. 52 (2001) [2] C. Miron, P. Morin. Nucl. Instr. Methods A 601 (2009) [3] S. Urpelainen, A. Caló, L. Partanen, M. Huttula, J. Niskanen, E. Kukk, S. Aksela, and H. Aksela. Phys. Rev. A 80 (2009) [4] E. Kukk, R. Sankari, M. Huttula, A. Sankari, H. Aksela and S. Aksela. J. Electron Spectrosc. Relat. Phenom. 155 (2007) [5] E. Kukk ,R. Sankari, M. Huttula, S. Mattila, E. Itälä, A. Sankari, b, H. Aksela and S. Aksela. I. J. Mass. Spec. 279 (2009) [6] A. McCulloch, P.M. Midgley, and P. Ashford, Atmos. Environ. 37 (2003). [7] W. Zhou, D.P. Seccombe, and R.P. Tuckett, Phys. Chem. Chem. Phys, 4 (2002) [8] S. Urpelainen, M. Huttula, T. Balasubramanian, R. Sankari, P. Kovala, E. Kukk, E. Nõmmiste, S. Aksela, R. Nyholm, and H. Aksela, AIP Conf. Proc. 1234 411 (2010) [9] J.A. Kettunen, L. Partanen, A. Sankari, S. Urpelainen, A. Kivimäki, M. Huttula, H. Aksela. Reprinted from manuscript to be submitted.

472 MAX-lab ACTIVITY REPORT 2010
SYNCHROTRON RADIATION – BEAMLINE I3
Figure 1. The PIY spectra of Sen clusters measured at the valence region threshold .
Size selective study of the Se microclusters induced by direct vacuum evaporation
K. Kooser1, D. T. Ha1, E. Itälä1, J. Laksman2, S. Urpelainen3,4 and E. Kukk1
1Dept. of Physics and Astronomy, University of Turku, FI-20014 Turku, Finland 2 Dept. of Synchrotron Radiation Research, Lund University , Sölvegatan 14, 223 62 Lund, Sweden
3 MAX-lab, Lund University , P.O. Box 118, SE-22100 Lund, Sweden 4Department of Physics , University of Oulu, Finland
The chemistry of the chalcogene clusters like Se is an area of growing relevance because of their ability to form polyatomic complex chains and rings of a variety of sizes and shapes. These structural preferences influence the physical properties of their microclusters[1, 2]. Here is presented the results of experimental study of the ionization and fragmentation of Sen clusters (n<9) after Se valence photoionization, using the Partial Ion Yield (PIY) and PhotoElectron-PhotoIon COincidence (PEPICO) techniques.
Nor
mal
ized
inte
nsity
(arb
. uni
ts)
9.59.08.58.07.5Photon energy (eV)
Se8Se7Se6Se5Se4Se2

MAX-lab ACTIVITY REPORT 2010 473
SYNCHROTRON RADIATION – BEAMLINE I3
[1] J. Berkowitz et al., J. Chem. Phys. 48, 4346 (1968). [2] J. Becker et al., Z. Phys. D 19, 233 (1991). [3] E. Kukk et al., J. Electron Spectroscopy Relat. Phenomena 155, 141 (2007).
The measurements were performed at FinEst branchline of the beamline I3 at MAX-III. In this work have been used the experimental PEPICO setup which consists of a modified Scienta SES-100 electron analyser and a homemade Wiley-McLaren type ion TOF detector [3]. The Se sample was evaporated into the interaction area of the spectrometers from the boron nitride crucible (T 235 oC) of effusion cell . The base pressure of the system was below 6 × 10 7 mbar and the measurements were performed at room temperature.
The normalised partial ion yields of Sen clusters measured in the photon energy range from 7.5 eV to 10 are shown in the Figure 1. In the photon energy range up to 10 eV have been detected the Se clusters Se2, Se4, Se5, Se6, Se7 and Se8. However, the PIYs of Se4 and Se8 clusters have very weak signal on absolute scale. The PIYs show strong dependence on the size of cluster.
In Figure 2 are represented the PEPICO maps of Sen clusters in coincidence with Se valence photoelectrons. The detected ionised clusters are marked on the maps and the patterns have been recorded in two adjacent energy windows (Ecenter = 9 and 12 eV) of the electron spectrometer. The ionizing photon energy was chosen equal to 22 eV. The appearance of coincidence patterns of Se1, Se2, Se3 and Se4 cations in higher binding energy range refers to the fragmentation of larger clusters.
Further data analysis is in progress and a systematic discussion of electronic structure and fragmentation of Se microclusters will be published as a regular article.
This work was supported by Nordforsk Infrastructure Network “Advanced spectroscopy using MAX-laboratory in Lund” and the EU “Transnational Access to Research Infrastructures” programme. Financial support from the Academy of Finland is also acknowledged. The staff of MAX-lab is acknowledged for their help during the experiments. We thank the Electron Spectroscopy Group of Oulu University for the opportunity to share the experimental equipment.
Figure 2. PEPICO maps of selenium clusters recorded in coincidence with Se valence photoionization.

474 MAX-lab ACTIVITY REPORT 2010
SYNCHROTRON RADIATION – BEAMLINE I3
Angle-resolved electron momentum imaging in the vicinity of the surface Plasmon resonance of C60
F. Lépine1, C. Cauchy1, P-A. Hervieux2, J. Laksman3, E. Månsson3, K. Hansen5,
S. Canton4, S.L. Sörensen3, P. Johnson6, M. Gisselbrecht3
1 LASIM, Université de Lyon, 43 Bvd. du 11 Novembre 1918, 69633 Villeurbanne Cedex, France
P.O. Box 118, S-221 00 Lund, Sweden 2 Institut de Physique et Chimie des Matériaux de Strasbourg, 23 rue du Loess, BP 43, 67034 Strasbourg Cedex
2, France 3 Division of Synchrotron Radiation Research, Institute of Physics, Lund University
P.O. Box 118, S-221 00 Lund, Sweden 4 MAXLab, Lund University, P.O. Box 118, S-221 00 Lund, Sweden
5 University of Gothenburg Department of Physics SE-412 96 Göteborg, Sweden 6 Dept. of Physics Institute of Physics, Lund University, P.O. Box 118, S-221 00 Lund, Sweden
In the last decades collective electronic properties of C60 have attracted continuing interest. The cloud of the outer-most valence electrons of carbon atoms distributed “uniformly” on the surface of a hollow sphere exhibits surprising behavior upon photoemission. Historically a giant surface plasmon resonance (SPR) was discovered in 1992 above the ionization threshold, near 20 eV, through measurements of the photoionization cross-section [1]. This feature was interpreted as a collective oscillation of delocalized electrons relative to the ionic carbon cage. Recently, a second collective resonance, associated with a dipole-excited volume plasmon, has been observed experimentally near 40 eV [2]. The study of collective excitation of electrons, or plasmons, in such model system enables to understand electronic correlation and coupling effects in systems with a large number of interacting fermions, especially in C60, where the collective excitation can relax through various channels, like ionization and/or fragmentation. In a recent publication [3], we demonstrate in the framework of the TDLDA (Time Dependent Local density Approximation) as well as with a semiclassical model that the nature of the SPR in C60 can be studied using angle-resolved momentum electron imaging. We show that while the imaginary part of the complex polarizability, Im[ ], is related to the photoabsorption cross-section, the real part, Re[ ], is associated with the energy-dependent angular distribution. In particular, we expect a drastic variation of the photoelectron angular distribution (characterized by its asymmetry parameter ) in the vicinity of the SPR. This variation is related to the correlated electron motion. Therefore, we are interested in the investigation of this resonance using the velocity map imaging technique [4].
Experimental setup
The experiment was carried out at the gas phase branch of the beamline I3 at MAXIII. The undulator delivers intense photon beam of 1012 ph/s with vertical polarization, with a wavelength tuned around the SPR. An effusive beam of C60 was produced with a ceramic oven, developed at LASIM, and resistively heated to a temperature of 550°C. The beam was collimated to get a well-defined spatial overlap with the monochromatic photon beam (few mm).
Figure 1a): Ion spatial imaging mode used to monitor the spatial overlap between the molecular beam of C60 and the light beam.

MAX-lab ACTIVITY REPORT 2010 475
SYNCHROTRON RADIATION – BEAMLINE I3
References: [1] I V Hertel et al 1992 Phys. Rev. Lett. 68 784 [2] S W J Scully et al 2005 Phys. Rev. Lett. 94 065503 [3] E. Maurat P-A. Hervieux and F Lépine 2009 J. Phys. B. 42 165105 [4] A T Eppink J B and Parker D H 1997 Rev. Sci. Instrum. 68 3477
The velocity map imaging apparatus from the Atomic-Physics Division of Lund University was installed for the first time at the MaxLab beamline. This system allows reconstructing the 3D electron(or ion) velocity distribution from its measured 2D projection, meaning that both the energy and angular distribution of the emitted electrons are accessible with a typical energy resolution of a few percent. The spectrometer can work in two distinct modes:
Figure 1b) Ion velocity map imaging mode used to characterize the molecular velocity of 170 m/s,
v=50 ms/s.i) spatial imaging mode that can used to optimize the spatial overlap (Figure 1a), ii) velocity map imaging mode to characterize the beam dynamics (figure 1b) or for electron/ion spectroscopy. Photoemission measurements were performed scanning the photon energy from 15 to 30 eV.
Results
Figure 2) Electron image on the detector of the spectrometer obtained at 20 eV exhibiting the C60 shell structure of the valence orbitals (HOMO, HOMO-1…). In the inset is presented the total ion yield in the vicinity of the SPR as a function of the photon energy.
In Figure 2 we present a typical electron image obtained at 20 eV around the maximum of the SPR. The rings map out the distinct lines corresponding to the different molecular orbitals. The radius scales with the velocity of the photoelectrons. The first ring corresponds to the ionization of a single orbital (6hu), the second ring is related to the ionization of two orbitals (10hg) and (6gg). The polarization axis is indicated as a guideline to inspect the angular distribution as function of . A clear difference between the HOMO and HOMO-1 is observed at | |=90°, where the signal almost vanishes for the outer ring. We are currently analyzing the variation of the angular distribution of these various orbitals both from the experimental data and theoretical point of view. This will lead to a reconstruction of the energy dependent real part of dynamical polarizability of C60. In addition, we have also studied anthracene molecules for which similar measurements have been performed around the the -> * resonance. These results pave the way towards experiments where we can also access the temporal evolution of plasmonic processes.

476 MAX-lab ACTIVITY REPORT 2010
SYNCHROTRON RADIATION – BEAMLINE I3
Angle- and spin-resolved photoemission on ferromagnetic Mn5Ge3(0001) thin films grown on Ge(111)
W. Ndiaye1, M. C. Richter1, O. Heckmann1, P. De Padova2, J.-M. Mariot3,
T. Balasubramanian,4 M. Leandersson,4 and K. Hricovini1
1 Laboratoire de Physique des Matériaux et des Surfaces, Université de Cergy-Pontoise, 5 mail Gay-Lussac, 95031 Cergy-Pontoise, France
2 CNR, Istituto di Struttura della Materia, via Fosso del Cavaliere, 00133 Roma, Italy
3 Laboratoire de Chimie Physique-Matière et Rayonnement (UMR 7614),
Université Pierre et Marie Curie, 11 rue P. et M. Curie, 75231 Paris Cedex 05, France
4 MAX-lab, Lund University, P.O. Box 118, S-221 00 Lund, Sweden
Mn-doped germanium has recently attracted a lot of attention due to its capability to form either diluted magnetic semiconductors with a high Curie temperature (TC) or to develop ferromagnetic (FM) compounds in the Ge semiconducting matrix, which are opportunities to achieve spin injection for the emergent spintronics.1,2 Recently, the structure and the magnetic/electronic properties of FM Mn5Ge3(0001) films epitaxially grown on Ge(111) have been investigated (see, e.g. Ref. 3 and the references cited therein). A degree of spin polarization (DSP) of 42% has been reported from point-contact Andreev reflection measurements.4 Recent spin-resolved photoemission in angle-integrated mode using He I radiation show a DSP of 15% at the Fermi energy (EF).5 This result is not consistent with the value of 41% predicted by band structure calculations,6 although theoretical predictions of the DSP are extremely sensitive to the details of the crystal structure in materials having a complicated Fermi surface. Thus further experimental measurements of the valence band electronic structure and of the DSP of FM Mn5Ge3 are highly needed. We have performed angle- and spin-resolved photoemission measurements on beamline I3 (MAX III) on in situ prepared Mn5Ge3(0001) Ge(111) films held at 80 K, i.e. well below the TC of bulk Mn5Ge3 ( 300 K). In Figure 1 (left) we show a waterfall picture of the energy distribution curves in normal emission ( –A direction) in the 13-40 eV photon energy range.
Figure 1: Left: valence band photoemission spectra of Mn5Ge3 recorded at normal emission and photon energies in the 15-40 eV energy range; right: intensity variation at EF as a function of the photon energy.

MAX-lab ACTIVITY REPORT 2010 477
SYNCHROTRON RADIATION – BEAMLINE I3
Each spectrum is normalized to its integral. By following the photon energy dependence of the spectral weight at EF [see Figure 1 (right)] and comparing to the calculations6 we were able to determine the and A points in the Brillouin zone. We then performed angle-resolved measurements (not shown here) along the A–L direction which shows clear band dispersion close to EF. Preliminary spin-resolved photoemission measurements have also been performed. The spin-up and spin-down spectra recorded in normal emission for a photon energy of 15 eV, i.e. close to the A point of the Brillouin zone, as well as the corresponding DSP are shown in Figure 2. The DSP exhibits significant binding energy dependence and reaches a value of 20% at EF (it has been checked that the DSP related to the out-of-plane magnetization is zero). Note that the change we observe in the DSP in the 0-1 eV binding energy range has not been detected in previous angle-integrated measurements. This highlights the interest of the present angle- and spin-resolved study in scrutinizing the spin-polarized band structure of Mn5Ge3.
Figure 2: Valence band spin-resolved photoemission spectra of Mn5Ge3 (normal emission; photon energy of 15 eV) and the corresponding degree of spin polarization.
References 1 T. Dietl, H. Ohno, F. Matsukura, J. Cibert, and D. Ferrand, Science 287, 1019 (2000). 2 Y. D. Park, A. T. Hanbicki, S. C. Erwin, C. S. Hellberg, J. M. Sullivan, J. E. Mattson, T. F. Ambrose,
A. Wilson, G. Spanos, and B. T. Jonker, Science 295, 651 (2002). 3 P. De Padova, J.-M. Mariot, L. Favre, I. Berbezier, B. Olivieri, P. Perfetti, C. Quaresima, C. Ottaviani,
A. Taleb-Ibrahimi, P. Le Fèvre, F. Bertran, O. Heckmann, M. C. Richter, W. Ndiaye, F. D'Orazio, F. Lucari, C. M. Cacho, and K. Hricovini, Surf. Sci. 605, 638 (2011).
4 R. P. Panguluri, C. Zeng, H. H. Weitering, J. M. Sullivan, S. C. Erwin, and B. Nadgorny, Phys. Status Solidi B 242, R67 (2005).
5 Yu. S. Dedkov, M. Holder, G. Mayer, M. Fonin, and A. B. Preobrajenski, J. Appl. Phys. 105, 073909 (2009). 6 S. Picozzi, A. Continenza, and A. J. Freeman, Phys. Rev. B 70, 235205 (2004).

478 MAX-lab ACTIVITY REPORT 2010
SYNCHROTRON RADIATION – BEAMLINE I3
In situ diagnostics of the thermal decomposition of partially hydrated hafnium tetrachloride by time-of-light mass spectrometry.
R.Ruus1, R. Pärna1, K.Kooser2, E.Kukk2, S. Urpelainen3, and E. Nõmmiste1
1Institute of Physics, University of Tartu, Riia 142, 51014 Tartu, Estonia 2Dept. of Physics and Astronomy, University of Turku, FIN-20014 Turku, Finland
3MAX-laboratory, Lunds University, Sweden
HfCl4 is the most common precursor for atomic layer deposition (ALD) of hafnium dioxide, used as high-k dielectrics in manufacture of modern metal-oxide-semiconductor based nanoelectronic devices. In-situ vapor analysis of the hydrated hafnium tetrachloride in the process chamber was performed by using time-of-light (TOF) mass spectroscopy and monochromatized synchrotron radiation in order to understand the chemistry and reaction channels of ALD. The measurements were carried out on the FINEST branchline of beamline I3 at the MAX-III storage ring, utilizing the photon energy range 7-40 eV1. Using the Wiley-McLaren type ion TOF spectrometer2 the investigated mass range was from 10 to 1000 amu. For the vapor production of the HfCl4 (98%; Sigma-Aldrich) a resistively heated oven was used. The temperature in the evaporation zone and a temperature range at which the thermolysis was investigated were 35 – 120 oC. The pressure of the residuals was in the range of 10-6 mbars during the measurements.
Hafnium tetrachloride is very hygroscopic due to the strong affinity of the Hf4+ cation for O2 and reacts spontaneously with H2O to produce oxyhalide HfOCl2 evolving hydrogen chloride. Anhydrous hygroscopic oxochloride (and hydrated oxochloride HfOCl2·8H2O) decompose above 65 oC, yielding the dioxides3: .
Hafnium dioxide, HfO2, is very stable oxide of hafnium (melting point 2900 oC3), in contrast to the HfCl4 which sublimes at 317 oC (pressure 1 atm) or at 212 oC (0.01 atm)4. The HfCl4 compound studied in the present work was partially hydrated. Thermogravimetric analysis5 has shown that the partially hydrated HfCl4 powders consist in particles with HfCl4 core and a hydrated outer layer of HfOCl2·nH2O with n in the range of 0–8. The low-temperature (<200 oC) weight-loss was attributed to decomposition of HfOCl2·nH2O, for which n 4.
Figure 1. Mass intensity signals of Hf species for the thermal decomposition of hafnium tetrachloride, at 100.9 oC.
Figure 2. TOF mass spectra in the region of hydrogen chloride, at 100.9 oC.
150 180 210 240 270 300 330
Hf+
HfCl+
HfCl2+
HfCl3+
m/z
HfCl4+
T=100.9 oC
31 32 33 34 35 36 37 38 39
T=100.9 oC
Cl(37)+
m/z
HCl(37)+
HCl(35)+
Cl(35)+
O2+
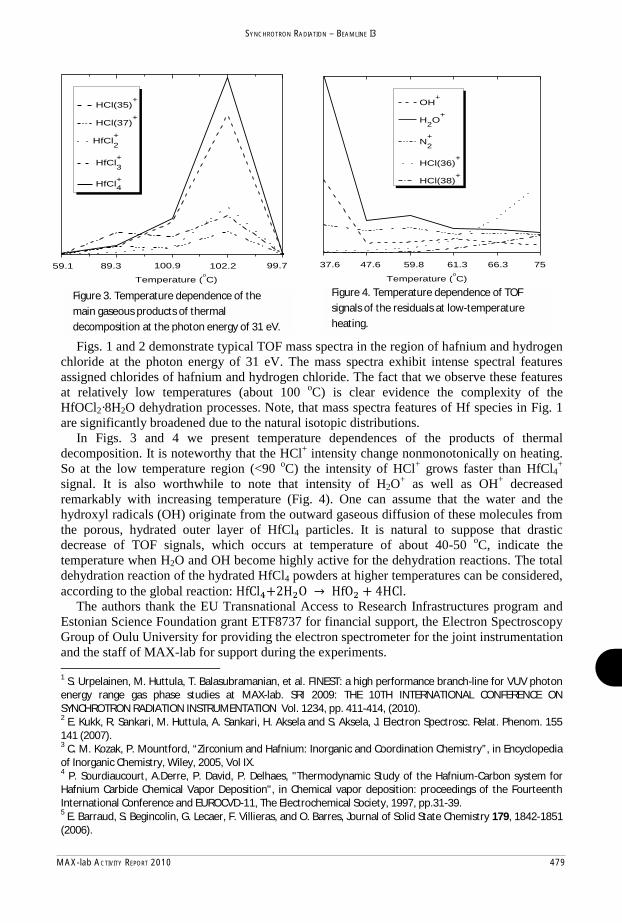
MAX-lab ACTIVITY REPORT 2010 479
SYNCHROTRON RADIATION – BEAMLINE I3
99.7102.2100.989.359.1
Temperature (oC)
HCl(35)+
HCl(37)+
HfCl+2
HfCl+3
HfCl+4
Temperature (oC)
37.6 47.6 59.8 61.3 66.3 75
OH+
H2O+
N+2
HCl(36)+
HCl(38)+
Figs. 1 and 2 demonstrate typical TOF mass spectra in the region of hafnium and hydrogen chloride at the photon energy of 31 eV. The mass spectra exhibit intense spectral features assigned chlorides of hafnium and hydrogen chloride. The fact that we observe these features at relatively low temperatures (about 100 oC) is clear evidence the complexity of the HfOCl2·8H2O dehydration processes. Note, that mass spectra features of Hf species in Fig. 1 are significantly broadened due to the natural isotopic distributions.
In Figs. 3 and 4 we present temperature dependences of the products of thermal decomposition. It is noteworthy that the HCl+ intensity change nonmonotonically on heating. So at the low temperature region (<90 oC) the intensity of HCl+ grows faster than HfCl4
+ signal. It is also worthwhile to note that intensity of H2O+ as well as OH+ decreased remarkably with increasing temperature (Fig. 4). One can assume that the water and the hydroxyl radicals (OH) originate from the outward gaseous diffusion of these molecules from the porous, hydrated outer layer of HfCl4 particles. It is natural to suppose that drastic decrease of TOF signals, which occurs at temperature of about 40-50 oC, indicate the temperature when H2O and OH become highly active for the dehydration reactions. The total dehydration reaction of the hydrated HfCl4 powders at higher temperatures can be considered, according to the global reaction: .
The authors thank the EU Transnational Access to Research Infrastructures program and Estonian Science Foundation grant ETF8737 for financial support, the Electron Spectroscopy Group of Oulu University for providing the electron spectrometer for the joint instrumentation and the staff of MAX-lab for support during the experiments. 1 S. Urpelainen, M. Huttula, T. Balasubramanian, et al. FINEST: a high performance branch-line for VUV photon energy range gas phase studies at MAX-lab. SRI 2009: THE 10TH INTERNATIONAL CONFERENCE ON SYNCHROTRON RADIATION INSTRUMENTATION Vol. 1234, pp. 411-414, (2010). 2 E. Kukk, R. Sankari, M. Huttula, A. Sankari, H. Aksela and S. Aksela, J. Electron Spectrosc. Relat. Phenom. 155 141 (2007). 3 C. M. Kozak, P. Mountford, “Zirconium and Hafnium: Inorganic and Coordination Chemistry”, in Encyclopedia of Inorganic Chemistry, Wiley, 2005, Vol IX. 4 P. Sourdiaucourt, A.Derre, P. David, P. Delhaes, "Thermodynamic Study of the Hafnium-Carbon system for Hafnium Carbide Chemical Vapor Deposition", in Chemical vapor deposition: proceedings of the Fourteenth International Conference and EUROCVD-11, The Electrochemical Society, 1997, pp.31-39. 5 E. Barraud, S. Begincolin, G. Lecaer, F. Villieras, and O. Barres, Journal of Solid State Chemistry 179, 1842-1851 (2006).
Figure 3. Temperature dependence of the main gaseous products of thermal decomposition at the photon energy of 31 eV.
Figure 4. Temperature dependence of TOF signals of the residuals at low-temperature heating.

480 MAX-lab ACTIVITY REPORT 2010
SYNCHROTRON RADIATION – BEAMLINE I3
Figure 1. Thfinal statespresent.
he PIY spectrum of the resonan
m of Sb4 clustersnt Auger decay
s just below they process are h
e 4d ionization ighly dissociativ
threshold. The ve as only a ve
PIY spectrum sery small amou
shows clearly thunt of Sb4 catio
hat the ons are
Disssociation o
S. U
1MA
3Dep
of Sb4 clust
Urpelainen1,2,
AX-lab, Lund
2Departm
partment of P
4Institu
ters followresonan
K. Kooser3, D
University, P
ment of Physic
Physics and As
ute of Physics,
wing 4d cornt Auger de
D. T. Ha3, E.
P.O. Box 118,
cs, University
stronomy, Un
, University of
re excitatioecay
Nõmmiste4, a
SE-221 00 L
y of Oulu, Fin
niversity of Tu
of Tartu, Esto
on and the
and E. Kukk3
Lund, Sweden
nland
urku, Finland
nia
subsequen
d
nt
The fragmresonant I3 of the ion coincrecorded time-of-ffor recorThe recodissociat
mentation pAuger decayMAX-III st
cidence (PEusing a PE
flight (TOF) rding the PIYorded PIY ive nature of
atterns of Sby process wtorage ring. T
EPICO) and EPICO appar
spectrometeY spectrum.spectrum isf the final sta
b4 clusters fere studied oThe fragmenpartial ion
ratus consister built in Tu. The Sb4 vas presented ates of the re
following theon the FINEntation of thyield (PIY)
ting of the Surku. The saapor was ge
in Fig. 1.esonant Aug
e 4d core exEST branch ohe Sb4 cluste) techniquesSES-100 andame ion TOFenerated usin
The PIY ger decay fol
xcitation andof the the uner was studies. The PEPId a Wiley-MF spectromeng a resistivspectrum shllowing the 4
d the subseqndulator beamed using elecICO events
McLaren-typter was used
vely heated ohows the h4d excitation
qurent mline ctron-were
pe ion d also oven.
highly n.

MAX-lab ACTIVITY REPORT 2010 481
SYNCHROTRON RADIATION – BEAMLINE I3
The PEPICas no disremoval ofragmentafragmenta
[1] S. Urpe
Figure
CO map showsociation tak
of two electroation of the cation of the c
elainen, J. Nisk
2. The PEPICO m
ws that the oukes place afteons from the cluster. The rcation .
kanen, J. A. Ke
map from Sb4 cl
uter valence eer removing outer valenceemoval of ele
ettunen, M. Hu
usters with fals
electrons do one electrone orbitals alreectrons from
uttula, and H. A
e coincidence e
not contributn from one oeady starts tothe inner va
Aksela, Phys. R
events subtracte
te to the bonof these orbito weaken thelence orbitals
Rev. A 83, 0152
ed.
ding of the ctals. Howeve bonds results always lead
201 (2011).
luster r, the ting in
ds to a
In order tthe photoin the binvalence (5where nl correlatiopresented
to further stuon energy cornding energy5t24a1)-1 and indicates and
on effects. Thd in Fig. 2.
udy the dissorresponding ty region 7.6 shake-up and
d excited electhe PEPICO r
ociation proceo the top of teV to 18.75
d correlation tronic state decorded PEP
esses in morethe first reson
eV corresposatellite stat
due to a shakePICO map wi
e detail the Pnance featureonding to oues (2e6t25a1)e-up process ith false coin
PEPICO mapse. The electrouter valence )-2nl/n’l’ and (and n’l’ an ex
ncidence eve
were recordons were coll(2e6t25a1)-1,
(5t24a1)-2nl/n’xcited state dents subtract
ded at ected inner
’l’ [1], due to ted is

482 MAX-lab ACTIVITY REPORT 2010
SYNCHROTRON RADIATION – BEAMLINE I3
Spin Resolved Photoemission Spectroscopy at MAX; the detector upgrade and
first data from a 1D topological surface
J. W. Wells,1, ∗ J. E. Wahlstrom,1 T. Balasubramanian,2 and M. Leandersson2
1Norwegian University of Science and Technology (NTNU), Trondheim, Norway.2MAXlab, S-22100 Lund, Sweden
(Dated: March 18, 2011)
300x103
250
200
150
100
50
0
Inte
nsity
(co
unts
)
0.4 0.2 0.0Binding energy (eV)
0.4 0.2 0.0Binding energy (eV)
6
4
2
0
-2
-4
-6
pola
risat
ion
(%)
0.4 0.2 0.0Binding energy (eV)
out-of-plane in-plane
0.4 0.2 0.0Binding energy (eV)
(a)
(b) (c)
(d) (e)
FIG. 1: The surface electronic structure ofAu(111); panel (a) shows an overview of theRashba split parabolic state, and the two greenlines indicate the momenta at which EDCswere made using the MAX Mott detectors.Panels (b) and (c) show the raw 4-channelEDCs and (d) and (e) show the uncorrectedpolarisations extracted from the EDCs. Thespin vector has a strong in-plane polarisation,and the spin direction (reversed between (d)and (e)) agrees with a simple Rashba model.
Detector test - Au(111): Following the replace-ment of the channeltrons at the Spin-resolving ARPESbeamline I3 of MAX3 [1], a test was performed onthe Rashba-split parabolic surface state of Au(111) (seeFig. 1). Panel (a) shows the spin-integrated photoemis-sion intensity of the surface state (actual measurementfrom Ph. Hofmann [6], after reference [2]). From thisoverview two energy distribution curves (EDCs) are cho-sen and remeasured using the 4-channel Mott detectorsat I3. The position of the two EDCs is indicated by thevertical green dashed lines, and the 4 spin signal EDCsare plotted as panels (b) and (c). From these 4-channelEDCs, it is straightforward to extract the uncorrected[7] polarisation as simply P‖ = (I→ − I←)/(I→ + I←)and P⊥ = (I↑ − I↓)/(I↑ + I↓) where P‖ and P⊥ are thein-plane and out-of-plane polarisations respectively, andI↑, I↓, I←, I→ are the intensities measured by the fourspin-selective Mott detectors as plotted in panels (b)and (c). The resulting in-plane and out-of-plane polar-isations are plotted in panels (d) and (e) of Fig. 1.
As expected, from previous studies in this surface [3],the Au(111) surface state shows a large in-plane reversalin polarisation, consistent with the Rasba spin splittingof the state. Between Fig 1 (d) and (e) the polarisa-tion is reversed - consistent with the spin-orbit couplednature of the state. The magnitude of the measured po-larisation is ≈ 5 % and the raw EDC count rate is good[8], indicating that the machine is performing very well.
Vicinal surfaces of bismuth: Bismuth is one ofthe heaviest stable elements, and hence has unusu-ally strong spin-orbit coupling associated with its elec-tronic surface states [4]. By preparing strongly vici-nal surfaces, we have previously demonstrated the 1-dimensional (1D) surfaces can be engineered, and thatthey support strongly 1D spin-split surface states [5].
Here we have used a new vicinal surface Bi(441), whichis also expected to have 1D character - a real-space trun-
cated bulk model of surface is depicted in Fig. 2(a). The 1D nature of the surface states isconfirmed by recent ARPES measurements both at I3 and at ASTRID - an image throughnormal emission collected at I3 is shown as Fig. 2(b).
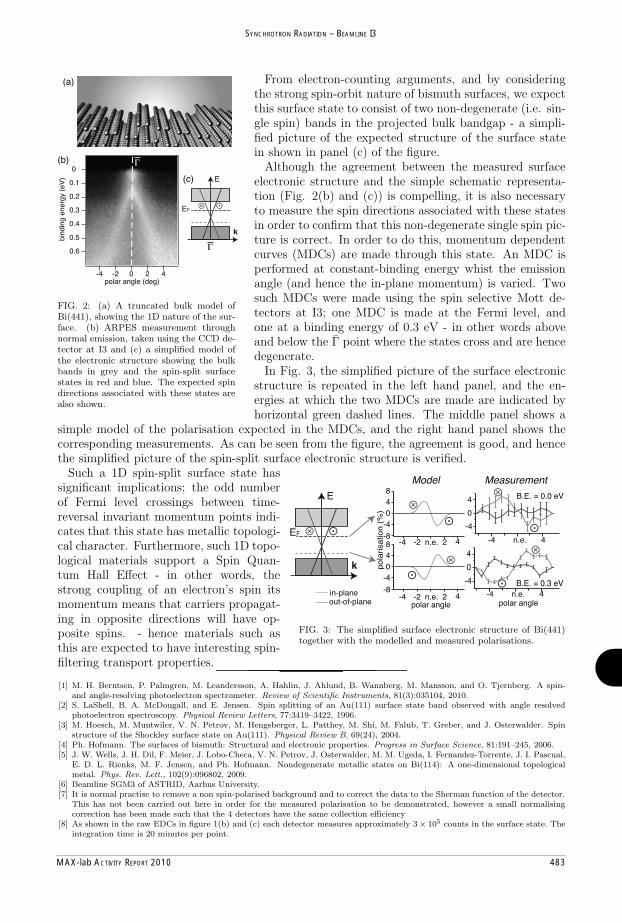
MAX-lab ACTIVITY REPORT 2010 483
SYNCHROTRON RADIATION – BEAMLINE I3
[1] M. H. Berntsen, P. Palmgren, M. Leandersson, A. Hahlin, J. Ahlund, B. Wannberg, M. Mansson, and O. Tjernberg. A spin-and angle-resolving photoelectron spectrometer. Review of Scientific Instruments, 81(3):035104, 2010.
[2] S. LaShell, B. A. McDougall, and E. Jensen. Spin splitting of an Au(111) surface state band observed with angle resolvedphotoelectron spectroscopy. Physical Review Letters, 77:3419–3422, 1996.
[3] M. Hoesch, M. Muntwiler, V. N. Petrov, M. Hengsberger, L. Patthey, M. Shi, M. Falub, T. Greber, and J. Osterwalder. Spinstructure of the Shockley surface state on Au(111). Physical Review B, 69(24), 2004.
[4] Ph. Hofmann. The surfaces of bismuth: Structural and electronic properties. Progress in Surface Science, 81:191–245, 2006.[5] J. W. Wells, J. H. Dil, F. Meier, J. Lobo-Checa, V. N. Petrov, J. Osterwalder, M. M. Ugeda, I. Fernandez-Torrente, J. I. Pascual,
E. D. L. Rienks, M. F. Jensen, and Ph. Hofmann. Nondegenerate metallic states on Bi(114): A one-dimensional topologicalmetal. Phys. Rev. Lett., 102(9):096802, 2009.
[6] Beamline SGM3 of ASTRID, Aarhus University.[7] It is normal practise to remove a non spin-polarised background and to correct the data to the Sherman function of the detector.
This has not been carried out here in order for the measured polarisation to be demonstrated, however a small normalisingcorrection has been made such that the 4 detectors have the same collection efficiency
[8] As shown in the raw EDCs in figure 1(b) and (c) each detector measures approximately 3× 10⁵ counts in the surface state. Theintegration time is 20 minutes per point.
0
0.1
0.2
0.3
0.4
0.5
0.6
bind
ing
ener
gy (
eV)
420-2-4polar angle (deg)
k
E
EF
(a)
(b)
(c)
Γ
Γ
FIG. 2: (a) A truncated bulk model ofBi(441), showing the 1D nature of the sur-face. (b) ARPES measurement throughnormal emission, taken using the CCD de-tector at I3 and (c) a simplified model ofthe electronic structure showing the bulkbands in grey and the spin-split surfacestates in red and blue. The expected spindirections associated with these states arealso shown.
From electron-counting arguments, and by consideringthe strong spin-orbit nature of bismuth surfaces, we expectthis surface state to consist of two non-degenerate (i.e. sin-gle spin) bands in the projected bulk bandgap - a simpli-fied picture of the expected structure of the surface statein shown in panel (c) of the figure.
Although the agreement between the measured surfaceelectronic structure and the simple schematic representa-tion (Fig. 2(b) and (c)) is compelling, it is also necessaryto measure the spin directions associated with these statesin order to confirm that this non-degenerate single spin pic-ture is correct. In order to do this, momentum dependentcurves (MDCs) are made through this state. An MDC isperformed at constant-binding energy whist the emissionangle (and hence the in-plane momentum) is varied. Twosuch MDCs were made using the spin selective Mott de-tectors at I3; one MDC is made at the Fermi level, andone at a binding energy of 0.3 eV - in other words aboveand below the Γ point where the states cross and are hencedegenerate.
In Fig. 3, the simplified picture of the surface electronicstructure is repeated in the left hand panel, and the en-ergies at which the two MDCs are made are indicated byhorizontal green dashed lines. The middle panel shows a
simple model of the polarisation expected in the MDCs, and the right hand panel shows thecorresponding measurements. As can be seen from the figure, the agreement is good, and hencethe simplified picture of the spin-split surface electronic structure is verified.
k
E
-8
-4048
-4 -2 n.e. 2 4
polar anglein-planeout-of-plane
-4
0
4
po
larisa
tion
(%
)
B.E. = 0.3 eV
-4
0
4
4n.e.-4
B.E. = 0.0 eV
-4 -2 n.e. 2 4polar angle
4n.e.-4-8
-4048
EF
Model Measurement
FIG. 3: The simplified surface electronic structure of Bi(441)together with the modelled and measured polarisations.
Such a 1D spin-split surface state hassignificant implications; the odd numberof Fermi level crossings between time-reversal invariant momentum points indi-cates that this state has metallic topologi-cal character. Furthermore, such 1D topo-logical materials support a Spin Quan-tum Hall Effect - in other words, thestrong coupling of an electron’s spin itsmomentum means that carriers propagat-ing in opposite directions will have op-posite spins. - hence materials such asthis are expected to have interesting spin-filtering transport properties.

484 MAX-lab ACTIVITY REPORT 2010
SYNCHROTRON RADIATION – BEAMLINE I4
Surface structure, charge transfer and core level shifts on fcc(111)-I 3 and 7 surfaces
Sareh Ahmadi, Shun Yu, Mats Leandersson, Jonas Weissenrieder and Mats Göthelid Materialfysik, KTH and MAXLAB
Iodine/iodide is used as redox couple in the Grätzel type solar cells. Charge is transferred from the metal electrode (usually a platinized oxide) by splitting of I3
- into 3I-. They donate charge and recombine into I3
- on the dye sensitized TiO2 electrode (the working electrode). Much effort has been put into understanding and improving the working electrode, but much less on the counter electrode. In order to improve the understanding of this side we have studied and compared some iodine induced structures on Au(111), Pt(111) and Pd(111) using valence band and core level spectroscopy at I4. One can question the relevance of such studies for real solar cell devices, but it has been shown by STM that iodine structures on Pd and Pt grown in solution share the same atomic geometry as those formed in UHV.
Halogens have been studied on several close packed fcc surfaces [1]. A commonly observed structure is the (√3x√3)R30° phase at 1/3 ML halogen coverage. On Pd(111)-I it was found by normal incidence X-ray standing wavefield absorption that iodine occupies the fcc hollow [1]. The equivalent adsorption site was also proposed for iodine on Cu(111) [2], iodine on Pt(111) [3] and iodine on Rh(111) [4]. In addition to the 1/3 ML (√3x√3)R30° structure on the Pt(111) surface, a (√7x√7)R19.1° structure was observed at 0.43 ML and a (3x3) structure at higher coverage [5,6]. Both these latter structures were determined to be commensurate iodide adlayer structures [5].
On all three clean surfaces a core level shift (SCLS) to lower binding energy is observed. In all three cases this SCLS is removed when iodine adsorbs in the hollow site to form the 3 structure. Recent theory on Pt(111)-I [7] and Pd(111)-I [8] suggest that I is neutral in this position. Formation of the 7 structure induces rather different changes; on Au there is a weak broadening on the low binding energy side, on Pt a weak broadening instead appears on the high binding energy side and on Pd a new chemically shifted component due to iodide formation is observed. I4d spectra are shown below. On all three 3 surfaces a single component is observed. The binding energies vary slightly between the surfaces. The widths are dramatically different; sharp on Pd(111), broad on Au(111) and broader on Pt(111). These differences are accentuated even more on the 7 structures; a moderate shift of the single component to lower binding energy on Au(111), a large chemical shift on Pt(111) and two new chemically shifted species on Pd(111). These differences in chemistry are accompanied by differences in electronic structure and the charge donating capacity of the different surfaces.

MAX-lab ACTIVITY REPORT 2010 485
SYNCHROTRON RADIATION – BEAMLINE I4
Experimental LEED patterns from Au(111)-I, together with a calculated ( 7x 7)R19° pattern.
This work was supported by the Swedish Research Council (VR) and the Göran Gustafsson Foundation.
References 1 V.R. Dhanak, A.G. Shard, S. D'Addato, and A. Santoni,
Chem Phys. Lett 306 (1999) 341 2 M. Pascal, C.L.A. Lamont, M. Kittel, J.T. Hoeft, L. Constant, M. Polcik, A.M. Bradshaw,
R.L. Toomes, and D.P. Woodruff, Surf. Sci. 512 (2002) 173 3 M. Saidy, K.A.R. Mitchell, S.A. Furman, M. Labayen, and D.A. Harrington,
Surface Review and Letters 6 (1999) 871 4 A.G. Shard, V.R. Dhanak, and A. Santoni, Surf. Sci. 429 (1999) 279 5 C.A. Lucas, N.M. Markovic and P.N. Ross, Phys. Rev. B55 (1997) 7964 6 D.G. Frank, O.M.R. Chyan, T. Golden, and A.T. Hubbard,
J. Phys. Chem. 97 (1993) 3829 7 A. Tkatchenko, N. Batina, A. Cdeillo, M. Galvan, Surf. Sci. 581 (2005) 58 8 M. Göthelid, H. von Schenck, J. Weissenrieder, B. Åkermark, A. Tkatchenko and M.
Galvan, Surf. Sci. 600 (2006) 3093

486 MAX-lab ACTIVITY REPORT 2010
SYNCHROTRON RADIATION – BEAMLINE I4
Photoemission from Graphene on SiC: asymmetry of replicas

MAX-lab ACTIVITY REPORT 2010 487
SYNCHROTRON RADIATION – BEAMLINE I4
78858
666

488 MAX-lab ACTIVITY REPORT 2010
SYNCHROTRON RADIATION – BEAMLINE I4
Electronic structure of the thallium induced 2 1 reconstruction on Si(001) P.E.J. Eriksson1, Kazuyuki Sakamoto2, and R.I.G. Uhrberg1
1Department of Physics, Chemistry and Biology, Linköping University, S-581 83 Linköping, Sweden
2Graduate School of Advanced Integration Science, Chiba University, Chiba 263-8522, Japan
P.E.J. Eriksson, K. Sakamoto, and R.I.G. Uhrberg, Electronic structure of the thallium induced 2x1 reconstruction on Si(001), Phys. Rev. B 81, 20422, 2010.
With a Tl coverage of one monolayer (ML), a 2 1 reconstruction is formed on the Si(001) surface at room temperature. In this study, low temperature angle resolved photoelectron spectroscopy (ARPES) data reveal four surface state bands associated with this Tl induced reconstruction. Calculated surface state band dispersions, obtained using the “pedestal + valley-bridge” model, are found to be similar to those obtained using ARPES. Inclusion of spin-orbit coupling is found to be important for the calculations to arrive at these results. A known effect of the strong spin-orbit coupling is the reluctance of the Tl 6s2 electrons to participate in the bonding, i.e., the inert pair effect. In the calculations, inclusion of spin-orbit coupling results in a 5 eV downshift of the Tl 6s2 electrons, away from the dispersive surface states close to the Fermi level. The atomic and electronic structures of reconstructions, induced by adsorption of group III metals on Si surfaces, have attracted a lot of attention through the years. These studies have mainly been focused on Al, Ga and In. Only recently, the attention has turned to Tl, the heaviest of the group III metals. Tl exhibits the peculiar inert pair effect, i.e., the 6s2 electrons tend to not participate in the bonding due to the strong spin-orbit coupling. As a consequence, Tl can exhibit a 1+ valence state, contrary to the other group III metals. By varying the temperature conditions, Tl was found to exhibit both the 1+ and the 3+ valence states in a study of the Si(111):Tl surface. Later, the valence state was found to be independent of coverage, as no evidence of the 3+ valence state was found for Tl coverages up to 1 monolayer (ML) in a core-level study of the same surface. At sub ML Tl coverages, the Si(001) surface exhibits a series of 2 2 reconstructions, while a 2 1 reconstruction is formed at 1 ML. Of the group III metals, Tl is the only one that gives rise to a 1 ML 2 1 reconstruction. Total energy calculations and scanning tunneling microscopy (STM) have suggested that the “pedestal + valley-bridge” model is the likely atomic structure of this surface. The Si(001):Tl surface has been shown, using STM, to transform into a (6,1) (0,6) periodicity. This is, however, not observed in low energy electron diffraction (LEED). The diffraction pattern resembles that of a c(4 6) periodicity. The variable valence state and the low temperature phase transitions make the Tl induced reconstructions interesting. Further, Tl/Si(001) has a possibility to show interesting spin splitting that originates from the Rashba effect, in similarity with Ti/Si(111) and Bi/Si(111).
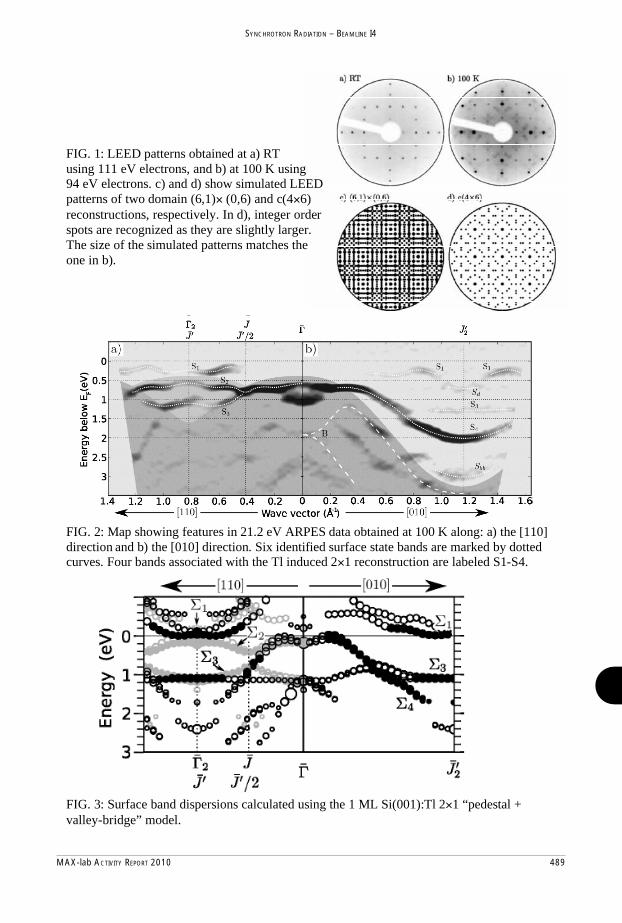
MAX-lab ACTIVITY REPORT 2010 489
SYNCHROTRON RADIATION – BEAMLINE I4
FIG. 1: LEED patterns obtained at a) RT using 111 eV electrons, and b) at 100 K using 94 eV electrons. c) and d) show simulated LEED patterns of two domain (6,1) (0,6) and c(4 6) reconstructions, respectively. In d), integer order spots are recognized as they are slightly larger. The size of the simulated patterns matches the one in b). FIG. 2: Map showing features in 21.2 eV ARPES data obtained at 100 K along: a) the [110] direction and b) the [010] direction. Six identified surface state bands are marked by dotted curves. Four bands associated with the Tl induced 2 1 reconstruction are labeled S1-S4. FIG. 3: Surface band dispersions calculated using the 1 ML Si(001):Tl 2 1 “pedestal + valley-bridge” model.

490 MAX-lab ACTIVITY REPORT 2010
SYNCHROTRON RADIATION – BEAMLINE I4
Photoemission study of (Zn,Co)O films with uniform Co distribution
E. Guziewicz1, M.I. ukasiewicz1, L. Wachnicki1, K. Kopalko1 and M. Godlewski1,2
1 Inst. of Physics, Polish Academy of Sciences, Al Lotnikow 32/46, 02-668 Warszawa, Poland 2 Dept. of Mathematics and Natural Sciences, UKSW, Dewajtis 5, 01-815 Warsaw, Poland
Diluted magnetic semiconductors (DMS) have been recently intensively studied for spintronic applications [1,2] and ZnCoO focuses a great part of an attention here [3,4]. Ferromagnetic ordering in (Zn,Co)O has been found and reported by several groups, but the origin of the ferromagnetism is still not clear. It has been related to defects in the ZnO lattice, formation of foreign phases like CoO and metal accumulations of the nanometers scale or uncompensated spins at the ZnCoO surface with higher Co content [5,6]. Dimensions of inclusions that contribute to room temperature ferromagnetism can be at the level of only few nm, so very difficult to detect. There are only few resonant photoemission results on a (Zn, Co)O system reported to date [7, 8]. In each of these papers, experimental photoemission data were obtained for only one (Zn, Co)O sample and none of them related the electronic structure with the Co content and distribution. The aim of the photoemission measurements was to partially fill this gap.
14 12 10 8 6 4 2 00.0
0.2
0.4
0.6
0.8
1.0
1.2
1.4
PE
S in
tens
ity [a
rb. u
nits
]
Binding Energy [eV]
66 eV 65 eV 64 eV 63 eV 62 eV 61 eV 60 eV 59 eV 58 eV 57 eV 56 eV 55 eV 54 eV 53 eV 52 eV 51 eV 50 eV 49 eV 48 eV 47 eV
ZnCoO
Zn3d
3.5% Co
16 14 12 10 8 6 4 2 0
0.0
0.1
0.2
0.3
0.4
0.5
0.6 (Zn,Co)O
PES
inte
nsity
[arb
. uni
ts]
Binding Energy [eV]
63 eV 58 eV ΔEDC2% Co
16 14 12 10 8 6 4 2 00.0
0.1
0.2
0.3
0.4
F175
(Zn,Co)O 58 eV Δ EDC 63 eV
PES
inte
nsity
[arb
. uni
ts]
Binding Energy [eV]
3.5% Co
16 14 12 10 8 6 4 2 0
0.0
0.1
0.2
0.3
0.4
0.5
0.6
F179
(Zn,Co)O 63 eV Δ EDC 58 eV
PES
inte
nsity
[arb
. uni
ts]
Binding Energy [eV]
7% Co
Figure 1. Left: EDC spectra of the (Zn,Co)O film with 3.5% Co measured across the Co3p Co3d resonance. Thicker lines shows resonant (63 eV, red on-line) and anti-resonant (58 eV, orange on-line) spectra. Right: EDC spectra taken at resonance (63 eV, blue solid circles) and anti-resonance (58 eV, black open triangles) photon energy along with the calculate difference curve ( EDC, red open circles).

MAX-lab ACTIVITY REPORT 2010 491
SYNCHROTRON RADIATION – BEAMLINE I4
The investigated (Zn,Co)O films were grown by the Atomic Layer Deposition (ALD) method at the same temperature of 1600C and using the same zinc, cobalt and water precursors (dimethylzinc, Co(acac)2 and water, respectively). We studied three samples with the Co content 2%, 3.5% and 7% as measured by SIMS and EDX. The experiment was performed at the I4 beamline at MAXLAB. All the films were uniform and the EDX signal showed a homogeneous Co and Zn distribution in the 200 nm x 200 nm scale. We used the resonant photoemission spectroscopy, which is as an effective tool for identification of the Co3d ion charge states in the valence band electronic structure of the (Zn,Co)O material. EDC’s were taken for photon energies between 47 eV and 66 eV, e.g. across the Co3p Co3d transition. In Fig. 1(left) we show the set of Energy Distribution Curves (EDC’s) for (Zn,Co)O film with 3.5% of Co. For all three investigated films the maximum of the Fano resonance was observed at photon energy 63 eV and the minimum at 58 eV. In Fig. 1 (right) we present resonant and anti-resonant EDC spectra for films containing 2% Co, 3.5% Co and 7% Co. We also show the difference spectra ( EDC) that is related to the Co3d contribution to the valence band of the (Zn,Co)O system. We noticed that resonant enhancement of the photoemission intensity from the Co3d shell does not scale with the cobalt content. The strongest photoemission response from the Co3d electron shell was observed for (Zn,Co)O film with 3.5% of cobalt. The resonant photoemission signal from the Co3d states for (Zn,Co)O films with 7% of Co was similar to that which was obtained for (Zn,Co)O film with 2% of cobalt. Moreover, we also noticed that films with different content of cobalt give different Co3d contributions to the valence band electronic structure. For films containing 3.5% of Co we observe only one Co3d contribution, which is located between 2 eV and 4 eV below the Fermi level with the maximum at 3 eV (see Fig. 3b). For two remaining (Zn,Co)O films the additional Co3d contribution at higher binding energy is also present. In case of film with 2% of Co it is located 9 eV below the Fermi level (see Fig. 3a), while for (Zn,Co)O film with 7% of Co it is observed at 7.4 eV below the Fermi level (see Fig. 3c). The observed differences are tentatively ascribed to different hydrogen content, as we suppose that hydrogen promotes correlation of the Co3d electrons.
Acknowledgements : The research leading to these results has received funding from European Union within the European Regional Development Fund, through grant Innovative Economy (POIG.01.01.02-00-008/08) and the European Community's Seventh Framework Programme (FP7/2007-2013) under grant agreement nº 226716.
[1] K. Ueda, H. Tabata, T. Kawai, Appl. Phys. Lett. 79, 988 (2001) [2] Bonanni, A., Dietl, T., Chem. Soc. Rev. 39, 528 (2010) [3] Gilliland, S.G., Sans, J.A., Sanchez-Royo, J.F., Almonacid, G., Segura, A., Appl. Phys.
Lett. 96, 241902 (2010) [4] Zhang, X., Cheng, Y.H., Li, L.Y., Liu, H., Zuo, X., Wen, G.H., Li, L., Zheng, R.K.,
Ringer, S.P., Phys. Rev. B80, 174427 (2009) [5] Coey, J.M.D., Wongsaprom, K., Alaria J., Venkatesan, M., J. Phys. D Appl. Phys. 41,
134012 (2008) [6] Park, J.H., Kim, M.G., Jang, H.M., Ryu, S., Kim, Y.M., Appl.Phys. Lett. 84, 1338 (2004) [7] Wi, S.C., Kang, J.-S., Kim, J.H., Cho, S.-B., Kim, B.J., Yoon, S., Suh, B.J., Han, S.W., Kim, K.H., Kim, K.J., Kim, B.S., Song, H.J., Shin H.J., Shim, J.H., Min, B.I., Appl. Phys. Lett. 84, 4233 (2004) [8] Kobayashi, M., Ishida, Y., Hwang, J.I., Mizokawa, T., Fuijmori, A., Mamiya, K., Okamoto, J., Takeda, Y., Okane, T., Saitoh, Y., Muramatsu, Y., Tanaka, A., Saeki, H., Tabata, H., Kawai, T., Phys. Rev. B72, 201201(R) (2005).

492 MAX-lab ACTIVITY REPORT 2010
SYNCHROTRON RADIATION – BEAMLINE I4
Self-organized trimesic-acid nanomesh on Cu(100): adsorption geometry of the TMA molecules
M. Hirsimäki 1, R. Pärna2, H. Ali-Löytty1, P.Jussila1, E. Nõmmiste2, and M. Valden1
1Surface Science Laboratory, Tampere University of Technology (TUT), P.O. Box 692, FIN-33101 Tampere, Finland (www.tut.fi/surfsci)
2Institute of Physics, University of Tartu, Riia 142, 51014 Tartu, Estonia
Self-organization of organic molecules into metallosupramolecular nanotemplates on metals and metal oxides is a promising avenue for bottom-up fabrication of functional surfaces. In particular, molecular species with functional groups for both intermolecular hydrogen bonding and covalent surface bonding readily facilitate self-assembly of highly organized and robust nanostructures. Potential applications range from enhanced surface corrosion resistance to covalent and specific immobilization of proteins in specific conformations and orientations for biosensor and implant technologies.
In the present study, the adsorption of trimesic acid (TMA) has been investigated on metallic Cu(100). While Cu is not widely used in bioapplications, its propensity to adopt a nanopatterned surface structure upon adsorption of molecules such as oxygen and nitrogen is highly useful for future studies in this field.
The Cu(100) surface was cleaned by cycles of Ar-ion bombardment at 500 K followed by annealing to 650 K. TMA was adsorbed on the surface at 300 K with physical vapor deposition in ultra high vacuum. Adlayers were investigated by Angle Resolved Ultraviolet Photoelectron Spectroscopy (ARUPS) at beamline I4 at MAX III. Scanning tunneling microscopy (STM) experiments were performed at TUT.
Figure 1 shows STM images from TMA covered Cu(100) at room temperature. As seen in Figures 1(a) and (b), at low coverages, TMA adsorbs preferentially at migrating Cu aggregates. As the coverage is increased, the TMA molecules begin to form a well-ordered nanomesh. This can be seen in Figures 1(c-f).
Figure 1: STM images of TMA/Cu(100) at the coverage of 2.8 Å (aand b) and 5.0 Å (c – f). The tunneling parameters: (a,b) the sample bias voltage VS = +0.42 V, the tunneling current IT = 479 pA; (c-e) VS
= -1.60 V, IT = 550 pA; (f) VS = -1.40 V, IT = 500 pA.
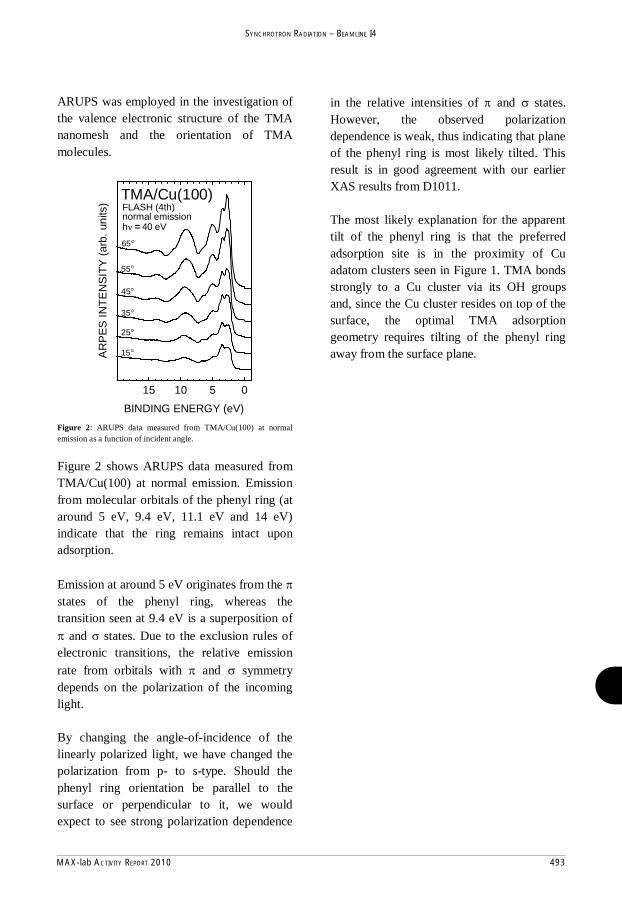
MAX-lab ACTIVITY REPORT 2010 493
SYNCHROTRON RADIATION – BEAMLINE I4
ARUPS was employed in the investigation of the valence electronic structure of the TMA nanomesh and the orientation of TMA molecules.
Figure 2: ARUPS data measured from TMA/Cu(100) at normal emission as a function of incident angle.
Figure 2 shows ARUPS data measured from TMA/Cu(100) at normal emission. Emission from molecular orbitals of the phenyl ring (at around 5 eV, 9.4 eV, 11.1 eV and 14 eV) indicate that the ring remains intact upon adsorption.
Emission at around 5 eV originates from the states of the phenyl ring, whereas the transition seen at 9.4 eV is a superposition of
and states. Due to the exclusion rules of electronic transitions, the relative emission rate from orbitals with and symmetry depends on the polarization of the incoming light.
By changing the angle-of-incidence of the linearly polarized light, we have changed the polarization from p- to s-type. Should the phenyl ring orientation be parallel to the surface or perpendicular to it, we would expect to see strong polarization dependence
in the relative intensities of and states. However, the observed polarization dependence is weak, thus indicating that plane of the phenyl ring is most likely tilted. This result is in good agreement with our earlier XAS results from D1011.
The most likely explanation for the apparent tilt of the phenyl ring is that the preferred adsorption site is in the proximity of Cu adatom clusters seen in Figure 1. TMA bonds strongly to a Cu cluster via its OH groups and, since the Cu cluster resides on top of the surface, the optimal TMA adsorption geometry requires tilting of the phenyl ring away from the surface plane.
15 10 5 0
FLASH (4th)
65
h = 40 eV
35
55
45
25
15
normal emission
TMA/Cu(100)
AR
PES
INTE
NSI
TY (a
rb. u
nits
)
BINDING ENERGY (eV)

494 MAX-lab ACTIVITY REPORT 2010
SYNCHROTRON RADIATION – BEAMLINE I4
Combined experimental and theoretical study of surface core-level shifts on Ge(111)-c(2××8)
M. Kuzmin,1 M.J.P. Punkkinen,1 P. Laukkanen,1 J.J.K. Lång,1 J. Dahl,1 V. Tuominen,1 M. Tuominen,1 R.E. Perälä,1 T. Balasubramanian,2 J. Adell,2 K. Kokko,1 and I.J. Väyrynen1
1 Department of Physics and Astronomy, University of Turku, FIN-20014 Turku, Finland 2MAX-lab, Lund University, SE-221 00 Lund, Sweden
The number and atomic origin of components in core-level photoemission from the clean
Ge(111)-c(2×8) surface so far remain an open issue. Typically, two surface core-level shifts (SCLS) have been found in 3d spectra taken with the total-energy resolution of 0.2-0.3 eV [1-6]. A third SCLS has been identified in spectra taken with higher resolution (80 meV) [7]. The assignment of these SCLS to individual atoms is still debated, which is hindered by the large size of the c(2×8) unit cell and the lack of ab initio core-level calculations.
In this study, we demonstrate the presence of four SCLS in the 3d spectra of Ge(111)-c(2×8) measured with improved resolution (48-58 meV), and interpret these data on the basis of density functional theory (DFT) calculations. The measurements were performed on beamline I4 at MAX-III by using a SPECS Phoibos 100 electron analyzer. The spectra were taken at 100 K with photon energies h = 40-90 eV and emission angles θe = 0-80°. The acceptance angle was ±8°. The Ge(111)-c(2×8) surface was prepared by repeated cycles of 700−1000-eV Ar+ sputtering at 775 K and subsequent annealing at 900 K until a sharp low-energy electron diffraction pattern was observed. The calculations were carried out by using Vienna ab initio simulation package (VASP).
Figs. 1 and 2 show Ge 3d spectra measured at various experimental conditions and their decompositions, respectively. The spectra are fitted by five spin-orbit-split Voigt functions which are the bulk (B) and surface (S1-S4) components. The binding energies of S1-S4 are respectively -0.290, -0.755, +0.150, and -0.125 eV relative to the bulk. The spin-orbit splitting and Lorentzian width are respectively 0.588 and 0.150 eV for all the components. The branching ratio is 0.658±10% at θe = 0° and 0.663±10% at θe = 60°. The Gaussian width is found to vary between 0.161 and 0.250 eV for different components. Fig. 3 illustrates residuals obtained in three fitting schemes: the fit with four surface components (Fig. 2) and two other fits with three and five surface components (not shown). It is seen that three surface components are not enough to reproduce the 3d spectrum around the relative binding energies of -0.2 eV and 0.35 eV (note that in this range, the S4 is identified in Fig. 2). An introducing of the fifth surface component, in contrast, does not lead to any noticeable improvement of the fit quality. Thus, we propose the fitting scheme with the four SCLS (S1-S4) which describes the 3d spectra adequately.
In order to interpret the measured SCLS, DFT calculations were performed by VASP. The slab with the full-periodicity c(2×8) surface unit was used. The SCLS were calculated for two different fully optimized atomic configurations: the structure with the adatoms at T4 sites, which is energetically favorable, and the structure with the adatoms at H3 sites, which is slightly less stable. In Fig. 4, the calculation results, i.e. the initial state and complete screening DFT SCLS and the differences between these values (SCLSIS, SCLSCS, and SCLS), are shown for the two structures. The analysis reveals that the Ge 3d line shape can be reproduced well within the initial state model, and that the measured shifts agree fairly with the T4 structure. On this basis, the following assignments are made: the atomic origin of S2 is the rest atoms, and the origin of S3 is the adatoms and third-layer atoms which are below the adatoms. The S1 and S4 are contributed by the first- and second-layer atoms, with the core-level binding-energy splitting of these atoms being too small to resolve in experiment.

MAX-lab ACTIVITY REPORT 2010 495
SYNCHROTRON RADIATION – BEAMLINE I4
[1] S. B. DiCenzo, P. A. Bennett, D. Tribula et al., Phys. Rev. B 31, 2330 (1985). [2] R. D. Bringans, M. A. Olmstead, R. J. G. Uhrberg et al., Phys. Rev. B 36, 9569 (1987). [3] J. Aarts, A.-J. Hoeven, and P. K. Larsen, Phys. Rev. B 38, 3925 (1988). [4] K. Hricovini, G. Le Lay, M. Abraham, and J. E. Bonnet, Phys. Rev. B 41, 1258 (1990). [5] L. Patthey, E. L. Bullock, and K. Hricovini, Surf. Sci. 269/270, 28 (1992). [6] D. H. Rich, T. Miller, and T.-C. Chiang, Phys. Rev. Lett. 60, 357 (1988). [7] M. Göthelid, T. M. Grehk, M. Hammar et al., Phys. Rev. B 48, 2012 (1993).
Thus, the four surface components are resolved in the 3d emission from the Ge(111)-c(2×8) surface. The atomic origins of these components are interpreted on the basis of DFT calculations, providing with more detailed understanding of 3d photoemission line shape from this reconstruction.
32 31 30 29 28 27
Nor
mal
ized
inte
nsity
(arb
. uni
ts) S
3 S1S
2
Ge(111)c(2x8) 3d core levelT = 100 K
B
40 eV: 0°
55 eV: 60° 0°
70 eV: 80° 60° 0°
Binding energy (eV)
90 eV: 80° 60° 0°
Fig. 1. Raw 3d spectra of Ge(111)-c(2×8) at various h and θe.
1.0 0.5 0.0 -0.5 -1.0-0.02
0.00
0.02
Relative binding energy (eV)
Res
idua
l (ar
b. u
nits
)
70 eV @ 60° 1+3 1+4 1+5
Fig. 3. Residuals obtained in the fitting schemes with three, four, and five surface components.
1.5 1.0 0.5 0.0 -0.5 -1.0
90 eV0°
B
S4
S3
S2
Nor
mal
ized
inte
nsity
(arb
. uni
ts)
Relative binding energy (eV)
70 eV60° S1
Fig. 2. Decomposition of spectra at (h , θe) = (70 eV, 60°) and (90 eV, 0°).
0.4 0.0 -0.4 -0.8 0.4 0.0 -0.4 -0.8
3-layer atoms2-layer atoms
3-layer atoms
3-layer atoms2-layer atoms
2-layer atoms
1-layer atoms
1-layer atoms
1-layer atoms
rest atoms
rest atoms
rest atoms
adatoms
adatoms
H3
SCLS (eV)
T4adatoms
ΔSCLS
SCLSCS
SCLSIS
SCLS (eV) Fig. 4. SCLS calculated in the initial state and complete screening models, and their differences for the T4 and H3 structures.

496 MAX-lab ACTIVITY REPORT 2010
SYNCHROTRON RADIATION – BEAMLINE I4
Unoccupied electronic structure of graphite probed by Angle-resolved Photoemission spectroscopy
S. K. Mahatha and Krishnakumar S. R. Menon
Surface Physics Division, Saha Institute of Nuclear Physics, 1/AF Bidhannagar, Kolkata-700064, India
T. Balasubramanian MAXLAB, Lund University P.O. Box 118, S-221 00 Lund, Sweden
Graphite valence band structure has been intensively studied both theoretically and experimentally [1–4]. The interest in graphite has been renewed recently because of the discovery of Graphene out of Graphite by peeling off the top layer [5]. Graphene has become the most promising material for future electronics due to its exceptional electronic structure around the Fermi energy [6]. Graphite can be regarded as a prototype two dimensional material with full valence bands structure characterization along parallel to the surface and strong localization perpendicular to the surface. Here, we present the angle-resolved photoemission spectroscopy (ARPES) results up to the range of secondary electron on single crystal graphite. In addition to the valence band structure which is well known and reported widely, we find some anomalous bands which appear as a constant kinetic energy features at different photon energies. This band are neither reported in ARPES of graphite nor predicted by the bulk band structure calculations. The experimental results are discussed in relation to the VLEED experiments performed by Strocov et al. [7], which essentially probes the photoemission final states, showing that the VLEED information can be found in the ARPES experiments. This makes the ARPES a versatile experimental tool for mapping both the occupied and unoccupied part of band structure with full k resolution [8]. The experiments on single crystal graphite were conducted at I4 beamline of MAX-Lab synchrotron in Sweden. The graphite single crystals were cleaved in-situ using the aluminum post in preparation chamber.
Figure 1: ARPES spectra of single crystalline graphite using (a) 41 eV photon energy along K symmetry direction, (b) 47 eV photon energy along K direction, (c) 53 eV photon energy along K direction and (d) 70 eV photon energy along K direction. Anomalous bands are shown with yellow dashed line. In order to study the origin of these anomalous bands, we have performed ARPES measurements at different photon energy in synchrotron. The same anomalous band can be seen in ARPES spectra of different photon energy as shown in Figure 1. Apart from the anomalous band seen in 41 eV photon energy ARPES spectra, we can see there are two more bands visible at 70 eV photon energy. There is a constant energy (non-dispersive) band near kinetic energy 28.5 eV and an upper dispersing band ranging from 30 eV to 42 eV kinetic energy. These other two anomalous bands were not visible or partly visible

MAX-lab ACTIVITY REPORT 2010 497
SYNCHROTRON RADIATION – BEAMLINE I4
in lower photon energies as those were masked by the other valence bands of the graphite. At 70 eV photon energy, the anomalous bands are in a region free of any other bands and can be distinguished very clearly. All these three anomalous bands are dispersed in constant kinetic energy for different photon energy. The dispersions along the K and M symmetry directions are very similar (not shown).
Figure 2: Comparison of the energy position and dispersion of anomalous bands in ARPES spectra with the VLEED results reported by Strocov et al [7] of graphite. Analyzing the different photon energy data and seeing the constant kinetic energy nature of these three anomalous bands, we propose that these bands are coming from the unoccupied states or photoelectron final state bands of graphite due to secondary electron emission process. Since the VLEED experiment maps the unoccupied valence band structure of the solid, we compare the VLEED data reported by Strocov et al. [7] with our anomalous bands accomplished by ARPES experiment as shown
in Figure 2. We establish the equivalence of VLEED and secondary electron emission process in the connection of mapping the unoccupied bands of graphite. In particular the experimental ARPES spectrum on graphite supports the idea of mapping the unoccupied bands or photoelectron final states by performing ARPES up to low kinetic energy (secondary electron energy) region. As a consequence, the ambiguity about the k can be regained and absolute band structure can be mapped by performing a single ARPES measurement. In conclusion, we found the presence of the unoccupied bands or photoelectron final states in the ARPES spectrum of single crystal graphite. The unoccupied bands were mapped by the secondary electron emission process produced by the cascaded scattering of the photoelectron ejecting from the valence band. We confirm the equivalence of VLEED and secondary electron emission process as shown by Strocov et al. [8] in the connection of mapping the unoccupied bands of graphite. In particular the experimental ARPES spectra on graphite single crystal supports the idea of mapping the unoccupied bands or photoelectron final states by performing ARPES up to low kinetic energy (secondary electron energy) region. This work was supported by the DST-facility for the synchrotron utilization, Department of Science and Technology, Govt. of India for experiments at MAX-Lab, Sweden. We acknowledge the Micro-Nano initiative programme of Department of Atomic Energy (DAE), Govt. of India for generous funding and support.
[1] S. Y. Zhou, G.-H. Gweon, C. D. Spataru, J. Graf, D.-H. Lee, Steven G. Louie, and A. Lanzara, Phys. Rev. B 71, 161403 (2005). [2] R. C. Tatar, and S. Rabii, Phys. Rev. B 25, 4126 (1982). [3] S. Y. Zhou, G.-H. Gweon, and A. Lanzara, Annals of Physics 321, 1730 (2006). [4] A. R. Law, M. T. Johnson, and H. P. Hughes, Phys. Rev. B 34, 4289 (1986). [5] K. S. Novoselov, A. K. Geim, S. V. Morosov, D. Jiang, Y. Zhang, S. V. Dubonos, I. V. Grigorieva, and A. A. Firsov, Science 306, 666 (2004). [6] A. H. Castro Neto, f. Guinea, n. M. R. Peres, K. S. Novoselov, and A. K. Geim, Rev. Mod. Phys. 81, 109 (2009). [7] V. N. Strocov, P. Blaha, H. I. Starnberg, M. Rohlfing, R. Claessen, J.-M. Debever, and J.-M. Themlin, Phys. Rev. B 61, 4994 (2000) [8] M. Bovet, V. N. Strocov, F. Clerc, C. Koitzsch, D. Naumovic, and P. Aebi, Phys. Rev. Lett. 93, 196804 (2004).
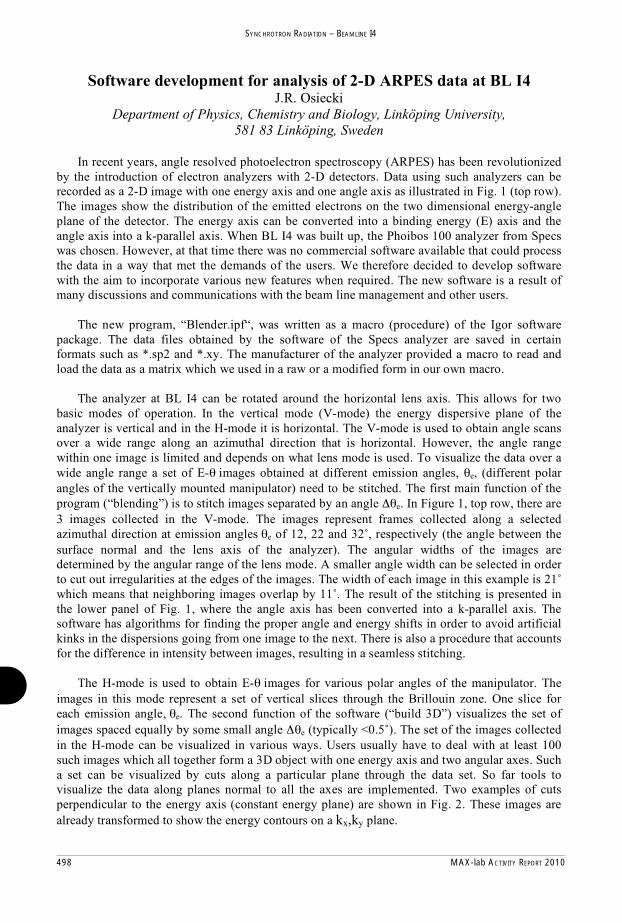
498 MAX-lab ACTIVITY REPORT 2010
SYNCHROTRON RADIATION – BEAMLINE I4

MAX-lab ACTIVITY REPORT 2010 499
SYNCHROTRON RADIATION – BEAMLINE I4

500 MAX-lab ACTIVITY REPORT 2010
SYNCHROTRON RADIATION – BEAMLINE I4

MAX-lab ACTIVITY REPORT 2010 501
SYNCHROTRON RADIATION – BEAMLINE I4

502 MAX-lab ACTIVITY REPORT 2010
SYNCHROTRON RADIATION – BEAMLINE I4
High-resolution core-level photoelectron spectroscopy of the Bi/Si(110)-(2x3) surface
K. Sakamoto1, B. Müller1, K. Miki2, J. Osiecki3, and R.I.G. Uhrberg3
1 Graduate School of Advanced Integration Science, Chiba University, Chiba 263-8522, Japan
2 National Institute for Materials Science, Ibaraki 305-0044, Japan 3 Department of Physics, Chemistry and Biology, Linköping University, S-581 83 Linköping, Sweden
Heavy element adsorbed light element substrates are systems where exotic physical phenomena occur. One of such phenomena is the Rashba-Bychkov (RB) (or simply Rashba) effect [1] that originates from the spin-orbit coupling and the broken space-inversion symmetry at the surface. The RB effect, which has been observed on clean surfaces of noble metals [2] and heavy group V elements [3], are enhanced in these heavy element adsorbed light element systems [4]. In our former studies, we have investigated the RB effect on heavy elements Tl [5] and Bi [6] adsorbed Si(111) surfaces, and discuss the relation between the RB effect and the symmetry of the surface. In the case of Tl/Si(111)-(1x1), the surface state showed a “curious splitting” around the K point. By performing spin-resolved ARPES measurements and first-principles electronic structure calculation, we concluded this curious splitting, which has not been observed on any other 2D or 3D system so far, to originate from the “C3 symmetry” of the K point of this system. On Bi/Si(111)-( 3x 3), we found another peculiar Rashba effect at the K point of this surface. That is, although the time-reversal symmetry was believed to be a necessary condition for the Rashba splitting and there is no time-reversal symmetry at the K point, the “C3V symmetry” originates a RB effect at a point without time reversal.
Since our former studies indicate that the 2D symmetry of the surface plays an important role to the RB effect, and because a proper understanding about the atomic structure of the surface is indispensable to comprehend a peculiar RB effect, we have performed core-level photoemission measurements on the Bi/Si(110)-(2x3) surface. The symmetry of the Bi/Si(110)-(2x3) surface is different from those of the systems used in our previous studies and thus this surface is a candidate to show new peculiar RB effects. The LEED pattern of the Bi/Si(110)-(2x3) surface shown in Fig. 1 indicates the high quality of the sample. In Figs. 2 and 3, we show the Bi 5d and Si 2p core-levels, respectively. The simple Bi 5d core-level spectrum shown in Fig. 2 and the observation of only one surface component in the Si 2p core-level spectra of Fig. 3 indicates that the atomic structure of this surface would be rather simple.

MAX-lab ACTIVITY REPORT 2010 503
SYNCHROTRON RADIATION – BEAMLINE I4
Fig. 1: LEED pattern of the Bi/Si(110)-(2x3) surface obtained at 100 eV.
Fig. 2: Bi 5d core-level spectrum measured at
hν=80 eV.
Fig. 3: Si 2p core-level spectra measured at different photon energies and emission angles
[1] Y.A. Bychkov and E.I. Rashba, JETP Lett. 39, 78 (1984). [2] see for example, F. Reinert, G. Nicolay, S. Schmidt, D. Ehm, and S. Hüfner, Phys. Rev. B 63,
115415 (2001). [3] see for example, Yu. M. Koroteev, G. Bihlmayer, J. E. Gayone, E. V. Chulkov, S. Blügel, P.
M. Echenique, and Ph. Hofmann, Phys. Rev. Lett. 93, 046403 (2004). [4] see for example, C. R. Ast, J. Henk, A. Ernst, L. Moreschini, M. C. Falub, D. Pacilé, P. Bruno,
K. Kern, and M. Grioni, Phys. Rev. Lett. 98, 186807 (2007). [5] K. Sakamoto, T. Oda, A. Kimura, K. Miyamoto, M. Tsujikawa, A. Imai, N. Ueno, H. Namatame,
M. Taniguchi, P.E.J. Eriksson, and R.I.G. Uhrberg, Phys. Rev. Lett. 102, 096805 (2009). [6] K. Sakamoto, H. Kakuta, K. Sugawara, K. Miyamoto, A. Kimura, T. Kuzumaki, N. Ueno, E.
Annese, J. Fujii, A. Kodama, T. Shishidou, H. Namatame, M. Taniguchi, T. Sato, T. Takahashi, and T. Oguchi, Phys. Rev. Lett. 103, 156801 (2009).

504 MAX-lab ACTIVITY REPORT 2010
SYNCHROTRON RADIATION – BEAMLINE I4
Electronic structure of Ce2TSi3 systems; magnetic Kondo lattice (T=Rh) and a Fermi liquid (T=Co)
P. Starowicz1, Ł. Walczak1,2, B. Penc1, M. Szlawska3, J. Adell4, D. Kaczorowski3, A. Szytuła1 1 M. Smoluchowski Institute of Physics, Jagiellonian University, ul. Reymonta 4, 30-059 Kraków, Poland 2 Depto. de Fisica de la Materia Condensada, Universidad Autónoma de Madrid, Madrid, Spain 3 Institute of Low Temperature and Structure Research, Polish Academy of Sciences, ul. Okólna 2, 50-950 Wrocław 4 MAX-Lab, Lund University, Lund
1. Introduction The project is devoted to investigations of Ce2CoSi3 and Ce2RhSi3 compounds, which exhibit peculiar electronic properties originating from the behaviour of Cerium f-electrons. Ce2RhSi3 is an antiferromagnetic Kondo system, thus exhibiting a competition between RKKY interaction and a Kondo effect [1]. Ce2CoSi3 is a moderate heavy fermion compound with the specific heat coefficient γ = 160 mJ/(mole K2), what signifies that the hybridization between Ce f-electrons and conducting band electrons is much stronger than for its counterpart containing Rhodium. It was reported that a quantum phase transition appears if Co is gradually substituted for Rh [2]. Hence, the studies of these systems gain a new dimension as the two investigated compounds are located on both sides of a quantum critical point. Present knowledge of the electronic structure of Ce2TSi3 systems (T=Rh, Co) is very limited. The first results concerning the angle integrated photoemission spectroscopy of Ce2CoSi3 valence band are known [3]. Therefore, the general purpose of the research is to determine the band structure topography and the Fermi surface. The second, but more important goal concerns the behaviour of f-electrons and their role in the physical phenomena observed in these systems. 2. Experimental
Single crystals of Ce2CoSi3 and Ce2RhSi3 were grown by Czochralski method at the Institute of Low Temperature and Structural Research in Wrocław. Studies of resonant photoelectron spectroscopy (RESPES) and angle resolved photoelectron spectroscopy (ARPES) were carried out at the beamline I4 of the MAX III storage ring with the PHOIBOS 100 electron analyzer from SPECS and photon energy between 36 eV and 150 eV.
The single crystals were cleaved in a vacuum of 1*10-10 mbar, cooled to the temperature of 100 K and subjected to the photoemission studies.

MAX-lab ACTIVITY REPORT 2010 505
SYNCHROTRON RADIATION – BEAMLINE I4
3. Results The valence bands of Ce2RhSi3 and Ce2CoSi3 were scanned for the incident photon energies between hν= 88 eV and hν =150 eV. The energies were selected to exploit the effect of Ce 4d – Ce 4f resonance, which is observed near 120 eV. The exemplary results of angle intergrated spectra for Ce2RhSi3 are shown in the Figure 1. Spectral intensity related to Ce f-electrons increases when the photon energy approaches the resonance energy. This fact was used to determine the contribution from f-electrons, which is characterized by major peaks at the Fermi energy (Kondo resonance) and at 0.25 eV. ARPES measurements were performed on Ce2RhSi3 and Ce2CoSi3 crystals as well. However, despite many attempts no clear dispersion was detected as the investigated compounds are very demanding systems.
Figure 1. The valence band of Ce2RhSi3 measured with photon energies of 96 eV, 111 eV, 116 eV and 120 eV. 4. Summary
The main achievement of the studies carried out at the beamline I4 is a set of the valence band spectra obtained for both Ce2RhSi3 and Ce2CoSi3 with a series of photon energies, which correspond to a crossing through the Ce 4d – 4f resonance. The data are used to separate the contribution from Ce-f states to the valence band and will be compared to band structure calculations.
5. Acknowledgments The research leading to these results has received funding from the European Community's Seventh Framework Programme (FP7/2007-2013) under grant agreement nº 226716. 6. References [1] M. Szlawska, D. Kaczorowski, A. Slebarski, L. Gulay, J. Stepien_Damm, Antiferromagnetic order and Kondo-lattice behaviour In single-crystalline Ce2RhSi3, Phys. Rev. B 79 (2009) 134435. [2] S. Patil, K.K. Iyer, E. V. Sampathkumaran, Behavior of magnetic ordering and the Kondo effect in the alloys Ce2Rh1-xCoxSi3, Phys. Rev. B 77 (2008) 094443. [3] S. Patil, S. K. Pandey, V.R.R Medicherla, R. S. Singh, R. Bindu, E. V. Sampaathkumaran and K. Maiti, Importance of conduction electron correlation in a Kondo lattice, Ce2CiSi3, J. Phys. Cond. Matter 22 (2010) 255602.
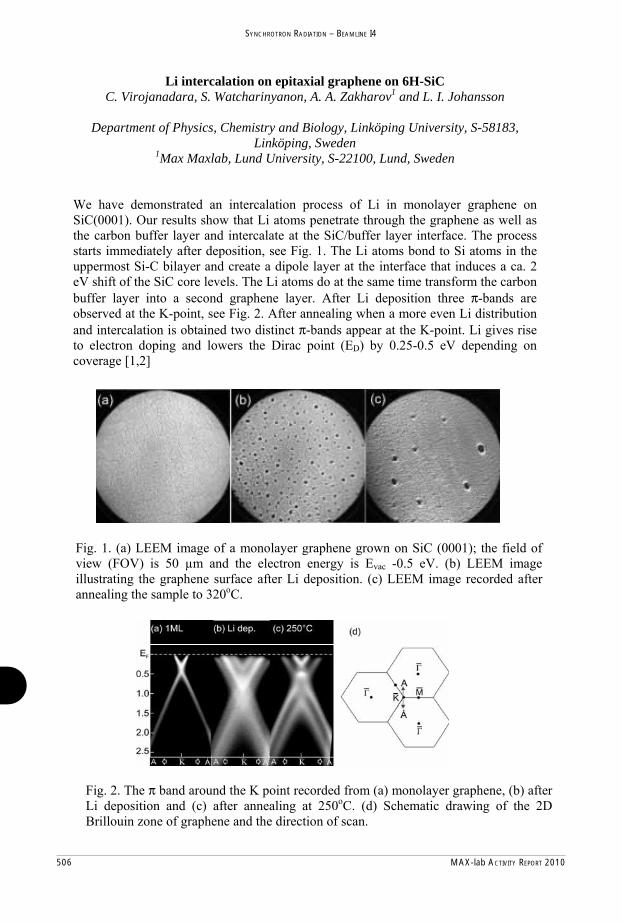
506 MAX-lab ACTIVITY REPORT 2010
SYNCHROTRON RADIATION – BEAMLINE I4
Li intercalation on epitaxial graphene on 6H-SiC C. Virojanadara, S. Watcharinyanon, A. A. Zakharov1 and L. I. Johansson
Department of Physics, Chemistry and Biology, Linköping University, S-58183,
Linköping, Sweden
1Max Maxlab, Lund University, S-22100, Lund, Sweden We have demonstrated an intercalation process of Li in monolayer graphene on SiC(0001). Our results show that Li atoms penetrate through the graphene as well as the carbon buffer layer and intercalate at the SiC/buffer layer interface. The process starts immediately after deposition, see Fig. 1. The Li atoms bond to Si atoms in the uppermost Si-C bilayer and create a dipole layer at the interface that induces a ca. 2 eV shift of the SiC core levels. The Li atoms do at the same time transform the carbon buffer layer into a second graphene layer. After Li deposition three π-bands are observed at the K-point, see Fig. 2. After annealing when a more even Li distribution and intercalation is obtained two distinct π-bands appear at the K-point. Li gives rise to electron doping and lowers the Dirac point (ED) by 0.25-0.5 eV depending on coverage [1,2]
Fig. 1. (a) LEEM image of a monolayer graphene grown on SiC (0001); the field of view (FOV) is 50 μm and the electron energy is Evac -0.5 eV. (b) LEEM image illustrating the graphene surface after Li deposition. (c) LEEM image recorded after annealing the sample to 320oC.
Fig. 2. The π band around the K point recorded from (a) monolayer graphene, (b) after Li deposition and (c) after annealing at 250oC. (d) Schematic drawing of the 2D Brillouin zone of graphene and the direction of scan.

MAX-lab ACTIVITY REPORT 2010 507
SYNCHROTRON RADIATION – BEAMLINE I4
References 1. C. Virojanadara, S. Watcharinyanon, A. A. Zakharov and L. I. Johansson,
“Epitaxial graphene on 6H-SiC and Li intercalation”, Phys. Rev. B. 82, 205402 (2010)
2. C. Virojanadara, A. A. Zakharov, S. Watcharinyanon, R. Yakimova and L. I. Johansson, “A LEEM and XPEEM study of Li intercalated into graphene on SiC(0001)”, New J. Phys. 12, 125015(2010)

508 MAX-lab ACTIVITY REPORT 2010
SYNCHROTRON RADIATION – BEAMLINE I4

MAX-lab ACTIVITY REPORT 2010 509
SYNCHROTRON RADIATION – BEAMLINE I4
Fig. 1 Dispersions of band structure from a thin Ag film on the Sn/Si(111) 3× 3 substrate along the M direction, recorded by the CCD camera with a photon energy of 21.2 eV at 100 K. The wide angle range was obtained by adding ten partially overlapping frames, each covering ±13°. The individual frames were stitched together using the software provided by Dr. Jacek Osiecki.
Fig. 2 Dispersions of band structure from a thin Ag film on the Sn/Si(111) 3× 3 substrate along the M direction, recorded by the CCD camera with a photon energy of 40 eV at 100 K. The wide angle range was obtained by adding ten partially overlapping frames, each covering ±13°.

510 MAX-lab ACTIVITY REPORT 2010
NUCLEAR PHYSICS AT MAX-lab

MAX-lab ACTIVITY REPORT 2010 511
NUCLEAR PHYSICS AT MAX-lab
ENERGETIC ELECTRONS

512 MAX-lab ACTIVITY REPORT 2010
NUCLEAR PHYSICS AT MAX-lab
A gathering of nuclear scientists at a coffee break during the Annual User Meeting, 8 November, 2010.Around the table; Lennart Isaksson, John Annand, Kevin Fissum, Ken Andersen, Grant O’Rielly, Kenneth Livingston, and David Hamlton.Photo: Annika Nyberg

MAX-lab ACTIVITY REPORT 2010 513
NUCLEAR PHYSICS AT MAX-lab
During 2010 the available beam time for the nuclear physics program at MAX-lab was the same as in 2009: 18 weeks. A detailed account of the program during these weeks may be found on the homepage of MAX-lab.
The tagged photon facility consists of an injector, two linear accelerators equipped with SLED cavities, operating at 10 Hz providing an electron pulse width of about 150 ns. This pulsed beam is injected into the pulse stretcher ring MAX I, and slowly extracted over 100 ms resulting in an almost continuous elec-tron beam in the nuclear physics area. For an average current in the ring of typically 20 mA; the stretched beam current, measured in a Faraday cup, is about 20 nA. The electron beam impinges on a thin Al-foil and bremsstrahlung is produced. The residual (final) electron is momentum analyzed in one of two mag-netic spectrometers. The non-interacting part of the electron beam is dumped in a shielded Faraday cup. The extracted beam contains an initial, short burst of electrons which are not contained in the ring. An abort kicker is used to dump these electrons before they reach the experimental cave.
The two magnetic spectrometers are the main tagger (MT) which covers photon energies corresponding to 10 – 70 per cent of the incoming electron energy, and the end point tagger (ET) which allows the use of tagged photons as close as 10 MeV from the endpoint of the bremsstrahlung spectrum. Full energy cover-age implies that the focal plane hodoscope has to be shifted along the focal plane. This applies to both tagging magnets. The focal plane hodoscope was provided, along with the tagging spectrometers, by the Saskatchewan Accelerator Laboratory in Saskatoon. The SAL hodoscope consists of 63 overlapping scintil-lators (3 mm thick, 50 mm high and 25 mm wide) providing 62 coincidence channels. The same hodoscope is used at both tagging magnets.
Energetic Electrons
ET
MT
Faraday cup
Focal plane hodoscope

514 MAX-lab ACTIVITY REPORT 2010
NUCLEAR PHYSICS AT MAX-lab
A new focal plane hodoscope with 160 scintillators has been designed and has been funded by the Knut and Alice Wallenberg Foundation. The construction is well underway and the hodoscope is expected to be commissioned in 2011.
The bremsstrahlung beam produced enters into the experimental cave (from the top left in the figure) through a collimator (with diameter 4, 12 or 19 mm). The energy of a photon interacting in a nuclear target is obtained from a time coincidence between a reaction product, measured in the detection system, and an overlap channel in the focal plane hodoscope. The photon energy is obtained from the energy differ-ence between the incoming and residual electrons. During 2010 two electron beam energies were used, 165 MeV and 193 MeV. The count rate in the focal plane hodoscope is typically 1 – 1.5 MHz per MeV.
The normal mode of operation of the MAX I as a stretcher ring is the following. The beam is available Tuesday morning until Monday morning the following week. There are normally three interruptions per day to allow filling the two storage rings MAX II and MAX III. In a normal week some 120 hours of stretched beam is delivered to the nuclear physics area. Students operate the accelerator during evening, night and weekend shifts. This system has worked well over the 18 weeks in 2010.
The Nuclear Physics Users at MAX-lab met on November 9-10 at a combined PAC and User meeting in con-junction with the MAX-lab Annual User Meeting. Four new proposals and letters of intent were presented, as well as status reports from ongoing experiments, facility-related reports and talks from invited speakers.
Period Electron energy Projects Photon energy range
25; 2010-01-25 – 02-05 164.7 MeV; 12.9 – 68.5 MeV PWO-crystal measurements
- “ - 164.7 MeV; 6.7 – 66.4 MeV Beam test
- “ - 164.7 MeV; 63.7 – 102.4 MeV Compton scattering on 16O
26; 2010-03-01 – 03-28 164.7 MeV; 63.7 – 102.4 MeV Beam diagnostics and rate-dependence measurements - “ - 192.9 MeV; 167.5 – 179.7 MeV (CH2, C
27; 2010-06-07 – 07-05 192.9 MeV; 167.5 – 179.7 MeV (CH2, CD2, C, 6Li
28; 2010-09-27 – 10-31 164.7 MeV; 81.6 – 115.8 MeV Compton scattering on 2H, C
29; 2010-11-15 – 12-05 164.7 MeV; 81.6 – 115.8 MeV Compton scattering on C
- “ - 192.9 MeV; 167.4 – 179.5 MeV (Ta
A summary of the activities in the beam time periods during 2010
The PhD thesis of Luke Myers, based on work carried out at MAX-lab, was defended in 2010.
During 2010 the following students carried out their project work for the BSc or the MSc at MAX-lab: Colleen Allen, Mohamed Luis El-Sheikh, Ulrika Forsberg and Matty Litwack.

MAX-lab ACTIVITY REPORT 2010 515
NUCLEAR PHYSICS AT MAX-lab
REPORTS FROM
NUCLEAR PHYSICS AT MAX-lab
Total photo-absorption cross section of 6,7Li below -threshold S. Al Jebali, J.R.M. Annand, M. Boselli, J. Brudvik, K. Fissum, P. Grabmayr, K. Hansen, L. Isaksson, K. Livingston, M. Lundin, I.J.D. MacGregor, D.G. Middleton, B. Nilsson, and B. Schröder .................... 516
Helium photodisintegration using the gas-scintillator active target S. Al Jebali, J.R.M. Annand, M. Boselli, J. Brudvik, K. Fissum, P. Grabmayr, K. Hansen, L. Isaksson, K. Livingston, M. Lundin, I.J.D. MacGregor, D.G. Middleton, B. Schröder, and J. Sjögren .................... 518
The new focal plane hodoscope at the tagged photon facility J.R.M. Annand, P. Lumsden, J. Brudvik, E. El Afifi, K. Fissum, K. Hansen, L. Isaksson, M. Lundin, B. Nilsson, B. Schröder, and H. Svensson ............................................................................................ 520
Response of the panda electromagnetic calorimeter to photons in the energy range 10–120 MeV J. Brudvik, K. Fissum, K. Fransson, L. Gerén, K. Hansen, L. Isaksson, T. Johansson, O. Lundberg, M. Lundin, K. Marcks, B. Schröder, P.-E. Tegnér, E. Thomé, and M. Wolke .......................................... 522
Detection of positively charged pions with a CsI/SSD telescope J. Brudvik, K. Hansen, L. Isaksson, M. Lundin, K. Fissum, and B. Schröder ........................................... 524
International research experience for students (IRES) H. Caceres, K. DiBenedetto, K. England, D. Kelleher, M. Litwack, B. Smith, W.J. Briscoe, N. Benmouna, K.G. Fissum, and G.V. O’Rielly ..................................................................................... 526
Elastic compton scattering on deuterium Compton@MAX-lab Collaboration ..................................................................................................... 528
Near-threshold + production in photonuclear reactions with heavy nuclei B. Jakobsson, K. Alselo, V. Avdeichikov, W.J. Briscoe, J. Brudvik, K. Fissum, U. Forsberg, P. Golubev, K. Hansen, L. Isaksson, M. Lundin, G.V. O´Rielly, B. Schröder, S. Shende,and the MAX-Tagg collaboration ........................................................................................................ 529
Positive pion photoproduction from the proton experiment NP-014 G.V. O’Rielly ....................................................................................................................................... 530
Investigation of the MAX I photon beam using a pair spectrometer A. Thelin ............................................................................................................................................ 532
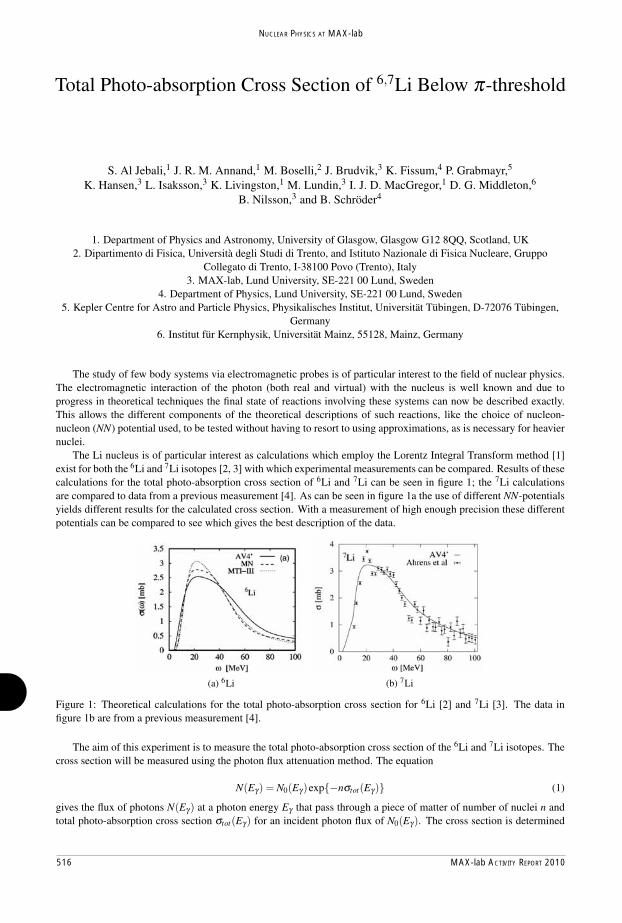
516 MAX-lab ACTIVITY REPORT 2010
NUCLEAR PHYSICS AT MAX-lab
Total Photo-absorption Cross Section of 6,7Li Below π-threshold
S. Al Jebali,1 J. R. M. Annand,1 M. Boselli,2 J. Brudvik,3 K. Fissum,4 P. Grabmayr,5
K. Hansen,3 L. Isaksson,3 K. Livingston,1 M. Lundin,3 I. J. D. MacGregor,1 D. G. Middleton,6
B. Nilsson,3 and B. Schröder4
1. Department of Physics and Astronomy, University of Glasgow, Glasgow G12 8QQ, Scotland, UK
2. Dipartimento di Fisica, Università degli Studi di Trento, and Istituto Nazionale di Fisica Nucleare, Gruppo
Collegato di Trento, I-38100 Povo (Trento), Italy
3. MAX-lab, Lund University, SE-221 00 Lund, Sweden
4. Department of Physics, Lund University, SE-221 00 Lund, Sweden
5. Kepler Centre for Astro and Particle Physics, Physikalisches Institut, Universität Tübingen, D-72076 Tübingen,
Germany
6. Institut für Kernphysik, Universität Mainz, 55128, Mainz, Germany
The study of few body systems via electromagnetic probes is of particular interest to the field of nuclear physics.
The electromagnetic interaction of the photon (both real and virtual) with the nucleus is well known and due to
progress in theoretical techniques the final state of reactions involving these systems can now be described exactly.
This allows the different components of the theoretical descriptions of such reactions, like the choice of nucleon-
nucleon (NN) potential used, to be tested without having to resort to using approximations, as is necessary for heavier
nuclei.
The Li nucleus is of particular interest as calculations which employ the Lorentz Integral Transform method [1]
exist for both the 6Li and 7Li isotopes [2, 3] with which experimental measurements can be compared. Results of these
calculations for the total photo-absorption cross section of 6Li and 7Li can be seen in figure 1; the 7Li calculations
are compared to data from a previous measurement [4]. As can be seen in figure 1a the use of different NN-potentials
yields different results for the calculated cross section. With a measurement of high enough precision these different
potentials can be compared to see which gives the best description of the data.
(a) 6Li (b) 7Li
Figure 1: Theoretical calculations for the total photo-absorption cross section for 6Li [2] and 7Li [3]. The data in
figure 1b are from a previous measurement [4].
The aim of this experiment is to measure the total photo-absorption cross section of the 6Li and 7Li isotopes. The
cross section will be measured using the photon flux attenuation method. The equation
N(Eγ) = N0(Eγ)exp{−nσtot(Eγ)} (1)
gives the flux of photons N(Eγ) at a photon energy Eγ that pass through a piece of matter of number of nuclei n and
total photo-absorption cross section σtot(Eγ) for an incident photon flux of N0(Eγ). The cross section is determined
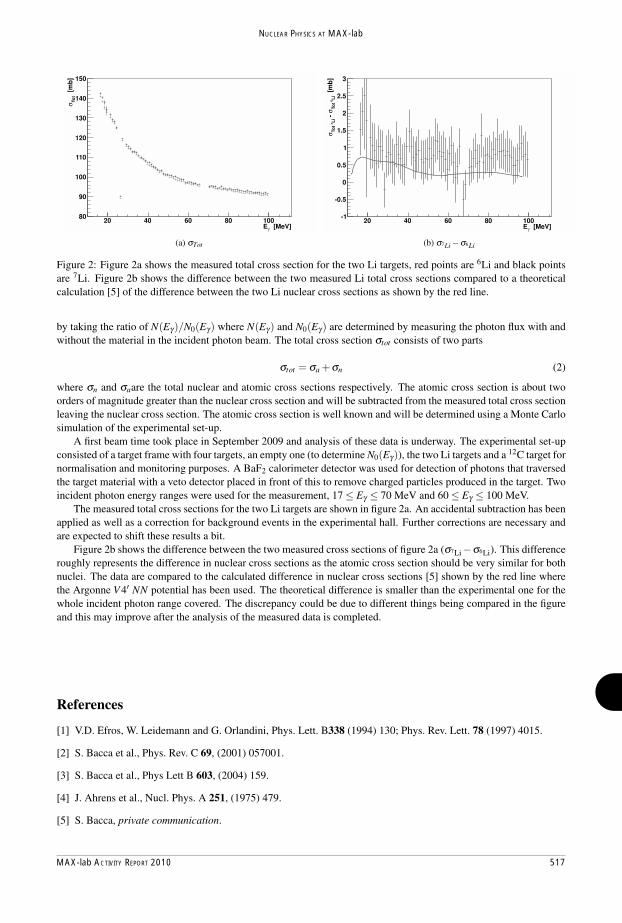
MAX-lab ACTIVITY REPORT 2010 517
NUCLEAR PHYSICS AT MAX-lab
References
[1] V.D. Efros, W. Leidemann and G. Orlandini, Phys. Lett. B338 (1994) 130; Phys. Rev. Lett. 78 (1997) 4015.
[2] S. Bacca et al., Phys. Rev. C 69, (2001) 057001.
[3] S. Bacca et al., Phys Lett B 603, (2004) 159.
[4] J. Ahrens et al., Nucl. Phys. A 251, (1975) 479.
[5] S. Bacca, private communication.
[MeV]γE20 40 60 80 100
[m
b]
Tot
σ
80
90
100
110
120
130
140
150
(a) σTot
[MeV]γE20 40 60 80 100
[m
b]
Li
6To
t σ
-
Li
7To
t σ
-1
-0.5
0
0.5
1
1.5
2
2.5
3
(b) σ7Li −σ6Li
Figure 2: Figure 2a shows the measured total cross section for the two Li targets, red points are 6Li and black points
are 7Li. Figure 2b shows the difference between the two measured Li total cross sections compared to a theoretical
calculation [5] of the difference between the two Li nuclear cross sections as shown by the red line.
by taking the ratio of N(Eγ)/N0(Eγ) where N(Eγ) and N0(Eγ) are determined by measuring the photon flux with and
without the material in the incident photon beam. The total cross section σtot consists of two parts
σtot = σa +σn (2)
where σn and σaare the total nuclear and atomic cross sections respectively. The atomic cross section is about two
orders of magnitude greater than the nuclear cross section and will be subtracted from the measured total cross section
leaving the nuclear cross section. The atomic cross section is well known and will be determined using a Monte Carlo
simulation of the experimental set-up.
A first beam time took place in September 2009 and analysis of these data is underway. The experimental set-up
consisted of a target frame with four targets, an empty one (to determine N0(Eγ)), the two Li targets and a12C target for
normalisation and monitoring purposes. A BaF2 calorimeter detector was used for detection of photons that traversed
the target material with a veto detector placed in front of this to remove charged particles produced in the target. Two
incident photon energy ranges were used for the measurement, 17≤ Eγ ≤ 70 MeV and 60≤ Eγ ≤ 100 MeV.
The measured total cross sections for the two Li targets are shown in figure 2a. An accidental subtraction has been
applied as well as a correction for background events in the experimental hall. Further corrections are necessary and
are expected to shift these results a bit.
Figure 2b shows the difference between the two measured cross sections of figure 2a (σ7Li−σ6Li). This difference
roughly represents the difference in nuclear cross sections as the atomic cross section should be very similar for both
nuclei. The data are compared to the calculated difference in nuclear cross sections [5] shown by the red line where
the Argonne V4′ NN potential has been used. The theoretical difference is smaller than the experimental one for the
whole incident photon range covered. The discrepancy could be due to different things being compared in the figure
and this may improve after the analysis of the measured data is completed.

518 MAX-lab ACTIVITY REPORT 2010
NUCLEAR PHYSICS AT MAX-lab
1 1 4,2,5 3 3 2 1
3 1 3 3 2,5 3
1,3
4
X Position [mm] (Y = Z = 0)-80 -60 -40 -20 0 20 40 60 800
0.01
0.02
0.03
0.04
0.05
0.06
0
100
200
300
400
500
Y Position [mm] (X = Z = 0)-80 -60 -40 -20 0 20 40 60 800
0.01
0.02
0.03
0.04
0.05
0.06
0
100
200
300
400
500
600
700
Z Position [mm] (X = Y = 0)-80 -70 -60 -50 -40 -30 -20 -10 00
0.01
0.02
0.03
0.04
0.05
0.06
0
50
100
150
200
250
4He(γ, γ′ 4He)4He(γ,Xn)
γ +4 He

MAX-lab ACTIVITY REPORT 2010 519
NUCLEAR PHYSICS AT MAX-lab
4He(γ, n)3He
4He (γ,n)
N2
9 × 10⁹
α
γ + 4He
4He(γ,X)
4He(γ, n 3He)
Σ3He

520 MAX-lab ACTIVITY REPORT 2010
NUCLEAR PHYSICS AT MAX-lab
The new focal plane hodoscope at the tagged photon facility
J.R.M. Annand1, P. Lumsden1, J Brudvik2, E. El Afifi2, K. Fissum3, K. Hansen2, L. Isaksson2, M. Lundin2, B. Nilsson2, B. Schröder2,3, H. Svensson2
1Department of Physics and Astronomy, University of Glasgow, Glasgow G128QQ, Scotland, UK
2MAX-lab, Lund University, 221 00 Lund, Sweden
3Department of Physics, Lund University, 221 00 Lund, Sweden
The Main Tagger (MT) at MAX-lab was moved from the Saskatchewan Accelerator Laboratory (SAL), Canada, to MAX-lab, in connection with the upgrade of the tagged photon facility. In addition, a hodoscope consisting of 63 overlapping plastic scintillators became available. The energy resolution depends on the incoming electron energy E0 and the magnetic field of the tagging magnet. The central momentum of the MT, P0 = 198.6 · E0 / S, where S is a number related to the exit path of the direct electron beam towards the beam dump. We use S = 345 or 475. The focal plane of the MT is linear from 0.8 P0 to 1.4 P0 and slightly curved over the range 0.6 P0 to 0.8 P0. The length of the focal plane is about 1240 mm. It is possible to use also parts of the focal plane that are outside the range 0.8 to 1.4 P0, however, the characteristics of this part has to determined for each setting using a NaI spectrometer in the direct tagged photon beam. The energy resolution is typically about 500 keV.
A new hodoscope is under construction funded by the Knut and Alice Wallenberg Foundation and by MAX-lab. The hodoscope consists of 160 scintillators, each 10.5 mm wide and 3 mm thick. The trajectories of the electrons form a 45o angle with respect to the focal plane and will pass the scintillators at 90o, see figure 1. The dimensions are chosen to obtain as high an energy resolution as possible using the smallest available PM tubes (Hamamatsu R1635). The total length of the new focal plane hodoscope is 1200 mm. The light guides from the scintillators to the PM tubes are designed to allow for two rows of PM tubes, every second PM tube is along one row. Figure 1 shows one of these rows. In reality the row is displayed with respect to the scintillators. The distance between the rows is determined by the size of the mymetal shield (diameter 15 mm) around the tubes.
Figure 1
electrons

MAX-lab ACTIVITY REPORT 2010 521
NUCLEAR PHYSICS AT MAX-lab
Each PM tube is mounted on a separate HV/discriminator card similar to the Glasgow design used at the tagging system at MAMI in Mainz. Each card has an analogue signal and two ECL signals, the three signals will be transported about 30 m to the counting rooms outside the shielded experimental area. The cards make it possible to require an overlap coincidence between two adjacent scintillators to improve the energy resolution, however, the cards can also be used in a stand-alone mode.
Examples of energy ranges and energy resolutions expected at the hodoscope are given in Table 1 for the MT with two values of S. The ET will provide tagged photon energies as close as 10 MeV from the endpoint of the bremsstrahlung spectrum.
Table 1
Electron energy (MeV) Photon energy range (MeV)
Photon energy resolution (MeV)
Tagging system
140 12 - 75 0.39 MT (345) 165 68.4 – 123.6 0.35 MT (475) 190 78.8 – 142.3 0.40 MT (475) 190 15.0 – 102.5 0.55 MT (345)
All parts of the new hodoscope are now available and the assembly is in progress. Figure 2 shows the frame that will be used to hold scintillators, discriminator cards, cables etc.

522 MAX-lab ACTIVITY REPORT 2010
NUCLEAR PHYSICS AT MAX-lab
RESPONSE OF THE PANDA ELECTROMAGNETIC CALORIMETER TO PHOTONS IN THE ENERGY RANGE 10 – 120 MeV.
Jason Brudvik1, Kevin Fissum3, Kjell Fransson2 , Linda Gerén4, Kurt Hansen1, Lennart
Isaksson1, Tord Johansson2 , Olle Lundberg4, Magnus Lundin1, Klas Marcks4 , Bent Schröder3, Per-Erik Tegnér4, Erik Thomé2 and Magnus Wolke
1MAXLAB, Lund University, P.O. Box 118, S-221 00 Lund, Sweden
2Department of Nuclear and Particle Physics, Uppsala University, P.O. Box 535, S-751 21 Uppsala, Sweden
3Department of Nuclear Physics, Lund University, P.O. Box 118, S-221 00 Lund, Sweden 4Department of Physics, Stockholm University, S-106 91 Stockholm, Sweden
The physics programme at the PANDA experiment at FAIR (Facility for Antiproton and Ion Research) relies heavily on the capability to measure photons with good energy, position and timing resolution over a wide dynamic range starting at a few MeV up to several GeV energy. The identification of a single photon as well as the coincident detection of the decay photons from multi-meson exit channels requires a high and homogenous efficiency. The invariant mass reconstruction requires also a precise determination of the opening angles between decay photons. This can only be achieved by a highly granular calorimeter. A compact scintillator material with a short Moliére radius will provide a minimum occupancy of the detector modules. These requirements makes the electromagnetic calorimeter one of the most difficult and expensive part of the whole PANDA detector. The chosen detector material is PbWO4 (PWO). Very encouraging results have been obtained by operating such crystals at low temperatures down to -25° C where the light yield increases by a factor of 2.5 as compared to room temperature. A new material composition for the PWO crystals (PWO-II) has given an additional increase of the light output by a factor more than 2. This will give a substantially increased performance with respect to the PWO crystals used at the CMS experiment at LHC. The electromagnetic calorimeter of the target spectrometer consists of a barrel part with 11 360 crystals of 11 different shapes, a forward end cap with 3600 crystals and a backward end cap with 592 crystals. Avalanche Photo Diodes (APDs) will be used for the barrel part and Vacuum Photo Triods (VPTs) are anticipated for the forward end cap. Four Swedish groups are members of the PANDA collaboration, the nuclear physics groups at KTH, Lund University, Stockholm University and Uppsala University. The Swedish groups have jointly decided to focus on the electromagnetic calorimeter with special emphasis of the forward end cap as the Swedish hardware contribution to PANDA. By a grant from the Swedish Research Council approximately half of the crystals for the forward end cap have been purchased. A good understanding of the EMC response to low-energy photons is very important in order to reach the desired resolution in PANDA. MAX-lab is a unique facility for the investigation of the PWO response to low-energy photons, i.e. linearity and energy resolution. The response at higher energies will be measured at MAMI, Mainz and ELSA, Bonn. In a series of experiments the response of PWO crystals to photons in region 10 – 120 MeV is measured at the tagged photon facility at MAX-lab. In March of 2009, a 5 x 5 matrix of crystals for the forward end cap of PANDA, equipped with photo-multiplier tubes, was inserted in a collimated photon beam. An unexpectedly low resolution (σ ≈ 2.6 MeV) for photon energies around 25 MeV compared to the resolution at higher and lower energies (σ ≈ 2.4 MeV at 32 MeV and σ ≈ 1.7 MeV at 13 MeV) was observed. We concluded from the data that this effect

MAX-lab ACTIVITY REPORT 2010 523
NUCLEAR PHYSICS AT MAX-lab
Figure 1: The resolution (σ = FWHM/2.35) as a function of photon energy for the CATS detector. In the analysis of the response the contributions from the central part and the peripheral segments were added. In addition, a new prototype for the forward end cap was tested. The prototype houses 64 crystals but was in a first stage equipped with 25 crystals in a 5 x 5 matrix configuration using photomultiplier tubes for read-out. The response was measured at -25 oC. Two different pulse-handling electronics were used. In the first preamplifiers, shaping amplifiers and peak-sensing ADCs were used. In the second, the anode signals were fed directly to flash-ADCs. In figure 2 we show the result for the relative resolution, before and after correcting for the inherent tagger resolution. Figure 2: The relative resolution σ/E (σ = FWHM/2.35) as a function of photon energy for the 5x5 crystal forward end cap prototype at -25 oC, measured (filled squares) and corrected for the energy resolution of the tagger (filled circles).
Energy [MeV]0 10 20 30 40 50 60 70
[MeV
]σ
0.2
0.4
0.6
0.8
1
1.2
1.4
1.6
1.8
Energy [MeV]10 20 30 40 50 60
/ E
σ
0
0.02
0.04
0.06
0.08
0.1
was most probably due bad resolution of the tagging facility for electrons with momenta 40% larger than the central momentum in the tagging magnet, rather than a property of the PWO matrix.. This problem was studied in January 2010. The energy resolution (and the absolute energies) of the tagged photon beam was independently measured using a large sodium iodide detector (CATS). Preliminary results are presented in Figure 1. The bad resolution of the tagger is clearly seen in the energy range 16 – 33 MeV. For the absolute energies we obtained a result deviating by 7% from the nominal energies
Figure 1 Figure 2

524 MAX-lab ACTIVITY REPORT 2010
NUCLEAR PHYSICS AT MAX-lab
π+
2
Δ Δ
2
Δ
π+ π−
π+
π+ → μ+ + ν(τπ+ = 26.0ns, Eμ+ = 4.12MeV
)
μ+ → e+ + 2ν(τμ+ = 2.197μs, Ee+ = 5→ 50MeV
)
2

MAX-lab ACTIVITY REPORT 2010 525
NUCLEAR PHYSICS AT MAX-lab
π+ μ+
μ
2
μ+
γ + p → π+n

526 MAX-lab ACTIVITY REPORT 2010
NUCLEAR PHYSICS AT MAX-lab
International Research Experience for Students (IRES)
H. Caceres a, K. DiBenedetto a, K. England b, D. Kelleher b, M. Litwack c, and B. Smith a, W.J. Briscoe a, N. Benmouna d, K.G. Fissum e and G.V. O’Rielly b
a) The George Washington University, Washington DC 22201, USA
b) University of Massachusetts Dartmouth, North Dartmouth MA, 02740, USA c) Georgia Institute of Technology, Atlanta, GA 3033, USA
d) Montgomery College, Rockville, MD 20850, USA e) Lund University & MAX-lab, Lund SE-221 00, Sweden
Supported by the US National Science Foundation’s Office of International Science and Engineering through an International Research Experience for Students (IRES) grant (Award 0853760), five undergraduate students from three US institutions participated in the pion photoproduction experiment NP-014 being performed by the PIONS@MAXLAB Collaboration in June 2010. Mr. H. Caceres, Ms. Kristina DiBenedetto and Mr. Brian Smith from The George Washington University, Ms. Khayla England and Mr. Daniel Kelleher, both from the University of Massachusetts Dartmouth, and Mr. Matty Litwack from Georgia Institute of Technology were integral members of the collaboration and participated in the detector and target set-up, took data acquisition shifts monitoring the apparatus and data quality, and were each responsible for a research project involving system calibration or event analysis. The work performed by the students was crucial for the success of both their projects and the measurements. Mr. Caceres and Mr. Litwack each had a project which involved the photon tagging efficiency, which determines the fraction of bremsstrahlung photons which make it to the target. Mr. Litwack
worked on developing a GEANT-4 monte-carlo simulation of the MAX-lab electron beam and photon tagging system in order to understand fully this property of the tagged photon beam. Mr. Caceres was responsible for the daily dedicated calibration runs to measure the tagging efficiency. The resulting data were analyzed to determine the tagging efficiency for the individual tagger channels. By comparing each day's value with previous measurements is was possible to create an estimate of the overall systematic uncertainty in the tagging efficiency. Knowledge of this quantity is essential to the determination of the absolute cross sections from these measurements.
The top left panel shows the tagging efficiency for each tagger channel with (red) and without (black) a background subtraction made. The lower left panel shows the channel-by-channel difference for the tagging efficiency compared with base-line values. These differences are plotted as a histogram in the top right panel.

MAX-lab ACTIVITY REPORT 2010 527
NUCLEAR PHYSICS AT MAX-lab
Ms. DiBenedetto's analysis project involved incorporating new photon beam monitoring hardware (X-Y beam position monitors and an in-beam photon flux monitor) into the measurement data acquisition system and online display. These beam monitors were essential for maintaining the quality and behaviour of the photon beam, quickly signaling even small changes in the beam parameters.
The left panel shows the in-beam flux monitor (IBM) rate normalized to the tagger focal plane rate. The sudden drop in this ratio was due to a change in the current to one of the MAX-I ring magnets. This change caused a shift in the steering of the electron beam. This mis-steering was also seen in the photon beam vertical (Y) position shown in the right panel. Ms. England worked on the gain measurements for the xSAL counters. These important calibration measurements were performed each day during the NP014 run period. The gamma-
ray spectrum produced by a Th-C -ray source was measured and recorded for analysis. By fitting this spectrum to extract the pedestal value and the position of the Compton edge, a two-point fit to these points was made to determine the energy calibration for each of the xSAL E-counters. These calibration measurements were used to monitor for gain changes in the xSAL detectors. This is necessary in order to accurately determine the pion energies from the γp nπ+ reaction.
The -ray spectrum recorded for one of the xSAL counters (located at 90º). The pedestal (near channel 160) and the Compton edge (near channel 360) are clearly seen. This data will be fitted with a gaussian peak and a smooth background to best determine the Compton edge position. Mr. Kelleher and Mr. Smith worked on the data analysis code to optimize the event identification procedure used to separate the pion events from the very large proton and electron background. This event analysis was based on identifying the 4.12 MeV muons from the π+ μ+ decay from the energy deposited in a long-gated versus short-gated QDC.

528 MAX-lab ACTIVITY REPORT 2010
NUCLEAR PHYSICS AT MAX-lab
Elastic Compton Scattering on Deuterium
Compton@MAX-lab Collaboration
The Compton collaboration performed several runs in the past year. First of all, in March 2010, a week-long test run was done in order to investigate rate-dependent effects in the tagger. A simulation of the tagger had been developed which enabled such corrections to be modeled, but the simulation needed to have some benchmark data with which to validate its results. The test run used plastic scintillator paddles to generate x-triggers and a wide range of tagger rates was investigated. The data from this test run effectively served to "calibrate" the tagger simulation so that it could be used reliably to calculate correction factors (for effects such as stolen coincidences and ghosts) for our major runs on deuterium Compton scattering. The next big production run on deuterium occurred in the October-November running period. This involved a 4-week run for more deuterium production data in the tagger energy range Eγ = 90-115 MeV, as well as a 2-week run on carbon as a further cross-check on our normalization procedures. The carbon running was done under various conditions to mock up the actual run conditions of earlier production runs, including variations due to shaker frequency, tagger discriminator output width, and tagger rate. The tagger rates that were used for the carbon running covered the range from high-rate production running (~1 MHz) down to lower rates (200 kHz) as part of our investigation of rate-dependent effects.
The October-November runs utilized an electron beam energy of 165 MeV, giving a tagged energy range of 90-115 MeV. As part of this run, the multi-hit TDC's were used extensively, and also were compared to the output of the single-hit TDC's. The multi-hit units are not affected by stolen coincidences due to high rates, since they do not have a single stop, and so this comparison aided in the study of rate-dependent effects in the data. The beam duty factor was carefully monitored using the recently installed "duty-factor circuit" and so an online relative measure of the beam time structure was available as a diagnostic tool. The NaI detectors BUNI, CATS and DIANA were placed at angles of 60°, 120° and 150°, respectively. This adds to our data set from November 2009 in which we measured 60°, 90° and 150°. These current runs (2010) were taken with essentially the same beam and tagger conditions as last year (2009), as related to the shaker frequency and the tagger discriminator width. These data from 2009 and 2010 constitute the Ph.D. thesis data of Khayrullo Shonyozov, who is a student at the University of Kentucky (thesis supervisor Mike Kovash).
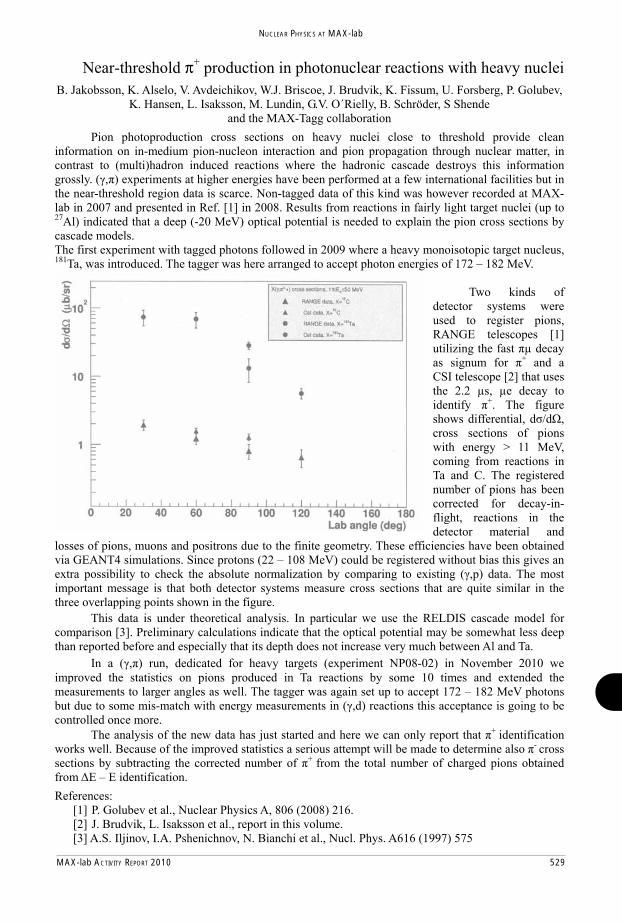
MAX-lab ACTIVITY REPORT 2010 529
NUCLEAR PHYSICS AT MAX-lab
Near-threshold π+ production in photonuclear reactions with heavy nuclei
improved the statistics on pions produced in Ta reactions by some 10 times and extended the measurements to larger angles as well. The tagger was again set up to accept 172 – 182 MeV photons but due to some mis-match with energy measurements in ( ,d) reactions this acceptance is going to be controlled once more.
B. Jakobsson, K. Alselo, V. Avdeichikov, W.J. Briscoe, J. Brudvik, K. Fissum, U. Forsberg, P. Golubev, K. Hansen, L. Isaksson, M. Lundin, G.V. O´Rielly, B. Schröder, S Shende
and the MAX-Tagg collaboration Pion photoproduction cross sections on heavy nuclei close to threshold provide clean information on in-medium pion-nucleon interaction and pion propagation through nuclear matter, in contrast to (multi)hadron induced reactions where the hadronic cascade destroys this information grossly. ( , ) experiments at higher energies have been performed at a few international facilities but in the near-threshold region data is scarce. Non-tagged data of this kind was however recorded at MAX-lab in 2007 and presented in Ref. [1] in 2008. Results from reactions in fairly light target nuclei (up to 27Al) indicated that a deep (-20 MeV) optical potential is needed to explain the pion cross sections by cascade models. The first experiment with tagged photons followed in 2009 where a heavy monoisotopic target nucleus, 181Ta, was introduced. The tagger was here arranged to accept photon energies of 172 – 182 MeV.
Two kinds of
detector systems were used to register pions, RANGE telescopes [1] utilizing the fast μ decay as signum for + and a CSI telescope [2] that uses the 2.2 μs, μe decay to identify +. The figure shows differential, d /d , cross sections of pions with energy > 11 MeV, coming from reactions in Ta and C. The registered number of pions has been corrected for decay-in-flight, reactions in the detector material and
losses of pions, muons and positrons due to the finite geometry. These efficiencies have been obtained via GEANT4 simulations. Since protons (22 – 108 MeV) could be registered without bias this gives an extra possibility to check the absolute normalization by comparing to existing ( ,p) data. The most important message is that both detector systems measure cross sections that are quite similar in the three overlapping points shown in the figure.
This data is under theoretical analysis. In particular we use the RELDIS cascade model for comparison [3]. Preliminary calculations indicate that the optical potential may be somewhat less deep than reported before and especially that its depth does not increase very much between Al and Ta.
In a ( , ) run, dedicated for heavy targets (experiment NP08-02) in November 2010 we
References: [1] P. Golubev et al., Nuclear Physics A, 806 (2008) 216. [2] J. Brudvik, L. Isaksson et al., report in this volume. [3] A.S. Iljinov, I.A. Pshenichnov, N. Bianchi et al., Nucl. Phys. A616 (1997) 575
The analysis of the new data has just started and here we can only report that + identification works well. Because of the improved statistics a serious attempt will be made to determine also - cross sections by subtracting the corrected number of + from the total number of charged pions obtained from E – E identification.

530 MAX-lab ACTIVITY REPORT 2010
NUCLEAR PHYSICS AT MAX-lab
Positive Pion Photoproduction from the Proton Experiment NP-014
G.V. O’Rielly
University of Massachusetts Dartmouth, North Dartmouth MA 02740, USA for the
PIONS@MAX-lab Collaboration One of the current challenges in nuclear science is to connect the observed properties of the nucleon with the theoretical framework provided by QCD [1]. One approach to address this question is to compare measurement results with theoretical predictions for those reactions where both can be done well. One such reaction is pion photoproduction from the nucleon in the nuclear regime. The development of modern descriptions of the strong interaction based on QCD can now provide detailed predictions for this reaction. Comparison of these predictions with the results from accurate measurements of these reactions serves as a stringent test of these QCD-based models. In addition, measurements of the differential cross sections for the γp nπ+ reaction channel are needed to extract the p-wave contribution for comparison with the predictions from Chiral Perturbation Theory calculations. These measurements are also essential for the partial-wave analyses performed by the MAID and SAID groups. Despite this broad interest, there are few modern data sets for the γp nπ+ reaction at energies below the Δ-resonance, with extensive angular distributions only at threshold and above 200 MeV, and no tagged photon data in the energy range between 155 and 185 MeV. To address this need for new, high-quality data on the charged pion channels at energies below the
-resonance, the PIONS@MAXLAB collaboration is performing measurements of the γp nπ+ reaction using the MAX-lab tagged photon facility. To detect the out-going pion, several different detector systems are being used. This report discusses the results obtained by the xSAL detectors, which are a set of four monolithic plastic scintillator counters configured as ΔE-E telescopes. The stopping counters have dimensions chosen to stop the highest energy pions produced by the tagged photon beam at MAX-lab. Complementing the measurements with the xSAL telescopes are measurements made using other detector systems with different pion identification methods; the RANGE and CsI detectors. The use of several independent detector systems will provide important cross-checks throughout the event analysis and for the final measurement results. A dedicated four-week production run took place during June 2010. The xSAL detectors and trigger electronics were configured in the same manner as was used during the June 2009 run period. Some modifications were made to the experimental set-up in order to increase the event rate, including a larger detector acceptance and a faster DAQ system. The four xSAL telescopes were placed at laboratory angles of 90°, 135° and two at 45°, these angles have been identified as having the maximum sensitivity to differences between the existing MAID and SAID partial-wave analysis solutions [2]. Data were collected from C and CH2 targets. Data for the γp nπ+ reaction will come from the CH2 target, with the C target used for background subtraction. Due to the very low event rate for the (γ,π+) reaction, standard particle identification techniques based on ΔE vs. E stopping power are insufficient to separate pions from the much larger electron and proton background. To reliably identify pion events, analysis methods based on detecting the π+ μ+ decay in the xSAL E-counter were used. This technique identifies the 4.12 MeV muon based on the energy deposited in a short- versus long-gated QDC.

MAX-lab ACTIVITY REPORT 2010 531
NUCLEAR PHYSICS AT MAX-lab
(top left) The E vs. E stopping power for all events recorded in one of the xSAL counters. The pion events are swamped by background electrons and protons. (top right) The tagger TDC spectrum with the prompt coincidence peak identified in red. (middle left) The energy deposited in the long- vs. short-gated QDC. The candidate pion events are located above the equal energy band produced by the background events. This plot is rotated so that these event bands are horizontal. (middle right) The projection of the long vs. short QDC bands with the candidate pion events identified in blue. (bottom left) The E vs. E stopping power for candidate pion events. The pion events are now clearly seen and well separated from the remaining background events. (bottom right) The time distribution of these candidate pion events exhibits a decay time of (27.9 ± 1.0) ns, consistent with the known lifetime.
This use of both energy and timing information from the π+ decay in the xSAL E-counter enables the reliable identification of pion events with a well-understood detection efficiency. The analysis to determine final pion yields from each xSAL telescope is currently underway. Additional work is required to determine corrections to account for the misidentification and loss fractions due to the analysis cuts, and to determine the absolute π+-detection efficiency. Monte-Carlo simulations, using the GEANT-4 package, of the experiment and detector systems are currently underway to determine the acceptance for each xSAL telescope. This will be combined with information from the photon tagger to determine the final differential cross sections for the γp nπ+ reaction.
[1] J. Symons et al, in Opportunities in Nuclear Science: A Long Range Plane for the Next Decade, http://www.sc.doe.gov/np/nsac/docs/Nuclear-Science.high-Res.pdf (2002) [2] K. Magno, M.S. thesis, University of Massachusetts Dartmouth (2007)

532 MAX-lab ACTIVITY REPORT 2010
NUCLEAR PHYSICS AT MAX-lab
_____________________________________________________
Investigation of the MAX I photon beam using a pair spectrometer
A. Thelin
_____________________________________________________________________________
As for today the energy of the photons in the MAX I beam is determined by the energy of the electrons which produces them through Bremsstrahlung. To further investigate characteristics of the beam, it would be of interest to measure the energy of the actual photons. It was suggested that this could be done using a pair spectrometer. The whole system can be seen in Figure 1 and works as follows:
The photon produced by Bremsstrahlung enters a converter. Photon is occasionally converted into an e- e+ pair. e- and e+ are separated by a magnetic field. Position sensitive detectors are hit by the particles. A second pair of detectors is placed behind the position sensitive detectors and act as
triggers to determine if two particles hit the detectors simultaneous. The signal from the detectors are registered in a DAQ and analyzed.
Figure 1. A simplified picture of the experimental setup.
Simulations made in Geant4 of the system, indicated that a relation between position of the e- e+ pair and incident electron energy could be made. The results from the simulations were produced under near perfect conditions and real-life experiment were expected to produce more uncertain results, due to showers from shielding and a broad photon beam to name a few examples.

MAX-lab ACTIVITY REPORT 2010 533
NUCLEAR PHYSICS AT MAX-lab
In the real experiment, a total of three runs were made, all with slightly different settings in order for maximum amount of information to be attained. The output signals from the two position sensitive detectors, registering the e- and e+ respectively, are shown in Figure 2.
Figure 2. Left: Signal from detector A Right: Signal from detector B.
The two signals in Figure 2 are typical for all QDC channels. The output from detector A is believed to be caused by a reflection in the detector, possibly between the scintillating fibers and the PM tube in the position sensitive detectors. The abnormal signal from detector A makes an analysis difficult and no relation between incident photon energy and e- e+ position could be established. However a more in depth analysis of the focal plane detectors, Figure 3, revealed that the detectors might have been placed too close center of the beam. This could also be a reason for the unexpected result.
Since expected results could not be attained from the experiment, and as simulations indicate that it should be possible, it is recommended that studies continue in this field, perhaps as another master thesis. It would be advisable to start by making sure that both position sensitive detectors function properly before continuing with the experiment.
Figure 3. Output from one of the focal plane detectors for all three runs made in the experiment. This indicates that the detectors were placed too close the center of the beam.

534 MAX-lab ACTIVITY REPORT 2010
Emelie Hilner, Department of Synchrotron Radiation Research at Lund University, preparing her presentation at the Annual User Meeting, 8 November 2010.Photo: Annika Nyberg

MAX-lab ACTIVITY REPORT 2010 535
PUBLICATIONS
J. Adell, I. Ulfat, L. Ilver, J. Sadowski, and J. Kanski, Thermally stimulated diffusion of Mn through a GaAs barrier: X-ray photoemission study, Phys. Rev. B, in press.
J. Adell, I. Ulfat, J. Sadowski, L. Ilver, and J. Kanski, Electron spectroscopic studies of nanowires formed by (GaMn)As growth on GaAs(111)B, Submitted to Appl. Phys. Lett.
B. Agnarsson, B. Qi, M. Göthelid, S. Olafsson, and H.P. Gislason, The effect of hard nitridation on Al2O3 using RF-plasma cell: A surface study, Submitted to Thin Solid Films.
M. Ahrén, L. Olsson, A. Klasson, F. Söderlind, M. Engström, P-O. Käll, and K. Uvdal, Synthesis and characterization of PEGylated Gd2O3 nanoparticles for MRI contrast enhancement, Langmuir, 26, 5753, 2010.
S. Aksela, M. Patanen, S. Urpelainen, and H. Aksela, Direct experimental determination of atom-molecule-solid binding energy shifts for Sb and Bi, New J. Phys., 12, 063003, 2010.
K.M. Alexacou, A.C. Tenchiu Deleanu, E.D. Chrysina, M.D. Charavgi, I.D. Kostas, S.E. Zographos, N.G. Oikonomakos, and D.D. Leonidas, The binding of -D-glucopyranosyl-thiosemicarbazone derivatives to glycogen phosphorylase: A new class of inhibitors, Bioorg. Med. Chem., 18, 7911, 2010.
Y. Alfredsson, H. Rensmo, A. Sandell, and H. Siegbahn, Electronic structure of thin film TiOPc studied by means of X-ray absorption and photoelectron spectroscopies, J. Electron Spectrosc. and Relat. Phenom., 174, 50, 2009.
H. Ali-Löytty, P. Jussila, M. Hirsimäki, and M. Valden, Influence of CrN surface compound on the initial stages of high temperature oxidation of ferritic stainless steel, To be submitted to Appl. Surf. Sci.
G. Almkvist, K. Boye, and I. Persson, K Edge XANES Analysis of Sulfur Compounds – An Investigation of the Relative Intensities Using Internal Calibration, J. Synchrotron Rad. and Relat. Phenom., 17, 683, 2010.
C.B.F. Andersen, M. Madsen, T. Storm, S.K. Moestrup, and G.R. Andersen, Structural basis for receptor recognition of vitamin-B12-intrinsic factor complexes, Nature, 464, 445, 2010.
K.R. Andersen, A.T. Jonstrup, L.B. Van, and D.E. Brodersen, The activity and selectivity of fission yeast Pop2p are affected by a high affinity for Zn2+ and Mn2+ in the active site, RNA, 15, 850, 2009.
S. Ansell and C. Camerani, Determination of Fe and Mn speciation in pulp fibers by synchrotron radiation EXAFS technique, Submitted to J. Anal. Chem.
A.S. Anselmo, L. Lindgren, J. Rysz, A. Bernasik, A. Budkowski, M. Andersson, K. Svensson, J. van Stam, and E. Moons, Tuning the vertical phase separation in polyfluorene: Fullerene blend films by polymer functionalisation, Submitted to Chem. Mater.
Publications based upon work done at MAX-lab

536 MAX-lab ACTIVITY REPORT 2010
PUBLICATIONS
H.S.A. Anselmo, A. Dzwilewski, J. van Stam, K. Svensson, and E. Moons, NEXAFS spectroscopy – surface morphology characterization of APFO3: PCBM blend films, Manuscript in preparation.
V.Yu. Aristov, O.V. Molodtsova, and M. Knupfer, Potassium doped CoPc films: Charge transfer to the metal center and ligand ring, Org. Electr., 12, 372, 2011.
V.Yu. Aristov, O.V. Molodtsova, C. Laubschat, V.M. Zhilin, I.M. Aristova, V.V. Kveder, and M. Knupfer, Properties of hybrid organic-inorganic systems: Au nanoparticles embedded into an organic CuPc matrix, Appl. Phys. Lett., 97, 113103, 2010.
V.Yu. Aristov, O.V. Molodtsova, V.V. Maslyuk, D.V. Vyalikh, T. Bredow, I. Mertig, A.B. Preobrajenski, and M. Knupfer, Electronic properties of potassium-doped FePc, Org. Electr., 11, 1461, 2010.
V.Yu. Aristov, G. Urbanik, K. Kummer, D.V. Vyalikh, O.V. Molodtsova, A.B. Preobrajenski, A.A. Zakharov, C. Hess, T. Hanke, B. Büchner, I. Vobornik, J. Fujii, G. Panaccione, Y.A. Ossipyan, and M. Knupfer, Graphene synthesis on cubic SiC/Si wafers. Perspectives for mass production of graphene-based electronic devices, Nano Lett., 10, 992, 2010.
E. Ataman, C. Isvoranu, J. Knudsen, K. Schulte, J.N. Andersen, and J. Schnadt, Adsorption of L-cysteine on rutile TiO2(110), Surf. Sci., 605, 179, 2011.
E. Avendano, H. Rensmo, A. Azens, A. Sandell, G.D. Azevedo, H. Siegbahn, G.A. Niklasson, and C.G. Granqvist, Coloration mechanism in proton-intercalated electrochromic hydrated NiOy and Ni1-xVxOy thin films, J. Electrochem. Soc., 156, 132, 2009.
A. Bakali, R. Knaust, and P. Nordlund, Crystal structure of the kinase domain of the human EphB1, In manuscript.
T. Balasubramanian, B.N. Jensen, S. Urpelainen, B. Sommarin, U. Johansson, M. Huttula, R. Sankari, E. Nõmmiste, S. Aksela, H. Aksela, and R. Nyholm, The normal incidence monochromator beamline I3 on MAX III, AIP Conf. Proc., 1234, 661, 2010.
A. Baldacci, P. Stoppa, S. Giorgianni, and R. Wugt Larsen, High resolution fourier transform infrared spectrum of CH2D
79Br: The ground, v5 = 1, and v9 = 1 state constants, Mol. Phys. 108, 733, 2010.
A. Baldacci, R. Visinoni, and R. Wugt Larsen, High resolution synchrotron far-infrared study of CH2D
79Br: The v6 fundamental and 2v6 - v6, v5 + v6 - v6 and v6 + v9 - v6 hot bands, Chem. Phys. Lett., 499, 40, 2010.
N. Ballav, B. Schüpbach, S. Neppl, P. Feulner, A. Terfort, and M. Zharnikov, Biphenylnitrile-based self-assembled monolayers on Au(111): Spectroscopic characterization and resonant excitation of the nitrile tail group, J. Phys. Chem. C 114, 12719, 2010.
L. Banks-Sills, P. Ståhle, I. Svensson, and E. Noam, Strain driven transport for bone modelling at the periosteal surface, Mathematical Biosci., 230, 37, 2011.

MAX-lab ACTIVITY REPORT 2010 537
PUBLICATIONS
J. Becker, M. Bremholm, C. Tyrsted, B. Pauw, K.M.Ø. Jensen, J. Eltzholt, M. Christensen, and B.B. Iversen, Experimental setup for in situ X-ray SAXS/WAXS/PDF studies of the formation and growth of nanoparticles in near- and supercritical fluids, J. Appl. Cryst., 43, 729, 2010.
M. Bilde, C. Delval, P. Von Hessberg, M.S. Johnson, I.K. Koponen, A. Kristensson, A.B. Lauridsen, E. Nilsson, and N. Prisle, Eksperimentel atmosfærisk kemi på Københavns Universitet, Dansk Kemi, in press.
C.F. Black, R.J. Wilson, T. Nylander, M.K. Dymond, and G.S. Attard, Linear dsDNA partitions spontaneously into the inverse hexagonal lyotropic liquid crystalline phases of phospholipids, J. Am. Chem. Soc., 132, 9728, 2010.
M. Blaise and S. Thirup, Crystallization of Escherichia coli maltoporin in the trigonal space group R3, Acta Cryst. F 67, 114, 2011.
C. Bonatto Minella, G. Barkhordarian, S. Garroni, C. Pistidda, C. Rongeat, O. Gutfleisch, T.R. Jensen, Y. Cerenius, M. Dolors Baro, R. Bormann, and M. Dornheim, Effect of Transition Metal Fluorides on Reversible Formation of Ca(BH4)2, J. Phys. Chem. C 115, 2497, 2011.
F.A. Bonk, S. Caldarelli, T. Phan, D. Bertin, E.R. Deazevedo, G.L. Mantovani, T.J. Bonagamba, T.S. Plivelic, and I.L. Torriani, Investigation by combined solid-state NMR and SAXS methods of the morphology and domain size in polystyrene-b-polyethylene oxide-b-polystyrene triblock copolymers, J. Polymer Sci. B: Polymer Physics, 48, 55, 2010.
Ø. Borck, I.-H. Svenum, L.E. Walle, T.H. Andersen, K. Schulte, and A. Borg, Adsorption of methylamine on Ni3Al(111) and NiAl (110) – a high resolution photoelectron spectroscopy and density functional theory study, J. Phys.: Condens. Matter, 22, 395004, 2010.
A.J. Britton, A. Rienzo, J.N. O’Shea, and K. Schulte, Charge transfer between the Au(111) surface and adsorbed C60: Resonant photoemission and new core-hole decay channels, J. Chem. Phys.,133, 094705, 2010.
A. Bujacz, M. Jedrzejczak-Krzepkowska, S. Bielecki, I. Redzynia, and G. Bujacz, Crystal structures of the apo form of -fructofuranosidase from Bifidobacterium longum and its complex with fructose, FEBS J., 2011. DOI: 10.1111/j.1742-4658.2011.08098.x.
P. Byla, M.H. Andersen, T.L. Holtet, H. Jacobsen, M. Munch, H.H. Gad, H.C. Thøgersen, and R.Hartmann, Selection of a novel and highly specific tumor necrosis factor alpha (TNFalpha) antagonist: Insight from the crystal structure of the antagonist-TNFalpha complex, J. Biol. Chem., 285, 12096, 2010.
A. Bøggild, M. Overgaard, P. Valentin-Hansen, and D.E. Brodersen, Cyanobacteria contain a structural homologue of the Hfq protein with altered RNA binding properties, FEBS J., 276, 4328, 2009.
U. Bösenberg, J.W. Kim, D. Gosslar, N. Eigen, T.R. Jensen, J.M. Bellosta von Colbe, Y. Zhou, M. Dahms, D.H. Kim, R. Günther, Y.W. Cho, K.H. Oh, T. Klassen, R. Bormann, and M. Dornheim, Role of additives in LiBH4 – MgH2 reactive hydride composites for sorption kinetics, Acta Mater., 58, 3381, 2010.

538 MAX-lab ACTIVITY REPORT 2010
PUBLICATIONS
U. Bösenberg, D.B. Ravnsbaek, H. Hagemann, V. D’anna, C. Bonatto Minella, C. Pistidda, W. van Beek, T.R. Jensen, R. Bormann, and M. Dornheim, Pressure and temperature influence on the desorption pathway of the LiBH4 – MgH2 composite system, J. Phys. Chem. C 114, 15212, 2010.
E. Callini, L. Pasquini, L.H. Rude, T.K. Nielsen, T.R. Jensen, and E. Bonetti, Hydrogen storage and phase transformations in Mg–Pd nanoparticles, J. Appl. Phys., 108, 073513, 2010.
M.C. Camerani, S. Ansell, B. Tokarz, and I. Panas, In situ determination of Ce speciation in coated colloidal silica particles by synchrotron radiation induced X-ray absorption spectroscopy, Submitted to Anal. Chem.
E. Carlegrim, Y. Zhan, F. Li, X. Liu, and M. Fahlman, Characterization of the Ni/V(TCNE)x interface for hybrid spintronics applications, Org. Electronics, 11, 1020, 2010.
A. Castell, C. Mille, and T. Unge, Structural analysis of mycobacterial branched-chain aminotransferase: Implications for inhibitor design, Acta Cryst. D 66, 549, 2010.
G. Cazzoli, L. Cludi, C. Puzzarini, P. Stoppa, A. Pietropolli Charmet, N. Tasinato, A. Baldacci, A. Baldan, S. Giorgianni, R. Wugt Larsen, S. Stopkowicz, and J. Gauss, Microwave, high-resolution infrared and quantum-chemical investigations of CHBrF2: The Ground and v4 = 1 State Constants, J. Phys. Chem. A. 115, 453, 2011.
D. Céolin, J.-O. Forsell, B. Wannberg, S. Legendre, J. Palaudoux, G. Öhrwall, S. Svensson, and M.N. Piancastelli, A rotatable electron spectrometer for multicoincidence experiments, Rev. Sci. Instr., 81, 063112, 2010.
J. Ceponkus, P. Uvdal, and B. Nelander, Acceptor switching and axial rotation of the water dimer in matrices, observed by infrared spectroscopy, J. Chem. Phys., 133, 074310, 2010.
J. Ceponkus, P. Uvdal, and B. Nelander, Complex formation of small molecules during isolation in low temperature matrices: Water dimers in p-H2 and Ne matrices, J. Phys. Chem. A, 114, 6829, 2010.
J. Ceponkus, P. Uvdal, and B. Nelander, Rotation of water in solid Parahydrogen and Orthodeuterium, J. Phys. Chem. A 114. 12979, 2010.
R. Černý, D.B. Ravnsbæk, G. Severa, Y. Filinchuk, V. d’Anna, H. Hagemann, D. Haase, J. Skibsted, C.M. Jensen, and T.R. Jensen, Structure and characterization of KSc(BH4)4, J. Phys. Chem. C 114, 19540, 2010.
Y. Chao, Q. Wang, A. Pietzsch, F. Hennies, and H. Ni, Soft X-ray induced oxidation on acrylic acid grafted luminescent water dispersible silicon quantum dots, Submitted to J. Appl. Phys.
W.-Q. Chen, A. Salmazo, M. Myllykoski, B. Sjöblom, M. Bidlingmaier, A. Pollak, P. Baumgärtel, K. Djinovic-Carugo, P. Kursula, and G. Lubec, Purification of recombinant growth hormone by clear native gels for conformational analyses – Preservation of conformation and receptor binding, Amino Acids, in press.

MAX-lab ACTIVITY REPORT 2010 539
PUBLICATIONS
F. Chesneau, B. Schüpbach, K. Szelągowska-Kunstman, N. Ballav, P. Cyganik, A. Terfort, and M. Zharnikov, Self-assembled monolayers of perfluoroterphenyl-substituted alkanethiols: characteristics and odd-even effects, Phys. Chem. Chem. Phys., 12, 12123, 2010.
F. Chesneau, J. Zhao, C. Shen, M. Buck, and M. Zharnikov, Adsorption of long-chain alkanethiols on Au(111) – a look from the substrate by high resolution X-ray photoelectron spectroscopy, J. Phys. Chem. C 114, 7112, 2010.
A.N. Christensen, L.M. Arnbjerg, E. DiMasi, Y. Cerenius, B.C. Hauback, and T.R. Jensen, Thermally induced phase transitions of barium oxalates and the structure of α-BaC2O4, Submitted.
A.N. Christensen, T.R. Jensen, and A. Nonat, A new calcium sulfate hemi-hydrate, Dalton Trans., 39, 2044, 2010.
J.F. Cramer, C. Gustafsen, M.A. Behrens, C.L. Oliveira, J.S. Pedersen, P. Madsen, C.M. Petersen, and S.S. Thirup, GGA autoinhibition revisited, Traffi c, 11, 259, 2010.
J. Dauselt, J. Zhao, M. Kind, R. Binder, A. Bashir, A. Terfort, and M. Zharnikov, Compensation of the odd-even effects in araliphatic self-assembled monolayers by non-symmetric attachment of the aromatic part, J. Phys. Chem. C, in press.
Yu.S. Dedkov and M. Fonin, Electronic and magnetic properties of the graphene-ferromagnet interface, New J. Phys. 12, 125004, 2010.
Yu.S. Dedkov, M. Sicot, and M. Fonin, X-ray absorption and magnetic circular dichroism of graphene/Ni(111), J. Appl. Phys. 107, 09E121, 2010.
C. Diehl, O. Engström, T. Delaine, M. Håkansson, S. Genheden, K. Modig, H. Leffler, U. Ryde, U.J. Nilsson, and M. Akke, Protein flexibility and conformational entropy in ligand design targeting the carbohydrate recognition domain of Galectin-3, J. Am. Chem. Soc., 132, 14577, 2010.
W. Doherty, S.L. Sorensen, and R. Friedlein, Selective hydrogen bond disruption in adenine monolayer films by reaction with water, J. Electron Spectrosc. and Relat. Phenom., 174, 107, 2009.
M. Dornheim, Tailoring reaction enthalpies of hydrides, In: “Handbook of Hydrogen Storage”, Ed. M. Hirschler, Wiley VCH, pp 187-214, 2010.
I. Doroshenko, V. Pogorelov, V. Sablinskas, V. Balevicius, Matrix-isolation study of cluster formation in methanol: O-H stretching region, J. Mol. Liq., 157, 142, 2010.
S. dos Santos, C. Gustavsson, C. Gudmundsson, P. Linse, and L. Piculell, When do water-insoluble polyion-surfactant ion complex salts “redissolve” by added excess surfactant? Langmuir, 27, 592, 2011.
S. dos Santos, B. Luigies, and L. Piculell, Associative phase behaviour and disintegration of copolymer aggregates on adding poly(acrylic acid) to aqueous solutions of a PEO-PPO-PEO triblock copolymer, Soft Matter, 6, 4756, 2010.

540 MAX-lab ACTIVITY REPORT 2010
PUBLICATIONS
S. dos Santos, L. Piculell, O.J. Karlsson, and M.G. Miguel, Phase diagrams come alive: understanding how to create, destroy or change ordered surfactant structures by polymerizing the counterions, Soft Matter, 2011, DOI: 10.1039/C0SM00958J
C.E. Drakou, A. Malekou, J.M. Hayes, C.W. Lederer, D.D. Leonidas, N.G. Oikonomakos, A.I. Lamond, N. Santama, and S.E. Zographos, Structure-based site-directed mutagenesis of hCINAP: insights into its catalytic mechanism and function, Submitted.
A. Dzwilewski, S.A. Anselmo, and E. Moons, NEXAFS studies on pristine and photo-polymerized P3HT:PCBM blends, Manuscript in preparation.
K. Döring, N. Ballav, M. Zharnikov, and H. Lang, Synthesis, electrochemical behavior and self-assembly of metallocene-functionalized thiolfluorenes, Submitted to Chem. Eur. J.
H. Enquist, H. Navirian, R. Nüske, C.v. Korff Schmising, A. Jurgilaitis, M. Herzog, M. Bargheer, P. Sondhauss and J. Larsson, Subpicosecond hard X-ray streak camera using single-photon counting, Opt. Lett. 35, 3219, 2010.
L.K.E. Ericsson, A.A. Zakharov, and K.O. Magnusson, ZnO nanocrystals on SiO2/Si surfaces thermally cleaned in ultrahigh vacuum and characterized using spectroscopic photoemission and low energy electron microscopy, J. Vac. Sci. Technol. A 28, 438, 2010.
P.E.J. Eriksson, J.R. Osiecki, K. Sakamoto, and R.I.G. Uhrberg, Atomic and electronic structures of the ordered 23x23 and the molten 1x1 phase on the Si(111): Sn surface, Phys. Rev. B 81, 235410, 2010.
P.E.J. Eriksson, K. Sakamoto, and R.I.G. Uhrberg, Electronic structure of the thallium induced 2x1 reconstruction on Si(001), Phys. Rev. B 81, 205422, 2010.
P.E.J. Eriksson and R.I.G. Uhrberg, Surface core-level shifts on clean Si(001) and Ge(001) studied with photoelectron spectroscopy and density functional theory calculations, Phys. Rev. B 81, 125443, 2010.
S.M. Fairclough, E. Tyrell, D.M. Graham, P. Lunt, K.L. Pogson, S.J.O. Hardman, A. Pietzsch, F. Hennies, J. Moghal, W.R. Flavell, A.A.R. Watt, and J.M. Smith, Exciton transitions in high bulk moduli ZnTeZnSe type-II Nanocrystals, To be submitted to J. Am. Chem. Soc.
J. Falces, I. Arregi, P.V. Konarev, M.A. Urbaneja, D.I. Svergun, S.G. Taneva, and S. Banuelos, Recognition of nucleoplasmin by Its nuclear transport receptor importin α/β: Insights into a complete import complex, Biochem., 49, 9756, 2010.
I.L. Farrell, R.J. Reeves, A.R.H. Preston, B.M. Ludbrook, J.E. Downes, B.J. Ruck, and S.M. Durbin, Tunable electrical and optical properties of hafnium nitride thin films, Appl. Phys. Lett. 96, 071914, 2010.
K. Fissum, V. Ganenko, K. Hansen, L. Isaksson, K. Livingston, M. Lundin, V. Morokhovskyi, B. Nilsson, D. Pugachov, B. Schröder, and G. Vashchenko, Production of linearly polarized photon beam at MAX-lab, Probl. Atom. Sci. Technol., in press.
J. Forsberg, J. Gråsjö, B. Brena, J. Nordgren, L.-C. Duda, and J.-E. Rubensson, Angular anisotropy in resonant inelastic soft X-ray scattering of liquid water, Phys. Rev. B, 79, 132203, 2009.
MAX-lab ACTIVITY REPORT 2010 541
PUBLICATIONS
N. Forsgren, R.J. Lamont, and K. Persson, Two intramolecular isopeptide bonds are identified in the crystal structure of the Streptococcus gordonii SspB C-terminal Domain, J. Mol. Biol., 397, 740, 2010.
R. Friedlein, G. Csányi, W.J. Doherty III, S.S. Saxena, M. Ellerby, R. Friend, and W.R. Salaneck, Experimental verification of the Ca(3d)-* hybrid interlayer state in the superconducting stage-1 Ca graphite intercalation compound, Submitted.
I. Fritzon, B. Svensson, S. al-Karadaghi, B. Walse, U. Wellmar, U.J. Nilsson, D. da Graça Thrige, and S. Jönsson, Inhibition of Human DHODH by 4-hydroxy coumarins, fenamic acids and N-(alkylcarbonyl) anthranilic acids identified by structure-guided fragment selection, ChemMedChem, in press.
K. Frydenvang, D.S. Pickering, J.R. Greenwood, N. Krogsgaard-Larsen, L. Brehm, B. Nielsen, S.B. Vogensen, H. Hald, J.S. Kastrup, P. Krogsgaard-Larsen, and R.P. Clausen, Biostructural and pharmacological studies of bicyclic analogues of the 3-Isoxazolol glutamate receptor agonist ibotenic acid, J. Med. Chem., 53, 8354, 2010.
M.J. Gladys, A.A. El-Zein, A. Mikkelsen, J.N. Andersen, and G. Held, Coverage-dependant changes from partially dissociated to molecular water adsorption on O-precovered Ru{0001} surfaces, To be submitted to J. Am. Chem. Soc.
Y. Gohon, J.D. Vindigni, A. Pallier, F. Wien, H. Celia, A. Giuliani, C. Tribet, T. Chardot, and P. Briozzo, High water solubility and fold in amphipols of proteins with large hydrophobic regions: Oleosins and caleosin from seed lipid bodies, Biochim. et Biophys. Acta, 1808, 706, 2011.
R. Gosalawit-Utke, J.M. Bellosta von Colbe, M. Dornheim, T.R. Jensen, Y. Cerenius, C.B. Minella, M. Peschke, and R. Bormann, LiF-MgB2 system for reversible hydrogen storage, J. Phys. Chem. C 114, 10291, 2010.
R. Gosalawit-Utke, K. Suarez, J.M. Bellosta von Colbe, U. Bösenberg, T.R. Jensen, Y. Cerenius, C. Bonnatto Minella, C. Pistidda, G. Barkhordarian, M. Schulze, T. Klassen, R. Bormann, and M. Dornheim, Ca(BH4)2−MgF2 reversible hydrogen storage: Reaction mechanisms and kinetic properties, J. Phys. Chem. C, 2011, DOI: 10.1021/jp108236e.
A. Gratien, E. Nilsson, L. Bache-Andreassen, J.-F. Doussin, M.S. Johnson, C.J. Nielsen, Y. Stenstrøm, and B. Picquet-Varrault, UV and IR absorption cross-sections and relative photolysis rates of HCHO, HCDO and DCDO, Submitted to J. Phys. Chem. A.
T.M. Greve, K.B. Andersen, O.F. Nielsen, and A. Engdahl, FTIR imaging and ATR-FT-Far-IR synchrotron spectroscopy of pig ear skin, Spectroscopy, 24, 105, 2010.
J. Gråsjö, J. Forsberg, B. Brena, L. Duda, C. Bergström, and J.-E. Rubensson, Studies by X-ray spectroscopy of aqueous solutions of ammonia and ammonium ions as a function of different pH, In manuscript.
J. Gråsjö, J. Söderström, C. Bergström, L. Yi, J.-E. Rubensson et al, Site and symmetry projected electronic structure of paracetamol, In manuscript.
B. Guo, A.K. Inge, C. Bonneau, J. Sun, K. Christensen, Z. Yuan, and X. Zou, Investigation of the GeO2-1,6-diaminohexane-water-pyridine-HF phase diagram leading to the discovery of two novel layered germanates with extra-large rings, Inorg. Chem., 50, 201, 2010.

542 MAX-lab ACTIVITY REPORT 2010
PUBLICATIONS
F. Guo, K. Jankova, L. Schulte, M.E. Vigild, and S. Ndoni, Surface modification of nanoporous 1,2-Polybutadiene by atom transfer radical polymerization or click chemistry, Langmuir, 26, 2008, 2010.
M. Gustafsson, A. Bartoszewicz, B. Martín-Matute, J. Sun, J. Grins, T. Zhao, Z. Li, G. Zhu, and X. Zou, A family of highly stable lanthanide metal-organic frameworks: structural evolution and catalytic activity, Chem. Mater., 22, 3316, 2010.
A. Gutacker, N. Koenen, U. Scherf, S. Adamczyk, J. Pina, S.M. Fonseca, A.J.M. Valente, R.C. Evans, J. Seixas de Melo, H.D. Burrows, and M. Knaapila, Cationic fluorene-thiophene diblock copolymers: Aggregation behaviour in methanol/water and its relation to thin film structures, Polymer, 51, 1898, 2010.
E. Guziewicz, M. Lukasiewicz, L. Wachnicki, K. Kopalko, B.S. Witkowski, J. Sadowski, and M. Godlewski, Photoemission study of (Zn,Co)O films with uniform Co distribution, Submitted to Rad. Phys. Chem.
E. Guziewicz, M. Lukasiewicz, L. Wachnicki, K. Kopalko, B.S. Witkowski, J. Sadowski, and M. Godlewski, Synchrotron photoemission study of (Zn,Co)O films with uniform Co distribution, Bull. Polish Synchr. Rad. Soc., 9, 99, 2010.
M. Göthelid, S. Yu, S. Ahmadi, C. Sun, and M. Zuleta, Structure dependent 4-tert-butyl pyridine induced band bending at TiO2 surfaces, J. Photoenergy, 2011, 401356, 2011.
I.W. Hamley, V. Castelletto, C. Moulton, J. Rodriguez-Perez, A. Squires, T. Eralp, G. Held, M. Hicks, and A. Rodger, Alignment of a model amyloid peptide fragment in bulk and at a solid surface, Submitted to J. Phys. Chem. B.
H. Hamoudi, S. Neppl, P. Kao, B. Schüpbach, P. Feulner, A. Terfort, D. Allara, and M. Zharnikov, Orbital-dependent charge transfer dynamics in conjugated self-assembled monolayers, Submitted to Phys. Rev. Lett.
M.D. Hansson, T. Karlberg, C.A. Söderberg, S. Rajan, M.J. Warren, S. Al-Karadaghi, S.E. Rigby, and M. Hansson, Bacterial ferrochelatase turns human: Tyr13 determines the apparent metal specificity of Bacillus subtilis ferrochelatase, J. Biol. Inorg. Chem., 16, 235, 2011.
S. Hansson and D.T. Logan, New insights into the role of the P-loop lysine: nucleotide binding, regulation and GTP hydrolysis in elongation factor G, Submitted.
S.J.O. Hardman, D.M. Graham, S.K. Stubbs, B.F. Spencer, W.R. Flavell, A.G. Thomas, K.L. Syres, D.J. Binks, F. Sirotti, M. El Kazzi, M. Silly, F. Hennies, J. Akhtar, P. O’Brien, G. Miller, and V. Dhanak, An X-ray photoemission study of PbS nanoparticles that show efficient carrier multiplication, In manuscript.
P.V. Harris, D. Welner, K.C. McFarland, E. Re, J.C.N. Poulsen, K. Brown, R. Salbo, H. Ding, E. Vlasenko, S. Merino, F. Xu, J. Cherry, S. Larsen, and L. Lo Leggio, Stimulation of lignocellulosic biomass hydrolysis by proteins of glycoside hydrolase family 61: Structure and function of a large, enigmatic family, Biochemistry, 49, 3305, 2010.
C.G. Hartmann, O.F. Nielsen, K. Ståhl, and P. Harris, In-house X-ray characterization of protein powder, J. Appl. Cryst. 43, 876, 2010.

MAX-lab ACTIVITY REPORT 2010 543
PUBLICATIONS
J.M. Hayes, M. Keramioti, K.E. Tsitsanou, C. Tiraidis, K.-M. Alexacou, D.D. Leonidas, N.G. Oikonomakos, A. Kato, and S.E. Zographos, Sourcing the affinity of flavanoids for the glycogen phosphorylase inhibitor site via crystallography, kinetics and QM/MM-PBSA binding studies: comparison of chrysin and flavopiridol, In manuscript.
J.M. Hayes, V.T. Skamnaki, G. Archontis, C. Lamprakis, J. Sarrou, N. Bischler, A.-L. Skaltsounis, S.E. Zographos, and N.G. Oikonomakos, Kinetics, in silico docking, molecular dynamics and MM-GBSA binding studies on prototype indirubins, KT5720 and staurosporine as phosphorylase kinase ATP-binding site inhibitors: The role of water molecules examined, Proteins, 79, 703, 2010.
Y. He, G.R. Andersen, and K.H. Nielsen, Structural basis for the function of DEAH helicases, EMBO Reports, 11, 180, 2010.
O. Hekmat, L. Lo Leggio, A. Rosengren, J. Kamarauskaite, K. Kolenova, and H. Stålbrand, Rational engineering of mannosyl binding in the distal glycone subsites of Cellulomonas fimi endo-β-1,4-mannanase: Mannosyl binding promoted at subsite -2 and demoted at subsite -3, Biochemistry, 49, 4884, 2010.
C. Helgstrand, M. Hasan, H. Uysal, J.Z. Haeggström, and M.M.G.M. Thunnissen, A Leukotriene A4-hydrolase-related aminopeptidase from yeast undergoes induced fit upon inhibitor binding, J. Mol. Biol., 406, 120, 2011.
M.D. Herman, M. Moche, S. Flodin, M. Welin, L. Trésaugues, I. Johansson, M. Nilsson, P. Nordlund and T. Nyman, Structures of BIR domains from human NAIP and cIAP2, Acta Cryst. F 65, 1091, 2009.
A. Hernandez-Santoyo, K. Michalska, M. Wahlbom, A. Grubb, and M. Jaskolski, Crystal structure of human cystatin C stabilized against amyloid formation, BMC Struct. Biol., in preparation.
E. Hilner, A.A. Zakharov, K. Schulte, J.N. Andersen, E. Lundgren, and A. Mikkelsen, Faceting and surface reconstruction of the GaP(111)B surface, Surf. Interface Anal., 42, 1524, 2010.
J. Hirvonen Grytzelius, H.M. Zhang, and L.S.O. Johansson, Surface electronic structure of Mn/Ge(111)-3x3, Manuscript in preparation.
B.N. Holland, N. Peltekis, G. Cabailh, C. McGuinness, A.A. Cafolla, and I.T. McGovern, STM and synchrotron studies of the adsorption of MPc on the Ge(001)-2x1 surface, Submitted to Surf. Sci.
C. Howell, J. Zhao, P. Koelsch, and M. Zharnikov, Hybridization in ssDNA films – a multi-technique spectroscopy study, Submitted to Phys. Chem. Chem. Phys.
L.L. Hussami, R.W. Corkery, and L. Kloo, Polyhedral carbon nanofoams with minimum surface area partitions produced using silica nanofoams as templates, Carbon, 48, 3121, 2010.
L.L. Hussami, R.W. Corkery, and L. Kloo, Study of [Dy(n6-p-xylene)(GaCl4)3]-incorporated polyhedral silica nanofoam, Microporous Mesoporous Mater., 132, 480, 2010.
J. Huttu, B. Singh, S.P. Bhargav, J. Sattler, H. Schüler, and I. Kursula, Crystallization and preliminary structural characterization of the two actin depolymerization factors of the malaria parasite, Acta Cryst. F 66, 583, 2010.

544 MAX-lab ACTIVITY REPORT 2010
PUBLICATIONS
M. Huttula, M.-H. Mikkelä, M. Tchaplyguine, and O. Björneholm, Size-varied photoelectron spectroscopy of metal clusters using the exchange metal cluster source, J. Electron Spectrosc. and Relat. Phenom., 181, 145, 2010.
K.O. Håkansson and A. Curovi, Crystallization and data collection of the nucleotide-binding domain of Mg-ATPase, Acta Cryst. F 65, 223, 2009.
R. Häggblad, S. Hansen, L.R. Wallenberg, and A. Andersson, Stability and performance of cation vacant Fe3-x-yVxyO4 spinel phase catalysts in methanol oxidation, J. Catalysis, 276, 24, 2010.
C.J.S. Ibsen and H. Birkedal, Modification of bone-like apatite nanoparticle size and growth kinetics by Alizarin red S, Nanoscale, 2, 2478, 2010.
H. Ingvarsson and T. Unge, Flexibility and communication within the structure of the Mycobacterium smegmatis methionyl-tRNA synthetase. Febs J., 277, 3947, 2010.
C. Isvoranu, J. Knudsen, E. Ataman, K. Schulte, B. Wang, M.-L. Bocquet, J.N. Andersen, and J. Schnadt, Adsorption of ammonia on multilayer iron phthalocyanine, J. Chem. Phys., in press.
C. Isvoranu, B. Wang, E. Ataman, K. Schulte, J. Knudsen, J.N. Andersen, M.-L. Bocquet, and J. Schnadt, Ammonia adsorption on iron phthalocyanine on Au(111): Influence on adsorbate-substrate coupling and molecular spin, J. Chem. Phys., in press.
C. Isvoranu, B. Wang, K. Schulte, E. Ataman, J. Knudsen, J.N. Andersen, M.-L. Bocquet, and J. Schnadt, Tuning the spin state of iron phthalocyanine by ligand adsorption, J. Phys.: Condens. Matter, 22, 472002, 2010.
S.H.M. Jafri, K. Carva, E. Widenkvist, T. Blom, B. Sanyal, J. Fransson, O. Eriksson, U. Jansson, H. Grennberg, O. Karis, R.A. Quinlan, B.C. Holloway, and K. Leifer, Conductivity engineering of graphene by defect formation, J. Phys. D: Appl. Phys., 43, 045404, 2010.
S. Jana, V. Singh, S.D. Kaushik, C. Meneghini, P. Pal, R. Knut, O. Karis, I. Dasgupta, V. Siruguri, and S. Ray, Atomic-scale chemical fluctuation in LaSrVMoO6, a proposed half-metallic antiferromagnet, Phys. Rev. B 82, 180407(R), 2010.
J. Janiak, L. Piculell, G. Olofsson, and K. Schillén, The aqueous phase behavior of polyion-surfactant ion complex salts mixed with nonionic surfactants, Phys.Chem. Chem. Phys,. 13, 3126, 2011.
G.V. Jensen, M. Bremholm, N. Lock, G.R. Deen, T.R. Jensen, B.B. Iversen, M. Niederberger, J.S. Pedersen, and H. Birkedal, Anisotropic crystal growth kinetics of anatase TiO2 nanoparticles synthesized in a non-aqueous medium, Chem. Mater., 22, 6044, 2010.
K.M.Ø. Jensen, M. Christensen, C. Tyrsted, M. Bremholm, and B.B. Iversen, Structure, size, and morphology control of nanocrystalline lithium cobalt oxide, Cryst. Growth Des., in press. DOI: 10.1021/cg101271d.
K.M.Ø. Jensen, M. Christensen, C. Tyrsted, and B.B. Iversen, Real-time synchrotron PXRD study of the anti-site defect formation during sub- and supercritical synthesis of LiFePO4 and LiFe0.75Mn0.25PO4 nanoparticles, Submitted to J. Mater. Chem.

MAX-lab ACTIVITY REPORT 2010 545
PUBLICATIONS
L.B. Jensen, K. Mortensen, G.M. Pavan, M.R. Kasimova, D.K. Jensen, V. Gadzhyeva, H.M. Nielsen, and C. Foged, Molecular characterization of the interaction between siRNA and PAMAM G7 dendrimers by SAXS, ITC, and molecular dynamics simulations, Biomacromol., 11, 3571, 2010.
M.H. Jensen, H. Otten, U. Christensen, T.V. Borchert, L.L.H. Christensen, S. Larsen, and L. Lo Leggio, Structural and biochemical studies elucidate the mechanism of Rhamnogalacturonan Lyase from Aspergillus aculeatus, J. Mol. Biol., 404, 100, 2010.
T.R. Jensen, T.K. Nielsen, Y. Filinchuk, J.E. Jørgensen, Y. Cerenius, E.M. Gray, and C.J. Webb, Versatile in-situ powder X-ray diffraction cells for solid-gas investigations, J. Appl. Cryst., 43, 1456, 2010.
E.M.J. Johansson, S. Plogmaker, L.E. Walle, R. Schölin, A. Borg, A. Sandell, and H. Rensmo, Comparing surface binding of the maleic anhydride anchor group on single crystalline anatase TiO2 (101), (100) and (001) surfaces, J. Phys. Chem., 114, 15015, 2010.
L.I. Johansson and C. Virojanadara, Surface and interface reactions for Ti layers deposited on the SiC(0001)-3x3R30° surface, Phys. Status. Solidi B 248, 667, 2011.
R. Johansson, E. Torrents, D. Lundin, J. Sprenger, M. Sahlin, B.-M. Sjöberg, and D.T. Logan, High resolution structures of the flavoprotein NrdI in oxidised and reduced states: An unusual flavoxodin FEBS J., 277, 4265, 2010.
M.T. Johnson and O.F. Wendt, Synthesis, characterisation and crystal structure of a novel nickel(II) phosphine complex, trans-[Ni2Cl4{cis-(Cy2PCH2)2C6H4}2], Inorg. Chim. Acta, in press.
A. Jurgilaitis, R. Nüske, H. Enquist, H. Navirian, P. Sondhauss, and J. Larsson, X-ray diffraction from the ripple structures created by femtosecond laser pulses, Appl. Phys. A 100, 105, 2010.
T. Juul, A. Malolepszy, K. Dybkær, R. Kidmose, J.T. Rasmussen, G.R. Andersen, H.E. Johnsen, J.-E. Jørgensen, and S.U. Andersen, The in vivo toxity of hydroxyurea depends on its direct target catalase, J. Biol. Chem., 285, 21411, 2010.
L. Kanninen, N. Jokinen, H. Ali-Löytty, P. Jussila, K. Lahtonen, M. Hirsimäki, M. Kuzmin, R. Pärna, E. Nõmmiste, and M. Valden, Adsorption structure and bonding of trimesic acid on Cu(100) as function of surface coverage and temperature, To be submitted to J. Chem. Phys.
P. Kao, S. Neppl, P. Feulner, D.L. Allara, and M. Zharnikov, Charge transfer time through single molecules in alkanethiolate self-assembled monolayers via Resonant Auger Spectroscopy, J. Phys. Chem. C 114, 13766, 2010.
T. Karlsson and P. Persson. Coordination chemistry and hydrolysis of Fe(III) in a peat humic acid studied by X-ray absorption spectroscopy, Geochim. Cosmochim. Acta, 74, 30, 2010.
T. Karlberg, A.G.M. Thorsell, M. Hammarstrom, S. van den Berg, L. Svensson, I. Johansson, A. Kallas, and H. Schuler, Structural basis for lack of ADPribosyltransferase activity in zinc finger antiviral protein/PARP13/ARTD13, In manuscript.
B. Kennedy, C. McGuinness, B.J. Arnold, A. Grogan, R.G. Egdell, T. Käämbre, and P. Blaha, Linear dichroism and resonant soft X-ray emission at the oxygen K-edge in rutile TiO2, To be submitted to Phys. Rev. B.

546 MAX-lab ACTIVITY REPORT 2010
PUBLICATIONS
R.T. Kidmose, N.N. Vasiliev, A.B. Chetverin, G.R. Andersen, and C.R. Knudsen, Structure of the Q replicase, an RNA-dependent RNA polymerase consisting of viral and host proteins, Proc. Natl. Acad. Sci. USA (PNAS), 107, 10884, 2010.
M. Knaapila, R.C. Evans, V.M. Garamus, L. Almásy, N.K. Székély, A. Gutacker, U. Scherf, and H.D. Burrows, Structure and “surfactochromic” properties of conjugated polyelectrolyte (CPE): surfactant complexes between a cationic polythiophene and SDS in water, Langmuir, 26, 15634, 2010.
M. Knaapila, R.C. Evans, A. Gutacker, V.M. Garamus, M. Torkkeli, S. Adamczyk, M. Forster, U. Scherf, and H.D. Burrows, Solvent dependent assembly of a polyfluorene−polythiophene “Rod−Rod” block copolyelectrolyte: nfluence on photophysical properties, Langmuir, 26, 5056, 2010.
M. Knaapila, R. Stepanyan, D. Haase, S. Carlson, M. Torkkeli, Y. Cerenius, U. Scherf, and S. Guha, Evidence for Structural Transition in Hairy-Rod Poly[9,9-bis(2-ethylhexyl)fluorene] under High Pressure Conditions, Phys. Rev. E 82, 051803, 2010.
J. Knudsen, L.R. Merte, G. Peng, R.T. Vang, A. Resta, E. Lægsgaard, J.N. Andersen, M. Mavrikakis, and F. Besenbacher, Low-temperature CO oxidation on Ni(111) and on a Au/Ni(111) surface alloy, ACS Nano, 4, 4380, 2010.
R. Knut, O. Karis, S. Valizadeh, A. Surpi, J. Hunter Dunn, M. Adell, P. Svedlindh, P. Warnicke, A. Sandell, J.H. Richter, L. Nyholm, G. Westin, B. Sanyal, and O. Eriksson, Electronic structure and magnetic properties of (Zn,Co)O room temperature ferromagnets, Submitted.
R. Knut, J.M. Wikberg, K. Lashgari, V.A. Coleman, G. Westin, P. Svedlindh, and O. Karis, Electronic and magnetic characterization of impurity induced magnetization in Co doped ZnO, Submitted to Phys. Rev. B.
K. Kooser, D.T. Ha, S. Granroth, E. Itälä, L. Partanen, E. Nõmmiste, H. Aksela, and E. Kukk, Resonant Auger electron–photoion coincidence study of the fragmentation dynamics of an acrylonitrile molecule, J. Phys. B: At. Mol. Opt. Phys., 43, 235103, 2010.
M. Kozak, Small angle scattering of synchrotron radiation studies of biomembranes, Synchrotron Rad. Nat. Sci., 8, 36, 2009.
S.A. Krasnikov, C.M. Doyle, N.N. Sergeeva, A.B. Preobrajenski, N.A. Vinogradov, Y.N. Sergeeva, A.A. Zakharov, M.O. Senge, and A.A. Cafolla, Formation of extended covalently bonded Ni porphyrin networks on the Au(111) surface, Nano Res., 2011. DOI: 10.1007/s12274-010-0092-7.
O. Kravchenko, I. Mitroshin, S. Nikonov, W. Piendl, and M. Garber, Structure of a two-domain N-terminal fragment of ribosomal protein L10 from Methanococcus jannaschii reveals a specific piece of the archaeal ribosomal stalk, J. Mol. Biol., 2010. DOI:10.1016/j.jmb.2010.04.017.
S. Krishnamurthy, B. Kennedy, F. McGee, M. Venkatesan, J.M.D. Coey, J.G. Lunney, T. Learmonth, K.E. Smith, T. Schmitt, and C. McGuinness, Resonant soft x-ray emission and x-ray absorption studies on Ga1-xMnxN grown by pulsed laser deposition, Phys. Stat. Sol. (C), in press.
E. Kukk, K. Kooser, D.T. Ha, S. Granroth, and E. Nõmmiste, VUV-induced dissociation of methylchlorosilanes, studied by electron–ion coincidence spectroscopy, J. Phys. B: At. Mol. Opt. Phys., 43, 065103, 2010.

MAX-lab ACTIVITY REPORT 2010 547
PUBLICATIONS
R. Kuktaite, T.S. Plivelic, Y. Cerenius, M.S. Hedenqvist, M. Gällstedt, S. Marttila, R. Ignell, I. Popineau, P.R. Shewry, and E. Johansson, Structure and morphology of wheat gluten films: From polymeric protein aggregates towards superstructure arrangements, Submitted to Biomacromol.
R. Kuktaite, T.S. Plivelic, Y. Cerenius, M.S. Hedenqvist, M. Gällstedt, S. Marttila, R. Ignell, I. Popineau, O. Tranquet, P. Shewry, and E. Johansson, Wheat gluten bio-plastics: From polymeric aggregates towards unusual hexagonal structures, Submitted to J. Mater. Chem.
R. Kuktaite, T.S. Plivelic, H. Türe, M.S. Hedenqvist, M. Gällstedt, S. Marttila, I. Popineau, O. Tranquet, P. Shewry, and E. Johansson, Unique protein structure in urea containing wheat gluten bio-plastics: A study by SAXS, WAXS, LM and CLSM, To be submitted to J. Mater. Chem.
K. Kummer, D.V. Vyalikh, G. Gavrila, A.B. Preobrajenski, A. Kick, M. Bönsch, M. Mertig, and S.L. Molodtsov, Electronic structure of genomic DNA: A photoemission and X-ray absorption study, J. Phys. Chem. B 114, 9645, 2010.
M. Kuzmin, M.P.J. Punkkinen, P. Laukkanen, R.E. Perälä, V. Tuominen, J.J.K. Lång, M. Ahola-Tuomi, J. Dahl, T. Balasubramanian, B. Johansson, L. Vitos, and and I.J. Väyrynen, Atomic structure of Yb/Si(100)(2×6): Interrelation between the silicon dimer arrangement and Si 2p photoemission line shape, Phys. Rev. B 82, 113302, 2010.
J. Laksman, D. Céolin, M. Gisselbrecht, and S.L. Sorensen, Nuclear motion in carbonyl sulfide induced by resonant core electron excitation, J. Chem. Phys., 133, 144314, 2010.
S.E. Lantz, F. Goedegebuur, R. Hommes, T. Kaper, B.R. Kelemen, C. Mitchinson, L. Wallace, J. Ståhlberg, and E.A. Larenas, Hypocrea jecorina CEL6A protein engineering, Biotechnol. for Biofuels, 3:20, 2010.
K.M. Larsson, D.T. Logan, and P. Nordlund, Structural basis for adenosylcobalamin activation in AdoCbl-dependent ribonucleotide reductases, ACS Chem. Biol., 5, 933, 2010.
A. Laumann, K.M. Ørnsbjerg Jensen, C. Tyrsted, M. Bremholm, K.T. Fehr, M. Holzapfel, and B.B. Iversen, In-situ synchrotron X-ray diffraction study of the formation of cubic Li2TiO3 under hydrothermal conditions, Submitted to Eur. J. Inorg. Chem.
N.S. Laursen, N. Gordon, S. Hermans, N. Natalie Lorenz, N. Jackson, B. Wines, E. Spillner, J.B. Christensen, M. Jensen, F. Fredslund, M. Bjerre, L. Sottrup-Jensen, J.F. Fraser, and G.R. Andersen, Structural basis for inhibition of complement C5 by the SSL7 protein from Staphylococcus aureus, Proc. Natl. Acad. Sci. USA (PNAS), 107, 3681, 2010.
K. Lawniczak-Jablonska, A. Wolska, M.T. Klepka, S. Kret, J. Gosk, A. Twardowski, D. Wasik, A. Kwiatkowski, B. Kurowska, B.J. Kowalski, and J. Sadowski, Magnetic Properties of MnSb Nano-inclusions Formed in GaSb Matrix Directly During MBE Process, J. Appl. Phys., in press.
K. Lawniczak-Jablonska, A. Wolska, M.T. Klepka, A. Twardowski, D. Wasik, J. Gose, and J. Sadowski, The shape anisotropy of the MnSb inclusions formed in GaSb matrix as probed by XMCD, Synchrotron Rad. Nat. Sci., 9, 56, 2010.
G. Lazzara, G. Olofsson, V. Alfredsson, K. Zhu, B. Nyström, and K. Schillén, Temperature-responsive inclusion complex of cationic PNIPAAM diblock copolymer and -Cyclodextrin, Submitted.

548 MAX-lab ACTIVITY REPORT 2010
PUBLICATIONS
M. Lee, M.C. Rosario, H.H. Harris, R.E. Blankenship, J.M. Guss, and H.C. Freeman, The crystal structure of auracyanin A at 1.85 A resolution: The structures and functions of auracyanins A and B, two almost identical ”blue” copper proteins, in the photosynthetic bacterium Chloroflexus aurantiacus, J. Biol. Inorg. Chem., 14, 329, 2009.
L. Leinartaité, K. Saraboji, A. Nordlund, D.T. Logan, and M. Oliveberg, Folding catalysis by transient coordination of the Cu ligands of the ALS-associated enzyme SOD1, J. Am. Chem. Soc., 132, 13495, 2010.
J. Lewis, J. Sjostrom, U. Skyllberg, and L. Hagglund, Distribution, chemical speciation and mobility of Pb and Sb originating from small arms ammunition in a coarse grained unsaturated surface sand, J Environ. Qual., in press.
F. Li, F. Allegretti, S. Surnev, and F.P. Netzer, Oxide-Metal Nanowires by Oxidation of a One-Dimensional Mn-Pd Alloy: Stability and Reactivity, Langmuir, 26, 16474, 2010.
F. Li, F. Allegretti, S. Surnev, F.P. Netzer, Y. Zhang, W.-B. Zhang, and K. Reuter, Oxygen adsorption on stepped Pd(100) surfaces, Surf. Sci., 604, 1813, 2010.
F. Li, P. Graziosi, Q. Tang, Y. Zhan, X. Liu, V. Dediu, and M. Fahlman, Electronic structure and molecular orientation of pentacene thin films on ferromagnetic La0.7Sr0.3MnO3, Phys. Rev. B 81, 205415, 2010.
G.L. Li, J. Wang, L.F. Li, and X.D. Su, Crystallization and preliminary X-ray analysis of three dUTPases from Gram-positive bacteria, Acta Cryst. F 65, 339, 2009.
Y. Li and X.D. Zou, Two novel 3D open-framework Zincogermanates built up from GeO2 4.82 sheets and Zn-O-Zn chains, To be submitted to Inorg. Chem.
J. Lindgren, P. Uvdal, and A. Engdahl, Molecular and biochemical analyses of fibrous bone tissues from the Cretaceous of Angola – preliminary results, GFF, J. Geol. Soc. Sweden, in press.
J. Lindgren, P. Uvdal, A. Engdahl, A.H. Lee, C. Alwmark, K.-E. Bergquist, E. Nilsson, P. Ekström, M. Rasmussen, D.A. Douglas, M.J. Polcyn, and L.L. Jacobs, Micropectroscopic evidence of Cretaceous bone proteins and lipids, To be submitted to Nature.
D. Lundberg, I. Persson, L. Eriksson, P. D’Angelo, and S. De Panfilis, Structural study of the N,N0-Dimethylpropyleneurea solvated Lanthanoid(III) Ions in solution and solid state with an analysis of the ionic radii of Lanthanoid(III) ions, Inorg. Chem., 49, 4420, 2010.
C. Madhurantakam, O.B. Nilsson, K. Jönsson, H. Grönlund, and A. Achour, Production, crystallization and preliminary X-ray diffraction analysis of the allergen Can f 2 from Canis familiaris, Acta Cryst. F 65, 467, 2009.
M. Magnuson, E. Lewin, L. Hultman, and U. Jansson, Electronic structure and chemical bonding of nc-TiC/a-C nanocomposites, Phys. Rev. B 80, 235108, 2009.
M. Magnuson, M. Mattesini, C. Höglund, J. Birch, and L. Hultman, Electronic structure and chemical bonding anisotropy investigation in wurtzite AlN, Phys. Rev. B 80, 155105, 2009.
M. Magnuson, M. Mattesini, C. Höglund, J. Birch, and L. Hultman, Electronic structure of GaN and Ga investigated by soft X-ray spectroscopy and firstprinciples methods, Phys. Rev. B 81, 085125, 2010.
MAX-lab ACTIVITY REPORT 2010 549
PUBLICATIONS
A.K. Mahalingam, L. Axelsson, J.K. Ekegren, J. Wannberg, J. Kihlstrom, T. Unge, H. Wallberg, B. Samuelsson, M. Larhed, and A. Hallberg, HIV-1 protease inhibitors with a transition-state mimic comprising a tertiary alcohol: improved antiviral activity in cells, J. Med. Chem., 53, 607, 2010.
K. Maher, K. Edström, I. Saadoune, T. Gustafsson, and M. Mansori, The electrochemical behaviour of the carbon-coated Ni0.5TiOPO4 electrode material, J. Power Sources, 196, 2819, 2011.
V. Majava and P. Kursula, Domain swapping and different oligomeric States for the complex between calmodulin and the calmodulin-binding domain of calcineurin A, PLoS ONE, 4, e5402, 2009.
V. Majava, C. Wang, M. Myllykoski, S.M. Kangas, S.U. Kang, N. Hayashi, P. Baumgärtel, A.M. Heape, G. Lubec, and P. Kursula, Structural analysis of the complex between calmodulin and full length myelin basic protein, an intrinsically disordered molecule, Amino Acids, 39, 59, 2010.
S. Malmgren, H. Rensmo, T. Gustafsson, M. Gorgoi, and K. Edström, Non-destructive depth profiling of the solid electrolyte interphase on LiFePO4 and graphite electrodes, ECS Trans., 25, 201, 2010.
G. Mamo, M. Thunnissen, R. Hatti-Kaul, and B. Mattiasson, An alkaline active xylanase: Insights into mechanisms of high pH catalytic adaptation, Biochimie, 91, 1187, 2009.
B. Mandl, J. Stangl, E. Hilner, A.A. Zakharov, K. Hillerich, L. Samuelson, G. Bauer, K. Deppert, and A. Mikkelsen, Growth mechanism of self-catalyzed III-V nanowires, NANO Lett., 10, 4443, 2010.
N.M. Martin, J. Knudsen, S. Blomberg, J. Gustafson, J.N. Andersen, E. Lundgren, H. Härelind Ingelsten, P.-A. Carlsson, M. Skoglundh, A. Stierle, and G. Kresse, High resolution core level spectroscopy study of the ultrathin aluminum oxide film on NiAl(110), Phys. Rev. B, in press.
C.L. McGuiness, G.A. Diehl, D. Blasini, D.-M. Smilgies, M. Zhu, N. Samarath, T. Weidner, N. Ballav, M. Zharnikov, and D.L. Allara, Molecular self-assembly at bare semiconductor surfaces: Cooperative substrate-molecule effects in octadecanethiolate monolayer assemblies on GaAs (111), (110), and (100), ACS Nano 4, 3447, 2010.
J. Mi, M. Christensen, C. Tyrsted, K.M.Ø. Jensen, J. Becker, P. Hald, and B.B. Iversen, Formation and growth of Bi2Te3 in biomolecule-assisted near-critical water: In situ synchrotron radiation study, J. Phys. Chem. C 114, 12133, 2010.
J. Mi, T.N. Jensen, M. Christensen, C. Tyrsted, J.E. Jørgensen, and B.B. Iversen, High-temperature and high-pressure aqueous solution formation, growth,crystal structure, and magnetic properties of BiFeO3 nanocrystals, Chem. Mater., in press. DOI: 10.1021/cm102575w.
A. Mikkelsen, S. Ghantnekar-Nilsson, E. Hilner, E. Lundgren, L. Montelius, J.N. Andersen, and A.A. Zakharov, Low temperature Ga surface diffusion from focused Ion beam milled grooves studied by X-ray photoemission electron microscopy, Submitted to Nano Lett.
O.V. Molodtsova, I.M. Aristova, V.V. Kveder, M. Knupfer, C. Laubschat, and V.Yu. Aristov, Morphology and properties of hybrid systems comprising gold nanoparticles in CuPc matrix, Submitted to e-J. Surf. Sci. Nanotechnol.

550 MAX-lab ACTIVITY REPORT 2010
PUBLICATIONS
D. Moore, S. Krishnamurthy, Y. Chao, Q. Wang, D. Brabazon, and P.J. McNally, Characteristics of silicon nanocrystals for photovoltaic applications, Phys. Stat. Sol. A, in press. DOI: 10.1002/pssa.20100038.
A.M. Mulders, H. Loosvelt, A. Fraile Rodriguez, E. Popova, T. Konishi, K. Temst, O. Karis, D. Arvanitis, and C. Van Haesendonck, On the interface magnetism of thin oxidized Co films: orbital and spin moments, J. Phys.: Condens. Matter, 21, 124211, 2009.
H. Navirian, H. Enquist, R. Nüske, A. Jurgilaitis, C.v. Korff Schmising, P. Sondhauss, and J. Larsson, Acoustically driven ferroelastic domain switching observed by time-resolved X-ray diffraction, Phys. Rev. B 81, 024113, 2010.
W.R. Newson, M.S. Hedenqvist, M. Gällstedt, R. Kuktaite, T.S. Plivelic, and E. Johansson, Bio-plastic sheets composed of proteins from oil crops Crambe abyssinica and Brassica carinata mechanical properties, structural morphology and potential use for packaging, In manuscript.
M.L. Ng, R. Balog, L. Hornekær, A.B. Preobrajenski, N.A. Vinoggradov, N. Mårtensson, and K. Schulte, Controlling hydrogenation of graphene on transition metals, J. Phys. Chem. C 114, 18559, 2010.
O.F. Nielsen, T.M. Greve, and A. Engdahl, FTIR-synchrotron and NIR-FT-Raman studies of water in animal and human skin, In: ”EUCMOS 2010”, 30th European Congress on Molecular Spectroscopy, Eds. M Beccucci, C Gellini, and V Schettino, p. 83, 2010.
O.F. Nielsen, T.M. Greve, N.D. Fries, N.W. Larsen, and A. Engdahl, Low-wavenumber raman and synchrotron studies of proteins and protein/water interactions. From model system to animal and human skin, AIP Conf. Proc., 1267, 366, 2010.
T.K. Nielsen, U. Bösenberg, R. Gosalawit, M. Dornheim, Y. Cerenius, F. Besenbacher, and T.R. Jensen, A reversible nanoconfined chemical reaction, ACS Nano, 4, 3903, 2010.
J. Niskanen, S. Urpelainen, S. Aksela, H. Aksela, O. Vahtras, V. Carravetta, and H. Ågren, Valence photoionization of LiCl monomer and dimer, Phys. Rev. A 81, 043401, 2010.
Å. Nylander, N. Forsgren, and K. Persson, Structure of the C-terminal domain of the surface antigen SpaP from the caries pathogen Streptococcus mutans, Acta Cryst. F 67, 23, 2011.
R. Nüske, C.v. Korff Schmising, A. Jurgilaitis, H. Enquist, H. Navirian, P. Sondhauss, and J. Larsson, Time-resolved X-ray scattering from laser-molten indium antimonide, Rev. Sci. Instrum., 81, 013106, 2010.
A. Nørlund Christensen, T.R. Jensen, E. DiMasi, Y. Cerenius, and B. Hauback, The crystal structure of -BaC2O4 and thermal decomposition of BaC2O4•0.5H2O and BaC2O4•3.5H2O using in situ X-ray and neutron diffraction data, To be submitted to J. Sol. Stat. Chem.
N. Ottosson, J. Heyda, E. Wernersson, W. Pokapanich, S. Svensson, B. Winter, G. Öhrwall, P. Jungwirth, and O. Björneholm, The influence of concentration on the molecular surface structure of simple and mixed aqueous electrolytes, Phys. Chem. Chem. Phys., 12, 10693, 2010.
N. Ottosson, R. Vácha, E.F. Aziz, W. Pokapanich, W. Eberhardt, S. Svensson, G. Öhrwall, P. Jungwirth, O. Björneholm, and B. Winter, Large variations in the propensity of aqueous oxychlorine anions for the solution/vapor interface, J. Chem. Phys., 131, 124706, 2009.

MAX-lab ACTIVITY REPORT 2010 551
PUBLICATIONS
M. Ozga, R. Dolot, M. Janicka, R. Kaczmarek, and A. Krakowiak, Histidine triad nucleotide-binding protein 1 (HINT-1) phosphoramidase transforms nucleoside 5’-O-phosphorothioates to nucleoside 5’-O-phosphates, J. Biol. Chem., 285, 40809, 2010.
O.M. Ozkendir, The electronic structure study of Fe L3 edge in CuFeO2, Optoelectr. Adv. Mater.- Rap. Commun. (OAM-RC), 3, 586, 2009.
P. Pal, M.K. Dalai, R.B. Sekhar, I. Ulfat, M. Merz, P. Nagel, S. Schuppler, C. Madhu, and A. Sundaresan, Resonant photoemission spectroscopy studies of magnetic phase transitions in Pr0.5Sr0.5MnO3, Submitted to J. Phys.: Condens. Matter.
P. Pal, M.K. Dalai, and I. Ulfat, Pseudogap behavior in Pr0.5Sr 0.5MnO3: A photoemission study, Surf. Sci., 2011, DOI: 10.1016/j.susc.2011.01.031.
P. Pal and I. Ulfat, Electron spectroscopic investigations of SrMnO3 doped with Mo, In manuscript.
P. Pal, and I. Ulfat, Nd0.5Sr 0.5MnO3 thin films studied via SQUID and XMCD, In manuscript.
P. Palmgren, O. Karis, H. Grennberg, U. Jansson, E. Widendkvist, and E. Lewin, Transition metal doping of TiC: A route for low temperature formation of graphene overlayers, In manuscript.
P. Palmgren, R. Knut, P. Pal, K. Novoselov, A. Geim, O. Karis, M. Katsnelson, and O. Eriksson, Electronic structure of graphane, graphene and graphene oxide, In manuscript.
L. Partanen, S. Fritzsche, K. Jänkälä, M. Huttula, S. Urpelainen, S. Osmekhin, H. Aksela, and S. Aksela, 2s photoionization and subsequent Auger cascade in atomic Si, Phys. Rev. A 81, 062513, 2010.
M. Patanen, S. Aksela, S. Urpelainen, T. Kantia, S. Heinäsmäki, and H. Aksela, Free atom 4f photoelectron spectra of Au, Pb and Bi, J. Electron Spectrosc. and Relat. Phenom., in press.
M. Patanen, S. Heinäsmäki, S. Urpelainen, S. Aksela, and H. Aksela, 4d-1 photoelectron and subsequent N45OO Auger electron spectra of atomic Sb, Phys. Rev. A 81, 053419, 2010.
B.R. Pauw, M.E. Vigild, K. Mortensen, J.W. Andreasen, and E.A. Klop, Analysing the nanoporous structure of aramid fibres, J. Appl. Cryst., 43, 837, 2010.
N. Peltekis, B. Holland, S. Krishnamurthy, C. Stephens, G. Cabailh, I.T. McGovern, L. Kjeldgaard, J.E. Downes, H.J. Trodahl, S. Wang, K.E. Smith, and C. McGuinness, Synchrotron radiation induced beam damage studies in the phtalocyanine family of organic molecular semiconductors, Submitted to Surf. Sci.
L.M.A. Perdigão, A.J. Britton, N. Taleb, M. Gimenex-Lopez, N.R. Champness, J.N. O’Shea, and P.H. Beton, Self-assembled chains of single molecule magnets on a gold surface, Submitted to Nature Nanotechnol.
A. Persson, L. Gridneva, M.A. Niño, J. Camarero, J.J. de Miguel, R. Miranda, C. Hofer, C. Teichert, T. Bobek, A. Locatelli, and D. Arvanitis, On the spin reorientation of ordered magnetic nano-dot arrays: Pt/Co/Pt versus Au/Co/Au, In manuscript.

552 MAX-lab ACTIVITY REPORT 2010
PUBLICATIONS
K. Persson, Structure of the sortase AcSrtC-1 from Actinomyces oris, Acta Cryst. D 67, 212, 2011.
T. Pesnot, R. Jørgensen, M.M. Palcic, and G.K. Wagner, Structural and mechanistic basis for a new mode of glycosyltransferase inhibition, Nature Chem. Biol., 6, 321, 2010.
Z. Pietralik, M. Chrabąszczewska, and M. Kozak, Interactions of cationic gemini surfactants with DMPC, Synchrotron Rad. Nat. Sci., 8, 81, 2009.
Z. Pietralik, M. Taube, M. Balcerzak, A. Skrzypczak, and M. Kozak, SAXS studies of DMPC and DPPC-Dimeric surfactant lipoplexes, Synchrotron Rad. Nat. Sci., 9, 151, 2010.
Z. Pietralik, M. Taube, A. Skrzypczak, and M. Kozak, SAXS study of influence of gemini surfactant – 1,4-bis[(butane)imidazole-1-yl-3-dodecyloxymethyl di-chloride on the DMPC-based biomembrane model, Acta Phys. Polonica A 117, 311, 2010.
C. Pistidda, G. Barkhordarian, D.B. Minella, S. Garroni, F. Dolci, T. Jensen, U. Bösenberg, Y. Cerenius, W. Lohstroh, M. Fichtner, R. Bormann, and M. Dornheim, Formation of 2 NaBH4+MgH2 by hydrogenation of 2NaH+MgB2, J. Phys. Chem. C 114, 10291, 2010.
C. Pistidda, S. Garroni, C. Bonatto Minella, F. Doci, T.R. Jensen, P. Nolis, U. Bösenberg, Y. Cerenius, W. Lohstroh, M. Fichtner, M.D. Baro, R. Bormann, and M. Dornheim, Pressure effect on the 2NaH+MgB2 hydrogen absorption reaction, J. Phys. Chem. C 114, 21816, 2010.
C. Pistidda, S. Garroni, F. Doci, A. Khandelwal, E.G. Bardaji, P. Nolis, M. Dornheim, R. Gosalawit, T. Jensen, Y. Cerenius, S. Surinach, M.D. Baro, W. Lohstroh, and M. Fichtner, Synthesis of amorphous Mg(BH4)2 from MgB2 and H2 at room temperature, J. Alloys Comp., 508, 212, 2010.
P. Piszora, Balancing of manganese oxidation state in lithium-manganese oxides by chemical reaction conditions and initial stoichiometry, Submitted.
W. Pitsawong, J. Sucharitakul, M. Prongjit, T.-C. Tan, O. Spadiut, D. Haltrich, C. Divne, and P. Chaiyen, A conserved active-site threonine is important for both sugar and flavin oxidations of pyranose 2-oxidase, J. Biol. Chem., 285, 9697, 2010.
V. Pogorelov, I. Doroshenko, P. Uvdal, V. Balevicius, and V. Sablinskas, Temperature-controlled kinetics of the growth and relaxation of alcohol clusters in an argon matrix, Mol. Phys., 108, 2165, 2010.
M. Polanski, J. Bystrzycki, T.K. Nielsen, Y. Cerenius, and T.R. Jensen, Synthesis and decomposition mechanisms of Mg2FeH6 studied by in-situ synchrotron X-ray diffraction and high-pressure DSC, Int. J. Hydrogen Energy, 35, 3578, 2010.
P.K. Pranzas, U. Bösenberg, F. Karimi, M. Münning, O. Metz, C. Bonatto Minella, H.-W. Schmitz, F. Beckmann, U. Vainio, D. Zajak, E. Welter, T.R. Jensen, Y. Cerenius, R. Bormann, T. Klassen, M. Dornheim, and A. Schreyer, Characterisation of hydrogen storage materials and systems with photons and neutrons, Adv. Eng. Mater., in press.
A.R.H. Preston, B.J. Ruck, W.R.L. Lambrecht, L.F.J. Piper, J.E. Downes, K.E. Smith, and H.J. Trodahl, Electronic band structure information of GdN extracted from X-ray absorption and emission spectroscopy, Appl. Phys. Lett., 96, 032101, 2010.

MAX-lab ACTIVITY REPORT 2010 553
PUBLICATIONS
A. Puig-Molina, F. Morales Cano, and T.V.W. Janssens, The Cu promoter in an Iron-Chromium-Oxide based water-gas shift catalyst under industrial conditions studied by in-Situ XAFS, J. Phys. Chem. C 114, 15410, 2010.
R. Pärna, E. Nõmmiste, A. Kikas, P. Jussila, M. Hirsimäki, M. Valden, and V. Kisand, Electron spectroscopic study of passive oxide layer formation on Fe-19Cr-18Ni-1Al-TiC austenitic stainless steel, J. Electron Spectrosc. and Relat. Phenom., 182, 108, 2010.
B. Qi, B. Agnarsson, S. Olafsson, H.P. Gislason, and M. Göthelid, Spectroscopic photoemission and low-energy electron microscope (SPELEEM) study on nitridation of Al nano patterns with ammonia, Submitted to J. Phys.: Condens. Matter.
B. Qi, S. Olafsson, B. Agnarsson, and M. Göthelid, High resolution X-ray photoemission spectroscopy study of AlN nano-columns grown by nitridation of Al nano-squares on Si(111) substrates with ammonia, Thin Solid Films, 518, 3632, 2010.
A. Ramachandran, T. Andersen, L.E. Walle, I.-H. Svenum, and A. Borg, Methanol adsorption on Pd(110) and Ag/Pd(110) studied by high-resolution photoelectron spectroscopy, Surf. Sci., 604, 89, 2010.
D.B. Ravnsbæk, R. Černý, Y. Filinchuk, and T.R. Jensen, Powder diffraction methods for studies of borohydride-based energy storage materials, Z. Krist., 225, 557, 2010.
D.B. Ravnsbæk, Y. Filinchuk, R. Černý, M.B. Ley, D. Haase, H.J. Jakobsen, J. Skibsted, and T.R. Jensen, Thermal polymorphism and decomposition of Y(BH4)3 , Inorg. Chem., 49, 3801, 2010.
D.B. Ravnsbæk and T.R. Jensen, Tuning hydrogen storage properties and reactivity; Investigation of the system LiBH4 – NaAlH4, J. Phys. Chem. Sol., 71, 1144, 2010.
D.B. Ravnsbæk, L.H. Sørensen, Y. Filinchuk, D. Reed, D. Book, H.J. Jakobsen, F. Besenbacher, J. Skibsted, and T.R. Jensen, Mixed-anion and mixed-cation borohydride KZn(BH4)Cl2: Synthesis, structure and thermal decomposition, Eur. J. Inorg. Chem., 2010, 1608, 2010.
I.C. Razado-Colambo, J.R. Osiecki, and R.I.G. Uhrberg, STM studies of the Sn/Ge(111)3x3 and 3x3 surfaces, Submitted to Surf. Sci.
A. Resta, J. Blomquist, J. Gustafson, H. Karhu, A. Mikkelsen, E. Lundgren, P. Uvdal and J.N. Andersen, Acetate formation during the ethanol oxidation on Rh(1 1 1), Surf. Sci., in press.
M.C. Richter, J.-M. Mariot, O. Heckmann, L. Kjeldgaard, B.S. Mun, C.S. Fadley, U. Lüders, J.-F. Bobo, P. De Padova, A. Taleb-Ibrahimi, and K. Hricovini, NiFe2O4 and Fe3O4 studied by XMCD and resonant photoemission, Eur. Phys. J. Spec. Top., 169, 175, 2009.
C. Riedl, C. Coletti, and U. Starke, Structural and electronic properties of epitaxial graphene on SiC(0001): A review of growth, characterization, transfer doping and hydrogen intercalation, J. Phys. D: Appl. Phys., 43, 374009, 2010.
L.C.V. Rodrigues, R. Stefani, H.F. Brito, M.C.F.C. Felinto, J. Hölsä, M. Lastusaari, T. Laamanen, and M. Malkamäki, Thermoluminescence and synchrotron radiation studies on the persistent luminescence of BaAl2O4:Eu2+,Dy3+, J. Sol. Stat. Chem., 183, 2365, 2010.

554 MAX-lab ACTIVITY REPORT 2010
PUBLICATIONS
L.H. Rude, L.M. Arnbjerg, Y. Filinchuk, F. Besenbacher, and T.R. Jensen, The effect of anion substitution in metal borohydrides, Am. Chem. Soc., Div. Fuel Chem. 55, 96, 2010.
L.H. Rude, T.K. Nielsen, D.B. Ravnsbæk, M.B. Ley, B. Richter, L.M. Arnbjerg, U. Bösenberg, M. Dornheim, Y. Filinchuk, F. Besenbacher, and T.R. Jensen, Tailoring properties of borohydrides for hydrogen storage: A review, Phys. Stat. Sol., in press.
V. Sablinskas, M. Pucetaite, J. Ceponkus, and L. Kimtys, Structure of propanoic acid dimers as studied by means of MIR and FIR spectroscopy, J. Mol. Struct., 976, 263, 2010.
A. Sandell, B. Sanyal, L.E. Walle, P. Uvdal, and A. Borg, Probing the conduction band edge of transition metal oxides by X-ray absorption spectroscopy, Submitted to J. Electron Spectrosc. and Relat. Phenom.
F. Sander, T. Peterle, N. Ballav, F. von Wrochem, M. Zharnikov, and M. Mayor, Loops vs. stems: benzylic sulfide oligomeres forming carpet type monolayers, J. Phys. Chem. C 114, 4118, 2010.
A. Saywell, A.J. Britton, N. Taleb, M. Giménez-López, N.R. Champness, P.H. Beton, and J.N O’Shea, Single molecule magnets on a gold surface: In-situ electrospray deposition, X-ray absorption and photoemission, Nanotechnol., 22, 075704, 2011.
A. Saywell, G. Magnano, C.J. Satterley, L.M.A. Perdigão, A.J. Britton, N. Taleb, M. Giménez-López, N.R. Champness, J.N. O’Shea, and P.H. Beton, Self-assembled aggregates formed by single-molecule magnets on a gold surfaces, Nature Commun., 1, 75, 2010.
A. Saywell, J.K. Sprafke, L.J. Esdaile, A.J. Britton, A. Rienzo, H.L. Anderson, J.N. O’Shea, and P.H. Beton, Conformation and packing of porphyrin polymer chains deposited using electrospray on a gold surface, Ang. Chem. Int. Ed., 49, 9136, 2010.
A. Schaefer, A. Sandell, L.E. Walle, M. Schowalter, V. Zielasek, A. Rosenauer, and M. Bäumer, Chemistry of thin film formation and stability during praseodymium oxide deposition on Si(111) under oxygen-deficient condition, Surf. Sci., 604, 1287, 2010.
J. Schiessling, A. Grigoriev, M. Stener, L. Kjeldgaard, T. Balasubramanian, P. Decleva, R. Ahuja, J. Nordgren, and P.A. Brüwhiler, The role of charge-charge correlations and covalent bonding in the electronic structure of adsorbed C60 :C60 / Al, J. Phys. Chem. C, 114, 18686, 2010.
S. Schreiner, A. Hatch, D. Shudy, C. Howell, J. Zhao, P. Koelsch, M. Zharnikov, D. Petrovykh, and A. Opdahl, Impact of DNA-surface interactions on the stability of DNA hybrids, Submitted to J. Am. Chem. Soc.
L. Schuldt, S. Weyand, G. Kefala, and M.S. Weiss, The three-dimensional structure of a mycobacterial DapD provides insights into DapD diversity and reveals unexpected particulars about the enzymatic mechanism, J. Mol. Biol., 389, 863, 2009.
P. Schütz, T. Karlberg, S. van den Berg, R. Collins, L. Lehtiö, M. Högbom, L. Holmberg-Schiavone, W. Tempel, H.W. Park, M. Hammarström, M. Moche, A.G. Thorsell, and H. Schüler, Comparative structural analysis of human DEAD-box RNA helicases, PLoS One., 5, e12791, 2010.
M. Segad, B. Jönsson, T. Åkesson, and B. Cabane, Ca/Na Montmorillonite: Structure, forces and swelling properties, Langmuir, 26, 5782, 2010.

MAX-lab ACTIVITY REPORT 2010 555
PUBLICATIONS
L. Selegård, V. Khranovskyy, F. Söderlind, C. Vahlberg, M. Ahrén, P.-O. Käll, R Yakimova, and K. Uvdal, Biotinylation of ZnO nanoparticles and thin films: A two-step surface functionalization study, ACS Appl. Mater. & Interfaces, 2, 2128, 2010.
L. Shi, K.E. Christensen, K. Jansson, Z. He, and X.D. Zou, SU-46: Synthesis and characterization of a new three-dimensional open-framework aluminogermanate, To be submitted to Inorg. Chem.
L. Šiller, Y. Chao, S. Krishnamurthy, and K. Svensson, Vacuum ultraviolet photoinduced reactions in solid CO2 and solid CO2 with coadsorbed water at 20K: A photoemisson spectroscopy study, Submitted to Phys. Rev. B.
N. Skar-Gislinge, J.B. Simonsen, K. Mortensen, R. Feidenhans’l, S.G. Sligar, B.L. Møller, T. Bjørnholm, and L. Arleth, Elliptical structure of phospholipid bilayer nanodiscs encapsulated by scaffold proteins: Casting the roles of the lipids and the protein, J. Am. Chem. Soc., 132, 13713, 2010.
U. Skyllberg, Biogeochemistry of mercury in soils and sediments, In: “Synchrotron-Based Techniques in Soil and Sediment”, Eds. Gräfe and Singh, Elsevier, in press.
A. Sobkowiak, J. Ångström, T. Kollin Nielsen, Y. Cerenius, T.R. Jensen, and M. Sahlberg, Hydrogen absorption and desorption properties of a novel ScNiAl alloy, Appl. Phys. A, Published online DOI: 10.1007/s00339-010-6116-z.
A. Sobkowiak, J. Ångström, T.K. Nielsen, Y. Cerenius, T.R. Jensen, and M. Sahlberg, ScNiAl, a novel material for hydrogen storage, J. Appl. Phys., in press.
C. Solano Arribas, S. Jonsson, A. Pillai, O.F. Wendt, and K. Wärnmark, Chiral Cu(I) and Ag(I) complexes of a 2-Pyridone-Fused 2,2’-Bipyridine analogue: Formation of rods containing hetero- and homochiral metal centers in the solid state, Submitted.
F. Song, J.W. Wells, K. Handrup, Z.S. Li, S.N. Bao, K. Schulte, M. Ahola-Tuomi, L.C. Mayor, J.C. Swarbrick, E.W Perkins, L. Gammelgaard, and Ph. Hofmann, Direct measurement of electrical conductance through a self-assembled molecular layer, Nature Nanotechnology, 4, 373, 2009.
O. Spadiut, D. Brugger, T.C. Tan, C. Divne, and D. Haltrich, Mutations in the active site loop of pyranose 2-oxidase from Trametes multicolor dramatically affect catalytic activity with sugar substrates and electron acceptors and substrate specificity, To be submitted.
O. Spadiut, K. Radakovits, I. Pisanelli, C. Salaheddin, M. Yamabhai, T.-C. Tan, C. Divne, and D. Haltrich, A thermostable triple mutant of pyranose 2-oxidase from Trametes multicolor with improved properties for biotechnological applications, Biotechnol. J., 4, 525, 2009.
U. Starke, Bandstructure manipulation of epitaxial graphene on SiC(0001) by molecular doping and hydrogen intercalation, In: “Silicon Carbide 2010 - Materials, Processing, and Devices”, Eds. S.E. Saddow, E. Sanchez, F. Zhao, and M. Dudley, Mater. Res. Soc. Symp. Proc., Vol. 1246, B10-01, Warrendale, PA, 2010.
B.-M. Steenari and K. Norén, The speciation and mobility of Zn in ash from biomass combustion in fluidised bed combustors – effects of kaolin and sulphur addition during combustion, Submitted to Environ. Sci. Technol.
B.-M. Steenari and K. Norén, The speciation of Zn in ash from combustion of municipal solid waste, Submitted to Environ. Sci. Technol.

556 MAX-lab ACTIVITY REPORT 2010
PUBLICATIONS
B.-M. Steenari, K. Norén, and K. Karlfeldt, The speciation of Cu in ash from combustion of municipal solid waste, In manuscript.
S. Surnev, F. Allegretti, G. Parteder, T. Franz, F. Mittendorfer, J.N. Andersen, and F.P. Netzer, One-Dimensional Oxide-Metal Hybrid Structures: Site-Specific Enhanced Reactivity for CO Oxidation, ChemPhysChem, 11, 2506, 2010.
P.D. Svensson and S. Hansen, Intercalation of smectite with liquid ethylene glycol – Resolved in time and space by synchrotron X-ray diffraction, Appl. Clay Sci., 48, 358, 2010.
P.D. Svensson and S. Hansen, Freezing and thawing of Montmorillonite – A time resolved synchrotron X-ray diffraction study, Appl. Clay Sci., 49, 127, 2010.
I.-H. Svenum, Ø. Borck, L.E. Walle, K. Schulte, and A. Borg, Adsorption of CO on Ni3Al(111) investigated using high-resolution photoemission spectroscopy and density functional theory, Phys. Rev. B 81, 245432, 2010.
K. Syres, A. Thomas, F. Bondino, M. Malvestuto, and M. Graetzel, Dopamine adsorption on anatase TiO2(101): A photoemission and NEXAFS spectroscopy study, Langmuir, 26, 14548, 2010.
K. Szamota-Leandersson, M. Leandersson, M. Göthelid, and U.O. Karlsson, Correlated development of a (2x2) reconstruction and a charge accumulation layer on the InAs(111)-Bi surface, Surf. Sci., 605, 12, 2011.
L.J. Sæthre, K.J. Børve, and T.D. Thomas, Chemical shifts of carbon 1s ionization energies, J. Electron Spectrosc. and Relat. Phenom., 183, 2, 2011.
A.V. Talyzin, S.M. Luzan, K. Leifer, S. Akhtar, J. Fetzer, F. Cataldo, V. Dmitriev, Y. Tsybin, C.-Wai Tai, A. Dzwilewski, and E. Moons, Coronene fusion by heat treatment: road to nano-graphenes, Manuscript in preparation.
K. Tars, B. Olin, and B. Mannervik, Structural basis for featuring of steroid isomerase activity in Alpha Class Glutathione Transferases, J. Mol. Biol., 397, 332, 2010.
M. Taube, M. Hilgendorff, Z. Pietralik, M. Giersig, and M. Kozak, SAXS studies of Fe3O4/SiO2 nanoparticles for nanosensing, Synchrotron Rad. Nat. Sci., 9, 156, 2010.
M. Tchaplyguine, G. Öhrwall, and O. Björneholm, Photoelectron spectroscopy of free clusters, In: “Handbook of Nanophysics: Clusters and Fullerenes”, pp 7:1-31, Ed. K.D. Sattler, CRC Press, 2010.
F. Tholander, B.P. Roques, M.C. Fournié-Zaluski, M.M.G.M. Thunnissen, and J.Z. Haeggström, Crystal structure of leukotriene A4 hydrolase in complex with kelatorphan, implications for design of zinc metallopeptidase inhibitors, FEBS Lett., 584, 3446, 2010.
T.D. Thomas, E. Kukk, T. Ouchi, A. Yamada, H. Fukuzawa, K. Ueda, R. Püttner, I. Higuchi, Y. Tamenori, T. Asahina, N. Kuze, H. Kato, M. Hoshino, H. Tanaka, A. Lindblad, and L.J. Sæthre, Valence photoelectron spectroscopy of N2 and CO: Recoil-induced rotational excitation, relative intensities, and atomic orbital composition of molecular orbitals, J. Chem. Phys., 133, 174312, 2010.
A.-G. Thorsell, C. Persson, S. Graslund, M. Hammarstrom, R.D. Busam, and B.M. Hallberg, Crystal structure of human diphosphoinositol phosphatase 1, Proteins - Structure, Function and Bioinformatics, 77, 242, 2009.

MAX-lab ACTIVITY REPORT 2010 557
PUBLICATIONS
R. Timm, A. Fian, M. Hjort, C. Thelander, E. Lind, J.N. Andersen, L.-E. Wernersson, and A. Mikkelsen, Reduction of native oxides on InAs by atomic layer deposited Al2O3 and HfO2, Appl. Phys. Lett., 97, 132904, 2010.
Ö. Topel, I. Persson, D. Lundberg, and A.-S. Ullström, Reactions and structures in the Gallium(III)/Indium(III)-N,N-dimethylthioformamide systems, Inorg. Chim. Acta, 365, 220, 2011.
O. Travnikova, D. Céolin, Z. Bao, K.J. Børve, T. Tanaka, M. Hoshino, H. Kato, H. Tanaka, J.R. Harries, Y. Tamenori, G. Prümper, T. Lischke, X.-J. Liu, M.N. Piancastelli, and K. Ueda, Selective vibrational excitation in the resonant Auger decay following core-to-* transitions in N2O, J. Electron Spectrosc. and Relat. Phenom., 181, 129, 2010.
O. Travnikova, R.F. Fink, A. Kivimäki, D. Céolin, Z. Bao, and M.N. Piancastelli, Assignment of the L2,3VV normal Auger decay spectrum of Cl2 by ab initio calculations, Chem. Phys. Lett., 474, 67, 2009.
O. Travnikova, C. Miron, M. Bässler, R. Feifel, M.N. Piancastelli, S.L. Sorensen, and S. Svensson, Resonant Auger decay study of C1s - * core-excited OCS, J. Electron Spectrosc. and Relat. Phenom., 174, 100, 2009.
K. Trzeciak-Karlikowska, A. Bujacz, W. Ciesielski, G.D. Bujacz, and M.J. Potrzebowski, Does the stereochemistry of alanine has influence on the solid state conformation, crystal packing and molecular dynamics of N-terminal sequences of opioid peptides? XRD and NMR study of Tyr-(L-Ala)-Phe-Gly and Tyr-(D-Ala)-Phe-Gly tetrapeptides, To be submitted.
V.G. Tsirkone, E. Tsoukala, C. Lamprakis, S. Manta, J.M. Hayes, V.T. Skamnaki, C. Drakou, S.E. Zographos, D. Komiotis, and D.D. Leonidas, 1-(3-Deoxy-3-fluoro-beta-D-glucopyranosyl) pyrimidine derivatives as inhibitors of glycogen phosphorylase b: Kinetic, crystallographic and modelling studies, Bioorg. Med. Chem., 18, 3413, 2010.
K.E. Tsitsanou, T. Thireou, C.E. Drakou, K. Koussis, M. Keramioti, D.D Leonidas, E. Eliopoulos, K. Iatrou, and S.E. Zographos, Anopheles gambiae odorant binding protein crystal complex with the synthetic repellent DEET: Implications for structure-based design of novel mosquito repellents, In manuscript.
C. Tyrsted, J. Becker, P. Hald, M. Bremholm, J.S. Pedersen, J. Chevallier, Y. Cerenius, S.B. Iversen, and B.B. Iversen, In-situ synchrotron radiation study of formation and growth of crystalline CexZr1−xO2 nanoparticles synthesized in supercritical water, Chem. Mater., 22, 1814, 2010.
C.R. Underwood, P. Garibay, L. Bjerre Knudsen, S. Hastrup, G.H. Peters, R. Rudolph, and S. Reedtz-Runge, Crystal structure of glucagon-like peptide-1 in complex with the extracellular domain of the glucagon-like peptide-1 receptor, J. Biol. Chem., 285, 723, 2010.
J. Unga, P. Matsson, and D. Mahlin, Understanding polymer – lipid solid dispersions – The properties of incorporated lipids govern the crystallisation behaviour of PEG, Int. J. Pharmaceutics, 386, 61, 2010.
S. Urpelainen, M. Huttula, T. Balasubramanian, R. Sankari, P. Kovala, E. Kukk, E. Nõmmiste, S. Aksela, R. Nyholm, and H. Aksela, FINEST: A high performance branch-line for VUV photon energy range gas phase studies at MAX-lab, AIP Conf. Proc., 1234, 411, 2010.

558 MAX-lab ACTIVITY REPORT 2010
PUBLICATIONS
C. Vahlberg, M. Linares, S. Villaume, P. Norman, and K. Uvdal, Noradrenaline and a Thiol analogue on gold surfaces: An infrared reflection-absorption spectroscopy, X-ray photoelectron spectroscopy, and near-edge X-ray absorption fine structure spectroscopy study, J. Phys. Chem. C 115, 165, 2011.
K. Walldén, A. Rinaldo-Matthis, B. Ruzzenente, C. Rampazzo, V. Bianchi, and P. Nordlund, Structure of human cytosolic Deoxyribonucleotidase: Insights into recognition of substrates and nucleoside analogs, In manuscript
K. Walldén, B. Ruzzenente, V. Bianchi, and P. Nordlund, Structures of the human mitochondrial deoxyribonucleotidase in complex with nucleoside analogue monophosphates: Implications for the structure-aided design of novel nucleoside analogues, In manuscript.
L.E. Walle, A. Borg, E.M.J. Johansson, S. Plogmaker, H. Rensmo, P. Uvdal, and A. Sandell, Mixed dissociative and molecular water adsorption on anatase TiO2(101), Submitted to J. Phys. Chem.
C.-J. Wallentin, T. Wixe, O.F. Wendt, K.-E. Bergquist, and K. Wärnmark, Enantio- and diastereomerically pure molecular tweezers from enantiopure building blocks and no fidelity in homochiral aggregation of the racemate, Chem. Eur. J., 16, 3994, 2010.
G. Vall-llosera, S. Lacombe, S. Sarabipour, E. Rachlew, F. Hennies, and M.A. Huels, Morphology and degradation of Adenine films by core specific ionization, In manuscript.
Q. Wang, A. Pietzsch, F. Hennies, H. Ni, and Y. Chao, Synthesis of water dispersible photoluminescent silicon nanoparticles and their use in biological fluorescent imaging, J. Nanopart. Res., in press.
S. Watcharinyanon, E. Moons, and L.S.O. Johansson, Mixed self-assembled monolayers of ferrocene-terminated and unsubstituted Alkanethiols on gold: Surfa-ce Structure and Work Function, J. Phys. Chem. C 113, 1972, 2009.
S. Watcharinyanon, C. Virojanadara, J.R. Osiecki, A.A. Zakharov, R. Yakimova, R.I.G. Uhrberg and L.I. Johansson, Hydrogen intercalation of graphene grown on 6H-SiC(0001), Surf. Sci., doi:10.1016/j.susc.2010.12.018.
T. Weidner, M. Zharnikov, J. Hoßbach, D.G. Castner, and U. Siemeling, Adamantane-based tripodal thioether ligands functionalized with a redox-active ferrocenyl moiety for self-assembled monolayers, J. Phys. Chem. C 114, 14975, 2010.
M.B. Vester-Christensen, M. Abou Hachem, B. Svensson, and A. Henriksen, The crystal structure of barley limit dextrinase in complex with - and -cyclodextrins. Insight into substrate specificity of a pivotal enzyme in seed starch degradation, J. Mol. Biol., 403, 739, 2010.
M. Weston, A.J. Britton and J.N. O’Shea, Charge transfer dynamics of model charge transfer centres of a multicentre water splitting dye complex on rutile TiO2(110), J. Chem. Phys., 134, 054705, 2011.
J.M. Wikberg, R. Knut, M. Ottosson, J. Sadowski, O. Karis, and P. Svedlindh, Magneto crystalline anisotropy and uniaxiality of MnAs:GaAs(100) films, In manuscript.
C. Virojanadara, S. Watcharinyanon, A.A. Zakharov, and L.I. Johansson, Epitaxial graphene on 6H-SiC and Li intercalation, Phys. Rev. B 82, 205402, 2010.

MAX-lab ACTIVITY REPORT 2010 559
PUBLICATIONS
C. Virojanadara, R. Yakimova, A.A. Zakharov, and L.I. Johansson, Large homogeneous mono-/Bi-layer graphene on 6H-SiC(0001) and buffer layer elimination, J. Phys. D: Appl. Phys., 43, 374010, 2010.
C. Virojanadara, A.A. Zakharov, S. Watcharinyanon, R. Yakimova, and L.I. Johansson, A LEEM and XPEEM study of Li intercalated into graphene on SiC(0001), New J. Phys,. 12, 125015, 2010.
C. Virojanadara, A.A. Zakharov, R. Yakimova, and L.I. Johansson, Buffer layer free large area bi-layer graphene on SiC(0001), Surf. Sci., 604, L4, 2010.
A. Wolska, M.T. Klepka, K. Lawniczak-Jablonska, D. Arvanitis, and A. Misiuk, EXAFS and XMCD investigations on the Mn+ implanted silicon crystals, Synchrotron Rad. Nat. Sci., 9, 126, 2010.
A. Wolska, M.T. Klepka, K. Lawniczak-Jablonska, A. Misiuk, and D. Arvanitis, Structural and magnetic properties of Mn+ implanted silicon crystals studied using X-ray absorption spectroscopy techniques, Rad. Phys. Chem., DOI:10.1016/j.radphyschem.2011.02.013.
A. Xun Li, Q. Wang, A.Z.Z. Zhang, S. Almqvist, O. Gustafsson, S. Yu, Z. Besharat, M. Göthelid, L. Höglund, A. Karim, B. Noharet, A. Gromov, M. Hammar, and J.Y. Andersson, Passivation and stability of infrared photodetectors based on type-II GaAs quantum dots in InAs matrix, Submitted to Appl. Phys. Lett.
R. Yakimova, C. Virojanadara, D. Gogova, M. Syväjärvi, D. Siche, K. Larsson, and L.I. Johansson, Analysis of the formation conditions for large area epitaxial graphene on SiC substrates, Mater. Sci. Forum., 645, 565, 2010.
T. Yang, J. Sun, G. Li, Y. Wang, J. Christensen, Z. He, K.E. Christensen, X. Zou, F. Liao, and J. Lin, Fe5O5[B6O10(OH)3]•nH2O: Wave-layered iron borate and frustrated antiferromagnetism, Inorg. Chem., 48, 11209, 2009.
S. Yu, S. Ahmadi, C. Sun, K. Schulte, A. Pietzsch, F. Hennies, M. Zuleta, and M. Göthelid, Crystal phase dependent charge transfer times in TiOPc thin films revealed by Resonant Photoemission Spectroscopy, Submitted to J. Phys. Chem. C.
S. Yu, S. Ahmadi, M. Zuleta, H. Tian, K. Schulte, A. Pietzsch, F. Hennies, J. Weissenrieder, X. Yang, and M. Göthelid, Adsorption geometry, molecular interaction and charge transfer of Triphenylamine-based Dye on Rutile TiO2(110), J. Chem. Phys., 133, 224704, 2010.
M.G. Zahl, V. Myrseth, T.H. Andersen, J. Harnes, A. Borg, L.J. Sæthre, and K.J. Børve, Molecular spectra as a tool in assigning carbon 1s photoelectron spectra of physisorbed overlayers, J. Phys. Chem. C 114, 15383, 2010.
A.A. Zakharov, C. Virojanadara, S. Watcharinyanon, R. Yakimova, and L.I. Johansson, Nano-scale 3D(E,kx,ky) band structure imaging on graphene and intercalated graphene, IBM J. Res. Develop., in press.
Y.Q. Zhan, E. Holmström, R. Lizárraga, O. Eriksson, X. Liu, F. Li, E. Carlegrim, S. Stafström, and M. Fahlman, Efficient spin injection through exchange coupling at organic semiconductor / ferromagnet heterojunctions, Adv. Mater., 22, 1626, 2010.
H.M. Zhang, J.B. Gustafsson, and L.S.O. Johansson, Electronic structure of PTCDA on Sn/Si(111)3x3, Manuscript in preparation.

560 MAX-lab ACTIVITY REPORT 2010
PUBLICATIONS
M. Zharnikov, High-resolution X-ray photoelectron spectroscopy in studies of self-assembled organic monolayers, J. Electron Spectrosc. and Relat. Phenom., 178-179, 380, 2010.
M. Zuleta, S. Yu, S. Ahmadi, G. Boschloo, M. Göthelid, and A. Hagfeldt, Monitoring N719-dye configurations on (1xn) reconstructed anatase (100) by means of STM: Reversible configurational changes upon illumination, Langmuir, 26, 13236, 2010.
G. Öhrwall, N. Ottosson, W. Pokapanich, S. Legendre, S. Svensson, and O. Björneholm, Charge dependence of solvent-mediated inter-molecular Coster-Kronig decay dynamics of aqueous ions, J. Phys. Chem. B 114, 17057, 2010.
A. Önsten, D. Stoltz, P. Palmgren, S. Yu, M. Göthelid, and U.O. Karlsson, Water adsorption on ZnO(0001): Transition from triangular reconstructions to hydroxyl termination, Submitted to J. Phys. Chem. C.
A. Önsten, D. Stoltz, P. Palmgren, S. Yu, M. Göthelid, and U.O. Karlsson, Water adsorption on ZnO(0001): transition from triangular reconstructions to hydroxyl termination, J. Phys. Chem. C 114, 11157, 2010.

MAX-lab ACTIVITY REPORT 2010 561
PUBLICATIONS
Anders Thelin, Department of Physics, Umeå University, is working on his master thesis ”Investigation of the MAX I 200 MeV Photon Beam Using a Pair Spectrometer”, 25 October 2010. Photo: Annika Nyberg

562 MAX-lab ACTIVITY REPORT 2010
THESES
Ph.D. Theses
J. Becker, Synthesis and Characterisation of Nanostructured Catalyst Materials for Biofuel Production, Department of Chemistry and Interdisciplinary Nanoscience Center (iNANO), Aarhus University, Aarhus, Denmark, 2010.
M. Bremholm, In situ X-ray Scattering Studies of Nanoparticles in Supercritical Water, Department of Chemistry and Interdisciplinary Nanoscience Center (iNANO), Aarhus University, Aarhus, Denmark, 2009.
E. Carlegrim, Development of Organic-Based Thin Film Magnets for Spintronics, Department of Physics, Chemistry and Biology, Linköping University, Linköping, Sweden, ISBN 978-91-7393-385-8, 2010.
D. Choudhury, Effects of Disorder on Physical Properties of Selected Transition Metal Oxides, Department of Physics, Indian Institute of Science, Bangalore, India, 2010.
C.E. Christensen, Molecular interactions in Arabidopsis -oxidation, Department of Biomolecular Sciences, University of Copenhagen, Copenhagen, Denmark, 2010.
J.F. Cramer, Phosphoregulation of GGA Proteins and Structural Studies of the Sortilin-proNGF-p75(NTR) Complex, Department of Molecular Biology, Aarhus University, Aarhus, Denmark, 2009.
J.P. Cunniffe, Optical and X-ray Characterization of the MagneticProperties Gold Capped Cobalt Nanowires Grown on Pt(997), School of Physics, Trinity College, University of Dublin, Dublin, Ireland, 2011.
S. dos Santos, Associative Polymer-Polymer and Polymer-Surfactant Systems: Phase Behaviour and the Influence of Chemical Reactions, Department of Physical Chemistry 1, Lund University, Lund, Sweden, ISBN 978-91-7422-257-9, 2010.
J. Eriksson, Atomic and Electronic Structures of Clean and Metal Adsorbed Si and Ge Surfaces: An Experimental and Theoretical Study, Department of Physics, Chemistry and Biology, Linköping University, Linköping, Sweden, ISBN 978-91-7393-433-6, 2010.
O.J. Hamming, The Interferon System of Humans and Fish – A Structural Point of View, Department of Molecular Biology, Aarhus University, Aarhus, Denmark, 2010.
M. Hansen, Structural Characterization of the Sortilin/CNTF complex, Department of Molecular Biology, Aarhus University, Aarhus, Denmark, 2010.
R. Häggblad, Selective Oxidation over Mixed Metal Oxide Catalysts, Department of Chemical Engineering, Lund University, Lund, Sweden, ISBN 978-91-628-8141-2, 2010.
Theses

MAX-lab ACTIVITY REPORT 2010 563
THESES
H. Ingvarsson, Structural Studies of Caseinolytic Protease 1 from Mycobacterium Tuberculosis and Methionyl-tRNA Synthetase from Mycobacterium Smegmatis, Department of Cell and Molecular Biolology, Uppsala University, Uppsala, Sweden, ISBN 978-91-554-7769-1, 2010.
C. Isvoranu, Metal-Organic Complexes at Surfaces, Department of Physics, Lund University, Lund, Sweden, ISBN 978-91-7473-012-8, 2010.
B. Kennedy, Resonant Soft X-ray Studies of Certain Transition Metal Oxides, School of Physics, Trinity College, University of Dublin, Dublin, Ireland, 2011.
F. Li, One-, Two-, and Three-Dimensional Manganese Oxide Nanostructures Supported on Palladium Surfaces, Department of Experimental Physics, Karl-Franzens University, Graz, Austria, 2010.
N. Lock, Synthesis and Characterisation of Crystalline and Nanoporous Materials, Department of Chemistry and Interdisciplinary Nanoscience Center (iNANO), Aarhus University, Aarhus, Denmark, 2009.
G. Magnano, Electrospray Deposition in Ultra-High Vacuum: The Development of a Deposition System for Non-volatile Molecules, School of Physics & Astronomy, University of Nottingham, Nottingham, UK, 2010.
C. Mathieu, Approche intégrée Spectroscopies électroniques et Calculs ab-initio d’états de coeur excités des modes d’adsorption de l’ammoniac et de diamines sur la surface Si(001)-2*1, Laboratoire de Chimie Physique – Matière et Rayonnement, Université Pierre & Marie Curie, Paris, France, 2009.
L.S. Myers, Deuteron Compton Scattering below Pion Threshold, University of Illinois at Urbana-Champaign, USA, 2010.
M.L. Ng, Characterization and Functionalization of 2D Overlayers Adsorbed on Transition Metals, Department of Physics and Astronomy, Uppsala University, Uppsala, Sweden, ISBN 978-91-554-7890-2, 2010.
S.S. Nielsen, Development of a Fully Automated Online Mixing System for SAXS Protein Structure Analysis, Life Science, University of Copenhagen, Copenhagen, Denmark, 2010.
J. Niskanen, Studies of Photoinduced Electronic Processes in Atoms and Molecules, Department of Physical Sciences, University of Oulu, Oulu, Finland and Theoretical Chemistry, School of Biotechnology, Royal Institute of Technology, Stockholm, Sweden, ISBN 978-951-42-6362-0, 2010.
M. Patanen, Electron Spectroscopic Studies of the Electronic Structure of Some Metal Atoms and Alkali Halide Molecules, Department of Physical Sciences, University of Oulu, Oulu, Finland, ISBN 978-951-42-6385-9, 2010.
N. Peltekis, Investigations of Electronic Structure and Optical Properties of Organic Molecular Semiconductor Materials by X-ray Spectroscopy, School of Physics, Trinity College, University of Dublin, Dublin, Ireland, 2010.
C. Riedl, Epitaxial Graphene on Silicon Carbide Surfaces: Growth, Characterization, Doping and Hydrogen Intercalation, Faculty for Natural Sciences, Department of Physics, Friedrich-Alexander-University Erlangen-Nürnberg, Erlangen, Germany, 2010.

564 MAX-lab ACTIVITY REPORT 2010
THESES
K. Røjkjær Andersen, Structural Basis for mRNA turnover in Bacteria and Eukaryotes, Department of Molecular Biology, Aarhus University, Aarhus, Denmark, 2009.
M. Sahlberg, Light-Metal Hydrides for Hydrogen Storage, Department of Material Chemistry, Uppsala University, Uppsala, Sweden, ISBN 978-91-554-7585-7, 2009.
A. Schaefer, Preparation and Characterization of Praseodymium Oxide Films on Silicon Substrates as a Model System for Microelectronic and Catalytic Applications, Institute of Applied and Physical Chemistry, University of Bremen, Bremen, Germany, 2010.
G. Svensson, Characterization and Crystallization of Anchorless Glypican-1, Department of Experimental Medical Science, Lund University, Lund, Sweden, ISBN 978-91-86671-51-8, 2011.
K.L. Syres, Molecular Adsorption on TiO2 Surfaces: Modelling Potential Biomedical and Photovoltaic Devices, School of Physics & Astronomy and Photon Science Institute, The University of Manchester, Manchester, UK, 2010.
K. Szamota-Leandersson, Electronic Structure of Clean and Adsorbate-Covered InAs Surfaces, Department of Materials Physics, Royal Institute of Technology, Stockholm, Sweden, ISBN 978-91-7415-702-4, 2010.
G. Weirum, Structural Investigation of Zinc-Palladium and Zinc Oxide-Palladium Model Catalyst Surfaces, Department of Experimental Physics, Karl-Franzens University, Graz, Austria, 2010.
R. Westerström, Compound Formation in Model Catalysts, Department of Physics, Lund University, Lund, Sweden, ISBN 978-91-628-8131-3, 2010.
M. Wikberg, Fundamental Properties of Functional Magnetic Materials, Department of Engineering Sciences, Uppsala University, Uppsala, Sweden, ISBN 978-91-554-7953-4, 2010.
R.K. Yengo, Structural and Functional Studies of the Wilms’ Tumour 1 Protein (WT1) in Interactions with Nucleic Acids: Focus on the Zinc Finger Domain, Department of Biochemistry and Structural Biology, Lund University, Lund, Sweden, ISBN 978-91-7422-260-9, 2011.
Licentiate Theses
E. Ataman, X-ray Photoelectron Spectroscopy Studies of Amino Group-Containing Compounds on Gold and Titanium Dioxide, Department of Physics, Lund University, Lund, Sweden, 2010.
R. Knut, Electronic Structure and Magnetic Investigation of Candidate Spintronic Materials, Department of Physics and Astronomy, Uppsala University, Uppsala, Sweden, 2010.
J. Laksman, Ion Spectroscopic Coincidence Measurements with a In-house Developed Momentum Imaging Spectrometer, Department of Physics, Lund University, Lund, Sweden, 2010.

MAX-lab ACTIVITY REPORT 2010 565
THESES
M.Sc., Bachelor and Diploma Theses
C.M. Allen, Identification of Pions from the p n+ Reaction, Department of Physics, University of Massachusetts Dartmouth, North Dartmouth, MA, USA, 2010.
C. Bennike, Cloning, xpression and puPrification of the N-terminal Domain of the Ionotropic Glutamate Receptor Subunit, GluN1-1a, Department of Medicinal Chemistry, University of Copenhagen, Copenhagen, Denmark, 2010.
K. Bienk, Synthesis and Characterisation of Sodium Aluminium Hydrides, Department of Chemistry & iNANO, Aarhus University, Aarhus, Denmark, 2010.
E.D. Bøjesen, Hydrothermal Synthesis of Zinc Oxide, Department of Chemistry, Aarhus University, Aarhus, Denmark, 2010.
S. Böttcher, Functionalization of Graphene: A Theoretical and Experimental Study of Water and Ammonia Adsorbed on Graphene/Ni(111), Department of Chemistry, Freie Universität Berlin, Berlin, Germany, 2010.
P.R. Christensen, Syntese og karakterisering af katalysator-materialer til CatLiq processen, Department of Chemistry and Interdisciplinary Nanoscience Center (iNANO), Aarhus University, Aarhus, Denmark, 2010.
C.E. Drakou, Kinetic and Crystallographic Studies of the Enzyme Adenylate Kinase 6, Department of Chemistry, National and Kapodistrian University of Athens, Athens, Greece, 2010.
P. Eckhold, Characterization of Ferromagnetic Films by XMCD, Department of Physics and Astronomy, Uppsala University, Uppsala, Sweden, and VU Berlin, Berlin, Germany, 2010.
M.L. El-Sheikh, Design and Simulation of Neutron Detectors, Department of Microelectronics and Applied Physics, Royal Institute of Technology, Stockholm, Sweden, 2009.
U. Filsø, Studies of Fluor Substitution in NaBH4, Department of Chemistry and Interdisciplinary Nanoscience Center (iNANO), Aarhus University, Aarhus, Denmark, 2010.
U. Forsberg, Tagging Efficiency Measurements at High Intensities, Department of Physics, Lund University, Lund, Sweden, 2010.
R. Fossheim, Photoelectron Spectroscopy and Chemical Properties of Chloro-Substituted Propene Compounds, Department of Chemistry, University of Bergen, Bergen, Norway, 2010.
B.R.S. Hansen and S. Tolborg, Investigation of Nanoporous Carbon Aerogels for Hydrogen Storage, Department of Chemistry and Interdisciplinary Nanoscience Center (iNANO), Aarhus University, Aarhus, Denmark, 2010.
J.M. Jensen, Exploring Aspects of the Barley Limit Dextrinase and its Endogenous Inhibitor, Department of Systems Biology, Technical University of Denmark, Lyngby, Denmark, 2010.
566 MAX-lab ACTIVITY REPORT 2010
THESES
T.N. Jensen, Synthesis and Characterization of Multiferroic Bismuth Ferrite, Department of Chemistry and Interdisciplinary Nanoscience Center (iNANO), Aarhus University, Aarhus, Denmark, 2010.
L.H. Jepsen, Synthesis and Characterization of Novel Borohydride-Fluorides, Department of Chemistry and Interdisciplinary Nanoscience Center (iNANO), Aarhus University, Aarhus, Denmark, 2010.
N. Johansson, Styrene Oxidation by X-ray Photoelectron Spectroscopy, Department of Physics, Lund University, Lund, Sweden, 2010.
N.K. Jordheim, Photoelectron Spectroscopy and Chemical Properties of Propene Compounds, Department of Chemistry, University of Bergen, Bergen, Norway, 2010.
V. Karlsson, Structural Determination of Proteins Involved in Biomass Degradation, Department of Chemistry, University of Copenhagen, Copenhagen, Denmark, 2010.
O.G. Larsen, Scandium in Alanates – Studies of Hydrogen Storage Properties, Department of Chemistry and Interdisciplinary Nanoscience Center (iNANO), Aarhus University, Aarhus, Denmark, 2010.
M. Litwack, MAX-lab May09 Tagging-Efficiency Measurements, Department of Physics, Lund University, Lund, Sweden, 2010.
D.E. McNally, X-ray Characterisation of Capped Low-dimensional Manetic Nanostructures, School of Physics, Trinity College, University of Dublin, Dublin, Ireland, 2010.
I.R. Møller, An Indirect Regulation of the Ras Signal Transduction Pathway: The Interactions of G3BP1’s NTF2-like Domain and Caprin-2, Department of Medicinal Chemistry, University of Copenhagen, Copenhagen, Denmark, 2010.
T.K. Nielsen, Nanoconfinement of Metal Hydrides for Energy Storage, Department of Chemistry and Interdisciplinary Nanoscience Center (iNANO), Aarhus University, Aarhus, Denmark, 2010.
P. Nørby, Syntese og karakterisering af yttrium-holdige granater, Department of Chemistry, Aarhus University, Aarhus, Denmark, 2010.
J. Olsen, Cloning, Expression, Purication and Crystallization of the Histone Demethylase JMJD2C, Department of Medicinal Chemistry, University of Copenhagen, Copenhagen, Denmark, 2010.
C. Mårup Osmundsen, Syntheses of Zeolitic Lewis Acids Using Post-Treatment, Technical University of Denmark, Lyngby, Denmark, 2010.
M. Pucetaite, Structure Studies of Renal Stones by Means of Infrared Spectral Microscopy and X-ray Diffractometry, Department of General Physics and Spectroscopy, Vilnius University, Vilnius, Lithuania, 2010.
MAX-lab ACTIVITY REPORT 2010 567
THESES
L.H. Rude, Anion Substitution in High Capacity Hydrides, Department of Chemistry and Interdisciplinary Nanoscience Center (iNANO), Aarhus University, Aarhus, Denmark, 2010.
P.L. Sørensen, Structure Determination of PSD95-PDZ12, Department of Medicinal Chemistry, University of Copenhagen, Copenhagen, Denmark, 2010.
F.M. Tabrizi, Preparation of the Ligand Binding Domain of the NMDA Receptor Subunit GluN1 for Structural Studies, Department of Medicinal Chemistry, University of Copenhagen, Copenhagen, Denmark, 2010.
A. Thelin, Investigation of the MAX I 200 MeV Photon Beam Using a Pair Spectrometer, Department of Physics, Umeå University, Umeå, Sweden, 2011.
M. Welke, Untersuchung zum Magnetismus von Cobalt auf Bariumtitanat, Wilhelm-Ostwald-Institut für Physikalische und Theoretische Chemie, Universität Leipzig. Leipzig, Germany, 2011.
A.G. Wielandt, Modification of a Left-Handed -Helix for Design, Department of Chemistry, University of Copenhagen, Copenhagen, Denmark, 2010.

568 MAX-lab ACTIVITY REPORT 2010
CONFERENCE CONTRIBUTIONS
L. Aagot Thomsen, Structural and Functional Studies of the Acetylcholine Binding Protein from L. stagnalis in Complex with Novel Compounds, CoLuAa XIX, Valby, Denmark, 4-5 November 2010.
N. Abrikossova, C. Skoglund, M. Ahren, L. Selegård, T. Bengtsson, and K. Uvdal, Rare Earth Nanoparticles – Biocompatibility Studies: Interaction with Human Neutrophil Granulocytes, AVS 57th International Symposium and Exhibition, Albuquerque, New Mexico, USA, 17-22 October 2010.
S. Al-Karadaghi and I. Grazia, Structural Studies on Frataxin Oligomers using X-ray Crystallography, Electron Microscopy and Small-Angle X-ray Scattering (SAXS), Structure and function of frataxin meeting, National Institute for Medical Research, London, United Kingdom, 7-8 May 2010.
F. Allegretti, Low-dimensional Oxide Nanostructures on Stepped Metal Surfaces, COST D41 WG4 workshop, Graz, Austria, 15-16 April 2010.
C. Allen, Pion Identification in Photonuclear Measurements at MAX-lab, American Physical Society Meeting 2010, Washington D.C., USA, 13-16 February 2010.
K.R. Andersen, A.T. Jonstrup, L.B. Van, and D.E. Brodersen, Structure of the Pop2p Deadenylation Subunit in Two Functional States, RNA 2008, Berlin, Germany, 28 July - 3 August, 2008.
M.V. Andersen, D.B. Ravnsbæk, and T.R. Jensen, Reactivitet, Thermal Stabilitet and Novel Compounds in the Mg(BH4)2-ZnCl2 System, Meeting for the nordic hydrogen network spring 2010, Svalbard, Norway, 21 April 2010.
M.V. Andersen, and T.R. Jensen, Overview and Discussion of Chemical Synthesis Using Ball Milling, Summer School on ”Materials for the hydrogen economy”, Reykjavik, Iceland, 17-21 August 2010.
T. Andersson, C. Zhang, S. Legendre, M. Tchaplyguine, G. Öhrwall, O. Björneholm, S. Svensson, and N. Mårtensson, Photoelectron Spectroscopy Studies of Free Cadmium Sulphide Clusters, International Workshop DyNano-2010, Porticcio, France, 21-25 April 2010.
A.S. Anselmo, E. Moons, and K. Svensson, NEXAFS Study of Surface Composition in Blend Films of APFO3:PCBM, Center for Organic Electronics yearly meeting, Linköping University, Sweden, May 14-15, 2010.
A.S. Anselmo, A. Opitz, J. Rysz, A. Bernasik, L. Lindgren, M. Andersson, A. Budkowski, K. Svensson, J. van Stam, and E. Moons, The Effect of Polymer-fullerene Interaction on Film Morphology and Performance of Thin-films of Polyfluorene-based Solar Cells, 9th International Symposium on Functional -Electron Systems (Fpi-9), Georgia Institute of Technology, Atlanta, Georgia, USA, 23-28 May 2010.
Conference Contributions

MAX-lab ACTIVITY REPORT 2010 569
CONFERENCE CONTRIBUTIONS
V.Yu. Aristov, V.V. Maslyuk, O.V. Molodtsova, D.V. Vyalikh, A.B. Preobrajenski, I. Mertig, T. Bredow, V.N. Sivkov, S.B. Nekipelov, and M. Knupfer, Electron Structure Modification of Magnetic Transition Metal Phthalocyanine Thin Films by Potassium Intercalation, Deutsche Tagung für Forschung mit Synchrotronstralung, Neutronen und Ionenstralen an Großgeräten (SNI2010), Berlin, Germany, 24-26 February 2010.
V. Yu. Aristov, V. Maslyuk, O. Molodtsova, I. Mertig, T. Bredow, and M. Knupfer, Magnetic Transition Metal Phthalocyanine Thin Films on Au(001): Ordering and Electronic Structure, 74th DPG Spring Meeting, Symposium: Thin Film Division (DS), Focused Session: Molecular Spintronics – Current Status and Challenges I, Regensburg, Germany, 22-26 March 2010.
V.Yu. Aristov, G. Urbanik, K. Kummer, D.V. Vyalikh, O.V. Molodtsova, A.B. Preobrajenski, A.A. Zakharov, C. Hess, T. Haenke, B. Buechner, I. Vobornik, J. Fujii, G. Panaccione, Yu.A. Ossipyan, and M. Knupfer, Graphene Synthesis on Cubic SiC(001)/Si Wafers, 37th International conference on Vacuum Ultraviolet and X-ray Physics (VUVX2010), Vancouver, Canada, 11-16 July 2010.
V.Yu. Aristov, V.V. Maslyuk, O.V. Molodtsova, I. Mertig, T. Bredow, and M. Knupfer, Electronic Structure and Ordering of Magnetic Transition Metal Phthalocyanines: Experiment and DFT Calculations, 15th International Conference on Solid Films and Surfaces (ICSFS-15), Beijing, China, 5-10 October 2010.
V.Yu. Aristov, G. Urbanik, K. Kummer, D.V. Vyalikh, O.V. Molodtsova, A.B. Preobrajenski, A.A. Zakharov, C. Hess, T. Haenke, B. Buechner, I. Vobornik, J. Fujii, G. Panaccione, Yu.A. Ossipyan, and M. Knupfer, Graphene Synthesis on -SiC(001)/Si Wafers – a Big Step for Mass Production of Graphene-based Electronic Devices, 15th International Conference on Solid Films and Surfaces (ICSFS-15), Beijing, China, 5-10 October 2010.
V.Yu. Aristov, G. Urbanik, K. Kummer, D.V. Vyalikh, O.V. Molodtsova, A.B. Preobrajenski, A.A. Zakharov, C. Hess, T. Haenke, B. Buechner, I. Vobornik, J. Fujii, G. Panaccione, Yu.A. Ossipyan, and M. Knupfer, High Quality Graphene Layers on Commercial Available 3C-SiC(001)/Si Wafers, 2nd Joint BER II and BESSY II Users’ Meeting, Berlin, Germany, 9-10 December 2010.
I.M. Aristova, O.V. Molodtsova, M.Knupfer, V.V. Kveder, C. Laubschat, and V.Yu. Aristov, Morphology and Properties of Hybrid Systems Comprising Gold Nanoparticles in CuPc Matrices, 6th International Workshop on Nano-scale Spectroscopy and Nanotechnology (NSS 6), Kobe, Japan, 25-29 October 2010.
M. Asad Ayoubi, U. Olsson, B. Nyström, K. Zhu, A.R. Khokhlov, K. Almdal, and L. Piculell, Experimental Models for Microphase Separation of Block Copolymers Containing Asymmetric Monomer Units, 7th Nordic Workshop on Scattering from Soft Matter, Helsinki, Finland, January, 27-28, 2010.
E. Ataman, C. Isvoranu, J. Knudsen, J.N. Andersen, and J. Schnadt, Amino Acid Adsorption on Rutile TiO2(110), 27th European Conference on Surface Science (ECOSS 27), Groningen, The Netherlands, 29 August - 3 September 2010.
L. Axelsson, M. Ahrén, L. Selegård, P. Nordblad, F. Söderlind, M. Lindgren, and K. Uvdal, Luminescent and Magnetic rare earth Oxide Nanoparticles for Biomedical Imaging, AVS 57th International Symposium and Exhibition, Albuquerque, New Mexico, USA, 17-22 October 2010.
J. Barauskas, J.L. Brennan, A.G. Kanaras, P. Nativo, T.R. Tshikhudo, C. Rees, L.C. Fernandez, N. Dirvianskyte, V. Razumas, M. Skjøt, A. Svendsen, C.I. Jørgensen, M. Brust, R. Schweins, M. Zackrisson, and T. Nylander, Digestion of Lipid Aggregates by Lipase-Functionalised Gold Nanoparticles, Swedish Neutron Scattering Society 14th Annual Meeting (SNSS), Lund, Sweden, 24-27 August 2010.
J. Barauskas, C. Cervin, M. Jankunec, M. Špandyreva, K. Ribokaitė, F. Tiberg, and M. Johnsson, Interactions of Lipid-based Liquid Crystalline Nanoparticles with Model and Cell Membranes, 24th European Colloid and Interface Society Conference (ECIS), Prague, Czech Republic, 5-10 September 2010.

570 MAX-lab ACTIVITY REPORT 2010
CONFERENCE CONTRIBUTIONS
C. Bargholtz, J. Brudvik, K. Fransson, L. Gerén, K. Hansen, L. Isaksson, T. Johansson, O. Lundberg, M. Lundin, P. Marciniewski, K. Marcks von Würtemberg, B. Schröder, P.-E. Tegnér, E. Thomé, P. Thörngren, and M. Wolke, The Response of a 5 x 5 Matrix of PWO Crystals, XXXIV PANDA Collaboration meeting, Groningen, The Netherlands, 30 August - 3 September 2010.
C. Bargholtz, J. Brudvik, K. Fransson, L. Gerén, K. Hansen, L. Isaksson, T. Johansson, O. Lundberg, M. Lundin, P. Marciniewski, K. Marcks von Würtemberg, B. Schröder, P.-E. Tegnér, E. Thomé, P. Thörngren, and M. Wolke, Performance of the PANDA Calorimeter in the Low-energy Regime, Meeting of the Swedish FAIR consortium (SFAIR), Uppsala, Sweden, 15-16 November 2010.
T. Bergfors, Crystallization Techniques and their Phase Diagrams Crystallization Training Exercises, 2nd Southeast Asian Crystallography Workshop, Siam Photon Laboratory, Synchrotron Light Research Institute and Biochemistry Laboratory, Suranaree University of Technology, Nakhon Ratchasima (Korat), Thailand, 5-8 April 2010.
T. Bergfors, The Highways, Biways and Detours in Protein Crystallization Crystallization Training Exercises, International Course on Protein Crystallography, International Network of Pasteur Institutes, Montevideo, Uruguay, 26 April - 7 May 2010.
T. Bergfors, Seeding as an Optimization Method, 42nd International School of Crystallography, Structure and Function from Macromolecular Crystallography: Organization in Space and Time, Erice, Italy, 3-13 June 2010.
T. Bergfors, Interpretation of Crystallization Drop Phenomena, International School and Conference on Crystallization of Biological Macromolecules (ICCBM 13), Trinity College, Dublin, Ireland, 10-16 September 2010.
I. Bidermane, S. Boudet, N. Witkowski, and C. Puglia, Electronic Properties of Lutetium Phtalocyanine Thin Films, European Conference on Surface Science (ECOSS-27), Groningen, The Netherlands, 30 August - 3 September 2010.
Ø. Borck, I.-H.Svenum, L.E. Walle, K. Schulte, and A. Borg, Adsorption of CO on Ni3Al(111): A Combined Theoretical and Experimental Study, Conference on Computational Physics 2010 (CCP), Trondheim, Norway, 23-26 June 2010.
W.J. Briscoe, Student Involvement in International Research – The IRES Program at MAMI & MAX-lab, American Physical Society Meeting 2010, Washington D.C., USA, 13-16 February 2010.
W.J. Briscoe, G.V. O’Rielly, and N. Benmouna, Student Involvement in International Research – The IRES Program at MAMI and MAX-lab, American Physical Society Meeting 2010, Washington D.C., USA, 13-16 February 2010.
W.J. Briscoe, The MAX-lab Tagged Photon Facility, Gordon Conference on Photonuclear Reactions, Tilton, New Hampshire, USA, 1-6 August 2010.
W.J. Briscoe, The Nuclear Physics Program at MAX-lab; Past, Present and Future, Gordon Conference on Photonuclear Reactions, Tilton, New Hampshire, USA, 1-6 August 2010.
A.J. Britton, M. Weston, and J.N. O’Shea, The Charge Transfer Interactions of a Ru(II) Dye Complex Adsorbed on a Au(111) Surface: Resonant Photoemission and X-ray Absorption, Condensed Matter and Materials Physics (CMMP10), Warwick, United Kingdom, 14-16 December 2010.

MAX-lab ACTIVITY REPORT 2010 571
CONFERENCE CONTRIBUTIONS
J. Brudvik, D. Burdeinyi, K. Fissum, V. Ganenko, K. Hansen, L. Isaksson, K. Livingston, M. Lundin, V. Morokhovskyi, B. Nilsson, B. Schroder, and G. Vashchenko, Beam of the Linearly Polarized Photons at MAX-lab for Nuclear Physics Investigations up to Pion Photoproduction Threshold, 8th Conference on High Energy and Nuclear Physics and Accelerators, Kharkov, Ukraine, 22-26 February 2010.
J. Brudvik, D. Burdeinyi, K. Fissum, V. Ganenko, K. Hansen, L. Isaksson, K. Livingston, M. Lundin, V. Morokhovskyi, B. Nilsson, B. Schroder, and G. Vashchenko, Measurements of Cross Section Asymmetry of the 12C(g,p)11B Reaction with Linearly Polarized Photons in Energy Range 40…60 MeV, 8th Conference on High Energy and Nuclear Physics and Accelerators, Kharkov, Ukraine, 22-26 February 2010.
S. Bucak, C.C. Cenker, and U. Olsson, A Peptide Nanotube Nematic Phase, 6th Nanoscience and Nanotechnology Conference (NanoTR VI), Cesme, Turkey, 15-18 June 2010.
S. Bucak, C.C. Cenker, and U. Olsson, Self Assembly of Peptides into Nanotubes: When and How?, 18th Surfactants in Solution Conference (SIS), Melbourne, Australia, 14-19 November 2010.
A. Budkowski, E. Moons, A. Bernasik, M. Lekka, J. Rysz, C.M. Björström-Svanström, J. Jaczewska, and J. Zemła, Film Structures for Electronics and Biotechnology Formed in Spin-cast Polymer Blends, 4th International Conference on Polymer Behavior, International Union of Pure and Applied Chemistry (IUPAC), Lodz, Poland, 20-23 September 2010.
U. Bösenberg, M. Dornheim, and R. Bormann, Reaction Pathways and Role of Additives in Reactive Hydride Composites, 4th International Symposium Hydrogen & Energy, Wildhaus, Switzerland, 24-29 January 2010.
U. Bösenberg, C. Pistidda, I. Saldan, D.B. Ravnsbaek, H. Hagemann, T. Jensen, T. Klassen, and M. Dornheim, Desorption Reactions in Reactive Hydride Composites, 2010 E-MRS Fall Meeting, Warsaw, Poland, 13-17 September 2010.
U. Bösenberg, M. Dornheim, T. Klassen, and R. Bormann, Reaction Mechanism in Reactive Hydride Composites for Hydrogen Storage, ICON 2010, Kharagpur, India, 8-11 December 2010.
S. Böttcher, M. Weser, K. Horn, Yu.S. Dedkov, E. Voloshina, and B. Paulus, Water on Graphene/Ni(111): Photoemission Experiments and DFT Calculations, European Conference on Surface Science (ECOSS-27), Groningen, The Netherlands, 30 August - 3 September 2010.
S. Böttcher, M. Weser, Yu.S. Dedkov, K. Horn, E. Voloshina, and B. Paulus, Graphene on Ferromagnetic Surfaces and its Functionalization with Water and Ammonia, E-MRS 2010 Fall Meeting, Warsaw, Poland, 13-17 September 2010.
S. Böttcher, M. Weser, Yu.S. Dedkov, K. Horn, E. Voloshina, and B. Paulus, Graphene on Ni(111) and its Functionalization, 5th Symposium on Vacuum based Science and Technology, Kaiserslautern, Germany, 28-30 September 2010.
H.T. Cao, L.M. Arnbjerg, D.B. Ravnsbæk, and T.R. Jensen, Synthesis and Characterization of Mixed Alkali Alanates, Summer School on ”Materials for the hydrogen economy”, Reykjavik, Iceland, 17-21 August 2010.
H.T. Cao, L.M. Arnbjerg, D.B. Ravnsbæk, and T.R. Jensen, Synthesis and Characterization of Mixed Alkali Alanates, Meeting for the nordic hydrogen network spring 2010, Svalbard, Norway, 21 April, 2010.
J. Ceponkus, R.R. Lozada García, M. Chevalier, W. Chin, A. Limongi, M. Broquier and C. Crépin, Infrared Study of the Structure and Dynamics of Internally Hydrogen Bonded Molecules Isolated in Parahydrogen Matrices, XVIII International Conference on Horizons in Hydrogen Bond Research, Paris, France, 14-18 September 2009.
572 MAX-lab ACTIVITY REPORT 2010
CONFERENCE CONTRIBUTIONS
J. Ceponkus, Para Enriched Hydrogen Crystals. Preparation, Diagnostics and Applications for Spectroscopy, GASOSPIN, Ivry-sur-Seine, France, 3-4 October 2009.
J. Ceponkus, R.R. Lozada García, W. Chin, M. Chevalier, A. Limongi, M. Broquier, and C. Crépin, Structure and UV Isomerization of Internally H-bonded Molecules Isolated in Parahydrogen Matrices, 6th International Meeting on Photodynamic, Havana, Cuba, 1-5 February 2010.
F. Chesneau, J. Zhao, C. Shen, M. Buck, and M. Zharnikov, Adsorption of Long-chain Alkanethiols on Au(111): A Look from the Substrate Side, 74th DPG Meeting, Regensburg, Germany, 21-26 March 2010.
F. Chesneau, B. Schüpbach, K. Szelagowska-Kunstman, N. Ballav, P. Cyganik, A. Terfort, and M. Zharnikov, Self-assembled Monolayers of Perfluoroterphenyl-substituted Alkanethiolates on Coinage Metal Substrates, 74th DPG Meeting, Regensburg, Germany, 21-26 March 2010.
F. Chesneau, B. Schüpbach, K. Szelągowska-Kunstman, N. Ballav, P. Cyganik, A. Terfort, and M. Zharnikov, Molecular Organization and Odd-even Effects in in Perfluoroterphenyl-based Monomolecular Films, AVS 57th International Symposium and Exhibition, Albuquerque, New Mexico, USA, 17-22 October 2010.
C.E. Christensen, V.E. Pye, B.B. Kragelund, P. Wettstein-Knowles, and A. Henriksen, Redox Regulation of the Peroxisomal -oxidation via Thiolase Oxidation, Frontiers in Protein Science, Lyngby, Denmark, 1 October 2009.
C.E. Christensen, V.E. Pye, S. Arent, and A. Henriksen, Dynamics in the Binding Pockets of the Arabidopsis MFPs Determine Substrate Specificity, CoLuAa XIX, Valby, Denmark, 4-5 November 2010.
C.E. Christensen, V.E. Pye, and A. Henriksen, The Flexibility of a Loop Determines Substrate Specificity in Arabidopsis MFPs, 4th Protein Workshop, DTU, Lyngby, Denmark, 12 November 2010.
K. Ciosek and K. Edström, Electrolyte Additives and XPS Depth Profiling of SEI on Graphite and LiFePO4, 15th International Meeting on Lithium Batteries (IMLB), Montreal, Canada, 27 June - 2 July 2010.
D. Cockburn, B. Kennedy, J. Denlinger, W.L. Yang, Y.S. Huang, and C. McGuinness, Symmetry Selective Resonant X-Ray Emission Spectroscopy Study of Iridium Dioxide (IrO2) at the O K Edge, 11th International Conference on Electronic Spectroscopy and Structure (ICESS-11), Nara, Japan, 6-10 October 2009.
D. Cockburn, B. Kennedy, J.D. Denlinger, F. Hennies, A. Pietzch, R.G. Egdell, and C. McGuinness, Symmetry Selective Resonant X-Ray Emission Spectroscopy Study of Tungsten Dioxide (WO2) at the O K Edge, 37th International conference on Vacuum Ultraviolet and X-ray Physics (VUVX2010), Vancouver, Canada, 11-16 July 2010.
C. Coletti, C. Riedl, T. Iwasaki, A.A. Zakharov, and U. Starke, Quasi-free Standing Epitaxial Graphene on SiC by Hydrogen Intercalation, 74th DPG Meeting, Regensburg, Germany, 21-26 March 2010.
C. Coletti, C. Riedl, T. Iwasaki, K.V. Emtsev, S. Forti, A.A. Zakharov, D.S. Lee, B. Krauss, L. Pahhtey, K. von Klitzing, J.H. Smet, and U. Starke, Tailoring the Electronic Structure of Epitaxial Graphene on SiC(0001): Transfer Doping and Hydrogen Intercalation, 457th Wilhelm and Else Heraeus Seminar – Graphene Electronics: Material, Physics and Devices, Bad Honnef, Germany, 15-18 August 2010.
C. Coletti, A. Oliveros, C. Riedl, K.V. Emtsev, S. Forti, T. Iwasaki, C. Frewin, C. Locke, D.S. Lee, B. Krauss, L. Patthey, A.A. Zakharov, K. von Klitzing, J.H. Smet, S.E. Saddow, and U. Starke, Band Structure Engineering and Biocompatibility of Epitaxial Graphene on SiC(0001), 2nd International Symposium on the Science and Technology of Epitaxial Graphene, Fernandina Beach, Florida, USA, 14-17 September 2010.

MAX-lab ACTIVITY REPORT 2010 573
CONFERENCE CONTRIBUTIONS
J.A. Cuesta-Seijo, M.S. Borchert, J.-C. Navarro-Poulsen, K.M. Schnorr, and L. Lo Leggio, Structure of a Fungal Carbonic Anhydrase of Industrial Interest, CoLuAa XIX, Valby, Denmark, 4-5 November 2010.
N. Čutić, F. Lindau, S. Thorin, S. Werin, C. Erny, A. L’Huillier, E. Mansten, J. Bahrdt, and K. Holldack, First Results of Coherent Harmonic Generation at the MAX-lab Test FEL, FEL10, Malmö, Sweden, 23-27 August 2010.
N. Čutić, F. Lindau, S. Werin, and E. Mansten, On-line Arrival Time and Jitter Measurements Using Electro-optical Spectral Decoding, FEL10, Malmö, Sweden, 23-27 August 2010.
Yu.S. Dedkov, K. Horn, M. Sicot, and M. Fonin, Induced Magnetism of Carbon Atoms at the Graphene/Ni(111) Interface, 11th Joint MMM – Intermag Conference, Washington D.C., USA, 18-22 January 2010.
Yu.S. Dedkov, Electronic Properties of Graphene on Metals, Invited talk, Discussion Meeting ”Fundamental Properties and Applications of Carbon Nanostructures”, Schloss Ringberg, Germany, 12-14 April 2010.
Yu.S. Dedkov, S. Böttcher, M. Weser, K. Horn, E. Voloshina, and M. Fonin, Electronic and Magnetic Properties of the Graphene-ferromagnet Interface, European Conference on Surface Science (ECOSS-27), Groningen, The Netherlands, 30 August - 3 September 2010.
Yu.S. Dedkov, Growth and Electronic Properties of Graphene on Metals, 1st EuroGraphene Symposium, Strasbourg, France, 18-19 November 2010.
M. Dornheim, Reaction Mechanism and Kinetics of MgH2/borohydrides Based Reactive Hydride Composites, International Symposium on Metal-Hydrogen Systems (MH2010), Moscow, Russia, 19-23 July 2010.
I. Doroshenko, V. Pogorelov, V. Sablinskas, and V. Balevicius, Temperature Controlled Kinetics of Growing and Relaxation of Alcohol Clusters in Ar Matrix, International Conference for Young Scientists Low Temperature Physics, Kharkiv, Ukraine, 7-11 June 2010.
I. Doroshenko, V. Pogorelov, and V. Sablinskas, Investigation of the Kinetics of the Cluster Formation in Alcohols by the Method of Matrix Isolation, XV Symposium on the intermolecular interaction and conformations of molecules, Petrozavodsk, Russia, 14-18 June 2010.
I. Doroshenko, V. Pogorelov, P. Uvdal, V. Sablinskas, and V. Balevicius, Temperature Controlled Kinetics of Growing and Relaxation of Alcohol Clusters in Ar Matrix, 30th European Congress on Molecular Spectroscopy (EUCMOS), Florence, Italy, 29 August - 3 September 2010.
I. Doroshenko, V. Pogorelov, V. Sablinskas, and V. Balevicius, Matrix-isolation Study of Hydrogen-bonded Clusters in Simple Alcohols, Baltic Polymer Symposium 2010, Palanga, Lithuania, 8-11 September 2010.
I. Doroshenko, V. Pogorelov, and V. Sablinskas, Matrix-isolation Study of Nanocluster Structure Formation in Primary Alcohols, International scientifi c conference “Nanostructure materials – 2010: Belarus, Russia, Ukraine,Kiev, Ukraine, 19-22 October 2010.
C.M. Doyle, S.A. Krasnikov, A.B. Preobrajenski, N.A. Vinogradov, N.N. Sergeeva, Y.N. Sergeeva, H.L. Lee, M.O. Senge, and A.A. Cafolla, The Formation of Covalently Bonded Porphyrin Networks on MetalSurfaces, Novel Aspects of Surfaces and Materials (NASM 3), Manchester, United Kingdom, 11-15 April 2010.

574 MAX-lab ACTIVITY REPORT 2010
CONFERENCE CONTRIBUTIONS
C.M. Doyle, S.A. Krasnikov, A.B. Preobrajenski, N.N. Sergeeva, N.A. Vinogradov, Y.N. Sergeeva, M.O. Senge, and A.A. Cafolla, The Formation of Covalently Bonded Nano-Networks on Metal Surfaces, European Conference on Surface Science (ECOSS-27), Groningen, The Netherlands, 30 August - 3 September 2010.
K. Edström, S. Malmgren, K. Ciosek, H. Rensmo, M. Gorgoi, and H. Siegbahn, The Electrode/Electrolyte Interfaces in Li-ion Batteries – the Hunt for Better Life-Time, 218th Electrochemical Society Meeting (ECS), Las Vegas, Nevada, USA, 10-15 October 2010.
K.V. Emtsev, A.A. Zakharov, and U. Starke, Decoupling Epitaxial Graphene from SiC(0001) Surface by a Germanium Buffer Layer, 74th DPG Meeting, Regensburg, Germany, 21-26 March 2010.
K.V. Emtsev, T. Seyller, L. Ley, and U. Starke, Epitaxial Graphene on SiC: Controlling the Growth, Electronic and Structural Properties?, 1st Graphene Satellite Symposium, 11th International Conference on the Science and Application of Nanotubes, Montreal, Canada, 27 June - 2 July 2010.
K.V. Emtsev, A. Zakharov, C. Coletti, S. Forti, and U. Starke, Electronic and Structural Decoupling of Epitaxial Graphene from SiC(0001) Surface by a Germanium Buffer Layer, The 8th European Conference on Silicon Carbide and Related Materials (ECSCRM), Oslo, Norway, 29 August - 2 September 2010.
J. Engblom, L. Pedersen, P. Nilsson, and V. Kocherbitov, Cubic Phases in the DOPS/DOPE/Water System, 6th Annual Workshop of Biofi lms – Research Center for Biointerfaces, Malmö, Sweden, 13-15 October 2010.
A. Engdahl, Synchrotron Infrared Microspectroscopy at Beamline 73, MAX-lab, Lund, Sweden, 6th International SPEC 2010, Manchester, United Kingdom, 26 June - 1 July 2010.
A. Engdahl, Synchrotron Infrared Microspectroscopy at beamline 73 MAX-lab, Lund, Sweden, 35th International Conference on Infrared, Millimeter, and Terahertz Waves (IRMMW-THz 2010), Rome, Italy, 5-10 September 2010.
A. Engdahl, Synchrotron Infrared Microspectroscopy at Beamline 73, MAX-lab, Lund, Sweden, Synchrotron Based FTIR Imaging Workshop, Madison, Wisconsin, USA, 5-7 October 2010.
R. Eriksson, T. Gustafsson, and K. Edström, On the Observation of the Structural Dynamics of the LiFePO4/FePO4 Cathode Material, 15th International Meeting on Lithium Batteries (IMLB), Montreal, Canada, 27 June - 2 July 2010.
R. Eriksson, T. Gustafsson, and K. Edström, Fast Time Resolved X-ray Diffraction of Electrochemically Active Materials, 12th European Powder Diffraction Conference (EPDIC-12), Darmstadt, Germany, 27-30 August 2010.
O. Faurskov Nielsen, T.M. Greve; N. de Fries, N. Wessel Larsen, and A. Engdahl, Low-Wavenumber Raman and Synchrotron Studies of Proteins and Protein/Water Interactions. From Model System to Animal and Human Skin, XXII International Conference on Raman Spectroscopy (ICORS 2010), Boston, Massachusetts, USA, 8-13 August 2010.
O. Faurskov Nielsen, T.M. Greve, and A. Engdahl, Investigation of Pig Ear Skin by IR-Imaging and Far-IR Spectroscopy, 35th International Conference on Infrared, Millimeter, and Terahertz Waves (IRMMW-THz 2010), Rome, Italy, 5-10 September 2010.
G. Feldman, Compton Scattering from Deuterium and the Electromagnetic Polarizabilities of the Neutron, International Nuclear Physics Conference (INPC),Vancouver, Canada, 4-9 July 2010.

MAX-lab ACTIVITY REPORT 2010 575
CONFERENCE CONTRIBUTIONS
C. Finnie, B.C. Bønsager, A. Shahpiri, K.G. Kirkensgaard, N. Navrot, P. Hägglund, A. Henriksen, and B. Svensson, Analysis of Redox-related Proteins in Barley Seed Proteomes, 3rd Iranian Proteomics Congress, Tehran, Iran, 26-27 May 2010.
C. Finnie, B.C. Bønsager, A. Shahpiri, K.G. Kirkensgaard, N. Navrot, P. Hägglund, A. Henriksen, and B. Svensson, Analysis of Redox-related Proteins in Barley Seed Proteomes, 5th ItPA Annual National Conference, Firenze, Italy, 9-12 June 2010.
M. Fiorentini, Production, Purification and Delta2 c-Terminal Binding Characterization of PSD93 Protein PDZ Domains, CoLuAa XIX, Valby, Denmark, 4-5 November 2010.
F. Fredslund, M.S. Møller, L. Lo Leggio, M.A. Hachem, and B. Svensson, The Structure of a GH13_31 -Glucosidase from the Probiotic Bacterium Lactobacillus Acidophilus NCFM, 4th symposium on the alpha-amylase family (ALAMY4), Smolenice Castle, Slovakia, 26-30 September 2010.
F. Fredslund, M.A. Hachem, R.J. Larsen, P.G. Sørensen, L. Lo Leggio, and B. Svensson, Structure of -Galactosidase from Lactobacillus Acidophilus NCFM: Insight into Tetramer Formation and Substrate Binding, CoLuAa XIX, Valby, Denmark, 4-5 November 2010.
P. Galberg, M. Rosrkowski, M.H.M. Olsen, L.P. McIntosh, T. Fritzemeier, M.G. Silow, J.H. Jensen, and L. Lo Leggio, Xylanases as an Experimental Model System for Predicting Thermostability from Structure, CoLuAa XIX, Valby, Denmark, 4-5 November 2010.
S. Gerstl, T. Baumbach, S. Casalbuoni, A.W. Grau, M. Hagelstein, D. Saez de Jauregui, C. Boffo, G. Sikler, V. Baglin, M.P. Cox, J.C. Schouten, R. Cimino, M. Commisso, B. Spataro, A. Mostacci, E.J. Wallén, R. Weigel, J. Clarke, D. Scott, T.W. Bradshaw, R.M. Jones, and I.R.R. Shinton, Status of COLDDIAG: A Cold Vacuum Chamber for Diagnostics, 1st International Particle Accelerator Conference (IPAC10), Kyoto, Japan, 23-28 May 2010.
M. Gorgel, S.R. Midtgaard, D. Vaicaityte, S.S.Thirup, P. Nissen, G. Christiansen, S.V. Hoffman, and T. Boesen, Structural Studies on Mycoplasma Adhesion Protein Vaa, CoLuAa XIX, Valby, Denmark, 4-5 November 2010.
R. Gosalawit-Utke, T.K. Nielsen, I. Saldan, C. Pistidda, T.R. Jensen, Y. Cerenius, T. Klassen, and M. Dornheim, Nanoconfinement of LiBH4-MgH2 in Carbon Aerogel Scaffold for Reversible Hydrogen Storage, Nano and Surface Science Approaches to Production and Storage of Hydrogen, Noordwijkerhout, The Netherlands, 14-19 November 2010.
D.M. Graham, S.J.O. Hardman, W.R. Flavell, G. Charron, T. Nann, A. Olsson, and F. Hennies, Investigating the Core/Shell Structure of InP/ZnS Quantum Dots Using Synchrotron-based Photoelectron Spectroscopy, Quantum Dot 2010 (QD2010), Nottingham, United Kingdom, 26-30 April 2010.
A. Green Wielandt, J.A. Cuesta-Seijo, and L. Lo Leggio, Structure of an Engineered Left-handed Beta-helix Protein, 40th Danish Crystallographers Meeting and 3rd DANSCATT Meeting, Copenhagen, Denmark, 31 May - 1 June 2010.
A. Green Wielandt, J.A. Cuesta-Seijo, and L. Lo Leggio, Structure of an Engineered Left-handed Beta-helix Protein, CoLuAa XIX, Valby, Denmark, 4-5 November 2010.
M. Grobosch, V.Yu. Aristov, O.V. Molodtsova, C. Schmidt, B.P. Doyle, S. Nannarone, and M. Knupfer, Engineering of the Energy Level Alignment at Organic Semiconductor Interfaces by Intra-molecular Degrees of Freedom: Transition Metal Phthalocyanines, 74th DPG Meeting: Thin Film Division (DS), Focused Session: Molecular Spintronics – Current Status and Challenges I, Regensburg, Germany, 21-26 March 2010.

576 MAX-lab ACTIVITY REPORT 2010
CONFERENCE CONTRIBUTIONS
M. Gurnett, L.J. Holleboom, H.M. Zhang, and L.S.O. Johansson, Photoemission Study of the Li/Ge(111)-sqrt3xsqrt3 Reconstruction, 18th International Vacuum Congress (IVC-18), International Conference on Nanoscience and Technology (ICN+T 2010), 14th International Conference on Surfaces Science (ICSS-14), Beijing, China, 23-27 August 2010.
M. Gustafsson, J. Grins, A. Bartoszewicz, B. Martín-Matute, and X. Zou, Lanthanide Metal-Organic Frameworks: Structural flexibility and potential catalytic properties, Workshop “MOFs on the Road to Applications”, Oslo, Norway, 17-19 June 2009.
M. Gustafsson, J. Grins, A. Bartoszewicz, B. Martín-Matute, and X. Zou, Metal-Organic Frameworks as Heterogeneous Catalysts, 2nd International Conference on Metal-Organic Frameworks and Open Framework Compounds (MOF2010), Marseille, France, 5-8 September 2010.
M. Gustafsson, A. Bartoszewicz, B. Martín-Matute, J. Sun, J. Grins, T. Zhao, and X. Zou, Lanthanide Metal-Organic Frameworks as Effective and Size-Selective Lewis Acid Catalysts, 14th International Symposium on Relations between Homogeneous and Heterogeneous Catalysis, Stockholm, Sweden, 13-18 September 2009.
T. Gustafsson, and K. Edström, Lithium Ion Batteries – a Challenge for in situ Characterisation, MRS Fall Meeting 2010, Symposium TT, Boston, MA, USA, 30 November - 1 December 2010.
E. Guziewicz, M.I. Łukasiewicz, L. Wachnicki, K. Kopalko, A. Kovács, B.S. Witkowski, B.J. Kowalski, J. Sadowski, M. Sawicki, R. Jakiela, and M. Godlewski, Synchrotron Photoemission Study of (Zn, Co)O Films with Uniform Co Distribution, 10th International School and Symposium on Synchrotron Radiation in Natural Science (ISSRNS), Szklarska Poreba, Poland, 6-12 June 2010.
M. Göthelid, S. Ahmadi, S. Yu, M. Zuleta, and C. Sun, The Role of Pyridine Derivatives on Energy Level Alignment and Adsorption of Dyes on TiO2 Surfaces, 18th International Vacuum Congress (IVC18), Bejing, China, 23-27 August 2010.
D.T. Ha, M. Huels, M. Huttula, S. Urpelainen, and E. Kukk, Ab initio and ion-ion coincidence study on the dissociation of d-ribose molecules, 37th International conference on Vacuum Ultraviolet and X-ray Physics (VUVX2010), Vancouver, Canada, 11-16 July 2010.
M. Haddad Momeni, X. Wang, J. Svedberg, H. Hansson, M. Sandgren, and J. Ståhlberg, Protein Expression by the Tree Pathogen Heterobasidion annosum, World Bioenergy 2010, Jönköping, Sweden, 25-27 May 2010.
M. Haddad Momeni, X. Wang, J. Svedberg, N.E. Mikkelsen, H. Hansson, M. Sandgren, and J. Ståhlberg, Cellulase Cel7A – The Major Secreted Protein of the Tree-killing Fungus Heterobasidion annosum (Rotticka), 14th Swedish Structural Biology Network Meeting, Tällberg, Sweden, 11-14 June 2010.
H. Hansson, M. Wu, S. Karkehabadi, E. Larenas, B. Kelemen, C. Mitchinson, and M. Sandgren, The Crystal Structure of the Exocellulase Cel6B (E3) from Thermobifida fusca, 24th Annual Symposium of The Protein Society, San Diego, California, USA, 1-5 August 2010.
C.G. Hartman, K. Ståhl, and P. Harris, Protein Characterization by In-house Powder Diffraction, 40th Danish Crystallographers Meeting and 3rd DANSCATT Meeting, Copenhagen, Denmark, 31 May-1 June 2010.
C.G. Hartmann, K. Ståhl, and P. Harris, In-house X-ray Characterization of Protein Powder, 12th European Powder Diffraction Conference (EPDIC-12), Darmstadt, Germany, 27-30 August 2010.

MAX-lab ACTIVITY REPORT 2010 577
CONFERENCE CONTRIBUTIONS
J. Hassinen, J. Hölsä, H. Jungner, T. Laamanen, M. Lastusaari, M. Malkamäki, and P. Novák, Thermoluminescence Study of the Optical Energy Storage Properties of Persistent Luminescence Materials, 10th European Symposium on Thermal Analysis and Calometry (ESTAC-10), Rotterdam, The Netherlands, 22-27 August 2010.
A. Henriksen, C.E. Christensen, and V.E. Pye, Redox Regulation and Substrate Specificity in Plant Peroxisomal -oxidation, 26th European Crystallographic Meeting (ECM26), Darmstadt, Germany, 29 August - 2 September 2010.
E. Hilner, A.A. Zakharov, and J.N. Andersen, Influence of Au Nanoparticles on the Self-propelled Motion of Mesoscopic Droplets, LEEM-PEEM 7, New York, New York, USA, 8-13 August 2010.
M. Hirsimäki, L. Kanninen, N. Jokinen, P. Jussila, K. Lahtonen, R. Pärna, E. Nõmmiste, and M. Valden, Synthesizing Bioactive Silane Layers on Nanopatterned Stainless Steel Surfaces, 3rd International NanoBio Conference, Zürich, Switzerland, 24-27 August 2010.
M. Hjort, A.A. Zakharov, and M.T. Borgström, Combined PEEM, LEEM and XPS Studies of III-V Semiconductors Nanowires, LEEM-PEEM 7, New York, New York, USA, 8-13 August 2010.
M. Holappa, S. Aksela, M. Patanen, S. Urpelainen, and H. Aksela, Atom-solid Binding Energy Shifts for K and Rb, 37th International conference on Vacuum Ultraviolet and X-ray Physics (VUVX2010), Vancouver, Canada, 11-16 July 2010.
M. Håkansson, M. Hansson, B. Walse, and D.T. Logan, The Macromolecular Crystallization Facility at MAX-lab, 42nd International School of Crystallography, Structure and Function from Macromolecular Crystallography: Organization in Space and Time, Erice, Sicily, 3-13 June 2010.
J. Hölsä, A. Kotlov, T. Laamanen, M. Lastusaari, M. Malkamäki, and P. Novák, Updating Persistent Luminescence: Experimental and Computational Evidence of Defects, IV Encontro Nacional sobre Terras Raras (TR2010), Aracaju, Brazil, 6-9 April 2010.
J. Hölsä, H. Brito, T. Laamanen, M. Lastusaari, M. Malkamäki, and L.C.V. Rodrigues, How to Design a Potential Persistent Luminescence Material, Excited States of Transition Elements 2010 (ESTE2010), Piechowice, Poland, 4-9 September 2010.
J. Hölsä, H.F. Brito, T. Laamanen, M. Lastusaari, M. Malkamäki, and L.C.V Rodrigues, Modeling Persistent Luminescence: Theory vs. Experiment, IX Brazilian MRS Meeting, Ouro Preto, Brazil, 24-28 October 2010.
J. Hölsä, H.F. Brito, T. Laamanen, M. Lastusaari, M. Malkamäki, and L.C.V. Rodrigues, Persistent Luminescence: How and Why?, 2a Reunião inct/inami, Gravatá-PE Brazil, 15-17 December 2010.
A.K. Inge, C. Bonneau, J. Sun, R. Sanchez-Smith, B. Guo, D. Zhang, and X. Zou, Novel Open-framework Germanates: Influence of Water and Hydrofluoric Acid, 16th International Zeolite Conference (16th IZC) and 7th International Mesostructured Materials Symposium (7th IMMS), Sorrento, Italy, 4-9 July 2010.
C. Isvoranu, B. Wang, E. Ataman, J. Knudsen, K. Schulte, J.N. Andersen, M.-L. Bocquet, and J. Schnadt, Modification of the Spin State and Molecule-substrate Interaction of Iron Phthalocyanine Adsorbates on Au(111) by Ligand Attachment, 70th Physical Electronics Conference (PEC), Milwaukee, Wisconsin, USA, 15-18 June 2010.
C. Isvoranu, B. Wang, E. Ataman, J. Knudsen, K. Schulte, J.N. Andersen, M.-L. Bocquet, and J. Schnadt, Modification of the Spin State and Molecule-substrate Interaction by Ligand Attachment to Iron Phthalocyanine Molecules on Au(111), 27th European Conference on Surface Science (ECOSS 27), Groningen, The Netherlands, 29 August - 3 September 2010.

578 MAX-lab ACTIVITY REPORT 2010
CONFERENCE CONTRIBUTIONS
C. Isvoranu, B. Wang, E. Ataman, J. Knudsen, K. Schulte, J.N. Andersen, M.-L. Bocquet, and J. Schnadt, Modification of the Spin State and Molecule-substrate Interaction of Iron Phthalocyanine Adsorbates on Au(111) by Ligand Attachment, European Conference on Surface Crystallography and Dynamics 10 (ECSCD10), Reading, United Kingdom, 20-22 September 2010.
C. Isvoranu, B. Wang, E. Ataman, K. Schulte, J. Knudsen, J.N. Andersen, M.-L. Bocquet, and J. Schnadt, Ligand Adsorption on Iron Phthalocyanine: Adsorption Sites, Substrate Decoupling, and Spin State Modification, Condensed Matter and Materials Physics (CMMP10), Warwick, United Kingdom, 14-16 December 2010.
T.R. Jensen, Halogen Substituted Metal Borohydrides for Hydrogen Storage (FLYHY), European Workshop on Hydrogen Storage Technologies co-organized by NESSHY, NANOHY, and FLYHY EC projects, Manchester, United Kingdom, 13 January 2010.
T.R. Jensen, Hydrogen Storage Materials (HN2), Task-22 IEA HIA Expert Meeting, Death Valley, California, USA, 11-15 April 2010.
T.R. Jensen, Hydrogen Storage Materials, 12th European Powder Diffraction Conference (EPDIC-12), Darmstadt, Germany, 27-30 August 2010.
T.R. Jensen, Novel Materials – The Only Hope for a Clean and Sustainable Future, E-MRS 2010 Fall Meeting, Warsaw, Poland, 13-17 September 2010.
T.R. Jensen, Metal Hydrides and Complex Hydrides for Hydrogen Storage, Department of Advanced Materials and Technologies, Military University of Technology (MUT), Warsaw, Poland, September 14, 2010.
T.R. Jensen, Hydrogen – a Possible Future Energy Carrier, The Annual Meeting of the Swiss Society For Crystallography, ‘New Materials for Clean Future’, Geneva, Switzerland, 17 September 2010.
T.R. Jensen, Fossil Fuels – Renewable Energy – Hydrogen, The 3rd Chalmers-ISIS Workshop: Neutron Scattering and Materials for Energy Applications, Göteborg, Sweden, 22 September 2010.
T.R. Jensen, Nanoconfinement and Novel Series of Bi-metal Borohydrides, The International Chemical Congress of Pacifi c Basin Societies, Honolulu, Hawaii, USA, 15-20 December 2010.
T.R. Jensen, Hydrogen Storage Updates, Meeting in the Centre for Energy Materials, Århus, Denmark, 3 September 2010.
C. Johansson, and G. Almkvist, Accelerated Aging of Recent Oak – Impact of Iron Ions and Oxygen on Mechanical Properties in Longitudinal Direction, 11th ICOM-CC WOAM (Wet Organic Archaeological Materials), Greenville, North Carolina, USA, 24-29 May 2010.
R. Johansson, J. Sprenger, B. Walse, M. Sahlin, B.M. Sjöberg, and D.T. Logan, High Resolution Structure of NrdI from Bacillus anthracis, an Important Maintenance Protein for Ribonucleotide Reductase, Joint workshop of the FOR630 “Biological function of organometallic compounds” and the IRTG1422 “Metal Sites in Biomolecules: Structures, Regulation and Mechanisms”, Goslar, Germany, 8-12 February 2010.

MAX-lab ACTIVITY REPORT 2010 579
CONFERENCE CONTRIBUTIONS
A.T. Jonstrup, K.R. Andersen, L.B. Van, and D.E. Brodersen, Structural and Mechanistic Insights into the S. Pombe Pop2 Deadenylase Protein, The modern RNA world, Murnau, Germany, 13-16 October 2010.
N.K. Jordheim, Photoelectron Spectroscopy, a New Technique for Studying Molecular Conformations, Norwegian Chemical Society, Annual meeting in Computational Chemistry, Trondheim, Norway, 22-23 November 2010.
L. Juknaite, Ionotropic Glutamate Receptors. Structural Studies of N-terminal Domains, CoLuAa XIX, Valby, Denmark, 4-5 November 2010.
L. Järvinen, O. Eklund, M. Heinonen, F. Bjondahl, and J. Leiro, The Use of Synchrotron Based HR-XPS in Characterization of Limestones Suitable for SO2 Storage, 29th Nordic Geological Winter Meeting, Oslo, Norway, 11-13 January 2010.
R. Jørgensen, T. Pesnot, M.M. Palcic, and G.K. Wagner, Structural Basis for a New Mode of Glycosyltransferase Inhibition, 26th European Crystallographic Meeting (ECM26), Darmstadt, Germany, 29 August - 2 September 2010.
S. Kadhirvel, E. Haglund, M. Oliveberg, and D.T. Logan, Edge Strand Gatekeepers in Ribosomal Protein S6, 13th Annual SBNet Conference, Tällberg, Sweden, 12-15 June 2009.
S. Kadhirvel, E. Haglund, M. Oliveberg, and D.T. Logan, Edge Strand Gatekeepers in Ribosomal Protein S6, CoLuAa-XVIII, Bagsvaerd, Denmark, 4-5 November 2009.
S. Kadhirvel, M. Håkansson, S. Genheden, J. Qvist, C. Diehl, U. Nilsson, H. Leffler, U. Ryde, M. Akke, and D.T. Logan, The Pre-organized Carbohydrate Binding Site in Galectin-3C: Insights from the Atomic Resolution Structures, 14th Annual SBNet Conference, Tällberg, Sweden, 11-14 June 2010.
L. Kanninen, K. Lahtonen, N. Jokinen, P. Jussila, O. Tarvainen, M. Kuzmin, M. Hirsimäki, and M. Valden, Chemical and Structural Characterization of Trimesic Acid on Cu(100) and O/Cu(100) Studied by XPS and STM, 44th annual meeting of the Finnish Physical Society, Jyväskylä, Finland, 11-13 March 2010.
L. Kanninen, N. Jokinen, K. Lahtonen, P. Jussila, H. Ali-Löytty, M. Hirsimäki, J. Leppiniemi, V. Hytönen, M. Kulomaa, N. Ahola, K. Paakinaho, M. Kellomäki, and M. Valden, Surface Science Analysis and Surface Modification Methods for Biomaterials Research, 3rd International NanoBio Conference, Zürich, Switzerland, 24-27 August 2010.
L. Kanninen, N. Jokinen, K. Lahtonen, P. Jussila, H. Ali-Löytty, M. Hirsimäki, J. Leppiniemi, V. Hytönen, M. Kulomaa, N. Ahola, K. Paakinaho, M. Kellomäki, and M. Valden, Surface Scientific Analysis and Surface Modification Methods for Biomaterials Research, 23rd European Conference on Biomaterials, Tampere, Finland, 11-15 September 2010.
P. Kao, S. Neppl, P. Feulner, D.L. Allara, and M. Zharnikov, Dynamics of the Charge Transfer Through the Individual Molecules in Alkanethiolate Self-assembled Monolayers, AVS 57th International Symposium and Exhibition, Albuquerque, New Mexico, USA, 17-22 October 2010.
S. Karkehabadi, F. Goedegebuur, P. Neefe, P. Gualfetti, E. Larenas, V. Huynh, C. Mitchinson, and M. Sandgren, Engineering an Improved Cellobiohydrolase (Cel6A) from Hypocrea jecorina by Site Directed Evolution, 24th Annual Symposium of The Protein Society, San Diego, California, USA, 1-5 August 2010.
T. Karlberg, A.-G. Thorsell, E. Wahlberg, J. Weigelt, and H. Schüler, PARP Macro Domains: From Atomic Detail to Function and Inhibitor Development, 18th International Conference on ADP-ribose metabolism (PARP 2010), Zürich, Switzerland, 18-21 August 2010.
J. Kastrup, The Structural Basis of Agonist Recognition in AMPA Receptors, Physiology 2010 Conference, Manchester, United Kingdom, 30 June - 2 July 2010.

580 MAX-lab ACTIVITY REPORT 2010
CONFERENCE CONTRIBUTIONS
J. Kastrup, Comparison of Various Ligand Interaction with iGluRs, Based on Crystallography (O7.1), 20th Neuropharmacology Conference, High Resolution Neuropharmacology, San Diego, California, USA, 10-12 November 2010.
B. Kennedy, D. Cockburn, B. Arnold, A. Grogan, T. Käämbre, J. Guo, R.G. Egdell, P. Blaha, and C. McGuinness, Measurement and Simulations of the Oxygen K edge Resonant X-ray Emission Spectroscopy of Rutile Titanium Dioxide, 11th International Conference on Electronic Spectroscopy and Structure (ICESS-11), Nara, Japan, 6-10 October 2009.
K.G. Kirkensgaard, P. Hägglund, C. Finnie, B. Svensson, and A. Henriksen, Reaction Mechanism of Barley Thioredoxin Reductase, International School and Conference on Crystallization of Biological Macromolecules (ICCBM 13), Trinity College, Dublin, Ireland, 10-16 September 2010.
K.G. Kirkensgaard, P. Hägglund, C. Finnie, B. Svensson, and A. Henriksen, Reaction Mechanism of Barley Thioredoxin Reductase, CoLuAa XIX, Valby, Denmark, 4-5 November 2010.
K.G. Kirkensgaard, P. Hägglund, C. Finnie, B. Svensson, and A. Henriksen, Structure of NADPH-dependent Thioredoxin Reductase from Barley, 4th Protein Workshop, DTU, Lyngby, Denmark, 12 November 2010.
J. Knudsen, K. Schulte, E. Ataman, C. Isvoranu, J. Schnadt, and J.N. Andersen, CO Adsorption on Au-particles Grown on Ultrathin and Partly Reduced Iron-oxide Films, 18th International Vacuum Congress (IVC-18), International Conference on Nanoscience and Technology (ICN+T 2010), 14th International Conference on Surfaces Science (ICSS-14), Beijing, China, 23-27 August 2010.
J. Knudsen, K. Schulte, E. Ataman, C. Isvoranu, J. Schnadt, and J.N. Andersen, CO Adsorption on Au-particles Grown on Ultrathin and Partly Reduced Iron-oxide Films, 27th European Conference on Surface Science (ECOSS 27), Groningen, The Netherlands, 29 August - 3 September 2010.
K. Kooser, D.T. Ha, E. Itälä, S. Granroth, L. Partanen, A. Caló, S. Aksela, H. Aksela, E. Nõmmiste, and E. Kukk, Resonant Auger Electron-ion Coincidence Study of the Fragmentation Dynamics of Acrylonitrile Molecule, 37th International conference on Vacuum Ultraviolet and X-ray Physics (VUVX2010), Vancouver, Canada, 11-16 July 2010.
B.J. Kowalski, M.A. Pietrzyk, W. Knoff, R. Nietubyć, K. Nowakowska-Langier, J. Sadowski, A. Łusakowski, and T. Story, Angle-resolved photoemission study of GeTe band structur, The Fifth Workshop on Laser Science and Applications, Damascus, Syria, May 14-26, 2010
B.J. Kowalski, W. Knoff, M. Pietrzyk, R. Nietubyć, K. Nowakowska-Langier, J. Sadowski, A. Łusakowski, and T. Story, Photoelectron Spectroscopy in Studies of the Band Structure of IV-VI Spintronic Materials, 10th International School and Symposium on Synchrotron Radiation in Natural Science (ISSRNS), Szklarska Poreba, Poland, 6-12 June 2010
B.J. Kowalski, M.A. Pietrzyk, R. Nietubyć, W. Knoff, B.A. Orłowski, A. Łusakowski, J. Sadowski, and T. Story, GeTe and Ge0.9Mn0.1Te Valence Band Structure – an Angle-resolved Photoemission Study, 37th International conference on Vacuum Ultraviolet and X-ray Physics (VUVX2010), Vancouver, Canada, 11-16 July 2010.
B.J. Kowalski, M.A. Pietrzyk, R. Nietubyć, W. Knoff, A. Łusakowski, J. Sadowski, J. Adell, and T. Story, Angle-resolved Photoemission Study of GeTe and Ge1-xMnxTe Valence Band, XXXIX “Jaszowiec” International School and Conference on the Physics of Semiconductors, Krynica-Zdrój, Poland, 19-24 June 2010.

MAX-lab ACTIVITY REPORT 2010 581
CONFERENCE CONTRIBUTIONS
M. Kozak, Small Angle Scattering of Synchrotron Radiation Studies of Biomembranes, 8th National Symposium of Synchrotron Users (KSUPS-8), Podlesice, Poland, 24-26 September 2009.
C. Krintel, BPAM-97 a Positive Allosteric GluA2 Modulator, CoLuAa XIX, Valby, Denmark, 4-5 November 2010.
S. Krishnamurthy, Soft X-ray Spectroscopy – An Effective Probe to Characterise Nanostructured Materials, National Conference on Experimental Tools for Material Science, Varanasi, India, 3-4 December 2010.
S. Krishnamurthy, Understanding the Electronic and Optical Properties of Micro Nano Systems through Various Spectroscopies and Optical Techniques, International Conference on Multifunctional Materials, Varanasi, India, 6-9 December 2010.
S. Krishnamurthy, R. Friend, A. Cheetam, D. Birnie, and S. Bill, Inspirational Lecture Programme for Youth, 3rd Bangalore Nano conference, Bangalore, India, 8-9 December 2010.
S. Krishnamurthy, Novel Materials for Microbial Fuel Cells, 3rd Bangalore Nano conference, Bangalore, India, 8-9 December 2010.
S. Krishnamurthy, Exploring the Origin of Ferromagnetism in Dilute Ferromagnetic Oxides and Novel Nanostructed Metal Nitrides, International Conference on Fundamentals and Applications of Nanoscience and technology (IKFANT2010), Kolkata, India, 9-11 December 2010.
J. Kristensen, Selective Inhibition of Histone Demethylases, CoLuAa XIX, Valby, Denmark, 4-5 November 2010.
T. Kroll, R. Kraus, M. Grobosch, O.V. Molodtsova, V.Yu. Aristov, P. Hoffmann, and M. Knupfer, Determination of the spin and orbital ground state of transition metal phthalocyanines, 74th DPG Spring Meeting, Symposium: Thin Film Division (DS), Focused Session: Molecular Spintronics – Current Status and Challenges I, Regensburg, Germany, 21-26 March 2010.
R. Kuktaite, T.S. Plivelic, Y. Cerenius, M.S. Hedenqvist, S. Marttila, R. Ignell, M. Gällstedt, and E. Johansson, Green gluten polymers instead of petrochemicals: are we there yet, 239th ACS Chemistry for a Sustainable World Polymer Chemistry division meeting, San Francisco, California, USA, 21-25 March 2010.
M. Kuzmin, Atomic Structure of Yb/Si(100)(2x6): What We Can Learn from Si 2p Core-level Photoemission, 4th International Workshop on Atomic-Scale Challenges in Advanced Materials (ASCAM IV), Turku, Finland, 19-20 August 2010.
T. Laamanen, J. Hölsä, M. Lastusaari, and P. Novák, Electronic Structure of Defects and Defect Aggregates in Sr2MgSi2O7, 3rd EuCheMS Chemistry Congress (EuCheMS2010), Nürnberg, Germany, 29 August - 2 September 2010.
T. Laamanen, J. Hölsä, M. Lastusaari, and P. Novák, Electronic Structure of Rare Earth Ions in the Sr2MgSi2O7 Persistent Luminescence Host Material, 9th Conference on Solid State Chemistry (SSC2010), Prague, Czech Republic, 10-15 September 2010.
J. Laksman, D. Céolin, M. Gisselbrecht, and S.L. Sorensen, Dynamics of Proton Migration and Dissociation in Core-excited Ethyne Probed by Multiple Ion Momentum Imaging, 37th International conference on Vacuum Ultraviolet and X-ray Physics (VUVX2010), Vancouver, Canada, 11-16 July 2010.

582 MAX-lab ACTIVITY REPORT 2010
CONFERENCE CONTRIBUTIONS
K. Lawniczak-Jablonska, A. Wolska, M.T. Klepka, A. Twardowski, D.Wasik, J. Gose, and J. Sadowski, The Shape Anisotropy of the MnSb Inclusions Formed in GaSb Matrix as Probed by XMCD, 10th International School and Symposium on Synchrotron Radiation in Natural Science (ISSRNS), Szklarska Poreba, Poland, 6-12 June 2010.
G. Lazzara, B. Nyström, and K. Schillén, Aqueous Mixtures of a Thermosensitive Cationic Block Copolyner and Cyclodextrins. Inclusion Complex Formation, 7th Nordic Workshop on Scattering from Soft Matter, Helsinki, Finland, 27-28 January 2010.
G. Lazzara, G. Olofsson, V. Alfredsson, K. Zhu, B. Nyström, and K. Schillén, Thermosensitive Cationic Block Copolymer and Cyclodextrins. Inclusion Complexes in Solution and in Solid State, XXXII National Congress on Calorimetry Thermal Analysis and Applied Thermodynamics (AICAT 2010), Trieste, Italy, 26-28 May 2010.
G. Lazzara, G. Olofsson, V. Alfredsson, K. Zhu, B. Nyström, and K. Schillén, Temperature-tuned Threading and De-threading in a Cationic Block Copolymer, 24th European Colloid and Interface Society Conference (ECIS), Prague, Czech Republic, 5-10 September 2010.
G. Lazzara, G. Olofsson, T. Nylander, V. Alfredsson, K. Zhu, B. Nyström, and K. Schillén, Threading and De-threading of Cyclodextrin in a Thermosensitive Cationic Block Copolymer in Water and at the Silica/water Interface, XXXIX Congresso Nazionale di Chimica Fisica, Stresa, Italy, 20-24 September 2010.
H.L. Lee, S.A. Krasnikov, N. Sergeeva, C.M. Doyle, M.O. Senge, and A.A. Cafolla, The Formation of Surface Supported Covalently Bonded Porphyrin Networks through Polyimidisation, European Conference on Surface Science (ECOSS-27), Groningen, The Netherlands, 30 August - 3 September 2010.
S.C. Leemann, J. Ahlbäck, Å . Andersson, M. Eriksson, M. Johansson, L.-J. Lindgren, M. Sjöström, and E. Wallén, Status of the MAX IV Storage Rings, 1st International Particle Accelerator Conference (IPAC10), Kyoto, Japan, 23-28 May 2010.
J. Lemrise, Proton Identification Using Plastic Scintillator Counters at MAX-lab, American Physical Society Meeting 2010, Washington D.C., USA, 13-16 February 2010.
M.B. Ley, D.B. Ravnsbæk, and T.R. Jensen, Thermal Polymorphism and Decomposition of Y(BH4)3, Summer School on ”Materials for the hydrogen economy”, Reykjavik, Iceland, 17-21 August 2010.
M. Litwack, Tagging Efficiency Measurements at the Nuclear Physics Beam Line at MAX-lab, American Physical Society Meeting 2010, Washington D.C., USA, 13-16 February 2010.
D.T. Logan, J. Unge, W. Ubhayasekera, D. Haase, K. Larsson, C. Svensson, M. Håkansson, T. Plivelic, J. Nygaard, K. Theodor, K. Norén, S. Carlson, Y. Cerenius, M.M.G.M. Thunnissen, and T. Ursby, Facilities for Structural Biology at MAX-lab, 10th International Conference on Biology and Synchrotron Radiation, Melbourne, Australia, 15-18 February 2010.
D.T. Logan, Structural Biology at MAX-lab: Working Towards MAX IV, CoLuAa XIX, Valby, Denmark, 4-5 November 2010.
R.R. Lozada García, J. Ceponkus, M. Chevalier, W. Chin, M. Broquier, and C. Crépin, Infrared Study of Acetylacetone Isolated in Parahydrogen Matrices, 6th International Meeting on Photodynamic, Havana, Cuba, 1-5 February 2010.
D. Lundberg, L. Eriksson, P. D’Angelo, S. De Panfilis, and I. Persson, The Coordination Chemistry of Lanthanoid(III) Ions Kindles the Ionic radii of Promethium(III), 1st Swedish Inorganic Meeting, Oorgdagarna, Uppsala, Sweden, 16-19 June 2010.

MAX-lab ACTIVITY REPORT 2010 583
CONFERENCE CONTRIBUTIONS
M. Lundin, L. Isaksson, and B. Schröder, Bulk Shielding Design for the MAX IV Facility, 5th International Workshop on RADiation safety at SYNCHrotron radiation sources (RADSYNCH), Trieste, Italy, 21-23 May 2009.
F.J. Luque, A. Persson, M.Á. Niño, A. Estrada, D. Arvanitis, J.J. de Miguel, and R. Miranda, Magnetic Anisotropy and Spin Reorientation Transitions in Nanomagnet Arrays, European Conference on Surface Science (ECOSS-27), Groningen, The Netherlands, 30 August - 3 September 2010.
A. Lushchik, A. Baimakhanuly, A. Kotlov, V. Nagirnyi, E. Shablonin, and E. Vasilchenko, Defect Creation via Hot Carriers Recombination or Decay of Cation Excitons in NaCl and MgO at 6-12 K, 11th Europhysical Conference on Defects in Insulating Materials (EURODIM 2010), Pecs, Hungary, 12-16 July 2010.
M. Massa, R. Häggblad, and A. Andersson, Cation Vacant Fe3-x-z Vx zO4 Spinel-Type Catalysts for Methanol Oxidation to Formaldehyde, Symposium on New Insights into Selective Heterogeneous Oxidation Catalysis, 5th Irsee Symposium, Irsee, Germany, 10-13 June 2010.
C. McGuinness, B. Kennedy, D. Cockburn, B. Arnold, A. Grogan, T. Käämbre, R.G. Egdell, and P. Blaha, Simulation of the Oxygen K edge Resonant X-ray Emission Spectroscopy of Rutile Titanium Dioxide, CECAM Workshop on Computer simulation of oxides: dopants, defects and surfaces, Dublin, Ireland, 9-11 September 2009.
C. McGuinness, B. Kennedy, D. Cockburn, B. Arnold, J.D. Denlinger, T. Käämbre, and R.G. Egdell, The Valence Band Electronic Structure of RuO2 – A Study of Chemical Bonding Through Polarisation Dependent Resonant Soft X-ray Emission, 37th International conference on Vacuum Ultraviolet and X-ray Physics (VUVX2010), Vancouver, Canada, 11-16 July 2010.
S.F. Midtgaard, C. Rosenberg, J. Reinholdt, M. Kilian, U.B.S. Sørensen, J.J. Enghild, S.S. Thirup, K. Poulsen, and T. Boesen, Structural Studies of IgA1 Protease from Streptococcus Pneumoniae, International School and Conference on Crystallization of Biological Macromolecules (ICCBM 13), Trinity College, Dublin, Ireland, 10-16 September 2010.
N.E. Mikkelsen, S. Karkehabadi, H. Hansson, E. Larenas, B. Kelemen, C. Mitchinson, and M. Sandgren, The First Crystal Structure of a Glycoside Hydrolase Family 3 -Xylosidase, Bxl1 from Hypocrea Jecorina, at 1.8Å Resolution, 32nd Symposium on Biotechnology for Fuels and Chemicals, Clearwater Beach, Florida, USA, 19-22 April 2010.
O.V. Molodtsova, M. Knupfer, V.V. Maslyuk, I. Mertig, T. Bredow, and V.Yu. Aristov, Ordering and Electronic Structure of Pristine Magnetic Transition Metal Phthalocyanine Thin Films on Au(001), Deutsche Tagung für Forschung mit Synchrotronstralung, Neutronen und Ionenstralen an Großgeräten (SNI2010), Berlin, Germany, 24-26 February 2010.
O. Molodtsova, V. Aristov, V. Maslyuk, D. Vyalikh, A. Preobrajenski, I. Mertig, T. Bredow, and M. Knupfer, Magnetic Transition Metal Phthalocyanine Thin Films: Electronic Properties via K Doping, 74th DPG Spring Meeting, Symposium: Thin Film Division (DS), Focused Session: Molecular Spintronics – Current Status and Challenges I, Regensburg, Germany, 21-26 March 2010.
O.V. Molodtsova, M. Knupfer, V.V. Kveder, C. Laubschat, and V.Yu. Aristov, Formation of Ferromagnetic Metal Top Contacts on an Organic Semiconductor in Soft Landing Conditions: Evidence for a Sharp, Mainly Nonreactive Interface, 37th International conference on Vacuum Ultraviolet and X-ray Physics (VUVX2010), Vancouver, Canada, 11-16 July 2010.
O.V. Molodtsova, M. Knupfer, I.M. Aristova, V.V. Kveder, V.M. Zhilin, C. Laubschat, and V.Yu. Aristov, Electronic Properties of Hybrid Organic-inorganic Systems: Au Nanoparticles Embedded into an Organic CuPc Matrix, 15th International Conference on Solid Films and Surfaces (ICSFS-15), Beijing, China, 5-10 October 2010.

584 MAX-lab ACTIVITY REPORT 2010
CONFERENCE CONTRIBUTIONS
O.V. Molodtsova, M. Knupfer, V.V. Kveder, C. Laubschat, and V.Yu. Aristov, Ferromagnetic Co and Fe Top Contact Formation on an Organic Semiconductor in Soft Landing Conditions: Evidence for Sharp, Mainly Chemically Inactive Interfaces, 15th International Conference on Solid Films and Surfaces (ICSFS-15), Beijing, China, 5-10 October 2010.
O.V. Molodtsova, I.M. Aristova, V.V. Kveder, M.Knupfer, C. Laubschat, and V.Yu. Aristov, Gold Nanoparticles Blended into an Organic Matrix (CuPc), 2nd Joint BER II and BESSY II Users’ Meeting, Berlin, Germany, 9-10 December 2010.
E. Moons, Solceller för framtiden, Biannual Conference of the Swedish Physical Society, Fysikdagar 2010, Karlstad, Sweden, 7-9 October 2010.
N. Navrot, K.G. Kirkensgaard, F. Yang, B.C. Bønsager, A. Shahpiri, P. Hägglund, C. Finnie, A. Henriksen, and B. Svensson, Barley Proteomics. Redox Proteins, Seed Germination, and Fusarium Infection, International Conference on Proteomics in Plants, Microorganisms and Environment, Luxembourg, 18-20 October 2010.
F.P. Netzer, Strain Effects in Oxide Nanostructures, 23rd Surface Science Symposium, St Christoph am Arlberg, Austria, 7-13 March 2010.
F.P. Netzer, W-oxide Clusters on Cu(110) Surfaces: Electronic Structure and Selforganisation, AVS 57th International Symposium and Exhibition, Albuquerque, New Mexico, USA, 17-22 October 2010.
T.K. Nielsen, U. Bösenberg, R. Gosalawit, M. Dornheim, Y. Cerenius, F. Besenbacher, and T.R. Jensen, A Reversible Nanoconfined Chemical Reaction, Meeting for the nordic hydrogen network spring 2010, Svalbard, Norway, 20 April 2010.
T.K. Nielsen, U. Bösenberg, R. Gosalawit, M. Dornheim, Y. Cerenius, F. Besenbacher, and T.R. Jensen, A Reversible Nanoconfined Chemical Reaction, International Symposium on Metal-Hydrogen Systems (MH2010), Moscow, Russia, 19-23 July 2010.
T.K. Nielsen, U. Bösenberg, R. Gosalawit, M. Dornheim, Y. Cerenius, F. Besenbacher, and T.R. Jensen, Reversible Nanoconfined Chemical Reaction, ACS Fall 2010 National Meeting and Exposition, Boston, Massachusetts, USA, 22-26 August 2010.
M.Á. Niño, F.J. Luque, T.O. Mentes, A. Locatelli, D. Arvanitis, J.J. de Miguel, and R. Miranda, Strong Interfacial Magnetic Anisotropy in fcc FeCu Alloy Films Grown on Pb Substrates, European Conference on Surface Science (ECOSS-27), Groningen, The Netherlands, 30 August - 3 September 2010.
J. Niskanen, S. Urpelainen, K. Jänkälä, J. Schulz, S. Heinäsmäki, S. Fritzsche, N.M. Kabachnik, S. Aksela, and H. Aksela, Photoelectron Angular Distribution and Linear Magnetic Dichroism in the 4p Photoemission from Rb Atoms, 37th International conference on Vacuum Ultraviolet and X-ray Physics (VUVX2010), Vancouver, Canada, 11-16 July 2010.
J. Niskanen, S. Urpelainen, S. Aksela, H. Aksela, O. Vahtras, V. Carravetta, and H. Ågren, Valence Photoionization of the LiCl Monomer and Dimer, 37th International conference on Vacuum Ultraviolet and X-ray Physics (VUVX2010), Vancouver, Canada, 11-16 July 2010.
P. Novák, T. Laamanen, M. Lastusaari, and J. Hölsä, Electronic Structure of Defects and Defect Aggregates in Sr2MgSi2O7, 9th Prague Colloquium f-Electron Systems (PCFES2010), Prague, Czech Republic, 31 May - 3 June 2010.
C.H. Olesen, D.B. Ravnsbæk, R. Černý, and T.R. Jensen, New Strontium Tetrahydridoboranates for Hydrogen Storage, Summer School on ”Materials for the hydrogen economy”, Reykjavik, Iceland, 17-21 August 2010.
MAX-lab ACTIVITY REPORT 2010 585
CONFERENCE CONTRIBUTIONS
C.H. Olesen, D.B. Ravnsbæk, R. Černý, and T.R. Jensen, Significant Different Reactions Observed for LiBH4-SrCl2 and KBH4-SrCl2, Meeting for the nordic hydrogen network spring 2010, Svalbard, Norway, 21 April 2010.
C.H. Olesen, D.B. Ravnsbæk, R. Černý, and T.R. Jensen, Novel Strontium Borohydrides Within the LiBH4-SrCl2 System, Meeting for the nordic hydrogen network fall 2010, Uppsala, Sweden, 23 November 2010.
G.V. O’Rielly, The Near Threshold Pion Photoproduction Program at MAX-lab, American Physical Society Meeting 2010, Washington D.C., USA, 13-16 February 2010.
J.N. O’Shea, M. Weston, L.C. Mayor, and A. Britton, Exploring the Charge Transfer Dynamics of Large, Fragile Dye Complexes on Surfaces Prepared by in-situ UHV Electrospray Deposition, European Conference on Surface Science (ECOSS-27), Groningen, The Netherlands, 30 August - 3 September 2010.
J.N. O’Shea, A. Saywell, A.J. Britton, N. Taleb, M. Gimenez-Lopez, N.R. Champness, and P.H. Beton, Single Molecule Magnets on a Gold Surface: In-situ Electrospray Deposition, STM, X-ray Absorption and Photoemission Spectroscopy, Condensed Matter and Materials Physics (CMMP10), Warwick, 14-16 December 2010.
F. Ossler, L. Vallenhag, S.E. Canton, and P. Sondhauss, Combining Small Angle and Wide Angle X-ray Scattering Techniques for In-situ Studies of Particle Formation Processes in Reactive Systems Using a New Detector Prototype, Annual World Conference on Carbon 2010, Clemson, South Carolina, USA, 11-16 July 2010.
H. Otten, S. Gauer, J.-C. N. Poulsen, M.J. Bjerrum, G.-W. Kohring, and L. Lo Leggio, Crystallization and Preliminary Characterization of Bradyrhizobium japonicum L-Sorbitol Dehydrogenase, 40th Danish Crystallographers Meeting and 3rd DANSCATT Meeting, Copenhagen, Denmark, 31 May - 1 June 2010.
M. Patanen, S. Aksela, S. Urpelainen, and H. Aksela, Direct Experimental Determination of Atom-molecule-solid Binding Energy Shifts for Sb and Bi, 37th International conference on Vacuum Ultraviolet and X-ray Physics (VUVX2010), Vancouver, Canada, 11-16 July 2010.
M. Patanen, S. Urpelainen, M. Huttula, V. Kisand, E. Nõmmiste, E. Kukk, H. Aksela, and S. Aksela, High Resolution Study of K3p Photoabsorption and Resonant Auger Decay in KF, 37th International conference on Vacuum Ultraviolet and X-ray Physics (VUVX2010), Vancouver, Canada, 11-16 July 2010.
Z. Pietralik, M. Chrabąszczewska, and M. Kozak, Interactions of Cationic Gemini Surfactants with DMPC, 8th National Symposium of Synchrotron Users (KSUPS-8), Podlesice, Poland, 24-26 September 2009.
Z. Pietralik, M. Taube, M. Balcerzak, A. Skrzypczak, and M. Kozak, SAXS Studies of DMPC And DPPC-Dimeric Surfactant Lipoplexes, 10th International School and Symposium on Synchrotron Radiation in Natural Science (ISSRNS), Szklarska Poreba, Poland, 6-12 June 2010.
M.A. Pietrzyk, B.J. Kowalski, B.A. Orlowski, R. Nietubyc, K. Nowakowska-Langier, W. Knoff, J. Sadowski, T. Story, and R.L. Johnson, Valence Band of Ge1-x-yMnxEuyTe – a Photoemission Study, XXXIX “Jaszowiec” International School and Conference on the Physics of Semiconductors, Krynica-Zdrój, Poland, 19-24 June 2010.
C. Pistidda, S. Garroni, F. Doci, A. Khandelwal, E. Gil Bardaji, P. Nolis, S. Surinach, M.D. Baro, W. Lohstroh, G. Barkhodarian, M. Fichtner, and M. Dornheim, Synthesis of Amorphous Mg(BH4)2 from MgB2 and H2 at Room Temperature, International Symposium on Metal-Hydrogen Systems (MH2010), Moscow, Russia, 19-23 July 2010.

586 MAX-lab ACTIVITY REPORT 2010
CONFERENCE CONTRIBUTIONS
V. Pogorelov, I. Doroshenko, V. Sablinskas, V. Balevicius, and P. Uvdal, Experimental Modeling of Phase Transition Gas-liquid in Alcohols, Solvay workshop on Molecular complexes in our atmosphere and beyond, Brussels, Belgium, 20-23 April 2010.
V. Pogorelov, I. Doroshenko, P. Uvdal, V. Balevicius, and V. Sablinskas, Temperature Controlled Kinetics of Growing and Relaxation of Alcohol Clusters in Ar Matrix, 5th International Conference Physics of Liquid Matter: Modern Problems, Kyiv, Ukraine, 21-24 May 2010.
V. Pogorelov, I. Doroshenko, V. Balevicius, and V. Sablinskas, Matrix Isolation Study of Nanocluster Structure Formation in Alcohols, Ukrainian-German Symposium on Physics and Chemistry of Nanostructures and on Nanobiotechnology, Beregove, Ukraine, 6-10 September 2010.
V. Pogorelov, І. Doroshenko, and V. Sablinskas, Matrix-isolation Study of the Process of the Formation of Nanocluster Structure of Alcohols, The Modern Problems of Condensed Matter, Kiev, Ukraine, 6-9 October 2010.
V. Pogorelov, I. Doroshenko, V. Balevicius, and V. Sablinskas, Spectral Manifestations of the Clusterization Process in Methanol in the Region of Stretch O-H Vibrations, Basic problems of optics 2010, Saint Petersburg, Russia, 18-22 October 2010.
V.E. Pye and A. Henriksen, The Anaerobic Crystallisation of a Plant Oxidase (ACX1) in Complex with its Substrate, International School and Conference on Crystallization of Biological Macromolecules (ICCBM 13), Trinity College, Dublin, Ireland, 10-16 September 2010.
D.B. Ravnsbæk and T.R. Jensen, In situ SR-PXD Studies of Novel Borohydrides, Meeting for the Nordic hydrogen network spring 2010, Svalbard, Norway, 21 April 2010.
D.B. Ravnsbæk, L.H. Sørensen and T.R. Jensen, Novel Alkali Cadmium Borohydrides, Meeting for the Nordic hydrogen network spring 2010, Svalbard, Norway, 21 April 2010.
D.B. Ravnsbæk, Y. Filinchuk, R. Černý, and T.R. Jensen, Novel Metalborhydrides: Synthesis, Crystal Structures and Thermal Decomposition, International Symposium on Metal-Hydrogen Systems (MH2010), Moscow, Russia, 19-23 July 2010.
D.B. Ravnsbæk, Novel Metalborhydrides: Crystal Chemistry, Synthesis and Thermal Decomposition, 12th European Powder Diffraction Conference (EPDIC-12), Darmstadt, Germany, 27-30 August 2010.
D.B. Ravnsbæk, Y. Filinchuk, R. Černý, and T.R. Jensen, Synthesis, Crystal Chemistry and Thermal Decomposition of Novel Metal Borohydrides, The International Chemical Congress of Pacifi c Basin Societies, Honolulu, Hawaii, USA, 15-20 December 2010.
C. Riedl, C. Coletti, T. Iwasaki, A.A. Zakharov, and U. Starke, Quasi-free Standing Epitaxial Graphene on SiC by Hydrogen Intercalation, 23rd Symposium on Surface Science, St. Christoph, Austria, 7-13 March 2010.
L.H. Rude, B. Richter, and T.R. Jensen, Anion Substitution in Borohydrides, European Workshop on Hydrogen Storage Technologies co-organized by NESSHY, NANOHY, and FLYHY EC projects, Manchester, United Kingdom, 13 January 2010.
L.H. Rude, L.M. Arnbjerg, Y. Filinchuk, H. Grove, M. Sørby, B.C. Hauback, and T.R. Jensen, Tailoring Hydrogen Storage Proporties of LiBH4 by Anionsubstitution, Meeting for the nordic hydrogen network spring 2010, Svalbard, Norway, 21 April 2010.
L.H. Rude, B. Richter, and T.R. Jensen, Anion Substitution in High Capacity Hydrides, FlyHy 4th project meeting, Aarhus, Denmark, 6 June 2010.
MAX-lab ACTIVITY REPORT 2010 587
CONFERENCE CONTRIBUTIONS
L.H. Rude, Y. Filinchuk, M. Sørby, B.C. Hauback, and T.R. Jensen, The Effect of Anion Substitution in Metal Borohydrides, International Symposium on Metal-Hydrogen Systems (MH2010), Moscow, Russia, 19-23 July 2010.
L.H. Rude, Y. Filinchuk, M. Sørby, B. Hauback, F. Besenbacher, and T.R. Jensen, Effect of Anion Substitution in Metal Borohydrides, ACS Fall 2010 National Meeting and Exposition, Boston, Massachusetts, USA, 22-26 August 2010.
L.H. Rude, E. Groppo, L.M. Arnbjerg, Y. Filinchuk, M. Baricco, and T.R. Jensen, Tailoring hydrogen storage properties by anion substitution of the heavier halides, Meeting for the nordic hydrogen network fall 2010, Uppsala, Sweden, 23 November 2010.
J. Rumnieks and K. Tars, Structural Studies of the Read-through Protein from Bacteriophage Q, 42nd Course: Structure and Function from Macromolecular Crystallography: Organisation in Space and Time, Erice, Italy, 3-13 June 2010.
J. Rysz, J. Jaczewska, A. Bernasik, C.M. Björström-Svanström, A. Budkowski, and E. Moons, Self-organization in Multi-component Polymer Films for Electronic Applications, 23rd General Conference of the European Physical Society, Condensed Matter Division (CMD23), Warsaw, Poland, 30 August - 3 September 2010.
M. Sahlberg, Hydrogen Storage in Scandium Based Alloys, 17th International Conference on Solid Compounds of Transition Elements, Annecy, France, 5-10 September 2010.
K. Sakamoto, Peculiar Rashba Spins Originating from the Two-dimensional Symmetry of the Surface, Symposium on Surface and Nano Science 2010, (SSNS10), Shizukuishi, Japan, 15-18 January 2010.
K. Sakamoto, Peculiar Rashba Spins Caused by the Two-dimensional Symmetry of the Surface, 14th Hiroshima International Symposium on Synchrotron Radiation, Higashi-Hiroshima, Japan, 4-5 March 2010.
K. Sakamoto, A. Kimura, T. Oda, K. Miyamoto, T. Kuzumaki, T. Takahashi, J. Fujii, T. Oguchi, and R.I.G. Uhrberg, Rashba Spins on Heavy Elements Adsorbed Silicon Surfaces, 37th International conference on Vacuum Ultraviolet and X-ray Physics (VUVX2010), Vancouver, Canada, 11-16 July 2010.
K. Sakamoto, A. Kimura, T. Oda, K. Miyamoto, T. Kuzumaki, T. Takahashi, J. Fujii, T. Oguchi, and R.I.G. Uhrberg, Peculiar Rashba Spins on Heavy Elements Adsorbed Silicon Surfaces, 18th International Vacuum Congress (IVC18), Bejing, China, 23-27 August 2010.
K. Sakamoto, A. Kimura, T. Oda, K. Miyamoto, T. Kuzumaki, T. Takahashi, J. Fujii, T. Oguchi, and R.I.G. Uhrberg, Peculiar Rashba Spins Caused by the Two-dimensional Symmetry of the Surface, 15th International Conference on Solid Films and Surfaces (ICSFS-15), Beijing, China, 5-10 October 2010.
I. Saldan, J. Bellosta von Colbe, K. Suarez, R. Gosalawit, C. Pistidda, U. Bösenberg, M. Schulze, T. Jensen, Y. Cerenius, K. Taube, and M. Dornheim, Possible Fluorine Substitution for H Atoms ind Li[BH4] and LiH during Hydrogen Absorption and Desorption, International Symposium on Metal-Hydrogen Systems (MH2010), Moscow, Russia, 19-23 July 2010.
I. Saldan, U. Bösenberg, O. Zavorotynska, C. Pistidda, R. Campesi, E. Welter, F. Dolci, P. Moretto, G. Spoto, M. Baricco, J. Bellosta von Colbe, K. Taube, and M. Dornheim, Catalytic Effect on Hydrogen Absorption-desorption for Mixture 2LIH with MgB2 by Titanium Additives, 2010 E-MRS Fall Meeting, Warsaw, Poland, 13-17 September 2010.
A. Sandell, Exploring Transition Metal Oxide Band Gaps with Synchrotron Radiation, XVIII Meeting of the Italian Society for Synchrotron Radiation (SILS XVIII), Padova, Italy, 24-26 June 2010.

588 MAX-lab ACTIVITY REPORT 2010
CONFERENCE CONTRIBUTIONS
A. Sandell, L.E. Walle, D. Ragazzon, A. Borg, and P. Uvdal, Water on Rutile TiO2(110): Growth of the First Layer, European Conference on Surface Science (ECOSS-27), Groningen, The Netherlands, 30 August - 3 September 2010.
K. Schulte, M.L. Ng, R. Balog, L. Hornekær, A. Preobrajenski, N.A. Vinogradov, and N. Mårtensson, Controlling the Hydrogenation of Graphene on the Transition Metals, European Conference on Surface Science (ECOSS-27), Groningen, The Netherlands, 30 August - 3 September 2010.
U. Starke, Bandstructure Manipulation of Epitaxial Graphene on SiC(0001) by Molecular Doping and Hydrogen Intercalation, MRS Meeting, San Francisco, California, USA, 5-9 April 2010.
U. Starke, Structural and Electronic Properties of Epitaxial Graphene on SiC(0001): Growth, Transfer Doping and Hydrogen Intercalation, European Conference on Surface Science (ECOSS-27), Groningen, The Netherlands, 30 August - 3 September 2010.
U. Starke, Structural and Electronic Properties of Epitaxial Graphene on SiC(0001): Growth, Transfer Doping and Hydrogen Intercalation, 2nd International Symposium on the Science and Technology of Epitaxial Graphene, Fernandina Beach, Florida, USA, 14-17 September 2010.
D. Stoltz, A. Önsten, J. Weissenrieder, U.O. Karlsson, and M. Göthelid, SO2 on Fe3O4(100): from Ordered Growth of Ferrous Sulfate to Dry Oxidation to SO4, 18th International Vacuum Congress (IVC18), Bejing, China, 23-27 August 2010.
H. Stålbrand, O. Hekmat, V. Karlsson, J. Kamarauskaite, J. Le Nours, L. Anderson, and L. Lo Leggio, Cellulomonas fimi endo--1,4-mannanase: Substrate Binding and Structure-based Protein Engineering, 40th Danish Crystallographers Meeting and 3rd DANSCATT Meeting, Copenhagen, Denmark, 31 May - 1 June 2010.
S. Surnev, Structure of Zinc Oxide Nanolayers on a Pd(111) Surface: STM and DFT Study, 23rd Surface Science Symposium, St Christoph am Arlberg, Austria, 7-13 March 2010.
S. Surnev, Oxide Nanostructures – Particles, Layered Structures, and Wires, NFN Workshop, Matrei, Austria, 30 June 2010.
S. Surnev, Fabrication of a NiOx Nanodot Superlattice, COST D41 Meeting, Torino, Italy, 7-9 October 2010.
B. Svensson, J.M. Jensen, M.B. Vester-Christensen, P. Hägglund, A. Henriksen, and M. Abou Hachem, Production, Purification, Characterisation and Protein-Protein Interaction Measurements of Barley Limit Dextrinase and Barley Limit Dextrinase Inhibitor, Plant Polysaccharide and Applied Glycoscience Workshop 2010, Tokyo, Japan, 29-31 July 2010.
B. Svensson, J.M. Jensen, M.B. Vester-Christensen, P. Hägglund, A. Henriksen, and M. Abou Hachem, Recombinant Production, Ligand Binding Analysis, Structural Characterization and Protein-Protein Interactions Involving Limit Dextrinase, Limit Dextrinase Inhibitor, and Thioredoxin from Barley, American Association of Cereal Chemists International Meeting 2010, Savannah, Georgia, USA, 24-27 October 2010.

MAX-lab ACTIVITY REPORT 2010 589
CONFERENCE CONTRIBUTIONS
B. Svensson, N. Navrot, F. Yang, K.G. Kirkensgaard, B.C. Bønsager, A. Shahpiri, O. Björnberg, P. Hägglund, A. Henriksen, and C. Finnie, Proteomics of Barley Seeds: Germination; NADPH-Thioredoxin Reductase – Thioredoxin System; Fusarium Infection, 2nd International Symposium on Frontier in Agriculture Proteome Research, Tsukuba, Japan, 18-19 November 2010.
D. Svensson and S. Hansen, Studying Iron Redox Chemistry in the Alternative Buffer Material Experiment Using XANES, 4th International Meeting, Clays in Natural & Engineered Barriers for Radioactive Waste Confi nement, Nantes, France, 29 March - 1 April 2010.
I.-H. Svenum, Ø. Borck, L.E. Walle, K. Schulte, and A. Borg, Adsorption of CO on Ni3Al(111): A Combined Theoretical and Experimental Study, 27th European Conference on Surface Science (ECOSS 27), Groningen, The Netherlands, 29 August - 3 September 2010.
C.A. Sö derberg, R. Sreekanth, G. Isaya, and S. Al-Karadaghi, Metal Dependant Self-assembly of the Yeast Frataxin Homologue, 14th Annual SBNet Conference, Tällberg, Sweden, 11-14 June 2010.
L.H. Sørensen, D.B. Ravnsbæk, Y. Filinchuk, and T.R. Jensen, Synthesis of New Cadmium Borohydrides, Summer School on ”Materials for the hydrogen economy”, Reykjavik, Iceland, 17-21 August 2010.
M. Taube, M. Hilgendorff, Z. Pietralik, M. Giersig, and M. Kozak, SAXS Studies of Fe3O4/SiO2 Nanoparticles for Nanosensing, 10th International School and Symposium on Synchrotron Radiation in Natural Science (ISSRNS), Szklarska Poreba, Poland, 6-12 June 2010.
M. Tchaplyguine, T. Andersson, C. Zhang, S. Svensson, and O. Björneholm, Recent Studies With The Gas-Aggregation Source, International Workshop DyNano-2010, Porticcio, France, 21-25 April 2010.
L.A. Thomsen, Structural and Functional Studies of the Acetylcholine Binding Protein from Lymnaea stagnalis in Complex with Novel Compounds, Gordon Research Conference: Ion Channels 2010, Tilton, New Hampshire, USA, 11-16 July 2010.
M.M.G.M. Thunnissen, T. Ursby, and D.T. Logan, Macromolecular crystallography beam lines at the new synchrotron MAX IV, 10th International Conference on Biology and Synchrotron Radiation, Melbourne, Australia, 15-18 February 2010.
R. Timm, M. Hjort, A. Fian, C. Thelander, E. Lind, J.N. Andersen, L.-E. Wernersson, and A. Mikkelsen, Interface Composition of Atomic Layer Deposited HfO2 and Al2O3 Thin Films on InAs Studied by X-ray Photoemission Spectroscopy, 2010 IEEE 41st Semiconductor Interface Specialists Conference (SISC), San Diego, California, USA, 2-4 December 2010.
N. Torapava and I. Persson, Structures Determination of Hydrated, Hydrolyzed and Solvated Chromium(III) Ions in Solution, 1st Swedish Inorganic Meeting, Oorgdagarna, Uppsala, Sweden, 16-19 June 2010.
N. Torapava, I. Persson, L. Eriksson, and D. Lundberg, Structures of Hydrated and Hydrolyzed Thorium(IV) Determined by EXAFS and LAXS, 1st Swedish Inorganic Meeting, Oorgdagarna, Uppsala, Sweden, 16-19 June 2010.

590 MAX-lab ACTIVITY REPORT 2010
CONFERENCE CONTRIBUTIONS
K.E. Tsitsanou, C.E. Drakou, A. Thireou, E. Eliopoulos, K. Iatrou, and S.E. Zographos, AgamOBP1 is a Molecular Target for the Development of Novel Insect Repellents, 5th Conference of the Hellenic Crystallographic Association, Larissa, Greece, 24-25 September 2010.
C. Ussing, Towards Identification of Key Interactions Determining the Pharmacological Profile of Nicotinic Acetylcholine Receptor Ligands, International School and Conference on Crystallization of Biological Macromolecules (ICCBM 13), Trinity College, Dublin, Ireland, 10-16 September 2010.
C. Ussing, Towards Identification of Key Interactions Determining the Pharmacological Profile of Nicotinic Acetylcholine Receptor Ligands, CoLuAa XIX, Valby, Denmark, 4-5 November 2010.
L.E. Walle, K. Schulte, J. Gustafson, C.J. Weststrate, E. Lundgren, J.N. Andersen, and A. Borg, Oxide Formation and CO Induced Oxide Reduction on the Pd75Ag25(100) Surface, 27th European Conference on Surface Science (ECOSS 27), Groningen, Nederland, 29 August - 3 September 2010.
L.E. Walle, D. Ragazzon, P. Uvdal, A. Borg, and A. Sandell, Experimental Evidence for Mixed Dissociative and Molecular Adsorption of Water on a Rutile TiO2(110) Surface without Oxygen Vacancies, AVS 57th International Symposium and Exhibition, Albuquerque, New Mexico, USA, 17-22 October 2010.
E. Wallén, Insertion Devices for the MAX IV 3 GeV Ring, 1st International Particle Accelerator Conference (IPAC10), Kyoto, Japan, 23-28 May 2010.
S. Watcharinyanon, J.R. Osiecki, C. Virojanadara, R. Yakimova, R.I.G. Uhrberg, and L.I. Johansson, Hydrogen Intercalation of Graphene Grown on 6H-SiC(0001), The 8th European Conference on Silicon Carbide and Related Materials (ECSCRM), Oslo, Norway, 29 August - 2 September 2010.
D. Welner, H.A. Ernst, A.N. Olsen, J.G. Grossmann, K. Skriver, and L. Lo Leggio, Structural Characterization of ANAC019, a Member of the NAC Family of Plant Specific Transcription Factors, 40th Danish Crystallographers Meeting and 3rd DANSCATT Meeting, Copenhagen, Denmark, 31 May - 1 June 2010.
D. Welner, H.A. Ernst, A.N. Olsen, J.G. Grossmann, K. Skriver, and L. Lo Leggio, Structural Characterization of ANAC019, a Member of the NAC Family of Plant Specific Transcription Factors, Gordon Conference: Diffraction Methods In Structural Biology, Lewiston, Maine, USA, 18-23 July 2010.
D. Welner, H.A. Ernst, A.N. Olsen, J.G. Grossmann, K. Skriver, and L. Lo Leggio, Structural Characterization of ANAC019, a Member of the NAC Family of Plant Specific Transcription Factors, CoLuAa XIX, Valby, Denmark, 4-5 November 2010.
R. Venskutonyte, Ligand Binding Core of the Kainate Receptor Gluk3, CoLuAa XIX, Valby, Denmark, 4-5 November 2010.
S. Werin, N. Čutić, M. Eriksson, F. Lindau, and S. Thorin, The MAX-IV Injector as a Soft X-ray FEL Driver, FEL10, Malmö, Sweden, 23-27 August 2010.
M. Weser, A. Generalov, C. Enderlein, S. Böttcher, K. Horn, M. Fonin, and Y.S. Dedkov, Fermi-surface Mapping of Graphene/Ni(111) and Ni/graphene/Ni(111), 74th DPG Meeting, Regensburg, Germany, 21-26 March 2010.
M. Weser, K. Horn, and Y.S. Dedkov, Intercalation of Iron Underneath Graphene on Ni(111): PES and XMCD Study,

MAX-lab ACTIVITY REPORT 2010 591
CONFERENCE CONTRIBUTIONS
74th DPG Meeting, Regensburg, Germany, 21-26 March 2010.
M. Weser, Y. Rehder, K. Horn, M. Sicot, M. Fonin, A. Preobrajenski, E. Voloshina, and Y.S. Dedkov, The XVIII Meeting of the Italian Society for Synchrotron Radiation, 74th DPG Meeting, Regensburg, Germany, 21-26 March 2010.
M. Weser, K. Horn, and Y.S. Dedkov, Intercalation of Iron Underneath Graphene on Ni(111): Photoemission and Magnetic Dichroism Studies, European Conference on Surface Science (ECOSS-27), Groningen, The Netherlands, 30 August - 3 September 2010.
M.B. Vester-Christensen, M. Abou Hachem, B. Svensson, and A. Henriksen, Barley Limit Dextrinase Structure and its Implications for Enzyme Activity, Plant Polysaccharide and Applied Glycoscience Workshop 2010, Tokyo, Japan, 29-31 July 2010.
M. Weston, A.J. Britton, and J.N. O’Shea, Charge Transfer Dynamics of Model Charge Transfer Centres of a Multi-centre Water Splitting Dye Complex on Rutile TiO2(110), Condensed Matter and Materials Physics (CMMP10), Warwick, United Kingdom, 14-16 December 2010.
N.A. Vinogradov, M.L. Ng, A. Zakharov, E. Lundgren, N. Mårtensson, and A. Preobrajenski, h-BN Nanowaves on the Metal Surfaces, European Conference on Surface Science (ECOSS-27), Groningen, The Netherlands, 30 August - 3 September 2010.
D. Vlachos, M. Kamaratos, and S.D. Foulias, Lead Nanostructures on Reconstructed by Indium Si(111) Surfaces, 7th International Conference on Nanosciences & Nanotechnologies (NN10), Ouranoupolis, Greece, 12-14 July 2010.
D. Vlachos, Lead Growth on Reconstructed by Indium Si(111)3×3 and 4×1 – In Surfaces, 26th Panhellenic Conference on Solid State Physics & Materials Science, Ioannina, Greece, 26-29 September 2010.
E. Voloshina, S. Böttcher, M. Weser, K. Horn, Y.S. Dedkov, and B. Paulus, Combined Photoelectron Spectroscopy and ab initio Studies of Water Adsorption on Graphene/Ni(111), k 2010 Conference, Berlin, Germany, 12-16 September 2010.
A. Wolska, M.T. Klepka, K. Lawniczak-Jablonska, D. Arvanitis, and A. Misiuk, EXAFS and XMCD Investigations on the Mn+ Implanted Silicon Crystals, 10th International School and Symposium on Synchrotron Radiation in Natural Science (ISSRNS), Szklarska Poreba, Poland, 6-12 June 2010
M. Wu, H. Hansson, M. Sandgren, and J. Ståhlberg, Sugar Binding in Cellulase Cel6B from the Filamentous Bacterium Thermobifida fusca Probed by Catalytic Mutants, 14th Swedish Structural Biology Network Meeting, Tällberg, Sweden, 11-14 June 2010.
S. Yu, S. Ahmadi, M. Zuleta, H. Tian, K. Schulte, A. Pietzsch, F. Hennies, J. Weissenrieder, X. Yang, and M. Göthelid, Molecular Interaction And Charge Transfer Dynamics of Metal-free Organic Dye Adsorbed on TiO2, 18th International Vacuum Congress (IVC18), Bejing, China, 23-27 August 2010.
A.A. Zakharov, C. Virojanadara, and L.I. Johansson, 3D Band Mapping by Using X-ray PEEM, LEEM-PEEM 7, New York, USA, 8-13 August 2010.
A.A. Zakharov, K.V. Emtsev, and U. Starke, Decoupling Epitaxial Graphene from SiC(0001) Surface by a Ge Buffer Layer, LEEM-PEEM 7, New York, USA, 8-13 August 2010.

592 MAX-lab ACTIVITY REPORT 2010
CONFERENCE CONTRIBUTIONS
Y. Zhan, E. Carlegrim, and M. Fahlman, Spinterface: The Role of Interaction at Organic/ferromagnets Interface, 3rd Topical Meeting on Spins in Organic Semiconductors (SPINOS III), Amsterdam, The Netherlands, 30 August - 3 September 2010.
Y. Zhan, E. Carlegrim, and M. Fahlman, Spinterface: The Role of Interaction at Organic/ferromagnets Interface, 5th International Meeting on Molecular Electronics (ElecMol’10), Grenoble, France, 6-10 December 2010.
C. Zhang, T. Andersson, M. Tchaplyguine, M. Huttula, M.-H. Mikkelä, H. Aksela, S. Svensson, and O. Björneholm, Ionic-bonding-model Tested in a Photoelectron Spectroscopy Experiment on Free ~1 nm Alkali-halide Clusters, International Workshop DyNano-2010, Porticcio, France, 21-25 April 2010.
H.M. Zhang, L.K.E. Ericsson, and L.S.O. Johansson, Photoemission and NEXAFS Studies of PTCDA on Sn/Si(111)2sqrt3x2sqrt3, 18th International Vacuum Congress (IVC-18), International Conference on Nanoscience and Technology (ICN+T 2010), 14th International Conference on Surfaces Science (ICSS-14), Beijing, China, 23-27 August 2010.
M. Zharnikov, Characterization of Self-assembled Monomolecular Films by Advanced Spectroscopic Techniques, 30th European Congress on Molecular Spectroscopy (EUCMOS), Florence, Italy, 29 August - 3 September 2010.
Y. Znamenskaya, J. Engblom, J. Sotres, T. Arnebrant, and V. Kocherbitov, Effect of Hydration on Structural and Thermodynamic Properties of Mucin, 24th European Colloid and Interface Society Conference (ECIS), Prague, Czech Republic, 5-10 September 2010.
Y. Znamenskaya, J. Engblom, J. Sotres, T. Arnebrant, and V. Kocherbitov, Effect of Hydration on Structural and Thermodynamic Properties of Mucin, 6th Annual Workshop of Biofi lms – Research Center for Biointerfaces, Malmö, Sweden, 13-15 October 2010.
S.E. Zographos, Structural Studies of hCINAP: An Atypical Mammalian Nuclear Adenylate Kinase with ATPase Activity, 3rd Swedish-Hellenic Life Science Research Conference, Athens, Greece, 25-27 March 2010.
A. Önsten, D. Stoltz, J. Weissenrieder, S. Yu, M. Göthelid, and U.O. Karlsson, H2O and SO2 Interactions with Oxide Surfaces, 18th International Vacuum Congress (IVC18), Bejing, China, 23-27 August 2010.

MAX-lab ACTIVITY REPORT 2010 593
CONFERENCE CONTRIBUTIONS