
3._Book_2_69_positions.pdf - Lund University Research Portal
Upload
khangminh22Category
view
2download
0
Website www.ehl.lu.se
Master programme in Economic Growth, Innovation and Spatial Dynamics
Innovation in the Automotive Sector
Revealing and Comparing Innovative Performance of
Major Car Manufacturers in the Years 2000 – 2015.
Vincent Pochhammer
Abstract: The automotive industry, a matured and vital global sector, is currently facing the biggest upheaval so far in the necessity to emancipate itself from fossil fuels. This moment before technical revolution is used for a detailed comparison of innovative performance of the sector in the last 15 years. With innovation being interpreted along the lines of technical progress in key variables, this thesis uses a technometric approach along the idea of trajectories of technological development to gather a comprehensive database, a descriptive and empirical set of data on innovation in the sector is shown, revealing the direction of technical change and the stable nature of innovation overall, but also surprising performances by the manufacturers. Furthermore, the technometric approach and the focus on the manufacturers’ perspective of this descriptive study aims at closing a gap to previous research on innovation in the automotive sector, focussing on the public sector perspective and mechanisms to externally influence innovation.. Key words: innovation, automotive sector, technometric data
EKHM51 Master thesis (15 credits ECTS) June 2016 Supervisor: Josef Taalbi Examiner: Word Count: 23462

i
Contents
List of tables ............................................................................................................................................ iii
List of figures ........................................................................................................................................... iv
1 Introduction ..................................................................................................................................... 1
1.1 Background .............................................................................................................................. 1
1.2 Objective.................................................................................................................................. 2
1.3 Outline ..................................................................................................................................... 4
2 Previous Research, Theory and Methodological Framework ......................................................... 5
2.1 Previous Research concerning Innovation in the Automotive Industry .................................. 6
2.2 Measuring Innovation ............................................................................................................. 9
2.2.1 R&D Data ....................................................................................................................... 11
2.2.2 Patent Data .................................................................................................................... 12
2.2.3 Bibliometric Data ........................................................................................................... 13
2.2.4 Database-resting Indicators .......................................................................................... 13
2.2.5 Technometric Data ........................................................................................................ 14
2.3 Technological Paradigms and Trajectories ............................................................................ 16
3 Data and Methods ......................................................................................................................... 19
3.1 Innovation in the Automotive Sector .................................................................................... 19
3.2 Technical Performance .......................................................................................................... 21
3.3 External Factors ..................................................................................................................... 24
3.3.1 Emission standards ........................................................................................................ 24
3.3.2 Fuel prices ...................................................................................................................... 25
3.4 Patenting Data ....................................................................................................................... 25
4 Results ........................................................................................................................................... 27
4.1 Innovation in the Automotive Sector .................................................................................... 27
4.2 Technical Performance .......................................................................................................... 40
4.2.1 BMW .............................................................................................................................. 40
4.2.2 Fiat ................................................................................................................................. 41
4.2.3 Ford................................................................................................................................ 43
4.2.4 Honda ............................................................................................................................ 45
4.2.5 Hyundai .......................................................................................................................... 46
4.2.6 Jaguar............................................................................................................................. 47
4.2.7 Mazda ............................................................................................................................ 49

4.2.8 Mercedes-Benz .............................................................................................................. 50
4.2.9 Nissan ............................................................................................................................ 51
4.2.10 Opel ............................................................................................................................... 53
4.2.11 Peugeot.......................................................................................................................... 54
4.2.12 Renault .......................................................................................................................... 55
4.2.13 Toyota ............................................................................................................................ 56
4.2.14 Volvo .............................................................................................................................. 57
4.2.15 Volkswagen .................................................................................................................... 58
4.3 External Factors ..................................................................................................................... 59
4.3.1 Emission standards ........................................................................................................ 59
4.3.2 Fuel prices ...................................................................................................................... 60
4.4 Patenting Data ....................................................................................................................... 63
5 Discussion & Further Research ...................................................................................................... 66
6 Conclusion ..................................................................................................................................... 68
7 Bibliography ................................................................................................................................... 70
8 Appendices .................................................................................................................................... 73
8.1 Technical Performance Figures ............................................................................................. 73
8.1.1 BMW .............................................................................................................................. 73
8.1.2 Fiat ................................................................................................................................. 74
8.1.3 Ford................................................................................................................................ 76
8.1.4 Honda ............................................................................................................................ 77
8.1.5 Hyundai .......................................................................................................................... 79
8.1.6 Jaguar............................................................................................................................. 80
8.1.7 Mazda ............................................................................................................................ 81
8.1.8 Mercedes ....................................................................................................................... 83
8.1.9 Nissan ............................................................................................................................ 84
8.1.10 Opel ............................................................................................................................... 85
8.1.11 Peugeot.......................................................................................................................... 87
8.1.12 Renault .......................................................................................................................... 88
8.1.13 Toyota ............................................................................................................................ 90
8.1.14 Volvo .............................................................................................................................. 91
8.1.15 VW ................................................................................................................................. 92

List of tables
Table 1: Average consumption (in litre/100 km per 100 kW engine power) ........................................ 30
Table 2: Average power (in kW per 1 litre displacement) ..................................................................... 31

List of figures
Figure 1: Fuel consumption in litre/100 km per 100 kW engine power per manufacturer, 2000 - 2015
............................................................................................................................................................... 28
Figure 2: Engine power in kW per 1 litre displacement per manufacturer, 2000 – 2015 ..................... 29
Figure 3: Overall annual percentage change in both consumption and power .................................... 32
Figure 4: Consumption, all manufacturers, all classes .......................................................................... 33
Figure 5: Power, all manufacturers, all classes ..................................................................................... 33
Figure 6: Consumption, all manufacturers, class B ............................................................................... 34
Figure 7: Power, all manufacturers, class B........................................................................................... 34
Figure 8: Consumption, all manufacturers, class C ............................................................................... 36
Figure 9: Power, all manufacturers, class C ........................................................................................... 36
Figure 10: Consumption, all manufacturers, class D ............................................................................. 37
Figure 11: Power, all manufacturers, class D ........................................................................................ 37
Figure 12: Consumption, all manufacturers, class E ............................................................................. 38
Figure 13: Power, all manufacturers, class E ......................................................................................... 38
Figure 14: Consumption, BMW, all classes ........................................................................................... 40
Figure 15: Power, BMW, all classes ....................................................................................................... 40
Figure 16: Consumption, Fiat, all classes ............................................................................................... 42
Figure 17: Power, Fiat, all classes .......................................................................................................... 42
Figure 18: Consumption, Ford, all classes ............................................................................................. 43
Figure 19: Power, Ford, all classes ........................................................................................................ 43
Figure 20: Consumption, Honda, all classes .......................................................................................... 45
Figure 21: Power, Honda, all classes ..................................................................................................... 45
Figure 22: Consumption, Hyundai, all classes ....................................................................................... 46
Figure 23: Power, Hyundai, all classes................................................................................................... 46
Figure 24: Consumption, Jaguar, all classes .......................................................................................... 48
Figure 25: Power, Jaguar, all classes ..................................................................................................... 48
Figure 26: Consumption, Mazda, all classes .......................................................................................... 49
Figure 27: Power, Mazda, all classes ..................................................................................................... 49
Figure 28: Consumption, Mercedes, all classes .................................................................................... 50
Figure 29: Power, Mercedes, all classes ................................................................................................ 50
Figure 30: Consumption, Nissan, all classes .......................................................................................... 52
Figure 31: Power, Nissan, all classes ..................................................................................................... 52
Figure 32: Consumption, Opel, all classes ............................................................................................. 53
Figure 33: Power, Opel, all classes ........................................................................................................ 53
Figure 34: Consumption, Peugeot, all classes ....................................................................................... 54
Figure 35: Power, Peugeot, all classes .................................................................................................. 54
Figure 36: Consumption, Renault, all classes ........................................................................................ 55
Figure 37: Power, Renault, all classes ................................................................................................... 55
Figure 38: Consumption. Toyota, all classes ......................................................................................... 56
Figure 39: Power, Toyota, all classes ..................................................................................................... 56
Figure 40: Consumption. Volvo, all classes ........................................................................................... 57
Figure 41: Power, Volvo all classes ........................................................................................................ 57
Figure 42: Consumption, Volkswagen, all classes ................................................................................. 58
Figure 43: Power, Volkswagen, all classes............................................................................................. 58
Figure 44: European Emission Standards and average fuel consumption ............................................ 59
Figure 45: Fuel prices, according to types (nominal); Source: European Environment Agency (2016),
own illustration ..................................................................................................................................... 62

Figure 46: Fuel prices, real versus nominal, * base year 2005; Source: European Environment Agency
(2016), own illustration ......................................................................................................................... 62
Figure 47: Overall patenting activity, all manufacturers, stacked......................................................... 64
Figure 48: Consumption, BMW, class C ................................................................................................. 73
Figure 49: Power, BMW, class C ............................................................................................................ 73
Figure 50: Consumption, BMW, class D ................................................................................................ 73
Figure 51: Power, BMW, class D ............................................................................................................ 73
Figure 52: Consumption, BMW, class E ................................................................................................. 74
Figure 53: Power, BMW, class E ............................................................................................................ 74
Figure 54: Consumption, Fiat, class B .................................................................................................... 74
Figure 55: Power, Fiat, class B ............................................................................................................... 74
Figure 56: Consumption, Fiat, class C .................................................................................................... 75
Figure 57: Power, Fiat, class C ............................................................................................................... 75
Figure 58: Consumption, Fiat, class D ................................................................................................... 75
Figure 59: Power, Fiat, class D ............................................................................................................... 75
Figure 60: Consumption, Ford, class B .................................................................................................. 76
Figure 61: Power, Ford, class B .............................................................................................................. 76
Figure 62: Consumption, Ford, class C .................................................................................................. 76
Figure 63: Power, Ford, class C .............................................................................................................. 76
Figure 64: Consumption, Ford, class D .................................................................................................. 77
Figure 65: Power, Ford, class D ............................................................................................................. 77
Figure 66: Consumption, Honda, class B ............................................................................................... 77
Figure 67: Power, Honda, class B .......................................................................................................... 77
Figure 68: Consumption, Honda, class C ............................................................................................... 78
Figure 69: Power, Honda, class C .......................................................................................................... 78
Figure 70: Consumption, Honda, class D ............................................................................................... 78
Figure 71: Power, Honda, class D .......................................................................................................... 78
Figure 72: Consumption, Hyundai, class B ............................................................................................ 79
Figure 73: Power, Hyundai, class B ........................................................................................................ 79
Figure 74: Consumption, Hyundai, class C ............................................................................................ 79
Figure 75: Power, Hyundai, class C ........................................................................................................ 79
Figure 76: Consumption, Hyundai, class D ............................................................................................ 80
Figure 77: Power, Hyundai, class D ....................................................................................................... 80
Figure 78: Consumption, Jaguar, class D ............................................................................................... 80
Figure 79: Power, Jaguar, class D .......................................................................................................... 80
Figure 80: Consumption, Jaguar, class E ............................................................................................... 81
Figure 81: Power, Jaguar, class E ........................................................................................................... 81
Figure 82: Consumption, Mazda, class B ............................................................................................... 81
Figure 83: Power, Mazda, class B .......................................................................................................... 81
Figure 84: Consumption, Mazda, class C ............................................................................................... 82
Figure 85: Power, Mazda, class C .......................................................................................................... 82
Figure 86: Consumption, Mazda, class D............................................................................................... 82
Figure 87: Power, Mazda, class D .......................................................................................................... 82
Figure 88: Consumption, Mercedes, class C .......................................................................................... 83
Figure 89: Power, Mercedes, class C ..................................................................................................... 83
Figure 90: Consumption, Mercedes, class D ......................................................................................... 83
Figure 91: Power, Mercedes, class D ..................................................................................................... 83
Figure 92: Consumption, Mercedes, class E .......................................................................................... 84
Figure 93: Power, Mercedes, class E ..................................................................................................... 84

Figure 94: Consumption, Nissan, class B ............................................................................................... 84
Figure 95: Power, Nissan, class B .......................................................................................................... 84
Figure 96: Consumption, Nissan, class C ............................................................................................... 85
Figure 97: Power, Nissan, class C .......................................................................................................... 85
Figure 98: Consumption, Opel, class B .................................................................................................. 85
Figure 99: Power, Opel, class B ............................................................................................................. 85
Figure 100: Consumption, Opel, class C ................................................................................................ 86
Figure 101: Power, Opel, class C ........................................................................................................... 86
Figure 102: Consumption, Opel, class D ................................................................................................ 86
Figure 103: Power, Opel, class D ........................................................................................................... 86
Figure 104: Consumption, Peugeot, class B .......................................................................................... 87
Figure 105: Power, Peugeot, class B ...................................................................................................... 87
Figure 106: Consumption, Peugeot, class C .......................................................................................... 87
Figure 107: Power, Peugeot, class C ...................................................................................................... 87
Figure 108: Consumption, Peugeot, class D .......................................................................................... 88
Figure 109: Power, Peugeot, class D ..................................................................................................... 88
Figure 110: Consumption, Renault, class B ........................................................................................... 88
Figure 111: Power, Renault, class B ...................................................................................................... 88
Figure 112: Consumption. Renault, class C ........................................................................................... 89
Figure 113: Power, Renault, class C....................................................................................................... 89
Figure 114: Consumption, Renault, class D ........................................................................................... 89
Figure 115: Power, Renault, class D ...................................................................................................... 89
Figure 116: Consumption, Toyota, class B ............................................................................................ 90
Figure 117: Power, Toyota, class B ........................................................................................................ 90
Figure 118: Consumption, Toyota, class C............................................................................................. 90
Figure 119: Power, Toyota, class C ........................................................................................................ 90
Figure 120: Consumption, Toyota, class D ............................................................................................ 91
Figure 121: Power, Toyota, class D ....................................................................................................... 91
Figure 122: Consumption, Volvo, class D .............................................................................................. 91
Figure 123: Power, Volvo, class D.......................................................................................................... 91
Figure 124: Consumption, Volvo, class E ............................................................................................... 92
Figure 125: Power, Volvo, class E .......................................................................................................... 92
Figure 126: Consumption, Volkswagen, class B .................................................................................... 92
Figure 127: Power, Volkswagen, class B ................................................................................................ 92
Figure 128: Consumption, Volkswagen, class C .................................................................................... 93
Figure 129: Power, Volkswagen, class C ................................................................................................ 93
Figure 130: Consumption, Volkswagen, class D .................................................................................... 93
Figure 131: Power, Volkswagen, class D ............................................................................................... 93

1
1 Introduction
1.1 Background
When Karl Benz set out to take his new invention, the ‘Patent-Motorwagen’, for a first small trip in
the streets of Mannheim in 1886, he most likely was not aware of the success story that would
unfold from this initial impulse (von Fersen, 1986). In the following decades, a vast surge in
development characterised the evolving automotive industry, transforming it from a group of small
experimental backyard workshops to a ubiquitous global industry of major importance nowadays. It
is safe to say that only few other innovations have shaped and influenced the twentieth century in
the way the car has. Along its path, the automotive industry has been pioneering in major industrial
innovations and its products, shifting from luxury goods for the rich towards affordable utilities for
the general public, became icons for generations, resulting in an unprecedented individual mobility,
therefore laying one of the cornerstones of today’s lifestyle. Today, the automotive sector globally
generates a total revenue of USD 3.5 trillion and in the European Union alone provides jobs for 12
million people and accounts for 4% of the GDP (European Commission, 2012; McKinsey, 2016).
Despite this 130 years of remarkable success so far, the industry is now facing what probably is the
biggest transformation process since its invention, and just as in 1886, we can only speculate on how
the next decades will shape the automotive sector. Although studies indicate a potential to almost
double the revenue in the industry, they also emphasise the necessity of the industry to transform
vastly in order to achieve this (McKinsey, 2016). Considering the environmental problems resulting
from an ever-growing population using cars that burn increasingly scarce fossil fuels, there is a
growing pressure within the industry to adapt to these changing conditions. The problem with clean,
renewable alternatives so far has mainly been the resulting cutbacks in performance data, operator
friendliness and especially affordability. A modern fossil-fuelled car can go at high speeds for several
hundreds of kilometres and conveniently be refuelled in a close-knit network of petrol stations within
minutes, whereas for example electric cars can only high travelling speed or range or quick recharge,
but not all three at once. This, in combination with a rather pronounced pressure to consolidate led
to a situation where it evidently did not seem economically appealing for the established
manufacturers to take the lead in a radical technology shift towards alternative propulsion methods
and develop and offer an appropriate product, as sales would suffer from its inadequacies and it is
only recently that this is apparently changing, due to the pressure of new innovative pioneers such as
Tesla. Instead, the answer of the automotive industry to the changing circumstances has for many

2
years been to stick with conventional propulsion and channelling efforts in increasing efficiency. This
special situation, with an imminent paradigm change in drive technology ahead and a preceded
competition in further innovating conventional technologies, offers an interesting opportunity to
compare the performance of the automotive manufacturers with each other on a larger scale, before
the industrywide conversion towards alternative drive technologies sets in and will distort the
picture.
The selection of this worthwhile period to look into the innovative performance of an interesting key
industry will furthermore be combined with the goal to attempt insights from a new perspective to
complete the overall picture of innovation in the sector. So far, research on innovation in the
automotive sector has been dominated by providing the perspective of the public sector in an
attempt to understand the theoretical connections allowing innovative processes to be influenced
and guided. This extensive theoretical research in understanding the mechanisms occurring before
the ‘black box’ of innovation processes, i.e. input, so far lacks an appropriate counterpart of
understanding the results, i.e. the ‘black box’ output. In using a technometric approach and providing
comprehensive data on innovative performance along the lines of technical improvement, this work
can provide a much clearer picture in terms of actual outcomes. While patenting data or database-
resting indicators can map major leaps innovation activity, it lacks the ability to show actual progress
in terms of outcomes. Similarly, R&D data only provides the amount of input, merely allowing a
rough estimation of resulting innovation. Here, given the technical nature of the automotive industry
and cars possessing a clear set of vital technical characteristics to be considered, in applying a
technometric approach, a more accurate insight based on technical figures being the actual
outcomes of innovative processes can be provided. In doing so, this work contributes to closing the
gap to the more inaccurate indicators previously used to capture innovation in this sector.
1.2 Objective
The aim of this study is to identify innovative potential of the major car manufacturers by revealing
the progress in technical performance and compare them with each other. The main research
question is:
What was the innovative performance of major international car manufacturers in the period 2000 -
2015 and how did they compare to each other?
In doing so, innovation will be assessed from a different perspective in this work. As shown in 2.1,
previous research on innovation in the automotive sector is primarily based on the public

3
perspective, focussing on understanding the effects of external factors such as policies on direction
and scope of innovation processes within the industry. In this work, however, the perspective of the
firms and the provision of historical data prevails. As opposed to previously used indicators to assess
innovation in the industry such as patenting data, a technometric approach will be used where
innovation is defined along the lines of improvements in specific technological characteristics. With
this approach, a comprehensive database is constructed, providing a descriptive and empirical
overview of innovation data across the industry from a new angle. This work has to be considered as
an initial step towards adding a new perspective to innovation research in this sector, on which
further steps of more in-depth analysis of results could follow, which is why the creation of the
database, the provision of the data and the resulting descriptive and empirical nature of the work
predominates.
For the purpose of answering the main research question, it also has to be answered what progress
in product specifications will be considered major innovations by identifying the underlying driving
forces that shape the requirements in the products in order to define ‘innovation’ in this context.
This study also compares external factors, such as fuel prices and environmental policies, to the
developments in terms of technical performance in order to analyse the determinants of the path of
technological progress. Furthermore, the question of comparative performance has to be answered
in the construction of a trajectory of technological development of the vital variables in order to
obtain a wide comparability across this rather heterogeneous industry. Also, a comparison of the
actual observed innovative performance of an individual firm with the patent activity as another
indicator of innovative activity will be carried out. This leads to, besides the main research question,
to the following three sub-questions:
1. In terms of technical variables, what core characteristics of cars were targeted by innovation
processes in the automotive sector in the relevant period and what was the direction of this
technological change in the period?
2. How did major external factors shape the technical development of cars in that period?
3. To what extent is the observed innovative performance related to the corresponding
patenting activity of the manufacturer in this period?

4
1.3 Outline
After this introductory chapter, the theoretical fundaments will be covered in Chapter 2, including
the main problem with measuring innovation due to the inability to measure innovation in a
standardised way. This problem will be addressed in the first part of Chapter 3, where the major
parameters to be measured and compared will be determined. These parameters will then be
collected and processed to ensure comparability across different car manufacturers and models in
order to show the innovative performance based on. Here, the construction of the database is also
explained, providing insights into the selection and grouping as well as the initial processing of the
data in preparation for the results. From this raw data, a trajectory of technological progress is
composed to visualise the innovative performance of the manufacturers. Also, the individual patent
activity and major external factors are mapped for a comparison with the observed progress from
the technometric approach. The results are collectively presented in Chapter 4, both generally and
also manufacturer-specific. According to the nature of this work, the main focus here lies on the data
gathered by the technometric approach. Subsequently, the findings will be discussed along with
ideas for improvement in further research in Chapter 5. The final Chapter 6 provides a conclusion to
sum up the study. In the Appendix, further results in more detail and grouped by the manufacturers
are shown.

5
2 Previous Research, Theory and Methodological Framework
In this chapter, a brief overview will be given on the previous research concerning innovation in the
automotive industry. Here, it will be revealed that previous research focussed on understanding the
mechanisms of external factors influencing innovative processes within the industry. This
corresponds to the tendency of previous research in examining innovative processes from the
perspective of the public sector, aiming at revealing setscrews to gain influence on the innovation
processes occurring detached and internally within the industry. This indeed is a fruitful field of
research and to reveal the underlying mechanisms to influence or even steer innovation processes
poses an appealing goal for the public, however this leads to a certain bias in research on this topic
due to the focus on one perspective. Furthermore, as will be elaborated afterwards, innovation as a
process is challenging to capture and measure due to its, broadly speaking, nature as being the
emergence of the new and unprecedented. Hence, approaches to measure innovation generally use
auxiliary variables to record innovation. These auxiliary variables could either be located before the
mysterious process of innovation, such as R&D expenses, or afterwards, such as the analysis of
technical data of products. As becomes apparent, in using variables prior to the actual innovation
process, a stronger degree of estimation results as to how strong the variable and innovation are
connected, whereas analysing variables post-innovation gives a clearer picture of the occurred
amount of innovation. Here lies a weakness of previous research concerning innovation in the
automotive sector, as the usage of indicators such as patenting data or R&D expenses results in a
higher degree of uncertainty. The gap that results from this in combination with the tendency of
previous research to aim at understanding the mechanisms prior to the innovation process to reveal
measures of influences, will be tackled by this work. Here, the focus will lie on the perspective of the
manufacturers and a technometric approach is used to benefit from the technical characteristics of
cars to provide a more accurate picture of innovation in relying on actual technical figures of the
products instead of more indirect indicators leading to a higher degree of uncertainty.
Hence, after giving a brief overview of the previous research on innovation in the automotive sector,
a fundamental overview on the problems and approaches on measuring innovation is provided, also
explaining the advantages and drawbacks of the different approaches more detailed. From this, the
technometric approach and Dosi’s concept of technological trajectories, used in this work as the
basis to reveal the direction of technological change and hence as a measure to reveal and compare
the innovative performance of the manufacturers, is introduced.

6
2.1 Previous Research concerning Innovation in the Automotive Industry
As mentioned in 1.2, the previous research concerning innovation in the automotive industry is
primarily concerned with the public perspective and the understanding of externally influencing
innovation processes in the industry. The relation between external factors and innovative processes
within the industry, providing the public sector with leverage to partially influence the path of
innovation dominates the research. In this work however, both an unusual angle and approach are
chosen. Neither the focus on the manufacturers nor the technometric approach to gather technical
data in a database carried out in this work are the typical approaches in this field. Hence, the
previous research shows no direct predecessor on which this work could build in terms of
methodology or perspective, but rather a list of research that approached the topic innovation in the
automotive sector from the more conservative point of view. Nevertheless, although not using the
same approaches as this work, it still will be briefly discussed here to provide an overview of the
current research on this matter.
Probably due to its interesting nature as an industry that saw its growth from the gentle beginnings
at the start of the significant twentieth century via the transformation to one of the key industries
shaping this century – while continuously relying on the same fundamental technical principle –
towards the major player of today facing fundamental restructurings, the automotive industry can be
considered a fruitful field for academic research. Parallel to the maturing of the academic
understanding of innovative processes and concepts, the automotive industry grew up, providing an
interesting research field. It primary a technical sector, but with strong influences of softer factors
such as design, it is subject to a vast catalogue of public influences in shape of policies and strong
demand forces, while satisfying the basic need for mobility and, as a symbol of individual mobility,
being attributed to the democratisation of wealth from the post-war period onwards. Yet, more
recently, it is also strongly being attributed with the malign man-made effect on global climate,
leading to an increasing outside pressure on the industry to change. This interplay of various factors,
from internal, rather individually economically motivated, to external, rather aiming at public
welfare, in shaping the development of the industry, is a prime opportunity to reveal the
mechanisms of innovation.
It comes as no surprise that a large portion of the research on innovation in the automotive sector is
aiming at understanding the effectiveness of externally influencing or even controlling the innovative
path of the industry. The public side has a substantial interest in revealing how to guide an industry
with adverse effects such as the carbon-based automotive sector towards an ecologically sustainable
alternative. The fundamental setscrews that are agreed to be at the public’s disposal by most

7
researchers in this field can be grouped into policies, which directly affect the producers in setting
immediate limits in certain factors, or indirect measures, resulting in effects such as increases in fuel
prices, channelling the pressure via the consumer and his demand forces. A comprehensive overview
of the different approaches of recent research in terms of induced innovation in the automotive
sector can be found in the informative work of Sauchanka (2015) that will briefly be explained here.
Crabb and Johnson (2010) examined the relation of patent data and oil prices in the period of 1980 –
1999, i.e. after the oil crises of the 1970s and the beginning of the formation of an ecologic
consciousness and also consider the role of American emission standards (CAFE). While they indeed
found empirical evidence for high oil prices affecting innovation, hinting towards the induced
innovation theory, they also revealed the emission policies of having no empirical influence on the
innovation. Haščič, de Vries, Johnstone and Medhi (2009) conducted a study focussing on the
patenting behaviour in developed countries and the effects of external factors fuel prices and policies
on the innovation processes. As opposed to Crabb and Johnson, they distinguish innovation between
the two groups of internal, i.e. technology within the internal combustion engine itself, and
technologies post-combustion, such as emission control measures. Their aim was to reveal possible
differences in external measures affecting innovation in both technologies and indeed, they found
that fuel prices had a strong influence on the internal technologies, whereas policies had a significant
effect on external, or post-combustion technologies. What seems surprising at first is proposed by
them in the difference in benefits: while internal technologies, aiming at consuming lower fuel, might
also lead to a reduction in attributed costs such as maintenance, they result in both public and
private benefit, while external technologies, mainly focussing on transforming the same amount of
fuel used to an environmentally cleaner emission will only result in public benefit. The intriguing
thought here is that by consciously selecting the right set of measures, either direct ones through
policies or indirect ones through taxation and resulting rise in fuel prices, the different benefits could
be selectively used to focus innovation in specific, desired technologies and thus be used to steer
industrial development. These findings however are challenged by the work of Vollebergh (2010),
who himself examined the effect of both policies and fuel prices on innovation relating to the
internal combustion engine, however even further subdividing the different areas of technical
innovation. While he shows an effect of policy measures on all areas at a different extent, most
notably he registers a negative effect of rising fuel prices and innovation in certain areas. This
surprising result of an increase in fuel price decreasing innovative activity is the opposite of Haščič et
al.’s findings. A possible explanation delivered by Vollebergh to this phenomenon is his
argumentation that an increase in fuel prices would lead to consumer demand dropping and
subsequently adapted consumer behaviour in switching to either more environment-friendly
products or decreasing the use of their existing products, both leading to a decrease in overall

8
emissions. He argues that the drop in overall emissions also decreases the incentives to innovate in
these areas, resulting in the findings he registered.
Taking a slightly different approach and focussing more on further elaborating the subdivision of the
technical areas being objective of the innovative processes, Aghion, Dechezlepêtre, Hemous, Martin
and van Reenen (2012) analyse the innovative activity on firm level while distinguishing between
‘dirty’ and ‘clean’ technologies. Here, ‘dirty’ means technologies being related to the fossil fuelled
internal combustion engine, while ‘clean’ technologies are related to eco-friendly alternative
propulsion systems and both are perceived by them as substitutes and the effects of tax-included
fuel price changes. Their work shows the path dependency of a firm in proving that firms tend to
stick to former decisions, which is corresponding to the focussing effect mentioned in Dosi’s work,
meaning a firm with a long history of development in ‘dirty’ technologies will tend to remain with
these technologies. They also find evidence for an influence of fuel price changes on both dirty and
clean technologies, leading them to their conclusion of fuel prices not being high enough to entirely
discourage the further innovation in dirty technologies.
Bergek, Berggren and the KITE Research Group (2013) of Sweden’s Linköping University take a more
pronounced look at the various forms of environmental policy instruments and their effect on the
innovative processes based on the example of the automotive and the energy sector. After defining
main types of policy instruments, they find evidence that general economic instruments promote
incremental innovation, whereas radical innovation is enforced by technology-specific instruments.
This adds to the results of the other mentioned papers, revealing the potential power in skilful policy
making as a steering device of an industry as important as the automotive sector. Whether all
specific results from the papers are considered final and universally accurate or not, they still indicate
the strong dependency of the industry on external factors. Therefore, in this paper, a look into the
major external factors already mentioned in these papers, namely fuel prices and emission policies
will be taken in order to elaborate the influence of these factors on the observed innovative
performance.
Finally, Zapata and Nieuwenhuis (2010) analyse the origins of major automotive innovations as well
as the causes for their industry-wide spread. While they elaborate that most fundamental
innovations have their roots in motorsports applications, they find evidence that at least since the
1960s the spread of innovations to broad road car usage has been influenced by governmental
policymaking, further stressing the importance of policies in influencing innovations in the
automotive sector. However, they also point out the time span that this spreading process is taking
in several examples such as the turbocharger: while it saw its origins in aeronautical applications
from the 1930s onwards and post-war saw applications in motorsports, it took pioneers such as SAAB

9
in the 1970s that introduced this technology in regular, yet unusual road cars, it is only now and due
to strict emission regulations that turbocharged engines see a broad spread across the industry in an
attempt to lower emissions. This might indicate a very extensive delay between actual invention and
broad and successful commercialisation that should always be taken into account when considering
innovation within the automotive sector.
2.2 Measuring Innovation
In order to reveal and compare innovation across the manufacturers in the automotive sector, it is
necessary to measure innovation beforehand. When trying to measure something accurately, it is
necessary to know in advance what to look for. Measuring includes the selection of a specific set of
tools, which themselves are being capable of only capturing a certain group of variables. As this
selection process and the subsequent inevitable restriction on variables to monitor is the initial step
in a measuring cycle, it is of vital importance to possess at least a suspicion of what variables to
measure in order to gain the desired information as result. It becomes obvious that subjects from the
fields of the natural sciences are generally easier to measure due to their specific definitions. Other
fields of science – also the one underlying this work – lack the formulated strictness in their
definitions and are characterised by rather conceptual definitions with broader leeway. Nevertheless,
as becomes apparent, the more exact a subject is defined, the more satisfying and accurate it can be
measured. This chapter will offer the theoretical fundamentals necessary to define what has to be
gathered and evaluated in the following chapters.
As mentioned above, the vital key for any measurement is an initial definition of the subject to be
measured in order to know what set of tools to pick for measuring. In this work, innovation in the
automotive sector is to be demonstrated, so the first step is to establish a definition for innovation
itself. Even before actually diving into the theoretical fundamentals of research on innovative
processes, an elementary problem can instantly be identified. As deducted above, the success of
measuring and therefore demonstrating something is dependent on a certain kind of knowledge
about what to look for, or in other words, properties of the subject to be demonstrated. This
necessity of ex ante knowledge seems to contradict the commonplace perception of the concept of
innovation as something new and unpredicted. Today’s scientific understanding of innovation has its
origins in the works of Schumpeter (1913), who provided the initial definition of innovation as a new
and unprecedented combination of materials and forces and their commercial realisation.

10
In more detail, Schumpeter’s understanding of innovation can be divided into 5 different cases
(Borbély 2008, Schumpeter 1913):
1. Production of new products
2. Introduction of new production methods
3. Exploration of new sources of supply
4. Development of new markets
5. Reorganisation of business
From these cases, in addition to his provided characterisation of innovation originating from the
economy in a discontinuous manner, it becomes apparent that Schumpeter’s initial understanding of
innovation was focussed rather on the commercialisation than the invention of new technologies and
ideas, as in his eyes, it is only the successful commercialisation of an invention that could act as a
proof of value of the invention and simultaneously provide the new impulse to the economy
(Schumpeter 1913, Kiss 2004 as cited by Borbély 2008). In Lazonick’s (2006) words, innovation
requires firms to learn about how technologies can be transformed and markets be accessed in
generating products with a higher quality and lower costs. He also stresses the uncertain nature of
the innovation process, since the required knowledge for transforming technologies and accessing
new markets, by definition, can only be revealed during the learning process itself. There is a vast
amount of research on the question what makes a firm innovative, ranging from social, historical or
managerial factors, not least by Lazonick (2006), who tries encircling the underlying question from
several directions, but here, the initially preponderating question will not be why certain firms
innovated, but rather quantifying their innovative performance. Therefore, after establishing the
fundamental meaning of innovation, it has now to be decided how to measure it – a field of research
that is of equal complexity as that of why firms innovate. As becomes apparent from the initial
definition of innovation by Schumpeter, which might be considered long alphabetically, but lacks the
clear precision of a mathematical formula, a universal and reliable method of measuring innovation
appears impossible, even more so as the definition of innovation depicts the characteristics of a third
party, the product or technology, which is unpredictable and unique in every case. This is also
pointed out by Smith (2006), who in his works on how to measure innovation explicitly points out the
underlying problem when trying to measure the uncertain. Although he tends to agree on certain
aspects of innovation being immeasurable, he still believes this to not be true in its exclusiveness.
Instead, he subsumes, the solution lies in breaking down the multidimensional aspect of novelty
creation into bits that can convincingly be measured, therefore, by concentrating on what can be
measured, and circumventing the fundamental paradox of being forced to measure novelty. The
formation of these innovation indicators is vastly influenced by the works of Kline and Rosenberg
11
(1986) and their creation of the so-called chain-link model of innovation, stressing the following
aspects of innovation:
1. Instead of a linear process, innovation involves numerous feedbacks and interactions
concerning knowledge creation
2. Innovation is a multi-dimensional learning process with various inputs
3. Innovation is not dependant on inventive processes, in terms of discovery of new
principles, with such processes by trend being considered as problem-solving within an
existing innovation process rather than an initiating event.
As Smith (2006) points out, this leads to two major implications in terms of innovation indicators, one
being novelty implying not only creating entirely new products, but also changes in a relatively small
scale, that however add up over time and may lead to major implications economically or
technologically. A successful indicator, he adds, has therefore to be able to capture not only radical
changes, but also gradual and subtle advancements. The second implication according to him is the
importance on innovation of factors besides usual R&D, such as design activities or exploration of
new markets, leading to the necessity of an indicator to being able to record those inputs besides
mere R&D spending. In his work, Smith (2006) distinguishes between five groups of major indicators,
which will briefly be described here.
2.2.1 R&D Data
The traditional approach to attempt to measure innovation is using an R&D indicator in putting R&D
expenses in relation to total sales (van der Panne, 2007). After establishing the fundamental problem
of innovation measurement described above, in picking R&D indicators as the initial base of
innovation mapping, several of the aforementioned problems could be solved and meaningful results
be obtained. The most obvious reason for R&D indicators being the initial and longest-standing area
of data collection lies in their simplicity (Smith, 2006). R&D data on corporate level has not only been
recorded for a long time span, but also in a rather standardised way, allowing for comparisons
between firms, industries or countries, making it a readily available and easily evaluable source of
data to circumvent the problem of immeasurability of innovation itself (van der Panne. 2007).
However, this simplicity comes at a price. Monitoring the R&D expenses can give an impression of
the activity of the R&D department of the respective entity, especially when put in comparison with
the expenses of competing entities, but eventually, even this is a deduction. Furthermore, this
activity in R&D could at most be translated to inventive activity, but, as according to Schumpeter’s
concept stated above, it is not invention defining innovation, but rather the successful

12
commercialisation of inventions. This imbalance of focussing only on inputs (i.e. R&D expenses),
discounting outputs (i.e. sales) as a measure of commercialisation is raised by Kleinknecht, van
Montfort, and Brouwer (2002). Furthermore, this indicator implies an exclusiveness of R&D activities
in innovation processes, which contradicts the aforementioned assumptions by Smith. Indeed, as a
work by Brouwer and Kleinknecht (1997) shows, only 25 percent of the total innovation expenses can
be attributed to mere R&D, the rest flowing into, inter alia, market evaluations or design processes.
Another problem raised by Smith (2006) is the difficulty in finding a sharp definition of R&D as
opposed to related processes.
2.2.2 Patent Data
The importance of the small states in 15th century Italy with their increasing focus on mercantilism,
technology and advance in the formation of a basis for the rise of the further development of
Europe, can exemplarily be seen in the example of patent systems. It was in these pioneering days
that innovation was made desirable within a market situation in linking it to a rewarding system.
Venice introduced a licensing system in 1474, granting those who could prove the feasibility of their
inventions through demonstration a protection from imitation for ten years, as a location measure to
attract engineers and boost progress (Granstrand, 2006). These beginnings of patent systems further
developed in a pattern that can be characterised by increasing spatial spread: was the initial licensing
limited to Venice and meant as a measure to recruitment, the current intellectual property rights
systems are in effect almost globally and focus rather on protection of the invention rather than
attraction of the inventor (Granstrand, 2006). Yet, the connection between innovation and patenting
is still valid and is used by researchers as a measure to detect innovation. The patenting system is
helpful here as it can make innovation visible: in order to successfully file a patent, the applicant has
to disclose his invention, prove its feasibility and agrees to have it publicly registered and roughly
explained in order to benefit from the promised protection from imitation (Smith, 2006). Through
public patent databases, innovations are publicly announced and therefore made measurable.
However, as with R&D indicators, the simplicity of patents as an indicator comes at a price. As with
R&D, patent data maps invention rather than innovation, as it is lacking the Schumpeterian
requirement of commercialisation (Smith, 2006). On a more complex level, the underlying trade-off
for the applicant has also to be considered: the protection by the patent system is only achieved by
previously disclosing the invention. This could trigger various considerations by firms, as a firm could
decide the resulting protection does not compensate the disclosure of internal details, possibly
revealing major strategic decisions beyond the actual patent itself, or, in contrary, using the patent

13
system as a strategic measure to seize key technologies without actually intending to commercialise
on them (Smith, 2006, Kleinknecht et al., 2002). Nevertheless, patent data can give an idea of
innovative activity and will in this work be used as a comparator to the main approach.
2.2.3 Bibliometric Data
In a more scientific approach, bibliometric data can also be used as an indicator for innovation. Here,
scientific publication and citation are analysed for composition and dynamics, with the Science
Citation Index and the database of the Institute for Scientific Information (ISI), founded in 1958,
being the most integral parts (Smith, 2006). Although those databases contain statistics for more
than 170 countries and a vast variety of subfields, the major problem with this approach lies in the
focus on scientific dynamics rather than innovation (Kaloudis, 1998; Moed, de Bruin, & van Leeuwen
1995; Smith, 2006).
2.2.4 Database-resting Indicators
In an attempt to overcome the aforementioned problems of the more simplistic indicators, the
development of more sophisticated indicators was pursued and led to the emerging of database-
resting indicators. According to Archibugi and Pianta (1996), these can be divided into two different
approaches, the one being called the subject approach, since the focus lies on the innovating entity,
i.e. the subject that is innovating, whereas the other is being called the object approach, as,
accordingly, the focus here lies on the output of the innovation process.
The most famous example for the object-based approaches in accordance with Smith (2006) is the
SPRU database developed by the University of Sussex, which bundles the major technical innovations
in British industry post-war up until 1983. As Smith adds, the advantages of such an approach lie in
the focus on the technological aspects in combination with a quality assurance mechanism through
the upstream panel of experts acting as gatekeepers. On the other hand, he points out, there is an
inherent weakness through the combination of the expert panel acting as gatekeepers of significance
and their sources being press releases or journals, i.e. published information, leading to a bias
towards more revolutionary progress, whereas the usual incremental progress might not be
journalistically noteworthy and therefore avoids being recorded by the panel in the first place.
Another form of object-based approach uses literature as the source of data. The so-called literature-
based innovation output method (LBIO) stems on the works of Edwards and Gordon (1982) and have

14
been refined and further developed most notably by Kleinknecht (see: Kleinknecht & Bain,
1993).Here, the information on the release of new products is taken from professional trade and
technical journals to map innovative processes in the industry, having the advantage of using an
independent source and being able to also capture innovations from smaller firms that in other
indicators such as patenting data tend to be missed, with the drawback already mentioned above of
only capturing innovation that is decided to be published (Coombs, Narandren, & Richards, 1996;
Kleinknecht & Bain, 1993). A recent example of a profound LBIO database is the Swedish SWINNO,
covering data of Swedish manufacturing firms between 1970 and 2007, providing unprecedented
insights into the development of the Swedish manufacturing sector (Sjöö, Taalbi, & Ljungberg, 2014;
Taalbi, 2014).
The subject-based approach is characterised by an initiative by the OECD in the early 1990s to
harmonise earlier survey results and laying the cornerstone of a uniformed approach, resulting in a
manual that is today known as the Oslo Manual (OECD, 1992; Smith, 2006). This initiative was taken
up by the European Commission and let to the formation of the Community Innovation Survey (CIS),
being a large scale attempt to collect international and comparable data on direct measures of
innovation output, inter alia incorporating data not only on R&D, but also on the associated fields
mentioned in chapter 2.2.1, or sales figures of both radically and incrementally changed products,
tackling the mentioned problems with incremental change disappearing in previous approaches
(Smith, 2006). Due to the survey-based approach, where the information is centrally gathered after
being compiled by the subjects themselves, it calls for a clear definition of figures to be stated on the
one hand, and on the other hand, in order to achieve an indicator as versatile and comparable as
possible, definitions cannot be too narrow in order to fit all different sectors and companies,
resulting in a constant trade-off between universality and complexity and criticism arises, whether
the CIS approach is feasible beyond its native area of application in manufacturing (Smith, 2006).
2.2.5 Technometric Data
Most of the aforementioned indicators focus strongly on either the input side of the innovation
processes, as in expenses flowing into R&D, or try to visualise the processes happening inside the
innovation black box through auxiliary by-products such as citations or patent applications. At least
for technical products, however, there is the possibility of actually assessing the degree of product
improvement through innovation processes by observing the improvements in technical
specifications in the products (Smith, 2006). In order to close the informational gap between the
analysis of mere R&D input at the beginning of the chain and market results at the end, Grupp (1994)

15
suggests bridging the gap through addition of analysing technical performance of the products to
gain the opportunity for a more specific insight. Here, he suggests an initial stage of data collection,
but also raises the necessity of an evaluation of the data, which he suggests to be achieved through a
board of experts. The importance of this becomes apparent when considering the variety of different
performance data of products from which those have to be determined that should be considered
crucial for the product’s commercialisation. When remembering Schumpeter’s understanding of
innovation, it is not the improvement in random technological parameters that constitutes
innovation, but rather the improvement in those technological parameters that have the biggest
effect on the product’s commercialisation. Grupp’s (1994) solution is to survey a board of expert as
an authority of appraisal, but as shown in 2.3, other approaches exist as well. Nevertheless, given a
functional appraisal mechanism insuring significance, the usage of an indicator based on
technometric data in assessing innovation is a tempting alternative or addition to the
aforementioned, as it approaches various raised problems. It is more precise than an indicator based
on inputs, such as R&D expenses, as measures the data of actual post-innovation process output.
Furthermore, it is immune to the behavioural trade-off present in the patent data indicator, as it
measures product characteristics independently from a possible patenting status. Additionally, it is
also capable of measuring both incremental and revolutionary progress in focussing on pure data,
avoiding the problems of journal-based bibliometric data, being prone to overlooking incremental
progress due to the lack of reference in these journals. Finally, as mentioned, the necessary
consideration of commercialisation is achieved through the appraisal mechanism. Simultaneously,
however, this does not only emphasise the importance of this integral part for the successful
functioning of this indicator, but also reveals it as the weakest link of this approach: it is only a
reliable, profound and careful selection of the significant technical parameters that enables the
potential of this approach. It is needless to say that the biggest drawback of this approach lies in its
inherent limitation on technical products, while the other indicators show a higher degree of
universality, compensating the alluded disadvantages. However, as in this work the focus will lie on
the automotive sector and the concerning products are heavily revolving around technical data, this
drawback is of no relevance, while the benefits of the indicator fully apply. Therefore, a technometric
approach is chosen in this work, including, as suggested by Grupp (1994), a supportive glance into
patent data.

16
2.3 Technological Paradigms and Trajectories
As mentioned above, the technometric approach according to Grupp (1994) includes an appraisal
entity to determine the technical variables of relevance. This can be considered a solution to
Schumpeter’s prerequisite of factoring in commercialisation into successful innovation. However,
based on the premise of this mechanism serving the main purpose of identifying those technical
aspects that will be of significance in terms of later commercialisation of said product, it becomes
apparent that this mechanism can be substituted if the knowledge of what technical aspects will be
of importance can be acquired elsewhere through another, preferably easier method. The
fundamental question is therefore how to determine the importance of a product’s various technical
variables and the direction of their future development.
This question of possibility to determine the direction of innovation has been tackled by Giovanni
Dosi, who in his work (1982) evaluates a corresponding concept of technological paradigms and
trajectories. While not trying to provide a general theory, his concept tries to tackle the question of
why certain directions in technological change emerged and others did not, which would be a crucial
information for evaluating innovation in an industry. Originating in the classic approach of technical
change being either forced by the market (demand-pull) or quasi-autonomous (technology-push), he
argues that there is the possibility of knowing the direction of technological development being
pulled by the market before the actual innovation process. In approaching technology in a rather
microeconomic way, he describes it as a limited set of pieces of knowledge and possible
technological alternatives a firm can use to achieve its goals and meet notional developments. From
this, his concept derives the idea of technical paradigms, which analogous to scientific paradigms, are
defined as models or patterns in order to solve certain technological problems, based on specific
principles or technologies. This means that in the beginning, there is the identification of a
technological problem, i.e. the definition of a goal for the further development of a product, based
on notional future development. Then, in a second step, as the goal is established, the actual set of
tools in terms of technological approach is chosen, which is what he defines as the technological
paradigm and of which there might exist several at the same time. In a crude example, the goal to
produce electricity could be achieved by either nuclear power, coal power or wind power, each
symbolising a different technological paradigm. Based on the chosen technological paradigm, Dosi
(1982) in the next step states that there is the possibility of defining the direction of regular progress,
meaning problem solving activity to achieve the aspired goal, as a chosen technological paradigm will
determine the direction of technological change. This direction is called technological trajectory by
him. This trajectory on one hand allows the identification along which route technical progress will

17
be pursued, on the other hand, it stands for the focussing effect of the choice of technological
paradigm, as following the trajectory with the chosen paradigm further enhances the blindness
towards other paradigm alternatives due to a growing momentum of the initial paradigm, called
natural trajectory (Dosi, 1982; Nelson & Winter, 1977a; Nelson & Winter, 1977b; Rosenberg, 1976).
Technical progress would then be defined as a movement in the multi-variable space along this
trajectory, leading to an improvement in the inherent variable trade-offs that comprise the
trajectory, which itself is nothing else than a series of possible technological combinations with the
underlying paradigm defining the outer boundaries (Dosi, 1982; Martino, 1980; Sahal, 1978). This
boundary is called the technological frontier and can be considered the highest possible level to be
reachable along the technical trajectory considering the technological paradigm, while also affecting
the probability of future advances along the trajectory of the concerning entity according to the
distance between entity and technological frontier, consistent with Nelson and Winter’s
understanding of technical progress based on Markovian chains (Dosi, 1982; Nelson & Winter,
1977a). As mentioned, the trajectory can contain strong focussing forces, which can impede the
switching to an alternative one due to the new trajectory being far behind the existing one, leading
to the necessity of starting new when switching the paradigm (Dosi, 1982). In his model, Dosi finds
evidence for the aforementioned market-induced evidence, however with the limitation of it rather
affecting incremental, or normal technological progress, instead of the radical, discontinuous
advances (Dosi, 1982; Schmookler, 1966).
Overall, Dosi’s concept of technological paradigms and trajectories serves as a fruitful addition to the
fundamental technometric approach. Not only does it enable identifying the relevant technical
aspects of the product for successful product innovation, but even allows plotting a path of the
direction of desired innovation due to the concept of technological trajectories, while also illustrating
the underlying problem of technological frontiers depending on the chosen technological paradigm
and the possibility to defining the position of the entity within this multi-variable space, enabling a
qualitative assessment. The major drawbacks of Dosi’s concept stem from the fundamental
drawbacks of the technometric approach in general, in being rather limited to technical products
instead of services and, more specifically, due to the concept of paradigms and the resulting
difference in trajectories, being more suited for small, incremental progress instead of revolutionary.
However, given that in this work the subject of interest is the automotive sector and their products
and therefore the characteristics of these products have to be matched with a suitable indicative
approach, Dosi’s concept can be considered a suitable approach. In order to determine innovation in
the automotive sector, the focus will lie on the main product of this sector, namely cars. These in
itself are a perfect example of a technical product and despite their diversity, all revolve around the

18
same fundamental technical concept and subsequently a similar set of technical aspects to provide.
This, in combination with the special situation mentioned in the introduction that all major
automotive firms can momentarily be considered on still being on the same page in terms of the
fundamental conceptual approach of problem solving in still focussing on internal combustion
engines, while simultaneously future research, development and announcements suggest an
imminent change towards alternative forms of drive systems within the coming years, leads to a
promising possibility of applying Dosi’s ideas. The current situation with major changes in terms of
drive train concepts to be expected is a critical point of time in Dosi’s concept, as it shows the
imminent transition from one technological paradigm towards another, hinting a technological
frontier to be reached with the current paradigm internal combustion engines. Simultaneously, as
currently, due to their adherence to conventional drive systems, the manufacturers can be
considered adhering to the same technological paradigm. This therefore enables a broad comparison
both along the industry and along the years, as the current paradigm has been the vastly
predominant approach for products in the automotive sector, resulting in a high level of overall
technical sophistication, and the imminent change in paradigms will lead to a rather frayed field of
competitors at various stages of technological transfer towards the by comparison rather embryonic
alternative technologies. As Dosi elaborates, the switching towards an alternative, new technological
paradigm will initially lead to a deterioration in terms of position along the technological trajectory
and therefore, the heterogenic switch towards new technologies along the industry will lead to
fragmentation, preventing a reasonable comparison both along the industry but especially
chronologically. So as the internal combustion engine will see its inevitable demise, it still does
provide the optimal occasion for a broad comparison of the industry’s past innovative performance
before the cards are being reshuffled.

19
3 Data and Methods
In order to answer the underlying questions of this work in a satisfactory manner, several sets of
questions have to be raised. In this chapter, it will be explained what data is gathered and how it is
composed. According to the target and nature of this work, a strong focus will lie on the technical
data that is gathered and compiled to the database. Due to the mentioned focus of previous research
on innovation in the automotive sector on the role of external factors and innovation indicators such
as innovation data, both the main external factors and patenting data are also included to provide a
brief comparability with the newly-gathered technometric data and thus enabling a better linkage of
the results from this work to previous findings. Nevertheless, this does not raise the claim to provide
a complete and in-depth statistical or econometric analysis of the results from the different
approaches, as the underlying main objective of this work is to provide the possibility to add a new
perspective on innovation in this sector by gathering a new set of data.
3.1 Innovation in the Automotive Sector
Any measurement of innovation requires prior identification or definition of what to perceive as
innovation. In order to map the direction of innovation in the automotive sector, Dosi’s fundamental
concept of technical paradigms and trajectories will form the basis. In exploiting the underlying
notion of technological trajectories showing the desired direction of development, this revealed path
can be assumed as the target direction and hence goals of innovation. Therefore, and in order to be
able to answer the follow-up question of innovative performance of the individual manufacturers,
along the lines of Dosi’s concept, an initial trajectory of technological change will be generated from
the average values of two selected key variables. This resulting industry-wide trajectory will reveal
the direction of innovative development of the industry in terms of technical progress and enables a
subsequent performance comparison.
In order to construct a trajectory to reveal the direction of technological change for the automotive
sector, it beforehand needs to be identified, what technical variables are to be considered crucial.
Despite this in general being a rather difficult task, in this specific case, several characteristics of the
automotive sector alleviate the process. With small exceptions such as electrically powered cars at
the beginning of car manufacturing or occasional experimental vehicles fathoming the potential of
alternative drive technologies, from the beginning up until today, virtually the whole automotive
industry is concentrating on building cars around the same basic concept of the internal combustion

20
engine. The whole progress of over a hundred years of technical advancement in car manufacturing,
the transformation from crude, mechanically controlled engines towards electronically optimised
high-performance engines and the ever-increasing complexity of a car’s internal system does not
belie the fact that beyond all these auxiliary systems, physically both engines work the same. This is
insofar remarkable and helpful for the underlying question of identifying variables, as it means that
the automotive sector is facing the same fundamental problems for over a hundred years in engine
development.
Naturally, these problems and their underlying technical variables have been prioritised and
therefore tackled differently, as for example power optimisation seemed more important than fuel
consumption in motoring’s early days, not least because of the lack of environmental awareness due
to the lack of large-scale environmental influence of cars at that time. However, when considering at
least the last quarter of a century, the same fundamental properties of an engine stand out. Here, it
is important to make a clear distinction. The factors or reasons of a consumer to buy a certain car
over another are as diverse as with other consumer goods. Car manufacturers succeeded in
segmenting the car market into different parts, each incorporating another demand, be it premium
cars, pragmatic cars, or design cars. Despite all being based on the same basic principle, car
manufacturers emphasise their image management in order to diversify what is based on an identical
functional basis. The technical component building the fundament of each car is covered with an
enormous range of emotional aspects in order to market the product successfully. However, these
marketing-based soft skills are irrelevant when assessing the innovative performance, where mere
technical data and functionality ought to be identified. It is therefore necessary to concentrate on the
technical factors that are of importance for a consumer to buy a car.
Here, only a few properties of a car remain and of these, even without thorough examination, two
could reasonably be considered the most important. Whereas most car owners would not be able to
state the weight, the dimensions or the emitted noise of their cars in numbers, most have a rather
clear idea of the car’s fuel consumption and its power. Obviously, these two variables should not be
considered exclusive technical purchasing arguments, but most other prominently advertised aspects
of an engine, be it CO2 emission, range or the sprint time to 100 km/h, inevitably result in affecting
either or both figures of an engine. Therefore, as in previous works, it can be considered a viable
choice to focus on these two aspects in order to evaluate the technical development and hence
innovation performance. In this work, the technical nature of cars prevails, hence the reduction of
cars to their key technical characteristics and a subsequent rather technical definition of product
innovation. How these variables are processed in order to make them comparable is illustrated in
3.2.
21
3.2 Technical Performance
The most important task in order to being able to record and evaluate innovative performance within
the automotive sector in a technometric approach is to build a suitable database. This database has
to meet several requirements in order to provide viable results. As mentioned before, the biggest
problem when trying to assess innovation is the difficulty to measure something as heterogeneous
and intangible as innovation. However, even after having identified a suitable set of tools to measure
the subject to be examined as elaborated in the previous chapter, the main obstacle to tackle is to
enable a comparability along the measured data both chronologically and spatially. The automotive
sector is characterised, despite the tendencies of consolidation and the demise of numerous
companies within the last decades, by a rather heterogeneous range of products. Car models alone
differ in sizes, features, and demands and that does even disregard the different motorisations,
further adding to a vast variation among cars from both different manufacturers but even
intracompany. This is reflected in the technical data to be collected and in order to establish a
comparability, it demands of a high degree of pre-organisation and arrangement of the data. The
initial problem is that despite the advanced level of globalisation in the automotive sector, with
major groups such as Ford, Toyota or Volkswagen being active on virtually all global markets, due to
differing consumer preferences, a rather high degree of market segmentation exists. The Volkswagen
Golf, ubiquitous in Europe, is less common in Japan or even the United States. Vice versa, the
American preference for large pickup trucks is unrequited by Europe, as is the Japanese fondness of
so-called Kei Cars, that can be considered small even by more moderate European standards. The
manufacturers responded to these differences in preference in offering especially tailored models for
major markets and omitting an 'one size fits all’-approach that could be observed in consumer
electronics for example. As a result, a global market comparison is threatening to produce skewed
results, as it would mean comparing a normal car (e.g. VW Golf) with a truck (e.g. Ford F-150) and a
four-wheeled motorbike (e.g. Suzuki Wagon R). As one aim of this work is to provide a possibility to
compare innovative performance not only chronologically along a model, but also spatially across the
industry, there is the need of harmonising the data starting point.
In order to achieve this, the focus in this work will be set on the European car market. Firstly, for the
majority (2000-2012) of the period to be examined, the combined European car market surpasses
the other major markets USA and China in annual sales, while secondly providing a degree of
comparability across its countries and being characterised as a stable, mature market not prone to
the chaotic growth of the catching up Chinese market and resulting distortions in chronological order
(Gomes, 2016). Based on this market decision, 15 major automotive groups were chosen, accounting

22
for over 97% of the European market (EU + EFTA, car registrations in 2015), with a focus on the
largest sub-brand of each group according to market share figures (ACEA, 2016). The range of
products of each of the 15 chosen sub-brands was classified according to the car classification
scheme developed by the European Commission (2002). From this classification scheme, the
following fringe classes and belonging products have been omitted:
A mini cars
F luxury cars
S sports cars
M multi-purpose cars
J sport utility cars
As marginal differences even within the EU internal market exist in terms of offered motorisation,
models or dates of introduction, in order to create a standardised database, technical data has been
gathered based on the biggest of the European car markets, Germany (Gomes, 2016). For this
purpose, the technical data has been centrally gathered from the database of Europe’s biggest motor
club, the German Allgemeiner Deutscher Automobil-Club (ADAC, 2016). This club possesses a publicly
accessible, closed and professionally maintained automotive database, gathering numerous
information and data on virtually all cars offered on the German car market for at least the last 25
years. Besides data from its own in-house tests, the database also provides an extensive amount of
manufacturer specifications and technical data on all models and all respective engine variants in the
relevant period. It is the combination of the vast extent of the data, the closed and professional
characteristic of the database, the good reputation of the data owner as a reputable club and car
insurance company, and the contained technical data being used for both insurance and fiscal
calculations, that makes this database a both comfortable and reliable source of data in this work.
In the next step, each offered model of the brands within the period 2000 – 2015 is classified to the
relevant classes B – E. As mentioned, the heterogeneous nature of the automotive firms resulted in
not all manufacturers offering cars in every class examined, or at least only partially over the period
of time. In order to maintain both comparability and consistency, sporadic models have been
omitted in the case of it being the only model the manufacturer is offering in this class and only for a
reasonably short time. The main goal has been to achieve timelines as complete as possible for each
class and each manufacturer. As a result, especially the high-end-oriented manufacturers are lacking
models at the lower end of classes and vice versa budget-oriented do not offer models within the
higher classes. This imbalance also is the reason for a priori dropping the most remote classes, while
including classes B and E is a compromise between adding diversity without causing too many data
holes. As a result, 148 models by 15 manufacturers are being analysed, with most manufacturers on

23
average having 2.5 or more models per each class, including those not covered by product range and
at least two up to 4 models per each class covered.
This list of models is now categorised and enriched by different motorisation. In order to achieve
comparability, a selection of engines per each model is selected and according data gathered.
Fundamentally, engines comparable in performance data can be expected in each class due to the
competitive forces within the industry. However, due to the heterogeneity of the automotive
market, several manufacturers aim at different niches within the market and the one standardised
engine per class cannot realistically be expected. Instead, certain manufacturers aim for the higher
end of performance, whereas others concentrate on the lower end. Secondly, certain manufacturers
offer a wide range of different motorisation for their model, while others might content their selves
with only a couple different engines. To overcome this striking imbalance, a standardised approach
proves impossible and data selection is rather based on individual choices. In the selection approach,
the aims were firstly to map the span and average of technical performance in the engines offered in
settling for engines from both ends and possibly a mid-tier engine. Secondly, great care has been
taken to achieve continuity over the whole time span, so engines only appearing for a couple of years
have been omitted in favour of engines being offered along the entire model history. Also, extremes
and artificially created gap fillers, meaning engines being decreased in power to fill in the model
range, have been omitted, as both would distort the results, the first in being niche products hardly
being comparable to other manufacturers, the second being artificially decreased in performance,
therefore distorting the manufacturer’s overall technical performance in an undesirable manner.
When in doubt, the more potent of two variants of the same engine has been selected. In terms of
continuity, the revision and improvement of the engines over the years sometimes led to a switch
with the possibility of either adopting a new smaller engine with comparable power or remaining
with the new equal sized engine that gained performance. In general, for the sake of continuity and
the mapping of development, an engine has been tracked as far as reasonable, in most cases, the
designation by the manufacturers acted as a guiding post and allowed identification of intended heir.
As in the end, the technical data of each engine is standardised, these decisions are only of minor
importance in terms of impacting the result. The same applies to the differences in nominal data for
the selected engines of the different manufacturers.
A general distinction has been made between petrol and diesel engines, with the aim of covering a
sound sample of engines for each fuel type in each class. Due to the lower distribution of diesel
engines at the end of the 1990s as compared to today (ca. 30 % as compared to over 50 % in EU 15,
AAA 2015), the starting point in 2000 saw a significantly lower number in diesel engine variants for
each manufacturer, resulting in an overall smaller sample of diesel engines, as the engine sample is

24
set in the first years. Where necessary and reasonable, the first data has been recorded in 2001 or
2002, when engines were only introduced then, but for the sake of avoidance of larger data holes,
later initially introduced engines were omitted. Nevertheless, for most models, the sample of diesel
engines might be smaller but is still informative. This eventually leads to a sample of 724 engines in
total for analysis. In order to standardise the resulting data and achieve comparability, for each
engine, the engine output per unit of displacement (standardised power output in kw per 1000 ccm)
and specific fuel consumption (standardised fuel consumption in l/100 km per 100 kw) have been
calculated. Further data can be found in the appendix, providing a more in-depth insight of the
results of each manufacturer in each class of cars, thus revealing the performance across the
different classes.
3.3 External Factors
As revealed in the previous chapter, there is evidence of recognisable influence of external factors on
the innovative processes within the automotive industry. In previous approaches, these external
factors have commonly been divided into policies and fuel prices as the major influencers. In order to
provide information on how the proven innovative processes in the automotive sector might be
influenced by these external factors, they need to be captured. Due to the selection of the European
car market as the standard for the collection of technical data as explained in 3.2, both external
factors themselves will be focussing on the European market.
3.3.1 Emission standards
Cars offered on the joint market of the European Union and the European Economic Area have to
comply with an extensive set of emission standards. This sequence of emission standards, the Euro
stages, will be taken into account in this work in order to map the policy side of the external factors
affecting the car industry. A timeline will be compiled, showing the emission standards and the
industry-wide fuel consumption to reveal connections. The data on the European Emission Standards
(Euro 3 – 5) have been gathered from the Official Journal of the European Community / European
Union (European Communities, 1998; European Union, 2007).
Besides this European emission standards system, the European Union also decided to implement a
mechanism in order to decrease carbon dioxide emission in setting an upper limit for manufacturer’s
fleet consumption. This mechanism was agreed upon in 2008 and although it will only be fully
applicable in 2015 and therefore by the end of the period covered here, due to the phasing-in

25
mechanism since 2012 and generally the forerun needed in the automotive sector, the effects of this
mechanism will also be examined (BMU, 2009).
3.3.2 Fuel prices
In previous research, one of the main factors of influence were the prices for fuel. In this work, the
according data has been gathered from the European Environment Agency (2016) for the period
2000 – 2015. Furthermore, the data is subdivided into two subsets. The first shows the average
prices within the European Union for Diesel, Petrol and All Fuel including taxes, i.e. final price. Due to
the different grades of petrol, the numbers for Petrol are consumption-weighted averages of both
leaded and unleaded petrol, corrected according to energy content to result in an equivalent amount
of unleaded petrol. All Fuel data is compiled according to the same principle, but also takes into
account the Diesel figures. These figures are all nominal. Therefore, in a second set, the nominal All
Fuel numbers are set aside real All Fuel numbers, prices corrected for inflation and using 2005 as
base year, in order to achieve a comparability and take skewing inflation effects into account.
3.4 Patenting Data
Furthermore, it will be examined whether the observed technical innovation within the automotive
sector derived from the technometric data can be confirmed from the patent data of the
manufacturers in the same period of time. In order to this, the patenting activity of each
manufacturer will be recorded. A fundamental theoretical problem is the approach to patenting
data. As mentioned in 2.2.2, patenting activity cannot necessarily be translated into innovative
activity as there might be behavioural trade-offs in both directions: it could be perceived
advantageous to waive patenting an innovation in order to avoid public attention for example, and it
might also be that the patenting system is rather used as a defensive mechanism to exclude
competitors from promising technologies in blocking key technologies that do not allow direct
feedback to actual innovation activity in the firm. Furthermore, it has also to be considered that
modern car manufacturers are offering a wide set of products and services and are involved in a vast
span of activities that go far beyond the actual technology contained in an internal combustion
engine. The car itself as the main product does include know-how from a plethora of fields in all its
different parts, without taking into consideration the multitude of other activities a manufacturer
finds himself involved in today. Patents of a car manufacturer might include work process
optimisations or even innovation related to its staff catering. This calls for a clear definition of what
patents to consider. Therefore, in this work, the patent classification according to the IPC classes is

26
used in selecting these areas that can be considered directly affecting technical performance of the
car in terms of the variables chosen to be relevant. These classes focus on the engine itself and the
following components involved in delivering the generated power towards the road and transform
the engine power into movement, as these influence the driving characteristics and technological
potential of the engine itself. Patenting data of the manufacturers is gathered centrally from
DEPATISnet, the central research gateway of the German Patent and Trade Mark Office (DPMA),
offering a database of almost 90 million data entries from all major patent registers, including the
European, the American, the Japanese and the Korean and therefore covering all countries of origin
of the manufacturers covered in this work (DPMA, 2014).

27
4 Results
4.1 Innovation in the Automotive Sector
The collection of the data of the engines and the subsequent standardisation to a comparable unit
allows the rendition of two graphs, showing the development of each manufacturer in terms of fuel
consumption (Figure 1 and Table 1) and power (Figure 2 and Table 2). These initial graphs do neither
distinguish the different car classes nor the different types of fuel, but they conveniently show the
overall performance of each manufacturer. As becomes apparent, despite a certain degree of
deviation especially concerning the development of fuel consumption, in both cases there exists a
clear tendency upward or downward respectively.
Furthermore, it can be noted that the differences between the manufacturers in terms of power are
not as pronounced over the whole period as the differences between the manufacturers regarding
fuel consumption. Instead, after showing a remarkable homogeneity especially in the first three
years, with only BMW and Jaguar significantly deviating from the rest, the overall tendency here
appears to be towards a stronger scattering towards the end of the time period with remarkable
outliers in form of Volvo and Jaguar.
Fuel consumption however, shows a stronger scattering overall, with most turbulence in the middle
of the period, characterised by significant deflections from Nissan. Towards the end of the period, a
tendency towards approximation on an overall lower level can be observed. In addition, due to the
stronger overall deviation within the industry, the individual developments can be identified more
easily, with certain manufacturers such as Peugeot showing a more gradual improvement, whereas
others, such as Volvo, a characterised by sudden steep steps.
Overall, it can be noted that each manufacturer, even Nissan, regarding its unusual spikes in fuel
consumption mid period, eventually achieved an improvement in both variables. Furthermore, at
least in fuel consumption, a certain set of leaders can be identified. Jaguar, Mercedes, BMW and
Volvo show a rather isolated group at an overall lower level of consumption throughout the whole
period, characterised by a strong approximation towards the end of the period.

28
Figure 1: Fuel consumption in litre/100 km per 100 kW engine power per manufacturer, 2000 - 2015
2
3
4
5
6
7
8
9
10
11
12
2 0 0 0 2 0 0 1 2 0 0 2 2 0 0 3 2 0 0 4 2 0 0 5 2 0 0 6 2 0 0 7 2 0 0 8 2 0 0 9 2 0 1 0 2 0 1 1 2 0 1 2 2 0 1 3 2 0 1 4 2 0 1 5
CO
NSU
MP
TIO
N IN
LIT
RE
PER
10
0 K
M P
ER 1
00
KW
BMW Fiat Ford Honda Hyundai Jaguar Mazda Mercedes
Nissan Opel Peugeot Renault Toyota Volvo VW

29
Figure 2: Engine power in kW per 1 litre displacement per manufacturer, 2000 – 2015
30
40
50
60
70
80
90
2 0 0 0 2 0 0 1 2 0 0 2 2 0 0 3 2 0 0 4 2 0 0 5 2 0 0 6 2 0 0 7 2 0 0 8 2 0 0 9 2 0 1 0 2 0 1 1 2 0 1 2 2 0 1 3 2 0 1 4 2 0 1 5
PO
WER
IN K
W P
ER 1
LIT
RE
DIS
PLA
CEM
ENT
BMW Fiat Ford Honda Hyundai Jaguar Mazda Mercedes
Nissan Opel Peugeot Renault Toyota Volvo VW

30
consumption years
manufacturers 2000 2001 2002 2003 2004 2005 2006 2007 2008 2009 2010 2011 2012 2013 2014 2015 Total
BMW 7,1894 6,4411 6,2300 6,2492 6,2210 5,7367 5,7081 5,1014 4,4427 4,4900 4,3694 4,4092 4,0280 4,0135 3,9625 3,9407 5,1528
Fiat 9,2842 9,2766 8,8733 8,9109 8,7817 8,6567 8,3871 7,9167 7,9167 7,6702 7,1427 7,1682 6,7938 6,7938 6,6014 7,2293 7,9880
Ford 9,5489 9,5489 8,6786 8,6355 8,6355 7,9438 7,9055 7,7920 7,7545 7,2712 7,0886 6,4552 6,3241 5,8317 5,8317 5,3883 7,5142
Honda 10,4052 10,4052 8,9429 7,7596 7,7217 7,7217 7,7996 7,7996 7,1893 6,7523 6,7295 6,6087 6,4374 6,4374 6,4374 6,4374 7,4850
Hyundai 10,3182 10,3182 10,1068 9,6128 9,1535 8,7815 7,6350 7,6350 7,4554 7,0339 7,3027 7,1386 6,1995 6,1995 6,1995 5,9167 7,6107
Jaguar 6,2296 6,4562 6,1828 6,1828 5,9589 5,9589 5,8639 5,9212 5,8293 5,6383 4,8128 3,6560 3,6560 3,8954 3,8954 4,0320 5,4405
Mazda 9,6334 9,6334 9,1234 8,9499 8,3118 8,2024 8,0170 8,0170 7,3883 6,7012 6,6148 6,4840 6,4436 6,1428 5,8705 5,4326 7,4834
Mercedes 7,5392 7,5126 7,2126 7,0990 7,1692 6,3621 6,1889 5,9518 5,9362 5,5591 5,3587 5,0407 4,9493 4,3389 4,2786 4,2235 5,9688
Nissan 10,0039 10,0039 10,0039 9,5007 9,5007 9,5007 10,9920 10,9920 9,2594 10,1237 10,1237 7,0845 7,0845 7,0845 7,2234 6,1934 9,1506
Opel 9,5394 9,5394 9,4826 9,3214 8,4714 8,5915 8,4722 8,4648 8,3957 7,9716 7,2290 7,1177 6,7437 6,5087 6,2929 6,1606 8,0351
Peugeot 8,9890 8,3398 8,2154 7,9338 7,9333 7,7332 7,6437 7,6437 7,1145 7,3580 6,8493 6,3598 6,1053 5,6035 5,3445 4,7617 7,1442
Renault 9,3023 9,1735 8,8302 9,0060 8,6404 8,5640 8,2184 8,1907 7,9788 7,7841 7,6735 7,3784 7,0074 6,6724 6,4512 6,4512 7,9264
Toyota 8,5642 8,4195 8,2503 8,2770 8,2439 8,1075 8,0154 7,9718 7,9718 6,8988 6,9199 6,9822 6,7722 6,4677 6,4266 6,3135 7,4963
Volvo 6,5762 7,0303 7,0303 6,9728 6,7780 6,8002 6,7156 6,7156 6,7156 6,2228 4,2844 4,3740 4,3592 4,3592 4,0322 4,0253 5,8886
VW 8,1220 8,0690 8,0487 8,0487 7,8961 7,6785 7,5952 7,5952 7,2179 6,6511 6,4582 6,2183 6,2183 5,7886 5,3022 5,0498 6,9973
Total 8,6116 8,3837 8,1735 8,0261 7,8625 7,5800 7,4002 7,2647 7,0358 6,6933 6,4908 6,1421 5,9055 5,6386 5,4668 5,2537 6,9926 Table 1: Average consumption (in litre/100 km per 100 kW engine power)

31
power years
manufacturers 2000 2001 2002 2003 2004 2005 2006 2007 2008 2009 2010 2011 2012 2013 2014 2015 Total
BMW 49,4311 51,8497 52,7311 52,2583 52,7525 55,8363 56,0933 59,1700 61,0092 60,4068 60,8319 61,3526 66,4206 66,3927 66,3927 66,6016 58,7346
Fiat 42,7519 42,6861 43,4402 44,0948 44,1757 44,8602 48,1610 55,2387 55,2387 55,4545 55,9895 55,9133 56,8296 56,8296 62,2385 59,5808 51,2336
Ford 42,9212 42,9212 45,0740 45,0740 45,0740 47,6177 47,6177 49,0191 49,0191 50,8011 51,0575 57,2000 59,7072 65,4527 65,4527 70,5638 52,2778
Honda 44,3840 44,3840 47,6558 49,1561 49,1561 49,1561 48,7258 48,7258 51,0986 54,1614 54,1614 54,1614 54,1614 54,1614 54,1614 54,1614 50,9814
Hyundai 45,5446 45,5446 43,9572 45,0012 44,3232 44,7187 49,2312 49,2312 50,0929 54,2545 51,3991 51,3991 55,5982 55,5982 55,5982 58,5037 50,7441
Jaguar 54,8915 56,1146 56,4625 56,4625 54,9634 54,9634 55,5996 55,0688 55,0688 55,8034 55,7899 57,8690 57,8690 77,0516 77,0516 75,5443 59,2633
Mazda 44,9640 44,9640 46,1116 44,6299 48,0849 48,3707 48,7282 48,7282 48,5682 49,5780 50,0067 50,8309 50,7595 51,8258 52,5177 52,7140 48,9735
Mercedes 45,9042 46,0522 47,0972 47,8104 47,9559 50,9993 52,3333 53,8939 53,8939 55,9343 57,0828 57,3837 57,9217 60,1930 61,4118 64,0918 53,5094
Nissan 43,2927 43,2927 43,2927 42,8007 42,8007 42,8007 42,8036 42,8036 47,6799 45,7771 45,7771 54,6745 54,6745 54,6745 54,6745 58,9503 46,8583
Opel 42,2421 42,2421 42,2421 41,8903 47,7299 47,1579 47,3665 47,7226 48,2789 52,2665 54,3099 54,3099 56,7901 57,5617 58,5988 58,7638 49,9008
Peugeot 44,0140 45,0137 45,5040 45,9611 47,6434 49,6169 50,1230 50,1230 52,7807 51,2998 53,6325 56,6247 56,3160 58,3164 57,9571 63,1493 51,6348
Renault 43,2630 43,9505 45,6054 47,2061 47,6366 48,5379 48,9871 50,7431 50,7853 51,5615 51,5615 51,9502 54,7398 55,6382 56,1931 56,1931 50,4275
Toyota 47,7210 47,2830 45,7782 46,2500 46,4505 47,9809 49,4890 50,7445 50,7445 53,3800 53,3047 53,2295 53,1294 53,0293 53,0293 53,0293 50,4024
Volvo 46,0805 47,1681 47,1681 47,3115 48,9368 48,6869 49,4643 49,4643 49,4643 52,5437 65,1751 76,5017 71,2820 71,2820 71,8565 68,8167 56,6240
VW 45,9711 46,4985 46,4985 46,4985 47,9965 50,1771 49,9794 49,9794 53,0065 55,4069 56,9801 56,9801 56,9801 59,2646 62,8062 62,5001 52,9702
Total 45,3329 46,0189 46,5287 46,8640 47,8775 49,3573 50,3233 51,6058 52,4360 53,9682 54,7286 56,5109 57,8468 59,5656 60,5763 61,9332 52,5962 Table 2: Average power (in kW per 1 litre displacement)

32
This isolation cannot be found in regard to power development, however the mentioned firms
dominating the consumption also show a strong performance in terms of power, with the exception
of Mercedes, which are considerably closer to the mainstream. Volvo here is a remarkable case with
an indistinguishable performance up until 2010, when a sudden rise occurs, surpassing the overall
stable and high performing BMW. Jaguar showed a better initial performance, being on par with
BMW but then experiencing a period of slump with virtually no development, only emerging the
mainstream in a similar way to Volvo in 2012. Lastly, it can be concluded that overall both variables
show a similar extent in development and an almost parallel progress. Overall, there can be no clear
preference identified towards one variable.
This data from the two variables can be further combined to improve the visualisation of the
findings. In calculating the percentage annual change in values for both variables per each
manufacturer and from this building an overall average percentage annual change for both variables
across the entire period and plotting these on a scatter diagram, the improvement of each
manufacturer in both variables becomes both apparent and comparable. Besides the previously
shown data that focusses on absolute values, this approach does also show the relative rate of
improvement, thus further revealing the performance of the manufacturers.
Figure 3: Overall annual percentage change in both consumption and power
-0,045
-0,04
-0,035
-0,03
-0,025
-0,02
-0,015
-0,01
-0,005
0
0 0 , 0 0 5 0 , 0 1 0 , 0 1 5 0 , 0 2 0 , 0 2 5 0 , 0 3 0 , 0 3 5 0 , 0 4
CO
NSU
MP
TIO
N
POWER
BMW Fiat Ford Honda Hyundai
Jaguar Mazda Mercedes Nissan Opel
Peugeot Renault Toyota Volvo VW

33
This for example reveals a strong performance in relative improvement from Peugeot, which
otherwise does not become as apparent from the figures with absolute values. Furthermore, this
direct comparison of values reveals the tendency each manufacturer shows in the rate of
improvement to either variable. Here, a majority of manufacturers shows a tendency to stronger
improvement in terms of fuel consumption than in power.
From this information and keeping in mind that these manufacturers account for the vast majority of
the car market, it is now possible to forge the data into a new graph in order to plot the trajectory,
therefore visualising the direction of innovation. The corresponding two figures (Figure 4 & Figure 5)
show both industry-wide development in both fuel consumption and power across all car classes and
distinguishing between both petrol and diesel. Below both figures, the corresponding development
across the entire period in percent is given.
This visualisation of the overall industry-wide development confirms what was already hinted in the
previous figures on all individual manufacturers. Especially overall, there is a steady improvement in
both variables, almost linear and remarkably equal in extent. The distinction between both types of
fuel offers a certain improvement in level of detail of industry observation.
Figure 4: Consumption, all manufacturers, all classes
Figure 5: Power, all manufacturers, all classes
-39% -37% -41%
37% 38% 37%
In terms of consumption, it becomes apparent that overall engines of both fuel types improved
rather parallel, no clear preference can be identified. However, from the percentage numbers, a
slight advantage in terms of consumption can be found for the diesel engine (+2 %), marginally
narrowing the gap between both fuel types. In terms of power, there is a different result, showing an
2
3
4
5
6
7
8
9
10
11
12
2000 2005 2010 2015
total petrol diesel
30
40
50
60
70
80
90
2000 2005 2010 2015
total petrol diesel

34
initial concentration in progress in diesel engines, leading to almost a closure of the gap between the
two fuel types around 2006 after a strong increase within only three years. Then, however, the rate
of improvement could not be maintained in diesel engines and as petrol-powered engines improved
their power at an increasing rate, diesel progress stabilised at a lower rate, further enlarging the gap
between the two. Eventually, this leads to an almost identical percentage of improvement. The
indication from this graph is that diesel engines, despite their initial upsurge in power performance,
cannot keep pace with the incipient technology push in petrol engines accelerating power
performance development mid-period.
Overall, this leads to a sound initial overview of the basic development of the industry and results in
trajectories revealing the direction of technological change for both variables. As apparent, both
trajectories in total are fairly linear and even when distinguishing between the two fuel types, a
difference becomes only apparent in power performance, suggesting the approach of a technological
ceiling for this fuel type. For a more detailed insight into the innovative performance of the different
manufacturers, the trajectories are subdivided into the different car classes. The existence of a
technical ceiling for diesel engines would thus become apparent, as would other characteristic
features of the trajectories.
Figure 6: Consumption, all manufacturers, class B
Figure 7: Power, all manufacturers, class B
-37% -35% -38%
35% 33% 50%
The smallest class of cars in this survey, class B, which corresponds to VW Polo / Ford Fiesta, instantly
shows the value of the further subdivision of the overall results for all classes. As can be seen in the
corresponding charts (Figure 6 & Figure 7), the results in this class are skewed from the overall
2
3
4
5
6
7
8
9
10
11
12
2000 2005 2010 2015
total petrol diesel
30
40
50
60
70
80
90
2000 2005 2010 2015
total petrol diesel

35
results. The consumption for both fuel types starts at a remarkably higher fuel consumption,
emphasising the importance of repeatedly pointing out that both variables are converted into
relative figures as explained in 3.2. Hence, these smaller cars do not show a real higher fuel
consumption than the average, but a higher relative consumption.
Overall, the consumption starts at a far higher level for both fuel types, with the difference between
both fuel types being more pronounced than across all classes. T progress along the period
resembles the all-classes progress, featuring one significant leap of petrol progress between 2008
and 2009. Eventually, however, as the percentage numbers show, both fuel types improve almost
equally well as overall, with diesel engines being 3 % stronger in improvement here instead of the 2
% overall. Furthermore, the imbalance between diesel and petrol engines in this class becomes
apparent from the shift of the total curve towards the higher petrol curve. As diesel engines were not
as widely spread as in other classes, at least at the beginning of the period, the diesel sample is
subsequently smaller.
The development of power performance shows similarities to the consumption figures, again
showing a lower overall level as compared to the overall figures. The progress itself of the curves
however comply with the observations made in the overall figures, also showing an initial catch-up
process of the diesel engine, resulting in almost equality between both fuel types, followed by an
onset in petrol performance development that the diesel cannot pursue. As above. Instead the
diesels’ performance remains at a slower rate and even shows signs of stagnation towards the end of
the period, whereas the petrol engines show another big leap towards the end of the period.
Furthermore, the remarkable low start of diesel performance at the beginning of the period has to be
pointed out, almost only reaching 75 % of the levels of the overall figures. This low start, followed by
the early and steep leap explains the variations of percentage improvements in this class as
compared to overall. While petrol motors show a weaker development in this class, (-5 %), diesel
engines achieve an improvement of 50 %, surpassing overall figures by 13 %.
The following class can be considered the most popular and most important class. Class C cars
include bestsellers such as the VW Golf or Peugeot 308 and this class is served by most
manufacturers, be it those that rather focus on smaller and cheaper cars or those that normally offer
bigger and expensive cars. Hence, it can be regarded as the class with most competition and
therefore biggest pressure to innovate.
This importance and dominance is mirrored in the charts (Figure 8 & Figure 9), showing a close
resemblance to the overall development in both progress but also values. As before, the
consumption shows the more steady development, with the absence of larger leaps. Only initially, a

36
stronger leap can be identified in diesel engines, but over the whole period, both fuel types show a
stable development with neither major leaps nor signs of stagnation. The percentage improvements
are in total only 1 % better than overall, as the diesel engines improved by 43 % rather than 41 %.
Figure 8: Consumption, all manufacturers, class C
Figure 9: Power, all manufacturers, class C
-40% -37% -43%
37% 37% 45%
In terms of power, again a similar pattern to the overall data can be seen. An initial surge in diesel
performance, narrowing the gap, is followed by a rise in petrol performance, leading to an increasing
distance between both fuel types. However, diesel development does not set in as abrupt as in class
B or as late as overall, but instead shows a gradual progression, indicating an innovative process
already at work at the beginning of the period. Furthermore, the approximation between both fuel
types mid-period is not as pronounced as in the previous charts and the following upsurge in petrol
technology is both stronger and irregular, with distinctive steps being identifiable. Stagnation in
diesel technology can also be identified, however at a very late stage of the period and only after
another significant step upwards. In total percentage figures, class C developed identical to all classes
combined at 37 % improvement. However, as in class B, the development is skewed towards diesel
engines, although not as distinct, with diesel engines improving by 45 % as compared to 37 % overall.
2
3
4
5
6
7
8
9
10
11
12
2000 2005 2010 2015
total petrol diesel
30
40
50
60
70
80
90
2000 2005 2010 2015
total petrol diesel

37
Figure 10: Consumption, all manufacturers, class D
Figure 11: Power, all manufacturers, class D
-42% -41% -41%
38% 44% 31%
The following class, consisting of cars such as the 3 series by BMW or the Volvo S60 shows different
results than the previous two classes. As becomes apparent from the related graphs (Figure 10 &
Figure 11), the curve shapes show a stronger resemblance to those of the overall data. In contrast to
the previous classes, the consumption data does not show the characteristic initial focus on diesel
development. Instead petrol engines are advancing at a higher rate before being interrupted by a
peculiar outlier in 2004, after which it took a couple of years to gain momentum again. The diesel
engines, although progressing gradually for the first two thirds of the period, match this velocity only
with the big step they make between 2010 and 2011, before again showing signs of slowing.
However, as the last entry for 2015 proves, the stagnating tendencies of the neighbouring class C are
not shown. The percentage change in consumption is in equilibrium, with both fuel types improving
by 41 %.
Development in power shows a relatively late and subtle start in diesel engines, while petrol engines
at the beginning of the period are showing a higher development rate than in the lower classes. As
before, the comparably stronger development in diesel engines narrows the gap between both fuel
types towards a minimum between 2005 and 2006, earlier than in class B and narrower than in class
C, before development in petrol engines rises here too. Here, however, the development in petrol
engines is far more pronounced than in the previous classes, also excelling the combined average
classes, leading to a growing gap between both fuel types, despite diesel engines also showing a
stronger development than the two lower classes and on average. Furthermore, diesel engines show
2
3
4
5
6
7
8
9
10
11
12
2000 2005 2010 2015
total petrol diesel
30
40
50
60
70
80
90
2000 2005 2010 2015
total petrol diesel

38
no sign of stagnation towards the end at a level significantly higher than the previous classes.
Interestingly, when looking at the percentage improvement in power for this class, the total almost is
the same as the previous class at 38 %, however instead of diesel engines, here petrol engines see
the higher progress with 44% as compared to 31 % in diesel engines, therefore offering an inversed
picture of the previous class.
Lastly, the biggest class in this survey, class E containing cars such as the Mercedes E class or the
Jaguar XF shows the most interesting data variation as compared to the average figures. As becomes
apparent from the graphs (Figure 12 & Figure 13), the total values resemble those of all classes
combined, but the distinction between the two fuel types reveals differences in this class as
compared to the previous smaller classes.
Figure 12: Consumption, all manufacturers, class E
Figure 13: Power, all manufacturers, class E
-42% -40% -43%
37% 46% 29%
Most notably, in terms of fuel consumption, there is a strong proximity between petrol and diesel
engines, with roughly one litre difference as compared to the approximately 3 litres at the beginning
of the period in class B. Not only are both fuel types remarkably close to each other throughout the
whole time period, but also show almost parallel development with only small occasional steps in
individual years. Eventually, both fuel types show a tendency towards stagnation in the last years of
the period at a noticeably low level of fuel consumption. In percentages, the class shows as much
improvement as adjacent class D at 42 %.
2
3
4
5
6
7
8
9
10
11
12
2000 2005 2010 2015
total petrol diesel
30
40
50
60
70
80
90
2000 2005 2010 2015
total petrol diesel

39
As mentioned, for the development in power, the total figures resemble those of both the previous
classes as those of the overall average. However, the two fuel types develop rather differently here
as previously. Diesel engines show a rather slow development in power at the beginning, as in class
D, however the emerging development gains more momentum as in the neighbouring smaller class
up until 2006, while petrol engines in this period show only weak development. After three years of
relative parallelism, yet maintaining a bigger gap between the two than in class D, the upsurge of
diesel engines is mirrored by a corresponding upsurge in petrol engines in two steps until 2015 up to
almost 80 kW per litre displacement, leaving the diesel engines far behind. Those, interestingly, were
not able to keep the pace of the first half of the period and showed clear signs of stagnation and
even decline at around 60 kW in 2015. It should be noted that this roughly equals the value at which
diesel engines of the lower class D also showed signs of stagnation, supporting the notion of a
technological frontier around this level. As before, the percentage figures reveal a concentration in
power progression in petrol engines, even more pronounced than in class D, with 46 % increase in
petrol engines, as opposed to only 29 % in diesel engines, the lowest growth of diesel power of all
classes.
Overall, these figures give an idea of the technological performance within the industry, hence
revealing the technical innovation potential within this period. Not only do they reveal the general
path the development has taken in the entire industry, but also offer insights on where technical
progress was steered at in the different classes. Diesel engines saw their biggest innovative potential
in terms of power growth in the smallest class of cars, doubling average power in only 15 years,
whereas the same almost holds true for petrol engines in the largest class. Interestingly, this
dispersion across the classes cannot be seen in the consumption figures. Here, innovation occurred
much more linear, with both fuel types showing similar rates of improvement and also across all
classes. Considering power to be the more emotional variable of the two, this might indicate a
conscious concentration from the manufacturers on the fuel types in each class to fulfil customer
needs, whereas the overall linear reduction in consumption hints for a larger scale reason equally
effective across all classes and fuel types, such as a policy. After having revealed what general
innovation in the automotive sector means, it is now possible to compare the individual performance
of the manufacturers with this.

40
4.2 Technical Performance
In the following, the individual manufacturers will be examined. For this purpose, general charts
according to the previous charts across all classes are shown. For further enhancement, class-specific
graphs are also shown, comparing the manufacturer’s performance in this class with the overall
average of all manufacturers. For the purpose of maintaining clarity and simplicity within this work,
these class-specific graphs are shown in the appendix and referred to accordingly.
4.2.1 BMW
Figure 14: Consumption, BMW, all classes
Figure 15: Power, BMW, all classes
-45% -40% -50%
35% 36% 36%
As already mentioned when looking at the overall performance in 4.1, BMW shows a strong
performance as compared to the manufacturer average. In terms of consumption, they are already
1.5 litres ahead of the average at the beginning of the period, indicating a strong innovative potential
that already has been successfully used before the time period. Throughout the period, BMW
succeeds to accomplish significant improvements in terms of fuel consumption at a rather early
stage. Towards the end however, these gains show signs of stagnation, especially visible in two
distinctive plateaus forming for petrol engines from 2008 onwards, showing no progress since 2012,
yet at a remarkably low level. This is also mirrored in the percentage figures of improvement,
showing above average improvement in all fuel types ( -45 % as compared to -39 % in total) and a
2
3
4
5
6
7
8
9
10
11
12
2000 2005 2010 2015
total petrol diesel
30
40
50
60
70
80
90
2000 2005 2010 2015
total petrol diesel

41
strong focus of improvement for diesel engines, where they achieve cutting consumption to 50 %,
nearly 10 % more than the average.
Power is characterised by a remarkable proximity of both fuel types across the period and even
showing equality mid-period, before a steep development in petrol engines leads to a bigger gap
between both types. Percentage-wise, the development does not exceed the overall development,
however despite the four years of stagnation in both fuel types, the nominal values stay above the
average.
In terms of classes, BMW is only present in the three biggest classes (Figure 48 – Figure 53). Here,
throughout all classes, a performance above average is shown. Interestingly, the performance
nominally does not vary strongly across the classes, showing similar figures and development in
consumption and power across all classes. This does indicate a broad use of researched technology,
as they manage to improve their variously sized engines across their classes towards a similar level of
technology. At the average figures, in contrast, especially the smaller engines show worse technical
figures than the bigger engines. Hence, the comparative advantage of BMW is more pronounced in
the smaller classes and is only marginal in the biggest class E, where the competitors achieve a
similar level in both categories. Even in the smaller classes, the late phases of stagnation cancel out
the initial strong performances, leading to an overall percentage advantage of roughly 10 % in the
smallest class and virtually no advantage in class D. This could either indicate a general technical
ceiling that BMW reached beforehand and others later approached too, or BMW losing its innovative
potential, thus experiencing a personal technical ceiling. While BMW is still maintaining a slight
advantage, both could hold true and so far do not impose an imminent threat, but as soon as the
other manufacturers manage to further improve their values, thus disproving the existence of a
general technical frontier and revealing the problems to lie within the company.
4.2.2 Fiat
Fiat is a manufacturer more focussed on the smaller cars and revealing larger gaps in its highest class
D. In an attempt of consolidation, the range of products has been reduced throughout the whole
period of assessment, focussing on successful models at the lower end of the size scope. The current
restart with modernised bigger models from 2016 onwards was not captured in this work, thus
leading to results characterised by the shrinking and omitting the regrowth that is yet to come.
The results for Fiat (Figure 16 & Figure 17) show a stark contrast to the overall figures and especially
those of BMW before. Development seems more erratic and inconsistent, as both variables show a

42
phase of negative development at the end of the period for both fuel types. Although especially
concerning power, the data shows remarkable steps in both types between 2005 and 2007, when a
new generation of innovative turbo engines was introduced, the curves are also characterised by
pronounced phases of stagnation.
The development in consumption seems less drastic, but more linear, with only one major step
corresponding the petrol development between 2006 and 2007 linked to the aforementioned turbo
engines. Nevertheless, stagnation towards the end of the period, not to mention the final rise, occurs
at roughly one litre above the average at all fuel types.
Figure 16: Consumption, Fiat, all classes
Figure 17: Power, Fiat, all classes
-22% -25% -24%
39% 38% 33%
When looking at the class-specific data (Figure 54 – Figure 59), the picture improves slightly. In its
main classes B and C, Fiat shows a robust performance. Consumption in these classes is characterised
by a development according to the average, resulting in a strong overlap of both curves and Fiat’s
curve oscillating around the average curve. Here, the explanation for the rise in values for Fiat’s
overall graph becomes apparent. As bigger models and their engines were cancelled, the weight of
the comparably worse smaller engines increased, leading to a rise on overall figures, which is not
mirrored in the class-specific performance.
In terms of power, the smallest class is characterised by a distinct catch-up throughout the entire
period, starting below average and ending above, resulting in a remarkable percentage increase in
power of 80 %. The bigger class C is characterised by an overall better performance as compared to
2
3
4
5
6
7
8
9
10
11
12
2000 2005 2010 2015
total petrol diesel
30
40
50
60
70
80
90
2000 2005 2010 2015
total petrol diesel

43
the average across the whole period and by the protruding step caused by the introduction of said
innovative engine generation. Overall and percentage-wise, the performance can be considered
comparable to the average. The last figures for class D possibly explain the reasons for the
restructuring of the range of models in favour of the smaller models. In terms of consumption, Fiat’s
models have never been better than the average and even in terms of power, there was only a short
phase of competitiveness after the introduction of the new motors, which however did not lead to
the initialisation of momentum to keep pace with the overall development pace. As already
mentioned, the average engines of the higher classes are technically on a higher level than the
smaller, so it was only consequent of Fiat to retreat from this segment given the available
technology.
4.2.3 Ford
Figure 18: Consumption, Ford, all classes
Figure 19: Power, Ford, all classes
-44% -46% -39%
64% 71% 42%
Ford is a rather versatile manufacturer that is strong in both the lower and the bigger size classes,
although not present in the biggest class E. As becomes apparent from the graphs (Figure 18 & Figure
19), their development is characterised by a strong performance in both categories. Despite starting
with total consumption values of approximately one litre above the average, they manage to achieve
average values at the end of the period. Not excelling average values is due to the comparably poor
performance in diesel engine development, which is characterised by a big step between 2004 and
2
3
4
5
6
7
8
9
10
11
12
2000 2005 2010 2015
total petrol diesel
30
40
50
60
70
80
90
2000 2005 2010 2015
total petrol diesel

44
2005, but otherwise rather mediocre development. Both combined lead to a percentage
improvement almost reaching average values (-39 % as compared to -41 %). Petrol engines however,
show a 9 % higher improvement rate than average, indicating a strong focus on petrol engines.
This focus can even clearer be identified when looking at power development. Whereas diesel
engines show only two distinctive steps of improvement and otherwise rather stagnating progress,
petrol engine development is characterised by extraordinary progress from 2010 onwards that does
not show any sign of stagnating or even slowing tendencies. Furthermore, the clear focus on petrol
engines can be clearly identified by the shift of the total curve closely towards the petrol curve.
Overall, Ford achieves a total power improvement of 64 %, as compared to 37 % by all manufacturers
and even 71 % in petrol engines as opposed to only 38 %, nearly doubling the average.
Class-wise, the focus of Ford on improvement in terms of power becomes apparent. The
consumption development across the classes mirror previously experienced patterns. The
development of the smallest class is characterised by a successful development from initial above-
average values towards below-average figures, while the middle class C shows a development
oscillating around the average curve, with initial and final values equalling average values. The
biggest class is characterised by consumption development above average throughout the entire
period, despite the technological advances.
In terms of power however, the strong potential from Ford becomes clearly apparent. Across every
class, they manage to achieve a remarkable result due to the significant upsurges from 2010
onwards, when they introduced their advanced turbocharged engines. Interestingly, this increase in
power does withstand the increasing competitive pressure with increase in size classes, leading to a
64 % increase in class B and even 69 % increase in class D, therefore remaining competitive across all
classes. Furthermore, their results challenge the notion of a general technological frontier derived
from BMW’s late stagnation.

45
4.2.4 Honda
Figure 20: Consumption, Honda, all classes
Figure 21: Power, Honda, all classes
-38% -33% -8%
22% 25% 7%
Honda is a manufacturer more focussed on the smaller classes, similar to Ford, but lacking their
aggressive technology push and being rather inconspicuous. Their overall values (Figure 20 & Figure
21) mirror this illustratively. The consumption figures are dominated by development in petrol
engines, which itself mainly consists of two separate phases of improvement until the middle of the
period and otherwise stagnating. This is only surpassed by the development in diesel engines, which
only shows a slight improvement mid period and a solid phase of late stagnation at a comparably
high level. This is also shown in the percentage figures, where the two steps in petrol development
still accumulate 33 %, but diesel improvement only amounts to a meagre 8 % drop in consumption.
A similar picture can be found when assessing the power values for Honda. Again, it is characterised
by two steps of improvement in petrol engines, corresponding to the steps in consumption progress,
with the lately introduced diesel engines picking up the second step. Otherwise, there is virtually
complete standstill in engine development, resulting in extraordinarily meagre improvement
percentages of as low as 7 % for diesel engines.
When assessing the class values (Figure 66 – Figure 71), an interesting picture can be identified.
Despite the low amount of innovative activity, Honda seems rather healthy in both classes B and D.
The distinctive steps of innovation at least in terms of consumption ensure a competitiveness with
the other manufacturers, as the big steps of improvement result in a couple of years grace period
2
3
4
5
6
7
8
9
10
11
12
2000 2005 2010 2015
total petrol diesel
30
40
50
60
70
80
90
2000 2005 2010 2015
total petrol diesel
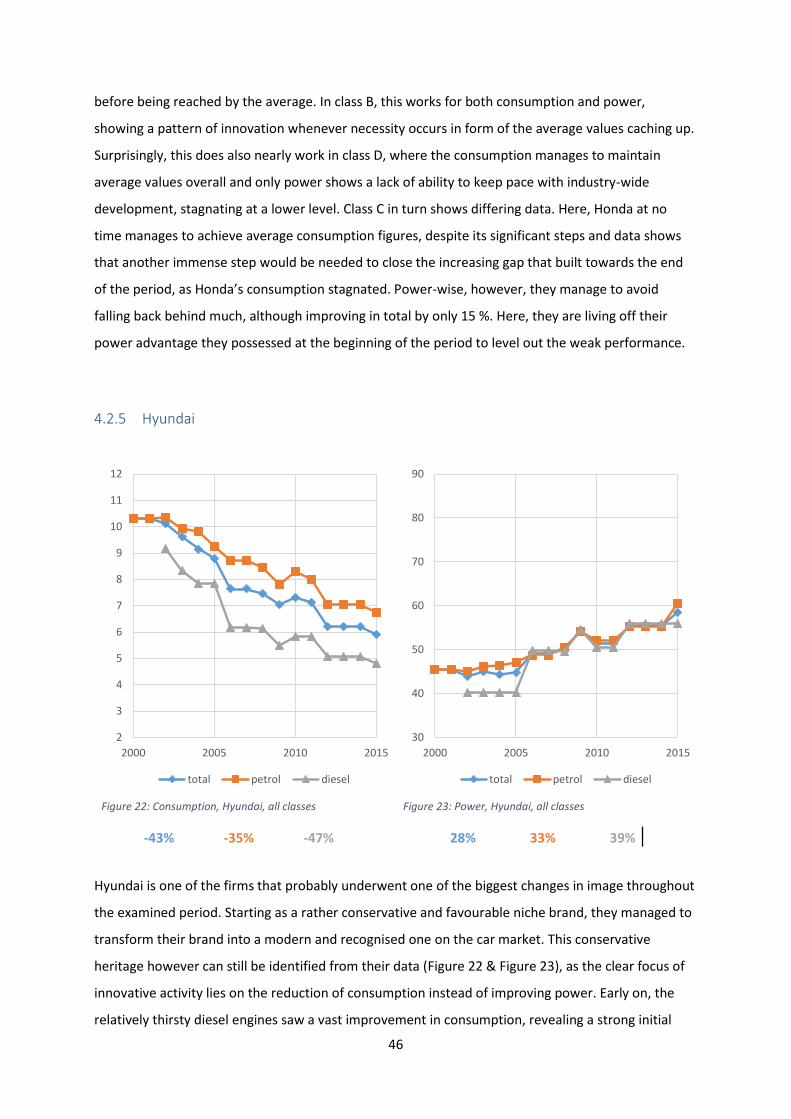
46
before being reached by the average. In class B, this works for both consumption and power,
showing a pattern of innovation whenever necessity occurs in form of the average values caching up.
Surprisingly, this does also nearly work in class D, where the consumption manages to maintain
average values overall and only power shows a lack of ability to keep pace with industry-wide
development, stagnating at a lower level. Class C in turn shows differing data. Here, Honda at no
time manages to achieve average consumption figures, despite its significant steps and data shows
that another immense step would be needed to close the increasing gap that built towards the end
of the period, as Honda’s consumption stagnated. Power-wise, however, they manage to avoid
falling back behind much, although improving in total by only 15 %. Here, they are living off their
power advantage they possessed at the beginning of the period to level out the weak performance.
4.2.5 Hyundai
Figure 22: Consumption, Hyundai, all classes
Figure 23: Power, Hyundai, all classes
-43% -35% -47%
28% 33% 39%
Hyundai is one of the firms that probably underwent one of the biggest changes in image throughout
the examined period. Starting as a rather conservative and favourable niche brand, they managed to
transform their brand into a modern and recognised one on the car market. This conservative
heritage however can still be identified from their data (Figure 22 & Figure 23), as the clear focus of
innovative activity lies on the reduction of consumption instead of improving power. Early on, the
relatively thirsty diesel engines saw a vast improvement in consumption, revealing a strong initial
2
3
4
5
6
7
8
9
10
11
12
2000 2005 2010 2015
total petrol diesel
30
40
50
60
70
80
90
2000 2005 2010 2015
total petrol diesel
47
focus on this type of fuel that possesses a strong importance on the assessed European market and
hence was considered vital for the survival and subsequent establishment. The short phase of rise in
consumption can again be traced to the temporary absence of bigger models in these years, resulting
in a rise of average values in this period.
Power development shows is rather weak and only characterised by an initial upsurge in diesel
power in order to achieve competitiveness. While diesel engines subsequently show values according
to the average, petrol engines lack behind in power development, only showing a tendency towards
the end of an insetting push of innovation.
Class-wise (Figure 72 – Figure 77), the initial tendency towards conventionality is confirmed by the
data. Across all classes, a development at the pace of the average industry is shown in both
consumption and power. In the bigger classes, there are signs of a strong and targeted innovative
effort in order to achieve competitiveness and improving values towards average standard, but
besides these initial sparks, there are neither signs of weaknesses nor signs of innovative strength, let
alone technology leadership. Innovation here seems to be a measure to remain in the midfield, but
not to stand out. Simultaneously, the absence of remarkable weaknesses across all classes hints a
well-balanced innovative system that is used in a very precise way and to a clear extent – and has
been so far successful in doing so.
4.2.6 Jaguar
Jaguar is a clear and distinct premium brand. Their range of products is limited to the biggest two
classes, with even the bigger one only being covered since one year before the assessment period. Its
heritage clearly lies in big luxury vehicles and the advance into the lower car classes was both an
experiment and a necessity. An experiment, because so far, the brand has only offered highly
luxurious cars in classes not even covered in this work and the reaction of the customer was
uncertain for the most part of the period covered here and a necessity, as in order to stay
economically viable in the increasingly tough automotive market, sales figures had to increase. This
was enabled by the affiliation with Ford, providing the basic elements to undertake this revolutionary
expansion of business activities. Simultaneously, the affiliation with Ford leads to another
phenomenon, making Jaguar one of the two special cases besides Volvo in this work. Both have been
sold by Ford in the second half of the observed period. This can be seen descriptively by the figures
for Jaguar (Figure 24 & Figure 25), showing both the technical reluctance up until the sale and the
subsequent sudden onset of innovation due to availability of funds.

48
Figure 24: Consumption, Jaguar, all classes
Figure 25: Power, Jaguar, all classes
-35% -29% -40%
38% 52% 15%
An interesting feature is the closeness of both fuel types, both in terms of innovative preference, but
also performance. This only unravels with the big innovative steps towards the end, were diesel
engines do not improve their power at all. The overall averages are again skewed by the temporary
absence of a class D car until introduction of the Jaguar XE in 2015, but nevertheless, the surge can
also be identified in the class figure.
These class figures (Figure 78 – Figure 81) reveal, that Jaguar throughout the entire time period
performed remarkably well without much innovative activity due to advantages at the beginning of
the period. Hence, as becomes apparent in consumption figures of class D, virtually without any
progression, Jaguar remained below average up until 2008, which is also the case for the power
development in this class. The only positive development occurring was in form of the introduction
of the new XE model with the new owner Tata, instantly rendering Jaguar above average again,
especially in terms of power, achieving a remarkably high value.
The similar pattern can be seen in the bigger class E, where also only slight development occurred in
both variables, leading to Jaguar living off its initial advantage. In terms of consumption, this
advantage however is not as pronounced, leading to a closer progression along the average than in
terms of power. Nevertheless, in both cases, Jaguar’s reserves enable above-average figures up until
2005, when remaining innovative efforts under the ownership of Ford were focussed on keeping
pace with industry-wide development of consumption, while power stagnated. Interesting here,
2
3
4
5
6
7
8
9
10
11
12
2000 2005 2010 2015
total petrol diesel
30
40
50
60
70
80
90
2000 2005 2010 2015
total petrol diesel

49
despite Jaguar being a niche manufacturer providing with only a small sample to this work, is the fact
of being able to observe the effect of changing ownership in terms of innovative activity. As soon as
the new owner took over and provided both a perspective and funds, Jaguar was almost instantly
able to develop highly innovative products that even surpass the established German competitors at
the premium end of the range. These astonishing innovative results are remarkable for such a small
company.
4.2.7 Mazda
Figure 26: Consumption, Mazda, all classes
Figure 27: Power, Mazda, all classes
-44% -37% -46%
17% 10% 45%
Similar to Honda, Mazda is a Japanese manufacturer long established on the European market,
focussing on smaller cars. Again, this is a typical manufacturer operating in the midfield and from its
overall figures (Figure 26 & Figure 27), it becomes apparent that innovative activity was mainly
channelled into lowering consumption instead of increasing power. In total, Mazda achieved a
lowering by 44 % in consumption, but only a 17 % increase in power, with the exception of a bigger
rise in diesel power towards the beginning of the period to reach a comparative level. The stagnation
in power sets in at a level that the other manufacturers reached on average in 2009. In terms of
consumption however, Mazda achieves to maintain a relatively competitive level in both fuel types,
but again shows no signs of extraordinary technology.
2
3
4
5
6
7
8
9
10
11
12
2000 2005 2010 2015
total petrol diesel
30
40
50
60
70
80
90
2000 2005 2010 2015
total petrol diesel

50
Class-wise (Figure 82 – Figure 87), these findings are confirmed. Interestingly, Mazda’s initial position
in terms of consumption is the better the bigger the class, with the consumption values in class B
being almost 2.5 litres above the anyway high average. Nevertheless, in all classes, technical progress
can be identified in attempting to maintain average levels throughout the entire period and also
succeeding doing so. It is another prime example of a manufacturer pursuing a rather purposeful
innovation strategy just so far as to maintain competitiveness and being satisfied in the midfield.
Strongest innovative efforts can be seen in the smallest class in the initial attempt to lower
consumption to industry-levels.
In terms of power, a similar pattern can be seen, being aggravated by the fact that Mazda’s subtle
innovation strategy seems to preferably focus on lowering consumption. Therefore, there is now
improvement in power in class B over the entire fifteen years, instead only slight rises in the second
half can level out initial deterioration in power values. The other classes show at least a positive
development in terms of power, but again are also characterised by strong periods of stagnation and
a growing gap between industry average and manufacturer’s values.
4.2.8 Mercedes-Benz
Figure 28: Consumption, Mercedes, all classes
Figure 29: Power, Mercedes, all classes
-44% -47% -40%
40% 47% 31%
2
3
4
5
6
7
8
9
10
11
12
2000 2005 2010 2015
total petrol diesel
30
40
50
60
70
80
90
2000 2005 2010 2015
total petrol diesel

51
Mercedes-Benz, as a premium brand oriented at the bigger car classes shows a distinctive difference
in its data (Figure 28 – Figure 29) as compared to both the industry-wide average, but also one of its
traditional competitors, BMW. As with BMW, a strong correlation between both fuel types can be
observed, however, as opposed to BMW and the industry average, not in terms of power, but rather
in consumption. This is insofar remarkable as diesel engines’ popularity is largely explained by the
advantages in terms of fuel consumption. The explanation lies in the combination of a slightly worse
value in diesel consumption and a slightly better value for petrol engines, as compared to BMW.
Furthermore, innovative activity, with the exception of a bigger step between 2004 and 2005, seems
rather linear and well-balanced between diesel and petrol engines.
Power development similarly shows a parallel progression between the fuel types, indicating
however an advantage in petrol engine development, as the gap between both types is increasing
with time and eventually shows an upward surge tendency for petrol and a stagnation tendency for
diesel.
Class-wise (Figure 88 - Figure 93), surprising results are revealed. The smallest class, not a class
traditionally associated with Mercedes, shows the manufacturer’s biggest problems with innovation
in terms of consumption only maintaining average levels by two distinctive steps of progress, while
otherwise stagnating. In power, there is almost no development up until 2012, far below the industry
average that only can be set off by a remarkable step upwards, however still not reaching average
levels. This is astonishing for a brand with an image such as Mercedes. In class D, Mercedes shows
the best performance, although limited to steady and gradual innovation, clearly focussed though on
improvement in consumption and only recently power. Class e performance can be considered
disappointing for a brand with such a focus. Both consumption and power almost entirely remain
below industry average, power even further falling behind towards the end. A distinctive innovative
input as can be seen at Ford or Jaguar lacks completely, which is surprising due to the financial
background of the manufacturer.
4.2.9 Nissan
Nissan is the third of the rather conservative Japanese brands besides Toyota on the European
market. As with the others, it has established its niche, but is lacking a clear and distinctive profile
that would protrude from the industry average. As with Fiat, the sample of Nissan is characterised by
a small size and gaps in the higher of the two classes where it is present. Nissan is not as focussed as
other manufacturers on offering a complete range of products on the European market, but instead

52
concentrates on a smaller number of successful models, which is unfortunately mirrored in this
sample.
As becomes apparent from the figures (Figure 30 & Figure 31), the data is dominated by the small
sample size and the gaps in it, leading to rather distorted overall graphs. Nevertheless, they indicate
both a rather weak start and irregular innovation activity, primarily dominated by a huge step
Figure 30: Consumption, Nissan, all classes
Figure 31: Power, Nissan, all classes
-38% -38% -39%
36% 33% 49%
between 2010 and 2011 resulting in a significant improvement in petrol consumption, but also petrol
power. Interestingly, the diesel engine performance is not as far behind initially and despite the
immense gaps, the introduction of modernised diesel engines shows competitive values, despite
activity clearly being focussed on petrol engines.
Class-wise (Figure 94 – Figure 97), only class B offers viable information as the gaps in class C are too
big to reveal much more than the ability to introduce competitive engines in 2015, after largely
stagnating in the beginning and showing erratic engine values in between, if any at all. In class B,
however, it becomes apparent that Nissan largely stayed behind in fuel consumption and eventually
in power, as there is almost no sign of any innovative activity up until 2010, where a single big step
was achieved in both variables, catching up to industry levels, but nothing else. It might be that
neither the market nor the offered and examined products are prioritised by Nissan far enough to
2
3
4
5
6
7
8
9
10
11
12
2000 2005 2010 2015
total petrol diesel
30
40
50
60
70
80
90
2000 2005 2010 2015
total petrol diesel

53
trigger further innovative activity. In any case, these results surprise considering a globally active,
established and big car manufacturer such as Nissan.
4.2.10 Opel
Figure 32: Consumption, Opel, all classes
Figure 33: Power, Opel, all classes
-35% -34% -36%
39% 38% 45%
Opel, together with its British twin brand Vauxhall that will always be considered included in this
work, is a car manufacturer rather focussing on the smaller end of the model spectrum and
belonging to General Motors. In comparison to the average development, the graphs (Figure 32 &
Figure 33) show certain anomalies. In terms of consumption, it becomes apparent that Opel is
constantly lacking behind by roughly a litre both at the start and the beginning of the period and in
both fuel types. Innovative activity seems to be rather focussed on the power development, where a
stronger development can be noticed. However, even this does not enable Opel to overall achieve
average values here, let alone such upsurges in power as Ford, one of Opel’s main direct contestants,
attained.
In the class-wise data (Figure 98 – Figure 103), this general impression is largely confirmed. The
below-average performance in terms of consumption can be found across all classes, with all three
showing a similar pattern of innovation with the introduction of new model generations and
stagnating phases in between. Power-wise, the rather poor performance in class B stands out,
2
3
4
5
6
7
8
9
10
11
12
2000 2005 2010 2015
total petrol diesel
30
40
50
60
70
80
90
2000 2005 2010 2015
total petrol diesel

54
showing almost no variation from 2004 onwards. In class C, however, a stronger effort to keep pace
with average figures is made, with each new introduction narrowing the gap again, despite never
reaching it
Then, there is the surprising performance in class D, where Opel not only manages to keep pace with
the average development in power, but from mid period onwards even manages to build and expand
a lead. It might not be an improvement as strong as Ford’s, but it still shows the innovative potential
within the brand.
4.2.11 Peugeot
Figure 34: Consumption, Peugeot, all classes
Figure 35: Power, Peugeot, all classes
-47% -39% -55%
43% 45% 69%
Peugeot is similarly set as Opel or Ford, with a strong range of products in smaller and middle size
classes and a pronounced reputation for diesel engines that is also mirrored in its data (Figure 34 &
Figure 35). Across all classes, the consumption values of diesel engines are always better than
average and improve stronger than petrol values, indicating a focusing. Power-wise, the values are
characterised by as strong initial improvement in power values for diesel engines, even surpassing
petrol engines, while then phasing out and in turn petrol engines being target to strong improving
activities. Overall, Peugeot shows a strong innovative activity across both fuel types, especially in
terms of power.
2
3
4
5
6
7
8
9
10
11
12
2000 2005 2010 2015
total petrol diesel
30
40
50
60
70
80
90
2000 2005 2010 2015
total petrol diesel

55
This is also mirrored in the class-wise data (Figure 104 – Figure 109), where at least in terms of
consumption, Peugeot eventually manages to perform above-average, despite certain negative peaks
in both the smallest and the largest class mid-period. In terms of power, the performance is more
linear and always close to the average figures and in all classes showing a positive tendency
eventually. Peugeot might not be the most innovative manufacturer in this survey across all classes,
but it manages to achieve sound innovative progress across a large span.
4.2.12 Renault
Figure 36: Consumption, Renault, all classes
Figure 37: Power, Renault, all classes
-31% -28% -40%
30% 24% 37%
Renault is the natural competitor of Peugeot, with a very similar range of products. This similarity can
also be seen from the comparison of the graphs (Figure 36 & Figure 37), showing a strong
resemblance between the two. However, the graphs also show that Renault cannot achieve the level
of innovative progress in neither consumption nor power development. Especially towards the end,
Renault shows tendencies towards stagnation, while Peugeot shows signs of further development.
This is also seen in the class-wise data (Figure 110 – Figure 115). In terms of consumption, the
strongest performance is seen in class B, where Renault only manages to hold the average levels. In
the other two classes, despite gradual innovation, average levels cannot be held and a gap is building
2
3
4
5
6
7
8
9
10
11
12
2000 2005 2010 2015
total petrol diesel
30
40
50
60
70
80
90
2000 2005 2010 2015
total petrol diesel

56
up with the time. The most innovative activity here in the end of the period can be seen in class C,
while class D shows signs of stagnation.
In terms of power, the strongest performance can also be seen in class B, where a strong mid-period
push in combination with slight and more gradual improvements overall ensure being above average
for the second half of the period. This gradual improvement is absent in class C, which is
characterised by two distinctive steps, which however cannot outreach overall average progress
consistently and only reach these levels. This is not accomplished in class D, where the second half of
the period is dominated by a prolonged phase of stagnation and a subsequently increasing gap.
4.2.13 Toyota
Figure 38: Consumption. Toyota, all classes
Figure 39: Power, Toyota, all classes
-26% -21% -32%
11% 11% 27%
Toyota is the strongest of the Japanese brands, worldwide and on the European market and
infamously known for its eco-friendly hybrid cars, where they play a pioneering role. A certain affinity
to eco-friendliness can also be identified from the graphs (Figure 38 & Figure 39), where Toyota
shows remarkable low initial values in terms of consumption – at least for their petrol engines. The
proficiency in diesel engines, despite constant effort for improvement, is not strong enough to reach
average diesel consumption levels in 2015, while petrol development seems stalled up until 2008,
when a big step separates another portion of stagnation until 2015.
2
3
4
5
6
7
8
9
10
11
12
2000 2005 2010 2015
total petrol diesel
30
40
50
60
70
80
90
2000 2005 2010 2015
total petrol diesel

57
Interestingly enough, this is also mirrored in terms of power development. An initial surge to improve
diesel engines does not reach overall average levels and transfers into a long phase of stagnation,
while petrol engines, with the exception of one distinct step, remain stagnant throughout the entire
period.
From the class-wise data (Figure 116 – Figure 121), this is also confirmed. While the subtle innovative
activity is enough to maintain above-average performance in both categories in class B for most of
the time, it results in below-average performance in the bigger classes. In both cases, towards the
end a complete absence of activity can be noted, which for a manufacturer with a reputation such as
Toyota comes extremely surprising.
4.2.14 Volvo
Figure 40: Consumption. Volvo, all classes
Figure 41: Power, Volvo all classes
-39% -40% -43%
49% 45% 33%
As already mentioned, Volvo is the second special case in this work next to Jaguar. Just as the latter,
Volvo has been part of the Ford Group and then found new owners following the sale by Ford. In
Volvo’s case, this is Geely from China, which, in a similar way to Tata with Jaguar, mostly limits itself in
providing funds and leaving the operational business to the Swedes. The range of products is also
characterised by a premium claim and dominated by larger cars. Ford’s legacy can be descriptively be
seen from the graphs (Figure 40 & Figure 41). The existence under the ownership of Ford is largely
2
3
4
5
6
7
8
9
10
11
12
2000 2005 2010 2015
total petrol diesel
30
40
50
60
70
80
90
2000 2005 2010 2015
total petrol diesel

58
dominated by the complete absence of innovation with the only progress noticeable in diesel engine
improvement. This however rapidly changes around 2010, when suddenly an extreme upsurge sets in
for both petrol and diesel engines in consumption and power. While diesel engines see an incredible
improvement in consumption figures, petrol engines see a rise to power levels far above the average.
This is further confirmed by the class-wise data (Figure 122 – Figure 125), where consumption
development keeps up with industry-wide values, but especially in class E, the upsurge in power is
exceptional. Given the previous rather disappointing performance by Toyota, Volvo’s performance is
a nice surprise. As with Jaguar, a brand that has been deemed dead with the purchase by unestablished
car manufacturers from Asia, manages to show such remarkable performance in such a short period
of time, while others, far more established, fail to achieve these levels.
4.2.15 Volkswagen
Figure 42: Consumption, Volkswagen, all classes
Figure 43: Power, Volkswagen, all classes
-38% -38% -38%
36% 41% 29%
Volkswagen is the synonym of a European car mass producer. It lacks presence in the highest class of
this survey, but other than that is ubiquitous. The corresponding figures (Figure 42 & Figure 43)
describe a company with a steady development and improvement, at least in terms of consumption.
Both fuel types are subject to almost parallel and ongoing improvement, being mirrored by the
identical percentage gain figures, also roughly corresponding to the average figures. In terms of power,
development occurred more erratic and isolated. After an upsurge in diesel engines and a subsequent
2
3
4
5
6
7
8
9
10
11
12
2000 2005 2010 2015
total petrol diesel
30
40
50
60
70
80
90
2000 2005 2010 2015
total petrol diesel

59
phase of equality between the two, a strong phase of petrol improvement ensues, leading to a growing
gap. Diesel engine development only accelerates again towards the end of the period, when petrol
figures stop rising.
The initial impression of activity according to industry average is further confirmed by the class-wise
data (Figure 126 – Figure 131), revealing a brand that targets innovation towards maintaining average
levels. It becomes apparent from all classes, how development cascades occur as soon as values drop
below average, maintaining a rather unobtrusive and conservative profile. Whether this shows the
actual limitation of innovative capabilities of a firm as embracing the car as Volkswagen is open to
dispute. Otherwise, it can also be that innovation is only used to maintain a previously set level with
which the firm is satisfied, without pushing to its technical limitations.
4.3 External Factors
4.3.1 Emission standards
Figure 44: European Emission Standards and average fuel consumption
EU and EEA member states are subject to a very dense net of emission standards being introduced in
a pattern of five years. In the period covered in this work, the regulations Euro 3 until Euro 5 are
relevant. Euro 3 and Euro 4 have been resolved in 1998 and Euro 5 in 2007.
2
3
4
5
6
7
8
9
10
11
12
2000 2002 2004 2006 2008 2010 2012 2014
total petrol diesel
Euro 3 Euro 4 Euro 5

60
The emission standard system in Europe is built around individual stages (Euro 1 etc.) that are both
well established and densely clocked. This, in combination with the fact that the stages are resolved
with several years lead time explains, why there are no obvious reactions in average fuel
consumption (Figure 44). Furthermore, these emission standards set limits on the emission of several
pollutants that may only partially be tackled by reducing consumption and instead via sophisticated
exhaust gas treatment. Then however, when comparing the introduction of the standards with the
development of consumption of individual manufacturers (see 4.2), there is a tendency with certain
manufacturers such as BMW, Honda, Peugeot or VW that show no or little progress in especially
petrol consumption during the Euro 3 phase, but a strong progress in phases of Euro 4 and
particularly during announcement and effect of Euro 5.
The key problem however, preventing to draw a reliable connection between fuel consumption and
emission standards, remains the fact that the emission standards focus on pollutants that can be
lowered by innovation in areas that are not captured in this work. An emission standard on carbon
dioxide would be tied much closer to fuel consumption and would allow a better comparison.
Besides the European emission standards, there is also the mechanism implemented by the
European Union to decrease carbon dioxide emission via upper limits for fleet consumption. This is
insofar interesting, as it also falls in the period where certain drops in fuel consumption can be
registered. Despite being in full effect from 2015 onwards and therefore virtually outside of the
period covered here, firstly the date of publication has to be considered as the date since when car
manufacturers knew what limits to expect when and being able to react accordingly. Furthermore,
the mechanism is built with a phase-in, meaning a gradual onset up until 2015. This leads to the
situation, where this fleet consumption mechanism, agreed upon in 2009 and gradually being
introduced from 2012 onwards, shows chronologic parallels to Euro 5 emission standards and it is
hard to factually determine the actual source of any fuel consumption progress to either of these
mechanisms. In either case, due to the strong tie between carbon dioxide emission and fuel
consumption, it appears that this distinct drop in fuel consumption for certain manufacturers might
be connected to the fleet consumption limit, whereas the long-established emission standards result
in a gradual overall pressure to decrease consumption. Without further data, however, this cannot
reliably be stated.
4.3.2 Fuel prices
As shown in previous work on innovation in the automotive sector shown in 2.1, fuel prices are
shown to have an effect on parts of technical innovation in the automotive sector. In this work, there

61
is no distinction between different types of innovation such as different drive technologies, but
rather a capture of innovative activity through improvement of technical data of the offered
products. Nevertheless, the question prevails, whether a connection between the observed technical
improvements and actual development in fuel prices in the observed area can be made.
When analysing the progress of fuel prices in Europe (Figure 45), it can firstly be noted that across
the entire period, the average price for both fuel types increases from approximately € 0.70 in 2000
to approximately € 1.15 in 2015, a rise of approximately 64 %. Furthermore, when looking at the
individual fuel types, an increase in petrol prices by approximately 56 % and even 90 % in diesel
prices can be registered. On the other hand, these figures are put into perspective when considering
real prices including inflation (Figure 46), showing the actual increase amounting to only 21 %.
Nevertheless, the progression in fuel consumption shows a clear intention to lower consumption.
The progression in prices does not vary greatly between the fuel types in terms of swings, but it
shows an interesting pattern. Besides the small-scale variations around a certain value, reminiscing a
heartbeat curve, major movements can be detected. While the first half of the period was
characterised by a gradually increasing rise in prices, the year 2009 saw a significant drop in prices,
followed by a steep rise to even higher levels until 2012, culminating and merging into a slight fall
towards the end of the period.

62
Figure 45: Fuel prices, according to types (nominal); Source: European Environment Agency (2016), own illustration
Figure 46: Fuel prices, real versus nominal, * base year 2005; Source: European Environment Agency (2016), own illustration
0
0,2
0,4
0,6
0,8
1
1,2
1,4
1,6
1,8Eu
ro
Diesel (nominal) All petrol, unleaded equivalent (nominal)
All fuel, unleaded petrol equivalent (nominal)
0
0,2
0,4
0,6
0,8
1
1,2
1,4
1,6
Euro
All fuel, unleaded petrol equivalent (nominal) All fuel, unleaded petrol equivalent (real*)
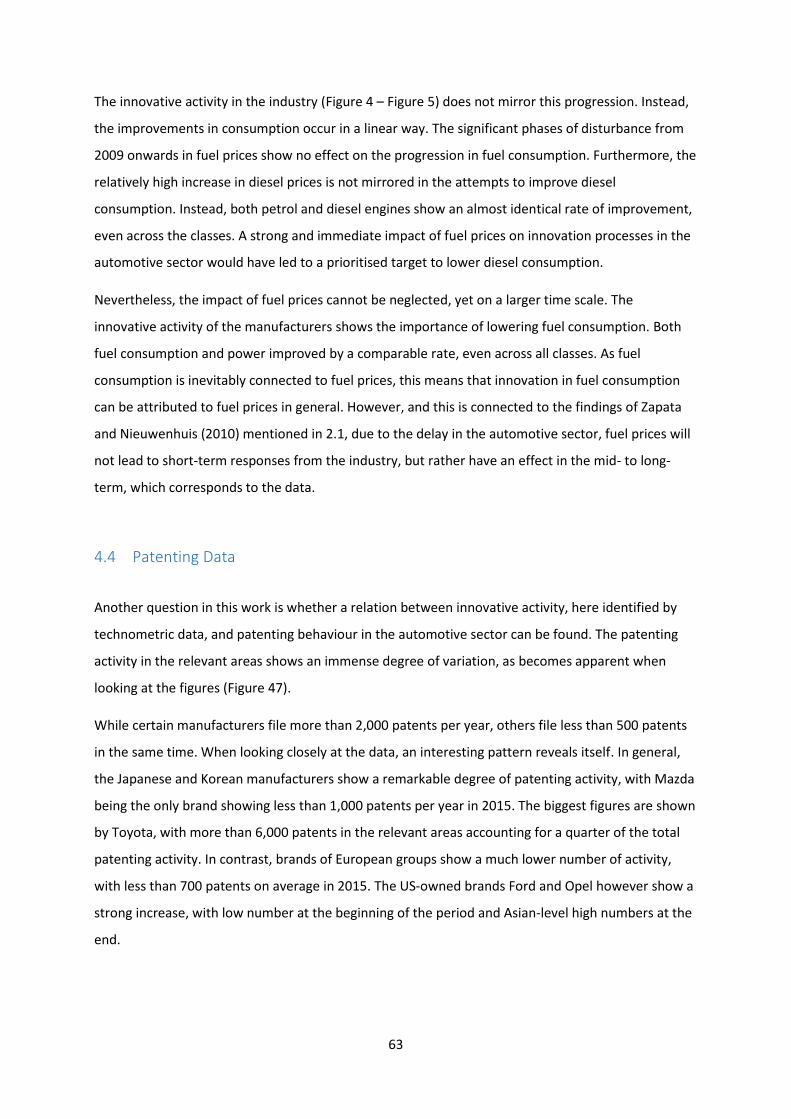
63
The innovative activity in the industry (Figure 4 – Figure 5) does not mirror this progression. Instead,
the improvements in consumption occur in a linear way. The significant phases of disturbance from
2009 onwards in fuel prices show no effect on the progression in fuel consumption. Furthermore, the
relatively high increase in diesel prices is not mirrored in the attempts to improve diesel
consumption. Instead, both petrol and diesel engines show an almost identical rate of improvement,
even across the classes. A strong and immediate impact of fuel prices on innovation processes in the
automotive sector would have led to a prioritised target to lower diesel consumption.
Nevertheless, the impact of fuel prices cannot be neglected, yet on a larger time scale. The
innovative activity of the manufacturers shows the importance of lowering fuel consumption. Both
fuel consumption and power improved by a comparable rate, even across all classes. As fuel
consumption is inevitably connected to fuel prices, this means that innovation in fuel consumption
can be attributed to fuel prices in general. However, and this is connected to the findings of Zapata
and Nieuwenhuis (2010) mentioned in 2.1, due to the delay in the automotive sector, fuel prices will
not lead to short-term responses from the industry, but rather have an effect in the mid- to long-
term, which corresponds to the data.
4.4 Patenting Data
Another question in this work is whether a relation between innovative activity, here identified by
technometric data, and patenting behaviour in the automotive sector can be found. The patenting
activity in the relevant areas shows an immense degree of variation, as becomes apparent when
looking at the figures (Figure 47).
While certain manufacturers file more than 2,000 patents per year, others file less than 500 patents
in the same time. When looking closely at the data, an interesting pattern reveals itself. In general,
the Japanese and Korean manufacturers show a remarkable degree of patenting activity, with Mazda
being the only brand showing less than 1,000 patents per year in 2015. The biggest figures are shown
by Toyota, with more than 6,000 patents in the relevant areas accounting for a quarter of the total
patenting activity. In contrast, brands of European groups show a much lower number of activity,
with less than 700 patents on average in 2015. The US-owned brands Ford and Opel however show a
strong increase, with low number at the beginning of the period and Asian-level high numbers at the
end.

64
Figure 47: Overall patenting activity, all manufacturers, stacked
0
5000
10000
15000
20000
25000
2 0 0 0 2 0 0 1 2 0 0 2 2 0 0 3 2 0 0 4 2 0 0 5 2 0 0 6 2 0 0 7 2 0 0 8 2 0 0 9 2 0 1 0 2 0 1 1 2 0 1 2 2 0 1 3 2 0 1 4 2 0 1 5
BMW Fiat Ford Honda Hyundai
Jaguar Mazda Mercedes Nissan Opel / Vauxhall
Peugeot Renault Toyota Volkswagen Volvo

65
When comparing these figures with the observed performance in 4.2, it becomes apparent that
there is no connection between the absolute numbers of patents and innovative performance
revealed in this work. Instead, the Asian brands and especially Toyota showed a rather mediocre
performance with little if any advances above average. According to the patenting figures, Toyota
should be technology leader by far, especially, as the relevant areas of patenting in this work were
limited to technology connected with the internal combustion engine and omitting Toyota’s strong
field hybrid propulsion.
Then again, a certain connection can be identified between patenting and technical performance,
when looking at the development of patenting behaviour of the individual manufacturer. Firms with
a positively developing performance in the technical data also show an increasing number of patents,
such as Volvo, Ford, Jaguar or Peugeot. Consistently well-performing firms such as BMW or
Volkswagen show a relatively stable patenting behaviour, while Fiat’s patenting activity mirrors parts
of its technical performance in its erraticism. In general, patenting increases in the industry and
connections to actual technical performance or innovation can mainly be drawn by those that show a
moderate patenting activity. In Asia, in contrast, patenting seems to be disconnected from actual
innovation.

66
5 Discussion & Further Research
The results in this work offer several insights. Firstly, they reveal and characterise the innovation
processes in the automotive sector by showing technical performance of all major manufacturers.
This compilation of an industry innovation path, along the lines of Dosi’s fundamental concept of
technological trajectories, furthermore enables the assessment of the innovation performance of
these manufacturers. These two steps reveal the character of the automotive industry. It is
remarkable that industry-wide, the technical progress occurs in such a linear way and even across the
classes shows such a balanced ratio between development in fuel consumption and power. On
industry level, the curves even at class level show no indication of a major shock, drastically
influencing the development. Instead, it gives the impression of a rather steady, i.e. mature industry
that incrementally improves and is free of significant upheavals.
Nevertheless, when looking at manufacturer performance, certain surprising results are revealed. It
is astonishing that bigger and financially robust manufacturers not necessarily show a strong
performance in innovation leadership. Instead, for example Toyota, being a manufacturer normally
perceived as very progressive, shows only average figures. This even more so considering the results
from the assessment of patenting data that also shows a high activity by Toyota. On the other hand,
manufacturers such as Volvo, having been on the verge of bankruptcy suddenly show technical
performance that outshines the established premium competitors from Germany. Then again, this
might also be linked to the fact that both Volvo and Jaguar had to restart completely, therefore being
more venturesome. Volvo’s concept of only offering relatively small but turbocharged four-cylinder
engines even in the biggest car classes is a risk that the German competitors apparently do not want
to take yet and, from a financial viewpoint, do not have to. Simultaneously however, this does
reward the risk-tolerant brands Volvo and Jaguar, at least in this survey.
Besides these, many manufacturers seem to have settled for a pace allowing to follow the average
without protruding from the masses. While external factors such as fuel prices definitely exert a
general pressure on the industry to improve especially in fuel consumption, the industry shows no
signs of short-term reactions to environmental influences. While this fundamentally mirrors the
findings of Zapata and Nieuwenhuis (2010) concerning a strong delay in the spread of automotive
innovation, it might need further confirmation in following studies tackling this question explicitly
and in more detail.
Due to the extenuated and delayed responses by the automotive industry, revealing the actual
effects of external factors would need a different approach. In order to reliably determine the effect

67
of the European emission standards, it is not enough to simply analyse the rather basic engine
parameters that are covered in this work. Instead, this work could be enhanced by adding knowledge
from engineering in order to achieve a broader set of technical data that also would allow for more
in-depth examination. This detailed assessment of the development of several parameters of
manufacturers’ cars would enable a reliable evaluation of the effects that these emission standards
had on the industry. Furthermore, the technical data distinguished between classes shows a
difference between the average performance characteristics in these classes. In adding further
engineering knowledge, a more profound understanding of engine physics could be used to develop
a model that would cancel out the differing characteristics of differently-sized engines. The rather
crude standardisation in this work seems to result in distortions that prevent reliable inter-class
comparison.
Furthermore, this work concentrated on one market and on a limited number of models and engines.
A following work could enhance the complexity in covering more markets, potentially all markets,
and drastically increasing the covered sample of product range of each manufacturer. Adding
statistical complexity, the gathered data could be analysed in a deeper way to enable more accurate
results and revealing correlations reliably. This would require both the collection and processing of a
wider set of data that goes far beyond the feasible scope of this work, but would definitely add to the
accuracy of results.
As mentioned in the beginning, besides the provision of descriptive data on the innovative
performance of the automotive sector, this work also wanted to improve the understanding of
innovation in this sector, closing the possible gap that results from the usage of indicators such as
patenting data in previous research. By taking a technometric approach, a more accurate insight on
the actual outcomes of innovative processes could be given than with other indicators. Indeed, the
comparison between the technical data and patenting data shows vast differences with Toyota for
example showing exceptionally high numbers of patenting activity but only average improvement in
technical outcome, while BMW shows a strong development in technical outcome while only
showing a meagre patenting activity as compared to others. This discrepancy between the two
approaches is noteworthy, especially for research concerning the influence of external factors on
innovation as a measure of public control and guidance. With the adverse effects of the sector
leading to the necessity for public intervention resulting from the actual outcomes of innovative
processes within this industry rather than the innovative activity itself, it seems advisable to select an
indicator being able to measure these outcomes. Here, the technometric approach appears to be a
sound choice.

68
6 Conclusion
Concluding, this work offered a number of insights into the development of the automotive industry.
Through the analysis of the technical development of the 15 most important manufacturers on the
European car market, being one of the major markets in the relevant period 2000 – 2015, innovation
– in the understanding of technical progress - in the sector could be plotted and identified. Fuel
consumption and engine power have been selected as the two key technical variables with which to
map the progress and hence innovative performance of the cars and subsequently the
manufacturers. The character of the automotive industry as rather stable, calm and mature was
revealed, showing a balanced progress in development both in the more rational factor fuel
consumption and the rather emotional factor power. It has furthermore been revealed that even
across the different car size classes, each comprising cars with different requirements profiles,
showed a similar overall development and also a similar weighting between the two assessed
technical factors. The relationship between diesel and petrol engines has been exposed, showing the
distinct industry- and class-wide tendency of a focussing in power development in diesel engines in
the first half of the examined period, whereas development then shifted to petrol engine power
development in the second half.
The comparison of the individual manufacturers with each other and the industry-wide trajectory of
innovation progress revealed the differing approaches of the manufacturers. It has been shown that
major car manufacturers with a general technologically advanced reputation such as Toyota or
Volkswagen show a rather conservative or even disappointing innovation performance in the
assessed areas, while comparably small manufacturers such as Volvo that saw severe disruptions in
ownership structure and economic conditions managed to show a surprisingly well performance
after restarting. A consistently well-performing manufacturer showing above-average values across
all classes and along the entire period has only been found in BMW.
The comparison of the innovation activity in the industry with the major two external factors
affecting the car industry, fuel prices and emission standards, further emphasised the calm and
rather delayed nature of the industry. Shorter-term changes such as the experienced drop in fuel
prices between 2008 and 2009, or the later stagnation showed no corresponding response in the
progression in fuel consumption development and even the disproportionate rise in diesel prices
across the period in comparison to petrol prices was not met by an according shift towards a focus
on development in diesel consumption. External factors were therefore found to be limited to a long-
term influence on the direction of innovation activity.

69
Comparing the innovation activity with the correspondent patenting activity revealed certain
surprises. Firstly, it was shown that the patenting activity is remarkably irregular in distribution
across the manufacturers, with only Toyota accounting for 25 %. Here, a clear tendency has been
revealed with Asian manufacturers contributing disproportionally towards the total number of
patents, while European brands show a much more moderate level of patenting activity. The
American-owned brands instead start low and increase towards Asian levels along the period.
Therefore, a clear connection between the nominal amount of patenting activity and innovation
performance could not be found, especially comparing Toyota’s technical performance to its
patenting activity. However, there have been hints in showing a relation between the change in
patenting behaviour and technical performance, especially for brands at a non-Asian level of
patenting. The discrepancy between patenting activity and technical improvement furthermore hints
at the gap that this work aimed at closing. For research concerned with the external influence on
innovative processes in the automotive sector, a focus on actual outcomes of innovative processes
seems more sensible than concentrating on the innovative activities itself. Hence, in aiming at
understanding innovative activities in the automotive sector, implementing a technometric approach
being able to capture the actual outcome appears to be a rewarding choice
As mentioned, the primary goal of this work was the initial introduction of a new perspective on
innovative processes in the automotive sector and the building of a new database using a
technometric approach to do so, hence providing a descriptive set of results to understand the
development of the sector in the last 15 years. Therefore, it is also meant as a basis for future work
to build on in more detail. The findings in this work could further be enhanced in broadening the
knowledge base behind. Through addition of dedicated engineering knowledge, experienced
imbalances between the different engine sizes in attempting to harmonise their figures could be
explained physically and hence overcome. The database, here concentrating on one of the major
markets and only a selection of car classes and engines, could be broadened to a fully global
approach, including all markets, all models and all engines to draw an absolutely accurate picture of
the international automotive industry. Furthermore, the data to be collected could heavily be
expanded in including more technical figures of the engine to be able to gain a more in-depth
understanding of the occurred engine development to specify the directions the industry or certain
manufacturers are following and being able to draw clear connections between the implementation
of emission standards on certain pollutants and appropriate engine development. This broader set of
data then would require added statistical complexity to accurately process and analyse the data to
reveal accurate results.
The possibilities to add complexity are virtually endless, but a cornerstone has been set.

70
7 Bibliography
AAA (2015) New Passenger Car Registrations breakdown by share of diesel. Association Auxiliaire de l’Automobile; http://www.acea.be/uploads/statistic_documents/Share_of_diesel_in_new_cars_in_Western_Europe_(1990-2015).xlsx as seen on 16. June 2016.
ACEA (2016). New Passenger Car Registrations European Union, 2015.
ADAC (2016). Autodaten & Autokosten; Autodatenbank; https://www.adac.de/infotestrat/autodatenbank/ as seen on 26. May 2016.
Aghion, P., Dechezleprêtre, A., Hemous, D., Martin, R., & Van Reenen, J. (2012). Carbon taxes, path dependency and directed technical change: evidence from the auto industry (No. w18596). National Bureau of Economic Research.
Archibugi, D., & Pianta, M. (1996). Innovation surveys and patents as technology indicators: the state of the art. Innovation, patents and technological strategies, 17-56.
Bergek, A., Berggren, C., & KITE Research Group. (2014). The impact of environmental policy instruments on innovation: A review of energy and automotive industry studies. Ecological Economics, 106, 112-123.
BMU (2009). Die EU-Verordnung zur Verminderung der CO2-Emissionen von Personenkraftwagen; Bundesministerium für Umwelt, Naturschutz und Reaktorsicherheit.
Borbély, E. (2008). JA Schumpeter und die Innovationsforschung. In 6th International Conference on Management, Enterprise and Benchmarking, MEB.
Brouwer, E., & Kleinknecht, A. (1997). Measuring the unmeasurable: a country's non-R&D expenditure on product and service innovation. Research policy, 25(8), 1235-1242.
Coombs, R., Narandren, P., & Richards, A. (1996). A literature-based innovation output indicator. Research policy, 25(3), 403-413.
Crabb, J. M., & Johnson, D. K. (2010). Fuelling innovation: the impact of oil prices and CAFE standards on energy-efficient automotive technology. The Energy Journal, 199-216.
Dosi, G. (1982). Technological paradigms and technological trajectories: a suggested interpretation of the determinants and directions of technical change. Research policy, 11(3), 147-162.
DPMA (2014). Deutsches Patent- und Markenamt. DEPATISnet – Weltweite Patentrecherche zum Stand der Technik
European Commission (2002). Distribution and Servicing of Motor Vehicles in the European Union; Commission Regulation (EC) NO 1400/2002 of 31 July 2002.
European Commission (2012). Enterprise and Industry. Issue No. 14. October 2012.
European Communities (1998). Directive 98/69/EC of the European Parliament and of the Council, Official Journal of the European Communities.
European Environment Agency (2016). Fuel prices. Indicator Assessment TERM 021, IND-114-en
European Union (2007). Regulation (EC) No 715/2007 of the European Parliament and of the Council, Official Journal of the European Union.

71
Gomes, C. (2016). Global Auto Report, Scotiabank Global Economics.
Granstrand, O. (2006) Innovation and Intellectual Property Rights. In: Fagerberg, J. (2006). The Oxford handbook of innovation. Oxford university press.
Grupp, H. (1994). The measurement of technical performance of innovations by technometrics and its impact on established technology indicators. Research Policy, 23(2), 175-193.
Haščič, I., De Vries, F. P., Johnstone, N., & Medhi, N. (2009). Effects of environmental policy on the type of innovation: The case of automotive emissions control technologies. OECD Journal: Economic Studies, 2009(1), 49-66.
Hicks, J. (1932). Theory of wages. Macmillan London.
Kaloudis, A. (1998). Bibliometrics. Science, Technology and Innovation Indicators: a guide for policy.
Kleinknecht, A., & Bain, D. (Eds.). (1993). New concepts in innovation output measurement (pp. 42-84). London: Macmillan.
Kleinknecht, A., van Montfort, K., & Brouwer, E. (2002). The non-trivial choice between innovation indicators. Economics of Innovation and new technology, 11(2), 109-121.Martino, J. P. (1980). Technological forecasting—an overview. Management Science, 26(1), 28-33.
Kline, S. J., & Rosenberg, N. (1986). An overview of innovation. The positive sum strategy: Harnessing technology for economic growth, 14, 640.
Lazonick, W. (2006) The innovative firm. In: Fagerberg, J. (2006). The Oxford handbook of innovation. Oxford university press.
Martino, J. P. (1980). Technological forecasting—an overview. Management Science, 26(1), 28-33.
McKinsey (2016). Automotive revolution – perspective towards 2030; How the convergence of disruptive technology-driven trends could transform the auto industry, Advanced Industries, January 2016.
Moed, H., De Bruin, R., & Van Leeuwen, T. H. (1995). New bibliometric tools for the assessment of national research performance: Database description, overview of indicators and first applications. Scientometrics, 33(3), 381-422.
Nelson, R. R., & Winter, S. G. (1977a). Dynamic competition and technical progress. Economic Progress, Private Values, and Public Policy: Essays in Honor of William Fellner, North-Holland, Amsterdam, 57-101.
Nelson, R. R., & Winter, S. G. (1977b). In search of useful theory of innovation. Research policy, 6(1), 36-76.
OECD (1992, rev. 1997), Innovation Manual: Proposed Guidelines for Collecting and Interpreting Innovation Data (Oslo Manual), Paris: OECD, Directorate for Science, Technology and Industry.
Rosenberg, N. (1976). Perspectives on technology. CUP Archive.
Sahal, D. (1978). Law-like aspects of technological development. Internat. Inst. of Management, Wissenschaftszentrum Berlin.
Sauchanka, P. (2015). Fuel Prices and Environment-Friendly Innovations. Evidence from the Automobile Industry.
Schmookler, J. (1966). Invention and economic growth. Harvard University Press
Schumpeter, J. (1913). Theorie der wirtschaftlichen Entwicklung.

72
Sjöö, K., Taalbi, J., Kander, A., & Ljungberg, J. (2014). SWINNO: A Database of Swedish Innovations, 1970-2007. Lund Papers in Economic History. General Issues, (133).
Smith, K. H. (2006). Measuring innovation. In: Fagerberg, J. (2006). The Oxford handbook of innovation. Oxford university press.
Taalbi, J. (2014). Innovation as Creative Response. Determinants of Innovation in the Swedish Manufacturing Industry, 1970-2007 (Vol. 67). Lund University.
Van Der Panne, G. (2007). Issues in measuring innovation. Scientometrics, 71(3), 495-507.
Vollebergh, H. (2010). Fuel taxes, motor vehicle emission standards and patents related to the fuel-efficiency and emissions of motor vehicles. Joint Meetings of Tax and Environment Experts.
von Fersen, O. (1986). Ein Jahrhundert Automobiltechnik: Personenwagen. VDI-Verlag.
Zapata, C., & Nieuwenhuis, P. (2010). Exploring innovation in the automotive industry: new technologies for cleaner cars. Journal of Cleaner Production, 18(1), 14-20.

73
8 Appendices
8.1 Technical Performance Figures
8.1.1 BMW
Figure 48: Consumption, BMW, class C
Figure 49: Power, BMW, class C
-53% 45%
Figure 50: Consumption, BMW, class D
Figure 51: Power, BMW, class D
-44% 38%
2
3
4
5
6
7
8
9
10
11
12
2000 2005 2010 2015
Consumption BMW, C class
BMW average
30
40
50
60
70
80
90
2000 2005 2010 2015
PowerBMW, C class
BMW average
2
3
4
5
6
7
8
9
10
11
12
2000 2005 2010 2015
Consumption BMW, D class
BMW average
30
40
50
60
70
80
90
2000 2005 2010 2015
PowerBMW, D class
BMW average

74
Figure 52: Consumption, BMW, class E
Figure 53: Power, BMW, class E
-41% 25%
8.1.2 Fiat
Figure 54: Consumption, Fiat, class B
Figure 55: Power, Fiat, class B
-32% 80%
2
3
4
5
6
7
8
9
10
11
12
2000 2005 2010 2015
Consumption BMW, E class
BMW average
30
40
50
60
70
80
90
2000 2005 2010 2015
PowerBMW, E class
BMW average
2
3
4
5
6
7
8
9
10
11
12
2000 2005 2010 2015
Consumption Fiat, B class
Fiat average
30
40
50
60
70
80
90
2000 2005 2010 2015
PowerFiat, B class
Fiat average

75
Figure 56: Consumption, Fiat, class C
Figure 57: Power, Fiat, class C
-32% 36%
Figure 58: Consumption, Fiat, class D
Figure 59: Power, Fiat, class D
-19% 25%
2
3
4
5
6
7
8
9
10
11
12
2000 2005 2010 2015
Consumption Fiat, C class
Fiat average
30
40
50
60
70
80
90
2000 2005 2010 2015
PowerFiat, C class
Fiat average
2
3
4
5
6
7
8
9
10
11
12
2000 2005 2010 2015
Consumption Fiat, D class
Fiat average
30
40
50
60
70
80
90
2000 2005 2010 2015
PowerFiat, D class
Fiat average

76
8.1.3 Ford
Figure 60: Consumption, Ford, class B
Figure 61: Power, Ford, class B
-48% 64%
Figure 62: Consumption, Ford, class C
Figure 63: Power, Ford, class C
-39% 53%
2
3
4
5
6
7
8
9
10
11
12
2000 2005 2010 2015
Consumption Ford, B class
Ford average
30
40
50
60
70
80
90
2000 2005 2010 2015
PowerFord, B class
Ford average
2
3
4
5
6
7
8
9
10
11
12
2000 2005 2010 2015
Consumption Ford, C class
Ford average
30
40
50
60
70
80
90
2000 2005 2010 2015
PowerFord, C class
Ford average
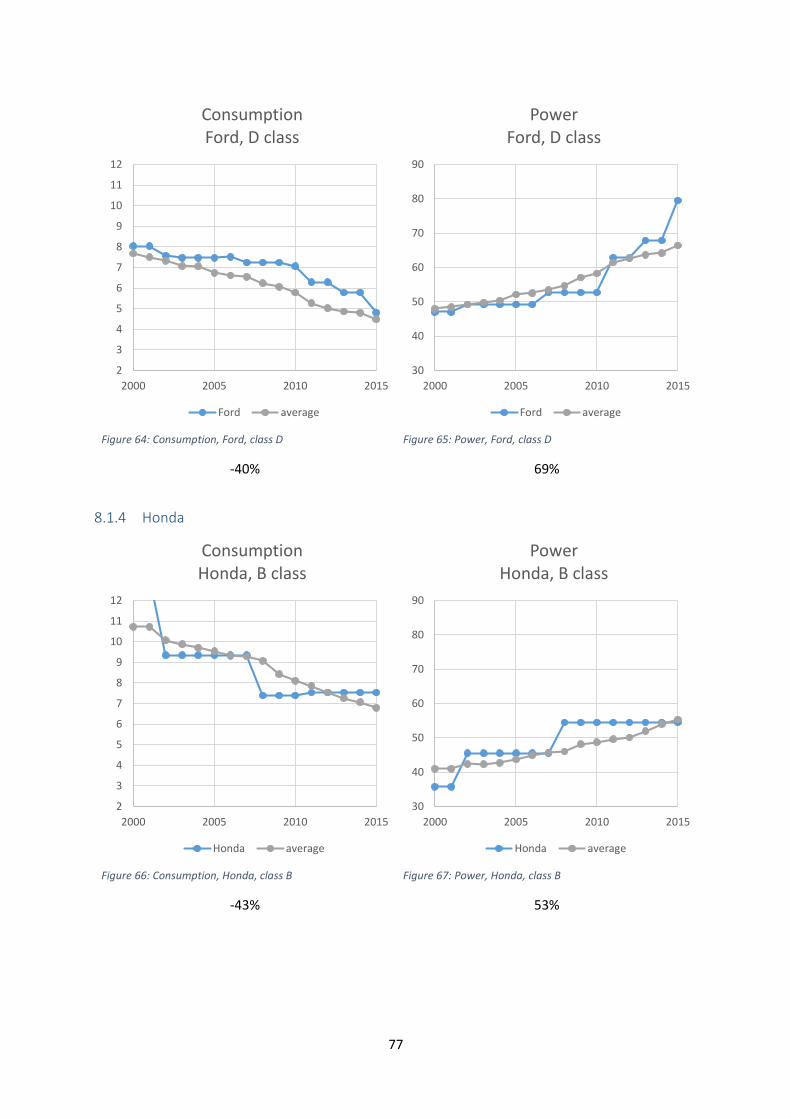
77
Figure 64: Consumption, Ford, class D
Figure 65: Power, Ford, class D
-40% 69%
8.1.4 Honda
Figure 66: Consumption, Honda, class B
Figure 67: Power, Honda, class B
-43% 53%
2
3
4
5
6
7
8
9
10
11
12
2000 2005 2010 2015
Consumption Ford, D class
Ford average
30
40
50
60
70
80
90
2000 2005 2010 2015
PowerFord, D class
Ford average
2
3
4
5
6
7
8
9
10
11
12
2000 2005 2010 2015
Consumption Honda, B class
Honda average
30
40
50
60
70
80
90
2000 2005 2010 2015
PowerHonda, B class
Honda average

78
Figure 68: Consumption, Honda, class C
Figure 69: Power, Honda, class C
-28% 15%
Figure 70: Consumption, Honda, class D
Figure 71: Power, Honda, class D
-31% 7%
2
3
4
5
6
7
8
9
10
11
12
2000 2005 2010 2015
Consumption Honda, C class
Honda average
30
40
50
60
70
80
90
2000 2005 2010 2015
PowerHonda, C class
Honda average
2
3
4
5
6
7
8
9
10
11
12
2000 2005 2010 2015
Consumption Honda, D class
Honda average
30
40
50
60
70
80
90
2000 2005 2010 2015
PowerHonda, D class
Honda average

79
8.1.5 Hyundai
Figure 72: Consumption, Hyundai, class B
Figure 73: Power, Hyundai, class B
-37% 27%
Figure 74: Consumption, Hyundai, class C
Figure 75: Power, Hyundai, class C
-48% 36%
2
3
4
5
6
7
8
9
10
11
12
2000 2005 2010 2015
Consumption Hyundai, B class
Hyundai average
30
40
50
60
70
80
90
2000 2005 2010 2015
PowerHyundai, B class
Hyundai average
2
3
4
5
6
7
8
9
10
11
12
2000 2005 2010 2015
Consumption Hyundai, C class
Hyundai average
30
40
50
60
70
80
90
2000 2005 2010 2015
PowerHyundai, C class
Hyundai average

80
Figure 76: Consumption, Hyundai, class D
Figure 77: Power, Hyundai, class D
-45% 25%
8.1.6 Jaguar
Figure 78: Consumption, Jaguar, class D
Figure 79: Power, Jaguar, class D
-38% 29%
2
3
4
5
6
7
8
9
10
11
12
2000 2005 2010 2015
Consumption Hyundai, D class
Hyundai average
30
40
50
60
70
80
90
2000 2005 2010 2015
PowerHyundai, D class
Hyundai average
2
3
4
5
6
7
8
9
10
11
12
2000 2005 2010 2015
Consumption Jaguar, D class
Jaguar average
30
40
50
60
70
80
90
2000 2005 2010 2015
PowerJaguar, D class
Jaguar average
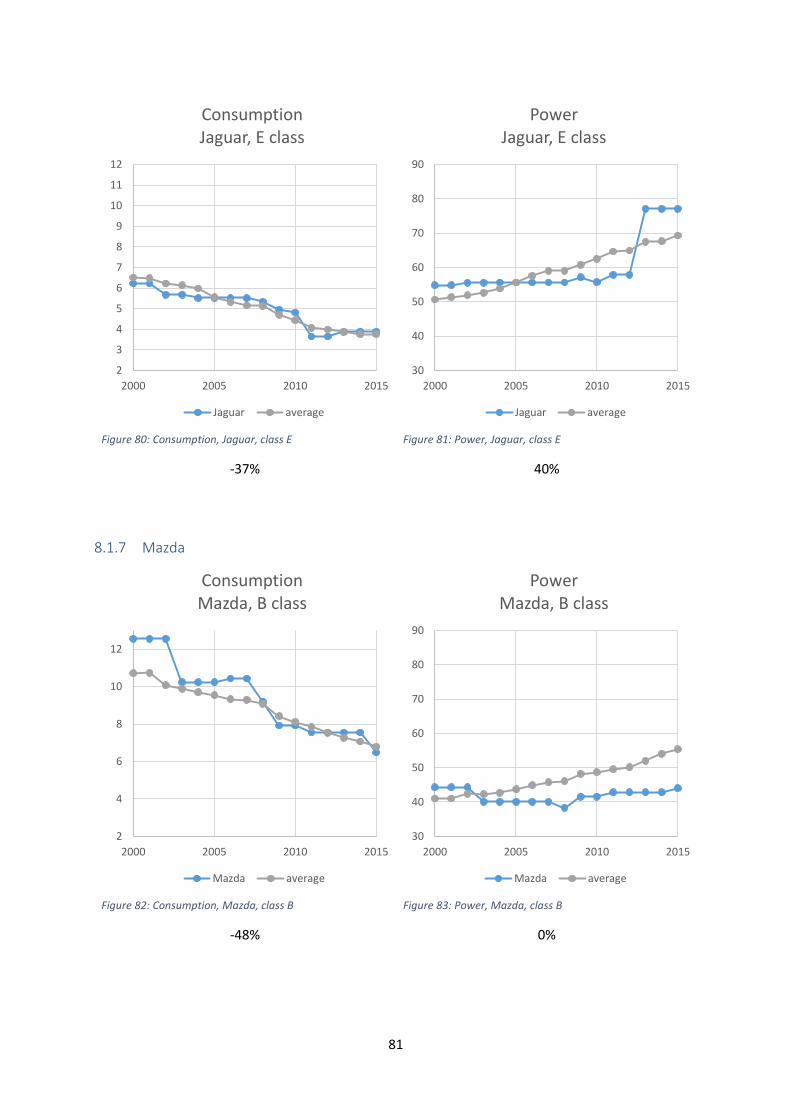
81
Figure 80: Consumption, Jaguar, class E
Figure 81: Power, Jaguar, class E
-37% 40%
8.1.7 Mazda
Figure 82: Consumption, Mazda, class B
Figure 83: Power, Mazda, class B
-48% 0%
2
3
4
5
6
7
8
9
10
11
12
2000 2005 2010 2015
Consumption Jaguar, E class
Jaguar average
30
40
50
60
70
80
90
2000 2005 2010 2015
PowerJaguar, E class
Jaguar average
2
4
6
8
10
12
2000 2005 2010 2015
Consumption Mazda, B class
Mazda average
30
40
50
60
70
80
90
2000 2005 2010 2015
PowerMazda, B class
Mazda average

82
Figure 84: Consumption, Mazda, class C
Figure 85: Power, Mazda, class C
-40% 24%
Figure 86: Consumption, Mazda, class D
Figure 87: Power, Mazda, class D
-48% 19%
2
3
4
5
6
7
8
9
10
11
12
2000 2005 2010 2015
Consumption Mazda, C class
Mazda average
30
40
50
60
70
80
90
2000 2005 2010 2015
PowerMazda, C class
Mazda average
2
3
4
5
6
7
8
9
10
11
12
2000 2005 2010 2015
Consumption Mazda, D class
Mazda average
30
40
50
60
70
80
90
2000 2005 2010 2015
PowerMazda, D class
Mazda average

83
8.1.8 Mercedes
Figure 88: Consumption, Mercedes, class C
Figure 89: Power, Mercedes, class C
-40% 42%
Figure 90: Consumption, Mercedes, class D
Figure 91: Power, Mercedes, class D
-49% 54%
2
3
4
5
6
7
8
9
10
11
12
2000 2005 2010 2015
Consumption Mercedes, C class
Mercedes average
30
40
50
60
70
80
90
2000 2005 2010 2015
PowerMercedes, C class
Mercedes average
2
3
4
5
6
7
8
9
10
11
12
2000 2005 2010 2015
Consumption Mercedes, D class
Mercedes average
30
40
50
60
70
80
90
2000 2005 2010 2015
PowerMercedes, D class
Mercedes average

84
Figure 92: Consumption, Mercedes, class E
Figure 93: Power, Mercedes, class E
-44% 26%
8.1.9 Nissan
Figure 94: Consumption, Nissan, class B
Figure 95: Power, Nissan, class B
-39% 23%
2
3
4
5
6
7
8
9
10
11
12
2000 2005 2010 2015
Consumption Mercedes, E class
Mercedes average
30
40
50
60
70
80
90
2000 2005 2010 2015
PowerMercedes, E class
Mercedes average
2
3
4
5
6
7
8
9
10
11
12
2000 2005 2010 2015
Consumption Nissan, B class
Nissan average
30
40
50
60
70
80
90
2000 2005 2010 2015
PowerNissan, B class
Nissan average

85
Figure 96: Consumption, Nissan, class C
Figure 97: Power, Nissan, class C
-36% 50%
8.1.10 Opel
Figure 98: Consumption, Opel, class B
Figure 99: Power, Opel, class B
-25% 16%
2
3
4
5
6
7
8
9
10
11
12
2000 2005 2010 2015
Consumption Nissan, C class
Nissan average
30
40
50
60
70
80
90
2000 2005 2010 2015
PowerNissan, C class
Nissan average
2
3
4
5
6
7
8
9
10
11
12
2000 2005 2010 2015
Consumption Opel, B class
Opel average
30
40
50
60
70
80
90
2000 2005 2010 2015
PowerOpel, B class
Opel average

86
Figure 100: Consumption, Opel, class C
Figure 101: Power, Opel, class C
-40% 41%
Figure 102: Consumption, Opel, class D
Figure 103: Power, Opel, class D
-45% 56%
2
3
4
5
6
7
8
9
10
11
12
2000 2005 2010 2015
Consumption Opel, C class
Opel average
30
40
50
60
70
80
90
2000 2005 2010 2015
PowerOpel, C class
Opel average
2
3
4
5
6
7
8
9
10
11
12
2000 2005 2010 2015
Consumption Opel, D class
Opel average
30
40
50
60
70
80
90
2000 2005 2010 2015
PowerOpel, D class
Opel average

87
8.1.11 Peugeot
Figure 104: Consumption, Peugeot, class B
Figure 105: Power, Peugeot, class B
-33% 40%
Figure 106: Consumption, Peugeot, class C
Figure 107: Power, Peugeot, class C
-56% 55%
2
3
4
5
6
7
8
9
10
11
12
2000 2005 2010 2015
Consumption Peugeot, B class
Peugeot average
30
40
50
60
70
80
90
2000 2005 2010 2015
PowerPeugeot, B class
Peugeot average
2
3
4
5
6
7
8
9
10
11
12
2000 2005 2010 2015
Consumption Peugeot, C class
Peugeot average
30
40
50
60
70
80
90
2000 2005 2010 2015
PowerPeugeot, C class
Peugeot average

88
Figure 108: Consumption, Peugeot, class D
Figure 109: Power, Peugeot, class D
-50% 30%
8.1.12 Renault
Figure 110: Consumption, Renault, class B
Figure 111: Power, Renault, class B
-34% 37%
2
3
4
5
6
7
8
9
10
11
12
2000 2005 2010 2015
Consumption Peugeot, D class
Peugeot average
30
40
50
60
70
80
90
2000 2005 2010 2015
PowerPeugeot, D class
Peugeot average
2
3
4
5
6
7
8
9
10
11
12
2000 2005 2010 2015
Consumption Renault, B class
Renault average
30
40
50
60
70
80
90
2000 2005 2010 2015
PowerRenault, B class
Renault average
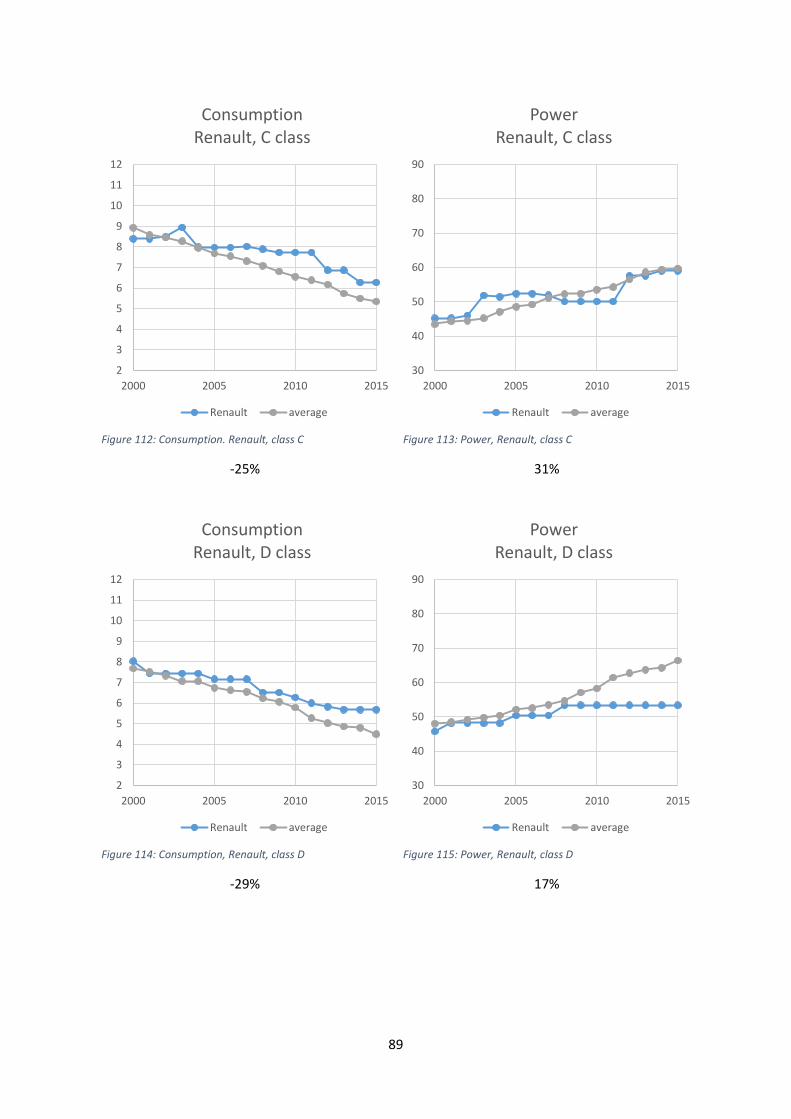
89
Figure 112: Consumption. Renault, class C
Figure 113: Power, Renault, class C
-25% 31%
Figure 114: Consumption, Renault, class D
Figure 115: Power, Renault, class D
-29% 17%
2
3
4
5
6
7
8
9
10
11
12
2000 2005 2010 2015
Consumption Renault, C class
Renault average
30
40
50
60
70
80
90
2000 2005 2010 2015
PowerRenault, C class
Renault average
2
3
4
5
6
7
8
9
10
11
12
2000 2005 2010 2015
Consumption Renault, D class
Renault average
30
40
50
60
70
80
90
2000 2005 2010 2015
PowerRenault, D class
Renault average

90
8.1.13 Toyota
Figure 116: Consumption, Toyota, class B
Figure 117: Power, Toyota, class B
-29% 4%
Figure 118: Consumption, Toyota, class C
Figure 119: Power, Toyota, class C
-32% 17%
2
3
4
5
6
7
8
9
10
11
12
2000 2005 2010 2015
Consumption Toyota, B class
Toyota average
30
40
50
60
70
80
90
2000 2005 2010 2015
PowerToyota, B class
Toyota average
2
3
4
5
6
7
8
9
10
11
12
2000 2005 2010 2015
Consumption Toyota, C class
Toyota average
30
40
50
60
70
80
90
2000 2005 2010 2015
PowerToyota, C class
Datenreihen1 Datenreihen2

91
Figure 120: Consumption, Toyota, class D
Figure 121: Power, Toyota, class D
-20% 12%
8.1.14 Volvo
Figure 122: Consumption, Volvo, class D
Figure 123: Power, Volvo, class D
-45% 38%
2
3
4
5
6
7
8
9
10
11
12
2000 2005 2010 2015
Consumption Toyota, D class
Toyota average
30
40
50
60
70
80
90
2000 2005 2010 2015
PowerToyota, D class
Toyota average
2
3
4
5
6
7
8
9
10
11
12
2000 2005 2010 2015
Consumption Volvo, D class
Volvo average
30
40
50
60
70
80
90
2000 2005 2010 2015
PowerVolvo, D class
Volvo average

92
Figure 124: Consumption, Volvo, class E
Figure 125: Power, Volvo, class E
-46% 98%
8.1.15 VW
Figure 126: Consumption, Volkswagen, class B
Figure 127: Power, Volkswagen, class B
-39% 39%
2
3
4
5
6
7
8
9
10
11
12
2000 2005 2010 2015
Consumption Volvo, E class
Volvo average
25
35
45
55
65
75
85
95
2000 2005 2010 2015
PowerVolvo, E class
Volvo average
2
3
4
5
6
7
8
9
10
11
12
2000 2005 2010 2015
Consumption Volkswagen, B class
Volkswagen average
30
40
50
60
70
80
90
2000 2005 2010 2015
PowerVolkswagen, B class
Volkswagen average

93
Figure 128: Consumption, Volkswagen, class C
Figure 129: Power, Volkswagen, class C
-34% 37%
Figure 130: Consumption, Volkswagen, class D
Figure 131: Power, Volkswagen, class D
-41% 33%
2
3
4
5
6
7
8
9
10
11
12
2000 2005 2010 2015
Consumption Volkswagen, C class
Volkswagen average
30
40
50
60
70
80
90
2000 2005 2010 2015
PowerVolkswagen, C class
Volkswagen average
2
3
4
5
6
7
8
9
10
11
12
2000 2005 2010 2015
Consumption Volkswagen, D class
Volkswagen average
30
40
50
60
70
80
90
2000 2005 2010 2015
PowerVolkswagen, D class
Volkswagen average
Copyright © 2022 FDOKUMEN