ABSTRACT LUND, KAITLYN E. Running Shoe Experience ...
146
ABSTRACT LUND, KAITLYN E. Running Shoe Experience. (Under the direction of Dr. Trevor Little). Running is one of the most popular sports worldwide. While considerable research has been conducted on how various aspects of running shoes may affect a runner, research on why runners wear the shoes they choose is limited. Every shoe design has different functional characteristics that influence the user feel and performance during running. Running shoe manufacturers do not possess a reliable method with which to purposely customize and prescribe these characteristics to meet the requirements of a specific user group. They could add significant value to the industry and potentially minimize the prevalence of injuries that are suffered by modern runners (Clifton et al., 2011). This research aimed to determine if more detailed shoe market segmentation is possible for runners. The survey of 1,472 runners determined that runners are primarily concerned with their perceived comfort in a shoe as this factor was chosen the most frequently. Comfort was also the top issue that participants had when a shoe did not meet their expectations. Runners responded that they would primarily prefer to know what type of stability a pair of running shoes would work for best when it comes to content and recommendations. In conclusion, more research would be recommended on the topic; and it is possible to define comprehensive shoe market segmentation for runners. Customization of running shoes to correctly fit runners faithfully has the prospect of being the next big running shoes innovation.
-
Upload
khangminh22 -
Category
Documents
-
view
1 -
download
0
Transcript of ABSTRACT LUND, KAITLYN E. Running Shoe Experience ...
ABSTRACT
LUND, KAITLYN E. Running Shoe Experience. (Under the direction of Dr. Trevor Little).
Running is one of the most popular sports worldwide. While considerable research has
been conducted on how various aspects of running shoes may affect a runner, research on why
runners wear the shoes they choose is limited. Every shoe design has different functional
characteristics that influence the user feel and performance during running. Running shoe
manufacturers do not possess a reliable method with which to purposely customize and prescribe
these characteristics to meet the requirements of a specific user group. They could add
significant value to the industry and potentially minimize the prevalence of injuries that are
suffered by modern runners (Clifton et al., 2011).
This research aimed to determine if more detailed shoe market segmentation is possible
for runners. The survey of 1,472 runners determined that runners are primarily concerned with
their perceived comfort in a shoe as this factor was chosen the most frequently. Comfort was
also the top issue that participants had when a shoe did not meet their expectations. Runners
responded that they would primarily prefer to know what type of stability a pair of running shoes
would work for best when it comes to content and recommendations. In conclusion, more
research would be recommended on the topic; and it is possible to define comprehensive shoe
market segmentation for runners. Customization of running shoes to correctly fit runners
faithfully has the prospect of being the next big running shoes innovation.

© Copyright 2019 Kaitlyn E. Lund
All Rights Reserved

Running Shoe Experience
by
Kaitlyn E. Lund
A thesis submitted to the Graduate Faculty of
North Carolina State University
in partial fulfillment of the
requirements for the degree of
Master of Science
Textiles
Raleigh, North Carolina
2019
APPROVED BY:
_______________________________ _______________________________
Dr. Trevor Little Dr. Yingjiao Xu
Committee Chair
_______________________________
Dr. Lori Rothenberg

ii
DEDICATION
This thesis is dedicated to my parents, for all of their hard work and continual sacrifice to
allow me the opportunity to succeed. Thank you for your love and support.
iii
BIOGRAPHY
Kaitlyn Elizabeth Lund was born on December 4, 1993 in Hickory, North Carolina; and
grew up in nearby Granite Falls. She is the oldest daughter of Bryan Alan Lund and Sherry
Oxford Lund, and sister to Adam Jacob Lund and Laura Ashley Lund. After graduating from
South Caldwell High School in the spring of 2012, Kaitlyn began her education at North
Carolina State University. Kaitlyn graduated from the Wilson College of Textiles at North
Carolina State University in May of 2017 and received a Bachelor of Science in Textile
Technology with a concentration in Medical Textiles. During her time as an undergraduate at
North Carolina State University, Kaitlyn was a member of the NCSU Dance Company, NC State
Club Swimming, and Phi Psi Professional Textile Fraternity where she served as Vice President
for 2016. During her summers as an undergraduate student, Kaitlyn interned with BSN medical
and Hanesbrands in the product development and research and development departments.
During the academic year she worked for NC State Student Media and spent 2 semesters on
preliminary undergraduate research for Dr. Minyoung Suh. Upon acceptance into graduate
school at North Carolina State University, Kaitlyn worked as a tutor for the Academic Support
Program for Student-Athletes for the duration of the fall 2017 semester. After this, Kaitlyn was
awarded Graduate Teaching Assistantships for her 3 remaining semesters. She worked as a lab
technician in the knitting and spinning labs at the Wilson College of Textiles. Kaitlyn spent the
summer of 2018 interning at Bob Barker Company with their product management and
development team. In order to improve her understanding of process improvement and project
management, Kaitlyn also completed lean six sigma training in the spring of 2018. She received
her green belt certification in February 2019. Kaitlyn plans to fulfill her academic requirements
and graduate with a Master of Science in Textiles degree in May 2019.

iv
ACKNOWLEDGMENTS
I would like to take this opportunity to extend my appreciation to the important people
who helped to inspire my academic career.
I would like to thank my graduate advisory committee for their guidance and support
over the course of my graduate degree. Chiefly, I would like to thank my committee chair, Dr.
Trevor Little, for his encouragement and assistance. He has been an advocate and a mentor in
my research and has provided exceptional knowledge and guidance. Additionally, I would like
to thank Dr. Lori Rothenberg and Dr. Yingjiao Xu for their input and support in my research.
Their devotion and motivation in their fields proved inspirational in my graduate career.
Furthermore, I am incredibly grateful for the financial support that the Wilson College of
Textiles offered me during my graduate study.
I would like to thank my family, friends, and mentors for providing unwavering support
and encouragement. I am extremely thankful and blessed for all of the wonderful people in my
life and would not be where I am today without every one of them. Also, a thank you to my cats,
Salem and Sabrina, for their unconditional love.
Lastly, I would like to thank all of the runners who participated in my survey. This
research would not have been successful without their enthusiastic participation.

v
TABLE OF CONTENTS
LIST OF TABLES .................................................................................................................... viii
LIST OF FIGURES .................................................................................................................... ix
1. CHAPTER 1: INTRODUCTION ........................................................................................... 1
1.1. Background of the Study ............................................................................................ 1
1.2. Purpose of the Study ................................................................................................... 1
1.3. Research Objectives .................................................................................................... 1
1.4. Significance of Study .................................................................................................. 2
1.5. Research Design.......................................................................................................... 2
2. CHAPTER 2: LITERATURE REVIEW............................................................................... 4
2.1. Running Approach ...................................................................................................... 4
2.1.1. Health Benefits of Running .............................................................................. 4
2.1.2. Why Do People Run? ....................................................................................... 5
2.2. Brief History of Running Shoes .................................................................................. 6
2.3. Running Injuries.......................................................................................................... 9
2.4. Buying Habits ........................................................................................................... 11
2.5. Running Shoe Design ............................................................................................... 12
2.5.1. What Comfort Means to the Industry ............................................................. 15
3. CHAPTER 3: METHODOLOGY........................................................................................ 17
3.1. Purpose of the Study ................................................................................................. 17
3.2. Research Questions ................................................................................................... 17
3.3. Research Design........................................................................................................ 17
3.4. Survey Instrument ..................................................................................................... 18
vi
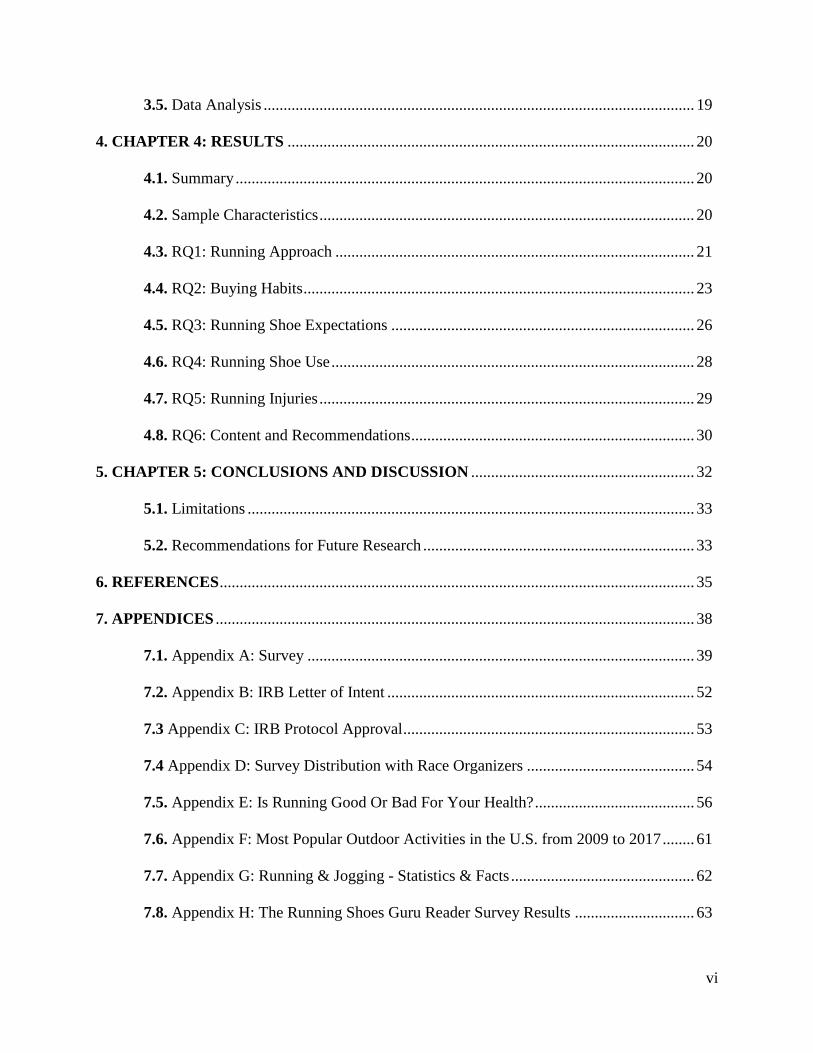
3.5. Data Analysis ............................................................................................................ 19
4. CHAPTER 4: RESULTS ...................................................................................................... 20
4.1. Summary ................................................................................................................... 20
4.2. Sample Characteristics .............................................................................................. 20
4.3. RQ1: Running Approach .......................................................................................... 21
4.4. RQ2: Buying Habits .................................................................................................. 23
4.5. RQ3: Running Shoe Expectations ............................................................................ 26
4.6. RQ4: Running Shoe Use ........................................................................................... 28
4.7. RQ5: Running Injuries .............................................................................................. 29
4.8. RQ6: Content and Recommendations ....................................................................... 30
5. CHAPTER 5: CONCLUSIONS AND DISCUSSION ........................................................ 32
5.1. Limitations ................................................................................................................ 33
5.2. Recommendations for Future Research .................................................................... 33
6. REFERENCES ....................................................................................................................... 35
7. APPENDICES ........................................................................................................................ 38
7.1. Appendix A: Survey ................................................................................................. 39
7.2. Appendix B: IRB Letter of Intent ............................................................................. 52
7.3 Appendix C: IRB Protocol Approval ......................................................................... 53
7.4 Appendix D: Survey Distribution with Race Organizers .......................................... 54
7.5. Appendix E: Is Running Good Or Bad For Your Health? ........................................ 56
7.6. Appendix F: Most Popular Outdoor Activities in the U.S. from 2009 to 2017 ........ 61
7.7. Appendix G: Running & Jogging - Statistics & Facts .............................................. 62
7.8. Appendix H: The Running Shoes Guru Reader Survey Results .............................. 63

vii
7.9. Appendix I: Runners - Average Miles Per Week Worldwide 2017 ......................... 73
7.10. Appendix J: Preferred Running Race Distance Worldwide 2017 .......................... 74
7.11. Appendix K: Run for Your (Long) Life: Harvard Health ....................................... 75
7.12. Appendix L: Why We Run ..................................................................................... 77
7.13. Appendix M: LA Research Project: Running Shoes History ................................. 80
7.14. Appendix N: A Brief History of the Running Shoe ................................................ 85
7.15. Appendix O: 10 Common Running Injuries: Prevention and Treatment ............... 86
7.16. Appendix P: Hip Tendonitis ................................................................................... 94
7.17. Appendix Q: Market Size of the Athletic Footwear Industry in the United
States from 2015 to 2017 (in billions U.S. dollars) .............................................. 104
7.18. Appendix R: Running Shoe Buying Habits .......................................................... 105
7.19. Appendix S: Money People Spend on Running Shoes Worldwide 2017 ............. 112
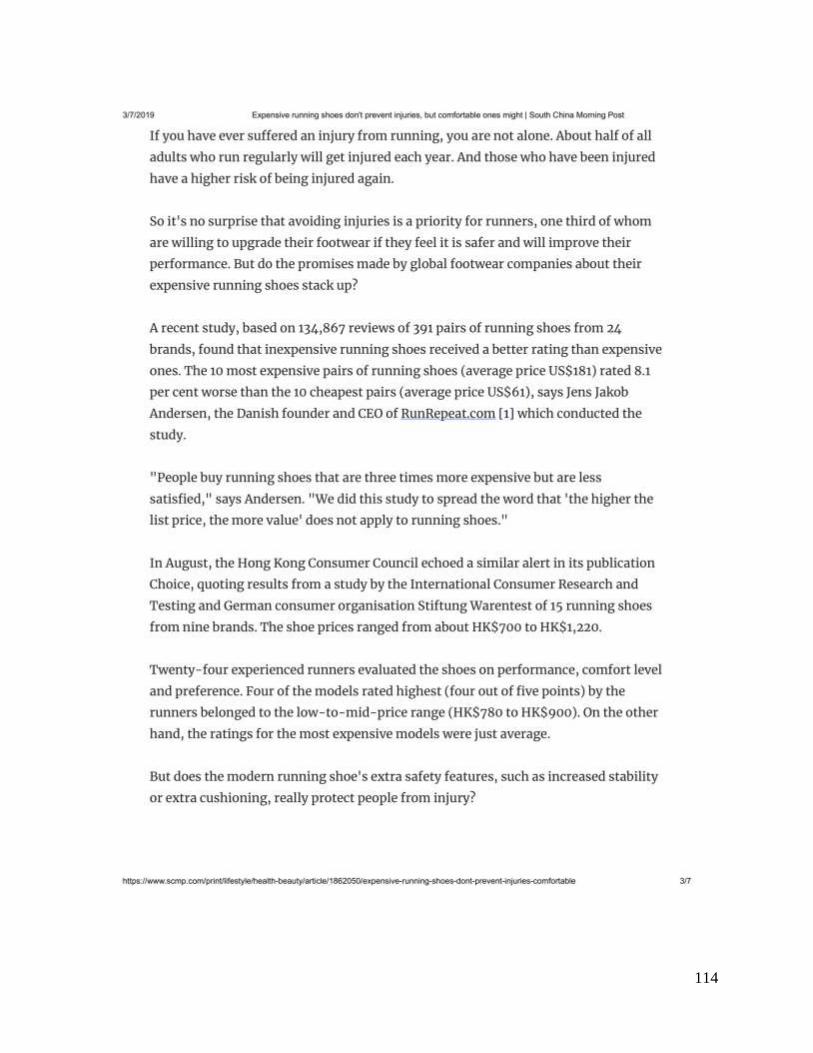
7.20. Appendix T: Expensive Running Shoes Don't Prevent Injuries, But
Comfortable Ones Might ...................................................................................... 113
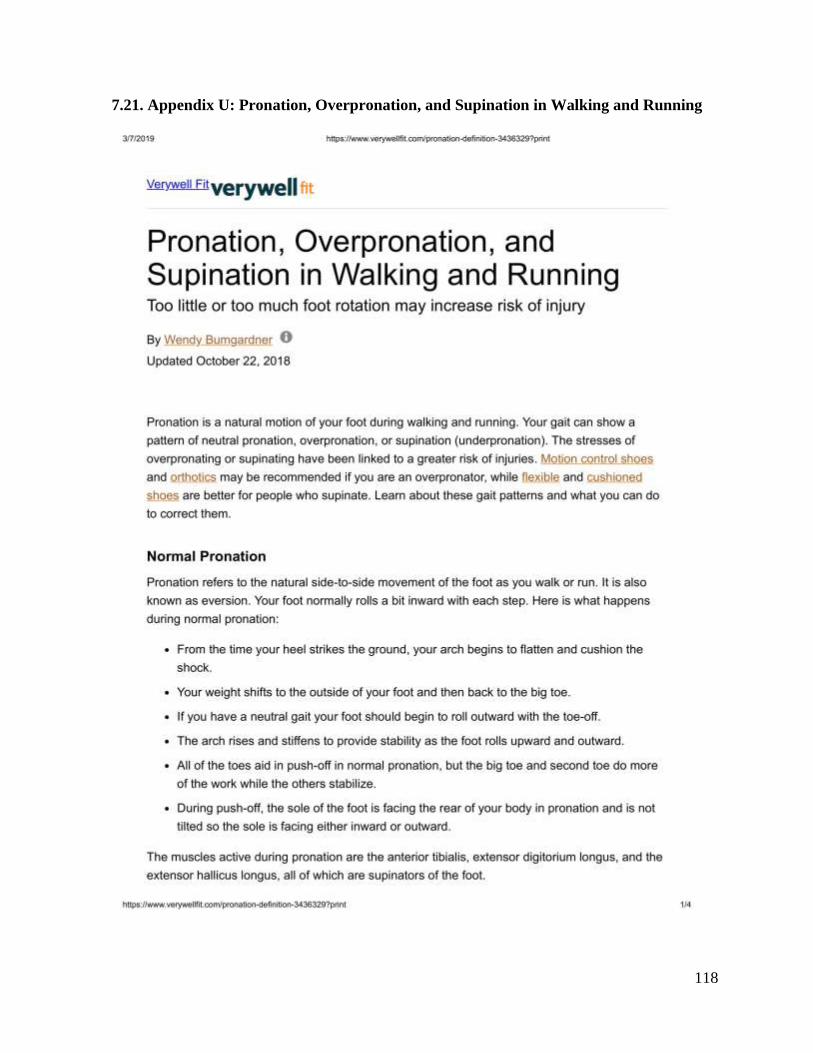
7.21. Appendix U: Pronation, Overpronation, and Supination in Walking and
Running ................................................................................................................. 118
7.22. Appendix V: Compiled Survey Results ................................................................ 122

viii
LIST OF TABLES
Table 1 Sample Characteristics ............................................................................................. 21
Table 2 Running Approach ................................................................................................... 22
Table 3 Weekly Mileage vs. Favorite Brand ......................................................................... 23
Table 4 Shoes Used Each Year and Brands .......................................................................... 24
Table 5 Resources and Shoe Factors ..................................................................................... 25
Table 6 Location of Purchase and Money Spent ................................................................... 26
Table 7 Running Shoe Expectations ...................................................................................... 27
Table 8 Gait Patterns ............................................................................................................. 27
Table 9 Shoe Usage ............................................................................................................... 29
Table 10 Running Injuries and Causes .................................................................................... 30
Table 11 Running Shoe Content and Recommendations ........................................................ 31

ix
LIST OF FIGURES
Figure 1 Pronation (Bumgardner, 2018) ................................................................................. 11
Figure 2 Favorite Brand of Running Shoes vs. Average Weekly Mileage (Luda, 2018) ....... 12
Figure 3 Examples of various shoe paradigm (Napier & Willy, 2018) .................................. 15
Figure 4 Clothing Comfort and Functional Design Evaluation System (Li, 2001) ................ 16

1
CHAPTER 1: INTRODUCTION
1.1. Background of the Study
Running is a popular sport and is appreciated by all ages. It was listed as the most
popular outdoor activity among Americans in 2018 when measured by both number of
participants and by number of total annual outings (Outdoor Foundation, 2018). Brands for
running shoes such as, but not limited to, Adidas, Asics, Brooks, Hoka One One, Mizuno, New
Balance, Nike, On, Reebok, Saucony, and Under Armour, have provided a variety of
performance shoes aimed to match to runners. While considerable research has been conducted
on how various aspects of running shoes may affect a runner, research on why runners wear the
shoes they select is limited. Every shoe design has different functional characteristics that
influence the user feel and performance during running.
Serious runners have a commitment that goes beyond just exercising for good health.
Generally, the more they run, the more they feel connected to their inner-selves, the more clearly
they see themselves, and the easier they see the tasks ahead (Gleiser, 2016). Currently, facets
that influence runners, at different levels of involvement, to purchase shoes for running have not
been wholly explored or understood in academia. In response, a main goal of this research study
is to investigate the factors that could influence the runner’s purchase intentions of running
shoes.
1.2. Purpose of Study
The purpose of this study was to investigate factors in running shoes that are important to
runners as well as the brand of shoe. This research would determine if more detailed shoe
market segmentation is possible for runners together with additional recommendations for
documentation that better matches the runner to the running shoe.
2
1.3. Research Objectives
The objectives of this research were:
1. To investigate if runners with similar running habits purchase specific brands.
2. To investigate the most common buying habits of runners.
2.1. To investigate what resources runners consult before deciding on a pair of shoes.
3. To investigate the aspects of running shoes that are not meeting runners’
expectations.
4. To investigate when runners decide to replace their shoes.
5. To investigate the most prevalent running-related injuries and causes.
6. To investigate if content and recommendations related to running shoes could be
improved upon.
1.4. Significance of Study
This research is important for three reasons:
1. To contribute to the knowledge of runners’ purchasing trends involving running shoes
along with motivations.
2. To determine possible important factors of running shoes required by runners at
different levels of commitment.
3. To facilitate a better understanding of runners’ expectations in running shoes and
running shoe content and recommendations.
1.5. Research Design
This study utilized both qualitative and quantitative research through the form of a
survey. While the topics of runners and how certain aspects of running shoes perform have been
studied extensively in the fields of sports science and kinesiology, the experience of runners with

3
running shoes has not been explored. It is for this reason that following a mixed methods
research design helped to facilitate the research’s overall direction.

4
CHAPTER 2: LITERATURE REVIEW
Running is one of the most popular and practiced sports worldwide. A study conducted
in the United States from 2009 to 2017 found running to be the most popular outdoor activity
with 55.9 million participants in 2017 (Statista, 2018). In 2017, about 24% of Americans stated
that exercise was the primary reason for them to start running (Statista, 2018). Nearly 80% of
American runners continue to run to stay healthy or to stay in shape (Statista, 2018). Relieving
stress and having fun were claimed to be the top reasons as to why people continue to run in the
United States (Statista, 2018).
2.1. Running Approach
Not all runners have been running consistently for years. In a survey conducted by
Running Shoes Guru, they asked how long ago their respondents started running. In order to
avoid confusion, they asked if a participant took a break from running and started up again, how
long it had been since they got back into a regular routine. While most runners responded “3-4
years”, the second and third most popular answers (as they were tied at 14%) were “26+ years”
and “1-2 years”, respectively (Paul, 2018). This suggests that there are many runners that have
been able to consistently run for years, but equally as many who have not. This worldwide
survey consisted of over 2,500 runners and found that 43% run an average of 11-25 miles a week
(Statista, 2018). Although not all runners may compete, entering a race or run in a particular
event is a major motivation to continue practicing the sport. In the survey, 36% of survey
respondents said that their favorite race distance was a half-marathon (Statista, 2018).
2.1.1. Health Benefits of Running
Running, even 5 to 10 minutes a day at slow speeds <6 mph, is associated with
markedly reduced risks of death from all causes and cardiovascular disease (Lee et al.,

5
2014). The study that made these claims found that during a mean follow-up of 15 years,
3,413 all-cause and 1,217 cardiovascular deaths occurred. Approximately 24% of adults
participated in running in this population. Compared with nonrunners, runners had 30%
and 45% lower adjusted risks of all-cause and cardiovascular mortality, respectively.
They also had a 3-year life expectancy benefit (Lee et al., 2014).
A Harvard study also found that running can add three years to a person’s life, as
will many other forms of cardiovascular exercise (Tello, 2017). The authors previously
published data from over 55,000 people that were followed over the span of 15 years.
This benefit was seen with as little as 5 to 10 minutes a day of running, even at paces as
slow as six miles per hour. These results were compiled after accounting for age, sex,
weight, and other health risk variables (like high blood pressure, diabetes, smoking, and
alcohol consumption) (Tello, 2017).
2.1.2. Why Do People Run?
When asked why they run, almost 50% of respondents in a survey conducted in
2017 by Running Shoes Guru answered that they run to stay fit and healthy (Paul, 2018).
The second and third most popular choices were to push themselves and improve their
mental well-being (Paul, 2018). Another survey, published in 1982, was conducted with
middle-aged non-elite marathon runners where they were questioned as to their reasons
for attempting a marathon, the perceived outcomes from running a marathon, and their
experiences while running (Summers et. al., 1982). While most runners began running to
improve physical fitness, personal challenge was the main reason for attempting a
marathon. Running the marathon was a very positive experience for the participants,
producing feelings of deep personal awareness and satisfaction (Summers et al., 1982).

6
Regardless of the decades between the conducted surveys, similar motivations were
found in runners.
Outside online interviewed various professional runners to question the reason(s)
they run (Outside Online, 2018). Laura Thweatt, a professional marathoner, stated how
she loves the simplicity of running and how it can be done almost anywhere by almost
anyone (Outside Online, 2018). Noah Droddy, a professional runner, detailed how
“running was the thing I knew I was best at, and it kept drawing me in. What I love about
it is that you get out what you put in. If you’re committed to doing the work, you will see
tangible results. Not everything in life is like that. Running is also such a great way to
see your community, get to know your body, and push yourself every day. I love the
experiences it leads to and the people you can meet” (Outside Online, 2018). Jared
Ward, another professional runner, chatted about how he could push himself with
running: “I’d been used to sports where there is a winner and a loser, but with running I
could always win by pushing harder and faster. I love the feeling of moving fast, and I
also love the idea of seeing how long I can push through when the fatigue sets in. I seek
freedom in terms of mind over body, and I’m trying to push my body further than it
wants. I think we all love freedom, right? It’s just me out there, and it’s only my shoes
between me and the pavement” (Outside Online, 2018).
2.2. Brief History of Running Shoes
The running shoe is a relatively new invention at just over 200 years old (LA Research
Project: Running Shoes, n.d.). Adolf Dassler is credited as the father of the modern running
shoe. He began making shoes in 1920 with shoe designs with spikes made specifically for
certain running distances (LA Research Project: Running Shoes, n.d.). This was the first time
7
that designs focused on whether the runner was sprinting or running distance. By 1936, his
designs were internationally acknowledged and worn by athletes such as Jesse Owens. In 1948,
Dassler founded a company that would soon split off and become what is known today as Adidas
(LA Research Project: Running Shoes, n.d.). A year later in Japan, Kihachiro Onitsuka created
what would become ASICS (LA Research Project: Running Shoes, n.d.).
Throughout this post war period the demand for leisure footwear grew. The fitness craze
of the 1930s meant sneakers became associated with sports and leisure activities. In 1936 the
U.S. basketball team adopted the Converse Chucks as the official shoe. In the same year,
Dassler’s running shoes were worn at the Berlin Olympics. By the 1950s famous runners were
supplied shoes for free. At the discretion of the athlete, they either wore socks or not. This
would imply the shoe was a very tight fit.
Demand for specialized shoes helped Nike get their start in the running shoe industry.
Their first big innovation came in 1972 when rubber was poured into a kitchen waffle iron by
one of the founding employees, Bill Bowerman. This was the birth of the waffle sole, as well as
the best-selling running shoe in the country (LA Research Project: Running Shoes, n.d.). During
the late 20th century, NASA was not only making strides for the space program, but was also
working with Nike to develop the first air cushioned athletic shoe. Frank Rudy from NASA
brought the idea of bags filled with pressurized gas that compress under impact to Nike (LA
Research Project: Running Shoes, n.d.). The bags absorb shock and cushion the foot. The
cushion was placed in the soles of Nike shoes and is still used today (LA Research Project:
Running Shoes, n.d.).
In 1973 track athlete Steve Profontane became the first major track person to wear Nike
running shoes. When the aerobics explosion took place, Reebok saw the market potential and
8
began to make trainers in softer materials and in colors appropriate for a variety of tastes (LA
Research Project: Running Shoes, n.d.). The shoes were also less rigid in construction. The
1976 Montreal Olympics was the first time an athlete was photographed endorsing his running
shoes after winning the 10,000 meter race (6.2 miles) (LA Research Project: Running Shoes,
n.d.).
During the 1970s running shoes were designed based not only on the type of running the
person did, but the running style the runner had. Pronation is a natural motion of the feet during
walking and running (Bumgardner, 2018). A person’s gait can show a pattern of neutral
pronation, overpronation, or supination (underpronation). These were the three running styles
for which shoes were designed. Another advancement that running shoes received during the
1970s was the use of ethylene vinyl acetate, also referred to as EVA. This material added an air
cushion to the design of a running shoe, providing runners with extra cushion and shock
absorption when they ran (LA Research Project: Running Shoes, n.d.).
In 1977, Brooks Vantage became the first mass-market running shoe with an EVA
midsole and “varus wedge” said to control pronation (Douglas, 2014). New Balance 990 became
the first $100 running shoe in 1982, while 1986 saw Adidas stitching in an electronic pedometer
(Douglas, 2014). This was the first attempt to meld electronics with running shoes. Reebok
released a running shoe in 1991 that had air chambers in the upper that were said to allow for a
customized fit (Douglas, 2014).
The first version of the Nike free was released in 2004 and is now seen as an early
minimalist model, with the bulk of sales being attributed to non-runners (Douglas, 2014). The
next year saw the release of the Vibram Fivefingers, a shoe originally made for outdoor
activities. In 2009, Hoka One One released their first maximally cushioned shoe (Douglas,

9
2014). Not long after, in 2014, companies began competing to introduce the lightest road racing
flat in the market. Today there are many running shoe companies marketing shoes to suit all
styles, surfaces, distances, and speed.
2.3. Running Injuries
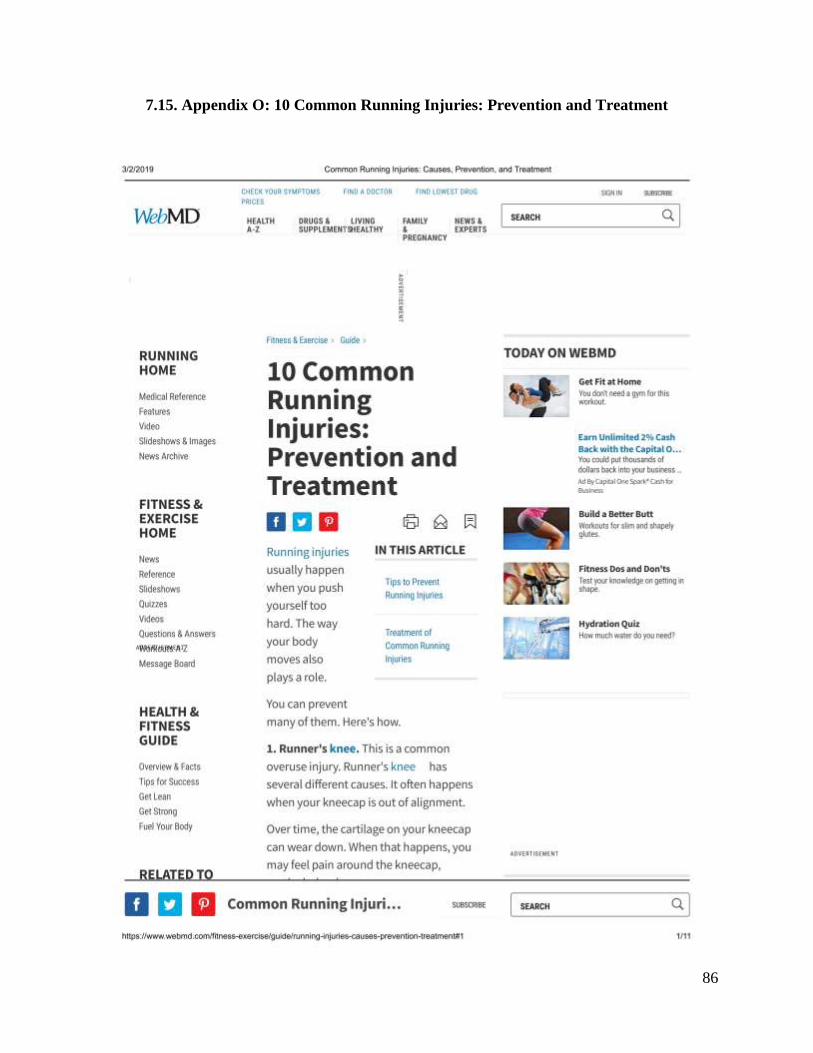
Running injuries usually occur when a runner pushes their body too hard. WebMD was
utilized as a resource to compile the top running-related injuries (WebMD, n.d.):
1. Runner’s knee is claimed to be a common overuse injury as it has several different
causes. It often occurs when the kneecap is out of alignment or the cartilage on a
kneecap wears down (WebMD, n.d.).
2. A stress fracture is a small crack in a bone that causes pain and discomfort. It
typically affects runners in the shins and feet as it is often due to working too hard
(WebMD, n.d.).
3. Shin splints occur in the front or inside of the lower leg along the shin bone. The pain
is common after changing a workout, such as running longer distances or increasing
the number of days a person runs too quickly (WebMD, n.d.).
4. Achilles tendinopathy, also known as tendinitis, is the inflammation of the Achilles
tendon. It causes pain and stiffness in the area of the tendon, especially in the
morning and with activity. It is usually caused by repetitive stress to the tendon.
Adding too much distance to a running routine can cause it. Tight calf muscles can
also contribute (WebMD, n.d.).
5. Muscle pull and/or strain is often caused by overstretching a muscle. If a muscle is
pulled, one may feel a popping sensation when the muscle tears (WebMD, n.d.).

10
6. An ankle sprain is the accidental stretching or tearing of ligaments surrounding the
ankle. This often occurs when the foot twists or rolls inward (WebMD, n.d.).
7. Plantar fasciitis is an inflammation of the plantar fascia. This is the thick band of
tissue in the bottom of the foot that extends from the heel to the toes (WebMD, n.d.).
8. IT (iliotibial) band syndrome causes pain on the outside of the knee. The IT band is a
ligament that runs along the outside of the thigh, from the top of the hip to the outside
of the knee. It occurs when this ligament thickens and rubs the knee bone, causing
inflammation (WebMD, n.d.).
9. Blisters are fluid-filled sacks on the surface of the skin. They are caused by friction
between shoes, socks, and/or skin (WebMD, n.d.).
10. Temperature-related injuries include sunburn, heat exhaustion, frostbite, and
hypothermia (WebMD, n.d.).
11. Another injury that can occur from running is hip flexor strain and/or tendinitis. It
can become irritated due to overuse, muscle weakness, and muscle tightness, causing
tenderness and pain. Athletes with hip flexor tendonitis often complain of “clicking”
in the hip and pain while running or walking (WebMD, n.d.).
Pronation is a natural motion of the feet during walking and running. A person’s gait can
show a pattern of neutral pronation, overpronation, or supination (underpronation). Examples
can be seen in Figure 1. The stresses of overpronating or supinating have been linked to a
greater risk of injuries. Motion control shoes and orthotics may be recommended if someone is
an overpronator, while flexible and cushioned shoes are better for people who supinate
(Bumgarder, 2018).

11
Figure 1. Pronation (Bumgardner, 2018).
2.4. Buying Habits
In 2017, the athletic footwear industry in the United States generated 19.6 billion U.S.
dollars in revenue (Statista, 2018). The top 5 running shoes brands found in a survey obtained
by Statista in late 2017 were Asics, Brooks, Nike, Saucony, and Hoka One One (Statista, 2018).
This is the same survey that is referenced earlier from Running Shoes Guru. Comparing favorite
brand of running shoes by average weekly mileage in the survey can be seen in Figure 2 (Luda,
2018).

12
Figure 2: Favorite Brand of Running Shoes vs. Average Weekly Mileage (Luda, 2018).
In the questionnaire, a quarter of the survey respondents said that they spent between
$101 and $120 U.S. dollars on their last pair of running shoes (Statista, 2018). Almost half
(47%) answered between $80 and $120 (Luda, 2018). When purchasing a new pair of running
shoes, runners do not only look at price. They seek out comfort. The survey indicated this and
found that 38% sought out comfort, 26% based their purchase on personal experience with that
brand, 17% were guided by reviews, 7% chose a pair based on the brand alone, and 5% focused
on recommendations (Luda, 2018).
2.5. Running Shoe Design
Various features of the design of running shoes have been known to affect the
performance and safety of athletes (Frederick, 1984). The performance-related effects of shoe
design on traction and on the economy of locomotion were reviewed in a paper by E.C.
Frederick. Traction measurements in various types of running shoes and on various surfaces
appeared to be adequate for all but running on wet asphalt roads. Future designs were
recommended to improve traction for those conditions (Frederick, 1984). The cost of carrying
similar weights is much lower for walking or for running when the weight is carried nearer the
body's center of mass. Cushioning and other features of shoe design besides weight were shown

13
to have significant effects on the economy of locomotion. Top designs for maximizing running
performance were recommended to provide sufficient traction, minimal weight, and maximum
cushioning (Frederick, 1984). While the study was conducted in 1984, recent studies have found
similar results with the latest shoe designs.
The optimum balance still remains to be found for the design of shoes regarding
cushioning, durability, and injury prevention (Chambon et al., 2014). For the past 40 years,
running shoes have been prescribed on the basis of matching shoe features to foot morphology in
order to prevent running-related injuries (RRI) (Napier & Willy, 2018). Still, many studies have
found that this does not seem to prevent RRIs. In contrast, a recent investigation found that
motion control shoes protected against injury in experienced runners who had pronated feet
(Napier & Willy, 2018). There are likely important methodological reasons for the discrepancies
between these studies. However, the lack of conclusive evidence leaves more to be desired in
both the running and scientific communities.
Alternative shoe recommendation models have emerged. While minimalist shoes have
historically received the most attention from researchers, clinicians, and runners, the more recent
paradigms of maximalism, zero-drop shoes, and choosing a shoe based on comfort appear to be
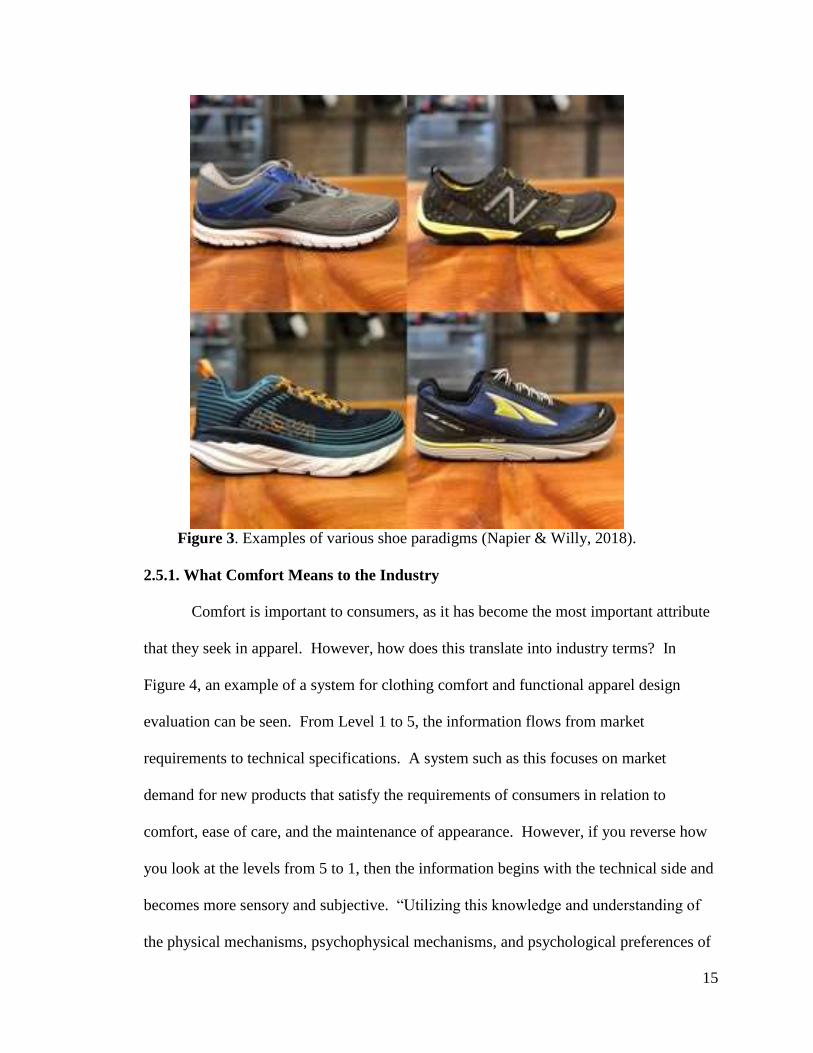
gaining in popularity. Figure 3 demonstrates this clockwise from top left: traditional (Brooks
Epinephrine 18), minimalist (New Balance Minimus Trail 10), zero-drop (Altra Torin 2.5) and
maximalist (Hoka Bondi 6) (Napier & Willy, 2018). Runners, like the rest of the population,
have anatomical, physiological, and kinematic differences (Clifton et al., 2011). Despite the lack
of proof from the research, the market is inundated by claims from global footwear companies
about the advantages of their products. These claims are often full of vague terms, which waver
between the medical and sportswear industries. Words such as "zoom", "fast", "elite", and

14
"launch pad" are used among others suggesting direct benefits from shoes, such as "better" and
"safer" (Arnold, 2015). In 2012, a class-action lawsuit was made against Vibram USA, the
company that makes FiveFingers running shoes. These are the glove-like footwear in the middle
of the "natural" or "barefoot" running phenomenon (Arnold, 2015). The case was based on
unsupported and deceptive claims of "strengthened foot and leg muscles", "reduced risk of
injury", and improved "balance and agility" and "spinal posture" from wearing the shoes
(Arnold, 2015). Vibram USA settled, offering refunds to customers and discontinuing the use of
these claims. Similarly, promises of more toned buttocks from walking in Reebok's EasyTone
shoes were found to be deceptive and misleading by the U.S. Federal Trade Commission
(Arnold, 2015). Reebok was required to pay the U.S. $25 million in customer refunds. The
company was also banned from making unsubstantiated health and fitness claims relating to its
"toning" footwear (Arnold, 2015). If running shoe manufacturers had a reliable method with
which to purposely customize and prescribe these characteristics to meet the requirements of a
specific user group, they could add significant value to the industry, potentially minimize the
prevalence of injuries that are suffered by modern runners, and limit and/or avoid more
preventable lawsuits (Clifton et al., 2011).
15
Figure 3. Examples of various shoe paradigms (Napier & Willy, 2018).
2.5.1. What Comfort Means to the Industry
Comfort is important to consumers, as it has become the most important attribute
that they seek in apparel. However, how does this translate into industry terms? In
Figure 4, an example of a system for clothing comfort and functional apparel design
evaluation can be seen. From Level 1 to 5, the information flows from market
requirements to technical specifications. A system such as this focuses on market
demand for new products that satisfy the requirements of consumers in relation to
comfort, ease of care, and the maintenance of appearance. However, if you reverse how
you look at the levels from 5 to 1, then the information begins with the technical side and
becomes more sensory and subjective. “Utilizing this knowledge and understanding of
the physical mechanisms, psychophysical mechanisms, and psychological preferences of

16
consumers on various sensory perceptions, one can develop predictive tools using either
statistical or mathematical models for product development purposes” (Li, 2001). This is
what the industry is trying to do more of today, as manufacturers can prepare better using
predictive tools such as statistical of mathematical models. It can help them save time
and money by responding to the market demand more quickly and with a greater
confidence.
Figure 4. Clothing Comfort and Functional Design Evaluation System (Li, 2001).

17
CHAPTER 3: METHODOLOGY
3.1. Purpose of Study
The purpose of this study was to investigate factors in running shoes that are important to
runners as well as the brand of shoe. This study investigated runners’ buying habits along with
motivations and other factors that are potentially influential in their level of commitment with
different types of running shoes. Elements of running and various running shoes that were
explored included: running approach, buying habits, expectations, shoe uses, injuries, and
content and recommendations for running shoes.
3.2. Research Questions
The following six research questions guided the design of the current study:
RQ1: Are runners with similar running habits purchasing specific brands?
RQ2: What are the most common buying habits of runners?
RQ2a: What resources are runners consulting before deciding on a pair of
shoes?
RQ3: What aspects of running shoes are not meeting runners’ expectations?
RQ4: What factors do runners use to determine when to replace their shoes?
RQ5: What are the most prevalent running-related injuries and their causes?
RQ6: What form of content and recommendations would runners like to have
available before deciding on a pair of running shoes?
3.3. Research Design
A survey (Appendix A) was conducted to collect data for this study. An IRB approval
(Appendices B & C) was obtained through North Carolina State University prior to the survey
distribution. Qualtrics, an online survey software and questionnaire tool, was used to create the

18
online survey. Respondents were provided with the web-link directing them to the anonymous
questionnaire. The survey took approximately 5-10 minutes for participants to complete.
Qualtrics automatically recorded and stored the responses for data analysis. The data collection
took place over a seven-week duration from the end of November 2018 to the middle of January
2019.
The target population of this study consisted of runners from age 15 and older. Running
often begins at an age younger than 18. The purpose of surveying 15-17 year olds was to capture
the experiences of high school age runners. A snowball method was used to recruit a
convenience sample to participate in the survey. A survey link was posted to social media, as
well as sent to several running mailing lists in North Carolina. The goal was to obtain
approximately 1,000 completed surveys. During the data collection process, ongoing monitoring
was implemented to delete incomplete surveys and respondents that selected that they would not
like to participate in the study.
3.4. Survey Instrument
There were multiple sections to the survey. The first section gathered the necessary
demographics for the survey to determine the estimated age range of the respondents and if they
wear male or female running shoes. The second section focused on the running approach of the
participants. It measured their running habits for training, exercising, and competing. The third
section focused on the buying habits of runners to measure their brand regularity, what they
focus on when purchasing shoes, and the resources they consult before buying. The fourth
section inquires if and how previous shoes have not met their expectations. It also questions if
they purchase shoes meant for certain gait patterns or not. The fifth section inquires the factors
that drive runners to replace their shoes as well as their uses. The sixth section examined the
19
different types of injuries that could befall runners in addition to their causes. The last section
invited participants to give their opinions on what content and recommendations they would like
to see with running shoes.
3.5. Data Analysis
The goal was to obtain approximately 1,000 completed surveys. When the survey link
was deactivated, 1,478 responses were recorded. Of these, 1,472 chose to participate in the
survey. Participants were also given the option to skip questions in the survey, so all surveys
that were submitted after the final question were kept. Any in-progress surveys that were not
submitted were deleted automatically by Qualtrics when the survey was closed on January 22nd,
2019.
A Python script was utilized to clean and reformat the data collected from the survey.
The Python script used the XML file provided by Qualtrics and parsed it using the ElementTree
package. Once the file was read in, irrelevant fields were filtered. From here, questions with
multiple response options were split into distinct columns through the use of pattern matching.
Once processing was complete, the data was written out to a CSV file. After the file was opened
in Excel, the data was compiled and analyzed using its built-in capabilities. All free response
information was gathered and grouped based on relevant categories to visualize the responses
cohesively.

20
CHAPTER 4: RESULTS
4.1. Summary
A total of 1,472 valid surveys were included to address the six research questions in this
study. This chapter consists of seven major sections. The first is an overview of respondents’
characteristics, followed by the next six sections consisting of the results, organized per the
research questions. All data from the survey was analyzed using descriptive statistics. The
tables consist of frequency distributions.
4.2. Sample Characteristics
Frequency analyses were conducted to compile the sample profile. The demographic
characteristics of the sample are summarized in Table 1. Among the final sample, over half of
the respondents wore female running shoes (57.1%). Participants were asked at what age they
started running and how many years they have been running since. In order to avoid confusion,
they were asked if they took a break from running and started up again, at what age they returned
to a regular running routine. Respondents averaged just over 11 years of running consistently.
The age range distribution of the participants (based on the calculation of their responses to the
age they started running and how many years it has been since that point) varied with over one-
fourth (29.7%) being in the estimated age range of 35-44, another 23% being in the range of 45-
54, 20.4% in the range of 25-34, 12.9% in the range of 15-24, and the remaining 14.1% were
aged about 55 and older. Therefore, the sample profile provided enough data to be applicable for
a variety of ages and gender of running shoes. Female running shoes were most prevalent, and
the majority of responses were from individuals in the 35-44 age range. Participants averaged 11
years of consistent running experience.

21
Table 1. Sample Characteristics.
4.3. RQ1: Running Approach
In addition to demographic characteristics, respondents’ were asked for details about their
running routine. These can be seen in Table 2 and address RQ1. “Road and/or paved surface”
(80.2%) was the surface run on the most with “sidewalk” at 38.3% and “woodland trail, grass,
and/or dirt” at 32.5%. Responses involving running on treadmills, track, rocky trail/gravel, sand,
and other were compiled and comprised the last 24.3% of the responses. In terms of average
weekly running mileage, half of the respondents (50.7%) answered “11 to 25 miles”, 21%
answered “less than 11 miles”, 19.8% answered “26-40 miles”, and 8.4% answered with “40+
miles” weekly. To assess the competitive nature/habits of the respondents, they were asked their
usual race distance and how many organized races they run each year on average. The usual race
distance chosen by respondents (32.3%) was “5K (3.1 mi)”. “Half-marathon (13.1 mi)” was the
second-highest choice at 29.9%. Most respondents (26%) answered that they run in “3-4”
organized races each year, 20.1% answered “5-6” organized races per year, 17.1% answered “1-
2”, and the last compiled 38.6% of respondents answered that they run in at least 7 races a year.
Consequently, the running routine data collected consisted of types of running surfaces, weekly
miles completed, and competition races entered. Most runners used a road and/or paved surface
Demographics Response Percent
Shoe Gender Female running shoes 57.1%
Male running shoes 42.9%
Age Range
15-24 12.9%
25-34 20.4%
35-44 29.7%
45-54 23.0%
55+ 14.1%
Average Number of Years Running
(Consistently) 11.4
Average Estimated Age 40.2

22
and completed 11-25 miles a week. The participants in this survey are serious and dedicated
runners.
Table 2. Running Approach.
Table 3 demonstrates more survey results related to RQ1. It shows that regardless of
average weekly distance, Brooks’ shoes were the top choice among participants. Saucony was
consistently chosen as the second most common option among runners averaging at least 11
miles a week. Asics showed up in the top three of all mileage ranges except the 26-40 miles
range where Hoka One One claimed the third spot. Nike made an appearance as well, as the
third top brand for runners who average less than 10 miles a week. Overall, all participants
preferred Brooks’ shoes. This shoe was preferred even though distances completed were
different.
Answer Response Percent
Running Surfaces
Road and/or paved surface 80.2%
Sidewalk 38.3%
Woodland trail, grass, and/or dirt 32.5%
Treadmill, Track, Rocky trail/gravel, Sand,
Other 24.3%
Average Weekly
Running Mileage
Less than 10 miles 21%
11-25 miles 50.7%
26-40 miles 19.8%
40+ miles 8.4%
Usual Race Distance
Track (under 5K/3.1 mi) 3.2%
5K (3.1 mi) 32.3%
10K (6.2 mi) 10.6%
11-20K (over 6.2 mi, but under 13.1 mi) 3.9%
Half-marathon (13.1 mi) 29.9%
Marathon (26.2 mi) 11.7%
Ultra-marathon (over 26.2 mi) 8.4%
Average Number of
Organized Races
1-2 17.1%
3-4 26%
5-6 20.1%
7+ 38.6%

23
Table 3. Weekly Mileage vs. Favorite Brand.
4.4. RQ2: Buying Habits
Buying habits were measured by a number of items within the questionnaire. These
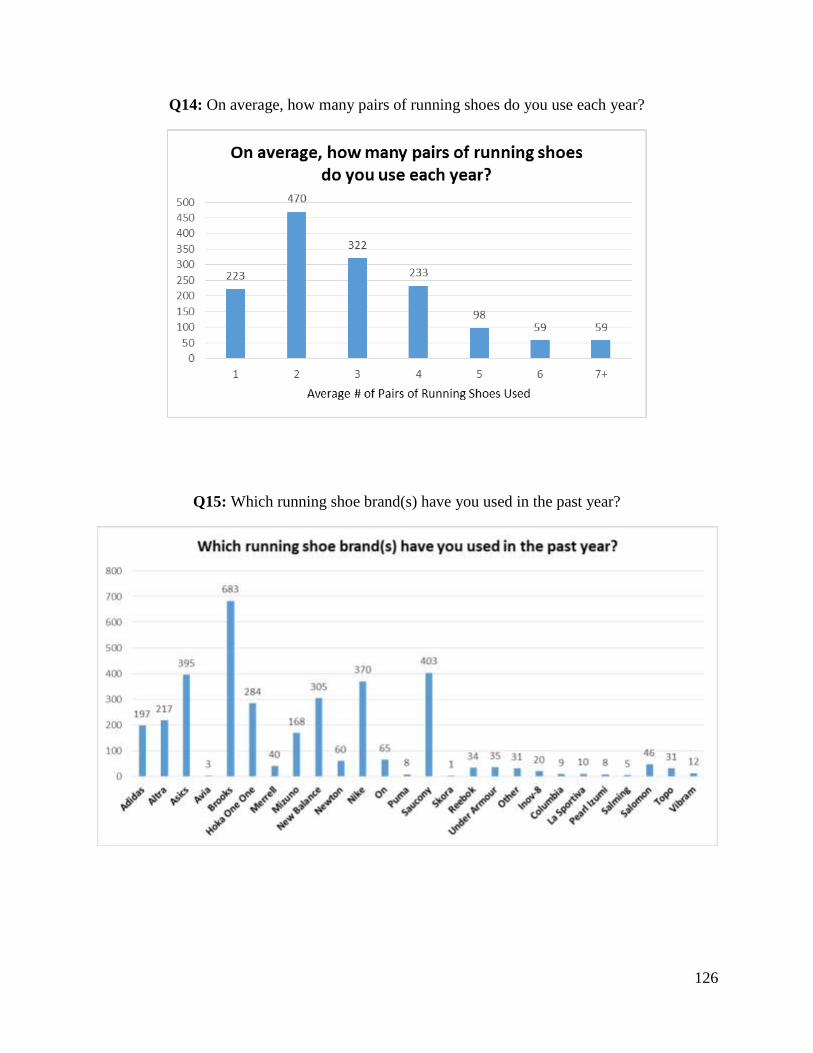
results address RQ2 and RQ2a. Respondents answered that they use an average of 2 pairs
(32.1%) of running shoes each year. 22% of respondents use 3 pairs, 15.9% use 4 pairs, and
15.2% only use 1 pair a year on average. To determine the most used brands of running shoes,
respondents were asked which brands they used in the past year. Almost half (46.6%) of the
respondents chose Brooks, with Saucony at 27.5% and Asics at 26.9%. Nike was chosen 25.2%
of the time by respondents and New Balance came in at 20.8%. These top responses were
almost completely mirrored in the respondents’ answers to their favorite running shoe brand.
Brooks’ shoes were chosen again as the top choice with 26.9%. Saucony had 12.6% and Asics
had 10.4%, while Nike came in at 9.6%. The difference is that instead of New Balance being
chosen as a top choice, Hoka One One came in fifth with 7.3%. The compiled responses can be
seen in Table 4. In summation, the results of buying habits revealed that Brooks’ shoes were the
most often used and preferred brand.
Average Weekly Mileage Top 3 Favorite Brands Response Percent
Less than 10 miles (<16 km)
Brooks 25.6%
Asics 13.9%
Nike 12.9%
11-25 miles (16-40 km)
Brooks 32.2%
Saucony 13%
Asics 11%
26-40 miles (41-64 km)
Brooks 17.8%
Saucony 12.3%
Hoka One One 10.6%
40+ miles (>64km)
Brooks 18.7%
Saucony 17.1%
Asics 13.9%

24
Table 4. Shoes Used Each Year and Brands.
Answer Response Percent
Pairs of Running Shoes
Used Annually (average)
1 15.2%
2 32.1%
3 22.0%
4 15.9%
5 6.7%
6 4.0%
7+ 4.0%
Top 5 Running Shoe Brands
Used (in the past year)
Brooks 46.6%
Saucony 27.5%
Asics 26.9%
Nike 25.2%
New Balance 20.8%
Top 5 Favorite Running
Shoe Brands
Brooks 26.9%
Saucony 12.6%
Asics 10.4%
Nike 9.6%
Hoka One One 7.3%
Before making a running shoe purchase, people often refer to a resource. Respondents
were asked what resources they have consulted before deciding on a pair of running shoes. Most
(61.5%) were repeat purchases, but 56.2% of respondents consult a salesperson of some degree
before making a purchasing decision. Online guides and/or online recommendations made up
42.9% and online reviews consisted of 41.9%. Along with consulting resources, runners
consider multiple factors when determining what running shoe is best for them. Respondents
were asked the top five factors that they consider when buying running shoes. Comfort was
chosen as the top factor (87.1%), with support (52%) and cushion (51.2%) chosen by over half of
the respondents as well. Price came in fourth with 49.7% and brand (36.8%) was chosen as the
fifth most popular factor. Of their top five choices, respondents were also asked to choose the
factor that was the most important to them. Comfort was the top choice, with over half of the

25
participants (53.5%) choosing it. The rest of the top responses mirrored the top five of the
previous question: support was 15.6%, cushion was 8.2%, price was 4.4%, and brand was the
last of the top five with 3.3%. The following Table 5 shows the top responses collected.
Consequently, it was determined that participants prefer to make their shoe purchases based on
recommendations from salespersons if not just repeating a previous purchase. The runners also
chose comfort above other aspects of their running shoes.
Table 5. Resources and Shoe Factors.
Answer Response Percent
Top Resources
Consulted
Repeat previous purchase 61.5%
Salesperson 56.2%
Online guide and/or recommendations 42.9%
Online reviews 41.9%
Word of mouth and/or running
colleague 35.8%
Top 5 Factors
Considered
Comfort 87.1%
Support 52.0%
Cushion 51.2%
Price 49.7%
Brand 36.8%
Top Factors Chosen
from Top 5 Factors
Comfort 53.5%
Support 15.6%
Cushion 8.2%
Price 4.4%
Brand 3.3%
Running shoes can be purchased in-store and online. In order to determine how runners
are purchasing their shoes, respondents were asked where they purchase their running shoes.
Almost half of the questionnaires indicated that respondents only purchase their shoes in-store
(47.3%). Those that purchase their shoes both online and in-store came in at 26.8% and online
only was 25.9%. Participants were then questioned about the average price range that they
purchase shoes in. The top response was the $101-$120 range at 35.4%, with $81-$100 at 24.3%

26
and $121-$140 at 20%. The following Table 6 shows the total responses collected for location
of purchase and average price ranges. Therefore, in-store purchases were the most preferred by
the participants. Also, most runners spent $101-$120 on their running shoes.
Table 6. Location of Purchase and Money Spent.
Answer Response Percent
Location of Running Shoe
Purchases
In-store only 47.3%
Online only 25.9%
Both in-store and online 26.8%
Money Spent on Running
Shoes (average in 2018 US
dollars)
Less than $40 0.8%
$40-$80 13.0%
$81-$100 24.3%
$101-$120 35.4%
$121-$140 20.0%
$141-$180 5.8%
Over $180 0.5%
4.5. RQ3: Running Shoe Expectations
Expectations are not always met after a runner purchases a pair of running shoes. The
questionnaire asked if participants have ever run in a pair of shoes that did not meet their
expectations. These results investigate RQ3 and can be seen in Table 7. Out of the respondents,
84.4% answered that they have encountered shoes that did not meet their expectations. As a
follow-up question to those that answered “Yes”, participants were then asked what expectations
were not met. This was a free response question, so the responses were cleaned and classified
into nine categories. Comfort and fit are subjective and were therefore the expectations that were
not met the most (55.5%). Support and stability can also be subjective and were mentioned
19.6% of the time, while quality and durability were mentioned in 17.6% of the responses.
Consequently, it was determined that many participants have purchased shoes that did not meet
their anticipated expectations. Since the question had no guided answers, categories created to

27
quantify the received data showed that comfort and fit were most often the responses of
expectations not met in running shoes.
Table 7. Running Shoe Expectations.
Answer Response Percentage
If Have Run In Shoes That
Did Not Meet Expectations
Yes 84.4%
No 15.6%
Shoe Expectations That Were
Not Met
Comfort and Fit 55.5%
Support and Stability 19.6%
Quality and Durability 17.6%
Injury and Pain 16.2%
Design 12.7%
Cushion 9.7%
Size 6.4%
Weight 3.7%
Price 0.4%
Participants were presented with a reference picture (Figure 1) showing examples of
different gait patterns. Using this, participants were then asked what their gait pattern is when
they run. Over half of respondents answered that they have a neutral gait (52.9%), while 24.6%
claimed to overpronate and 14.1% claimed to supinate. These results can be seen in Table 8.
When questioned if their gait pattern affects the type of running shoe they purchase, the majority
of respondents answered “yes” (70.1%). Over half of the participants believe they have a neutral
gait and that their gait pattern affects their shoe purchases.
Table 8. Gait Patterns.
Answer Response Percentage
Perceived Gait Pattern
Neutral 52.9%
Overpronation 24.6%
Supination (underpronation) 14.1%
I don’t know 8.4%
If Gait Pattern Affects
Participants’ Shoe Purchases
Yes 70.1%
No 29.9%

28
4.6. RQ4: Running Shoe Use
The life of a pair of running shoes may vary and many runners have different reasons for
deciding to replace their shoes. Participants were asked what factors they take into consideration
when determining the time to replace their running shoes. This addresses RQ4 and can be seen
in Table 9. Almost half of the participants (48.3%) responded that they replace their shoes after
the tread starts to look bare and/or worn and 40.5% after having run a certain distance in them
(such as 300 miles). Numerous runners’ feet begin to hurt from running when their shoes have
worn out, as 32.2% of respondents answered this. Consequently, runners primarily use tread
wear as a determining factor on when to replace shoes.
Those that claim they replace their shoes after having run a certain distance in them were
then asked how many miles (on average) they run in their shoes. The majority of the
respondents (41.9%) run 300-399 miles in their shoes, while 28.7% run 400-499 miles and
14.4% run 200-299 miles in their shoes. However, runners may use their shoes for more than
running. Respondents were asked what they specifically use their shoes for. While running was
selected 98.6% of the time by respondents, walking came in second with 37.1%. Everyday use
was the third most common response with 17.6%. Summarily, the participants replace their
running shoes when they have run between 300-399 miles in their shoes. Most participants also
used their shoes primarily for running.

29
Table 9. Shoe Usage.
4.7. RQ5: Running Injuries
Injuries can be common in running-related activities. Respondents were asked if they
have ever received an injury due to running and, if so, what it was related to. This section
addresses RQ5 and the top results can be seen in Table 10. Overuse of body was chosen 65.9%
of the time, while ill-fitting shoes (18.8%) and running surface (14.1%) were much farther
behind. These reflect the responses to the following question that ask the exact injuries they
have experienced from running. The most common responses (58.4%) involved blisters and/or
bunions, with IT band syndrome (36.9%) and shin splints (36.1%) coming in a close second and
third. Not far behind, muscle pull, strain, and/or cramps received 35.1% and runner’s knee
received 30.7%. Therefore, most running injuries reported resulted from overuse. When asked
about specific injuries, most often the response was blisters and/or bunions.
Answer Response Percentage
When Runners Replace
Their Shoes
Tread starts to look bare and/or
worn 48.3%
After having run a certain distance
in them (such as 300 mi) 40.5%
Feet start to hurt from running 32.2%
Shoes starting to fall apart, have
holes, lose cushioning, etc. 28.1%
Knees start to hurt from running 23.1%
Average Mileage on
Running Shoes Before
Replacing
100-199 1.5%
200-299 14.4%
300-399 41.9%
400-499 28.7%
500+ 13.5%
Top Running Shoe Uses
Running 98.6%
Walking 37.1%
Everyday use 17.6%
Hiking 14.7%
Biking 8.0%

30
Table 10. Running Injuries and Causes.
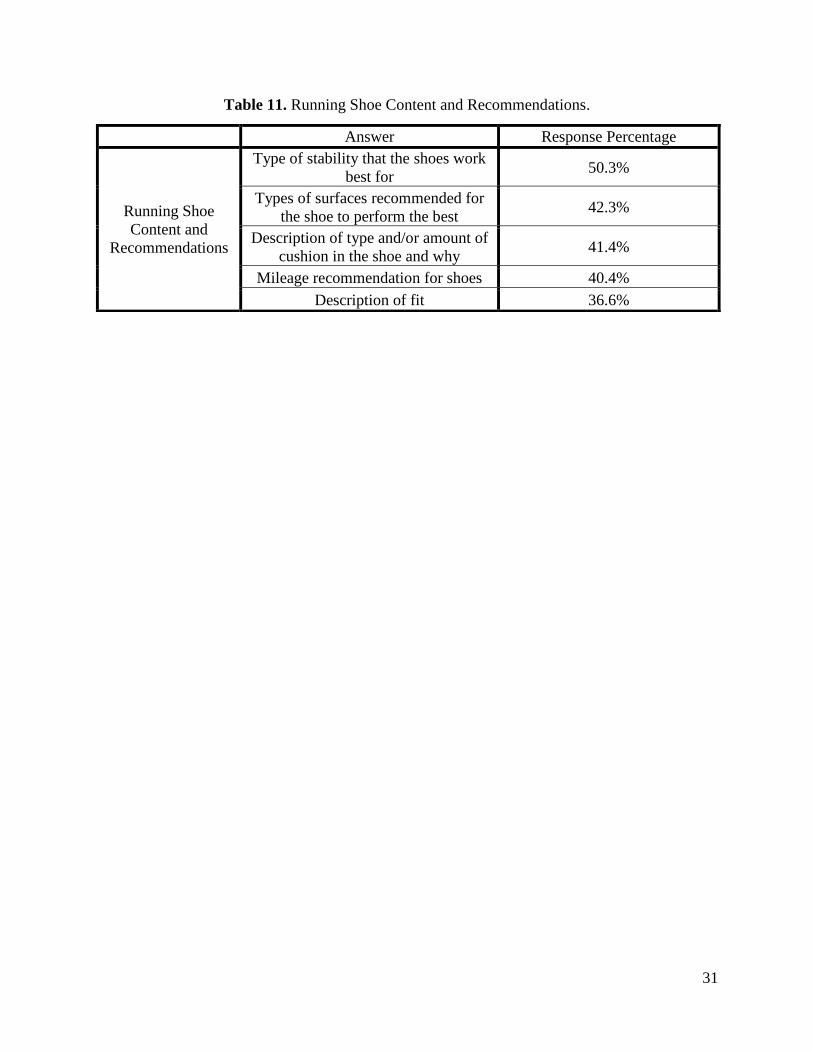
4.8. RQ6: Content and Recommendations
Runners’ expectations of content and recommendations around running shoes can differ.
To see what additional recommendations for documentation could better match the runner to the
running shoe, a final question concerning this was asked on the survey. This answers RQ6 and
can be seen in Table 11. Just over half of the respondents (50.3%) wanted to know the type of
stability that the shoes work for best. The types of surfaces recommended for the shoe to
perform the best on was chosen 42.3% of the time and the description of type and/or amount of
cushion in the shoe was selected by 41.4% of the respondents. An overall description of the fit
of the shoe was selected at 36.6%. In conclusion, the participants were most interested in the
stability of the shoe in relation to what type of running for which it was designed.
Answer Respondent Percentage
Top Causes of Running-
Related Injury
Overuse of body 65.9%
Ill-fitting shoes 18.8%
Running surface 14.1%
Overuse of shoes 11.5%
Trip and/or fall 1.6%
Top Injuries Experienced
from Running
Blisters and/or bunions 58.4%
IT band syndrome 36.9%
Shin splints 36.1%
Muscle pull, strain, and/or cramps 35.1%
Runner’s knee 30.7%
31
Table 11. Running Shoe Content and Recommendations.
Answer Response Percentage
Running Shoe
Content and
Recommendations
Type of stability that the shoes work
best for 50.3%
Types of surfaces recommended for
the shoe to perform the best 42.3%
Description of type and/or amount of
cushion in the shoe and why 41.4%
Mileage recommendation for shoes 40.4%
Description of fit 36.6%

32
CHAPTER 5: CONCULSIONS AND DISCUSSION
Running shoe comfort perception has been discussed over the past few decades, but the
relationship between comfort and running shoe factors is not well established due to the
subjectivity of the concept. This research aimed to determine if more detailed shoe market
segmentation is possible for runners. The survey of 1,472 runners determined that runners are
primarily concerned with their perceived comfort in a shoe as this factor was chosen the most
frequently. Comfort was also the top issue that participants described when a shoe did not meet
their expectations. Runners responded that they would primarily prefer to know what type of
stability a pair of running shoes would work for best in regards to content and recommendations.
Based on the most often reported responses, the typical runner from the survey is a 40
year old who wears women’s Brooks running shoes and has been running consistently for 11
years. This runner primarily runs on roads and/or paved surfaces for 11-25 miles every week.
They run at least 7 races a year, largely 5Ks. In this time frame, they use at least 2 pairs of
shoes. While the runner tends to purchase their shoes in-store, they have a habit of repeating a
previous purchase when they do not ask a salesperson for advice. Comfort is the biggest factor
in this runner’s shoe purchase decision and they spend between $101 and $120 on running shoes.
If a pair of shoes does not meet their expectations, it was due to comfort and fit. They look for
shoes aimed towards runners with a neutral gait and do not replace their shoes until the tread
looks bare and/or worn, or if they have run 300 to 399 miles in them. This runner tends to injure
themselves due to overuse of body and frequently deals with blisters and/or bunions. In regards
to running shoe content and recommendations, this runner would prefer to know what type of
stability the pair of shoes they are wanting to purchase would work for best.

33
In conclusion, more research would be recommended on the topic; and it is possible to
define comprehensive shoe market segmentation for runners. Shoe manufacturers assume the
left and right feet to be of equal size and this is not the case, as this is just one of the aspects that
differ from runner to runner. Customization of running shoes to correctly fit runners faithfully
has the prospect of being the next big running shoes innovation.
5.1. Limitations
The snowball method was used to collect data in this study. Although the snowball
method was used to widely capture a niche population in a relatively short amount of time, this
method produced non-probabilistic sampling. Given limited time and financial constraints, this
method was considered to be most appropriate. However, if time, technical resources, and the
financial situation permitted, a more probabilistic sampling method may have provided an added
comprehensive analysis to determine further market segmentation of runners.
The survey method of distributing online potentially caused some respondents to
misinterpret questions. Due to the inability to provide a reward for survey completion, the
survey also relied on runners who would participate for free. The length of the survey used in
this study could be the cause for some respondents prematurely terminating their surveys. This
analysis also assumes that all responses to the survey were complete and truthful.
5.2. Recommendations for Future Research
To ensure a higher number of completed surveys and greater participant commitment,
future research should include a shorter, more focused survey. It could also employ a larger
sample size so as to give more reliable results with greater precision and power. Future research
could replicate the study using a simple random sample from the general population.
Additionally, the data could be analyzed more extensively with a focus on inferential statistics.

34
In a future survey, more of the questions could be free response in order to facilitate detailed
responses. In-person interviews with focus groups could be enlightening as well.

35
6. REFERENCES
Arnold, J. (2015, September 28). Expensive running shoes don’t prevent injuries, but
comfortable ones might. Retrieved from https://www.scmp.com/lifestyle/health-
beauty/article/1862050/expensive-running-shoes-dont-prevent-injuries-comfortable
Bumgardner, W. (2018, October 22). Pronation, Overpronation, and Supination in Walking and
Running. Retrieved from https://www.verywellfit.com/pronation-definition-3436329
Chambon, N., Sevrez, V., Ly, Q. H., Guéguen, N., Berton, E., & Rao, G. (2014). Aging of
running shoes and its effect on mechanical and biomechanical variables: implications for
runners. Journal of Sports Science, 32(11), 1013–1022.
doi:10.1080/02640414.2014.886127
Clifton, P., Burton, M., Subic, A., Perret-Ellena, T., Bedford, A., & Schembri, A. (2011).
Identification of performance requirements for user-centered design of running shoes.
Procedia Engineering, 13, 100–106. doi:10.1016/j.proeng.2011.05.058
Douglas, S. (2014, May 12). A Brief History of the Running Shoe. Retrieved from
https://www.runnersworld.com/gear/a20787065/a-brief-history-of-the-running-shoe/
Frederick, E. C. (1984). Physiological and ergonomics factors in running shoe design. Applied
Ergonomics, 15(4), 281–287.
Gleiser, M. (2016, September 14). Is Running Good Or Bad For Your Health? Retrieved from
https://www.npr.org/sections/13.7/2016/09/14/493803246/is-running-good-or-bad-for-
your-health
LA Research Project: Running Shoes. (n.d.). The History of Running Shoes. Retrieved from
https://runningtortoiseandhare.wordpress.com/running-shoes/history-of-running-shoes/
36
Lee, D., Pate, R. R., Lavie, C. J., Sui, X., Church, T. S., & Blair, S. N. (2014). Leisure-Time
Running Reduces All-Cause and Cardiovascular Mortality Risk. Journal of the American
College of Cardiology, 64(5), 471–481. doi:10.1016/j.jacc.2014.04.058
Li, Y. (2001). The Science of Clothing Comfort. Textile Progress, 31(1-2), 1–135.
Luda, R. (2018, October 24). Running Shoes Buying Habits: Results from our Survey (plus
Infographic). Retrieved from https://www.runningshoesguru.com/content/running-shoes-
buying-habits-results-from-our-survey-plus-infographic/
Napier, C., & Willy, R. W. (2018). Logical fallacies in the running shoe debate: let the evidence
guide prescription. British Journal of Sports Medicine, 52(24), 1552–1553.
doi:10.1136/bjsports-2018-100117
Outdoor Foundation. (2018, July 17). 2018 Outdoor Participation Report. Retrieved from
https://outdoorindustry.org/resource/2018-outdoor-participation-report/
Outside Online. (2018, July 25). Why We Run. Retrieved from
https://www.outsideonline.com/2330266/why-we-run
Paul, A. (2018, January 9). The Biggest Pet Hate of Runners Revealed (And It’s Not People
Getting in Their Way). Retrieved from https://www.runningshoesguru.com/content/rsg-
survey-results/
Statista. (2018, January). Favorite running shoe brand worldwide 2017. Retrieved from
https://www.statista.com/statistics/933857/running-favorite-race-distance/
Statista. (2018, February). Market size of the athletic footwear industry in the United States from
2015 to 2017 (in billion U.S. dollars). Retrieved from
https://www.statista.com/statistics/246496/athletic-footwear-industy-revenue/

37
Statista. (2018, January). Money people spend on running shoes worldwide 2017. Retrieved from
https://www.statista.com/statistics/933841/money-spent-on-running-shoes/
Statista. (2018, January). Preferred running race distance worldwide 2017. Retrieved from
https://www.statista.com/statistics/933857/running-favorite-race-distance/
Statista. (2018, January). Runners - average miles per week worldwide 2017. Retrieved from
https://www.statista.com/statistics/933796/average-miles-runners-worldwide/
Statista. (2018, July). Most popular outdoor activities in the U.S. from 2009 to 2017. Retrieved
from https://www.statista.com/statistics/190202/number-of-participants-in-outdoor-
activities-in-the-us-2009/
Statista. (2018, July). Running & Jogging - Statistics & Facts. Retrieved from
https://www.statista.com/topics/1743/running-and-jogging/
Summers, J. J., Sargent, G. I., Levey, A. J., & Murray, K. D. (1982). Middle-aged, non-elite
marathon runners: a profile. Perceptual and Motor Skills, 54, 963–969.
Tello, M. (2017, May 24). Run for your (long) life. Retrieved from
https://www.health.harvard.edu/blog/run-long-life-2017052411722
WebMD. (n.d.). 10 Common Running Injuries: Prevention and Treatment. Retrieved from
https://www.webmd.com/fitness-exercise/guide/running-injuries-causes-prevention-
treatment#1
WebMD. (n.d.). Hip Tendonitis. Retrieved from https://www.webmd.com/fitness-
exercise/features/hip-tendonitis#1

38
7. APPENDICES

39
7.1. Appendix A

40

41

42

43

44

45

46

47

48

49

50

51

52
7.2. Appendix B: IRB Letter of Intent

53
7.3. Appendix C: IRB Protocol Approved

54
7.4. Appendix D: Survey Distribution with Race Organizers

55

56
7.5. Appendix E: Is Running Good or Bad For Your Health?

57

58

59

60

61
7.6. Appendix F: Most Popular Outdoor Activities in the U.S. from 2009 to 2017

62
7.7. Appendix G: Running & Jogging – Statistics & Facts

63
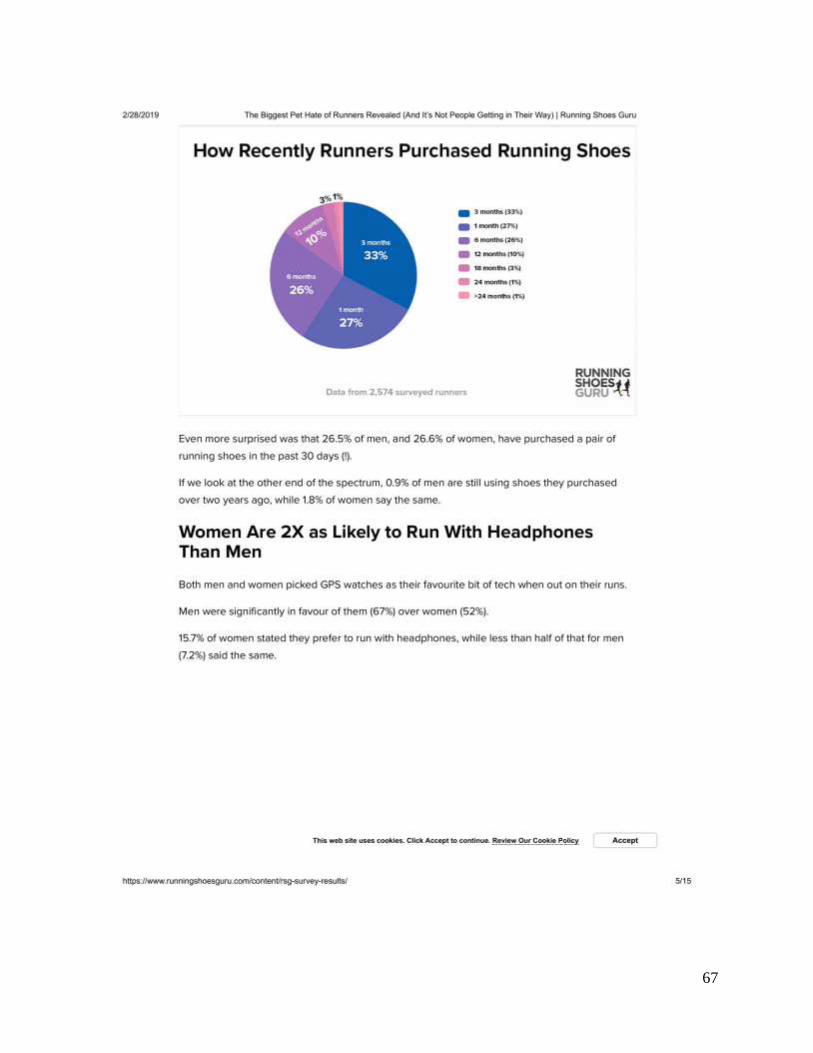
7.8. Appendix H: The Running Shoes Guru Reader Survey Results

64

65

66
67

68

69

70

71

72

73
7.9. Appendix I: Runners - Average Miles Per Week Worldwide 2017

74
7.10. Appendix J: Preferred Running Race Distance Worldwide 2017

75
7.11. Appendix K: Run for Your (Long) Life: Harvard Health

76

77
7.12. Appendix L: Why We Run

78

79

80
7.13. Appendix M: LA Research Project: Running Shoes History

81

82

83
84

85
7.14. Appendix N: A Brief History of the Running Shoe
86
7.15. Appendix O: 10 Common Running Injuries: Prevention and Treatment

87

88

89

90

91

92

93
94
7.16. Appendix P: Hip Tendonitis

95

96

97

98

99

100

101

102

103

104
7.17. Appendix Q: Market Size of the Athletic Footwear Industry in the United States from
2015 to 2017 (in billions U.S. dollars)

105
7.18. Appendix R: Running Shoe Buying Habits

106

107

108

109

110

111

112
7.19. Appendix S: Money People Spend on Running Shoes Worldwide 2017
113
7.20. Appendix T: Expensive Running Shoes Don't Prevent Injuries, But Comfortable Ones
Might
114

115
116

117
118
7.21. Appendix U: Pronation, Overpronation, and Supination in Walking and Running

119

120

121

122
7.22. Appendix V: Compiled Survey Results
Q1: Do you consent to participate in this study?
Q8: Do you give this minor permission to participate in this study?

123
Q4: What type of running shoes do you wear?
Combined Data from Q5 and Q38

124
Q10: What do you run on the most?
Q11: What is your average weekly running mileage?

125
Q13: What is your usual race distance?
Q25: On average, how many organized races do you run each year?
126
Q14: On average, how many pairs of running shoes do you use each year?
Q15: Which running shoe brand(s) have you used in the past year?

127
Q26: From the running shoe brands you’ve used, what is your favorite?
Q32: What resources have you consulted before deciding on a pair of running shoes?

128
Q16: What are the top 5 factors you consider when buying running shoes?

129
Q36: Of your top 5 choices, which factor is the most important to you?

130
Q17: Where do you buy your running shoes from?
Q21: On average, how much do you spend on a pair of running shoes?

131
Q35: Have you ever run in a pair of shoes that did not meet your expectations?
37: What expectations were not met?

132
Q22: When do you decide to replace your running shoes?
Q23: How many miles (on average) do you run in your shoes before replacing them?

133
Q24: What do you use your running shoes for?
Q27: What type of gait pattern do you have when you run?

134
Q34: Does your gait pattern affect what type of running shoe you choose to purchase?
Q29: If you’ve had a running-related injury, what was it caused by?

135
Q30: What injuries have you experienced from running?
Q41: What form of recommendation/content for running shoes would you like to see?