Introducing Undergraduate Electrical Engineering Students to Chaotic Dynamics: Computer Simulations...
22
Introducing Undergraduate Electrical Engineering Students to Chaotic Dynamics: Computer Simulations with Logistic Map and Buck Converter Sajid Iqbal Ph.D student Harbin Institute of Technology
Transcript of Introducing Undergraduate Electrical Engineering Students to Chaotic Dynamics: Computer Simulations...
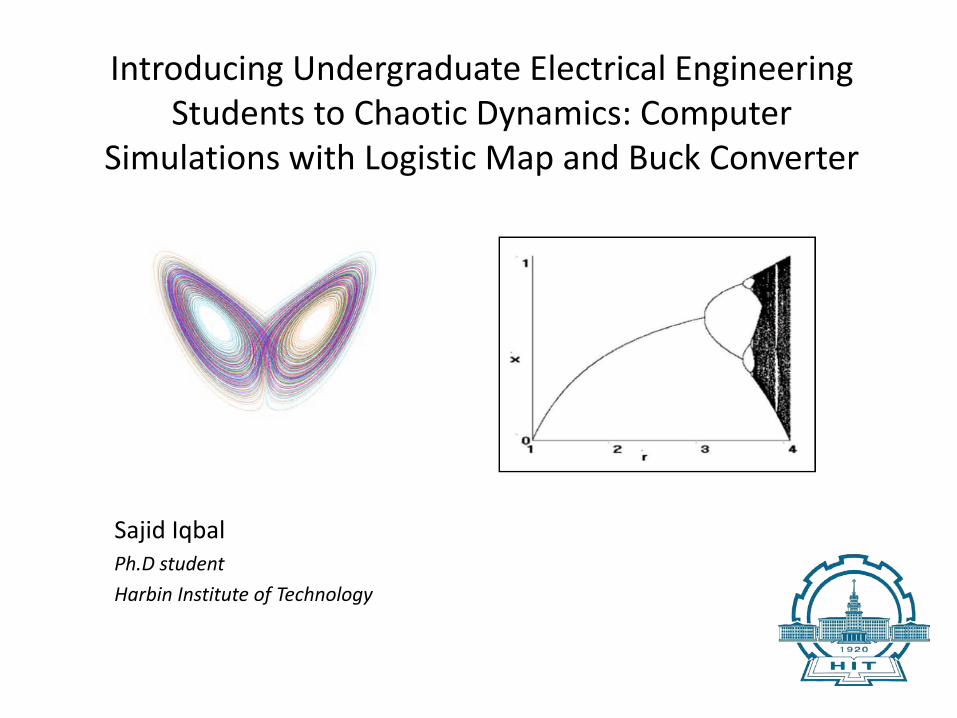
Introducing Undergraduate Electrical Engineering Students to Chaotic Dynamics: Computer
Simulations with Logistic Map and Buck Converter
Sajid IqbalPh.D studentHarbin Institute of Technology


Contents
• Determinism• Nonlinear Dynamics: bifurcations and chaos• Introducing nonlinear dynamics in Undergraduate
Electrical Engineering• Simulation results Logistic map DC-DC buck converter
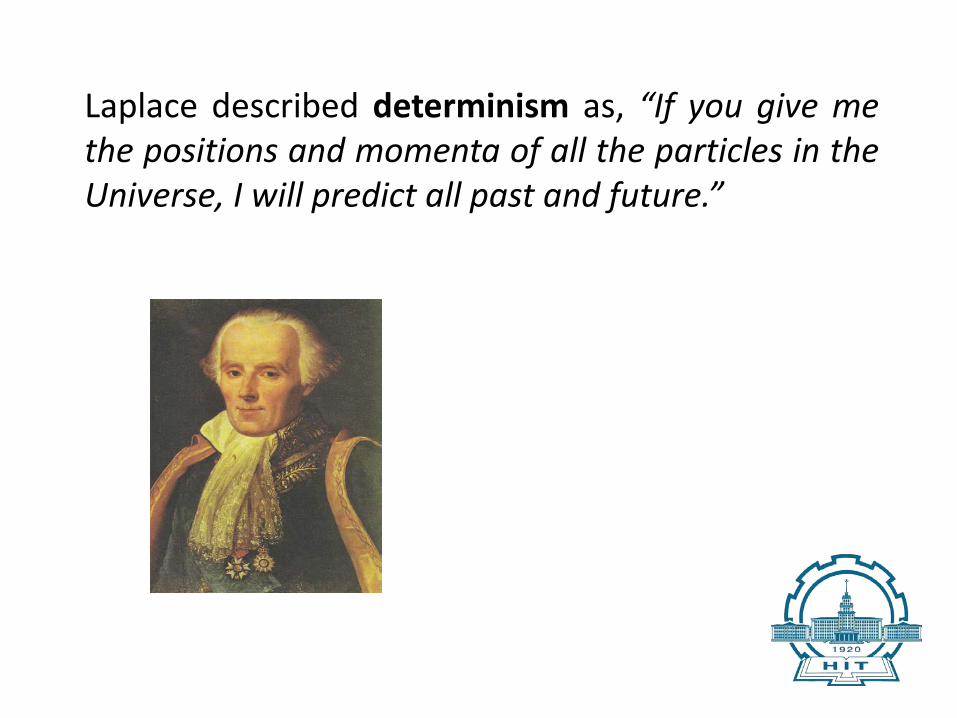
Laplace described determinism as, “If you give methe positions and momenta of all the particles in theUniverse, I will predict all past and future.”
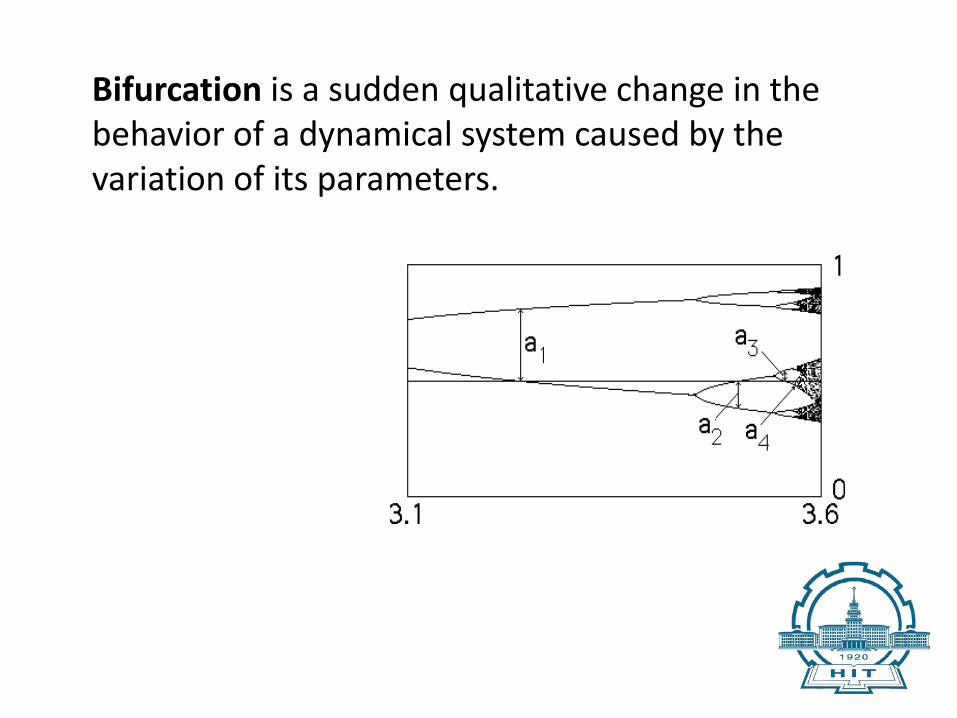
Bifurcation is a sudden qualitative change in the behavior of a dynamical system caused by the variation of its parameters.

“We collectively wish to apologize for havingmisled the general educated public by spreadingideas about the determinism of systems satisfyingNewtons’ laws of motion that, after 1960, wereproved to be incorrect.”
Sir James Lighthill collectiveapology on behalf of allscientists
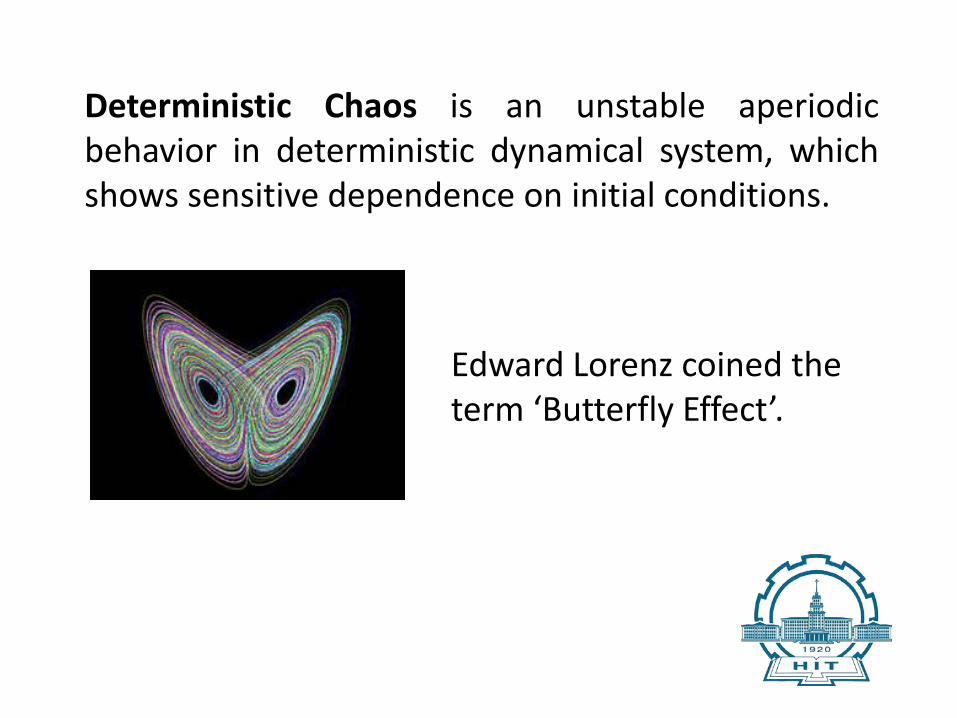
Deterministic Chaos is an unstable aperiodicbehavior in deterministic dynamical system, whichshows sensitive dependence on initial conditions.
Edward Lorenz coined the term ‘Butterfly Effect’.
The advent of chaos theory shattered and obscuredthe well-regarded Newtonian vision.
The consequence of chaos is that complexbehavior need not have complex causes.
The logistic map also known as the “Verhulst model” is given as
Xn +1 = k * Xn (1-Xn) 0 < k < 4
Where parameter ‘k’ represents the population growth rate and ‘Xn’ is the variable at the nth iteration.
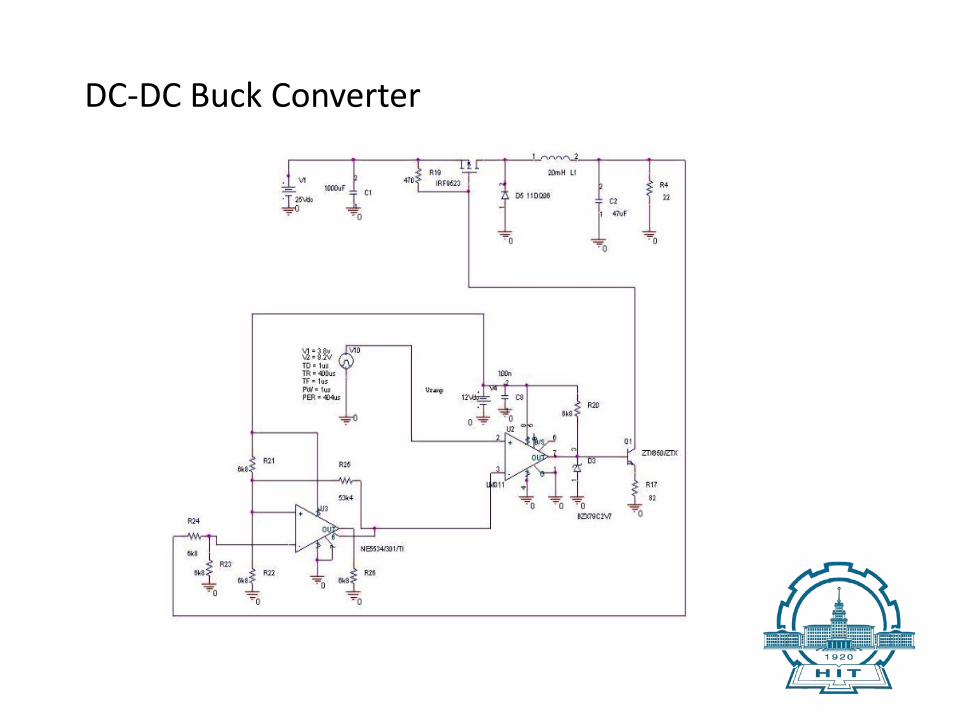
DC-DC Buck Converter
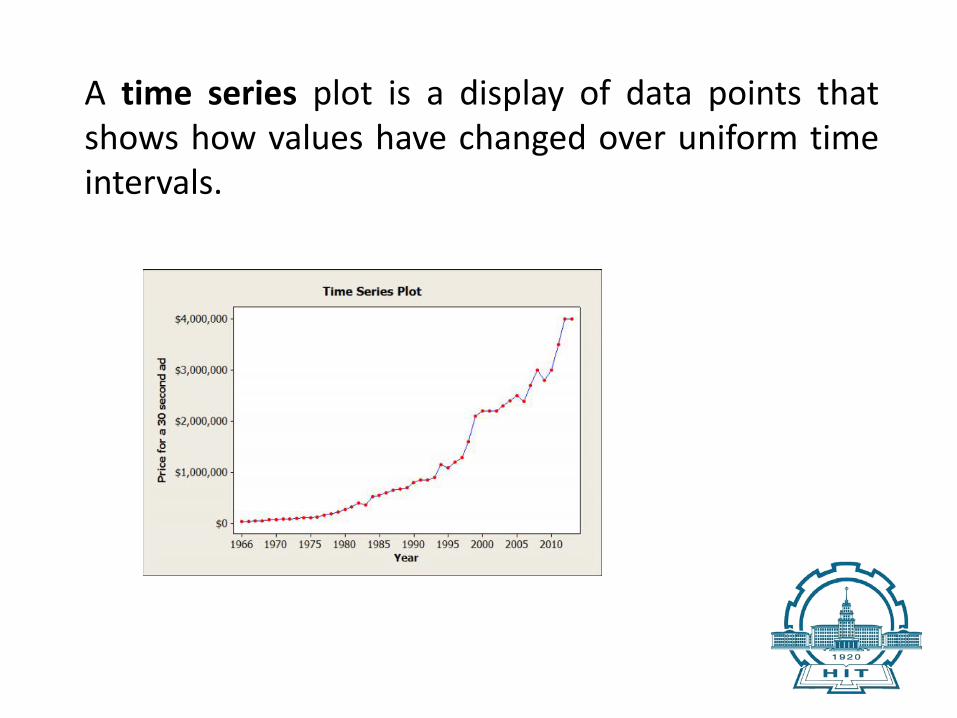
A time series plot is a display of data points thatshows how values have changed over uniform timeintervals.
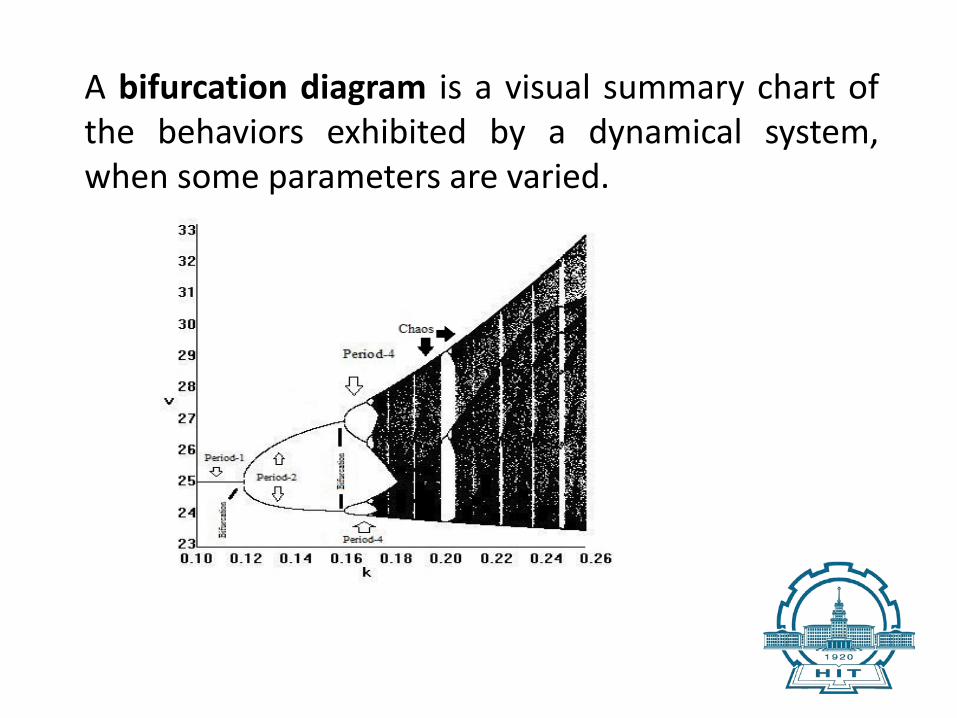
A bifurcation diagram is a visual summary chart ofthe behaviors exhibited by a dynamical system,when some parameters are varied.
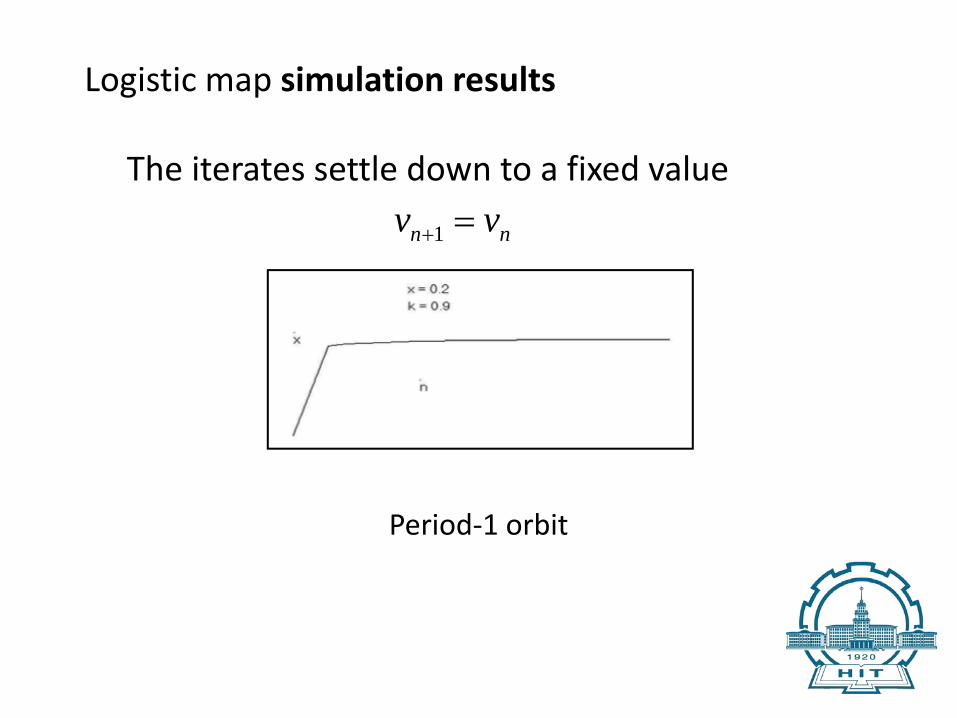
Logistic map simulation results
The iterates settle down to a fixed value
Period-1 orbit
1n nv v+ =
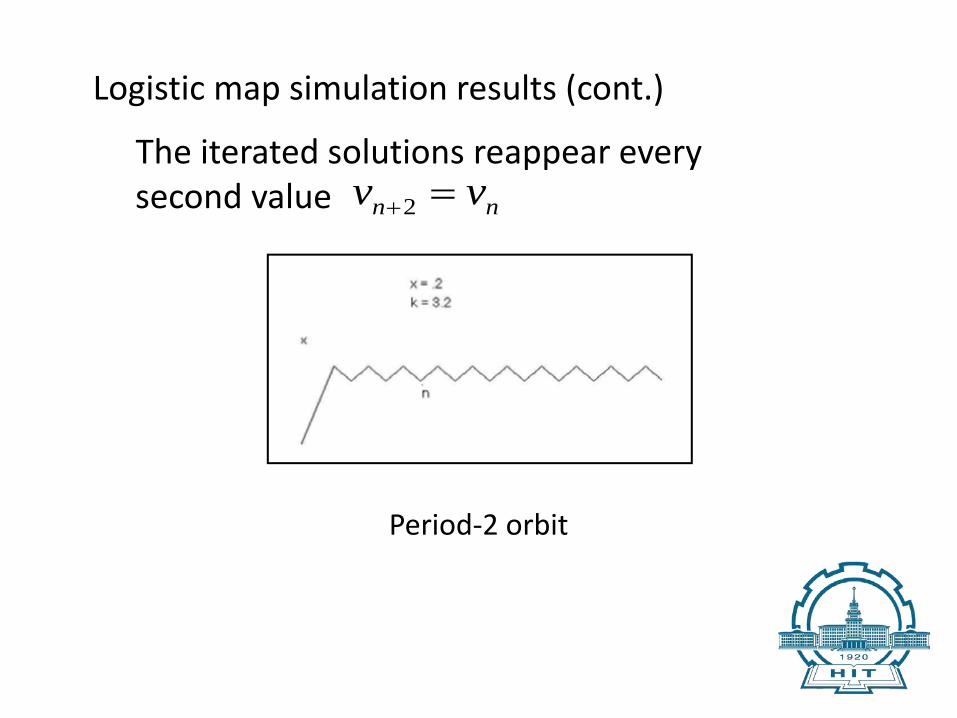
Logistic map simulation results (cont.)
The iterated solutions reappear everysecond value
Period-2 orbit
2n nv v+ =
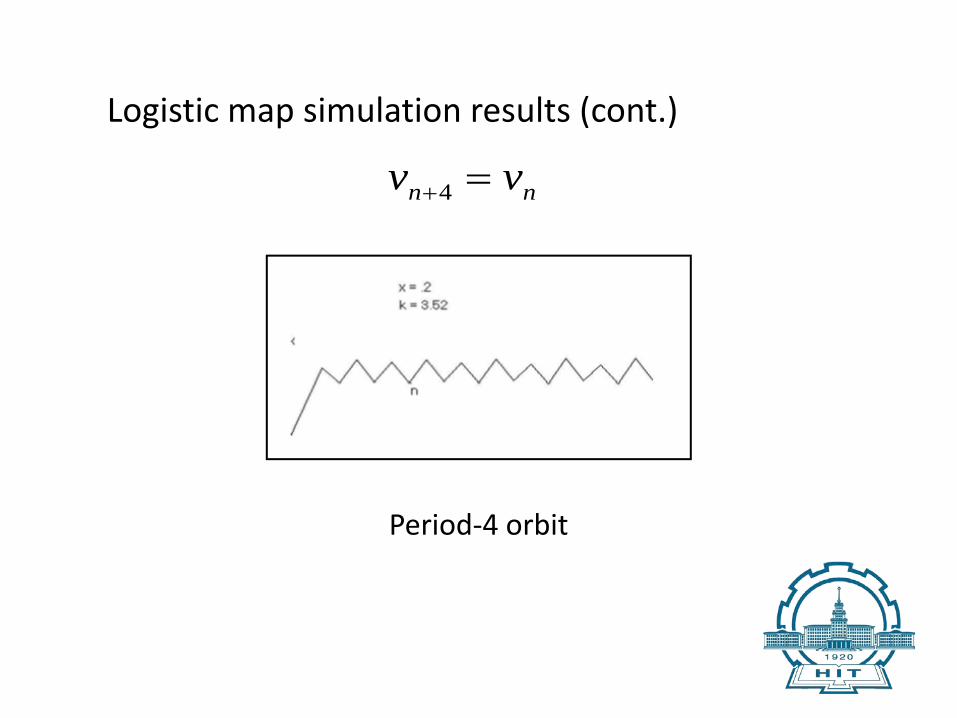
Period-4 orbit
4n nv v+ =
Logistic map simulation results (cont.)
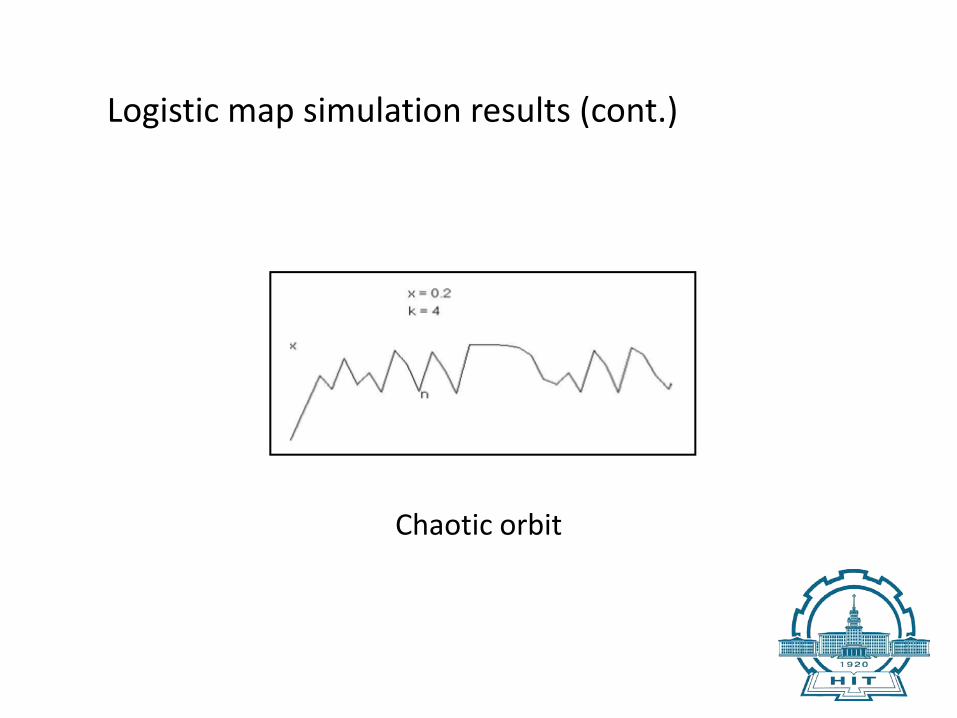
Chaotic orbit
Logistic map simulation results (cont.)
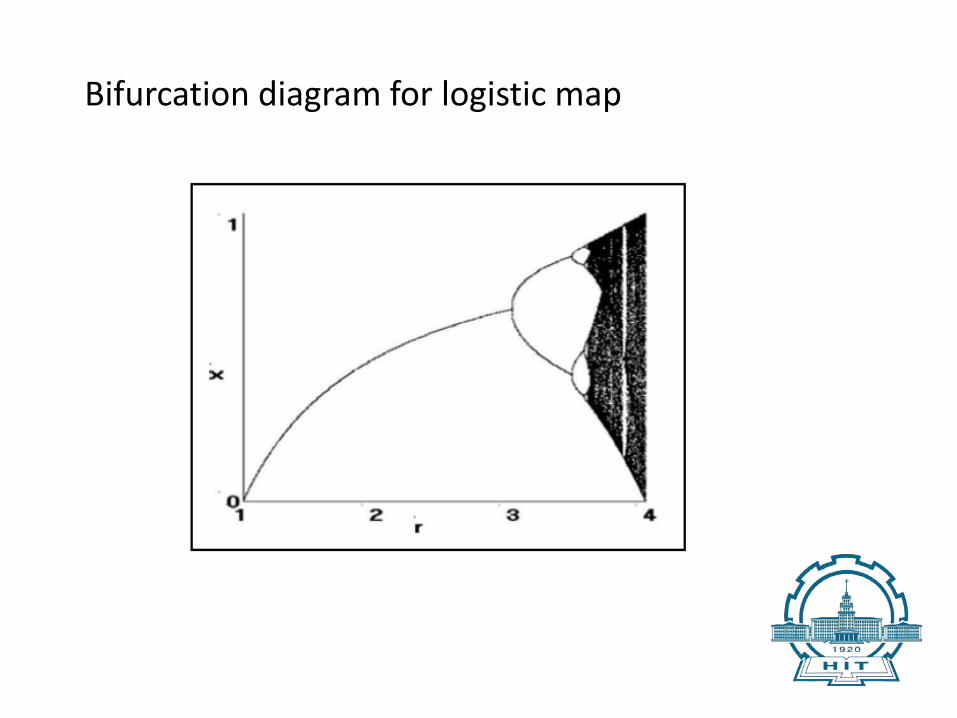
Bifurcation diagram for logistic map

Buck converter simulation results
Period-1 output waveform and attractor

Buck converter simulation results (cont.)
Period-2 output waveformand
Period-2 attractor
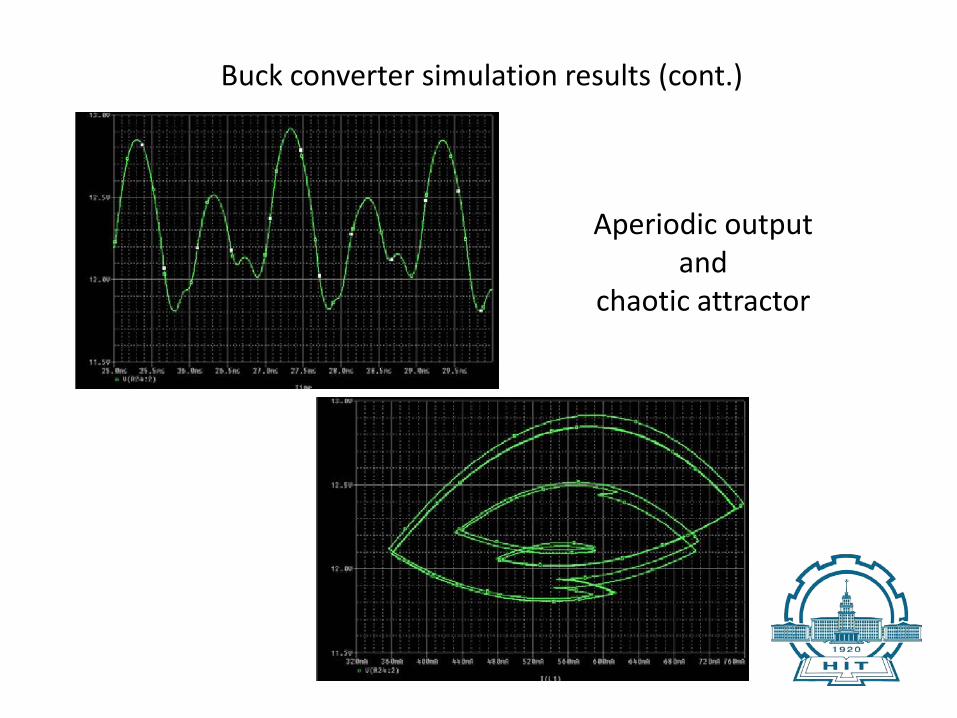
Buck converter simulation results (cont.)
Aperiodic outputand
chaotic attractor
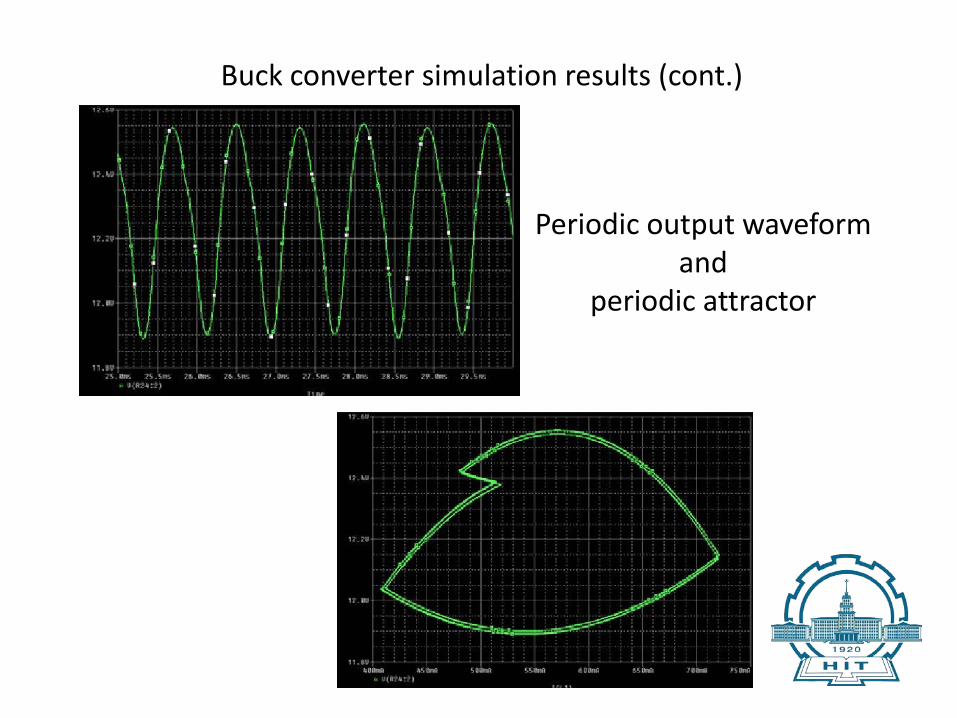
Buck converter simulation results (cont.)
Periodic output waveformand
periodic attractor
Such dynamical systems are excellent vehicles for explaining concepts of chaotic dynamics.
They provide an easy-to-understand idea of this novel and productive way of thinking.
Don't curse the darkness,light a candle.