INTERNET 2016 Proceedings - ThinkMind
63
INTERNET 2016 The Eighth International Conference on Evolving Internet ISBN: 978-1-61208-516-6 November 13 - 17, 2016 Barcelona, Spain INTERNET 2016 Editors Eugen Borcoci, University “Politehnica” Bucharest, Romania Dirceu Cavendish, Kyushu Institute of Technology, Japan 1 / 63
-
Upload
khangminh22 -
Category
Documents
-
view
0 -
download
0
Transcript of INTERNET 2016 Proceedings - ThinkMind

INTERNET 2016
The Eighth International Conference on Evolving Internet
ISBN: 978-1-61208-516-6
November 13 - 17, 2016
Barcelona, Spain
INTERNET 2016 Editors
Eugen Borcoci, University “Politehnica” Bucharest, Romania
Dirceu Cavendish, Kyushu Institute of Technology, Japan
1 / 63

INTERNET 2016
Foreword
The Eighth International Conference on Evolving Internet (INTERNET 2016), heldbetween November 13-17, 2016 - Barcelona, Spain, dealt with challenges raised by evolvingInternet making use of the progress in different advanced mechanisms and theoreticalfoundations. The gap analysis aimed at mechanisms and features concerning the Internet itself,as well as special applications for software defined radio networks, wireless networks, sensornetworks, or Internet data streaming and mining.
Originally designed in the spirit of interchange between scientists, the Internet reacheda status where large-scale technical limitations impose rethinking its fundamentals. This refersto design aspects (flexibility, scalability, etc.), technical aspects (networking, routing, traffic,address limitation, etc), as well as economics (new business models, cost sharing, ownership,etc.). Evolving Internet poses architectural, design, and deployment challenges in terms ofperformance prediction, monitoring and control, admission control, extendibility, stability,resilience, delay-tolerance, and interworking with the existing infrastructures or withspecialized networks.
We take here the opportunity to warmly thank all the members of the INTERNET 2016Technical Program Committee, as well as the numerous reviewers. The creation of such a highquality conference program would not have been possible without their involvement. We alsokindly thank all the authors who dedicated much of their time and efforts to contribute toINTERNET 2016. We truly believe that, thanks to all these efforts, the final conference programconsisted of top quality contributions.
Also, this event could not have been a reality without the support of many individuals,organizations, and sponsors. We are grateful to the members of the INTERNET 2016 organizingcommittee for their help in handling the logistics and for their work to make this professionalmeeting a success.
We hope that INTERNET 2016 was a successful international forum for the exchange ofideas and results between academia and industry and for the promotion of progress in the fieldof the evolving internet.
We are convinced that the participants found the event useful and communications veryopen. We also hope the attendees enjoyed the charm of Barcelona, Spain.
INTERNET 2016 Chairs:
INTERNET Advisory Committee
Eugen Borcoci, University “Politehnica” Bucharest, RomaniaAbdulrahman Yarali, Murray State University, USAVladimir Zaborovsky, Technical University - Saint-Petersburg, RussiaDirceu Cavendish, Kyushu Institute of Technology, JapanDanny Krizanc, Wesleyan University-Middletown, USA
2 / 63

Natalija Vlajic, York University - Toronto, CanadaKrzysztof Walkowiak, Wroclaw University of Technology, PolandJunzo Watada, Waseda University - Fukuoka, JapanRobert van der Mei, Centrum Wiskunde & Informatica, The Netherlands
INTERNET Industrial/Research Chairs
Jerome Galtier, Orange Labs, France
3 / 63

INTERNET 2016
Committee
INTERNET Advisory Committee
Eugen Borcoci, University “Politehnica” Bucharest, RomaniaAbdulrahman Yarali, Murray State University, USAVladimir Zaborovsky, Technical University - Saint-Petersburg, RussiaDirceu Cavendish, Kyushu Institute of Technology, JapanDanny Krizanc, Wesleyan University-Middletown, USANatalija Vlajic, York University - Toronto, CanadaKrzysztof Walkowiak, Wroclaw University of Technology, PolandJunzo Watada, Waseda University - Fukuoka, JapanRobert van der Mei, Centrum Wiskunde & Informatica, The Netherlands
INTERNET Industrial/Research Chairs
Jerome Galtier, Orange Labs, France
INTERNET 2016 Technical Program Committee
Jemal Abawajy, Deakin University - Victoria, AustraliaCristina Alcaraz, University of Malaga, SpainOnur Alparslan, Osaka University, JapanMercedes Amor, University of Malaga, SpainDemetris Antoniades, University of Cyprus, CyprusOlivier Audouin, Alcatel-Lucent Bell Labs, FranceLiz Bacon, University of Greenwich, UKJacques Bahi, University of Franche-Comté, FranceMichael Bahr, Siemens AG, GermanyAndrzej Beben, Warsaw University of Technology, PolandNik Bessis, Edge Hill University, UKMaumita Bhattacharya, Charles Sturt University - Albury, AustraliaKashif Bilal, COMSATS Institute of Information Technology, PakistanBruno Bogaz Zarpelão, State University of Londrina (UEL), BrazilEugen Borcoci, University “Politehnica” Bucharest, RomaniaFernando Boronat Seguí, Universidad Politécnica De Valencia, SpainDamian Bulira, Wroclaw University of Technology, PolandWojciech Burakowski, Warsaw University of Technology, PolandChristian Callegari, University of Pisa, ItalyMaya Carrillo Ruiz, Benemérita Universidad Autónoma de Puebla (BUAP), MexicoDirceu Cavendish, Kyushu Institute of Technology, JapanAntonio Celesti, University of Messina, ItalyYue-Shan Chang, National Taipei University, Taiwan
4 / 63

Hao Che, University of Texas at Arlington, USAHsing-Chung Chen, Asia University, TaiwanShiping Chen, Sybase Inc., USATzung-Shi Chen, National University of Tainan, TaiwanWeifeng Chen, California University of Pennsylvania, USAYaw-Chung Chen, National Chiao Tung University, TaiwanAlbert M. K. Cheng, Member, University of Houston, USAHongmei Chi, Florida A&M University, USABeen-Chian Chien, National University of Tainan, TaiwanAndrzej Chydzinski, Silesian University of Technology - Gliwice, PolandDaniel Corujo, Instituto de Telecomunicações, Aveiro, PortugalJosé Alfredo F. Costa, Federal University, UFRN, BrazilHenry Hong-Ning Dai, Macau University of Science and Technology, ChinaGuillermo Diaz-Delgado, Universidad Autónoma de Querétaro (UAQ) / Queretaro State University(UAQ), MexicoIoanna Dionysiou, University of Nicosia, CyprusYingfei Dong, University of Hawaii, USACharalampos Doukas, CREATE-NET, Trento, ItalyZongming Fei, University of Kentucky, USAGiancarlo Fortino, University of Calabria - Rende, ItalySteffen Fries, Siemens AG, GermanySong Fu, University of North Texas - Denton, USAMarco Furini, Universita' di Modena e Reggio Emilia, ItalyJerome Galtier, Orange Labs, FranceFilippo Gandino, Politecnico di Torino, ItalyBezalel Gavish, Southern Methodist University - Dallas, USAS.K. Ghosh, Indian Institute of Technology - Kharagpur, IndiaVictor Govindaswamy, Concordia University - Chicago, USAAnnie Gravey, Technopôle Brest Iroise, FranceAlexandre Guitton, Université Blaise Pascal, FranceJavier Gutierrez, University of Seville, SpainFrederic Guyard, Orange Labs, France, FranceJing (Selena) He, Kennesaw State University, USAFrans Henskens, University of Newcastle, AustraliaChing-Hsien Hsu, Chung Hua University, TaiwanWladyslaw Homenda, Warsaw University of Technology, PolandPao-Ann Hsiung, National Chung Cheng University, TaiwanChing-Hsien Hsu, Chung Hua University, TaiwanFu-Hau Hsu, National Central University, TaiwanYongjian Hu, University of Warwick, UKChung-Ming Huang, National Cheng Kung University, TaiwanYo-Ping Huang, National Taipei University of Technology - Taipei, TaiwanMarc Jansen, University of Applied Sciences Ruhr West, GermanyIvan Jelinek, Czech Technical University in Prague, Czech RepublicTerje Jensen, Telenor Corporate Development - Fornebu / Norwegian University of Science andTechnology - Trondheim, NorwaySeil Jeon, Instituto de Telecomunicacoes, PortugalYoung-Sik Jeong, Dongguk University Seoul, Korea
5 / 63

Hanmin Jung, Korea Institute of Science and Technology Information (KISTI), South KoreaEpaminondas Kapetanios, The University of Westminster, UKDeepak Kataria, IPJunction Inc, USASokratis K. Katsikas, University of Piraeus, GreeceMuhammad Khurram Khan, King Saud University, Saudi ArabiaDonghyun (David) Kim, North Carolina Central University, USAWojciech Kmiecik, Wroclaw University of Technology, PolandRen-Song Ko, National Chung Cheng University, TaiwanIgor Kotenko, SPIIRAS, RussiaVitomir Kovanovic, Simon Fraser University - Surrey, CanadaConstantine Kotropoulos, Aristotle University of Thessaloniki, GreeceDanny Krizanc, Wesleyan University-Middletown, USAMichal Kucharzak, Wroclaw University of Technology, PolandLatif Ladid, University of Luxembourg, LuxembourgKP Lam, University of Keele, UKMariano Lamarca i Lorente, Barcelona City Council, SpainMikel Larrea, University of the Basque Country UPV/EHU, SpainGyu Myoung Lee, Liverpool John Moores University, UKClement Leung, Hong Kong Baptist University, Hong KongJuan Li, North Dakota State University, USAFidel Liberal Malaina, University of the Basque Country, Spain
Xingcheng Liu (刘星成), Sun Yat-sen University - Guangzhou, ChinaJaime Lloret Mauri, Polytechnic University of Valencia, SpainSeng Loke, La Trobe University, AustraliaIsaí Michel Lombera, University of California - Santa Barbara, USAJuan M. Lopez-Soler, University of Granada, SpainRadu Lupu, University Politehnica of Bucharest, RomaniaOlaf Manuel Maennel, Tallinn University of Technology, EstoniaDamien Magoni, University of Bordeaux - Talence, FranceZoubir Mammeri, IRIT - Université Paul Sabatier, FranceGregorio Martinez, University of Murcia, SpainAlbena Mihovska, Aalborg University, DenmarkSangman Moh, Chosun University - Gwangju, South KoreaAugusto Morales Dominguez, Check Point Software Technologies, MexicoPaul Mueller, University Kaiserslautern, GermanyEthiopia Nigussie, University of Turku, FinlandRonit Nossenson, Akamai Technologies, USASamuel Nowakovski, LORIA, FranceMasaya Okada, Shizuoka University, JapanLuis M. Oliveira, Instituto de Telecomunicações, PortugalPasquale Pace, University of Calabria, ItalyJanne Parkkila, Lappeenranta University of Technology, FinlandLuigi Patrono, University of Salento, ItalyIlia Petrov, Reutlingen University, GermanyAngel P. del Pobil, Jaume I University, SpainChenxi Qiu, Pennsylvania State University, USADanda B. Rawat, Georgia Southern University, USAMarek Reformat, University of Alberta - Edmonton, Canada
6 / 63

Domenico Rotondi, FINCONS SpA, ItalyAbdel-Badeeh M. Salem, Ain Shams University Abbasia - Cairo, EgyptPaul Sant, University of Bedfordshire, UKJosé Santa, University Centre of Defence at the Spanish Air Force Academy, SpainPeter Schartner, University of Klagenfurt, AustriaBruno Sericola, INRIA, FranceKuei-Ping Shih, Tamkang University, TaiwanRoman Y. Shtykh, CyberAgent, Inc., JapanDimitrios Serpanosm ISI/R.C. Athena & University of Patras, GreeceYang Song, IBM Research, USAPedro Sousa, University of Minho, PortugalNeuman Souza, Federal University of Ceara, BrazilGünther Specht, Universität Innsbruck - Institut für Informatik, AustriaÁlvaro Suárez Sarmiento, Universidad de Las Palmas de Gran Canaria, SpainMaciej Szostak, Wroclaw University of Technology, PolandYuzo Taenaka, University of Tokyo, JapanSabu M. Thampi, Indian Institute of Information Technology and Management - Kerala (IIITM-K), IndiaRuppa K. Thulasiram, University of Manitoba - Winnipeg, CanadaParimala Thulasiraman, University of Manitoba - Winnipeg, CanadaMinoru Uehara, Toyo University, JapanHerwig Unger, FernUniversitaet in Hagen, GermanyRobert van der Mei, Centrum Wiskunde & Informatica, The NetherlandRob van Kranenburg, University of Liepaja, LatviaMassimo Villari, University of Messina, ItalyNatalija Vlajic, York University - Toronto, CanadaKrzysztof Walkowiak, Wroclaw University of Technology, PolandJunzo Watada, Waseda University - Fukuoka, JapanSabine Wittevrongel, Ghent University, BelgiumKui Wu, University of Victoria, CanadaMudasser F. Wyne, National University - San Diego, USABin Xie, InfoBeyond Technology LLC - Louisville, USAChao-Tung Yang, Tunghai University, TaiwanZhenglu Yang, The University of Tokyo, JapanKun-Ming Yu, Chung Hua University, TaiwanChuan Yue, University of Colorado - Colorado Springs, USAHabib Zaidi, Geneva University Hospital, SwitzerlandJie Zeng, Tsinghua University, ChinaZhao Zhang, Iowa State University, USAFen Zhou, CERI-LIA | University of Avignon, FranceWeiying Zhu, Metropolitan State University of Denver, USACliff C. Zou, University of Central Florida - Orlando, USA
7 / 63

Copyright Information
For your reference, this is the text governing the copyright release for material published by IARIA.
The copyright release is a transfer of publication rights, which allows IARIA and its partners to drive the
dissemination of the published material. This allows IARIA to give articles increased visibility via
distribution, inclusion in libraries, and arrangements for submission to indexes.
I, the undersigned, declare that the article is original, and that I represent the authors of this article in
the copyright release matters. If this work has been done as work-for-hire, I have obtained all necessary
clearances to execute a copyright release. I hereby irrevocably transfer exclusive copyright for this
material to IARIA. I give IARIA permission or reproduce the work in any media format such as, but not
limited to, print, digital, or electronic. I give IARIA permission to distribute the materials without
restriction to any institutions or individuals. I give IARIA permission to submit the work for inclusion in
article repositories as IARIA sees fit.
I, the undersigned, declare that to the best of my knowledge, the article is does not contain libelous or
otherwise unlawful contents or invading the right of privacy or infringing on a proprietary right.
Following the copyright release, any circulated version of the article must bear the copyright notice and
any header and footer information that IARIA applies to the published article.
IARIA grants royalty-free permission to the authors to disseminate the work, under the above
provisions, for any academic, commercial, or industrial use. IARIA grants royalty-free permission to any
individuals or institutions to make the article available electronically, online, or in print.
IARIA acknowledges that rights to any algorithm, process, procedure, apparatus, or articles of
manufacture remain with the authors and their employers.
I, the undersigned, understand that IARIA will not be liable, in contract, tort (including, without
limitation, negligence), pre-contract or other representations (other than fraudulent
misrepresentations) or otherwise in connection with the publication of my work.
Exception to the above is made for work-for-hire performed while employed by the government. In that
case, copyright to the material remains with the said government. The rightful owners (authors and
government entity) grant unlimited and unrestricted permission to IARIA, IARIA's contractors, and
IARIA's partners to further distribute the work.
8 / 63

Table of Contents
Protection of Personal Information in South Africa: A Framework for Biometric Data Collection SecurityPhiwa Mzila
1
Stepping Stone Detection under Timing Perturbations through the Uniform Distributed Random DelayKoohong Kang, Jungtae Kim, and Ikkyun Kim
7
On the Feasibility of Remote Attestation for IoT DevicesYong-Hyuk Moon, Jeong-Nyeo Kim, and Yong-Sung Jeon
12
Static Detection of Malware and Benign Executable Using Machine Learning AlgorithmDong-Hee Kim, Sang-Uk Woo, Dong-Kyu Lee, and Tai-Myoung Chung
14
Practical Approaches to the DRDoS Attack Detection based on Netflow AnalysisJungtae Kim, Ik-Kyun Kim, and Koohong Kang
20
HTTP Get Flooding Detection Technique Based on Netflow InformationYoungsoo Kim, Jungtae Kim, Ikkyun Kim, and Koohong Kang
25
Detection of Tweets Where Birthdays are Revealed to Other PeopleYasuhiko Watanabe, Naohiro Miyagi, Kenji Yasuda, Ryo Nishimura, and Yoshihiro Okada
29
Study on Enhancement of Emulator to Incapacitate Analysis Evasion by Android Malicious AppsMijoo Kim, Woong Go, Tae Jin Lee, and Heung Youl Youm
35
Wireless Sensor Network for Monitoring Water FactorySeung-Jun Lee, Young Jin Kwon, and Do Hyun Kim
39
Performance Characterization of Streaming Video over Multipath TCPRyota Matsufuji, Dirceu Cavendish, Kazumi Kumazoe, Daiki Nobayashi, Takeshi Ikenaga, and Yuji Oie
41
Optimization of Multi-server Video Content Streaming in 5G EnvironmentEugen Borcoci, Tudor Ambarus, Joachim Bruneau-Queyreix, Daniel Negru, and Jordi Mongay Batalla
47
Powered by TCPDF (www.tcpdf.org)
1 / 1 9 / 63
Protection of Personal Information in South Africa: A Framework for Biometric
Data Collection Security
Phiwa Mzila
Modeling and Digital Sciences, Information Security
CSIR
Pretoria, South Africa
e-mail: [email protected]
Abstract—The use of biometric technology as a means to
improve national security and reduce fraud has been adopted
by many countries including South Africa. This technology
involves the collection of biometric data which is attributed as
part of one’s personal information. Like many other countries,
South Africa, in 2013 officially approved and enacted the
Protection of Personal Information (POPI) Act, which gives
guidelines that should be followed when processing personal
information. The Act regards biometric data in the same way
as any other personal data. As such the processing of biometric
data is regulated in the personal information protection act of
the country. The responsible party for the collection of
personal information needs to implement strict and
appropriate measures to protect personal data against
unauthorised access. In areas where biometric systems are
implemented, biometric data cannot be collected without the
knowledge of the concerned person. Designers of biometric
systems must engage with appropriate biometric security
experts to ensure that security vulnerabilities are
appropriately tackled, especially if existing systems are
migrated to the internet. This is particularly important
because once a biometric data is compromised; it cannot be
replaced like passwords and tokens. In this paper we proposed
a framework for biometric data collection security using South
Africa as our case study. The framework aims to bridge the
gap between the collectors of biometric data, biometric
security experts and the law enforcement agency for
compliance with the POPI Act.
Keywords - privacy; personal information; security;
compliance; biometric data; protection scheme.
I. INTRODUCTION
The adoption and use of biometric systems world-wide has gained massive momentum. Biometric systems are mostly used for authentication, which comprises of verification and identification. Verification involves the presenting of an actual biometric image and in order to assert whether or not it belongs to a specified person. This process is referred to as a “one-to-one” search, whereas identification involves the presenting of an actual biometric image and then asking the system to search for a match from a database. This process is referred to a “one-to-many” search [1]. As prominent as they are, biometric systems also create a lot of anxiety as far as privacy and security are concerned. Such privacy and security risks come in the form of attacks on
databases storing biometric data [2]. When biometric data is compromised, the identity of the person is exposed, and it can then be used for any malicious activities [3]. This behavior can lead to the violation of some policies that are put in place by the authorities of the country, such as in the POPI Act in South Africa.
Biometric data may be collected and used for various purposes. For example, in South Africa, the collection of biometric data at major border gates is aimed at securing the movement of people in and out of the country [3]. Furthermore, this is done to accurately identify people and determine whether they pose a risk to South Africa. By using biometrics, South Africa’s immigration prevents the use of fraudulent documents, protects visitors from identify theft and stops criminals and immigration violators from entering the country. In other cases, biometric data is collected from places such as residential complexes, learning institutions, work places for control of access to high security and restricted areas and governmental organs such as police departments and home affairs. In the process of biometric data collection, written policy and clear guidelines should be developed to ensure proper use of the biometric data collected. This should include among others, awareness, protection mechanism, and penalties for failure to comply.
In South Africa, there is the POPI act, biometric data subjects, responsible parties (data collectors), biometric experts from research and development (R&D) institutions such as CSIR, universities and Centres for Excellence, but there is still no proper framework that integrates all these entities together in ensuring a harmonized protection of biometric data that is being collected by different organizations for different purposes.
Throughout this research work, biometric technologies that improve national security capabilities in access control, identity verification, and online transaction security in a manner that is compliant with the South African POPI act, are analysed. To achieve this objective, relevant South African departments responsible for national security, border control and security, and the law enforcement and financial institutions, are studied. In this paper, we propose a framework for biometric data security in South Africa that incorporates the POPI Act and biometric template protection schemes.
1Copyright (c) IARIA, 2016. ISBN: 978-1-61208-516-6
INTERNET 2016 : The Eighth International Conference on Evolving Internet
10 / 63
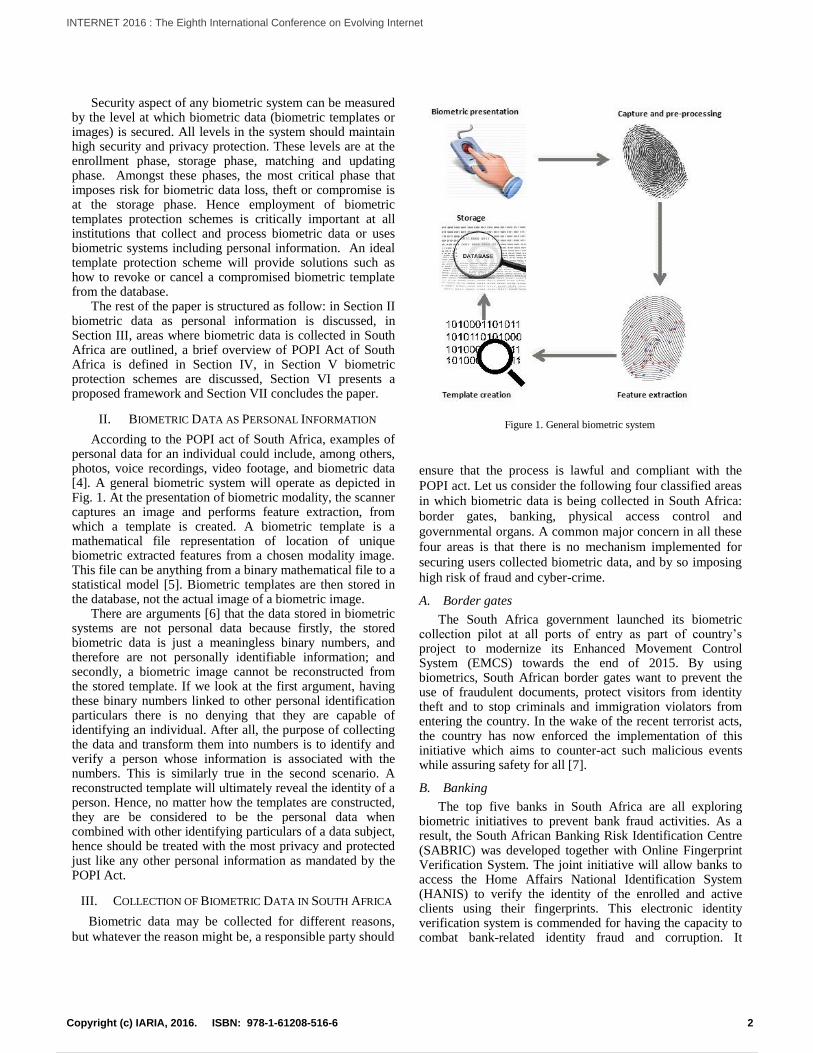
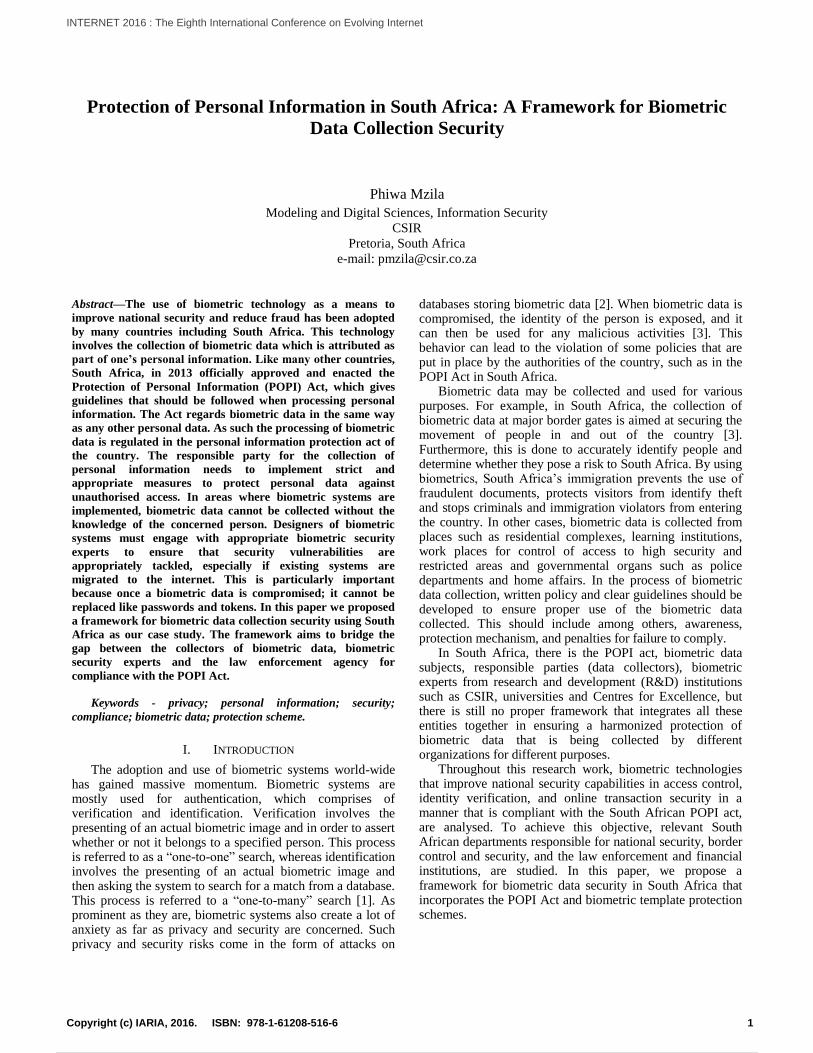
Figure 1. General biometric system
Security aspect of any biometric system can be measured by the level at which biometric data (biometric templates or images) is secured. All levels in the system should maintain high security and privacy protection. These levels are at the enrollment phase, storage phase, matching and updating phase. Amongst these phases, the most critical phase that imposes risk for biometric data loss, theft or compromise is at the storage phase. Hence employment of biometric templates protection schemes is critically important at all institutions that collect and process biometric data or uses biometric systems including personal information. An ideal template protection scheme will provide solutions such as how to revoke or cancel a compromised biometric template from the database.
The rest of the paper is structured as follow: in Section II biometric data as personal information is discussed, in Section III, areas where biometric data is collected in South Africa are outlined, a brief overview of POPI Act of South Africa is defined in Section IV, in Section V biometric protection schemes are discussed, Section VI presents a proposed framework and Section VII concludes the paper.
II. BIOMETRIC DATA AS PERSONAL INFORMATION
According to the POPI act of South Africa, examples of personal data for an individual could include, among others, photos, voice recordings, video footage, and biometric data [4]. A general biometric system will operate as depicted in Fig. 1. At the presentation of biometric modality, the scanner captures an image and performs feature extraction, from which a template is created. A biometric template is a mathematical file representation of location of unique biometric extracted features from a chosen modality image. This file can be anything from a binary mathematical file to a statistical model [5]. Biometric templates are then stored in the database, not the actual image of a biometric image.
There are arguments [6] that the data stored in biometric systems are not personal data because firstly, the stored biometric data is just a meaningless binary numbers, and therefore are not personally identifiable information; and secondly, a biometric image cannot be reconstructed from the stored template. If we look at the first argument, having these binary numbers linked to other personal identification particulars there is no denying that they are capable of identifying an individual. After all, the purpose of collecting the data and transform them into numbers is to identify and verify a person whose information is associated with the numbers. This is similarly true in the second scenario. A reconstructed template will ultimately reveal the identity of a person. Hence, no matter how the templates are constructed, they are be considered to be the personal data when combined with other identifying particulars of a data subject, hence should be treated with the most privacy and protected just like any other personal information as mandated by the POPI Act.
III. COLLECTION OF BIOMETRIC DATA IN SOUTH AFRICA
Biometric data may be collected for different reasons,
but whatever the reason might be, a responsible party should
ensure that the process is lawful and compliant with the
POPI act. Let us consider the following four classified areas
in which biometric data is being collected in South Africa:
border gates, banking, physical access control and
governmental organs. A common major concern in all these
four areas is that there is no mechanism implemented for
securing users collected biometric data, and by so imposing
high risk of fraud and cyber-crime.
A. Border gates
The South Africa government launched its biometric collection pilot at all ports of entry as part of country’s project to modernize its Enhanced Movement Control System (EMCS) towards the end of 2015. By using biometrics, South African border gates want to prevent the use of fraudulent documents, protect visitors from identity theft and to stop criminals and immigration violators from entering the country. In the wake of the recent terrorist acts, the country has now enforced the implementation of this initiative which aims to counter-act such malicious events while assuring safety for all [7].
B. Banking
The top five banks in South Africa are all exploring biometric initiatives to prevent bank fraud activities. As a result, the South African Banking Risk Identification Centre (SABRIC) was developed together with Online Fingerprint Verification System. The joint initiative will allow banks to access the Home Affairs National Identification System (HANIS) to verify the identity of the enrolled and active clients using their fingerprints. This electronic identity verification system is commended for having the capacity to combat bank-related identity fraud and corruption. It
2Copyright (c) IARIA, 2016. ISBN: 978-1-61208-516-6
INTERNET 2016 : The Eighth International Conference on Evolving Internet
11 / 63
contributes to a positive environment in which the citizens feel safe about their and are indeed secure in the hands of the various banking institutions.
Fingerprints data retrieved from HANIS by banks will not be stored in the databases of banks. The Department of Home Affairs will continue being the only guardian of the HANIS database. Banks will not have a full access to data in the database, but only the ability to verify the identity of a client through information in the database [8].
C. Physical Access Control
South Africa is one of the fast developing countries. Organizations are becoming increasingly security conscious, with a growing attention to advanced physical access control and robust access control technologies such as biometric systems. The adoption of biometric systems in physical access control places such as residential complexes, homes and working places is taking a steady growth in South Africa. The biometric system approach that is employed mostly in physical access control setup is 1 to 1, which is verification. Responsible parties, for example in residential complexes, use fingerprint scanners to capture and collect fingerprint images in huge volumes during enrollment for later use as an access control protocol in the complex. This process is repeated for every new resident moving in. Biometric data subjects are not made aware, let alone being guaranteed that their fingerprints will be securely stored.
Furthermore, responsible parties do not assure biometric data subjects what happens with processed data once the contract ends and the resident has to vacate the complex. Is the data deleted or kept in the database? If it is kept in the database, the question then is for how long? Will it not be cross matched in other applications for malicious activities? This conveys biometric security in physical access control under scrutiny, especially in South Africa.
D. Governmental Organs
South Africa’s Home Affairs National Identification System (HANIS) was developed as a verification service, which is an initiative that uses fingerprints to verify the identity of active clients and prevent identity fraud‚ irregular insurance claims and related crimes. This system uses a National Population Register database of fingerprints for all registered citizen of the country. This database can be accessed by all organs of government for different purposes, such as vetting for State Security Department, grant payments for South Africa Social Security Agency and crime investigation for Police Department.
IV. POPI ACT OF SOUTH AFRICA
In attempt to enforce the procedure of protecting
personal information, South Africa enacted the POPI act
which is summarized in this section.
A. Overview of POPI Act
In this paper and in POPI Act, unless the context indicates otherwise, ‘‘biometrics’’ means a technique of personal identification that is based on physical, physiological or behavioral characterization including blood
typing, fingerprinting, DNA analysis, retinal scanning and voice recognition to promote the protection of personal information processed by public and private bodies [4].
POPI Act binds every entity that is involved in the processing of personal information. It can be any public or private body or any person alone in conjunction with others determines the purpose of and means for processing personal information. In simple terms, the purpose of the POPI Act is to ensure that all South African institutions follow the right procedures when processing (collect, share, store or access) one’s personal information by holding them accountable should they abuse or compromise it. Personal information is widely stated and could include but not limited to the list in Table 1.
TABLE I. CLASSIFICATION OF PERSONAL INFORMATION
The POPI Act basically considers one’s personal
information to be precious goods and therefore aims to bestow upon all citizens of South African, as the owners of their personal information, firm rights of protection and control over the following:
when and how to share their personal information (requires consent)
the type and extent of their information to share (must be collected for valid reasons)
providing access to their own information as well as the right to have data removed and/or destroyed upon request
who has access to their information, i.e., there must be adequate measures to prevent unauthorised people from accessing their information
how and where their information is stored [4] The POPI Act lists eight core mandatory information
processing principles [9]:
1) Information quality: The responsible party must take
reasonably practical steps that the personal information is
complete, accurate, not misleading, updated and taking into
account the purpose for which it is collected.
2) Purpose specification: Personal information must be
collected for a specific, explicitly defined and lawful purpose
related to a function or activity of the responsible party. The
responsible party must take necessary steps to ensure those
Personal Information
Contact details Email, telephone address etc.
Demographics Age, sex, race, birthdate,
ethnicity etc.
History
Employment, financial,
educational, criminal,
medical etc.
Opinion Opinions of and about the person
Biometrics
Fingerprints, iris, palm,
veins, DNA, face, behavior,
etc.
Correspondence Private correspondence
3Copyright (c) IARIA, 2016. ISBN: 978-1-61208-516-6
INTERNET 2016 : The Eighth International Conference on Evolving Internet
12 / 63
data subjects are aware of the purpose for which their data is
being collected. 3) Accountability: The responsible party must ensure
that the eight mandatory information processing principles are complied with.
4) Processing limitation: Processing must be lawful
and personal data may only be processed if it is adequate,
relevant and not excessive given the purpose for which it is
processed.
5) Further processing limitation: This is where personal
data is received form a third party and passed on to the
responsible party for further processing. In these
circumstances, the further processing must be compatible
with the purpose for which it was initially collected.
6) Openness: Personal data may only be processed by a
responsible party that has notified the information protection
regulator.
7) Security safeguarding: The responsible party must
secure the integrity of personal data in its possession or
under its control by taking prescribed measures to prevent
loss of damage to or unauthorised destruction of data.
8) Data subject participating: A data subject has the
right to request a responsible party to confirm, free of charge,
whether or not the responsible party holds personal data,
including information about the identity of third parties, who
have, or have had, access to the information.
B. Collecting and Recording of Personal Information
Under the POPI Act, responsible parties processing personal information from data subject [4]:
can only collect personal information directly from the owner of the information
should acknowledges the owner before they collect personal information and obtain his or her consent
should have adequate reason for collecting this information
should provide enough transparency on the purpose and intended use of this information
may only share this information with authorised parties
Responsible parties have a strong mandate from the POPI Act that after the information has been collected from data subject the following two obligations should be followed:
They should only use the information for lawful purposes that the data subject agrees to. Any further processing must be compatible with the original purpose.
Access to this information should be limited to authorised parties only and only for as long as they need to perform their duty. Once the third party has completed his or her part, unless authorised for other duties, he or she may no longer have access to this information.
V. BIOMETRIC DATA PROTECTION SCHEMES
To comply with the POPI Act, responsible parties need to provide an assurance that collected data is securely stored and protected from hackers and fraudsters in their databases. Traditionally, biometric data (captured image), during enrollment is transformed into unreadable format or file called template as shown in Fig. 1. The template is then stored in the database. From a naked eye, a biometric template should be secure enough since it is a mathematical representation of the actual image, making it to be difficult to recreate the original biometric image when associated with other information of the same person, the personality of the person can be revealed. But recent studies [10] [11] [[12] have successfully proved that, it is indeed possible to reconstruct the original biometric image from a mere biometric template.
Researchers have proposed different schemes in order to secure biometric templates. These schemes should meet four desirable properties for protection biometric templates [13]:
1) Diversity: To ensure privacy, secure template must not allow cross matching.
2) Revocability: Compromised template should be
revoked and it must be possible to reissue a new template
from the same biometric data.
3) Security: It should not be possible to generate the
original template from the secured template.
4) Performance: The operation of the protection
scheme should not degrade the recognition performance
(FAR and FRR) of the biometric system. Biometric data protection schemes can broadly be
classified into two, namely: cryptosystem based approach and feature transformation based approach.
A. Cryptosystem Based Approach
Biometric cryptosystem approach is also known as helper data based method because in this approach some public information about the biometric template is stored [14]. Helper data does not reveal any significant information about the original biometric template. Cryptosystem can be classified either as key binding or as key generating as shown in Fig. 2 and Fig. 3 respectively.
In key generation method, helper data (H) is extracted
only from the biometric template (T). The cryptographic key (K) is generated from the helper data and the biometric query (Q). Therefore if the template and query are from the same
Figure 2. Key generation
4Copyright (c) IARIA, 2016. ISBN: 978-1-61208-516-6
INTERNET 2016 : The Eighth International Conference on Evolving Internet
13 / 63
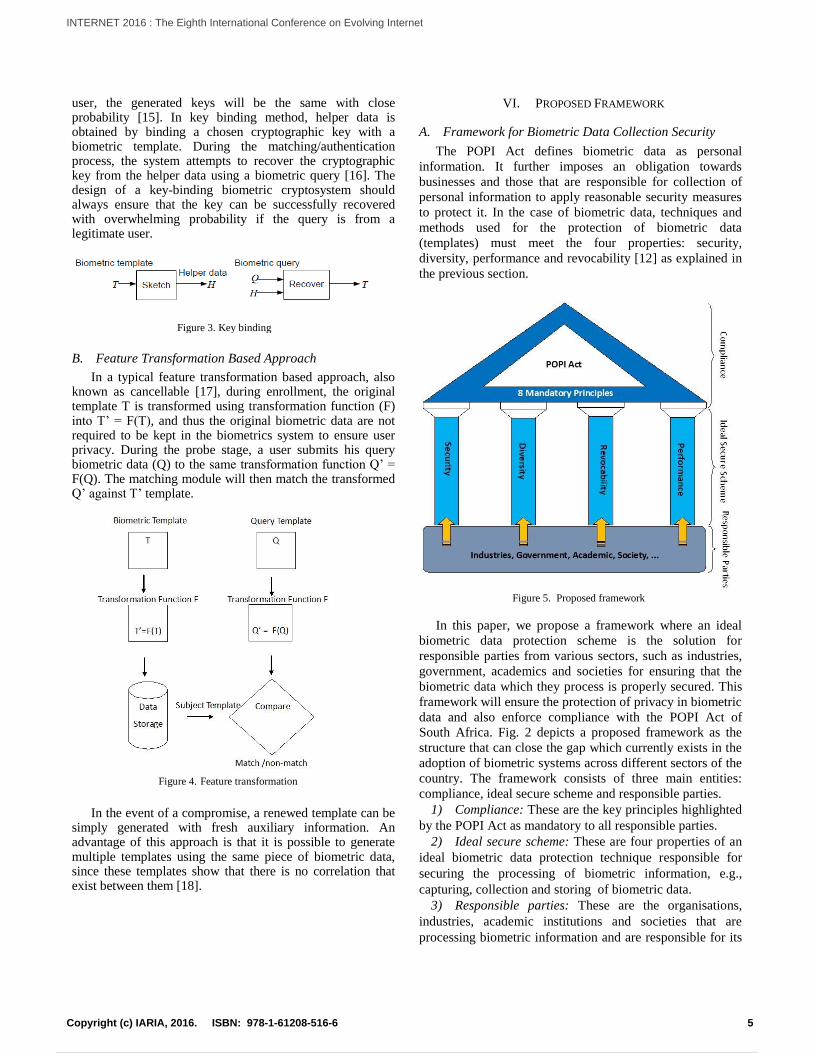
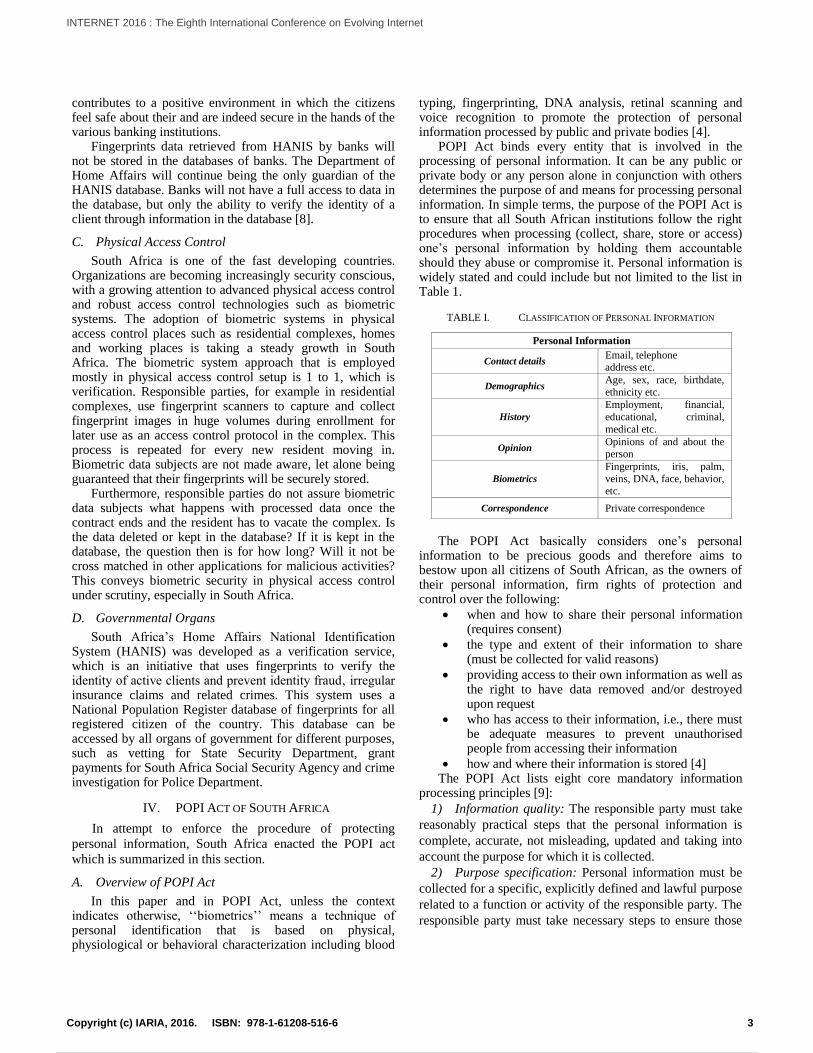
Figure 5. Proposed framework
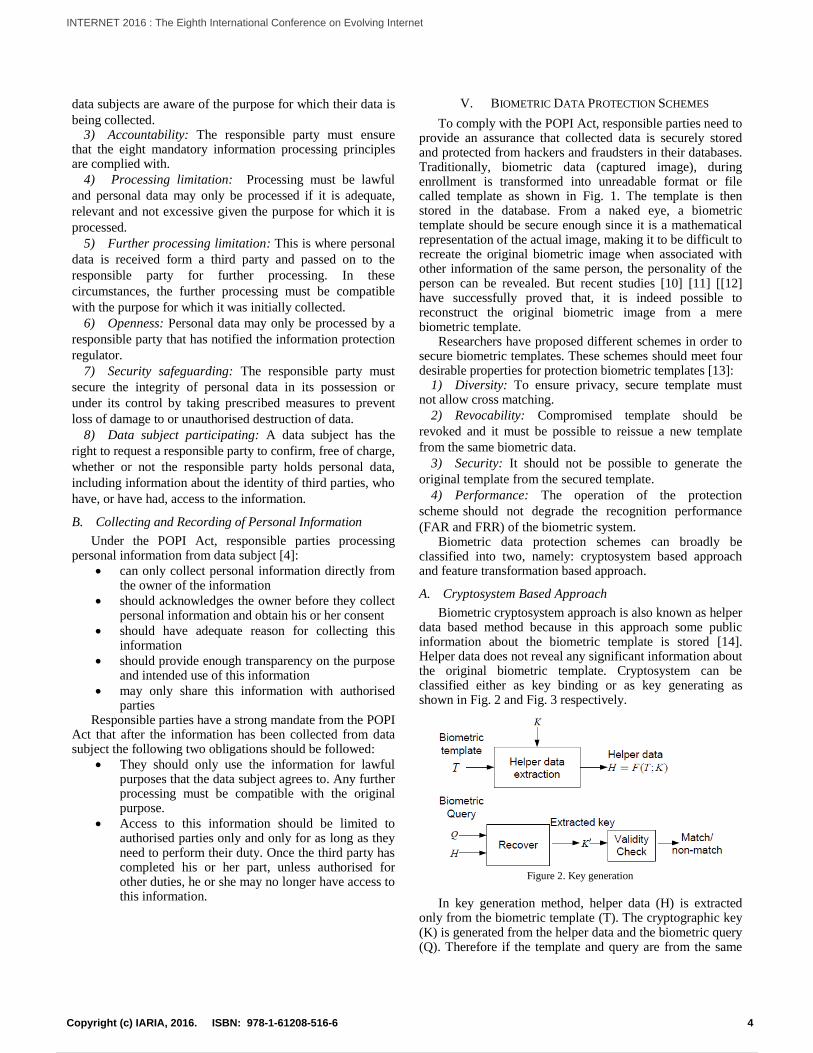
user, the generated keys will be the same with close probability [15]. In key binding method, helper data is obtained by binding a chosen cryptographic key with a biometric template. During the matching/authentication process, the system attempts to recover the cryptographic key from the helper data using a biometric query [16]. The design of a key-binding biometric cryptosystem should always ensure that the key can be successfully recovered with overwhelming probability if the query is from a legitimate user.
B. Feature Transformation Based Approach
In a typical feature transformation based approach, also known as cancellable [17], during enrollment, the original template T is transformed using transformation function (F) into T’ = F(T), and thus the original biometric data are not required to be kept in the biometrics system to ensure user privacy. During the probe stage, a user submits his query biometric data (Q) to the same transformation function Q’ = F(Q). The matching module will then match the transformed Q’ against T’ template.
In the event of a compromise, a renewed template can be
simply generated with fresh auxiliary information. An advantage of this approach is that it is possible to generate multiple templates using the same piece of biometric data, since these templates show that there is no correlation that exist between them [18].
VI. PROPOSED FRAMEWORK
A. Framework for Biometric Data Collection Security
The POPI Act defines biometric data as personal
information. It further imposes an obligation towards
businesses and those that are responsible for collection of
personal information to apply reasonable security measures
to protect it. In the case of biometric data, techniques and
methods used for the protection of biometric data
(templates) must meet the four properties: security,
diversity, performance and revocability [12] as explained in
the previous section.
In this paper, we propose a framework where an ideal
biometric data protection scheme is the solution for
responsible parties from various sectors, such as industries,
government, academics and societies for ensuring that the
biometric data which they process is properly secured. This
framework will ensure the protection of privacy in biometric
data and also enforce compliance with the POPI Act of
South Africa. Fig. 2 depicts a proposed framework as the
structure that can close the gap which currently exists in the
adoption of biometric systems across different sectors of the
country. The framework consists of three main entities:
compliance, ideal secure scheme and responsible parties.
1) Compliance: These are the key principles highlighted
by the POPI Act as mandatory to all responsible parties.
2) Ideal secure scheme: These are four properties of an
ideal biometric data protection technique responsible for
securing the processing of biometric information, e.g.,
capturing, collection and storing of biometric data.
3) Responsible parties: These are the organisations,
industries, academic institutions and societies that are
processing biometric information and are responsible for its
Figure 3. Key binding
Figure 4. Feature transformation
5Copyright (c) IARIA, 2016. ISBN: 978-1-61208-516-6
INTERNET 2016 : The Eighth International Conference on Evolving Internet
14 / 63
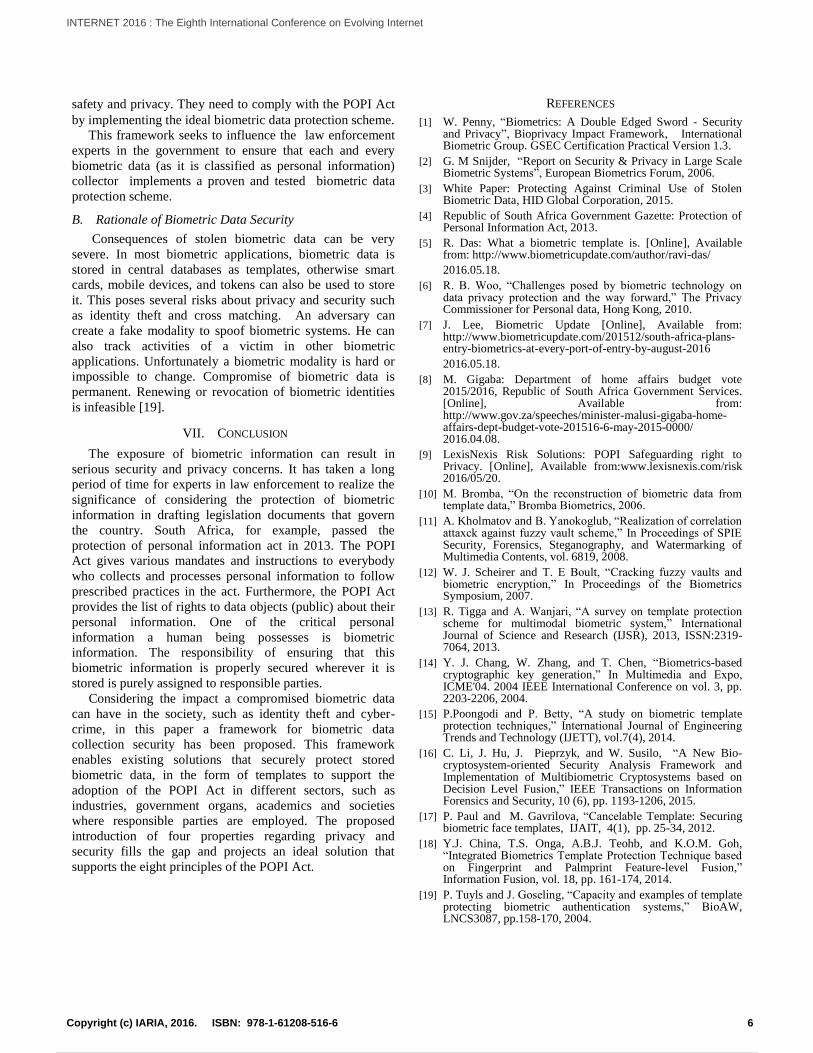
safety and privacy. They need to comply with the POPI Act
by implementing the ideal biometric data protection scheme.
This framework seeks to influence the law enforcement
experts in the government to ensure that each and every
biometric data (as it is classified as personal information)
collector implements a proven and tested biometric data
protection scheme.
B. Rationale of Biometric Data Security
Consequences of stolen biometric data can be very
severe. In most biometric applications, biometric data is
stored in central databases as templates, otherwise smart
cards, mobile devices, and tokens can also be used to store
it. This poses several risks about privacy and security such
as identity theft and cross matching. An adversary can
create a fake modality to spoof biometric systems. He can
also track activities of a victim in other biometric
applications. Unfortunately a biometric modality is hard or
impossible to change. Compromise of biometric data is
permanent. Renewing or revocation of biometric identities
is infeasible [19].
VII. CONCLUSION
The exposure of biometric information can result in
serious security and privacy concerns. It has taken a long
period of time for experts in law enforcement to realize the
significance of considering the protection of biometric
information in drafting legislation documents that govern
the country. South Africa, for example, passed the
protection of personal information act in 2013. The POPI
Act gives various mandates and instructions to everybody
who collects and processes personal information to follow
prescribed practices in the act. Furthermore, the POPI Act
provides the list of rights to data objects (public) about their
personal information. One of the critical personal
information a human being possesses is biometric
information. The responsibility of ensuring that this
biometric information is properly secured wherever it is
stored is purely assigned to responsible parties.
Considering the impact a compromised biometric data
can have in the society, such as identity theft and cyber-
crime, in this paper a framework for biometric data
collection security has been proposed. This framework
enables existing solutions that securely protect stored
biometric data, in the form of templates to support the
adoption of the POPI Act in different sectors, such as
industries, government organs, academics and societies
where responsible parties are employed. The proposed
introduction of four properties regarding privacy and
security fills the gap and projects an ideal solution that
supports the eight principles of the POPI Act.
REFERENCES
[1] W. Penny, “Biometrics: A Double Edged Sword - Security and Privacy”, Bioprivacy Impact Framework, International Biometric Group. GSEC Certification Practical Version 1.3.
[2] G. M Snijder, “Report on Security & Privacy in Large Scale Biometric Systems”, European Biometrics Forum, 2006.
[3] White Paper: Protecting Against Criminal Use of Stolen Biometric Data, HID Global Corporation, 2015.
[4] Republic of South Africa Government Gazette: Protection of Personal Information Act, 2013.
[5] R. Das: What a biometric template is. [Online], Available from: http://www.biometricupdate.com/author/ravi-das/
2016.05.18.
[6] R. B. Woo, “Challenges posed by biometric technology on data privacy protection and the way forward,” The Privacy Commissioner for Personal data, Hong Kong, 2010.
[7] J. Lee, Biometric Update [Online], Available from: http://www.biometricupdate.com/201512/south-africa-plans-entry-biometrics-at-every-port-of-entry-by-august-2016
2016.05.18.
[8] M. Gigaba: Department of home affairs budget vote 2015/2016, Republic of South Africa Government Services. [Online], Available from: http://www.gov.za/speeches/minister-malusi-gigaba-home-affairs-dept-budget-vote-201516-6-may-2015-0000/ 2016.04.08.
[9] LexisNexis Risk Solutions: POPI Safeguarding right to Privacy. [Online], Available from:www.lexisnexis.com/risk 2016/05/20.
[10] M. Bromba, “On the reconstruction of biometric data from template data,” Bromba Biometrics, 2006.
[11] A. Kholmatov and B. Yanokoglub, “Realization of correlation attaxck against fuzzy vault scheme,” In Proceedings of SPIE Security, Forensics, Steganography, and Watermarking of Multimedia Contents, vol. 6819, 2008.
[12] W. J. Scheirer and T. E Boult, “Cracking fuzzy vaults and biometric encryption,” In Proceedings of the Biometrics Symposium, 2007.
[13] R. Tigga and A. Wanjari, “A survey on template protection scheme for multimodal biometric system,” International Journal of Science and Research (IJSR), 2013, ISSN:2319-7064, 2013.
[14] Y. J. Chang, W. Zhang, and T. Chen, “Biometrics-based cryptographic key generation,” In Multimedia and Expo, ICME'04. 2004 IEEE International Conference on vol. 3, pp. 2203-2206, 2004.
[15] P.Poongodi and P. Betty, “A study on biometric template protection techniques,” International Journal of Engineering Trends and Technology (IJETT), vol.7(4), 2014.
[16] C. Li, J. Hu, J. Pieprzyk, and W. Susilo, “A New Bio-cryptosystem-oriented Security Analysis Framework and Implementation of Multibiometric Cryptosystems based on Decision Level Fusion,” IEEE Transactions on Information Forensics and Security, 10 (6), pp. 1193-1206, 2015.
[17] P. Paul and M. Gavrilova, “Cancelable Template: Securing biometric face templates, IJAIT, 4(1), pp. 25-34, 2012.
[18] Y.J. China, T.S. Onga, A.B.J. Teohb, and K.O.M. Goh, “Integrated Biometrics Template Protection Technique based on Fingerprint and Palmprint Feature-level Fusion,” Information Fusion, vol. 18, pp. 161-174, 2014.
[19] P. Tuyls and J. Goseling, “Capacity and examples of template protecting biometric authentication systems,” BioAW, LNCS3087, pp.158-170, 2004.
6Copyright (c) IARIA, 2016. ISBN: 978-1-61208-516-6
INTERNET 2016 : The Eighth International Conference on Evolving Internet
15 / 63
Stepping Stone Detection under Timing Perturbations through the Uniform
Distributed Random Delay
Koohong Kang
Dept. of information and communications Engineering,
Seowon University
Cheongju, Republic of Korea
e-mail: [email protected]
Jungtae Kim and Ikkyun Kim
Information Security Research Division,
Electronics and Telecommunications Research Institute
Daejeon, Republic of Korea
e-mail: {jungtae_kim,ikkim21}@etri.re.kr
Abstract—Even if many research works for detecting the
interactive stepping stones have been presented, it is a still very
challenging problem due to the intruder evasions, such as
timing perturbations and adding meaningless packets called
the chaff. Instead of using more elaborate techniques to timely
perturb the streams crossing over stepping stones, many
previous works have been exploiting the uniformly distributed
random delays. In this paper, we revisit the de-synchronization
problem between the original and transformed streams at a
stepping stone when we use a simple uniform distribution for
timing perturbations. To do so, we present a limitation of the
range of uniform distribution for adding the local timing jitters
in terms of the user’s maximum tolerable delay. In particular,
we simulate the delay distribution of the perturbed stream in
terms of , which represents the packet inter-
arrivals. We also define a simple metric to determine the
correlation between two traffic streams for detecting the
stepping stones. Finally, we show that our detection algorithm
is robust to the timing perturbations within the maximum
tolerable delay.
Keywords-stepping stones; timing perturbations; evasion;
interactive services.
I. INTRODUCTION
Intruders on the Internet often attack their targets indirectly by staging their attacks through intermediate hosts known as stepping stones to make it complicated to trace them. For example, an attack may traverse a sequence of hosts through a chain of interactive connections using Telnet, Rlogin, or secure shell (SSH). Over the past decades, several approaches have been introduced to find the interactive stepping stones. Zhang and Paxson [1] proposed the first timing-based method that uses the packets’ arrival time information, and Yoda and Etoh [2] defined the minimum average delay gap between the packet streams of two connections as the deviation. Since then, many research works [3][5] have been presented using only the packet timing characteristics because these systems can be used to find steeping stones even when the traffic is encrypted. These algorithms are based on the timing information, however, are all vulnerable to the active timing perturbation by the attacker; that is, the intruder can possibly evade the detection systems by modifying the packet timing information at the stepping stones [4]-[10].
Donoho et al. [4] first discussed evasions that consist of the local jittering of packet arrival times. They also assume
that an intruder has the maximum tolerable delay that an attacker is willing to introduce since humans are not able to work effectively over the interactive connections with a very long latency. Under the bounded delay assumption, Blum et al. [9] and He/Tong [10] extended the work of Donoho et al. [4] to correlate between two streams. They based on the packet counting process of the bidirectional streams (incoming and outgoing streams at a monitoring point) with a packet-conservation constraint; that is no packets are generated or dropped at the stepping stones. Yang/Huang [11] and Yang/Zhang [12] monitored the Send and Echo packets at the incoming and outgoing session of a host, and then compute the number of RTTs for both sessions. If the difference between the two numbers of RTTs is bounded, then it indicates that the host is used as a stepping-stone. However, the pair-wise (incoming and outgoing) monitoring at a single point could make the proposed system unrealistic in the national/world-wide Internet due to traffic asymmetric induced by routing policies [13]; that is, the packet streams between two endpoints follows the different physical links between intermediate nodes for both forward and reverse direction. In this paper, our main contribution is to propose a passive network-based approach to correlate between two streams without considering the directions of streams.
To meet the maximum tolerable delay of a transformed stream from the original inbound stream, Donoho et al. [4] used the dyadic block reshuffling. However, many researchers [5][6][7] are still considering a simple uniform random delay to perturb the timing information because the attackers can embed a simple delay routine into the pseudo-tty programs for interactive services. In this paper, we revisit the de-synchronization problem between the original and transformed streams at a stepping stone when we use a simple uniform distribution for timing perturbations. That is, we present a limitation of the uniform distribution ranges for adding a local timing jittering in terms of the user’s maximum tolerable delay. We also propose a practical approach to correlate between connections for finding the stepping stones. We will show that our detection algorithm is robust to the timing perturbations within the maximum tolerable delay because the total time interval of the ON times (a burst of packets) or the OFF times (no packets) is less fluctuated compared with the packet level jittering.
The rest of this paper is organized as follows. Section 2 discusses the related works in timing perturbations. In Section 3, we model the uniform distributed time delay, and
7Copyright (c) IARIA, 2016. ISBN: 978-1-61208-516-6
INTERNET 2016 : The Eighth International Conference on Evolving Internet
16 / 63
then simulate the delay distribution of the perturbed stream in terms of , which represents the packet inter-arrivals. In Section 4, we define a simple metric to determine the correlation between two traffic streams for detecting stepping stones, and then provide the experimental results. Finally, we conclude in Section 5.
II. RELATED WORKS
Donoho et al. [4] indicated that there are theoretical limits on the ability of attackers to disguise their traffic using evasions for a sufficiently long connection. They prepared a transformed stream using the dyadic block reshuffling which supports their assumption of a maximum delay tolerance; that is, they keep the same number of packets for each fixed time bin in the original and transformed streams, and times for packets in transformed stream are chosen uniformly at random within the time bin.
Venkateshaiah and Wright [8] proposed a simple buffering technique that could be used by an attacker on a stepping stone to evade detection, in which the transformed stream generates a constant rate traffic similar to the characteristics of a multimedia stream such that the timing correlations between the incoming original stream and the outgoing transformed stream do not exist anymore. Hence, they used a watermark-based timing analysis algorithm for detecting stepping stones. Even if the intruders install a crafty program for the interactive services, which introduces delays to make the incoming and outgoing streams to have a different timing characteristic as similar to the above two studies[4,8], we can easily expect a fact that the intruders embed a simple random delay routine into the existing interactive service programs. Wang and Reeves [5] used that the random delays added by the attacker are up to a maximum 1400ms timing perturbation. Zhang et al. [7] also added uniform distributed delays to each original flow for their experiments. In particular, they consider 10 different kinds of uniform delays, and their maximum delays increase from 2 to 20 seconds by incrementing 2 seconds gradually. However, we will identify the fact that these delays over 500 milliseconds timing perturbation are unrealistic in the real world. Peng et al. [6] experimented with 9 different timing perturbation variables, which are uniformly distributed with a maximum delay from 0 to 8 seconds. As mentioned earlier, Donoho et al. [4] noted that the incoming and outgoing streams become unboundedly out-of-sync if we simply add random delays to make a series of the time perturbed streams. In this paper, we also systematically review the de-synchronization problem, and simulate how much the delays can be added when we use a uniformly distributed random delay within the boundary of the maximum tolerable delay.
III. TIMING PERTURBATIONS
A. Delay Modeling
Most network operating systems provide an interactive service client and server, such as Telnet, Rlogin and SSH. These clients and servers are small executable programs that allow a local computer to access services and programs on a remote computer. An attacker who has a complete control
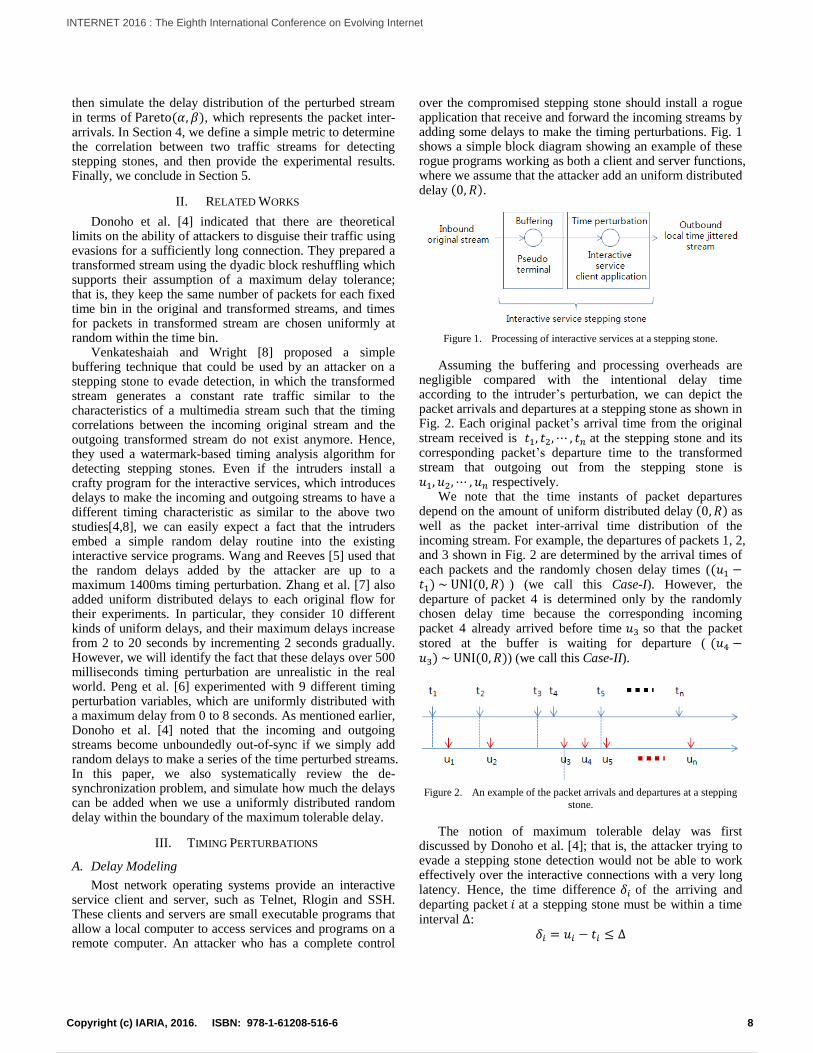
over the compromised stepping stone should install a rogue application that receive and forward the incoming streams by adding some delays to make the timing perturbations. Fig. 1 shows a simple block diagram showing an example of these rogue programs working as both a client and server functions, where we assume that the attacker add an uniform distributed delay .
Figure 1. Processing of interactive services at a stepping stone.
Assuming the buffering and processing overheads are negligible compared with the intentional delay time according to the intruder’s perturbation, we can depict the packet arrivals and departures at a stepping stone as shown in Fig. 2. Each original packet’s arrival time from the original stream received is at the stepping stone and its corresponding packet’s departure time to the transformed stream that outgoing out from the stepping stone is respectively.
We note that the time instants of packet departures depend on the amount of uniform distributed delay as well as the packet inter-arrival time distribution of the incoming stream. For example, the departures of packets 1, 2, and 3 shown in Fig. 2 are determined by the arrival times of each packets and the randomly chosen delay times ( ) (we call this Case-I). However, the departure of packet 4 is determined only by the randomly chosen delay time because the corresponding incoming packet 4 already arrived before time so that the packet stored at the buffer is waiting for departure ( ) (we call this Case-II).
Figure 2. An example of the packet arrivals and departures at a stepping
stone.
The notion of maximum tolerable delay was first discussed by Donoho et al. [4]; that is, the attacker trying to evade a stepping stone detection would not be able to work effectively over the interactive connections with a very long latency. Hence, the time difference of the arriving and departing packet at a stepping stone must be within a time interval :
8Copyright (c) IARIA, 2016. ISBN: 978-1-61208-516-6
INTERNET 2016 : The Eighth International Conference on Evolving Internet
17 / 63
As we can expect, depends on the distribution of packet inter-arrival time as well as the distribution of random delay. Paxson and Floyd [14] showed that the users’ typing patterns of Telnet service fit very well to a Pareto distribution with a shape parameter 0.9 or 0.95. In this paper, we also use the Pareto distribution instead of the exponential distribution because the exponential distribution results in seriously underestimating the longer inter-arrivals (burstiness) of interactive services due to the heavy tailed property of their inter-arrival times.
B. Simulation Results
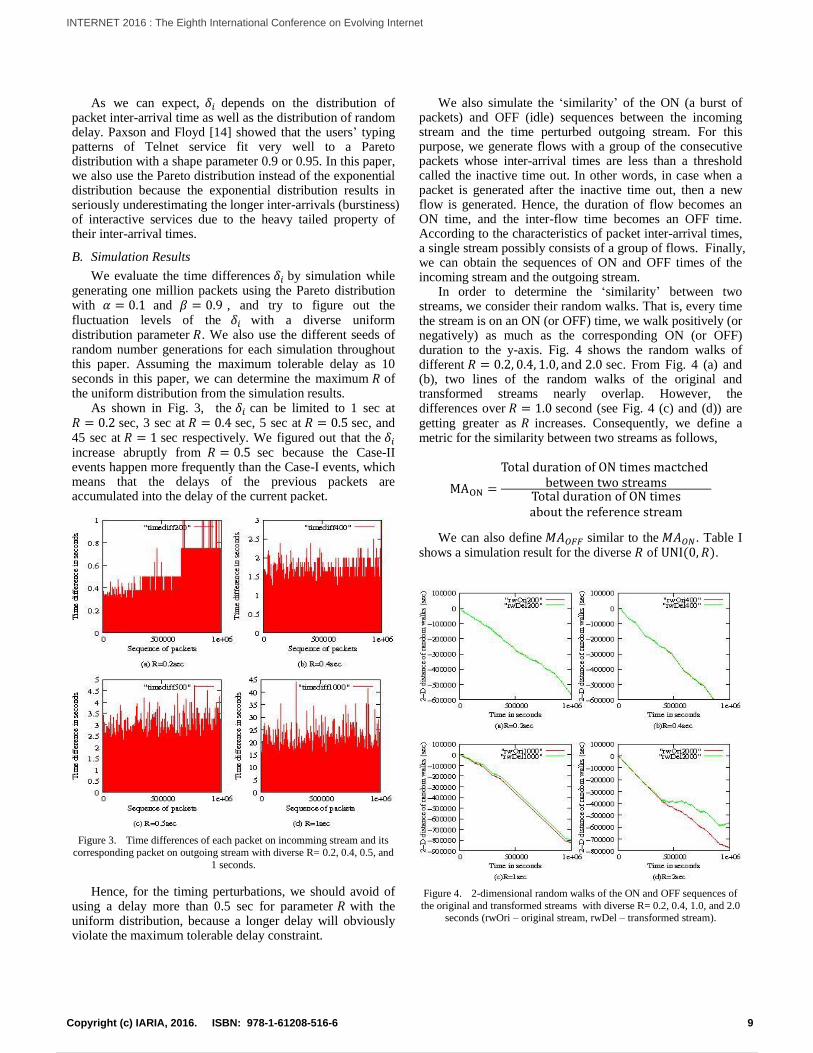
We evaluate the time differences by simulation while generating one million packets using the Pareto distribution with and , and try to figure out the fluctuation levels of the with a diverse uniform distribution parameter . We also use the different seeds of random number generations for each simulation throughout this paper. Assuming the maximum tolerable delay as 10 seconds in this paper, we can determine the maximum of the uniform distribution from the simulation results.
As shown in Fig. 3, the can be limited to 1 sec at sec, 3 sec at sec, 5 sec at sec, and 45 sec at sec respectively. We figured out that the increase abruptly from sec because the Case-II events happen more frequently than the Case-I events, which means that the delays of the previous packets are accumulated into the delay of the current packet.
Figure 3. Time differences of each packet on incomming stream and its
corresponding packet on outgoing stream with diverse R= 0.2, 0.4, 0.5, and
1 seconds.
Hence, for the timing perturbations, we should avoid of using a delay more than 0.5 sec for parameter with the uniform distribution, because a longer delay will obviously violate the maximum tolerable delay constraint.
We also simulate the ‘similarity’ of the ON (a burst of packets) and OFF (idle) sequences between the incoming stream and the time perturbed outgoing stream. For this purpose, we generate flows with a group of the consecutive packets whose inter-arrival times are less than a threshold called the inactive time out. In other words, in case when a packet is generated after the inactive time out, then a new flow is generated. Hence, the duration of flow becomes an ON time, and the inter-flow time becomes an OFF time. According to the characteristics of packet inter-arrival times, a single stream possibly consists of a group of flows. Finally, we can obtain the sequences of ON and OFF times of the incoming stream and the outgoing stream.
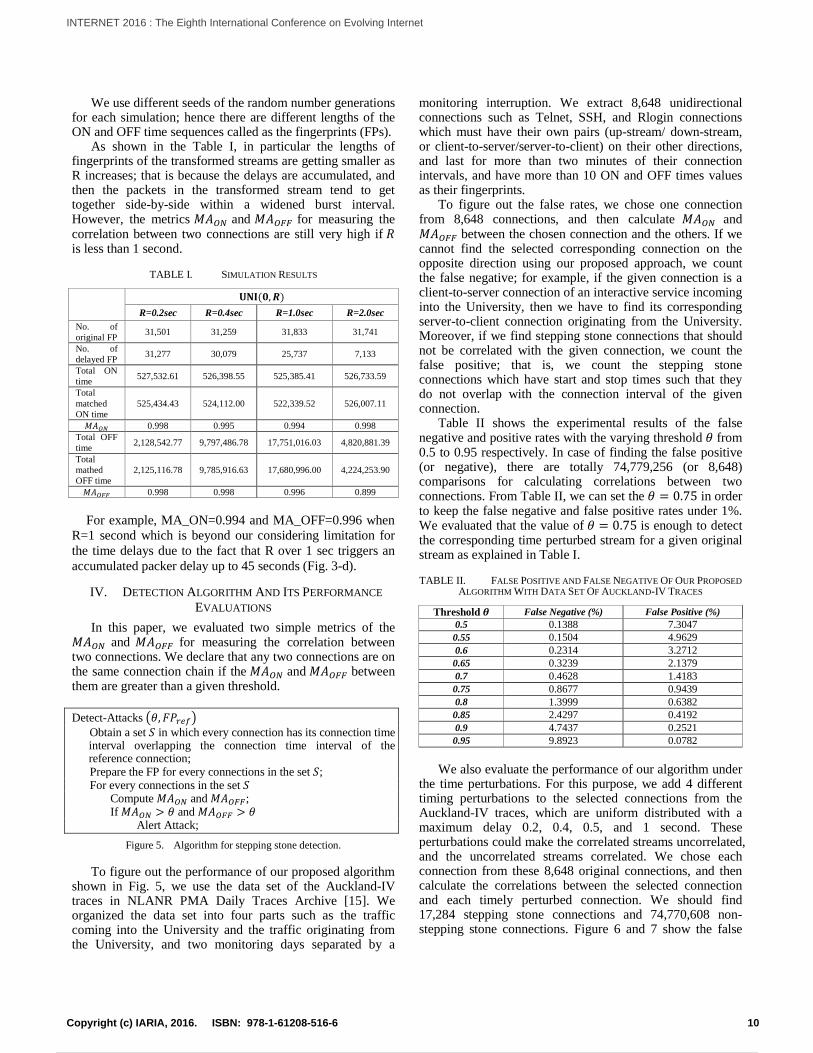
In order to determine the ‘similarity’ between two streams, we consider their random walks. That is, every time the stream is on an ON (or OFF) time, we walk positively (or negatively) as much as the corresponding ON (or OFF) duration to the y-axis. Fig. 4 shows the random walks of different sec. From Fig. 4 (a) and (b), two lines of the random walks of the original and transformed streams nearly overlap. However, the differences over second (see Fig. 4 (c) and (d)) are getting greater as increases. Consequently, we define a metric for the similarity between two streams as follows,
We can also define similar to the . Table I
shows a simulation result for the diverse of .
Figure 4. 2-dimensional random walks of the ON and OFF sequences of
the original and transformed streams with diverse R= 0.2, 0.4, 1.0, and 2.0 seconds (rwOri – original stream, rwDel – transformed stream).
9Copyright (c) IARIA, 2016. ISBN: 978-1-61208-516-6
INTERNET 2016 : The Eighth International Conference on Evolving Internet
18 / 63
We use different seeds of the random number generations for each simulation; hence there are different lengths of the ON and OFF time sequences called as the fingerprints (FPs).
As shown in the Table I, in particular the lengths of fingerprints of the transformed streams are getting smaller as R increases; that is because the delays are accumulated, and then the packets in the transformed stream tend to get together side-by-side within a widened burst interval. However, the metrics and for measuring the correlation between two connections are still very high if is less than 1 second.
TABLE I. SIMULATION RESULTS
R=0.2sec R=0.4sec R=1.0sec R=2.0sec
No. of
original FP 31,501 31,259 31,833 31,741
No. of
delayed FP 31,277 30,079 25,737 7,133
Total ON
time 527,532.61 526,398.55 525,385.41 526,733.59
Total
matched
ON time
525,434.43 524,112.00 522,339.52 526,007.11
0.998 0.995 0.994 0.998
Total OFF
time 2,128,542.77 9,797,486.78 17,751,016.03 4,820,881.39
Total
mathed
OFF time
2,125,116.78 9,785,916.63 17,680,996.00 4,224,253.90
0.998 0.998 0.996 0.899
For example, MA_ON=0.994 and MA_OFF=0.996 when
R=1 second which is beyond our considering limitation for
the time delays due to the fact that R over 1 sec triggers an
accumulated packer delay up to 45 seconds (Fig. 3-d).
IV. DETECTION ALGORITHM AND ITS PERFORMANCE
EVALUATIONS
In this paper, we evaluated two simple metrics of the and for measuring the correlation between two connections. We declare that any two connections are on the same connection chain if the and between them are greater than a given threshold.
Detect-Attacks
Obtain a set in which every connection has its connection time interval overlapping the connection time interval of the reference connection; Prepare the FP for every connections in the set ; For every connections in the set Compute and ; If and Alert Attack;
Figure 5. Algorithm for stepping stone detection.
To figure out the performance of our proposed algorithm shown in Fig. 5, we use the data set of the Auckland-IV traces in NLANR PMA Daily Traces Archive [15]. We organized the data set into four parts such as the traffic coming into the University and the traffic originating from the University, and two monitoring days separated by a
monitoring interruption. We extract 8,648 unidirectional connections such as Telnet, SSH, and Rlogin connections which must have their own pairs (up-stream/ down-stream, or client-to-server/server-to-client) on their other directions, and last for more than two minutes of their connection intervals, and have more than 10 ON and OFF times values as their fingerprints.
To figure out the false rates, we chose one connection from 8,648 connections, and then calculate and between the chosen connection and the others. If we cannot find the selected corresponding connection on the opposite direction using our proposed approach, we count the false negative; for example, if the given connection is a client-to-server connection of an interactive service incoming into the University, then we have to find its corresponding server-to-client connection originating from the University. Moreover, if we find stepping stone connections that should not be correlated with the given connection, we count the false positive; that is, we count the stepping stone connections which have start and stop times such that they do not overlap with the connection interval of the given connection.
Table II shows the experimental results of the false negative and positive rates with the varying threshold from 0.5 to 0.95 respectively. In case of finding the false positive (or negative), there are totally 74,779,256 (or 8,648) comparisons for calculating correlations between two connections. From Table II, we can set the in order to keep the false negative and false positive rates under 1%. We evaluated that the value of is enough to detect the corresponding time perturbed stream for a given original stream as explained in Table I.
TABLE II. FALSE POSITIVE AND FALSE NEGATIVE OF OUR PROPOSED
ALGORITHM WITH DATA SET OF AUCKLAND-IV TRACES
Threshold False Negative (%) False Positive (%)
0.5 0.1388 7.3047
0.55 0.1504 4.9629
0.6 0.2314 3.2712
0.65 0.3239 2.1379
0.7 0.4628 1.4183
0.75 0.8677 0.9439
0.8 1.3999 0.6382
0.85 2.4297 0.4192
0.9 4.7437 0.2521
0.95 9.8923 0.0782
We also evaluate the performance of our algorithm under
the time perturbations. For this purpose, we add 4 different timing perturbations to the selected connections from the Auckland-IV traces, which are uniform distributed with a maximum delay 0.2, 0.4, 0.5, and 1 second. These perturbations could make the correlated streams uncorrelated, and the uncorrelated streams correlated. We chose each connection from these 8,648 original connections, and then calculate the correlations between the selected connection and each timely perturbed connection. We should find 17,284 stepping stone connections and 74,770,608 non-stepping stone connections. Figure 6 and 7 show the false
10Copyright (c) IARIA, 2016. ISBN: 978-1-61208-516-6
INTERNET 2016 : The Eighth International Conference on Evolving Internet
19 / 63
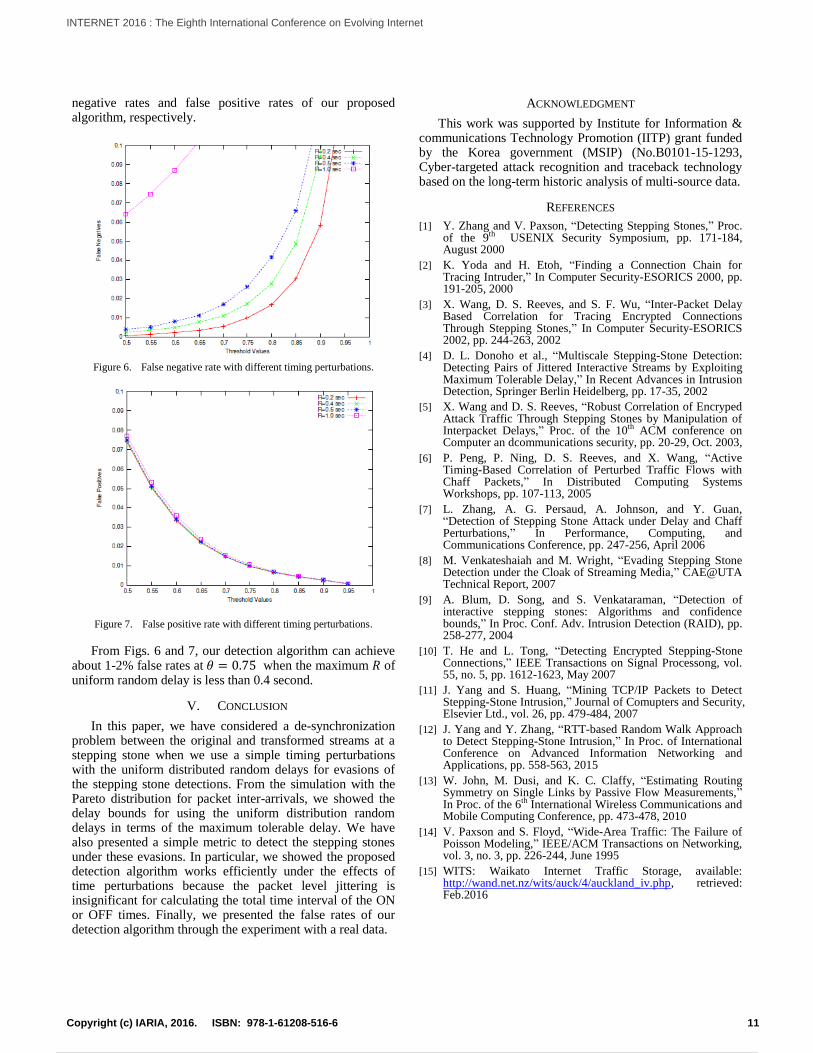
negative rates and false positive rates of our proposed algorithm, respectively.
Figure 6. False negative rate with different timing perturbations.
Figure 7. False positive rate with different timing perturbations.
From Figs. 6 and 7, our detection algorithm can achieve about 1-2% false rates at when the maximum of uniform random delay is less than 0.4 second.
V. CONCLUSION
In this paper, we have considered a de-synchronization problem between the original and transformed streams at a stepping stone when we use a simple timing perturbations with the uniform distributed random delays for evasions of the stepping stone detections. From the simulation with the Pareto distribution for packet inter-arrivals, we showed the delay bounds for using the uniform distribution random delays in terms of the maximum tolerable delay. We have also presented a simple metric to detect the stepping stones under these evasions. In particular, we showed the proposed detection algorithm works efficiently under the effects of time perturbations because the packet level jittering is insignificant for calculating the total time interval of the ON or OFF times. Finally, we presented the false rates of our detection algorithm through the experiment with a real data.
ACKNOWLEDGMENT
This work was supported by Institute for Information & communications Technology Promotion (IITP) grant funded by the Korea government (MSIP) (No.B0101-15-1293, Cyber-targeted attack recognition and traceback technology based on the long-term historic analysis of multi-source data.
REFERENCES
[1] Y. Zhang and V. Paxson, “Detecting Stepping Stones,” Proc. of the 9th USENIX Security Symposium, pp. 171-184, August 2000
[2] K. Yoda and H. Etoh, “Finding a Connection Chain for Tracing Intruder,” In Computer Security-ESORICS 2000, pp. 191-205, 2000
[3] X. Wang, D. S. Reeves, and S. F. Wu, “Inter-Packet Delay Based Correlation for Tracing Encrypted Connections Through Stepping Stones,” In Computer Security-ESORICS 2002, pp. 244-263, 2002
[4] D. L. Donoho et al., “Multiscale Stepping-Stone Detection: Detecting Pairs of Jittered Interactive Streams by Exploiting Maximum Tolerable Delay,” In Recent Advances in Intrusion Detection, Springer Berlin Heidelberg, pp. 17-35, 2002
[5] X. Wang and D. S. Reeves, “Robust Correlation of Encryped Attack Traffic Through Stepping Stones by Manipulation of Interpacket Delays,” Proc. of the 10th ACM conference on Computer an dcommunications security, pp. 20-29, Oct. 2003,
[6] P. Peng, P. Ning, D. S. Reeves, and X. Wang, “Active Timing-Based Correlation of Perturbed Traffic Flows with Chaff Packets,” In Distributed Computing Systems Workshops, pp. 107-113, 2005
[7] L. Zhang, A. G. Persaud, A. Johnson, and Y. Guan, “Detection of Stepping Stone Attack under Delay and Chaff Perturbations,” In Performance, Computing, and Communications Conference, pp. 247-256, April 2006
[8] M. Venkateshaiah and M. Wright, “Evading Stepping Stone Detection under the Cloak of Streaming Media,” CAE@UTA Technical Report, 2007
[9] A. Blum, D. Song, and S. Venkataraman, “Detection of interactive stepping stones: Algorithms and confidence bounds,” In Proc. Conf. Adv. Intrusion Detection (RAID), pp. 258-277, 2004
[10] T. He and L. Tong, “Detecting Encrypted Stepping-Stone Connections,” IEEE Transactions on Signal Processong, vol. 55, no. 5, pp. 1612-1623, May 2007
[11] J. Yang and S. Huang, “Mining TCP/IP Packets to Detect Stepping-Stone Intrusion,” Journal of Comupters and Security, Elsevier Ltd., vol. 26, pp. 479-484, 2007
[12] J. Yang and Y. Zhang, “RTT-based Random Walk Approach to Detect Stepping-Stone Intrusion,” In Proc. of International Conference on Advanced Information Networking and Applications, pp. 558-563, 2015
[13] W. John, M. Dusi, and K. C. Claffy, “Estimating Routing Symmetry on Single Links by Passive Flow Measurements,” In Proc. of the 6th International Wireless Communications and Mobile Computing Conference, pp. 473-478, 2010
[14] V. Paxson and S. Floyd, “Wide-Area Traffic: The Failure of Poisson Modeling,” IEEE/ACM Transactions on Networking, vol. 3, no. 3, pp. 226-244, June 1995
[15] WITS: Waikato Internet Traffic Storage, available: http://wand.net.nz/wits/auck/4/auckland_iv.php, retrieved: Feb.2016
11Copyright (c) IARIA, 2016. ISBN: 978-1-61208-516-6
INTERNET 2016 : The Eighth International Conference on Evolving Internet
20 / 63
On the Feasibility of Remote Attestation for IoT Devices
Yong-Hyuk Moon, Jeong-Nyeo Kim, and Yong-Sung Jeon
Hyper-connected Communication Research Laboratory
Electronics and Telecommunication Research Institute (ETRI)
Daejeon, Republic of Korea
email: {yhmoon, jnkim, ysjeon}@etri.re.kr
Abstract—This paper reviews practical difficulty of deploying
conventional remote attestation mechanisms into Internet-of-
Things. We then suggest a new research direction for highly
feasible attestation in terms of six identified perspectives.
Keywords-remote attestation; code integrity; device security.
I. INTRODUCTION
These days, device security is a growing concern with proliferation of low-power embedded devices. Especially, malware injection has become a critical threat even to small footprint devices, e.g., Internet-of-Things (IoT). Once a device is infected or compromised, unauthorized software can send confidential data to an external entity, force the device to operate abnormally, and induce harmful activities in an unpredictable manner. This creates several challenges, so that flawless design and implementation remains a crucial issue in practical system. In this paper, we confine our focus to three objectives: i) a brief review on the existing attestation approaches in Section II, ii) identifying requirements from challenging issues of attestation in Section III, and iii) setting a research direction towards a highly feasible attestation for IoT devices in Section IV.
II. EXISTING APPROACHES TO ATTESTATION
Three lines of attestation schemes have been proposed to
convince a verifier of a current system state of device.
A. Hardware Based Attestation
Trusted platform module (TPM) [1], a chip connecting to the microcontroller unit (MCU), is widely used to ensure that a system platform has loaded properly (e.g., secure booting). For this, TPM as the root of trust for measurement offers isolated storage to maintain asymmetric keys and platform configuration registers (PCRs). However, attestation based on such hardware trusted computing base (TCB) is most suitable for more-capable computing devices.
B. Software Only Attestation
As an early effort, PIONEER [2] offers primitive design principles and operations in order to externally verify a code at runtime. On the other hand, a software attestation protocol could be unfeasible due to the three common assumptions: i) a target device has been authenticated; thus, means for encrypted communication, secure key storage and so forth are given, ii) trustworthiness of prover relies on the
predefined time bound for a response to a verifier’s challenge, and iii) a prover process is strongly protected.
C. Hybrid Approaches
New approaches have been recently developed for establishing a dynamic root of trust with minimal modifications to standard built-in hardware. SMART [3] changes access logic to memory bus in the existing MCU, so that particular read only memory (ROM) resident code only accesses to a protected key for computing measurement. However, memory access violation is not concerned in this scheme. Unlike SMART, memory protection unit (MPU) enforces that only a trustlet constructing an attestation mechanism can access to its data for execution in TrustLite [4]. Secure inter-process communication issue is still a remaining issue.
III. CHALLENGING ISSUES OF DEVICE ATTESTATION
IoT devices are commonly resource-constrained; thus, installing TCB increases the costs of device production and requires additional software (e.g., driver, library). This strategy also increases the overall system complexity and is utterly opposed to the things’ characteristics.
A software process loaded on memory can be identified by comparing the measured hash values in attestation with reference data, called a list of reference integrity measurements (RIMs). Despite the simple matching, creating and maintaining RIMs is a challenging task. Furthermore, measurement represents not a security state of code but its execution state. Although a platform state relies on different software configurations, a binary decision of attestation only implies whether measured hash values are correct. Thus, the RIM-based technique may not be valid for detecting buffer overflow and return-oriented programing (ROP) attacks.
On the one hand, a prover can be replaced by malicious codes and its invocation can be hijacked. Precomputation of measured integrity value is also possible. To guarantee the secure state of prover as well as reliability of response, it is required to separate a prover’s work space from the other memory regions in a strict manner. Intuitively, it is difficult to verify the large number of devices one by one, that is, considerably time-consuming. Further, a verifier needs to handle devices, which operate on heterogeneous system platforms allowing various software configurations. Conventional attestation is insufficient in terms of scalability.
12Copyright (c) IARIA, 2016. ISBN: 978-1-61208-516-6
INTERNET 2016 : The Eighth International Conference on Evolving Internet
21 / 63
Since verifier impersonation could be a trivial attack to devices, if a prover believe that a bogus verifier is genuine, fake attestation requests easily invoke the measuring process of prover at any time. This situation acts as Denial of Service (DoS) attack. Thus, software only attestation is especially vulnerable to this setting.
IV. TOWARDS HIGHLY FEASIBLE ATTESTATION
With respect to the aforementioned major concerns, we discuss candidate solutions that can be applied to design a highly feasible remote attestation mechanism for IoT devices.
A. Authentic Requests
In the context of IoT devices, computing a message authentication code is time-consuming and asymmetric key cryptography based on X.509 certificates requires large computational complexity. A recent solution [5] mitigates this limitation by applying nonces, counters and timestamps to the process of authenticating verifier requests in attestation. These data can be effective in detecting reply attacks, reordered requests and delayed requests, respectively, if non-volatile memory is supported and provides a sufficient space.
B. Meausrement Assurance
A measurement result must not be compromised even in a tempered device. To this end, reference data and keys must be protected in the isolated memory space. One possible solution is to use the internal inaccessible ROM in which a bootloader is located. However, such a type of ROM may not be a built-in component to some devices. MPU could be another countermeasure to enforce rules of controlling memory access and permission. Fortunately, this hardware chip is provided by widely used commodity MCU products.
C. Prover Protection
To satisfy minimal hardware support, MPU could be used for prover protection by making a specific region of memory isolate. An isolated region is only accessible by a system module with a privileged mode, so that a set functions of MPU could not be called by a user process. In addition to that, one region can be divided into several blocks according to specific purposes. One critical drawback is caused by the fact that some IoT operating systems do not provide any barrier or means (e.g., system call interfaces) to differentiate user mode and kernel mode.
D. Verfication Flexibility
Since conventional attestation depends on cryptographic algorithms, such as hashing, it is very effective in ensuring whether a binary code running on a device is exactly same as that a verifier expects. Its all-or-nothing strategy does not allow the existence of devices with various degree of trustworthiness, cannot distinguish between identification and behavior of codes, and locks a device into a limited platform. One ultimate goal of new attestation is to obtain a strong evidence that a program on a remote device purely behaves according to a given security policy.
E. Control Flow
To measure and verify the runtime state of particular codes, every control flow of program including stack usage should be traced by TCB. In case of detecting ROP attacks, the last branch record (LBR) may be required to monitor the abnormal branch instructions to some gadget (a small piece of codes). Low-power MCU, such as ARM cortex family is not capable of maintaining the overall history of these instructions due to the absence of LBR. To overcome this problem, a prover can accumulate addresses of source and target of every branch instruction by building a hash chain of branch path, i.e., control flow.
F. Scalability
One common limitation of remote attestation is that a verifier certainly suffers from a performance bottleneck since it cannot scale to diversity of devices. A simple and straightforward approach to mitigate this problem is to attest a group of devices (swarms) instead of dealing with a single device at time of attestation [6]. Devices, meanwhile, can be also verified by rapidly investigating consistency of their relationship, which is created in the form of clique [7]. The matter to consider is that these attestation schemes may be subject to the construction types of topologies.
V. CONCLUSIONS
In this paper, we have reviewed the existing attestation schemes with respect to their limitations. Future research directions and advanced solutions have been also discussed for designing a highly feasible attestation in the IoT system.
ACKNOWLEDGMENT
This work was supported by Institute for Information and communication Technology Promotion (IITP) grant funded by the Korea government (MSIP) [B0190-16-2032, Development of Operating System Security Core Technology for the Smart Lightweight IoT Devices].
REFERENCES
[1] Trusted Computing Group. TPM Main Specification Level 2 Version 1.2, Revision 116, March 1 2011.
[2] Arvind Seshadri et al., “Pioneer: Verifying Code Integrity and Enforcing Untampered Code Execution on Legacy Systems,” SOSP’05, pp. 1-16, October 23-26, 2005, United Kingdom.
[3] E. Karim, F. Aurélien, P. Daniele, and T. Gene, “SMART: Secure and Minimal Architecture for (Establishing a Dynamic) Root of Trust,“ NDSS’12, February 5-8, USA.
[4] P. Koeberl, S. Schulz, A.-R. Sadeghi, and V. Varadharajan, “TrustLite: A Security Architecture for Tiny Embedded Devices,” EuroSys’14, April 13-16, 2014.
[5] F. Brasser, K. B. Rasmussen, A.-R. Sadeghi, and G. Tsudik, “Remote Attestation for Low-End Embedded Devices: the Prover’s Perspective,” DAC ’16, June 05-09, 2016, USA.
[6] N. Asokan et al., “SEDA: Scalable Embedded Device Attestation,” CCS’15, pp. 964-975, October 12–16, 2015.
[7] Y.-H. Moon and Y.-S. Jeon, “A Functional Relationship Based Attestation Scheme for Detecting Compromised Nodes in Large IoT Networks,” CUTE’15, vol. 373, pp. 713-721, December 2015.
13Copyright (c) IARIA, 2016. ISBN: 978-1-61208-516-6
INTERNET 2016 : The Eighth International Conference on Evolving Internet
22 / 63
Static Detection of Malware and Benign Executable
Using Machine Learning Algorithm
Dong-Hee Kim∗, Sang-Uk Woo∗, Dong-Kyu Lee∗ and Tai-Myoung Chung†∗Dept of Electrical and Computer Engineering
Sungkyunkwan University, Suwon, KoreaEmail: {kkim, suwoo, leedg84}@imtl.skku.ac.kr
†College of SoftwareSungkyunkwan University, Suwon, Korea
Email: [email protected]
Abstract—One of the popular ways of detecting malware issignature based pattern matching. However, the signature ofmalware should be stored in advance for the pattern matchingdetection. Moreover, it calculates the similarity of input data usingstored signature. Therefore, the storage problem and calcula-tion overheads occur undoubtedly. Also, detection possibility isdropped, when malicious code is modified. So we use machinelearning algorithm technique for detecting malicious executableand benign executable. However, previous technique has a limita-tion on detecting Worms and Trojans. In this paper, distinguishedfeatures of Portable Executable header are used. For the machinelearning algorithm, Classification And Regression Tree (CART),Support Vector Classification (SVC), and Stochastic GradientDescent (SGD) are applied for improving to detection rate.The performance of each algorithm firstly evaluated to findthe most outperformed algorithm each for classifying benignexecutable and malicious executable. And then, these algorithmswere combined to detect malware more precisely.
Keywords–Portable Executable Header; Machine Learning;Malware Detection; Intrusion Detection System.
I. INTRODUCTION
Traditionally signature-based static method is mostly usedfor malware detection. Signature-based method has somedrawbacks. Pattern matching method, one of the signature-based static method, should possess all the pattern informationof malware samples before the detection. Saving all the patterninformations, may causes the storage management problem andmatching overheads. Moreover, detection efficiency of patternmatching method decreases, if pattern is changed by sourcecode modification (e.g., inserting or removing the opcode).Therefore, machine learning-based malware detection meth-ods are being researched [1][2][3][4]. The purpose of usingmachine learning algorithm is to study the pattern from thelearning set and to predict the classes or value from the givendata [5]. The acceptable detection rate is described in severalprevious researches. The various features of benign code andmalicious code had been considered from many research paper.Researchers have derived the distinctive characteristics whichare from binary code [6][7], opcode [8][9], and PortableExecutable header (PE-header) of benign executables andmalicious executables [10]. They have evaluated their resultusing a variety of machine learning algorithms. The advantageof using a machine learning technique is the prediction ofunknown class. It can detect not only known malware but alsonon-recognized malware through the pattern analysis itself. In
addition, machine learning algorithm can detect a large amountof malware using relatively small amount of input training sets.
The interested detection method is PE-miner framework[10]. The PE format is a file format for executables, objectcode, DLLs, Font files, and others used in 32-bit and 64-bitversions of Windows operating systems [11]. In shafiq et al.paper [10], they have analyzed the distinctive characteristicsof PE-header between malicious executable and benign one.They categorized malicious executable into 7 types; backdoor+ sniffer, Constructor + Virtool, DoS + Nuker, Flooder, Exploit+ Hacktool, Work, Trojan and Virus. From the PE-header,18 different features are founded by Shafiq. However, PE-header features might not convey useful information in aparticular scenario. For example, some attribute value couldhave too much low value or dummy value, and some couldbe counter. Also, considering the application of the manyattributes increases the dimensional spaces in machine learningalgorithm. This is the main reason for time delay in fitting pro-cess. So, for reducing dimensionality of input feature space, apreprocessor process is removing or combining the PE-headerinformation with other similar features. Redundant FeatureRemoval (RFR), Principal Component Analysis (PCA), andHaar Wavelet Transform (HWT) mechanisms are used forpreprocessing the PE-header feature.
The purpose of this paper is to evaluate the existing PE-miner framework [10] and improving the detection rate byadjusting the attribute of training set and algorithm. We havechosen the PE feature from many other distinctive character-istics because it has an almost fixed size of data structureregardless of program size. If the number of attributes com-posing the training set is changed depending on data, it willincrease the complexity of training process. We expect that theattributes that extracted from previous research could not carrythe characteristic of the malware according to the Windowssystem changes. Also, in previous research [10], Shafiq et al.use insufficient amount of training set and sample file. For theirexperiment, 1,477 benign sample files and 15,925 malwaresample files were used. The most relevant information is storedwith the highest coefficients at each order of a transform.The lower order coefficients can be ignored to get only themost relevant information. Decision Tree (J48), Instance BasedLearner (IBk), Native Bayes (NB), RIPPER (inductive rulelearner), Support Vector Machine using Sequential MinimalOptimization (SMO) algorithms are used for their experiment.The outputs of these algorithms were compared with each other
14Copyright (c) IARIA, 2016. ISBN: 978-1-61208-516-6
INTERNET 2016 : The Eighth International Conference on Evolving Internet
23 / 63
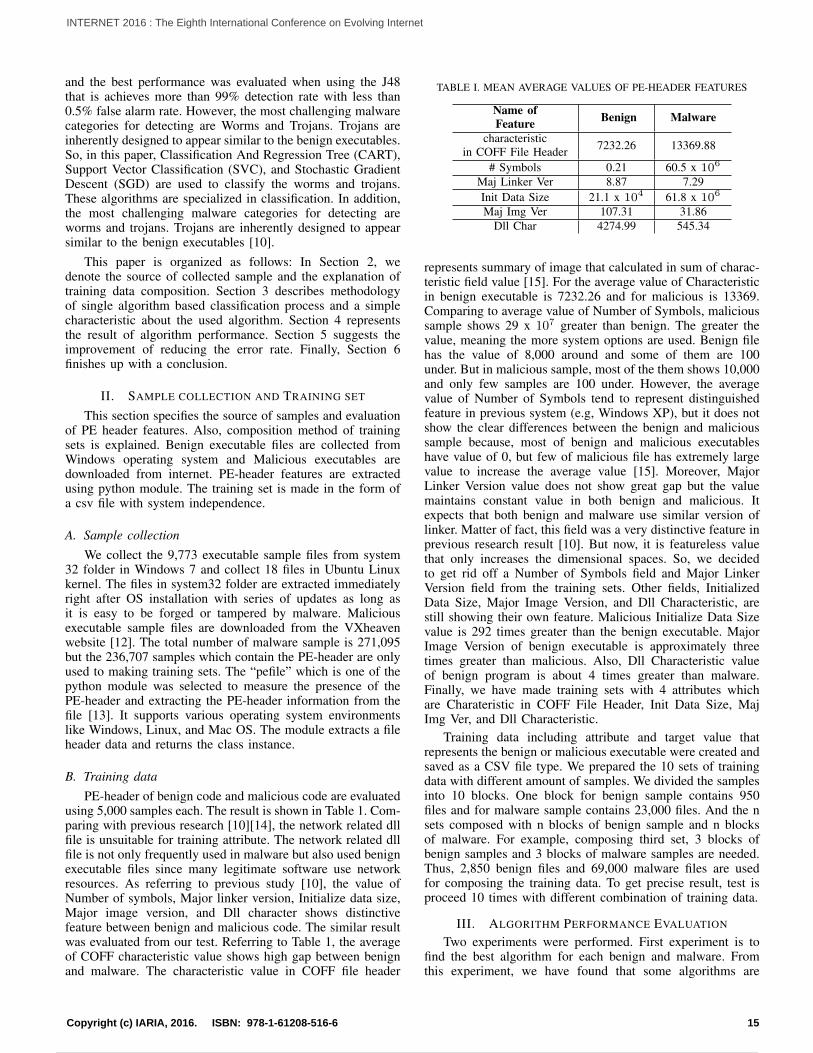
and the best performance was evaluated when using the J48that is achieves more than 99% detection rate with less than0.5% false alarm rate. However, the most challenging malwarecategories for detecting are Worms and Trojans. Trojans areinherently designed to appear similar to the benign executables.So, in this paper, Classification And Regression Tree (CART),Support Vector Classification (SVC), and Stochastic GradientDescent (SGD) are used to classify the worms and trojans.These algorithms are specialized in classification. In addition,the most challenging malware categories for detecting areworms and trojans. Trojans are inherently designed to appearsimilar to the benign executables [10].
This paper is organized as follows: In Section 2, wedenote the source of collected sample and the explanation oftraining data composition. Section 3 describes methodologyof single algorithm based classification process and a simplecharacteristic about the used algorithm. Section 4 representsthe result of algorithm performance. Section 5 suggests theimprovement of reducing the error rate. Finally, Section 6finishes up with a conclusion.
II. SAMPLE COLLECTION AND TRAINING SET
This section specifies the source of samples and evaluationof PE header features. Also, composition method of trainingsets is explained. Benign executable files are collected fromWindows operating system and Malicious executables aredownloaded from internet. PE-header features are extractedusing python module. The training set is made in the form ofa csv file with system independence.
A. Sample collectionWe collect the 9,773 executable sample files from system
32 folder in Windows 7 and collect 18 files in Ubuntu Linuxkernel. The files in system32 folder are extracted immediatelyright after OS installation with series of updates as long asit is easy to be forged or tampered by malware. Maliciousexecutable sample files are downloaded from the VXheavenwebsite [12]. The total number of malware sample is 271,095but the 236,707 samples which contain the PE-header are onlyused to making training sets. The “pefile” which is one of thepython module was selected to measure the presence of thePE-header and extracting the PE-header information from thefile [13]. It supports various operating system environmentslike Windows, Linux, and Mac OS. The module extracts a fileheader data and returns the class instance.
B. Training dataPE-header of benign code and malicious code are evaluated
using 5,000 samples each. The result is shown in Table 1. Com-paring with previous research [10][14], the network related dllfile is unsuitable for training attribute. The network related dllfile is not only frequently used in malware but also used benignexecutable files since many legitimate software use networkresources. As referring to previous study [10], the value ofNumber of symbols, Major linker version, Initialize data size,Major image version, and Dll character shows distinctivefeature between benign and malicious code. The similar resultwas evaluated from our test. Referring to Table 1, the averageof COFF characteristic value shows high gap between benignand malware. The characteristic value in COFF file header
TABLE I. MEAN AVERAGE VALUES OF PE-HEADER FEATURES
Name ofFeature Benign Malware
characteristicin COFF File Header 7232.26 13369.88
# Symbols 0.21 60.5 x 10⁶
Maj Linker Ver 8.87 7.29Init Data Size 21.1 x 10⁴ 61.8 x 10⁶
Maj Img Ver 107.31 31.86Dll Char 4274.99 545.34
represents summary of image that calculated in sum of charac-teristic field value [15]. For the average value of Characteristicin benign executable is 7232.26 and for malicious is 13369.Comparing to average value of Number of Symbols, malicioussample shows 29 x 107 greater than benign. The greater thevalue, meaning the more system options are used. Benign filehas the value of 8,000 around and some of them are 100under. But in malicious sample, most of the them shows 10,000and only few samples are 100 under. However, the averagevalue of Number of Symbols tend to represent distinguishedfeature in previous system (e.g, Windows XP), but it does notshow the clear differences between the benign and malicioussample because, most of benign and malicious executableshave value of 0, but few of malicious file has extremely largevalue to increase the average value [15]. Moreover, MajorLinker Version value does not show great gap but the valuemaintains constant value in both benign and malicious. Itexpects that both benign and malware use similar version oflinker. Matter of fact, this field was a very distinctive feature inprevious research result [10]. But now, it is featureless valuethat only increases the dimensional spaces. So, we decidedto get rid off a Number of Symbols field and Major LinkerVersion field from the training sets. Other fields, InitializedData Size, Major Image Version, and Dll Characteristic, arestill showing their own feature. Malicious Initialize Data Sizevalue is 292 times greater than the benign executable. MajorImage Version of benign executable is approximately threetimes greater than malicious. Also, Dll Characteristic valueof benign program is about 4 times greater than malware.Finally, we have made training sets with 4 attributes whichare Charateristic in COFF File Header, Init Data Size, MajImg Ver, and Dll Characteristic.
Training data including attribute and target value thatrepresents the benign or malicious executable were created andsaved as a CSV file type. We prepared the 10 sets of trainingdata with different amount of samples. We divided the samplesinto 10 blocks. One block for benign sample contains 950files and for malware sample contains 23,000 files. And the nsets composed with n blocks of benign sample and n blocksof malware. For example, composing third set, 3 blocks ofbenign samples and 3 blocks of malware samples are needed.Thus, 2,850 benign files and 69,000 malware files are usedfor composing the training data. To get precise result, test isproceed 10 times with different combination of training data.
III. ALGORITHM PERFORMANCE EVALUATION
Two experiments were performed. First experiment is tofind the best algorithm for each benign and malware. Fromthis experiment, we have found that some algorithms are
15Copyright (c) IARIA, 2016. ISBN: 978-1-61208-516-6
INTERNET 2016 : The Eighth International Conference on Evolving Internet
24 / 63
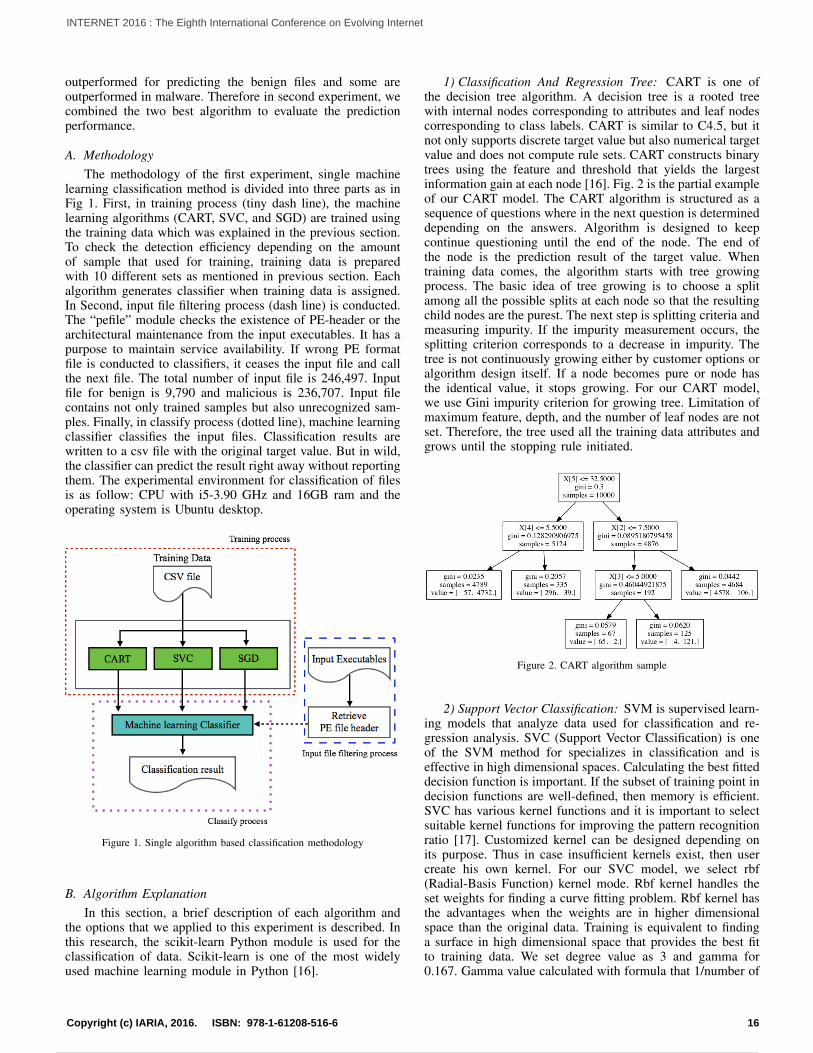
outperformed for predicting the benign files and some areoutperformed in malware. Therefore in second experiment, wecombined the two best algorithm to evaluate the predictionperformance.
A. MethodologyThe methodology of the first experiment, single machine
learning classification method is divided into three parts as inFig 1. First, in training process (tiny dash line), the machinelearning algorithms (CART, SVC, and SGD) are trained usingthe training data which was explained in the previous section.To check the detection efficiency depending on the amountof sample that used for training, training data is preparedwith 10 different sets as mentioned in previous section. Eachalgorithm generates classifier when training data is assigned.In Second, input file filtering process (dash line) is conducted.The “pefile” module checks the existence of PE-header or thearchitectural maintenance from the input executables. It has apurpose to maintain service availability. If wrong PE formatfile is conducted to classifiers, it ceases the input file and callthe next file. The total number of input file is 246,497. Inputfile for benign is 9,790 and malicious is 236,707. Input filecontains not only trained samples but also unrecognized sam-ples. Finally, in classify process (dotted line), machine learningclassifier classifies the input files. Classification results arewritten to a csv file with the original target value. But in wild,the classifier can predict the result right away without reportingthem. The experimental environment for classification of filesis as follow: CPU with i5-3.90 GHz and 16GB ram and theoperating system is Ubuntu desktop.
Figure 1. Single algorithm based classification methodology
B. Algorithm ExplanationIn this section, a brief description of each algorithm and
the options that we applied to this experiment is described. Inthis research, the scikit-learn Python module is used for theclassification of data. Scikit-learn is one of the most widelyused machine learning module in Python [16].
1) Classification And Regression Tree: CART is one ofthe decision tree algorithm. A decision tree is a rooted treewith internal nodes corresponding to attributes and leaf nodescorresponding to class labels. CART is similar to C4.5, but itnot only supports discrete target value but also numerical targetvalue and does not compute rule sets. CART constructs binarytrees using the feature and threshold that yields the largestinformation gain at each node [16]. Fig. 2 is the partial exampleof our CART model. The CART algorithm is structured as asequence of questions where in the next question is determineddepending on the answers. Algorithm is designed to keepcontinue questioning until the end of the node. The end ofthe node is the prediction result of the target value. Whentraining data comes, the algorithm starts with tree growingprocess. The basic idea of tree growing is to choose a splitamong all the possible splits at each node so that the resultingchild nodes are the purest. The next step is splitting criteria andmeasuring impurity. If the impurity measurement occurs, thesplitting criterion corresponds to a decrease in impurity. Thetree is not continuously growing either by customer options oralgorithm design itself. If a node becomes pure or node hasthe identical value, it stops growing. For our CART model,we use Gini impurity criterion for growing tree. Limitation ofmaximum feature, depth, and the number of leaf nodes are notset. Therefore, the tree used all the training data attributes andgrows until the stopping rule initiated.
Figure 2. CART algorithm sample
2) Support Vector Classification: SVM is supervised learn-ing models that analyze data used for classification and re-gression analysis. SVC (Support Vector Classification) is oneof the SVM method for specializes in classification and iseffective in high dimensional spaces. Calculating the best fitteddecision function is important. If the subset of training point indecision functions are well-defined, then memory is efficient.SVC has various kernel functions and it is important to selectsuitable kernel functions for improving the pattern recognitionratio [17]. Customized kernel can be designed depending onits purpose. Thus in case insufficient kernels exist, then usercreate his own kernel. For our SVC model, we select rbf(Radial-Basis Function) kernel mode. Rbf kernel handles theset weights for finding a curve fitting problem. Rbf kernel hasthe advantages when the weights are in higher dimensionalspace than the original data. Training is equivalent to findinga surface in high dimensional space that provides the best fitto training data. We set degree value as 3 and gamma for0.167. Gamma value calculated with formula that 1/number of
16Copyright (c) IARIA, 2016. ISBN: 978-1-61208-516-6
INTERNET 2016 : The Eighth International Conference on Evolving Internet
25 / 63
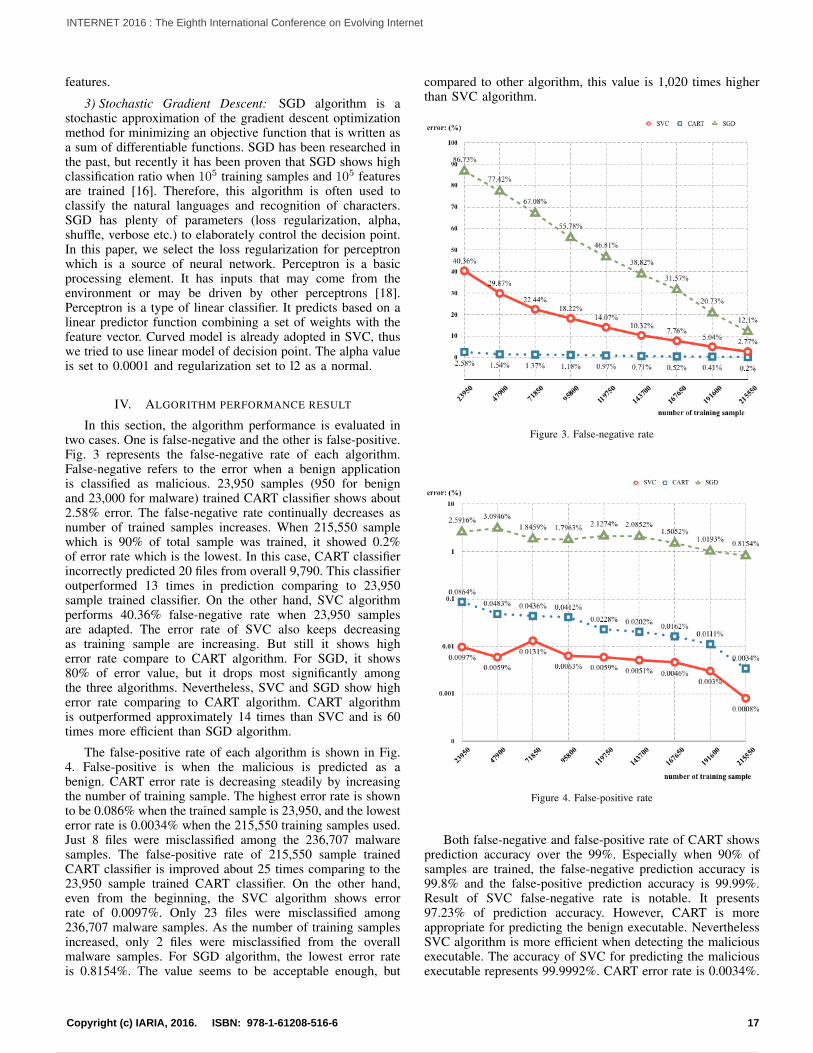
features.
3) Stochastic Gradient Descent: SGD algorithm is astochastic approximation of the gradient descent optimizationmethod for minimizing an objective function that is written asa sum of differentiable functions. SGD has been researched inthe past, but recently it has been proven that SGD shows highclassification ratio when 105 training samples and 105 featuresare trained [16]. Therefore, this algorithm is often used toclassify the natural languages and recognition of characters.SGD has plenty of parameters (loss regularization, alpha,shuffle, verbose etc.) to elaborately control the decision point.In this paper, we select the loss regularization for perceptronwhich is a source of neural network. Perceptron is a basicprocessing element. It has inputs that may come from theenvironment or may be driven by other perceptrons [18].Perceptron is a type of linear classifier. It predicts based on alinear predictor function combining a set of weights with thefeature vector. Curved model is already adopted in SVC, thuswe tried to use linear model of decision point. The alpha valueis set to 0.0001 and regularization set to l2 as a normal.
IV. ALGORITHM PERFORMANCE RESULT
In this section, the algorithm performance is evaluated intwo cases. One is false-negative and the other is false-positive.Fig. 3 represents the false-negative rate of each algorithm.False-negative refers to the error when a benign applicationis classified as malicious. 23,950 samples (950 for benignand 23,000 for malware) trained CART classifier shows about2.58% error. The false-negative rate continually decreases asnumber of trained samples increases. When 215,550 samplewhich is 90% of total sample was trained, it showed 0.2%of error rate which is the lowest. In this case, CART classifierincorrectly predicted 20 files from overall 9,790. This classifieroutperformed 13 times in prediction comparing to 23,950sample trained classifier. On the other hand, SVC algorithmperforms 40.36% false-negative rate when 23,950 samplesare adapted. The error rate of SVC also keeps decreasingas training sample are increasing. But still it shows higherror rate compare to CART algorithm. For SGD, it shows80% of error value, but it drops most significantly amongthe three algorithms. Nevertheless, SVC and SGD show higherror rate comparing to CART algorithm. CART algorithmis outperformed approximately 14 times than SVC and is 60times more efficient than SGD algorithm.
The false-positive rate of each algorithm is shown in Fig.4. False-positive is when the malicious is predicted as abenign. CART error rate is decreasing steadily by increasingthe number of training sample. The highest error rate is shownto be 0.086% when the trained sample is 23,950, and the lowesterror rate is 0.0034% when the 215,550 training samples used.Just 8 files were misclassified among the 236,707 malwaresamples. The false-positive rate of 215,550 sample trainedCART classifier is improved about 25 times comparing to the23,950 sample trained CART classifier. On the other hand,even from the beginning, the SVC algorithm shows errorrate of 0.0097%. Only 23 files were misclassified among236,707 malware samples. As the number of training samplesincreased, only 2 files were misclassified from the overallmalware samples. For SGD algorithm, the lowest error rateis 0.8154%. The value seems to be acceptable enough, but
compared to other algorithm, this value is 1,020 times higherthan SVC algorithm.
Figure 3. False-negative rate
Figure 4. False-positive rate
Both false-negative and false-positive rate of CART showsprediction accuracy over the 99%. Especially when 90% ofsamples are trained, the false-negative prediction accuracy is99.8% and the false-positive prediction accuracy is 99.99%.Result of SVC false-negative rate is notable. It presents97.23% of prediction accuracy. However, CART is moreappropriate for predicting the benign executable. NeverthelessSVC algorithm is more efficient when detecting the maliciousexecutable. The accuracy of SVC for predicting the maliciousexecutable represents 99.9992%. CART error rate is 0.0034%.
17Copyright (c) IARIA, 2016. ISBN: 978-1-61208-516-6
INTERNET 2016 : The Eighth International Conference on Evolving Internet
26 / 63
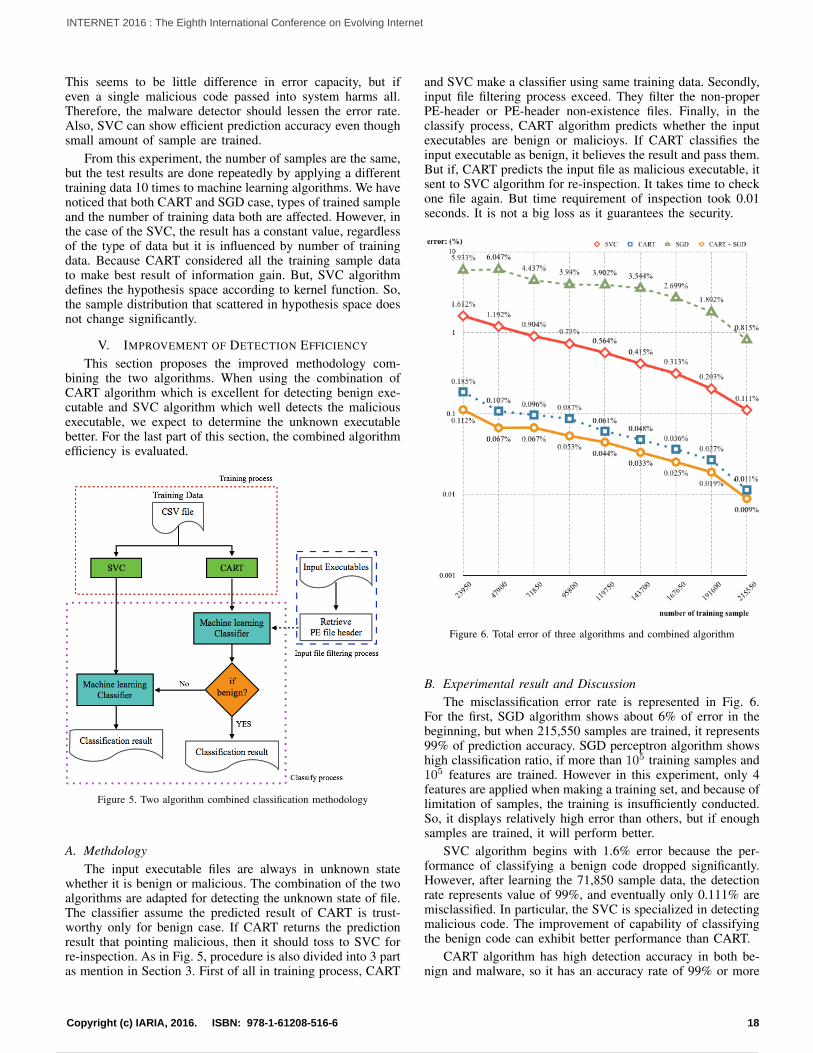
This seems to be little difference in error capacity, but ifeven a single malicious code passed into system harms all.Therefore, the malware detector should lessen the error rate.Also, SVC can show efficient prediction accuracy even thoughsmall amount of sample are trained.
From this experiment, the number of samples are the same,but the test results are done repeatedly by applying a differenttraining data 10 times to machine learning algorithms. We havenoticed that both CART and SGD case, types of trained sampleand the number of training data both are affected. However, inthe case of the SVC, the result has a constant value, regardlessof the type of data but it is influenced by number of trainingdata. Because CART considered all the training sample datato make best result of information gain. But, SVC algorithmdefines the hypothesis space according to kernel function. So,the sample distribution that scattered in hypothesis space doesnot change significantly.
V. IMPROVEMENT OF DETECTION EFFICIENCY
This section proposes the improved methodology com-bining the two algorithms. When using the combination ofCART algorithm which is excellent for detecting benign exe-cutable and SVC algorithm which well detects the maliciousexecutable, we expect to determine the unknown executablebetter. For the last part of this section, the combined algorithmefficiency is evaluated.
Figure 5. Two algorithm combined classification methodology
A. MethdologyThe input executable files are always in unknown state
whether it is benign or malicious. The combination of the twoalgorithms are adapted for detecting the unknown state of file.The classifier assume the predicted result of CART is trust-worthy only for benign case. If CART returns the predictionresult that pointing malicious, then it should toss to SVC forre-inspection. As in Fig. 5, procedure is also divided into 3 partas mention in Section 3. First of all in training process, CART
and SVC make a classifier using same training data. Secondly,input file filtering process exceed. They filter the non-properPE-header or PE-header non-existence files. Finally, in theclassify process, CART algorithm predicts whether the inputexecutables are benign or malicioys. If CART classifies theinput executable as benign, it believes the result and pass them.But if, CART predicts the input file as malicious executable, itsent to SVC algorithm for re-inspection. It takes time to checkone file again. But time requirement of inspection took 0.01seconds. It is not a big loss as it guarantees the security.
Figure 6. Total error of three algorithms and combined algorithm
B. Experimental result and DiscussionThe misclassification error rate is represented in Fig. 6.
For the first, SGD algorithm shows about 6% of error in thebeginning, but when 215,550 samples are trained, it represents99% of prediction accuracy. SGD perceptron algorithm showshigh classification ratio, if more than 105 training samples and105 features are trained. However in this experiment, only 4features are applied when making a training set, and because oflimitation of samples, the training is insufficiently conducted.So, it displays relatively high error than others, but if enoughsamples are trained, it will perform better.
SVC algorithm begins with 1.6% error because the per-formance of classifying a benign code dropped significantly.However, after learning the 71,850 sample data, the detectionrate represents value of 99%, and eventually only 0.111% aremisclassified. In particular, the SVC is specialized in detectingmalicious code. The improvement of capability of classifyingthe benign code can exhibit better performance than CART.
CART algorithm has high detection accuracy in both be-nign and malware, so it has an accuracy rate of 99% or more
18Copyright (c) IARIA, 2016. ISBN: 978-1-61208-516-6
INTERNET 2016 : The Eighth International Conference on Evolving Internet
27 / 63
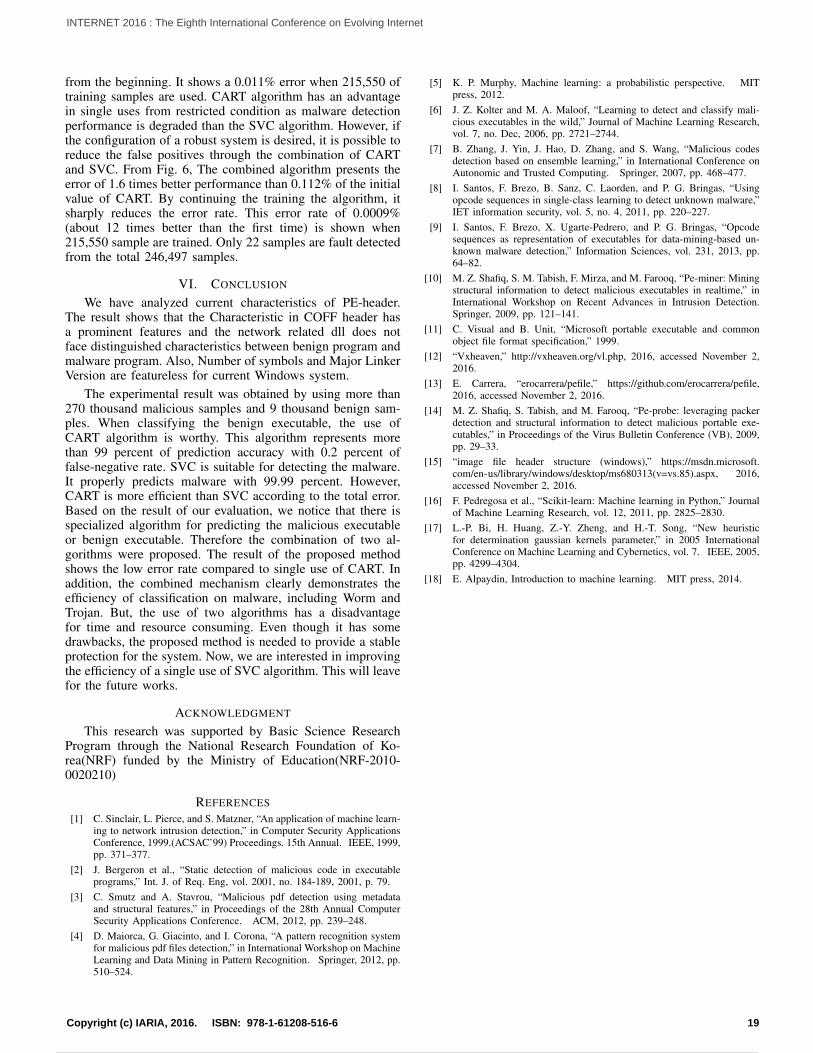
from the beginning. It shows a 0.011% error when 215,550 oftraining samples are used. CART algorithm has an advantagein single uses from restricted condition as malware detectionperformance is degraded than the SVC algorithm. However, ifthe configuration of a robust system is desired, it is possible toreduce the false positives through the combination of CARTand SVC. From Fig. 6, The combined algorithm presents theerror of 1.6 times better performance than 0.112% of the initialvalue of CART. By continuing the training the algorithm, itsharply reduces the error rate. This error rate of 0.0009%(about 12 times better than the first time) is shown when215,550 sample are trained. Only 22 samples are fault detectedfrom the total 246,497 samples.
VI. CONCLUSION
We have analyzed current characteristics of PE-header.The result shows that the Characteristic in COFF header hasa prominent features and the network related dll does notface distinguished characteristics between benign program andmalware program. Also, Number of symbols and Major LinkerVersion are featureless for current Windows system.
The experimental result was obtained by using more than270 thousand malicious samples and 9 thousand benign sam-ples. When classifying the benign executable, the use ofCART algorithm is worthy. This algorithm represents morethan 99 percent of prediction accuracy with 0.2 percent offalse-negative rate. SVC is suitable for detecting the malware.It properly predicts malware with 99.99 percent. However,CART is more efficient than SVC according to the total error.Based on the result of our evaluation, we notice that there isspecialized algorithm for predicting the malicious executableor benign executable. Therefore the combination of two al-gorithms were proposed. The result of the proposed methodshows the low error rate compared to single use of CART. Inaddition, the combined mechanism clearly demonstrates theefficiency of classification on malware, including Worm andTrojan. But, the use of two algorithms has a disadvantagefor time and resource consuming. Even though it has somedrawbacks, the proposed method is needed to provide a stableprotection for the system. Now, we are interested in improvingthe efficiency of a single use of SVC algorithm. This will leavefor the future works.
ACKNOWLEDGMENT
This research was supported by Basic Science ResearchProgram through the National Research Foundation of Ko-rea(NRF) funded by the Ministry of Education(NRF-2010-0020210)
REFERENCES[1] C. Sinclair, L. Pierce, and S. Matzner, “An application of machine learn-
ing to network intrusion detection,” in Computer Security ApplicationsConference, 1999.(ACSAC’99) Proceedings. 15th Annual. IEEE, 1999,pp. 371–377.
[2] J. Bergeron et al., “Static detection of malicious code in executableprograms,” Int. J. of Req. Eng, vol. 2001, no. 184-189, 2001, p. 79.
[3] C. Smutz and A. Stavrou, “Malicious pdf detection using metadataand structural features,” in Proceedings of the 28th Annual ComputerSecurity Applications Conference. ACM, 2012, pp. 239–248.
[4] D. Maiorca, G. Giacinto, and I. Corona, “A pattern recognition systemfor malicious pdf files detection,” in International Workshop on MachineLearning and Data Mining in Pattern Recognition. Springer, 2012, pp.510–524.
[5] K. P. Murphy, Machine learning: a probabilistic perspective. MITpress, 2012.
[6] J. Z. Kolter and M. A. Maloof, “Learning to detect and classify mali-cious executables in the wild,” Journal of Machine Learning Research,vol. 7, no. Dec, 2006, pp. 2721–2744.
[7] B. Zhang, J. Yin, J. Hao, D. Zhang, and S. Wang, “Malicious codesdetection based on ensemble learning,” in International Conference onAutonomic and Trusted Computing. Springer, 2007, pp. 468–477.
[8] I. Santos, F. Brezo, B. Sanz, C. Laorden, and P. G. Bringas, “Usingopcode sequences in single-class learning to detect unknown malware,”IET information security, vol. 5, no. 4, 2011, pp. 220–227.
[9] I. Santos, F. Brezo, X. Ugarte-Pedrero, and P. G. Bringas, “Opcodesequences as representation of executables for data-mining-based un-known malware detection,” Information Sciences, vol. 231, 2013, pp.64–82.
[10] M. Z. Shafiq, S. M. Tabish, F. Mirza, and M. Farooq, “Pe-miner: Miningstructural information to detect malicious executables in realtime,” inInternational Workshop on Recent Advances in Intrusion Detection.Springer, 2009, pp. 121–141.
[11] C. Visual and B. Unit, “Microsoft portable executable and commonobject file format specification,” 1999.
[12] “Vxheaven,” http://vxheaven.org/vl.php, 2016, accessed November 2,2016.
[13] E. Carrera, “erocarrera/pefile,” https://github.com/erocarrera/pefile,2016, accessed November 2, 2016.
[14] M. Z. Shafiq, S. Tabish, and M. Farooq, “Pe-probe: leveraging packerdetection and structural information to detect malicious portable exe-cutables,” in Proceedings of the Virus Bulletin Conference (VB), 2009,pp. 29–33.
[15] “image file header structure (windows),” https://msdn.microsoft.com/en-us/library/windows/desktop/ms680313(v=vs.85).aspx, 2016,accessed November 2, 2016.
[16] F. Pedregosa et al., “Scikit-learn: Machine learning in Python,” Journalof Machine Learning Research, vol. 12, 2011, pp. 2825–2830.
[17] L.-P. Bi, H. Huang, Z.-Y. Zheng, and H.-T. Song, “New heuristicfor determination gaussian kernels parameter,” in 2005 InternationalConference on Machine Learning and Cybernetics, vol. 7. IEEE, 2005,pp. 4299–4304.
[18] E. Alpaydin, Introduction to machine learning. MIT press, 2014.
19Copyright (c) IARIA, 2016. ISBN: 978-1-61208-516-6
INTERNET 2016 : The Eighth International Conference on Evolving Internet
28 / 63
Practical Approaches to the DRDoS Attack Detection based on Netflow Analysis
Jungtae Kim/Ik-Kyun Kim Information Security Research Department
Electronics and Telecommunications Research Institute Daejeon, South Korea
email: jungtae_kim/[email protected]
Koohong Kang Dept. of Information and Communications Eng.
Seowon University Cheongju, South Korea
email: [email protected]
Abstract—The paper proposes a practical method of detecting the Distributed Reflection Denial-of-Service Attack (DRDoS) in the Internet with the policy based routing and load balancing applied. To do so, the detection algorithm is provided separately accordingly to the underlying network infrastructure such as routing symmetry or asymmetry. Finally, it provides a practical way of detecting the reflection attacker, which connects the reflectors to command or trigger the IP Spoofed DNS (Domain Name Service)/NTP (Network Time Protocol) requests, by analyzing the connection information available on the Netflow enabled Routers.
Keywords—DDoS; Reflection DoS; Netflow; Connection Traceback.
I. INTRODUCTION The Distributed Denial-of-Service (DDoS) attack prevents the availability of a target system from normal user access by consuming computing resources including CPU, memory and network bandwidth that are necessary for network applications. Recent DDoS attack evolved with a series of intelligent attacks rather than a simple large scale traffic volume based attack types. The attack trends are especially targeting the enterprise servers or user applications with a subtle changes of packet header and consequently, spoofing the source IP address to hide identity and distributed reflectors to increase complexity for detection. The DDoS attack, which triggers a high volume of traffics into the network backbone devices, is classified as three attack types; Volumetric, TCP State Exhaustion, and Application Layer. [1]. Firstly, the Volumetric Attacks mainly trigger a congestion to a target network or service by generating volumes of traffic which bottleneck the bandwidth of the Internet. Secondly, the TCP State Exhaustion Attacks disables the connection state table, which is designed to manage the connections or session states, of the load balancers, firewalls and application servers. Lastly, the Application Layer Attacks targets a particular layer 7 application services with less traffic volumes; consequently, it is hard to predict or release the attacks patterns such as the HTTP Get Flooding attacks. Recently, the Distributed Reflection Denial-of-Service (DRDoS) attacks are major issues of the Internet and other service operators. A hacker controls several zombie PCs with a spoofed IP address and delivers Domain Name Service (DNS) or Network Time Protocol (NTP) requests to the distributed reflectors by changing the request source IP to a target victim PC’s address. Consequently, the reflectors forward the amplified numbers of reply to a target victim PC, which
consumes both bandwidth and CPU usages of the target. In other words, such amplification attack generates more reply traffic than requests by utilizing the reflectors and also security weakness of the NTP or DNS servers. As the number of incidents involving such an amplification attack increases with NTP, DNS, and other UDP based protocols are vulnerable to the attacks, the ISP network suffers with a huge volumes of attack traffics. Although there were researches and practices conducted to prevent the victims from the DRDoS attack, there are no defense measures to detect and prevent the attack [4]. The difficulty of identifying the DRDoS attack is mainly due to the fact that activities of reflectors are not easy to identify whether it is normal or abnormal. To overcome the complexity of identifying the reflectors and DRDoS attacks, the paper reviews a basic context on the DRDoS attack in Section II. A proposal of a practical architecture to detect the attack by managing the netflow information in Section III. Details of the practical approach to identify the reflector at the ISP network with the proposed algorithm is explained in Section IV and also provides a flow based traceback method to identify an actual attacker or C&C those who control the reflectors even though their IP addresses are spoofed. Finally, the Section V introduces an implementation and evaluation on the experimental testbed settings with the conclusion in Section VI.
II. BACKGROUNDS This section describes a basic information about the
DRDoS attack and the conventional defense measures on the DNS Reflection Attacks.
A. Distributed Refection Denial of Service In the year 2013 and 2014, the DDoS attack with DNS
amplification had a maximum of 34.9% of the total DDoS attack traffic and 18.6% of the overall DDoS attack in the network. [2]. For the case of the attack on the Spamhaus in 2013, the DNS amplification attacks triggered a 300 Gbps traffics and the OpenDNS Security Lab reported that more than 5,000 different types of the amplification attacks are progressing at every hour in 2014 [3][4]. The Fig. 1 describes a simple amplification attack based on the DNS protocol that attackers normally send a spoofed DNS request to the open resolver (reflectors) which generates a large reply, such as 3876 bytes, to a target victim by using the ANY record type to produce maximum amplifications of the reply volumes.
20Copyright (c) IARIA, 2016. ISBN: 978-1-61208-516-6
INTERNET 2016 : The Eighth International Conference on Evolving Internet
29 / 63
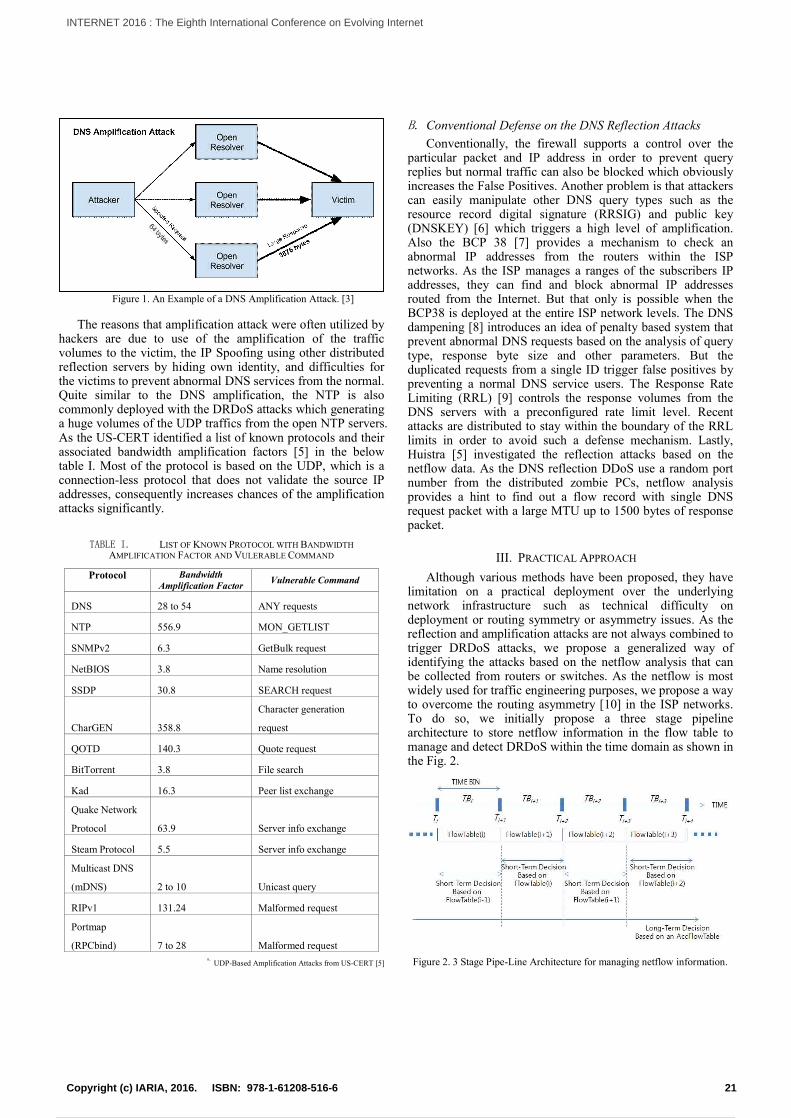
Figure 1. An Example of a DNS Amplification Attack. [3]
The reasons that amplification attack were often utilized by hackers are due to use of the amplification of the traffic volumes to the victim, the IP Spoofing using other distributed reflection servers by hiding own identity, and difficulties for the victims to prevent abnormal DNS services from the normal. Quite similar to the DNS amplification, the NTP is also commonly deployed with the DRDoS attacks which generating a huge volumes of the UDP traffics from the open NTP servers. As the US-CERT identified a list of known protocols and their associated bandwidth amplification factors [5] in the below table I. Most of the protocol is based on the UDP, which is a connection-less protocol that does not validate the source IP addresses, consequently increases chances of the amplification attacks significantly.
TABLE I. LIST OF KNOWN PROTOCOL WITH BANDWIDTH AMPLIFICATION FACTOR AND VULERABLE COMMAND
Protocol Bandwidth Amplification Factor Vulnerable Command
DNS 28 to 54 ANY requests
NTP 556.9 MON_GETLIST
SNMPv2 6.3 GetBulk request
NetBIOS 3.8 Name resolution
SSDP 30.8 SEARCH request
CharGEN 358.8
Character generation
request
QOTD 140.3 Quote request
BitTorrent 3.8 File search
Kad 16.3 Peer list exchange
Quake Network
Protocol 63.9 Server info exchange
Steam Protocol 5.5 Server info exchange
Multicast DNS
(mDNS) 2 to 10 Unicast query
RIPv1 131.24 Malformed request
Portmap
(RPCbind) 7 to 28 Malformed request a. UDP-Based Amplification Attacks from US-CERT [5]
B. Conventional Defense on the DNS Reflection Attacks Conventionally, the firewall supports a control over the
particular packet and IP address in order to prevent query replies but normal traffic can also be blocked which obviously increases the False Positives. Another problem is that attackers can easily manipulate other DNS query types such as the resource record digital signature (RRSIG) and public key (DNSKEY) [6] which triggers a high level of amplification. Also the BCP 38 [7] provides a mechanism to check an abnormal IP addresses from the routers within the ISP networks. As the ISP manages a ranges of the subscribers IP addresses, they can find and block abnormal IP addresses routed from the Internet. But that only is possible when the BCP38 is deployed at the entire ISP network levels. The DNS dampening [8] introduces an idea of penalty based system that prevent abnormal DNS requests based on the analysis of query type, response byte size and other parameters. But the duplicated requests from a single ID trigger false positives by preventing a normal DNS service users. The Response Rate Limiting (RRL) [9] controls the response volumes from the DNS servers with a preconfigured rate limit level. Recent attacks are distributed to stay within the boundary of the RRL limits in order to avoid such a defense mechanism. Lastly, Huistra [5] investigated the reflection attacks based on the netflow data. As the DNS reflection DDoS use a random port number from the distributed zombie PCs, netflow analysis provides a hint to find out a flow record with single DNS request packet with a large MTU up to 1500 bytes of response packet.
III. PRACTICAL APPROACH Although various methods have been proposed, they have
limitation on a practical deployment over the underlying network infrastructure such as technical difficulty on deployment or routing symmetry or asymmetry issues. As the reflection and amplification attacks are not always combined to trigger DRDoS attacks, we propose a generalized way of identifying the attacks based on the netflow analysis that can be collected from routers or switches. As the netflow is most widely used for traffic engineering purposes, we propose a way to overcome the routing asymmetry [10] in the ISP networks. To do so, we initially propose a three stage pipeline architecture to store netflow information in the flow table to manage and detect DRDoS within the time domain as shown in the Fig. 2.
Figure 2. 3 Stage Pipe-Line Architecture for managing netflow information.
21Copyright (c) IARIA, 2016. ISBN: 978-1-61208-516-6
INTERNET 2016 : The Eighth International Conference on Evolving Internet
30 / 63
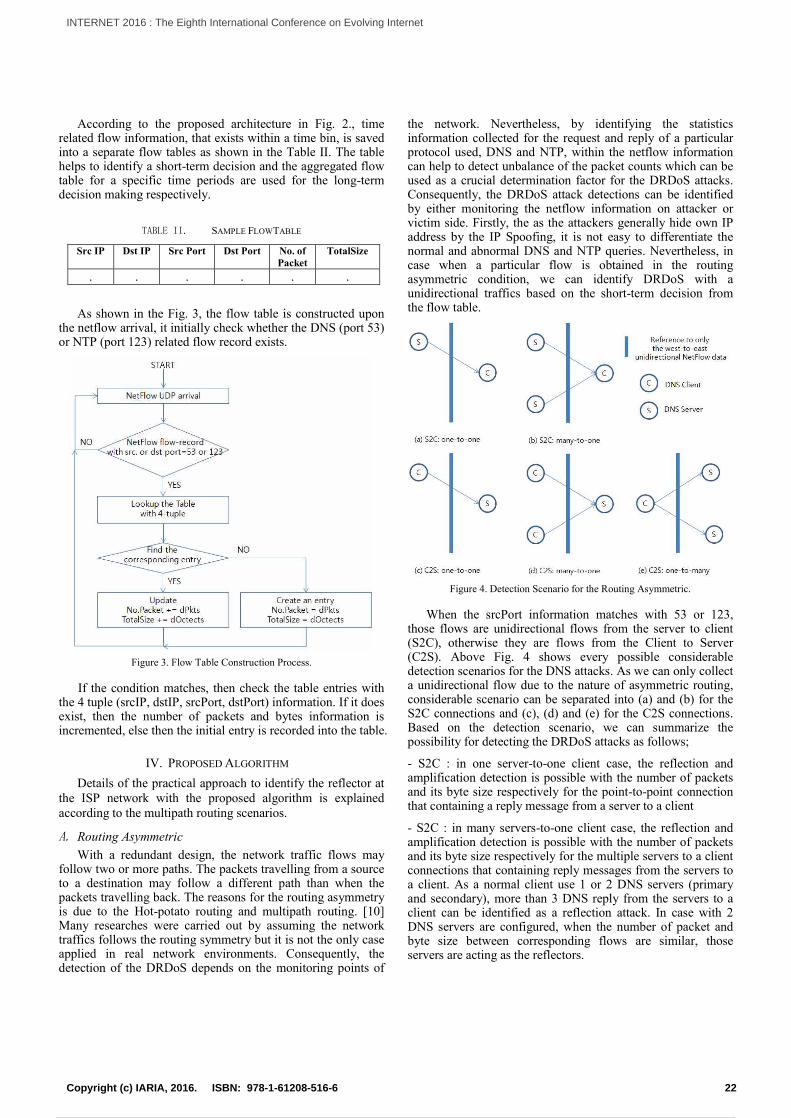
According to the proposed architecture in Fig. 2., time related flow information, that exists within a time bin, is saved into a separate flow tables as shown in the Table II. The table helps to identify a short-term decision and the aggregated flow table for a specific time periods are used for the long-term decision making respectively.
TABLE II. SAMPLE FLOWTABLE
Src IP Dst IP Src Port Dst Port No. ofPacket
TotalSize
. . . . . .
As shown in the Fig. 3, the flow table is constructed upon the netflow arrival, it initially check whether the DNS (port 53) or NTP (port 123) related flow record exists.
Figure 3. Flow Table Construction Process.
If the condition matches, then check the table entries with the 4 tuple (srcIP, dstIP, srcPort, dstPort) information. If it does exist, then the number of packets and bytes information is incremented, else then the initial entry is recorded into the table.
IV. PROPOSED ALGORITHM Details of the practical approach to identify the reflector at
the ISP network with the proposed algorithm is explained according to the multipath routing scenarios.
A. Routing Asymmetric With a redundant design, the network traffic flows may
follow two or more paths. The packets travelling from a source to a destination may follow a different path than when the packets travelling back. The reasons for the routing asymmetry is due to the Hot-potato routing and multipath routing. [10] Many researches were carried out by assuming the network traffics follows the routing symmetry but it is not the only case applied in real network environments. Consequently, the detection of the DRDoS depends on the monitoring points of
the network. Nevertheless, by identifying the statistics information collected for the request and reply of a particular protocol used, DNS and NTP, within the netflow information can help to detect unbalance of the packet counts which can be used as a crucial determination factor for the DRDoS attacks. Consequently, the DRDoS attack detections can be identified by either monitoring the netflow information on attacker or victim side. Firstly, the as the attackers generally hide own IP address by the IP Spoofing, it is not easy to differentiate the normal and abnormal DNS and NTP queries. Nevertheless, in case when a particular flow is obtained in the routing asymmetric condition, we can identify DRDoS with a unidirectional traffics based on the short-term decision from the flow table.
Figure 4. Detection Scenario for the Routing Asymmetric.
When the srcPort information matches with 53 or 123, those flows are unidirectional flows from the server to client (S2C), otherwise they are flows from the Client to Server (C2S). Above Fig. 4 shows every possible considerable detection scenarios for the DNS attacks. As we can only collect a unidirectional flow due to the nature of asymmetric routing, considerable scenario can be separated into (a) and (b) for the S2C connections and (c), (d) and (e) for the C2S connections. Based on the detection scenario, we can summarize the possibility for detecting the DRDoS attacks as follows;
- S2C : in one server-to-one client case, the reflection and amplification detection is possible with the number of packets and its byte size respectively for the point-to-point connection that containing a reply message from a server to a client
- S2C : in many servers-to-one client case, the reflection and amplification detection is possible with the number of packets and its byte size respectively for the multiple servers to a client connections that containing reply messages from the servers to a client. As a normal client use 1 or 2 DNS servers (primary and secondary), more than 3 DNS reply from the servers to a client can be identified as a reflection attack. In case with 2 DNS servers are configured, when the number of packet and byte size between corresponding flows are similar, those servers are acting as the reflectors.
22Copyright (c) IARIA, 2016. ISBN: 978-1-61208-516-6
INTERNET 2016 : The Eighth International Conference on Evolving Internet
31 / 63
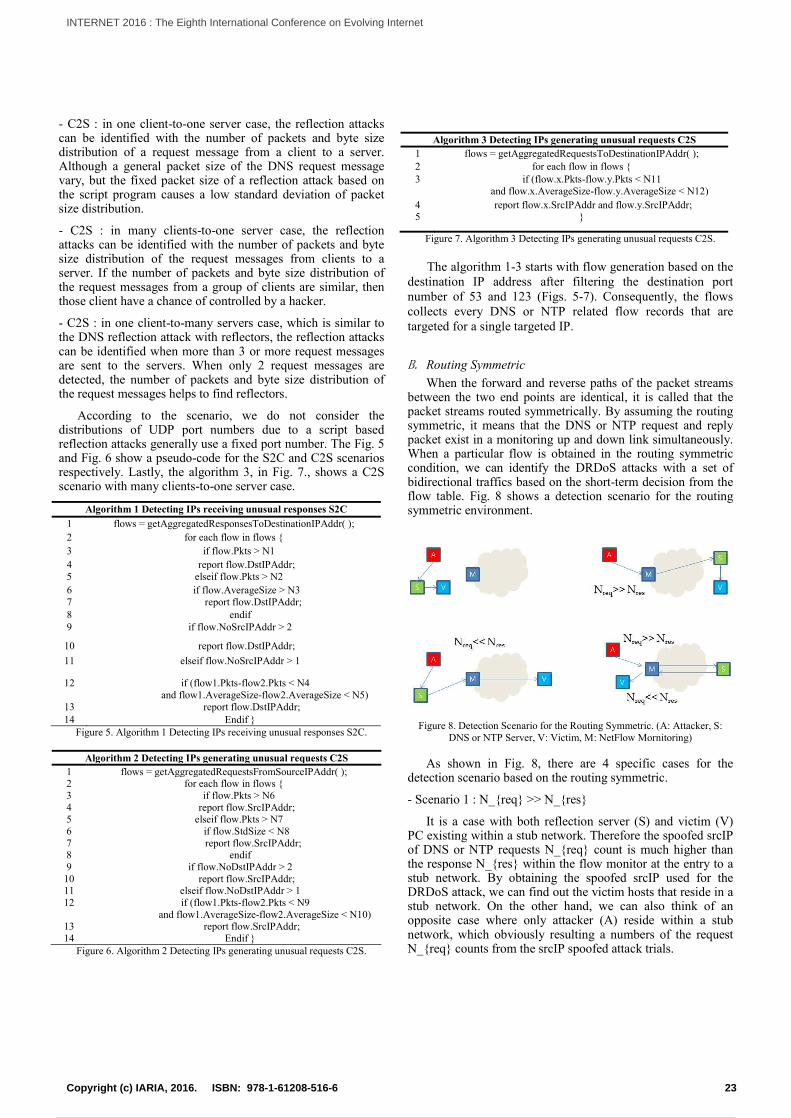
- C2S : in one client-to-one server case, the reflection attacks can be identified with the number of packets and byte size distribution of a request message from a client to a server. Although a general packet size of the DNS request message vary, but the fixed packet size of a reflection attack based on the script program causes a low standard deviation of packet size distribution.
- C2S : in many clients-to-one server case, the reflection attacks can be identified with the number of packets and byte size distribution of the request messages from clients to a server. If the number of packets and byte size distribution of the request messages from a group of clients are similar, then those client have a chance of controlled by a hacker.
- C2S : in one client-to-many servers case, which is similar to the DNS reflection attack with reflectors, the reflection attacks can be identified when more than 3 or more request messages are sent to the servers. When only 2 request messages are detected, the number of packets and byte size distribution of the request messages helps to find reflectors.
According to the scenario, we do not consider the distributions of UDP port numbers due to a script based reflection attacks generally use a fixed port number. The Fig. 5 and Fig. 6 show a pseudo-code for the S2C and C2S scenarios respectively. Lastly, the algorithm 3, in Fig. 7., shows a C2S scenario with many clients-to-one server case.
Algorithm 1 Detecting IPs receiving unusual responses S2C 1 flows = getAggregatedResponsesToDestinationIPAddr( ); 2 for each flow in flows { 3 if flow.Pkts > N1 4 report flow.DstIPAddr; 5 elseif flow.Pkts > N2 6 if flow.AverageSize > N3 7 report flow.DstIPAddr; 8 endif 9 if flow.NoSrcIPAddr > 2
10 report flow.DstIPAddr; 11 elseif flow.NoSrcIPAddr > 1
12 if (flow1.Pkts-flow2.Pkts < N4 and flow1.AverageSize-flow2.AverageSize < N5)
13 report flow.DstIPAddr; 14 Endif }
Figure 5. Algorithm 1 Detecting IPs receiving unusual responses S2C.
Algorithm 2 Detecting IPs generating unusual requests C2S 1 flows = getAggregatedRequestsFromSourceIPAddr( ); 2 for each flow in flows { 3 if flow.Pkts > N6 4 report flow.SrcIPAddr; 5 elseif flow.Pkts > N7 6 if flow.StdSize < N8 7 report flow.SrcIPAddr; 8 endif 9 if flow.NoDstIPAddr > 2
10 report flow.SrcIPAddr; 11 elseif flow.NoDstIPAddr > 1 12 if (flow1.Pkts-flow2.Pkts < N9
and flow1.AverageSize-flow2.AverageSize < N10) 13 report flow.SrcIPAddr; 14 Endif }
Figure 6. Algorithm 2 Detecting IPs generating unusual requests C2S.
Algorithm 3 Detecting IPs generating unusual requests C2S
1 flows = getAggregatedRequestsToDestinationIPAddr( ); 2 for each flow in flows { 3 if (flow.x.Pkts-flow.y.Pkts < N11
and flow.x.AverageSize-flow.y.AverageSize < N12) 4 report flow.x.SrcIPAddr and flow.y.SrcIPAddr; 5 }
Figure 7. Algorithm 3 Detecting IPs generating unusual requests C2S. The algorithm 1-3 starts with flow generation based on the
destination IP address after filtering the destination port number of 53 and 123 (Figs. 5-7). Consequently, the flows collects every DNS or NTP related flow records that are targeted for a single targeted IP.
B. Routing Symmetric When the forward and reverse paths of the packet streams
between the two end points are identical, it is called that the packet streams routed symmetrically. By assuming the routing symmetric, it means that the DNS or NTP request and reply packet exist in a monitoring up and down link simultaneously. When a particular flow is obtained in the routing symmetric condition, we can identify the DRDoS attacks with a set of bidirectional traffics based on the short-term decision from the flow table. Fig. 8 shows a detection scenario for the routing symmetric environment.
Figure 8. Detection Scenario for the Routing Symmetric. (A: Attacker, S: DNS or NTP Server, V: Victim, M: NetFlow Mornitoring)
As shown in Fig. 8, there are 4 specific cases for the detection scenario based on the routing symmetric.
- Scenario 1 : N_{req} >> N_{res}
It is a case with both reflection server (S) and victim (V) PC existing within a stub network. Therefore the spoofed srcIP of DNS or NTP requests N_{req} count is much higher than the response N_{res} within the flow monitor at the entry to a stub network. By obtaining the spoofed srcIP used for the DRDoS attack, we can find out the victim hosts that reside in a stub network. On the other hand, we can also think of an opposite case where only attacker (A) reside within a stub network, which obviously resulting a numbers of the request N_{req} counts from the srcIP spoofed attack trials.
23Copyright (c) IARIA, 2016. ISBN: 978-1-61208-516-6
INTERNET 2016 : The Eighth International Conference on Evolving Internet
32 / 63
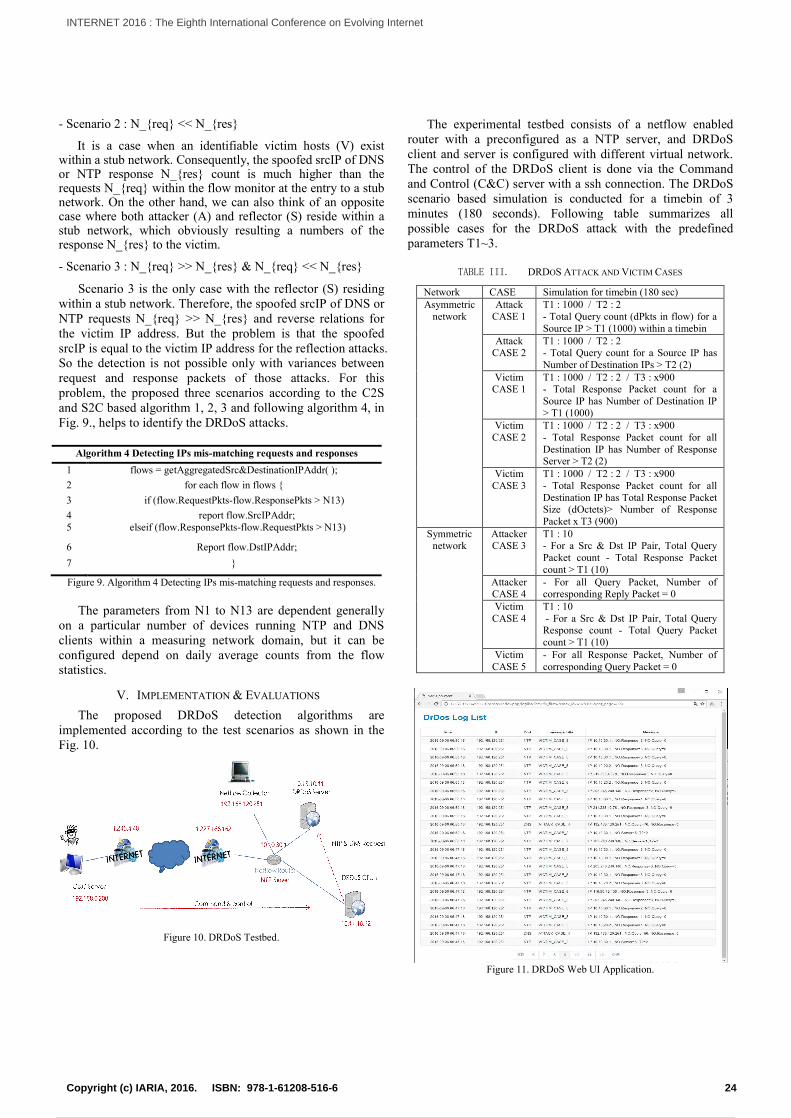
- Scenario 2 : N_{req} << N_{res}
It is a case when an identifiable victim hosts (V) exist within a stub network. Consequently, the spoofed srcIP of DNS or NTP response N_{res} count is much higher than the requests N_{req} within the flow monitor at the entry to a stub network. On the other hand, we can also think of an opposite case where both attacker (A) and reflector (S) reside within a stub network, which obviously resulting a numbers of the response N_{res} to the victim.
- Scenario 3 : N_{req} >> N_{res} & N_{req} << N_{res}
Scenario 3 is the only case with the reflector (S) residing within a stub network. Therefore, the spoofed srcIP of DNS or NTP requests N_{req} >> N_{res} and reverse relations for the victim IP address. But the problem is that the spoofed srcIP is equal to the victim IP address for the reflection attacks. So the detection is not possible only with variances between request and response packets of those attacks. For this problem, the proposed three scenarios according to the C2S and S2C based algorithm 1, 2, 3 and following algorithm 4, in Fig. 9., helps to identify the DRDoS attacks.
Algorithm 4 Detecting IPs mis-matching requests and responses 1 flows = getAggregatedSrc&DestinationIPAddr( ); 2 for each flow in flows { 3 if (flow.RequestPkts-flow.ResponsePkts > N13) 4 report flow.SrcIPAddr; 5 elseif (flow.ResponsePkts-flow.RequestPkts > N13)
6 Report flow.DstIPAddr; 7 }
Figure 9. Algorithm 4 Detecting IPs mis-matching requests and responses.
The parameters from N1 to N13 are dependent generally on a particular number of devices running NTP and DNS clients within a measuring network domain, but it can be configured depend on daily average counts from the flow statistics.
V. IMPLEMENTATION & EVALUATIONS The proposed DRDoS detection algorithms are
implemented according to the test scenarios as shown in the Fig. 10.
Figure 10. DRDoS Testbed.
The experimental testbed consists of a netflow enabled router with a preconfigured as a NTP server, and DRDoS client and server is configured with different virtual network. The control of the DRDoS client is done via the Command and Control (C&C) server with a ssh connection. The DRDoS scenario based simulation is conducted for a timebin of 3 minutes (180 seconds). Following table summarizes all possible cases for the DRDoS attack with the predefined parameters T1~3.
TABLE III. DRDOS ATTACK AND VICTIM CASES
Network CASE Simulation for timebin (180 sec) Asymmetric
network Attack
CASE 1 T1 : 1000 / T2 : 2 - Total Query count (dPkts in flow) for a Source IP > T1 (1000) within a timebin
Attack CASE 2
T1 : 1000 / T2 : 2 - Total Query count for a Source IP has Number of Destination IPs > T2 (2)
Victim CASE 1
T1 : 1000 / T2 : 2 / T3 : x900 - Total Response Packet count for a Source IP has Number of Destination IP > T1 (1000)
Victim CASE 2
T1 : 1000 / T2 : 2 / T3 : x900 - Total Response Packet count for all Destination IP has Number of Response Server > T2 (2)
Victim CASE 3
T1 : 1000 / T2 : 2 / T3 : x900 - Total Response Packet count for all Destination IP has Total Response Packet Size (dOctets)> Number of Response Packet x T3 (900)
Symmetric network
Attacker CASE 3
T1 : 10 - For a Src & Dst IP Pair, Total Query Packet count - Total Response Packet count > T1 (10)
Attacker CASE 4
- For all Query Packet, Number of corresponding Reply Packet = 0
Victim CASE 4
T1 : 10 - For a Src & Dst IP Pair, Total Query Response count - Total Query Packet count > T1 (10)
Victim CASE 5
- For all Response Packet, Number of corresponding Query Packet = 0
Figure 11. DRDoS Web UI Application.
24Copyright (c) IARIA, 2016. ISBN: 978-1-61208-516-6
INTERNET 2016 : The Eighth International Conference on Evolving Internet
33 / 63
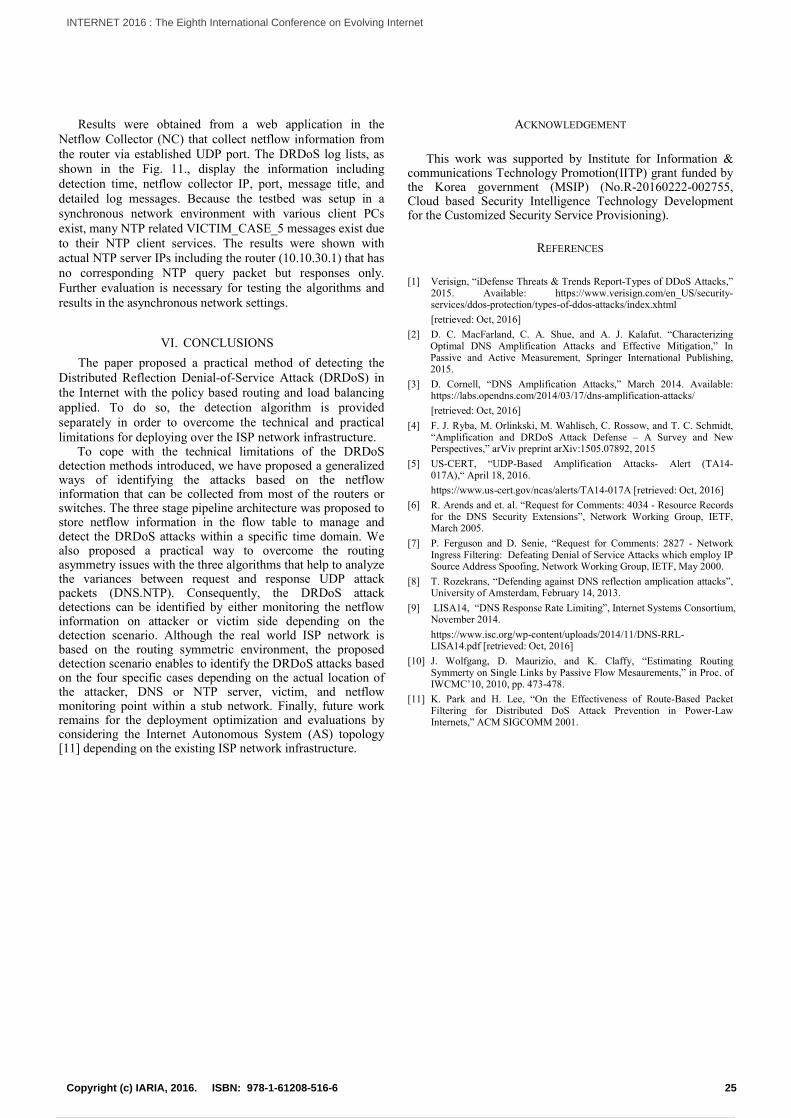
Results were obtained from a web application in the Netflow Collector (NC) that collect netflow information from the router via established UDP port. The DRDoS log lists, as shown in the Fig. 11., display the information including detection time, netflow collector IP, port, message title, and detailed log messages. Because the testbed was setup in a synchronous network environment with various client PCs exist, many NTP related VICTIM_CASE_5 messages exist due to their NTP client services. The results were shown with actual NTP server IPs including the router (10.10.30.1) that has no corresponding NTP query packet but responses only. Further evaluation is necessary for testing the algorithms and results in the asynchronous network settings.
VI. CONCLUSIONS The paper proposed a practical method of detecting the
Distributed Reflection Denial-of-Service Attack (DRDoS) in the Internet with the policy based routing and load balancing applied. To do so, the detection algorithm is provided separately in order to overcome the technical and practical limitations for deploying over the ISP network infrastructure.
To cope with the technical limitations of the DRDoS detection methods introduced, we have proposed a generalized ways of identifying the attacks based on the netflow information that can be collected from most of the routers or switches. The three stage pipeline architecture was proposed to store netflow information in the flow table to manage and detect the DRDoS attacks within a specific time domain. We also proposed a practical way to overcome the routing asymmetry issues with the three algorithms that help to analyze the variances between request and response UDP attack packets (DNS.NTP). Consequently, the DRDoS attack detections can be identified by either monitoring the netflow information on attacker or victim side depending on the detection scenario. Although the real world ISP network is based on the routing symmetric environment, the proposed detection scenario enables to identify the DRDoS attacks based on the four specific cases depending on the actual location of the attacker, DNS or NTP server, victim, and netflow monitoring point within a stub network. Finally, future work remains for the deployment optimization and evaluations by considering the Internet Autonomous System (AS) topology [11] depending on the existing ISP network infrastructure.
ACKNOWLEDGEMENT
This work was supported by Institute for Information & communications Technology Promotion(IITP) grant funded by the Korea government (MSIP) (No.R-20160222-002755, Cloud based Security Intelligence Technology Development for the Customized Security Service Provisioning).
REFERENCES [1] Verisign, “iDefense Threats & Trends Report-Types of DDoS Attacks,”
2015. Available: https://www.verisign.com/en_US/security-services/ddos-protection/types-of-ddos-attacks/index.xhtml [retrieved: Oct, 2016]
[2] D. C. MacFarland, C. A. Shue, and A. J. Kalafut. “Characterizing Optimal DNS Amplification Attacks and Effective Mitigation,” In Passive and Active Measurement, Springer International Publishing, 2015.
[3] D. Cornell, “DNS Amplification Attacks,” March 2014. Available: https://labs.opendns.com/2014/03/17/dns-amplification-attacks/ [retrieved: Oct, 2016]
[4] F. J. Ryba, M. Orlinkski, M. Wahlisch, C. Rossow, and T. C. Schmidt, “Amplification and DRDoS Attack Defense – A Survey and New Perspectives,” arViv preprint arXiv:1505.07892, 2015
[5] US-CERT, “UDP-Based Amplification Attacks- Alert (TA14-017A),“ April 18, 2016. https://www.us-cert.gov/ncas/alerts/TA14-017A [retrieved: Oct, 2016]
[6] R. Arends and et. al. “Request for Comments: 4034 - Resource Records for the DNS Security Extensions”, Network Working Group, IETF, March 2005.
[7] P. Ferguson and D. Senie, “Request for Comments: 2827 - Network Ingress Filtering: Defeating Denial of Service Attacks which employ IP Source Address Spoofing, Network Working Group, IETF, May 2000.
[8] T. Rozekrans, “Defending against DNS reflection amplication attacks”, University of Amsterdam, February 14, 2013.
[9] LISA14, “DNS Response Rate Limiting”, Internet Systems Consortium, November 2014. https://www.isc.org/wp-content/uploads/2014/11/DNS-RRL-LISA14.pdf [retrieved: Oct, 2016]
[10] J. Wolfgang, D. Maurizio, and K. Claffy, “Estimating Routing Symmerty on Single Links by Passive Flow Mesaurements,” in Proc. of IWCMC’10, 2010, pp. 473-478.
[11] K. Park and H. Lee, “On the Effectiveness of Route-Based Packet Filtering for Distributed DoS Attack Prevention in Power-Law Internets,” ACM SIGCOMM 2001.
25Copyright (c) IARIA, 2016. ISBN: 978-1-61208-516-6
INTERNET 2016 : The Eighth International Conference on Evolving Internet
34 / 63
HTTP Get Flooding Detection Technique based on Netflow Information
Youngsoo Kim, Jungtae Kim and Ikkyun Kim Information Security Research Division
Electronics & Telecommunications Research Institute Daejeon, Republic of Korea
e-mail: {blitzkrieg, jungtae_kim, ikkim21}@etri.re.kr
Koohong Kang 2Dept. of Information and Communications Engineering
Seowon University Cheongju, Republic of Korea e-mail: [email protected]
Abstract— A variety of attacks by botnets on a web server has become the most significant threat. One of the DDoS attack, HTTP get flooding attack, is especially difficult to distinguish because HTTP based attack to web server access is similar to the normal accesses of user. In this paper, in order to detect the HTTP get flooding attack, we propose detection technique using netflow information, which can be distinguished from the normal characteristics.
Keywords-HTTP Get Flooding Attack; Netflow; Botnet; Command & Control Server; Flow Pattern; Zombie Host.
I. INTRODUCTION Considering the social turmoil, economic benefits, and
showing off the hackers have targeted, it is the most effective for hackers to attack web server that is most widely used and provides important services these days. HTTP Get flooding attacks are being exploited in the most efficient way among denial-of-service type attacks aimed at these web server application layer [1][2]. HTTP Get flooding attack is to send a large amount of HTTP-GET requests to the target Web server by virus-infected computers or Bot under the control of Command and Control (C&C) server in order to deplete the processing resources so it disables normal user’s requests. Since these attack packets maintain the normal HTTP payload, servers cannot easily distinguish between normal user’s HTTP-GET request messages and their malicious request.
These attacks aimed at the application layer can be divided into three classes as follows: [3]. 1) Request Flooding Attack: each attack session creates a large amount of request rate compared with the normal session; 2) Asymmetric Workload attack: each attack session increases the request rate in the form of increasing the operation workload of the server resource. For example, it increases the ratio of the request that causes the database access. This type of attack can lower request rate than Request Flooding attack so it is more effective for hackers; 3) Request One-Shot attack: it is from Asymmetric workload attack, rather than sending multiple requests, it sends one request causing overload to one session. Thus, these attacks will be able to easily avoid a threshold-based DoS defense system, and also after the session ends, it can continue to give damage to the performance of the server.
As stated above, HTTP-GET flooding attacks use normal HTTP protocol so it is not easy for common Intrusion Detection System (IDS Intrusion Detection System) to detect. Since IDS detects attacks based on the attack signature, it is not easy to detect the HTTP-GET flooding attack. Therefore, it adopts a method of blocking an input request message if it exceeds maximum amount of traffic that the web server can support. However, this simple method has a problem that also blocks the normal traffic. Recently, a variety of detection methods to overcome this problem have been proposed.
The paper reviews various conventional methods suggested for detecting the HTTP Get Flooding Attack in Section II. Details of the proposed detection technique using netflow information with the analysis results are described in III. Finally, the Section IV concludes the paper with future works.
II. THE TRADITIONAL METHODS HTTP / 1.1 sessions support the persistent connection.
Therefore, a client sends and receives requests to a web-cluster without opening a new TCP connection for each request. As a result, one normal HTTP / 1.1 session is composed of a number of requests for the session. Requests can be closed loop type that the client waits for response before it sends the next request, or can be pipelined type that the client does not wait and sends numbers of requests. One page brings one main request for text context and image files included in main page through embedded requests. Main request is typically dynamic so contains a processing, such as database processing but embedded requests are shown as static, simply handle web-cluster processing.
The DNS query and response pattern of the normal user are important information. It can be used to set a reference value for the attack patterns based on these user baseline models. Therefore, in this section, this paper analyzes the traffic characteristics of a normal user.
One client request is processed as follows. 1) If the request is received, reverse proxy server will parse the requested URL and forward the request to a web server according to the load balancing policy. If the request is for static web pages or image files, the server will service the requested page.
26Copyright (c) IARIA, 2016. ISBN: 978-1-61208-516-6
INTERNET 2016 : The Eighth International Conference on Evolving Internet
35 / 63
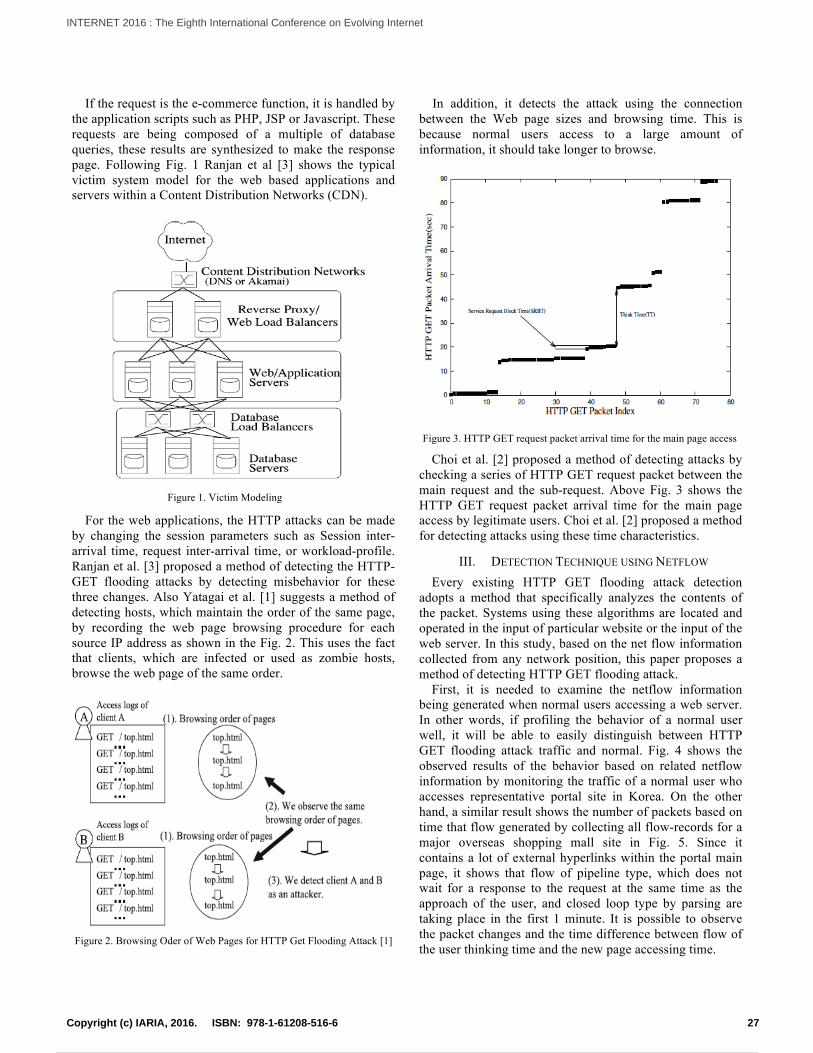
If the request is the e-commerce function, it is handled by the application scripts such as PHP, JSP or Javascript. These requests are being composed of a multiple of database queries, these results are synthesized to make the response page. Following Fig. 1 Ranjan et al [3] shows the typical victim system model for the web based applications and servers within a Content Distribution Networks (CDN).
For the web applications, the HTTP attacks can be made by changing the session parameters such as Session inter-arrival time, request inter-arrival time, or workload-profile. Ranjan et al. [3] proposed a method of detecting the HTTP-GET flooding attacks by detecting misbehavior for these three changes. Also Yatagai et al. [1] suggests a method of detecting hosts, which maintain the order of the same page, by recording the web page browsing procedure for each source IP address as shown in the Fig. 2. This uses the fact that clients, which are infected or used as zombie hosts, browse the web page of the same order.
In addition, it detects the attack using the connection between the Web page sizes and browsing time. This is because normal users access to a large amount of information, it should take longer to browse.
Choi et al. [2] proposed a method of detecting attacks by checking a series of HTTP GET request packet between the main request and the sub-request. Above Fig. 3 shows the HTTP GET request packet arrival time for the main page access by legitimate users. Choi et al. [2] proposed a method for detecting attacks using these time characteristics.
III. DETECTION TECHNIQUE USING NETFLOW Every existing HTTP GET flooding attack detection
adopts a method that specifically analyzes the contents of the packet. Systems using these algorithms are located and operated in the input of particular website or the input of the web server. In this study, based on the net flow information collected from any network position, this paper proposes a method of detecting HTTP GET flooding attack.
First, it is needed to examine the netflow information being generated when normal users accessing a web server. In other words, if profiling the behavior of a normal user well, it will be able to easily distinguish between HTTP GET flooding attack traffic and normal. Fig. 4 shows the observed results of the behavior based on related netflow information by monitoring the traffic of a normal user who accesses representative portal site in Korea. On the other hand, a similar result shows the number of packets based on time that flow generated by collecting all flow-records for a major overseas shopping mall site in Fig. 5. Since it contains a lot of external hyperlinks within the portal main page, it shows that flow of pipeline type, which does not wait for a response to the request at the same time as the approach of the user, and closed loop type by parsing are taking place in the first 1 minute. It is possible to observe the packet changes and the time difference between flow of the user thinking time and the new page accessing time.
Figure 1. Victim Modeling
Figure 3. HTTP GET request packet arrival time for the main page access
Figure 2. Browsing Oder of Web Pages for HTTP Get Flooding Attack [1]
27Copyright (c) IARIA, 2016. ISBN: 978-1-61208-516-6
INTERNET 2016 : The Eighth International Conference on Evolving Internet
36 / 63
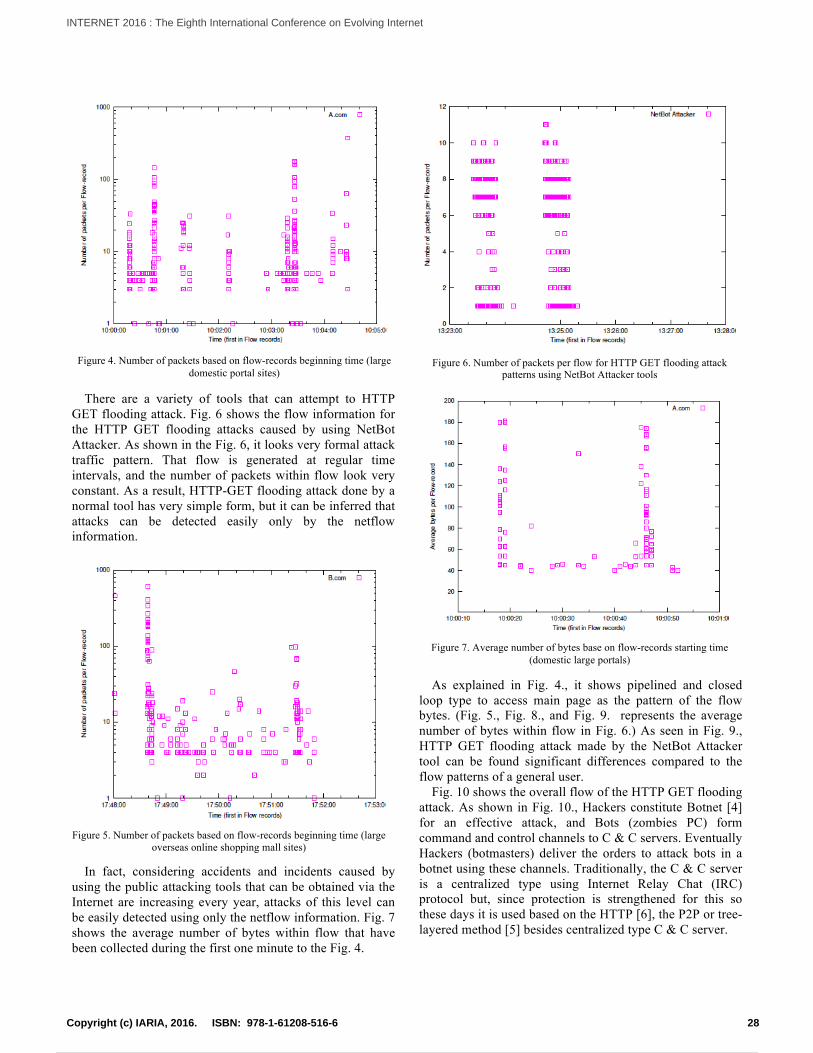
There are a variety of tools that can attempt to HTTP GET flooding attack. Fig. 6 shows the flow information for the HTTP GET flooding attacks caused by using NetBot Attacker. As shown in the Fig. 6, it looks very formal attack traffic pattern. That flow is generated at regular time intervals, and the number of packets within flow look very constant. As a result, HTTP-GET flooding attack done by a normal tool has very simple form, but it can be inferred that attacks can be detected easily only by the netflow information.
In fact, considering accidents and incidents caused by using the public attacking tools that can be obtained via the Internet are increasing every year, attacks of this level can be easily detected using only the netflow information. Fig. 7 shows the average number of bytes within flow that have been collected during the first one minute to the Fig. 4.
As explained in Fig. 4., it shows pipelined and closed loop type to access main page as the pattern of the flow bytes. (Fig. 5., Fig. 8., and Fig. 9. represents the average number of bytes within flow in Fig. 6.) As seen in Fig. 9., HTTP GET flooding attack made by the NetBot Attacker tool can be found significant differences compared to the flow patterns of a general user.
Fig. 10 shows the overall flow of the HTTP GET flooding attack. As shown in Fig. 10., Hackers constitute Botnet [4] for an effective attack, and Bots (zombies PC) form command and control channels to C & C servers. Eventually Hackers (botmasters) deliver the orders to attack bots in a botnet using these channels. Traditionally, the C & C server is a centralized type using Internet Relay Chat (IRC) protocol but, since protection is strengthened for this so these days it is used based on the HTTP [6], the P2P or tree-layered method [5] besides centralized type C & C server.
Figure 4. Number of packets based on flow-records beginning time (large domestic portal sites)
Figure 5. Number of packets based on flow-records beginning time (large overseas online shopping mall sites)
Figure 7. Average number of bytes base on flow-records starting time (domestic large portals)
Figure 6. Number of packets per flow for HTTP GET flooding attack patterns using NetBot Attacker tools
28Copyright (c) IARIA, 2016. ISBN: 978-1-61208-516-6
INTERNET 2016 : The Eighth International Conference on Evolving Internet
37 / 63

This section may remain at the level of detecting the bot (zombie PC), as previously described. Of course, it is also important to detect these bots and block the HTTP GET flooding attack generated by them, but in order to defense more effectively, it is important to detect the C & C server.
That is, after detecting the C & C server and blocking the traffic, eventually botnets will not be able to proceed with the malicious acts longer. Existing methods for detecting the connection channels between bots and C & C servers, they are required to retrieve all of the traffic based on the messages using the corresponding protocol. For example, IRC session is a message, such as PASS, NICK, USER and etc. HTTP protocol is a signature, such as GET, POST, or HEAD. However, in this study, it will be able to extract another bots in corresponding botnet by configuring fingerprint using the netflow information that can be extracted from traffic between detected bot hosts and C&C servers. Also, it can also be applied to the Connection Based Tracking Algorithm, developed to track the botmaster access to the C&C server. These ideas are left for further study.
IV. CONCLUSION AND FUTURE WORK DoS attacks still dominate the ranking of cyber threats. It
is a great challenge to accurately detect. HTTP-GET flooding attacks use normal HTTP protocol so it is not easy for common intrusion detection system to detect. In this paper, we show a method of detecting HTTP GET flooding attack from normal behavior based on the net flow information. And it shows that most attacks can be detected easily only by the net flow information. We will study the method of extracting netflow information between bots and C&C server and find the other bots for future work.
ACKNOWLEDGMENT This work was supported by Institute for Information &
communications Technology Promotion(IITP) grant funded by the Korea government(MSIP) (No.R-20160222-002755, Cloud based Security Intelligence Technology Development for the Customized Security Service Provisioning).
REFERENCES [1] T. Yatagai, T. Isohara, and I. Sasase, “Detection of HTTP-GET flood
Attack Based on Analysis of Page Access Behavior,”, in Proc. of IEEE Pacific Rim Conference on Communications, Computers and Signal Processing, pp.232-335, 2007.
[2] Y. Choi, I. Kim, J. Oh, and J. Jang, “AIGG Threshold Based HTTP GET Flooding Attack Detection,” in Proc. of WISA 2012, pp 270-284, 2012.
[3] S. Ranjan, R. Swaminathan, M. Uysal, A. Nucci, and E. Knightly, “DDoS-Shield: DDoS-Resilient Scheduling to Counter Application Layer Attacks,” IEEE/ACM Trans. On Networking, Vol. 7 No.1, pp.26-39, 2009.
[4] G. Gu, J. Zhang, and W. Lee, “ BotSniffer: Detecting Botnet Command and Control Channels in Network Traffic,”In Proc. of the 15th Annual Network and Distributed System Security Symposium, pp.1-18, 2008.
[5] G. Ollmann, “Botnet Communication Topologies: Understanding the intricacies of botnet Command-and-control,” White Paper, Damballa Inc., 2009.
[6] J. Lee, H. Jeong, J. Park, and M. Kim, “The Activity Anaylysis of Malicious HTTP-Based Botnets Using Degree of Periodic Repeatability, ” In Proc. of International Conference on Security Technology, pp.83-86, 2008.
Figure 9. Average number of bytes per flow for HTTP GET flooding attack pattern by NetBot Attacker tools
Figure 8. Average number of bytes based on flow-records starting time (large overseas online shopping mall sites)
Figure 10. Connection of HTTP GET Flooding
29Copyright (c) IARIA, 2016. ISBN: 978-1-61208-516-6
INTERNET 2016 : The Eighth International Conference on Evolving Internet
38 / 63

Detection of Tweets Where Birthdays are Revealed to Other People
Yasuhiko Watanabe, Naohiro Miyagi, Kenji Yasuda, Ryo Nishimura, and Yoshihiro OkadaRyukoku University
Seta, Otsu, Shiga, JapanEmail: [email protected], [email protected], [email protected],
r [email protected], [email protected]
Abstract—These days, many people use a social networkingservice (SNS). When we use SNSs, we carefully protect the privacyof personal information: name, age, gender, address, birthday, etc.However, we often reveal birthdays on SNS, not only ours butalso of others. Birthday information can threaten our privacy andsecurity when combined with other personal information. In thisstudy, we investigated tweets where birthdays were revealed toother people. We collected 1,000 Japanese tweets including word“tanjyobi (birthday)” and found about 30% of them were tweetswhere birthdays were revealed to other people. Furthermore,70% of tweets where birthdays were revealed to other peoplewere ones where receivers’ birthdays were revealed. We obtained87% accuracy when we applied support vector machine (SVM)machine learning techniques to classify tweets including word“tanjyobi (birthday)” into ones revealing birthdays of senders,receivers, and others. However, the recall rate of tweets wheresenders’ birthdays were revealed was only 20%.
Keywords–birthday; personal information; Twitter; SNS; privacyrisk.
I. INTRODUCTION
These days, many people use a social networking service(SNS). These users, especially young users, tend to disclosepersonal information on their SNS profiles seemingly withoutmuch concern for the potential privacy risks. They seemto believe the benefits of disclosing personal information inorder to use SNSs as greater than the potential privacy risks.Furthermore, they often reveal personal information on SNSs,not only theirs but also of others. For example, (exp 1) is acomment on a Facebook user profile.
(exp 1) I hope you had an amazing birthdayyy!
This comment was time-stamped. As a result, anyone, includ-ing unwanted audiences, could understand this user’s birthdayeven if the user did not disclose his/her birthday on the profile.Also, we often find tweets where we can understand someone’sbirthday.
(exp 2) Atashi no tanjyobi ha 8 gatu youka yo, Risshutte itte 1 nen de mottomo atsui hi rashii wane–.Koyomi no ue deha dayo?(My birthday is August 8th, that is, the beginningday of autumn, and seems to be the hottest dayof the year. Well, it is according to the calendar,you know?)
(exp 3) @kahuhi kahuhi san tanjyobi omedetou goza-imasu!!(@kahuhi Mr. kahuhi, happy birthday!!)
Both (exp 2) and (exp 3) are tweets on Twitter. The sender of(exp 2) disclosed her birthday by herself. On the other hand,the sender of (exp 3) revealed his/her friend’s birthday. In this
Figure 1. Twitter recommends us to add our birthday to our profiles.
paper, we focus on birthday information because we treat itdifferently than other personal information. For example, ifsomeone revealed our name, address, age, gender, telephonenumber, or social security number on a SNS, we would getupset him/her for doing it. On the other hand, interestingly, ifsomeone revealed our birthday in his/her birthday message ona SNS, like (exp 3), most of us would appreciate what he/shedoes, like (exp 4) and (exp 5).
(exp 4) message kureta minna arigatou. yoi tanjyobi ninarimashita – (*ˆˆ*)(Thank you for birthday messages. I have a nicebirthday – (*ˆˆ*))
(exp 5) @taguma6 reina no mama no tanjyobi oboetekurete runyane, arigatou, sasuga(@taguma6 I’m glad to hear that you remembermy mother’s birthday. Thank you. Amazing.)
Birthday messages often give us opportunities to start newcommunications. As a result, as shown in Fig. 1, Twitterrecommends us to add our birthday to our profiles. It is likelythat these kinds of recommendations let SNS users discountthe potential risks related to disclosing personal information.However, birthday information can be linkable to a specificindividual when it is combined with other information. In orderto deal with the privacy risks, it is important to investigatehow we disclose or reveal personal information on SNSs, notonly ours but of others. Birthday information especially should
30Copyright (c) IARIA, 2016. ISBN: 978-1-61208-516-6
INTERNET 2016 : The Eighth International Conference on Evolving Internet
39 / 63
be investigated carefully because we treat it differently thanother personal information. Furthermore, it is important toinvestigate whether unwanted audiences can collect revealedpersonal information automatically. To solve these problems, inthis paper, we investigate tweets where birthdays are revealedto other users and show how we communicate with eachother about our birthdays. Furthermore, we discuss whetherunwanted audiences can collect revealed birthday informationby using machine learning techniques.
The rest of this paper is organized as follows: In SectionII, we survey the related works. In Section III, we reporthow we disclose or reveal birthday information on Twitter. InSection IV, we discuss whether unwanted audiences can col-lect revealed birthday information by using machine learningtechniques. Finally, in Section V, we present our conclusions.
II. RELATED WORKS
Personally identifiable information is defined as informa-tion which can be used to distinguish or trace an individual’sidentity such as social security number, biometric records,etc. alone, or when combined with other information that islinkable to a specific individual, such as date and place ofbirth, mother’s maiden name, etc. [1] [2]. Internet users aregenerally concerned about unwanted audiences obtaining per-sonal information. Fox et al. reported that 86% of Internet usersare concerned that unwanted audiences will obtain informationabout them or their families [3]. Also, Acquisti and Grossreported that students expressed high levels of concern for gen-eral privacy issues on Facebook, such as a stranger finding outwhere they live and the location and schedule of their classes,and a stranger learning their sexual orientation, name of theircurrent partner, and their political affiliations [4]. However,Internet users, especially young users, tend to disclose personalinformation on their profiles, for example, real full name,gender, hometown and full date of birth, which can potentiallybe used to identify details of their real life, such as theirsocial security numbers. In order to discuss this phenomenon,many researchers investigated how much and which type ofinformation are revealed in SNSs, especially, in Facebook.Stutzman investigated Facebook profiles of University of NorthCarolina at Chapel Hill freshmen and found that 96.2% of thempublished their birthdays on their Facebook profiles, 74.7%their political views and 83.2% their sexual orientation [5].Gross and Acquisti investigated Facebook profiles of CarnegieMellon University students and found that 87.8% of themreveal their birth date on their profiles, 39.9% list their phonenumber, and 50.8% list their current residence [6]. Taraszowet al. observed Facebook profiles of 131 young people (68females and 63 males, ages ranged from 14 to 29 years)and found that all participants disclosed their birthdays and54.2% list their hometowns on their Facebook profiles [7].Taraszow et al. also observed Cypriot Facebook users andfound that they were willing to share personal information:All of them published their real names, 97% revealed theirgender, 97% published a facial profile picture of themselves,97% published their facial profile pictures, 51% indicated theirhometowns and 88% published their birth date [8]. Huffakerand Calvert studied 70 teenage bloggers and found that 70%of them published their first names, 20% list their full names,67% list their ages, and 39% list their birthdays [9]. Basedon these results, researchers discussed the reasons why users
willingly disclose personal information on their SNS profiles.Dwyer concluded in her research that privacy is often notexpected or undefined in SNSs [10]. Barnes argues that Internetusers, especially teenagers, are not aware of the nature of theInternet and SNSs [11]. Hirai reported that many users hadtroubles in SNSs because they did not mind that strangersobserved their communication with their friends [12]. Viseuet al. reported that many online users believe the benefits ofdisclosing personal information in order to use an Internetsite as greater than the potential privacy risks [13]. On theother hand, Acquisti and Gross explain this phenomenon asa disconnection between the users’ desire to protect theirprivacy and their actual behavior [4]. Also, Livingstone pointsout that teenagers’ conception of privacy does not match theprivacy settings of most SNSs [14]. Joinson et al. reported thattrust and perceived privacy had a strong affect on individuals’willingness to disclose personal information to a website [15].Also, Tufekci found that concern about unwanted audienceshad an impact on whether or not students revealed their realnames and religious affiliation on MySpace and Facebook [16].
Next, we survey studies that focus on the issue of potentialprivacy risks of disclosing personal information. Birthdayinformation alone cannot threaten the privacy and security ofusers. However, it can expose users’ identities and threatentheir privacy when combined with other personal informationdisclosed in their profiles. Sweeney reported 87% of Ameri-cans can be uniquely identified from a birth date, five-digit zipcode, and gender [17]. Acquisti and Gross reported the exis-tence of a potential ability to reconstruct users’ social securitynumbers utilizing a combination of information often found inprofiles, such as their full name, date of birth and hometown[4]. Many banks and credit-card companies recommend theircustomers to select a personal identification number (PIN)that cannot be easily guessed, for example, birth date [18][19]. Bonneau et al. investigated 805 participants and foundthat 23% of them chose their PINs representing dates [20].Furthermore, Bonneau et al. asked users about the significanceof the dates in their PINs: 29% of them used their ownbirthday, 26% the birthday of a partner or family member, and25% an important life event like an anniversary or graduation.As a result, we should be aware of the potential privacy riskson SNSs and manage our personal information carefully. SNSsdo not force users to reveal personal information. However, wethink, they actually recommend and encourage them to do so.As shown in Fig. 1, Twitter recommended users to add theirbirthdays on their Twitter profiles. On the other hand, Twitterenables each user to set the visibility preferences for his/herbirthday on the profile from options [21] [22]:
• public,• limited audience, or• closed.
Fig. 2 shows a Twitter profile where a user sets the visibilitypreferences for his/her birthday. However, even if a user set itclosed, his/her birthday would be revealed to others when thefollowing kind of tweets was submitted.
(exp 6) @446xx110rn tanjyobi omedetou!!(@446xx110rn Happy birthday!!)
We found many tweets where someone’s birthdays were re-vealed and linked to specific Twitter accounts. We may say that
31Copyright (c) IARIA, 2016. ISBN: 978-1-61208-516-6
INTERNET 2016 : The Eighth International Conference on Evolving Internet
40 / 63

Figure 2. A Twitter user can set the visibility preferencesfor his/her birthday on the profile.
Fig. 1 and Fig. 2 show a disconnection between the Twitter’sdesire to protect their users’ privacy and their actual behavior.
III. INVESTIGATION OF TWEETS WHERE BIRTHDAYS AREREVEALED TO OTHER PEOPLE
In this section, we show how we disclose or reveal birthdayinformation on Twitter.
A. The investigation objectWe collected 1,000 Japanese tweets including word “tanjy-
obi (birthday)” in December 2015. We used these 1,000 tweetsfor investigating tweets where birthdays were revealed to otherpeople.
Tweets can be classified into three types [23]:
• replyA reply is submitted to a particular person. It contains“@username” in the body of the tweet. For example,(exp 3), (exp 5), and (exp 6) are replies.
• retweetA retweet is a reply to a tweet that includes the originaltweet.
• normal tweetA normal tweet is neither reply nor retweet. For ex-ample, (exp 2) and (exp 4) are normal tweets. Normaltweets are generally submitted to general public.
Table I shows the numbers and percentages of normal tweets,replies, and retweets in the 1,000 tweets. As shown in Table I,there were no retweets in the 1,000 tweets. On the other hand,Table II shows the numbers and percentages of normal tweets,replies, and retweets in the 7,085,267 Japanese tweets obtainedin November and December 2012 by using the streaming API[24]. The comparison of Table I with Table II shows that
TABLE I. THE NUMBERS AND PERCENTAGES OF NORMAL TWEETS,REPLIES, AND RETWEETS IN THE 1,000 JAPANESE TWEETS INCLUDING
“tanjyobi (BIRTHDAY)” (IN DECEMBER 2015).
number (percentage)normal tweet 560 (56.0 %)
reply 440 (44.0 %)retweet 0 ( 0.0 %)
total 1,000 (100.0 %)
TABLE II. THE NUMBERS AND PERCENTAGES OF NORMAL TWEETS,REPLIES, AND RETWEETS IN THE 7,085,267 JAPANESE TWEETS (IN
NOVEMBER AND DECEMBER 2012).
number (percentage)normal tweet 3,813,164 (53.8 %)
reply 2,528,642 (35.7 %)retweet 743,461 (10.5 %)
total 7,085,267 (100.0 %)
TABLE III. THE CLASSIFICATION RESULT OF THE 1,000 TWEETSOBTAINED IN DECEMBER 2015 (BY HUMAN EXPERTS).
TYPEwhose birthday
is revealednormaltweet reply total
TYPE S sender 51 32 83TYPE R receiver 0 211 211TYPE N no one 509 197 706
total 560 440 1,000
word “tanjyobi (birthday)” was used more frequently in repliesthan normal tweets. We classified these 1,000 tweets into threetypes:
TYPE S tweets where sender’s birthdays were disclosedby themselves,
TYPE R tweets where receiver’s birthdays were revealedby senders, and
TYPE N tweets where no one’s birthdays were revealed.
Table III shows the classification result. As shown in Table III,there were 294 tweets revealing senders’ or receivers’ birth-days. Furthermore, the number of tweets revealing receivers’birthdays (211 tweets) was more than twice the number oftweets revealing senders’ birthdays (83 tweets). In this study,a tweet where someone’s birthday was revealed but could notbe linked to a specific Twitter account was classified intoTYPE N: tweets where no one’s birthdays were revealed. Forexample, the birthdays of oniichan (brother) in (exp 7) andChihiro Iwasaki in (exp 8) were revealed but could not belinked to their Twitter accounts. As a result, in this study,these tweets were classified into TYPE N.
(exp 7) kyou ha jikkei no tanjyobi! oniichan tanjyobiomedetou – ! 18 kin kaikin toka otona yana...(Today is my elder brother’s birthday! Happybirthday, brother. Now, you can watch movies foradults only...)
(exp 8) Iwasaki Chihiro san no tanjyobi nanoka(Today is the birthday of Chihiro Iwasaki.)
Chihiro Iwasaki was a famous Japanese artist.
32Copyright (c) IARIA, 2016. ISBN: 978-1-61208-516-6
INTERNET 2016 : The Eighth International Conference on Evolving Internet
41 / 63
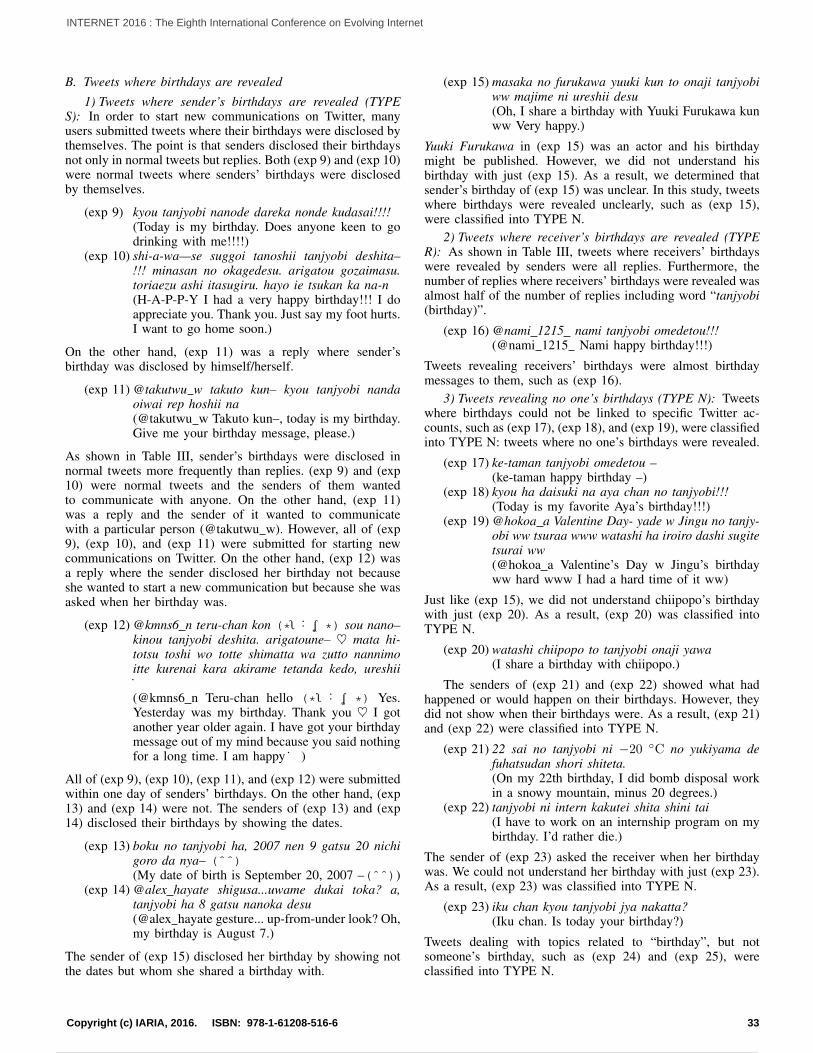
B. Tweets where birthdays are revealed1) Tweets where sender’s birthdays are revealed (TYPE
S): In order to start new communications on Twitter, manyusers submitted tweets where their birthdays were disclosed bythemselves. The point is that senders disclosed their birthdaysnot only in normal tweets but replies. Both (exp 9) and (exp 10)were normal tweets where senders’ birthdays were disclosedby themselves.
(exp 9) kyou tanjyobi nanode dareka nonde kudasai!!!!(Today is my birthday. Does anyone keen to godrinking with me!!!!)
(exp 10) shi-a-wa—se suggoi tanoshii tanjyobi deshita–!!! minasan no okagedesu. arigatou gozaimasu.toriaezu ashi itasugiru. hayo ie tsukan ka na-n(H-A-P-P-Y I had a very happy birthday!!! I doappreciate you. Thank you. Just say my foot hurts.I want to go home soon.)
On the other hand, (exp 11) was a reply where sender’sbirthday was disclosed by himself/herself.
(exp 11) @takutwu w takuto kun– kyou tanjyobi nandaoiwai rep hoshii na(@takutwu w Takuto kun–, today is my birthday.Give me your birthday message, please.)
As shown in Table III, sender’s birthdays were disclosed innormal tweets more frequently than replies. (exp 9) and (exp10) were normal tweets and the senders of them wantedto communicate with anyone. On the other hand, (exp 11)was a reply and the sender of it wanted to communicatewith a particular person (@takutwu w). However, all of (exp9), (exp 10), and (exp 11) were submitted for starting newcommunications on Twitter. On the other hand, (exp 12) wasa reply where the sender disclosed her birthday not becauseshe wanted to start a new communication but because she wasasked when her birthday was.
(exp 12) @kmns6 n teru-chan kon (*´∇`*) sou nano–kinou tanjyobi deshita. arigatoune– ♡ mata hi-totsu toshi wo totte shimatta wa zutto nannimoitte kurenai kara akirame tetanda kedo, ureshii♪(@kmns6 n Teru-chan hello (*´∇`*) Yes.Yesterday was my birthday. Thank you ♡ I gotanother year older again. I have got your birthdaymessage out of my mind because you said nothingfor a long time. I am happy♪)
All of (exp 9), (exp 10), (exp 11), and (exp 12) were submittedwithin one day of senders’ birthdays. On the other hand, (exp13) and (exp 14) were not. The senders of (exp 13) and (exp14) disclosed their birthdays by showing the dates.
(exp 13) boku no tanjyobi ha, 2007 nen 9 gatsu 20 nichigoro da nya– (ˆˆ)(My date of birth is September 20, 2007 –(ˆˆ))
(exp 14) @alex hayate shigusa...uwame dukai toka? a,tanjyobi ha 8 gatsu nanoka desu(@alex hayate gesture... up-from-under look? Oh,my birthday is August 7.)
The sender of (exp 15) disclosed her birthday by showing notthe dates but whom she shared a birthday with.
(exp 15) masaka no furukawa yuuki kun to onaji tanjyobiww majime ni ureshii desu(Oh, I share a birthday with Yuuki Furukawa kunww Very happy.)
Yuuki Furukawa in (exp 15) was an actor and his birthdaymight be published. However, we did not understand hisbirthday with just (exp 15). As a result, we determined thatsender’s birthday of (exp 15) was unclear. In this study, tweetswhere birthdays were revealed unclearly, such as (exp 15),were classified into TYPE N.
2) Tweets where receiver’s birthdays are revealed (TYPER): As shown in Table III, tweets where receivers’ birthdayswere revealed by senders were all replies. Furthermore, thenumber of replies where receivers’ birthdays were revealed wasalmost half of the number of replies including word “tanjyobi(birthday)”.
(exp 16) @nami 1215 nami tanjyobi omedetou!!!(@nami 1215 Nami happy birthday!!!)
Tweets revealing receivers’ birthdays were almost birthdaymessages to them, such as (exp 16).
3) Tweets revealing no one’s birthdays (TYPE N): Tweetswhere birthdays could not be linked to specific Twitter ac-counts, such as (exp 17), (exp 18), and (exp 19), were classifiedinto TYPE N: tweets where no one’s birthdays were revealed.
(exp 17) ke-taman tanjyobi omedetou –(ke-taman happy birthday –)
(exp 18) kyou ha daisuki na aya chan no tanjyobi!!!(Today is my favorite Aya’s birthday!!!)
(exp 19) @hokoa a Valentine Day- yade w Jingu no tanjy-obi ww tsuraa www watashi ha iroiro dashi sugitetsurai ww(@hokoa a Valentine’s Day w Jingu’s birthdayww hard www I had a hard time of it ww)
Just like (exp 15), we did not understand chiipopo’s birthdaywith just (exp 20). As a result, (exp 20) was classified intoTYPE N.
(exp 20) watashi chiipopo to tanjyobi onaji yawa(I share a birthday with chiipopo.)
The senders of (exp 21) and (exp 22) showed what hadhappened or would happen on their birthdays. However, theydid not show when their birthdays were. As a result, (exp 21)and (exp 22) were classified into TYPE N.
(exp 21) 22 sai no tanjyobi ni −20 ◦C no yukiyama defuhatsudan shori shiteta.(On my 22th birthday, I did bomb disposal workin a snowy mountain, minus 20 degrees.)
(exp 22) tanjyobi ni intern kakutei shita shini tai(I have to work on an internship program on mybirthday. I’d rather die.)
The sender of (exp 23) asked the receiver when her birthdaywas. We could not understand her birthday with just (exp 23).As a result, (exp 23) was classified into TYPE N.
(exp 23) iku chan kyou tanjyobi jya nakatta?(Iku chan. Is today your birthday?)
Tweets dealing with topics related to “birthday”, but notsomeone’s birthday, such as (exp 24) and (exp 25), wereclassified into TYPE N.
33Copyright (c) IARIA, 2016. ISBN: 978-1-61208-516-6
INTERNET 2016 : The Eighth International Conference on Evolving Internet
42 / 63
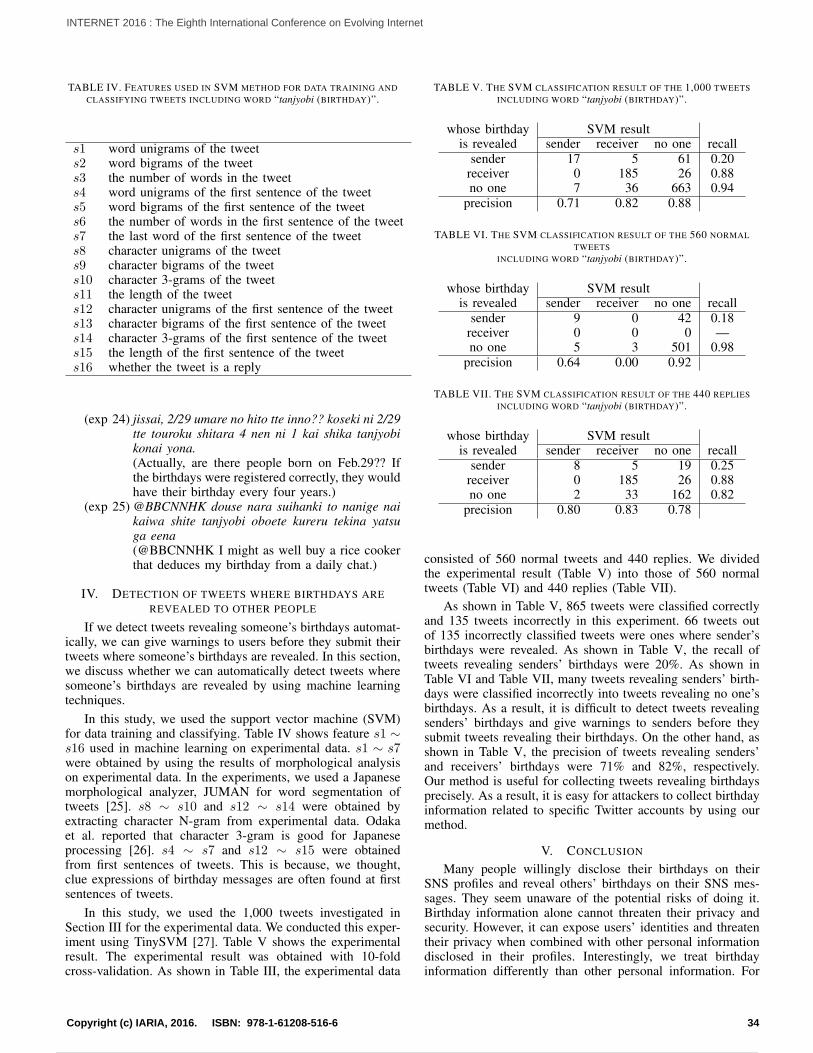
TABLE IV. FEATURES USED IN SVM METHOD FOR DATA TRAINING ANDCLASSIFYING TWEETS INCLUDING WORD “tanjyobi (BIRTHDAY)”.
s1 word unigrams of the tweets2 word bigrams of the tweets3 the number of words in the tweets4 word unigrams of the first sentence of the tweets5 word bigrams of the first sentence of the tweets6 the number of words in the first sentence of the tweets7 the last word of the first sentence of the tweets8 character unigrams of the tweets9 character bigrams of the tweets10 character 3-grams of the tweets11 the length of the tweets12 character unigrams of the first sentence of the tweets13 character bigrams of the first sentence of the tweets14 character 3-grams of the first sentence of the tweets15 the length of the first sentence of the tweets16 whether the tweet is a reply
(exp 24) jissai, 2/29 umare no hito tte inno?? koseki ni 2/29tte touroku shitara 4 nen ni 1 kai shika tanjyobikonai yona.(Actually, are there people born on Feb.29?? Ifthe birthdays were registered correctly, they wouldhave their birthday every four years.)
(exp 25) @BBCNNHK douse nara suihanki to nanige naikaiwa shite tanjyobi oboete kureru tekina yatsuga eena(@BBCNNHK I might as well buy a rice cookerthat deduces my birthday from a daily chat.)
IV. DETECTION OF TWEETS WHERE BIRTHDAYS AREREVEALED TO OTHER PEOPLE
If we detect tweets revealing someone’s birthdays automat-ically, we can give warnings to users before they submit theirtweets where someone’s birthdays are revealed. In this section,we discuss whether we can automatically detect tweets wheresomeone’s birthdays are revealed by using machine learningtechniques.
In this study, we used the support vector machine (SVM)for data training and classifying. Table IV shows feature s1 ∼s16 used in machine learning on experimental data. s1 ∼ s7were obtained by using the results of morphological analysison experimental data. In the experiments, we used a Japanesemorphological analyzer, JUMAN for word segmentation oftweets [25]. s8 ∼ s10 and s12 ∼ s14 were obtained byextracting character N-gram from experimental data. Odakaet al. reported that character 3-gram is good for Japaneseprocessing [26]. s4 ∼ s7 and s12 ∼ s15 were obtainedfrom first sentences of tweets. This is because, we thought,clue expressions of birthday messages are often found at firstsentences of tweets.
In this study, we used the 1,000 tweets investigated inSection III for the experimental data. We conducted this exper-iment using TinySVM [27]. Table V shows the experimentalresult. The experimental result was obtained with 10-foldcross-validation. As shown in Table III, the experimental data
TABLE V. THE SVM CLASSIFICATION RESULT OF THE 1,000 TWEETSINCLUDING WORD “tanjyobi (BIRTHDAY)”.
whose birthday SVM resultis revealed sender receiver no one recall
sender 17 5 61 0.20receiver 0 185 26 0.88no one 7 36 663 0.94
precision 0.71 0.82 0.88
TABLE VI. THE SVM CLASSIFICATION RESULT OF THE 560 NORMALTWEETS
INCLUDING WORD “tanjyobi (BIRTHDAY)”.
whose birthday SVM resultis revealed sender receiver no one recall
sender 9 0 42 0.18receiver 0 0 0 —no one 5 3 501 0.98
precision 0.64 0.00 0.92
TABLE VII. THE SVM CLASSIFICATION RESULT OF THE 440 REPLIESINCLUDING WORD “tanjyobi (BIRTHDAY)”.
whose birthday SVM resultis revealed sender receiver no one recall
sender 8 5 19 0.25receiver 0 185 26 0.88no one 2 33 162 0.82
precision 0.80 0.83 0.78
consisted of 560 normal tweets and 440 replies. We dividedthe experimental result (Table V) into those of 560 normaltweets (Table VI) and 440 replies (Table VII).
As shown in Table V, 865 tweets were classified correctlyand 135 tweets incorrectly in this experiment. 66 tweets outof 135 incorrectly classified tweets were ones where sender’sbirthdays were revealed. As shown in Table V, the recall oftweets revealing senders’ birthdays were 20%. As shown inTable VI and Table VII, many tweets revealing senders’ birth-days were classified incorrectly into tweets revealing no one’sbirthdays. As a result, it is difficult to detect tweets revealingsenders’ birthdays and give warnings to senders before theysubmit tweets revealing their birthdays. On the other hand, asshown in Table V, the precision of tweets revealing senders’and receivers’ birthdays were 71% and 82%, respectively.Our method is useful for collecting tweets revealing birthdaysprecisely. As a result, it is easy for attackers to collect birthdayinformation related to specific Twitter accounts by using ourmethod.
V. CONCLUSION
Many people willingly disclose their birthdays on theirSNS profiles and reveal others’ birthdays on their SNS mes-sages. They seem unaware of the potential risks of doing it.Birthday information alone cannot threaten their privacy andsecurity. However, it can expose users’ identities and threatentheir privacy when combined with other personal informationdisclosed in their profiles. Interestingly, we treat birthdayinformation differently than other personal information. For
34Copyright (c) IARIA, 2016. ISBN: 978-1-61208-516-6
INTERNET 2016 : The Eighth International Conference on Evolving Internet
43 / 63
example, if someone revealed our personal information exceptbirthday on a SNS, we would get upset him/her for doingit. On the other hand, if someone revealed our birthday inhis/her birthday message on a SNS, most of us would feelhappy and appreciate what he/she does. However, we have notsufficiently investigated how we reveal birthday informationon SNSs. As a result, the authors investigated how we revealbirthday information on SNSs, not only ours but of others.
In this study, we investigated tweets where someone’sbirthdays were revealed to other people. We collected 1,000Japanese tweets including word “tanjyobi (birthday)” andfound that about 30% of them were tweets where someone’sbirthdays were revealed to other people. Furthermore, about70% of tweets revealing someone’s birthdays were ones wherereceivers’ birthdays were revealed by senders. In this study, weproposed a method of detecting tweets revealing someone’sbirthday by using machine learning techniques. The experi-mental result showed that our method was able to classifytweets including word “tanjyobi (birthday)” with accuracy of87%. However, the recall of tweets revealing senders’ birthdaywas only 20%. As a result, in our method, it is difficult todetect tweets revealing senders’ birthdays and give warningsto senders before they submit them. On the other hand, theprecision of tweets revealing senders’ and receivers’ birthdayswere 71% and 82%, respectively. As a result, in our method, itis not difficult to collect tweets revealing birthdays precisely.We recommend that birthday messages should not be sent viaSNSs. This is because unwanted audiences can read and collectthem. We are now investigating other language tweets wherebirthdays are disclosed or revealed to other people.
REFERENCES
[1] C. Johnson III, Safeguarding against and responding tothe breach of personally identifiable information, Officeof Management and Budget Memorandum, 2007. [Online].Available: http://www.whitehouse.gov/omb/memoranda/fy2007/m07-16.pdf [accessed: 2016-10-4]
[2] B. Krishnamurthy and C. E. Wills, “On the leakage of personallyidentifiable information via online social networks,” in Proceedings ofthe 2Nd ACM Workshop on Online Social Networks, ser. WOSN ’09.New York, NY, USA: ACM, 2009, pp. 7–12. [Online]. Available:http://doi.acm.org/10.1145/1592665.1592668 [accessed: 2016-10-4]
[3] S. Fox et al., Trust and Privacy Online: Why Americans Want to Rewritethe Rules, The Pew Internet & American Life Project, 2000. [Online].Available: http://www.pewinternet.org/˜/media//Files/Reports/2000/PIP Trust Privacy Report.pdf.pdf [accessed: 2016-10-4]
[4] A. Acquisti and R. Gross, Imagined Communities: Awareness, Infor-mation Sharing, and Privacy on the Facebook. Berlin, Heidelberg:Springer Berlin Heidelberg, 2006, pp. 36–58.
[5] F. Stutzman, Student life on the Facebook, 2006. [Online]. Avail-able: http://www.ibiblio.org/fred/facebook/stutzman fbook.pdf [ac-cessed: 2016-10-4]
[6] R. Gross and A. Acquisti, “Information revelation and privacy in onlinesocial networks,” in Proceedings of the 2005 ACM Workshop on Privacyin the Electronic Society, ser. WPES ’05. New York, NY, USA: ACM,2005, pp. 71–80.
[7] T. Taraszow, E. Aristodemou, G. Shitta, Y. Laouris, and A. Arsoy,“Disclosure of personal and contact information by young people insocial networking sites: An analysis using Facebook profiles as anexample,” International Journal of Media and Cultural Politics, vol. 6,no. 1, 2010, pp. 81–101.
[8] T. Taraszow, A. Arsoy, G. Shitta, and Y. Laouris, “How much personaland sensitive information do cypriot teenagers reveal in facebook?” inProceedings of the 7th European Conference on E-Learning, 2008, pp.606–611.
[9] D. A. Huffaker and S. L. Calvert, “Gender, identity, and languageuse in teenage blogs.” Journal of Computer-Mediated Communication,vol. 10, no. 2, 2005. [Online]. Available: http://onlinelibrary.wiley.com/doi/10.1111/j.1083-6101.2005.tb00238.x/full [accessed: 2016-10-4]
[10] C. Dwyer, “Digital relationships in the ”myspace” generation: Resultsfrom a qualitative study,” in Proceedings of the 40th Annual HawaiiInternational Conference on System Sciences, ser. HICSS ’07. Wash-ington, DC, USA: IEEE Computer Society, 2007, p. 19.
[11] S. B. Barnes, “A privacy paradox: Social networking in the unitedstates.” First Monday, vol. 11, no. 9, 2006. [Online]. Available:http://firstmonday.org/article/view/1394/1312 [accessed: 2016-10-4]
[12] T. Hirai, “Why does “Enjyo“ happen on the Web? : An Examinationbased on Japanese Web Culture,” Journal of Information andCommunication Research, vol. 29, no. 4, mar 2012, pp. 61–71.[Online]. Available: http://doi.org/10.11430/jsicr.29.4 61 [accessed:2016-10-4]
[13] A. Viseu, A. Clement, and J. Aspinall, “Situating privacy online: Com-plex perception and everyday practices,” Information, Communication& Society, 2004, pp. 92–114.
[14] S. Livingstone, “Taking risky opportunities in youthful content creation:teenagers’ use of social networking sites for intimacy, privacy and self-expression.” New Media & Society, vol. 10, no. 3, 2008, pp. 393–411.
[15] A. N. Joinson, U.-D. Reips, T. Buchanan, and C. B. P.Schofield, “Privacy, trust, and self-disclosure online.” Human-ComputerInteraction, vol. 25, no. 1, 2010, pp. 1–24. [Online]. Available:www.joinson.com/home/pubs/HCI journal.pdf [accessed: 2016-10-4]
[16] Z. Tufekci, “Can You See Me Now? Audience and Disclosure Regula-tion in Online Social Network Sites,” Bulletin of Science, Technology& Society, vol. 28, no. 1, 2008, pp. 20–36.
[17] L. Sweeney, “Uniqueness of Simple Demographics in the U.S.Population,” LIDAP-WP4 Carnegie Mellon University, Laboratory forInternational Data Privacy, Pittsburgh, Pennsylvania, 2000. [Online].Available: http://dataprivacylab.org/projects/ identifiability/index.html[accessed: 2016-10-4]
[18] VISA, “Issuer PIN Security Guidelines,” http://usa.visa.com/dam/VCOM/download/merchants/visa-issuer-pin-security-guideline.pdf [ac-cessed: 2016-10-4], 2010.
[19] HSBC, “New service for HSBC cards ― PIN (personal identifica-tion number) change via HSBC ATMs,” https://www.hsbc.am/1/2/am/en/new-service-for-hsbc-cards [accessed: 2016-10-4], 2016.
[20] J. Bonneau, S. Preibusch, and R. Anderson, “A birthday present everyeleven wallets? the security of customer-chosen banking pins,” in The16 th International Conference on Financial Cryptography and DataSecurity, 2012, pp. 25–40.
[21] Twitter, “Customizing your profile,” https://support.twitter.com/articles/127871 [accessed: 2016-10-4].
[22] ——, “Profile visibility settings,” https://support.twitter.com/articles/20172733 [accessed: 2016-10-4].
[23] Y. Watanabe, K. Nakajima, H. Morimoto, R. Nishimura, andY. Okada, “An investigation of a factor that affects the usage ofunsounded code strings at the end of japanese and english tweets,”in Proceedings of the Seventh International Conference on EvolvingInternet (INTERNET 2015), Oct 2015, pp. 50–55. [Online]. Available:https://www.thinkmind.org/index.php?view=article&articleid=internet2015 2 40 40038 [accessed: 2016-10-4]
[24] Twitter, Inc. The Streaming APIs. [Online]. Available:https://dev.twitter.com/streaming/overview [accessed: 2016-10-4]
[25] S. Kurohashi and D. Kawahara, JUMAN Manual version 5.1 (inJapanese). Kyoto University, 2005.
[26] T. Odaka et al., “A proposal on student report scoring systemusing n-gram text analysis method,” The transactions of theInstitute of Electronics, Information and Communication Engineers.D-I, vol. 86, no. 9, sep 2003, pp. 702–705. [Online]. Available:http://ci.nii.ac.jp/naid/110003171273/en/ [accessed: 2016-10-4]
[27] Taku Kudoh. TinySVM: Support Vector Machines. [Online]. Available:http://chasen.org/t̃aku/software/TinySVM/index.html [accessed: 2016-10-4]
35Copyright (c) IARIA, 2016. ISBN: 978-1-61208-516-6
INTERNET 2016 : The Eighth International Conference on Evolving Internet
44 / 63
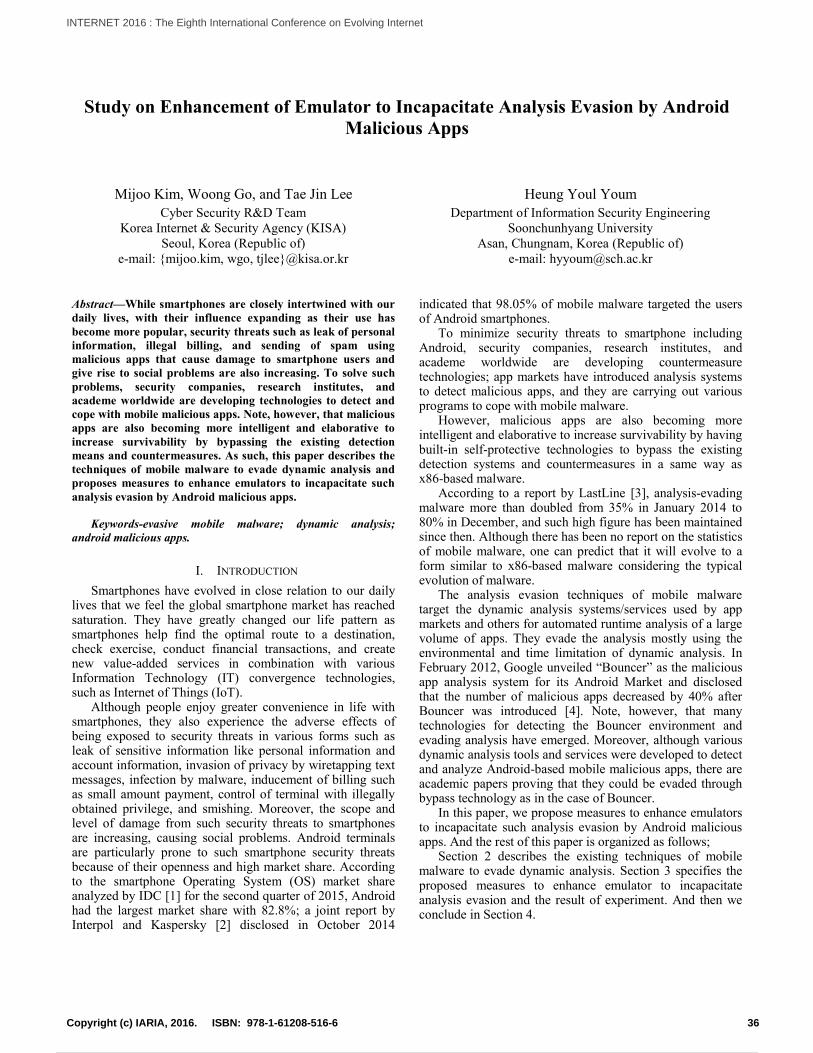
Study on Enhancement of Emulator to Incapacitate Analysis Evasion by Android
Malicious Apps
Mijoo Kim, Woong Go, and Tae Jin Lee
Cyber Security R&D Team
Korea Internet & Security Agency (KISA)
Seoul, Korea (Republic of)
e-mail: {mijoo.kim, wgo, tjlee}@kisa.or.kr
Heung Youl Youm
Department of Information Security Engineering
Soonchunhyang University
Asan, Chungnam, Korea (Republic of)
e-mail: [email protected]
Abstract—While smartphones are closely intertwined with our
daily lives, with their influence expanding as their use has
become more popular, security threats such as leak of personal
information, illegal billing, and sending of spam using
malicious apps that cause damage to smartphone users and
give rise to social problems are also increasing. To solve such
problems, security companies, research institutes, and
academe worldwide are developing technologies to detect and
cope with mobile malicious apps. Note, however, that malicious
apps are also becoming more intelligent and elaborative to
increase survivability by bypassing the existing detection
means and countermeasures. As such, this paper describes the
techniques of mobile malware to evade dynamic analysis and
proposes measures to enhance emulators to incapacitate such
analysis evasion by Android malicious apps.
Keywords-evasive mobile malware; dynamic analysis;
android malicious apps.
I. INTRODUCTION
Smartphones have evolved in close relation to our daily lives that we feel the global smartphone market has reached saturation. They have greatly changed our life pattern as smartphones help find the optimal route to a destination, check exercise, conduct financial transactions, and create new value-added services in combination with various Information Technology (IT) convergence technologies, such as Internet of Things (IoT).
Although people enjoy greater convenience in life with smartphones, they also experience the adverse effects of being exposed to security threats in various forms such as leak of sensitive information like personal information and account information, invasion of privacy by wiretapping text messages, infection by malware, inducement of billing such as small amount payment, control of terminal with illegally obtained privilege, and smishing. Moreover, the scope and level of damage from such security threats to smartphones are increasing, causing social problems. Android terminals are particularly prone to such smartphone security threats because of their openness and high market share. According to the smartphone Operating System (OS) market share analyzed by IDC [1] for the second quarter of 2015, Android had the largest market share with 82.8%; a joint report by Interpol and Kaspersky [2] disclosed in October 2014
indicated that 98.05% of mobile malware targeted the users of Android smartphones.
To minimize security threats to smartphone including Android, security companies, research institutes, and academe worldwide are developing countermeasure technologies; app markets have introduced analysis systems to detect malicious apps, and they are carrying out various programs to cope with mobile malware.
However, malicious apps are also becoming more intelligent and elaborative to increase survivability by having built-in self-protective technologies to bypass the existing detection systems and countermeasures in a same way as x86-based malware.
According to a report by LastLine [3], analysis-evading malware more than doubled from 35% in January 2014 to 80% in December, and such high figure has been maintained since then. Although there has been no report on the statistics of mobile malware, one can predict that it will evolve to a form similar to x86-based malware considering the typical evolution of malware.
The analysis evasion techniques of mobile malware target the dynamic analysis systems/services used by app markets and others for automated runtime analysis of a large volume of apps. They evade the analysis mostly using the environmental and time limitation of dynamic analysis. In February 2012, Google unveiled “Bouncer” as the malicious app analysis system for its Android Market and disclosed that the number of malicious apps decreased by 40% after Bouncer was introduced [4]. Note, however, that many technologies for detecting the Bouncer environment and evading analysis have emerged. Moreover, although various dynamic analysis tools and services were developed to detect and analyze Android-based mobile malicious apps, there are academic papers proving that they could be evaded through bypass technology as in the case of Bouncer.
In this paper, we propose measures to enhance emulators to incapacitate such analysis evasion by Android malicious apps. And the rest of this paper is organized as follows;
Section 2 describes the existing techniques of mobile malware to evade dynamic analysis. Section 3 specifies the proposed measures to enhance emulator to incapacitate analysis evasion and the result of experiment. And then we conclude in Section 4.
36Copyright (c) IARIA, 2016. ISBN: 978-1-61208-516-6
INTERNET 2016 : The Eighth International Conference on Evolving Internet
45 / 63

II. TECHNIQUES OF EVADING ANALYSIS OF MOBILE
MALICIOUS APPS
The review of the trend in studies of evasion of dynamic analysis of mobile malicious apps shows that the cases can be mainly categorized into two types.
The first type is detecting the app running environment and not operating or executing the malicious behavior if it is not an actual terminal. A representative case of such type can be the bypassing of Google Bouncer announced by Jon O. and Charlie M. at SummerCon2012 [5]. The technique bypassed the verification system and enabled a malicious app to be registered in the Android Market by modifying the code when it receives the environment data under which the app runs during the verification stop when an app is registered. The “BrainTest” app, which actually got registered in Google Play in 2015 and infected more than 2 million devices, detected the analytical environment of Google Bouncer by checking the Internet Protocol (IP) address and domain character string and bypassed the analysis.
Techniques of evading analysis by detecting the virtual environment have been reported in many papers or presentations.
Timothy V. and Nicolas C. [6] showed that the analysis could be evaded after detecting the dynamic analysis system -- which was a virtual terminal -- by analyzing the difference of behavior between an actual terminal and a virtual terminal, performance, hardware and software components, and system design. Methods using the difference in behavior include checking the data that have the characteristics of emulator using Android Application Programming Interface (API), detecting the network emulations, and detecting the underlying emulator. The method using the performance difference detects the emulator by comparing the performances of Central Processing Unit (CPU) and graphic of actual terminals and emulator. The study also described the method of detecting the virtual environment according to the existence of hardware and software component.
Thanasis Petsas, et al. [7] deduced the static elements, dynamic elements, and hypervisor elements for detecting a dynamic analysis system. Static elements are the fixed values of a virtual terminal distinguishable from an actual terminal, and they include International Mobile Station Equipment Identity (IMEI), International Mobile Subscriber Identity (IMSI), and routing table. Dynamic elements are the values that dynamically change in an actual terminal but are fixed or are not provided in a virtual device; they include various sensors such as accelerator sensor, magnetic field sensor, rotation vector, proximity sensor, and gyroscope. Hypervisor elements use the configuration difference between a Virtual Machine (VM) emulation and the actual OS such as identifying the Quick Emulator (QEMU) scheduling and execution. The study tested 12 tools for the dynamic analysis of malicious apps including DroidBox [8], TaintDroid [9], Andrubis [10], CopperDroid [11], and Apk Analyzer [12] using 10 malicious apps that attempt to evade detection using the static, dynamic, and hypervisor elements and found that almost all dynamic analysis tools could not detect the
evasion attempt except in the case of the attempt to evade detection using very simple static elements such as IMEI.
Yiming Zing, et al. [13] proposed Morpheus, a framework that automatically generates heuristics to detect an Android emulator by analyzing the difference between an actual terminal and a virtual terminal. Using Morpheus, they deduced more than 10,000 types of heuristics including basic heuristics such as network, power management, audio, USB, radio and software components, and configurations as well as the heuristics to detect QEMU, such as QEMU, Goldfish virtual hardware, Bluetooth, Near Field Communication (NFC), and vibrator and heuristics to detect VirtualBox and Personal Computer (PC) hardware. Their study showed that various evasion technologies can be applied against the dynamic analysis of malicious apps under the virtualization environment.
At HITCON2013, Tim Strazzere [14] announced various methods of evading emulators. He showed that an emulator can be detected with the checking of system attributes, checking of QEMU pipe to communicate with the host environment and checking of terminal contents such as address book, Short Message Service (SMS) transfer history, call list, and battery level.
The second type of technique of evading malicious app analysis is in logic bomb form by specifying the malicious behavior to be carried out only when the specific predefined conditions based on user interaction, time, and environment are satisfied.
The case of carrying out malicious behavior by detecting user interaction is similar to the technique of bypassing the analysis though a sandbox in the existing x86-based malware since it remains in hiding until it detects the intervention of human user such as mouse click and intelligent response to a dialog box. User interaction in the mobile environment occurs in the form of touch on a screen, touch on a popup, and information input. Although user interaction can be easily generated using a monkey that generates an event for a random coordinate value when simple interaction such as popup and button touch is required, there is a limitation as to what the monkey can do when an intelligent interaction such as continuous and accurate button touch or information input based on user judgment is required. An example is the “Horoscope” app, which attempted to leak the information by disguising as an app providing horoscope information. The Horoscope app [15] induced the user to touch a button twice continuously and accurately to obtain horoscope information in an attempt to leak the information stored in the smartphone.
Malicious behavior based on time condition is a case of carrying out malicious behavior not right after the app is run but after a specific period has passed or when a particular time is reached. A typical tool for the dynamic analysis of malicious app runs an app for a very short period since it cannot spend too much time analyzing an app. Therefore, it cannot detect a malicious app if the malicious app does not carry out malicious behavior during a short period. For example, Bouncer determines malicious behavior by observing an app for 5 minutes for dynamic analysis. It means that a malicious app designed to carry out malicious
37Copyright (c) IARIA, 2016. ISBN: 978-1-61208-516-6
INTERNET 2016 : The Eighth International Conference on Evolving Internet
46 / 63
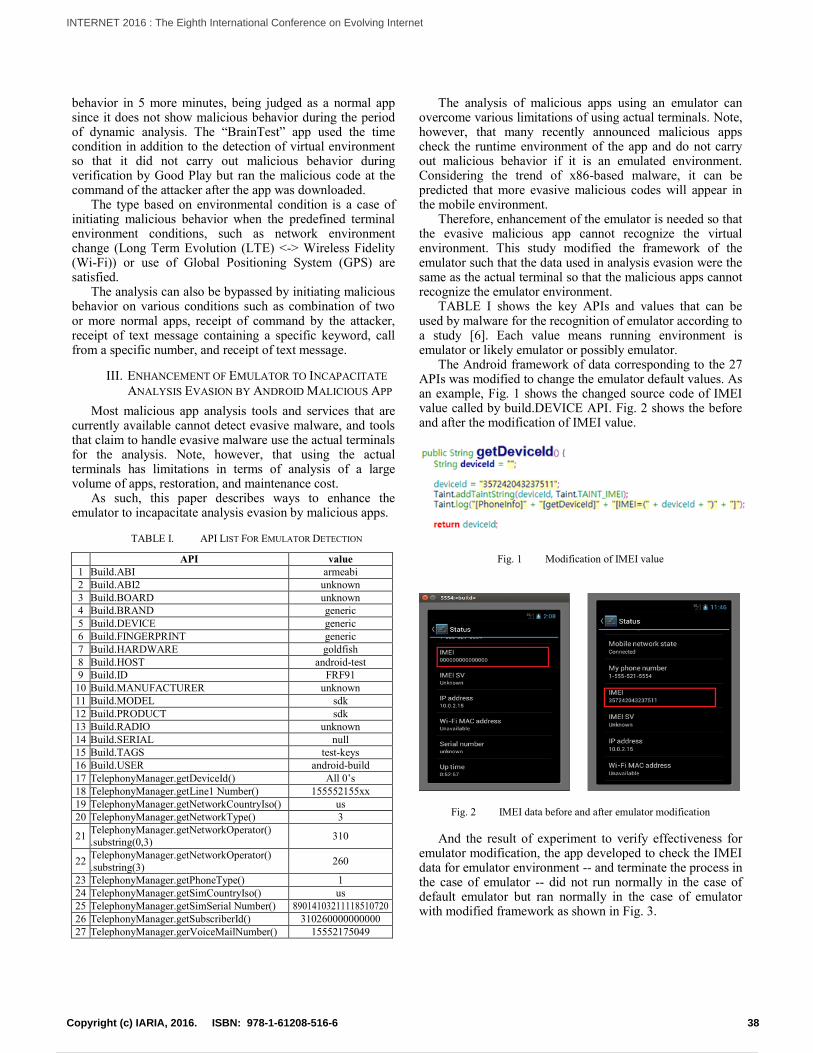
behavior in 5 more minutes, being judged as a normal app since it does not show malicious behavior during the period of dynamic analysis. The “BrainTest” app used the time condition in addition to the detection of virtual environment so that it did not carry out malicious behavior during verification by Good Play but ran the malicious code at the command of the attacker after the app was downloaded.
The type based on environmental condition is a case of initiating malicious behavior when the predefined terminal environment conditions, such as network environment change (Long Term Evolution (LTE) <-> Wireless Fidelity (Wi-Fi)) or use of Global Positioning System (GPS) are satisfied.
The analysis can also be bypassed by initiating malicious behavior on various conditions such as combination of two or more normal apps, receipt of command by the attacker, receipt of text message containing a specific keyword, call from a specific number, and receipt of text message.
III. ENHANCEMENT OF EMULATOR TO INCAPACITATE
ANALYSIS EVASION BY ANDROID MALICIOUS APP
Most malicious app analysis tools and services that are currently available cannot detect evasive malware, and tools that claim to handle evasive malware use the actual terminals for the analysis. Note, however, that using the actual terminals has limitations in terms of analysis of a large volume of apps, restoration, and maintenance cost.
As such, this paper describes ways to enhance the emulator to incapacitate analysis evasion by malicious apps.
TABLE I. API LIST FOR EMULATOR DETECTION
API value
1 Build.ABI armeabi
2 Build.ABI2 unknown
3 Build.BOARD unknown
4 Build.BRAND generic
5 Build.DEVICE generic
6 Build.FINGERPRINT generic
7 Build.HARDWARE goldfish
8 Build.HOST android-test
9 Build.ID FRF91
10 Build.MANUFACTURER unknown
11 Build.MODEL sdk
12 Build.PRODUCT sdk
13 Build.RADIO unknown
14 Build.SERIAL null
15 Build.TAGS test-keys
16 Build.USER android-build
17 TelephonyManager.getDeviceId() All 0’s
18 TelephonyManager.getLine1 Number() 155552155xx
19 TelephonyManager.getNetworkCountryIso() us
20 TelephonyManager.getNetworkType() 3
21 TelephonyManager.getNetworkOperator()
.substring(0,3) 310
22 TelephonyManager.getNetworkOperator()
.substring(3) 260
23 TelephonyManager.getPhoneType() 1
24 TelephonyManager.getSimCountryIso() us
25 TelephonyManager.getSimSerial Number() 89014103211118510720
26 TelephonyManager.getSubscriberId() 310260000000000
27 TelephonyManager.gerVoiceMailNumber() 15552175049
The analysis of malicious apps using an emulator can overcome various limitations of using actual terminals. Note, however, that many recently announced malicious apps check the runtime environment of the app and do not carry out malicious behavior if it is an emulated environment. Considering the trend of x86-based malware, it can be predicted that more evasive malicious codes will appear in the mobile environment.
Therefore, enhancement of the emulator is needed so that the evasive malicious app cannot recognize the virtual environment. This study modified the framework of the emulator such that the data used in analysis evasion were the same as the actual terminal so that the malicious apps cannot recognize the emulator environment.
TABLE I shows the key APIs and values that can be used by malware for the recognition of emulator according to a study [6]. Each value means running environment is emulator or likely emulator or possibly emulator.
The Android framework of data corresponding to the 27 APIs was modified to change the emulator default values. As an example, Fig. 1 shows the changed source code of IMEI value called by build.DEVICE API. Fig. 2 shows the before and after the modification of IMEI value.
Fig. 1 Modification of IMEI value
Fig. 2 IMEI data before and after emulator modification
And the result of experiment to verify effectiveness for emulator modification, the app developed to check the IMEI data for emulator environment -- and terminate the process in the case of emulator -- did not run normally in the case of default emulator but ran normally in the case of emulator with modified framework as shown in Fig. 3.
38Copyright (c) IARIA, 2016. ISBN: 978-1-61208-516-6
INTERNET 2016 : The Eighth International Conference on Evolving Internet
47 / 63
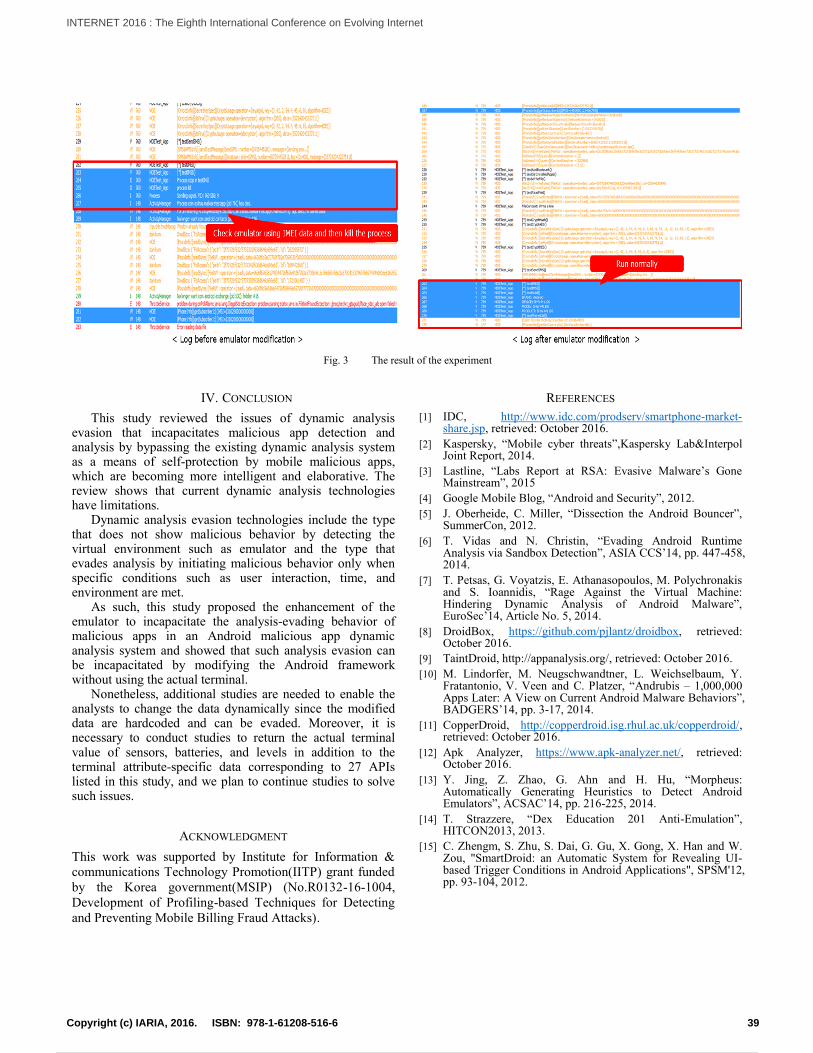
IV. CONCLUSION
This study reviewed the issues of dynamic analysis evasion that incapacitates malicious app detection and analysis by bypassing the existing dynamic analysis system as a means of self-protection by mobile malicious apps, which are becoming more intelligent and elaborative. The review shows that current dynamic analysis technologies have limitations.
Dynamic analysis evasion technologies include the type that does not show malicious behavior by detecting the virtual environment such as emulator and the type that evades analysis by initiating malicious behavior only when specific conditions such as user interaction, time, and environment are met.
As such, this study proposed the enhancement of the emulator to incapacitate the analysis-evading behavior of malicious apps in an Android malicious app dynamic analysis system and showed that such analysis evasion can be incapacitated by modifying the Android framework without using the actual terminal.
Nonetheless, additional studies are needed to enable the analysts to change the data dynamically since the modified data are hardcoded and can be evaded. Moreover, it is necessary to conduct studies to return the actual terminal value of sensors, batteries, and levels in addition to the terminal attribute-specific data corresponding to 27 APIs listed in this study, and we plan to continue studies to solve such issues.
ACKNOWLEDGMENT
This work was supported by Institute for Information &
communications Technology Promotion(IITP) grant funded
by the Korea government(MSIP) (No.R0132-16-1004,
Development of Profiling-based Techniques for Detecting
and Preventing Mobile Billing Fraud Attacks).
REFERENCES
[1] IDC, http://www.idc.com/prodserv/smartphone-market-share.jsp, retrieved: October 2016.
[2] Kaspersky, “Mobile cyber threats”,Kaspersky Lab&Interpol Joint Report, 2014.
[3] Lastline, “Labs Report at RSA: Evasive Malware’s Gone Mainstream”, 2015
[4] Google Mobile Blog, “Android and Security”, 2012.
[5] J. Oberheide, C. Miller, “Dissection the Android Bouncer”, SummerCon, 2012.
[6] T. Vidas and N. Christin, “Evading Android Runtime Analysis via Sandbox Detection”, ASIA CCS’14, pp. 447-458, 2014.
[7] T. Petsas, G. Voyatzis, E. Athanasopoulos, M. Polychronakis and S. Ioannidis, “Rage Against the Virtual Machine: Hindering Dynamic Analysis of Android Malware”, EuroSec’14, Article No. 5, 2014.
[8] DroidBox, https://github.com/pjlantz/droidbox, retrieved: October 2016.
[9] TaintDroid, http://appanalysis.org/, retrieved: October 2016.
[10] M. Lindorfer, M. Neugschwandtner, L. Weichselbaum, Y. Fratantonio, V. Veen and C. Platzer, “Andrubis – 1,000,000 Apps Later: A View on Current Android Malware Behaviors”, BADGERS’14, pp. 3-17, 2014.
[11] CopperDroid, http://copperdroid.isg.rhul.ac.uk/copperdroid/, retrieved: October 2016.
[12] Apk Analyzer, https://www.apk-analyzer.net/, retrieved: October 2016.
[13] Y. Jing, Z. Zhao, G. Ahn and H. Hu, “Morpheus: Automatically Generating Heuristics to Detect Android Emulators”, ACSAC’14, pp. 216-225, 2014.
[14] T. Strazzere, “Dex Education 201 Anti-Emulation”, HITCON2013, 2013.
[15] C. Zhengm, S. Zhu, S. Dai, G. Gu, X. Gong, X. Han and W. Zou, "SmartDroid: an Automatic System for Revealing UI-based Trigger Conditions in Android Applications", SPSM'12, pp. 93-104, 2012.
Fig. 3 The result of the experiment
39Copyright (c) IARIA, 2016. ISBN: 978-1-61208-516-6
INTERNET 2016 : The Eighth International Conference on Evolving Internet
48 / 63
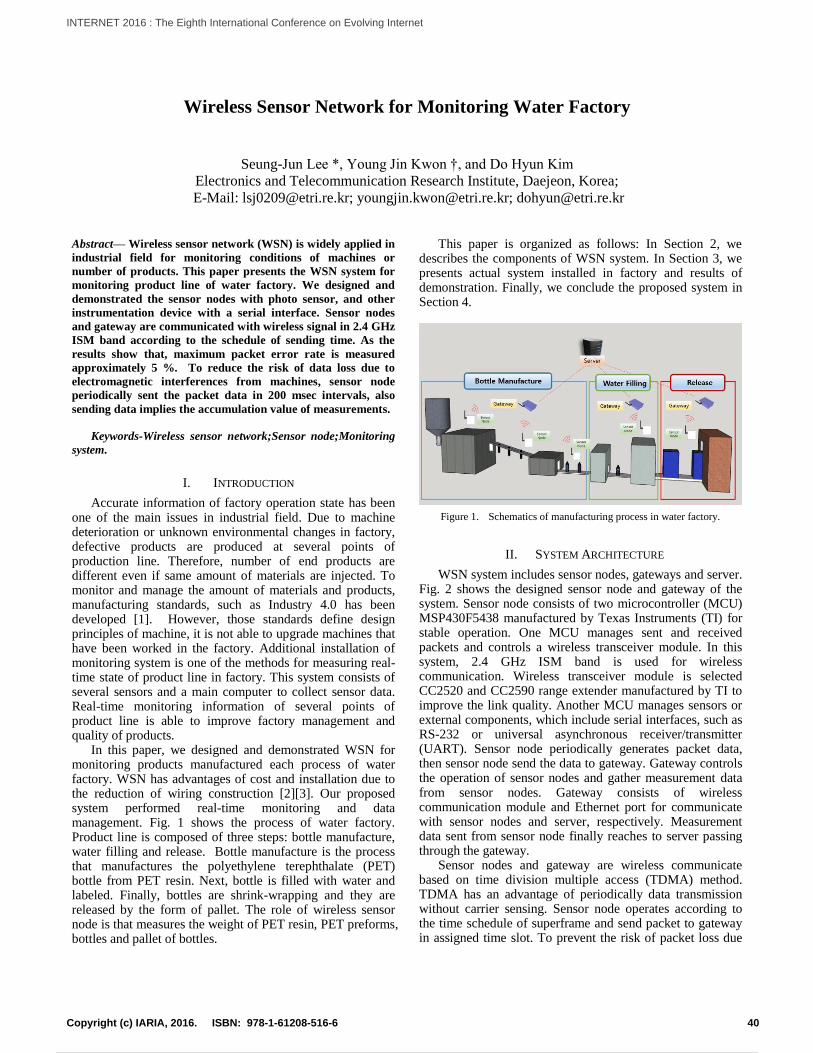
Wireless Sensor Network for Monitoring Water Factory
Seung-Jun Lee *, Young Jin Kwon †, and Do Hyun Kim
Electronics and Telecommunication Research Institute, Daejeon, Korea;
E-Mail: [email protected]; [email protected]; [email protected]
Abstract— Wireless sensor network (WSN) is widely applied in
industrial field for monitoring conditions of machines or
number of products. This paper presents the WSN system for
monitoring product line of water factory. We designed and
demonstrated the sensor nodes with photo sensor, and other
instrumentation device with a serial interface. Sensor nodes
and gateway are communicated with wireless signal in 2.4 GHz
ISM band according to the schedule of sending time. As the
results show that, maximum packet error rate is measured
approximately 5 %. To reduce the risk of data loss due to
electromagnetic interferences from machines, sensor node
periodically sent the packet data in 200 msec intervals, also
sending data implies the accumulation value of measurements.
Keywords-Wireless sensor network;Sensor node;Monitoring
system.
I. INTRODUCTION
Accurate information of factory operation state has been one of the main issues in industrial field. Due to machine deterioration or unknown environmental changes in factory, defective products are produced at several points of production line. Therefore, number of end products are different even if same amount of materials are injected. To monitor and manage the amount of materials and products, manufacturing standards, such as Industry 4.0 has been developed [1]. However, those standards define design principles of machine, it is not able to upgrade machines that have been worked in the factory. Additional installation of monitoring system is one of the methods for measuring real-time state of product line in factory. This system consists of several sensors and a main computer to collect sensor data. Real-time monitoring information of several points of product line is able to improve factory management and quality of products.
In this paper, we designed and demonstrated WSN for monitoring products manufactured each process of water factory. WSN has advantages of cost and installation due to the reduction of wiring construction [2][3]. Our proposed system performed real-time monitoring and data management. Fig. 1 shows the process of water factory. Product line is composed of three steps: bottle manufacture, water filling and release. Bottle manufacture is the process that manufactures the polyethylene terephthalate (PET) bottle from PET resin. Next, bottle is filled with water and labeled. Finally, bottles are shrink-wrapping and they are released by the form of pallet. The role of wireless sensor node is that measures the weight of PET resin, PET preforms, bottles and pallet of bottles.
This paper is organized as follows: In Section 2, we describes the components of WSN system. In Section 3, we presents actual system installed in factory and results of demonstration. Finally, we conclude the proposed system in Section 4.
Figure 1. Schematics of manufacturing process in water factory.
II. SYSTEM ARCHITECTURE
WSN system includes sensor nodes, gateways and server. Fig. 2 shows the designed sensor node and gateway of the system. Sensor node consists of two microcontroller (MCU) MSP430F5438 manufactured by Texas Instruments (TI) for stable operation. One MCU manages sent and received packets and controls a wireless transceiver module. In this system, 2.4 GHz ISM band is used for wireless communication. Wireless transceiver module is selected CC2520 and CC2590 range extender manufactured by TI to improve the link quality. Another MCU manages sensors or external components, which include serial interfaces, such as RS-232 or universal asynchronous receiver/transmitter (UART). Sensor node periodically generates packet data, then sensor node send the data to gateway. Gateway controls the operation of sensor nodes and gather measurement data from sensor nodes. Gateway consists of wireless communication module and Ethernet port for communicate with sensor nodes and server, respectively. Measurement data sent from sensor node finally reaches to server passing through the gateway.
Sensor nodes and gateway are wireless communicate based on time division multiple access (TDMA) method. TDMA has an advantage of periodically data transmission without carrier sensing. Sensor node operates according to the time schedule of superframe and send packet to gateway in assigned time slot. To prevent the risk of packet loss due
40Copyright (c) IARIA, 2016. ISBN: 978-1-61208-516-6
INTERNET 2016 : The Eighth International Conference on Evolving Internet
49 / 63
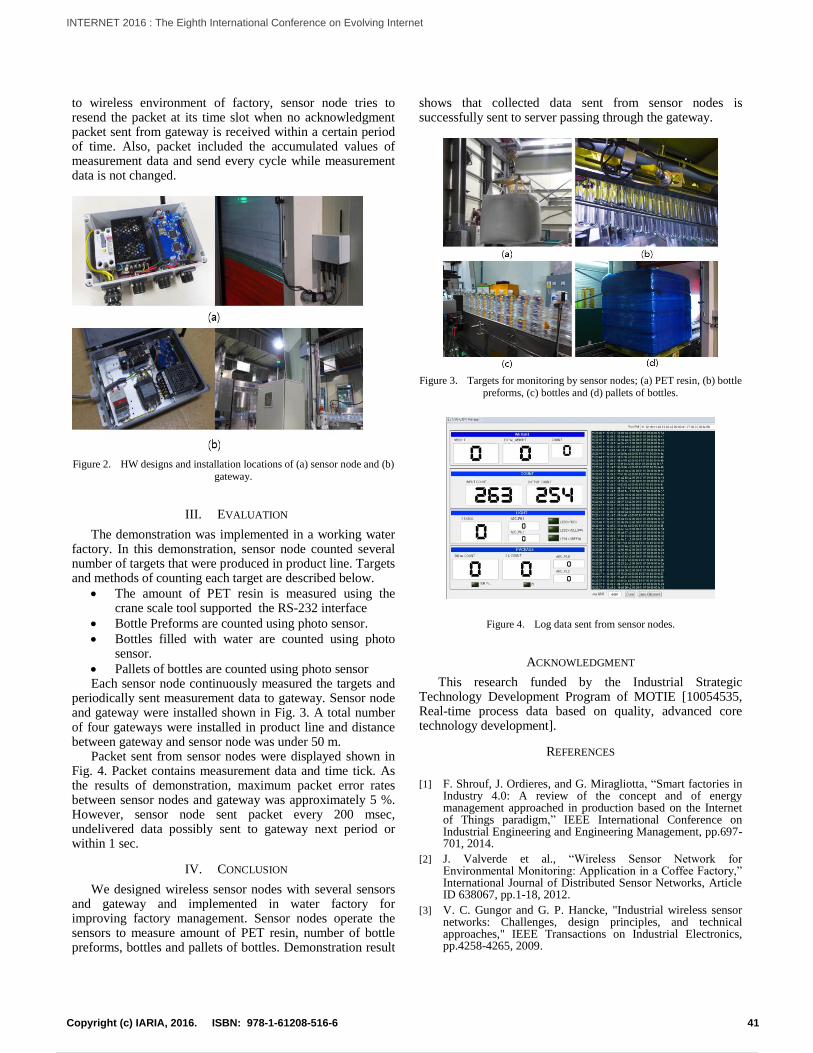
to wireless environment of factory, sensor node tries to resend the packet at its time slot when no acknowledgment packet sent from gateway is received within a certain period of time. Also, packet included the accumulated values of measurement data and send every cycle while measurement data is not changed.
Figure 2. HW designs and installation locations of (a) sensor node and (b)
gateway.
III. EVALUATION
The demonstration was implemented in a working water factory. In this demonstration, sensor node counted several number of targets that were produced in product line. Targets and methods of counting each target are described below.
The amount of PET resin is measured using the crane scale tool supported the RS-232 interface
Bottle Preforms are counted using photo sensor.
Bottles filled with water are counted using photo sensor.
Pallets of bottles are counted using photo sensor Each sensor node continuously measured the targets and
periodically sent measurement data to gateway. Sensor node and gateway were installed shown in Fig. 3. A total number of four gateways were installed in product line and distance between gateway and sensor node was under 50 m.
Packet sent from sensor nodes were displayed shown in Fig. 4. Packet contains measurement data and time tick. As the results of demonstration, maximum packet error rates between sensor nodes and gateway was approximately 5 %. However, sensor node sent packet every 200 msec, undelivered data possibly sent to gateway next period or within 1 sec.
IV. CONCLUSION
We designed wireless sensor nodes with several sensors and gateway and implemented in water factory for improving factory management. Sensor nodes operate the sensors to measure amount of PET resin, number of bottle preforms, bottles and pallets of bottles. Demonstration result
shows that collected data sent from sensor nodes is successfully sent to server passing through the gateway.
Figure 3. Targets for monitoring by sensor nodes; (a) PET resin, (b) bottle
preforms, (c) bottles and (d) pallets of bottles.
Figure 4. Log data sent from sensor nodes.
ACKNOWLEDGMENT
This research funded by the Industrial Strategic Technology Development Program of MOTIE [10054535, Real-time process data based on quality, advanced core technology development].
REFERENCES
[1] F. Shrouf, J. Ordieres, and G. Miragliotta, “Smart factories in
Industry 4.0: A review of the concept and of energy management approached in production based on the Internet of Things paradigm,” IEEE International Conference on Industrial Engineering and Engineering Management, pp.697-701, 2014.
[2] J. Valverde et al., “Wireless Sensor Network for Environmental Monitoring: Application in a Coffee Factory,” International Journal of Distributed Sensor Networks, Article ID 638067, pp.1-18, 2012.
[3] V. C. Gungor and G. P. Hancke, "Industrial wireless sensor networks: Challenges, design principles, and technical approaches," IEEE Transactions on Industrial Electronics, pp.4258-4265, 2009.
41Copyright (c) IARIA, 2016. ISBN: 978-1-61208-516-6
INTERNET 2016 : The Eighth International Conference on Evolving Internet
50 / 63
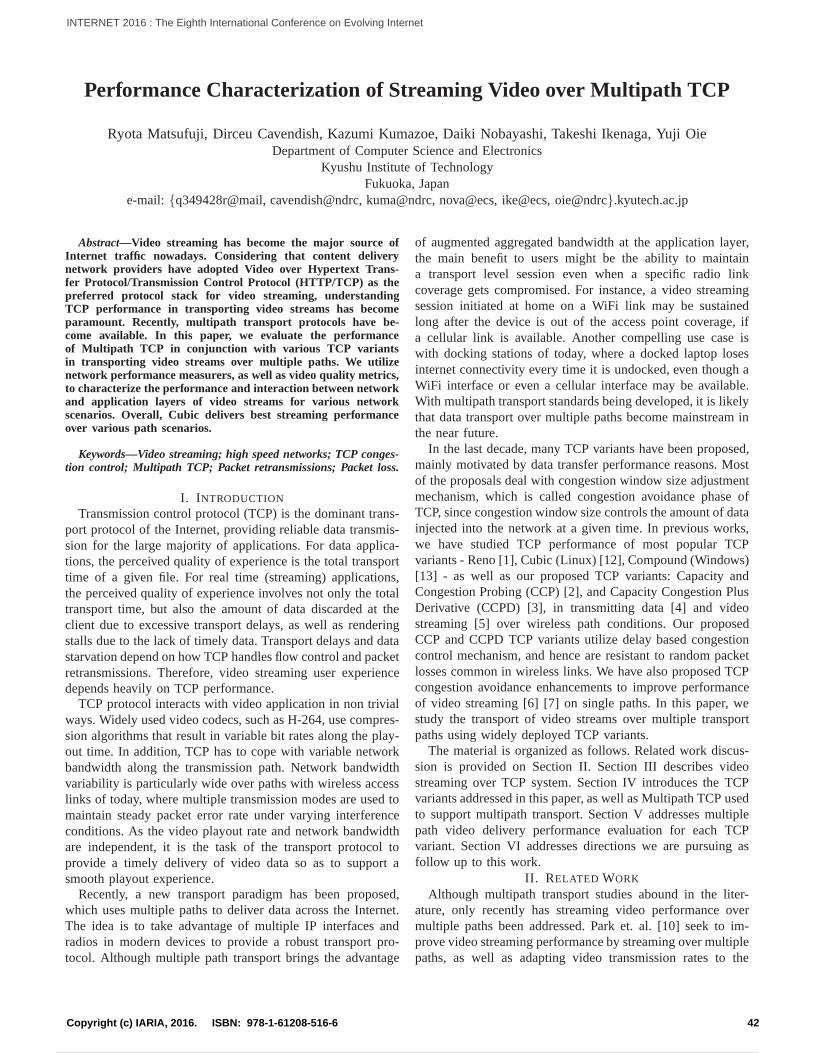
Performance Characterization of Streaming Video over Multipath TCP
Ryota Matsufuji, Dirceu Cavendish, Kazumi Kumazoe, Daiki Nobayashi, Takeshi Ikenaga, Yuji OieDepartment of Computer Science and Electronics
Kyushu Institute of TechnologyFukuoka, Japan
e-mail: {q349428r@mail, cavendish@ndrc, kuma@ndrc, nova@ecs, ike@ecs, oie@ndrc}.kyutech.ac.jp
Abstract—Video streaming has become the major source ofInternet traffic nowadays. Considering that content deliverynetwork providers have adopted Video over Hypertext Trans-fer Protocol/Transmission Control Protocol (HTTP/TCP) as thepreferred protocol stack for video streaming, understandingTCP performance in transporting video streams has becomeparamount. Recently, multipath transport protocols have be-come available. In this paper, we evaluate the performanceof Multipath TCP in conjunction with various TCP variantsin transporting video streams over multiple paths. We utilizenetwork performance measurers, as well as video quality metrics,to characterize the performance and interaction between networkand application layers of video streams for various networkscenarios. Overall, Cubic delivers best streaming performanceover various path scenarios.
Keywords—Video streaming; high speed networks; TCP conges-tion control; Multipath TCP; Packet retransmissions; Packet loss.
I. I NTRODUCTION
Transmission control protocol (TCP) is the dominant trans-port protocol of the Internet, providing reliable data transmis-sion for the large majority of applications. For data applica-tions, the perceived quality of experience is the total transporttime of a given file. For real time (streaming) applications,the perceived quality of experience involves not only the totaltransport time, but also the amount of data discarded at theclient due to excessive transport delays, as well as renderingstalls due to the lack of timely data. Transport delays and datastarvation depend on how TCP handles flow control and packetretransmissions. Therefore, video streaming user experiencedepends heavily on TCP performance.
TCP protocol interacts with video application in non trivialways. Widely used video codecs, such as H-264, use compres-sion algorithms that result in variable bit rates along the play-out time. In addition, TCP has to cope with variable networkbandwidth along the transmission path. Network bandwidthvariability is particularly wide over paths with wireless accesslinks of today, where multiple transmission modes are used tomaintain steady packet error rate under varying interferenceconditions. As the video playout rate and network bandwidthare independent, it is the task of the transport protocol toprovide a timely delivery of video data so as to support asmooth playout experience.
Recently, a new transport paradigm has been proposed,which uses multiple paths to deliver data across the Internet.The idea is to take advantage of multiple IP interfaces andradios in modern devices to provide a robust transport pro-tocol. Although multiple path transport brings the advantage
of augmented aggregated bandwidth at the application layer,the main benefit to users might be the ability to maintaina transport level session even when a specific radio linkcoverage gets compromised. For instance, a video streamingsession initiated at home on a WiFi link may be sustainedlong after the device is out of the access point coverage, ifa cellular link is available. Another compelling use case iswith docking stations of today, where a docked laptop losesinternet connectivity every time it is undocked, even though aWiFi interface or even a cellular interface may be available.With multipath transport standards being developed, it is likelythat data transport over multiple paths become mainstream inthe near future.
In the last decade, many TCP variants have been proposed,mainly motivated by data transfer performance reasons. Mostof the proposals deal with congestion window size adjustmentmechanism, which is called congestion avoidance phase ofTCP, since congestion window size controls the amount of datainjected into the network at a given time. In previous works,we have studied TCP performance of most popular TCPvariants - Reno [1], Cubic (Linux) [12], Compound (Windows)[13] - as well as our proposed TCP variants: Capacity andCongestion Probing (CCP) [2], and Capacity Congestion PlusDerivative (CCPD) [3], in transmitting data [4] and videostreaming [5] over wireless path conditions. Our proposedCCP and CCPD TCP variants utilize delay based congestioncontrol mechanism, and hence are resistant to random packetlosses common in wireless links. We have also proposed TCPcongestion avoidance enhancements to improve performanceof video streaming [6] [7] on single paths. In this paper, westudy the transport of video streams over multiple transportpaths using widely deployed TCP variants.
The material is organized as follows. Related work discus-sion is provided on Section II. Section III describes videostreaming over TCP system. Section IV introduces the TCPvariants addressed in this paper, as well as Multipath TCP usedto support multipath transport. Section V addresses multiplepath video delivery performance evaluation for each TCPvariant. Section VI addresses directions we are pursuing asfollow up to this work.
II. RELATED WORK
Although multipath transport studies abound in the liter-ature, only recently has streaming video performance overmultiple paths been addressed. Park et. al. [10] seek to im-prove video streaming performance by streaming over multiplepaths, as well as adapting video transmission rates to the
42Copyright (c) IARIA, 2016. ISBN: 978-1-61208-516-6
INTERNET 2016 : The Eighth International Conference on Evolving Internet
51 / 63

network bandwidth available. Such approach, best suited todistributed content delivery systems, requires coordinationbetween multiple distribution sites. In contrast, we seek tounderstand network transport session carrying a video sessionby characterizing underneath TCP variants, independentlyofthe video encoder.
Wu et. al. [14] advocate the use of a Forward Error Cor-rection (FEC) coding to remedy artifacts on video streamingdue to packet retransmissions on stringent delay constraintscenarios. Their framework seeks to improve video qualityby formulating a combined FEC and path rate allocationoptimization problem which takes into account paths packetloss, latency, as well as available bandwidth. Video codec,as well as MPTCP resource allocation, are affected, althoughTCP variants’ impact on performance is not investigated, asin this paper.
Corbillon et al. [8] propose a cross layer scheduler whichprioritizes video frames with best chance of being playedout on time. Hence, late frames are discarded at the source,whereas frames with tight deadlines are given delivery pri-ority. The approach requires coupling between applicationand MPTCP transport layers. In contrast, we evaluate videostreaming performance of video/transport stacks that operateindependently, focusing instead on performance differencesdue to popular TCP variants.
A distinct aspect of our current work is that we analyzethe performance of video streaming over multipath TCP usingwidespread TCP variants, evaluating them on real client andserver network stacks widely deployed for video streaming viaVLC open source video client and standard HTTP server.
III. V IDEO STREAMING OVER TCP
Video streaming over HTTP/TCP involves an HTTP serverside, where video files are made available for streamingupon HTTP requests, and a video client, which places HTTPrequests to the server over the Internet, for video streaming.Fig. 1 illustrates video streaming components.
cwndrwnd
playout buffer
videorendering
Client Server
awnd TCP
Application
video file
Internet
packetization
Figure 1: Video Streaming over TCP
An HTTP server stores encoded video files, available uponHTTP requests. Once a request is placed, a TCP sender isinstantiated to transmit packetized data to the client machine.At TCP transport layer, a congestion window is used for flowcontrolling the amount of data injected into the network. Thesize of the congestion window,cwnd, is adjusted dynamically,according to the level of congestion in the network, as wellas the space available for data storage,awnd, at the TCPclient receiver buffer. Congestion window space is freed only
when data packets are acknowledged by the receiver, so thatlost packets are retransmitted by the TCP layer. At the clientside, in addition to acknowledging arriving packets, TCPreceiver sends back its current available spaceawnd, so thatat the sender side,cwnd ≤ awnd at all times. At the clientapplication layer, a video player extracts data from a playoutbuffer, filled with packets delivered by TCP receiver from itsbuffer. The playout buffer is used to smooth out variable dataarrival rate.
A. Interaction between Video streaming and TCP
At the server side, HTTP server retrieves data into the TCPsender buffer according withcwnd size. Hence, the injectionrate of video data into the TCP buffer is different than thevideo variable encoding rate. In addition, TCP throughputperformance is affected by the round trip time of the TCPsession. This is a direct consequence of the congestion windowmechanism of TCP, where only up to acwnd worth of bytescan be delivered without acknowledgements. Hence, for a fixedcwnd size, from the sending of the first packet until the firstacknowledgement arrives, a TCP session throughput is cappedat cwnd/rtt. For each TCP congestion avoidance scheme,the size of the congestion window is computed by a specificalgorithm at time of packet acknowledgement reception bythe TCP source. However, for all schemes, the size of thecongestion window is capped by the available TCP receiverspaceawnd sent back from the TCP client.
At the client side, the video data is retrieved by the videoplayer into a playout buffer, and delivered to the video ren-derer. Playout buffer may underflow, if TCP receiver windowempties out. On the other hand, playout buffer overflow doesnot occur, since the player will not pull more data into theplayout buffer than it can handle.
In summary, video data packets are injected into the networkonly if space is available at the TCP congestion window.Arriving packets at the client are stored at the TCP receiverbuffer, and extracted by the video playout client at the videonominal playout rate.
IV. A NATOMY OF TRANSMISSION CONTROL PROTOCOL
TCP protocols fall into two categories, delay and loss based.Advanced loss based TCP protocols use packet loss as primarycongestion indication signal, performing window regulation ascwndk = f(cwndk−1), being ack reception paced. Mostffunctions follow an Additive Increase Multiplicative Decreasestrategy, with various increase and decrease parameters. TCPNewReno [1] and Cubic [12] are examples of additive increasemultiplicative decrease (AIMD) strategies. Delay based TCPprotocols, on the other hand, use queue delay informationas the congestion indication signal, increasing/decreasing thewindow if the delay is small/large, respectively. Compound[13], CCP [2] and CCPD [3] are examples of delay basedprotocols.
Most TCP variants follow TCP Reno phase framework: slowstart, congestion avoidance, fast retransmit, and fast recovery.
43Copyright (c) IARIA, 2016. ISBN: 978-1-61208-516-6
INTERNET 2016 : The Eighth International Conference on Evolving Internet
52 / 63
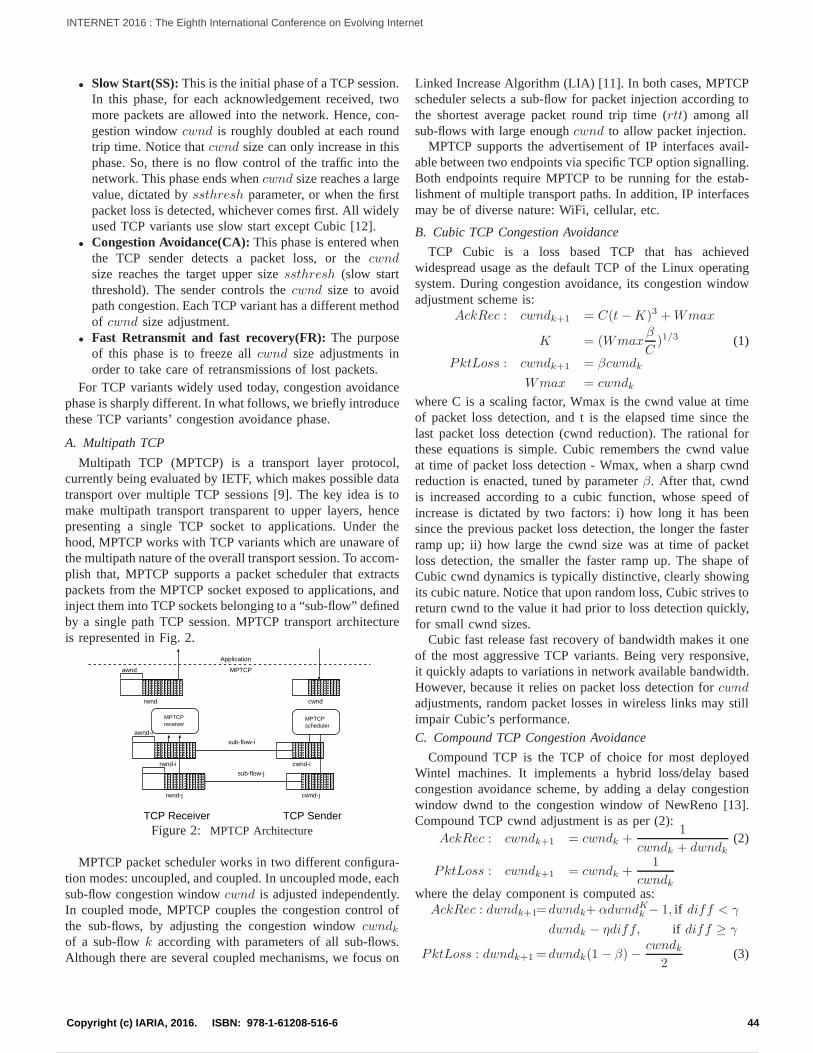
• Slow Start(SS):This is the initial phase of a TCP session.In this phase, for each acknowledgement received, twomore packets are allowed into the network. Hence, con-gestion windowcwnd is roughly doubled at each roundtrip time. Notice thatcwnd size can only increase in thisphase. So, there is no flow control of the traffic into thenetwork. This phase ends whencwnd size reaches a largevalue, dictated byssthresh parameter, or when the firstpacket loss is detected, whichever comes first. All widelyused TCP variants use slow start except Cubic [12].
• Congestion Avoidance(CA):This phase is entered whenthe TCP sender detects a packet loss, or thecwndsize reaches the target upper sizessthresh (slow startthreshold). The sender controls thecwnd size to avoidpath congestion. Each TCP variant has a different methodof cwnd size adjustment.
• Fast Retransmit and fast recovery(FR):The purposeof this phase is to freeze allcwnd size adjustments inorder to take care of retransmissions of lost packets.
For TCP variants widely used today, congestion avoidancephase is sharply different. In what follows, we briefly introducethese TCP variants’ congestion avoidance phase.
A. Multipath TCP
Multipath TCP (MPTCP) is a transport layer protocol,currently being evaluated by IETF, which makes possible datatransport over multiple TCP sessions [9]. The key idea is tomake multipath transport transparent to upper layers, hencepresenting a single TCP socket to applications. Under thehood, MPTCP works with TCP variants which are unaware ofthe multipath nature of the overall transport session. To accom-plish that, MPTCP supports a packet scheduler that extractspackets from the MPTCP socket exposed to applications, andinject them into TCP sockets belonging to a “sub-flow” definedby a single path TCP session. MPTCP transport architectureis represented in Fig. 2.
cwndrwnd
awnd-i
MPTCP
Application
sub-flow-i
cwnd-irwnd-i
TCP Receiver TCP Sender
sub-flow-j
cwnd-jrwnd-j
MPTCPscheduler
MPTCPreceiver
awnd
Figure 2: MPTCP Architecture
MPTCP packet scheduler works in two different configura-tion modes: uncoupled, and coupled. In uncoupled mode, eachsub-flow congestion windowcwnd is adjusted independently.In coupled mode, MPTCP couples the congestion control ofthe sub-flows, by adjusting the congestion windowcwndkof a sub-flowk according with parameters of all sub-flows.Although there are several coupled mechanisms, we focus on
Linked Increase Algorithm (LIA) [11]. In both cases, MPTCPscheduler selects a sub-flow for packet injection accordingtothe shortest average packet round trip time (rtt) among allsub-flows with large enoughcwnd to allow packet injection.
MPTCP supports the advertisement of IP interfaces avail-able between two endpoints via specific TCP option signalling.Both endpoints require MPTCP to be running for the estab-lishment of multiple transport paths. In addition, IP interfacesmay be of diverse nature: WiFi, cellular, etc.
B. Cubic TCP Congestion Avoidance
TCP Cubic is a loss based TCP that has achievedwidespread usage as the default TCP of the Linux operatingsystem. During congestion avoidance, its congestion windowadjustment scheme is:
AckRec : cwndk+1 = C(t−K)3 +Wmax
K = (Wmaxβ
C)1/3 (1)
PktLoss : cwndk+1 = βcwndk
Wmax = cwndk
where C is a scaling factor, Wmax is the cwnd value at timeof packet loss detection, and t is the elapsed time since thelast packet loss detection (cwnd reduction). The rational forthese equations is simple. Cubic remembers the cwnd valueat time of packet loss detection - Wmax, when a sharp cwndreduction is enacted, tuned by parameterβ. After that, cwndis increased according to a cubic function, whose speed ofincrease is dictated by two factors: i) how long it has beensince the previous packet loss detection, the longer the fasterramp up; ii) how large the cwnd size was at time of packetloss detection, the smaller the faster ramp up. The shape ofCubic cwnd dynamics is typically distinctive, clearly showingits cubic nature. Notice that upon random loss, Cubic strives toreturn cwnd to the value it had prior to loss detection quickly,for small cwnd sizes.
Cubic fast release fast recovery of bandwidth makes it oneof the most aggressive TCP variants. Being very responsive,it quickly adapts to variations in network available bandwidth.However, because it relies on packet loss detection forcwndadjustments, random packet losses in wireless links may stillimpair Cubic’s performance.
C. Compound TCP Congestion Avoidance
Compound TCP is the TCP of choice for most deployedWintel machines. It implements a hybrid loss/delay basedcongestion avoidance scheme, by adding a delay congestionwindow dwnd to the congestion window of NewReno [13].Compound TCP cwnd adjustment is as per (2):
AckRec : cwndk+1 = cwndk +1
cwndk + dwndk(2)
PktLoss : cwndk+1 = cwndk +1
cwndkwhere the delay component is computed as:
AckRec : dwndk+1=dwndk+ αdwndKk − 1, if diff < γ
dwndk − ηdiff, if diff ≥ γ
PktLoss : dwndk+1 =dwndk(1 − β)−cwndk
2(3)
44Copyright (c) IARIA, 2016. ISBN: 978-1-61208-516-6
INTERNET 2016 : The Eighth International Conference on Evolving Internet
53 / 63
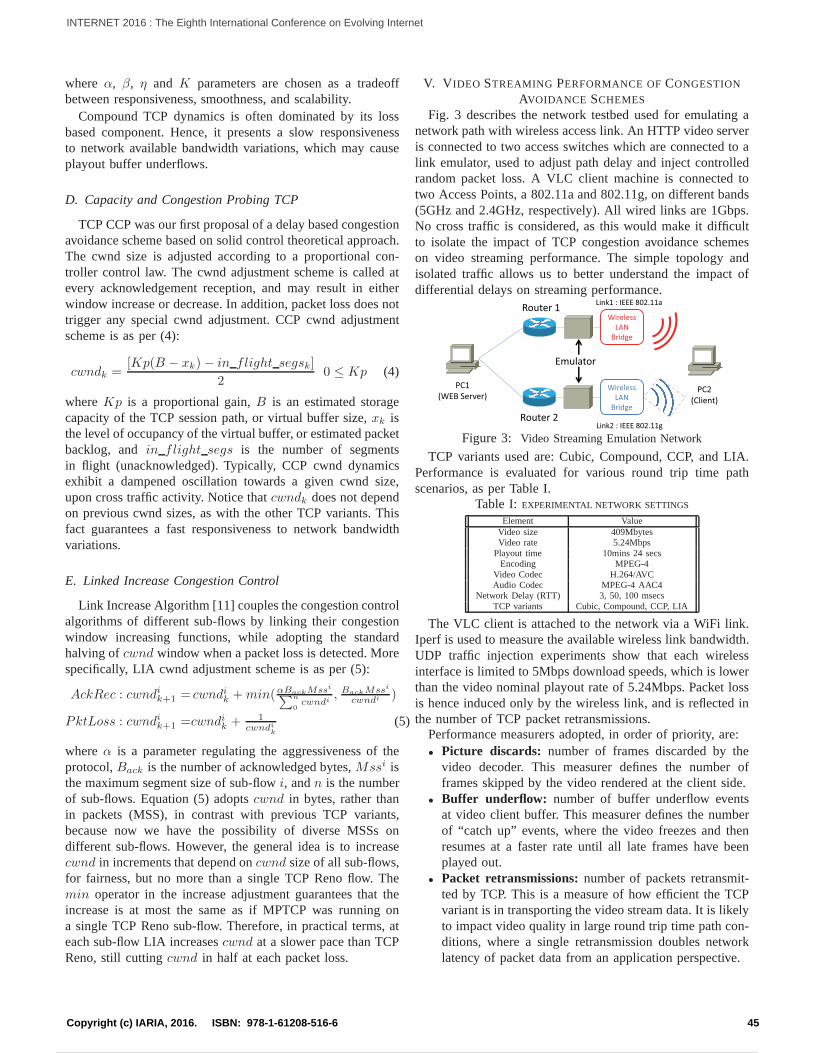
whereα, β, η and K parameters are chosen as a tradeoffbetween responsiveness, smoothness, and scalability.
Compound TCP dynamics is often dominated by its lossbased component. Hence, it presents a slow responsivenessto network available bandwidth variations, which may causeplayout buffer underflows.
D. Capacity and Congestion Probing TCP
TCP CCP was our first proposal of a delay based congestionavoidance scheme based on solid control theoretical approach.The cwnd size is adjusted according to a proportional con-troller control law. The cwnd adjustment scheme is called atevery acknowledgement reception, and may result in eitherwindow increase or decrease. In addition, packet loss does nottrigger any special cwnd adjustment. CCP cwnd adjustmentscheme is as per (4):
cwndk =[Kp(B − xk)− in flight segsk]
20 ≤ Kp (4)
whereKp is a proportional gain,B is an estimated storagecapacity of the TCP session path, or virtual buffer size,xk isthe level of occupancy of the virtual buffer, or estimated packetbacklog, andin flight segs is the number of segmentsin flight (unacknowledged). Typically, CCP cwnd dynamicsexhibit a dampened oscillation towards a given cwnd size,upon cross traffic activity. Notice thatcwndk does not dependon previous cwnd sizes, as with the other TCP variants. Thisfact guarantees a fast responsiveness to network bandwidthvariations.
E. Linked Increase Congestion Control
Link Increase Algorithm [11] couples the congestion controlalgorithms of different sub-flows by linking their congestionwindow increasing functions, while adopting the standardhalving ofcwnd window when a packet loss is detected. Morespecifically, LIA cwnd adjustment scheme is as per (5):
AckRec : cwndik+1 = cwndik +min(αBackMssi∑n
0cwndi
, BackMssi
cwndi )
PktLoss : cwndik+1 =cwndik + 1
cwndi
k
(5)
whereα is a parameter regulating the aggressiveness of theprotocol,Back is the number of acknowledged bytes,Mssi isthe maximum segment size of sub-flowi, andn is the numberof sub-flows. Equation (5) adoptscwnd in bytes, rather thanin packets (MSS), in contrast with previous TCP variants,because now we have the possibility of diverse MSSs ondifferent sub-flows. However, the general idea is to increasecwnd in increments that depend oncwnd size of all sub-flows,for fairness, but no more than a single TCP Reno flow. Themin operator in the increase adjustment guarantees that theincrease is at most the same as if MPTCP was running ona single TCP Reno sub-flow. Therefore, in practical terms, ateach sub-flow LIA increasescwnd at a slower pace than TCPReno, still cuttingcwnd in half at each packet loss.
V. V IDEO STREAMING PERFORMANCE OFCONGESTION
AVOIDANCE SCHEMES
Fig. 3 describes the network testbed used for emulating anetwork path with wireless access link. An HTTP video serveris connected to two access switches which are connected to alink emulator, used to adjust path delay and inject controlledrandom packet loss. A VLC client machine is connected totwo Access Points, a 802.11a and 802.11g, on different bands(5GHz and 2.4GHz, respectively). All wired links are 1Gbps.No cross traffic is considered, as this would make it difficultto isolate the impact of TCP congestion avoidance schemeson video streaming performance. The simple topology andisolated traffic allows us to better understand the impact ofdifferential delays on streaming performance.
PC1
(WEB Server)PC2
(Client)
Router 1
Router 2
Emulator
Wireless
LAN
Bridge
Wireless
LAN
Bridge
Link1 : IEEE 802.11a
Link2 : IEEE 802.11g
Figure 3: Video Streaming Emulation Network
TCP variants used are: Cubic, Compound, CCP, and LIA.Performance is evaluated for various round trip time pathscenarios, as per Table I.
Table I: EXPERIMENTAL NETWORK SETTINGS
Element ValueVideo size 409MbytesVideo rate 5.24Mbps
Playout time 10mins 24 secsEncoding MPEG-4
Video Codec H.264/AVCAudio Codec MPEG-4 AAC4
Network Delay (RTT) 3, 50, 100 msecsTCP variants Cubic, Compound, CCP, LIA
The VLC client is attached to the network via a WiFi link.Iperf is used to measure the available wireless link bandwidth.UDP traffic injection experiments show that each wirelessinterface is limited to 5Mbps download speeds, which is lowerthan the video nominal playout rate of 5.24Mbps. Packet lossis hence induced only by the wireless link, and is reflected inthe number of TCP packet retransmissions.
Performance measurers adopted, in order of priority, are:• Picture discards: number of frames discarded by the
video decoder. This measurer defines the number offrames skipped by the video rendered at the client side.
• Buffer underflow: number of buffer underflow eventsat video client buffer. This measurer defines the numberof “catch up” events, where the video freezes and thenresumes at a faster rate until all late frames have beenplayed out.
• Packet retransmissions:number of packets retransmit-ted by TCP. This is a measure of how efficient the TCPvariant is in transporting the video stream data. It is likelyto impact video quality in large round trip time path con-ditions, where a single retransmission doubles networklatency of packet data from an application perspective.
45Copyright (c) IARIA, 2016. ISBN: 978-1-61208-516-6
INTERNET 2016 : The Eighth International Conference on Evolving Internet
54 / 63
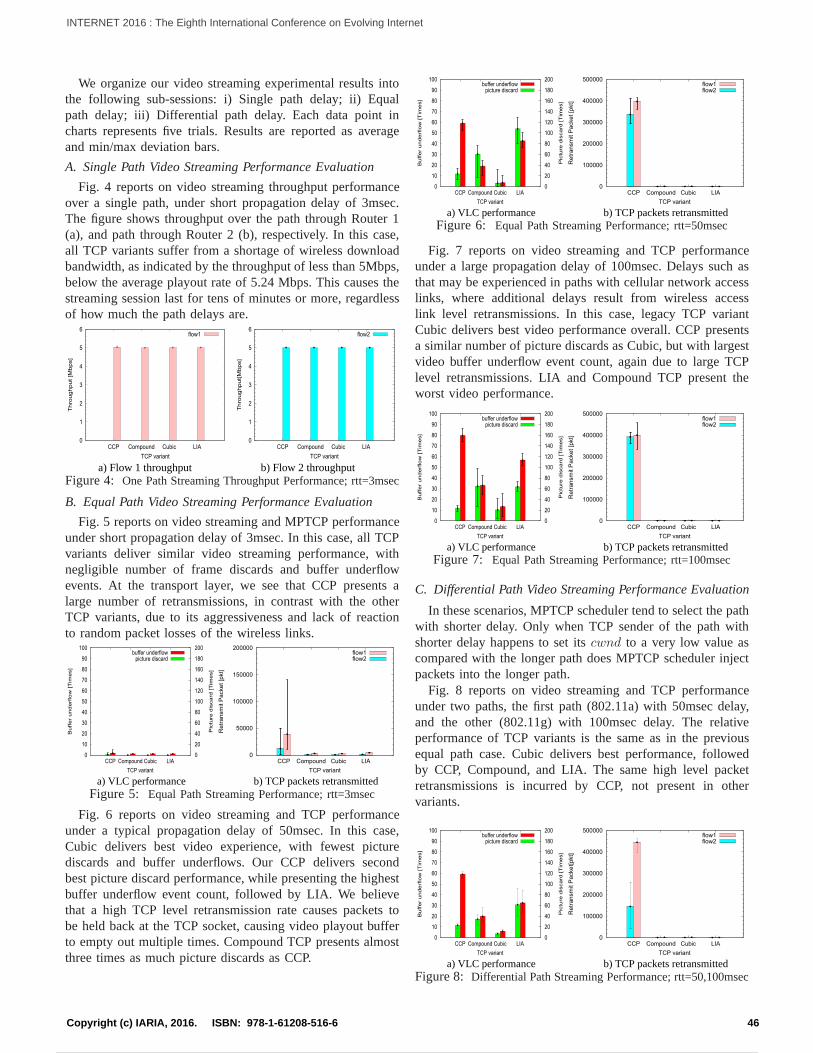
We organize our video streaming experimental results intothe following sub-sessions: i) Single path delay; ii) Equalpath delay; iii) Differential path delay. Each data point incharts represents five trials. Results are reported as averageand min/max deviation bars.
A. Single Path Video Streaming Performance Evaluation
Fig. 4 reports on video streaming throughput performanceover a single path, under short propagation delay of 3msec.The figure shows throughput over the path through Router 1(a), and path through Router 2 (b), respectively. In this case,all TCP variants suffer from a shortage of wireless downloadbandwidth, as indicated by the throughput of less than 5Mbps,below the average playout rate of 5.24 Mbps. This causes thestreaming session last for tens of minutes or more, regardlessof how much the path delays are.
a) Flow 1 throughput b) Flow 2 throughput
0
1
2
3
4
5
6
CCP Compound Cubic LIA
Th
rou
gh
pu
t [M
bp
s]
TCP variant
flow1
0
1
2
3
4
5
6
CCP Compound Cubic LIA
Th
rou
gh
pu
t[M
bp
s]
TCP variant
flow2
Figure 4: One Path Streaming Throughput Performance; rtt=3msec
B. Equal Path Video Streaming Performance Evaluation
Fig. 5 reports on video streaming and MPTCP performanceunder short propagation delay of 3msec. In this case, all TCPvariants deliver similar video streaming performance, withnegligible number of frame discards and buffer underflowevents. At the transport layer, we see that CCP presents alarge number of retransmissions, in contrast with the otherTCP variants, due to its aggressiveness and lack of reactionto random packet losses of the wireless links.
a) VLC performance b) TCP packets retransmitted
0
10
20
30
40
50
60
70
80
90
100
CCP Compound Cubic LIA 0
20
40
60
80
100
120
140
160
180
200
Bu
ffe
r u
nd
erf
low
[T
ime
s]
Pic
ture
dis
ca
rd [
Tim
es]
TCP variant
buffer underflowpicture discard
0
50000
100000
150000
200000
CCP Compound Cubic LIA
Re
tra
nsm
it P
acke
t [p
kt]
TCP variant
flow1flow2
Figure 5: Equal Path Streaming Performance; rtt=3msec
Fig. 6 reports on video streaming and TCP performanceunder a typical propagation delay of 50msec. In this case,Cubic delivers best video experience, with fewest picturediscards and buffer underflows. Our CCP delivers secondbest picture discard performance, while presenting the highestbuffer underflow event count, followed by LIA. We believethat a high TCP level retransmission rate causes packets tobe held back at the TCP socket, causing video playout bufferto empty out multiple times. Compound TCP presents almostthree times as much picture discards as CCP.
a) VLC performance b) TCP packets retransmitted
0
10
20
30
40
50
60
70
80
90
100
CCP Compound Cubic LIA 0
20
40
60
80
100
120
140
160
180
200
Bu
ffe
r u
nd
erf
low
[T
ime
s]
Pic
ture
dis
ca
rd [
Tim
es]
TCP variant
buffer underflowpicture discard
0
100000
200000
300000
400000
500000
CCP Compound Cubic LIA
Re
tra
nsm
it P
acke
t [p
kt]
TCP variant
flow1flow2
Figure 6: Equal Path Streaming Performance; rtt=50msec
Fig. 7 reports on video streaming and TCP performanceunder a large propagation delay of 100msec. Delays such asthat may be experienced in paths with cellular network accesslinks, where additional delays result from wireless accesslink level retransmissions. In this case, legacy TCP variantCubic delivers best video performance overall. CCP presentsa similar number of picture discards as Cubic, but with largestvideo buffer underflow event count, again due to large TCPlevel retransmissions. LIA and Compound TCP present theworst video performance.
a) VLC performance b) TCP packets retransmitted
0
10
20
30
40
50
60
70
80
90
100
CCP Compound Cubic LIA 0
20
40
60
80
100
120
140
160
180
200B
uff
er
un
de
rflo
w [
Tim
es]
Pic
ture
dis
ca
rd [
Tim
es]
TCP variant
buffer underflowpicture discard
0
100000
200000
300000
400000
500000
CCP Compound Cubic LIA
Re
tra
nsm
it P
acke
t [p
kt]
TCP variant
flow1flow2
Figure 7: Equal Path Streaming Performance; rtt=100msec
C. Differential Path Video Streaming Performance Evaluation
In these scenarios, MPTCP scheduler tend to select the pathwith shorter delay. Only when TCP sender of the path withshorter delay happens to set itscwnd to a very low value ascompared with the longer path does MPTCP scheduler injectpackets into the longer path.
Fig. 8 reports on video streaming and TCP performanceunder two paths, the first path (802.11a) with 50msec delay,and the other (802.11g) with 100msec delay. The relativeperformance of TCP variants is the same as in the previousequal path case. Cubic delivers best performance, followedby CCP, Compound, and LIA. The same high level packetretransmissions is incurred by CCP, not present in othervariants.
a) VLC performance b) TCP packets retransmitted
0
10
20
30
40
50
60
70
80
90
100
CCP Compound Cubic LIA 0
20
40
60
80
100
120
140
160
180
200
Bu
ffe
r u
nd
erf
low
[T
ime
s]
Pic
ture
dis
ca
rd [
Tim
es]
TCP variant
buffer underflowpicture discard
0
100000
200000
300000
400000
500000
CCP Compound Cubic LIA
Re
tra
nsm
it P
acke
t[p
kt]
TCP variant
flow1flow2
Figure 8: Differential Path Streaming Performance; rtt=50,100msec
46Copyright (c) IARIA, 2016. ISBN: 978-1-61208-516-6
INTERNET 2016 : The Eighth International Conference on Evolving Internet
55 / 63

We have also tracked video streaming and TCP performancewith path delay values swapped as compared with previouscase: 802.11a path with 50msec delay, and 802.11g path with100msec delay. The relative performance of TCP variantsremains the same as in the previous case. To understand why,we monitored path utilization by tracking sub-flow sequencenumbers. Fig. 9 plots Cubic TCP session sequence numberdynamics of a video stream for a differential delay of 50msecs. Figs. 9 a) and b) show reversed path differential cases.Notice that flow 1 always presents higher SN slope, due tothe fact that path 2 wireless link has less bandwidth than path1, and Cubic adjusts to it by reducing flow 2cwnd muchfurther than flow 1cwnd. The amount of differential delay alsoimpacts utilization of path 2. In addition, SN progressing issteady, which means that MPTCP scheduler keeps distributingpackets across both paths throughout the video session.
a) p1: 50msec; p2: 100msec b) p1: 100msec; p2: 50msec
0
5e+07
1e+08
1.5e+08
2e+08
2.5e+08
3e+08
3.5e+08
4e+08
4.5e+08
10:06:00
10:08:00
10:10:00
10:12:00
10:14:00
Su
bflo
w S
eq
ue
nce
Nu
mb
er
Time
Flow 1Flow 2
0
5e+07
1e+08
1.5e+08
2e+08
2.5e+08
3e+08
3.5e+08
4e+08
4.5e+08
16:08:00
16:10:00
16:12:00
16:14:00
16:16:00
Su
bflo
w S
eq
ue
nce
Nu
mb
er
Time
Flow 1Flow 2
Figure 9: Cubic Seq. Num. Dynamics; rtt=50,100msec
About sub-flow utilization, Fig. 10 reports on LIA andCompound TCP variants sub-flow sequence number dynamics.Notice how little LIA utilizes path 2, whereas Compound usesit a little more, but not as much as Cubic.
a) Compound TCP b) LIA TCP
0
5e+07
1e+08
1.5e+08
2e+08
2.5e+08
3e+08
3.5e+08
4e+08
4.5e+08
10:18:00
10:20:00
10:22:00
10:24:00
10:26:00
10:28:00
Subflow
Sequence N
um
ber
Time
Flow 1Flow 2
0
5e+07
1e+08
1.5e+08
2e+08
2.5e+08
3e+08
3.5e+08
4e+08
4.5e+08
10:32:00
10:34:00
10:36:00
10:38:00
10:40:00
10:42:00
Subflow
Sequence N
um
ber
Time
Flow 1Flow 2
Figure 10: Compound/LIA Seq. Num. Dynamics; rtt=50,100msec
In conclusion, although being the recommended TCP vari-ant for MPTCP, LIA delivers worst video performance thanwhen it operates in uncoupled mode with Cubic, Compound,and CCP TCP variants for various dual path settings. LIAalso fails to push more traffic on less bandwidth paths. In ourextensive real time testbed results, Cubic is the clear winner inboth delivering best video streaming over two paths as well asbalancing traffic load. Our CCP TCP variant comes in second,albeit suffering from a large retransmission issue which causesa significant number of buffer underflow events.
In our performance evaluation, we have not attempted totune VLC client to minimize frame discards, even though VLCsettings may be used to lower the number of frame discards.In addition, no tuning of TCP parameters was performed to
better video client performance.
VI. CONCLUSION AND FUTURE WORK
In this paper, we have evaluated Multipath TCP transportof video streaming, using widely deployed TCP variants, aswell as LIA coupled TCP variant currently under considerationby IETF. We have characterized MPTCP performance withthese TCP variants when transporting video streaming overtwo wireless network paths via open source experiments. Ourexperimental results show that Cubic delivers best streamingperformance, with fewer picture discards and less video stalls,across a wide range of path round trip times. As more complexnetwork scenarios present both limited bandwidth paths aswell as differential path delays, we expect similar impact ofthese impairments on video streaming performance.
As MPTCP scheduler switches frequently between paths,driven by cwnd and path delay changes, triggering bufferunderflow events due to frame reordering at the receiver. weare currently studying schemes to reduce buffer underflowevents, especially when path delays are significantly different.We also intend to explore different MPTCP coupling schemes.
ACKNOWLEDGMENTS
This work is supported by JSPS KAKENHI Grant Number16K00131.
REFERENCES
[1] M. Allman, V. Paxson, and W. Stevens, “TCP Congestion Control,”IETF RFC 2581, April 1999.
[2] D. Cavendish, K. Kumazoe, M. Tsuru, Y. Oie, and M. Gerla, “Capacityand Congestion Probing: TCP Congestion Avoidance via Path Capacityand Storage Estimation,” IEEE Second International Conference onEvolving Internet, best paper award, pp. 42-48, September 2010.
[3] D. Cavendish, H. Kuwahara, K. Kumazoe, M. Tsuru, and Y. Oie, “TCPCongestion Avoidance using Proportional plus Derivative Control,”IARIA Third International Conference on Evolving Internet, best paperaward, pp. 20-25, June 2011.
[4] H. Ishizaki et al., “On Tuning TCP for Superior Performance on HighSpeed Path Scenarios,” IARIA Fourth International Conference onEvolving Internet, best paper award, pp. 11-16, June 2012.
[5] G. Watanabe et al., “Performance Characterization of Streaming Videoover TCP Variants,” IARIA Fifth International Conference on EvolvingInternet, best paper award, pp. 16-21, June 2013.
[6] G. Watanabe et al., “Slow Start TCP Improvements for Video StreamingApplications,” IARIA Sixth International Conference on EvolvingInternet, best paper award, pp. 22-27, June 2014.
[7] D. Cavendish et al., “Congestion Avoidance TCP Improvements forVideo Streaming,” IARIA Seventh International Conferenceon Evolv-ing Internet, best paper award, pp. 22-27, October 2015.
[8] X. Corbillon, R. Aparicio-Pardo, N. Kuhn, G. Texier, andG. Simon,“Cross-Layer Scheduler for Video Streaming over MPTCP,” ACM 7thInternational Conference on Multimedia Systems, May 10-13,2016,Article 7.
[9] A. Ford, et al., “Architectural Guidelines for Multipath TCP Develop-ment,” IETF RFC 6182, 2011.
[10] J-W. Park, R. P. Karrer, and J. Kim,, “TCP-Rome: A Transport-Layer Parallel Streaming Protocol for Real-Time Online MultimediaEnvironments,” In Journal of Communications and Networks,Vol.13,No. 3, pp. 277-285, June 2011.
[11] C. Raiciu, M. Handly, and D. Wischik, “Coupled Congestion Controlfor Multipath Transport Protocols,” IETF RFC 6356, 2011.
[12] I. Rhee, L. Xu, and S. Ha, “CUBIC for Fast Long-Distance Networks,”Internet Draft, draft-rhee-tcpm-ctcp-02, August 2008.
[13] M. Sridharan, K. Tan, D. Bansal, and D. Thaler, “Compound TCP: ANew Congestion Control for High-Speed and Long Distance Networks,”Internet Draft, draft-sridharan-tcpm-ctcp-02, November2008.
[14] J. Wu, C. Yuen, B. Cheng, M. Wang, and J. Chen, “StreamingHigh-Quality Mobile Video with Multipath TCP in Heterogeneous WirelessNetworks,” IEEE Transactions on Mobile Computing, to be published.
47Copyright (c) IARIA, 2016. ISBN: 978-1-61208-516-6
INTERNET 2016 : The Eighth International Conference on Evolving Internet
56 / 63
Optimization of Multi-server Video Content Streaming in 5G Environment
Eugen Borcoci, Tudor Ambarus
University POLITEHNICA of Bucharest
Bucharest, Romania
emails: [email protected],
Joachim Bruneau-Queyreix, Daniel Negru,
LaBRI Lab, University of Bordeaux, Bordeaux, France
emails: [email protected]
Jordi Mongay Batalla, National Institute of
Telecommunications Warsaw, Poland
email: [email protected]
Abstract — This paper presents a preliminary work,
proposing an architectural control plane solution for
optimization of multiple-server video content streaming in 5G
wireless environment. The starting point was an existing video
streaming delivery system, having a light, over-the-top (OTT)
architecture, which performs for each client request of a
content object, an initial selection among multiple servers and
paths, then followed by in-session dynamic media adaptation.
This work extends the above system concepts to a different
environment, i.e., heterogeneous Cloud Radio Access Network
and cooperation with Mobile Edge Computing. The proposed
solution can support recently developed multi-server and
multi-path dynamic adaptive streaming over HTTP.
Keywords — Content delivery; 5G; Server selection; Path
selection; C-RAN; DASH.
I. INTRODUCTION
Content, media and especially video traffic have become significant part of Internet and integrated networks traffic, including mobile one and will still grow in the next years. Estimations show [1][2], that in 5G networks, the data rate required for a mobile user equipment (MUE) will have to increase to 10 Mbps or more for high-definition (HD) video service, and 100 Mbps for ultra-high-definition TV (UHDTV), in various mobility scenarios. Other applications (e.g., 3D video conferences) might require even higher transmission rates up to 10 Gbps. Some forecast [3] show that video traffic (e.g., TV, video on demand, Internet video streaming, peer to peer) is estimated to become between 80 and 90 percent among overall consumer traffic.
On the other side, among the strong requirements to be addressed by 5G [1], some are related to very low end-to-end (E2E) latency (few milliseconds) especially for critical communications. For media video streaming, this requirement could be met by applying content delivery networks (CDN) - like techniques [4], i.e., placing in an intelligent way content servers and replica servers, in the proximity of communities of end users. The content objects are cached in several servers, based on criteria as content popularity, time-life, CDN provider policies, etc. One challenge to be solved in 5G is to decide the locations where to locate the original and caching servers. The solution can be also determined by the 5G architecture adopted for the
Radio Access Network (RAN) and also for the core network, which aggregates and performs control of several heterogeneous RANs [2][5].
This paper proposes a control plane architectural solution for video content delivery optimization, applicable in 4G and or 5G networks environment, if several (multiple) content servers (and/or caching) and paths are available, working to serve a given user. Note that the algorithms and procedures to place the servers and then to place/store/replace the media objects and also the dynamic control of the time-life of the media objects in these servers do not constitute the target of this work.
The starting point of this work has been a previously designed light architecture system [6-8], for efficient video streaming and delivery, acting in Over-the-Top (OTT) style, i.e., controlling only a Content Server and User/Client functionalities and working on top of the current multiple-domain Internet. The system operation is based on collaboration between several entities: a Service Provider (SP), several Content Servers (CS) and the End User (EU). An assumption is valid: the geographical locations of servers and mapping of different media objects to servers are known by the SP management entity. When a user request for a media content object arrives to SP entity, the system performs an initial selection among multiple servers and paths pairs. Then, during the video streaming session, two methods have been used to preserve/enhance the Quality of Experience (QoE) perceived by the user: media flow adaptation (adaptive streaming protocols) and/or server switching. For the video session phase, the Dynamic Adaptive Streaming over Hypertext Transfer Protocol- HTTP (DASH) [10][11], has been selected and implemented.
The novel contribution of this paper consists in the following aspects. First it extends the initial system concepts (shortly described above, and detailed in [6-8]), to novel network environment like 5G having a Cloud Radio Access Network (C-RAN) – based architecture, and possibly including Mobile Edge Computing (MEC) capabilities. Second, for server selection phase it is considered not only an OTT approach but an extension; the network status and channel information, existent at RAN level is used as additional input in the overall optimization algorithm. Third, the system proposed here supposes not only a single-server-at-a-time selection, but multiple servers, allowing a single
48Copyright (c) IARIA, 2016. ISBN: 978-1-61208-516-6
INTERNET 2016 : The Eighth International Conference on Evolving Internet
57 / 63
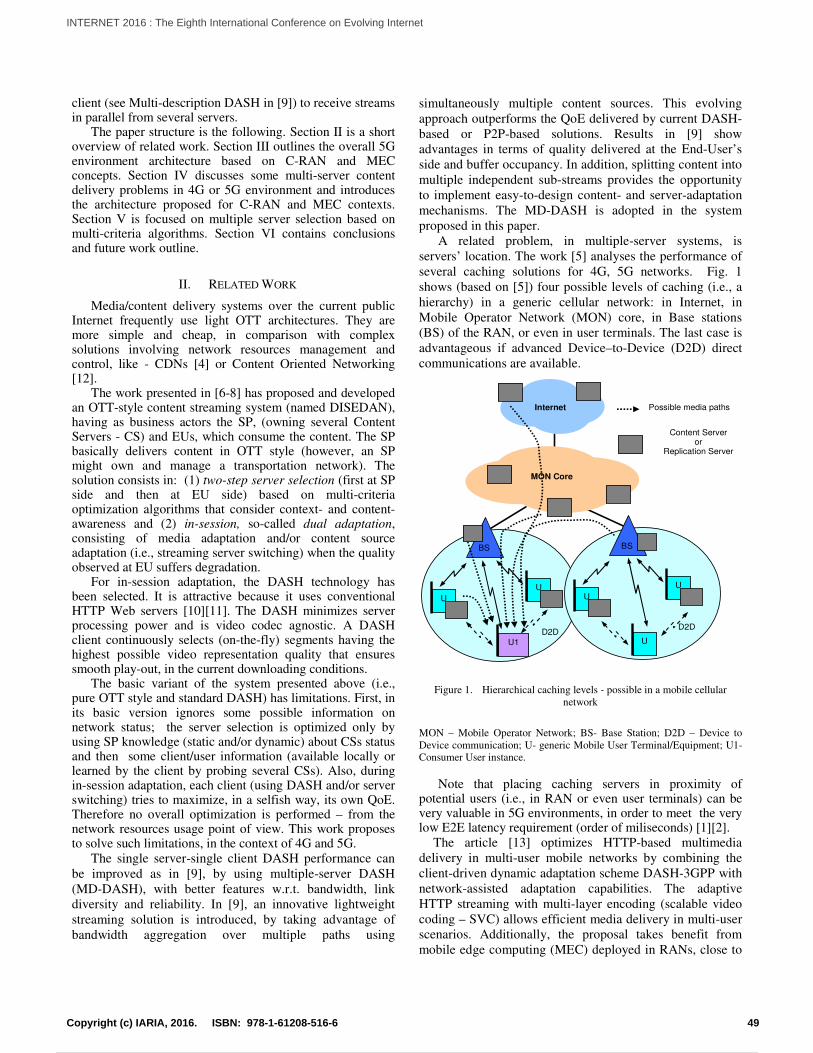
client (see Multi-description DASH in [9]) to receive streams in parallel from several servers.
The paper structure is the following. Section II is a short overview of related work. Section III outlines the overall 5G environment architecture based on C-RAN and MEC concepts. Section IV discusses some multi-server content delivery problems in 4G or 5G environment and introduces the architecture proposed for C-RAN and MEC contexts. Section V is focused on multiple server selection based on multi-criteria algorithms. Section VI contains conclusions and future work outline.
II. RELATED WORK
Media/content delivery systems over the current public Internet frequently use light OTT architectures. They are more simple and cheap, in comparison with complex solutions involving network resources management and control, like - CDNs [4] or Content Oriented Networking [12].
The work presented in [6-8] has proposed and developed an OTT-style content streaming system (named DISEDAN), having as business actors the SP, (owning several Content Servers - CS) and EUs, which consume the content. The SP basically delivers content in OTT style (however, an SP might own and manage a transportation network). The solution consists in: (1) two-step server selection (first at SP side and then at EU side) based on multi-criteria optimization algorithms that consider context- and content-awareness and (2) in-session, so-called dual adaptation, consisting of media adaptation and/or content source adaptation (i.e., streaming server switching) when the quality observed at EU suffers degradation.
For in-session adaptation, the DASH technology has been selected. It is attractive because it uses conventional HTTP Web servers [10][11]. The DASH minimizes server processing power and is video codec agnostic. A DASH client continuously selects (on-the-fly) segments having the highest possible video representation quality that ensures smooth play-out, in the current downloading conditions.
The basic variant of the system presented above (i.e., pure OTT style and standard DASH) has limitations. First, in its basic version ignores some possible information on network status; the server selection is optimized only by using SP knowledge (static and/or dynamic) about CSs status and then some client/user information (available locally or learned by the client by probing several CSs). Also, during in-session adaptation, each client (using DASH and/or server switching) tries to maximize, in a selfish way, its own QoE. Therefore no overall optimization is performed – from the network resources usage point of view. This work proposes to solve such limitations, in the context of 4G and 5G.
The single server-single client DASH performance can
be improved as in [9], by using multiple-server DASH
(MD-DASH), with better features w.r.t. bandwidth, link
diversity and reliability. In [9], an innovative lightweight
streaming solution is introduced, by taking advantage of
bandwidth aggregation over multiple paths using
simultaneously multiple content sources. This evolving
approach outperforms the QoE delivered by current DASH-
based or P2P-based solutions. Results in [9] show
advantages in terms of quality delivered at the End-User’s
side and buffer occupancy. In addition, splitting content into
multiple independent sub-streams provides the opportunity
to implement easy-to-design content- and server-adaptation
mechanisms. The MD-DASH is adopted in the system
proposed in this paper.
A related problem, in multiple-server systems, is
servers’ location. The work [5] analyses the performance of
several caching solutions for 4G, 5G networks. Fig. 1
shows (based on [5]) four possible levels of caching (i.e., a
hierarchy) in a generic cellular network: in Internet, in
Mobile Operator Network (MON) core, in Base stations
(BS) of the RAN, or even in user terminals. The last case is
advantageous if advanced Device–to-Device (D2D) direct
communications are available.
MON Core
Internet
BS
U
U1
D2D
U
BS
U
U
D2D
U
Possible media paths
Content Server or
Replication Server
Figure 1. Hierarchical caching levels - possible in a mobile cellular
network
MON – Mobile Operator Network; BS- Base Station; D2D – Device to
Device communication; U- generic Mobile User Terminal/Equipment; U1-
Consumer User instance.
Note that placing caching servers in proximity of potential users (i.e., in RAN or even user terminals) can be very valuable in 5G environments, in order to meet the very low E2E latency requirement (order of miliseconds) [1][2].
The article [13] optimizes HTTP-based multimedia
delivery in multi-user mobile networks by combining the
client-driven dynamic adaptation scheme DASH-3GPP with
network-assisted adaptation capabilities. The adaptive
HTTP streaming with multi-layer encoding (scalable video
coding – SVC) allows efficient media delivery in multi-user
scenarios. Additionally, the proposal takes benefit from
mobile edge computing (MEC) deployed in RANs, close to
49Copyright (c) IARIA, 2016. ISBN: 978-1-61208-516-6
INTERNET 2016 : The Eighth International Conference on Evolving Internet
58 / 63
the users, in order to provide network assistance in the
optimization process. A novel element- mobile edge-DASH
adaptation function (ME-DAF) is introduced, which
combines SVC-DASH-MEC to support efficient media
delivery in mobile multi-user scenarios. The ME-DAF is
inserted in the Data Plane managing effectively the DASH
requests and media flows for multiple users. Our approach
is different, in the sense that we also use MEC capabilities
to provide network assistance, but he DASH sessions for
multiple users are not concentrated in a single element, thus
we avoid some scalability problems.
III. THE CLOUD RAN AND MOBILE EDGE COMPUTING
The emergent 5G will bring novel network and service capabilities [1][2]. It will ensure user experience continuity in various contexts like high mobility (e.g., in trains), dense or sparsely populated areas, or heterogeneous technologies. The target application range is broad: manufacturing, automotive, energy, food and agriculture, education, city management, government, healthcare, public transportation, and so forth.
The 5G has very ambitious goals and raises challenges [1][2], in terms of data volume, number of connected devices, latency, energy consumption, flexibility, etc. The 5G will be fully driven by software: a unified operating system is needed, in a number of points of presence, especially at the network edge. To achieve the required performance, scalability and agility the 5G can rely on technologies like Software Defined Networking, (SDN) Network Function Virtualization (NFV), Mobile Edge Computing (MEC) and Fog Computing (FC).
Recently, C-RAN architecture has been proposed [14-18], applicable both in 4G or 5G, able to provide among others, high spectral and energy efficiency. In C-RAN, the traditional base station (BS) is split into two parts: baseband units (BBUs) clustered as a BBU pool in a centralized location and several distributed remote radio heads (RRHs) plus antennas, which are located at the remote site. A high bandwidth low-latency optical or microwave transport network connect the RRHs and BBU pool (the connection is realized in hub-style from several RRUs to a single BBU). The RRHs perform radio frequency functions and support high capacity in hot spots. The BBU pool is virtualized and performs several functions as large-scale collaborative processing (LSCP), cooperative radio resource allocation (CRRA), and intelligent networking. The BBU pool communicates with RRHs via common public radio interface (CPRI) protocol, which supports a constant bit rate and bidirectional digitized in-phase and quadrature (I/Q) transmission, and includes specifications for control plane and data plane.
Several functional splits between BBU and RRH in 4G and 5G C-RANs are possible [19]. Shifting more functionality to the RRH can decrease the capacity requirement and increase delay requirement on the fronthaul links, but complicate and increase the cost of RRHs. If we consider the functional stack layers defined already in 4G, as Radio Frequency (RF), Physical Processing (PHY),
Medium Access Control (MAC), Radio Link Control (RLC), Packet Data Convergence Protocol (PDCP), one might have for RRH functions: 4G - RF and 5G: RF,PHY, or RF,PHY,MAC, or RF,PHY,MAC,RLC. In general, the fronthaul network (between BBU and RRH) constraints have high impact on worsening C-RAN performance; the scale size of RRHs accessing the same BBU pool is limited and could not be too large due to the implementation complexity.
Each variant of the C-RAN architecture has some advantages and limitations. A „highly centralized‟ C-RAN, is easily upgradable and allows network capacity expansion; it can support multi-standard operation, maximum resource sharing and multi-cell collaborative signal processing. However, it has high bandwidth requirement between the BBU and RRHs. A „partial centralized‟ C-RAN requires much lower transmission bandwidth between BBU and RRH, by integrating some baseband processing into RRH.
C-RAN allows to operators to save costs and use green and efficient infrastructures. Open interfaces offers support for algorithms customization. The RAN virtualization solution can allow: HW/SW decoupling, multivendor I/O, flexible deployments, etc.
However, 5G new strong requirements and services (especially in terms of latency, energy efficiency, etc.) are difficult to be met by C-RAN only. Here, Mobile Edge Computing (MEC) can help.
MEC is a recent network architecture developed by the European Telecommunications Standards Institute (ETSI), [20] enabling distributed cloud computing capabilities and an IT service environment at network edge. By running applications and performing related processing tasks closer to the customers, network congestion is reduced and applications perform better. MEC can be implemented at the BSs, and enables flexible and rapid deployment of new applications and services (middleware, infrastructure) for customers. So, the operators can open their RAN to authorized third-parties, such as application developers and content providers. Location services, Internet-of-Things (IoT), video analytics, augmented reality, local content distribution, and data caching are some of the use cases identified by MEC.
The main element is the MEC application server (it can be
integrated in RAN), which provides computing resources,
storage capacity, connectivity and, if necessary, access to
RAN information. It supports a multi-tenancy run-time and
hosting environment for applications. The applications can
be constructed as virtual appliances and packaged as
operating system virtual machine (VM) images. They can be
provided by equipment vendors, service providers and third-
parties. The MEC application server can be deployed at the
macro base station eNodeB LTE/4G or at the Radio
Network Controller (RNC) in 3G networks. It can also
collect data about storage, network bandwidth, CPU
utilization, etc., for each application or service deployed by
a third party. Therefore application developers and content
providers can take advantage of close proximity to cellular
subscribers and real-time RAN information.
50Copyright (c) IARIA, 2016. ISBN: 978-1-61208-516-6
INTERNET 2016 : The Eighth International Conference on Evolving Internet
59 / 63
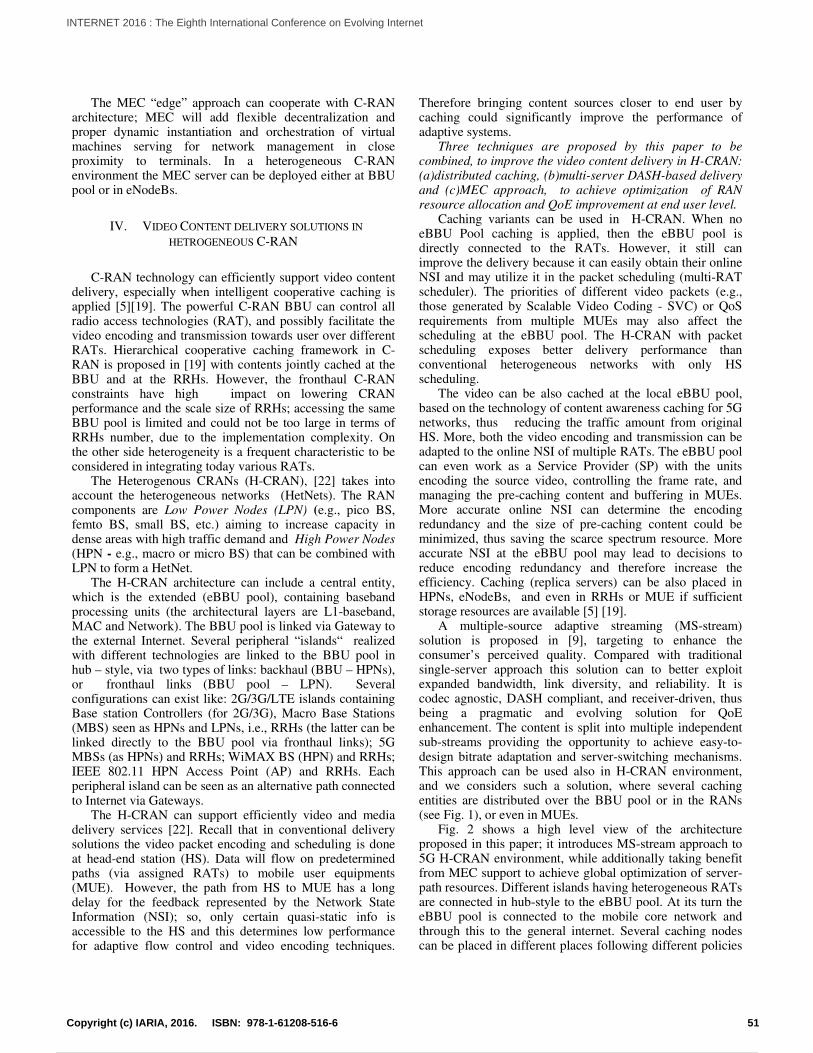
The MEC “edge” approach can cooperate with C-RAN architecture; MEC will add flexible decentralization and proper dynamic instantiation and orchestration of virtual machines serving for network management in close proximity to terminals. In a heterogeneous C-RAN environment the MEC server can be deployed either at BBU pool or in eNodeBs.
IV. VIDEO CONTENT DELIVERY SOLUTIONS IN
HETROGENEOUS C-RAN
C-RAN technology can efficiently support video content
delivery, especially when intelligent cooperative caching is applied [5][19]. The powerful C-RAN BBU can control all radio access technologies (RAT), and possibly facilitate the video encoding and transmission towards user over different RATs. Hierarchical cooperative caching framework in C-RAN is proposed in [19] with contents jointly cached at the BBU and at the RRHs. However, the fronthaul C-RAN constraints have high impact on lowering CRAN performance and the scale size of RRHs; accessing the same BBU pool is limited and could not be too large in terms of RRHs number, due to the implementation complexity. On the other side heterogeneity is a frequent characteristic to be considered in integrating today various RATs.
The Heterogenous CRANs (H-CRAN), [22] takes into account the heterogeneous networks (HetNets). The RAN components are Low Power Nodes (LPN) (e.g., pico BS, femto BS, small BS, etc.) aiming to increase capacity in dense areas with high traffic demand and High Power Nodes (HPN - e.g., macro or micro BS) that can be combined with LPN to form a HetNet.
The H-CRAN architecture can include a central entity, which is the extended (eBBU pool), containing baseband processing units (the architectural layers are L1-baseband, MAC and Network). The BBU pool is linked via Gateway to the external Internet. Several peripheral “islands“ realized with different technologies are linked to the BBU pool in hub – style, via two types of links: backhaul (BBU – HPNs), or fronthaul links (BBU pool – LPN). Several configurations can exist like: 2G/3G/LTE islands containing Base station Controllers (for 2G/3G), Macro Base Stations (MBS) seen as HPNs and LPNs, i.e., RRHs (the latter can be linked directly to the BBU pool via fronthaul links); 5G MBSs (as HPNs) and RRHs; WiMAX BS (HPN) and RRHs; IEEE 802.11 HPN Access Point (AP) and RRHs. Each peripheral island can be seen as an alternative path connected to Internet via Gateways.
The H-CRAN can support efficiently video and media delivery services [22]. Recall that in conventional delivery solutions the video packet encoding and scheduling is done at head-end station (HS). Data will flow on predetermined paths (via assigned RATs) to mobile user equipments (MUE). However, the path from HS to MUE has a long delay for the feedback represented by the Network State Information (NSI); so, only certain quasi-static info is accessible to the HS and this determines low performance for adaptive flow control and video encoding techniques.
Therefore bringing content sources closer to end user by caching could significantly improve the performance of adaptive systems.
Three techniques are proposed by this paper to be combined, to improve the video content delivery in H-CRAN: (a)distributed caching, (b)multi-server DASH-based delivery and (c)MEC approach, to achieve optimization of RAN resource allocation and QoE improvement at end user level.
Caching variants can be used in H-CRAN. When no eBBU Pool caching is applied, then the eBBU pool is directly connected to the RATs. However, it still can improve the delivery because it can easily obtain their online NSI and may utilize it in the packet scheduling (multi-RAT scheduler). The priorities of different video packets (e.g., those generated by Scalable Video Coding - SVC) or QoS requirements from multiple MUEs may also affect the scheduling at the eBBU pool. The H-CRAN with packet scheduling exposes better delivery performance than conventional heterogeneous networks with only HS scheduling.
The video can be also cached at the local eBBU pool, based on the technology of content awareness caching for 5G networks, thus reducing the traffic amount from original HS. More, both the video encoding and transmission can be adapted to the online NSI of multiple RATs. The eBBU pool can even work as a Service Provider (SP) with the units encoding the source video, controlling the frame rate, and managing the pre-caching content and buffering in MUEs. More accurate online NSI can determine the encoding redundancy and the size of pre-caching content could be minimized, thus saving the scarce spectrum resource. More accurate NSI at the eBBU pool may lead to decisions to reduce encoding redundancy and therefore increase the efficiency. Caching (replica servers) can be also placed in HPNs, eNodeBs, and even in RRHs or MUE if sufficient storage resources are available [5] [19].
A multiple-source adaptive streaming (MS-stream) solution is proposed in [9], targeting to enhance the consumer’s perceived quality. Compared with traditional single-server approach this solution can to better exploit expanded bandwidth, link diversity, and reliability. It is codec agnostic, DASH compliant, and receiver-driven, thus being a pragmatic and evolving solution for QoE enhancement. The content is split into multiple independent sub-streams providing the opportunity to achieve easy-to-design bitrate adaptation and server-switching mechanisms. This approach can be used also in H-CRAN environment, and we considers such a solution, where several caching entities are distributed over the BBU pool or in the RANs (see Fig. 1), or even in MUEs.
Fig. 2 shows a high level view of the architecture proposed in this paper; it introduces MS-stream approach to 5G H-CRAN environment, while additionally taking benefit from MEC support to achieve global optimization of server-path resources. Different islands having heterogeneous RATs are connected in hub-style to the eBBU pool. At its turn the eBBU pool is connected to the mobile core network and through this to the general internet. Several caching nodes can be placed in different places following different policies
51Copyright (c) IARIA, 2016. ISBN: 978-1-61208-516-6
INTERNET 2016 : The Eighth International Conference on Evolving Internet
60 / 63
of the Service Provider and other criteria (popularity, time-life, cost, etc.). MEC servers are supposed to be installed close to each HPNs of the H-CRAN. The specific Control Plane of our system is composed mainly by the Service Provider (SP) entity placed at eBBU pool level and several functional blocks called RAN Monitors (RAN-Mon), which are installed as application instances over MEC servers. The SP gets the video content requests from the user terminals and optimizes server utilization. The RAN-Mon block role is similar as in [13], i.e., it interacts with MEC server in order to collect RAN statistics (NSI, i.e., cell load information, channel state information provided by channel state indicator, etc.).
Fig. 2 considers a variant where the MEC server is collocated with a Macro Base Station (MBS). DASH clients can run in mobile terminals. The SP communicates in the Control Plane with RAN-Mon and is aware of network resources status; such information is usually available at RAN level in 4G or 5G.
An user client content object request is addressed (similar to DISEDAN system discussed in Section II) to SP entity. Based on user request the SP performs a selection phase (based on multiple criteria algorithm) of a set of servers containing DASH descriptions (see [9] for details) of the required media object media. Then the user (after making the final filtering/selection and performing a local-information based selection) starts a set of parallel Data Plane dialogues with the caching servers selected. During the sessions, individual adjustments of the flow rates can be applied by using DASH algorithms and/or changing the current server set (server switching). Also in an action of selecting an updated set of servers, the multiple criteria optimization
algorithm can be applied. The main difference from DISEDAN system and also from approach presented in [13] is the fact that not only individual, but overall optimization can be achieved while taking benefit from RAN information.
V. MULTI-SERVER SELECTION OPTIMIZATION FOR H-
CRAN
This section is devoted to propose a solution for multiple server set selection to serve a given user request, coming form an mobile end user terminal, to the Service Provider. It will be supposed that SP has enough knowledge about caching servers placed in a given region, and also about distance and channel status between a given server and mobile terminal of the requesting user. This paper will not detail the signaling messages between the SP and different MEC servers placed in RAN.
Several multi-objective optimization algorithms can be considered. In this work, the optimization is based on a previously used procedure - Multi-Criteria Decision Algorithms (MCDA) - which has been proved powerful and efficient in [23][24]. Note the important fact that the method proposed has no limitation in number of parameters to be considered as input. The multi-criteria algorithm can use more or less parameters as they are available in the system.
The multi-objective optimization algorithm tries to find
min F(x) = [f1(x), ..fk(x)] where x ∈ Xi, the decision variables
space, and f1(x), ..fk(x), are a set of objectives, [23] [24].
MIMO
Caching DASH server
5G MBS
D2D
BBU Pool
MS-Stream
DASH client
RAN-5G island
Internet
MEC Srv
Mon
X2/S1 Backhaul
HPN
RRH Fronthaul
U
U
Other islands
3G/4G/WiMAX
GW
GW
Parallel DASH sessions
SP Mobile
Core
Network
Figure 2. Architecture based on H-CRAN for multiple source streaming and MEC support (variant: MEC implemented at MBS); GW- gateway; RRH-
Remote Radio Head; MBS- Macro Base Station; D2D- Device to Device; HPN- High Power Node; MS- multiserver; BBU – Baseband Unit; MEC Mobile
Edge Computing; X2/S1 – Interfaces imported from 4G technology; U- generic notation for an user having a mobile terminal
52Copyright (c) IARIA, 2016. ISBN: 978-1-61208-516-6
INTERNET 2016 : The Eighth International Conference on Evolving Internet
61 / 63

One method to solve MCDA problem is offered by
reference level decision algorithm [24], which considers a decision space R
m and the decision parameter/variables: vi,
i=1, ..m; ∀i, vi≥0. A candidate solution is an element Ss=(vs1,
vs2, .., vsm) ∈ Rm. Let S be the number of candidates indexed
by s = 1, 2, ..S. The value ranges of decision variables might be bounded by given constrains.
The algorithm searches a solution satisfying a given objective function, conforming a particular metric. Two reference parameters are defined: ri =reservation level=the upper limit for a decision variable which should not be crossed by the selected solution; ai=aspiration level=the lower bound for a decision variable, beyond which the solutions are seen as similar. For each decision variable vi, ri and ai , will be computed among all solutions s = 1, 2, ..S: ri
= max [vis], ai = min [vis], where s = 1, 2, ..S. Two modifications of the decision variables are applied
in [24]: a. replacement of each variable with distance from its value to the reservation level: vi � ri-vi; (higher vi will decrease the distance); b. normalization is also introduced to get non-dimensional values, which can be numerically compared. For each variable vsi, a ratio is computed, for each
solution s, and each variable i: vsi' = (ri-vsi)/(ri-ai), where
the factor 1/(ri-ai) - plays also the role of a weight. To support a variety of SP policies, a modified formula can be used, i.e.:
vsi' = wi(ri-vsi)/(ri-ai) (1)
where the factor wi ∈ (0,1] represents a weight (associated to a priority) that can be established from SP policy considerations. Such weights can significantly influence the final selection. The optimization algorithm presented below is derived from that applied in [7]:
1. Compute the matrix M{vsi'}, s=1…S, i=1…m
2. Compute for each candidate solution s, the minimum
(worst case) among all its normalized variables vsi':
mins = min{vsi'}; i=1...m (2)
3. Make selection among solutions by computing:
vopt = max {mins}, s=1, ..S (3)
This vopt is the optimum solution, i.e it selects the best value
among those produced by the Step 1.
4. Repeat the algorithm for the servers left, until a desired
set of “best” servers is obtained, or the list is exhausted.
(this step is necessary to determine the set of active servers
for MS-stream). The performance of such optimization algorithm has
been already proven in [6][7]. In the context of H-CRAN its efficiency depends finally on the accuracy of the network parameters delivered by MEC server to SP.
A simplified example shows the optimization procedure. One supposes that decision variables are those defined in Table 1. The variable v1 is estimated directly by the SP, by inspecting the servers. The other variables are provided by
the MEC server to SP. Table 2 presents six candidates solutions (entries are native not-yet normalized values). Priority examples are introduced in Table 1, derived from SP policy. Here, the server load and numbers of RAN cells crossed are considered the most important.
In this example one can define: a1= 0, r1=100; a2=0, r2=10; a3=120, r3 = 20; a4=0, r4=100; a5=0, r5=30.
TABLE I. DECISION VARIABLES EXAMPLE
Decision
variables
Semantics Units Priority
v1 Load of the caching server ( %) 1- max
v2 Number of RAN cells or sub-
networks to be crossed
Integer 2
v3 Average capacity available on
the channel server- client
Mbps 2
v4 Load of the cell of the server (%) 3
v5 Estimated server-client delay ms 4- min
TABLE II. CANDIDATE SOLUTIONS EXAMPLE
s1 s2 s3 s4 s5 s6
vs1 0 20 40 70 80 50
vs2 2 3 1 3 4 5
vs3 60 30 50 80 50 60
vs4 30 10 20 60 20 30
vs5 15 20 10 10 20 5
Applying the basic algorithm (i.e., with no priorities)
simple computation will show that formula (4) is max{0.5,
0.3, 0.5, 0.3, 0.2, 0.5}, showing that solutions s1, s3, s6 are
equivalent. Suppose we want n servers for MS-stream
delivery. Then the step 4 of the algorithm simply means to
select the first n servers of the list, considering the order
given by the step 3 of the algorithm; if n=3, they are { s1, s3,
s6}.
If some decision variables are considered more
important in the selection process, then introduce policies,
can be defined. An example of priorities assigned is given in
the last column of the Table 1. To these priorities the SP can
associate weights (acting as compression factors) defined,
e.g., w1= 0.5, w2= 0.7, w3= 0.7, w4= 0.8, w5= 1.0. Then the
step 3 of the algorithm will produce the {0.5, 0.3, 0.3, 0.15,
0.1, 0.25}. It is seen that s1 solution is the best, followed by
s2 and s3.
VI. CONCLUSIONS, EXTENSIONS AND FUTURE WORK
This paper proposed an architectural solution for optimizing video content delivery in 5G Heterogeneous Cloud RAN environment. A previously developed multi-server video streaming system, based on DASH adaptation subsystem has been taken and combined here with Mobile Edge Computing (MEC) capabilities, in order to optimize the resource usage in RAN and enhance the quality of experience (QoE) seen by the end users.
Specific work developed here is on the initial best path-server selection, producing a subset of servers (which will serve the DASH sessions of the users). While the efficiency of Multi-criteria decision algorithms has been already proven in such types of problems, the contribution here is the
53Copyright (c) IARIA, 2016. ISBN: 978-1-61208-516-6
INTERNET 2016 : The Eighth International Conference on Evolving Internet
62 / 63
extension of such an approach to MS-stream + MEC cooperation in H-CRAN environment. Due to network related information, both QoE increase and global optimization of RAN resource usage is expected.
Future work will be done to evaluate the system performance in a large network environment, and extension of algorithm applicability during the DASH sessions, when problems appear to switch the set of caching servers. More in depth study should be also done to embed the RAN Monitoring subsystem in mobile edge computing environment.
REFERENCES
[1] J.G. Andrews, .et al., “What Will 5G Be?”, IEEE Journal on Selected Areas in Communications, Vol. 32, No.6, pp. 1065-82, June 2014.
[2] M. Peng, Y. Li, Z. Zhao, and C. Wang, “System Architecture and Key Technologies for 5G Heterogeneous Cloud Radio Access Networks”, IEEE Network Magazine, vol. 29, no. 2, pp. 6–14, Mar. 2015.
[3] “Cisco Visual Networking Index: Forecast and Methodology 2013–2018”, White Paper, June 2014.
[4] P. A. Khan and B. Rajkumar, “A Taxonomy and Survey of Content Delivery Networks”, Department of Computer Science and Software Engineering, University of Melbourne. Australia : s.n., 2008, www.cloudbus.org/reports/CDN-Taxonomy.pdf , [retrieved: Dec., 2015].
[5] X.Wang, M. Chen, T. Taleb, A. Ksentini, and V. C. M.Leung, "Cache in the Air: Exploiting Content Caching and Delivery Techniques for 5G Systems", IEEE Communications Magazine, pp.131-139, February 2014.
[6] http://wp2.tele.pw.edu.pl/disedan/ [retrieved: May, 2016]
[7] E. Borcoci, M. Vochin, M. Constantinescu, J. M. Batalla, and D. Negru, “On Server and Path Selection Algorithms and Policies in a light Content-Aware Networking Architecture”, ICSNC 2014, http://www.iaria.org/conferences2014/ICSNC14.html [retrieved: July, 2016].
[8] A. Bęben, J. Mongay Batalla, P. Wiśniewski, and P. Krawiec (WUT), “ABMA+ : lightweight and efficient algorithm for HTTP adaptive streaming”, ACM Multimedia Systems (MMSys), Klagenfurt (Austria), May 2016, [doi: http://dx.doi.org/10.1145/2910017.2910596]
[9] J. Bruneau-Queyreix, D. Négru, J. M. Batalla, and E. Borcoci, “Multiple Description-DASH: Pragmatic video streaming maximizing End-Users' Quality of Experience” IEEE International Conference on Communications, 23-27 May 2016, Kuala Lumpur, Malaysia, http://icc2016.ieee-icc.org/content/symposia, [retrieved: July, 2016].
[10] I. Sodagar, "The MPEG-DASH Standard for Multimedia Streaming Over the Internet," MultiMedia, IEEE, vol. 18, no. 4, pp. 62 – 67, 2011,.
[11] ISO/IEC 23009-1, "Information technology -- Dynamic adaptive streaming over HTTP (DASH) -- Part 1: Media presentation description and segment formats," ISO/IEC, Geneve, second edition, 2014.
[12] J. Choi, J. Han, E. Cho, T. Kwon, and Y. Choi, “A Survey on Content-Oriented Networking for Efficient Content Delivery”, IEEE Communications Magazine, pp. 121-127, March 2011.
[13] J. O. Fajardo, I. Taboada, and F. Liberal, "Improving Content Delivery Efficiency Through Multi-Layer Mobile Edge Adaptation", IEEE Network Magazine, pp.40-46, November/December 2015.
[14] P. K. Agyapong, M. Iwamura, D. Staehle, W. Kiess and A. Benjebbour, „Design Considerations for a 5G Network Architecture” IEEE Communications Magazine, pp. 65-75, November 2014.
[15] M. Peng, Y. Sun, X. Li, Z. Mao, and C. Wang, "Recent Advances in Cloud Radio Access Networks:System Architectures, Key Techniques, and Open Issues" IEEE Communications Surveys and Tutorials, pp. 1 - 27, 2016, http://arxiv.org/abs/1604.00607, [retrieved: July, 2016].
[16] N. Panwar, S. Sharma, and A. K. Singh, “A Survey on 5G: The Next Generation of Mobile Communication” , accepted in Elsevier Physical Communication, pp.64-84, 4 Nov 2015, http://arxiv.org/pdf/1511.01643v1.pdf, [retrieved: July, 2016].
[17] A. Checko et al., “Cloud RAN for Mobile Networks—A Technology Overview”, IEEE Communications Surveys & Tutorials, Vol. 17, No. 1, pp. 405-426, First Quarter 2015.
[18] China Mobile Research Institute, “C-RAN White Paper: The Road Towards Green RAN”, June 2014, http://labs.chinamobile.com/cran/wp-content/uploads/2014/06/20140613-C-RAN-WP-3.0.pdf, [retrieved: July, 2016].
[19] T.X. Tran, A. Hajisami, and D.Pompili, “Cooperative Hierarchical Caching in 5G Cloud Radio Access Networks (C-RANs)”, https://arxiv.org/pdf/1602.02178, [retrieved: October, 2015].
[20] M. Patel et al., “Mobile-Edge Computing Introductory Technical White, Paper,” 2014, https://portal.etsi.org/portals/0/tbpages/mec/docs/mobile-edge_computing_- introductory_technical_white_paper_v1%2018-09-14.pdf, [retrieved: October, 2015].
[21] H. S. Matharu, “Cloud RAN and Mobile Edge Computing, a dichotomy in the making”, http://www.microwave-eetimes.com/content/cloud-ran-and-mobile-edge-computing-dichotomy-making, 2016, [retrieved: July, 2016].
[22] M. Sheng, W. Han, C. Huang, and S. Cui, ‘Video Delivery in Heterogenous Crans: Architectures and Strategies’, IEEE Wireless Communications, pp.14-21, June 2015.
[23] J. Figueira, S. Greco, and M. Ehrgott, “Multiple Criteria Decision Analysis: State of the Art Surveys”, Kluwer Academic Publishers, 2005.
[24] A. P. Wierzbicki, “The use of reference objectives in multiobjective optimization”. Lecture Notes in Economics and Mathematical Systems, vol. 177., Springer-Verlag, pp. 468–486.
54Copyright (c) IARIA, 2016. ISBN: 978-1-61208-516-6
INTERNET 2016 : The Eighth International Conference on Evolving Internet
Powered by TCPDF (www.tcpdf.org)
63 / 63