INTENSE GRAZING AND PREY-DEPENDENT GROWTH OF PFIESTERIA PISCICIDA (DINOPHYCEAE
12
INTENSE GRAZING AND PREY-DEPENDENT GROWTH OF PFIESTERIA PISCICIDA (DINOPHYCEAE) 1 Senjie Lin 2 Department of Marine Sciences, University of Connecticut, Groton, Connecticut 06340, USA Margaret R. Mulholland Department of Ocean, Earth & Atmospheric Sciences, Old Dominion University, 4600 Elkhorn Avenue, Norfolk, Virginia 23529-0276, USA Huan Zhang, Timothy N. Feinstein 3 Department of Marine Sciences, University of Connecticut, Groton, Connecticut 06340, USA Frank J. Jochem Marine Biology Program, Florida International University, 3000 NE 151 Street, North Miami, Florida 33181, USA and Edward J. Carpenter Romberg Tiburon Center, San Francisco State University, 3152 Paradise Drive, Tiburon, California 94920, USA Grazing and growth of Pfiesteria piscicida (Pfiest) were investigated using batch and cyclostat cultures with Rhodomonas sp. (Rhod) as prey. Observed max- imum growth rates (1.4 d 1 ) and population densi- ties (2 10 5 cells . mL 1 ) corresponded to values predicted by Monod functions (1.76 d 1 ; 1.4 10 5 cells . mL 1 ). In batch cultures under a range of prey-to-predator ratios (0.1:1 to 180:1) and prey concentrations (1000–71,000 cells . mL 1 ), Rho- domonas sp. was always depleted rapidly and P. pi- scicida concentrations increased briefly. The rate of Rhodomonas sp. depletion and the magnitude of P. piscicida population maxima depended on the prey- to-predator ratio and prey concentration. Starvation resulted in cell cycle arrest at G1 and G2 þ M and ultimately the demise of both P. piscicida and Rho- domonas sp. populations, demonstrating the de- pendence of P. piscicida on the supply of appropriate prey. The depletion of Rhodomonas sp. populations could be attributed directly to grazing, because P. piscicida did not exert detectable inhibi- tory effects on the growth of Rhodomonas sp. but grazed intensely, with maximum grazing rates410 Rhod . Pfiest 1 . d 1 and with no apparent threshold prey abundance for grazing. The results suggest that 1) the abundance of appropriate prey may be an im- portant factor regulating P. piscicida abundance in nature, 2) P. piscicida may control prey population, and 3) high growth and grazing potentials of P. piscicida along with cell cycle arrest may confer survival advantages. Key index words: cell cycle; flow cytometry; graz- ing; growth; heterotrophic dinoflagellate; Pfiesteria piscicida; prey dependence; Rhodomonas sp. Abbreviations: LT Batch, long-term batch cultures; Pfiest, Pfiesteria piscicida; PPF, P. piscicida filtrate; Rhod, Rhodomonas sp.; SC Batch, semicontinuous batch cultures Pfiesteria piscicida Steidinger et Burkholder is an am- bush predator dinoflagellate implicated in major fish kills in North Carolina and Maryland estuaries. The suspected ichthyotoxicity and potential consequences of this organism for public health have motivated in- tensive research to understand factors promoting its blooms (Burkholder et al. 2001). Research has focused on understanding the nutritional requirements and trophic interactions (Burkholder and Glasgow 1997, Lewitus et al. 1999, Seaborn et al. 1999, Feinstein et al. 2002). Although reported to feed by myzocytosis on moribund or caged fish (Burkholder et al. 1992, Glasgow et al. 2001, Berry et al. 2002), zoospore pop- ulations of P. piscicida are able to meet their nutritional requirements in diverse ways. They are capable of us- ing dissolved organic and inorganic nutrients and can prey on organisms ranging from bacteria to mamma- lian tissues (Burkholder et al. 2001). It has been shown that P. piscicida feeds and grows efficiently on phyto- plankton prey (Glasgow et al. 1998, Seaborn et al. 1999, Burkholder et al. 2001, Parrow et al. 2001, 1 Received 5 December 2003. Accepted 19 August 2004. 2 Author for correspondence: e-mail [email protected]. 3 Present address: Department of Biological sciences, Carnegie Mellon University, 4400 5th Avenue, Pittsburgh, PA 15213, USA. 1062 J. Phycol. 40, 1062–1073 (2004) r 2004 Phycological Society of America DOI: 10.1111/j.1529-8817.2004.03217.x
-
Upload
independent -
Category
Documents
-
view
4 -
download
0
Transcript of INTENSE GRAZING AND PREY-DEPENDENT GROWTH OF PFIESTERIA PISCICIDA (DINOPHYCEAE
INTENSE GRAZING AND PREY-DEPENDENT GROWTH OF PFIESTERIA PISCICIDA(DINOPHYCEAE)1
Senjie Lin2
Department of Marine Sciences, University of Connecticut, Groton, Connecticut 06340, USA
Margaret R. Mulholland
Department of Ocean, Earth & Atmospheric Sciences, Old Dominion University, 4600 Elkhorn Avenue, Norfolk, Virginia
23529-0276, USA
Huan Zhang, Timothy N. Feinstein3
Department of Marine Sciences, University of Connecticut, Groton, Connecticut 06340, USA
Frank J. Jochem
Marine Biology Program, Florida International University, 3000 NE 151 Street, North Miami, Florida 33181, USA
and
Edward J. Carpenter
Romberg Tiburon Center, San Francisco State University, 3152 Paradise Drive, Tiburon, California 94920, USA
Grazing and growth of Pfiesteria piscicida (Pfiest)were investigated using batch and cyclostat cultureswith Rhodomonas sp. (Rhod) as prey. Observed max-imum growth rates (1.4 d� 1) and population densi-ties (2 � 105 cells .mL� 1) corresponded to valuespredicted by Monod functions (1.76 d� 1; 1.4 � 105
cells .mL� 1). In batch cultures under a range ofprey-to-predator ratios (0.1:1 to 180:1) and preyconcentrations (1000–71,000 cells .mL� 1), Rho-domonas sp. was always depleted rapidly and P. pi-scicida concentrations increased briefly. The rate ofRhodomonas sp. depletion and the magnitude of P.piscicida population maxima depended on the prey-to-predator ratio and prey concentration. Starvationresulted in cell cycle arrest at G1 and G2þM andultimately the demise of both P. piscicida and Rho-domonas sp. populations, demonstrating the de-pendence of P. piscicida on the supply ofappropriate prey. The depletion of Rhodomonas sp.populations could be attributed directly to grazing,because P. piscicida did not exert detectable inhibi-tory effects on the growth of Rhodomonas sp. butgrazed intensely, with maximum grazing rates410Rhod .Pfiest� 1 . d�1 and with no apparent thresholdprey abundance for grazing. The results suggest that1) the abundance of appropriate prey may be an im-portant factor regulating P. piscicida abundance innature, 2) P. piscicida may control prey population,and 3) high growth and grazing potentials of P.
piscicida along with cell cycle arrest may confersurvival advantages.
Key index words: cell cycle; flow cytometry; graz-ing; growth; heterotrophic dinoflagellate; Pfiesteriapiscicida; prey dependence; Rhodomonas sp.
Abbreviations: LT Batch, long-term batch cultures;Pfiest, Pfiesteria piscicida; PPF, P. piscicida filtrate;Rhod, Rhodomonas sp.; SC Batch, semicontinuousbatch cultures
Pfiesteria piscicida Steidinger et Burkholder is an am-bush predator dinoflagellate implicated in major fishkills in North Carolina and Maryland estuaries. Thesuspected ichthyotoxicity and potential consequencesof this organism for public health have motivated in-tensive research to understand factors promoting itsblooms (Burkholder et al. 2001). Research has focusedon understanding the nutritional requirements andtrophic interactions (Burkholder and Glasgow 1997,Lewitus et al. 1999, Seaborn et al. 1999, Feinsteinet al. 2002). Although reported to feed by myzocytosison moribund or caged fish (Burkholder et al. 1992,Glasgow et al. 2001, Berry et al. 2002), zoospore pop-ulations of P. piscicida are able to meet their nutritionalrequirements in diverse ways. They are capable of us-ing dissolved organic and inorganic nutrients and canprey on organisms ranging from bacteria to mamma-lian tissues (Burkholder et al. 2001). It has been shownthat P. piscicida feeds and grows efficiently on phyto-plankton prey (Glasgow et al. 1998, Seaborn et al.1999, Burkholder et al. 2001, Parrow et al. 2001,
1Received 5 December 2003. Accepted 19 August 2004.2Author for correspondence: e-mail [email protected] address: Department of Biological sciences, Carnegie
Mellon University, 4400 5th Avenue, Pittsburgh, PA 15213, USA.
1062
J. Phycol. 40, 1062–1073 (2004)r 2004 Phycological Society of AmericaDOI: 10.1111/j.1529-8817.2004.03217.x
Feinstein et al. 2002). However, the quantitative rela-tionship between P. piscicida growth and algal prey con-centration has not yet been adequately assessed.
The capacity of P. piscicida grazing and its effect onprey populations also remain to be assessed. Grazingby heterotrophic and mixotrophic dinoflagellates hasreceived increasing attention in recent years, but moststudies focused on short-term grazing rates andgrowth efficiencies of the grazers (Strom 1991, 2002,Jeong and Latz 1994, Skovgaard 2000). Long-termobservations and quantitative analyses of grazing andits effect on prey populations are largely unexploredfor dinoflagellates, including P. piscicida. The scarcity ofinformation is likely due to culturing difficulties (Skov-gaard 2000). Pfiesteria piscicida provides an excellentmodel species for studying the effects of grazing onprey populations because laboratory cultures are ro-bust. In this study, we designed a range of feeding ex-periments (both short and long term) to investigate 1)P. piscicida growth and grazing rates with respect toprey availability, 2) cell cycle responses of P. piscicida toprey deficiency, and 3) the effect of P. piscicida grazingon prey populations. Results will contribute to ourgeneral understanding of how P. piscicida natural pop-ulations may be regulated by prey availability, whatstrategies P. piscicida may have for surviving prey defi-ciency, and how dinoflagellate predators like P. piscicidacan regulate the dynamics of algal prey.
MATERIALS AND METHODS
Cultures. Pfiesteria piscicida strains NCSU113–3 (Dr. J. M.Burkholder, North Carolina State University) and CCMP
1831 (Provasoli-Guillard National Center for Culture of Ma-rine Phytoplankton at the Bigelow Laboratory for Ocean Sci-ences, West Boothbay Harbor, ME, USA) were grown in 15psu seawater at 201 C. Rhodomonas sp. (strain CCMP768),grown at the same salinity and temperature in seawater sup-plemented with f/2 nutrients, was supplied to P. piscicida asfood. Light was supplied at 75 mmol photons �m�2 � s�1 withcool white fluorescence lamps on a 12:12-h light:dark cycle.Both NCSU113-3 and CCMP1831 were verified to be P. pi-scicida by 18S rRNA sequencing (Oldach et al. 2000), and theidentity of the cultures used in this study was further con-firmed by P. piscicida-specific dual-gene PCR (Zhang and Lin2002). Most results shown originate from strain CCMP1831;results from the other strain were comparable.
Experiments with long-term batch (LT Batch) cultures. Exper-iments were designed to determine how a single addition ofprey affects the growth of P. piscicida and how the predatoraffects prey population growth. A range of initial prey con-centrations and prey-to-predator ratios in the experimentalcultures (Table 1) was achieved by adding different amountsof Rhodomonas sp. to P. piscicida cultures (schemes I and II) orby introducing different amounts of P. piscicida to Rhodomonassp. cultures (schemes III and IV). In each experiment, pred-ator and prey abundances were quantified microscopicallyusing a counting chamber (Sedgwick-Rafter, Phyco Tech,Inc., St. Joseph, MI, USA) after preservation with Lugol’siodine solution. Over 200 cells were counted for each sample,except when low cell concentrations made it impractical, inwhich case 5–10 random swipes across the whole countingchamber were counted. Two replicate sets of counts made oneach sample were averaged. If the two counts disagreed, ad-ditional counts were taken until the variation was within 20%.
Feeding experiments were set up with stock cultures 1–50 � 104 cells �mL� 1 for Rhodomonas sp. and 5–10�103
cells �mL�1 for P. piscicida. In feeding scheme I, variations inprey abundance were achieved by adding 1, 3, 10, or 20 mL ofRhodomonas sp. stock culture to 30 mL of P. piscicida stock cul-ture and adjusting the final volume to 50 mL. In scheme II, 5
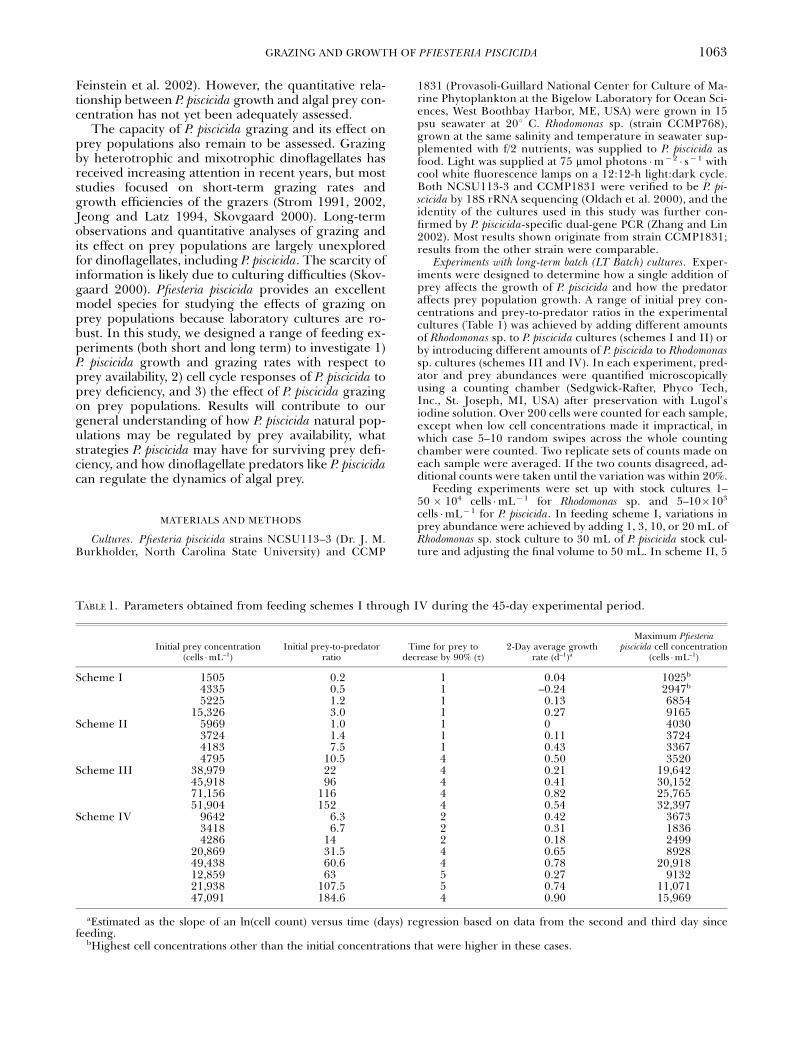
TABLE 1. Parameters obtained from feeding schemes I through IV during the 45-day experimental period.
Initial prey concentration(cells �mL–1)
Initial prey-to-predatorratio
Time for prey todecrease by 90% (t)
2-Day average growthrate (d–1)a
Maximum Pfiesteriapiscicida cell concentration
(cells �mL–1)
Scheme I 1505 0.2 1 0.04 1025b
4335 0.5 1 –0.24 2947b
5225 1.2 1 0.13 685415,326 3.0 1 0.27 9165
Scheme II 5969 1.0 1 0 40303724 1.4 1 0.11 37244183 7.5 1 0.43 33674795 10.5 4 0.50 3520
Scheme III 38,979 22 4 0.21 19,64245,918 96 4 0.41 30,15271,156 116 4 0.82 25,76551,904 152 4 0.54 32,397
Scheme IV 9642 6.3 2 0.42 36733418 6.7 2 0.31 18364286 14 2 0.18 2499
20,869 31.5 4 0.65 892849,438 60.6 4 0.78 20,91812,859 63 5 0.27 913221,938 107.5 5 0.74 11,07147,091 184.6 4 0.90 15,969
aEstimated as the slope of an ln(cell count) versus time (days) regression based on data from the second and third day sincefeeding.
bHighest cell concentrations other than the initial concentrations that were higher in these cases.
GRAZING AND GROWTH OF PFIESTERIA PISCICIDA 1063
mL of a Rhodomonas sp. stock culture was added to a dilutionseries of P. piscicida cultures representing 10%, 25%, 50%, or100% of the parent culture density to yield varying predatorconcentrations. In scheme III, uniform prey density was at-tempted by adding 1, 3, 5, or 15 mL of P. piscicida to 35 mL ofRhodomonas sp. derived from a single parent culture and ad-justing the final volume to 50 mL. To achieve a uniform pred-ator condition in the two experiments in scheme IV, 1 or 5 mLof P. piscicida was added to Rhodomonas sp. cultures represent-ing a dilution series of 10%, 25%, 50%, or 100% of initial stockculture concentrations. The total volume for each culture in allfeeding schemes was adjusted to 50 mL with autoclaved fil-tered seawater. Initial prey concentrations and prey-to-preda-tor ratios in each experimental culture were measured frominitial cell counts from each culture (Table 1). Because similartrends of predator and prey abundances were observed in all20 treatments, their results were analyzed as replicates.
Effects of starvation on cell cycle and cell size. To determinehow P. piscicida responds to prey depletion, cell cycle pro-gression and cell size were examined in cultures that hadbeen starved and then resupplied with prey. Triplicate batchcultures were grown to exponential phase by supplying ex-cess Rhodomonas sp. Feeding was then discontinued for up to9 days, during which time cell cycle and size were examined.In one experiment, samples were collected every 4 h for thefirst 2 days and less frequently for another 2 days thereafter.In another experiment, samples were collected on days 1, 2,5, and 9, after which Rhodomonas sp. was resupplied, andsamples were collected for an additional 2 days for cell cycleand size analyses. At each sampling point, one sample set waspreserved with Lugol’s iodine solution for cell counts of bothpredator and prey and cell size measurement of P. piscicida. Asecond set of samples was preserved for flow cytometric cellcycle analysis. Cells from 15-mL samples were harvested bycentrifugation (4000g for 20 min at 181 C) and fixed in 4%PBS-buffered paraformaldehyde for 6 h at 41 C and stored in0.5% PBS-buffered paraformaldehyde at 41 C until analysis.
Triplicate samples were combined before analysis of cell sizeand cell cycle. Cell size was measured, for4200 cells in eachsample, from apex to antapex of the cell using a microscope(model BX51, Olympus, Melville, NY, USA) equipped withNorthern Eclipse imaging software (Empix, Ontario, Canada).Pfiesteria piscicida cell cycle was analyzed on a FACSort flowcytometer (Becton-Dickinson, San Jose, CA, USA) after sam-ples were washed with PBS and incubated for 30 min at 371 Cwith 0.1 g �L�1 RNase (1:1 mix of RNase A and B), and cellularDNA was stained with SYBR Green I (105-fold dilution ofcommercial stock; Molecular Probes, Eugene, OR, USA) for 20min (Jochem 2001). Samples were measured at a flow rate of0.2 mL � s�1, and P. piscicida populations were gated on side-angle light scatter versus DNA (FL1; 535 � 15 nm) fluores-cence. Cell cycle phases (G1, S, G2þM) were resolved fromone-parameter histograms of DNA fluorescence of gated pop-ulations by ModFit LT (Verity Software, Topsham, ME, USA).Pfiesteria piscicida cells that contained 1N DNA were defined asG1, whereas those with 2N DNA were, as usual, referred to asG2þM, because flow cytometric cell cycle assessment based oncellular DNA content cannot differentiate between cells in G2or M phases. Starved P. piscicida cultures were essentially de-pleted of prey cells, and P. piscicida cells did not contain visibleDNA from ingested Rhodomonas. In fed cultures, prey cellswere present, but their DNA did not interfere with P. piscicidacell cycle analysis because DNA fluorescence from these Rho-domonas cells was generally dim and fell below the dynamicrange set for DNA analysis in P. piscicida.
Effects of Pfiesteria piscicida filtrate on Rhodomonas sp.growth. To determine whether prey growth was inhibited byP. piscicida toxins or exudates, Rhodomonas sp. was grown withf/2 medium amended with filtrate from P. piscicida cultures.
Triplicate 10-mL cultures of Rhodomonas sp. were grown in15-mL centrifuge tubes under temperature and light condi-tions described above. Filtrates of a dense P. piscicida culture(1.2 � 105 cells �mL�1; PPF) were obtained using 0.45 mmpolycarbonate filters (Nuclepore Corp., Pleasanton, CA,USA). Rhodomonas sp. medium was amended either with 0%(control), 5%, or 50% PPF and final nutrient concentrationsadjusted to f/2. Over a 10-day period, 1-mL samples werewithdrawn periodically for cell counts, and after each sam-pling, 1 mL of the respective f/2 media (with 0, 5%, and 50%of PPF) was replenished.
Experiments with semicontinuous batch (SC Batch) cultures. Todetermine quantitatively the effect of prey density on P. pi-scicida grazing and growth, triplicate semicontinuous cultureswere established with initial P. piscicida concentration of 1000cells �mL�1 and initial prey concentrations of 100, 1000,10,000, or 100,000 cells �mL�1. Prey concentrations wereadjusted to those levels each day of examination by addingmore Rhodomonas sp. (except for a few occasions in whichprey concentration increased due to growth and no Rho-domonas sp. was added). Control Rhodomonas sp. cultures weregrown at identical cell densities and nutrient concentrationsas those in the P. piscicida cultures (natural seawater withoutaddition of nutrients) to estimate growth in the absence ofgrazing. Grazing rates were calculated as in Frost (1972),based on comparison between Rhod (Rhodomonas sp.) con-centrations in the Pfiest (P. piscicida) culture and in the control(Rhod without Pfiest).
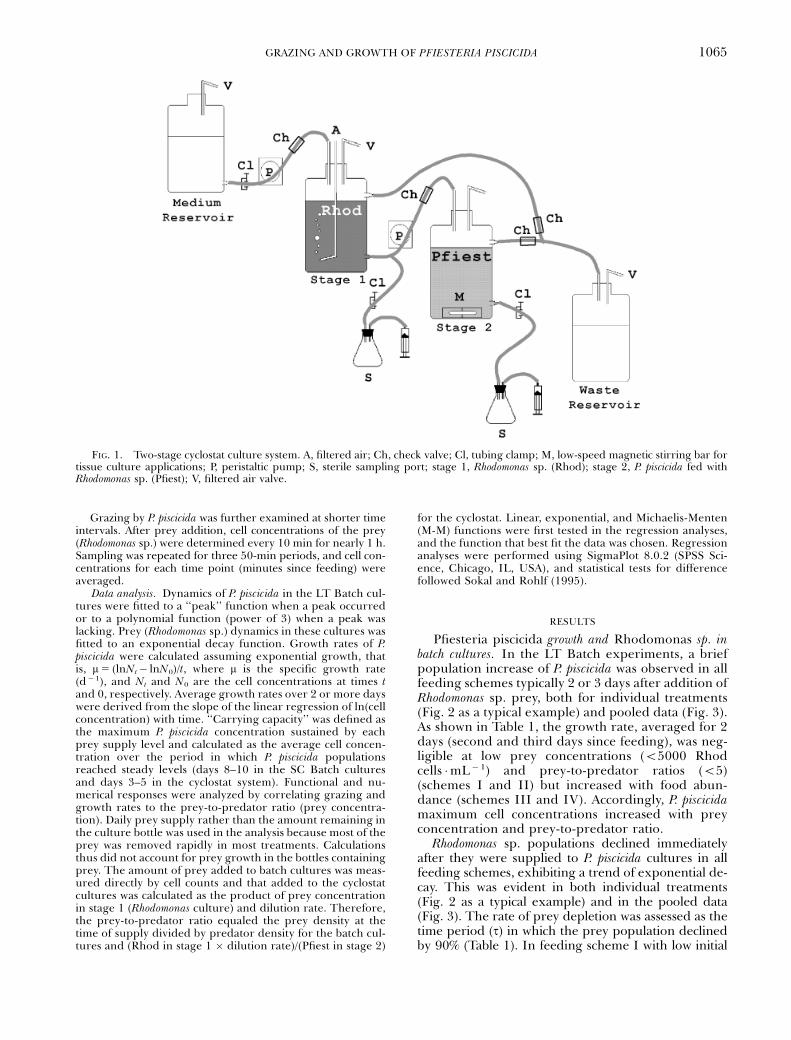
Experiments with a two-stage cyclostat culture. To measure P.piscicida grazing and growth under equilibrium conditions, atwo-stage cyclostat culture system was constructed (Fig. 1),essentially following Rhee et al. (1981) and Selph (1999).Culture vessels consisted of modified 2-L polycarbonate‘‘roller bottles’’ (Fisher Scientific, Hampton, NH, USA) withoverflow and sampling nipples affixed to their sides. Vesselswere connected with sterile silicone tubing (Cole-Parmer In-strument Company, Vernon Hills, IL, USA), and the systemwas run in an environmental chamber (Hotpack, Philadel-phia, PA, USA) at 201 C and 100 mmol photons �m�2 � s�1. Aunialgal culture of Rhodomonas sp. (stage 1) was grown in f/2medium at a dilution (5 growth) rate of 1 d�1. Media wassupplied at a constant rate using a peristaltic pump (Cole-Parmer Instrument Company), and cultures were mixed byconstant bubbling with sterile air. The prey culture (stage 1)was pumped into a bialgal culture of Rhodomonas sp. and P.piscicida (stage 2) or to the waste. Stage 2 was not stirredcontinuously because constant turbulence or shear inhibitsthe growth of dinoflagellates (Berdalet 1992), a result con-firmed in preliminary experiments with P. piscicida. Instead,10-min mixing was applied hourly when prey was pumped tostage 2. With the pumping rate kept constant, dilution rate(or food supply rate and hence grazer growth rate) for stage2 was changed by varying the size of the culture vessel.
The cultures were grown with both stages under a 12:12-hlight:dark regime. Cell concentrations in both chambers weremeasured daily, and experiments were performed once pop-ulations in both chambers were stable for at least 5 days (at leastthree generations). Pfiesteria piscicida abundance in stage 2 fluc-tuated only slightly once steady state was achieved. Therefore,P. piscicida growth rates could be approximated by the dilutionrate. Daily average grazing (I) was estimated as
I ¼ S1� S2
XT¼ ðS1� S2ÞD
Xð1Þ
where S1 and S2 are steady-state Rhodomonas sp. concentra-tions in stage 1 and stage 2, respectively; T is residence time; Dis the dilution rate or inverse of T; and X is the P. piscicida con-centration in stage 2.
SENJIE LIN ET AL.1064
Grazing by P. piscicida was further examined at shorter timeintervals. After prey addition, cell concentrations of the prey(Rhodomonas sp.) were determined every 10 min for nearly 1 h.Sampling was repeated for three 50-min periods, and cell con-centrations for each time point (minutes since feeding) wereaveraged.
Data analysis. Dynamics of P. piscicida in the LT Batch cul-tures were fitted to a ‘‘peak’’ function when a peak occurredor to a polynomial function (power of 3) when a peak waslacking. Prey (Rhodomonas sp.) dynamics in these cultures wasfitted to an exponential decay function. Growth rates of P.piscicida were calculated assuming exponential growth, thatis, m5 (lnNt� lnN0)/t, where m is the specific growth rate(d�1), and Nt and N0 are the cell concentrations at times tand 0, respectively. Average growth rates over 2 or more dayswere derived from the slope of the linear regression of ln(cellconcentration) with time. ‘‘Carrying capacity’’ was defined asthe maximum P. piscicida concentration sustained by eachprey supply level and calculated as the average cell concen-tration over the period in which P. piscicida populationsreached steady levels (days 8–10 in the SC Batch culturesand days 3–5 in the cyclostat system). Functional and nu-merical responses were analyzed by correlating grazing andgrowth rates to the prey-to-predator ratio (prey concentra-tion). Daily prey supply rather than the amount remaining inthe culture bottle was used in the analysis because most of theprey was removed rapidly in most treatments. Calculationsthus did not account for prey growth in the bottles containingprey. The amount of prey added to batch cultures was meas-ured directly by cell counts and that added to the cyclostatcultures was calculated as the product of prey concentrationin stage 1 (Rhodomonas culture) and dilution rate. Therefore,the prey-to-predator ratio equaled the prey density at thetime of supply divided by predator density for the batch cul-tures and (Rhod in stage 1 � dilution rate)/(Pfiest in stage 2)
for the cyclostat. Linear, exponential, and Michaelis-Menten(M-M) functions were first tested in the regression analyses,and the function that best fit the data was chosen. Regressionanalyses were performed using SigmaPlot 8.0.2 (SPSS Sci-ence, Chicago, IL, USA), and statistical tests for differencefollowed Sokal and Rohlf (1995).
RESULTS
Pfiesteria piscicida growth and Rhodomonas sp. inbatch cultures. In the LT Batch experiments, a briefpopulation increase of P. piscicida was observed in allfeeding schemes typically 2 or 3 days after addition ofRhodomonas sp. prey, both for individual treatments(Fig. 2 as a typical example) and pooled data (Fig. 3).As shown in Table 1, the growth rate, averaged for 2days (second and third days since feeding), was neg-ligible at low prey concentrations (o5000 Rhodcells �mL� 1) and prey-to-predator ratios (o5)(schemes I and II) but increased with food abun-dance (schemes III and IV). Accordingly, P. piscicidamaximum cell concentrations increased with preyconcentration and prey-to-predator ratio.
Rhodomonas sp. populations declined immediatelyafter they were supplied to P. piscicida cultures in allfeeding schemes, exhibiting a trend of exponential de-cay. This was evident in both individual treatments(Fig. 2 as a typical example) and in the pooled data(Fig. 3). The rate of prey depletion was assessed as thetime period (t) in which the prey population declinedby 90% (Table 1). In feeding scheme I with low initial
FIG. 1. Two-stage cyclostat culture system. A, filtered air; Ch, check valve; Cl, tubing clamp; M, low-speed magnetic stirring bar fortissue culture applications; P, peristaltic pump; S, sterile sampling port; stage 1, Rhodomonas sp. (Rhod); stage 2, P. piscicida fed withRhodomonas sp. (Pfiest); V, filtered air valve.
GRAZING AND GROWTH OF PFIESTERIA PISCICIDA 1065
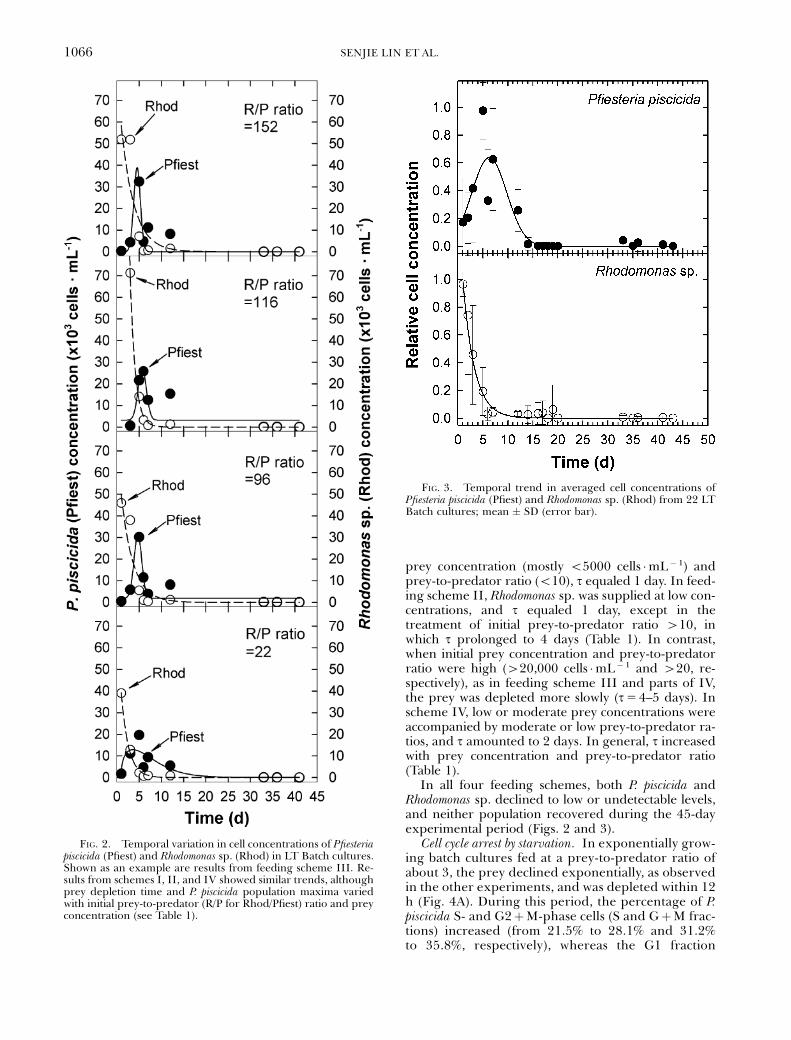
prey concentration (mostly o5000 cells �mL� 1) andprey-to-predator ratio (o10), t equaled 1 day. In feed-ing scheme II, Rhodomonas sp. was supplied at low con-centrations, and t equaled 1 day, except in thetreatment of initial prey-to-predator ratio 410, inwhich t prolonged to 4 days (Table 1). In contrast,when initial prey concentration and prey-to-predatorratio were high (420,000 cells �mL�1 and 420, re-spectively), as in feeding scheme III and parts of IV,the prey was depleted more slowly (t54–5 days). Inscheme IV, low or moderate prey concentrations wereaccompanied by moderate or low prey-to-predator ra-tios, and t amounted to 2 days. In general, t increasedwith prey concentration and prey-to-predator ratio(Table 1).
In all four feeding schemes, both P. piscicida andRhodomonas sp. declined to low or undetectable levels,and neither population recovered during the 45-dayexperimental period (Figs. 2 and 3).
Cell cycle arrest by starvation. In exponentially grow-ing batch cultures fed at a prey-to-predator ratio ofabout 3, the prey declined exponentially, as observedin the other experiments, and was depleted within 12h (Fig. 4A). During this period, the percentage of P.piscicida S- and G2þM-phase cells (S and GþM frac-tions) increased (from 21.5% to 28.1% and 31.2%to 35.8%, respectively), whereas the G1 fraction
FIG. 2. Temporal variation in cell concentrations of Pfiesteriapiscicida (Pfiest) and Rhodomonas sp. (Rhod) in LT Batch cultures.Shown as an example are results from feeding scheme III. Re-sults from schemes I, II, and IV showed similar trends, althoughprey depletion time and P. piscicida population maxima variedwith initial prey-to-predator (R/P for Rhod/Pfiest) ratio and preyconcentration (see Table 1).
FIG. 3. Temporal trend in averaged cell concentrations ofPfiesteria piscicida (Pfiest) and Rhodomonas sp. (Rhod) from 22 LTBatch cultures; mean � SD (error bar).
SENJIE LIN ET AL.1066
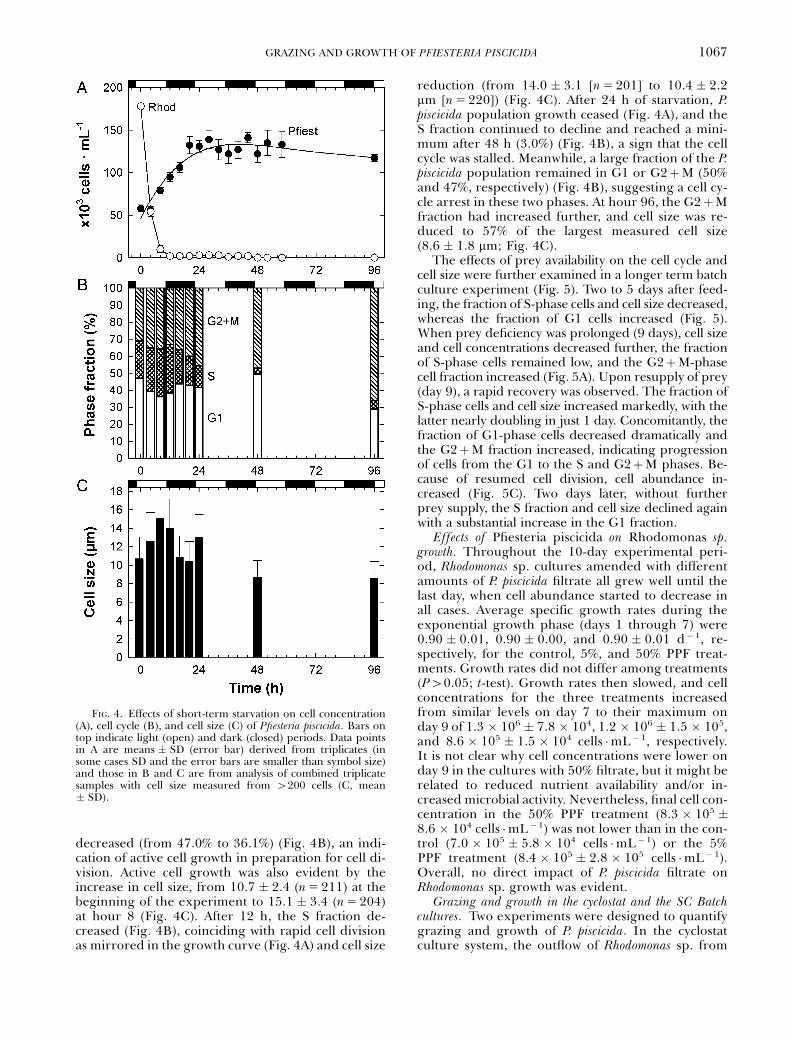
decreased (from 47.0% to 36.1%) (Fig. 4B), an indi-cation of active cell growth in preparation for cell di-vision. Active cell growth was also evident by theincrease in cell size, from 10.7 � 2.4 (n5 211) at thebeginning of the experiment to 15.1 � 3.4 (n5 204)at hour 8 (Fig. 4C). After 12 h, the S fraction de-creased (Fig. 4B), coinciding with rapid cell divisionas mirrored in the growth curve (Fig. 4A) and cell size
reduction (from 14.0 � 3.1 [n5 201] to 10.4 � 2.2mm [n5 220]) (Fig. 4C). After 24 h of starvation, P.piscicida population growth ceased (Fig. 4A), and theS fraction continued to decline and reached a mini-mum after 48 h (3.0%) (Fig. 4B), a sign that the cellcycle was stalled. Meanwhile, a large fraction of the P.piscicida population remained in G1 or G2þM (50%and 47%, respectively) (Fig. 4B), suggesting a cell cy-cle arrest in these two phases. At hour 96, the G2þMfraction had increased further, and cell size was re-duced to 57% of the largest measured cell size(8.6 � 1.8 mm; Fig. 4C).
The effects of prey availability on the cell cycle andcell size were further examined in a longer term batchculture experiment (Fig. 5). Two to 5 days after feed-ing, the fraction of S-phase cells and cell size decreased,whereas the fraction of G1 cells increased (Fig. 5).When prey deficiency was prolonged (9 days), cell sizeand cell concentrations decreased further, the fractionof S-phase cells remained low, and the G2þM-phasecell fraction increased (Fig. 5A). Upon resupply of prey(day 9), a rapid recovery was observed. The fraction ofS-phase cells and cell size increased markedly, with thelatter nearly doubling in just 1 day. Concomitantly, thefraction of G1-phase cells decreased dramatically andthe G2þM fraction increased, indicating progressionof cells from the G1 to the S and G2þM phases. Be-cause of resumed cell division, cell abundance in-creased (Fig. 5C). Two days later, without furtherprey supply, the S fraction and cell size declined againwith a substantial increase in the G1 fraction.
Effects of Pfiesteria piscicida on Rhodomonas sp.growth. Throughout the 10-day experimental peri-od, Rhodomonas sp. cultures amended with differentamounts of P. piscicida filtrate all grew well until thelast day, when cell abundance started to decrease inall cases. Average specific growth rates during theexponential growth phase (days 1 through 7) were0.90 � 0.01, 0.90 � 0.00, and 0.90 � 0.01 d� 1, re-spectively, for the control, 5%, and 50% PPF treat-ments. Growth rates did not differ among treatments(P40.05; t-test). Growth rates then slowed, and cellconcentrations for the three treatments increasedfrom similar levels on day 7 to their maximum onday 9 of 1.3 � 106 � 7.8 � 104, 1.2 � 106 � 1.5 � 105,and 8.6 � 105 � 1.5 � 104 cells �mL�1, respectively.It is not clear why cell concentrations were lower onday 9 in the cultures with 50% filtrate, but it might berelated to reduced nutrient availability and/or in-creased microbial activity. Nevertheless, final cell con-centration in the 50% PPF treatment (8.3 � 105 �8.6 � 104 cells �mL� 1) was not lower than in the con-trol (7.0 � 105 � 5.8 � 104 cells �mL� 1) or the 5%PPF treatment (8.4 � 105 � 2.8 � 105 cells �mL� 1).Overall, no direct impact of P. piscicida filtrate onRhodomonas sp. growth was evident.
Grazing and growth in the cyclostat and the SC Batchcultures. Two experiments were designed to quantifygrazing and growth of P. piscicida. In the cyclostatculture system, the outflow of Rhodomonas sp. from
FIG. 4. Effects of short-term starvation on cell concentration(A), cell cycle (B), and cell size (C) of Pfiesteria piscicida. Bars ontop indicate light (open) and dark (closed) periods. Data pointsin A are means � SD (error bar) derived from triplicates (insome cases SD and the error bars are smaller than symbol size)and those in B and C are from analysis of combined triplicatesamples with cell size measured from 4200 cells (C, mean� SD).
GRAZING AND GROWTH OF PFIESTERIA PISCICIDA 1067

stage 1 was fairly constant throughout each experi-ment. Once reaching steady state, Rhodomonas sp. andP. piscicida concentrations in stage 2 were stable, withRhodomonas sp. present at low levels (Fig. 6A). Pfies-teria piscicida growth rate was assumed to equal thedilution rate of stage 2. Hourly supplied Rhodomonassp. rations were removed rapidly, resulting in an ex-ponential decline of the prey population in stage 2(Fig. 6B). In one experiment, at a P. piscicida growth
rate of one doubling per day, Rhodomonas sp. concen-trations declined from 20,000 to 10,000 cells �mL�1
within 10 min and down to 5000 cells �mL� 1 in 20min (Fig. 6B). After 50 min, 490% of Rhodomonaswere removed. Integration of the exponential decayfunction fitted to the dynamics of Rhodomonas sp.gave an average concentration of about 5000 cells �mL� 1. For the experiments conducted at three P. pi-scicida growth rates (0.5, 0.75, and 1 doubling �d� 1),grazing rates ranged from 1 to 8 Rhod �Pfiest�1 �d�1
and averaged 1.94 � 0.42, 2.44 � 0.46, and 4.61 �1.44 Rhod �Pfiest�1 �d� 1, respectively.
In the SC Batch culture system, P. piscicida growthand final population density depended directly on theamount of prey provided daily (Fig. 7A). In treatmentR1 (Rhodomonas sp. concentration adjusted to 100cells �mL�1 daily), P. piscicida did not grow. A small in-crease in the P. piscicida population was attained by thedaily prey supply of 1000 cells �mL�1 (R2). The pop-ulation increase was more remarkable when prey sup-ply was 104 and 105 cells �mL� 1 (R3 and R4,respectively) (Fig. 7A). Pfiesteria piscicida concentrationsreached steady state after 8 days, except for R4, which
FIG. 5. Effects of prolonged starvation and refeeding on thecell cycle (A), cell size (B), and cell concentration (C) of Pfiesteriapiscicida. Each data point in A originates from the analysis ofcombined triplicates, and B and C present the mean of the trip-licates � SD. Arrows indicate addition of the prey alga Rho-domonas sp.
FIG. 6. Dynamics of Pfiesteria piscicida (Pfiest) and Rho-domonas sp. (Rhod) in the cyclostat culture system. (A) Periodiccell counts of prey and the predator verifying the steady-statecondition of the culture system (days 5 through 30). Arrow in-dicates the date of short-term grazing (shown in B) measure-ment. (B) Exponential decline of Rhod during the 1-h feedinginterval; each data point represents the mean of triplicates � SD.
SENJIE LIN ET AL.1068
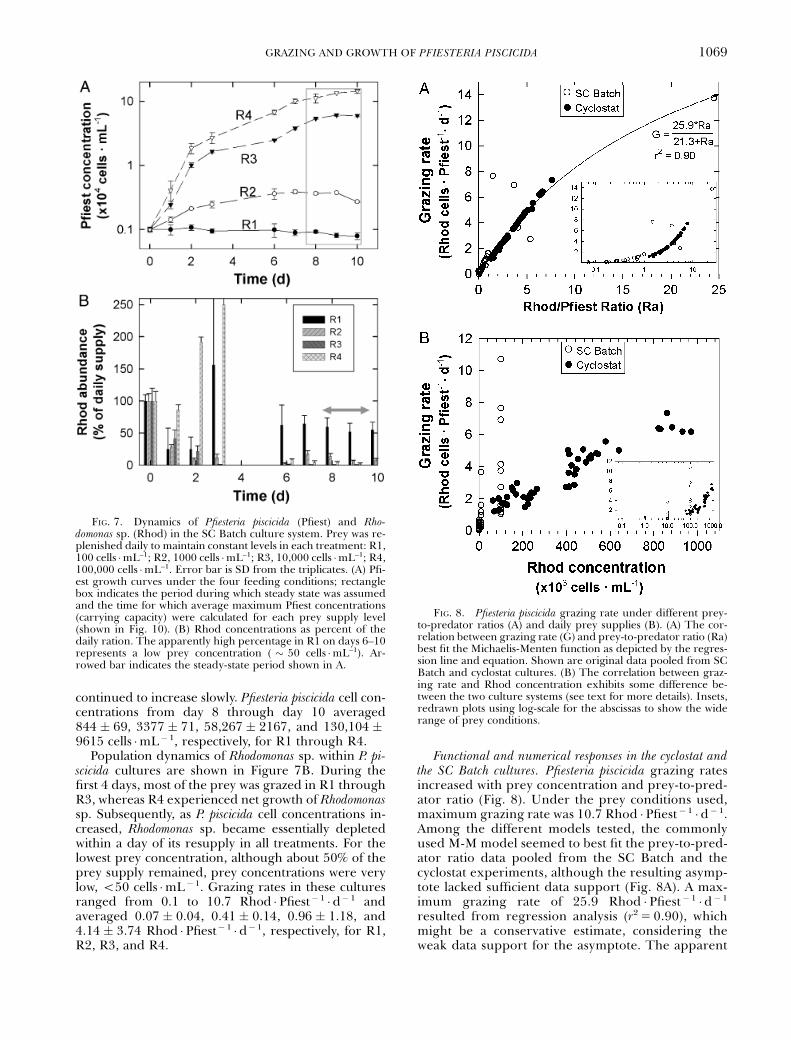
continued to increase slowly. Pfiesteria piscicida cell con-centrations from day 8 through day 10 averaged844 � 69, 3377 � 71, 58,267 � 2167, and 130,104 �9615 cells �mL�1, respectively, for R1 through R4.
Population dynamics of Rhodomonas sp. within P. pi-scicida cultures are shown in Figure 7B. During thefirst 4 days, most of the prey was grazed in R1 throughR3, whereas R4 experienced net growth of Rhodomonassp. Subsequently, as P. piscicida cell concentrations in-creased, Rhodomonas sp. became essentially depletedwithin a day of its resupply in all treatments. For thelowest prey concentration, although about 50% of theprey supply remained, prey concentrations were verylow, o50 cells �mL�1. Grazing rates in these culturesranged from 0.1 to 10.7 Rhod �Pfiest� 1 �d�1 andaveraged 0.07 � 0.04, 0.41 � 0.14, 0.96 � 1.18, and4.14 � 3.74 Rhod �Pfiest� 1 �d�1, respectively, for R1,R2, R3, and R4.
Functional and numerical responses in the cyclostat andthe SC Batch cultures. Pfiesteria piscicida grazing ratesincreased with prey concentration and prey-to-pred-ator ratio (Fig. 8). Under the prey conditions used,maximum grazing rate was 10.7 Rhod �Pfiest� 1 �d� 1.Among the different models tested, the commonlyused M-M model seemed to best fit the prey-to-pred-ator ratio data pooled from the SC Batch and thecyclostat experiments, although the resulting asymp-tote lacked sufficient data support (Fig. 8A). A max-imum grazing rate of 25.9 Rhod �Pfiest�1 �d� 1
resulted from regression analysis (r25 0.90), whichmight be a conservative estimate, considering theweak data support for the asymptote. The apparent
FIG. 7. Dynamics of Pfiesteria piscicida (Pfiest) and Rho-domonas sp. (Rhod) in the SC Batch culture system. Prey was re-plenished daily to maintain constant levels in each treatment: R1,100 cells �mL–1; R2, 1000 cells �mL–1; R3, 10,000 cells �mL–1; R4,100,000 cells �mL–1. Error bar is SD from the triplicates. (A) Pfi-est growth curves under the four feeding conditions; rectanglebox indicates the period during which steady state was assumedand the time for which average maximum Pfiest concentrations(carrying capacity) were calculated for each prey supply level(shown in Fig. 10). (B) Rhod concentrations as percent of thedaily ration. The apparently high percentage in R1 on days 6–10represents a low prey concentration ( � 50 cells �mL–1). Ar-rowed bar indicates the steady-state period shown in A.
FIG. 8. Pfiesteria piscicida grazing rate under different prey-to-predator ratios (A) and daily prey supplies (B). (A) The cor-relation between grazing rate (G) and prey-to-predator ratio (Ra)best fit the Michaelis-Menten function as depicted by the regres-sion line and equation. Shown are original data pooled from SCBatch and cyclostat cultures. (B) The correlation between graz-ing rate and Rhod concentration exhibits some difference be-tween the two culture systems (see text for more details). Insets,redrawn plots using log-scale for the abscissas to show the widerange of prey conditions.
GRAZING AND GROWTH OF PFIESTERIA PISCICIDA 1069
half-saturation coefficient from the same regressionwas 21.3. Imposing a threshold prey-to-predator ra-tio on the regression analyses, that is, replacing Ra inthe correlation equation in Figure 8A with (Ra�b),decreased the correlation coefficient remarkably (r2
from 0.9 to 0.7), and the resulting b value was neg-ative. Forcing a linear or an exponential regressionalso yielded no positive intercept. Therefore, no sig-nificant feeding threshold was apparent. Correlationbetween grazing rate and prey concentration was lessconsistent between the SC Batch and the cyclostatexperiments (Fig. 8B). Grazing rates increased fasterat lower prey concentrations in the SC Batch culturesthan in the cyclostat.
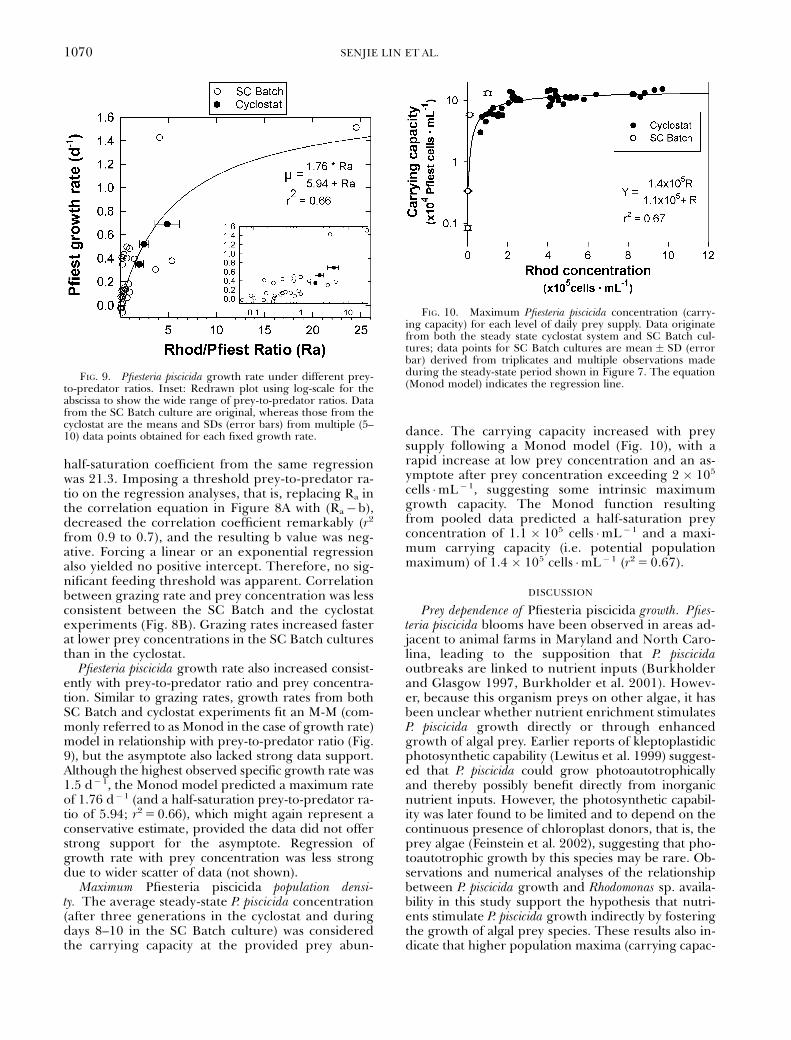
Pfiesteria piscicida growth rate also increased consist-ently with prey-to-predator ratio and prey concentra-tion. Similar to grazing rates, growth rates from bothSC Batch and cyclostat experiments fit an M-M (com-monly referred to as Monod in the case of growth rate)model in relationship with prey-to-predator ratio (Fig.9), but the asymptote also lacked strong data support.Although the highest observed specific growth rate was1.5 d�1, the Monod model predicted a maximum rateof 1.76 d�1 (and a half-saturation prey-to-predator ra-tio of 5.94; r250.66), which might again represent aconservative estimate, provided the data did not offerstrong support for the asymptote. Regression ofgrowth rate with prey concentration was less strongdue to wider scatter of data (not shown).
Maximum Pfiesteria piscicida population densi-ty. The average steady-state P. piscicida concentration(after three generations in the cyclostat and duringdays 8–10 in the SC Batch culture) was consideredthe carrying capacity at the provided prey abun-
dance. The carrying capacity increased with preysupply following a Monod model (Fig. 10), with arapid increase at low prey concentration and an as-ymptote after prey concentration exceeding 2 � 105
cells �mL� 1, suggesting some intrinsic maximumgrowth capacity. The Monod function resultingfrom pooled data predicted a half-saturation preyconcentration of 1.1 � 105 cells �mL� 1 and a maxi-mum carrying capacity (i.e. potential populationmaximum) of 1.4 � 105 cells �mL� 1 (r25 0.67).
DISCUSSION
Prey dependence of Pfiesteria piscicida growth. Pfies-teria piscicida blooms have been observed in areas ad-jacent to animal farms in Maryland and North Caro-lina, leading to the supposition that P. piscicidaoutbreaks are linked to nutrient inputs (Burkholderand Glasgow 1997, Burkholder et al. 2001). Howev-er, because this organism preys on other algae, it hasbeen unclear whether nutrient enrichment stimulatesP. piscicida growth directly or through enhancedgrowth of algal prey. Earlier reports of kleptoplastidicphotosynthetic capability (Lewitus et al. 1999) suggest-ed that P. piscicida could grow photoautotrophicallyand thereby possibly benefit directly from inorganicnutrient inputs. However, the photosynthetic capabil-ity was later found to be limited and to depend on thecontinuous presence of chloroplast donors, that is, theprey algae (Feinstein et al. 2002), suggesting that pho-toautotrophic growth by this species may be rare. Ob-servations and numerical analyses of the relationshipbetween P. piscicida growth and Rhodomonas sp. availa-bility in this study support the hypothesis that nutri-ents stimulate P. piscicida growth indirectly by fosteringthe growth of algal prey species. These results also in-dicate that higher population maxima (carrying capac-
FIG. 9. Pfiesteria piscicida growth rate under different prey-to-predator ratios. Inset: Redrawn plot using log-scale for theabscissa to show the wide range of prey-to-predator ratios. Datafrom the SC Batch culture are original, whereas those from thecyclostat are the means and SDs (error bars) from multiple (5–10) data points obtained for each fixed growth rate.
FIG. 10. Maximum Pfiesteria piscicida concentration (carry-ing capacity) for each level of daily prey supply. Data originatefrom both the steady state cyclostat system and SC Batch cul-tures; data points for SC Batch cultures are mean � SD (errorbar) derived from triplicates and multiple observations madeduring the steady-state period shown in Figure 7. The equation(Monod model) indicates the regression line.
SENJIE LIN ET AL.1070
ity) of P. piscicida can be attained when appropriateprey is supplied at high rates.
Strong dependence of P. piscicida on the supply ofalgal prey is further supported by the modulation ofcell cycle behavior by prey availability. For eukaryotes,cells undergo G1 (1N genome status), S (DNA replica-tion or synthesis phase), G2 (2N genome status), andM (mitosis) phases before cell division, and entry intothe S phase usually indicates commitment of the cellsto division (Murray and Hunt 1993). The fraction of P.piscicida cells in the S phase was elevated wheneverRhodomonas sp. was provided as prey. After prey de-pletion, advancement of P. piscicida cells into the Sphase decreased rapidly, in parallel with a reductionin cell size (an indicator of cellular growth) (after 48 h)and the arrest of a large fraction of cells in the G1 andG2 phases. Theoretically, zygotes formed during sex-ual reproduction also contain 2N or more DNA sets(Parrow and Burkholder et al. 2002) and could becompounded with G2þM cells in our analysis. How-ever, there is no evidence that starvation induces sex-ual reproduction in P. piscicida (Litaker et al. 2002). It istherefore most likely that the 2N cells observed understarvation in this study represented G2þM cells. Al-though these G1- and G2þM-arrested cells could the-oretically be temporary cysts (Litaker et al. 2002,Parrow et al. 2002), no cysts were discovered duringmicroscopic examination of the starved samples. Rapidrecovery of cell cycle progression upon refeeding in-dicates that prey availability modulates the cell divisioncycle of P. piscicida closely.
Effects of Pfiesteria piscicida grazing on prey popula-tions. Previous studies showed that P. piscicida is ca-pable of grazing on phytoplankton (Burkholder et al.2001). The array of feeding experiments in this studyrevealed that P. piscicida populations could not con-tinue to grow without a resupply of prey and thatboth the algal prey and the grazer populations couldnot rebound without additional seed populations.This result contrasts classical prey–predator oscilla-tions documented for micrograzers (Shertzer et al.2002, Yoshida et al. 2003), including a Pfiesteria-likedinoflagellate (CCMP1828; unpublished data). Thelack of effect of P. piscicida filtrate on the growth ofRhodomonas sp. noted in this study excluded the pos-sibility of prey mortality or growth inhibition fromtoxic agents possibly produced and released by P. pi-scicida. Grazing by P. piscicida seemed to annihilate aprey population. This rapid and voracious feedingbehavior is corroborated by video observations dem-onstrating swift clearance of prey by P. piscicida cul-tures. Our video recording (available at http://www.blackwellpublishing.com/products/journals/suppmat/jpy/jpy03217/jpy03-217 clip.avi) showedthat a P. piscicida cell, using its peduncle to acquirethe cellular contents of the prey, could con-sume one Rhodomonas sp. in less than a minute (notshown), a rate similar to a Crypthecodinium-likepeduncle-dependent feeding dinoflagellate (Uckoet al. 1997) but two to three times faster than in the
mixotrophic gymnodinioid, Karlodinium micrum (Liet al. 1999).
The exponential decline of prey was observed con-sistently in various P. piscicida cultures. In the LT Batchcultures, prey was generally depleted within 1 to 5days, depending on the supply level. In some cases,prey depletion was observed within 8 to12 h (Feinsteinet al. 2002). In addition, results from both the SCBatch and the cyclostat cultures revealed a maximumgrazing rate of 10.7 Rhod cells �Pfiest�1 �d� 1, whereasthe M-M function derived from the data predicted amaximum rate of 25.9 Rhod cells �Pfiest� 1 �d�1. As-suming P. piscicida and Rhodomonas sp. C contents of206 and 48 pg � cell�1, respectively (Feinstein et al.2002), the maximum grazing rate amounted to 0.51–1.24 ng C �Pfiest�1 �d� 1 or a specific grazing rate of2.5–6.0 d�1, which exceeds the P. piscicida specificgrowth rate markedly. This range of rates is higherthan many reported maximum ingestion rates for oth-er dinoflagellates. For instance, Protoperidinium pellu-cidum grazed at a maximum rate of 0.14 to 0.78cells �h� 1, depending on the type of prey (Jeong andLatz 1994, Buskey 1997). Gymnodinium sp. fed Synecho-coccus sp. exhibited a maximum carbon-specific graz-ing rate of 0.41 h� 1 (Strom 1991). Comparablegrazing rates have been reported only for Oxyrrhis ma-rina, which ingested as many as 28 Amphidinium carteraecells �d� 1 (Jeong et al. 2001), and a Crypthecodinium-like peduncle-dependent heterotrophic dinoflagellate,which exhibited a maximum grazing rate of 20 preycells �d� 1 (Ucko et al. 1997).
Prey thresholds for grazing have been observed forother dinoflagellates. Gymnodinium sp. exhibited athreshold prey concentration of 17 to 19.8 mg C �L� 1
(Strom 1991, Jakobsen and Hansen 1997), equivalentto 350–410 Rhod cells �mL� 1. Higher grazing thresh-old concentrations (50–1250 mg C �L� 1) have beendocumented for other dinoflagellates and protozoangrazers (Strom 1991). In contrast, no threshold preyconcentration (or prey-to-predator ratio) was apparentfor P. piscicida. This apparent lack of prey thresholdmight allow P. piscicida to deplete the prey efficientlyand hence account for the demise of Rhodomonas sp. inthe LT Batch cultures, which is reminiscent of an ‘‘im-prudent’’ type of grazer (Slobodkin 1974).
In the natural estuarine environment where P. pisci-cida may co-occur with potential prey algae as well ascompeting micrograzers, prey depletion as observed inthe simplistic culture systems used in this study maynot occur. However, the results from this study suggestthat P. piscicida is a voracious grazer, which can exertconsiderable impact on prey populations (Lessard1991, Jacobson 1999, Jeong 1999, Stoecker 1999).The influence of predators on the dynamics of theirprey has been documented for Polykrikos kofoidii prey-ing on Gymnodinium catenatum (Matsuyama et al. 1999)and Protoperidinium spp. grazing on other dinoflagel-lates and diatoms (Jeong and Latz 1994, Buskey 1997).However, the significance of P. piscicida as a grazer innatural ecosystem needs to be further assessed with
GRAZING AND GROWTH OF PFIESTERIA PISCICIDA 1071

thorough studies of its in situ grazing rates and abun-dances.
Growth and cell cycle characteristics as a potential sur-vival strategy. A population maximum of P. piscicida of1.4 � 105 cells �mL�1 was predicted by the Monodfunction. However, some batch cultures in our labo-ratory reached cell concentrations as high as 2 � 105
cells �mL�1 (data not shown). The maximum ob-served (1.4 d� 1) and predicted (1.76 d�1) growthrates for P. piscicida are also high compared with otherdinoflagellates. Although Oxyrrhis marina can grow ata similar rate (1.17 d� 1; Jeong et al. 2001), a rate of0.9 d�1 observed for Polykrikos kofoidii was consideredunusually high for dinoflagellates (Matsuoka et al.2000). The maximum growth rate ranged from 0.31to 0.84 d� 1 in Gymnodinium spp. (Bj�rnsen andKuparinen 1991, Strom 1991) and from 0.35 to0.48 d� 1 in Protoperidinium spp. (Jeong and Latz1994, Naustvoll 2000). Diplopsalis lenticula grows atrates up to 0.25 d� 1 (Naustvoll 1998). In concert withits high grazing potential, the high growth potentialof P. piscicida might provide a competitive advantageby allowing cells to exploit pulses of prey efficiently toachieve large population increases within a short timeperiod.
The cell cycle arrest of P. piscicida at both G1 andG2þM phases after a period of prey deficiency is un-common among eukaryotic microalgae (Vaulot 1995)but has also been observed in Oxyrrhis marina (Whiteleyet al. 1993). The cell cycle of photosynthetic dinoflag-ellates and other eukaryotic phytoplankton tends to bearrested at G1 in response to nutrient deficiency (Vau-lot 1995) with few exceptions (e.g. G2-arrest in silicate-starved diatoms; Brzezinski et al. 1990). Whether thedifference is related to trophic mode remains to be in-vestigated, but the arrest of the P. piscicida cell cycle atboth G1 and G2þM suggests that growth in thesestages probably relies on an external source of carbonor energy. Pfiesteria piscicida cultures starved for 9 daysreentered the S phase and resumed cell division quick-ly (within 1 day) after prey was resupplied, suggestingthat these organisms may be able to survive short pe-riods of starvation while arrested in the cell cycle. Ar-rest at both G1 and G2þM phases under preydepletion and rapid resumption of cell division uponprey replenishment might provide survival advantagein an environment where prey supply is discrete. Rap-id P. piscicida population response to supply and re-moval of fish and other prey observed earlier(Burkholder and Glasgow 1997) might be associatedwith the cell cycle behavior noted here.
We thank Dr. JoAnn M. Burkholder for providing Pfiesteriapiscicida strain NCSU113–3, Keri Perkins and Daniel Lin fortechnical assistance, and Dr. Hans Dam for access to his videocamera. This research was supported by a NOAA-ECOHABgrant NA86OP0491 and is ECOHAB publication no. 99.
Berdalet, E. 1992. Effects of turbulence on the marine dinoflagel-late Gymnodinium nelsonii. J. Phycol. 28:267–72.
Berry, J. P., Reece, K. S., Rein, K. S., Baden, D. G., Haas, L. W.,Ribeiro, W. L., Shields, J. D. & Snyder, R. V. 2002. Are Pfiesteriaspecies toxicogenic? Evidence against production of ichthyo-toxins by Pfiesteria shumwayae. Proc. Natl. Acad. Sci. USA 99:10970–5.
Bj�rnsen, P. K. & Kuparinen, J. 1991. Growth and herbivory by theheterotrophic dinoflagellates in the Southern Ocean, studiedby microscosm experiments. Mar. Biol. 109:397–405.
Brzezinski, M. A., Olson, R. J. & Chisholm, S. W. 1990. Siliconavailability and cell-cycle progression in marine diatoms. Mar.Ecol. Prog. Ser. 67:83–96.
Burkholder, J. M. & Glasgow, H. B. 1997. Pfiesteria piscicida andother Pfiesteria-like dinoflagellates: Behavior, impacts, and en-vironmental controls. Limnol. Oceanogr. 42:1052–75.
Burkholder, J. M., Glasgow, H. B. & Deamer-Melia, N. 2001.Overview and present status of the toxic Pfiesteria complex(Dinophyceae). Phycologia. 40:186–214.
Burkholder, J. M., Noga, E. J., Hobbs, C. W., Glasgow, H. B. &Smith, S. A. 1992. New ‘‘phantom’’ dinoflagellate is the caus-ative agent of major estuarine fish kills. Nature 358:407–10.
Buskey, E. J. 1997. Behavioral component of feeding selectivity ofthe heterotrophic dinoflagellate Protoperidinium pellucidum.Mar. Ecol. Prog. Ser. 153:77–89.
Feinstein, T. N. R., Sun, M.-Y., Traslavina, R. & Lin, S. 2002. Effectsof light on photosynthesis, grazing, and population dynamicsof the heterotrophic dinoflagellate Pfiesteria piscicida (Din-ophyceae). J. Phycol. 38:659–69.
Frost, B. W. 1972. Effects of size and concentration of food particleson the feeding behavior of the marine planktonic copepodCalanus pacificus. Limnol. Oceanogr. 17:805–15.
Glasgow, H. B., Burkholder, J. M., Mallin, M. A., Deamer-Melia, N.J. & Reed, R. E. 2001. Field ecology of toxic Pfiesteria complexspecies, and a conservative analysis of their role in estuarinefish kills. Environ. Health Perspect. 109(suppl 5):715–30.
Glasgow, H. B., Lewitus, A. J. & Burkholder, J. M. 1998. Feedingbehavior of the ichthyotoxic estuarine dinoflagellate, Pfiesteriapiscicida, on amino acids, algal prey, and fish vs. mammalianerythrocytes In Reguera, B., Blankco, J., Fernandez, M. L. &Wyatt, T., [Eds.]. Harmful Algae 394–7.
Jacobson, D. M. 1999. A brief history of dinoflagellate feeding re-search. J. Eukaryot. Microbial. 46:376–81.
Jakobsen, H. H. & Hansen, P. J. 1997. Prey size selection, grazing,and growth response of the small heterotrophic dinoflagellateGymnodinium sp. and the ciliate Balanion comatum-a compara-tive study. Mar. Ecol. Prog. Ser. 158:75–86.
Jeong, H. J. 1999. The ecological roles of heterotrophic dinoflag-ellates in marine planktonic community. J. Euk. Microbiol. 46:390–6.
Jeong, H. J., Kang, H., Shim, J. H., Park, J. K., Kim, J. S., Song, J.Y. & Choi, H.-J. 2001. Interactions among the toxic dinoflag-ellate Amphidinium carterae, the heterotrophic dinoflagellateOxyrrhis marina, and the calanoid copepods Acartia spp. Mar.Ecol. Prog. Ser. 218:77–86.
Jeong, H. J. & Latz, M. I. 1994. Growth and grazing rates of Pro-toperidinium cf. Divergens on copepod eggs and early naupliarstages. Mar. Ecol. Prog. Ser. 158:75–86.
Jochem, F. J. 2001. Morphology and DNA content of bacterio-plankton in the northern Gulf of Mexico: analysis by epiflu-orescence microscopy and flow cytometry. Aquat. Microb. Ecol.25:179–94.
Lessard, E. J. 1991. The trophic role of heterophic dinoflagellatesin diver marine environments. Mar. Microb. Food Webs 5:49–58.
Lewitus, A. J., Glasgow, H. B. & Burkholder, J. M. 1999.Kleptoplastidy in the toxic dinoflagellate Pfiesteria piscicida(Dinophyceae). J. Phycol. 35:305–12.
Li, A., Stoecker, D. K. & Adolf, J. E. 1999. Feeding, pigmentation,photosynthesis and growth of the mixotrophic dinoflagellateGyrodinium galatheanum. Aquat. Microb. Ecol. 19:163–76.
Litaker, R. W., Vandersea, M.W., Kibler, S. R., Madden, V. J., Noga,E. J. & Tester, P. A. 2002. Life cycle of the heterotrophicdinoflagellate Piscicida piscicida (Dinophyceae). J. Phycol. 38:442–63.
SENJIE LIN ET AL.1072

Matsuoka, K., Cho, H.-J. & Jacobson, D. M. 2000. Observations ofthe feeding behavior and growth rates of the heterotrophicdinoflagellate Polykrikos kofoidii (Polykridaceae, Dinophyceae).Phycologia 39:82–6.
Matsuyama, Y., Miyamoto, M. & Kotani, Y. 1999. Grazing im-pacts of the heterotrophic dinoflagellate Polykrikos kofoidii on abloom of Gymnodinium catenatum. Aquat. Microb. Ecol. 17:91–8.
Murray, A. & Hunt, T. 1993. The Cell Cycle: An Introduction. OxfordUniversity Press, New York, 251 pp.
Naustvoll, L.-J. 1998. Growth and grazing by the thecate hetero-tropic dinoflagellate Dipliosalis lenticula (Diplopsalidaceae, Di-nophyecae). Phycologia 37:1–9.
Naustvoll, L.-J. 2000. Prey size spectra and food preferencesin thecate heterotrophic dinoflagellates. Phycologia 39:187–98.
Oldach, D., Delwiche, C. F., Jakobsen, K. S., Tengs, T., Brown, E.G., Kempton, J. W., Schaefer, E. F., Bowers, H. A., Glasgow, H.B., Burkholder, J. M., Steidinger, K. A. & Rublee, P. A. 2000.Heteroduplex mobility assay-guided sequence discovery: elu-cidation of the small subunit (18S) rRNA sequences of Pfiesteriapiscicida and related dinoflagellates from complex algal cultureand environmental sample DNA pools. Proc. Natl. Acad. Sci.USA. 97:4303–8.
Parrow, M. W. & Burkholder, J. M. 2002. Flow cytometric deter-mination of zoospore DNA content and population DNA dis-tribution in cultured Pfiesteria spp. (Pyrrhophyta). J. Exp. Mar.Biol. Ecol. 267:35–51.
Parrow, M. W., Glasgow, H. B., Burkholder, J. M. & Zhang, C.2001. Comparative response to algal prey by Pfiesteria piscicida,Pfiesteria shumwayae, and a co-occurring ‘‘look-alike’’ species. InHallegraeff, G. M., Blackburn, S. I., Bolch, C. J. & Lewis, R.[Eds.] Proceedings of the Ninth International Conference on Harm-ful Algal Blooms. Intergovernmental Oceanographic Commis-sion of UNESCO, Paris, France pp. 101–4.
Rhee, G. Y., Gotham, I. J. & Chisolm, S. W. 1981. Use of cyclostatcultures to study phytoplankton ecology. In Calcott, P. R. [Ed.]Continuous Cultures of Cells. CRC Press, Boca Raton, FL, pp.159–86.
Seaborn, D., Seaborn, A., Dunstan, W. & Marshall, H. 1999.Growth and feeding studies on the algal feeding stage of aPfiesteria-like dinoflagellate. VA J. Sci. 50:337–44.
Selph, K. E. 1999. Application of Two-Stage Chemostats and FlowCytometry to Study Marine Nanoflagellate Grazing and Digestion.PhD. Thesis, University of Hawaii, 229 pp.
Shertzer, K. W., Ellener, S. P., Fussmann, G. F. & Hairston, N. G.2002. Predator-prey cycles in an aquatic microcosm: testinghypothesis of mechanism. J. An. Ecol. 71:802–15.
Skovgaard, A. 2000. A phagotrophically derivable growth factor inthe plastic dinoflagellates Gyrodinium resplendens. J. Phycol. 36:1069–78.
Slobodkin, L. B. 1974. Prudent predation does not require groupselection. Am. Nat. 108:665–78.
Sokal, R. R. & Rohlf, F. J. 1995. Biometry. 3rd ed. W. H. Freeman &Co, New York, 887 pp.
Stoecker, D. 1999. Mixtrophy among dinoflagellates. J. Eukarot.Microbiol. 46:397–401.
Strom, S. L. 1991. Growth and grazing rates of the herbivorousdinoflagellate Gymnodinium sp. from the open subarctic PacificOcean. Mar. Ecol. Prog. Ser. 78:103–13.
Strom, S. L. 2002. Light-aided digestion, grazing and growth inherbivorous protists. Aquat. Microb. Ecol. 23:253–61.
Ucko, M., Elbrachter, M. & Schnepf, E. 1997. A Crypthecodinium-likedinoflagellate feeding myzocytotically on the unicellular redalga Porphyridium sp. Eur. J. Phycol. 32:133–40.
Vaulot, D. 1995. The cell cycle of phytoplankton: couplingcell growth to population growth. In Joint, I. [Ed.] MolecularEcology of Aquatic Microbes. Springer, New York, pp. 303–22.
Whiteley, A. S., Burkhill, P. H. & Sleigh, . M. A. 1993. Rapid meth-od for cell cycle analysis in a predatory marine dinoflagellate.Cytometry. 14:909–15.
Yoshida, T., Jones, L. E., Ellner, S. P., Fussmann, G. F. & Hairston,N. G. 2003. Rapid evolution drives ecological dynamics in apredator-prey system. Nature. 424:303–6.
Zhang, H. & Lin, S. 2002. Identification and quantification ofPfiesteria piscicida by using the mitochondrial cytochrome bgene. Appl. Environ. Microbiol. 68:989–94.
GRAZING AND GROWTH OF PFIESTERIA PISCICIDA 1073