Dynamic estimation of markets exhibiting a prey–predator behavior
11
Dynamic estimation of markets exhibiting a prey–predator behavior Christos Michalakelis ⇑ , Charisios Christodoulos, Dimitrios Varoutas, Thomas Sphicopoulos National and Kapodistrian University of Athens, Panepistimioupolis, Illisia, Athens, Greece article info Keywords: Market structure Market competition Market shares Telecommunications forecasting Prey–predator species Lotka–Volterra model abstract The evolution of market concentration in high technology saturated markets with a dominant player is dynamically estimated, based on concepts of population biology. The mathematical description was per- formed using the Lotka–Volterra model and the corresponding parameters were estimated by genetic algorithms. The proposed methodology shows itself capable of estimating market equilibrium and mar- ket concentration, the latter expressed by corresponding market shares. Evaluation of the presented methodology in the area of fixed lines telecommunications market led to accurate results, as compared to historical data, in a specific case study. This methodology can provide valuable inputs for managerial decisions, strategic planning and regulatory decisions to the players of a high technology market. Ó 2012 Elsevier Ltd. All rights reserved. 1. Introduction Telecommunications are related with the biggest and most sig- nificant civil investment regarding new technologies and services. For a long period of time they used to operate under governmental provision and monopolistic regime, mainly because of governmen- tal strategic perceptions and military security. During this time, the telecommunications industry was a relatively stable environment (van Kranenburg & Hagedoorn, 2008), since incumbent telecom- munications operators offered only traditional voice and data transfer services via fixed telecommunications networks. The liberalization of basic fixed telephone services started dur- ing the mid-1990s. By 1999, competition for such services had be- come relatively common, although it was still not the policy of a majority of countries. During 1999 more than 40% of the countries in Europe and 35% of the countries in the Americas permitted com- petition for basic fixed services (Banerjee & Ros, 2004). However, only 22% of Asian, 15% of the Middle East, and 15% of African coun- tries had followed. In 2000, competition for basic fixed services was still restricted in 105 countries. As far as Europe is concerned, since the 1990s the European Union (EU), in the context of its plans for a Single European Market, has been pursuing a common tele- communications regulatory policy aiming to establish a liberalized and harmonized pan-European telecommunications market, to stimulate economic growth, increase employment and the stan- dard of living in the European Community. Towards this direction, the Commission of the European Community in the Green Paper (European Commission, 1987) has put forward the principles for the liberalization of the telecommunications sector and described the common policy, in view of the single market. The main goal of market opening and restructuring was to promote market struc- tures that would enable the exploitation of substantial demand and innovation potentials in the communications industry. The ini- tial regulation aimed to transform telecommunication monopolies into competitive industries. Since the 1st of January 1998 almost all of the telecommunication markets in the EU have been fully lib- eralized, although full liberalization was delayed in Portugal and Greece until 2000 and 2001, respectively (Grzybowski, 2008). As stated in (van Kranenburg & Hagedoorn, 2008), where an informa- tive review regarding the European telecommunications industry can be found, ‘‘ The liberalization of European telecommunications markets and the privatization of many historically state-owned tele- communications companies are probably the two most significant changes in the landscape’’. Obviously, these changes amount to a substantially new world- wide environment for market players in the telecommunications area and present new challenges in terms of both new opportuni- ties and new competitors. According to the contemporary eco- nomic theory regarding competition, (Baye, 2006; Shy, 1995) downward pressure on the prices of telecommunication services is likely to lead service providers to introduce new pricing pack- ages in order to better satisfy consumer preferences. This was ex- actly the case when liberalization started in the new converged telecommunication market, as a fierce competition emerged be- tween the incumbent operators and the new companies that ap- peared, all trying to increase the number of their customers by providing services and products in very attractive prices. This is re- garded as a significant dimension of the market structure, since it plays an important part in determining market power and there- fore business behavior and performance in a market that was 0957-4174/$ - see front matter Ó 2012 Elsevier Ltd. All rights reserved. doi:10.1016/j.eswa.2012.01.049 ⇑ Corresponding author. Tel.: +30 210 7275236. E-mail addresses: [email protected] (C. Michalakelis), [email protected] (C. Christodoulos), [email protected] (D. Varoutas), [email protected] (T. Sphicopoulos). Expert Systems with Applications 39 (2012) 7690–7700 Contents lists available at SciVerse ScienceDirect Expert Systems with Applications journal homepage: www.elsevier.com/locate/eswa
Transcript of Dynamic estimation of markets exhibiting a prey–predator behavior

Expert Systems with Applications 39 (2012) 7690–7700
Contents lists available at SciVerse ScienceDirect
Expert Systems with Applications
journal homepage: www.elsevier .com/locate /eswa
Dynamic estimation of markets exhibiting a prey–predator behavior
Christos Michalakelis ⇑, Charisios Christodoulos, Dimitrios Varoutas, Thomas SphicopoulosNational and Kapodistrian University of Athens, Panepistimioupolis, Illisia, Athens, Greece
a r t i c l e i n f o
Keywords:Market structureMarket competitionMarket sharesTelecommunications forecastingPrey–predator speciesLotka–Volterra model
0957-4174/$ - see front matter � 2012 Elsevier Ltd. Adoi:10.1016/j.eswa.2012.01.049
⇑ Corresponding author. Tel.: +30 210 7275236.E-mail addresses: [email protected] (C. Mich
(C. Christodoulos), [email protected] (D. Va(T. Sphicopoulos).
a b s t r a c t
The evolution of market concentration in high technology saturated markets with a dominant player isdynamically estimated, based on concepts of population biology. The mathematical description was per-formed using the Lotka–Volterra model and the corresponding parameters were estimated by geneticalgorithms. The proposed methodology shows itself capable of estimating market equilibrium and mar-ket concentration, the latter expressed by corresponding market shares. Evaluation of the presentedmethodology in the area of fixed lines telecommunications market led to accurate results, as comparedto historical data, in a specific case study. This methodology can provide valuable inputs for managerialdecisions, strategic planning and regulatory decisions to the players of a high technology market.
� 2012 Elsevier Ltd. All rights reserved.
1. Introduction
Telecommunications are related with the biggest and most sig-nificant civil investment regarding new technologies and services.For a long period of time they used to operate under governmentalprovision and monopolistic regime, mainly because of governmen-tal strategic perceptions and military security. During this time, thetelecommunications industry was a relatively stable environment(van Kranenburg & Hagedoorn, 2008), since incumbent telecom-munications operators offered only traditional voice and datatransfer services via fixed telecommunications networks.
The liberalization of basic fixed telephone services started dur-ing the mid-1990s. By 1999, competition for such services had be-come relatively common, although it was still not the policy of amajority of countries. During 1999 more than 40% of the countriesin Europe and 35% of the countries in the Americas permitted com-petition for basic fixed services (Banerjee & Ros, 2004). However,only 22% of Asian, 15% of the Middle East, and 15% of African coun-tries had followed. In 2000, competition for basic fixed serviceswas still restricted in 105 countries. As far as Europe is concerned,since the 1990s the European Union (EU), in the context of its plansfor a Single European Market, has been pursuing a common tele-communications regulatory policy aiming to establish a liberalizedand harmonized pan-European telecommunications market, tostimulate economic growth, increase employment and the stan-dard of living in the European Community. Towards this direction,the Commission of the European Community in the Green Paper(European Commission, 1987) has put forward the principles for
ll rights reserved.
alakelis), [email protected]), [email protected]
the liberalization of the telecommunications sector and describedthe common policy, in view of the single market. The main goalof market opening and restructuring was to promote market struc-tures that would enable the exploitation of substantial demandand innovation potentials in the communications industry. The ini-tial regulation aimed to transform telecommunication monopoliesinto competitive industries. Since the 1st of January 1998 almostall of the telecommunication markets in the EU have been fully lib-eralized, although full liberalization was delayed in Portugal andGreece until 2000 and 2001, respectively (Grzybowski, 2008). Asstated in (van Kranenburg & Hagedoorn, 2008), where an informa-tive review regarding the European telecommunications industrycan be found, ‘‘ The liberalization of European telecommunicationsmarkets and the privatization of many historically state-owned tele-communications companies are probably the two most significantchanges in the landscape’’.
Obviously, these changes amount to a substantially new world-wide environment for market players in the telecommunicationsarea and present new challenges in terms of both new opportuni-ties and new competitors. According to the contemporary eco-nomic theory regarding competition, (Baye, 2006; Shy, 1995)downward pressure on the prices of telecommunication servicesis likely to lead service providers to introduce new pricing pack-ages in order to better satisfy consumer preferences. This was ex-actly the case when liberalization started in the new convergedtelecommunication market, as a fierce competition emerged be-tween the incumbent operators and the new companies that ap-peared, all trying to increase the number of their customers byproviding services and products in very attractive prices. This is re-garded as a significant dimension of the market structure, since itplays an important part in determining market power and there-fore business behavior and performance in a market that was

C. Michalakelis et al. / Expert Systems with Applications 39 (2012) 7690–7700 7691
reformed from a monopolistic to oligopolistic or even to a morecompetitive structure.
Studying the concentration of the new market schema is there-fore necessary, in order to identify its possible peculiarities, to de-scribe competitors’ behavior and to provide necessary inputs tolegislation and regulation authorities, regarding market structureand the degree of competition (Curry & George, 1983; Marfels,1972; Saving, Feb., 1970; Tirole, 1988), as well as predictions forthe future regarding, among others, potential entry of new providers(Baye, 2006; Shy, 1995). Moreover, market concentration, as ex-pressed by the values of market shares, is of major interest forproviders as well, since it is strongly related to managerial decisions,available actions to be taken and expectations towards competition.Such decisions are usually accompanied by investments andbusiness plans, targeting to enhance the ability of providers to meetthe market’s demand. Since market shares reflect, among others, theinfluence of providers’ pricing policies over the subscribers, this isanother important aspect to be taken under consideration.
In the context of the present work, the evolution of fixed tele-phony market (PSTN) concentration is studied, based on the evolu-tion of the corresponding market shares of both the incumbent andthe alternative providers, by adopting approaches from evolution-ary theory of population biology and population dynamics. Morespecifically, market evolution is estimated and forecasted byapplying the Lotka–Volterra model that describes the interactionof species in a prey–predator mode (Murray, 2002; Neal, 2004).Lotka–Volterra models have already been used in literature in orderto model market dynamics, mainly in a duopolistic market (Kim,Lee, & Ahn, 2006; Lopez & Sanjuan, 2001; Tschirhart, 2000;Wijeratne, Yi, & Wei, 2007), or to provide forecasts for the stockmarket (Lee, Lee, & Oh, 2005; Modis, 1999).
1.1. Research objectives and contribution
The above approaches, although they constitute important con-tributions to the literature, they refer to markets where competitionis already established. The main objective of the present work is tofill this gap by proposing a methodology that can describe thedynamics of an already saturated monopolistic market, whichmakes its first steps towards competition. Such an analysis is ex-pected to provide valuable information to the existing competitors,as well as to the potential entrants and regulators, regarding marketstructure, degree of competition and market equilibrium.
The second objective is to point out the relation of pricingschemes with the corresponding market shares. Indeed, the callcharges paid by the consumers influence, up to a certain point,their decision to switch to another provider, or to stay with theirpresent one, thus influencing the share of each competitor intothe market of reference.
The third objective is the application of the proposed methodol-ogy over a number of historical data series, in order to evaluate itsperformance and its ability to provide accurate estimations and reli-able forecasts. Therefore, the evaluation of the proposed methodol-ogy was performed over historical data regarding market sharesbetween the incumbent operator and the alternatives, for local, na-tional long distance and international calls in five European coun-tries. The data used for this evaluation were extracted fromEurostat’s database (http://ec.europa.eu/eurostat/).
Accomplishment of the work’s objectives would provide signif-icant contribution to both research and practice. Research wouldbenefit by the provision of new directions towards the develop-ment of a framework that incorporates the theories of populationdynamics in order to analyze and study market competition, espe-cially for high technology markets. For practitioners, the researchfindings can be very useful to strategic planning and decision mak-ing, in a continuously increased competitive environment, since
more accurate a-priori estimates of the market dynamics patternscan be derived, including market equilibria and the estimation ofthe level of customers’ switching among providers.
1.2. Population dynamics
Population dynamics is the study of marginal and long-termchanges in the numbers (Neal, 2004), individual weights and agecomposition of individuals in one or several populations, and bio-logical and environmental processes influencing those changes.The corresponding population modeling is an application of statisti-cal models to the study of these changes in populations as a conse-quence of interactions of organisms with the physical environment,with individuals of their own species (intraspecies competition),and with organisms of other species (interspecies competition). Fi-nally, one of the most important questions population modelingseeks to answer is if interacting species can coexist or not and whatare the major factors that affect coexistence.
The rest of the paper is structured as follows: Section 2 is de-voted in modeling of the fixed lines market dynamics accordingto the population biology approach. Section 3 provides a shortoverview of the mathematical concepts of population dynamics,especially the dynamics of the prey–predator system. Based onthese concepts, the development of the proposed methodology ispresented in Section 4, and the corresponding case study resultsare presented in Section 5. In Section 6 the methodology’s forecast-ing ability is evaluated and finally, Section 7 describes an overviewand the conclusions of the work conducted in this paper, togetherwith directions for future work.
2. Approaching fixed line market dynamics by populationbiology modeling
The hypothesis concerning the variation of population is thatthe rate of its change is proportional to the current size of the pop-ulation and the most common approach for modeling populationgrowth of a species, in the absence of any competitors is givenby (Boyce & DiPrima, 2005; Neal, 2004)
dNðtÞdt¼ rNðtÞ 1� NðtÞ
K
� �ð1Þ
In Eq. (1) N(t) is the size of population at time t, the constant r is thegrowth rate, and K is the saturation level or the environmental car-rying capacity, for the given species. K is the upper bound that isreached, but not exceeded, by growing populations starting belowthis value. Models based on the above approach are widely usedin modern literature for demand estimation and forecasting, suchas the logistic family growth models (Bewley & Fiebig, 1988; Fisher& Pry, 1971) and the Gompertz model (Gompertz, 1825; Rai, 1999).An application of these demand models over mobile telephony dif-fusion set can be found in (Michalakelis, Varoutas, & Sphicopoulos,2008).
However, when more than one species coexist in the same envi-ronment, they are expected to interact between each other in anumber of ways. Definitions and descriptions of species interactioncan be found in (Begon, Townsend, & Harper, 2006, 4th ed.; Neal,2004) and a more precise definition, regarding interaction of spe-cies, is given in (Murray, 2002), where three types of interactionare identified: (i) If the growth rate of one population is decreasedand the other increased the populations are in a ‘‘prey–predator’’situation. (ii) If the growth rate of each population is decreasedthen it is ‘‘competition’’. (iii) If each population’s growth rate is en-hanced then it is called ‘‘mutualism’’ or ‘‘symbiosis’’.
Towards this direction, the present work is based on the ratio-nale of viewing the incumbent and the alternative operators as

7692 C. Michalakelis et al. / Expert Systems with Applications 39 (2012) 7690–7700
biological species competing for survival and growth, expressed interms of market shares. The main target is to model the evolutionof the market during the first time period that followed liberaliza-tion, when the incumbent operators dominated the market, in theabsence of any competitors.
As soon as liberalization took place the alternative operatorsthat emerged did not have their own network infrastructure, sothey were depended on the incumbent. Moreover, by the timeof liberalization, the fixed lines market was an already saturatedone and since no further growth was expected all of the compet-itors would have to compete for a market share in an already ma-ture market. Thus, the incumbent operator met a decrease in itsmarket share, while the alternative operators enjoyed an increasein their corresponding shares and growth. Moreover, convergenceof the telecommunication services accelerates redistribution ofmarket shares, since the alternative operators provide not onlyvoice services but also internet access or even triple play services,at low cost.
Thus, following the above, the prey–predator model is consid-ered as the most appropriate approach for capturing the evolutionof the telecommunications market, in terms of market shares. Theincumbent operator is viewed as the prey and all the alternativeoperators as a predator, which bases its survival on consuming theprey’s market share. Thus, the prey’s population decreases, whilethe predator’s increases. Market shares is a quite accurate indicatorfor estimating the degree of competition, since they can be consid-ered as the observed outcome of the underlying, usually non-coop-erative, game of the participating players–service providers. Theyreflect the results of managerial and strategic decisions, such asadvertising, pricing policy, quality of services and more. In the nextsection, the mathematical model for describing the interaction ofspecies in a prey–predator mode is presented, which turned out toadequately describe the fixed line market dynamics.
3. Population dynamics – prey predator species
The most common model for capturing the measure of interac-tion between species is the well-known Lotka–Volterra model,based on the work of Alfred J. Lotka and Vito Volterra. The approachis mainly based on incorporating suitable parameters into a corre-sponding system of differential equations. Analytical description to-gether with informative examples regarding prey–predatorinteraction between species can be widely found in literature, suchas in (Begon et al., 2006, 4th ed.; Boyce & DiPrima, 2005; Murray,2002; Neal, 2004). Theoretical analyses together with applicationsof species interaction can be found in (Fay & Greeff, 2008; Freedman& Waltman, 1977, 1984, 1985; Kirlinger, 1989; Leach & Miritzis,2006; Li & Yan, 2008; May & Leonard, 1975; Pao, 2003; Seifert,1995; Shair & Tineo, 2007; Wangersky, 1978).
Construction of an interacting model consisting of one prey andone predator, whose populations at time t are denoted by x(t) andy(t), respectively, is based on the following assumptions:
� If no predator is present, population of the prey, at any time t, isdescribed by Eq. (1).� In the absence of the prey, the predator would die out at a rate
proportional to its population.� The number of encounters between the predator and the prey is
proportional to the product of their populations. Each encountertends to promote the growth of the predator and to inhibit thegrowth of the prey.
Following the above assumptions, the dynamics of the de-scribed system can be represented by the following system offirst-order nonlinear differential equations:
dxðtÞdt¼ r � xðtÞ � 1� xðtÞ
K
� �� b � xðtÞ � yðtÞ ð2Þ
dyðtÞdt¼ �c � yðtÞ þ d � xðtÞ � yðtÞ
In Eq. (2) dx(t)/dt, dy(t)/dt are the rates of population change for theprey and the predator respectively and the parameters, r, K, b, c andd are all positive; parameter r stands for the growth rate of the prey,K for its carrying capacity (the maximum potential of the market)and b is a constant, used to capture the prey’s extinction rate, as aresult of interaction with the predator. Obviously, the greater thevalue of b the greater the effect of extinction of the prey, due toexistence of the predator. Regarding the second equation that de-scribes the predator, c is a constant that captures its death rateand d measures the predator’s growth as a result of the interactionwith the prey. Finally and according to the population biology ter-minology, the coefficients b and d measure the interspecies inter-acting effects (of each species over the other).
Given the two-dimensional autonomous system described byEq. (2), every solution can be represented as a curve in the planeand each such solution curve is called a trajectory, or an orbit.The main objective is to determine the behavior of the solutionsof the system, given the initial values for x(t) and y(t). This canbe achieved by plotting a phase portrait, the geometric representa-tion of the trajectories of a dynamical system, which shows howthe qualitative behavior of the system is determined as x and y varywith the time t.
The above system has three critical points (or equilibrium solu-tions, the values of x and y for which the derivatives of system de-scribed by Eq. (2) becomes zero): (0,0), (K,0) and c
d ;rb 1� c
dK
� �� �.
Since the system of Eq. (2) is a nonlinear system, linearizationnear critical points is necessary in order to study the qualitativebehavior of the corresponding solution. Thus, for a nonlinearautonomous system described by:
dxdt¼ Pðx; yÞ ð3Þ
dydt¼ Qðx; yÞ
where P and Q are functions of x and y, having continuous partialderivatives up to order two, linearization at a critical point (x0,y0)is achieved by considering the following transformation, whichmoves the critical point to the origin:
X ¼ x� x0 ð4Þ
Y ¼ y� y0
After applying the above transformation and performing a Taylorseries expansion the system of Eq. (3) becomes:
dXdt¼ PðX þ x0;Y þ y0Þ
¼ Pðx0; y0Þ þ X@P@x
����x¼x0 ;y¼y0
þ Y@P@y
����x¼x0 ;y¼y0
þ R1ðX;YÞ ð5Þ
dYdt¼ QðX þ x0;Y þ y0Þ
¼ Qðx0; y0Þ þ X@Q@x
����x¼x0 ;y¼y0
þ Y@Q@y
����x¼x0 ;y¼y0
þ R2ðX;YÞ
Since the nonlinear terms R1 and R2 satisfy the conditions:
R1ðX;YÞffiffiffiffiffiffiffiffiffiffiffiffiffiffiffiffiffiX2 þ Y2
p ! 0;R2ðX;YÞffiffiffiffiffiffiffiffiffiffiffiffiffiffiffiffiffi
X2 þ Y2p ! 0 ð6Þ
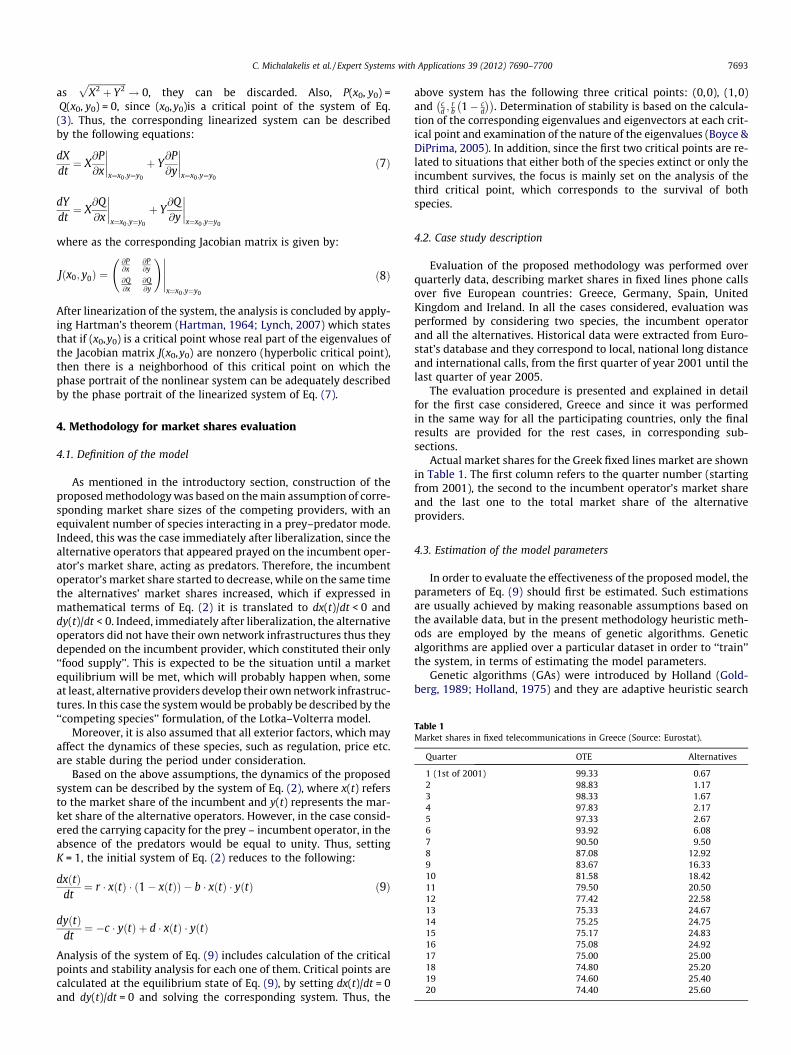
Table 1Market shares in fixed telecommunications in Greece (Source: Eurostat).
Quarter OTE Alternatives
1 (1st of 2001) 99.33 0.672 98.83 1.173 98.33 1.674 97.83 2.175 97.33 2.676 93.92 6.087 90.50 9.508 87.08 12.929 83.67 16.3310 81.58 18.4211 79.50 20.5012 77.42 22.5813 75.33 24.6714 75.25 24.7515 75.17 24.8316 75.08 24.9217 75.00 25.0018 74.80 25.2019 74.60 25.4020 74.40 25.60
C. Michalakelis et al. / Expert Systems with Applications 39 (2012) 7690–7700 7693
asffiffiffiffiffiffiffiffiffiffiffiffiffiffiffiffiffiX2 þ Y2
p! 0, they can be discarded. Also, P(x0, y0) =
Q(x0, y0) = 0, since (x0,y0)is a critical point of the system of Eq.(3). Thus, the corresponding linearized system can be describedby the following equations:
dXdt¼ X
@P@x
����x¼x0 ;y¼y0
þ Y@P@y
����x¼x0 ;y¼y0
ð7Þ
dYdt¼ X
@Q@x
����x¼x0 ;y¼y0
þ Y@Q@y
����x¼x0 ;y¼y0
where as the corresponding Jacobian matrix is given by:
Jðx0; y0Þ ¼@P@x
@P@y
@Q@x
@Q@y
!�����x¼x0 ;y¼y0
ð8Þ
After linearization of the system, the analysis is concluded by apply-ing Hartman’s theorem (Hartman, 1964; Lynch, 2007) which statesthat if (x0,y0) is a critical point whose real part of the eigenvalues ofthe Jacobian matrix J(x0,y0) are nonzero (hyperbolic critical point),then there is a neighborhood of this critical point on which thephase portrait of the nonlinear system can be adequately describedby the phase portrait of the linearized system of Eq. (7).
4. Methodology for market shares evaluation
4.1. Definition of the model
As mentioned in the introductory section, construction of theproposed methodology was based on the main assumption of corre-sponding market share sizes of the competing providers, with anequivalent number of species interacting in a prey–predator mode.Indeed, this was the case immediately after liberalization, since thealternative operators that appeared prayed on the incumbent oper-ator’s market share, acting as predators. Therefore, the incumbentoperator’s market share started to decrease, while on the same timethe alternatives’ market shares increased, which if expressed inmathematical terms of Eq. (2) it is translated to dx(t)/dt < 0 anddy(t)/dt < 0. Indeed, immediately after liberalization, the alternativeoperators did not have their own network infrastructures thus theydepended on the incumbent provider, which constituted their only‘‘food supply’’. This is expected to be the situation until a marketequilibrium will be met, which will probably happen when, someat least, alternative providers develop their own network infrastruc-tures. In this case the system would be probably be described by the‘‘competing species’’ formulation, of the Lotka–Volterra model.
Moreover, it is also assumed that all exterior factors, which mayaffect the dynamics of these species, such as regulation, price etc.are stable during the period under consideration.
Based on the above assumptions, the dynamics of the proposedsystem can be described by the system of Eq. (2), where x(t) refersto the market share of the incumbent and y(t) represents the mar-ket share of the alternative operators. However, in the case consid-ered the carrying capacity for the prey – incumbent operator, in theabsence of the predators would be equal to unity. Thus, settingK = 1, the initial system of Eq. (2) reduces to the following:
dxðtÞdt¼ r � xðtÞ � ð1� xðtÞÞ � b � xðtÞ � yðtÞ ð9Þ
dyðtÞdt¼ �c � yðtÞ þ d � xðtÞ � yðtÞ
Analysis of the system of Eq. (9) includes calculation of the criticalpoints and stability analysis for each one of them. Critical points arecalculated at the equilibrium state of Eq. (9), by setting dx(t)/dt = 0and dy(t)/dt = 0 and solving the corresponding system. Thus, the
above system has the following three critical points: (0,0), (1,0)and c
d ;rb 1� c
d
� �� �. Determination of stability is based on the calcula-
tion of the corresponding eigenvalues and eigenvectors at each crit-ical point and examination of the nature of the eigenvalues (Boyce &DiPrima, 2005). In addition, since the first two critical points are re-lated to situations that either both of the species extinct or only theincumbent survives, the focus is mainly set on the analysis of thethird critical point, which corresponds to the survival of bothspecies.
4.2. Case study description
Evaluation of the proposed methodology was performed overquarterly data, describing market shares in fixed lines phone callsover five European countries: Greece, Germany, Spain, UnitedKingdom and Ireland. In all the cases considered, evaluation wasperformed by considering two species, the incumbent operatorand all the alternatives. Historical data were extracted from Euro-stat’s database and they correspond to local, national long distanceand international calls, from the first quarter of year 2001 until thelast quarter of year 2005.
The evaluation procedure is presented and explained in detailfor the first case considered, Greece and since it was performedin the same way for all the participating countries, only the finalresults are provided for the rest cases, in corresponding sub-sections.
Actual market shares for the Greek fixed lines market are shownin Table 1. The first column refers to the quarter number (startingfrom 2001), the second to the incumbent operator’s market shareand the last one to the total market share of the alternativeproviders.
4.3. Estimation of the model parameters
In order to evaluate the effectiveness of the proposed model, theparameters of Eq. (9) should first be estimated. Such estimationsare usually achieved by making reasonable assumptions based onthe available data, but in the present methodology heuristic meth-ods are employed by the means of genetic algorithms. Geneticalgorithms are applied over a particular dataset in order to ‘‘train’’the system, in terms of estimating the model parameters.
Genetic algorithms (GAs) were introduced by Holland (Gold-berg, 1989; Holland, 1975) and they are adaptive heuristic search

Define fitness function f:= Sum of squared errors between
observed and calculated values
Define probabilities for crossover and mutation
Generate random initial population
Produce next generation based on genetic operators of crossover and
mutation
Evaluate population against fitness function. Discard the worst ranked.
Repeat until termination conditions are met
Fig. 1. Genetic algorithm procedure for the estimation of the proposed system’sparameters.
Incumbent provider (Greece)
0.00
0.20
0.40
0.60
0.80
1.00
1.20
1 2 3 4 5 6 7 8 9 10 11 12 13 14 15 16 17Time (quarters)
Mar
ket S
hare
s
Observed Estimated
Fig. 2. Estimation results for incumbent operator’s market shares.
7694 C. Michalakelis et al. / Expert Systems with Applications 39 (2012) 7690–7700
algorithms based on the mechanisms of natural selection and nat-ural genetics. The basic concept of GAs is designed to simulate pro-cesses in natural systems necessary for evolution, specifically thosethat follow the principles first laid down by Charles Darwin of sur-vival of the fittest. As such, they represent an intelligent exploita-tion of a random search within a defined search space to solve aproblem. The key points to the process are reproduction, crossoverand mutation, which are performed according to a given probabil-ity, just as it happens in real world. Reproduction involves copying(reproducing) solution vectors, crossover involves swapping partialsolution vectors and mutation is the process of randomly changinga cell in the string of the solution vector preventing the possibilityof the algorithm being trapped. The process continues until itreaches the optimal solution to the fitness function, which is usedto evaluate individuals. Genetic algorithms have been applied forhigh technology demand estimation and they constitute a rapidlygrowing area of artificial intelligence (Michalakelis et al., 2008;Venkatesan & Kumar, 2002).
The general steps a genetic algorithm consists of are the following:
1. Define the fitness function, for the particular optimizationproblem.
2. Set crossover and mutation probabilities.3. Randomly generate an initial population N(0).4. Generate N(t + 1) population by probabilistically selecting indi-
viduals from N(t) to produce offsprings via genetic operators ofcrossover and mutation.
5. Compute fitness for each individual in the current populationN(t). Offsprings with values closer to the fitness function aremore probable to contribute with one or more offsprings tothe next generation. Offsprings that diverge from the fitnessfunction are discarded.
6. Repeat steps 4 and 5 usually until, either a prefixed number ofgenerations are created, or after some predefined time haselapsed.
In the context of the examined case study, the algorithm de-scribed above is performed, seeking to find the minimum valueof the fitness function. In this case, the fitness function is definedto be the sum of the squared errors between the observed andthe estimated market shares described by the system of Eq. (9).Convergence of the algorithm is expected to provide the valuesfor the parameters that best describe the dynamics of the aboveprocess. Initial values for the algorithm were based on estimationsof the rates of change of the market shares. Moreover, the algo-rithm was also executed with random initial values, in order to en-sure that the algorithm will converge to the global minimum,instead of being trapped to a local one. In each case a number ofabout one million iterations were performed to ensure conver-gence. Application of the genetics algorithm for the particular opti-mization problem, based on the steps defined above, is illustratedin Fig. 1.
5. Case study results
Application of the genetic algorithms described in the previoussection provided with the following values for the correspondingparameters of the system of Eq. (9):
dxðtÞdt¼ 1:76xðtÞð1� xðtÞÞ � 1:75xðtÞyðtÞ ð10Þ
dyðtÞdt¼ �0:11yðtÞ þ 0:23xðtÞyðtÞ
Fitting of the estimated values over the observed is quite accurate,since the coefficient of determination (R2) has a value of 0.985 and
statistical measures were calculated at a value of 4.27E�04 for theMean Squared Error (MSE) and a value of 0.07 for the Mean Abso-lute Percentage Error (MAPE). Fitting results are illustrated in Figs.2 and 3.
Since x(t) and y(t) variables that appear in Eq. (10) correspondto market shares of the incumbent and the alternative operators,respectively, the estimated coefficients of the system provide quiteimportant information regarding the dynamics of the describedprocess. Thus, it can be observed that the rate at which the preypopulation decreases due to predation is quite high, almost asmuch as the rate of its growth. Therefore, if the system continuesthis way the incumbent operator is expected to meet a real threatby the alternatives. In addition, the growth rate of the predator dueto interaction with the prey is quite higher than its death rate,which is in accordance with the previous finding, stating that the

Alternative providers (Greece)
0.00
0.05
0.10
0.15
0.20
0.25
0.30
1 2 3 4 5 6 7 8 9 10 11 12 13 14 15 16 17Time (quarters)
Mar
ket s
hare
s
Observed Estimated
Fig. 3. Estimation results for alternative operators’ market shares.
Direction field for Incumbent -Alternatives
0
0.1
0.2
0.3
0.4
0.5
0.6
0.7
0.8
0.9
1
1.1
0 0.1 0.2 0.3 0.4 0.5 0.6 0.7 0.8 0.9 1 1.1Incumbent
Alte
rnat
ive
Fig. 4. Direction field for the prey–predator system of Eq. (10).
0.2 0.4 0.6 0.8 1.00.0
0.2
0.4
0.6
0.8
Alte
rnat
ives
Incumbent
Fig. 5. Phase portrait of dynamic system based on random initial values for marketshares. All trajectories tend to the critical point.
C. Michalakelis et al. / Expert Systems with Applications 39 (2012) 7690–7700 7695
present system dynamics is very probable to result into a greatreduction of the incumbent’s market share with a simultaneous in-crease for the alternatives. These two parameters reflect the poten-tial of the interspecies competition as they depict the dynamics ofeach competitor. They also provide quite useful informationregarding the ‘‘churn effect’’ i.e. the movements of subscribersamong the providers. Churn effect for each provider is depictedby the parameters’ values that correspond to interspecies interac-tion. It is obvious that such kind of information, which can be de-rived by studying the present system, is an extremely helpful inputin proceeding to critical managerial decisions.
As stated earlier, the stability analysis of the critical points isbased on Hartman’s theorem and is performed by resorting tothe transformations described by Eq. (4), by considering the linear-ized system of Eq. (7) that approximates the system near a criticalpoint (x0,y0) (Boyce & DiPrima, 2005; Lynch, 2007). Thus:
ddt
X
Y
� �¼
r � 2rx0 � by0 �bx0
dy0 �c þ dx0
� �X
Y
� �ð11Þ
which, after substitution of the parameter values reduces to:
ddt
X
Y
� �¼
1:76� 3:52x0 � 1:75y0 �1:75x0
0:23y0 �0:11þ 0:23x0
� �X
Y
� �ð12Þ
The system has three solutions, (0,0), (1,0) and (0.478,0.522), all lo-cated at the positive quadrant. Plotting a direction field of the sys-tem (plot of tangent vectors to solutions of the system) provides aqualitative understanding of the behavior of the solutions. A direc-tion field for the examined system is shown in Fig. 4. As observed,for the first two solutions, trajectories depart from the correspond-ing neighborhood, thus characterizing the solutions as unstable. Onthe other hand, all trajectories approach the third critical point val-idating the critical point as a stable node.
Mathematical analysis, based on eigenvalue analysis showedthat the first two critical points (0,0) and (1,0) are indeed unstable,since the corresponding eigenvalues are positive. Regarding thethird critical point c
d ;rb 1� c
d
� �� �, substitution of the corresponding
parameter values provides with an equilibrium value of 47.8% forthe incumbent provider and 52.2% for the alternatives. This is animportant finding since it states that, given the current processdynamics, the incumbent operator will cease dominance of themarket. This finding can be explained based on the considerationsof the introductory section. More specifically, subscribers of thealternative providers enjoy voice services for local, national andmany international destinations at no extra cost, together withunlimited broadband access. As the quality of services of the alter-native providers’ increases, offering more services at lower prices,more subscribers tend to switch to them. This fact should be takeninto account by the incumbent operator as a serious consideration,in order to meet the challenges of the new market.
The stability of the last critical point is determined by substitut-ing the corresponding values into Eq. (12):
ddt
X
Y
� �¼�0:84 �0:840:12 0
� �X
Y
� �ð13Þ
Eigenvalue analysis leads to the following general solution:
X
Y
� �¼ c1
�0:9850:17
� �e�0:69t þ c2
0:77�0:64
� �e�0:145t ð14Þ
In Eq. (14) c1, c2 are arbitrary constants. However, since it is an ini-tial value problem, substitution of the initial values into the generalsolution allows calculation of c1, c2 which yields:
X
Y
� �¼
1:26�0:22
� �e�0:69t þ
�0:270:23
� �e�0:145t ð15Þ
The critical point’s stability is shown in the phase diagram illus-trated in Fig. 5, based on different initial values for market shares.As observed, whatever the initial conditions are, all trajectories

Forecasted fixed lines market dynamics (Greece)
0.00
0.20
0.40
0.60
0.80
1.00
1.20
1 2 3 4 5 6 7 8 9 10 11 12 13 14 15 16 17 18 19 20 21 22 23 24 25 26 27 28 29 30 31
Time (quarters)
Mar
ket S
hare
s
Incumbent Alternatives
historical data forecasted
Fig. 6. Forecasted fixed lines market shares allocation, based on the estimated values of the constructed Lotka–Volterra model – Greece.
Incumbent provider (Germany)
0.000.100.200.300.400.500.600.700.800.90
1 2 3 4 5 6 7 8 9 10 11 12 13 14 15 16 17 18Time (quarters)
Mar
ket S
hare
s
Observed Estimated
Fig. 7. Estimation results for incumbent operator’s market shares – Germany.
Alternative providers (Germany)
0.00
0.10
0.20
0.30
0.40
0.50
0.60
1 2 3 4 5 6 7 8 9 10 11 12 13 14 15 16 17 18Time (quarters)
Mar
ket s
hare
s
Observed Estimated
Fig. 8. Estimation results for alternative operators’ market shares – Germany.
Forecasted fixed lines m
0.00
0.10
0.20
0.30
0.40
0.50
0.60
0.70
0.80
0.90
0 1 2 3 4 5 6 7 8 9 10 11 12 13 14
Time
Mar
ket S
hare
s
Incumben
historical data
Fig. 9. Forecasted fixed lines market shares allocation, based on the est
7696 C. Michalakelis et al. / Expert Systems with Applications 39 (2012) 7690–7700
converge to the estimated critical point, because as time increasesthe solutions decay exponentially and approach the critical point.
Finally, Fig. 6 illustrates the expected market shares evolution,based on the system described by Eq. (12). The grey shaded portionof the graph refers to the historical data used to perform the eval-uation and the white area to the forecasted values of marketshares. The historical data corresponds to the time period startingfrom the first quarter of year 2001 up to the last quarter of year2005.
The graph provides a measure of the rate of the subscribersswitching between the incumbent provider and the alternatives.Although the calculated critical point is expected to be met inabout eight years time, given the present dynamics of the market,the switching rate will increase rapidly during the next few years,at a value of about 1–2% per quarter.
The evaluation results for the rest cases considered are pre-sented in the following subsections (Figs. 7–18). They were derivedby applying the same procedure described so far, in the presentsection.
5.1. Evaluation results for Germany
See Figs. 7–9.
5.2. Evaluation results for Spain
See Figs. 10–12.
arket dynamics (Germany)
15 16 17 18 19 20 21 22 23 24 25 26 27 28 29 30
(quarters)
t Alternatives
forecasted
imated values of the constructed Lotka–Volterra model – Germany.

Incumbent provider (Spain)
0.000.100.200.300.400.500.600.700.800.90
1 2 3 4 5 6 7 8 9 10 11 12 13 14 15 16 17 18 19 20 21Time (quarters)
Mar
ket S
hare
Observed Estimated
Fig. 10. Estimation results for incumbent operator’s market shares – Spain.
Alternative providers (Spain)
0.00
0.05
0.10
0.15
0.20
0.25
0.30
0.35
1 2 3 4 5 6 7 8 9 10 11 12 13 14 15 16 17 18 19 20 21Time (quarters)
Mar
ket s
hare
s
Observed Estimated
Fig. 11. Estimation results for alternative operators’ market shares – Spain.
Incumbent provider (United Kingdom)
0.48
0.50
0.52
0.54
0.56
0.58
0.60
0.62
0.64
1 2 3 4 5 6 7 8 9 10 11 12 13 14 15 16 17 18Time (quarters)
Mar
ket S
hare
Observed Estimated
Fig. 13. Estimation results for incumbent operator’s market shares – UnitedKingdom.
Alternative providers (United Kingdom)
0.000.050.100.150.200.250.300.350.400.450.50
1 2 3 4 5 6 7 8 9 10 11 12 13 14 15 16 17 18Time (quarters)
Mar
ket s
hare
s
Observed Estimated
Fig. 14. Estimation results for alternative operators’ market shares – UnitedKingdom.
C. Michalakelis et al. / Expert Systems with Applications 39 (2012) 7690–7700 7697
5.3. Evaluation results for United Kingdom
See Figs. 13–15.
5.4. Evaluation results for Ireland
See Figs. 16–18.
5.5. Results discussion
The results presented in this section reveal, together with theability of the proposed model to describe market evolution, the dif-ferent levels of competition between the incumbent and the alter-native providers, across Europe. In addition, these changes inmarket shares reflect the influence of the pricing schemes over
Forecasted fixed lines
0.00
0.10
0.20
0.30
0.40
0.50
0.60
0.70
0.80
0.90
0 1 2 3 4 5 6 7 8 9 10 11 12 13 14Time
Mar
ket S
hare
s
Incumben
historical data
Fig. 12. Forecasted fixed lines market shares allocation, based on the e
the market shares (Eurostat, 2007) contains information thatshows a continuous drop in prices regarding charges for nationaland international calls, together with charging differences betweenthe incumbent provider and the competitors. Findings of the pres-ent evaluation are in accordance with this information, as pricingdifferences are depicted in the corresponding market shares. In-deed, in the cases where the incumbent is more expensive thanthe alternatives, its market shares decreased. However, by the timethat a price reduction policy was adopted, it was interpreted intoan increased or stable market share. The countries considered inthis work also fall into this case. For example, BT in the United
market dynamics
15 16 17 18 19 20 21 22 23 24 25 26 27 28 29 30 (quarters)t Alternatives
forecasted
stimated values of the constructed Lotka–Volterra model – Spain.

Forecasted fixed lines market dynamics (United Kingdom)
0.00
0.10
0.20
0.30
0.40
0.50
0.60
0.70
0.80
0.90
1.00
0 1 2 3 4 5 6 7 8 9 10 11 12 13 14 15 16 17 18 19 20 21 22 23 24 25 26 27 28 29 30Time (quarters)
Mar
ket S
hare
s
Incumbent Alternatives
historical data forecasted
Fig. 15. Forecasted fixed lines market shares allocation, based on the estimated values of the constructed Lotka–Volterra model – United Kingdom.
Incumbent provider (Ireland)
0.640.660.680.700.720.740.760.780.800.82
1 2 3 4 5 6 7 8 9 10 11 12 13 14 15 16 17Time (quarters)
Mar
ket S
hare
Observed Estimated
Fig. 16. Estimation results for incumbent operator’s market shares – Ireland.
Alternative providers (Ireland)
0.00
0.05
0.10
0.15
0.20
0.25
0.30
0.35
1 2 3 4 5 6 7 8 9 10 11 12 13 14 15 16 17Time (quarters)
Mar
ket s
hare
s
Observed Estimated
Fig. 17. Estimation results for alternative operators’ market shares – Ireland.
7698 C. Michalakelis et al. / Expert Systems with Applications 39 (2012) 7690–7700
Kingdom charged an almost double price for national calls, as com-pared to competition, until 2004. This was translated into a corre-sponding reduction in BT’s market share. However, after 2004when its prices for national calls where cheaper than competition,managed not only to retain its market share but also to increase it.However, this was not the case for Ireland, where Eircom, theincumbent operator, during 2003 and 2004 was charging nationalcalls as a price more than double than its competitors and this wasconsequently translated into a substantial market share reduction.In Spain on the other hand, the incumbent operator adopted a pric-ing scheme almost the same as its competitors and it managed to
have a high market share, which is expected to retain during thefollowing years. The same considerations regarding charging holdfor international calls as well, as can be observed in (Eurostat,2007), which are also reflected into the findings of the presentwork.
6. Forecasting ability test
Testing of the proposed model’s forecasting ability was basedon using a portion of the dataset as a holdback sample for trainingthe model, in order to attempt to forecast the remaining valuesthat were held back. More specifically, the historical dataset wassplit into two parts, the ‘‘training’’ and the ‘‘holdback’’ data. Theformer part was used to train the model and estimate its parame-ters, whereas the latter was used to compare the actual recordedvalues with the ones provided by the model as forecasts. The train-ing data includes the first quarter of year 2001 up to the secondquarter of year 2003, leaving the rest quarters as the holdbacksample for testing purposes. The selection of the training data por-tion was based on the fact that during that period of time, the rateof the ‘‘churn-effect’’ (switching from the incumbent to the alter-natives) was quite high, thus testing the forecasting ability of theproposed model taking into account that period of time would pro-vide useful information regarding the dynamics of the process.
Once again, the parameters of the system described by Eq. (9)were estimated by applying the genetic algorithms over the train-ing dataset. Estimation and forecasting results are illustrated inFigs. 19 and 20 where the gray shaded portion of the graph refersto the forecasted values of the process and the white to the trainingportion of the dataset. The accuracy of fitting is quite high in thiscase as well, since the coefficient of determination (R2) had a valueof about 0.95 and the rest statistical measures were calculated at avalue of 4.19E�04 for the Mean Squared Error (MSE) and a value of0.123 for the Mean Absolute Percentage Error (MAPE). As a conclu-sion, the proposed methodology manages to capture the dynamicsof the system quite early in time, providing valuable inputs forshaping decision making policies. This result indicates that the pro-posed methodology can be applied in similar cases of markets, pro-viding useful information regarding their evolution.
7. Conclusion
The main target of this work is the proposal of a methodology,based on concepts of population biology, in order to describe theevolution of an already saturated high technology market having

Forecasted fixed lines market dynamics (Ireland)
0.00
0.10
0.20
0.30
0.40
0.50
0.60
0.70
0.80
0.90
1.00
0 1 2 3 4 5 6 7 8 9 10 11 12 13 14 15 16 17 18 19 20 21 22 23 24 25 26 27 28 29 30Time (quarters)
Mar
ket S
hare
s
Incumbent Alternatives
historical data forecasted
Fig. 18. Forecasted fixed lines market shares allocation, based on the estimated values of the constructed Lotka–Volterra model – Ireland.
Incumbent provider
0.000
0.200
0.400
0.600
0.800
1.000
1.200
1 2 3 4 5 6 7 8 9 10 11 12 13 14 15 16 17 18 19 20 21Time (quarters)
Mar
ket S
hare
Observed Estimated
training forecast
Fig. 19. Forecasted market shares for the incumbent provider, based on training data (years 2001–mid 2003).
Alternative providers
0.000
0.050
0.100
0.150
0.200
0.250
0.300
1 2 3 4 5 6 7 8 9 10 11 12 13 14 15 16 17 18 19 20 21Time (quarters)
Mar
ket
Observed Estimated
training forecast
Fig. 20. Forecasted market shares for the alternative providers, based on training data (years 2001–mid 2003).
C. Michalakelis et al. / Expert Systems with Applications 39 (2012) 7690–7700 7699
one dominant player, which the rest players have to compete with,in order to retain survival and growth. The mathematical descrip-tion of the methodology was performed using the Lotka–Volterramodel, in a prey–predator mode and the corresponding parameterswere estimated by the means of genetic algorithms. The proposedmethodology showed itself capable of estimating market equilib-rium and market concentration and it can be applied over any hightechnology market meeting the above characteristics, providingvaluable inputs for managerial decisions, strategic planning andregulatory decisions to the players of a high technology market.
As a case study, the structure of fixed lines market during thefirst stages after liberalization was evaluated and analyzed, overa number of European countries. The main assumption was to con-
sider the incumbent and the alternative operators as prey andpredator species, respectively, interacting for food supply. Evalua-tion results provided some very interesting information, regardingthe estimation of the competition process and the market equilib-rium. According to these, given the current process dynamics, theincumbent operator is expected to loose domination of the marketif it does not respond quickly in order to create or to sustain a com-petitive advantage. Indeed, the evaluation of the proposed method-ology provided results that reflect the influence of the pricingschemes over the corresponding market shares. Therefore, theincumbents can decide to divest activities and businesses thatare characterized by low attractiveness and use the available finan-cial resources to invest in new product–market combinations that

7700 C. Michalakelis et al. / Expert Systems with Applications 39 (2012) 7690–7700
create or sustain the competitive advantages of firms (van Kranen-burg & Hagedoorn, 2008). Furthermore, customers are beginning todemand more telecommunications, information and media ser-vices in the form of one-stop-shopping (Graack, 1996). Due tochanging demand, alternative companies have become moreattractive to customers and businesses when they are able to deli-ver a critical mass of connected customers and content providers(Chacko & Mitchell, 1998).
Future work includes development of suitable framework ofcorresponding methodologies, based on the other approaches ofLotka–Volterra model as well, in order to comprehensively studythe different aspects of the telecommunication market, into thecontext of the theory of population biology. Such examples includethe application of the ‘‘competing species’’ approach, in order todescribe the evolution of the market after it reaches its equilibriumand the symbiosis model, in order to describe the enhancement ofthe growth rate of adoption in the case of complementary productsor services. Moreover, the presented methodology can be extendedby itself, so as to separately consider each market competitor as apredator preying on the dominant player, in order to describe in amore detailed level the structure of the market, the degree of com-petition and the market equilibrium.
References
Banerjee, A., & Ros, A. J. (2004). Patterns in global fixed and mobiletelecommunications development: A cluster analysis. TelecommunicationsPolicy, 28(2), 107–132.
Baye, M. (2006). Managerial economics and business strategy (5th ed.). Boston:McGraw-Hill.
Begon, M., Townsend, C., & Harper, J. (2006). Ecology: From individuals to ecosystems(4th ed.). Blackwell Publishing.
Bewley, R., & Fiebig, D. G. (1988). A flexible logistic growth-model with applicationsin telecommunications. International Journal of Forecasting, 4(2), 177–192.
Boyce, W. E., & DiPrima, R. C. (2005). Elementary differential equations and boundaryvalue problems (8th ed.). Hoboken, NJ: Wiley.
Chacko, M., & Mitchell, W. (1998). Growth incentives to invest in a networkexternality environment. Industrial and Corporate Change, 7(4), 731–744.
Curry, B., & George, K. D. (1983). Industrial Concentration - a Survey. Journal ofIndustrial Economics, 31(3), 203–255.
European Commission, (1987). Towards a Dynamic European Economy Green Paperon the development of the common market for telecommunications servicesand equipment, Corn (87), Brussels.
Eurostat. (2007). Consumers in Europe: Facts and figures on services of generalinterest.
Fay, T. H., & Greeff, J. C. (2008). A three species competition model as a decisionsupport tool. Ecological Modelling, 211(1–2), 142–152.
Fisher, J. C., & Pry, R. H. (1971). A simple substitution model of technological change.Technological Forecasting and Social Change, 3(1), 75–88.
Freedman, H. I., & Waltman, P. (1977). Mathematical-analysis of some 3-speciesfood-chain models. Mathematical Biosciences, 33(3–4), 257–276.
Freedman, H. I., & Waltman, P. (1984). Persistence in models of 3 interactingpredator–prey populations. Mathematical Biosciences, 68(2), 213–231.
Freedman, H. I., & Waltman, P. (1985). Persistence in a model of 3 competitivepopulations. Mathematical Biosciences, 73(1), 89–101.
Goldberg, D. E. (1989). Genetic algorithms in search, optimization, and machinelearning. Reading, Mass: Addison-Wesley.
Gompertz, B. (1825). On the nature of the function expressive of the law of humanmortality, and on a new mode of determining the value of life contingencies.Philosophical Transactions of the Royal Society of London, 115, 513–585.
Graack, C. (1996). Telecom operators in the European Union: Internationalizationstrategies and network alliances. Telecommunications Policy, 20(5), 341–355.
Grzybowski, L. (2008). The impact of regulation on the retail prices in fixed-linetelephony across the European Union. Telecommunications Policy, 32(2),131–144.
Hartman, P. (1964). Ordinary differential equations. New York: Wiley.Holland, J. (1975). Adaption in natural and artificial systems. Ann Arbor, Michigan:
University of Michigan Press.Kim, J., Lee, D. J., & Ahn, J. (2006). A dynamic competition analysis on the Korean
mobile phone market using competitive diffusion model. Computers & IndustrialEngineering, 51(1), 174–182.
Kirlinger, G. (1989). Two predators feeding on two prey species: A result onpermanence. Mathematical Biosciences, 96, 1–32.
Leach, P. G. L., & Miritzis, J. (2006). Analytic behaviour of competition among threespecies. Journal of Nonlinear Mathematical Physics, 13(4), 535–548.
Lee, S., Lee, D. J., & Oh, H. (2005). Technological forecasting at the Korean stockmarket: A dynamic competition analysis using Lotka–Volterra model.Technological Forecasting and Social Change, 72, 1044–1057.
Li, J. X., & Yan, J. R. (2008). Partial permanence and extinction in an N-speciesnonautonomous Lotka–Volterra competitive system. Computers & Mathematicswith Applications, 55(1), 76–88.
Lopez, L., & Sanjuan, M. A. F. (2001). Defining strategies to win in the Internetmarket. Physica A, 301(1–4), 512–534.
Lynch, S. (2007). Dynamical systems with applications using mathematica. Boston:Birkhäuser.
Marfels, C. (1972). Testing Concentration Measures. Zeitschrift Fur Nationalokonomie,32(4), 461–486.
May, R. M., & Leonard, W. J. (1975). Nonlinear aspects of competition between threespecies. SIAM Journal on Applied Mathematics, 29(2), 243–253.
Michalakelis, C., Varoutas, D., & Sphicopoulos, T. (2008). Diffusion models of mobiletelephony in Greece. Telecommunications Policy, 32(3–4), 234–245.
Modis, T. (1999). Technological forecasting at the stock market. TechnologicalForecasting and Social Change, 62, 173–202.
Murray, J. D. (2002). Mathematical biology (3rd ed.). New York: Springer.Neal, D. (2004). Introduction to population biology. New York: Cambridge University
Press.Pao, C. V. (2003). Global asymptotic stability of Lotka–Volterra 3-species reaction–
diffusion systems with time delays. Journal of Mathematical Analysis andApplications, 281(1), 186–204.
Rai, L. P. (1999). Appropriate models for technology substitution. Journal of Scientific& Industrial Research, 58(1), 14–18.
Saving, T. (Feb., 1970). Concentration Ratios and the Degree of Monopoly.International Economic Review, 11(1), 139–146.
Seifert, G. (1995). A Lotka–Voltera predator–prey system involving two predators.Methods and Applications of Analysis, 2(2), 248–255.
Shair, A., & Tineo, A. (2007). Three-dimensional population systems. NonliearAnalysis: Real World Applications, 9, 1607–1611.
Shy, O. (1995). Industrial organization, theory and applications. New York: The MITPress.
Tirole, J. (1988). The theory of industrial organization. Cambridge: The MIT Press.Tschirhart, J. (2000). General equilibrium of an ecosystem. Journal of Theoretical
Biology, 203(1), 13–32.van Kranenburg, H. L., & Hagedoorn, J. (2008). Strategic focus of incumbents in the
European telecommunications industry: The cases of BT, Deutsche Telekom andKPN. Telecommunications Policy, 32(2), 116–130.
Venkatesan, R., & Kumar, V. (2002). A genetic algorithms approach to growth phaseforecasting of wireless subscribers. International Journal of Forecasting, 18(4),625–646.
Wangersky, P. (1978). Lotka–Volterra Population Models. Annual Review of Ecologyand Systematics, 9, 189–218.
Wijeratne, A. W., Yi, F., & Wei, J. (2007). Bifurcation analysis in the diffusive Lotka–Voltera system: An application to market economy. Chaos, Solitons and Fractals.doi:10.1016/j.chaos.2007.08.043.