Intense surface currents in the tropical Pacific during 1996–1998
12
Intense surface currents in the tropical Pacific during 1996 –1998 Semyon A. Grodsky and James A. Carton Department of Meteorology, University of Maryland, College Park, Maryland Abstract. Tropical Pacific Ocean near-surface currents and their momentum and temperature balances are investigated using several data sets, including drifting buoy velocities and TOPEX/Poseidon altimetry. The data sets are combined to produce monthly surface current estimates on a uniform grid for the 6-year period 1993–1998, using multivariate optimal interpolation. The analysis shows dramatic changes in current from December 1996 through August 1998 in response to the recent El Nin ˜ o–Southern Oscillation event. Eastward current anomalies of ;1ms 21 were recorded in December 1996 in the western Pacific, generated by sporadic westerly wind bursts. By April 1997 these equatorial anomalies reached the eastern boundary, and in the summer of 1997 a band of strong eastward flow formed across the basin. This circulation pattern persisted until the beginning of 1998, when a westward equatorial jet appeared in January–April. Interestingly, the reversal of flow occurred prior to the restoration of the trade winds. The timing of these events as well as the results of previous dynamical studies raise questions about the relative importance of terms in the zonal momentum and temperature balances. We address the first of these questions by examining the applicability of a three-term linear zonal momentum balance on the equator. In all cases we focus on anomalies from the time mean. Our results show that local acceleration is reasonably well balanced by the difference between zonal pressure gradient anomaly and wind-induced momentum flux. This three-term balance displays significant basin-wide variations and is consistent with the conclusion that the equatorial Pacific is not in equilibrium with local wind forcing due to the presence of propagating waves. Examination of the temperature balance shows that at the beginning of El Nin ˜ o the warming in the central Pacific is mainly supported by horizontal temperature transport, while the vertical heat exchange and transport become important in the eastern half of the equatorial Pacific during the transition from El Nin ˜ o to La Nin ˜ a. 1. Introduction Although many models of air/sea interaction in the tropical Pacific assume that mixed layer temperature is controlled by diabatic mixing at its base [e.g., Suarez and Schopf, 1988], others assume that it is governed by the mass and heat dynam- ics in the western Pacific warm pool, with zonal transport playing a key role [see, e.g., Wyrtki, 1985]. Indeed, Picaut et al. [1996] found that much of the monthly shift in the position of the pool of warm surface water that normally resides in the western basin can be explained by zonal advection of water within the mixed layer. Picaut et al. also found that the bound- ary between the warm pool of water to the west and the cooler water to the east defines a region of zonal convergence and subduction. The potential role of such advective processes in controlling sea surface temperature (SST) complicates our un- derstanding of the air/sea feedback cycles leading to El Nin ˜ o– Southern Oscillation (ENSO) [Picaut et al., 1997; An et al., 1999; Jin and An, 1999]. The purpose of this paper is to reex- amine the contribution of horizontal advection to momentum and heat balances in the tropical Pacific during the extreme events of 1997–1998, making use of the extensive surface drifter and sea level data sets now available. There is strong independent experimental evidence [see, e.g., Johnson and Luther, 1994; Qiao and Weisberg, 1997] that the momentum balance on seasonal and interannual time- scales is generally linear and geostrophic away from the equa- tor. Along the equator, Yu and McPhaden [1999] examined Tropical Atmosphere-Ocean (TAO) buoy data at four moor- ing locations and found a three-term balance in the zonal momentum equation between local acceleration, pressure gra- dient force, and wind stress whose relative strength must change as wind intensity and direction shift. Recently, a suite of studies has revisited the ocean’s role in regulating SST on seasonal and interannual timescales [e.g., Ko ¨berle and Philander, 1994; Picaut et al., 1996; Delcroix and Picaut, 1998; Moisan and Niiler, 1998; Kessler et al., 1998; De- Witt and Schneider, 1999; Swenson and Hansen, 1999]; however, the conclusions have not been uniform. Modeling studies by Ko ¨berle and Philander [1994] and DeWitt and Schneider [1999] suggest that the annual cycle of SST in the eastern basin results from entrainment of cool subthermocline water into the mixed layer because of meridional divergence of surface waters, while Swenson and Hansen [1999] argue that local storage is also important. In contrast, Kessler et al. [1998] conclude that three- dimensional temperature advection terms tend to cancel each other and, to first order, the seasonal variation of SST can be described as simply following the variation of net surface heat flux. It is still debatable whether or not the same terms dom- Copyright 2001 by the American Geophysical Union. Paper number 2000JC000481. 0148-0227/01/2000JC000481$09.00 JOURNAL OF GEOPHYSICAL RESEARCH, VOL. 106, NO. C8, PAGES 16,673–16,684, AUGUST 15, 2001 16,673
-
Upload
independent -
Category
Documents
-
view
0 -
download
0
Transcript of Intense surface currents in the tropical Pacific during 1996–1998

Intense surface currents in the tropical Pacificduring 1996–1998
Semyon A. Grodsky and James A. CartonDepartment of Meteorology, University of Maryland, College Park, Maryland
Abstract. Tropical Pacific Ocean near-surface currents and their momentum andtemperature balances are investigated using several data sets, including drifting buoyvelocities and TOPEX/Poseidon altimetry. The data sets are combined to producemonthly surface current estimates on a uniform grid for the 6-year period 1993–1998,using multivariate optimal interpolation. The analysis shows dramatic changes in currentfrom December 1996 through August 1998 in response to the recent El Nino–SouthernOscillation event. Eastward current anomalies of ;1 m s21 were recorded in December1996 in the western Pacific, generated by sporadic westerly wind bursts. By April 1997these equatorial anomalies reached the eastern boundary, and in the summer of 1997 aband of strong eastward flow formed across the basin. This circulation pattern persisteduntil the beginning of 1998, when a westward equatorial jet appeared in January–April.Interestingly, the reversal of flow occurred prior to the restoration of the trade winds. Thetiming of these events as well as the results of previous dynamical studies raise questionsabout the relative importance of terms in the zonal momentum and temperature balances.We address the first of these questions by examining the applicability of a three-termlinear zonal momentum balance on the equator. In all cases we focus on anomalies fromthe time mean. Our results show that local acceleration is reasonably well balanced by thedifference between zonal pressure gradient anomaly and wind-induced momentum flux.This three-term balance displays significant basin-wide variations and is consistent with theconclusion that the equatorial Pacific is not in equilibrium with local wind forcing due tothe presence of propagating waves. Examination of the temperature balance shows that atthe beginning of El Nino the warming in the central Pacific is mainly supported byhorizontal temperature transport, while the vertical heat exchange and transport becomeimportant in the eastern half of the equatorial Pacific during the transition from El Ninoto La Nina.
1. Introduction
Although many models of air/sea interaction in the tropicalPacific assume that mixed layer temperature is controlled bydiabatic mixing at its base [e.g., Suarez and Schopf, 1988],others assume that it is governed by the mass and heat dynam-ics in the western Pacific warm pool, with zonal transportplaying a key role [see, e.g., Wyrtki, 1985]. Indeed, Picaut et al.[1996] found that much of the monthly shift in the position ofthe pool of warm surface water that normally resides in thewestern basin can be explained by zonal advection of waterwithin the mixed layer. Picaut et al. also found that the bound-ary between the warm pool of water to the west and the coolerwater to the east defines a region of zonal convergence andsubduction. The potential role of such advective processes incontrolling sea surface temperature (SST) complicates our un-derstanding of the air/sea feedback cycles leading to El Nino–Southern Oscillation (ENSO) [Picaut et al., 1997; An et al.,1999; Jin and An, 1999]. The purpose of this paper is to reex-amine the contribution of horizontal advection to momentumand heat balances in the tropical Pacific during the extremeevents of 1997–1998, making use of the extensive surfacedrifter and sea level data sets now available.
There is strong independent experimental evidence [see,e.g., Johnson and Luther, 1994; Qiao and Weisberg, 1997] thatthe momentum balance on seasonal and interannual time-scales is generally linear and geostrophic away from the equa-tor. Along the equator, Yu and McPhaden [1999] examinedTropical Atmosphere-Ocean (TAO) buoy data at four moor-ing locations and found a three-term balance in the zonalmomentum equation between local acceleration, pressure gra-dient force, and wind stress whose relative strength mustchange as wind intensity and direction shift.
Recently, a suite of studies has revisited the ocean’s role inregulating SST on seasonal and interannual timescales [e.g.,Koberle and Philander, 1994; Picaut et al., 1996; Delcroix andPicaut, 1998; Moisan and Niiler, 1998; Kessler et al., 1998; De-Witt and Schneider, 1999; Swenson and Hansen, 1999]; however,the conclusions have not been uniform. Modeling studies byKoberle and Philander [1994] and DeWitt and Schneider [1999]suggest that the annual cycle of SST in the eastern basin resultsfrom entrainment of cool subthermocline water into the mixedlayer because of meridional divergence of surface waters, whileSwenson and Hansen [1999] argue that local storage is alsoimportant. In contrast, Kessler et al. [1998] conclude that three-dimensional temperature advection terms tend to cancel eachother and, to first order, the seasonal variation of SST can bedescribed as simply following the variation of net surface heatflux. It is still debatable whether or not the same terms dom-
Copyright 2001 by the American Geophysical Union.
Paper number 2000JC000481.0148-0227/01/2000JC000481$09.00
JOURNAL OF GEOPHYSICAL RESEARCH, VOL. 106, NO. C8, PAGES 16,673–16,684, AUGUST 15, 2001
16,673

inate for interannual processes such as ENSO. Tropical insta-bility waves [Baturin and Niiler, 1997] may also contribute toseasonal and interannual cycles because of their seasonalityand dependence on mean shear.
In the central and western basin the story of the heat budgetis complicated as well. As mentioned above, Picaut et al. [1996]and Delcroix and Picaut [1998] argue that on interannual time-scales, changes of mixed layer temperature largely reflectchanges in the anomalous zonal advection of water acting onthe mean westward temperature gradient, while Wang andMcPhaden [1999] additionally argue for the importance of sur-face heat flux.
The massive El Nino of 1997–1998 provides an excitingopportunity to reexamine the momentum and heat balances ofthe tropical Pacific under extreme conditions. The story of thisEl Nino begins with a series of westerly wind bursts in thewestern basin in late 1996 [Yu and Rienecker, 1998; McPhaden,1999; Wang and Weisberg, 2000]. These westerly wind bursts, anenhancement of the normal Madden Julian Oscillation, werefollowed by a relaxation of the trade winds and warming of SSTnear the dateline in January–February 1997 and in the east byMarch. Instantaneous zonal velocity transects from acousticDoppler current profiler (ADCP) meridional vertical sectionstaken from October 1996 through November 1998 by Johnsonet al. [2000] show a strong eastward surface current anomaly onthe equator in response to the relaxing trade winds, with peakvelocities approaching 1 m s21. As warm conditions were rap-idly replaced by cold La Nina conditions and the trade windsaccelerated (see McPhaden [1999] for a discussion), the cur-rent anomalies also reversed direction, forming a westward jetwith its maximum speed (.1 m s21) north of the equator.However, spatial discreteness and time sampling of these datacomplicate the assessment of time and spatial derivativesneeded to estimate the momentum and heat budgets.
Fortunately for the cause of trying to understand momen-tum and heat balances during these extreme events, severalnew data sets have become available in recent years. Extensivedeployments of drogued surface drifters by the World OceanCirculation Experiment Surface Velocity Programme [Niiler etal., 1987; Hansen and Poulain, 1996] now provide ;3000–4000buoy days of direct currents observations per month in thetropical Pacific [Acero-Schertzer et al., 1997]. Much of the trop-ical ocean is in near-geostrophic balance with surface pressure.Thus satellite-based altimetry from the joint U.S./FrenchTOPEX/Poseidon mission provides a powerful additional con-straint on near-surface velocity. Indeed, Yu et al. [1995] haveshown that the velocity estimates from these two data sets areremarkably consistent. We believe that the difference betweenthe two is due to (ageostrophic) wind-driven effects, whichRalph and Niiler [1999] show can be explained to a consider-able degree by Ekman-like dynamics, except when close to theequator.
The velocity analysis that we use for this study was con-structed by combining drifter velocity and sea level data usingmultivariate optimal interpolation [Carton and Hackert, 1989;Daley, 1991]. We estimate the background (first guess) currentas the long-term mean of drifter velocities. This backgroundfield is corrected with monthly mean observational incrementsof altimeter sea level and drifter data. We separately estimategeostrophic and ageostrophic components of the total velocity.Geostrophic error covariances have been extended to theequatorial b plane on the basis of the Kelvin wave scaling ofPicaut et al. [1989] and Menkes et al. [1995]. A simple linear
friction is included to allow an Ekman-like balance to accountfor the ageostrophic component on the equator, following La-gerloef et al. [1999]. Our presentation of results begins with akinematic description of currents during 1996–1998 followedby a discussion of the corresponding zonal momentum andthermal balances.
2. Data and AnalysisThis study is based on four data sets: altimeter sea level,
drifter velocity, SST, and National Center for EnvironmentalPrediction (NCEP) wind stress and surface heat fluxes. TheTOPEX/Poseidon altimeter sea level is obtained from thePathfinder version 2.1 archive [Koblinsky et al., 1997]. Thesedata are available with a 9.92-day repeat cycle spanning theperiod from late September 1992 through November 1998.After the usual corrections for geophysical effects the sea levelestimates have been averaged into 18 latitude segments. Thenominal accuracy of these estimates when averaged monthly is2 cm [Cheney et al., 1994], while observed sea level anomaliesare at least 4 times that amount.
The drouged surface drifter currents are obtained from theWorld Ocean Circulation Experiment/Tropical Ocean–GlobalAtmosphere archive at the Atlantic Ocean Marine Laboratory/National Oceanic and Atmospheric Administration (NOAA).The data span the period from 1979 to November 1998. Afterthe processing described by Hansen and Poulain [1996] weaveraged currents into 38 longitude 3 28 latitude 3 1 monthbins. These data form the basic velocity data set for this study.For velocity comparisons, additional moored velocity time se-ries were obtained from the Pacific Marine EnvironmentalLaboratory/NOAA [McPhaden et al., 1998]. An additional ex-periment was conducted including these moored observationsin order to improve our estimates of currents along the equa-tor.
The surface wind stress and the net heat flux through theocean surface are obtained from monthly mean NCEP/National Center for Atmospheric Research reanalysis product[Kalnay et al., 1996]. SST is the combined satellite advancedvery high resolution radiometer (AVHRR)/in situ analysis ofReynolds and Smith [1994]. For the purpose of this study thewind stress, the heat flux, and the SST fields have been aver-aged into 38 3 28 3 1 month bins.
Our analysis methodology is a form of multivariate optimalinterpolation [see Daley, 1991], which is briefly summarizedhere. Let rk, 1 # k # K , define the analysis grid, while thespatial vectors rm, 1 # m # M , and rn, 1 # n # N , are theobservation station locations for sea level h and mixed layervelocity u, respectively. The analysis velocity uA may be writtenas a linear combination of the weighted differences betweenobservations and a background estimate of sea level and ve-locity vector:
ukA 5 uk
B 1 WkmUh~hm
O 2 hmB ! 1 Wkn
UU~unO 2 un
B! . (1)
There are several possible choices for use as the backgroundvelocity field uk
B, unB. Lagerloef et al. [1999] derive flow esti-
mates using a background estimate based on spatiallysmoothed altimetry, hydrographic climatology, and wind drift.A disadvantage of this approach is the introduction of bias intothe background error. Here we have explored the use of thelong-term average surface drifter field to define uk
B, unB. The
background estimate of sea level, hB, is similarly derived from
GRODSKY AND CARTON: TROPICAL PACIFIC NEAR-SURFACE CURRENTS16,674
the long-term averaged altimeter data. Sea level appears in (1)only in the form of observational increment, hO 2 hB.
Much of the challenge in applying (1) is in evaluating theweights, W. We do this by minimizing the analysis error vari-ance in (1), assuming unbiased, stationary statistics [see Daley,1991]:
W 5 C z ~B 1 O!21, (2)
where C 5 [CUh, CUU] is the K(M 1 2N) matrix of covari-ances between background velocity and sea level error com-ponents evaluated at the analysis and observation station lo-cations. Similarly, B and O are (M 1 2N)(M 1 2N) matricescontaining background and observation error covariances eval-uated at different station locations:
B 5 F Bhh BhU
BUh BUUG , O 5 FOhh
OUUG . (3)
Thus the weights W are small if the observations are eitherinaccurate or so closely distributed that they are duplicative.The elements of C, B, and O are difficult to estimate accu-rately. Instead of trying to do this we apply a variety of sim-plifying assumptions. First, we assume that O is diagonal,meaning that the observation errors are uncorrelated. Normal-izing O by the analysis variance (assumed homogeneous), theelements along the diagonal of O are simply the ratio of noise-to-signal variances. This ratio we assume to be 4 for 1-s aver-aged altimetry, following Carton et al. [1996]. We do not yethave good estimates of the noise-to-signal ratio for velocityobservations because of our lack of knowledge of unresolvedphysical processes. Here we assume a ratio of 0.2, followingCarton and Hackert [1989]. Finally, we set the backgrounderror covariance noise-to-signal ratios to 1. Observationalnoise is a combination of instrument error and error of inter-polation including that introduced by unresolved physics. Oneproblem in particular is noise due to aliasing of inertial mo-tions and tropical instability waves into the drifter observa-tions. We attempt to mitigate these effects by only includingmeasurements at locations where at least 10 buoy days/monthof independent observations are available.
To complete our statistics, we begin by defining the back-ground sea level error covariance Bhh and deriving all otherbackground error covariances from this. To assure that allderived error covariances have appropriate properties (i.e.,positive definiteness, compactness, and continuous deriva-tives), we choose Bhh to have a very simple homogeneousGaussian form:
Bhh~rp, rq! 5 Cov ~hp, hq! 5 ~sh!2 exp F2Dx2
rx2 2
Dy2
ry2 G ,
(4)rx 5 450 km, ry 5 250 km,
where (sh)2 is the sea level error variance, assumed to bespatially homogeneous, and where (Dx , Dy) are the zonal andmeridional displacements of the vector Dr 5 rq 2 rp. Ourestimates of horizontal length scales, rx, ry, follow those ofCarton et al. [2000].
In order to derive the remaining covariance submatrices it ishelpful and reasonable to assume a dynamical relationshipbetween sea level and velocity. We begin by assuming thatanalysis, observation, and background velocity can be decom-posed into a geostrophic and a wind-driven component, u 5
ug 1 uw. Following Lagerloef et al. [1999], we assume that uw
satisfies an Ekman-like equation balancing the difference be-tween wind-induced momentum flux t and linear friction bythe Coriolis force:
fk 3 uw 5t
rH 2ruw
H , (5)
where k is the vertical unit vector and r is water density. Someassumption must be made regarding H , the depth scale overwhich wind-induced momentum is distributed (see Ralph andNiiler [1999] for discussion of possible options). Here we usethe thickness of the ocean mixed layer provided by the oceanreanalysis of Carton et al. [2000] as a proxy for H and estimatethe friction coefficient r by assuming that the mean meridionalvelocity near the equator is mainly wind-driven. On the basis ofthis assumption we estimate r 5 2 3 1024 m s21, a valuesimilar to that proposed by Lagerloef et al. [1999]. Then wesubtract uw from each term (uk
A, unO, and un
B) before evaluating(2). Thus (2) becomes an equation for the geostrophic com-ponent of uA. Evaluation of (2) requires error covariances.These are derived from (4) by applying geostrophy and arepresented in Appendix A. The error variances and covariancesvary spatially. We account for these variations by solving (1) ina series of 5 3 3 (longitude 3 latitude) grid point patches (1083 98).
Within a radius of deformation of the equator the Coriolisterm can no longer be considered constant within a grid patch,and indeed, the geostrophic approximation may be invalid.However, if we accept Kelvin wave scaling following Menkes etal. [1995], then we can assume that background errors (againthese are differences between the first guess and the truevalue) for zonal geostrophic velocity dug on the equator arerelated to background sea level errors dh as dug 5 2( g/b)2(dh)/2y . Following Carton and Hackert [1989] and La-gerloef et al. [1999] and allowing a smooth transition to equa-torial dynamics,
dug 5 2F~w!gf
~dh!
y 2 @1 2 F~w!#gb
2~dh!
y2 , (6)
dvg 5 F~w!gf
~dh!
x ,(7)
F~w! 5 1 2 exp @2~w/ 2.28!2# ,
where F(w) decreases smoothly as latitude w approaches zerowith a scale estimated by the first-mode equatorial radius ofdeformation. The proper assumption to make for the meridi-onal velocity component error dvg is less clear. Following theKelvin wave analogy, we have assumed that background errorsof sea level and meridional velocity decorrelate near the equa-tor, as expressed in (7). For a positive sea level error on theequator, (6) and (7) together imply convergence to the east ofthe anomaly and divergence to the west.
The analysis results for March 1998 are illustrated in Figure1. This analysis takes place during the late stage of the intense1997–1998 El Nino when equatorial currents are already west-ward at speeds of up to 1 m s21 in the west. In the east thecurrents are weaker, indicating divergence in the zonal direc-tion. North of the equator a weak eastward countercurrent isevident in the analysis even though it is not apparent in thedrifter observations. The drifter data coverage during thismonth is not dense along the equator because of the dispersingeffects of the strong currents.
16,675GRODSKY AND CARTON: TROPICAL PACIFIC NEAR-SURFACE CURRENTS

The relative impact of sea level and drifter observations aswell as the accuracy of the analysis are explored in Figure 2. Atthree equatorial locations (1658E, 1408W, and 1108W) themean analysis (and observed) zonal velocities were 22 cm s21
(10 cm s21), 215 cm s21 (219 cm s21), and 219 cm s21 (214cm s21) based on the same time during which buoy data areavailable. Hence the difference between the buoy and theanalysis currents does not exceed 25% of the standard devia-tion of current (around 50 cm s21 for zonal velocity). Thelargest bias of 12 cm s21 at 1658E may simply reflect statisticaluncertainty (the buoy at this location was only in operation for3.5 years). The mean analysis (and observed) meridional com-ponents were 0.5 cm s21 (1 cm s21), 23 cm s21 (21 cm s21),and 2 cm s21 (5 cm s21). The differences are small comparedto standard deviation of meridional current, which is around 10cm s21. The standard deviations of analysis minus observeddifference velocities are 29, 38, and 31 cm s21 for the zonalcomponent and 16, 12, and 10 cm s21 for the meridionalcomponent at 1658E, 1408W, and 1108W, respectively. Whenthe analysis is based solely on sea level (h) observations (thefirst two terms on the right-hand side of (1)), the main featuresof variability remain although the amplitudes are reduced.
3. ResultsWe begin our presentation of results by examining the
changes in surface current during the dramatic events of 1997–1998. Throughout the following discussion the time mean1993–1998 fields (u# , T# , h# ) are removed. This focuses attentionon the behavior of anomalies from the time mean. We choosenot to remove the seasonal cycle because of the close connec-tion between seasonal cycle and ENSO. For the latest 1997–1998 ENSO event this connection was clearly demonstrated byMcPhaden [1999].
In late 1996 a strong eastward current developed in thewestern Pacific basin in response to local westerly wind bursts
(Figure 3). By March–April 1997 the ocean responded to thesedisturbances in wind and current with a simultaneous increasein SST and sea level in the central and eastern basins (seeFigure 4, April 1997), while the eastward current became con-centrated in the equatorial zone. During this season the strongeastward equatorial current was down the slope of sea level,while off the equator the current was weaker and variable.However, as 1997 progressed, the region of westerly windanomalies shifted eastward and the equatorial current in thewest weakened (December 1997 in Figure 4). For much of1996 and early 1997, SST changed in phase with zonal velocityalong the equator (see Figure 3). This, coupled with a negativezonal gradient of SST to the west along the equator, suggestsan important role for advection in regulating central and east-ern SST.
In midbasin the current remained eastward even though thepressure gradient reversed sign, so that by August the eastwardcurrent was flowing up the slope of sea level. Interestingly, eastof 1208W a temporary reversal of eastward flow appeared inAugust–September 1997 (see Figure 3 and Figure 4, August)and was also observed in ADCP transports by Johnson et al.[2000]. The presence of a local westward jet in the easternequatorial Pacific occurred in conjunction with the cooling ofSST (compare zonal velocity and SST in Figure 3). The east-ward equatorial current persisted until the boreal spring of1998 when it shifted to westward west of 1508W, again allowingthe current to flow downhill (see Figure 4, April 1998). By thefall of 1998 the zonal pressure gradient relaxed, although thecurrent continued to flow westward. During this later stage,zonal advection and SST do not seem closely linked (see alsoFigure 5). The equatorial currents swung to the west betweenDecember and January, but SST remained high through April1998. This suggests that advection plays a lesser role in regu-lating SST during this stage.
In this kinematic discussion it has been evident that changes
Figure 1. Velocity for March 1998. (a) Drifter velocity observations and (b) analysis velocity.
GRODSKY AND CARTON: TROPICAL PACIFIC NEAR-SURFACE CURRENTS16,676

in the zonal pressure gradient follow shifts in the direction ofthe equatorial currents. The correspondence between varia-tions of zonal velocity and SST varies significantly with timeand becomes smaller during the late stage. To obtain a morequantitative understanding of the relationship between theseterms, we now evaluate the zonal momentum balance andtemperature budget.
There is strong experimental evidence to conclude [see, e.g.,Johnson and Luther, 1994] that the momentum balance is lin-ear and geostrophic to within 58 of the equator. Qiao andWeisberg [1997] extend this conclusion into the equatorial zoneby showing that the momentum balance in the equatorialmixed layer remains essentially linear. This balance was alsoinvestigated at four TAO mooring locations by Yu and McPh-aden [1999]. On seasonal cycle and interannual timescales theyfound a three-term balance between local acceleration u/t ,zonal pressure gradient force 2gh/ x , and wind stress tx:
ut 5 2g
h
x 1tx
rH . (8)
At interannual timescales, acceleration is small, and thepressure gradient force balances wind stress. Zonal currentsare in phase with these two terms, as was explicitly shown byJohnston and Merrifield [2000], who found that interannualgeostrophic current anomalies derived from the tide gaugenetwork data vary in phase with both zonal wind stress and sealevel in the near-equatorial western Pacific Ocean. At shorterseasonal periods, acceleration becomes important, so that thedevelopment of an anomalous zonal pressure gradient lagsbehind changes in wind stress and local acceleration. Althoughthe mooring data provide good sampling in time and depth,their spatial coverage is very limited. Here we apply method-ology similar to that of Johnston and Merrifield [2000] to ex-amine the applicability of this three-term balance throughoutthe basin during the extreme events of 1997–1998.
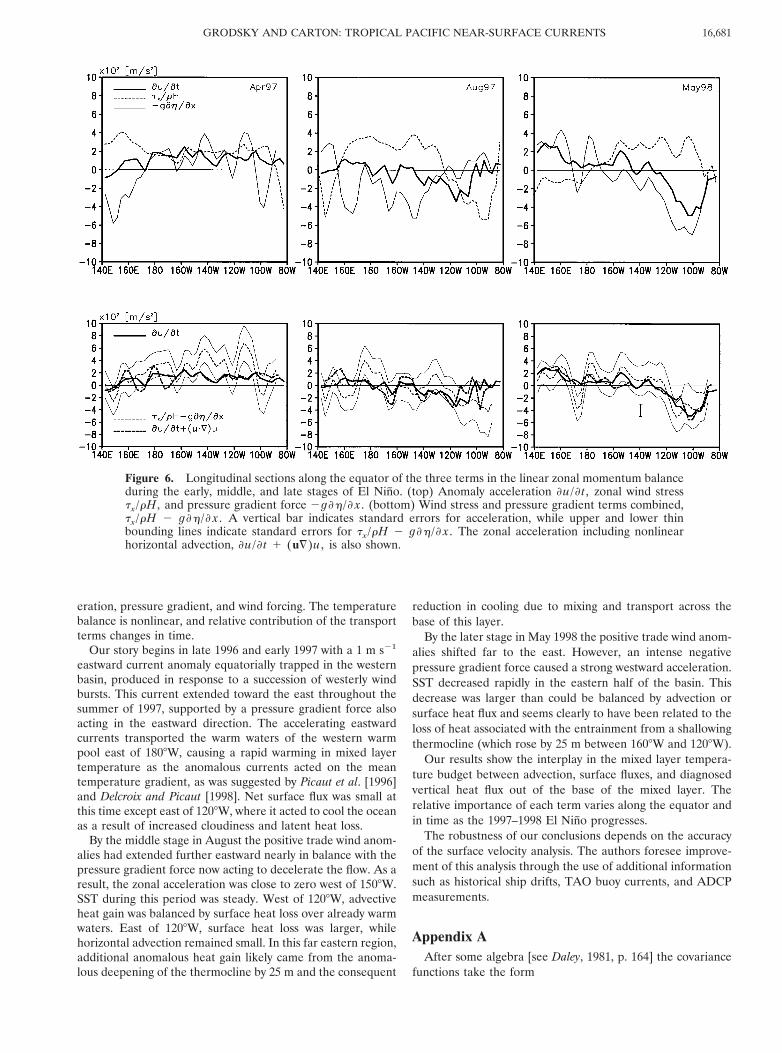
Figure 6 shows results for 3 months during the early, middle,and late stages of El Nino. For this comparison, accelerationand spatial derivatives have been estimated using central dif-ferences. Error estimates (see Appendix B) are included in
Figure 2. Velocity comparisons at three mooring locations. Four estimates are compared: 10-m mooredcurrents (TAO), surface drifter observations (drifter), and analysis velocity (analysis), and analysis velocitywithout drifter data (h only).
16,677GRODSKY AND CARTON: TROPICAL PACIFIC NEAR-SURFACE CURRENTS

Figure 6 (bottom) to indicate the uncertainties in the variousdata sets. We select April 1997 to represent the early stage ofEl Nino, when the currents reverse and SST is increasing (seeFigure 3). We choose August 1997 to characterize the condi-tions during the middle stage, when the rate of change of theSST is relatively low. We choose May 1998 to represent the latestage, when the SST begins to drop in the eastern basin.
In April 1997, when the easterly winds begin to reverse, theycan no longer balance the negative pressure gradient associ-ated with sea level. As a result, the currents across the basinaccelerate eastward. The close balance between the threeterms in (8) suggests, to within the errors of estimates, thatfriction and nonlinearity play lesser roles during this onsetphase in the surface layer. Including our estimates of horizon-tal advection, for example, does not improve agreement be-tween acceleration and force terms in (8); however, our esti-mate is quite uncertain (65 3 1027 m s22).
By the middle stage (August 1997) the positive trade windanomalies have extended farther eastward nearly in balancewith the pressure gradient force. As a result, the zonal accel-eration is close to zero along the equator west of 1508W. For508 east of 1508W an eastward pressure gradient accelerates awestward current (see Figure 3 and 1408W and 1108W in Fig-ure 2). By the late stage (May 1998) the positive trade windanomalies have shifted far to the east. However, an intensenegative pressure gradient force causes a strong westward ac-celeration of up to 4 cm s21 d21. In summary (see Figure 7),
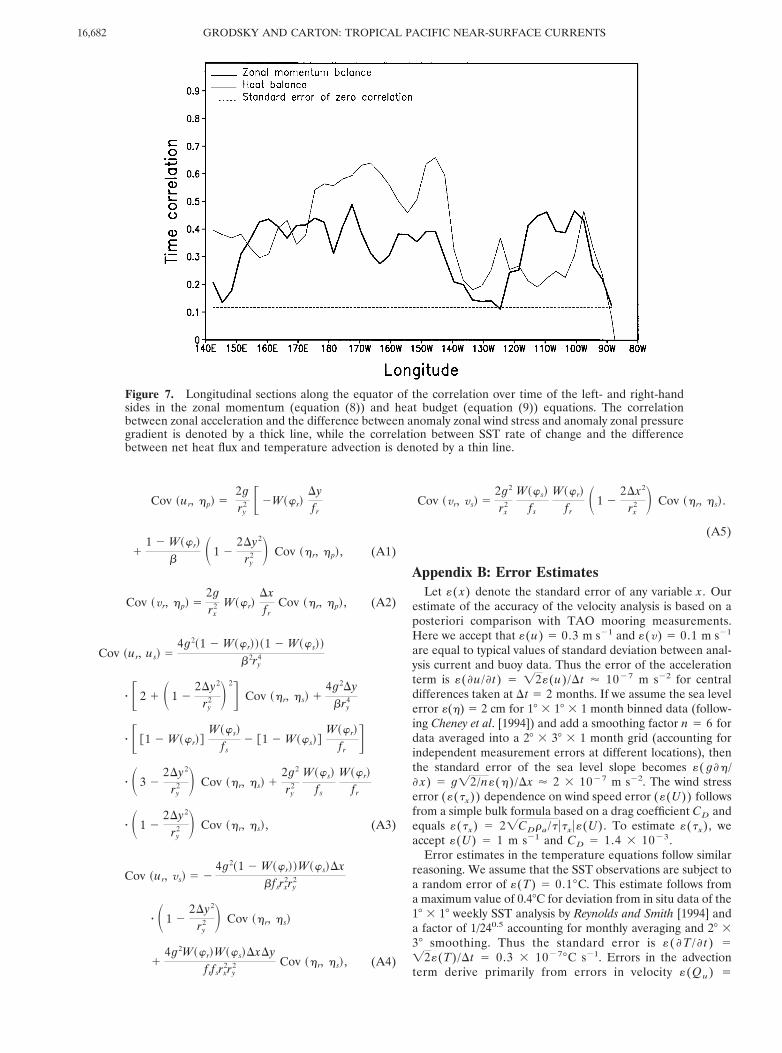
the three-term balance applies for much of the basin (corre-lation .0.4). The exception is a 208 band of longitudes from1408W to 1208W. In this band of longitudes, which is a regionof rather strong zonal gradient of the thermocline depth andcool surface temperatures, acceleration and the sum of windstress and pressure gradient force become uncorrelated. Thelow correlation is not a result of missing advection or of near-equatorial sampling problems. It is not improved by includingobservations from the TAO moorings in the analysis. We be-lieve that the missing dynamics are nonlinearity (at least, ver-tical advection) and mixing processes. We can anticipate sim-ilar results for the heat budget.
Now we examine the heat balance during the same threestages examined for momentum, focusing on spatial variationsalong the equator. Written for anomalies from the long-termmean and averaged over the upper ocean mixed layer of depthH , this balance becomes, following Moisan and Niiler [1998],
Tt 5 2@u z ¹T# 1 u# z ¹T 1 u z ¹T# 1
~F0 2 Fw!
CprH , (9)
where Cp is specific heat capacity of water and F0 and Fw aredownward anomaly heat fluxes across the air-sea interface andat the bottom of the mixed layer, respectively. F0 representsthe net surface radiative flux actually absorbed by the mixedlayer (following Wang and McPhaden [1999]), and Fw repre-sents the heat flux out of base of the mixed layer and is acombination of entrainment and vertical turbulent diffusion.
Figure 3. (top) Time-longitude equatorial cross section of (left) zonal wind stress, (middle) surface velocity,and (right) SST during 1996–1998. (bottom) Time average removed from each field. Horizontal lines mark thetimes for which the estimates of the upper ocean momentum and temperature balances are shown in Figures6 and 8.
GRODSKY AND CARTON: TROPICAL PACIFIC NEAR-SURFACE CURRENTS16,678

We estimate all terms in (9), except Fw, using velocity analysis,SST, surface fluxes, and mixed layer depth. Then we diagnosetimes/places where Fw might be significant by comparing theSST rate of change to the sum of terms on the right-hand sideof (9), accounting for the effects of horizontal transport andsurface fluxes. For this comparison, rate of change and spatialderivatives were estimated as central differences.
During the early stage (see Figure 8, April 1997), accelerat-ing eastward currents transport the waters of the western warmpool toward the east. This transport is mainly due to anomalycurrent advection acting on the mean SST gradient 2(u z ¹T# ),and gives warming east of 1808W. Net surface flux is smallexcept east of 1208W, where it acts to cool the ocean. This dropresults from two factors: first, a drop in incoming short-waveradiation resulting from increased cloudiness over alreadywarm waters and second, an increase of latent heat loss. Sur-face flux, advection, and heat storage rate balance west of1108W to within our error estimates. Thus heat flux due toother processes such as entrainment must play a lesser role.We conclude that during this early stage the increase of SST is
balanced by eastward advection of warm pool waters by thezonal current, as was suggested by Picaut et al. [1996] andDelcroix and Picaut [1998]. East of 1108W the left- and right-hand sides of (9) balance each other to within the errors of ourdata. Nevertheless, T/t exceeds the sum of fluxes. Examina-tion of the ocean reanalysis shows that the mixed layer thick-ness averaged 1208–808W increased to 30–35 m from the15–20 m observed in late 1996. This deepening of the thermo-cline acts to reduce the effect of heat loss across the bottom ofthe mixed layer on its temperature because of larger H .
During the middle stage (see Figure 8, August), SST isrelatively steady (T/t ' 0). Heat gain by horizontal advec-tion is compensated for by surface heat loss over already warmwaters west of 1208W. East of 1208W, surface heat loss in-creases while horizontal advection remains small, and addi-tional heat gain to the mixed layer is needed to complete thebalance. Examination of the ocean reanalysis shows that themixed layer depth (1208W–808W) increases by 25 m, againacting to reduce the effect of heat loss across its bottom on theSST. Note that our reasoning regarding the need for the anom-
Figure 4. Monthly sea level anomalies (shading) and velocity anomalies (arrows) from the climatologicalmean for every 4 months from December 1996 through August 1998. Contour interval is 5 cm. Only sea levelanomalies exceeding 10 cm are shaded. Only currents greater than 10 cm s21 are shown.
16,679GRODSKY AND CARTON: TROPICAL PACIFIC NEAR-SURFACE CURRENTS
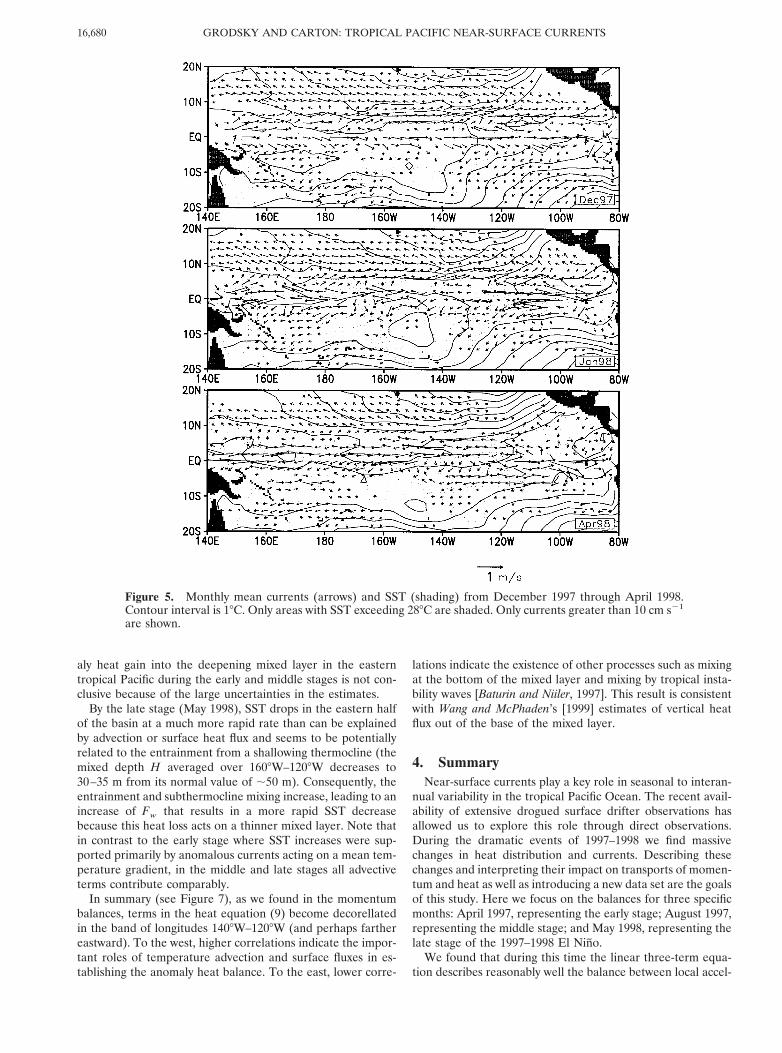
aly heat gain into the deepening mixed layer in the easterntropical Pacific during the early and middle stages is not con-clusive because of the large uncertainties in the estimates.
By the late stage (May 1998), SST drops in the eastern halfof the basin at a much more rapid rate than can be explainedby advection or surface heat flux and seems to be potentiallyrelated to the entrainment from a shallowing thermocline (themixed depth H averaged over 1608W–1208W decreases to30–35 m from its normal value of ;50 m). Consequently, theentrainment and subthermocline mixing increase, leading to anincrease of Fw that results in a more rapid SST decreasebecause this heat loss acts on a thinner mixed layer. Note thatin contrast to the early stage where SST increases were sup-ported primarily by anomalous currents acting on a mean tem-perature gradient, in the middle and late stages all advectiveterms contribute comparably.
In summary (see Figure 7), as we found in the momentumbalances, terms in the heat equation (9) become decorellatedin the band of longitudes 1408W–1208W (and perhaps farthereastward). To the west, higher correlations indicate the impor-tant roles of temperature advection and surface fluxes in es-tablishing the anomaly heat balance. To the east, lower corre-
lations indicate the existence of other processes such as mixingat the bottom of the mixed layer and mixing by tropical insta-bility waves [Baturin and Niiler, 1997]. This result is consistentwith Wang and McPhaden’s [1999] estimates of vertical heatflux out of the base of the mixed layer.
4. SummaryNear-surface currents play a key role in seasonal to interan-
nual variability in the tropical Pacific Ocean. The recent avail-ability of extensive drogued surface drifter observations hasallowed us to explore this role through direct observations.During the dramatic events of 1997–1998 we find massivechanges in heat distribution and currents. Describing thesechanges and interpreting their impact on transports of momen-tum and heat as well as introducing a new data set are the goalsof this study. Here we focus on the balances for three specificmonths: April 1997, representing the early stage; August 1997,representing the middle stage; and May 1998, representing thelate stage of the 1997–1998 El Nino.
We found that during this time the linear three-term equa-tion describes reasonably well the balance between local accel-
Figure 5. Monthly mean currents (arrows) and SST (shading) from December 1997 through April 1998.Contour interval is 18C. Only areas with SST exceeding 288C are shaded. Only currents greater than 10 cm s21
are shown.
GRODSKY AND CARTON: TROPICAL PACIFIC NEAR-SURFACE CURRENTS16,680
eration, pressure gradient, and wind forcing. The temperaturebalance is nonlinear, and relative contribution of the transportterms changes in time.
Our story begins in late 1996 and early 1997 with a 1 m s21
eastward current anomaly equatorially trapped in the westernbasin, produced in response to a succession of westerly windbursts. This current extended toward the east throughout thesummer of 1997, supported by a pressure gradient force alsoacting in the eastward direction. The accelerating eastwardcurrents transported the warm waters of the western warmpool east of 1808W, causing a rapid warming in mixed layertemperature as the anomalous currents acted on the meantemperature gradient, as was suggested by Picaut et al. [1996]and Delcroix and Picaut [1998]. Net surface flux was small atthis time except east of 1208W, where it acted to cool the oceanas a result of increased cloudiness and latent heat loss.
By the middle stage in August the positive trade wind anom-alies had extended further eastward nearly in balance with thepressure gradient force now acting to decelerate the flow. As aresult, the zonal acceleration was close to zero west of 1508W.SST during this period was steady. West of 1208W, advectiveheat gain was balanced by surface heat loss over already warmwaters. East of 1208W, surface heat loss was larger, whilehorizontal advection remained small. In this far eastern region,additional anomalous heat gain likely came from the anoma-lous deepening of the thermocline by 25 m and the consequent
reduction in cooling due to mixing and transport across thebase of this layer.
By the later stage in May 1998 the positive trade wind anom-alies shifted far to the east. However, an intense negativepressure gradient force caused a strong westward acceleration.SST decreased rapidly in the eastern half of the basin. Thisdecrease was larger than could be balanced by advection orsurface heat flux and seems clearly to have been related to theloss of heat associated with the entrainment from a shallowingthermocline (which rose by 25 m between 1608W and 1208W).
Our results show the interplay in the mixed layer tempera-ture budget between advection, surface fluxes, and diagnosedvertical heat flux out of the base of the mixed layer. Therelative importance of each term varies along the equator andin time as the 1997–1998 El Nino progresses.
The robustness of our conclusions depends on the accuracyof the surface velocity analysis. The authors foresee improve-ment of this analysis through the use of additional informationsuch as historical ship drifts, TAO buoy currents, and ADCPmeasurements.
Appendix AAfter some algebra [see Daley, 1981, p. 164] the covariance
functions take the form
Figure 6. Longitudinal sections along the equator of the three terms in the linear zonal momentum balanceduring the early, middle, and late stages of El Nino. (top) Anomaly acceleration u/t , zonal wind stresstx/rH , and pressure gradient force 2gh/ x . (bottom) Wind stress and pressure gradient terms combined,tx/rH 2 gh/ x . A vertical bar indicates standard errors for acceleration, while upper and lower thinbounding lines indicate standard errors for tx/rH 2 gh/ x . The zonal acceleration including nonlinearhorizontal advection, u/t 1 (u¹)u , is also shown.
16,681GRODSKY AND CARTON: TROPICAL PACIFIC NEAR-SURFACE CURRENTS
Cov ~ur, hp! 52gry
2 F2W~w r!Dyfr
11 2 W~w r!
b S 1 22Dy2
ry2 D Cov ~h r, hp! , (A1)
Cov ~v r, hp! 52grx
2 W~w r!Dxfr
Cov ~h r, hp! , (A2)
Cov ~ur, us! 54g2~1 2 W~w r!!~1 2 W~w s!!
b2ry4
z F 2 1 S 1 22Dy2
ry2 D 2G Cov ~h r, h s! 1
4g2Dybry
4
z F @1 2 W~w r!#W~w s!
fs2 @1 2 W~w s!#
W~w r!
f rG
z S 3 22Dy2
ry2 D Cov ~h r, h s! 1
2g2
ry2
W~w s!
fs
W~w r!
f r
z S 1 22Dy2
ry2 D Cov ~h r, h s! , (A3)
Cov ~ur, v s! 5 24g2~1 2 W~w r!!W~w s!Dx
bfsrx2ry
2
z S 1 22Dy2
ry2 D Cov ~h r, h s!
14g2W~w r!W~w s!DxDy
frfsrx2ry
2 Cov ~h r, h s! , (A4)
Cov ~v r, v s! 52g2
rx2
W~w s!
fs
W~w r!
f rS 1 2
2Dx2
rx2 D Cov ~h r, h s! .
(A5)
Appendix B: Error EstimatesLet «( x) denote the standard error of any variable x . Our
estimate of the accuracy of the velocity analysis is based on aposteriori comparison with TAO mooring measurements.Here we accept that «(u) 5 0.3 m s21 and «(v) 5 0.1 m s21
are equal to typical values of standard deviation between anal-ysis current and buoy data. Thus the error of the accelerationterm is «(u/t) 5 =2«(u)/Dt ' 1027 m s22 for centraldifferences taken at Dt 5 2 months. If we assume the sea levelerror «(h) 5 2 cm for 18 3 18 3 1 month binned data (follow-ing Cheney et al. [1994]) and add a smoothing factor n 5 6 fordata averaged into a 28 3 38 3 1 month grid (accounting forindependent measurement errors at different locations), thenthe standard error of the sea level slope becomes «( gh/ x) 5 g=2/n«(h)/Dx ' 2 3 1027 m s22. The wind stresserror («(tx)) dependence on wind speed error («(U)) followsfrom a simple bulk formula based on a drag coefficient CD andequals «(tx) 5 2=CDra/t utxu«(U). To estimate «(tx), weaccept «(U) 5 1 m s21 and CD 5 1.4 3 1023.
Error estimates in the temperature equations follow similarreasoning. We assume that the SST observations are subject toa random error of «(T) 5 0.18C. This estimate follows froma maximum value of 0.48C for deviation from in situ data of the18 3 18 weekly SST analysis by Reynolds and Smith [1994] anda factor of 1/240.5 accounting for monthly averaging and 28 338 smoothing. Thus the standard error is «(T / t) 5=2«(T)/Dt 5 0.3 3 10278C s21. Errors in the advectionterm derive primarily from errors in velocity «(Qu) 5
Figure 7. Longitudinal sections along the equator of the correlation over time of the left- and right-handsides in the zonal momentum (equation (8)) and heat budget (equation (9)) equations. The correlationbetween zonal acceleration and the difference between anomaly zonal wind stress and anomaly zonal pressuregradient is denoted by a thick line, while the correlation between SST rate of change and the differencebetween net heat flux and temperature advection is denoted by a thin line.
GRODSKY AND CARTON: TROPICAL PACIFIC NEAR-SURFACE CURRENTS16,682

=«2(u)(T/ x)2 1 «2(v)(T/ y)2, where «2(u) 5 0.1 m2
s22, and «2(v) 5 0.01 m2 s22. Finally, we accept the optimis-tic «(Q0) 5 5 W m22 error estimate of Kistler et al. [2001] forthe surface flux data.
Acknowledgments. This work has been supported by the NationalScience Foundation (OCE9530220 and OCE9812404). We gratefullyacknowledge Mark Swenson, formerly of the NOAA Atlantic Ocean-ographic Marine Laboratory, for providing the surface drifter data set.Chet Koblinsky of NASA Goddard Space Flight Center provided thealtimeter data. We are grateful to Eric Johnson of Earth and SpaceResearch and to an anonymous reviewer for valuable comments.
ReferencesAcero-Schertzer, C. E., D. V. Hansen, and M. S. Swenson, Evaluation
and diagnosis of surface currents in the National Center for Envi-ronmental Prediction’s ocean analyses, J. Geophys. Res., 102, 21,037–21,048, 1997.
An, S.-I., F.-F. Jin, and I.-S. Kang, The role of zonal advection feed-back in phase transition and growth of ENSO in the Cane-Zebiakmodel, J. Meteorol. Soc. Jpn., 77, 1151–1160, 1999.
Baturin, N. G., and P. P. Niiler, Effects of instability waves in the mixedlayer of the equatorial Pacific, J. Geophys. Res., 102, 27,771–27,793,1997.
Carton, J. A., and E. C. Hackert, Application of multivariate statisticalobjective analysis to the circulation in the tropical Atlantic Ocean,Dyn. Atmos. Oceans, 13, 491–515, 1989.
Carton, J. A., B. S. Giese, X. Cao, and L. Miller, Impact of altimeter,
thermistor, and expendable bathythermograph data on retrospectiveanalyses of the tropical Pacific Ocean, J. Geophys. Res., 101, 14,147–14,159, 1996.
Carton, J. A., G. Chepurin, X. Cao, and B. Giese, A simple ocean dataassimilation analysis of the global upper ocean 1959–1995, part 1,Methodology, J. Phys. Oceanogr., 30, 294–309, 2000.
Cheney, R., L. Miller, R. Agreen, N. Doyle, and J. Lillibridge,TOPEX/Poseidon: The 2-cm solution, J. Geophys. Res., 99, 24,555–24,563, 1994.
Daley, R., Atmospheric Data Analysis, 457 pp., Cambridge Univ. Press,New York, 1991.
Delcroix, T., and J. Picaut, Zonal displacement of the western equa-torial Pacific “fresh pool,” J. Geophys. Res., 103, 1087–1098, 1998.
DeWitt, D. G., and E. K. Schneider, The processes determining theannual cycle of equatorial sea surface temperature: A coupled gen-eral circulation model perspective, Mon. Weather Rev., 127, 381–395,1999.
Hansen, D. V., and P.-M. Poulain, Quality control and interpolationsof WOCE-TOGA drifter data, J. Atmos. Oceanic Technol., 13, 900–909, 1996.
Jin, F.-F., and S.-I. An, Thermocline and zonal advective feedbackswithin the equatorial ocean recharge oscillator model for ENSO,Geophys. Res. Lett., 26, 2989–2992, 1999.
Johnson, E. S., and D. S. Luther, Mean zonal momentum balance inthe upper and central equatorial Pacific Ocean, J. Geophys. Res., 99,7689–7705, 1994.
Johnson, G. C., M. J. McPhaden, G. D. Rowe, and K. E. McTaggart,Upper equatorial Pacific Ocean current and salinity variability dur-ing the 1996–1998 El Nino–La Nina cycle, J. Geophys. Res., 105,1037–1053, 2000.
Johnston, T. M. S., and M. A. Merrifield, Interannual geostrophic
Figure 8. Longitudinal sections along the equator of the terms in the heat budget equation (equation (9))during the same three months as in Figure 6. (top) Rate of change of SST (T/t), zonal (2uT/ x) andmeridional (2vT/ y) advection, and effective surface heat flux (F0/CprH). (bottom) Heat advection andheat flux terms combined. A vertical bar indicates standard errors for the SST rate of change, while upper andlower thin bounding lines indicate standard errors for the term combining the effects of advection and surfaceheat flux. Note that an SST rate of change of 10278C s21 corresponds to heat flux of 28 and 10 W m22 for themixed layer thickness of H 5 70 m and H 5 25 m, respectively, typical of the central and eastern parts ofthe basin.
16,683GRODSKY AND CARTON: TROPICAL PACIFIC NEAR-SURFACE CURRENTS
current anomalies in the near-equatorial western Pacific, J. Phys.Oceanogr., 30, 3–14, 2000.
Kalnay, E., et al., The NCEP/NCAR 40-year reanalysis project, Bull.Am. Meteorol. Soc., 77, 437–471, 1996.
Kessler, W. C., L. M. Rothstein, and D. Chen, The annual cycle of SSTin the eastern tropical Pacific, diagnosed in an ocean GCM, J. Clim.,11, 777–799, 1998.
Kistler, R., et al., The NCEP/NCAR 50-year reanalysis: Monthlymeans CD-ROM and documentation, Bull. Am. Meteorol. Soc., 82,247–268, 2001.
Koberle, C., and S. G. H. Philander, On the processes that controlseasonal variations of sea surface temperatures in the tropical Pa-cific Ocean, Tellus, Ser. A, 46, 481–496, 1994.
Koblinsky, C. J., B. D. Beckley, S. Howden, L. Tsaoussi, L. Wang, andY. M. Wang, Sea surface topography over the past decade observedfrom satellite altimeters, paper presented at International Sympo-sium, TOPEX/Poseidon Sci. Working Team Meet., Biarritz, France,Oct. 13–17, 1997.
Lagerloef, G. S. E., G. T. Mitchum, R. B. Lukas, and P. P. Niiler,Tropical Pacific near-surface currents estimated from altimeter,wind, and drifter data, J. Geophys. Res., 104, 23,313–23,326, 1999.
McPhaden, M. J., Genesis and evolution of the 1997–1998 El Nino,Science, 283, 950–954, 1999.
McPhaden, M. J., et al., The Tropical Ocean–Global Atmosphereobserving system: A decade of progress, J. Geophys. Res., 103,14,169–14,240, 1998.
Menkes, C., J.-P. Boulanger, and A. J. Busalacchi, Evaluation ofTOPEX and basin-wide Tropical Ocean and Global Atmosphere–Tropical Atmosphere-Ocean sea surface topographies and derivedgeostrophic currents, J. Geophys. Res., 100, 25,087–25,099, 1995.
Moisan, J. R., and P. P. Niiler, The seasonal heat budget of the NorthPacific: Net heat flux and heat storage rates (1950–1990), J. Phys.Oceanogr., 28, 401–421, 1998.
Niiler, P. P., R. E. Davis, and H. J. White, Water-following character-istics of a mixed layer drifter, Deep Sea Res., Part A, 34, 1867–1882,1987.
Picaut, J., S. P. Hayes, and M. J. McPhaden, Use of geostrophicapproximation to estimate time-varying zonal currents at the equa-tor, J. Geophys. Res., 94, 3228–3236, 1989.
Picaut, J., M. Ioualalen, C. Menkes, T. Delcroix, and M. J. McPhaden,Mechanism of the zonal displacements of the Pacific warm pool:Implications for ENSO, Science, 274, 1486–1489, 1996.
Picaut, J., F. Masia, and Y. du Penhoat, An advective-reflective con-ceptual model for the oscillatory nature of the ENSO, Science, 277,663–666, 1997.
Qiao, L., and R. H. Weisberg, The zonal momentum balance of theequatorial undercurrent in the central Pacific, J. Phys. Oceanogr., 27,1094–1119, 1997.
Ralph, E. A., and P. P. Niiler, Wind-driven currents in the tropicalPacific, J. Phys. Oceanogr., 29, 2121–2129, 1999.
Reynolds, R. W., and T. M. Smith, Improved global sea surface tem-perature analyses using optimum interpolation, J. Clim., 7, 929–948,1994.
Suarez, M. J., and P. S. Schopf, A delayed action oscillator for ENSO,J. Atmos. Sci., 45, 3283–3287, 1988.
Swenson, M. S., and D. V. Hansen, Tropical Pacific Ocean mixed layerheat budget: The Pacific cold tongue, J. Phys. Oceanogr., 29, 69–81,1999.
Wang, C. Z., and R. H. Weisberg, The 1997–98 El Nino evolutionrelative to previous El Nino events, J. Clim., 13, 488–501, 2000.
Wang, W. M., and M. J. McPhaden, The surface-layer heat balance inthe equatorial Pacific Ocean, part I, Mean seasonal cycle, J. Phys.Oceanogr., 29, 1812–1831, 1999.
Wyrtki, K., Water displacements in the Pacific and genesis of El Ninocycles, J. Geophys. Res., 90, 7129–7132, 1985.
Yu, X. R., and M. J. McPhaden, Dynamical analysis of seasonal andinterannual variability in the equatorial Pacific, J. Phys. Oceanogr.,29, 2350–2369, 1999.
Yu, L. A., and M. M. Rienecker, Evidence of an extratropical atmo-spheric influence during the onset of the 1997–1998 El Nino, Geo-phys. Res. Lett., 25, 3537–3540, 1998.
Yu, Y., W. J. Emery, and R. R. Leben, Satellite altimeter derivedgeostrophic currents in the western tropical Pacific during 1992–1993 and their validation with drifting buoy trajectories, J. Geophys.Res., 100, 25,069–25,085, 1995.
J. A. Carton and S. A. Grodsky, Department of Meteorology, Uni-versity of Maryland, 2417 Computer and Space Sciences Building,College Park, MD 20742. ([email protected]; [email protected])
(Received June 8, 2000; revised February 9, 2001;accepted March 13, 2001.)
GRODSKY AND CARTON: TROPICAL PACIFIC NEAR-SURFACE CURRENTS16,684