Harmonic Effects of Solar Geomagnetically Induced Currents ...
22
BNL-NUREG-48242 Harmonic Effects of Solar Geomagnetically Induced Currents on the Electrical Distribution System in Nuclear Power Plants' D. P. Carroll*, S. KasturT, M. Subudhi, and W. Gunther BNL ~NUREG—48242 Brookhaven National Laboratory r < T> DE93 0 0 7 ? 7 a Upton, New York 11973 nCb * University of Florida, Gainesville, Florida CLJ ** MOS, INC, Melville, New York ABSTRACT Most previous analysis on the effects of geomagnetically induced currents (GIC) on electric utility systems has concentrated on steady-state phenomena, with the main interest in the generator step-up transformer and the off-site power system. This paper begins to investigate the possible effects that a GIC event might have on the power plant itself, by examining the harmonic distortion that could exist at various voltage levels in the on-site distribution system. This study was carried out using an EMTP (ElectroMagnetic Transients Program) computer simulation of an electrics! distribution system of a typical nuclear power plant. Elements of both the on-site and off-site power systems are included for completeness. The simulation employs detailed three-phase models of all system components represented, including distributed- parameter transmission line models in the off-site system, saturation characteristics for all main transformers, and rotating machine models of major motor loads. The simulation also models the essential features of both the nonsafety-related and the safety-related portions in the on-site distribution network. Studies were performed for various operating configurations and conditions to determine harmonic levels in several parts of the distribution system. Results varied widely with station configuration and operating mode, but total harmonic distortion (THD) ranging from 4 to 11 % was observed in some sensitive low voltage busses. The safety-related busses appear to be more susceptible to high harmonics during normal station operation, due to typically light loading conditions. Harmonic levels generally increased with escalating GIC, but not in a linear fashion, since the frequency spectrum of the transformer excitation current also shifts significantly with changing GIC. Very high GIC may actually reduce the higher order excitation harmonics, which in turn can reduce the THD in the distribution network. A major factor in determining the on-site harmonic levels is the high-voltage transmission line, since its harmonic impedance varies sharply with frequency, as determined by the line length and any external impedance. Certain line lengths can produce a very high impedance at one or more of the harmonics generated by transformer saturation, thus forcing large harmonic currents into the on-site network. Future work will include refined load models, particularly at the lower voltage levels, in order to assess the effect of high harmonics on sensitive control circuits. Work will also evaluate the compounding effects of major system transients (e.g. loss of load ot large motor start-up) on plant behavior during GIC events. Finally, the simulation will be used to determine the effectiveness of various GIC mitigation schemes to minimize the impact of in-plant disturbances. 1 This work was performed under the auspices of the Nuclear Plant Aging Research (NPAR) program sponsored by the Nuclear Regulatory Commission MASTER DISTRIBUTION OF THIS DOOUMSNT IS UNUMHSJ
-
Upload
khangminh22 -
Category
Documents
-
view
0 -
download
0
Transcript of Harmonic Effects of Solar Geomagnetically Induced Currents ...
BNL-NUREG-48242
Harmonic Effects of Solar Geomagnetically Induced Currents on the ElectricalDistribution System in Nuclear Power Plants'
D. P. Carroll*, S. KasturT, M. Subudhi, and W. Gunther B N L~NUREG—48242Brookhaven National Laboratory r < T > DE93 0 0 7 ? 7 a
Upton, New York 11973 nCb* University of Florida, Gainesville, Florida CL J
** MOS, INC, Melville, New York
ABSTRACT
Most previous analysis on the effects of geomagnetically induced currents (GIC) onelectric utility systems has concentrated on steady-state phenomena, with the main interest in thegenerator step-up transformer and the off-site power system. This paper begins to investigate thepossible effects that a GIC event might have on the power plant itself, by examining the harmonicdistortion that could exist at various voltage levels in the on-site distribution system.
This study was carried out using an EMTP (ElectroMagnetic Transients Program)computer simulation of an electrics! distribution system of a typical nuclear power plant. Elementsof both the on-site and off-site power systems are included for completeness. The simulationemploys detailed three-phase models of all system components represented, including distributed-parameter transmission line models in the off-site system, saturation characteristics for all maintransformers, and rotating machine models of major motor loads. The simulation also models theessential features of both the nonsafety-related and the safety-related portions in the on-sitedistribution network.
Studies were performed for various operating configurations and conditions to determineharmonic levels in several parts of the distribution system. Results varied widely with stationconfiguration and operating mode, but total harmonic distortion (THD) ranging from 4 to 11 %was observed in some sensitive low voltage busses. The safety-related busses appear to be moresusceptible to high harmonics during normal station operation, due to typically light loadingconditions. Harmonic levels generally increased with escalating GIC, but not in a linear fashion,since the frequency spectrum of the transformer excitation current also shifts significantly withchanging GIC. Very high GIC may actually reduce the higher order excitation harmonics, whichin turn can reduce the THD in the distribution network. A major factor in determining the on-siteharmonic levels is the high-voltage transmission line, since its harmonic impedance varies sharplywith frequency, as determined by the line length and any external impedance. Certain line lengthscan produce a very high impedance at one or more of the harmonics generated by transformersaturation, thus forcing large harmonic currents into the on-site network.
Future work will include refined load models, particularly at the lower voltage levels, inorder to assess the effect of high harmonics on sensitive control circuits. Work will also evaluatethe compounding effects of major system transients (e.g. loss of load ot large motor start-up) onplant behavior during GIC events. Finally, the simulation will be used to determine theeffectiveness of various GIC mitigation schemes to minimize the impact of in-plant disturbances.
1This work was performed under the auspices of the Nuclear Plant Aging Research (NPAR) programsponsored by the Nuclear Regulatory Commission
MASTER DISTRIBUTION OF THIS DOOUMSNT IS UNUMHSJ
INTRODUCTION
Transient disturbances in the earth's magnetic field, caused by the interaction with auroralcurrents (electrojets), can induce electric potential gradients across the earth's surface. Theauroral currents are created by complex solar magnetic disturbances [1-3]. The inducedpotentials, known as earth surface potentials (ESP), are due to portions of the earth's non-homogeneous surface being subjected to the time-varying magnetic field. ESP magnitudes canrange from 1.2-6 V/km (2-10 V/mile). They act like quasi-dc voltage sources impressed betweenthe grounded wye (Y) neutrals of transformers at opposite ends of power transmission systems.The results of ESP are geomagnetically induced currents (GIC), which are quasi-dc currents thatcan have magnitudes many times greater than the RMS ac exciting currents in transformerwindings. GIC magnitudes greater than 100 A have actually been measured in transformer neutralleads [4,5].
There are three factors which combine to roughly determine the likelihood that a givenpower system will experience GIC and its related effects. The first factor is the geological rockformation on which the transmission lines are situated. The resistance posed by igneous rockformations can be thought of as being in parallel with that of the power lines. Because igneousrock has a high resistivity, transmission lines situated on such formations, which have muchlower resistances, will allow the GICs to flow through with greater ease. The latitude of thepower lines is another factor which determines GIC susceptibility. Lines in the higher northernlatitudes, closer to where the aurora appear, are more apt to be susceptible to GIC currents.Finally, the direction the power lines run determines to a lesser degree the magnitude of GICcurrents. If the previously mentioned electroj ;ts are idealized as east-west line currents they willinduce an ESP in the east-west direction; thus, power lines running east-west may experiencehigher GICs than those running north-south.
The primary effect that GIC has upon transformers is known as half-cycle saturation. Themajor consequences of half-cycle saturation are: (1) the potential for drastic stray leakage fluxand excessive localized heating; (2) a rich source of even and odd harmonics; and (3) asignificant increase in inductive VARS drawn by the transformer. Harmonics, due to transformersaturation, can affect the entire power system in several ways, for example: overloading ofcapacitor banks, misoperation of relays, and higher recovery voltages for circuit breakers. Manystudies have been conducted on the effect of GIC on transformers [6,7], and nearly all of themreport potential for crippling damage to the transformer.
Whether the effects of GIC are restricted to the transmission system or not, the potentialfor impact on a nuclear power station already exists. A loss of offsite power is an example ofhow GIC can indirectly affect a nuclear plant. A great deal of concern was recently generatedover an incidence at Hydro Quebec on March 13, 1989, where the entire province was blackedout as a result of GIC [5]. In total, 21,500 MW of generation was lost. Nine hours later, 17percent of the province was still without service.
Occurrences at Salem Unit 1, Hope Creek Unit 1, and Three Mile Island Unit 1 have alsoraised concern over the potential for trouble. Moreover, it is expected that the disturbances which
cause GIC will reach their peak activity sometime between 1992 and 1995. Current trends arealso indicating that this may be one of the highest peaks in recent decades.
The main purpose of the work reported in this paper was to investigate the manner inwhich GIC can affect the in-plant electrical distribution system, and to quantify such GIC effectsas manifested on the distribution system busses at different voltage levels. A typical electricaldistribution system inside a nuclear power plant was modeled in detail using the ElectroMagneticTransients Program (EMTP). Parametric studies of the subject plant model were performed tosimulate the GIC effects on various electrical busses at all voltage levels, including the 120 voltac safety busses.
COMPUTER SIMULATION STUDIES
Detailed study of power system transients and abnormal steady-state conditions usuallyare highly complex and nonlinear by nature, and do not generally lend themselves to theoreticalanalysis. Instead it is often necessary to use simulation techniques to investigate these conditions.Problem areas of this type include system overvoltages (such as lightning and switching surges),fault currents, non-sinusoidal waveforms (such as harmonics and inrush currents),electromechanical oscillations, and various other types of transients.
EMTP is recognized by the power industry as the most comprehensive digital simulationprogram specifically designed to study power system transients. It has a structure and library ofcomponent models well-suited for various types of powsr system investigations. It has been usedin many previous studies ranging from high-frequency phenomena such as switching surges tolow-frequency phenomena such as subsynchronous resonance. EMTP usage generally falls intotwo main categories: system design and analysis of operating problems. System design includesareas such as insulation coordination, specification of equipment ratings, protective devicespecifications, relay design, control system design, and harmonic filter selection. Operatingproblems include system outages, equipment failures, harmonics and resonance, fault analysis,voltage instability, and many others.
EMTP Simulation Model
Figure 1 is a one-line diagram of the initial EMTP simulation model of a typical nuclearpower plant distribution network and offsite transmission system. The simulation is actually afully detailed three-phase representation of the system. The generator is represented by either asimple voltage-behind-subtransient-reactance, as shown in the diagram, or it can be representedby a more detailed d-q axis model (Park's equations) with mechanical system and exciterincluded. Preliminary comparisons between these two approaches showed very little differencein results for problems involving GlC-induced harmonics. Therefore, the simpler generator modelis preferred, since it requires much less computer time to implement. If later transient studiesrequire the more detailed generator model, it is ready and available for immediate use. The delta-

grounded-wye generator step-up transformer (Tl) is modeled in full detail, with core loss,winding loss, leakage inductance, and magnetic saturation all included. The step-up transformeris connected to the transmission system, represented by a single overhead line model connectedto an infinite bus. It can easily be expanded later to include more transmission lines if necessary.The overhead line can be modeled in various forms: equivalent PI section(s), a constant-frequency distributed-parameter model, or a frequency-dependent distributed-parameter model.The length of the line, which could have an important influence on system behavior, may alsobe easily varied in each of the options.
As Fig. 1 shows, this initial simulation attempts to model the essential features of boththe nonsafety-related and safety-related systems, without over-complicating the picture. It isimportant initially to keep things as simple as possible until the basic mechanisms are betterunderstood. This is especially important in using a transients program like EMTP, in order tominimize the computer time spent for each run. Many computer runs are necessary to understandthe problem and to acquire enough simulation data for a meaningful evaluation.
Figure 1 shows the system configuration for normal operation, where the normal stationservice transformer (T2) feeds the nonsafety-related network and the reserve station servicetransformer (T3) feeds the safety-related, emergency system. The system configuration can easilybe changed for other modes of operation by changing the status of the various switches availablein the simulation, or by manually changing node names in the EMTP data input file. Both thenormal and the reserve station service transformers are represented in full three-phase, three-winding detail, with losses, leakage reactances, and magnetic saturation included. Because oftypical system symmetry it is necessary to model in detail only one safety train circuit in theemergency system, and only one of the two 13.8 kV nonsafety-related busses. Note that,although the two systems are not coupled in the plant, there is potential coupling at thetransmission level in the offsite power system. The coupling may be important in GIC studies,therefore, it is necessary in this mode of operation to simultaneously represent the nonsafety-related and the safety-related systems together in the simulation.
For the nonsafety-related system, the normal station service transformer (T2) feeds 13.8kV busses B001 and B003. Bus B003 supplies two 12,000 hp pump motors, a static equivalentof several other motors, and a static equivalent of several 600 V loads connected through13.8kV/600V delta-wye transformers. The 12,000 Hp motors are modeled in full transient detailas three-phase rotating machines, including losses, magnetizing current, and rotor/load inertia.Bus B003 also feeds two 4.16 kV busses, B013 and B015, through a delta-wye transformer (T4).These busses are loaded with static equivalents of several additional motors, and B015 also feedsa 600 V bus, called BUS6 in the EMTP data file, through another delta-wye transformer (T6).BUS6 in turn supplies a 270 kVA static equivalent load, and feeds a 120/240 V bus, B120N,through a single-phase transformer (T7). This particular 120/240 V bus supplies power to fireprotection panels and miscellaneous control circuits.
For the emergency system, the reserve station service transformer (T3) 4.16 kV windingsupplies the main bus, BUSD. BUSD in turn feeds several 600 V busses and distribution panels,which are represented by the equivalent bus B600 fed by delta-wye transformer (T5). B600 feedsa static equivalent 535 kVA load, and supplies a 120 V bus, B120E, through a 25 kVA single-
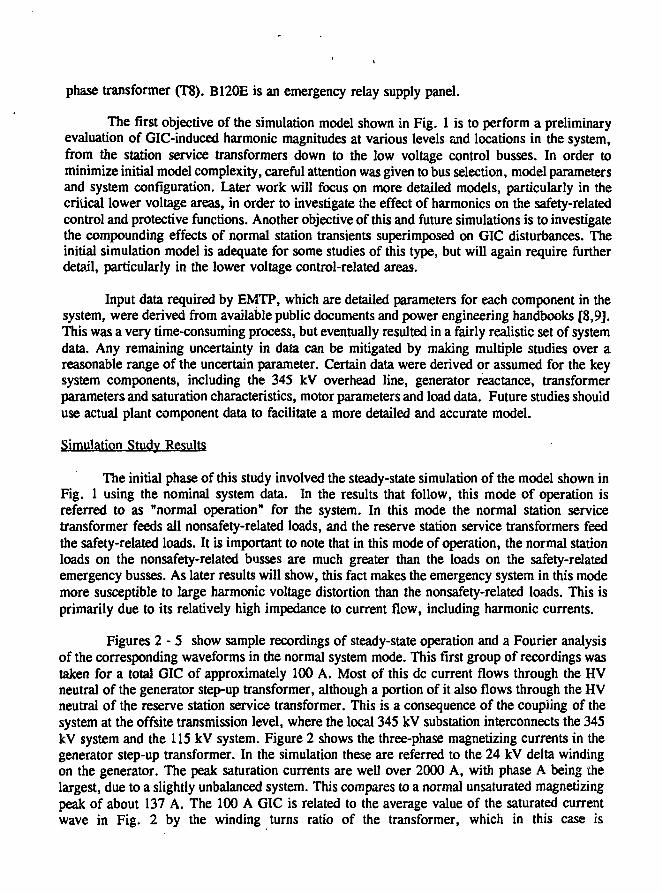
phase transformer (T8). B120E is an emergency relay supply panel.
The first objective of the simulation model shown in Fig. 1 is to perform a preliminaryevaluation of GlC-induced harmonic magnitudes at various levels and locations in the system,from the station service transformers down to the low voltage control busses. In order tominimize initial model complexity, careful attention was given to bus selection, model parametersand system configuration. Later work will focus on more detailed models, particularly in thecritical lower voltage areas, in order to investigate the effect of harmonics on the safety-relatedcontrol and protective functions. Another objective of this and future simulations is to investigatethe compounding effects of normal station transients superimposed on GIC disturbances. Theinitial simulation model is adequate for some studies of this type, but will again require furtherdetail, particularly in the lower voltage control-related areas.
Input data required by EMTP, which are detailed parameters for each component in thesystem, were derived from available public documents and power engineering handbooks [8,9].This was a very time-consuming process, but eventually resulted in a fairly realistic set of systemdata. Any remaining uncertainty in data can be mitigated by making multiple studies over areasonable range of the uncertain parameter. Certain data were derived or assumed for the keysystem components, including the 345 kV overhead line, generator reactance, transformerparameters and saturation characteristics, motor parameters and load data. Future studies shoulduse actual plant component data to facilitate a more detailed and accurate model.
Simulation Study Results
The initial phase of this study involved the steady-state simulation of the model shown inFig. 1 using the nominal system data. In the results that follow, this mode of operation isreferred to as "normal operation" for the system. In this mode the normal station servicetransformer feeds all nonsafety-related loads, and the reserve station service transformers feedthe safety-related loads. It is important to note that in this mode of operation, the normal stationloads on the nonsafety-related busses are much greater than the loads on the safety-relatedemergency busses. As later results will show, this fact makes the emergency system in this modemore susceptible to large harmonic voltage distortion than the nonsafety-related loads. This isprimarily due to its relatively high impedance to current flow, including harmonic currents.
Figures 2 - 5 show sample recordings of steady-state operation and a Fourier analysisof the corresponding waveforms in the normal system mode. This first group of recordings wastaken for a total GIC of approximately 100 A. Most of this dc current flows through the HVneutral of the generator step-up transformer, although a portion of it also flows through the HVneutral of the reserve station service transformer. This is a consequence of the coupling of thesystem at the off site transmission level, where the local 345 kV substation interconnects the 345kV system and the 115 kV system. Figure 2 shows the three-phase magnetizing currents in thegenerator step-up transformer. In the simulation these are referred to the 24 kV delta windingon the generator. The peak saturation currents are well over 2000 A, with phase A being thelargest, due to a slightly unbalanced system. This compares to a normal unsaturated magnetizingpeak of about 137 A. The 100 A GIC is related to the average value of the saturated currentwave in Fig. 2 by the winding turns ratio of the transformer, which in this case is
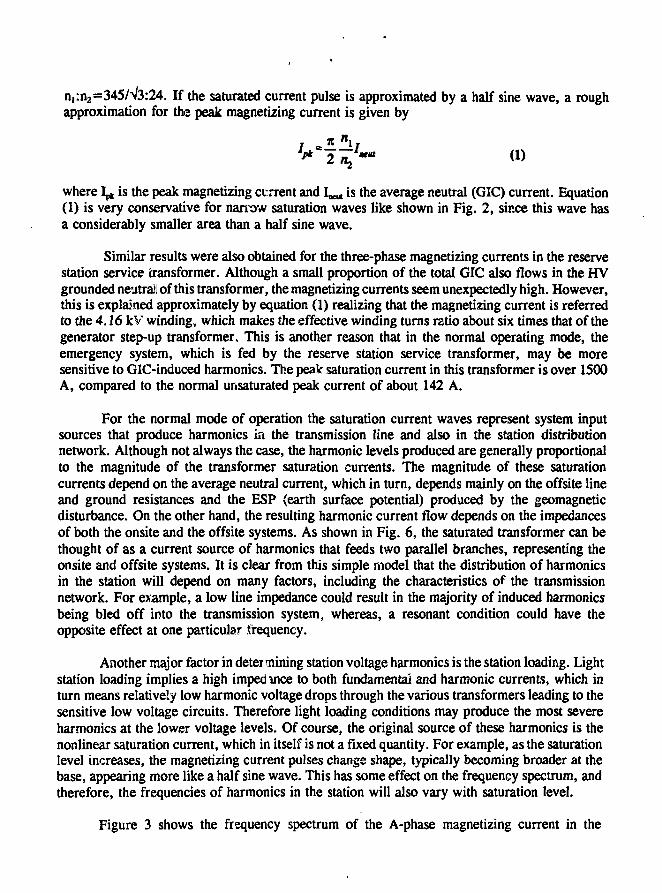
n,:n2=345/V3:24. If the saturated current pulse is approximated by a half sine wave, a roughapproximation for the peak magnetizing current is given by
where I,* is the peak magnetizing current and I,,̂ , is the average neutral (GIC) current. Equation(1) is very conservative for narrow saturation waves like shown in Fig. 2, since this wave hasa considerably smaller area than a half sine wave.
Similar results were also obtained for the three-phase magnetizing currents in the reservestation service transformer. Although a small proportion of the total GIC also flows in the HVgrounded neutral of this transformer, the magnetizing currents seem unexpectedly high. However,this is explained approximately by equation (1) realizing that the magnetizing current is referredto the 4.16 k¥ winding, which makes the effective winding turns ratio about six times that of thegenerator step-up transformer. This is another reason that in the normal operating mode, theemergency system, which is fed by the reserve station service transformer, may be moresensitive to GlC-induced harmonics. The peaV saturation current in this transformer is over 1500A, compared to the normal unsaturated peak current of about 142 A.
For the normal mode of operation the saturation current waves represent system inputsources that produce harmonics in the transmission line and also in the station distributionnetwork. Although not always the case, the harmonic levels produced are generally proportionalto the magnitude of the transformer saturation currents. The magnitude of these saturationcurrents depend on the average neutral current, which in turn, depends mainly on the offsite lineand ground resistances and the ESP (earth surface potential) produced by the geomagneticdisturbance. On the other hand, the resulting harmonic current flow depends on the impedancesof both the onsite and the offsite systems. As shown in Fig. 6, the saturated transformer can bethought of as a current source of harmonics that feeds two parallel branches, representing theonsite and offsite systems. It is clear from this simple model that the distribution of harmonicsin the station will depend on many factors, including the characteristics of the transmissionnetwork. For example, a low line impedance could result in the majority of induced harmonicsbeing bled off into the transmission system, whereas, a resonant condition could have theopposite effect at one particular frequency.
Another major factor in determining station voltage harmonics is the station loading. Lightstation loading implies a high imped ince to both fundamental and harmonic currents, which inturn means relatively low harmonic voltage drops through the various transformers leading to thesensitive low voltage circuits. Therefore light loading conditions may produce the most severeharmonics at the lower voltage levels. Of course, the original source of these harmonics is thenonlinear saturation current, which in itself is not a fixed quantity. For example, as the saturationlevel increases, the magnetizing current pulses change shape, typically becoming broader at thebase, appearing more like a half sine wave. This has some effect on the frequency spectrum, andtherefore, the frequencies of harmonics in the station will also vary with saturation level.
Figure 3 shows the frequency spectrum of the A-phase magnetizing current in the
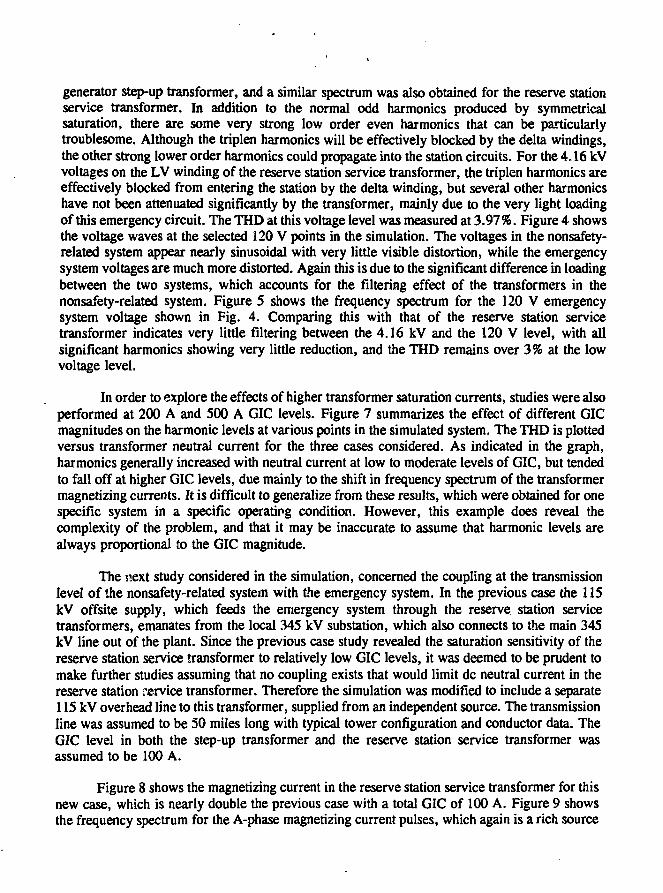
generator step-up transformer, and a similar spectrum was also obtained for the reserve stationservice transformer. In addition to the normal odd harmonics produced by symmetricalsaturation, there are some very strong low order even harmonics that can be particularlytroublesome. Although the triplen harmonics will be effectively blocked by the delta windings,the other strong lower order harmonics could propagate into the station circuits. For the 4.16 kVvoltages on the LV winding of the reserve station service transformer, the triplen harmonics areeffectively blocked from entering the station by the delta winding, but several other harmonicshave not been attenuated significantly by the transformer, mainly due to the very light loadingof this emergency circuit. The THD at this voltage level was measured at 3.97%. Figure 4 showsthe voltage waves at the selected 120 V points in the simulation. The voltages in the nonsafety-related system appear nearly sinusoidal with very little visible distortion, while the emergencysystem voltages are much more distorted. Again this is due to the significant difference in loadingbetween the two systems, which accounts for the filtering effect of the transformers in thenonsafety-related system. Figure 5 shows the frequency spectrum for the 120 V emergencysystem voltage shown in Fig. 4. Comparing this with that of the reserve station servicetransformer indicates very little filtering between the 4.16 kV and the 120 V level, with allsignificant harmonics showing very little reduction, and the THD remains over 3% at the lowvoltage level.
In order to explore the effects of higher transformer saturation currents, studies were alsoperformed at 200 A and 500 A GIC levels. Figure 7 summarizes the effect of different GICmagnitudes on the harmonic levels at various points in the simulated system. The THD is plottedversus transformer neutral current for the three cases considered. As indicated in the graph,harmonics generally increased with neutral current at low to moderate levels of GIC, but tendedto fall off at higher GIC levels, due mainly to the shift in frequency spectrum of the transformermagnetizing currents. It is difficult to generalize from these results, which were obtained for onespecific system in a specific operating condition. However, this example does reveal thecomplexity of the problem, and that it may be inaccurate to assume that harmonic levels arealways proportional to the GIC magnitude.
The next study considered in the simulation, concerned the coupling at the transmissionlevel of the nonsafety-related system with the emergency system. In the previous case the 115kV offsite supply, which feeds the emergency system through the reserve station servicetransformers, emanates from the local 345 kV substation, which also connects to the main 345kV line out of the plant. Since the previous case study revealed the saturation sensitivity of thereserve station service transformer to relatively low GIC levels, it was deemed to be prudent tomake further studies assuming that no coupling exists that would limit dc neutral current in thereserve station service transformer. Therefore the simulation was modified to include a separate115 kV overhead line to this transformer, supplied from an independent source. The transmissionline was assumed to be 50 miles long with typical tower configuration and conductor data. TheGIC level in both the step-up transformer and the reserve station service transformer wasassumed to be 100 A.
Figure 8 shows the magnetizing current in the reserve station service transformer for thisnew case, which is nearly double the previous case with a total GIC of 100 A. Figure 9 showsthe frequency spectrum for the A-phase magnetizing current pulses, which again is a rich source
of low frequency harmonics. Figure 10 shows the reserve station service transformer voltageson the 4.16 kV side, and Fig. 11 shows the frequency spectrum of the A-phase waveform. Thevoltage waves are highly distorted, and the spectrum plot confirms this observation showing avariety of strong harmonics present in the wave over a wide frequency range. We see thisspectrum is quite different than in the previous case study. The overall harmonic level is alsosignificantly larger than before, with a THD of 8.93 %. Fig. 12 shows the normal and emergencysystem voltages at the selected 120 V busses, and again the emergency system voltage is highlydistorted. This is also verified by the frequency spectrum plot of this voltage, shown in Fig. 13,which reveals a wide range of relatively strong frequency components. The spectrum in Fig. 13is similar to that in Fig. 11, with only a slight attenuation of harmonics from the 4.16 kV levelto the 120 V level. The overall harmonic level is also only slightly reduced, with a THD of8.23%.
The next case study considered was for plant operation in one stage of the start-up mode.In this case it was assumed that the normal station service transformer is disconnected from thenormal onsite distribution system. Instead, the reserve station service transformers are assumedto carry the entire onsite load, including tJie nonsafety-related and the emergency system loads.Therefore, the only source of harmonics in the plant are from a GIC flow through the groundedneutrals of the reserve station service transformers. Even if GIC flows through the step-uptransformer there is no path for harmonics to enter the station. Referring to the simulation modelin Fig. 1, this study was performed by opening the breakers from the normal station servicetransformer (T2) to the 13.8 kV busses B001 and B003, then closing the NO breaker from thereserve station service transformer (T3) to bus B003. One additional feature was also added tothe simulation: a 0.1S pu source reactance was placed in series with the remote voltage sourceat the far end of the 345 kV line. This is to model the finite short circuit capacity of the remotesource. It may have the effect of increasing harmonic levels in the station, by further blockingharmonic current flow into the transmission system.
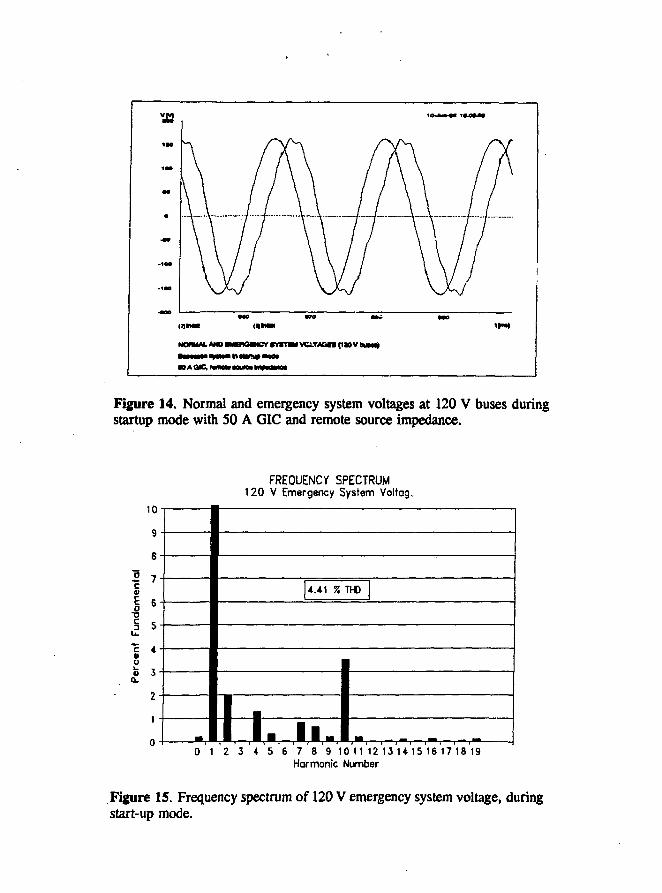
For the assumed start-up mode of operation, the reserve station service transformermagnetizing currents were higher than previous cases, with a GIC of only SO A at the 345 kVtransmission level. Since the GIC appears at this high voltage level, and the magnetizing currentis referred to the 4.16 kV winding of the transformer, the current pulses are higher for thereserve station service transformer. Based on previous observations, this would seem to implya potentially high harmonic level at the lower frequencies, unless some resonant conditiondevelops at higher harmonics. Simulation results verify this for the 4.16 kV side of the reservestation service transformer, and the spectrum reveals several low frequency components and apartial resonance at the tenth harmonic. This is probably due to an interaction between the stationimpedance and the transmission line. The THD at the 4.16 kV voltage level is 4.94%. Figure14 shows normal system and emergency system voltages at the 120 V level. Again the emergencysystem voltages are visibly distorted. Figure 15 shows the frequency spectrum of the 120 Vemergency system voltage, which has similar characteristics as the 4.16 kV level. This againindicates very little harmonic attenuation through the lightly-loaded emergency system.
Frequency Analysis of Nominal Case Studies
EMTP simulation studies and Fourier analysis of the waveforms taken from these
simulations have shown that the harmonic levels present on the plant distribution busses dependson several factors. These include the magnitude of the GIC, the loading of the distributionbusses, the transformer saturation characteristics, and the transmission line configuration, linelength and magnitude of remote source impedance. Among these factors the transmission linecharacteristics may be the most important in determining both the magnitude and dominantfrequency of harmonic currents forced into the station circuits. This is best explained by referringto the circuit analogy of the process suggested by Fig. 6. The step-up transformer and/or thereserve station service transformer, whichever is fed through grounded wye-connected windingsfrom the line side, acts essentially as a current source of various harmonic frequencies. Theseharmonic currents may flow into either the transmission system or the station distribution system,depending on the relative impedances of the two sides of the circuit. The effective harmoniccurrent source amplitude falls off sharply with frequency, as both the distribution circuitimpedance and transmission line impedance generally increase with frequency. However, thetransmission line may reach its resonant point near one of these higher harmonics, which resultsin a very sharp increase in line impedance. This causes most of the harmonic current at thatfrequency and nearby frequencies to be forced into the distribution system. The transmission linethus acts like a frequency-sensitive valve, which acts to either drain off and dissipate harmoniccurrents in the transmission network, or block these currents and force them into the stationcircuits. Once the harmonic currents enter the distribution network, the harmonic voltage levelsat the various busses depends on the relative circuit impedances. The dominant impedances inthe distribution network are inductive, due to the various transformer leakage reactances and themajor loads. The network impedance therefore increases with frequency, and is generally higherunder light loading conditions. Thus the harmonic voltages can be quite high at high frequencies,even if harmonic current injection is low, especially for light loads.
In order to test this theory, the Frequency Scan feature of EMTP was used to computetransmission line impedance functions, as viewed from the excitation branch of the step-uptransformer and/or the reserve station service transformer. These impedance functions werecomputed using the complete system models used in the previous time simulations, by injectingharmonic currents into the transformer excitation circuits, then measuring the harmonic voltagesproduced at the terminals of the transmission line. Since these impedance functions are computedusing the total current injection, including that flowing into the distribution network, they are nottrue measurements of the line impedance, but serve only as a convenient measure of the blockingability of the line over the frequency spectrum of interest.
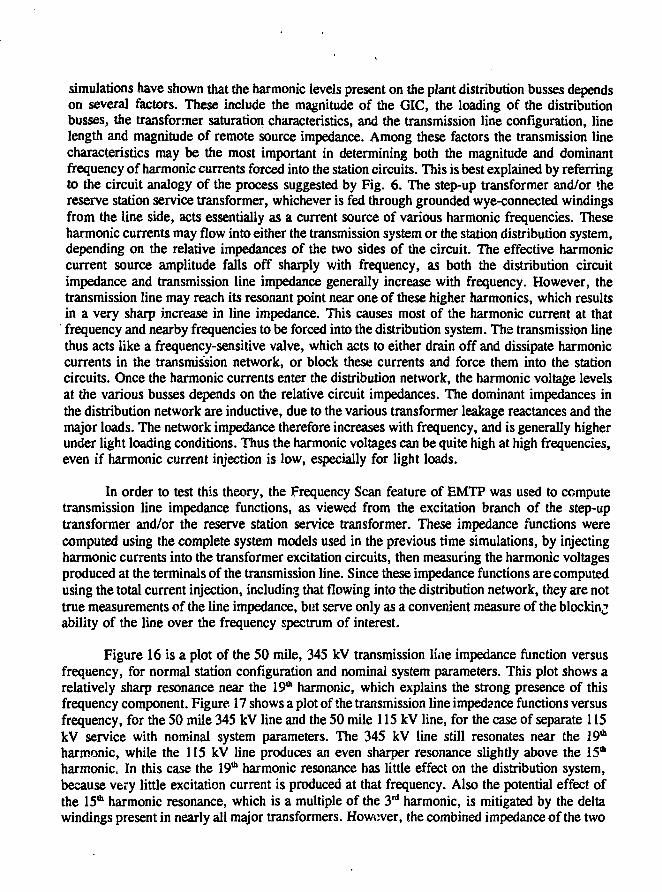
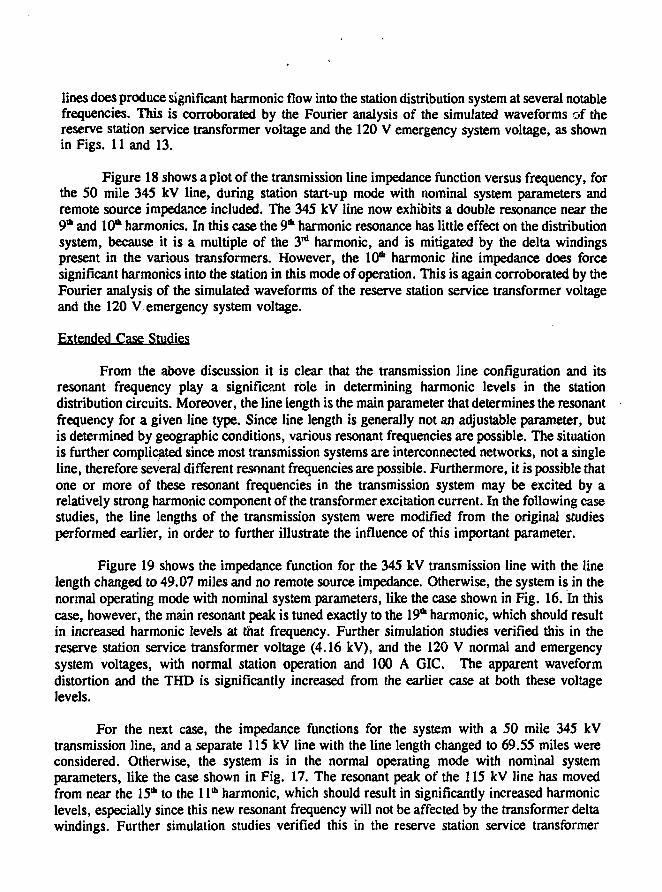
Figure 16 is a plot of the SO mile, 34S kV transmission line impedance function versusfrequency, for normal station configuration and nominal system parameters. This plot shows arelatively sharp resonance near the 19"1 harmonic, which explains the strong presence of thisfrequency component. Figure 17 shows a plot of the transmission line impedance functions versusfrequency, for the 50 mile 345 kV line and the 50 mile 115 kV line, for the case of separate 115kV service with nominal system parameters. The 345 kV line still resonates near the 19th
harmonic, while the 115 kV line produces an even sharper resonance slightly above the 15*harmonic. In this case the 19th harmonic resonance has little effect on the distribution system,because very little excitation current is produced at that frequency. Also the potential effect ofthe 15th harmonic resonance, which is a multiple of the 3rd harmonic, is mitigated by the deltawindings present in nearly all major transformers. However, the combined impedance of the two
lines does produce significant harmonic flow into the station distribution system at several notablefrequencies. This is corroborated by the Fourier analysis of the simulated waveforms of thereserve station service transformer voltage and the 120 V emergency system voltage, as shownin Figs. 11 and 13.
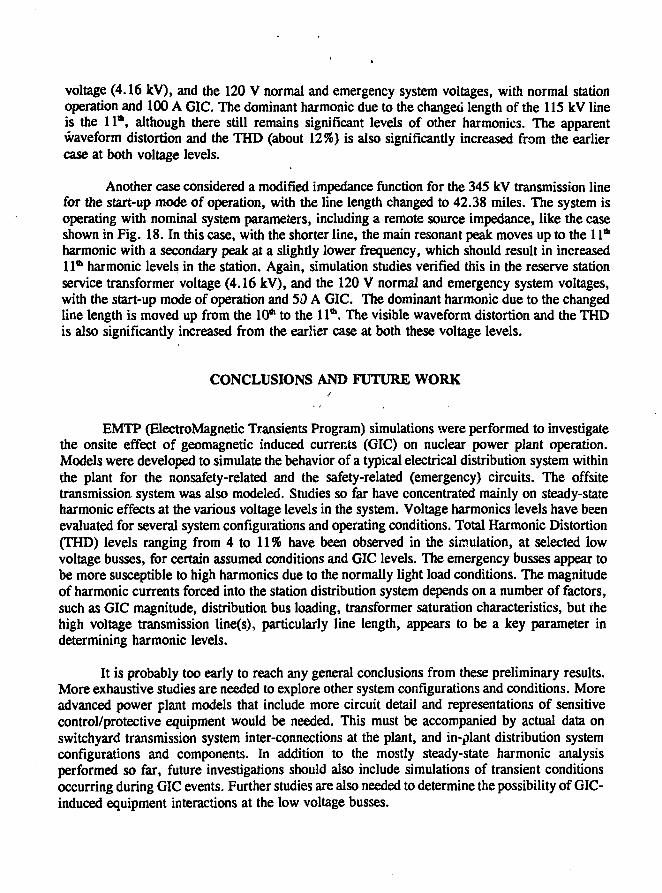
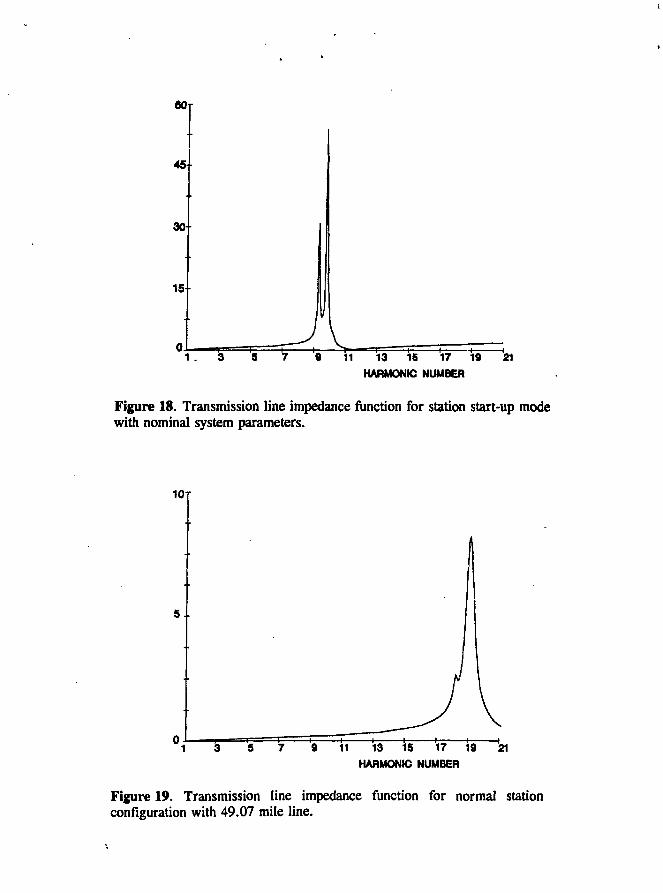
Figure 18 shows a plot of the transmission line impedance function versus frequency, forthe 50 mile 345 kV line, during station start-up mode with nominal system parameters andremote source impedance included. The 345 kV line now exhibits a double resonance near the9* and 10* harmonics. In this case the 9* harmonic resonance has little effect on the distributionsystem, because it is a multiple of the 3rd harmonic, and is mitigated by the delta windingspresent in the various transformers. However, the 10* harmonic line impedance does forcesignificant harmonics into the station in this mode of operation. This is again corroborated by theFourier analysis of the simulated waveforms of the reserve station service transformer voltageand the 120 V emergency system voltage.
Extended Case Studies
From the above discussion it is clear that the transmission line configuration and itsresonant frequency play a significant role in determining harmonic levels in the stationdistribution circuits. Moreover, the line length is the main parameter that determines the resonantfrequency for a given line type. Since line length is generally not an adjustable parameter, butis determined by geographic conditions, various resonant frequencies are possible. The situationis further complicated since most transmission systems are interconnected networks, not a singleline, therefore several different resonant frequencies are possible. Furthermore, it is possible thatone or more of these resonant frequencies in the transmission system may be excited by arelatively strong harmonic component of the transformer excitation current. In the following casestudies, the line lengths of the transmission system were modified from the original studiesperformed earlier, in order to further illustrate the influence of this important parameter.
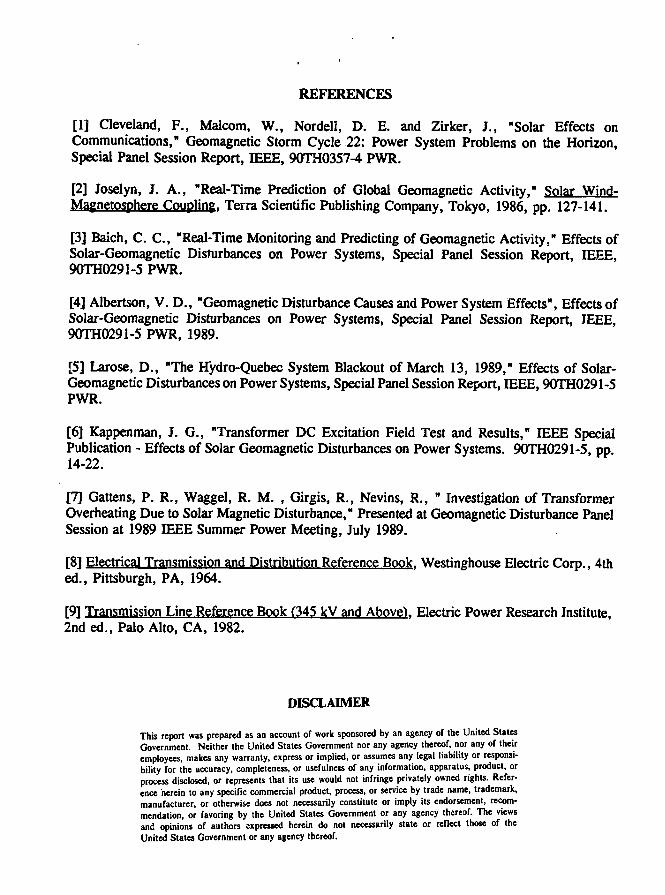
Figure 19 shows the impedance function for the 345 kV transmission line with the linelength changed to 49.07 miles and no remote source impedance. Otherwise, the system is in thenormal operating mode with nominal system parameters, like the case shown in Fig. 16. In thiscase, however, the main resonant peak is tuned exactly to the 19* harmonic, which should resultin increased harmonic levels at that frequency. Further simulation studies verified this in thereserve station service transformer voltage (4.16 kV), and the 120 V normal and emergencysystem voltages, with normal station operation and 100 A GIC. The apparent waveformdistortion and the THD is significantly increased from the earlier case at both these voltagelevels.
For the next case, the impedance functions for the system with a 50 mile 345 kVtransmission line, and a separate 115 kV line with the line length changed to 69.55 miles wereconsidered. Otherwise, the system is in the normal operating mode with nominal systemparameters, like the case shown in Fig. 17. The resonant peak of the 115 kV line has movedfrom near the 15th to the 11* harmonic, which should result in significantly increased harmoniclevels, especially since this new resonant frequency will not be affected by the transformer deltawindings. Further simulation studies verified this in the reserve station service transformer
voltage (4.16 kV), and the 120 V normal and emergency system voltages, with normal stationoperation and 100 A GIC. The dominant harmonic due to the changed length of the 115 kV lineis the 11*, although there still remains significant levels of other harmonics. The apparentwaveform distortion and the THD (about 12%) is also significantly increased from the earliercase at both voltage levels.
Another case considered a modified impedance function for the 345 kV transmission linefor the start-up mode of operation, with the line length changed to 42.38 miles. The system isoperating with nominal system parameters, including a remote source impedance, like the caseshown in Fig. 18. In this case, with the shorter line, the main resonant peak moves up to the 11th
harmonic with a secondary peak at a slightly lower frequency, which should result in increased11* harmonic levels in the station. Again, simulation studies verified this in the reserve stationservice transformer voltage (4.16 kV), and the 120 V normal and emergency system voltages,with the start-up mode of operation and 50 A GIC. The dominant harmonic due to the changedline length is moved up from the 10* to the 11*. The visible waveform distortion and the THDis also significantly increased from the earlier case at both these voltage levels.
CONCLUSIONS AND FUTURE WORK
EMTP (ElectroMagnetic Transients Program) simulations were performed to investigatethe onsite effect of geomagnetic induced currents (GIC) on nuclear power plant operation.Models were developed to simulate the behavior of a typical electrical distribution system withinthe plant for the nonsafety-related and the safety-related (emergency) circuits. The offsitetransmission system was also modeled. Studies so far have concentrated mainly on steady-stateharmonic effects at the various voltage levels in the system. Voltage harmonics levels have beenevaluated for several system configurations and operating conditions. Total Harmonic Distortion(THD) levels ranging from 4 to 11% have been observed in the simulation, at selected lowvoltage busses, for certain assumed conditions and GIC levels. The emergency busses appear tobe more susceptible to high harmonics due to the normally light load conditions. The magnitudeof harmonic currents forced into the station distribution system depends on a number of factors,such as GIC magnitude, distribution bus loading, transformer saturation characteristics, but thehigh voltage transmission line(s), particularly line length, appears to be a key parameter indetermining harmonic levels.
It is probably too early to reach any general conclusions from these preliminary results.More exhaustive studies are needed to explore other system configurations and conditions. Moreadvanced power plant models that include more circuit detail and representations of sensitivecontrol/protective equipment would be needed. This must be accompanied by actual data onswitchyard transmission system inter-connections at the plant, and in-plant distribution systemconfigurations and components. In addition to the mostly steady-state harmonic analysisperformed so far, future investigations should also include simulations of transient conditionsoccurring during GIC events. Further studies are also needed to determine the possibility of GIC-induced equipment interactions at the low voltage busses.
REFERENCES
[1] Cleveland, F., Malcom, W., Nordell, D. E. and Zirker, J., "Solar Effects onCommunications," Geomagnetic Storm Cycle 22: Power System Problems on the Horizon,Special Panel Session Report, IEEE, 90TH0357-4 PWR.
[2] Joselyn, J. A., "Real-Time Prediction of Global Geomagnetic Activity," Solar Wind-Magnetosphere Coupling. Terra Scientific Publishing Company, Tokyo, 1986, pp. 127-141.
[3] Baich, C. C , "Real-Time Monitoring and Predicting of Geomagnetic Activity," Effects ofSolar-Geomagnetic Disturbances on Power Systems, Special Panel Session Report, IEEE,90TH0291-5 PWR.
[4] Albertson, V. D., "Geomagnetic Disturbance Causes and Power System Effects", Effects ofSolar-Geomagnetic Disturbances on Power Systems, Special Panel Session Report, IEEE,90TH0291-5 PWR, 1989.
[5] Larose, D., "The Hydro-Quebec System Blackout of March 13, 1989," Effects of Solar-Geomagnetic Disturbances on Power Systems, Special Panel Session Report, IEEE, 90TH0291-5PWR.
[6] Kappenman, J. G., "Transformer DC Excitation Field Test and Results," IEEE SpecialPublication - Effects of Solar Geomagnetic Disturbances on Power Systems. 90TH0291-5, pp.14-22.
[7] Gattens, P. R., Waggel, R. M. , Girgis, R., Nevins, R., " Investigation of TransformerOverheating Due to Solar Magnetic Disturbance," Presented at Geomagnetic Disturbance PanelSession at 1989 IEEE Summer Power Meeting, July 1989.
[8] Electrical Transmission and Distribution Reference Book. Westinghouse Electric Corp., 4thed., Pittsburgh, PA, 1964.
[9] Transmission Line Reference Book f345 kV and Abovei. Electric Power Research Institute,2nd ed., Palo Alto, CA, 1982.
DISCLAIMER
This report was prepared as an account of work sponsored by an agency of the United SlatesGovernment. Neither the United States Government nor any agency thereof, nor any of theiremployees, makes any warranty, express or implied, or assumes any legal liability or responsi-bility for the accuracy, completeness, or usefulness of any information, apparatus, product, orprocess disclosed, or represents that its use would not infringe privately owned rights. Refer-ence herein to any specific commercial product, process, or service by trade name, trademark,manufacturer, or otherwise does not necessarily constitute or imply its endorsement, recom-mendation, or favoring by the United States Government or any agency thereof. The viewsand opinions of authors expresied herein do not necessarily state or reflect those of theUnited States Government or any agency thereof.
25kV
'E25G25
T1
•n-345kV 345kV
L345
~i,EIGIC
OHUne
aiOn
R345 Jr7Y115
115kV
T3Y>Y
13.8W B001
If I NO."M i 2on 'RTD frht
B003 13.8kV
LRFPC IRFPBPM003 T
30MVA HI03
B013 4160V
ooo
tL003 1 6n
1
10,500 OHP °
6MVA
RT13
BUSD 4160V
T5
B015 4160V
4100HP T015
600V
600V B600
BUS 6
B120N
4200HP
535kVA T8
B120E
270kVA
15kVA
lOkVA
Figure 1. EMTP Simulation Model
Fig. 2. Step-up transformer magnetizing currents during normal operation with100 A GIC.
FREQUENCY SPECTRUMStep-up Transformer Magnetizing Current
100
90
co
•a
3
C«U
II
0 1 2 3 4 5 6 7 8 9 10 11 12 13 U 15 16 17 18 19Harmonic Number
Fig. 3. Frequency spectrum of generator step-up transformer magnetizing current.

i»
* • •
• •
•»
•10*
-i«a
•
W VxnlMM M M
/ wFigure 4. Normal and emergency system voltages at 120 V busses duringnormal operation with 100 A GIC.
to
9
8
I 7
I •S 5
t 2
FREQUENCY SPECTRUM120 V Emergency System Voltage
-
3.08 % THD
•. 11 ll . • - !
0 1 2 3 4 5 6 7 8 9 10 1 1 1 2 13 14 15 16 17 18 19Harmonic Number
Figure 5. Frequency spectrum of 120 V emergency system voltage.

Onsite Loadsand Transformers
GICHarmonic Source
Of/siteTransmission Line
Figure 6. Simple model for distribution of GlC-induced harmonics betweenpower station and transmission system.
I3oL
TOTAL HARMONIC VOLTAGE DISTORTIONFor Different G/C Levels
A
14
C
/ ,
/ / /
V
* ., Generc• .
_____R«s»rv
ip II UII3I Ul 1 Ml
tor' - —
i transform*1 •—-i
120 V «mer
f
ency bus
I
]
0 100 200 300 400 500Transformer DC Neutral Current (GIC)
Figure 7. Comparison of THD for different GIC levels.
600
Figure 8. Reserve station service transformer magnetizing currents duringnormal operation with 100 A GIC and separate 1 IS kV line.
FREQUENCY SPECTRUMReserve Transformer Magnetizing Current
100
90
80
70
60
SO
40
30
20
to
0
1Illll . . .
0 1 2 3 4 5 6 7 8 9 10 1112 13 14 15 16 17 18 19Harmonic Number
Figure 9. Frequency spectrum of the magnetizing current in the reservestation service transformer, with separate 115 kV line.
MMflMC tTAIKM MtMCC TfWNtMMWR VOLTAOCI (4.1* KV WW
Figure 10. Reserve station service transformer voltages on 4.16 kV sideduring normal operation with separate 115 kV line.
-
m
FREQUENCY SPECTRUMReserve Transformer Voltage (4.16 kV)
8.93 % THO
•
1 1 I 1ll II II 1. 1 _0 1 2 3 4 5 6 7 8 9 10 11 12 13 U 15 16 17 18 19
Harmonic Number
Figure 11. Frequency spectrum of A-phase reserve station servicetransformer voltage on 4.16 kV side, with separate 115 kV line.

Figure 12. Normal and emergency system voltages at 120 V buses duringnormal operation with separate 115 kV line.
FREQUENCY SPECTRUM120 V Emergency System Voltage
8.23 % THO
•11 ll 1 1ll.ll.ll I. l . _
0 1 2 3 4 5 6 7 8 9 10 11 1 2 13 U 15 16 17 18 19Harmonic Number
Figure 13. Frequency spectrum of 120 V emergency system voltage, withseparate 115 kV line to reserve station service transformer.
HOimM.*Momiinnmirtftzntivci.jAan(taav»i»m)
HOAOIC,!.
Figure 14. Normal and emergency system voltages at 120 V buses duringstartup mode with SO A GIC and remote source impedance.
FREQUENCY SPECTRUM120 V Emergency System Voltag.
I 7
3 5
m
4.41 % THD
111 1 11 1 . l l - l - _ _ _0 1 2 3 4 5 6 7 8 9 10 11 12 13 14 15 16 17 18 19
Harmonic Number
Figure 15. Frequency spectrum of 120 V emergency system voltage, duringstart-up mode.

9 11 13 15 17
HARMONIC NUMBER
21
Figure 16. Transmission line impedance function for normal stationconfiguration and nominal system parameters.
40T
30
1 3 5 7 9 11 13 15 17 19 21
Figure 17. Transmission line impedance functions for station with separate115 kV service and nominal system parameters.
60
45
30
15
1 . 3 5 11 13 15 17 "i9 21
HARMONIC NUMBER
Figure 18. Transmission line impedance function for station start-up modewith nominal system parameters.
1 0 T
1 3 5 9 11 13 15 17 19 21
HARMONIC NUMBER
Figure 19. Transmission line impedance function for normal stationconfiguration with 49.07 mile line.