
Strong Kleinman Forbidden Second Harmonic Generation in ...
16
Supporting Information S1 Strong Kleinman Forbidden Second Harmonic Generation in Chiral Sulfide: La 4 InSbS 9 Hua-Jun Zhao, Yong-Fan Zhang, Ling Chen * Synthesis. The elements were used as purchased and stored in a nitrogen-filled glovebox (moisture and oxygen level is less than 0.1 ppm), and all manipulations were performed inside the glovebox. La (99.99%), Pr (99.5%), and Nd (99.5%) were purchased from Huhhot Jinrui Rare Earth Co., Ltd. S (99.999%) was purchased from Alfa Aesar China (Tianjin) Co., Ltd. Sb (99.99%) and In (99.999%) were purchased from Sinopharm Chemical Reagent Co., Ltd. All reactants in evacuated fused-silica tubes were placed in resistance furnaces with controlled temperature. The stoichiometric mixture of Ln, In, Sb, S were weighed accordingly with an overall loading of about 300 mg and loaded into a silica tube, which was evacuated and sealed. The sample were heated to 950 °C in 24 h and kept at that temperature for 4 days, subsequently cooled at 2.5 °C/h to 200°C before the furnace was turned off. The yellow block crystals were picked for single crystal diffraction studies, which yielded a formula of Ln 4 InSbS 9 . The EDX results on such crystals confirmed the presence of Ln, In, Sb, and S with a molar ratio around 3.2(1):1.1(1):1.1(1):10.7(5). No other element, such as Si from the reaction container, was found (Figure S1). The homogeneity of the samples was confirmed by XRD analyses (Figure S2–4). No corrosion on the silica tubing in any case was observed and all compounds were stable in air for about one year.
-
Upload
khangminh22 -
Category
Documents
-
view
0 -
download
0
Transcript of Strong Kleinman Forbidden Second Harmonic Generation in ...

Supporting Information
S1
Strong Kleinman Forbidden Second Harmonic
Generation in Chiral Sulfide: La4InSbS9
Hua-Jun Zhao, Yong-Fan Zhang, Ling Chen*
Synthesis. The elements were used as purchased and stored in a nitrogen-filled
glovebox (moisture and oxygen level is less than 0.1 ppm), and all manipulations
were performed inside the glovebox. La (99.99%), Pr (99.5%), and Nd (99.5%) were
purchased from Huhhot Jinrui Rare Earth Co., Ltd. S (99.999%) was purchased from
Alfa Aesar China (Tianjin) Co., Ltd. Sb (99.99%) and In (99.999%) were purchased
from Sinopharm Chemical Reagent Co., Ltd. All reactants in evacuated fused-silica
tubes were placed in resistance furnaces with controlled temperature.
The stoichiometric mixture of Ln, In, Sb, S were weighed accordingly with an
overall loading of about 300 mg and loaded into a silica tube, which was evacuated
and sealed. The sample were heated to 950 °C in 24 h and kept at that temperature for
4 days, subsequently cooled at 2.5 °C/h to 200°C before the furnace was turned off.
The yellow block crystals were picked for single crystal diffraction studies, which
yielded a formula of Ln4InSbS9. The EDX results on such crystals confirmed the
presence of Ln, In, Sb, and S with a molar ratio around 3.2(1):1.1(1):1.1(1):10.7(5).
No other element, such as Si from the reaction container, was found (Figure S1). The
homogeneity of the samples was confirmed by XRD analyses (Figure S2–4). No
corrosion on the silica tubing in any case was observed and all compounds were stable
in air for about one year.

Supporting Information
S2
Figure S1. The EDX spectrum of Pr4InSbS9
Point-1 Point-2
Point-3 Point-4
Element Weight% Atomic% Formula
S K 32.77 66.65 10.43
In L 13.03 7.40 1.16
Sb L 11.93 6.39 1.00
Pr L 42.27 19.57 3.06
Totals 100.00
Average formula: Pr3.2(1)In1.1 (1)Sb1.1(1)S10.7(5)
Element Weight% Atomic% Formula
S K 33.49 67.49 11.23
In L 10.68 6.01 1.00
Sb L 12.62 6.70 1.11
Pr L 43.20 19.81 3.30
Totals 100.00
Element Weight% Atomic% Formula
S K 33.98 67.94 11.04
In L 11.44 6.39 1.04
Sb L 11.68 6.15 1.00
Pr L 42.90 19.52 3.17
Totals 100.00
Element Weight% Atomic% Formula
S K 31.59 65.53 10.22
In L 11.06 6.41 1.00
Sb L 13.17 7.20 1.12
Pr L 44.18 20.86 3.25
Totals 100.00

Supporting Information
S3
Figure S2. The experimental and simulated X-ray powder diffraction patterns of La4InSbS9.
Figure S3. The experimental and simulated X-ray powder diffraction patterns of Pr4InSbS9.
Figure S4. The experimental and simulated X-ray powder diffraction patterns of Nd4InSbS9.

Supporting Information
S4
Crystal Structure Determinations. Data collections were performed on either a
Rigaku Saturn70 CCD or a Rigaku Mercury CCD equipped with
graphite-monochromated Mo Kα radiation (λ = 0.71073 Å) at 293 K. The data were
corrected for Lorentz and polarization factors. Absorption corrections were performed
by the multiscan method.1 All structure were solved by the direct methods and refined
by full-matrix least-squares fitting on F2 by SHELX-97.2 All atoms were refined with
anisotropic thermal parameters. All positions were fully occupied. Crystallographic
data and structural refinement details are summarized in Table S1 (the structure of
La4InSbS9 was solved in the P41212 group, and the others in P43212 group, but this
did not preclude the existence of the enantiomorph in one sample). The positional
coordinates and isotropic equivalent thermal parameters are given in Table S2, and
important bond distances are listed in Table S3.

Supporting Information
S5
Table S1. Crystallographic Data and Refinement Details for Ln4InSbS9 (Ln = La, Pr, Nd).
Formula La4InSbS9 Pr4InSbS9 Nd4InSbS9
Fw 1080.75 1088.85 1102.17
Crystal system tetragonal tetragonal tetragonal
Crystal color yellow yellow yellow
Z 8 8 8
Space group P41212 (No. 92) P43212 (No. 96) P43212 (No. 96)
a (Å) 10.2728(2) 10.105(2) 10.0722(1)
c (Å) 28.313(1) 27.907(6) 27.830(1)
V (Å3) 2987.9(2) 2849.1(9) 2823.2(1)
F(000) 3776 3840 3872
Dc (g cm–3) 4.805 5.076 5.343
µ (mm-1) 15.701 18.149 19.857
2θmax (deg.) 54.96 54.96 54.94
GOOF on F2 1.192 0.988 1.119
R1, wR2 (I > 2σ(I)) a 0.0211, 0.0347 0.0178, 0.0336 0.0371, 0.0631
R1, wR2 (all data) 0.0218, 0.0349 0.0187, 0.0349 0.0419, 0.0651
Flack parameter 0.03(2) 0.05(1) -0.02(3)
diff peak, hole (e. Å-3) 0.722, -0.932 0.827, -0.803 1.498, -1.476
a R1 = Σ||Fo| - |Fc||/Σ|Fo|, wR2 = [Σw(Fo2 - Fc
2)2/Σw(Fo2)2]1/2

Supporting Information
S6
Table S2. Atomic coordinates and equivalent isotropic displacement parameters of Ln4InSbS9 (Ln = La, Pr, Nd).
atom symmetry x y z U(eq)
La4InSbS9
La1 8b 0.22412(3) 0.44032(3) 0.08836(1) 0.01084(7)
La2 8b 0.48962(4) 0.14819(3) 0.05238(1) 0.01122(7)
La3 8b 0.49702(4) 0.26817(3) 0.19911(1) 0.01219(7)
La4 8b 0.05579(3) 0.27104(3) 0.34180(1) 0.01057(7)
In1 8b 0.01288(4) 0.20343(4) 0.20281(1) 0.01333(9)
Sb1 8b 0.36137(4) 0.49277(5) 0.30584(2) 0.0233(1)
S1 8b 0.3238(1) 0.4926(2) 0.21166(5) 0.0155(3)
S2 8b 0.0170(2) 0.1857(1) 0.44991(5) 0.0135(3)
S3 8b 0.0054(1) 0.0141(1) 0.14780(4) 0.0149(3)
S4 8b 0.0021(2) 0.3942(1) 0.15127(4) 0.0116(3)
S5 4a 0.6893(2) 0.6893(2) 0.0000 0.0336(7)
S6 8b 0.2056(2) 0.1941(2) 0.25351(5) 0.0166(4)
S7 8b 0.0037(1) 0.4969(1) 0.28184(4) 0.0110(2)
S8 8b 0.2975(2) 0.1757(2) 0.37639(5) 0.0118(3)
S9 8b 0.3105(2) 0.2013(2) 0.12748(5) 0.0116(3)
S10 4a 0.3166(2) 0.3166(2) 0.0000 0.0153(5)
Pr4InSbS9
Pr1 8b 0.43971(3) 0.22393(3) 0.08825(1) 0.00660(7)
Pr2 8b 0.48941(3) 0.14961(3) –0.052697(9) 0.00701(6)
Pr3 8b 0.76724(3) 0.00218(3) 0.050635(9) 0.00795(6)
Pr4 8b 0.44370(3) –0.22829(3) 0.09229(1) 0.00696(7)
In1 8b 0.20339(4) 0.01347(4) 0.20316(1) 0.00797(8)
Sb1 8b 0.64079(4) 0.50859(4) 0.19454(1) 0.01157(8)
S1 8b 0.6770(1) 0.5094(2) 0.28825(4) 0.0090(3)
S2 8b 0.4805(1) –0.3124(1) 0.20009(4) 0.0082(3)
S3 8b 0.5104(1) 0.4945(1) 0.10178(4) 0.0085(2)
S4 8b 0.3970(1) 0.0031(2) 0.15097(4) 0.0069(2)
S5 4a 0.1926(2) –0.1926(2) 0.2500 0.0266(6)
S6 8b 0.2936(2) –0.3028(2) 0.00549(5) 0.0096(3)
S7 8b 0.4964(1) –0.0016(1) 0.03151(4) 0.0071(2)
S8 8b 0.2018(2) –0.3241(1) 0.12667(4) 0.0077(3)
S9 8b 0.2013(2) 0.3104(1) 0.12804(4) 0.0070(3)
S10 4a 0.3166(2) 0.3166(2) 0.0000 0.0096(4)
Nd4InSbS9
Nd1 8b 0.55967(7) 0.77561(6) 0.08828(2) 0.0126(1)
Nd2 8b 0.51027(7) 0.84942(6) –0.05276(2) 0.0134(1)
Nd3 8b 0.23302(6) 0.99840(7) 0.05068(2) 0.0143(1)
Nd4 8b 0.55620(7) 1.22772(6) 0.09243(2) 0.0129(1)

Supporting Information
S7
In1 8b 0.79569(8) 0.98705(9) 0.20315(3) 0.0152(2)
Sb1 8b –0.14136(8) 1.0093(1) 0.05544(3) 0.0215(2)
S1 8b 0.0099(3) 0.8229(3) 0.0388(1) 0.0167(6)
S2 8b 0.5200(3) 1.3120(3) 0.2004(1) 0.0134(6)
S3 8b 0.4904(3) 0.5047(3) 0.10105(9) 0.0166(5)
S4 8b 0.6021(2) 0.9964(3) 0.1510(1) 0.0123(5)
S5 4a 0.8070(4) 1.1930(4) 0.2500 0.042(2)
S6 8b 0.7066(3) 1.3025(3) 0.0058(1) 0.0167(7)
S7 8b 0.5033(3) 1.0010(3) 0.03145(9) 0.0126(5)
S8 8b 0.7985(3) 1.3234(3) 0.1265(1) 0.0125(6)
S9 8b 0.7981(3) 0.6899(3) 0.1280(1) 0.0120(6)
S10 4a 0.6835(3) 0.6835(3) 0.0000 0.0153(9)
S7, S8, S9, and S10 are the discrete atoms.
Table S3. Selected bond lengths (Å) of Ln4InSbS9 (Ln = La, Pr, Nd)
La4InSbS9 Pr4InSbS9 Nd4InSbS9
La1–S9 2.838(2) 2.794(2) 2.780(3)
La1–S9 2.872(2) 2.827(2) 2.819(3)
La1–S7 2.889(1) 2.834(1) 2.824(3)
La1–S3 2.908(2) 2.850(1) 2.839(3)
La1–S4 2.934(2) 2.869(2) 2.859(3)
La1–S10 2.9624(4) 2.9136(6) 2.9073(7)
La2–S7 2.848(1) 2.804(1) 2.798(3)
La2–S9 2.865(2) 2.823(1) 2.814(3)
La2–S10 2.8898(3) 2.8387(5) 2.8271(7)
La2–S8 2.891(2) 2.845(1) 2.829(3)
La2–S4 2.923(1) 2.863(1) 2.853(3)
La2–S6 2.930(2) 2.875(2) 2.857(3)
La3–S8 2.840(2) 2.792(1) 2.788(3)
La3–S7 2.845(1) 2.789(1) 2.775(3)
La3–S9 2.874(2) 2.828(1) 2.823(3)
La3–S2 2.906(1) 2.852(1) 2.839(3)
La3–S1 2.934(2) 2.888(2) 2.879(3)
La3–S2 2.939(2) 2.885(2) 2.872(3)
La4–S8 2.843(2) 2.799(2) 2.785(3)
La4–S8 2.857(2) 2.799(2) 2.789(3)
La4–S7 2.925(1) 2.900(1) 2.895(3)
La4–S3 2.943(2) 2.894(2) 2.877(3)

Supporting Information
S8
La4–S4 2.955(2) 2.894(2) 2.880(3)
La4–S6 3.040(2) 2.956(2) 2.947(3)
La4–S2 3.210(1) 3.149(1) 3.141(3)
In1–S4 2.446(1) 2.438(2) 2.433(3)
In1–S6 2.447(2) 2.441(1) 2.439(3)
In1–S5 2.474(2) 2.461(2) 2.453(3)
In1–S3 2.494(1) 2.483(1) 2.476(3)
Sb1–S2 2.438(2) 2.434(2) 2.431(3)
Sb1–S1 2.461(2) 2.460(2) 2.461(3)
Sb1–S1 2.695(1) 2.641(1) 2.646(3)
Sb1–S3 2.905(1) 2.909(1) 2.924(3)
X-ray Powder Diffraction. XRD pattern were collected on a Rigaku DMAX
2500 diffractometer. The measured XRD patterns are in good agreement with the ones
simulated from crystal structure data (Figure S2–4).
Elemental analysis. The elemental analyses of Ln, In, Sb, S have been examined
with the aid of a fieldemission scanning electron microscope (FESEM, JSM6700F)
equipped with an energy dispersive X-ray spectroscope (EDX, Oxford INCA).
Magnetic Susceptibility. The dc magnetic susceptibility measurements were
performed on a Quantum Design PPMS-9T magnetometer in the temperature range of
2–300K. The X-ray pure polycrystalline samples were ground to a fine power to
minimize possible anisotropic effects and loaded into a gelatin capsule. The data were
corrected for the susceptibility of container and for the diamagnetic contribution from
the ion core. The susceptibility data in the temperature range 60–300 K were fit by a
least-squares method to the Curie–Weiss equation χM = C/(T – θ),where χM is the
magnetic susceptibility, C is the Curie constant and θ is the Weiss constant. The
effective magnetic moment (µeff) was calculated from the equation µeff = (7.997C)1/2

Supporting Information
S9
µB.3
UV/Vis/NIR Diffuse Reflectance Spectroscopy. The optical diffuse reflectance
spectrum of powdered samples were measured at room temperature using a
Perkin-Elmer Lambda 900 UV-vis spectrophotometer equipped with an integrating
sphere attachment and BaSO4 as a reference. The absorption spectrum was calculated
from the reflection spectrum via the Kubelka-Munk function: α/S = (1 – R)2/2R, in
which α is the absorption coefficient, S is the scattering coefficient, and R is the
reflectance.4
Infrared Spectroscopy. IR spectra was recorded by using a Magna 750 FTIR
spectrometer with samples as KBr pellets in the range of 4000–400 cm-1.
SHG Measurements. Powder Second harmonic generation (SHG) was measured
by using the Kurtz and Perry method with a 2.05 µm Q-switch laser.5 The samples
were carefully ground and sieved into five distinct particle size ranges (30–46, 46–74,
74–106, 106–150, and 150–210 µm). The SHG effects of compounds sieved with
70–100 meshes (≈150–210 µm) were measured with the same graded powdery
AgGaS2 as a reference.
The thermogravimetric analysis. Thermogravimetric analyses (TGA) were
carried out with a NETZSCH STA 449C unit at a heating rate of 10 °C/min under a
nitrogen atmosphere. In order to check the thermal stability in details, we loaded the
sample of La4InSbS9 into silica tube, which was evacuated and sealed. The sample
was heated to 750, 800, and 900 °C, respectively, and kept at that temperature for 10
hrs. Serious XRD analyses indicated the sample heated at 750 °C was still single

Supporting Information
S10
phased La4InSbS9; that heated at 800 °C contained minor binary La2S3 as impurity,
and that at 900 °C, contained considerable binary La2S3 impurity (about 50 %).
(Figure S11). These data were consistent with the TG analysis.
Calculations of electronic structures and static SHG coefficients.
First-principles calculations based on density functional theory (DFT) were carried
out utilizing the Vienna ab initio simulation package (VASP) and the projected
augmented wave (PAW) method.6–8 The generalized gradient approximation
Perdew-Burke-Ernzerh of (PBE)9 exchange-correlation functional was employed. The
kinetic cutoff energy for the plane-wave expansion was set to 280 eV, and more than
1000 empty energy bands were involved in the calculations. Tests for the
Monkhorst-Pack k-point mesh were carried out, and the results indicated that a (3 × 3
× 3) sampling k mesh was enough to ensure the convergence of the second harmonic
generation (SHG) coefficients of La4InSbS9 crystal. Ab initio molecular dynamic
(MD) simulations using the Nosé algorithm10 were performed to obtain possible
structures of La4InSbS9, considering the effects of nuclei vibrations. The MD
simulation was carried out with a low-energy cutoff (194 eV) and one k point (namely,
Γ point); the simulation length was 10 ps with time step of 1 fs at the temperature of
300 K. After simulation time was longer than 7 ps, eleven typical configurations were
chosen to study the variation of SHG coefficients.
In this work, the SHG coefficients were determined by using the so-called
length-gauge formalism derived by Aversa and Sipe.11, 12 At a zero-frequency limit,
the second-order nonlinear susceptibility ),,2( ωωωχ −abc can be expressed as:

Supporting Information
S11
+++=− ∑ ][}{1
),,2( ln, ln
lnnmlmmln
knml mlnm
cb
ml
a
nmabcfff
rrr
Vωωω
ωωωωωωχ
∑ +++++knm
b
amn
a
bmn
c
nm
c
amn
a
cmn
b
nm
c
bmn
b
cmn
a
nm
mn
nm rrrrrrrrrf
V
i
,;;;;;;2
)]()()([4 ω
in which r is the position operator, mnnm ωωω hhh −= is the energy difference
between bands m and n, mnnm fff −= is the difference of the Fermi distribution
functions, V is the unit cell volume, and b
amnr ; is the so-called generalized derivative
of the coordinate operator in k space.
∑ −+∆+∆
=l
a
lm
b
nlnl
b
lm
a
nllm
nmnm
a
mn
b
nm
b
mn
a
nmb
amn rrrrirr
r )(; ωωωω
Figure S5. (a) The helical chain of [In2Sb2S1110–]∞ in La4InSbS9 (b) NCS chain of
[Ga2Sb2S1110–]∞ in Sm4GaSbS9. Pink, In; sky blue, Ga; Orange, Sb; Yellow, S.

Supporting Information
S12
Table S4. The calculated second-order nonlinear optical susceptibilities (pm/V) based on the 11 typical ab initio molecular dynamic simulated configurations of La4InSbS9 at 300 K.
Figure S6. Inverse magnetic susceptibility plotted against temperature for Pr4InSbS9 and Nd4InSbS9.
Eg d11 d12/
d26
d13/
d35
d14/
d25/
d36
d15/
d31
d16/
d21 d22
d23/
d34
d24/
d32 d33
1 2.0500 –2.61 –0.63 0.29 1.29 1.77 –1.29 –14.95 –6.73 –1.46 –7.81
2 2.0460 –13.47 –1.64 –5.58 1.48 2.68 0.91 –8.36 –0.18 –4.15 18.94
3 2.0343 –1.30 0.58 2.00 –0.04 2.48 2.55 0.20 2.47 –1.57 9.30
4 1.8769 –21.17 –3.11 –12.90 –2.38 4.56 4.32 –14.80 –3.34 –0.01 14.27
5 2.0291 –9.00 –3.94 –5.05 0.37 –1.10 4.02 –8.05 –4.42 5.26 17.31
6 1.9891 10.12 10.00 –3.50 2.31 –2.38 –2.12 –0.96 –4.53 –13.98 –3.51
7 1.9107 –6.96 1.01 –2.52 –4.56 –1.94 –1.49 1.49 –1.27 3.39 –20.47
8 1.7041 12.11 3.82 16.06 0.87 8.51 0.70 0.26 –1.12 8.35 –18.85
9 1.6605 –3.45 –6.25 –3.45 3.35 1.09 3.79 4.56 –7.42 7.45 –2.64
10 1.7926 11.53 6.31 9.23 0.30 3.28 –11.17 –0.19 4.82 –4.76 7.80
11 1.7608 13.29 5.01 –0.78 –1.27 –6.37 –4.09 20.73 6.89 –10.78 24.37

Supporting Information
S13
Figure S7. UV/Vis/NIR diffuse reflectance of (a) Pr4InSbS9, (b) Nd4InSbS9.
Figure S8. Transmittance curves of the powder AgGaS2 in the IR region and UV/Vis/NIR reflection spectrum (inset panel).
Supporting Information
S14
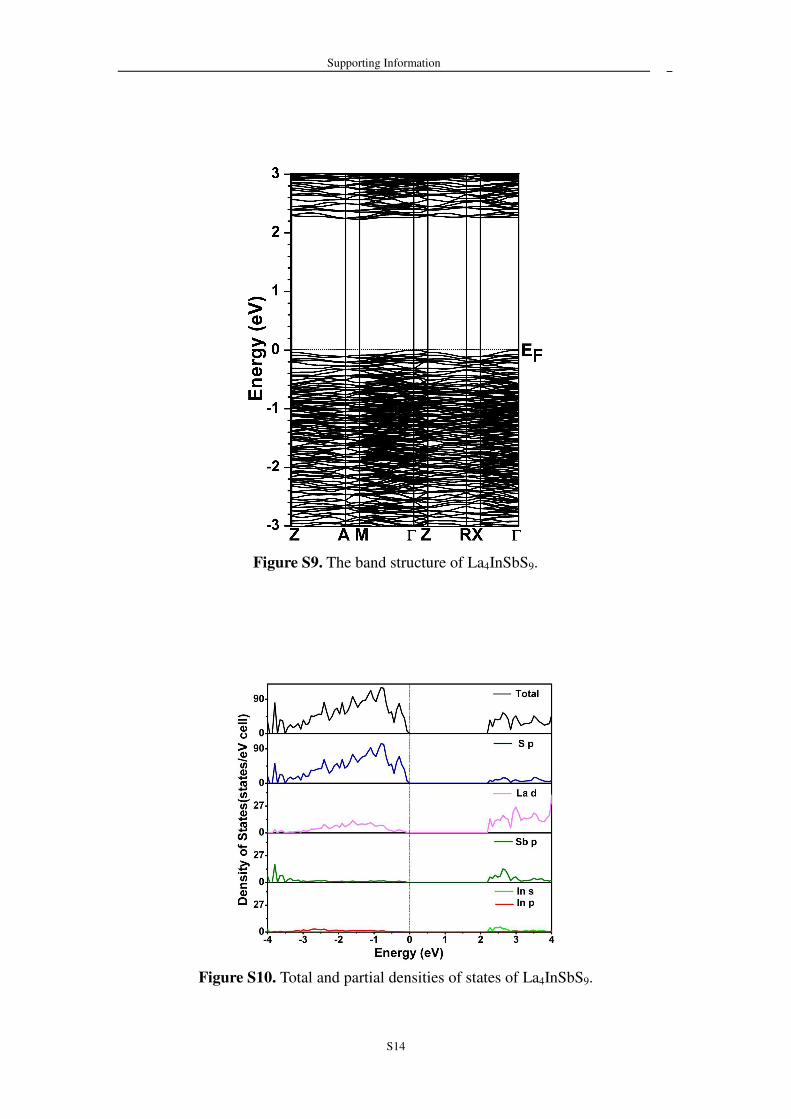
Figure S9. The band structure of La4InSbS9.
Figure S10. Total and partial densities of states of La4InSbS9.

Supporting Information
S15
Figure S11. The X-ray powder diffraction patterns of sample of La4InSbS9 heated at various temperatures and the simulated one. Arrows indicate the decomposed product.

Supporting Information
S16
Reference.
1. CrystalClear, version 1.3.5; Rigaku Corp.: The Woodlands, TX, 1999.
2. Sheldrick, G. M. SHELXTL, version 5.1; Bruker-AXS: Madison, WI, 1998.
3. O’Connor, C. J. Prog. Inorg. Chem. 1982, 29, 203.
4. Kortüm, G. Reflectance Spectroscopy; Springer-Verlag: New York, 1969.
5. Kurtz, S. K.; Perry, T. T. Appl. Phys. 1968, 39, 3798.
6. Blöchl, O. E. Phys. Rev. B 1994, 50, 17953.
7. Kresse, G.; Furthmuller, J. J. Phys. Rev. B 1996, 54, 11169.
8. Kresse, G.; Furthmuller, J. Comput. Mater. Sci. 1996, 6, 15.
9. Perdew, J. P.; Chevary, J. A.; Vosko, S. H.; Jackson, K. A.; Pederson, M. R.;
Singh, D. J.; Fiolhais, C. Phys. Rev. B 1992, 46, 6671.
10. Nosé, S. J. Chem. Phys. 1984, 81, 511.
11. Rashkeev, S. N.; Lambrecht, W. R. L.; Segall, B. Phys. Rev. B 1998, 57,
3905.
12. Aversa, C.; Sipe, J. E. Phys. Rev. B 1995, 52, 14636.