Integrating ArcGIS and ArcPAD in an Archaeological Field School
14
Integrating ArcGIS and ArcPAD in an Archaeological Field School Gary L. Christopherson, Paul R. Fish, Suzanne K. Fish, John F. Chamblee, Phillip O. Leckman: The University of Arizona, Center for Applied Spatial Analysis, Arizona State Museum Abstract In the spring of 2005, the University of Arizona’s Archaeological Field School began a new project at Tumamoc Hill in Tucson, Arizona. This project was designed to incorporate spatial technologies as part of the learning experience for undergraduate students with no GIS experience. In addition to basic excavation skills, they were taught to collect spatial data using a total station and GPS, and to incorporate these data in a geodatabase. Combined with readily available high resolution DEMs and DOQQs, they used these data to create a base map of Tumamoc Hill, surface archaeological remains, and excavation data. These base maps were then used for community outreach, statistical analysis, site reports, and articles. It is the hope of the authors that this process will spark interest in spatial technologies in the next generation of archaeologists. This paper reports on the methodology used, the results of the work, and the initial analyses. Introduction The University of Arizona traditionally operates two archaeological field schools each year. In addition to the traditional field school offered at higher, cooler elevations during the summer, the spring format exposes University of Arizona students and participants from other universities to intensive field research in the Tucson area as part of their normal semester schedule. During the spring semester of 2005, the field school introduced training in mapping and spatial analysis in addition to the more traditional fare of excavation, analysis, and report writing. The 2005 spring Field School was a collaboration between the Arizona State Museum, the Department of Anthropology, and the Center for Applied Spatial Analysis (CASA). The directors were Paul Fish and Suzanne Fish, from the Arizona State Museum, and Gary Christopherson from CASA. The goals were to build on existing, long-term interdisciplinary research on the Hohokam in the Tucson Basin, emphasizing: 1) Landuse and landscape as the interface between societies and their environments; 2) societal institutions for the organization of population and territory; and 3) the development of a spatial database that could be used for both management and analysis of the archaeological material. To reach these goals, and to provide students with a variety of field situations, investigations were conducted at three locations, Tumamoc Hill, the Marana Mound site, and University Indian
Transcript of Integrating ArcGIS and ArcPAD in an Archaeological Field School

Integrating ArcGIS and ArcPAD in an Archaeological Field School
Gary L. Christopherson, Paul R. Fish, Suzanne K. Fish, John F. Chamblee, Phillip O. Leckman: The University of Arizona, Center for Applied Spatial Analysis, Arizona State Museum
Abstract
In the spring of 2005, the University of Arizona’s Archaeological Field School began a new project at Tumamoc Hill in Tucson, Arizona. This project was designed to incorporate spatial technologies as part of the learning experience for undergraduate students with no GIS experience. In addition to basic excavation skills, they were taught to collect spatial data using a total station and GPS, and to incorporate these data in a geodatabase. Combined with readily available high resolution DEMs and DOQQs, they used these data to create a base map of Tumamoc Hill, surface archaeological remains, and excavation data. These base maps were then used for community outreach, statistical analysis, site reports, and articles. It is the hope of the authors that this process will spark interest in spatial technologies in the next generation of archaeologists. This paper reports on the methodology used, the results of the work, and the initial analyses.
Introduction
The University of Arizona traditionally operates two archaeological field schools each year. In addition to the traditional field school offered at higher, cooler elevations during the summer, the spring format exposes University of Arizona students and participants from other universities to intensive field research in the Tucson area as part of their normal semester schedule. During the spring semester of 2005, the field school introduced training in mapping and spatial analysis in addition to the more traditional fare of excavation, analysis, and report writing.
The 2005 spring Field School was a collaboration between the Arizona State Museum, the Department of Anthropology, and the Center for Applied Spatial Analysis (CASA). The directors were Paul Fish and Suzanne Fish, from the Arizona State Museum, and Gary Christopherson from CASA. The goals were to build on existing, long-term interdisciplinary research on the Hohokam in the Tucson Basin, emphasizing: 1) Landuse and landscape as the interface between societies and their environments; 2) societal institutions for the organization of population and territory; and 3) the development of a spatial database that could be used for both management and analysis of the archaeological material. To reach these goals, and to provide students with a variety of field situations, investigations were conducted at three locations, Tumamoc Hill, the Marana Mound site, and University Indian

Ruin, representing a span from very early to very late in the Hohokam archaeological sequence, as well as three distinct environmental settings.
This paper concentrates on the development of the spatial database at Tumamoc Hill, a unique hilltop site occupied during the Early Agricultural (500 B.C. to A.D. 1) and Early Ceramic Tortolita phase (A.D. 400 to 600) time periods (Fish et al. 1986; Wallace et al. forthcoming; Wilcox and Larson 1979). In the following pages, we will discuss the landscape and history of Tumamoc Hill, data collection technologies and methodologies, results of the project, and future directions for research at Tumamoc Hill.
Tumamoc Hill
A prominent Tucson landmark, Tumamoc Hill has one of the most extensive prehispanic settlements with masonry architecture (cerros de trincheras) in southern Arizona. This flat-topped peak rises 700 ft above the Santa Cruz floodplain in central Tucson. Stone constructions concentrated on the summit and upper slopes include massive encircling walls and terraces, an elaborate trail system, smaller
terraces, structures, and an extensive array of petroglyphs. Since Spanish colonial times, trincheras sites such as Tumamoc Hill have spurred public and scholarly interest. Many have favored a defensive motivation for the massive terraces and walls, while others have posited agricultural, ceremonial, and signaling functions. Proponents on all sides of these debates have cited Tumamoc Hill in their arguments.
Terraces and walls were constructed by early inhabitants of the area between 500 and 300 B.C., before the beginning of extensive pottery use. These represent the earliest known public constructions in Arizona, that is structures large enough to require communal labor for building. Several centuries later in the Tortolita phase (A.D. 400-500), the summit was the location of one of the largest villages in the Tucson Basin with more than 100 pit houses. Residents built circular houses with domed superstructures of desert willow poles, woven brush, and packed hearth.
More recently, Tumamoc Hill has been utilized as a source of volcanic rock, a destination for antiquity hounds, and a home for a variety of university experiments and communication towers. In the early 20th century, the volcanic rock on Tumamoc Hill was mined for construction projects in Tucson. A number of houses in the West University neighborhood used this rock and there are long walls of Tumamoc volcanic rock in the older parts of the University campus. The antiquities on the hill have also lured interested explorers and
Figure 1: Tumamoc Hill with Tucson in the background.
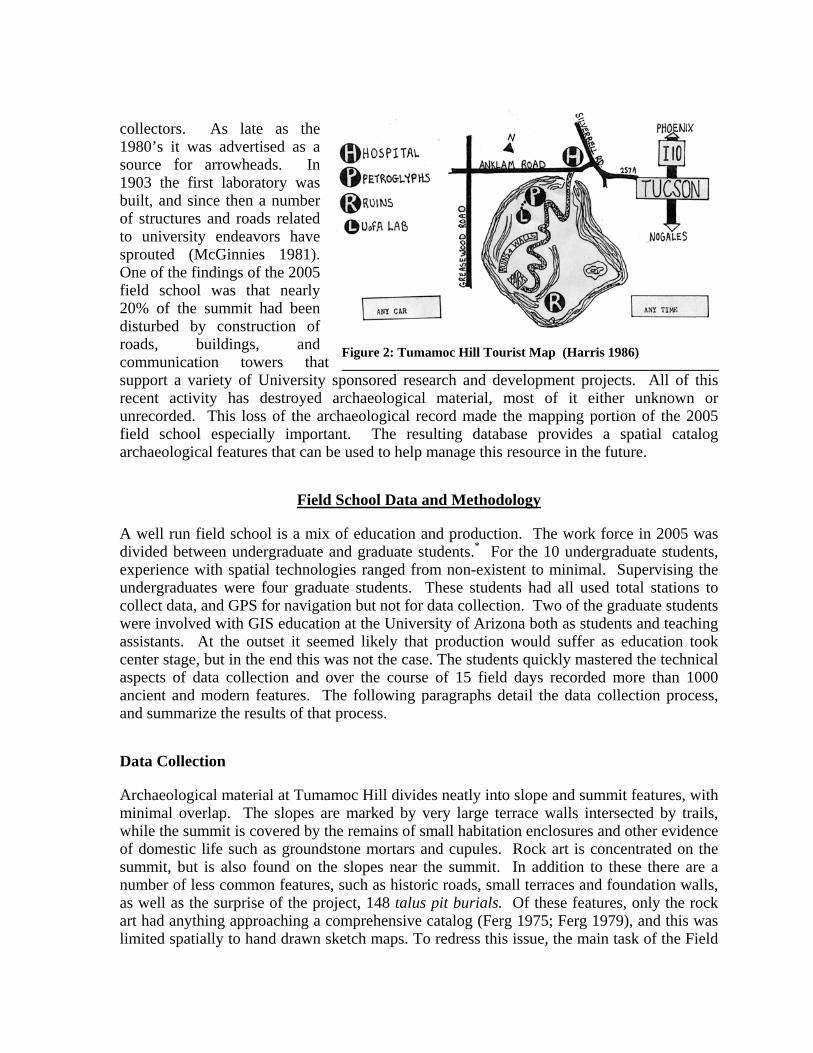
collectors. As late as the 1980’s it was advertised as a source for arrowheads. In 1903 the first laboratory was built, and since then a number of structures and roads related to university endeavors have sprouted (McGinnies 1981). One of the findings of the 2005 field school was that nearly 20% of the summit had been disturbed by construction of roads, buildings, and communication towers that support a variety of University sponsored research and development projects. All of this recent activity has destroyed archaeological material, most of it either unknown or unrecorded. This loss of the archaeological record made the mapping portion of the 2005 field school especially important. The resulting database provides a spatial catalog archaeological features that can be used to help manage this resource in the future.
Field School Data and Methodology
A well run field school is a mix of education and production. The work force in 2005 was divided between undergraduate and graduate students.* For the 10 undergraduate students, experience with spatial technologies ranged from non-existent to minimal. Supervising the undergraduates were four graduate students. These students had all used total stations to collect data, and GPS for navigation but not for data collection. Two of the graduate students were involved with GIS education at the University of Arizona both as students and teaching assistants. At the outset it seemed likely that production would suffer as education took center stage, but in the end this was not the case. The students quickly mastered the technical aspects of data collection and over the course of 15 field days recorded more than 1000 ancient and modern features. The following paragraphs detail the data collection process, and summarize the results of that process.
Data Collection
Archaeological material at Tumamoc Hill divides neatly into slope and summit features, with minimal overlap. The slopes are marked by very large terrace walls intersected by trails, while the summit is covered by the remains of small habitation enclosures and other evidence of domestic life such as groundstone mortars and cupules. Rock art is concentrated on the summit, but is also found on the slopes near the summit. In addition to these there are a number of less common features, such as historic roads, small terraces and foundation walls, as well as the surprise of the project, 148 talus pit burials. Of these features, only the rock art had anything approaching a comprehensive catalog (Ferg 1975; Ferg 1979), and this was limited spatially to hand drawn sketch maps. To redress this issue, the main task of the Field
Figure 2: Tumamoc Hill Tourist Map (Harris 1986)

School was the collection of spatially explicit data for a variety of features, and the development of a spatial database.
THE GEODATABASE
In preparation for the field work, a geodatabase was constructed by Christopherson and Leckman containing a variety of data organized into feature datasets and feature classes. These included base data, such as roads, land ownership, a sub-meter resolution DEM, and color image of the site. In addition, empty feature classes were added to contain both ancient and modern features as they were collected. These included feature classes for horizontal control points; feature classes for modern buildings, roads, and disturbed areas; and archaeological feature classes for rock walls, enclosures, groundstone, rock art, trails and wall cross-sections. As the work progressed, the tables for these feature classes were modified to better reflect the data we were collecting, and a new feature class was created when we unexpectedly encountered large numbers of talus pit burials.
DATA COLLECTION: INSTRUMENTS AND METHODOLOGY
The different scales of these features corresponded well with the division between slope and summit features that was noted above. Most of the large, linear features were found on the slopes, while smaller features were located mostly on the summit. This differentiation in scale, along with the different terrain dictated different data collection strategies, one using GPS receivers and the other using total stations. Features on the slopes were recorded by two teams using Trimble GeoXT GPS receivers/data loggers. Their level of precision matched the large size of the features, and their portability made them ideal for data collection in the steep terrain. Each GPS team consisted of a graduate student supervisor and two undergraduate student workers. Attribute data was recorded using Trimble’s TerraSync software.
The larger linear features, i.e. terrace walls and trails, were used to control the data collection. One team member used the GPS to walk and record the feature, while the other two walked and scanned the area on either side of the feature. Any additional features they noted were flagged and recorded later.
Figure 3: Recording a cupule with a Trimble GeoXT
All data collected by the GPS were processed each day. Following field work the feature data were transferred to a PC running Trimble’s Pathfinder Office software, where they were differentially corrected and exported as shape files. These shapefiles were then appended to the existing feature classes. Using this methodology, the GPS crews collected over 900 features in 15 days.
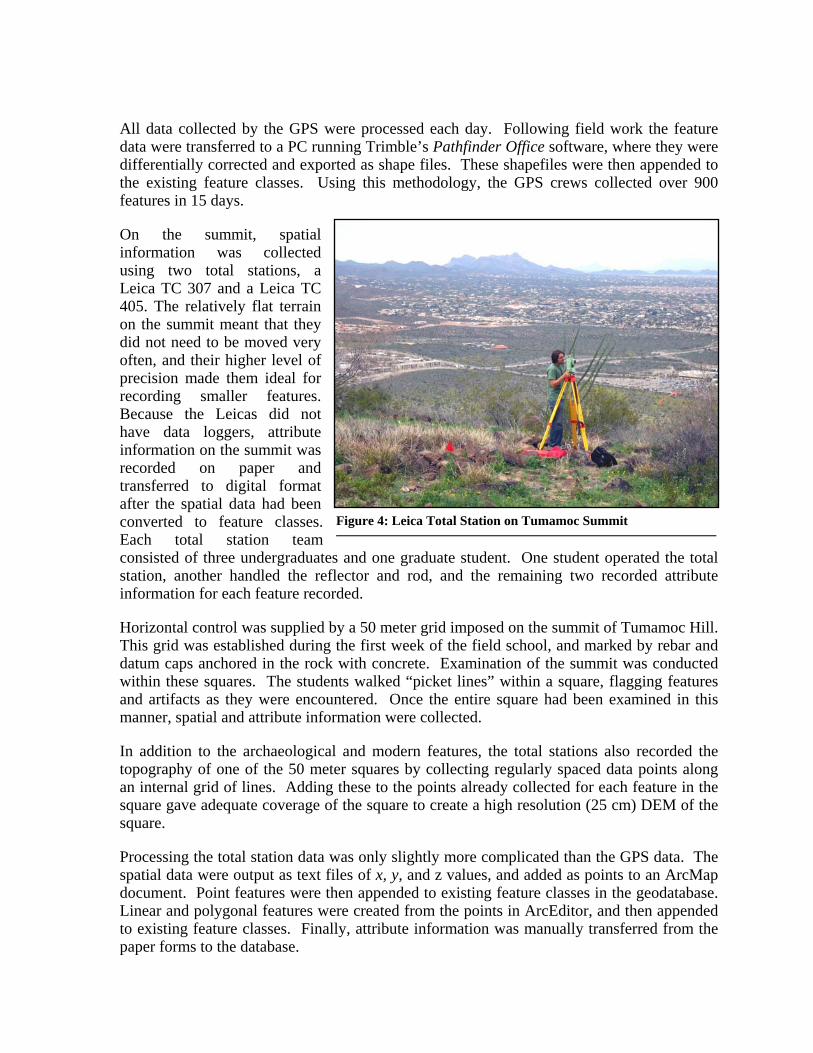
On the summit, spatial information was collected using two total stations, a Leica TC 307 and a Leica TC 405. The relatively flat terrain on the summit meant that they did not need to be moved very often, and their higher level of precision made them ideal for recording smaller features. Because the Leicas did not have data loggers, attribute information on the summit was recorded on paper and transferred to digital format after the spatial data had been converted to feature classes. Each total station team consisted of three undergraduates and one graduate student. One student operated the total station, another handled the reflector and rod, and the remaining two recorded attribute information for each feature recorded.
Horizontal control was supplied by a 50 meter grid imposed on the summit of Tumamoc Hill. This grid was established during the first week of the field school, and marked by rebar and datum caps anchored in the rock with concrete. Examination of the summit was conducted within these squares. The students walked “picket lines” within a square, flagging features and artifacts as they were encountered. Once the entire square had been examined in this manner, spatial and attribute information were collected.
In addition to the archaeological and modern features, the total stations also recorded the topography of one of the 50 meter squares by collecting regularly spaced data points along an internal grid of lines. Adding these to the points already collected for each feature in the square gave adequate coverage of the square to create a high resolution (25 cm) DEM of the square.
Processing the total station data was only slightly more complicated than the GPS data. The spatial data were output as text files of x, y, and z values, and added as points to an ArcMap document. Point features were then appended to existing feature classes in the geodatabase. Linear and polygonal features were created from the points in ArcEditor, and then appended to existing feature classes. Finally, attribute information was manually transferred from the paper forms to the database.
Figure 4: Leica Total Station on Tumamoc Summit

Results
From an instructor’s point if view, the results of the 2005 Field School were impressive. Given the small number of students, the difficult terrain of the site, and the short time span, the number of features recorded was remarkable. Additionally, the students rapidly became experts in data collection and processing, gaining familiarity with a variety of spatial and non-spatial technologies. It is not possible to detail all the results in this venue, but some highlights are listed here.
A SPATIAL DATABASE
The most significant result of the 2005 Field School was the development of a spatial database of the cultural resources on Tumamoc Hill. Although there is a history of archaeological projects on Tumamoc Hill, there has never been a systematic examination and mapping of features. Not knowing their location has led to the loss of important cultural resources during construction, and made management of the resources difficult. The construction of a usable, increasingly comprehensive spatial database will improve future management of the archaeological resources of this important Hohokam site.
A HIGH RESOLUTION TOPOGRAPHIC MAP
One of the most important tasks for the total station crews was the creation of a detailed map of a single fifty-by-fifty-meter square on the summit's southern end. This square was chosen because it was one of the most architecturally complex on the summit and it was thought that any research design that could map this area efficiently would work well elsewhere. Approximately 5000 points were needed to accurately survey this square. Once the research design was established, and the grid laid out, actual mapping took about 8 days. The result was a high resolution DEM and very accurate mapping of each feature in the square. This map is useful in a number of ways. It provides a topographical context for features in the square and helps explain cultural patterns in the hilltop village. Further, it will serve as the template for work next year as we attempt to complete this for the entire summit of Tumamoc Hill.
Figure 5: Tumamoc Archaeological Base Map

Figure 6: High resolution DEM and recorded features.
Talus Pit Burials
One of the most surprising finds at Tumamoc Hill was the discovery of 148 talus pit burials. Talus pits are common on the volcanic hills of Tucson, and thought to be post-contact Tohono O'odham (Anderson et al. 1982; Madsen 1995). The pits were found on the western and northern talus slopes of Tumamoc Hill, Most were shallow depressions; although there were also some large, well defined cavities in the slope. The pits were not excavated, and no human remains were noted, but typical of this type of burial, large plainware sherds were found in some of the pits. Given their frequent occurrence in the Tucson area, and the near constant human activity on Tumamoc Hill, it is surprising that
Figure 7: Talus Pit

these talus pits were undocumented before the 2005 Field School. Their presence at the site will likely have a significant impact on the hill. Human remains mean that a number of regulatory laws will come into play as new developments on the hill and surrounding bajadas are contemplated, serving to further protect these important cultural resources.
Rock Art Catalog
Rock art represents a significant proportion of the archaeological features at Tumamoc Hill. It is also the only feature that had a previously existing catalog. Alan Ferg located, categorized, and published the Tumamoc rock art in the mid to late 1970’s (Ferg 1975; Ferg 1979). Ferg’s descriptions of the locations for the features he recorded was sophisticated for its day, positions were described as they related to other phenomena on the hill and noted in hand drawn sketch maps, but modern technology lends a precision not available in the 1970’s. Using perseverance and a growing of knowledge of the hill, the students in charge of the rock art survey were able to locate most of Ferg’s cataloged features. By adding spatial reference to the rock art catalog, it is now possible to navigate to particular features, and to see the relationship of rock art to other features on Tumamoc Hill. For example, although excellent rock faces for art are ubiquitous on the summit, the new maps make it clear that rock art appears in clusters.
MASSIVE TERRACE WALLS
Massive terrace walls are the characteristic feature of trincheras sites like Tumamoc Hill. The term trincheras, Spanish for entrenchments or fortifications, also demonstrates the bias of earlier archaeologists for a military explanation for these features. Since then, alternatives have been proposed, among them agricultural, habitation, or symbolic features (Wilcox 1979). The Field School survey identified and recorded 43 massive terrace walls. These walls were found from the lower slopes to the top of the hill, ranging in length from 5 to 252
Figure 8: Rock art on Tumamoc summit

meters in length, with a mean of 56 meters. The thickness of these walls ranged from less than a meter to nearly 9 meters, with an average of 2.4 meters. Although the terrace wall data collected at this site will not end the debate, it was clear to those recording these features that the number and size of the walls would not have been necessary to defend the site, nor did they retain soil in sufficient quantities to dramatically increase arable land. It is hoped that further analysis of these walls, and those from other sites, will help to clarify the function of these structures.
TOTAL STATION DATA VS. GPS DATA
A bonus of the data collection methodology discussed above was the opportunity to compare total station data to GPS data as a start to developing a best practices document. The cost of the total station equipment and GPS equipment were roughly equivalent, and within the budget range of many archaeological projects. (As a caveat, it should be pointed out that a different budget would provide different equipment and give different results.)
All spatial data collection devices are found somewhere along a spectrum of productivity vs. accuracy. In the case of the Field School equipment, the GPS excelled at productivity while the total station was more accurate. In order to test the real time/productivity of the different recording devices, 10 points features, a wall line and two enclosure polygons were set up as a data collection course. These features were then recorded with the total station and the GPS. Table 1 shows the number of person minutes required to go from arrival at a site to the creation of the spatial database. The main differences between the two was the time it took to set up the total station, the fact that it took more than one person to operate the total station, and the lack of a data logger for the total stations.
Although the total stations had productivity issues, they were clearly the more accurate. The advertised accuracy for the Trimble GeoXT for point data is sub 30 cm, and for kinematic data sub 1 meter. In the real world, these inaccuracies will likely be larger, though not significantly (Trimble 2004). For total stations, accuracy is largely a result of the daily
Figure 9: Recording a terrace wall

machine set up process and how steady the reflector and rod are held. Well set up machines and solidly held rods lead to sub-centimeter accuracy. During the Field School, daily readings were taken in the morning and afternoon at a datum of known coordinates. The mean difference between the known coordinates and the GPS readings was just over 40 centimeters; and for the total station it was less than 2 centimeters. These numbers fit well with our expectations and the standards claimed by Trimble.
Table 1: A comparison of data productivity for total station and GPS data collection.
Processing Step Person Minutes for Total Station
Person Minutes for GeoXT
Equipment set up 34 1
Collect spatial and attribute data for 10 points 15 10
Collect spatial and attribute data for a wall line 20 5
Collect spatial and attribute data for enclosures 20 14
Upload data to PC 10 1
Differential correction 0 1
Export to GIS format 3 0.5
Edit Features 3 0
Create Feature Class 3 0.5
Attribute Features 20 0
Totals 128 33
Figure 10 shows the features recorded in Table 1. Here it is clear that the GPS gets the shape generally correct, but the accuracy of the points and vertices varies. The mean difference between the two recording devices for all recorded points and vertices was 0.88. This makes the GPS perfect for large features like the terrace walls and trails, features whose size is significantly larger than the likely inaccuracies. For smaller features where accuracy will have a greater affect on shape and area, the total station is preferable. Note also that these features all had a clear view of the sky. Under canopy the GPS signal is degraded and the accuracy of the information collected suffers (Trimble 2004).

Figure 10: A comparison of total station and GPS data.
STUDENT SKILLS
Finally, a very important result was a group of students with spatial skills. All the students are now familiar with GPS and total station data collection and nearly all of them are familiar enough with ArcMap that they can add data, symbolize it and create maps that tell a story. Two of the students have indicated that they will be entering the GIS course sequence at the University of Arizona next fall and I would expect to see others as they become juniors and seniors. Archaeology is inherently spatial in nature, and the University of Arizona Field School is committed to utilizing spatial technologies, providing our students with the skills necessary to succeed.

Conclusions and Future Considerations
The 2005 University of Arizona Archaeological Field School was a great success. We discovered that it is possible to integrate spatial technology into a short field season, even when the students are unfamiliar with the hardware and software. The ability of the GPS receivers to record both spatial and attribute data far exceeded our expectations. The number of features recorded with this technology was amazing by any standard. The ability of the total station to collect topographic data at high resolution was also a satisfying discovery. After a few false starts, the total station rapidly collected thousands of points and provided the data for the high resolution DEM that we had envisioned.
Although it was not discussed in the preceding material, we also learned that ArcPad’s user friendly approach to palmtop GIS does not extend to the collection and entering of feature attributes. As the title for this paper suggests, the original plan had been for the Field School to use ArcPad as the primary GPS data collection software. Although ESRI has provided a means to create data entry screens, what we quickly discovered was that the students in our field school were unable to master the ArcPad Application Builder software. That left it up to faculty to create the data entry screens, but the short time span for field work made this a non-starter as well. In the end, we decided to use Trimble’s TerraSync software. Creating the data dictionary in TerraSync required less than 2 hours and with few exceptions the data entry was not only painless, but also fast and reliable. The only real criticism we had of TerraSync was that it does not allow access to external tables for those features that required one-to-many relationships.
There were a few things that we were unable to finish this season. There are fifty-two 50 X 50 meter squares on Tumamoc’s summit. The original plan had been to complete three of these squares this spring; however, the establishment of horizontal control points for this grid took more time than anticipated and in the end we were only able to complete one of these squares. Also, the success of the technologies and methodologies utilized in the 2005 Field School has caused us to begin thinking about the numerous archaeological remains on the plains and in the washes at the foot of Tumamoc. We began looking for funding in February and the plan is to return to Tumamoc in the fall to address both the remaining data on the summit and begin collecting material at the base of Tumamoc Hill.
Acknowledgements
The authors would like to acknowledge the following organizations, without whom this research would have been impossible.
• The University of Arizona’s Desert Laboratory. The people at this great facility have the day-to-day responsibility for Tumamoc Hill. They were always gracious, even when we made strange requests.
• The sponsoring units at the University of Arizona: the Department of Anthropology, The Arizona State Museum, and the Center for Applied Spatial Analysis. Without their support, this Field School would not have happened.

• Special thanks to the students who did all the real work: Emilee Ellsworth, Nicole French, Richard Gilmour, Jerry Gray, Lauren Kingston, Margaret Neff, Andrzej Proczka, Estee Rivera, Stephen Summers, and Jessica Webber.
References Cited
Anderson, Keith M, Fillman Bell, and Yvonne G. Stewart 1982 Quitobaquito: A Sand Papago Cemetery. The Kiva 47:215-231.
Ferg, Alan 1975 Tumamoc Hill Petroglyph Project Report. Arizona State Museum. 1979 The Petroglyphs of Tumamoc Hill. The Kiva 45:95-118.
Fish, Paul R., Suzanne K. Fish, Austin Long, and Charles Miksicek 1986 Early corn remains from Tumamoc Hill, southern Arizona. American Antiquity
51:563-572. Harris, Rick
1986 Explore Arizona! (Arizona and the Southwest). Golden West Publishers, Phoenix.
Madsen, John H. 1995 Rock Cairn and the Talus Pit Features in the Los Robles Community. In
Between the Desert and River: Hohokam Settlement and Land Use in the Los Robles Community. Anthropological Papers of the University of Arizona, edited by Christian E. Downum, pp. 96-136. University of Arizona, Tucson.
McGinnies, William G. 1981 The Desert Laboratory of the Carnegie Institution of Washington: History and
Achievements. University of Arizona Press, Tucson, Arizona. Trimble Navigation
2004 A study of GeoXT antenna performance. In Mapping and GIS White Paper. Trimble Navigation.
Wallace, Henry, Paul R. Fish, and Suzanne K. Fish forthcoming Tumamoc Hill in the Context of Early Ceramic Occupations in the
Tucson Basin. In Enduring Borderlands Traditions: Trincheras Sites in Time, Space, and Society, edited by Suzanne K. Fish and Paul R. Fish. University of Arizona Press, Tucson.
Wilcox, D.R. 1979 Warfare Implications of Dry-Laid Masonry Walls on Tumamoc Hill. The Kiva
45. Wilcox, D.R., and S.M. Larson
1979 Introduction to the Tumamoc Hill Survey. The Kiva 45.

Endnotes
* The members of the spring 2005 University of Arizona Field School were: Gary L. Christopherson, Paul R. Fish, Suzanne K. Fish, John F. Chamblee, Mathew Hill, R. Emerson Howell, Phillip O. Leckman, Todd Pitezel, Emilee Ellsworth, Nicole French, Richard Gilmour, Jerry Gray, Lauren Kingston, Margaret Neff, Andrzej Proczka, Estee Rivera, Stephen Summers, and Jessica Webber.
Author Information
Gary L. Christopherson Director, Center for Applied Spatial Analysis Harvill Building 460 The University of Arizona Tucson, AZ 85721 [email protected]
Paul R. Fish Professor of Anthropology/ Curator Arizona State Museum Arizona State Museum North 221 Tucson, AZ 85721 [email protected]
Suzanne K. Fish Professor of Anthropology/ Curator Arizona State Museum Arizona State Museum North 217 Tucson, AZ 85721 [email protected]
John F. Chamblee Graduate Research Assistant Arizona State Museum/Center for Applied Spatial Analysis [email protected]
Phillip O. Leckman Graduate Research Assistant Arizona State Museum/Center for Applied Spatial Analysis [email protected]