1. Getting started on ArcGIS Online - Mapping Indigenous LA
24
1. Getting started on ArcGIS Online Mapping Indigenous LA (MILA) uses Esri’s Story Maps, an online mapping application, to create and display spatial information that is then annotated with text and multimedia. To get started with Story Maps, you must first create an account on ArcGIS online . Creating a “public account” is free, but means that your maps are available to the public. Once you have create an account and signed in, click on “My Content” at the top of the screen to get started. When you click here, you will be brought to a separate page where you can store all of your content. In the My Content page, you can do several things: 1) Create folders for storing and organizing your content 2) Upload files from your computer or the web 3) Create new maps and mapping applications Feel free to play around with this page on your own. The most important section for this tutorial is the “create” button (3), which is how we create new maps and Story Maps.
-
Upload
khangminh22 -
Category
Documents
-
view
5 -
download
0
Transcript of 1. Getting started on ArcGIS Online - Mapping Indigenous LA

1. Getting started on ArcGIS Online Mapping Indigenous LA (MILA) uses Esri’s Story Maps, an online mapping application, to create and display spatial information that is then annotated with text and multimedia. To get started with Story Maps, you must first create an account on ArcGIS online. Creating a “public account” is free, but means that your maps are available to the public. Once you have create an account and signed in, click on “My Content” at the top of the screen to get started.
When you click here, you will be brought to a separate page where you can store all of your content. In the My Content page, you can do several things:
1) Create folders for storing and organizing your content 2) Upload files from your computer or the web 3) Create new maps and mapping applications
Feel free to play around with this page on your own. The most important section for this tutorial is the “create” button (3), which is how we create new maps and Story Maps.

When you click “create”, you will be prompted to choose an app, map, or scene. For our purposes, we are only concerned with apps and maps. We will start with apps because this where we will create Story Maps for MILA. 2. Creating a Story Map Journal ArcGIS mapping applications come in a variety of templates with different designs and functionalities. While we encourage you to explore the different templates to get a feel for Story Maps, we will be focusing on the Story Map Journal template. When you are ready to get started, find and click on the Story Map Journal template.
You will be asked to choose a title and “tags” for your map. Tags are simple words and phrases that help identify what your map is about. For example, a map about historic sites in Los Angeles might have tags like “Los Angeles” “historic” “sites” “preservation”. Choose a title and a few tags (these are required) for your Story Map, and click next. You will then have the option of a side panel or a floating panel. For first time users, we recommend using a regular side panel. Once you have made your selection, you will be brought to the main interface of Story Maps Journal. You will be asked here to give another title to your map. Don’t panic! This first title you gave to your Story Map was essentially the name of the file in your My Content folder. Think of this second title as the real title of your Story Map: the one that will appear at the top of the screen for your users.

Once you have created a title, you will be asked to create a “home section”. The home section is the first section of your Story Map. Think of it as the introductory paragraph to an essay. Think of subsequent sections as short chapters in your story.

The Story Maps’ “Story Map Journal” template consists of two sections, the Main Stage and the Side Panel. The Main Stage is the larger section on the right of the screen, where you can add images, videos, maps, or web pages. The Side Panel is where you can add text, images, videos, and hyperlinks to help describe and/or give context to the content in the Main Stage. 3. Creating Sections 3.1 Main Stage The first step in creating a section is to create the Main Stage content. You can choose from the following items: a map, image, video, or web page. The Map option will be discussed later (see Section 5). For images, you have several options to choose from. If you choose Flickr, Facebook, or Picassa, Map Journal will ask you to login or provide your username, and then it will automatically load your photo albums. Keep in mind that the content from these sites must be public in order for them to be viewable in Story Maps. If you choose URL, you will need to provide the direct link for an online image (this is covered in detail below).

(Note: When adding images to Story Maps, it is important the image be of a high quality. Low quality images will appear blurry or small. In most cases, images copied and pasted from the internet are low quality. Therefore, it is recommended that you use pictures you have taken with a camera or iPhone in Story Maps.) Once you have chosen an image, you will asked how you would like the photo to be formatted to the Main Stage (stretch, fill, etc.) Images will look better in different formats depending on the quality of the image and the orientation. Play around with different formats to see which is best for each photo. 3.1.1 Copying and Pasting Image URLs To get the direct link of an image, simply right click on an image you find on a webpage, and scroll to the option “Copy Image Location”.
When you click “Copy Image Location”, nothing will appear to have happened. However, the hyperlink for that particular image will now be copied and ready for you to paste it. In your Map Journal, paste the image location where it says “Image URL”. You can paste the link by right clicking in the text field and choosing “Paste”, or by pressing Command+V. To be

sure you have the correct link, check the last few letters. It should end with an image file type, such as .jpeg or .png.
3.1.2 Adding Videos Adding videos is even easier. When you choose the video option, you will be prompted to choose between YouTube, Vimeo, or Other. Don’t worry about other, because it is overly complicated for our purposes. If you have your own video file that you want to use in a Story Maps, we recommend uploading it to YouTube or Vimeo. Whether you choose YouTube or Vimeo, all you need to do is copy and paste the hyperlink for the video and paste it into the URL field in Story Maps.

Once you paste it in, you will need to click the “check” button before you can continue so they system can verify that the video URL is valid. Once it is checked, click save to continue.
3.1.3 Adding Web Pages The final option, “web page”, is the easiest of them all. In this case, all you need to do is copy and paste the hyperlink for the webpage that you would like to appear in the Main Stage. Similar to photos, you will be asked how you would like the size of the webpage to be formatted to the Main Stage. 3.2 Side Panel Once you have made your Main Stage selection, you will be prompted to add the Side Panel content. The interface for the Side Panel offers a number of functionalities for typing and formatting text, such as:
● Typeface formatting ● Embedding hyperlinks, images, and videos ● Bullet points ● Indentations and paragraph alignment

(Note: While you can copy and paste text from another document, the formatting from the original document will not always carry over to Story Maps, such as spacing and indentation, hyperlinks, images, etc. Should you decide to copy and paste, is important that you double check that everything is in order in the Story Maps.) 3.3 Main Stage Actions While you can embed links, images, and videos into the Side Panel to add additional context to your Main Stage content, one of the most useful and dynamic functionalities of Story Map Journals is “Main Stage Actions”. Main Stage Actions essentially create buttons out of words or phrases in the Side Panel. When the user clicks on these buttons, the Main Stage content changes. To add a Main Stage Action, highlight the word or phrases that you want to turn into a button, and then click on the “Main Stage Actions” button, which will unlock another button, called “Change Main Stage Actions”.
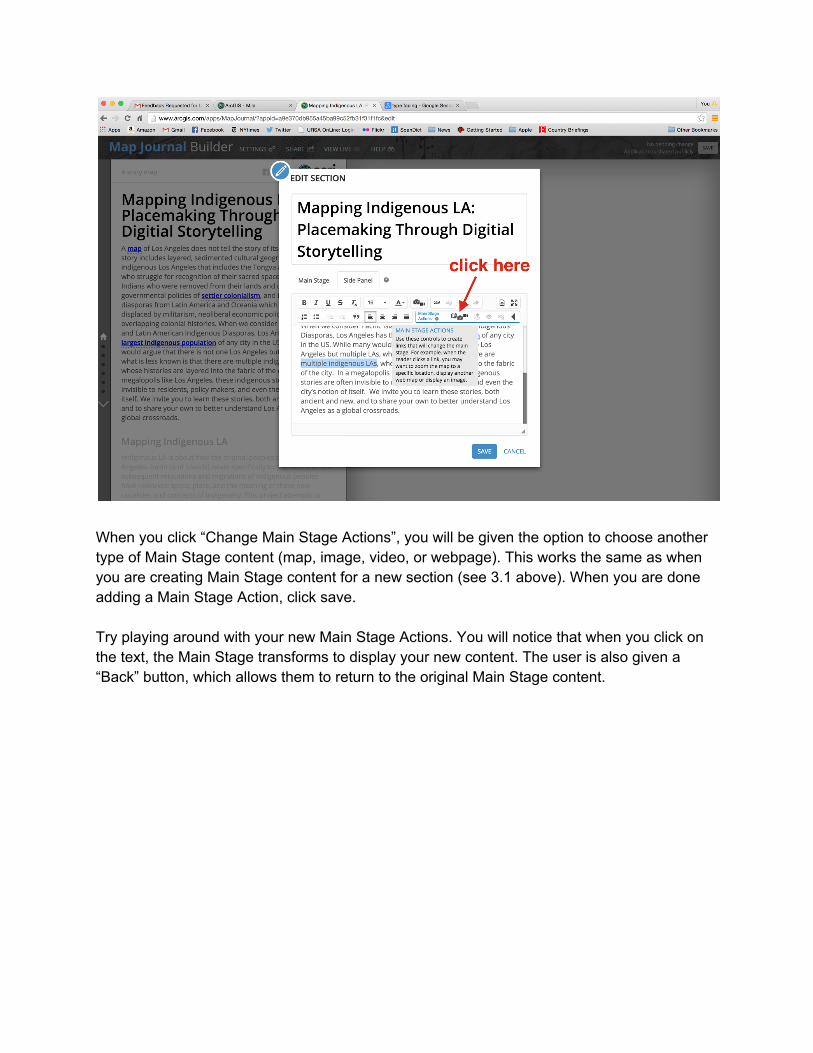
When you click “Change Main Stage Actions”, you will be given the option to choose another type of Main Stage content (map, image, video, or webpage). This works the same as when you are creating Main Stage content for a new section (see 3.1 above). When you are done adding a Main Stage Action, click save. Try playing around with your new Main Stage Actions. You will notice that when you click on the text, the Main Stage transforms to display your new content. The user is also given a “Back” button, which allows them to return to the original Main Stage content.

You now know the basic functionalities of Story Maps Journal! Play around with different functionalities to customize your Story Map. The more you experiment, the more you will learn. (Note: In order to save changes made to your Story Map Journal, it is important that you click “Save” at the top right corner of the screen. It is a good idea to do this after every major addition or revision to ensure your changes are not lost.)

4. Creating ArcGIS Online Maps
ArcGIS Online also allows you to create your own maps for displaying spatial information. While these maps do not have nearly as many functionalities as ArcGIS or QGIS software packages, these online maps are ideal for those that wish to create simple, interactive maps for use in a Story Map template.
To create a new map, click “Create” in the My Content page, and choose “Map.” Similar to a Story Map (see section 2), you will need create a map title (the title of the map as it appears in your My Content folder), and a few tags. The interface for creating a map is slightly more complicated than the Story Maps Journal. On the left hand side is your Table of Contents. This is where all of your map layers will be displayed. Above that are the button “Details”, “Add”, and “Basemap”. “Details” simply allows you to hide the Table of Contents. “Add” allows you to add map layers from a variety of sources. Let’s begin with “Basemaps”. 4.1 Basemaps Basemaps are the base layers, or skin, of your map. You have a number of types and style available to you, from street maps to topographic maps. You should choose the Basemap that is ideal for the type of information you want to display. If you will be displaying locations of individual buildings or addresses, the street map might be best, If you are going to be showing the locations of mountain ranges, then try a topographic map.
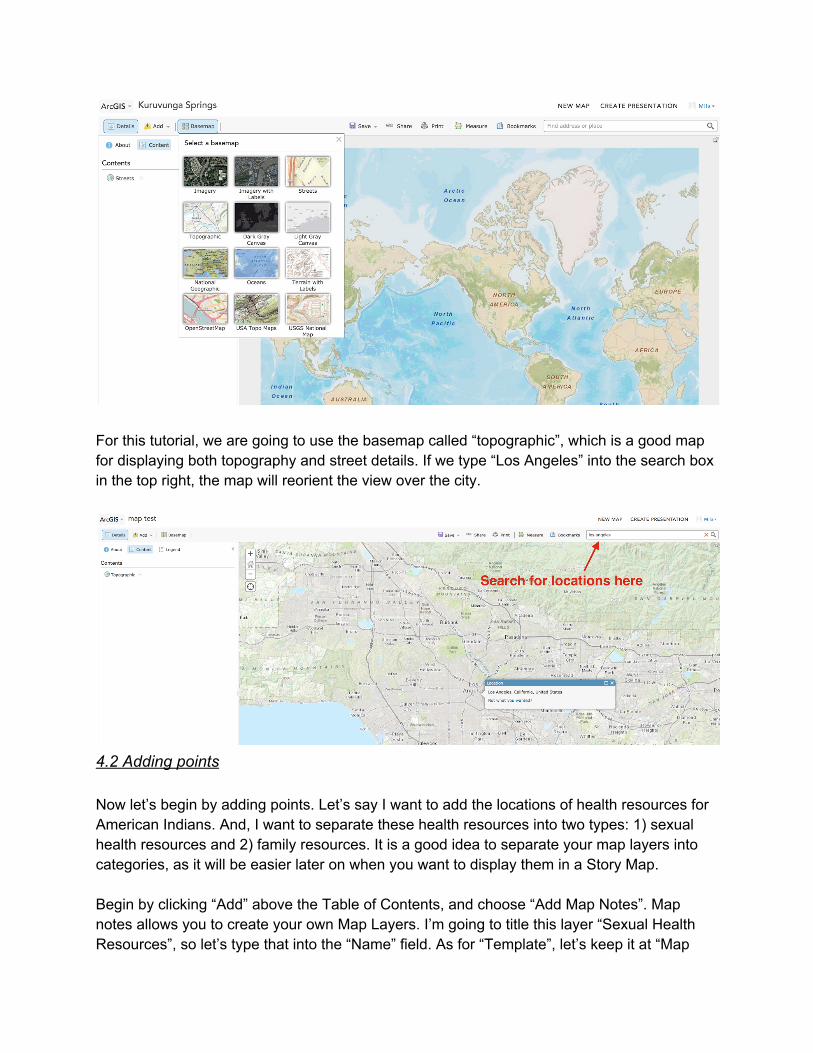
For this tutorial, we are going to use the basemap called “topographic”, which is a good map for displaying both topography and street details. If we type “Los Angeles” into the search box in the top right, the map will reorient the view over the city.
4.2 Adding points Now let’s begin by adding points. Let’s say I want to add the locations of health resources for American Indians. And, I want to separate these health resources into two types: 1) sexual health resources and 2) family resources. It is a good idea to separate your map layers into categories, as it will be easier later on when you want to display them in a Story Map. Begin by clicking “Add” above the Table of Contents, and choose “Add Map Notes”. Map notes allows you to create your own Map Layers. I’m going to title this layer “Sexual Health Resources”, so let’s type that into the “Name” field. As for “Template”, let’s keep it at “Map

Notes”. Map Notes is the most basic template, and allows us to choose from a number of basic markers to add to our map. Feel free to browse the other options, which offer more specific markers for different categories. (Note: You can also Add Map Layers from the web or your computer. To upload a Map Layer, it must be a zipped Shape File (.shp) or tab delimited text file (.csv).)
The Table of Contents section will change to “Add Features”. Here, you are given a number of different features you can add to your map. “Points” are useful for demarcating particular addresses. “Lines” and “Areas” allow you to demarcate whole streets, neighborhoods, and regions of the map. Adding “Text” or individual arrows are useful for curating your map with additional information and references. Let’s add a point. Based off of their website, I know that the Red Circle Project, an HIV prevention program in LA, is located at 1125 West 6th Street, Los Angeles, CA 90017. Type this address into the search box at the top right corner of the screen and hit enter. The location of the address will be demarcated by an infowindow. Click one of the point markers (stickpin, pushpin, or cross), and then click again on the map where you want to marker to drop.

You will see that the point marker is now pinned to the map, and an point editing window asking for additional information. Let’s give the point the title “Red Circle Project”. Under “description”, I am going to add some information I receive from the organization’s website.
To make my infowindow even more dynamic, I am going to add a hyperlink to the phrase “Red Circle Project” that links the user to the organization’s homepage. I am also going to paste an Image URL (see 3.1.1) under the section “Image URL”. Lastly, I am going to change the color of my stick pin by clicking “Change Symbol”, and then choosing the purple pin under the “Basic” category.
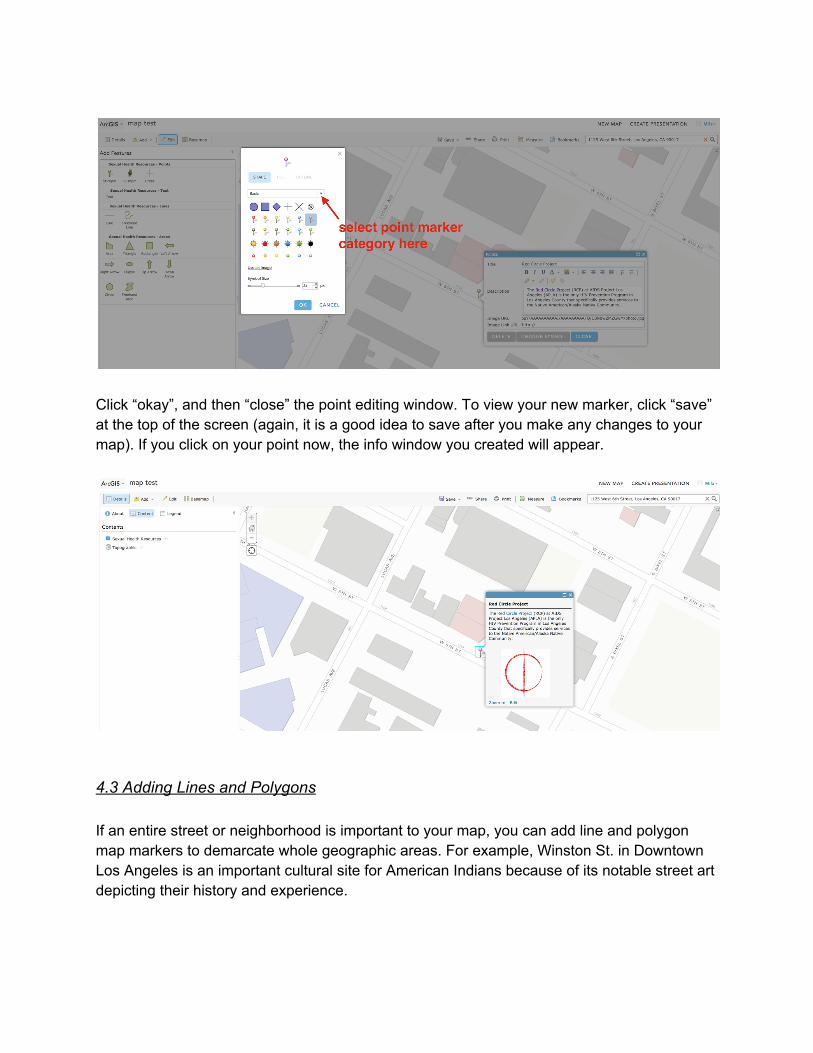
Click “okay”, and then “close” the point editing window. To view your new marker, click “save” at the top of the screen (again, it is a good idea to save after you make any changes to your map). If you click on your point now, the info window you created will appear.
4.3 Adding Lines and Polygons If an entire street or neighborhood is important to your map, you can add line and polygon map markers to demarcate whole geographic areas. For example, Winston St. in Downtown Los Angeles is an important cultural site for American Indians because of its notable street art depicting their history and experience.

If we choose the “line” tool under add features, we can mark the entire street (you have the option of drawing it (“freehand”), or a click and snap line segment tool (“line”)). To finish drawing your line, double click. A marker editing window will then appear where you can add additional information. If you click “change symbol”, you can change the color and thickness of your line.
Adding polygons is very similar. You can choose between a number of shapes to highlight areas of your maps, as well as a freehand tool. Let’s say we want to highlight Santa Monica

on our map. Let’s use the “area” tool, which allows you to draw polygons by connecting line segments. Trace the outline of Santa Monica. Click once to create a corner of your polygon, and double click when you have completed drawing it. You can then add a title, descriptions and edit its appearance.
4.4 Navigating Layers It is a good idea to have different map layers for different categories of map information. Let’s say we have two layers: Sexual Health and Family Health resources.

To add map markers to ONE layer, it is important that you only have one map layer checked. Then, click “edit” at the top to add additional map markers. You will notice that if you uncheck one of your map layers, its corresponding map markers will disappear from the map. This does not mean they are deleted! Checking and unchecking map layers is useful if you are adding lots of information to one map and need it to look clean temporarily. If you click on the drop down menu next to a layer and choose “Zoom To”, your map will automatically zoom to the point where you can see all of the map markers in that layer. In this case, because we only have one point, it simply zooms to that individual marker.
(Note: we strongly recommend NOT using the map legend tool provided by ArcGIS online maps. To add a legend to a map, we encourage creating it manually in the sidebar of your story map. We will cover this more later on). 5. Adding ArcGIS Online Maps to your Story Map Journal

As you may remember from earlier on in the tutorial, when you create a new section in a Story Map Journal, you have the option of inserting a map into the Main Stage. Now that we know how to create our own maps, let’s try adding one to a Story Map. Add a new section to your Story Map Journal, select “maps” for the content, and click “browse for maps.”
You will then be able to choose from the maps in your “My Content” folder. When you have chosen which map to display, you will have a number of options you can edit to change how the map will appear in the Main Stage. To edit one of them, click “custom configuration”.
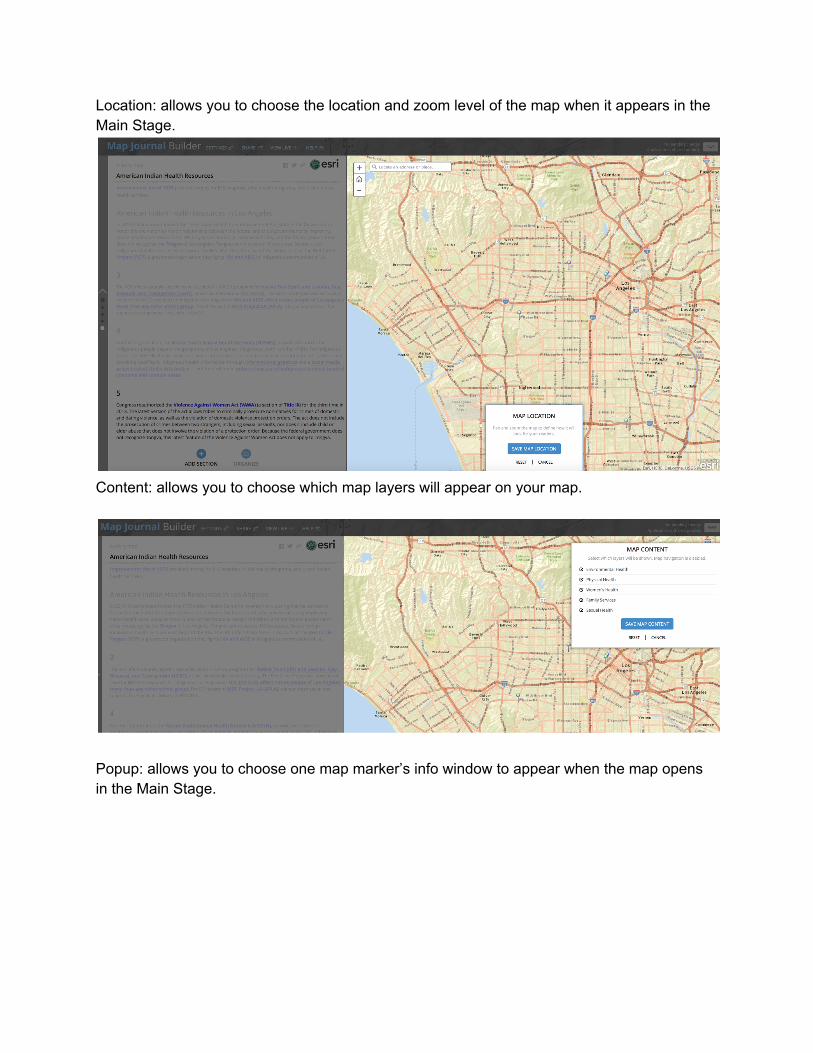
Location: allows you to choose the location and zoom level of the map when it appears in the Main Stage.
Content: allows you to choose which map layers will appear on your map.
Popup: allows you to choose one map marker’s info window to appear when the map opens in the Main Stage.
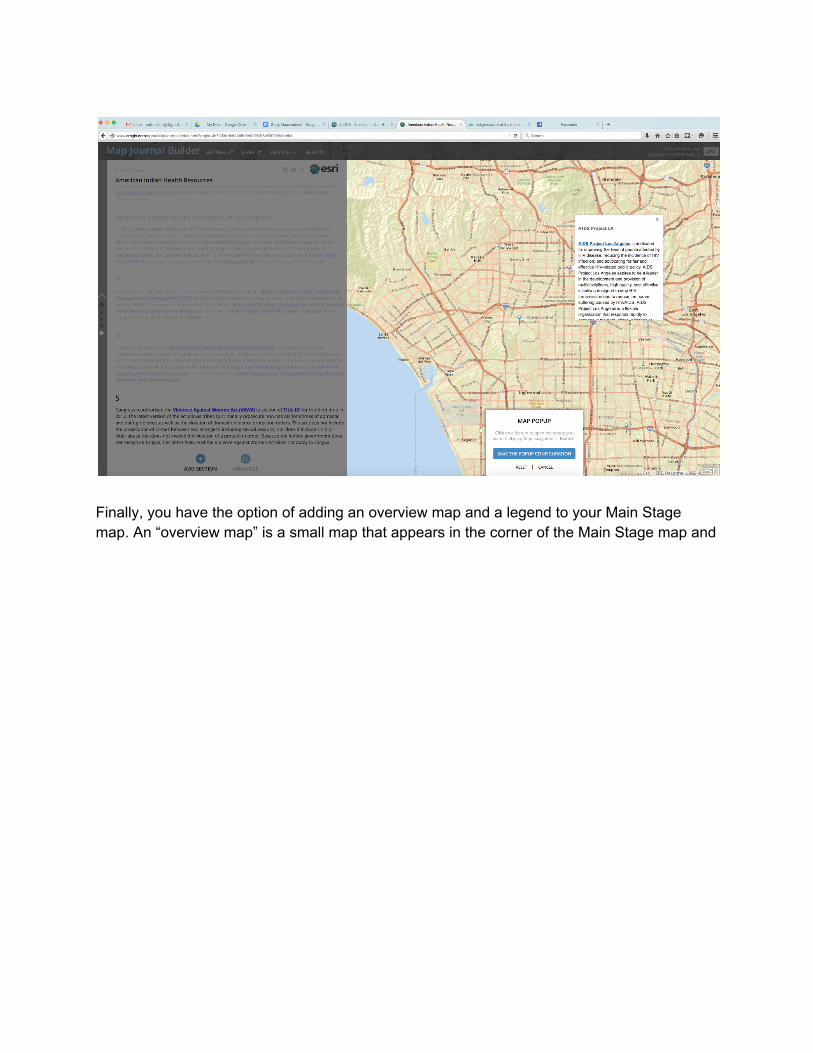
Finally, you have the option of adding an overview map and a legend to your Main Stage map. An “overview map” is a small map that appears in the corner of the Main Stage map and

orients to the viewer to where Main Stage map is located within a larger geographic area.
As mentioned earlier, we recommend against using the legend functionality built into the ArcGIS online maps. Instead, we encourage writing out your legend manually in the Side

Panel to accompany your Main Stage map.
The user will now be able to easily view the legend, navigate the map, and explore different map markers!

If you have any questions about functionalities not covered in this tutorial feel free to contact us at [email protected].