
GETTING STARTED WITH ENTERPRISE MANUFACTURING ...
33
TABLE OF CONTENTS PAGE GETTING STARTED WITH ENTERPRISE MANUFACTURING INTELLIGENCE (EMI) lnsresearch.com CONNECT:
-
Upload
khangminh22 -
Category
Documents
-
view
0 -
download
0
Transcript of GETTING STARTED WITH ENTERPRISE MANUFACTURING ...

TABLE OF CONTENTS
PAGE
GETTING STARTED WITH ENTERPRISE MANUFACTURING INTELLIGENCE (EMI)
lnsresearch.com
CONNECT:
lnsresearch.com
TABLE OF CONTENTS
Section 1: Introduction . . . . . . . . . . . . . . . . . . . . . . . . . . . . . . . . . . . . . . . . . . . . . . . . . . . . . . . . . . . . . . . . . . . . . . . . . . . . . . . . . . 3
Section 2: Five Easy Steps To Ensure A Successful EMI Deployment – How To Get Started . . . . . . . . . . . 5
Section 3: Landscape of Organizations, Processes & Technology . . . . . . . . . . . . . . . . . . . . . . . . . . . . . . . . . . . 9
Section 4: Top Manufacturing Objectives & Challenges . . . . . . . . . . . . . . . . . . . . . . . . . . . . . . . . . . . . . . . . . . . . 13
Section 5: EMI - Futher Explained . . . . . . . . . . . . . . . . . . . . . . . . . . . . . . . . . . . . . . . . . . . . . . . . . . . . . . . . . . . . . . . . . . . . . 19
Section 6: Case Study . . . . . . . . . . . . . . . . . . . . . . . . . . . . . . . . . . . . . . . . . . . . . . . . . . . . . . . . . . . . . . . . . . . . . . . . . . . . . . . . . 23
Section 7: EMI Adoption Trends . . . . . . . . . . . . . . . . . . . . . . . . . . . . . . . . . . . . . . . . . . . . . . . . . . . . . . . . . . . . . . . . . . . . . . . 26
Section 8: Summary/Recommendations . . . . . . . . . . . . . . . . . . . . . . . . . . . . . . . . . . . . . . . . . . . . . . . . . . . . . . . . . . . . . . 29
GETTING STARTED WITH ENTERPRISE MANUFACTURING INTELLIGENCE (EMI)

SECTION 1
Introduction

4
GETT
ING
STAR
TED
W
ITH
EMI
SECTION
TABLE OF CONTENTS
PAGE
1 2 34 5 67 8
Introduction
Manufacturing and IT professionals are looking for faster and
easier ways to support challenging business initiatives to improve
products, services, processes, and the company bottom line. At the
same time, it is important that their people be empowered with the
best possible information and tools that enable them to consistent-
ly perform their jobs and achieve results. Through the use of this
interactive eBook, readers will be able to quickly relate to manu-
facturing operational challenges seen in their own businesses and
understand how to get on the fast track with programs, processes,
and technologies that truly help them address these challenges.
Readers will also find education on the terminology and technol-
ogy issues associated with Enterprise Manufacturing Intelligence
(EMI), and will be given five critical steps on how to get started
and find success with their own EMI initiatives. A case study will
be explored, along with the benefits that others are seeing from
implementing EMI software solutions.

SECTION 2
to Ensure a Successful EMI Deployment -How To Get Started
EASY STEPS5
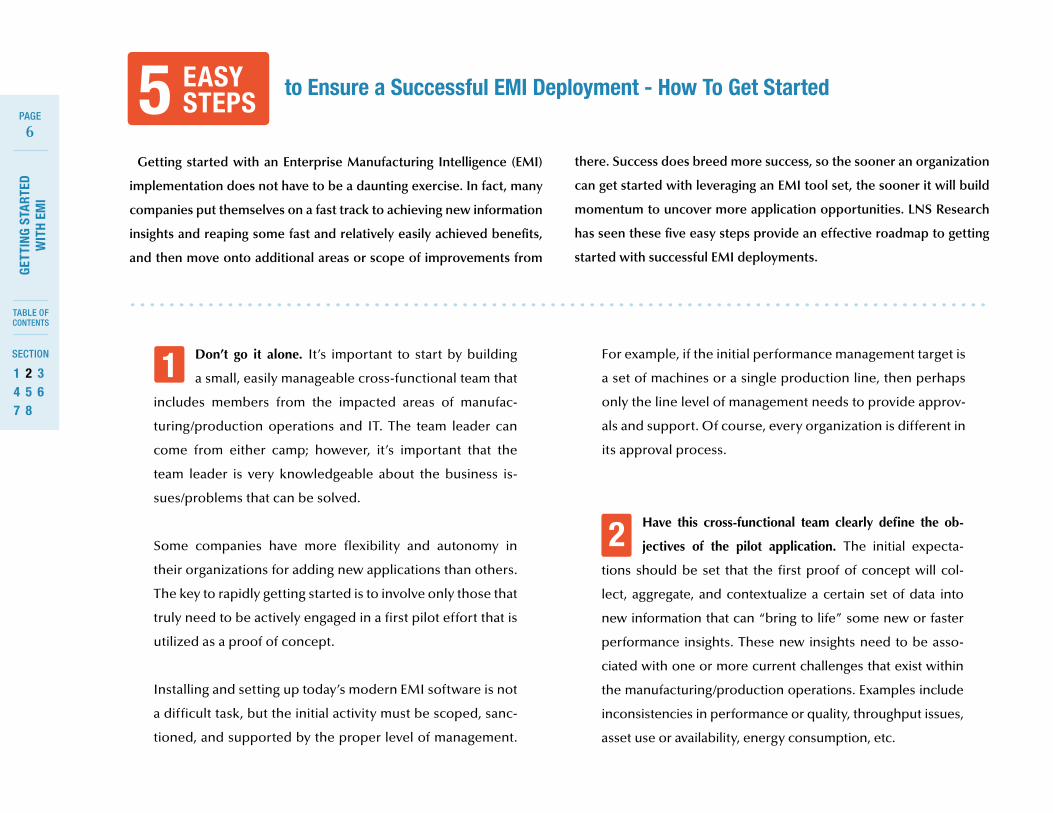
there. Success does breed more success, so the sooner an organization
can get started with leveraging an EMI tool set, the sooner it will build
momentum to uncover more application opportunities. LNS Research
has seen these five easy steps provide an effective roadmap to getting
started with successful EMI deployments.
6
GETT
ING
STAR
TED
W
ITH
EMI
SECTION
TABLE OF CONTENTS
PAGE
1 2 34 5 67 8
Have this cross-functional team clearly define the ob-
jectives of the pilot application. The initial expecta-
tions should be set that the first proof of concept will col-
lect, aggregate, and contextualize a certain set of data into
new information that can “bring to life” some new or faster
performance insights. These new insights need to be asso-
ciated with one or more current challenges that exist within
the manufacturing/production operations. Examples include
inconsistencies in performance or quality, throughput issues,
asset use or availability, energy consumption, etc.
Don’t go it alone. It’s important to start by building
a small, easily manageable cross-functional team that
includes members from the impacted areas of manufac-
turing/production operations and IT. The team leader can
come from either camp; however, it’s important that the
team leader is very knowledgeable about the business is-
sues/problems that can be solved.
Some companies have more flexibility and autonomy in
their organizations for adding new applications than others.
The key to rapidly getting started is to involve only those that
truly need to be actively engaged in a first pilot effort that is
utilized as a proof of concept.
Installing and setting up today’s modern EMI software is not
a difficult task, but the initial activity must be scoped, sanc-
tioned, and supported by the proper level of management.
1
2
EASY STEPS5 to Ensure a Successful EMI Deployment - How To Get Started
Getting started with an Enterprise Manufacturing Intelligence (EMI)
implementation does not have to be a daunting exercise. In fact, many
companies put themselves on a fast track to achieving new information
insights and reaping some fast and relatively easily achieved benefits,
and then move onto additional areas or scope of improvements from
For example, if the initial performance management target is
a set of machines or a single production line, then perhaps
only the line level of management needs to provide approv-
als and support. Of course, every organization is different in
its approval process.

7
GETT
ING
STAR
TED
W
ITH
EMI
SECTION
TABLE OF CONTENTS
PAGE
1 2 34 5 67 8
Ensure that the first proof of concept project is scoped
to be a short-term (1-3 months) slice for EMI. It’s im-
portant to not make this a time-consuming and expensive
effort to get momentum started. Otherwise, the pilot proj-
ect should be scaled back in complexity and scope to bring
it into this type of timeframe. While being limited in scope,
the project definition should include the ability to deliver
some anticipated results that can be documented for the
initial investment. Therefore, even though the project team
will not be sure, it’s important to get them to think in terms
of some small potential outcomes.
The pilot project will need to address issues like where and
how will the automated data collection occur. Will it con-
nect to data from existing Data Historians, imported from
spreadsheets, from inside of other application databases,
or collect data from manual data capture screens?
The pilot will also need to address how to deliver the right
information to the right role(s)/user(s). Oftentimes, a Web
After completing a successful short-term slice as de-
scribed above, your organization will likely produce
many more ideas as to how these same EMI tools and ap-
proaches can be scaled to address additional areas of your
manufacturing business. These additional areas can become
the next tactical EMI projects, or, better yet, form the basis
for a longer term, grander vision.
Once the organization is convinced that EMI can act as a
performance visualizer and accelerator, companies are
ready to define a long-term vision (1-5 years). This vision
should be transformative in the way in which your organi-
zation can work and collaborate in the future. The vision
should also capitalize on major trends in technology like
3
4
The target role(s) of the new information insights should be
identified in this early stage, such that their specific inputs can
be solicited, as well as to ensure that the displays and informa-
tion will be directly relevant to their job role(s) as part of the
EMI software configuration and display building process.
browser-based interface may be used, displaying onto ex-
isting screens or terminals that are already in use by these
same people. Today’s EMI software solutions are also of-
fering displays on mobile devices/tablets, so this may be a
good option depending on the users and availability within
your IT and manufacturing landscape.
By involving the end users in this proof of concept design
phase, you can determine what metrics are most meaningful
to provide, and what new actions can be potentially taken
based on having the new information insights.

8
GETT
ING
STAR
TED
W
ITH
EMI
SECTION
TABLE OF CONTENTS
PAGE
1 2 34 5 67 8
It’s important to select the right software and imple-
mentation partners that can work with you effectively
along this fast track journey. The software vendor should have
a technology tool set that can address both the quick project
cycles in the short term vision, as well as possess the capabil-
ities to scale to the sophistication of your long-term vision.
LNS Research recommends that you work with software
suppliers that have proven experience and a successful
track record in your company’s industry. In addition, en-
sure that whatever software solution is selected fits well
into your existing IT and application landscape to simplify
the data integration efforts. And, it is always a best practice
to speak with other users/customers of the solutions that
you are considering to understand more about their expe-
riences with both the software and the support provided.
5
using the “information anywhere” capabilities of mobile
devices and cloud-based applications. As part of the long-
term vision, you should also consider the use of “Big Data”
analytics to mine massive amounts of data and to support
a combination of corporate and manufacturing objectives.
By aligning the achievement of manufacturing objectives
that can be aided by EMI with overall corporate objectives,
your EMI vision and roadmap can become an essential in-
gredient for future business success.
Some companies have enough internal IT and application
expertise to implement EMI software on their own. If you
do need assistance from an integration/implementation
partner, you can consider working with the professional ser-
vices arm of the chosen software company. Or if you prefer
to work with a separate implementation provider, choose
one that is non-biased, but has an experienced practice
working with the chosen software. The implementation
partner should have the scale and resources to meet your
company’s long-term vision, but be able to deliver on quick
methodologies that meet your short-term vision and project
slices as well.
SECTION 3
Landscape of Organizations, Processes & Technology
10
GETT
ING
STAR
TED
W
ITH
EMI
SECTION
TABLE OF CONTENTS
PAGE
1 2 34 5 67 8
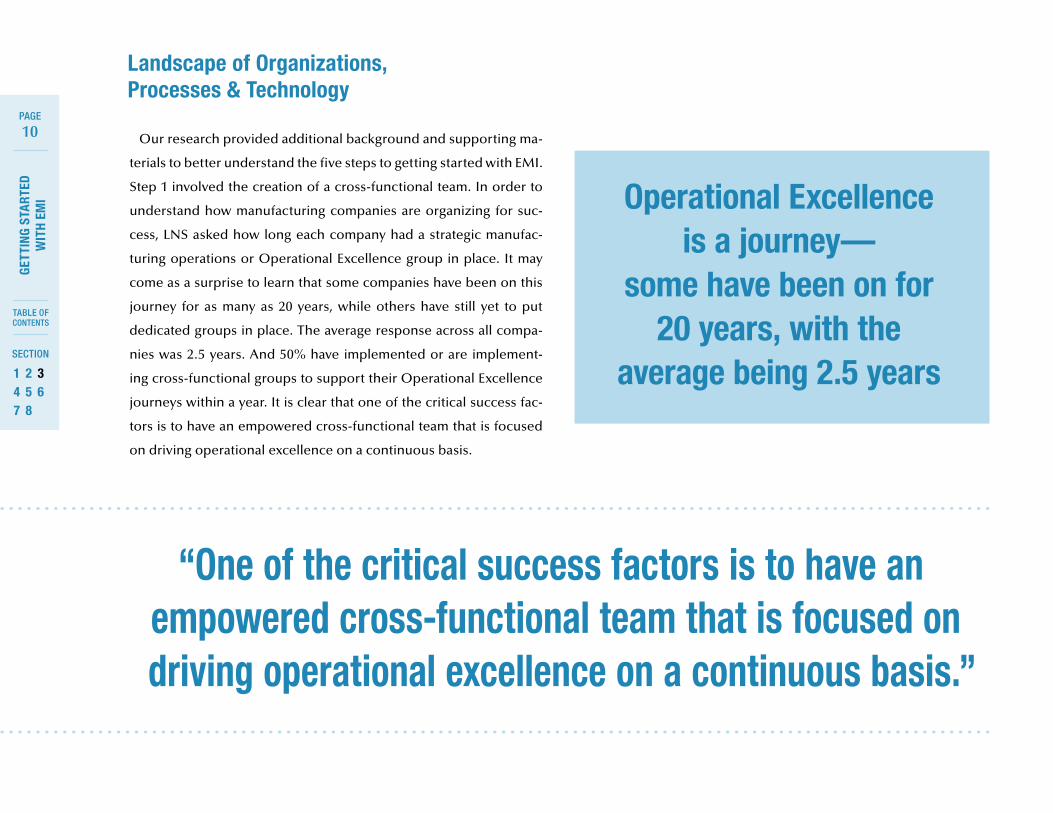
Our research provided additional background and supporting ma-
terials to better understand the five steps to getting started with EMI.
Step 1 involved the creation of a cross-functional team. In order to
understand how manufacturing companies are organizing for suc-
cess, LNS asked how long each company had a strategic manufac-
turing operations or Operational Excellence group in place. It may
come as a surprise to learn that some companies have been on this
journey for as many as 20 years, while others have still yet to put
dedicated groups in place. The average response across all compa-
nies was 2.5 years. And 50% have implemented or are implement-
ing cross-functional groups to support their Operational Excellence
journeys within a year. It is clear that one of the critical success fac-
tors is to have an empowered cross-functional team that is focused
on driving operational excellence on a continuous basis.
Landscape of Organizations, Processes & Technology
“One of the critical success factors is to have an empowered cross-functional team that is focused on driving operational excellence on a continuous basis.”
Operational Excellence is a journey—
some have been on for 20 years, with the
average being 2.5 years

11
GETT
ING
STAR
TED
W
ITH
EMI
SECTION
TABLE OF CONTENTS
PAGE
1 2 34 5 67 8
Most continuous improvement activities start by better understand-
ing and mapping existing processes and results and then looking for
ways to make impactful, incremental improvements. These teams
need reliable data and information that can be the basis for baseline
measurements and ongoing improvements. This is a key area where
EMI software can provide support.
When looking at the popular manufacturing programs and initiatives
Manufacturing Programs Implemented or Planned
LEAN MANUFACTURING
ISO 9000/9001
OPERATIONAL EXCELLENCE
SIX SIGMA
TQM
ISO 14001
GOOD MFG. PRACTICES CGMP
OHSAS 18001
DEMAND-DRIVEN MANUFACTURING
COMPANY-WIDE CUSTOM COMBINATION
DIGITAL MANUFACTURING
ISO 22000
0% 5% 10% 15% 20% 25% 30%
29%
25%
23%
22%
13%
11%
11%
7%
7%
5%
4%
2%
that are either in place or planned across a broad set of industries,
73% of manufacturing / production companies have formal programs
in place or else planned for the following year. LNS found that most
companies are implementing combinations of the programs in this
graph in order to meet their strategic objectives, as opposed to just
one. And in some cases, companies have customized combinations
of these well-established programs to tailor them to their businesses.
73% have formal programs in place or planned for next year
12
GETT
ING
STAR
TED
W
ITH
EMI
SECTION
TABLE OF CONTENTS
PAGE
1 2 34 5 67 8
All of these manufacturing programs require accurate data col-
lection and analysis in order to measure and guide their respec-
tive success. Most companies start out by manually collecting the
data and performing analyses, and as their programs progress,
by automating the data collection with more integrated systems
and providing their teams with better analysis tools that facilitate
quicker access and responses to information.
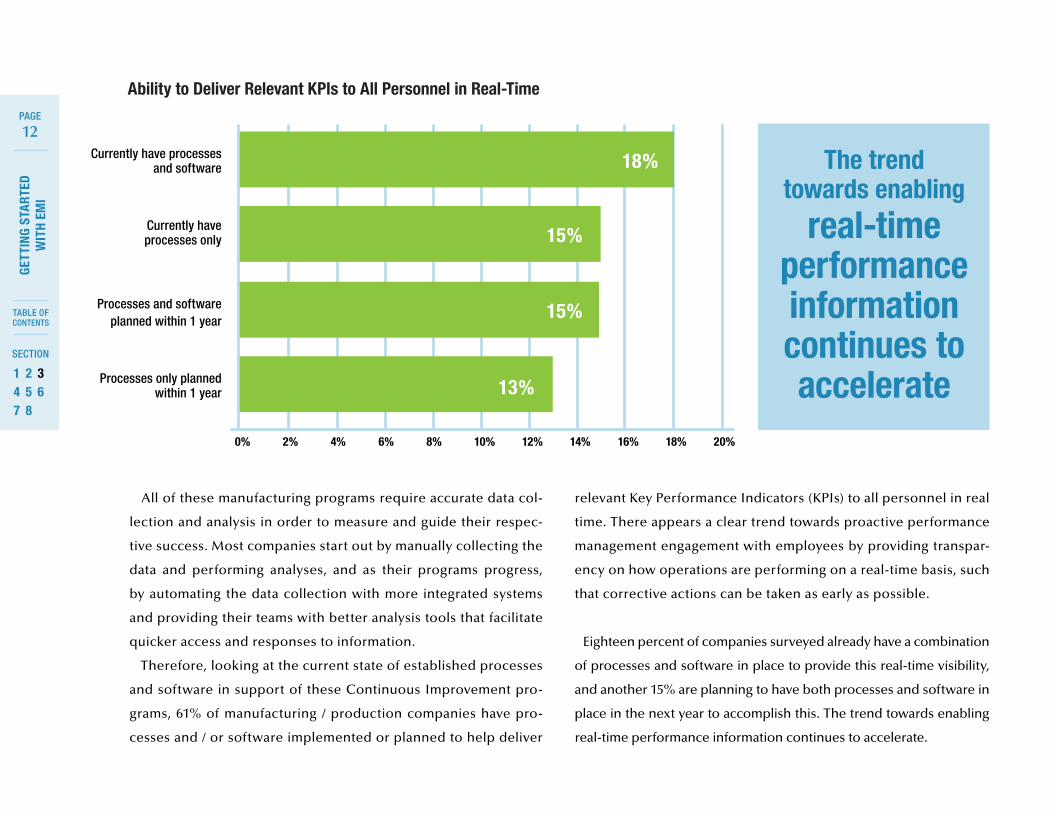
Therefore, looking at the current state of established processes
and software in support of these Continuous Improvement pro-
grams, 61% of manufacturing / production companies have pro-
cesses and / or software implemented or planned to help deliver
Currently have processes and software
Currently have processes only
Processes and software planned within 1 year
Processes only planned within 1 year
0% 2% 4% 6% 8% 10% 12% 14% 16% 18% 20%
18%
15%
15%
13%
relevant Key Performance Indicators (KPIs) to all personnel in real
time. There appears a clear trend towards proactive performance
management engagement with employees by providing transpar-
ency on how operations are performing on a real-time basis, such
that corrective actions can be taken as early as possible.
Eighteen percent of companies surveyed already have a combination
of processes and software in place to provide this real-time visibility,
and another 15% are planning to have both processes and software in
place in the next year to accomplish this. The trend towards enabling
real-time performance information continues to accelerate.
Ability to Deliver Relevant KPIs to All Personnel in Real-Time
The trend towards enabling
real-time performance information continues to accelerate

SECTION 4
Top Manufacturing Objectives & Challenges

14
GETT
ING
STAR
TED
W
ITH
EMI
SECTION
TABLE OF CONTENTS
PAGE
1 2 34 5 67 8
In support of Step 2 of how to get started with EMI, it’s import-
ant to align your proof of concept project to a specific subset of
objectives and challenges. Therefore, we wanted to share related
research in these areas. The LNS Research Manufacturing Oper-
ations Management (MOM) survey data collected to date show
that the combination of the top 1, 2, and 3 strategic objectives for
manufacturing industries are related to serving customers. First
and foremost is ensuring consistency of quality for products pro-
duced, followed by being responsive to customer order demands.
These areas of customer focus bode well for the industry given
that, if customers are not being properly served and satisfied, then
nothing else will matter for a manufacturing / production business
in a rapid fashion.
We can also see that there are many other strategic objectives
that need to be simultaneously managed in order to have a suc-
cessful business. These include meeting regulatory compliance,
improving on production capabilities, getting new products to
market more quickly, and others. These research data show that
there are multiple strategic objectives that are of some significant
importance – all of which need to be simultaneously improved
upon. This makes for a challenging environment, whereby better
tools and information can be of assistance.
Ensuring consistent quality of products
Responsiveness to customer order demands
Increasing production capacity and capabilities
Getting new products to market faster
Tighter alignment of business and manufacturing goals
Global alignment and standardization of manufacturing processes and reporting
Regulatory compliance
Improving environment, health, and safety performance
Effective human resource skills and management
0% 10% 20% 30% 40% 50% 60% 70%
66%
56%
49%
42%
39%
35%
33%
32%
30%
Top Strategic Manufacturing Objectives - #1, #2, & #3
Serving customers
takes top
priority
15
GETT
ING
STAR
TED
W
ITH
EMI
SECTION
TABLE OF CONTENTS
PAGE
1 2 34 5 67 8
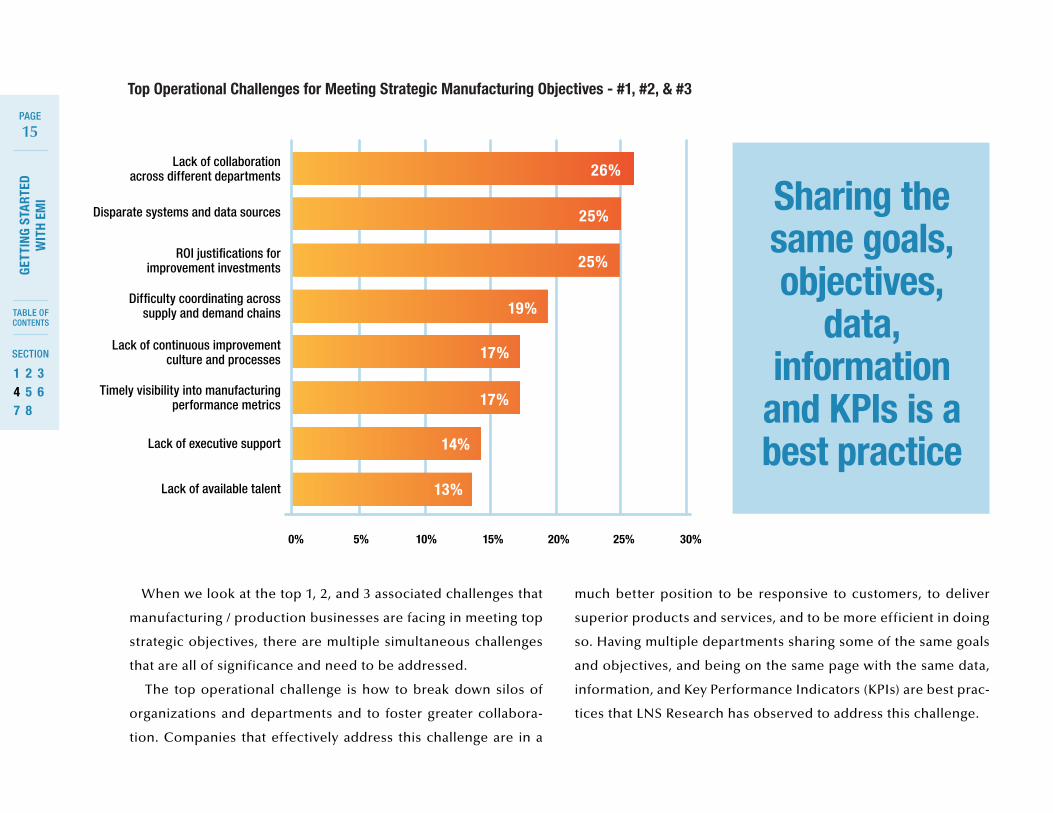
When we look at the top 1, 2, and 3 associated challenges that
manufacturing / production businesses are facing in meeting top
strategic objectives, there are multiple simultaneous challenges
that are all of significance and need to be addressed.
The top operational challenge is how to break down silos of
organizations and departments and to foster greater collabora-
tion. Companies that effectively address this challenge are in a
much better position to be responsive to customers, to deliver
superior products and services, and to be more efficient in doing
so. Having multiple departments sharing some of the same goals
and objectives, and being on the same page with the same data,
information, and Key Performance Indicators (KPIs) are best prac-
tices that LNS Research has observed to address this challenge.
Lack of collaboration across different departments
Disparate systems and data sources
ROI justifications for improvement investments
Difficulty coordinating acrosssupply and demand chains
Lack of continuous improvement culture and processes
Timely visibility into manufacturing performance metrics
Lack of executive support
Lack of available talent
0% 5% 10% 15% 20% 25% 30%
26%
25%
25%
19%
17%
17%
14%
13%
Top Operational Challenges for Meeting Strategic Manufacturing Objectives - #1, #2, & #3
Sharing the same goals, objectives,
data, information
and KPIs is a best practice
16
GETT
ING
STAR
TED
W
ITH
EMI
SECTION
TABLE OF CONTENTS
PAGE
1 2 34 5 67 8
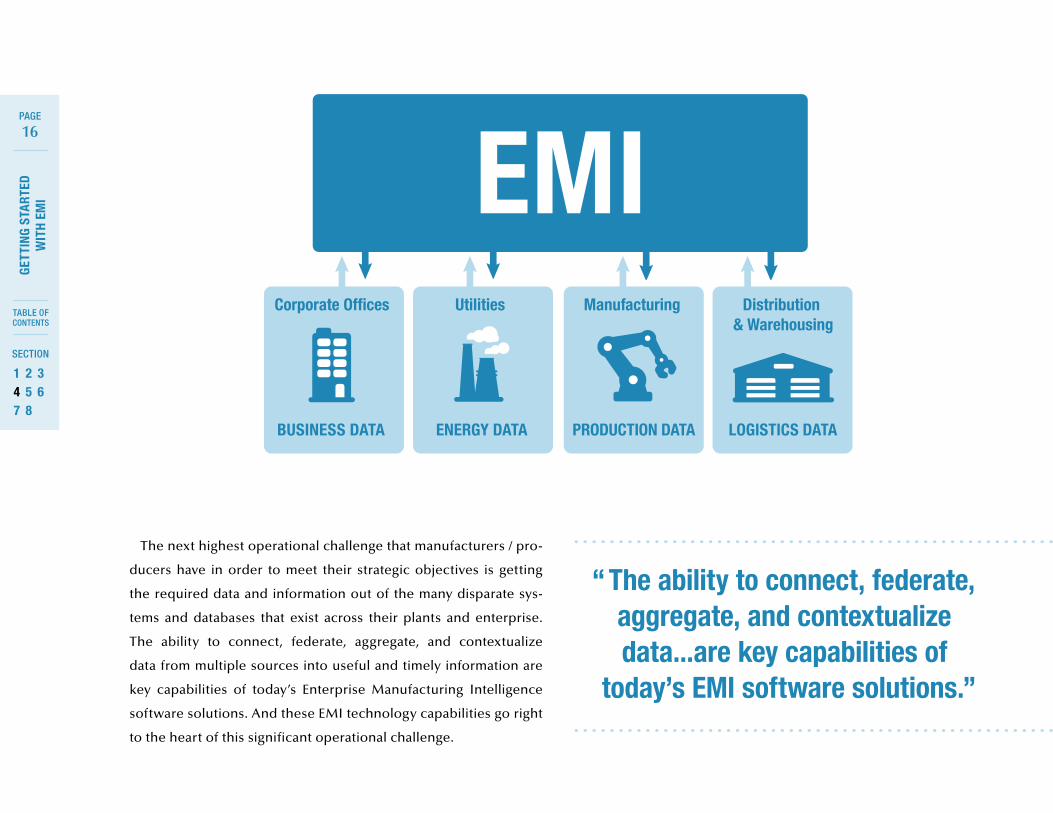
The next highest operational challenge that manufacturers / pro-
ducers have in order to meet their strategic objectives is getting
the required data and information out of the many disparate sys-
tems and databases that exist across their plants and enterprise.
The ability to connect, federate, aggregate, and contextualize
data from multiple sources into useful and timely information are
key capabilities of today’s Enterprise Manufacturing Intelligence
software solutions. And these EMI technology capabilities go right
to the heart of this significant operational challenge.
“The ability to connect, federate, aggregate, and contextualize data...are key capabilities of
today’s EMI software solutions.”

17
GETT
ING
STAR
TED
W
ITH
EMI
SECTION
TABLE OF CONTENTS
PAGE
1 2 34 5 67 8
The next challenge is one that we have a lot of discussion with
manufacturers / producers and software vendors alike. Creating a
return on investment (ROI) business case to make operational im-
provements and justifying capital project expenditures or expense
budget expenditures can be a tedious and lengthy process. Good
data and information can go a long way towards simplifying and
improving this process.
It is often challenging to get good baseline performance infor-
mation. Therefore, one popular approach to defining the short-
term slice of EMI in Step 3, is to start with putting in the ‘as is’ per-
formance metrics. Sometimes the required data to observe or
calculate performance metrics is not even being measured or
collected. This is where automated data collection systems like
Historians can be a first fundamental step towards justifying and
tracking the results of operational improvement programs.

18
GETT
ING
STAR
TED
W
ITH
EMI
SECTION
TABLE OF CONTENTS
PAGE
1 2 34 5 67 8
Company culture comes out of the examples set by management
and the actions of all employees. Therefore, the next top operational
challenge of building a continuous improvement culture and sup-
porting processes is a longer and never-ending journey for any or-
ganization. Industry experience has shown that without also making
continuous improvements to the associated measurement, data, and
information systems, building a competitive performance culture is
not going to be possible.
Another key way of getting this type of culture ingrained into the DNA
of an organization is to provide universal and timely visibility into man-
ufacturing performance metrics. This links directly with where many
organizations go with Step 4 of getting started with EMI. After getting
some experience on a smaller scale, they see that the longer term vi-
sion can support a cultural shift. When everyone across an organiza-
tion is aligned in their individual, group, and company goals and armed
with the information they need at their fingertips, truly great things can
happen. We can see from the survey that timely visibility into manufac-
turing performance metrics was among the top operational challenges.

SECTION 5
EMI - Further Explained

20
GETT
ING
STAR
TED
W
ITH
EMI
SECTION
TABLE OF CONTENTS
PAGE
1 2 34 5 67 8
This section is intended to assist with Step 5 of getting started
with EMI - by providing additional technology and requirements
information to consider as you select a solution partner for your
journey. EMI software is a crucial tool that organizations have been
using to gain immediate and actionable intelligence from both shop
floor automation and enterprise business systems.
EMI - Further Explained
• Bringstogetherbusiness,energy,production,and
logistics data by connecting to disparate sources –
equipment, systems, applications, and databases
• Often used as an intermediary step to connect
to multiple different Data Historians and other
available databases serving as real-time data
collection applications that may contain
manually input data from energy, production,
and logistics data
• Contextualizes data into relevant and useful
information using calculations and data models
to make it immediate and actionable to
decision makers
Enterprise Manufacturing Intelligence (EMI)
21
GETT
ING
STAR
TED
W
ITH
EMI
SECTION
TABLE OF CONTENTS
PAGE
1 2 34 5 67 8
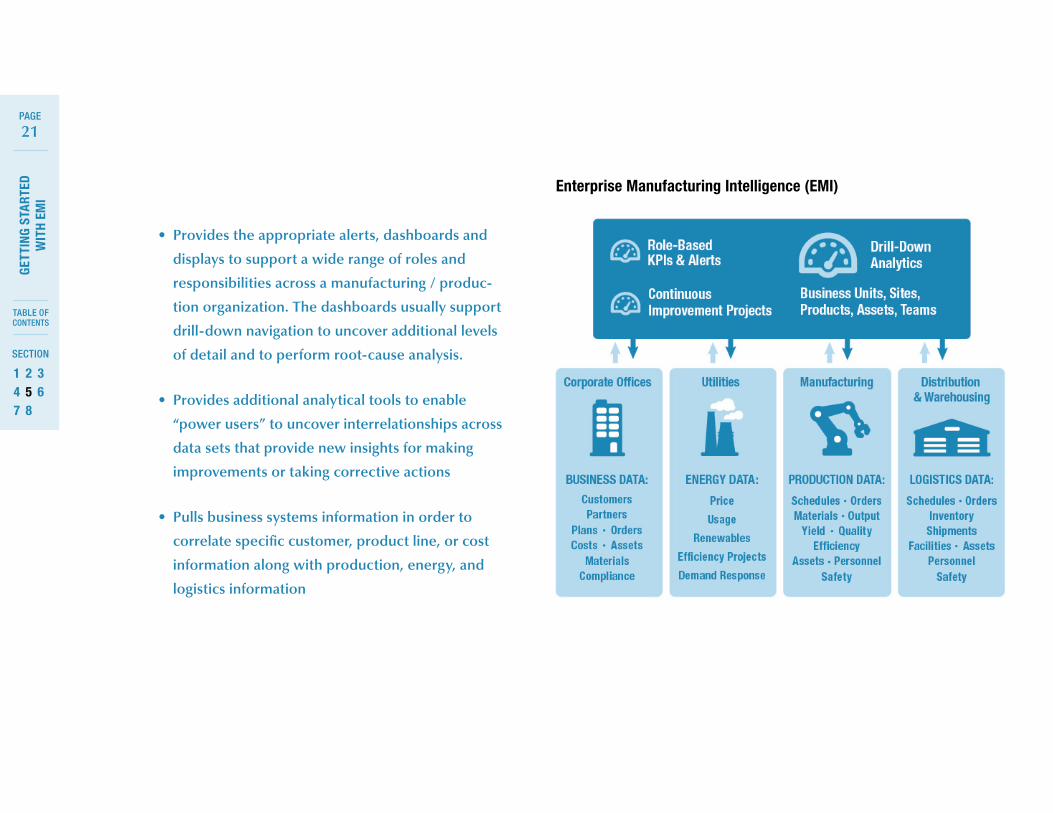
• Provides the appropriate alerts, dashboards and
displays to support a wide range of roles and
responsibilities across a manufacturing / produc-
tion organization. The dashboards usually support
drill-down navigation to uncover additional levels
of detail and to perform root-cause analysis.
• Providesadditionalanalyticaltoolstoenable
“power users” to uncover interrelationships across
data sets that provide new insights for making
improvements or taking corrective actions
• Pulls business systems information in order to
correlate specific customer, product line, or cost
information along with production, energy, and
logistics information
Enterprise Manufacturing Intelligence (EMI)

22
GETT
ING
STAR
TED
W
ITH
EMI
SECTION
TABLE OF CONTENTS
PAGE
1 2 34 5 67 8
Impact of Mobile Technology
• MobiledisplaysnowallowEMIfunctionalityon
smart phones and tablets
• Full visual capability supported from operator
up through managers and executives
• Operators, supervisors, maintenance, quality,
and engineering personnel no longer need to be
tethered to the factory for information
• Reduced time to react to potential operational
issues, with alerts sent directly to each involved
person’s device of choice
• Allows executives who previously never viewed
manufacturing level reporting to see and com-
pare real-time information from across multiple
plants, and to get new business unit and product
line views of performance

SECTION 6
Case Study

24
GETT
ING
STAR
TED
W
ITH
EMI
SECTION
TABLE OF CONTENTS
PAGE
1 2 34 5 67 8
CASE STUDY Hillshire Farms Sausage
BUSINESS PROBLEMBACKGROUND
Jimmy Dean, part of the Hillshire Brands portfolio, is the largest
retailer of refrigerated breakfast sausages in the U.S., outselling the
next top four producers combined. The company attributes this
leading position in part to delivering consistently high-quality and
uniform products while keeping costs low and throughput high.
The company’s Newbern, TN plant produces more than 150 million
pounds of sausage annually, with two-thirds of this production total
dedicated to one-pound sausage rolls (“chubs”). Chubs that are
off-weight are manually sliced open and checked for contaminants,
at which point, they are placed back into the system or discarded,
both costly options. Since the product is priced per package, any
amount of weight over the requirement is lost revenue, and any
under risks customer satisfaction. In addition, the company must
comply with the Federal Meat Inspection Act, which requires that
packages of meat products are accurate to weight labels.
Newbern plant operators were experiencing unacceptable varianc-
es in chub weight, resulting in lost revenue and compliance issues,
but lacked the control-system data to understand the amounts or
the cause of throwaway.
Meeting federal compliance was a concern, and plant engineers
saw an opportunity to reduce weight variances if the source of the
problem could be pinpointed.

25
GETT
ING
STAR
TED
W
ITH
EMI
SECTION
TABLE OF CONTENTS
PAGE
1 2 34 5 67 8
SOLUTION RESULTS
Senior Engineer Jon Riechert brought in third-party expertise to
implement an EMI solution suite, which integrated directly to the
control platform that provides access to the plant’s real-time produc-
tion data.
In addition, the 11 chub-line machines at Newbern were connect-
ed to a Data Historian, allowing the team to collect data over lon-
ger-term periods for trend viewing and more accurate performance
comparisons. Newbern engineers were able to pinpoint when chub
variances began and better examine the causes through a custom-
ized dashboard accessible from any browser.
“The Newbern team had full control over what that they wanted to
see on the dashboards,” said Riechert. “I’ve worked with this soft-
ware enough to understand that there are almost infinite possibilities
of what it can show visually.”
The data access enabled by this EMI implementation translated
to a yield improvement of nearly 0.10% within the first six weeks of
system roll-out, the equivalent of saving 105,000 chubs a year and
hundreds of thousands of dollars in cost of goods sold.
“Before we implemented this system, operators could only see how
many bad apples were produced,” Reichert said. “Now operators can
see weight fluctuations along the line, the exact giveaways on fin-
ished chubs, machine downtime, OEE, and even meat temperature.”
While the 0.10% yield improvement satisfied the company’s ROI
justification, the company expects chub giveaway to be reduced
another several tenths of a percent, increasing yield by up to 0.50%,
or more than half a million pounds of sausage. The tremendous
success of the implementation has even spurred the potential for
further system development.
“We are currently considering adding energy-use metrics to the
system at several plants,” said Reichert. “The information is empow-
ering and the operators want more.”
Within the first six weeks of system roll-out… saving hundreds of thousands of dollars in cost of goods sold
CASE STUDY Hillshire Farms Sausage
SECTION 7
EMI Adoption Trends
27
GETT
ING
STAR
TED
W
ITH
EMI
SECTION
TABLE OF CONTENTS
PAGE
1 2 34 5 67 8
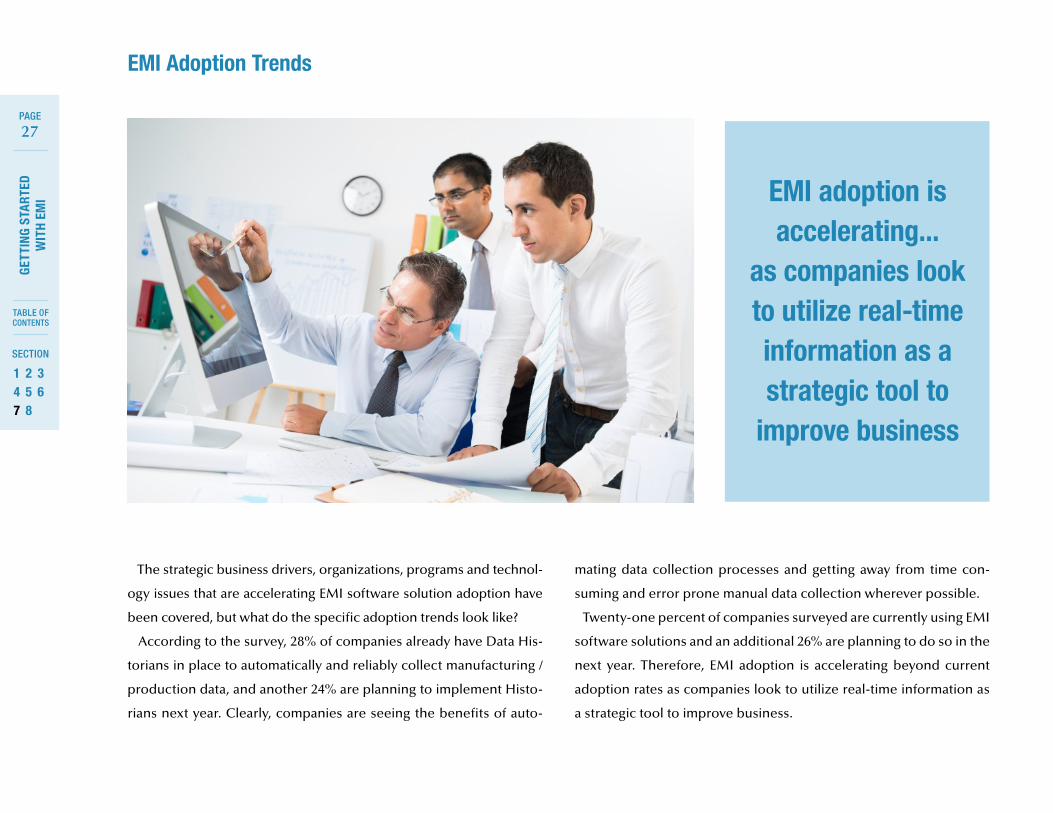
The strategic business drivers, organizations, programs and technol-
ogy issues that are accelerating EMI software solution adoption have
been covered, but what do the specific adoption trends look like?
According to the survey, 28% of companies already have Data His-
torians in place to automatically and reliably collect manufacturing /
production data, and another 24% are planning to implement Histo-
rians next year. Clearly, companies are seeing the benefits of auto-
mating data collection processes and getting away from time con-
suming and error prone manual data collection wherever possible.
Twenty-one percent of companies surveyed are currently using EMI
software solutions and an additional 26% are planning to do so in the
next year. Therefore, EMI adoption is accelerating beyond current
adoption rates as companies look to utilize real-time information as
a strategic tool to improve business.
EMI Adoption Trends
EMI adoption is accelerating...
as companies look to utilize real-time information as a strategic tool to
improve business
28
GETT
ING
STAR
TED
W
ITH
EMI
SECTION
TABLE OF CONTENTS
PAGE
1 2 34 5 67 8
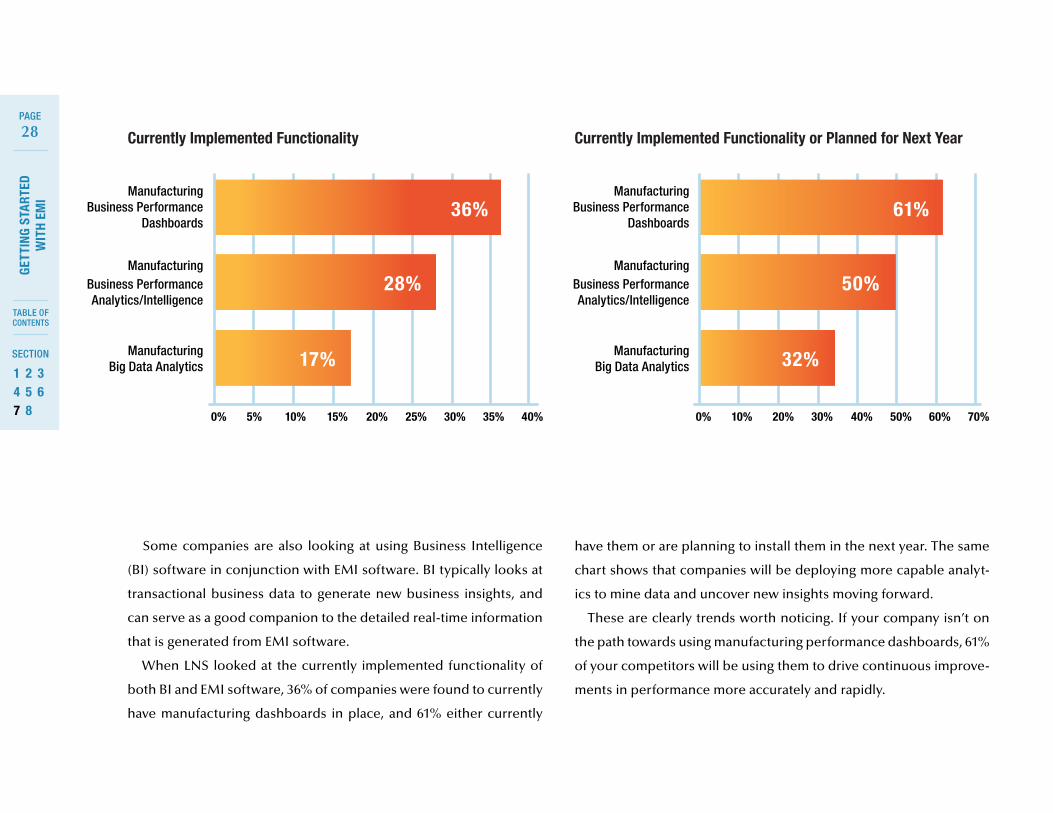
Some companies are also looking at using Business Intelligence
(BI) software in conjunction with EMI software. BI typically looks at
transactional business data to generate new business insights, and
can serve as a good companion to the detailed real-time information
that is generated from EMI software.
When LNS looked at the currently implemented functionality of
both BI and EMI software, 36% of companies were found to currently
have manufacturing dashboards in place, and 61% either currently
have them or are planning to install them in the next year. The same
chart shows that companies will be deploying more capable analyt-
ics to mine data and uncover new insights moving forward.
These are clearly trends worth noticing. If your company isn’t on
the path towards using manufacturing performance dashboards, 61%
of your competitors will be using them to drive continuous improve-
ments in performance more accurately and rapidly.
Manufacturing Business Performance
Dashboards
Manufacturing Business Performance Analytics/Intelligence
Manufacturing Big Data Analytics
Manufacturing Business Performance
Dashboards
Manufacturing Business Performance Analytics/Intelligence
Manufacturing Big Data Analytics
0% 5% 10% 15% 20% 25% 30% 35% 40% 0% 10% 20% 30% 40% 50% 60% 70%
36% 61%
28% 50%
17% 32%
Currently Implemented Functionality Currently Implemented Functionality or Planned for Next Year
SECTION 8
Summary/Recommendations

30
GETT
ING
STAR
TED
W
ITH
EMI
SECTION
TABLE OF CONTENTS
PAGE
1 2 34 5 67 8
Fact: As the above box plot shows, companies that have adopted EMI
software solutions are experiencing a 5% higher OEE performance.
Over
all E
quip
men
t Effe
ctiv
enes
s
Median
EMI Adoption
74 69
Currently Implemented Not Implemented
90
85
80
75
70
65
60
55
50
45
40
35
On T
ime
and
Com
plet
e Sh
ipm
ents
Median
Data Historian Adoption
96 92
Currently Implemented Not Implemented
100
98
96
94
92
90
88
86
84
82
Fact: As the above box plot shows, companies that have adopted His-
torian software for automated data collection also have 4% higher
On-Time and Complete Product Shipments.
Summary/RecommendationsBenefits of a Successful EMI Implementation
Analysis of the LNS Research MOM survey has uncovered the fol-
lowing facts in relation to benefits of a successful EMI implementation.
Fact: Companies that have more maturity in their organizations and manufacturing excellence programs are also using Historians for automat-
ed data collection and EMI software solutions. As evidence of this, the users of these technologies have had their Continuous Improvement
organizations in place for an average of 5.4 years versus an average of 2.5 years for all companies.

31
GETT
ING
STAR
TED
W
ITH
EMI
SECTION
TABLE OF CONTENTS
PAGE
1 2 34 5 67 8
Manufacturers are using a combination of proven program meth-
odologies and process improvements to drive bottom-line results.
Key to achieving these results is the ability to harness the capabilities
and collaboration of the different people that contribute to success,
and to empower them with the best possible information and tools
that enable them to consistently perform their jobs and get results.
Many organizations tell us that they are drowning in data, but
starving for good information. In order to harness all of the dif-
ferent data sources into useful information and analysis, EMI soft-
ware solutions are now well proven and easier than ever to deploy.
Companies can start with a narrowly defined problem area and
then quickly scale the scope of their EMI solution over time – often
funding the expansion of their initiatives from savings that were
achieved in the previous deployments.
In order to be most successful, five easy steps should be followed to
ensure a successful EMI deployment:
1. Build a cross-functional team to define an initial proof of concept
2. Clearly define the objectives and users/roles of the new information insights
3. Implement a short-term (1-3 months) slice for an EMI pilot
4. Use initial results to define a long term-vision (1-5 years)
5. Select the right software and implementation partners that match the short and long-term requirements of your EMI journey
1
2
3
4
5
Summary/Recommendations - Continued
From our analysis of survey data, we can conclude that companies
that are using Historians for automated data collection and EMI soft-
ware solutions are about three years ahead of competition on the
maturity of their Continuous Improvement programs. They are also
enjoying the benefits of 5% greater OEE performance and 4% better
On-Time and Complete Delivery to customers.
When we reflect on the case study, we can also conclude that EMI
software solutions are directly contributing to reductions in waste
and bottom line cost savings.
LNS Research recommends EMI software solutions as a solid place to start for enabling continuous
improvements

COLOR BY HQ LOCATION
Asia / Pacific
Europe
North America
Rest of the World
32
GETT
ING
STAR
TED
W
ITH
EMI
SECTION
TABLE OF CONTENTS
PAGE
1 2 34 5 67 8
Research Demographics for Manufacturing Operations Management Survey
The pie charts above provide background information on the
LNS Research MOM survey participants. Each was asked to fill in
basic demographic data. As shown, the results depict a diverse set
of respondents. There were 37.1% from the discrete manufacturing
industries, 17.0% from process manufacturing, 15.2% from food &
beverage/consumer packaged goods, 11.4% from life sciences and
19.3% for all others. Nearly 67% of the executives surveyed were
from Small to Medium businesses, with 33.6% from companies
with revenue greater than $1 billion. Geographically, North Amer-
ican companies comprised half of respondents, 30.1% were from
Europe, 11.9% from the Asia/Pacific region, and 8.0% were from
the rest of world.
COLOR BY INDUSTRY
Discrete Manufacturing
F&B / CPG
Life Sciences
Other
Process Manufacturing
COLOR BY COMPANY REVENUE
Large: $1BB+
Medium: $250MM - $1BB
Small: $0 - $250MM
33
GETT
ING
STAR
TED
W
ITH
EMI
SECTION
TABLE OF CONTENTS
PAGE
1 2 34 5 67 8
Author:
Mark Davidson
Principal Analyst
Presented by:
lnsresearch.com
Connect:
© LNS Research, 2014. All Rights Reserved.
www.rockwellautomation.com