SOTETSU HERITAGE Cycads, sustenance and cultural landscapes in the Amami islands
Upload
independentCategory
view
0download
0
INTEGRABILITY OF SOLAR ENERGY SYSTEMS INBUILDINGS FOR SELF- SUSTENANCE
Dissertation Submitted by
HARKIRAT SINGH113701100
B.ARCHITECTURE VII SEMESTER
FACULTY OF ARCHITECTURE AND PLANNING

MANIPAL UNIVERSITY
NOVEMBER 2014
FACULTY OF ARCHITECTURE AND PLANNINGMANIPAL UNIVERSITY
CERTIFICATE
We certify that the Dissertation entitled “INTEGRIBILITY
OF RENEWABLE ENERGY SYSTEMS IN BUILDINGS FOR SELF-
SUSTENANCE”, that is being submitted by Master. HARKIRAT
SINGH 113701100, in the VII semester of Architecture
undergraduate program, Faculty of Architecture and
Planning, Manipal University, Manipal is a record of
bonafide work, to the best of our knowledge.

ACKNOWLEDGEMENT
I would like to express my deepest appreciation to allthose who provided me the possibility to complete thisreport. A special gratitude I give to our DissertationFaculty in Charge ar. Sahana and my Guide Ar. AhmadullahKhan whose contribution in stimulating suggestions andencouragement, helped me to coordinate my topicespecially in writing this report. Further, I would alsolike to acknowledge with much appreciation the crucialrole of the MIT Library which helped me to access all thepossible books and journals that were needed to bestudied for my topic. A special thanks goes to my guideAr. Ahmedullah Khan, who helped me to assemble the partsand gave suggestion about the topic and helped mestructure my topic accordingly. Last but not least, manythanks go to all the articles and journals without whichit would not be possible to study this topic completely.I have to appreciate the guidance given by otherfaculties and the review of the other panels. Theiradvices and feedback has helped me to go about the studyin the right direction. I would like to express mygratitude towards my Director Mr. Nishant H. Manapure andmy college Faculty of Architecture for their kind co-operation and encouragement which help me in completionof this dissertation. My thanks and appreciations also go

to my batchmates and every other people who havewillingly helped me out with their abilities.

ABSTRACT This study aims at renewable sources of energygeneration and their compatibility and feasibility ofintegration into different building typologies forachieving self-sustenance in energy production. Theeffects of such systems on building location, form andsizes and vice versa. A comparative analysis is conductedbetween traditional non-renewable sources of energy andrenewable source of energy in terms of economicfeasibility. The data so procured is analyzed for use inrural and urban contexts. Further an analytical study isconducted to check system feasibility in an off-grid typesystem situation. Case studies are conducted as ananalytical study to see the systems productivity andworkability in existing situations.

TABLE OF CONTENTS
1. INTRODUCTION:1.1 Background
1.2 Relevance of the study
1.3 Aim
1.4 Research question
1.5 Objectives
1.6 Definitions
1.7 Scope and Limitations
1.8 Methodology
1.9 Outcome of the research
2. SOLAR ENERGY SYSTEMS:2.1 Introduction
2.2 History of Solar Energy systems
2.3 Applications

2.3.1 Photovoltaics
2.3.2 Photovoltaic Production system
2.4 Energy Economics
2.5 Grid Parity
2.6 Energy Payback
3. BUILDING INTEGRIBILITY3.1 Introduction
3.2 Principles in Building Integration
3.2.1 Key Design issues in Building Integrated
Photovoltaics
3.3 Types of Building Integrated Photovoltaics
3.3.1 Roof Mounted systems
3.3.2 Façade Mounting
3.4 Market Segmentation
3.5 Global and Indian scenario
3.5.1 Indian Scenario
3.6 Technical Analysis
3.6.1 Installation of BiPV and Component Details
3.7 Positioning of Solar Panels
4. REFRENCES

1.INTRODUCTION:The subject focuses on integrating solar energy systems
in buildings for self-sustenance in energy generation.
This includes the capability and probability of making
the building as an off-grid system with it requiring no

external grid based power source for its day to day
functions. It focuses solely on renewable sources of
energy generation to counter the growing problem of
climate change whilst providing a cleaner and ever-
present source of power.
1.1 BACKGROUND:The current energy scenario has led to a major
depletion resource banks for generating energy to meet
with the world’s requirement. A significant amount of
energy available from commercial sources i.e. coal,
oil, natural gas etc. is used for the production of
electricity. Data on the installed capacity and the
electricity produced in the world from these sources [1]
[2] [3] shows that the electricity produced has increased
from 6117 TWh in 1973 to 17540 TWh in 2004 over a
period of 30 years with the average per year increment
being 365 TWh.
The current trend for world energy production can be
seen in Table 1.1
Energy use in terawatt-hours
FossilNuclea
r
Renewabl
eTotal
1990 83,374 6,113 13,082102,56
9
2000 94,493 7,857 15,337 117,68

7
2008117,07
68,283 18,492
143,85
1
Change
2000-
2008
+23.9% +5.4% +20.6% +22.2%
Table 1.1[4]
Rates of World Energy usage [5]
.
The estimates of remaining non-renewable worldwide
energy resources vary, with the remaining fossil fuels
totaling an estimated 0.4 YJ (1 YJ = 1024J) and the
available nuclear fuel such as uranium exceeding
2.5 YJ. Fossil fuels range from 0.6 to 3 YJ if
estimates of reserves of methane clathrates are
accurate and become technically extractable. The total
energy flux from the sun is 3.8 YJ/yr., though not all
of this is available for human consumption. The IEA

estimates for the world to meet global energy demand
for the two decades from 2015 to 2035 it will require
investment of $48 trillion and "credible policy
frameworks."[6]
Global warming emissions resulting from energy
production are an environmental problem. Efforts to
resolve this include the Kyoto Protocol, which a UN
agreement is aiming to reduce harmful climate impacts,
which a number of nations have signed. Limiting global
temperature increase to 2 degrees Celsius, thought to
be a risk by the SEI, is now doubtful.
To limit global temperature to a hypothetical 2 degrees
Celsius rise would demand a 75% decline in carbon
emissions in industrial countries by 2050, if the
population is 10 billion in 2050.[7] Across 40 years,
this averages to a 2% decrease every year. In 2011, the
emissions of energy production continued rising
regardless of the consensus of the basic problem.
Hypothetically, according to Robert
Engelmann (Worldwatch institute), in order to prevent
collapse, human civilization would have to stop
increasing emissions within a decade regardless of the
economy or population (2009).[8]
Changing climate, pollution and energy poverty are
significant problems and addressing them requires major
changes to energy infrastructures. [9] Renewable energy

technologies are important contributors to the energy
demand, as they contribute to energy security
worldwide, reduce dependency on fossil fuels and
provide opportunities for reducing the impact of
greenhouse gases.
Climate destroying fossil fuels are now being replaced
with clean, climate-steadying un- exhaustive renewable
sources of energy.
Internationally there is a strong support towards for
alternate sources of energy to address the problem of
energy insecurity. These alternate sources include
renewable sources of energy such as solar, wind, tidal,
geothermal etc. and providing government incentives to
encourage use and development.
Renewable energy sources were estimated 16.7% of global
final energy consumption in 2010. By the end of 2011,
total renewable power capacity worldwide exceeded 1,360
GW, up 8%. Of this total, modern renewable energy
accounted for an estimated 8.2%, while the share from
traditional biomass has declined slightly to an
estimated 8.5%. In the power renewables accounted for
almost half of the 208 GW of capacity added globally
during 2011. Wind and solar photovoltaics (PV)
accounted for almost 40% and 30%. [10]
This growth has been possible due to concerted effort
by the governments in providing financial setup to
provide low interest rates, subsidized prices and

reduced taxes to make the system more economical and
viable for purchase and implementation.
Projected renewable energy investment growth globally[11]
1.2 RELEVANCE OF THE STUDY:Based on the above data for fossil fuels, consumption
is slated to increase rapidly whilst the production
remaining the same providing energy accessibility
problems.
The average rate of oil production in the world is
declining at a steady pace and peak in production is
expected to be achieved by 2015.Thereafter the
production will steadily decline and most of the
reserves are slated for depletion by the end of this
century. The gravity of the situation can be visualized
when about 30% of the world’s current energy demand is

provided for by energy generated through oil and most
of the transportation systems use oil as the main
source acting as a fuel for the engines.
The production of natural gas is continuing to increase
at a rate of 4% per annum.In comparison to oil, there
has been significant reduction in the speed of increase
of production. Present indications are that a peak in
production of gas will be reached by 2025, 10 years
after oil reaches its peak production.
As oil and natural gas become scarcer, greater pressure
will be experienced by coal production which will reach
its peak production near 2050.
Solar Energy as an alternative is a very practicable
future. Solar Energy is a very large and unexhausted
source of energy. The daily solar insolation on the
surface of the earth is approximately 1.8X10¹¹ MW, about
a thousand times larger than the present consumption
rate of all the commercial energy sources combined.
Therefore in theory solar energy could provide us with
an unlimited and clean source of energy.
In addition to its scope, solar energy has two other
aspects in its favor. Firstly unlike fossil fuels and
nuclear power it is a clean source of energy. Secondly
it is inexpensive and available in limitless quantities
in every part of the word.
1.3 AIM:

The aim of this study is to learn about the solar
energy systems available and to employ them in design
of buildings for achieving sustainability and self-
sustenance.
1.4 RESEARCH QUESTION:Integribility of Solar energy Systems in Buildings for
Self-Sustenance
1.5 OBJECTIVES:A. To find out the various sources and techniques
for energy generation and check for the
Economic feasibility in integrating them into
different building systems.
B. To get experimental data pertaining to system
efficiency, economic viability, ecological impact
and cultural acceptability.
C. To check for system workability at grass-roots
level/rural typologies.
1.6 SCOPE AND LIMITATIONS:There are quite a few problems associated with the use
of solar energy as an alternative to traditional means
of energy production.
The main problem is that it is a dilute source of
energy. Even in the hottest regions on earth, the
solar radiation flux available rarely exceeds 1 KW/m2

and the total radiation over the day is at best about
7 KWh/m2.
Accordingly, large areas are required in many
applications and this adds to cost.
Secondly, the availability of solar radiation for
energy purposes varies widely from time to time and
location to location. This disparity in availability
occurs daily because of day-night cycle and also due
to the earth’s orbit around the sun at different times
of the year. Therefore, energy collected when there is
solar insolation must be stored and kept for times it
is not available.
Thus the real challenge in utilizing solar energy as
an alternative to traditional sources of energy is of
the economic kind. Public and private companies should
cooperate for the development of cheaper methods of
collection and storage so the large initial investment
required for the system to be put up is reduced.
The scope of the study varies from micro level
initiative as in the case of an off-grid system
generating its own energy consumption requirements
locally to a macro level initiative wherein the whole
urban typology is made into an off-grid system making
the urban system sustainable in itself and provide for
its own energy needs.
The application spectrum is varied and diverse for
such systems ranging from land based systems
integrated into buildings to offshore systems on

drilling platforms to meet for their own production
needs.
The two major limitations of the system are as follows
a. For generating equivalent amounts of electricity
in comparative to non-renewable sources of energy
a large area is required for generating that much
output thereby increasing implementation costs.
b. The second limitation being the availibity and
consistency of supply as the systems depend on
climate and various other factors which can
hamper production requirements.
1.7 METHODOLOGY:A. To do a primary study involving history of energy
generating systems.
B. To find out about the various energy generation
systems available(incl. prototypes)
C. To gather experimental data checking system
feasibility and efficiency.
D. To conduct case studies acquiring data on
previous applications of the known/new systems.
E. To do a comparison between different micro and
macro level applications.

2.RENEWABLE ENERGY
2.1 INTRODUCTION:Renewable energy, generally termed as energy that comes
from resources which are replenished naturally such as
wind, tides, sunlight, rains and geothermal heat.
Renewable energy has helped in replacing traditional

energy sources in areas such as electricity generation,
thermal heating, motor fuels and rural (off-grid)
energy services.
Renewable energy sources are widely available over a
wide geographical area, in contrast to traditional
energy resources which are available in a limited
number of locations. Rapid deployment of these energy
resources and efficient energy is resulting in
significant energy security, climate change mitigation
and economic benefits.
While the majority of renewable energy projects are
large scale in nature, newer technologies have been
able to vanguard implementation at rural/grass roots
levels.
Renewable aims at replacing the traditional fuel
sources in these distinct areas namely;
I. Power Generation:Renewable energy now provides 21.7% of world’s
electricity requirement as of 2013.
Renewable power generation provides a significant
share of electricity in most of the areas
II. Heating:Solar Energy makes a significant contribution to
renewable thermal energy in many countries.
Worldwide, total installed solar thermal energy
systems meet needs of over 70 million households.
At the national level, at least 30 nations around the world already
have renewable energy contributing more than 20% of energy
supply. National renewable energy markets are projected to
continue to grow strongly in the coming decade and beyond, and
some 120 countries have various policy targets for longer-term
shares of renewable energy, including a 20% target of all electricity
generated for the European Union by 2020. Some countries have
much higher long-term policy targets of up to 100% renewables.
Outside Europe, a diverse group of 20 or more other countries
target renewable energy shares in the 2020–2030 time frame that
range from 10% to 50%.
(REN21 (2013), Renewables Global Status Report
2012)
II.2HISTORY OF SOLAR ENERGY SYSTEMS:Prior to the use of coal in the mid-19th century, nearly
all energy consumed was renewable. The oldest known use
of renewable energy was in the form of biomass to fuel
fires dating back to about 790,000 years ago. Use of
biomass to fuel fires did not become commonplace until
thousands of years after, between 200,000 and 400,000
years ago.
The second known source of renewable energy use is the
harnessing of wind to sail ships across oceans, the start
of this practice can be traced back to Nile, some 7000
years ago. Moving up into the future, the primary sources
of traditional renewable energy were human labor, animal
labor, water power, and wind for crushing grains in
windmills, and firewood, a traditional biomass.

By 1873, concerns of depleting coal reserves prompted
experiments with solar energy. [12]
In 1897, Frank Shuman, a U.S. inventor, engineer and
solar energy pioneer built a small demonstration solar
engine that worked by reflecting solar energy onto square
boxes filled with ether, which has a lower boiling point
than water, and were fitted internally with black pipes
which in turn powered a steam engine. In 1908 Shuman
formed the Sun Power Company with the intent of building
larger solar power plants. He, along with his technical
advisor A.S.E. Ackermann and British physicist
Sir Charles Vernon Boys, [13] developed an improved system
using mirrors to reflect solar energy upon collector
boxes, increasing heating capacity to the extent that
water could now be used instead of ether. Shuman then
constructed a full-scale steam engine powered by low-
pressure water, enabling him to patent the entire solar
engine system by 1912. Shuman built the world’s
first solar thermal power station in Maadi, Egypt between
1912 and 1913. Shuman’s plant used parabolic troughs to
power a 45-52 kilowatt (60-70 H.P.) engine that pumped
more than 22,000 liters of water per minute from the Nile
River to adjacent cotton fields. Although the outbreak of
World War I and the discovery of cheap oil in the 1930s
discouraged the advancement of solar energy, Shuman’s
vision and basic design were resurrected in the 1970s
with a new wave of interest in solar thermal energy. [14]

2.3 APPLICATIONS:Solar energy refers predominantly to the use of solar
radiation for practical ends. However, all renewable
energies, other than geothermal and tidal, derive their
energy from the sun.
Solar technologies are broadly characterized as either
passive or active depending on the way they behave.
Active solar techniques use photovoltaic panels,
pumps and fans to convert sunlight.
Passive solar techniques include selecting materials
with favorable thermal properties, therefore making
it necessary
2.3 ELECTRICITY PRODUCTION:The conversion of solar power to electricity is termed as
Solar Power is done either directly using Photovoltaics
or indirectly using concentrated solar power.
Concentrated solar power systems use tracking systems
made up of mirrors and lenses to concentrate a large area
of sunlight into a small beam. Photovoltaics on the other
hand convert light into electricity using the
photovoltaic effect. [14]
Photovoltaics initially used to power small and medium
sized applications. They are an important inexpensive
source of electricity in areas where grid power is
inconvenient, excessively expensive to connect to
unavailable. Although due to growing trends in solar
electricity production the cost of the system is

gradually coming down making it affordable for the common
man.
Commercially viable concentrated solar power plants were
first developed in the 1980’s. The 392 MW ISEGS
concentrated solar power installation is the largest
solar power plant in the world, located in the Mojave
Desert California. The 290 MW Agua Caliente Solar project
in the United States, and the 221 MW Charanka Solar Park
in India, are the world’s largest photovoltaic power
stations.
2.3.1 Photovoltaics or Photovoltaic Cells:Is a device used to convert solar radiations into
electricity. The first solar cell was made by Charles
Fritts in 1880’s.Ernst Werner von Siemens, a German

industrialist was one of the few to recognize the
importance of the discovery.
2.3.2 Photovoltaic Power systems:Solar Cells produce DC (direct current) which fluctuates
with the sun’s intensity. For practical use this is
usually requires conversion to a certain desired voltage
or alternating current (AC) by using inverters. Multiple
solar cells are combined together to form a module which
are further connected with other modules to form an
array, which is then tied to an inverter producing power
at a desired voltage.
The early development of solar technologies starting in
the 1860s was driven by an expectation that coal would
soon become scarce. However, development of solar
technologies stagnated in the early 20th century in the
face of the increasing availability, economy, and utility
of coal and petroleum. [15]
Between 1970 and 1983 photovoltaic installations grew
rapidly, but falling oil prices in the early 1980s

moderated the growth of PV from 1984 to 1996. Since 1997,
PV development has accelerated due to supply issues with
oil and natural gas, global warming concerns, and the
improving economic position of PV relative to other
energy technologies. [16]
Photovoltaic production growth has averaged 40% per year
since 2000 and worldwide installed capacity reached
139 GW at the end of 2013 with Germany having the most
cumulative installations (35.7 GW) and Italy having the
highest percentage of electricity generated by solar
(7.0%) [17]
Electricity Generation fromSolar
Year Energy (TWh) % ofTotal
2005 3.7 0.02%
2006 5.0 0.03%
2007 6.7 0.03%
2008 11.2 0.06%
2009 19.1 0.09%
2010 30.4 0.14%
2011 58.7 0.27%
2012 93.0 0.41%
2013 124.8 0.54%

In 2010, the IEA predicted that the worldwide solar
capacity could reach 3000 GW by 2050; sufficient to
produce 4500 TWh of electricity per year. In 2014, the
agency increased its solar estimates, reporting that
solar power could reach 27% of electricity generation
worldwide by 2050.
2.4 ENERGY ECONOMICS:Photovoltaic systems use no fuel and modules typically
last 25 to 40 years. The cost of installation is almost
the only cost, as there is very little maintenance
required. Installation cost is measured in $/watt or
€/watt. The electricity generated is sold for ¢/kWh. 1
watt of installed photovoltaics generates roughly 1 to 2
kWh/year, as a result of the local insolation. The
product of the local cost of electricity and the

insolation determines the break-even point for solar
power. The International Conference on Solar Photovoltaic
Investments, organized by EPIA, has estimated that PV
systems will pay back their investors in 8 to 12 years.[18]
As of 2011, the cost of PV has fallen well below that of
nuclear power and is set to fall further. The average
retail price of solar cells as monitored by the Solarbuzz
group fell from $3.50/watt to $2.43/watt over the course
of 2011, and a decline to prices below $2.00/watt seems
inevitable:
For large-scale installations, prices below $1.00/watt
are now common. In some locations, PV has reached grid
parity, the cost at which it is competitive with coal or
gas-fired generation. More generally, it is now evident
that, given a carbon price of $50/ton, which would raise
the price of coal-fired power by 5c/kWh, solar PV will be
cost-competitive in most locations. The declining price
of PV has been reflected in rapidly growing
installations, totaling about 23 GW in 2011. Although
some consolidation is likely in 2012, as firms try to
restore profitability, strong growth seems likely to
continue for the rest of the decade. Already, by one
estimate, total investment in renewables for 2011
exceeded investment in carbon-based electricity
generation. [19]
Shi Zhengrong has said that, as of 2012, unsubsidized
solar power is already competitive with fossil fuels in

India, Hawaii, Italy and Spain. He said "We are at a
tipping point. No longer are renewable power sources like
solar and wind a luxury of the rich. They are now
starting to compete in the real world without subsidies".
"Solar power will be able to compete without subsidies
against conventional power sources in half the world by
2015". [20]
2.5 GRID PARITY:Grid parity is considered as the point at which the cost
of photovoltaic electricity is equal to or cheaper than
the price of commercial grid power.
The fully loaded cost (cost not price) of solar
electricity in 2008 was $0.25/kWh or less in most of
the OECD countries. By late 2011, the fully loaded cost
was predicted to fall below $0.15/kWh for most of the
OECD and reach $0.10/kWh in sunnier regions. These cost
levels are driving three emerging trends: [21]
1. Vertical integration of the supply chain;
2. Origination of power purchase agreements (PPAs) by
solar power companies;
3. Unexpected risk for traditional power generation
companies, grid operators and wind turbine
manufacturers.
2.6 ENERGY PAYBACK:The energy payback time of a power generating system is
the time required to generate as much energy as was
consumed during production of the system.

In 2000 the energy payback time of PV systems was
estimated as 8 to 11 years [22] and in 2006 this was
estimated to be 1.5 to 3.5 years for crystalline silicon
PV systems [23] and 1-1.5 years for thin film technologies
(S. Europe).[24]
3. BUILDING INTEGRIBILITY:
3.1 INTRODUCTION:Buildings and their processes account for one half of all
energy consumption. When the energy required to mine,
produce, deliver and assemble materials for the
construction of buildings. For developed countries to
carry on enjoying the comforts sustainability must be the
cornerstone for design philosophy for the years to come.
Rather than reducing usage of non-renewable resources to

create less pollution, we need sustainable building
designs that run on renewable sources of energy to
provide most/almost of their own energy needs and future
pollution.
Planners have long anticipated large scale solar power
plants covering large masses of land. As solar
electricity increases, there is an increase in consensus
that PV systems will provide energy at the point of use
or near the point of use. Distributed PV systems are
advantageous as:
Provide grid support, particularly during summer
peak loads.
Eliminate costs and losses in transmission and
distribution.
Create a diverse and resilient energy system.
Rapid deployment.
The most lucrative distributed power applications are PV
power systems for individual buildings having benefits
such as:
The building and processes they house consume
majority of electricity.
Real estate comes free with the building.
No site development costs.
Utility interconnection already serves the building.

Building integrated Photovoltaics has many additional
benefits:
The building itself becomes the support structure.
System electrical interface is easy
BiPV components displace conventional building
materials and labor, reducing the net installed cost
of the PV system
Architecturally classy. Well integrated systems will
increase marketplace
3.2 PRINCIPLES OF BUILDING INTEGRATION:Unlike any other building installation, building
integrated photovoltaics can affect a lot of essential
parts of the design process:
Layout and orientation
Form and Massing
Layout and height of surrounding buildings
Energy strategy
Building structure and modularity
Selection and assembly of other building materials
Capital and running costs
Construction integrity and detail
Appearance and architectural expression
3.2.1 KEY DESIGN ISSUES IN BiPVA successful BiPV solution requires interaction between
building design and PV design system. A fully integral

approach is possible with the PV system shifting a
convention building existing material.
The integration of PV systems in architecture can be
divided into five approaches as follows:
1. Applied seamlessly:a. By this the installed PV system is not
architecturally disturbing. It is well
integrated and goes in form with the overall
design of the building.
2. Added to the design:a. The building can be missing a design function
that the building can be missing which the PV
can compensate for example being a PV shading
device.
b. Often, PV addition do not necessarily mean that
architectural integration is lacking as the
added PV system is not always highly visible.
3. Used to determine the architectural image:The PV system is used as an integral part of the
building envelope and thus espouses a core building
characteristic. PV revitalizes what may have been a
stereotypical glazed corridor into a prominent
feature.
3.3 TYPES OF BIPV SYSTEM We have classified BIPV into the following four types:
1. Roof integrated systems
2. Facade integrated systems

3. Retrofit roof or facade systems
4. PV used as a shading system either built with the
building or retrofit
3.3.1 ROOF INTEGRATED SYSTEMS:The roof integrated BIPV system which is the integration
of the panels into the roof of the building serves two
purposes, first as a roof and secondly as an electricity
generator. It replaces the conventional roof while
allowing the natural sunlight to filter through. As a
roof, the BIPV serves as structural and weather condition
requirements by providing structural strength and
stability; it protects against the damages like chemical
and mechanical damage; preventing against fires;
protecting against rain, sun, wind, and moisture; it
allows heat absorption and heat storage; controls the
diffusion of light, etc. In addition to these features it
serves as an electricity generator through meeting part
of the electrical load requirements of the building. The
BIPV modules for roofs (which are based on crystalline
technology) are available in the three forms. Although
the detail about the module is being covered in the
technical analysis chapter but readers are advised to
once go through it because it is appropriate to describe
this here.
Single glass element:

Here the solar cells are laminated on a single glass
with transparent encapsulation that allows light to
pass through space between cells.
Double glass element:
In this case, the solar cells are sandwiched between
two glasses with transparent encapsulation; this
encapsulation reduces heat losses from indoor
building spaces.
Double glazing element:
In which a third glass is fixed at the bottom of the
double glass element, with vacuum in between the
second and the third glass to reduce heat losses.
3.3.2 FAÇADE MOUNTING:The word façade comes from the French literally meaning
"frontage" or "face”. A façade is generally one side of
the exterior of a building, especially the front, but
also sometimes the sides and rear. In case of façade
integrated system, PV in integrated once the building is
constructed. PVis usually integrated into the south
façade, for maximum utilization. Module comes in
different color so adding more flexibility to the
architects as far as the aesthetic view is concerned. The
typical BIPV façade is vertical, and integrated with
clear glazing and semi-transparent PV modules. However,
vertically oriented PV panels produce less electricity as
compare to the solar panels slanting towards the sun. The
reduction is greatest in the summer when the sun is high
up. So facades can be sloped in to a saw tooth design top
absorb maximum solar energy. Semitransparent glazing does
not allow direct sunlight to enter the building, thus
reducing cooling loads and glare. Opaque PV material can
be used in building structural members. Integrated façade
system requires a high degree of refinement to get
sufficient cooling of the modules. In architecture, the
facade of a building is often the most important from a
design standpoint, as it sets the tone for the rest of
the building. Many facades are historic, and local zoning
regulations or other laws greatly restrict or even forbid
their alteration.
The low powered systems of up to some 10 kW are usually
integrated into the south facade. Facade integrated
photovoltaic systems could consist of different
transparent module types, such as:
Crystalline PV modules
Micro-perforated amorphous transparent modules.
In such case a part of natural light is transferred into
the building through the modules. Solar cells are
available in different colors; therefore, there is no
limitation for imagination of the architect or the
designer. We can say that such constructed buildings give
the term architecture a completely new meaning. The best
results and efficiency can be reached with systems, which
are tightly integrated into the passive solar buildings;
however, the use of active solar systems is an additional

possibility. This is where the modules are partially
transmitting allowing natural light to penetrate the
building. Undoubtedly, such systems challenge even the
best of architects. High-level of expertise is required
for successful BIPV systems planning, not only in regard
to architecture, but also to civil and photovoltaic
engineering. The projects realized in the past show that
a successful BIPV system designing is based heavily on
technical experience and knowledge. Poorly designed
systems usually have to be redesigned or repaired later,
consequently swelling maintenance costs and lowering
system efficiency rate. Inside the BIPV system,
photovoltaic (PV) panels are integrated into some of the
building components, such as glass plates on curtain wall
glass system, window shades, skylight systems, etc. They
functioned as normal parts of a building and at the same
time generate electricity.
3.4 MARKET SEGMENTATION:Market segmentation describes about the four types of
building where BIPV system in mostly used.
1. Residential buildings

These mainly use roof integrated systems. Cost is a major
concern for this segment, with the focus being on lower
RoI time and increased efficiency. The residential
buildings that we are considering for the analysis are
single dwelling, attached and multi-unit house buildings.
2. Commercial buildings
These are large BIPV systems used by major companies and
organizations where they feel that it is more cost
effective in the long term than conventional power
sources. This is usually done in parts of Europe where
there is a large support policy for BIPV.
3. Industrial buildings
Since industrial buildings are large in area and hence if
we can even prove BIPV in one such building then this
could be an initiative towards the grand success of BIPV
in industrial buildings.
4. Government and PSU buildings
It is a difficult task to convince customer without
showing the practical viability of the similar kind of
the projects thus if BIPV is first being proved to the
government buildings then it could serve as a showcase
for all the BIPV customers.

3.5 GLOBAL AND INDIAN SCENARIO:
FACTORS JAPAN GERMANY SPAIN INDIA
SOLAR
INSOLATI
ON
1051 950 1300 1700-2500
INSTALLE
D PV1919 3862 120.2 830.5
FEED-IN
TARRIF
0.32-
0.430.44-0.49 0.32-0.34 0.39
SUBSIDIE
S
50% of
Installat
ion cost
33% for
Local
Governmen
t’s
Subsidized
loan at 5.2%
for 5 to 10
Yrs. Up to
20 Yrs.
50% of cos
ts for
modules
of 5
kWpmaximum
,
atRs.200,0
00/kWp,50%
of cost
for
modules
of 1 kWp

maximum
capped at
Rs.100,000
/kWp
TAX
CREDITS
3-year
property
tax
credit
with PV
system
NO
4% (2009)
on total
capacity
installed
100% tax
credits on
installati
ons
3.5.1 INDIAN SCENARIO: [23]
Installed PV Capacity: Cumulative installed as of September 2007: 112 MW2
(97.3% off-grid)
Cumulative installed end 2006: ~100MW (98% off-grid)
Cumulative installations growth rate: 2005-2006: +16.3%
2006-2007: +12%
Annual installations growth rate 2006-2007: -14%
State-level feed-in tariffs: Punjab: ~Rs 8.93/kWh NSRE policy
West Bengal: Rs 11/kWh
Haryana: ~Rs 15.75/kWh
Direct Capital Subsidies:
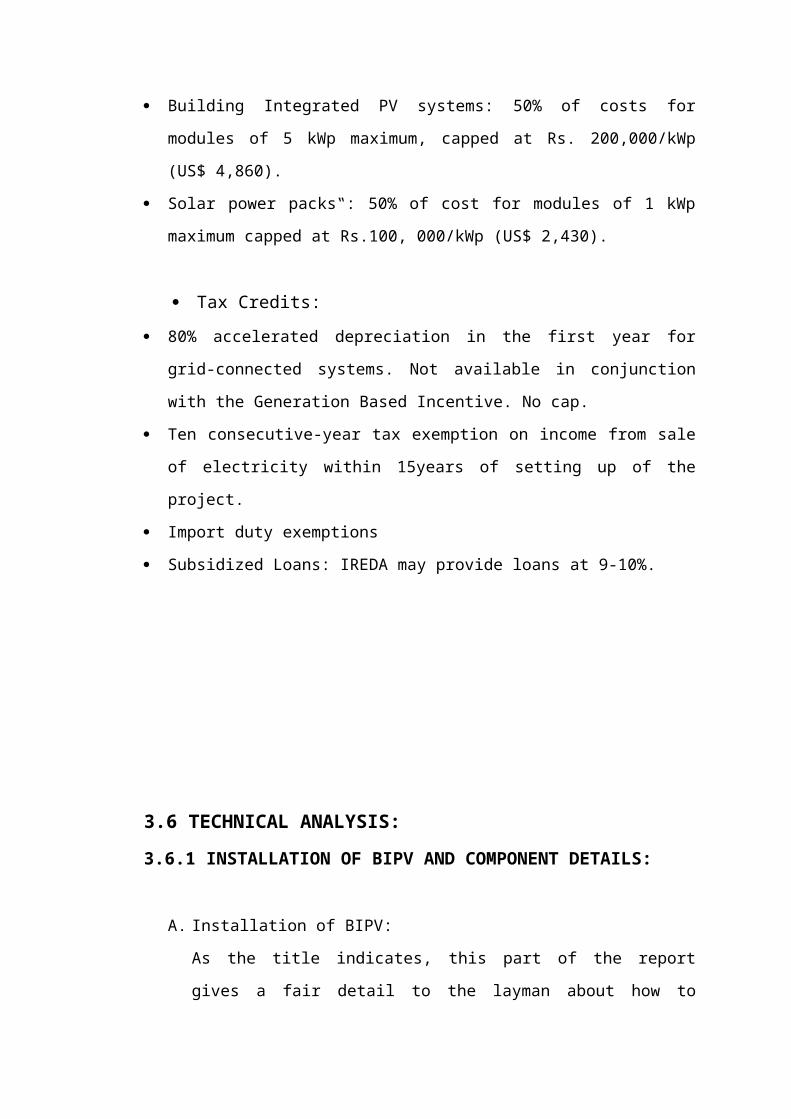
Building Integrated PV systems: 50% of costs for
modules of 5 kWp maximum, capped at Rs. 200,000/kWp
(US$ 4,860).
Solar power packs‟: 50% of cost for modules of 1 kWp
maximum capped at Rs.100, 000/kWp (US$ 2,430).
Tax Credits: 80% accelerated depreciation in the first year for
grid-connected systems. Not available in conjunction
with the Generation Based Incentive. No cap.
Ten consecutive-year tax exemption on income from sale
of electricity within 15years of setting up of the
project.
Import duty exemptions
Subsidized Loans: IREDA may provide loans at 9-10%.
3.6 TECHNICAL ANALYSIS:3.6.1 INSTALLATION OF BIPV AND COMPONENT DETAILS:
A. Installation of BIPV:
As the title indicates, this part of the report
gives a fair detail to the layman about how to

install BIPV system and what are the
basic components of the BIPV system.
B. How to install a BIPV system:
To install BIPV in newly constructing house or to
the home already constructed the very first thing we
need to decide that whether we need to fulfill all
our electricity requirements by solar BIPV or to
utilize BIPV as a substitute to the presently used
conventional electricity. Once we have decided this,
the very second step is to decide the capacity being
installed accordingly, it needs a little knowledge
of electrical terminologies otherwise we require to
take the help of a consultant or directly the BIPV
installers to calculate it.
STEP 1: CALCULATE DAILY POWER USED:
Method 1:
To do this, take the last 12 monthly power bills and
calculate the average kilowatt hour (kWh) usage per
month.
The reason we use 12 is because our power consumption
fluctuates with the seasons.
Then divide the monthly usage by 30 (the average number
of days in a month, to get the daily power used.
So for example: If the monthly power consumption of 800
kWh (which is generally in a double story upper class 4
bhk house), then the daily consumption is 800/30= 26.7
kWh per day.

Now if we want to halve the power bill then you need to
produce 26.7 / 2 = 13.4 kWh of solar panel watt power
per day.
Method 2:
If we don’t have the electricity bill then there is a
way to calculate the power consumption by means of the
electrical appliances used. All it needs to know is the
capacity, hours of use and the hours of use per day of
these equipment’s.
Some of these appliances with all the details are as
given below: -
SR.
NO.
EQUIPMENT CAPAC
ITY
NUMBE
RS
HOURS/
DAY
CONSUMPTION/
YEAR1 TUBELIGHT 5-10W 5 8hrs 146000 W2 BULB 60W 5 4hrs 138000 W
3AIRCONDIT
IONER1000W 1 4hrs 1060000 W
4FAN 10-
50W4 8hrs 350400 W
5 COMPUTER 370W 1 8hrs 1080400 W
6TELEVISIO
N100W 1 2hrs 73000 W
TOTAL3147800 W ~
3147.8 KW

TABLE 3.6.1[24]
Power consumption per year = 3147.80 kWh (from table
3.6.1)
Power consumption per day = 3147.80/365 = 8.62 kWh
Power consumption per hour = 7.66/24 = 0.359 kW
STEP 2 - CALCULATE TOTAL SOLAR PANEL WATT NEEDS:To do this, first determine how many usable hours of
sunlight the area receives per day.
This is taken from a solar insulation map.
For example sunshine hour per year in India = from 2300
to 3200 = 2750 (average)
Thus average sunshine hours per day = 2750/365= 7.5
hours per day
Now we know the daily sunlight hours (i.e. 7.5 hours)
and we have calculated per hour power consumption in
Step1 (i.e. 13.4 kWh from method 1), thus if we divide
the per hour power consumption by total sunshine hours
in a day then we will get the power capacity required.
This is calculated below:-
13.4 KWh / 7.5hrs = 1.78 kW or 1780 Watts
Thus 1.78kW is the power that we require for our house
but since there are some energy losses from the solar
panel wiring, battery, and inverter which is

approximately 25% thus to get the desired power we need
to install system which is capable of generating 1.78kW
power with 25% energy losses.
Thus the system would be 125% of the desired power.
Hence solar panel capacity should be:
1780*1.25 = 2225 watts
Now we are able to calculate the BIPV capacity that the
house will require. After knowing this we need to
calculate the cost of the BIPV system which requires
the financial analysis of the 2.234 kW BIPV system
which is being detailed out in a topic named financial
analysis. For a fair idea the general cost for a 2kW
BIPV system could be around 8 lakhs with major of the
cost required for PV module.
STEP 3 - CALCULATE SOLAR PANEL WATT COSTS:This step will help to work out the cost of the solar
panels needed to make 2234 Watts of power. At the
moment the lowest cost for solar panels based on multi-
crystalline technology is Rs. 180 from the Indian
manufacturer. Since PV modules participate generally
around 68% of the total cost of the BIPV system thus we
can arrive at a rough estimate of the total BIPV cost
that we are going to install.
The detailed analysis of all these components and their
financial part is described in the further part of the
report
In our example:
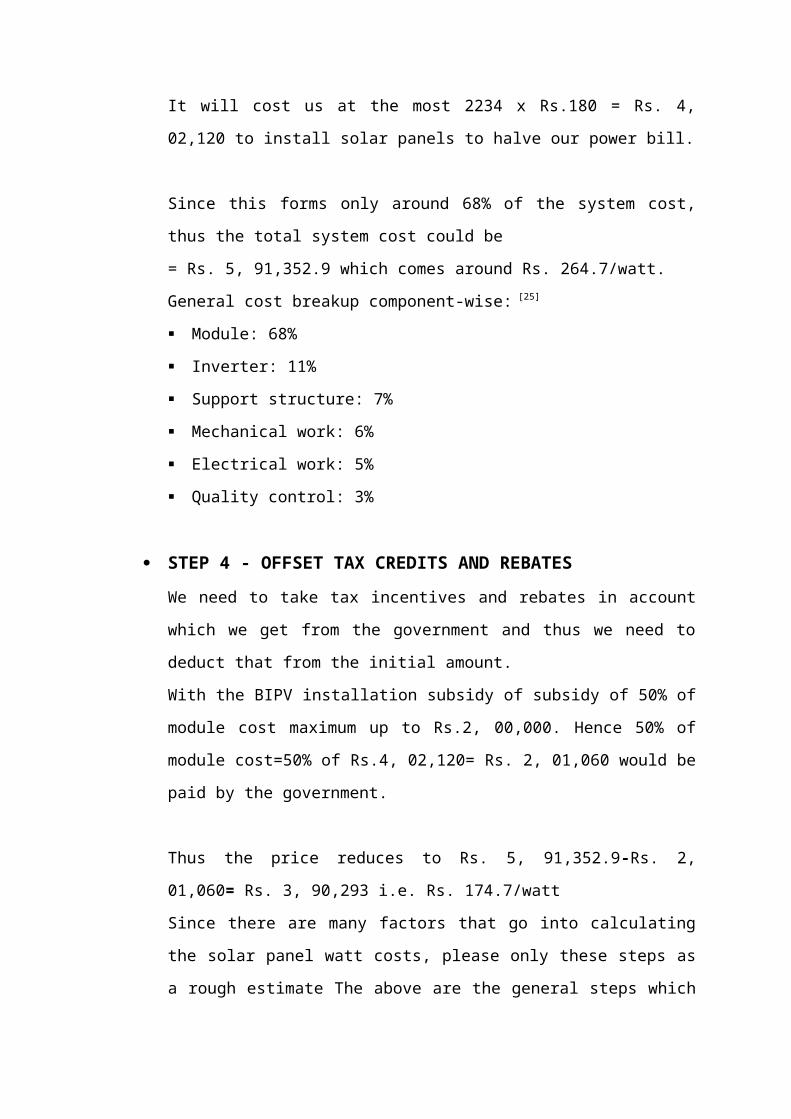
It will cost us at the most 2234 x Rs.180 = Rs. 4,
02,120 to install solar panels to halve our power bill.
Since this forms only around 68% of the system cost,
thus the total system cost could be
= Rs. 5, 91,352.9 which comes around Rs. 264.7/watt.
General cost breakup component-wise: [25]
Module: 68%
Inverter: 11%
Support structure: 7%
Mechanical work: 6%
Electrical work: 5%
Quality control: 3%
STEP 4 - OFFSET TAX CREDITS AND REBATESWe need to take tax incentives and rebates in account
which we get from the government and thus we need to
deduct that from the initial amount.
With the BIPV installation subsidy of subsidy of 50% of
module cost maximum up to Rs.2, 00,000. Hence 50% of
module cost=50% of Rs.4, 02,120= Rs. 2, 01,060 would be
paid by the government.
Thus the price reduces to Rs. 5, 91,352.9-Rs. 2,
01,060= Rs. 3, 90,293 i.e. Rs. 174.7/watt
Since there are many factors that go into calculating
the solar panel watt costs, please only these steps as
a rough estimate The above are the general steps which

give a layman a fair idea on deciding whether
to install BIPV system in the house or not.
3.7 POSITIONING OF SOLAR PANELSThe direction and angle that the panel faces can have a
big impact on its performance by affecting the amount of
light that hits the panel each day through the year. Some
solar panels move continuously to track the sun but most
will not go to the expense and difficulty of implementing
that. To get it right we have to make sure that the
panels get hit by the maximum amount of light. This
happens when the sun is directly above the panel.

As you can see from above, the angle that the sun hits a
panel changes the amount of exposure. At 30 degrees from
the panel, the panel is only exposed to 50% of the light
of the sun, at 60degrees, 87% and at 90 degrees, 100%.
This happens because the sun emits the same number
of photons in a square cm, but once we put our panels on
an angle, those photons are spread across a larger area.
As we all know, at different times of the day the sun
moves through the sky and so any stationary panels get
exposed to different angles, so what is directly above at
one time of the day will not be at the next.
Although when the sun it at its highest it is not
necessarily straight up, but may be off by an angle. And
that angle is different at different times of the year
and different at different latitudes. This angle is to
the south in the northern hemisphere and the north in the
southern hemisphere.
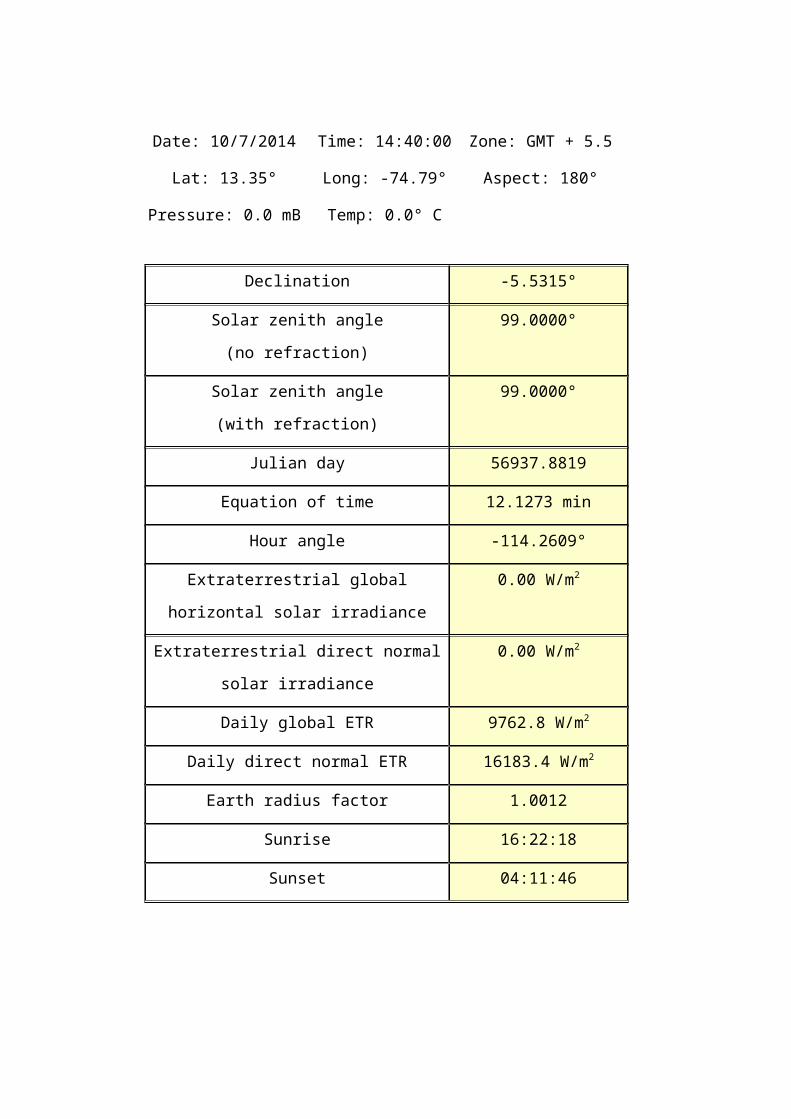
Date: 10/7/2014 Time: 14:40:00 Zone: GMT + 5.5
Lat: 13.35° Long: -74.79° Aspect: 180°
Pressure: 0.0 mB Temp: 0.0° C
Declination -5.5315°
Solar zenith angle
(no refraction)
99.0000°
Solar zenith angle
(with refraction)
99.0000°
Julian day 56937.8819
Equation of time 12.1273 min
Hour angle -114.2609°
Extraterrestrial global
horizontal solar irradiance
0.00 W/m2
Extraterrestrial direct normal
solar irradiance
0.00 W/m2
Daily global ETR 9762.8 W/m2
Daily direct normal ETR 16183.4 W/m2
Earth radius factor 1.0012
Sunrise 16:22:18
Sunset 04:11:46

4.REFRENCES:1. International Energy Annual 2004, Energy Information
Administration, Department of Energy, USA

2. Considine, D.M. (Ed.) 1977. Energy Technology Handbook,
McGraw Hill, New York
3. Key World Energy Statistics 2006, International Energy
Agency, Paris.
4. Eenergiläget i siffror 2011 figure 49 and 53
5. "IEA estimates $48tn investments till 2035 to meet
global energy demands”. Bloomberg. Retrieved 4 June
2014.
6. Energiläget 2050 by prof. Cristian Azar and Kristian
Lindgren Chalmers Göteborg(Swedish)
7. State of the world 2009, Worldwatch institute, 2009
8.
9. Jacobson, Mark Z. and Delucchi, Mark A.
(2010). "Providing all Global Energy with Wind,
Water, and Solar Power, Part I: Technologies, Energy
Resources, Quantities and Areas of Infrastructure,
and Materials”. Energy Policy.
10. Renewables 2012 Global status report Executive
summary REN21
11. Makower, J. Pernick, R. Wilder, C. (2008). Clean
Energy Trends 2007
12. "The surprising history of sustainable energy".
Sustainablehistory.wordpress.com. Retrieved 2012-11-
01.
13. C.V. Boys, scientist, Yatedo.com website.
14. "Energy Sources: Solar". Department of Energy.
Retrieved 19 April 2011.
15. Butti and Perlin (1981), p. 63, 77, 101

16. Solar: photovoltaic: Lighting Up The
World retrieved 19 May 2009
17. "Photovoltaics: Overview of installed PV in
2013". Renewables International. 2014-01-14.
Retrieved 2014-06-23.
18. "3rd International Conference on Solar
Photovoltaic Investments".
Pvinvestmentconference.org. Retrieved 19 April 2011.
19. John Quiggin (3 January 2012). "The End of the
Nuclear Renaissance". National Interest.
20. Mark Clifford (8 February 2012). "China’s
visible solar power success". MarketWatch.
21. The True Cost of Solar Power retrieved 22
October 2008
22. Andrew Blakers and Klaus Weber, “The Energy
Intensity of Photovoltaic Systems”, Centre for
Sustainable Energy Systems, Australian National
University, 2000.
23. Global solar report card, 2008
24. www.absak.com
25. ENVISION consulting report

Copyright © 2022 FDOKUMEN