Progressing from Intelligent to Smart Buildings
7
PROGRESSING FROM INTELLIGENT TO SMART BUILDINGS A.H.Buckman, Energy Researcher, Department of Mechanical Engineering, The University of Sheffield, UK M.Mayfield, Visiting Professor of Civil Engineering, The Department of Civil and Structural Engineering, The University of Sheffield, UK Director, ARUP, UK R.Meijer, Information Commons Manager, The Information Commons, The University of Sheffield, UK S.B.M.Beck Professor of Mechanical Engineering, The Department of Mechanical Engineering, The University of Sheffield, UK ABSTRACT This paper addresses the issue of the misunderstandings surrounding the terms intelligent and smart when applied to modern buildings. The terms have increasingly been used interchangeably which has led to confusion for designers, researchers and clients. The authors propose that utilising the increasingly available information as a tool to forewarn the building control systems, rather than reacting to stimuli, can allow adaptability and a distinction between Intelligent and Smart Buildings. A case study building in Sheffield is used as a simple example of using enterprise systems to manipulate zoning of a building at predicted occupancy levels. The results suggest that this example of information utilisation enables efficient energy and resource distribution whilst maintaining the functional value of the building and the ability for occupants to have a choice of their own environment. INTRODUCTION A view of non-domestic building progression is that it can be measured through three drivers: 1. Energy and Efficiency 2. Comfort and Satisfaction 3. Longevity Each is used here in its broadest sense and encompasses a number of contemporary terms such as energy effectiveness and well-being. With significant operating costs and “a shifting culture towards value rather than cost” (Clements-Croome 2011), longevity accounts for the financial cost of the building. Over the past three decades, intelligent building research has evolved from definitions relating to full control of their own environment (Stubbings 1986), to being holistically “responsive to the requirements of occupants, organisations and society” (Clements-Croome 2011). The development in definition reflects the changing requirements and expectations of a building when related to the drivers mentioned previously. The change has been, for the better part, positive and can be seen as a useful progression. However, the rapid advancement of technology and research has resulted in confusion around the meaning of intelligence with views ranging from vernacular ESL-IC-13-10-46 Proceedings of the 13th International Conference for Enhanced Building Operations, Montreal, Quebec, October 8-11, 2013
Transcript of Progressing from Intelligent to Smart Buildings

PROGRESSING FROM INTELLIGENT TO SMART
BUILDINGS
A.H.Buckman,
Energy Researcher,
Department of
Mechanical
Engineering,
The University of
Sheffield,
UK
M.Mayfield,
Visiting Professor of
Civil Engineering,
The Department of
Civil and Structural
Engineering,
The University of
Sheffield,
UK
Director,
ARUP,
UK
R.Meijer,
Information Commons
Manager,
The Information
Commons,
The University of
Sheffield,
UK
S.B.M.Beck
Professor of Mechanical
Engineering,
The Department of
Mechanical
Engineering, The
University of Sheffield,
UK
ABSTRACT This paper addresses the issue of the
misunderstandings surrounding the terms
intelligent and smart when applied to modern
buildings. The terms have increasingly been used
interchangeably which has led to confusion for
designers, researchers and clients.
The authors propose that utilising the
increasingly available information as a tool to
forewarn the building control systems, rather than
reacting to stimuli, can allow adaptability and a
distinction between Intelligent and Smart
Buildings. A case study building in Sheffield is
used as a simple example of using enterprise
systems to manipulate zoning of a building at
predicted occupancy levels.
The results suggest that this example of
information utilisation enables efficient energy and
resource distribution whilst maintaining the
functional value of the building and the ability for
occupants to have a choice of their own
environment.
INTRODUCTION A view of non-domestic building progression
is that it can be measured through three drivers:
1. Energy and Efficiency
2. Comfort and Satisfaction
3. Longevity
Each is used here in its broadest sense and
encompasses a number of contemporary terms such
as energy effectiveness and well-being. With
significant operating costs and “a shifting culture
towards value rather than cost” (Clements-Croome
2011), longevity accounts for the financial cost of
the building.
Over the past three decades, intelligent
building research has evolved from definitions
relating to full control of their own environment
(Stubbings 1986), to being holistically “responsive
to the requirements of occupants, organisations and
society” (Clements-Croome 2011). The
development in definition reflects the changing
requirements and expectations of a building when
related to the drivers mentioned previously. The
change has been, for the better part, positive and
can be seen as a useful progression. However, the
rapid advancement of technology and research has
resulted in confusion around the meaning of
intelligence with views ranging from vernacular
ESL-IC-13-10-46
Proceedings of the 13th International Conference for Enhanced Building Operations, Montreal, Quebec, October 8-11, 2013
architecture to the most technically advanced
modern buildings.
Recent research into concepts such as
intelligent agent controllers (Callaghan, Clarke et
al. 2009), enterprise integration and novel methods
for control has provided an opportunity to define
upper bounds to intelligent buildings and clarify a
definition of the increasingly used term Smart
Building. The increasing amount of information
available to building researchers, designers,
operators and occupants is at the heart of the
concept, with adaptability being fundamental.
This paper will use the case study of a non-
domestic building in Sheffield, which would be
categorized as intelligent, to show how the
operation could be improved, by assessing energy
usage data and applying methods through which
information could be used differently in order to
reduce energy usage whilst increasing comfort
levels, without removing occupant control.
WHAT IS A SMART BUILDING? Control within non-domestic buildings is a
largely contested and well researched area.
Buildings which are largely manually controlled
can perform very well when appropriately designed
for a specific context, providing that the occupants
use them in the way that the building was designed
for. Automated buildings tend to be designed to the
theoretical climatic conditions, occupancy and use.
Both are susceptible to decreases in performance
during change of occupancy, use or climatic
conditions. Smart Buildings reconcile both human
control and automation in order to achieve the
drivers for buildings progression. This can be
achieved through the effective utilisation of the
wealth of information that can be gathered from a
building.
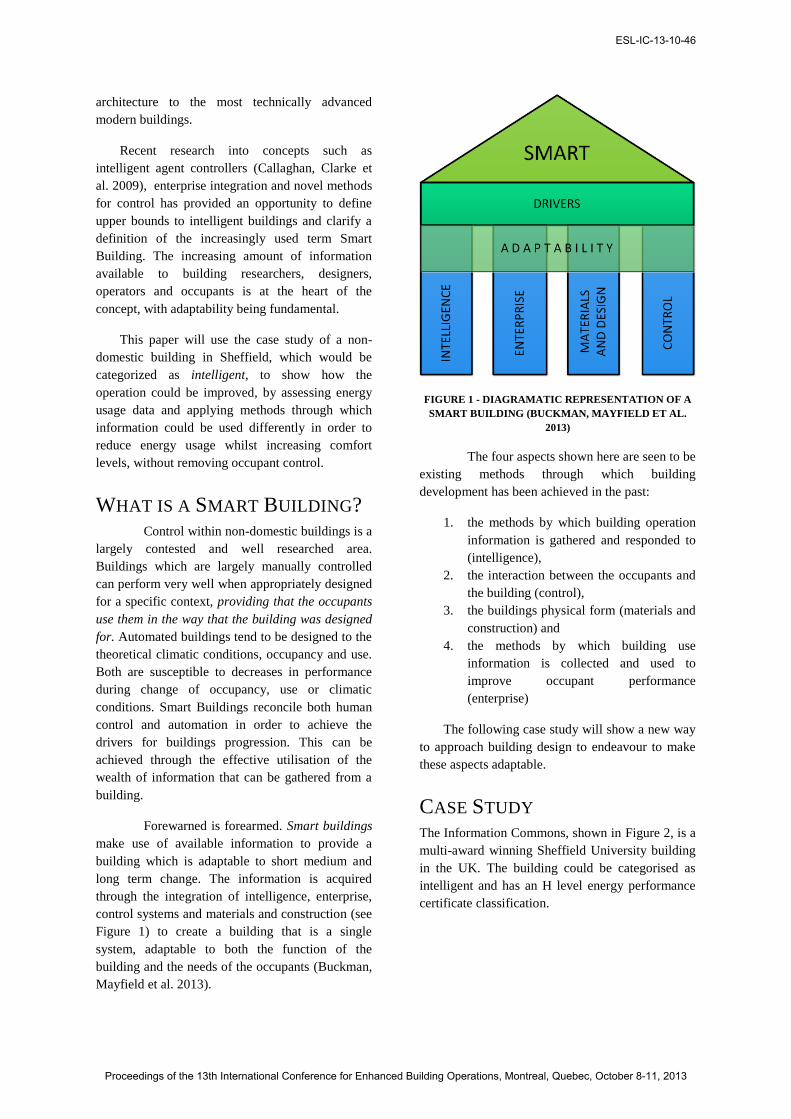
Forewarned is forearmed. Smart buildings
make use of available information to provide a
building which is adaptable to short medium and
long term change. The information is acquired
through the integration of intelligence, enterprise,
control systems and materials and construction (see
Figure 1) to create a building that is a single
system, adaptable to both the function of the
building and the needs of the occupants (Buckman,
Mayfield et al. 2013).
FIGURE 1 - DIAGRAMATIC REPRESENTATION OF A
SMART BUILDING (BUCKMAN, MAYFIELD ET AL.
2013)
The four aspects shown here are seen to be
existing methods through which building
development has been achieved in the past:
1. the methods by which building operation
information is gathered and responded to
(intelligence),
2. the interaction between the occupants and
the building (control),
3. the buildings physical form (materials and
construction) and
4. the methods by which building use
information is collected and used to
improve occupant performance
(enterprise)
The following case study will show a new way
to approach building design to endeavour to make
these aspects adaptable.
CASE STUDY The Information Commons, shown in Figure 2, is a
multi-award winning Sheffield University building
in the UK. The building could be categorised as
intelligent and has an H level energy performance
certificate classification.
ESL-IC-13-10-46
Proceedings of the 13th International Conference for Enhanced Building Operations, Montreal, Quebec, October 8-11, 2013

FIGURE 2 - THE INFORMATION COMMONS,
SHEFFIELD, UK
BACKGROUND
When opened in April 2007 the
Information Commons (IC) was seen as a unique,
leading environment which provides a flexible
space to facilitate learning. The building is seven
storeys high with an atrium space rising through
floors 1-4. The numerous, flexible spaces available
for silent and quiet study are supplemented by a
number of bookable small rooms and seminar
rooms, as well as spaces for permanent staff
offices. Besides these spaces, the building operates
as The University’s largest (by area) library. The
building reaches capacity during most term time
dates, which is testament to its effectiveness. It is
open 24 hours a day, 364 days per year and is run
predominantly upon electricity. The electricity-
reliant building is likely to become more common
in the future due to decentralised energy production
and electrification of power supplies (Kyle, Clarke
et al. 2010; HM Government 2011).
The building has an online room booking
system for staff and students, a computer booking
system for students only, as well as methods
through which occupancy and the distribution of
computer users can be measured.
Although the function of the building has
been fulfilled, the open, flexible nature has come at
a cost of inflexible energy consumption. The users
of the building generate a lot of heat by nature of
its function and so cooling is the primary use of
electricity. This cooling is achieved via a single air
blast cooler running constantly, and two chillers
which are used when required. The other primary
electricity use is for small power, including
computing, lighting and services.
Each floor has between 3 (ground floor)
and 6 (first floor) zones apart from floors 5 and 6
which are single zones. Each zone is served by a
single air conditioning unit which supplies air to
the zone through numerous floor grates, containing
low powered fans.
RESULTS AND DISCUSSION
ENERGY CONSUMPTION
Four weeks have been chosen to represent
key points in the academic year as shown in Table
1. The electricity metering intervals in the building
are half-hourly. Figure 3 shows a visual
representation of the building energy consumption
over these four weeks and it can be seen that there
are peak times of power consumption which
occasionally breaches 200kWh, but the apparent
base load power consumption, which occurs for the
majority of the period, is between 80 and 120kWh.
The increase from base load energy is likely to be
caused be the use of small power from the plug
systems and lighting, whereas the base load energy
will be used for maintaining a constant comfortable
environment throughout the building.
TABLE 1 - REPRESENTATIVE DATES FOR DATA
# Week Comparison Represents
1 3rd–9th October 2011 Beginning of Term 2 24th-30th October 2011 Mid Term 3 26th December 2011 –
1st January 2012
Holiday Period
4 16th-22nd January 2012 Exam Period
TABLE 2 - KEY FOR FIGURE 3
kWh Energy Consumption
0 Minimum
40 Low
80 Medium
120 High
160 Very High
200 Maximum
ESL-IC-13-10-46
Proceedings of the 13th International Conference for Enhanced Building Operations, Montreal, Quebec, October 8-11, 2013

OCCUPANCY VS ELECTRICITY
CONSUMPTION
Figure 4 shows a visual representation of
the occupancy within the IC during the 2011/12
academic year. The occupancy and weather data
intervals are hourly. Table 3 shows the
classifications related to the maximum occupancy
percentage of the building capacity.
The areas that are most intriguing in Figure 4 are
the sub optimal times where the building has less
than 600 occupants, with the capacity for over
double this. Quite often, especially in the holiday
periods and early mornings (throughout the year
between 03:00 and 06:00) there are less than 100
occupants, yet the building is still required to be
mechanically regulated to comfortable conditions.
TABLE 3 - KEY FOR FIGURE 4
Minimum
Occupancy
Maximum
Percentage of
Capacity
Classification
0 46 Suboptimal
600 69 Optimal
900 81 Busy
1050 92 Full
1200 100 Overfull
1300 Dangerous
The relatively high energy use within the
IC towards midnight compared to other suboptimal
times is illustrative of the number of people
remaining in the IC in the evenings, since the levels
are often only a little below optimal, alongside the
FIGURE 3 - VISUAL REPRESENTATION OF ENERGY CONSUMPTION WITHIN THE INFORMATION COMMONS
FIGURE 4 - VISUAL REPRESENTATION OF OCCUPANCY LEVELS WITHIN THE INFORMATION COMMONS
ESL-IC-13-10-46
Proceedings of the 13th International Conference for Enhanced Building Operations, Montreal, Quebec, October 8-11, 2013

varying functions at different time of day. For
example, in mid semester, at midnight, a relatively
high proportion of occupants will be utilising the
computer and printing facilities to complete
assignments. This can go some way to explaining
the high energy usage on the Sunday night. This
suggestion is further enforced by the average stay
time on Sunday October 30th increasing from 20
minutes for those leaving between 8am and 9am, to
3 hours 49 minutes for those leaving between 11pm
and 12pm.
A Smart Building will endeavour to
reduce the base load energy consumption and thus
target more consistent energy consumption per
occupant whilst maintaining functionality and
occupant comfort. Error! Reference source not
found. shows the current correlation between
occupancy and energy usage per occupant hour
over the four days shown in table 1. The
average energy consumption per occupant-hour,
when the building is “optimal” or above, during
these four days is 0.72kWh person-1 hour-1. In
contrast, the average for “below optimal” energy
usage is 3.34kWh person-1 hour-1; near a factor of 5
higher. However, the building is suboptimal 70%
of the time, and therefore, as an example, if the
energy consumption per occupant-hour was
reduced by half when in suboptimal occupancy
states, the energy saved would be 31% of the total
building energy consumption over the four days
used. This will be primarily due to inefficient use
of space and resources in the building. Using
information more effectively can enable building
space and resources to be used more effectively in
suboptimal time periods.
TABLE 4 - KEY FOR FIGURE 5
kWh per Occupant Hour
<0.3
0.3-1
1-3
3-10
10-30
30-100
>100
APPLYING SMART CONCEPTS
An example of how higher levels of
building space and resource efficiency can be
achieved through a combination of enterprise
system integration, real time displays and occupant
feedback is provided below.
Part of the value of the IC is the ability for
occupants to have a choice of location, hence the
reason for optimal occupancy being between 45%
and 70% of capacity. Therefore, when the building
has only 200 occupants, it would be useful to have
approximately 1/3 of the building operational.
Further value in the IC is added through
its multifunctional use capabilities, with silent
study areas, group working areas and quiet zones as
examples. In order to enable this distribution of
uses to be maintained, occupants would need to be
informed as to where the location of the zones. This
would be achieved through real time screens at the
entrance to the IC, as well as screens within each
area of the building.
FIGURE 5 - VISUAL REPRESENTATION OF ENERGY USED PER OCCUPANT HOUR WITHIN THE INFORMATION COMMONS
ESL-IC-13-10-46
Proceedings of the 13th International Conference for Enhanced Building Operations, Montreal, Quebec, October 8-11, 2013

The IC has 7 floors and assuming that
these are flexible spaces which can adapt to the
needs of the occupants, each floor can be utilised
when the occupancy requires it, in order to meet the
minimum occupancy levels of 70% capacity, as
based upon current optimal levels. Table 5 shows
the number of floors that are required to be
available for different occupancies and the
corresponding number of hours within the 4 weeks
discussed that the building could satisfy the
occupancy criteria to have only the respective
number of floors operational.
TABLE 5 - MAXIMUM PERMITTABLE CAPACITY TO
ALLOW MAINTENANCE OF CHOICE AVAILABLE TO
OCCUPANTS
Floors
Open
Capa
city
Max
Allowable
Occupancy
Hours
occupancy
criteria are
satisfied
7 floors 1300 900 132
6 floors 1114 771 46
5 floors 929 643 30
4 floors 743 514 50
3 floors 557 386 63
2 floors 371 257 106
1 floor 186 129 245
In the building the floors would not
necessarily need to signify the usable zones here
we will treat it as such. When implemented the new
spread of occupancy classifications would be as in
Figure 6. It can be seen that, compared to Figure 4,
space is utilised far more efficiently, whilst
maintaining the value of the IC.
Table 6 shows estimated theoretical
maximum energy savings possible using this
concept. A number of assumptions have been made
to estimate this value, the two most important
being:
The baseline energy is assumed to be the
minimum electricity consumption value over
the entire year (180kW), and is therefore
assumed to be unaffected by the occupancy of
the building and solely dependent on the area
of the building that is operational.
It is assumed that the building zones are
functionally flexible and use baseline energy
equally.
TABLE 6 - MAXIMUM THEORETICAL ENERGY SAVINGS OVER
THE 4 WEEKS
Baseline energy use (original) 120960 kWh
Baseline energy use (with smart
concept) 56469 kWh
Total building energy use in the
4 selected weeks 156491 kWh
Maximum energy saving
potential 41.2%
The actual savings are likely to be lower
than the figure in Table 6 due to, among other
reasons:
Dedicated functional zones that are operational
at all times
The assigning of larger discrete blocks of time
in which zones are closed, rather than half hour
iterations
Interactions between operational and non-
operational zones
FIGURE 6 - UPDATED OCCUPANCY DIAGRAM WHEN BUILDING ZONES ARE SHUT DOWN CORRELATING TO EXPECTED OCCUPANCY LEVELS
ESL-IC-13-10-46
Proceedings of the 13th International Conference for Enhanced Building Operations, Montreal, Quebec, October 8-11, 2013

However, by designing a building to be
adaptable and implementing smart principles, the
reduction in energy consumption will be significant
and achieved without compromising the comfort of
the occupants.
Integrating enterprise into the building
operating system would allow for an individual to
specify a computer and preferred comfort variables
in order to be allocated a computer that is in the
currently occupied zones of the building. A similar
method could be achieved with room bookings.
Enterprise integration could also allow the building
to adapt the mechanical services needed in a room
based upon the occupancy levels and intended use.
The ability to tailor information to specific
occupants would also be possible and useful for
both the comfort and energy use within the
building. Informing an occupant that their preferred
location is likely to be cooler than usual due to the
predicted weather conditions may encourage the
occupant to adapt themselves and therefore negate
the need for excess mechanical heating, whilst
improving comfort. This information can be
conveyed using smart devices, computers and
social networking sites in order to reach the desired
audience.
CONCLUSIONS Although it needs to be acknowledged that
The IC is a relatively unusual example of a
building with highly variable rates of occupancy
usage, it serves as an example as to how the
utilisation of information before an event has
occurred can increase energy efficiency whilst
maintaining occupant comfort, rather than the
building operator, the building systems or the
building occupants having to react in order to
rectify the energy waste or discomfort within a
building.
The design of both interior and external
aspects of a building, alongside the flexibility of
the building enterprise systems, will impact upon
the effectiveness of the concept; the more flexible
the functions are in a particular zone, and the fewer
rooms that are required to be open at all times, the
higher the potential savings will be.
The occupants still control their own
comfort but with the benefit of being informed,
showing that choice does not need to be to the
detriment of energy efficiency.
ACKNOWLEDGEMENTS This research was funded by the UK
Energy Research Council (UKERC) and conducted
as part of the E-Futures DTC at The University of
Sheffield.
REFERENCES
Buckman, A. H., M. Mayfield, et al. (2013).
What is a Smart Building?, The
University of Sheffield.
Callaghan, V., G. Clarke, et al. (2009). "Some
socio-technical aspects of intelligent
buildings and pervasive computing
research." Intelligent Buildings
International 1(1): 56-74.
Clements-Croome, D. (2011). "Editorial."
Intelligent Buildings International
3(4): 221-222.
Clements-Croome, D. (2011). "Sustainable
intelligent builldings for people: A
review." Intelligent Buildings
International 3(2): 67-86.
HM Government (2011). The Carbon Plan:
Delivering our low carbon future,
Department of Energy and Climate
Change.
Kyle, P., L. Clarke, et al. (2010). "Climate
policy and the long-term evolution of
the U.S. buildings sector." Energy
Journal 31(2): 145-172.
Stubbings, M. (1986). "Intelligent Buildings."
Contracts.
ESL-IC-13-10-46
Proceedings of the 13th International Conference for Enhanced Building Operations, Montreal, Quebec, October 8-11, 2013