INFORMATIO»fTC^(ISER& - OhioLINK ETD Center
290
INFORMATIO»fTC^(ISER& This manuscript has been reproduced from the microfilm master UMI films the text directly from the original or copy submitted. Thus, some thesis and dissertation copies are in typewriter face, while otfiers may be from any type of computer printer. The quality of this reproduction is dependent upon the quality of the copy submitted. Broken or indistinct print, colored or poor quality illustrations and photographs, print bleedthrough, substandard margins, and improper alignment can adversely affect reproduction. In the unlikely event that the author did not send UMI a complete manuscript and there are missing pages, these will be noted. Also, if unauthorized copyright material had to be removed, a note will indicate the deletion. Oversize materials (e.g., maps, drawings, charts) are reproduced by sectioning the original, beginning at the upper left-hand comer and continuing from left to right in equal sections with small overlaps. Photographs included in the original manuscript have been reproduced xerographically in this copy. Higher quality 6" x 9" black and white photographic prints are available for any photographs or illustrations appearing in this copy fbr an addltionaf charge. Contact UMtdirectly to order. ProQuest Information and Learning 300 North Zeeb Road. Ann Arbor, Ml 48106-1346 USA 800-521-0600 UMÏ
-
Upload
khangminh22 -
Category
Documents
-
view
3 -
download
0
Transcript of INFORMATIO»fTC^(ISER& - OhioLINK ETD Center
INFORMATIO»fTC^(ISER&
This manuscript has been reproduced from the microfilm m aster UMI films the text directly from the original or copy submitted. Thus, some thesis and dissertation copies are in typewriter face, while otfiers may be from any type of computer printer.
The quality of this reproduction is dependent upon the quality of the copy submitted. Broken or indistinct print, colored or poor quality illustrations and photographs, print bleedthrough, substandard margins, and improper alignment can adversely affect reproduction.
In the unlikely event that the author did not send UMI a complete manuscript and there are missing pages, these will be noted. Also, if unauthorized copyright material had to be removed, a note will indicate the deletion.
Oversize materials (e.g., maps, drawings, charts) are reproduced by sectioning the original, beginning at the upper left-hand comer and continuing from left to right in equal sections with small overlaps.
Photographs included in the original manuscript have been reproduced xerographically in this copy. Higher quality 6" x 9" black and white photographic prints are available for any photographs or illustrations appearing in this copy fbr an addltionaf charge. Contact UMtdirectly to order.
ProQuest Information and Learning 300 North Zeeb Road. Ann Arbor, Ml 48106-1346 USA
800-521-0600
UMÏ

THE IMPACT OF DYNAMIC GEOMETRY SOFTWARE ON STUDENTS’ ABILITIES TO GENERALIZE IN GEOMETRY
DISSERTATION
Presented in Partial Fulfilment of the Requirements for the Degree Doctor of Philosophy in the
Graduate School of The Ohio State University
By
James Velo, B.A., M.A.
* * * * *
The Ohio State University
2001
Dissertation Committee:
Dr. Sigrid Wagner, Adviser Approved by
Dr. Douglas T. Owens
Dr. Stephen J. Pape
Adviser College of Education

UMI Number: 3031279
Copyright 2001 by Velo, James
All rights reserved.
UMI’UMI Microform 3031279
Copyright 2002 by Bell & Howell Information and Learning Company. All rights reserved. This microform edition Is protected against
unauthorized copying under Title 17. United States Code.
Bell & Howell Information and Leaming Company 300 North Zeeb Road
P.O. Box 1346 Ann Arbor, Ml 48106-1346
Copyright by
James Velo
2001
-■ '■
ABSTRACT
The purpose of this study was to investigate whether regular use of dynamic
geometry software enhances students’ abilities to make generalizations in geometry. Three
high school geometry classes participated in the study. The experimental group consisted
of two classes taught by the researcher, and used Cabri Geometry II (on individual TI-92
calculators) on a regular basis for exploring concepts in geometry. The third class, taught
by another teacher, served as a control group. While both groups used the same textbook
and followed the same course of study, the control group did not use dynamic geometry
software.
Data sources for the study were: scores on an Entering Geometry Student Test
(HOST), a generalization pre- and posttest, task-based interviews, and classroom
observations of each group. No significant differences were found between the groups on
the HOST or on the generalization pretest. Analysis of covariance (ANCOVA) was used to
control for initial differences on the EGST and the generalization pretest. Results of the
ANCOVA test did not show any significant differences (p < .05) between the groups on
the generalization posttest.
Task-based interviews with a subset of fifteen students from each group were
conducted to further investigate differences between the groups on their ability to
generalize. Six geometry tasks were posed to the students. The sixth task contained
multiple parts. Student responses to the tasks were classifîed into high, medium, or low
response categories based on criteria developed by the researcher. A chi-square analysis
showed that there was a significant relationship (p < .OS) between group membership and
performance in ten of the rifteen categories of the task analysis. The experimental group
showed a greater tendency to make and test conjectures during the interviews. Results of
the interviews and classroom observations of the experimental group indicate that regular
use of dynamic geometry software seems to enhance students’ abilities to make
generalizations in geometry.
m

Dedicated to;
My mother and father.
You have both inspired me more than you will ever know.
Dad, I miss you.
IV
ACKNOWLEDGMENTS
I would like to thank my adviser. Dr. Sigrid Wagner, for her encouragement and
support during my years as a doctoral student at The Ohio State University. Her insight
and thoughtfulness has always been an inspiration to me. The feedback that she provided
during the dissertation process was invaluable. I would like to thank the other members of
my dissertation committee. Dr. Douglas Owens and Dr. Stephen Pape, for their help and
encouragement during this process. The editorial changes suggested by the dissertation
committee resulted in a much-improved final version. I would like to thank Dr. Arthur
White for his help in quantitative data analysis. I would also like to thank Dr. Michelle
Reed for her help in providing inter-rater reliability in the scoring of the interview tasks.
Many thanks go to all of my colleagues (in the Columbus Public Schools and at The
Ohio State University) who have been supportive of my efforts to pursue this degree. I
appreciate your encouragement and enthusiasm. Special thanks go to Mr. Andrew Nguyen
for all of his help with this study. My heartfelt thanks go to all of the students who
participated in this study. Particularly, I wish to thank the thirty students who participated
in the interviews. I appreciate your time and effort.
Finally, to my family and friends: Thanks for being there during my journey
through this doctoral program. I am sure that many of you wondered if I would ever
actually finish this dissertation. The good news: It is done! I share my joy of
accomplishment with all of you!
VITA
August 28, 1959
1981
1989
1987 - Present
Bom - Mansfîeld, Ohio
B.A., Miami University, Oxford, Ohio Mathematics and Statistics, Public Administration
M.A., The Ohio State University, Columbus, Ohio Mathematics Education
Columbus Public Schools, Columbus, Ohio Mathematics Teacher
FIELDS OF STUDY
MAJOR FIELD: EDUCATION
MATHEMATICS EDUCATION
VI
TABLE OF CONTENTSPAPE
A bstrac t........................................................................................................................... ü
D edication ...................................................................................................................... iv
A cknow ledgm ents........................................................................................................ v
V ita ................................................................................................................................... vi
List o f Tables............................................................................................................. xi
List o f Figures.......................................................................................................... xiii
CHAPTER 1. STATEMENT OF THE PROBLEM................................................ 1
NCTM Standards............................................................................................. 2
Third International Mathematics and Science Study................................. 4
G eneralization.................................................................................................... 6
G eom etry............................................................................................................. 9
Dynamic Geometry Software..................................................................... 11
Cabri Geometry II .......................................................................................... 15
An Amazing Discovery................................................................................ 18
Research Q uestion...........................................................................................22
CHAPTER 2. THEORETICAL FRAMEWORK AND REVIEW OF RELATED
LITERA TURE.................................................................................................... 24
D ienes................................................................................................................... 24
Dienes’ Mathematics Leaming Theory....................................................... 27
Dienes’ Theory of Abstraction and Generalization..................................... 35
Vll
Generalizing With Dynamic Geometry Software...................................... 44
A M odel...................................................... 47
Review of Related Literature.................................................................... 48
G eneralization ........................................................................................48
Geometry softw are........................................................................... 56
Significance of the Study.......................................................................... 82
CHAPTER 3. METHODOLOGY........................................................................ 84
S ite ...................................................................................................................... 84
S u b jec ts .............................................................................................................. 85
Instrum enta tion ............................................................................................... 89
Entering Geometry Student Test................................................... 89
Generalization Tests........................................................................... 89
Interview Tasks.............................................................................. 100
Instructional M aterials............................................................................... 101
List o f Topics................................................................................. 101
Lesson Vignettes (Experimental Group)................................................ 103
Lesson Vignettes (Control Group).......................................................... 119
Connecting the Lessons to Dienes’ Theory............................................ 127
P rocedures...................................................................................................... 129
R ecruitm ent........................................................................................ 129
Pre-instrum ents.................................................................................. 129
Instruc tion ........................................................................................... 130
Post-instrum ents............................................................................... 130
CHAPTER 4. DATA ANALYSIS.................................................................... 132
Reliability o f instruments.......................................................................... 132
Entering Geometry Student Test............................................................. 133
viii
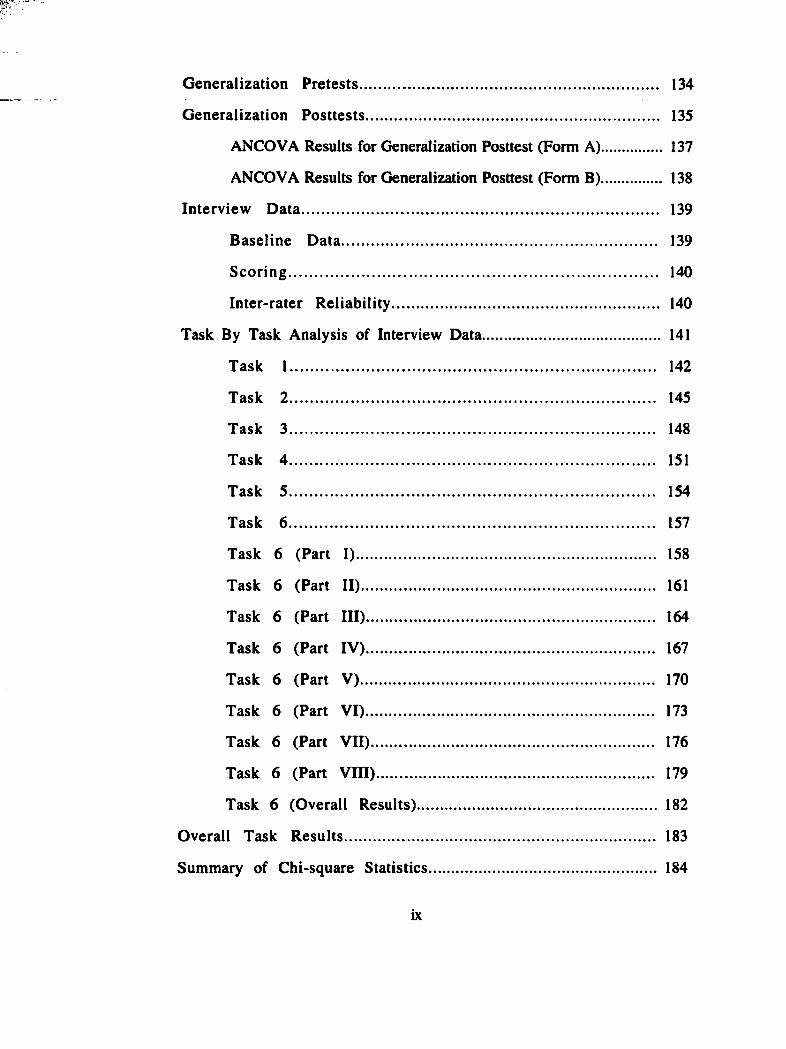
Generalization Pretests.............................................................................. 134
Generalization Posttests............................................................................. 135
ANCOVA Results for Generalization Posttest (Form A).............. 137
ANCOVA Results for Generalization Posttest (Form B).............. 138
Interview D ata.............................................................................................. 139
Baseline D ata................................................................................... 139
S coring ................................................................................................. 140
Inter-rater Reliability..................................................................... 140
Task By Task Analysis of Interview Data............................................. 141
Task 1................................................................................................ 142
Task 2 ................................................................................................ 145
Task 3 ................................................................................................ 148
Task 4 ................................................................................................ 151
Task 5 ................................................................................................ 154
Task 6 ................................................................................................ 157
Task 6 (Part I)............................................................................... 158
Task 6 (Part II)............................................................................... 161
Task 6 (Part III)............................................................................. 164
Task 6 (Part IV)............................................................................. 167
Task 6 (Part V ).............................................................................. 170
Task 6 (Part VI)............................................................................. 173
Task 6 (Part V II)........................................................................... 176
Task 6 (Part VIH).......................................................................... 179
Task 6 (Overall Results).................................................................. 182
Overall Task Results................................................................................... 183
Summary of Chi-square Statistics................................................................ 184
ix
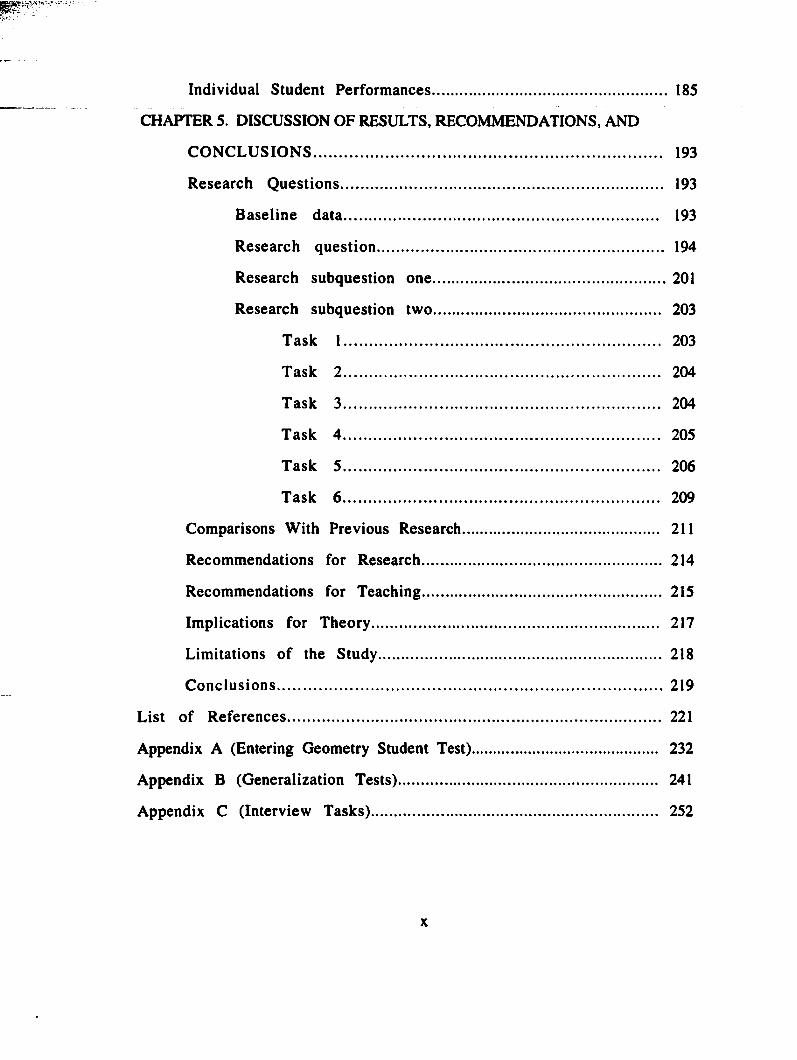
Individual Student Performances.............................................................. 185
CHAPTER 5. DISCUSSION OF RESULTS, RECOMMENDATIONS, AND
CO N CLU SIO N S............................................................................................ 193
Research Q uestions..................................................................................... 193
Baseline data ................................................................................... 193
Research question........................................................................... 194
Research subquestion one...............................................................201
Research subquestion tw o............................................................ 203
Task 1................................................................................... 203
Task 2 ................................................................................... 204
Task 3 ................................................................................... 204
Task 4 ................................................................................... 205
Task 5 ................................................................................... 206
Task 6 ................................................................................... 209
Comparisons With Previous Research................................................... 211
Recommendations for Research............................................................... 214
Recommendations for Teaching............................................................... 215
Implications for Theory........................................................................... 217
Limitations of the Study.......................................................................... 218
C onclusions..................................................................................................... 219
List of References.............................................................................. 221
Appendix A (Entering Geometry Student Test)................................................. 232
Appendix B (Generalization Tests).................................................................... 241
Appendix C (Interview Tasks)........................................................................... 252
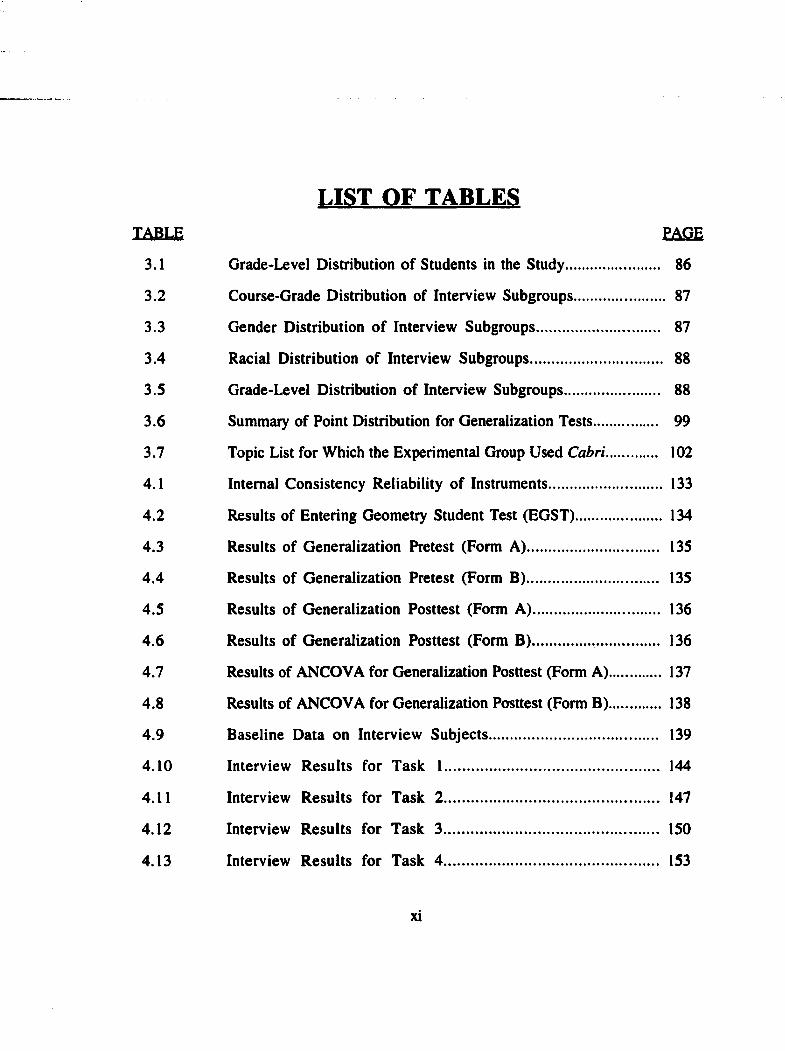
LIST OF TABLESTAPLE PAGE
3.1 Grade-Level Distribution of Students in the Study............................ 86
3.2 Course-Grade Distribution of Interview Subgroups.......................... 87
3.3 Gender Distribution of Interview Subgroups................................... 87
3.4 Racial Distribution of Interview Subgroups..................................... 88
3.5 Grade-Level Distribution of Interview Subgroups............................ 88
3.6 Summary of Point Distribution for Generalization Tests.................... 99
3.7 Topic List for Which the Experimental Group Used Cal>ri 102
4.1 Internal Consistency Reliability of Instruments................................. 133
4.2 Results of Entering Geometry Student Test (EGST)........................ 134
4.3 Results of Generalization Pretest (Form A)..................................... 135
4.4 Results of Generalization Pretest (Form B)..................................... 135
4.5 Results of Generalization Posttest (Form A)................................... 136
4.6 Results of Generalization Posttest (Form B).................................. 136
4.7 Results of ANCOVA for Generalization Posttest (Form A) 137
4.8 Results of ANCOVA for Generalization Posttest (Form B) 138
4.9 Baseline Data on Interview Subjects.............................................. 139
4.10 Interview Results for Task 1............................................................ 144
4.11 Interview Results for Task 2........................................................... 147
4.12 Interview Results for Task 3........................................................... 150
4.13 Interview Results for Task 4 ........................................................... 153
XI
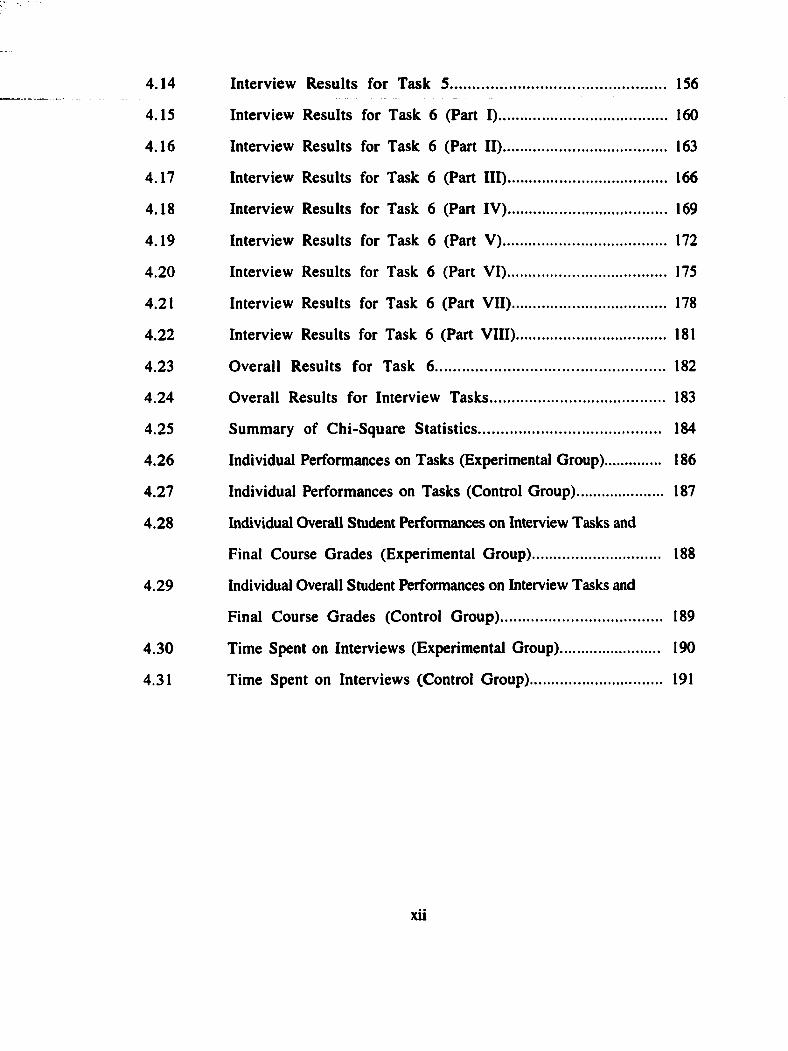
4.14 Interview Results for Task 5......................................................... 156
4.15 Interview Results for Task 6 (Part I)........................................... 160
4.16 Interview Results for Task 6 (Part II).......................................... 163
4.17 Interview Results for Task 6 (Part HI).......................................... 166
4.18 Interview Results for Task 6 (Part IV)......................................... 169
4.19 Interview Results for Task 6 (Part V).......................................... 172
4.20 Interview Results for Task 6 (Part VI)......................................... 175
4.21 Interview Results for Task 6 (Part VII)........................................ 178
4.22 Interview Results for Task 6 (Part VIH)....................................... 181
4.23 Overall Results for Task 6............................................................. 182
4.24 Overall Results for Interview Tasks............................................... 183
4.25 Summary of Chi-Square Statistics................................................. 184
4.26 Individual Performances on Tasks (Experimental Group)............... 186
4.27 Individual Performances on Tasks (Control Group)....................... 187
4.28 Individual Overall Student Performances on Interview Tasks and
Final Course Grades (Experimental Group)................................. 188
4.29 Individual Overall Student Performances on Interview Tasks and
Final Course Grades (Control Group).......................................... 189
4.30 Time Spent on Interviews (Experimental Group)........................... 190
4.31 Time Spent on Interviews (Control Group)................................... 191
XU
LIST OF FIGURESFIQ yR g PAGE
1.1 Triangle sum, initial appearance...................................................... 16
1.2 Triangle sum, modified appearance................................................. 17
1.3 Marion Walter’s Theorem {based on Watanabe, Hanson, &
Nowosielski, 1996)........................................................................... 18
1.4 Cabri sketch based on February 1992 cover of Mathematics
Teacher jo u rn a l................................................................................... 19
1.5 Morgan’s discovery {based on Watanabe, Hanson, &
Nowosielski, 1996)........................................................................... 21
2.1 A student’s “construction” of a rectangle......................................... 28
2.2 Modified “rectangle” ........................................................................... 29
2.3 A rectangle constructed using perpendicular lines............................ 30
2.4 Initial manipulation of constructed rectangle.................................... 31
2.5 Further manipulation of constructed rectangle................................. 32
2.6 More than one rectangle in the same sketch..................................... 34
2.7 Mathematical generalization.............................................................. 36
2.8 Centroid o f a triangle.......................................................................... 37
2.9 Centroid o f a quadrilateral as I have defined it.................................38
2.10 Centroid o f a quadrilateral {based on Larson, Boswell, &
Stiff, 1995)............................................................................................. 39
xui
2.11 Center o f gravity and centroid o f the quadrilateral
on the same sketch.......................................................................... 41
2.12 Centroid o f a pentagon ..................................................................... 43
2.13 Four versions of triangle ABC.......................................................... 45
2.14 Dienes’ Mathematics Leaming Theory explored through the lens of
dynamic geometry software...............................................................47
2.15 Exterior angles o f a triangle............................................................ 50
2.16 Oullette and Bennett’s discovery (based on Oullette &
Bennett, 1979)............. 57
2.17 Quadrilateral formed by angle bisectors (based on Arzarello
et a l , 1998)............................................. 73
2.18 The case when ABCD is a square (based on Arzarello
et a l , 1998).......................................................................................... 74
2.19 Ordinary quadrilateral ABCD with coincident inner points
(based on Arzarello et a l, 1998).................................................... 75
2.20 Quadrilateral ABCD circumscribed about a circle (based on
Arzarello et a l, 1998)....................................................................... 76
2.21 Pentagon problem [1 decimal place precision]
(based on Zbiek, 1996).................................................................... 80
2.22 Pentagon problem [2 decimal place precision]
(based on Zbiek, 1996).................................................................... 81
3.1 Parallel lines, transversals, and angles........................................... 104
3.2 Parallel lines and specifîc angle measures..................................... 104
3.3 Modified version of angle measurements...................................... 105
3.4 Isosceles right triangle.................................................................... 107
XIV
3.5 Half-equilateral triangle.................................................................... 107
3.6 Concurrency of perpendicular bisectors........................................ 108
3.7 Circumscribed circle of a triangle................................................ 109
3.8 Angle bisectors of any triangle are concurrent................................ I l l
3.9 Incenter and inscribed circle......................................................... 111
3.10 Triangle Midsegment Theorem...................................................... 113
3.11 Trapezoid Midsegment Theorem.................................................... 113
3.12 Polygon Interior Angles Theorem.................................................. 115
3.13 Polygon Exterior Angles Theorem................................................. 116
3.14 Connecting midpoints of a quadrilateral........................................ 117
3.15 Pythagorean Theorem ....................................................................... 118
3.16 Beginning of Triangle Sum Theorem investigation........................ 119
3.17 Conclusion of Triangle Sum Theorem investigation....................... 120
3.18 Exterior Angle Theorem investigation........................................... 120
3.19 Explanation of Exterior Angle Theorem........................................ 121
3.20 Special segments in a triangle....................................................... 122
3.21 Concurrency properties.................................................................... 123
3.22 Triangle Midsegment Theorem...................................................... 124
3.23 Data collected for Polygon Interior Angle Theorem........................ 125
3.24 Polygon Exterior Angle Theorem.................................................. 126
4.1 Time spent on interviews............................................................... 192
5.1 Circumcenters of acute and obtuse triangles................................. 196
5.2 Circumcenter of a right triangle.................................................... 196
5.3 Euler line of a triangle................................................................... 197
5.4 Euler line of an isosceles triangle................................................. 199
5.5 All four points coincide in an equilateral triangle........................... 199
XV
5.6 Medians of an isosceles triangle................................................... 200
5.7 Medians of an equilateral triangle................................................... 201
5.8 Example 1 from Task 5................................................................. 207
5.9 A discovery made during Task 5.................................................. 207
5.10 Reasoning behind students' discovery made during Task 5............. 208
XVI
CHAPTER 1
STATEMENT OF THE PROBLEM
The ability to generalize in various mathematical situations is a key goal of school
mathematics. The importance of generalization, the key place that geometry holds in our
curriculum, and advancements in technology set the stage for research in mathematics
education that connects all three areas. Abstraction and generalization have long been
important processes in school mathematics; the performance of United States students on
domestic and international assessments has much room for improvement; and finally,
technology provides teachers with new opportunities to enhance student leaming in the
geometry classroom. This dissertation study connects generalization in the geometry
classroom through the use of a particular technological resource, dynamic geometry
software.
The chapter begins with a discussion of key changes that have been recommended
by the professional organization for mathematics teachers, the National Council of Teachers
of Mathematics (NCTM). The chapter continues with data from the Third International
Mathematics and Science Study, comparing the performance of U.S. students in geometry
to the performance of students from other nations. The importance of generalization and
geometry in school mathematics is the focus of the next sections, followed by a discussion
of the role of technology in leaming mathematics. Subsequent sections familiarize the
reader with some of the ctqiabilities of d>'namic geometry software programs. The chapter
1
closes with details of an amazing discovery by a high school student who was working
with dynamic geometry software and the particular research questions that guided this
study.
NCTM STANDARDSThe quality of mathematics education of American students has been a source of
discussion in this country for many years. In the recent past, the professional organization
for practicing mathematics teachers has become vocal in calling for reform in mathematics
curriculum, instruction, and assessment. NCTM has published four documents
(Curriculum and Evaluation Standards fo r School Mathematics, 1989; Professional
Standards fo r Teaching Mathematics, 1991b; Assessment Standards for School
Mathematics, 1995; Principles and Standards for School Mathematics, 2000) which are
meant to guide reform in the teaching and leaming of mathematics. NCTM supplemented
the Curriculum and Evaluation Standards fo r School Mathematics with an Addenda
Series, which presents ideas and activities for classroom use. The most recent publication,
entitled Principles and Standards fo r School Mathematics, builds upon the strong
foundation of the three previous Standards publications. Also referred to as Standards
2000, the latest publication will continue to provide a foundation for growth, development,
and reform in mathematics education in the years to come.
NCTM, in the Curriculum and Evaluation Standards for School Mathematics,
discusses the need for standards for school mathematics and the need for new goals for
society and students as a background to the proposed K-12 recommendations. Throughout
history, standards have been important to ensure quality, to indicate goals, and to promote
change (NCTM, 1989, p. 2). NCTM argues that we have become an information society,
with low-cost technology having had major impacts in the sciences, business, industry,
and government. Our schools must adapt and prepare students for the world they will enter
2
as young adults. The current organization of schools is more associated with the industrial
age than the information age and the number of students preparing for agricultural and
industrial careers is greatly diminished. Today’s students must be prepared to adapt in an
ever-changing technological society. NCTM lists new social goals for education as
follows: 1) mathematically literate workers, 2) lifelong leaming, 3) opportunity for all, and
4) an informed electorate (pp. 3-4). To best prepare students to live and be productive in
the information society, NCTM suggests that we must have new goals for students. They
are as follows: 1) leaming to value mathematics, 2) becoming confident in one’s own
ability, 3) becoming a mathematical problem solver, 4) leaming to communicate
mathematically, and 5) leaming to reason mathematically (pp. 5-6).
Along with NCTM, the Mathematical Sciences Educational Board (MSEB) and
several other organizations with roots in the mathematical sciences have called for change in
K-12 classrooms. In Reshaping School Mathematics (MSEB, 1990), MSEB
complements NCTM with its discussion of reform in school mathematics. MSEB
effectively argues that many changes affect the world of mathematics education. These
changes include: changes in the need for mathematics, changes in mathematics and how it
is used, changes in the role of technology, changes in American society, changes in
understanding how students learn, and changes in intemational competitiveness (pp. 1-3).
As jobs now require analytical rather than mechanical skills, students will need more
mathematical power to be able to compete in the job market (p. 1). Finally, a changing
American society and changing demands of the workplace make it increasingly important
for “an approach to mathematics education that ensures achievement across the
demographic spectrum’’ (MSEB, 1990, p. 3).
Technology has made possible new developments in mathematics and has given us
new possibilities as to how students are able to learn mathematics. Various technologies in

mathematics classrooms give students immediate feedback on their conjectures, help
students to solve problems, and may assist students in developing reasoning skills.
Technology may fundamentally change teaching and leaming in mathematics classrooms.
Dynamic geometry software, in particular, offers new opportunities for leaming geometry.
Dynamic geometry software can help students to analyze problem situations and to develop
analytical skills.
THIRD INTERNATIONAL MATHEMATICS AND SCIENCE STUDY
Along with recommendations of professional organizations, large-scale data have
been collected which compare mathematics achievement in the United States to that of other
countries. The Third Intemational Mathematics and Science Study (TIMSS) provides
much data for those attempting to make a case for improvements in achievement of
American students. Conducted in 1995 by the Intemational Association for the Evaluation
of Education (lAEE), TIMSS collected information on a half-million students worldwide,
including more than 33,000 students in more than 500 U.S. public and private schools. In
mathematics, TIMSS data were collected in the following areas at the fourth-, eighth-, and
twelfth-grade levels: fractions and number sense; algebra; geometry; data representation,
analysis, and probability; measurement; and proportionality. In the advanced mathematics
assessments, data were collected in the areas of numbers and equations, calculus, and
geometry. Findings from the eighth and twelfth grades are presented below. Specific
attention is drawn to findings in geometry.
Eighth-grade findings. Eighth-grade results showed that U.S. students were
outperformed by students from 20 countries, were comparable to students of 13 countries,
and outperformed students of only 7 countries. The intemational standing of U.S. eighth-
grade students was stronger in the areas of algebra, fractions, data representation, analysis,
probability, and number sense than it was in the areas of geometry, measurement, and
4
proportionality. Geometry problems included visualization and properties of geometric
figures, including symmetry, congruence, and similarity.
In an analysis of eighth-grade textbooks, geometry occupied more space in German
and Japanese books than in U.S. texts. Classroom observations indicated that Japanese
and German lessons were also more likely to cover geometry. In studying lessons by
U.S., German, and Japanese teachers, 30% of Japanese lessons and 23% of German
lessons were considered to contain high-quality sequences of mathematical ideas while
none of the U.S. lessons were classified in this category.
The TIMSS report (lAEE, 1995) states that a primary goal of the reform movement
in mathematics education is to create classrooms where students are engaged in thinking
deeply about mathematics. Discovery, understanding, and applications of concepts to new
and different situations should be prevalent in mathematics classrooms. TIMSS data
suggest that the content of the U.S. eighth-grade mathematics curriculum is not as
challenging as that of other countries. United States teachers have tried to implement some
of the reform recommendations, according to TIMSS. The changes have been, however,
focused on isolated techniques such as cooperative leaming rather than the key idea that
mathematics teaching and leaming should bring about high levels of mathematical thinking
in students. Finally, TIMSS data suggest that U.S. students have a relatively lower
intemational standing in mathematics than they do in science.
Twelfth-grade findings. The twelfth-grade items of TIMSS focused on
mathematics general knowledge, advanced mathematics, science general knowledge, and
physics. The United States was among the lowest performing countries in both the
mathematics and science general knowledge assessments. In both areas, the U.S. was
below the intemational average. In mathematics general knowledge, U.S. students were
outperformed by 14 out of 20 countries, performed similarly to students in four countries,
and outperformed students of only two countries.
5
Mathematics items at the twelfth-grade level consisted of questions in the following
areas: 1) numbers, equations, and functions, 2) calculus, and 3) geometry. The geometry
items consisted of basic geometry, coordinate geometry, polygons, and circles, and three-
dimensional geometry. Among the content areas, U.S. students’ performance was
relatively weakest in geometry. No country scored below the United States in geometry.
Other large-scale domestic assessments such as the National Assessment of
Educational Progress (U. S. Department of Education, 1997) offer additional data
suggesting that U.S. students have much room for improvement in geometry achievement.
Clearly, there is both room and reason to conduct research in the area of geometry in
American schools.
GENERALIZATION
Being able to reason is essential to understanding mathematics. By developing ideas, exploring phenomena, justifying results, and using mathematical conjectures in all content areas and— with different expectations o f sophistication—at all grade levels, students should see and expect that mathematics makes sense.
—NCTM, 2000, p. 55.
We believe that learning should be guided by the search to answer questions—first at an intuitive, empirical level; then by generalizing; and finally by justifying (proving).
—NCTM, 1989, p. 10.
NCTM’s Principles and Standards fo r School Mathematics (2000) calls for many
changes in mathematics curricula. An emphasis on new topics introduced through problem
situations that will encourage students to explore mathematics, to make and test
conjectures, and prove generalizations is evident throughout the document. Conjecturing is
a process in which learners make an informed guess as to whether an idea is true.
Conjecturing, therefore, is a generalizing process. NCTM (2000) states that “to make
conjectures, students need multiple opportunities and rich, engaging contexts for learning”
(p. 56).
In the Curriculum and Evaluation Standards fo r School Mathematics, NCTM
(1989) describes one of its new goals for students (learning to reason mathematically), by
stating that “making conjectures, gathering evidence, and building an argument to support
such notions are fundamental to doing mathematics” (p. 6). NCTTM (1989) summarizes the
discussion on goals by stating that the intent of the goals is for students to become
mathematically literate. NCTM defines “mathematically literate” as “an individual’s ability
to explore, to conjecture, and to reason logically, as well as to use a variety of mathematical
methods to effectively solve problems” (p. 6). Thus, making and testing conjectures is a
critical aspect of mathematics learning.
In Geometry from Multiple Perspectives (NCTM, 1991a), NCTM points out that
“drawing and measuring computer utilities provide learning environments that foster the
active process of making and exploring conjectures” (p. vi). This particular publication
contains many activities “that require students to experiment, collect data, search for
patterns, make conjectures, and give convincing arguments” (p. vi). NCTM further
illustrates its commitment to this type of thinking in school mathematics with the following
quote: “It is important that provisions be made for students to share their experiences,
clarify their thinking, generalize their discoveries, construct convincing arguments, and
recognize connections with other topics” (p. vii).
In the Professional Standards for Teaching Mathematics (NCTM, 1991b),
several shifts in the environment of mathematics classrooms that are important for
achieving the goal of empowering students are discussed. One of these shifts is toward a
focus on mathematical reasoning, and away from a focus on memorizing procedures.
Another shift is that conjecturing, inventing, and problem solving replace mechanistic
answer-finding (p. 3). Many of the vignettes presented in this volume of the Standards
series illustrate how reasoning, conjecturing, problem solving, and generalizing can be
effectively threaded into mathematics lessons.
MSEB (1990) also describes learning as a quest to answer questions intuitively and
empirically, followed by generalization and proof. MSEB states the following: “If
mathematics is a science and language of patterns, then to know mathematics is to
investigate and express relationships among patterns" (p. 12). Generalization, therefore, is
seen as a key goal of school mathematics.
Finally, the College Entrance Examination Board (CEEB) argues that developing
the ability to generalize should be an important focus of high school mathematics. In a
publication titled Academic Preparation in Mathematics: Teaching fo r Transition From
High School to College (CEEB, 1985), a case is made for examining number patterns with
origins in geometry. Students should investigate data, conjecture a general law, and finally
test their conjectures for validity.
In this section, the importance of generalization as a process in school mathematics
has been discussed. While generalization occurs in every branch of mathematics, geometry
provides a rich context for generalization. A brief history of the development of geometry
and its role in school mathematics is presented in the following section.
GEOMETRY
When all is said and done, however, the fact remains that geometry has attracted and held the attention and interest o f the human race from prehistoric times until the present, purely fo r its own sake. Geometry is at the same time a science and an art, mathematics and philosophy. It supplies us the only perfect system o f logic and its beautiful completeness is not to be found in any other branch o f knowledge.
— }. E. Thompson, 1934, pp. xii-xiv.
Thompson (1934) describes the evolution of geometry from early history to its
present status in the school curriculum. With beginnings in the era of the Babylonians,
geometry has a rich history of development and use. Ancient Egyptian and early Greek
mathematicians contributed to the development of the geometry we know and use today.
Pythagoras (569 - 500 B.C.), a Greek mathematician, was the first to investigate
systematically the principles of geometry and to apply the methods of logic to its
development. Two more prominent Greek mathematicians, Euclid and Archimedes,
furthered knowledge in geometry with their contributions to the field. Euclid, who lived
from about 330 B.C. to about 275 B.C., is known for his books on geometry, collectively
known as Euclid’s Elements. The Elements, written in Euclid’s later years, is the basis
of school geometry today.
Archimedes (287 - 212 B.C.) is known for perfecting the measurement of the
circle, sphere, cylinder, and cone, as well as many other contributions to geometry and
mathematics. The development of geometry as a field of study continued beyond Euclid
and Archimedes, with many mathematicians making contributions. Appolonius of Perga
(260 - 200 B.C.) developed the study of the conic sections, and his work became the basis
for modem analytical geometry. Hipparchus of Nicaea is credited with the invention of
9
trigonometry, an advanced branch of tq)plied geometry. While elementary and secondary
students study Euclidean geometry, advanced topics in geometry, including non-Euclidean
geometries are generally studied at the post-secondary level.
There is general agreement on the goals of geometry instruction. By studying
geometry, students develop logical thinking abilities, spatial intuition about the real world,
knowledge needed to study more mathematics, and skills in the reading and interpretation
of mathematical arguments (Suydam, 1985, p. 481). NCTM argues that by studying
geometry, “students will learn about geometric shapes and structures and how to analyze
their characteristics and relationships” (NCTM, 2000, p. 41). NCTM continues by
discussing the importance of spatial visualization and how geometry is a natural setting for
developing students’ reasoning and justification skills. Geometry is important in
representing and solving problems in mathematics and in real-world situations.
While tools such as compasses and straightedges have traditionally been used in the
study of geometry at the elementary and secondary level, new tools have emerged in the
recent past with the development of various geometry software programs for computers
and calculators. These new technological developments have tremendous potential to
impact the teaching and learning of geometry in our schools. NCTM acknowledges the
important role of dynamic geometry software in the teaching and learning of geometry
(NCTM, 2000, p. 25). One particular dynamic geometry software program is described
later in this chapter. The researcher has observed in his own classes the power of dynamic
geometry software to explore many examples and help students make generalizations in
geometry.
10
DYNAMIC GEOMETRY SOFTWARE
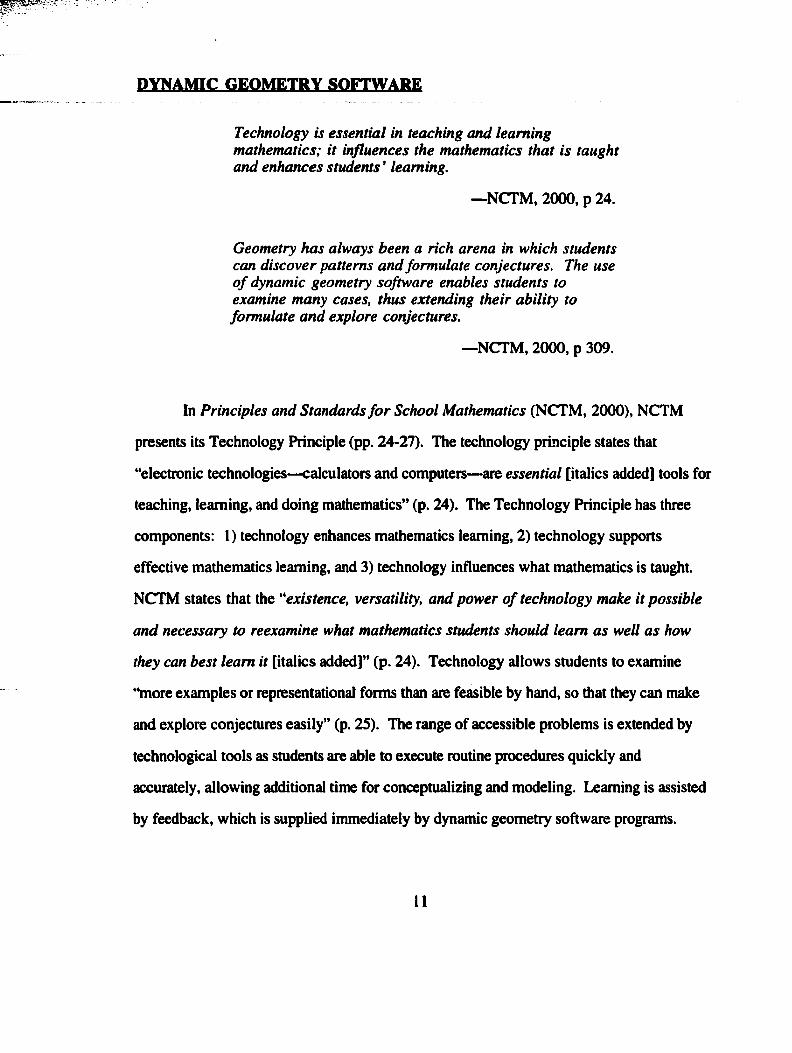
Technology is essential in teaching and learning mathematics; it influences the mathematics that is taught and enhances students ’ learning.
—NCTM, 2000, p 24.
Geometry has always been a rich arena in which students can discover patterns and formulate conjectures. The use o f dynamic geometry software enables students to examine many cases, thus extending their ability to formulate and explore conjectures.
—NCTM, 2000, p 309.
In Principles and Standards fo r School Mathematics (NCTM, 2000), NCTM
presents its Technology Principle (pp. 24-27). The technology principle states that
“electronic technologies—calculators and computers—are essential [italics added] tools for
teaching, learning, and doing mathematics” (p. 24). The Technology Principle has three
components: 1) technology enhances mathematics learning, 2) technology supports
effective mathematics learning, and 3) technology influences what mathematics is taught.
NCTM states that the '^existence, versatility, and power o f technology make it possible
and necessary to reexamine what mathematics students should leam as well as how
they can best leam it [italics added]” (p. 24). Technology allows students to examine
“more examples or representational forms than are feasible by hand, so that they can make
and explore conjectures easily” (p. 25). The range of accessible problems is extended by
technological tools as students are able to execute routine procedures quickly and
accurately, allowing additional time for conceptualizing and modeling. Learning is assisted
by feedback, which is supplied immediately by dynamic geometry software programs.
11
NCTM discusses further the role of dynamic geometry software in mathematics
classrooms. Students can use dynamic geometry software to “engage actively with
geometric ideas” (NCTM, 20CX), p. 41). NCTM points out that dynamic geometry
software allows students to have an interactive experience with two-dimensional objects
and is useful in modeling. With dynamic geometry software, “students can generate many
examples as a way of forming and exploring conjectures” (p. 41).
The teacher is the key to whether or not technology is used effectively in the
classroom. Technology alone does not make a difference; it is how the teacher decides to
use it that will impact student learning in mathematics. Teachers have opportunities to
focus on student thinking as students use technology in the classroom. NCTM clarifies
this point as follows: “As students use calculators or computers in the classroom, the
teacher has an opportunity to observe the students and to focus on their thinking” (NCTM,
20CX), p. 26). Finally, NCTM argues that technology influences what topics are taught and
when they appear in the curriculum. Young children can explore problems involving large
numbers and can use geometry software to investigate shapes. Technology is useful in
helping teachers connect the development of skills and procedures to the more general
development of understanding in mathematics. Some skills previously considered to be
essential, may now be considered less necessary because of technology. NCTM makes the
point that as some skills become less necessary because of the technology, "students can
be asked to work at higher levels o f generalization or abstraction [italics added]” (p.
26). Clearly, the use of technology can positively impact students’ mathematical learning
experiences.
The National Research Council (NRC) reported on the future of mathematics
education to the nation in a document called Everybody Counts (National Academy Press,
1989). In its argument for changing the role of technology in mathematics education, NRC
makes five key points:
12
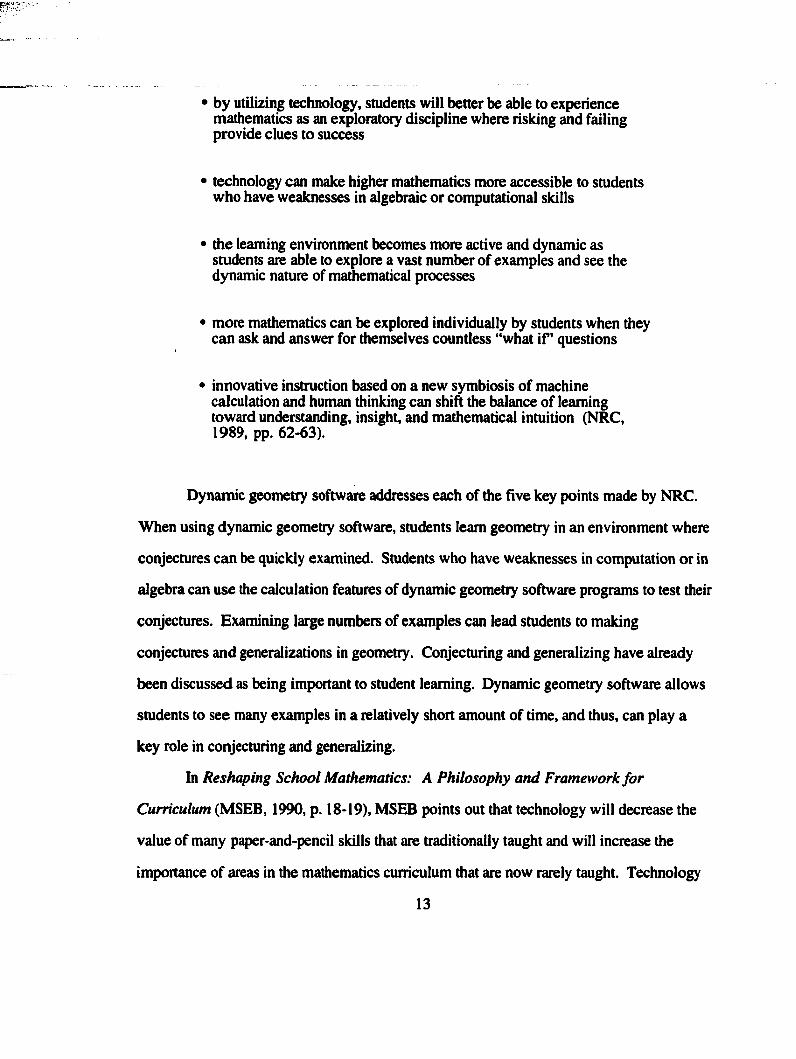
by utilizing technology, students will better be able to experience mathematics as an exploratory discipline where risking and failing provide clues to success
technology can make higher mathematics more accessible to students who have weaknesses in algebraic or computational skills
the learning environment becomes more active and dynamic as students are able to explore a vast number of examples and see the dynamic nature of madiematical processes
more mathematics can be explored individually by students when they can ask and answer for themselves countless “what if ’ questions
innovative instruction based on a new symbiosis of machine calculation and human thinking can shift the balance of learning toward understanding, insight, and mathematical intuition (NRC, 1989, pp. 62-63).
Dynamic geometry software addresses each of the five key points made by NRC.
When using dynamic geometry software, students leam geometry in an environment where
conjectures can be quickly examined. Students who have weaknesses in computation or in
algebra can use the calculation features of dynamic geometry software programs to test their
conjectures. Examining large numbers of examples can lead students to making
conjectures and generalizations in geometry. Conjecturing and generalizing have already
been discussed as being important to student leaming. Dynamic geometry software allows
students to see many examples in a relatively short amount of time, and thus, can play a
key role in conjecturing and generalizing.
In Reshaping School Mathematics: A Philosophy and Framework for
Curriculum (MSEB, 1990, p. 18-19), MSEB points out that technology will decrease the
value of many paper-and-pencil skills that are traditionally taught and will increase the
importance of areas in the mathematics curriculum that are now rarely taught. Technology
13
will help focus attention on problem formulation as well as problem solving. Lastly,
MSEB states that technology may impact the world of teaching and leaming in ways that
mathematics educators can only dream of. We can only imagine Euclid’s amazement if he
were to see dynamic geometry software programs and their power to explore the ideas of
geometry.
The College Board (CEEB, 1985) points out that computers are changing the
discipline of mathematics, and consequently the mathematics curriculum. CEEB states that
“computers are making mathematics into a subject that requires much less attention to the
mastery of routine procedures and much more to how computer power can be used to
explore mathematical ideas" (p. 22). Dynamic geometry software programs (available on
computers and on hand-held calculators) offer the capability of leaming traditional ideas of
geometry in new and different ways, as well as the potential for new discoveries. One
such discovery is described later in this chapter.
The Committee for Economic Development (CED), a private, nonprofit, research
and education organization made up of corporate executives and university presidents,
makes a case for dramatic changes in mathematics and science education due to
technological improvements and availability. In Connecting Students to a Changing
World: A Technology Strategy fo r Improving Mathematics and Science Education,
CED (1995) discusses technology’s role in more effective leaming as well as presenting a
new technology strategy for education. Dynamic geometry programs are highlighted for
their potential in helping students to test hypotheses and make conjectures. An example of
an active learning environment using a particular dynamic geometry program, The
Geometer's Sketchpad, is described. Students “can draw, rotate, and measure geometric
figures to test hypotheses about what happens when different parameters of a figure
change ” (p. 4). Technology is described as stimulating student interest and increasing time
14
spent by students on tasks, which can lead to improved achievement. CED cites evidence
that when technology is effectively integrated into mathematics instruction, student leaming
and achievement can be positively impacted (p. 4).
C A M l GEQMETM U
One particular dynamic geometry software program, Cabri Geometry II (Texas
Instruments), has been used by the researcher in his geometry classes for several years.
Cabri Geometry II (hereafter referred to as Cabri) offers students a software environment
in which geometric objects can be constructed, measured, and manipulated. Basic ideas of
geometry as well as advanced ideas are easily explored with Cabri. Once a geometric
object is created in Cabri, students can manipulate the object, perform constructions on the
object, and measure angles, lengths, and area. Cabri has the potential to impact geometry
leaming in the manner described by NCTM as well as in each of the five areas addressed
by NRC in Everybody Counts. With Cabri, students have the power to explore many
variations o f a geometric situation in a short amount of time. With the ability to do
calculations easily and quickly, computation takes a secondary role to concepts and ideas.
Students have the ability to see mathematics as a dynamic discipline when working with
Cabri.
An example to show the power of Cabri is how a well-known generalization is
discovered by students using the software. Early in geometry courses, students discover
that sum of the interior angles of any triangle is 180°. While this result can be attained in an
analytic manner or by paper folding, Cabri offers an exciting and different way to explore
the problem, along with the added advantage of being able to examine many triangles very
quickly to develop the idea. Students begin by using the drawing capabilities of Cabri to
create a triangle. The angle measuring tool can be used to measure each of the three angles.
Cabri has a calculator feature which allows the user to compute with numerical values that
15
have been generated by CabrVs measuring tools. The student can add the measures of the
three angles together to find out that the sum is 180°. The real power of software programs
such as Cabri lies in what the student is able to do next. Cabri has a feature that allows the
user to select an object and move it. This is the reason why software such as Cabri is
referred to as dynamic. Figures can be manipulated easily. Anything that depends on the
object in any way changes when the object is moved. In this particular example, the
student is able to select the vertices of the triangle (one vertex at a time) and drag them to
new locations. The shape of the triangle changes, and along with it, the lengths of the
sides and the measurements of the angles change. What remains constant, of course, is the
sum of the measures of the interior angles. The student is thus able to look at many
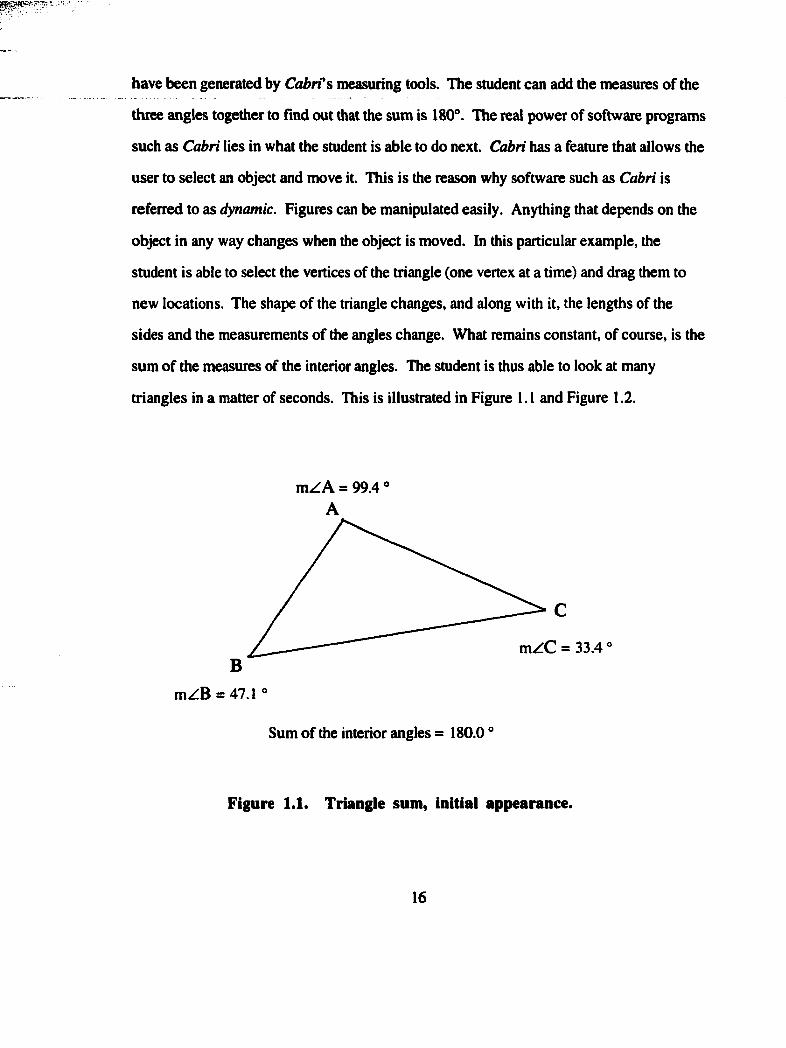
triangles in a matter of seconds. This is illustrated in Figure 1.1 and Figure 1.2.
m Z A = 99.4 ° A
BmZB = 47.1 °
m ZC = 33.4
Sum of the interior angles = 180.0
Figure 1.1. Triangle sum, initial appearance.
16
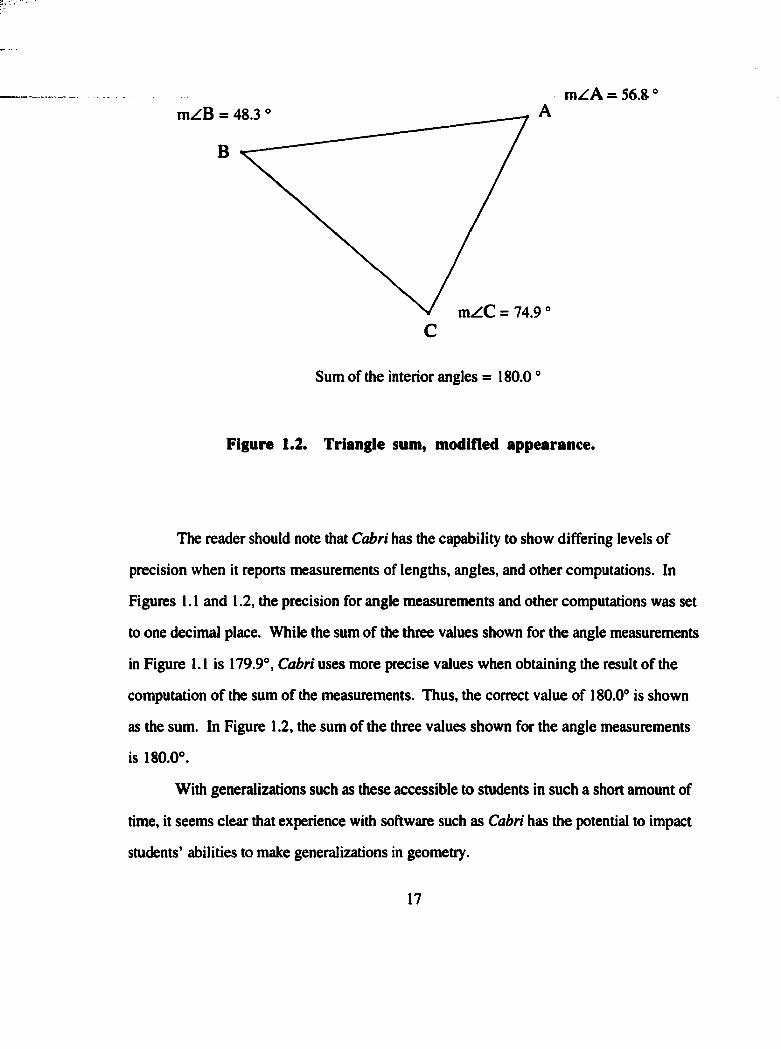
m ZA = 56.8 °m ZB = 48.3
m ZC = 74.9C
Sum of the interior angles = 180.0 °
Figure 1.2. Triangle sum, modified appearance.
The reader should note that Cabri has the capability to show differing levels of
precision when it reports measurements of lengths, angles, and other computations. In
Figures 1.1 and 1.2, the precision for angle measurements and other computations was set
to one decimal place. While the sum of the three values shown for the angle measurements
in Figure 1.1 is 179.9°, Cabri uses more precise values when obtaining the result of the
computation of the sum of the measurements. Thus, the correct value of 180.0° is shown
as the sum. In Figure 1.2, the sum of the three values shown for the angle measurements
is 180.0°.
With generalizations such as these accessible to students in such a short amount of
time, it seems clear that experience with software such as Cabri has the potential to impact
students’ abilities to make generalizations in geometry.
17
AN AMAZING DISCOVERY
In addition to using the software to help students discover well-known
generalizations in geometry, dynamic geometry software has the potential to help students
discover brand new generalizations. Dynamic geometry software has, in fact, helped one
secondary student, Ryan Morgan, discover a new theorem. The theorem that Ryan
Morgan discovered is now named after him (Watanabe, Hanson, & Nowosielski, 1996).
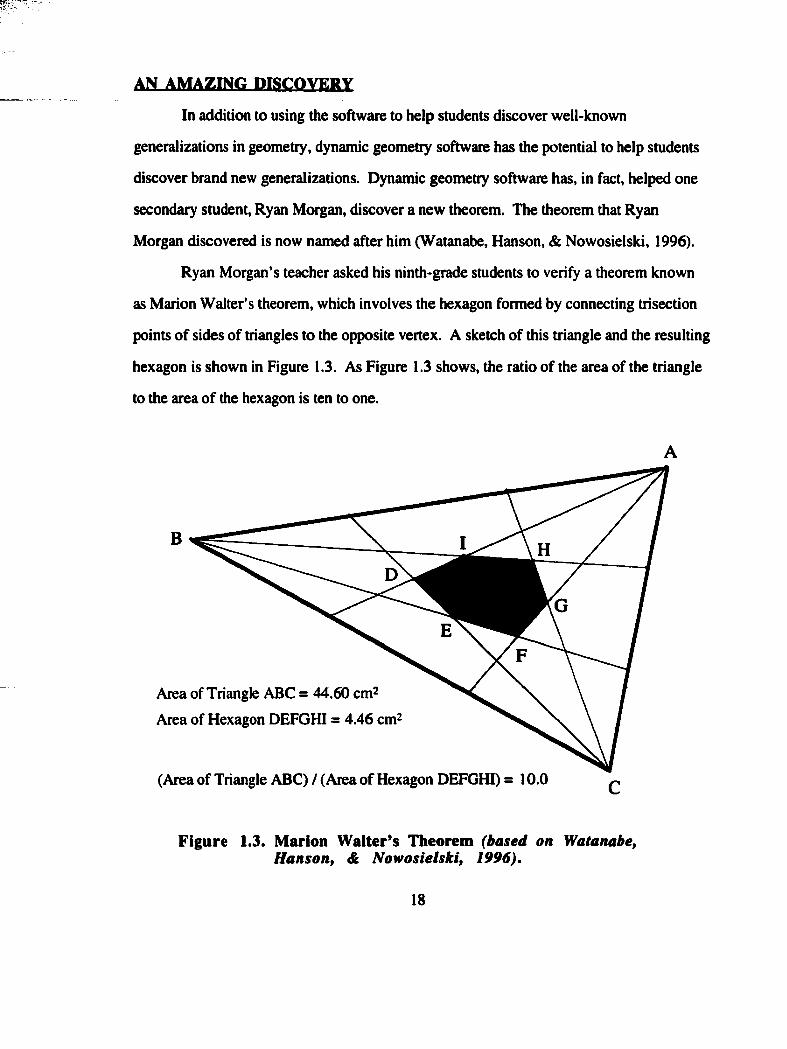
Ryan Morgan’s teacher asked his ninth-grade students to verify a theorem known
as Marion Walter’s theorem, which involves the hexagon formed by connecting trisection
points of sides of triangles to the opposite vertex. A sketch of this triangle and the resulting
hexagon is shown in Figure 1.3. As Figure 1.3 shows, the ratio of the area of the triangle
to the area of the hexagon is ten to one.
Area of Triangle ABC = 44.60 cm^
Area of Hexagon DEFGHI = 4.46 cm^
(Area of Triangle ABC) / (Area of Hexagon DEFGHI) = 10.0
Figure 1.3. Marion Walter’s Theorem (based on Watanabe, Hanson, & Nowosielski, 1996).
18
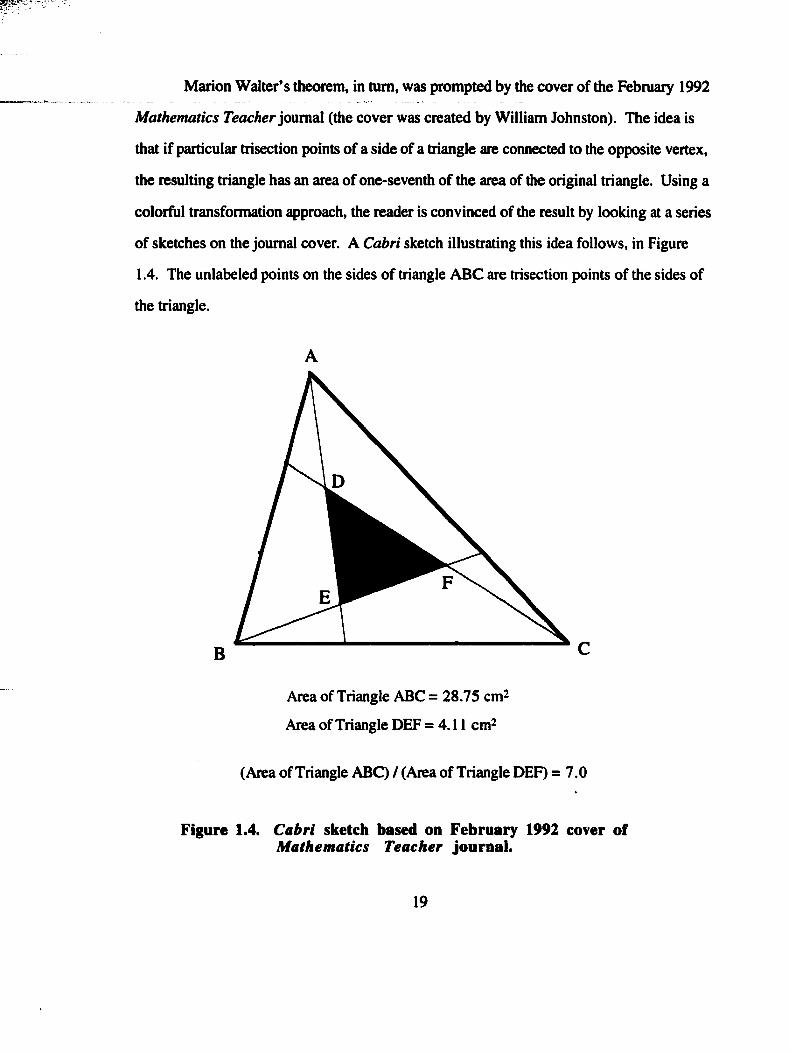
Marion Walter’s theorem, in turn, was prompted by the cover of the February 1992
Mathematics TeacAer journal (the cover was created by William Johnston). The idea is
that if particular trisection points of a side of a triangle are connected to the opposite vertex,
the resulting triangle has an area of one-seventh of the area of the original triangle. Using a
colorful transformation approach, the reader is convinced of the result by looking at a series
of sketches on the journal cover. A Cabri sketch illustrating this idea follows, in Figure
1.4. The unlabeled points on the sides of triangle ABC are trisection points of the sides of
the triangle.
CB
Area of Triangle ABC = 28.75 cm-
Area of Triangle DBF = 4.11 cm^
(Area of Triangle ABC) / (Area of Triangle DBF) = 7.0
Figure 1.4. Cabri sketch based on February 1992 cover of Mathematics Teacher journal.
19
Marion Walter’s Theorem is an extension of this idea. Instead of just three of the segments
being drawn in the interior of the triangle, all six possible segments are drawn to form a
hexagon. The ratio of the area of the original triangle to the area of the hexagon is ten to
one, as discussed earlier.
After using a non dynamic geometry software program, GeoExplorer
(ScottForesman, 1992), Morgan used a dynamic program. The Geometer’s Sketchpad
(Jackiw, 1991) to extend Walter’s Theorem by dividing a side of a triangle into various
numbers of congruent segments. Noticing that a pattern emerged when the number of
congruent segments was odd, Morgan collected data and used regression to determine a
general result. The case of dividing the sides of the triangle into five congruent segments is
shown below in Figure 1.5.
20
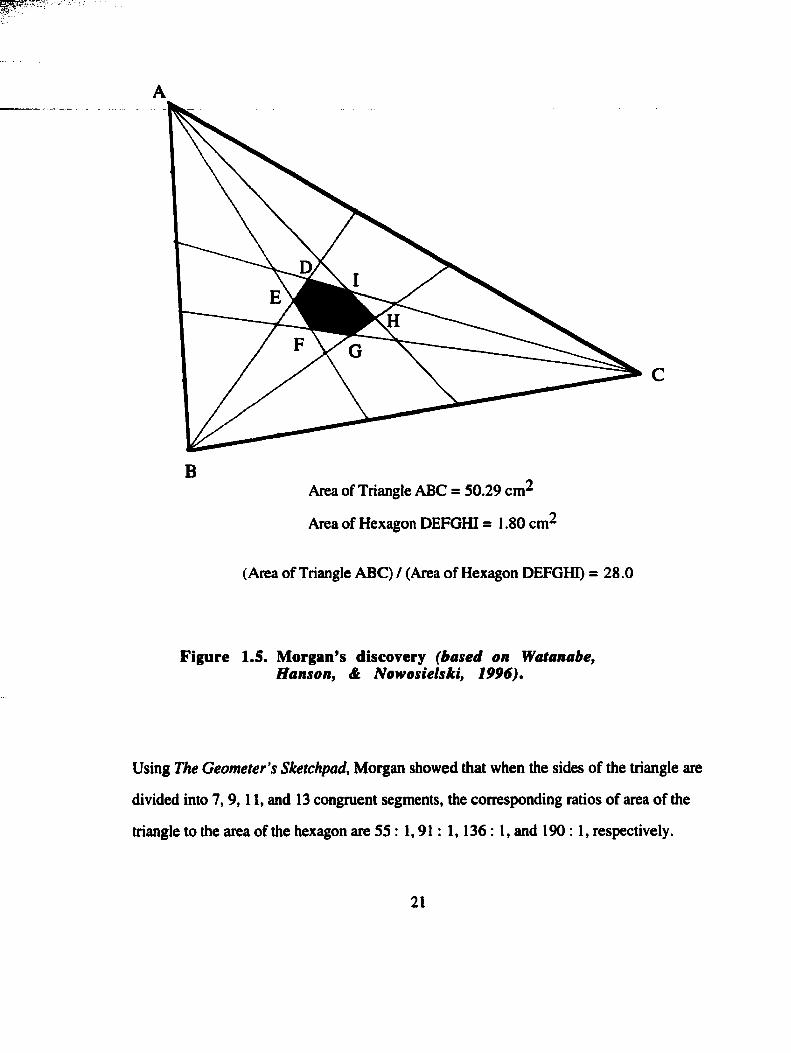
BArea of Triangle ABC = 50.29 cm^
Area of Hexagon DEFGHI = 1.80 cm^
(Area of Triangle ABC) / (Area of Hexagon DEFGHI) = 28.0
Figure 1.5. Morgan’s discovery (based on Watanabe, Hanson, & Nowosielski, 1996).
Using The Geometer’s Sketchpad, Morgan showed that when the sides of the triangle are
divided into 7 ,9 ,11 , and 13 congruent segments, the corresponding ratios of area of the
triangle to the area of the hexagon are 55: 1,91: 1,136 : 1, and 190 : 1, respectively.
21
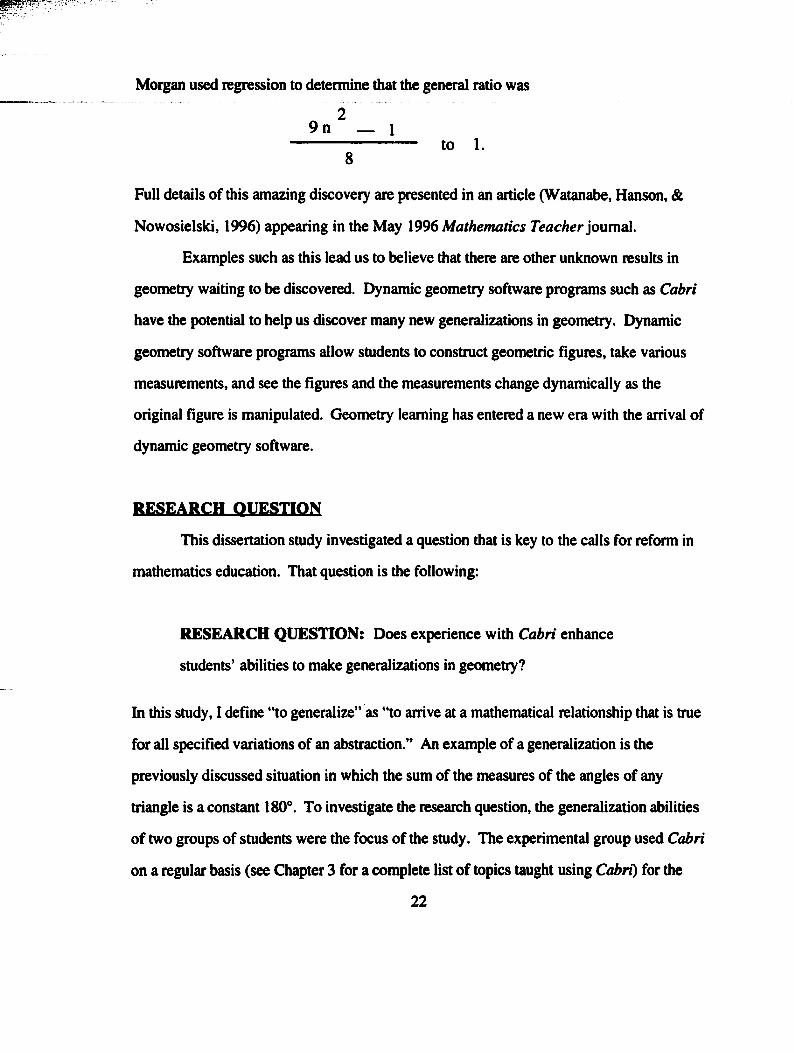
Morgan used regression to determine that the general ratio was
^ 29 n — 1
to 1.8
Full details of this amazing discovery are presented in an article (Watanabe, Hanson, &
Nowosielski, 1996) appearing in the May 1996 Mathematics Feac/ier journal.
Examples such as this lead us to believe that there are other unknown results in
geometry waiting to be discovered. Dynamic geometry software programs such as Cabri
have the potential to help us discover many new generalizations in geometry. Dynamic
geometry software programs allow students to construct geometric figures, take various
measurements, and see the fîgures and the measurements change dynamically as the
original fîgure is manipulated. Geometry leaming has entered a new era with the arrival of
dynamic geometry software.
RESEARCH QUESTION
This dissertation study investigated a question that is key to the calls for reform in
mathematics education. That question is the following:
RESEARCH QUESTION: Does experience with Cabri enhance
students’ abilities to make generalizations in geometry?
In this study, 1 define “to generalize ” as “to arrive at a mathematical relationship that is true
for all specifîed variations of an abstraction.” An example of a generalization is the
previously discussed situation in which the sum of the measures of the angles of any
triangle is a constant 180°. To investigate the research question, the generalization abilities
of two groups of students were the focus of the study. The experimental group used Cabri
on a regular basis (see Chapter 3 for a complete list of topics taught using Cabri) for the
22
s w î ^ . î ;;.̂ :
purpose of exploring and discovering geometric ideas. The control group did not use the
software at all, and were taught using a traditional approach. An entering geometry test and
a generalization pretest were given to both groups at the beginning of the course for
comparison purposes. A generalization posttest was given to compare the groups in the
final week of the course. A subset of students from each group participated in task-based
geometry interviews. Further research questions which guided the study are as follows:
RESEARCH SUBQUESTION ONE: Were there significant
differences between the groups in scores on the generalization posttest?
RESEARCH SUBQUESTION TW O: Was there a significant
relationship between group membership and performance on the interview
tasks?
A theoretical framework for the study as well as a review of related research
literature is presented in Chapter 2. All pertinent details o f the study are described in
Chapter 3. Results of the study are presented in Chapter 4. Major findings of the study as
well as implications for teaching and research are summarized in Chapter 5.
23
CHAPTER 2
THEORETICAL FRAMEWORK AND
REVIEW OF RELATED LITERATURE
The ideas of mathematics education theorist Zoltan P. Dienes provide a theoretical
framework for the study. In particular, Dienes’ mathematics leaming theory and his theory
of abstraction and generalization are discussed in relation to dynamic geometry software.
RimES
I suggest that it is possible to establish fully creative mathematical-leaming situations at all the stages o f mathematics-learning. When a child has effectively formed a concept from his own experiences, he has really created something that was not there before, and this something is built into his personality in the psychological sense in the same way as essential substances in his food are built inta his body. The value o f this piece o f leaming to him will be o f a similar kind to the painting o f a satiffactory picture or the writing o f a good story, or the inventing o f an exciting play to be acted with his friends. It will have intrinsic value, as part o f the very stuff that life is made of.
—Zoltan P. Dienes, 1960, p. 17.
24
This quote from Building Up Mathematics (1960), by Dr. Zoltan P. Dienes lays
the groundwork for a theoretical framework for the study. As the introductory pages of the
book which Dienes entitled " A Survey of the Present Position " are read, one begins to
wonder whether the book was indeed written in 1960, or perhaps yesterday. It is both
illuminating and somewhat disheartening to read a discussion of the state of affairs in
mathematics education from forty years ago that so clearly describes the present situation.
Dienes describes the great number of children who dislike mathematics and asserts that the
majority of children never succeed in understanding the real meaning of mathematical
concepts. Dienes further states that "at best, they [students] become deft technicians in the
art of manipulating complicated sets of symbols, at worst they are baffled by the impossible
situations into which the present mathematical requirements in schools tend to place them "
(p. 1). Dienes suggests that the leaming of mathematics can contribute to personal
fulfillment as the practice of the arts can. He states that "we need to create mathematical
leaming situations, partly as if we were practicing an art-form, and partly as if we were
devising an original research-situation" (pp. 2-3).
Dienes considers school leaming situations as falling into three main categories:
mathematical, educational, and psychological. Mathematical leaming situations can be
thought of as consisting of two aspects: the acquisition of techniques, and the
understanding of ideas (p. 3). It can be argued that one aspect, the acquisition of
techniques, plays a dominant role in school mathematics even today, despite
recommendations to the contrary by leading mathematics professional organizations and
mathematical leaming theorists. Dienes gives an example that clarifies this situation. He
asks the reader to consider if an average person were asked how well he understood the
mathematics he learned in school, that he might tell about carrying out the teacher’s
instmctions but that the reasons often seemed unclear and even mysterious. Children may
25
be under the impression that they understand mathematics when in fact they do not. It is
also easy for teachers, Dienes argues, to be under the impression that students understand
ideas when in fact they do not. Children leam to give standard answers to standard
questions and true understanding is often never realized. For many students, mathematics
ends up as a collection of unrelated procedures.
Teachers are described by Dienes as authorities and dispensers of information. If
we use achievement as a measure, then this method of teaching and leaming has not fared
well. Data from TIMSS and other assessments support the ideas that our present modes of
teaching and leaming are not totally adequate. Dienes goes so far as to say that “it may be
that the whole system of the class-lesson is an unsuitable vehicle for the transmission of
mathematical information" (p. 4). Ruling out bad teaching as being a major cause of the
situation, Dienes points to the transmission stage of the process as the major issue. While
improvements have been suggested and made, Dienes argues that “there are fundamental
shortcomings in the present system which cannot be patched up by new methods of
communication, however ingeniously devised" (p. 5). Such devices (pictorial aids,
models, film, and television) may prove necessary, but not sufficient for an effective
teaching and leaming situation.
Dienes continues by discussing the psychological situation of mathematics leaming.
As a society, we have leamed much about abstract thinking, but there is much yet to leam.
Dienes states that even if all of the psychological knowledge that is known were put to
practical use in classrooms immediately, he doubts that it would solve all of the problems in
education. As this volume was written in 1960, one may wonder how Dienes would view
the situation today. He states that there are three principal areas in which research is
conducted: 1) individual differences in ways of forming abstract ideas, and variations in
the same individual as he grows up, 2) details of the mechanism of the process of
abstraction, and 3) the problem of motivation. As knowledge accumulates in these areas,
26
Dienes states that it is desirable to make the information available to teachers in a way that
can be used in classrooms. He doubts that anything of the kind is happening to the degree
to which it is necessary.
DIENES* MATHEMATICS LEARNING THEORY
Dienes’ (1960) Mathematics Leaming Theory can be summarized into four
principles; the dynamic principle, the constructivity principle, the mathematical variability
principle, and the perceptual variability or multiple embodiment principle (pp. 30-31).
Dynamic Principle. Preliminary, structured practice and/or reflective type of
games must be provided as necessary experiences from which mathematical concepts can
eventually be built, so long as each type of game is introduced at the appropriate time.
Constructivity Principle. In the structuring of the games, construction should
always precede analysis.
Mathematical Variability Principle. Concepts involving variables should be
leamed by experiences involving the largest possible number of variables.
Perceptual Variability Principle or Multiple Embodiment Principle. To allow
as much scope as possible for individual variations in concept-formation, as well as to
induce children to gather the mathematical essence of an abstraction, the same conceptual
structure should be presented in the form of as many perceptual equivalents as possible.
Dynamic geometry software such as Cabri satisfies every principle of Dienes’
Mathematics Leaming Theory. As Dienes conceptualized this theory with elementary age
students in mind, the researcher will make adtq)tations of the theory to the high school
level. Specifically, the researcher will consider how Dienes’ Mathematics Leaming Theory
might pertain to a geometry class which utilizes dynamic geometry software. Software
such as Cabri certainly fits Dienes’ Dynamic Principle, as it is dynamic in nature. A
sketch of a geometric figure is not fixed; it can be manipulated to look at many cases in a
27
very short amount of time. Students must also experiment with the software to find out
how the various commands work. Regular use of the software helps students develop a
knowledge base of how to use the software, so that time is not wasted relearning how to do
basic things every time the software is used.
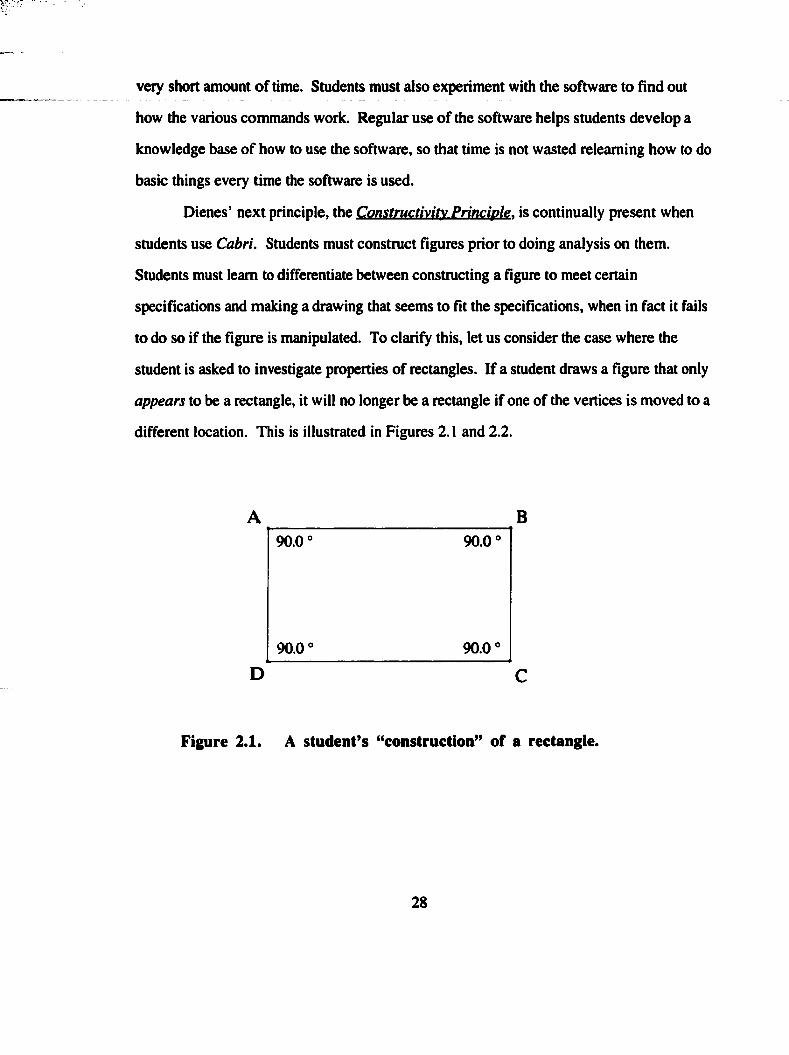
Dienes’ next principle, the Constructivity Principle, is continually present when
students use Cabri. Students must construct figures prior to doing analysis on them.
Students must leam to differentiate between constructing a figure to meet certain
specifications and making a drawing that seems to fit the specifications, when in fact it fails
to do so if the figure is manipulated. To clarify this, let us consider the case where the
student is asked to investigate properties of rectangles. If a student draws a figure that only
appears to be a rectangle, it will no longer be a rectangle if one of the vertices is moved to a
different location. This is illustrated in Figures 2 .1 and 2.2.
B90.090.0
90.090.0
D C
Figure 2.1. A student’s ‘‘construction” of a rectangle.
2 8
B90.0 106.9
73.190.0D C
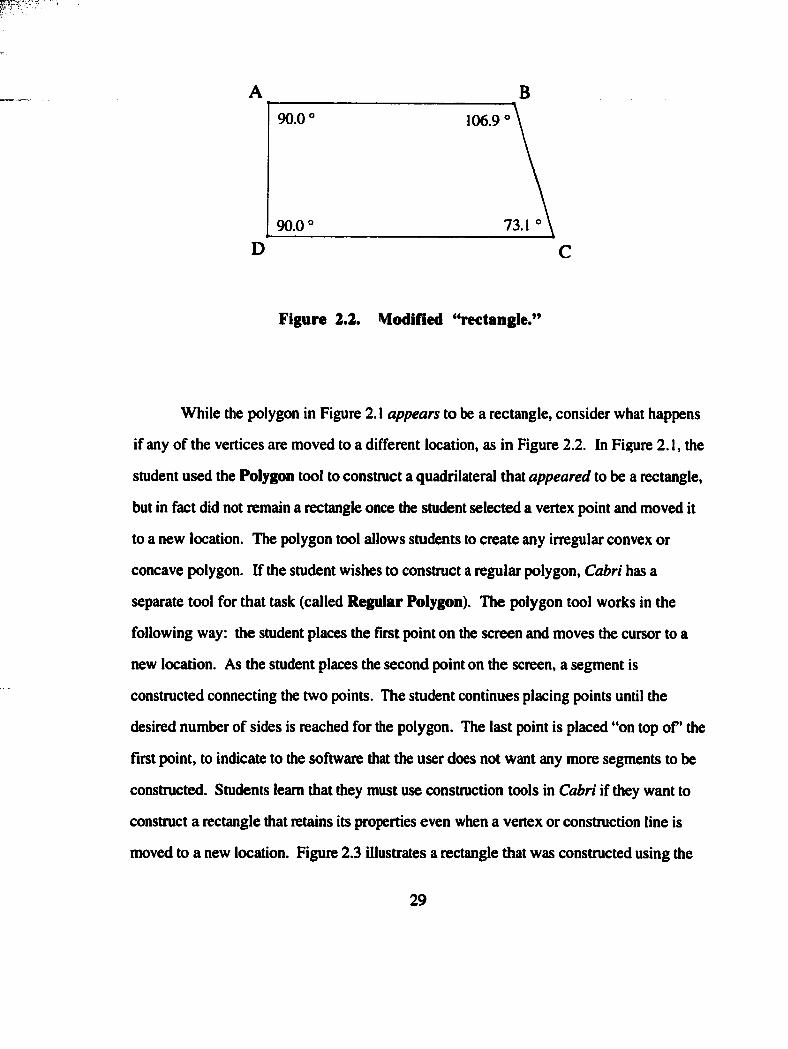
Figure 2.2. Modified “rectangle.
While the polygon in Figure 2.1 appears to be a rectangle, consider what happens
if any of the vertices are moved to a different location, as in Figure 2.2. In Figure 2.1, the
student used the Polygon tool to construct a quadrilateral that appeared to be a rectangle,
but in fact did not remain a rectangle once the student selected a vertex point and moved it
to a new location. The polygon tool allows students to create any irregular convex or
concave polygon. If the student wishes to construct a regular polygon, Cabri has a
separate tool for that task (called Regular Polygon). The polygon tool works in the
following way: the student places the first point on the screen and moves the cursor to a
new location. As the student places the second point on the screen, a segment is
constructed connecting the two points. The student continues placing points until the
desired number of sides is reached for the polygon. The last point is placed “on top o f ’ the
first point, to indicate to the software that the user does not want any more segments to be
constructed. Students leam that they must use construction tools in Cabri if they want to
construct a rectangle that retains its properties even when a vertex or construction line is
moved to a new location. Figure 2.3 illustrates a rectangle that was constructed using the
29
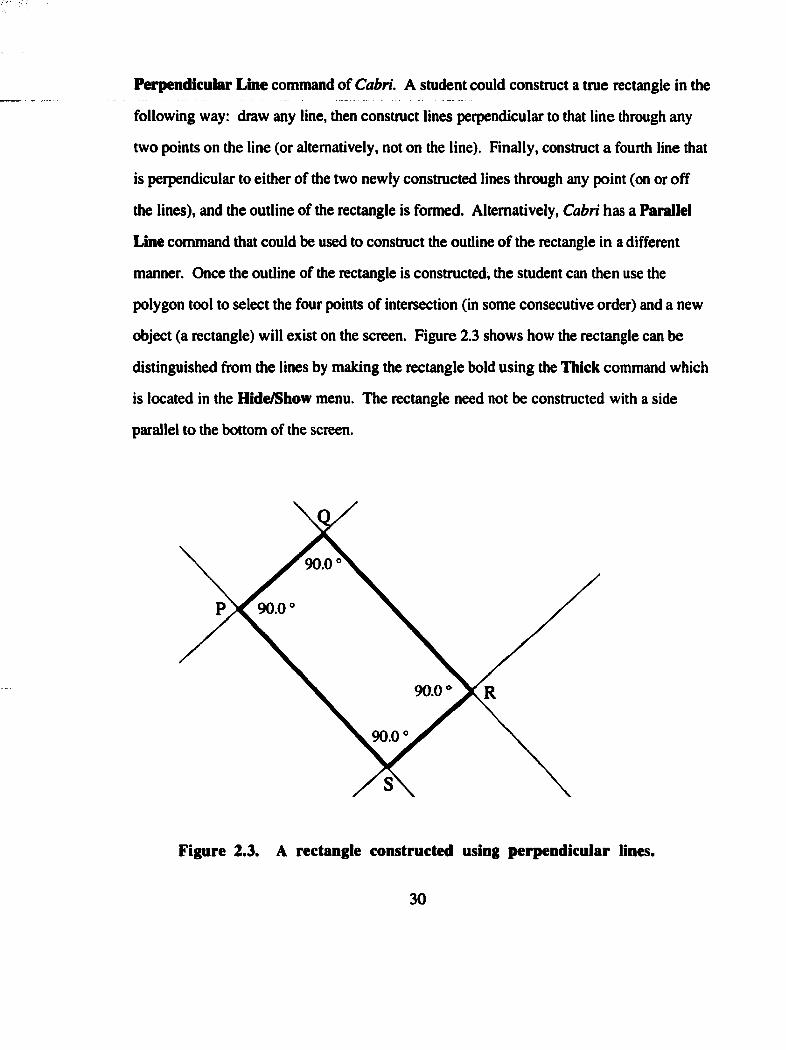
Perpendicular Line command of Cabri. A student could construct a true rectangle in the
following way: draw any line, then construct lines perpendicular to that line through any
two points on the line (or alternatively, not on the line). Finally, construct a fourth line that
is perpendicular to either of the two newly constructed lines through any point (on or off
the lines), and the outline of the rectangle is formed. Alternatively, Cabri has a Parallel
Line command that could be used to construct the outline of the rectangle in a different
manner. Once the outline of the rectangle is constructed, the student can then use the
polygon tool to select the four points of intersection (in some consecutive order) and a new
object (a rectangle) will exist on the screen. Figure 2.3 shows how the rectangle can be
distinguished from the lines by making the rectangle bold using the Thick command which
is located in the Hide/Show menu. The rectangle need not be constructed with a side
parallel to the bottom of the screen.
90.0
90.0
90.0
90.0
Figure 2.3. A rectangle constructed using perpendicular lines.
30
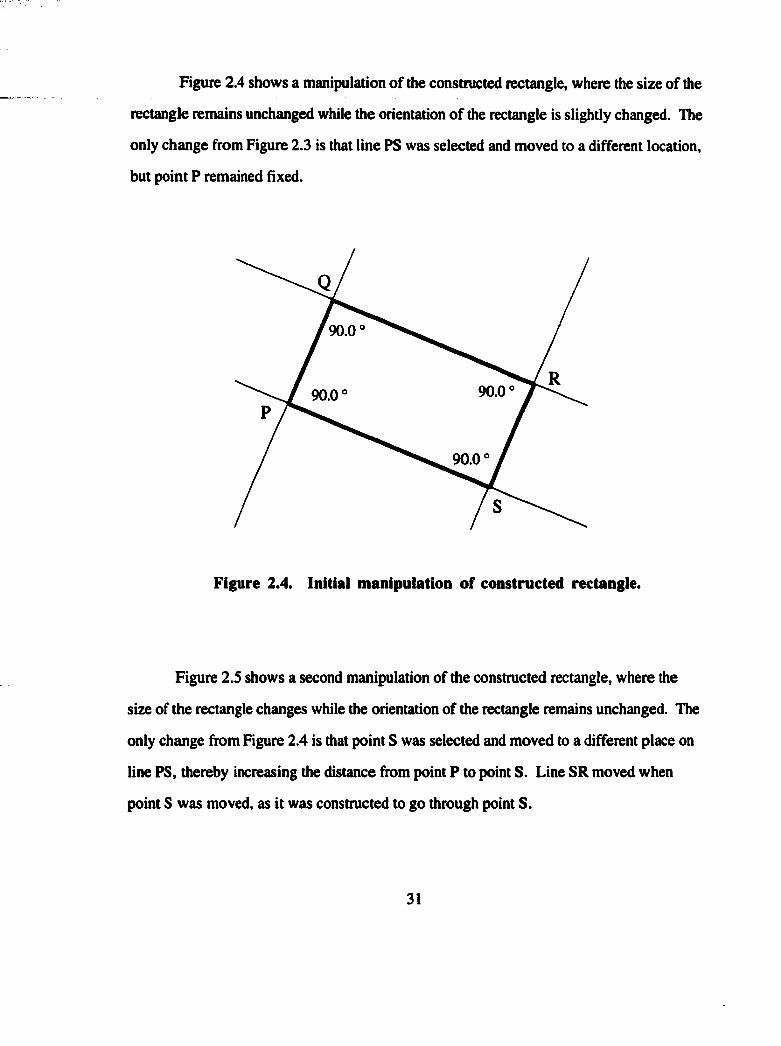
Figure 2.4 shows a manipulation of the constructed rectangle, where the size of the
rectangle remains unchanged while the orientation of the rectangle is slightly changed. The
only change from Figure 2.3 is that line PS was selected and moved to a different location,
but point P remained tixed.
90.0
90.090.0
90.0
Figure 2.4. Initial manipulation of constructed rectangle.
Figure 2.5 shows a second manipulation of the constructed rectangle, where the
size of the rectangle changes while the orientation of the rectangle remains unchanged. The
only change from Figure 2.4 is that point S was selected and moved to a different place on
line PS, thereby increasing the distance from point P to point S. Line SR moved when
point S was moved, as it was constructed to go through point S.
31
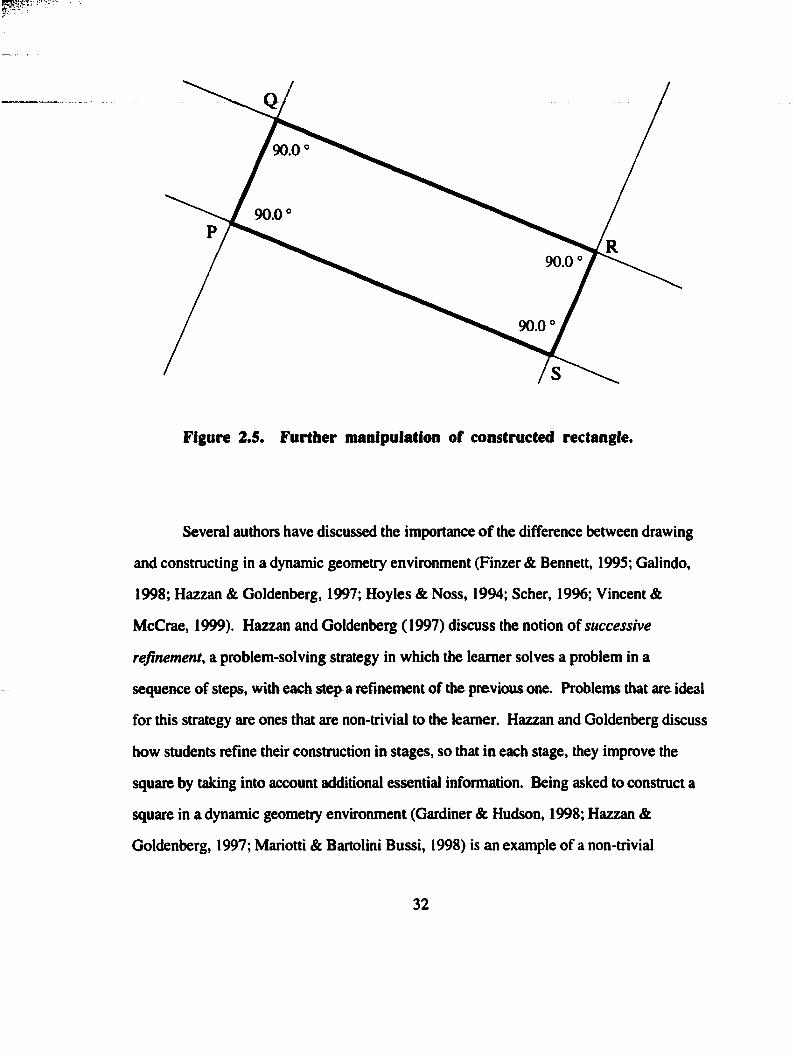
90.0
90.0
90.0
90.0
Figure 2.5. Further manipulation of constructed rectangle.
Several authors have discussed the importance o f the difference between drawing
and constructing in a dynamic geometry environment (Finzer & Bennett, 1995; Galindo,
1998; Hazzan & Goldenberg, 1997; Hoyles & Noss, 1994; Scher, 1996; Vincent &
McCrae, 1999). Hazzan and Goldenberg (1997) discuss the notion o f successive
refinement, a problem-solving strategy in which the learner solves a problem in a
sequence of steps, with each step a reBnement of the previous one. Problems that are ideal
for this strategy are ones that are non trivial to the learner. Hazzan and Goldenberg discuss
how students refine their construction in stages, so that in each stage, they improve the
square by taking into account additional essential information. Being asked to construct a
square in a dynamic geometry environment (Gardiner & Hudson, 1998; Hazzan &
Goldenberg, 1997; Mariotti & Bartolini Bussi, 1998) is an example of a non trivial
32
problem for many students. Vincent and McCrae (1999) note that “Cabri can result in
significant progress in understanding of geometric properties and relationships even after
relatively few lessons” (p. 507).
Dienes’ third and fourth principles, the Mathematical Variability Principle and
the Perceptual Variability Principle, address the notions of variability. Students working
with Cabri have the opportunity to see many things vary in the same sketch. In the
example of the rectangle in Figures 2.3, 2.4, and 2.5, we could move point S or point R
around so that the size and shape of the rectangle changes. Size and shape are mathematical
variables. What remains invariant is the fact that all of the angles are right angles. The
Mathematical Variability Principle is embodied by Cabri in the sense that a student can
change the size and shape of a figure.
The Perceptual Variability Principle is embodied by Cabri in the sense that a
student can change the orientation of the figure. Orientation is a perceptual variable. Line
PS was the original object in the sketch. As line PS is moved, the orientation of the
rectangle changes. Students can even look at many different figures (space permitting) on
the same sketch. For example, another rectangle could be constructed in the same sketch,
as shown in Figure 2.6. Dienes (1960) states that "to give the maximum amount of
experience, structured so as to encourage the growth of the concept, it seems a priori
desirable that all possible variables should be made to vary while keeping the concept
intact” (p. 29).
33
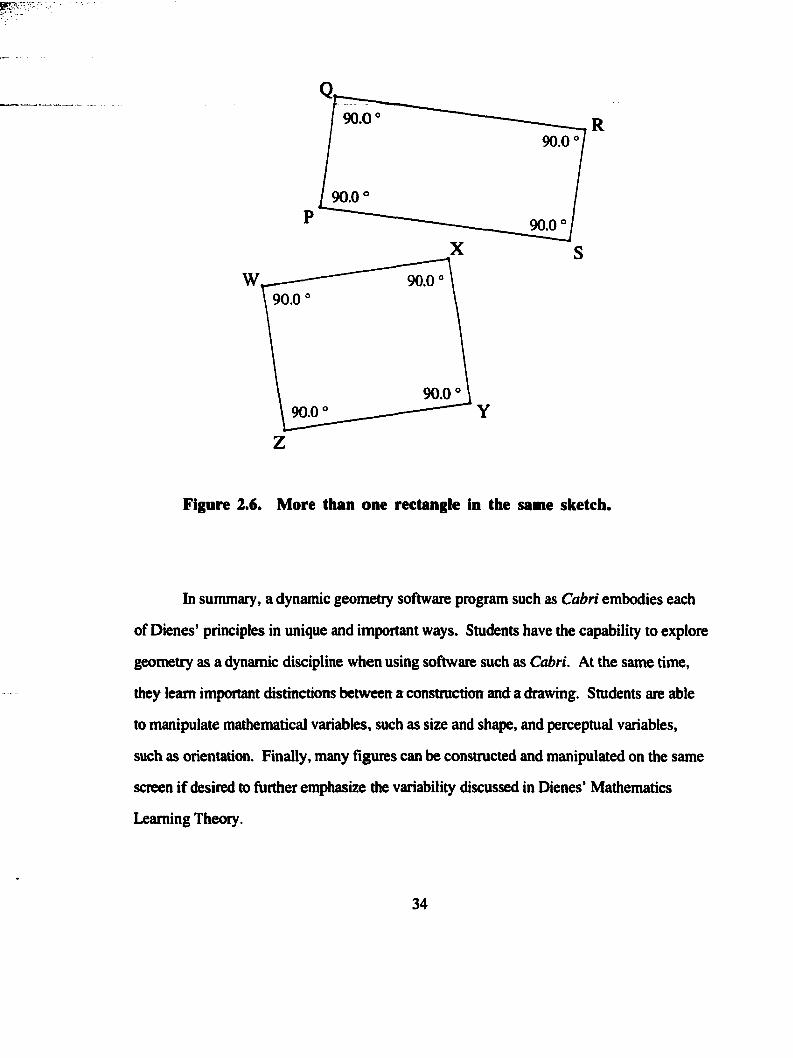
90.090.0
90.0
90.0
90.090.0
90.090.0
Figure 2.6. More than one rectangle in the same sketch.
In summary, a dynamic geometry software program such as Cabri embodies each
of Dienes’ principles in unique and important ways. Students have the capability to explore
geometry as a dynamic discipline when using software such as Cabri. At the same time,
they learn important distinctions between a construction and a drawing. Students are able
to manipulate mathematical variables, such as size and shape, and perceptual variables,
such as orientation. Finally, many figures can be constructed and manipulated on the same
screen if desired to further emphasize the variability discussed in Dienes’ Mathematics
Learning Theory.
34
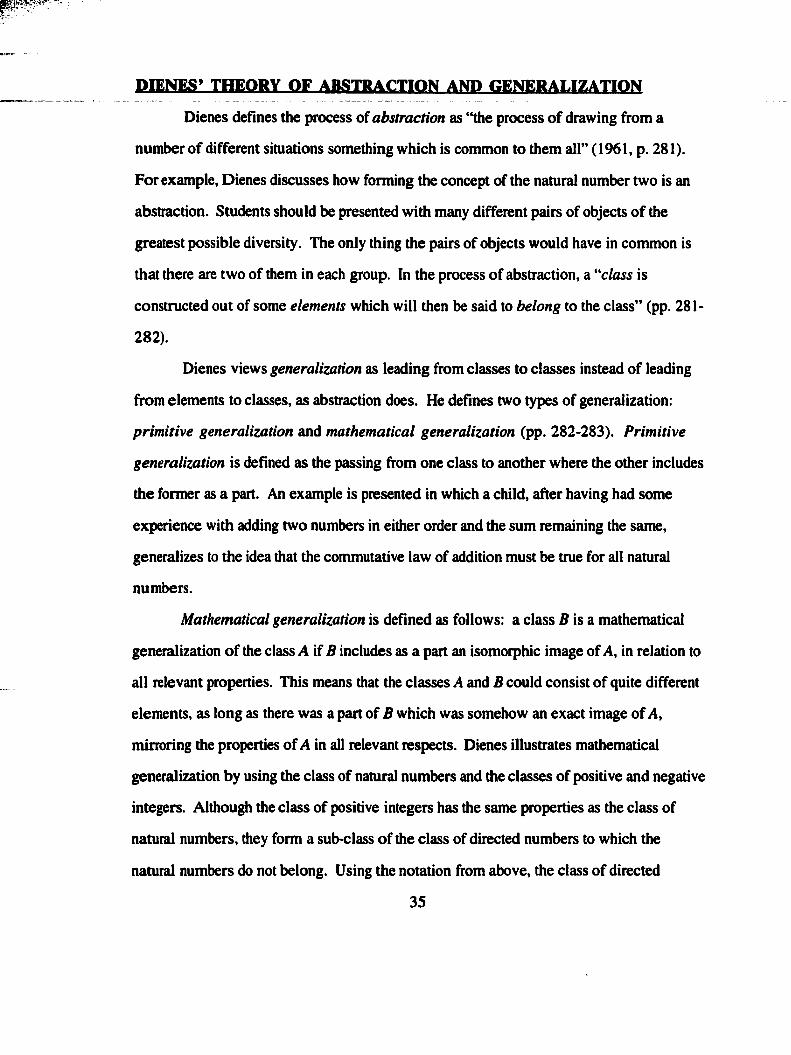
DJENESMHEORY OF ABSTRACTION AND GENERALIZATION
Dienes defînes the process of abstraction as “the process of drawing hrom a
number of different situations something which is common to them all” (1961, p. 281).
For example, Dienes discusses how forming the concept of the natural number two is an
abstraction. Students should be presented with many different pairs of objects of the
greatest possible diversity. The only thing the pairs of objects would have in common is
that there are two of them in each group. In the process of abstraction, a "'class is
constructed out of some elements which will then be said to belong to the class” (pp. 281-
282).
Dienes views generalization as leading from classes to classes instead of leading
from elements to classes, as abstraction does. He defines two types of generalization;
primitive generalization and mathematical generalization (pp. 282-283). Primitive
generalization is defined as the passing from one class to another where the other includes
the former as a part. An example is presented in which a child, after having had some
experience with adding two numbers in either order and the sum remaining the same,
generalizes to the idea that the commutative law of addition must be true for all natural
numbers.
Mathematical generalization is defined as follows: a class B is a mathematical
generalization of the class A if B includes as a part an isomorphic image of A, in relation to
all relevant properties. This means that the classes A and B could consist of quite different
elements, as long as there was a part of B which was somehow an exact image of A,
mirroring the properties of A in all relevant respects. Dienes illustrates mathematical
generalization by using the class of natural numbers and the classes of positive and negative
integers. Although the class of positive integers has the same properties as the class of
natural numbers, they form a sub-class of the class of directed numbers to which the
natural numbers do not belong. Using the notation from above, the class of directed
35
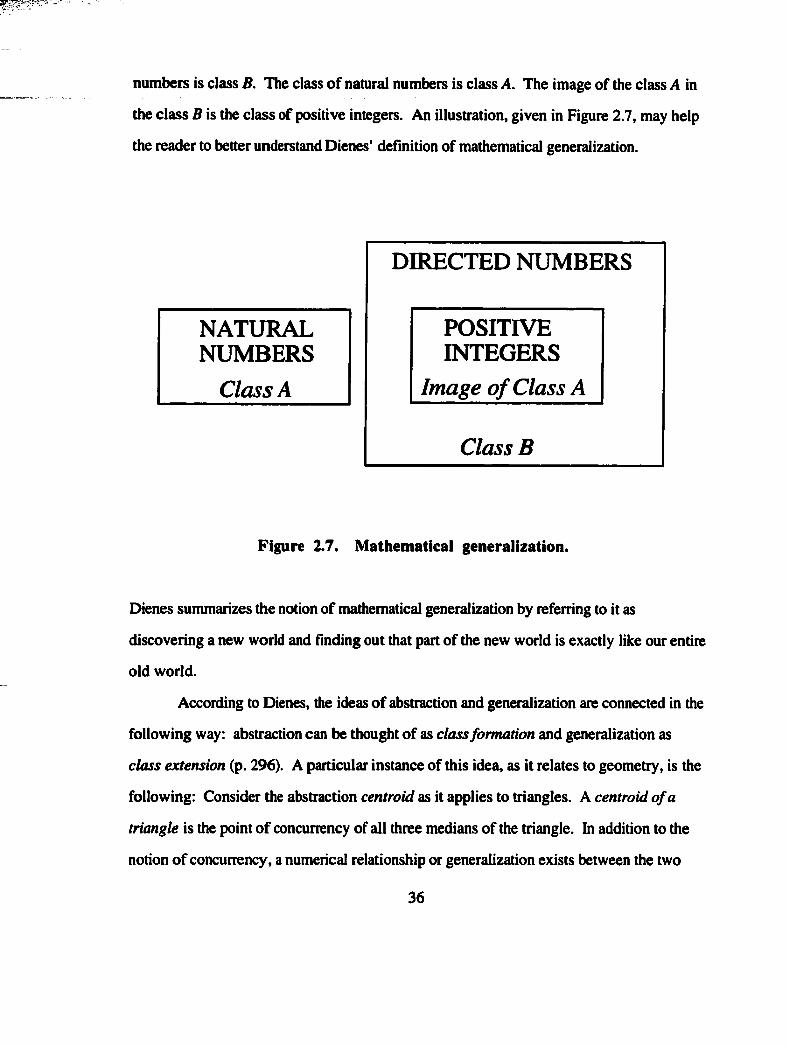
numbers is class B. The class o f natural numbers is class A. The image of the class A in
the class B is the class of positive integers. An illustration, given in Figure 2.7, may help
the reader to better understand Dienes’ definition of mathematical generalization.
NATURALNUMBERS
Class A
DIRECTED NUMBERS
POSITIVEINTEGERS
Image of Class A
Class B
Figure 2.7. Mathematical generalization.
Dienes summarizes the notion of mathematical generalization by referring to it as
discovering a new world and finding out that part of the new world is exactly like our entire
old world.
According to Dienes, the ideas of abstraction and generalization are connected in the
following way; abstraction can be thought of as class formation and generalization as
class extension (p. 296). A particular instance of this idea, as it relates to geometry, is the
following: Consider the abstraction centroid as it applies to triangles. A centroid o f a
triangle is the point o f concurrency of all three medians of the triangle. In addition to the
notion of concurrency, a numerical relationship or generalization exists between the two
36
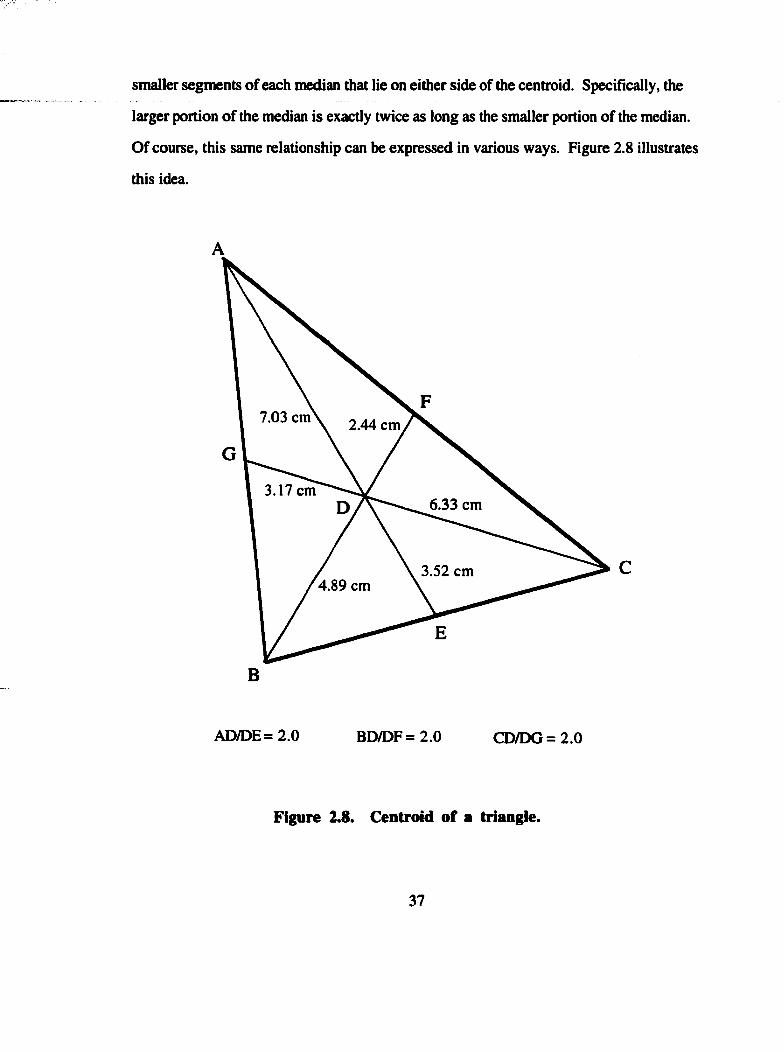
smaller segments of each median that lie on either side of the centroid. Specifically, the
larger portion of the median is exactly twice as long as the smaller portion of the median.
Of course, this same relationship can be expressed in various ways. Figure 2.8 illustrates
this idea.
7.03 cm 2.44 cm
3.17 cm6.33 cm
3.52 cm4.89 cm
B
AD/DE = 2.0 BD/DF = 2 .0 CD/DG = 2.0
Figure 2.8. Centroid of a triangle.
37
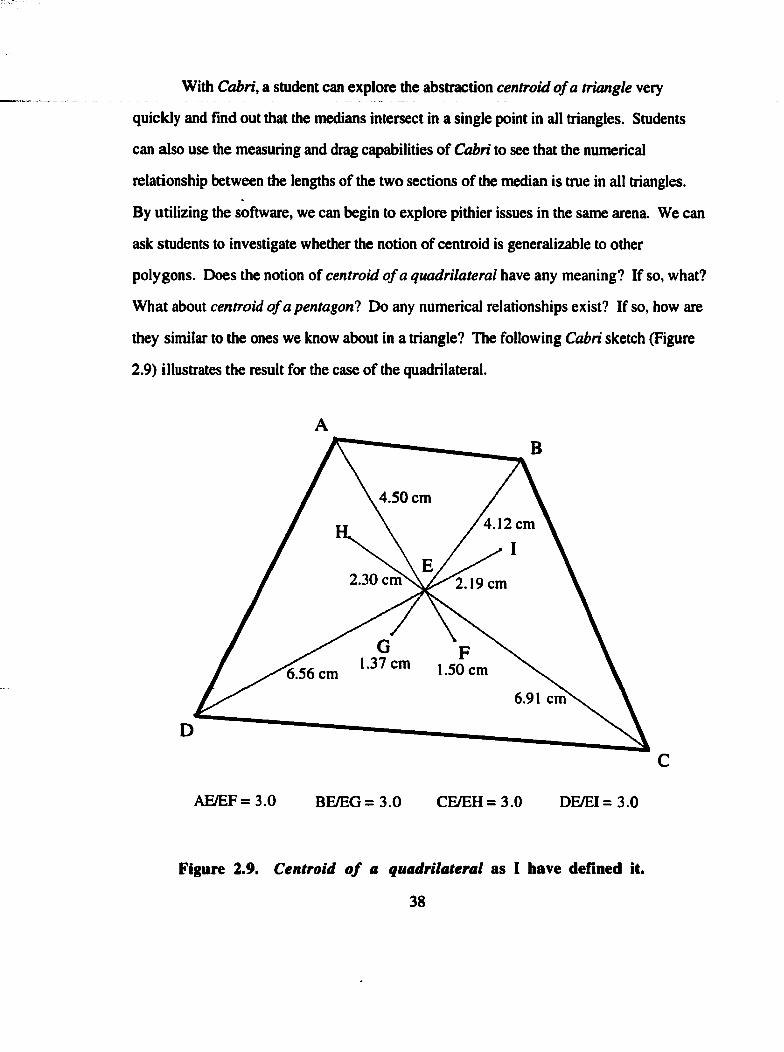
With Cabri, a student can explore the abstraction centroid o f a triangle very
quickly and fînd out that the medians intersect in a single point in all triangles. Students
can also use the measuring and drag capabilities of Cabri to see that the numerical
relationship between the lengths of the two sections of the median is true in all triangles.
By utilizing the software, we can begin to explore pithier issues in the same arena. We can
ask students to investigate whether the notion of centroid is generalizable to other
polygons. Does the notion of centroid o f a quadrilateral have any meaning? If so, what?
What about centroid o f a pentagon! Do any numerical relationships exist? If so, how are
they similar to the ones we know about in a triangle? The following Cabri sketch (Figure
2.9) illustrates the result for the case of the quadrilateral.
4.50 cm
4.12 cm
2.30 cm 2.19 cm
6.56 cm 1.50 cm
6.91 cm
AE/EF=3.0 BE/EG = 3.0 CE/EH= 3.0 DE/EI= 3.0
Figure 2.9. Centroid o f a quadrilateral as I have defined It.
38
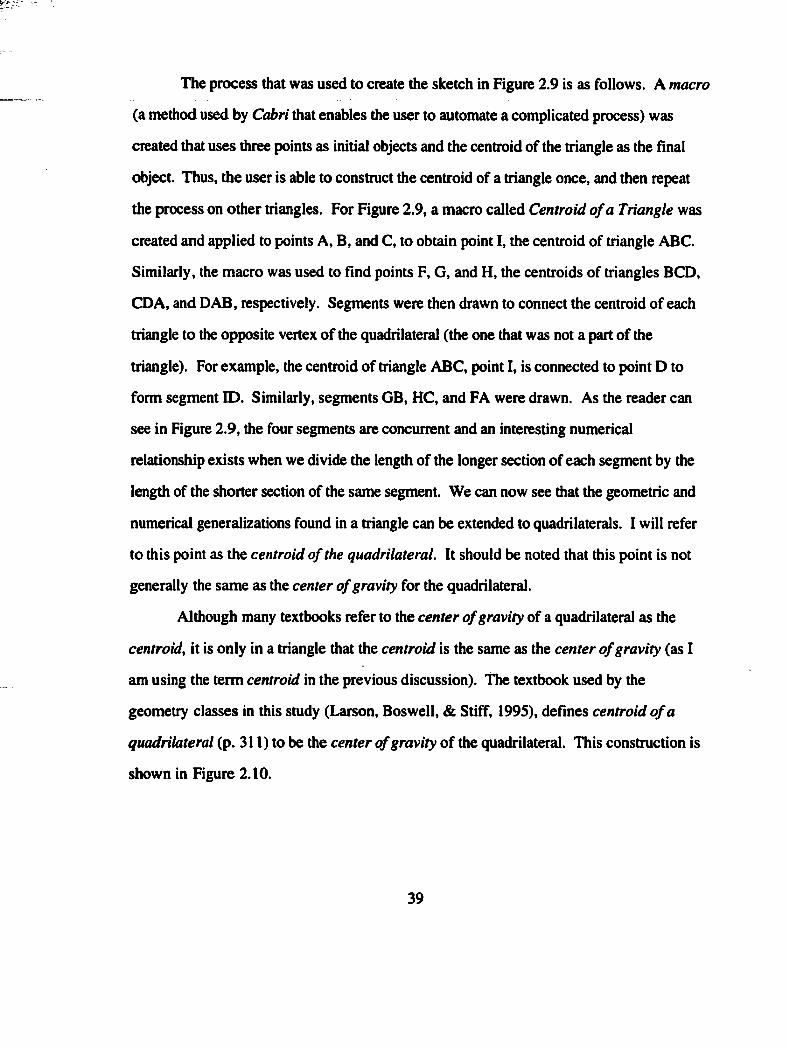
The process that was used to create the sketch in Figure 2.9 is as follows. A macro
(a method used by Cabri that enables the user to automate a complicated process) was
created that uses three points as initial objects and the centroid of the triangle as the final
object. Thus, the user is able to construct the centroid of a triangle once, and then repeat
the process on other triangles. For Figure 2.9, a macro called Centroid o f a Triangle was
created and applied to points A, B, and C, to obtain point I, the centroid of triangle ABC.
Similarly, the macro was used to fînd points F, G, and H, the centroids of triangles BCD,
CDA, and DAB, respectively. Segments were then drawn to connect the centroid of each
triangle to the opposite vertex of the quadrilateral (the one that was not a part of the
triangle). For example, the centroid of triangle ABC, point I, is connected to point D to
form segment ID. Similarly, segments GB, HC, and FA were drawn. As the reader can
see in Figure 2.9, the four segments are concurrent and an interesting numerical
relationship exists when we divide the length of the longer section of each segment by the
length of the shorter section of the same segment. We can now see that the geometric and
numerical generalizations found in a triangle can be extended to quadrilaterals. I will refer
to this point as the centroid o f the quadrilateral. It should be noted that this point is not
generally the same as the center o f gravity for the quadrilateral.
Although many textbooks refer to the center o f gravity of a quadrilateral as the
centroid, it is only in a triangle that the centroid is the same as the center o f gravity (as I
am using the term centroid in the previous discussion). The textbook used by the
geometry classes in this study (Larson, Boswell, & Stiff, 1995), defînes centroid o f a
quadrilateral (p. 311) to be the center o f gravity of the quadrilateral. This construction is
shown in Figure 2.10.
39
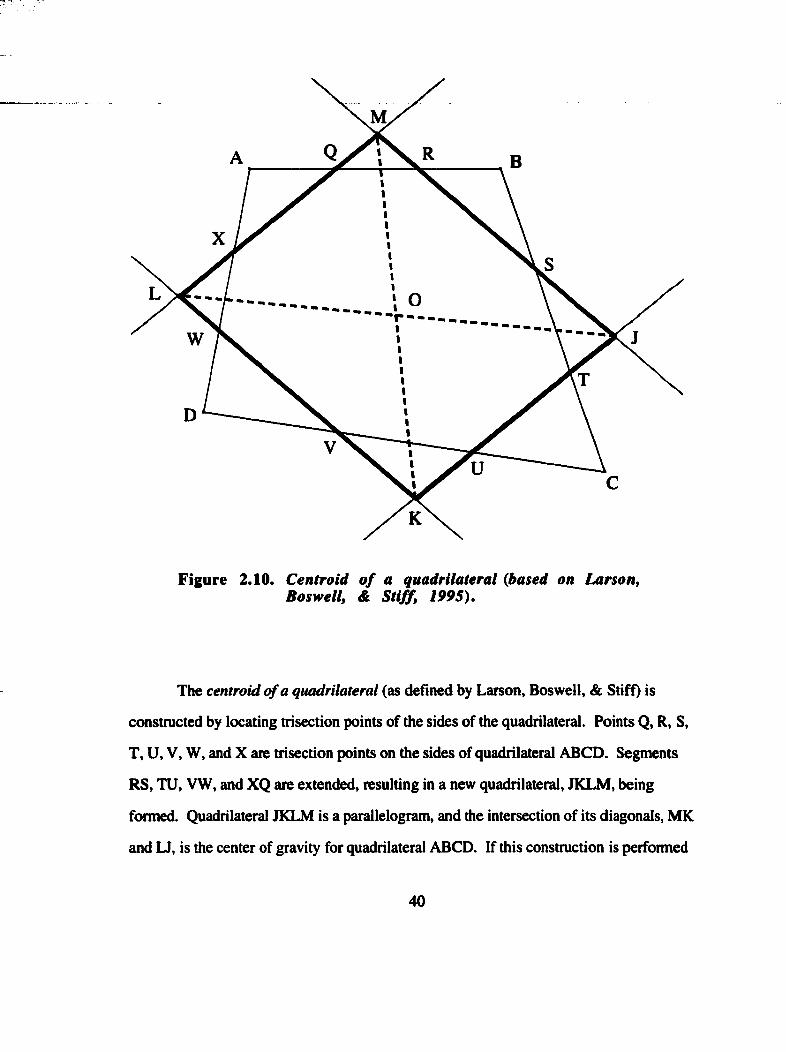
w
D
B
O \
1 / u -
Figure 2.10. Centroid o f a quadrilateral (based on Larson, Boswell, & Stiff, 1995).
The centroid o f a quadrilateral (as defîned by Larson, Boswell, & Stiff) is
constructed by locating trisection points of the sides of the quadrilateral. Points Q, R, S,
T, U, V, W, and X are trisection points on the sides of quadrilateral ABCD. Segments
RS, TU, VW, and XQ are extended, resulting in a new quadrilateral, JKLM, being
formed. Quadrilateral JKLM is a parallelogram, and the intersection of its diagonals, MK
and Li, is the center of gravity for quadrilateral ABCD. If this construction is performed
40
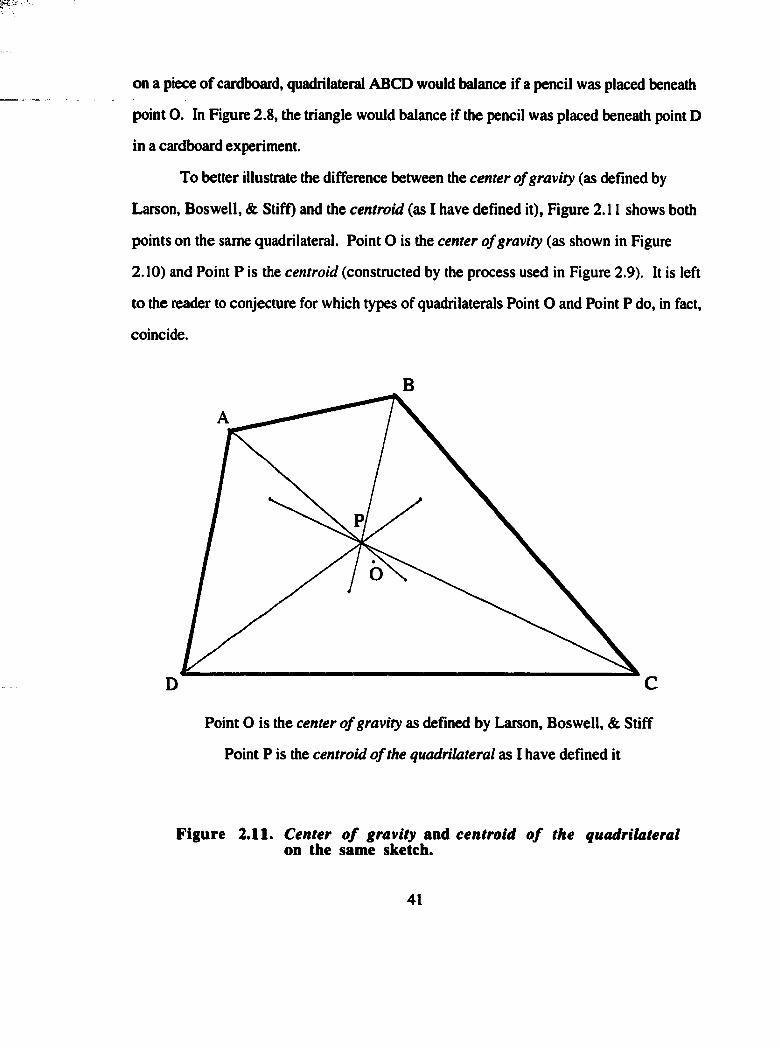
on a piece of cardboard, quadrilateral ABCD would balance if a pencil was placed beneath
point O. In Figure 2.8, the triangle would balance if the pencil was placed beneath point D
in a cardboard experiment.
To better illustrate the difference between the center o f gravity (as defined by
Larson, Boswell, & Stiff) and the centroid (as I have defined it). Figure 2.11 shows both
points on the same quadrilateral. Point O is the center o f gravity (as shown in Figure
2.10) and Point P is the centroid (constructed by the process used in Figure 2.9). It is left
to the reader to conjecture for which types of quadrilaterals Point O and Point P do, in fact,
coincide.
B
CD
Point O is the center o f gravity as defined by Larson, Boswell, & Stiff
Point P is the centroid o f the quadrilateral as I have derined it
Figure 2.11. Center o f gravity and centroid o f the quadrilateral on the same sketch.
41
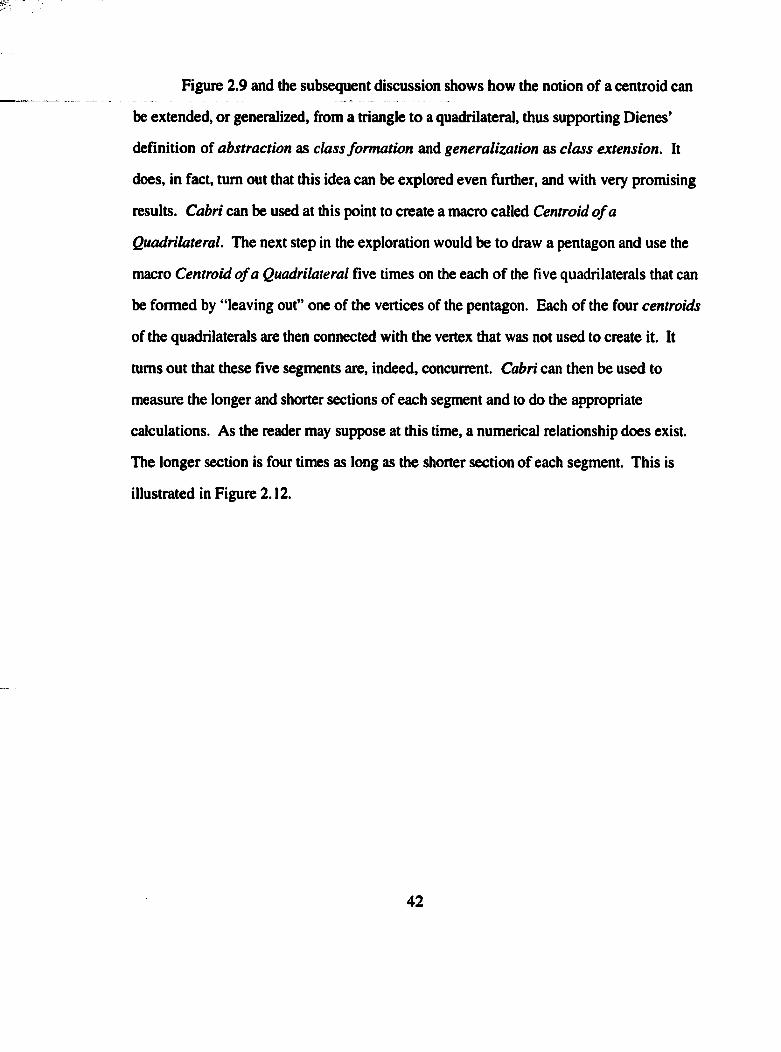
Figure 2.9 and the subsequent discussion shows how the notion of a centroid can
be extended, or generalized, from a triangle to a quadrilateral, thus supporting Dienes’
defînition of abstraction as class formation and generalization as class extension. It
does, in fact, turn out that this idea can be explored even further, and with very promising
results. Cabri can be used at this point to create a macro called Centroid o f a
Quadrilateral. The next step in the exploration would be to draw a pentagon and use the
macro Centroid o f a Quadrilateral five times on the each of the five quadrilaterals that can
be formed by “leaving out” one of the vertices of the pentagon. Each of the four centroids
of the quadrilaterals are then connected with the vertex that was not used to create it. It
turns out that these five segments are, indeed, concurrent. Cabri can then be used to
measure the longer and shorter sections of each segment and to do the appropriate
calculations. As the reader may suppose at this time, a numerical relationship does exist.
The longer section is four times as long as the shorter section of each segment. This is
illustrated in Figure 2.12.
42
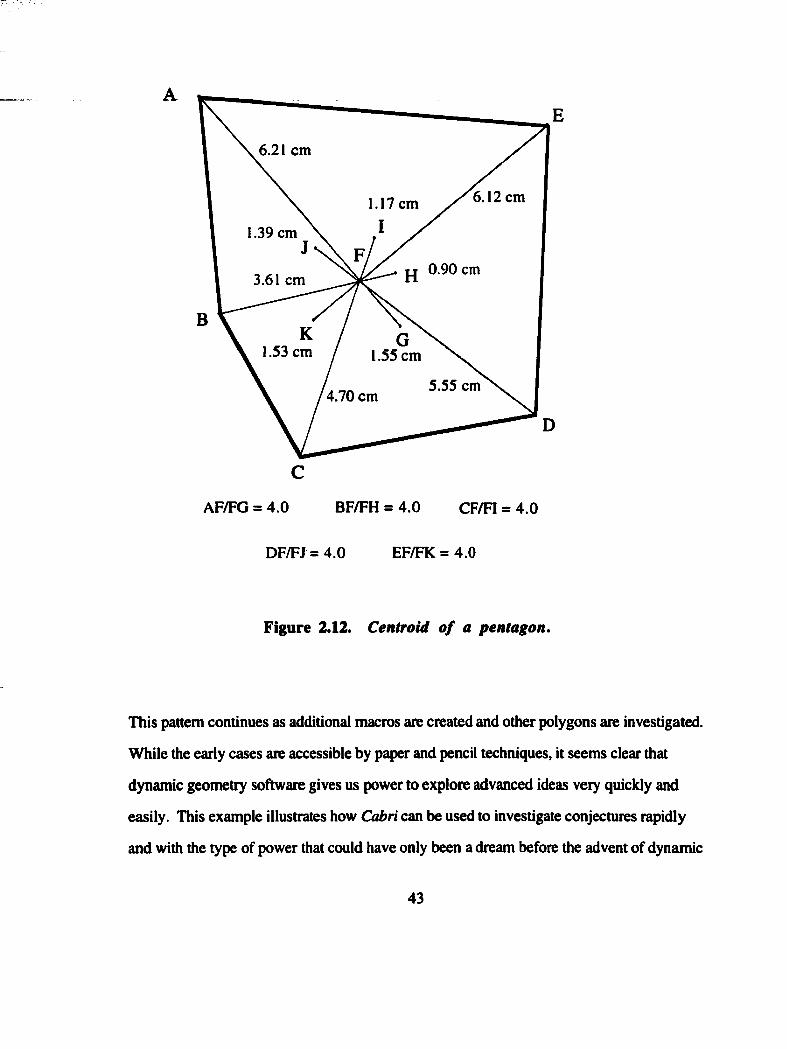
6.21 cm
6.12 cm1.17 cm
1.39 cm
0.90 cm3.61 cm
1.53 cm 1.55 cm
5.55 cm4.70 cm
AF/FG = 4.0 BF/FH = 4.0 CF/FI = 4.0
DF/FJ = 4.0 EF/FK = 4.0
Figure 2.12. Centroid o f a pentagon.
This pattern continues as additional macros are created and other polygons are investigated.
While the early cases are accessible by paper and pencil techniques, it seems clear that
dynamic geometry software gives us power to explore advanced ideas very quickly and
easily. This example illustrates how Cabri can be used to investigate conjectures rapidly
and with the type of power that could have only been a dream before the advent of dynamic
43

geometry software. Someone with a working knowledge of Cabri could investigate the
previous scenario in a matter of minutes. How many ideas of class extension are waiting to
be discovered if our students use software such as Cabri on a regular basis?
GENERALIZING W ITH DYNAMIC GEOMETRY SOFTW ARE
Schwartz (1993), one of the developers of The Geometric Supposer (a geometric
construction program described later in this chapter), discusses creativity and generalization
as they pertain to school mathematics. He claims that in other subject areas, English
language arts for example, students are asked to create as well as study the masters such as
Shakespeare. In mathematics, however, students are rarely asked to create. Students
spend time in mathematics classes learning previously proven results. Schwartz (1993)
states that “students m ust... be challenged to invent and create” (p. 7) and believes that
geometry software programs such as The Geometric Supposer offer that potential.
Schwartz (1993) asserts that “the essence of mathematical creativity lies in the making and
exploring of mathematical conjectures” (p. 8). Without adequate tools, however, making
and exploring conjectures is more difficult, according to Schwartz.
On the topic of generalization, Schwartz (1993) states that “the mental acts of
thinking inductively and generalizing are at the heart of what mathematics students ought to
learn to do” (p. 9). Schwartz does not claim that using The Geometric Supposer
necessarily leads students to be better at making generalizations, but at least it provides “the
setting and the occasion” (p. 10).
Schwartz (1993) discusses differences in algebra and geometry with respect to
representation of key ideas in the subject. In algebra, we can represent all possible linear
relationships by the equation Ax + By = C. In geometry, Schwartz (1993) claims it is easy
to construct (either by hand, or with software) a regular polygon such as a triangle or even
a 17-gon. How do we construct, however, a regular n-gon? Schwartz (1993) states, “one
44
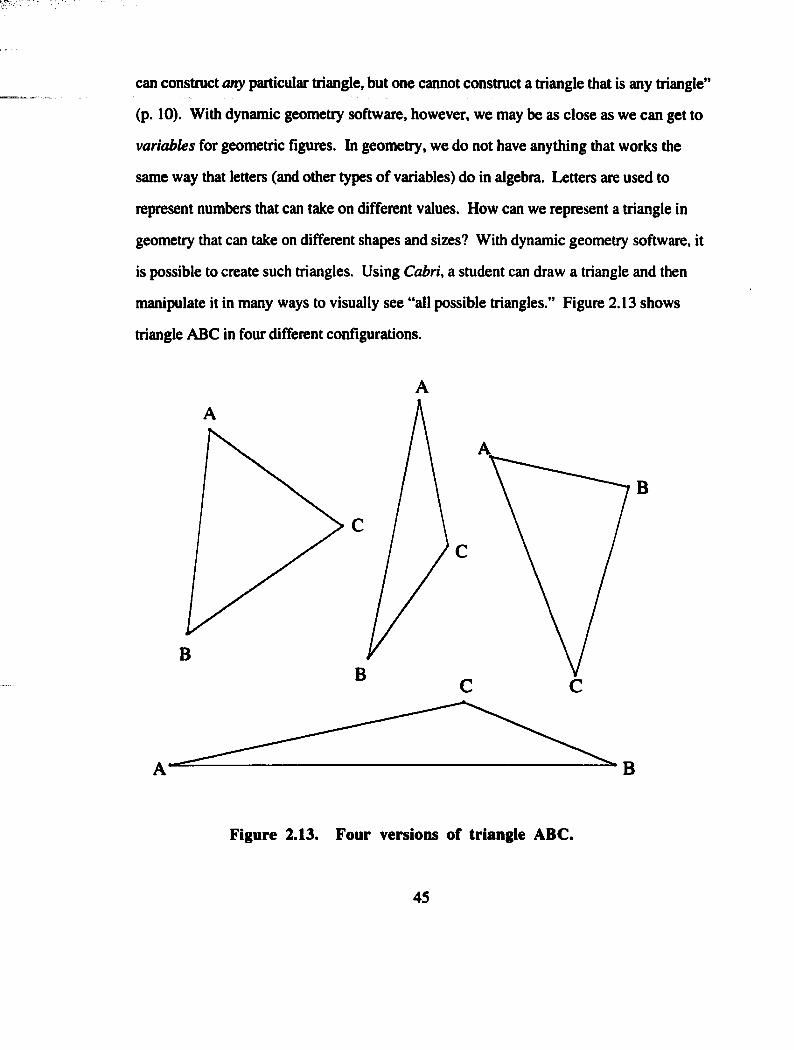
can construct any particular triangle, but one cannot construct a triangle that is any triangle”
(p. 10). With dynamic geometry software, however, we may be as close as we can get to
variables for geometric figures. In geometry, we do not have anything that works the
same way that letters (and other types of variables) do in algebra. Letters are used to
represent numbers that can take on different values. How can we represent a triangle in
geometry that can take on different shapes and sizes? With dynamic geometry software, it
is possible to create such triangles. Using Cabri, a student can draw a triangle and then
manipulate it in many ways to visually see “all possible triangles.” Figure 2.13 shows
triangle ABC in four different confîgurations.
B
C
B
C
C C
B
Figure 2.13. Four versions of triangle ABC.
45
Yerushalmy and Chazan (1993) discuss the issue of diagrams as an obstacle to
student learning in geometry and how The Geometric Supposerez be an aid to overcome
this obstacle. Three themes serve as the focus for examining these obstacles; 1) diagrams
are particular, 2) common usage confuses certain standard diagrams with the classes of
objects to which they belong, and 3) a single diagram is often viewed in different ways
(Yerushalmy & Chazan, 1993, p. 25). Yerushalmy and Chazan (1993) conclude that
Supposer students “are able to treat a single diagram as a model for a whole class of
diagrams and simultaneously are aware that such models have characteristics not shared by
all members of the class” (p. S3).
Yerushalmy (1993) discusses the confusion among the terms generalization,
induction, and conjecturing. Yerushalmy (1993) states that in the process of induction, a
generalization is a product created by examining a set of examples. Generalization is also a
process acted out on either a conjecture or a proven statement, whereby a specific statement
becomes a more general statement. Yerushalmy (1993) states that for generalization to
occur, three major processes must be involved: the generation of a set of examples,
manipulation of the samples, and analysis of ideas to form more general ideas. She
concludes by stating that she is “convinced that it is essential to create opportunities to
generalize in any domain of mathematics using various software tools” (pp. 82-83).
Dynamic geometry software helps students to generalize because it embodies each
of the principles in Dienes’ mathematics learning theory. The next section presents a model
that shows how Dienes’ theory is applied to generalization through the use of dynamic
geometry software.
46
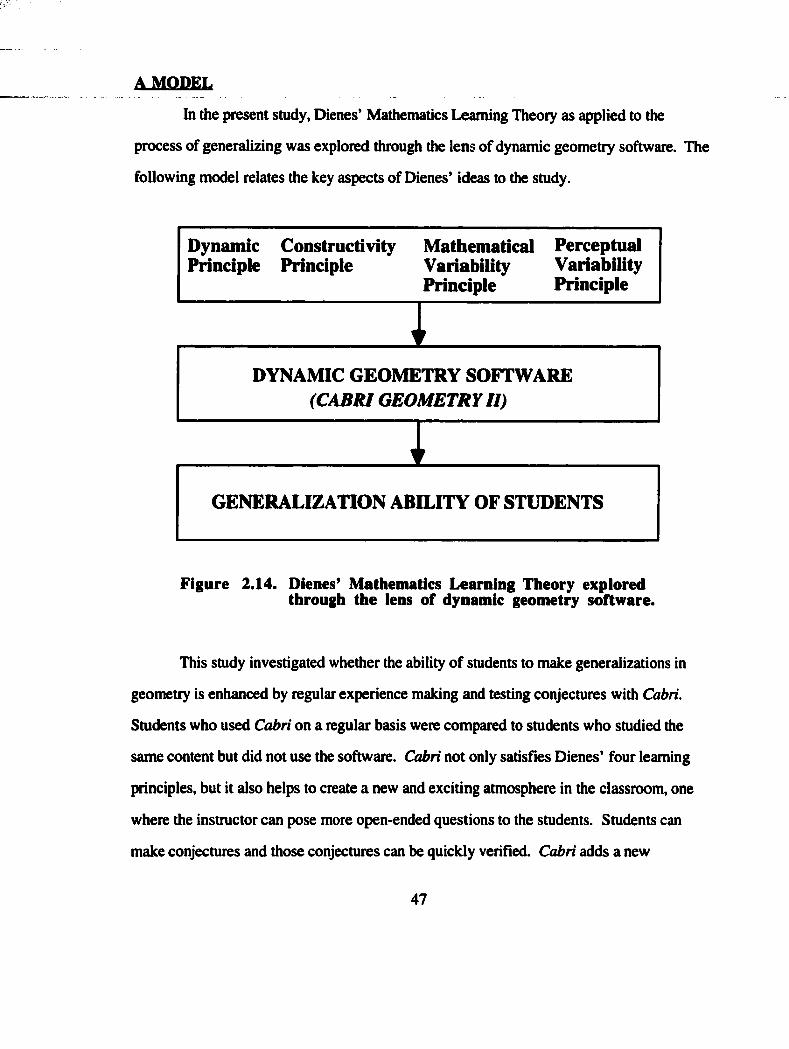
A MODEL
In the present study, Dienes’ Mathematics Learning Theory as applied to the
process of generalizing was explored through the lens of dynamic geometry software. The
following model relates the key aspects of Dienes’ ideas to the study.
Dynamic Constructivity Mathematical PerceptualVariability VariabilityPrinciple Principle
Principle Principle
GENERALIZATION ABILITY OF STUDENTS
DYNAMIC GEOMETRY SOFTWARE (CABRI GEOMETRY II)
Figure 2.14. Dienes* Mathematics Learning Theory explored through the lens of dynamic geometry software.
This study investigated whether the ability of students to make generalizations in
geometry is enhanced by regular experience making and testing conjectures with Cabri.
Students who used Cabri on a regular basis were compared to students who studied the
same content but did not use the software. Cabri not only satisfies Dienes’ four leaming
principles, but it also helps to create a new and exciting atmosphere in the classroom, one
where the instructor can pose more open-ended questions to the students. Students can
make conjectures and those conjectures can be quickly verified. Cabri adds a new
47
dimension to the classroom. It should be noted, however, that Cabri does not reduce the
need for formal verification. Conjectures are verified with Cabri, and formal proof follows
at a later time. Dienes (1960, p. 28) states that “the problem is to devise standard
mathematical situations in which... adventurous kind of thinking can ... take place."
When dynamic geometry software such as Cabri is used, classrooms become a more likely
environment for adventurous thinking to take place.
REVIEW OF RELATED LITERATURE
In this section, literature related to the study is presented. There are a great number
of articles and research studies that have been published which impact the current study in
one way or another. Articles, research studies, and other relevant literature pertaining to
the topic of generalization in mathematics are presented, followed by a discussion of
articles and research studies pertaining to the role of geometry software in leaming.
Generalization. Davydov (1990/1972) discusses generalization as it pertains to
various subjects in the school curriculum. He notes the confusion between the process of
generalization and the result of this process (p. 10). A search for an invariant in a
collection of objects occurs during the generalization process. Davydov discusses how
geometry teachers provide numerous examples when trying to get students to generalize
results in geometry. Davydov states (p. 13) that generalization is inseparably linked to the
operation of abstracting. He discusses an example (p. 13) where students arrive at the
generalization that the number three is one more than the number two. At first the student
realizes that for any three objects, there is one more than if there were two objects, but
subsequently, this feature is separated from the other properties such as size. At this point,
the relationship is “regarded as a relationship of abstract numbers, as a particular object of
the attention, abstracted from concrete objects” (p. 13).
48
Mitchelmore (1999) discusses Davydov’s theory of generalization and examines
three methods of teaching generalizations in light of Davydov’s theory. The first method is
referred to as the Abstract Before Concrete (ABC) method. Widely used in mathematics
teaching, in this method, knowledge is acquired in “context-free” circumstances. This
knowledge is then supposed to be available for general applications at later times.
Mitchelmore stated that knowledge acquired by the ABC method is often superficial
knowledge that cannot be applied in problem situations and is quickly forgotten once
examinations are over. The second type of methodology is empirical, where leaming
proceeds from the concrete to the abstract. An example is given in which students draw
squares of dots, representing the square numbers, and use inductive reasoning to find the
next number in the sequence. The third method is a problem-solving approach. In this
approach, the teacher poses a problem to the students, allows the students to solve the
problem, after which the students must convince others that the solution is correct. An
example of the problem-solving approach is the following question: Can a scalene triangle
tessellate the plane? Mitchelmore’s opinion is that students must deal with a great variety of
geometry topics while examining this question, and by working with all of these concepts
in a problem situation, a deeper level of understanding will result than if the students had
been taught each topic separately.
Students’ representations of geometric ideas are key to the present study, as
representations impact students’ abilities to generalize. Vinner and Hershkowitz (1980)
report that people use concept images, which are combinations of mental pictures and
properties associated with the concept, rather than definitions. Students develop certain
images of geometric objects based on what they have seen in textbooks and how their
instructor has represented an object on the chalkboard or on paper. Cabri offers the
potential to give students a greater variety of representations of geometric objects. A
closely related topic is the use of diagrams. Kabanova-Meller (1970) discusses the need
49
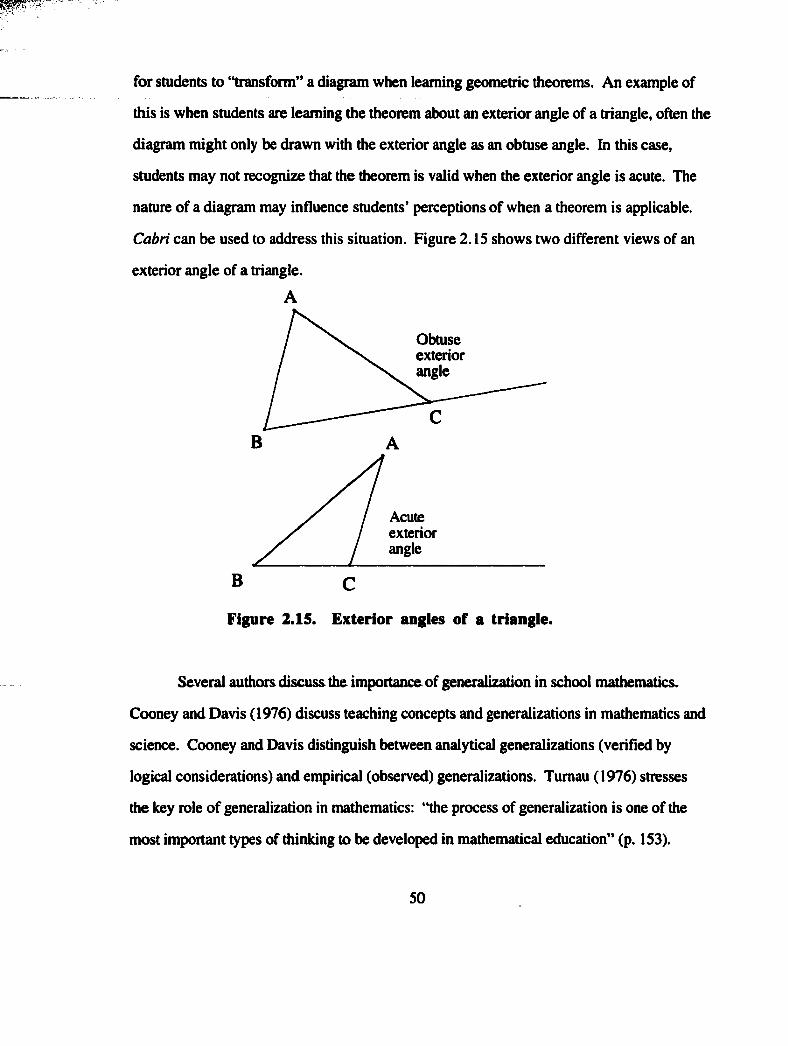
for students to “transform” a diagram when leaming geometric theorems. An example of
this is when students are leaming the theorem about an exterior angle of a triangle, often the
diagram might only be drawn with the exterior angle as an obtuse angle. In this case,
students may not recognize that the theorem is valid when the exterior angle is acute. The
nature of a diagram may influence students’ perceptions of when a theorem is applicable.
Cabri can be used to address this situation. Figure 2. IS shows two different views of an
exterior angle of a triangle.
A
Obtuseexteriorangle
B A
Acuteexteriorangle
B C
Figure 2.15. Exterior angles of a triangle.
Several authors discuss the importance of generalization in school mathematics.
Cooney and Davis (1976) discuss teaching concepts and generalizations in mathematics and
science. Cooney and Davis distinguish between analytical generalizations (verified by
logical considerations) and empirical (observed) generalizations. Tumau (1976) stresses
the key role of generalization in mathematics: “the process of generalization is one of the
most important types of thinking to be developed in mathematical education” (p. 153).
50

Generalizations that originate from number patterns are the focus of the writing of
several authors (Aviv, 1979; Hartman, 1976; Oullette, 1975,1978; Ranucci, 1974; Smith,
1972; Szetela, 1999). The triangular numbers and other polygonal numbers are the subject
of much of this work. Smith (1972) presents a broader generalization on the nth polygonal
number. Ranucci (1974) discusses the need for students to know how to analyze data so
that they may work toward generalizations. He describes how high school students used
successive differences to arrive at generalizations.
Many research studies that focus on students’ abilities to generalize have used
patterns and functions as the arena in which to conduct the study. Stacey (1989) studied
how students find and use patterns in linear generalizing problems. Stacey investigated
several issues in this study: 1) what type of generalizations students make and how they
vary with increased schooling, 2) how students explain the patterns they find and the
generalizations they make, 3) how consistent students are in the mathematical models used
when making generalizations, and 4) how the responses of students who have had some
experience generalizing differ from the responses of students who have had little to no
experience generalizing. Stacey’s study is an example of a study which looks into a deeper
issue; it is an analysis of strategies used in generalizing. The subjects of the study were
140 seventh- and eighth-grade students. Stacey reported that a majority of students could
recognize the constant difference in the problems and could successfully find the next term
in a linear sequence. Students had more difficulty when asked to find terms such as the
100th or 1000th terms. An error that was reported for many students was they moved to a
direct proportion when trying to figure out, for example, the 100th term. These students
correctly figured the 50th term, but then doubled the result to obtain the 100th term. Stacey
also reported that students seem to grasp at relationships without subjecting them to critical
thinking.
51
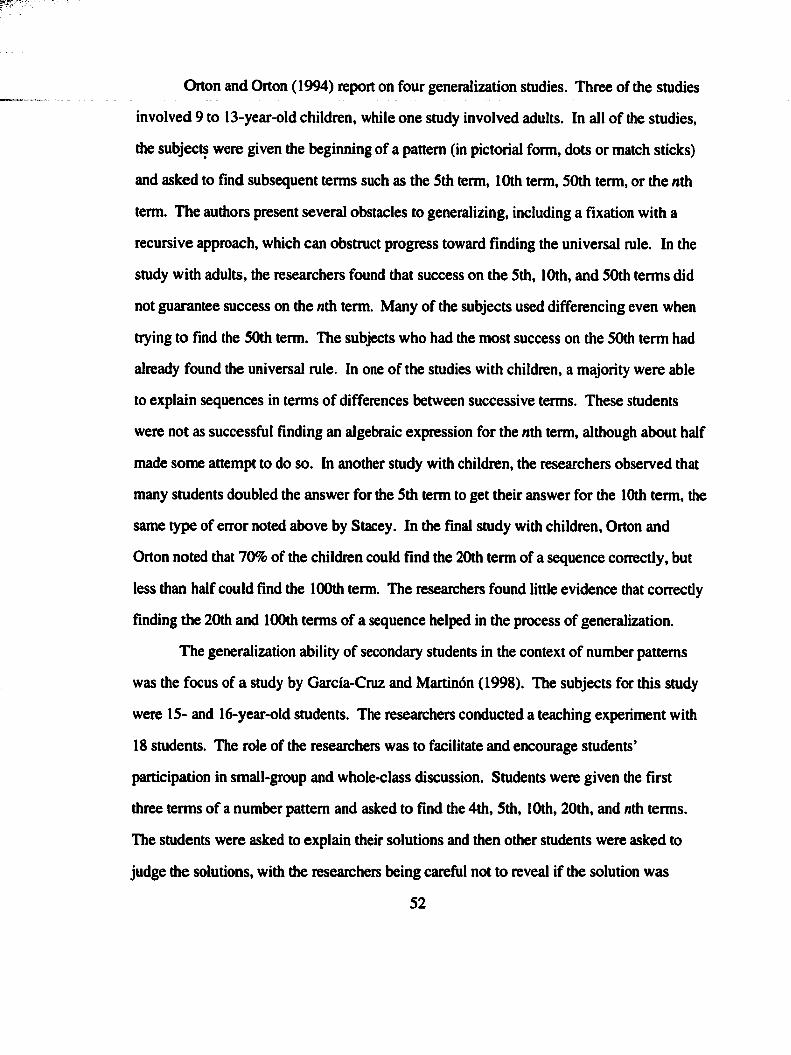
Orton and Orton (1994) report on four generalization studies. Three of the studies
involved 9 to 13-year-old children, while one study involved adults. In all of the studies,
the subjects were given the beginning of a pattern (in pictorial form, dots or match sticks)
and asked to find subsequent terms such as the 5th term, 10th term, 50th term, or the nth
term. The authors present several obstacles to generalizing. Including a fixation with a
recursive approach, which can obstruct progress toward fînding the universal rule. In the
study with adults, the researchers found that success on the 5th, 10th, and 50th terms did
not guarantee success on the nth term. Many of the subjects used differencing even when
trying to find the 50th term. The subjects who had the most success on the 50th term had
already found the universal rule. In one of the studies with children, a majority were able
to explain sequences in terms of differences between successive terms. These students
were not as successful fînding an algebraic expression for the nth term, although about half
made some attempt to do so. In another study with children, the researchers observed that
many students doubled the answer for the 5th term to get their answer for the 10th term, the
same type of error noted above by Stacey. In the fînal study with children, Orton and
Orton noted that 70% of the children could fînd the 20th term of a sequence correctly, but
less than half could find the 100th term. The researchers found little evidence that correctly
fînding the 20th and 100th terms of a sequence helped in the process of generalization.
The generalization ability of secondary students in the context of number patterns
was the focus of a study by Garcfa-Cruz and Martinôn (1998). The subjects for this study
were 15- and 16-year-old students. The researchers conducted a teaching experiment with
18 students. The role of the researchers was to facilitate and encourage students’
participation in small-group and whole-class discussion. Students were given the fîrst
three terms of a number pattern and asked to fînd the 4th, 5th, 10th, 20th, and nth terms.
The students were asked to explain their solutions and then other students were asked to
judge the solutions, with the researchers being careful not to reveal if the solution was
52
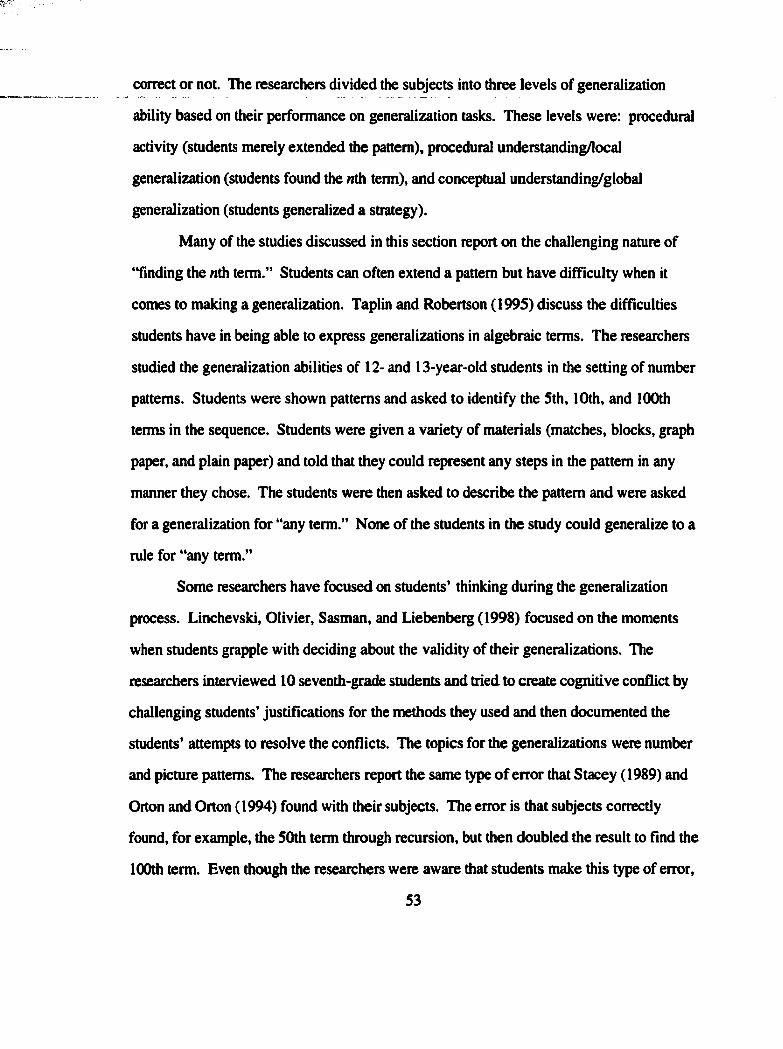
correct or not. The researchers divided the subjects into three levels of generalization
ability based on their performance on generalization tasks. These levels were: procedural
activity (students merely extended the pattern), procedural understanding/local
generalization (students found the nth term), and conceptual understanding/global
generalization (students generalized a strategy).
Many of the studies discussed in this section report on the challenging nature of
'finding the nth term.” Students can often extend a pattern but have difficulty when it
comes to making a generalization. Taplin and Robertson (1995) discuss the difficulties
students have in being able to express generalizations in algebraic terms. The researchers
studied the generalization abilities of 12- and 13-year-old students in the setting of number
patterns. Students were shown patterns and asked to identify the 5th, 10th, and 100th
terms in the sequence. Students were given a variety of materials (matches, blocks, graph
paper, and plain paper) and told that they could represent any steps in the pattern in any
manner they chose. The students were then asked to describe the pattern and were asked
for a generalization for “any term.” None of the students in the study could generalize to a
rule for “any term.”
Some researchers have focused on students’ thinking during the generalization
process. Linchevski, Olivier, Sasman, and Liebenberg (1998) focused on the moments
when students grapple with deciding about the validity of their generalizations. The
researchers interviewed 10 seventb-grade students and tried to create cognitive conflict by
challenging students’ justiflcations for the methods they used and then documented the
students’ attempts to resolve the conflicts. The topics for the generalizations were number
and picture patterns. The researchers report the same type of error that Stacey (1989) and
Orton and Orton (1994) found with their subjects. The error is that subjects correctly
found, for example, the 50th term through recursion, but then doubled the result to find the
100th term. Even though the researchers were aware that students make this type of error,
53
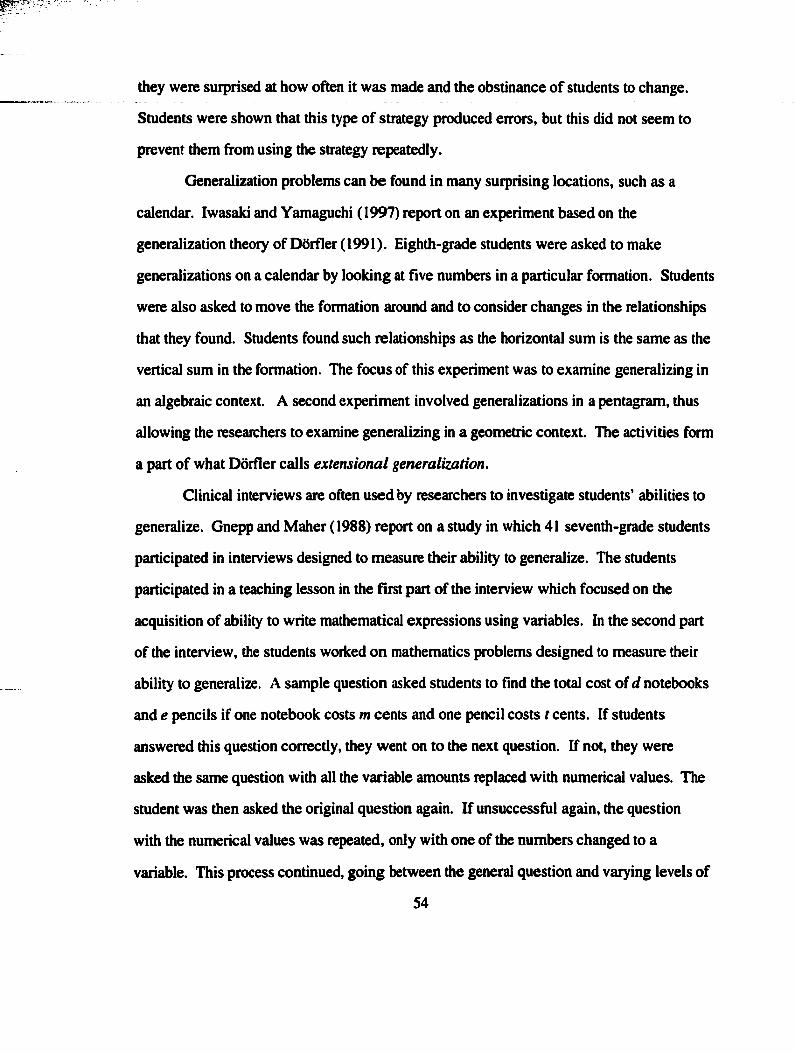
they were surprised at how often it was made and the obstinance of students to change.
Students were shown that this type of strategy produced errors, but this did not seem to
prevent them from using the strategy repeatedly.
Generalization problems can be found in many surprising locations, such as a
calendar. Iwasaki and Yamaguchi (1997) report on an experiment based on the
generalization theory of Ddrfler (1991). Eighth-grade students were asked to make
generalizations on a calendar by looking at rive numbers in a particular formation. Students
were also asked to move the formation around and to consider changes in the relationships
that they found. Students found such relationships as the horizontal sum is the same as the
vertical sum in the formation. The focus of this experiment was to examine generalizing in
an algebraic context. A second experiment involved generalizations in a pentagram, thus
allowing the researchers to examine generalizing in a geometric context. The activities form
a part of what Ddrfler calls extensional generalization.
Clinical interviews are often used by researchers to investigate students’ abilities to
generalize. Gnepp and Maher (1988) report on a study in which 41 seventh-grade students
participated in interviews designed to measure their ability to generalize. The students
participated in a teaching lesson in the first part of the interview which focused on the
acquisition of ability to write mathematical expressions using variables. In the second part
of the interview, the students worked on mathematics problems designed to measure their
ability to generalize. A sample question asked students to find the total cost of d notebooks
and e pencils if one notebook costs m cents and one pencil costs t cents. If students
answered this question correctly, they went on to the next question. If not, they were
asked the same question with aU the variable amounts replaced with numerical values. The
student was then asked the original question again. If unsuccessful again, the question
with the numerical values was repeated, only with one of the numbers changed to a
variable. This process continued, going between the general question and varying levels of
54
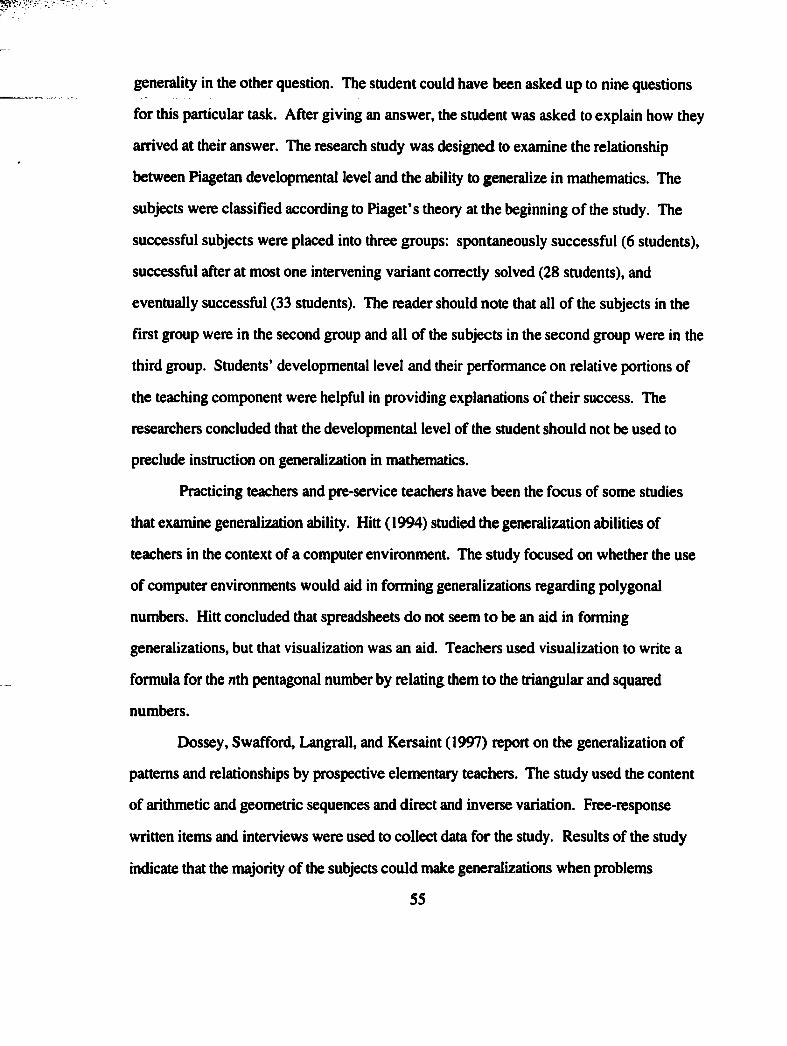
generality in the other question. The student could have been asked up to nine questions
for this particular task. After giving an answer, the student was asked to explain how they
arrived at their answer. The research study was designed to examine the relationship
between Piagetan developmental level and the ability to generalize in mathematics. The
subjects were classified according to Piaget's theory at the beginning of the study. The
successful subjects were placed into three groups: spontaneously successful (6 students),
successful after at most one intervening variant correctly solved (28 students), and
eventually successful (33 students). The reader should note that all of the subjects in the
first group were in the second group and all of the subjects in the second group were in the
third group. Students’ developmental level and their performance on relative portions of
the teaching component were helpful in providing explanations of their success. The
researchers concluded that the developmental level of the student should not be used to
preclude instruction on generalization in mathematics.
Practicing teachers and pre-service teachers have been the focus of some studies
that examine generalization ability. Hitt (1994) studied the generalization abilities of
teachers in the context of a computer environment. The study focused on whether the use
of computer environments would aid in forming generalizations regarding polygonal
numbers. Hitt concluded that spreadsheets do not seem to be an aid in forming
generalizations, but that visualization was an aid. Teachers used visualization to write a
formula for the nth pentagonal number by relating them to the triangular and squared
numbers.
Dossey, Swafford, Langrall, and Kersaint (1997) report on the generalization of
pattems and relationships by prospective elementary teachers. The study used the content
of arithmetic and geometric sequences and direct and inverse variation. Free-response
written items and interviews were used to collect data for the study. Results of the study
indicate that the majority of the subjects could make generalizations when problems
55
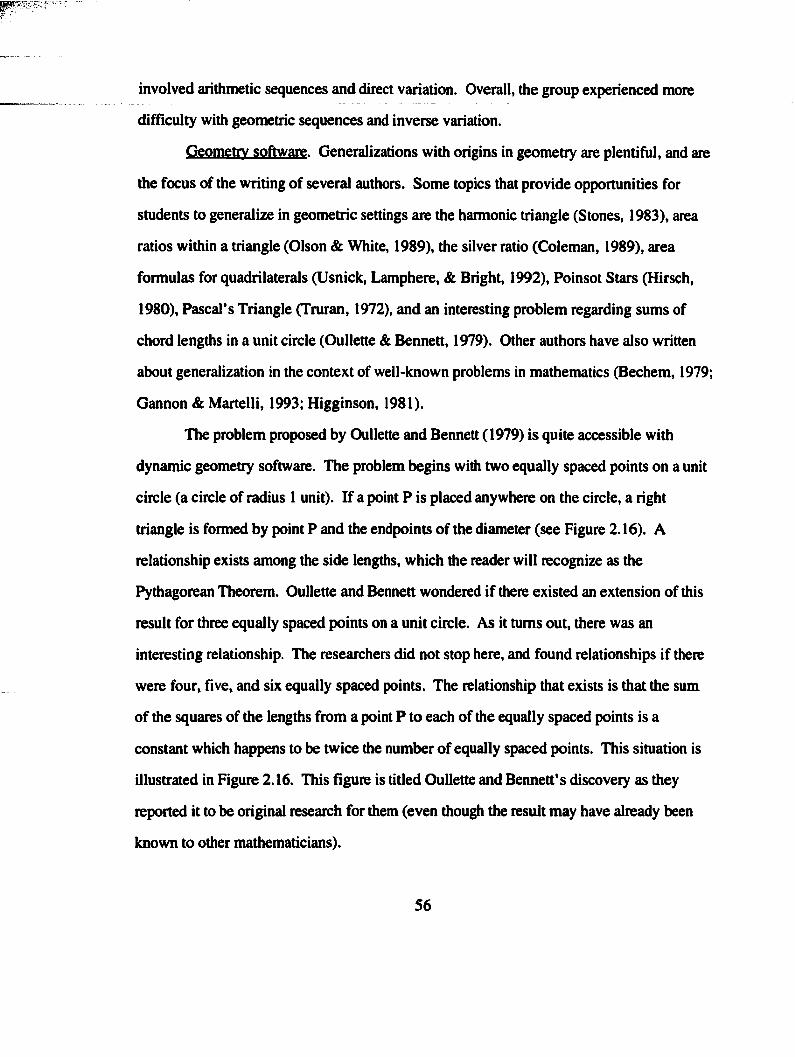
involved arithmetic sequences and direct variation. Overall, the group experienced more
difficulty with geometric sequences and inverse variation.
Geometrv software. Generalizations with origins in geometry are plentiful, and are
the focus of the writing of several authors. Some topics that provide opportunities for
students to generalize in geometric settings are the harmonic triangle (Stones, 1983), area
ratios within a triangle (Olson & White, 1989), the silver ratio (Coleman, 1989), area
formulas for quadrilaterals (Usnick, Lamphere, & Bright, 1992), Poinsot Stars (Hirsch,
1980), Pascal’s Triangle (Truran, 1972), and an interesting problem regarding sums of
chord lengths in a unit circle (Oullette & Bennett, 1979). Other authors have also written
about generalization in the context of well-known problems in mathematics (Bechem, 1979;
Gannon & Martelli, 1993; Higginson, 1981).
The problem proposed by Oullette and Bennett (1979) is quite accessible with
dynamic geometry software. The problem begins with two equally spaced points on a unit
circle (a circle of radius 1 unit). If a point P is placed anywhere on the circle, a right
triangle is formed by point P and the endpoints of the diameter (see Figure 2.16). A
relationship exists among the side lengths, which the reader will recognize as the
Pythagorean Theorem. Oullette and Bennett wondered if there existed an extension of this
result for three equally spaced points on a unit circle. As it turns out, there was an
interesting relationship. The researchers did not stop here, and found relationships if there
were four, five, and six equally spaced points. The relationship that exists is that the sum
of the squares of the lengths from a point P to each of the equally spaced points is a
constant which happens to be twice the number of equally spaced points. This situation is
illustrated in Figure 2.16. This fîgure is titled Oullette and Bennett’s discovery as they
reported it to be original research for them (even though the result may have already been
known to other mathematicians).
56
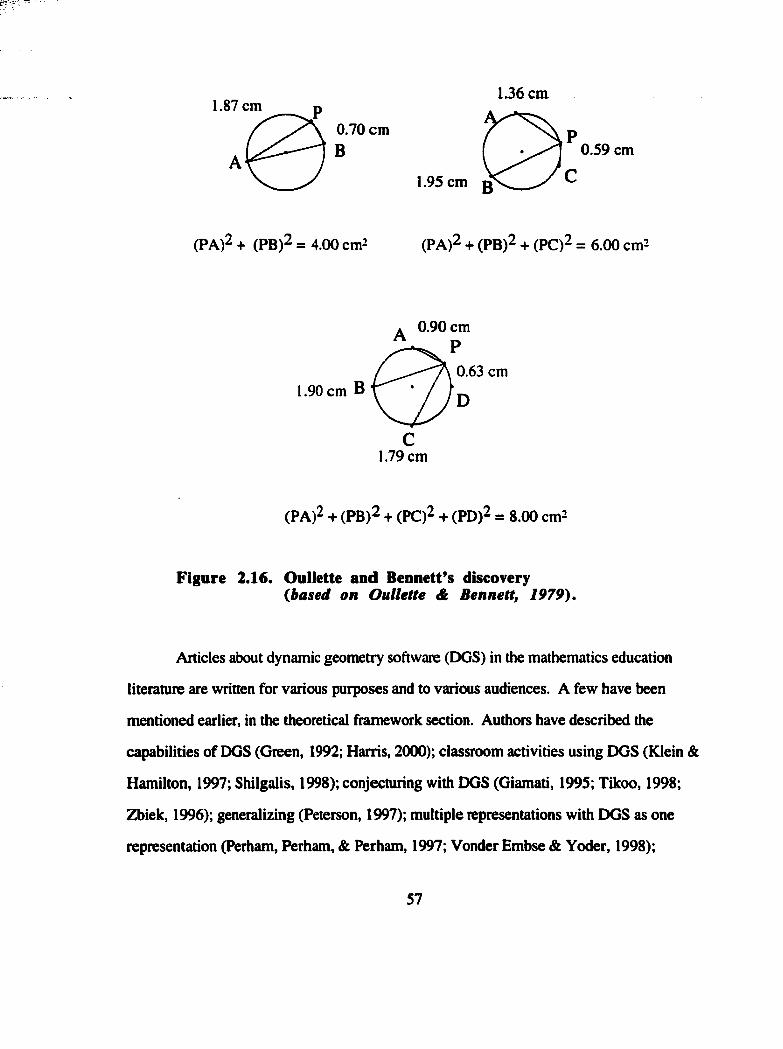
1.87 cm0.70 cm
1.36 cm
0.59 cm
1.95 cm
(PA)2 + (PB)2 = 4.00 cm2 (PA)^ + (PB)2 + (PC)2 = 6.00 cm2
0.90 cm
0.63 cm1.90 cm B
C1.79 cm
(PA)2 + (PB)2 + (PC)2 + (PD)2 = 8.00 cm2
Figure 2.16. Oullette and Bennett’s discovery{based on Oullette & Bennett, 1979).
Articles about dynamic geometry software (DCS) in the mathematics education
literature are written for various purposes and to various audiences. A few have been
mentioned earlier, in the theoretical framework section. Authors have described the
capabilities of DCS (Green, 1992; Harris, 2(XX)); classroom activities using DOS (Klein &
Hamilton, 1997; Shilgalis, 1998); conjecturing with DOS (Giamati, 1995; Tikoo, 1998;
Zbiek, 1996); generalizing (Peterson, 1997); multiple representations with DGS as one
representation (Perham, Perham, & Perham, 1997; Vonder Embse & Yoder, 1998);
57
particular topics that can be investigated with DGS (Battista & Clements, 1995; Foletta &
Leep, 2CXX); McGehee, 1998; Olmstead, 1998; Perham, Perham, & Perham, 1997;
Peterson, 1997; Scher, 1996; Schuman & Green, 20CX); Tikoo, 1998; Vonder Embse &
Yoder, 1998); projects in DGS (Brown, 1999); proof-related issues (Dreyftiss & Hadas,
1996; Galindo, 1998; Giamati, 1995; Hanna, 1998; Izen, 1998; Silver, 1998; Zbiek,
1996); reasoning with DGS (Perham, Perham, & Perham, 1997; Zbiek, 1996); and
teaching-related issues (Cuoco, Goldenberg, & Mark, 1994; Manouchehri, Enderson, &
Pugnucco, 1998; Pokay & Tayeh, 1997; Schumann, 1991; Schumann, 1992; Taylor,
1992). Harris (2000) compares differences between Cabri and The Geometer’s
Sketchpad and discusses how two different theoretical frameworks can guide us toward
the design of appropriate tasks in dynamic geometry environments. Finzer (1995)
discusses the implications of network collaboration using dynamic geometry software.
Schoaff (1993) describes how to develop mathematics lessons using technology.
Clements and Battista (1994) review research on computer environments for
geometry learning and describe the unique benefits of constructive computer programs,
implications for the design of computer environments, and other educational implications of
computer environments. Clements and Battista (1992) highlight the promising role of
computers in geometry learning by stating that “computers’ graphic capabilities may also
facilitate the construction of geometric representations” (p. 449).
An important issue with regard to generalizations in geometry is the idea of variance
versus invariance. Kaput (1992) states that in order for students to recognize invariance,
they must be able to see variance. Dynamic geometry software allows students to see
variance, as discussed earlier in the chapter. Kaput discusses the differences between static
and dynamic computer environments and points out that “dynamic media inherently make
variation easier to achieve” (p. 525). Kaput suggests that software programs such as Cabri
may soon act as an alternative to the traditional approach to Euclidean geometry (p. 538).
58
One of the earliest software programs used to explore geometric ideas is Logo. In
this software program, a turtle moves around the computer screen through a sequence of
commands given by the user. Clements and Battista (1989) report that experience with
Logo encourages students to view objects in geometry in terms of the actions used to create
them. Some dissertation studies have used Logo as a medium. Scally (1990) studied the
impact of experience in a Logo learning environment on students’ understanding of angle.
Students participated in a one semester Logo course to provide experiences that bridge the
gap between the middle and high school geometry curriculum. Gains were made between
visual and descriptive level thinking on some tasks, generally more by the Logo students
than the non-Logo students. Yusuf (1990) investigated whether middle school students
using Logo would have a more positive attitude toward learning geometry and a better
conceptualization of points, rays, lines, and line segments than students taught the same
concepts through lecture and paper and pencil activities. Results indicated that there were
significant differences in favor of the Logo group. Elmore (1992) created and field tested
Logo curricular materials to teach certain geometric concepts. Results showed that using
Logo had little effect on the students’ geometric achievement. The students did have a
positive attitude toward using Logo.
Another type of computer program used in the study of geometry is The Geometric
Supposer (Schwartz & Yerushalmy, 1985-88). The focus of this type of software is “to
facilitate students making and testing conjectures’’ (Clements & Battista, 1992, p. 452).
The Geometric Supposer: What Is It a Case of? (Schwartz, Yerushalmy, & Wilson,
Eds., 1993) discusses problems of learning, teaching, and implementation associated with
the Supposer. When using the Supposer, students use a menu to select certain geometric
figures and then perform constructions on those figures. For example, to investigate the
idea of centroid of a triangle with the Supposer, a student would select an acute triangle.
59
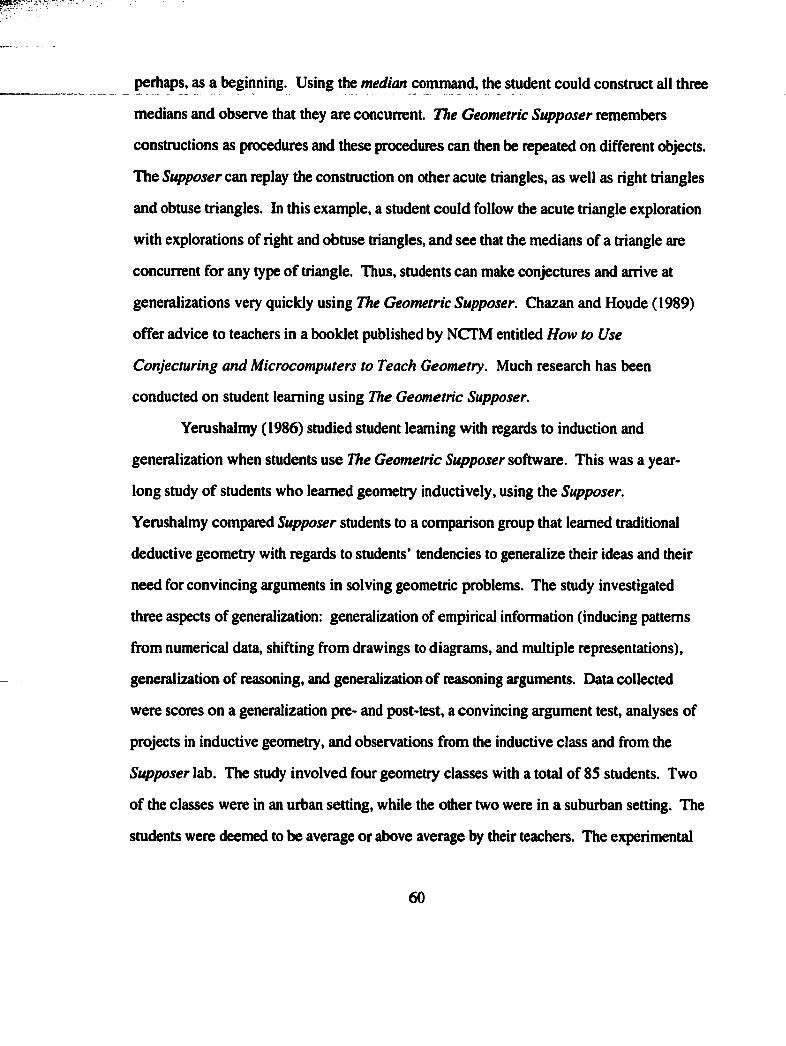
perhaps, as a beginning. Using the median command, the student could construct all three
medians and observe that they are concurrent. The Geometric Supposer remembers
constructions as procedures and these procedures can then be repeated on different objects.
The Supposer can replay the construction on other acute triangles, as well as right triangles
and obtuse triangles. In this example, a student could follow the acute triangle exploration
with explorations of right and obtuse triangles, and see that the medians of a triangle are
concurrent for any type of triangle. Thus, students can make conjectures and arrive at
generalizations very quickly using The Geometric Supposer. Chazan and Houde (1989)
offer advice to teachers in a booklet published by NCTM entitled How to Use
Conjecturing and Microcomputers to Teach Geometry. Much research has been
conducted on student learning using The Geometric Supposer.
Yerushalmy (1986) studied student learning with regards to induction and
generalization when students use The Geometric Supposer software. This was a year
long study of students who learned geometry inductively, using the Supposer.
Yerushalmy compared Supposer students to a comparison group that learned traditional
deductive geometry with regards to students' tendencies to generalize their ideas and their
need for convincing arguments in solving geometric problems. The study investigated
three aspects of generalization: generalization of empirical information (inducing patterns
from numerical data, shifting from drawings to diagrams, and multiple representations),
generalization of reasoning, and generalization of reasoning arguments. Data collected
were scores on a generalization pre- and post-test, a convincing argument test, analyses of
projects in inductive geometry, and observations from the inductive class and from the
Supposer lab. The study involved four geometry classes with a total of 85 students. Two
of the classes were in an urban setting, while the other two were in a suburban setting. The
students were deemed to be average or above average by their teachers. The experimental
6 0
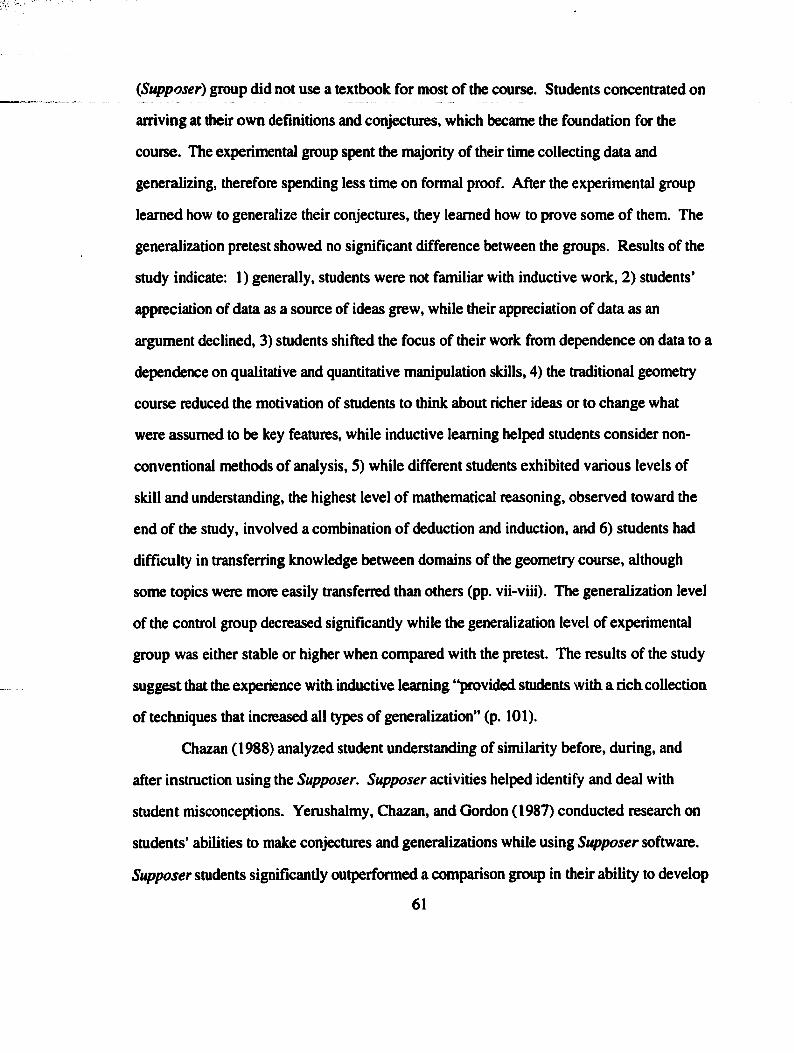
(Supposer) group did not use a textbook for most of the course. Students concentrated on
arriving at their own definitions and conjectures, which became the foundation for the
course. The experimental group spent the majority of their time collecting data and
generalizing, therefore spending less time on formal proof. After the experimental group
learned how to generalize their conjectures, they learned how to prove some of them. The
generalization pretest showed no significant difference between the groups. Results of the
study indicate: 1) generally, students were not familiar with inductive work, 2) students’
appreciation of data as a source of ideas grew, while their appreciation of data as an
argument declined, 3) students shifted the focus of their work from dependence on data to a
dependence on qualitative and quantitative manipulation skills, 4) the traditional geometry
course reduced the motivation of students to think about richer ideas or to change what
were assumed to be key features, while inductive leaming helped students consider non-
conventional methods of analysis, S) while different students exhibited various levels of
skill and understanding, the highest level of mathematical reasoning, observed toward the
end of the study, involved a combination of deduction and induction, and 6) students had
difficulty in transferring knowledge between domains of the geometry course, although
some topics were more easily transferred than others (pp. vii-viii). The generalization level
of the control group decreased significantly while the generalization level of experimental
group was either stable or higher when compared with the pretest. The results of the study
suggest that the experience with inductive leaming "provided students with a rich collection
of techniques that increased all types of generalization ” (p. 101).
Chazan (1988) analyzed student understanding of similarity before, during, and
after instruction using the Supposer. Supposer activities helped identify and deal with
student misconceptions. Yerushalmy, Chazan, and Gordon (1987) conducted research on
students’ abilities to make conjectures and generalizations while using Supposer software.
Supposer students significantly outperformed a comparison group in their ability to develop
61
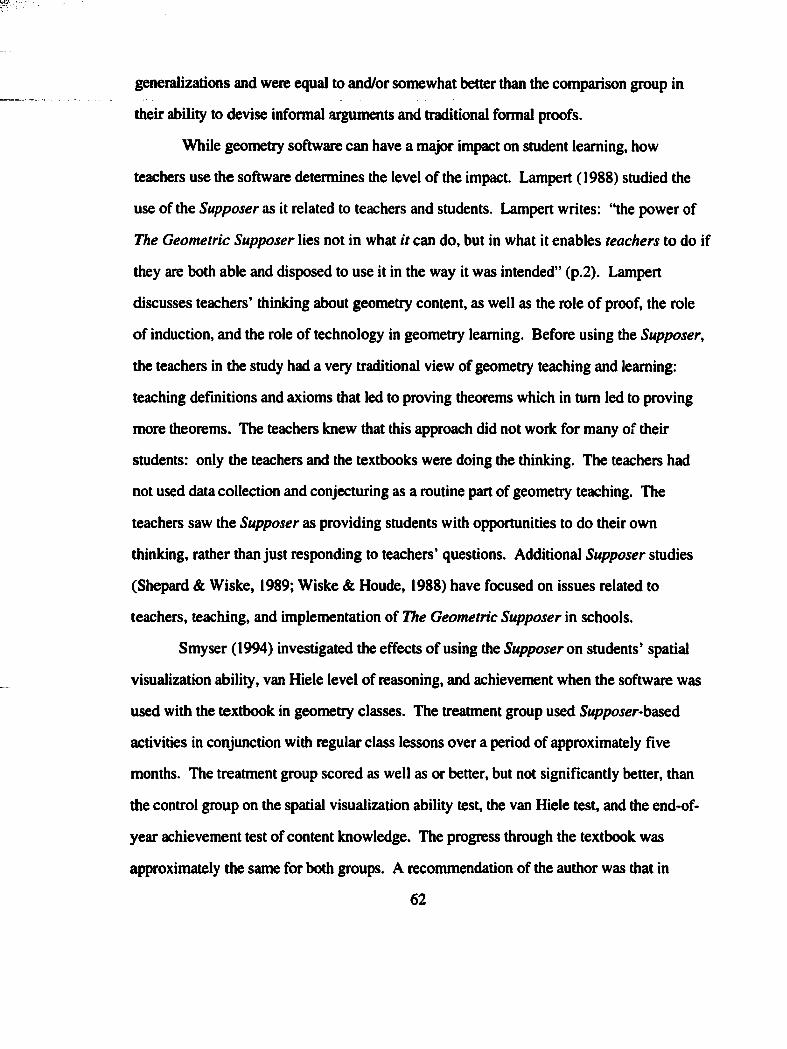
generalizations and were equal to and/or somewhat better than the comparison group in
their ability to devise informal arguments and traditional formal proofs.
While geometry software can have a major impact on student leaming, how
teachers use the software determines the level of the impact. Lamport (1988) studied the
use of the Supposer as it related to teachers and students. Lampert writes: “the power of
The Geometric Supposer lies not in what it can do, but in what it enables teachers to do if
they are both able and disposed to use it in the way it was intended” (p.2). Lampert
discusses teachers’ thinking about geometry content, as well as the role of proof, the role
of induction, and the role of technology in geometry leaming. Before using the Supposer,
the teachers in the study had a very traditional view of geometry teaching and leaming:
teaching definitions and axioms that led to proving theorems which in tum led to proving
more theorems. The teachers knew that this approach did not work for many of their
students: only the teachers and the textbooks were doing the thinking. The teachers had
not used data collection and conjecturing as a routine part of geometry teaching. The
teachers saw the Supposer as providing students with opportunities to do their own
thinking, rather than just responding to teachers’ questions. Additional Supposer studies
(Shepard & Wiske, 1989; Wiske & Houde, 1988) have focused on issues related to
teachers, teaching, and implementation of The Geometric Supposer in schools.
Smyser (1994) investigated the effects of using the Supposer on students’ spatial
visualization ability, van Hiele level of reasoning, and achievement when the software was
used with the textbook in geometry classes. The treatment group used Supposer-bs^sed
activities in conjunction with regular class lessons over a period of approximately five
months. The treatment group scored as well as or better, but not signiHcantly better, than
the control group on the spatial visualization ability test, the van Hiele test, and the end-of-
year achievement test of content knowledge. The progress through the textbook was
approximately the same for both groups. A recommendation of the author was that in
6 2
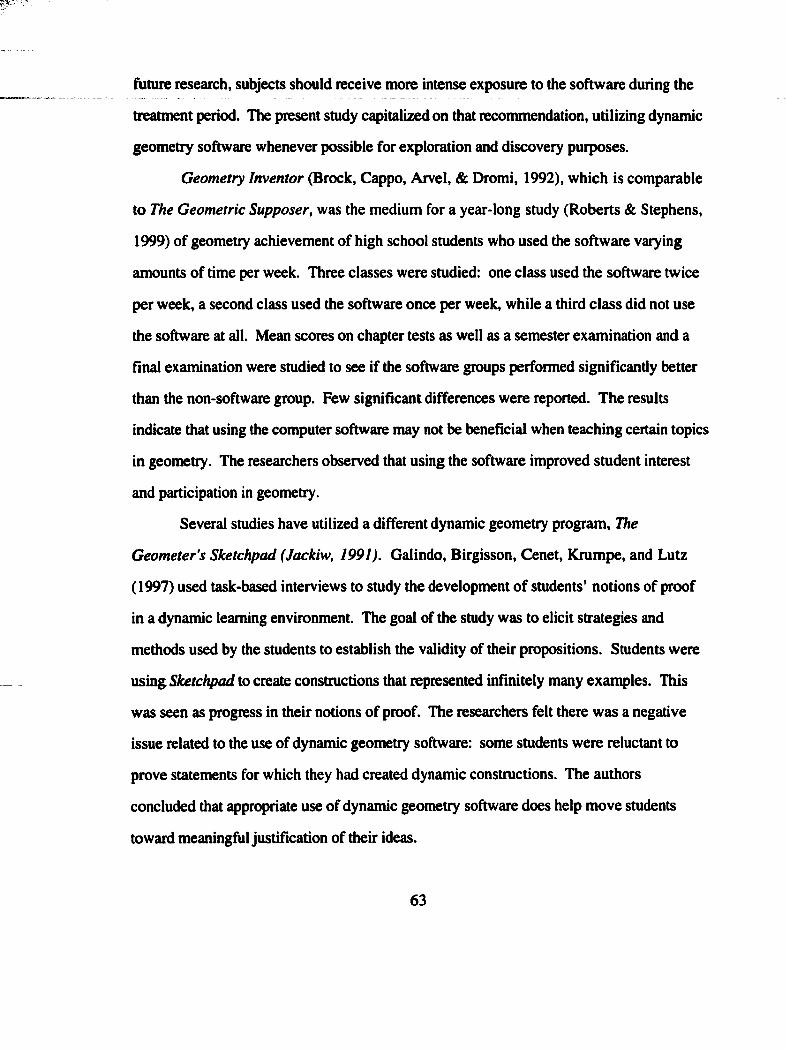
future research, subjects should receive more intense exposure to the software during the
treatment period. The present study capitalized on that recommendation, utilizing dynamic
geometry software whenever possible for exploration and discovery purposes.
Geometry Inventor (Brock, Cappo, Arvel, & Dromi, 1992), which is comparable
to The Geometric Supposer, was the medium for a year long study (Roberts & Stephens,
1999) of geometry achievement of high school students who used the software varying
amounts of time per week. Three classes were studied; one class used the software twice
per week, a second class used the software once per week, while a third class did not use
the software at all. Mean scores on chapter tests as well as a semester examination and a
final examination were studied to see if the software groups performed signifîcantly better
than the non-software group. Few significant differences were reported. The results
indicate that using the computer software may not be beneficial when teaching certain topics
in geometry. The researchers observed that using the software improved student interest
and participation in geometry.
Several studies have utilized a different dynamic geometry program. The
Geometer’s Sketchpad (Jackiw, 1991). Galindo, Birgisson, Cenet, Kmmpe, and Lutz
(1997) used task-based interviews to study the development of students’ notions of proof
in a dynamic leaming environment. The goal of the study was to elicit strategies and
methods used by the students to establish the validity of their propositions. Students were
using Sketchpad to create constructions that represented infinitely many examples. This
was seen as progress in their notions of proof. The researchers felt there was a negative
issue related to the use of dynamic geometry software: some students were reluctant to
prove statements for which they had created dynamic constmctions. The authors
concluded that appropriate use of dynamic geometry software does help move students
toward meaningful justification of their ideas.
63
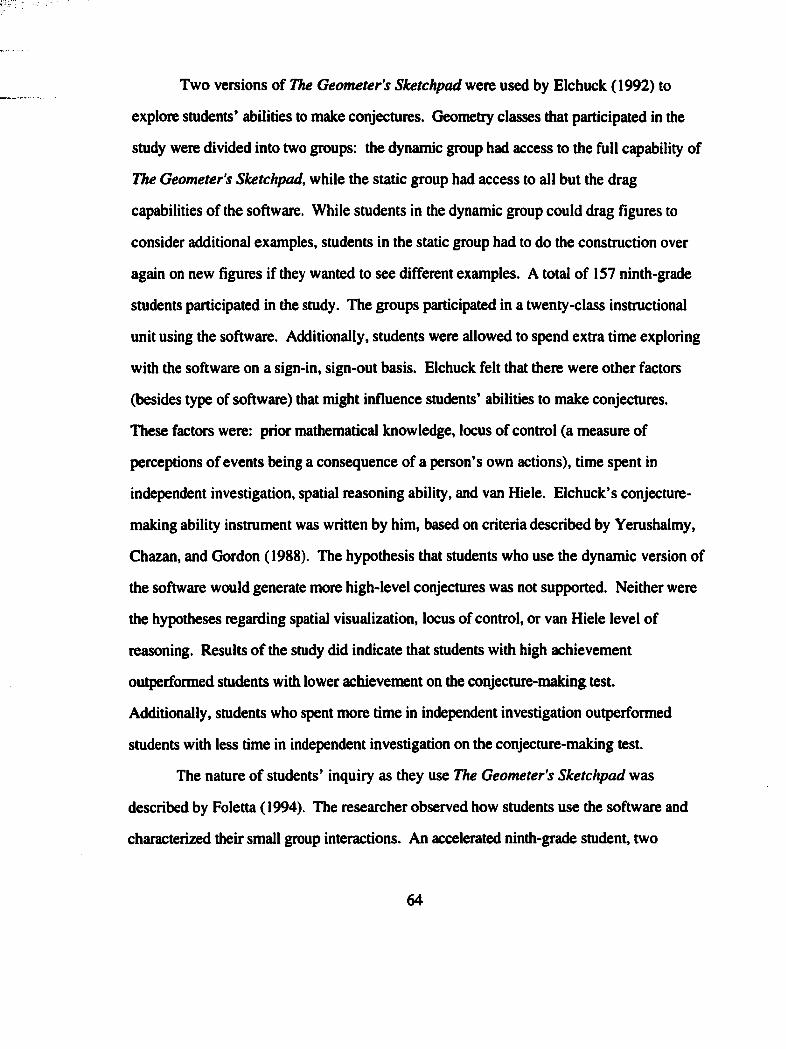
Two versions of The Geometer's Sketchpad were used by Elchuck (1992) to
explore students’ abilities to make conjectures. Geometry classes that participated in the
study were divided into two groups: the dynamic group had access to the full capability of
The Geometer's Sketchpad, while the static group had access to all but the drag
capabilities of the software. While students in the dynamic group could drag figures to
consider additional examples, students in the static group had to do the construction over
again on new figures if they wanted to see different examples. A total of 157 ninth-grade
students participated in the study. The groups participated in a twenty-class instructional
unit using the software. Additionally, students were allowed to spend extra time exploring
with the software on a sign-in, sign-out basis. Elchuck felt that there were other factors
(besides type of software) that might influence students’ abilities to make conjectures.
These factors were: prior mathematical knowledge, locus of control (a measure of
perceptions of events being a consequence of a person’s own actions), time spent in
Independent investigation, spatial reasoning ability, and van Hiele. Elchuck’s conjecture-
making ability instrument was written by him, based on criteria described by Yerushalmy,
Chazan, and Gordon (1988). The hypothesis that students who use the dynamic version of
the software would generate more high-level conjectures was not supported. Neither were
the hypotheses regarding spatial visualization, locus of control, or van Hiele level of
reasoning. Results of the study did indicate that students with high achievement
ouq>erformed students with lower achievement oa the conjecture-making test.
Additionally, students who spent more time in independent investigation outperformed
students with less time in independent investigation on the conjecture-making test.
The nature of students’ inquiry as they use The Geometer's Sketchpad was
described by Foletta (1994). The researcher observed how students use the software and
characterized their small group interactions. An accelerated ninth-grade student, two
64
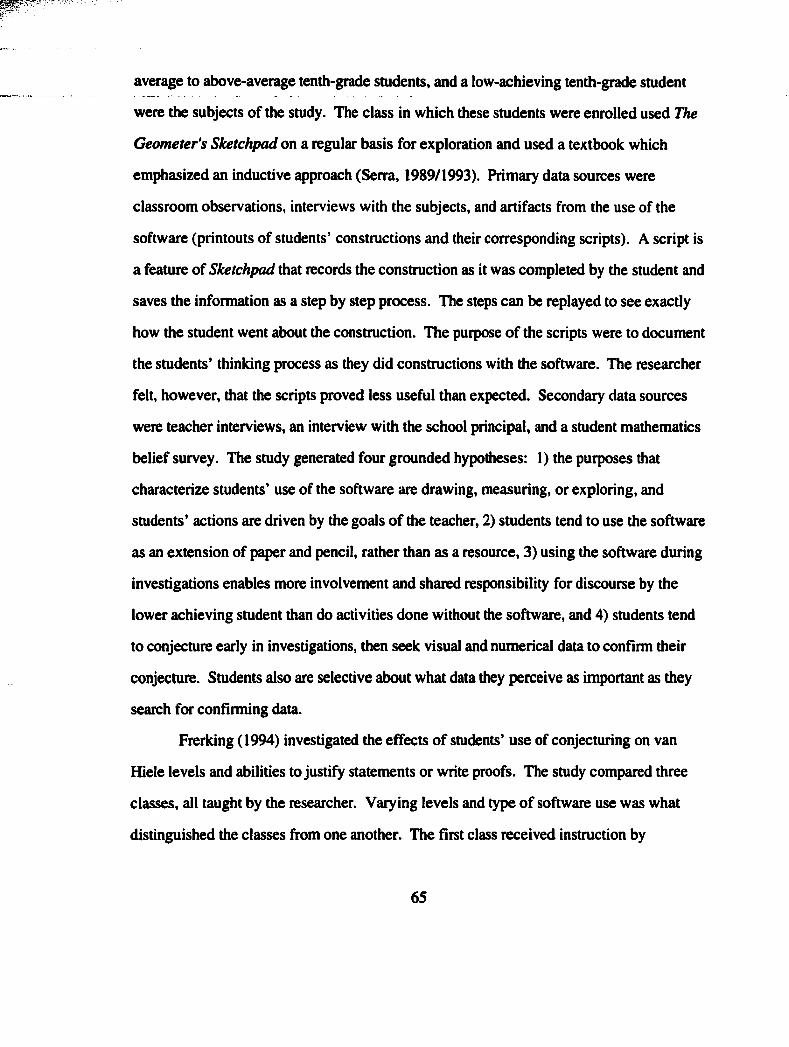
average to above-average tenth-grade students, and a low-achieving tenth-grade student
were the subjects of the study. The class in which these students were enrolled used The
Geometer's Sketchpad on a regular basis for exploration and used a textbook which
emphasized an inductive approach (Serra, 1989/1993). Primary data sources were
classroom observations, interviews with the subjects, and artifacts from the use of the
software (printouts of students’ constructions and their corresponding scripts). A script is
a feature of Sketchpad that records the construction as it was completed by the student and
saves the information as a step by step process. The steps can be replayed to see exactly
how the student went about the construction. The purpose of the scripts were to document
the students’ thinking process as they did constructions with the software. The researcher
felt, however, that the scripts proved less useful than expected. Secondary data sources
were teacher interviews, an interview with the school principal, and a student mathematics
belief survey. The study generated four grounded hypotheses: 1) the purposes that
characterize students’ use of the software are drawing, measuring, or exploring, and
students’ actions are driven by the goals of the teacher, 2) students tend to use the software
as an extension of paper and pencil, rather than as a resource, 3) using the software during
investigations enables more involvement and shared responsibility for discourse by the
lower achieving student than do activities done without the software, and 4) students tend
to conjecture early in investigations, then seek visual and numerical data to confirm their
conjecture. Students also are selective about what data they perceive as important as they
search for confirming data.
Frerking (1994) investigated the effects of students’ use of conjecturing on van
Hiele levels and abilities to justify statements or write proofs. The study compared three
classes, all taught by the researcher. Varying levels and type o f software use was what
distinguished the classes from one another. The first class received instruction by
65

traditional deductive methods. This class used The Geometer's Sketchpad fourteen times
throughout the course to explore theorems already discussed or proven in class. The
second class developed conjectures with manipulatives, compass and straightedge
constructions, and geometry software {The Geometer's Sketchpad and The Geometric
Supposer). Students in this group used geometry software a total of twenty times (fourteen
Sketchpad sessions and six Supposer sessions). Students were asked to justify or prove
some of their conjectures. The third class used The Geometer's Sketchpad twenty-two
times to explore ideas and develop conjectures. When in the computer lab, the students
used both commercially-developed and researcher-developed activities to make conjectures.
Pretest measures consisted of an Entering Geometry Test (also used by this researcher in
the current study) and a van Hiele Geometry Test. Throughout the study, conjectures of
the second and third classes were evaluated by the Conjecturing Evaluation Instrument
(CEI) and the Justification Evaluation Instrument (JEI). These instruments were modified
versions of instruments used by Yerushalmy (1986). Posttest data consisted of the
Entering Geometry Test, the van Hiele test, the CDASSG Proof test, and a county
geometry achievement test based on material covered in the first semester. Results of the
study indicate that the median gain on van Hiele scores was greater for the second and third
classes but the gain was not statistically signifîcant at the p < .05 level. There were no
significant differences among the groups on the net gain on scores on the Entering
Geometry TesL There were also no significant differences on achievement in proof writing
or on the county achievement test. There was a significant relationship between scores on
both the van Hiele pretest and posttest and the county achievement test. There was a
significant relationship between scores on the van Hiele posttest and scores on the proof
test. There were no significant relationships between scores on the van Hiele pretest and
the scores on the CEI or JEI, but there were significant relationships between scores on the
van Hiele posttest and scores on the CEI and JEI. Student scores on the CEI did not show
66
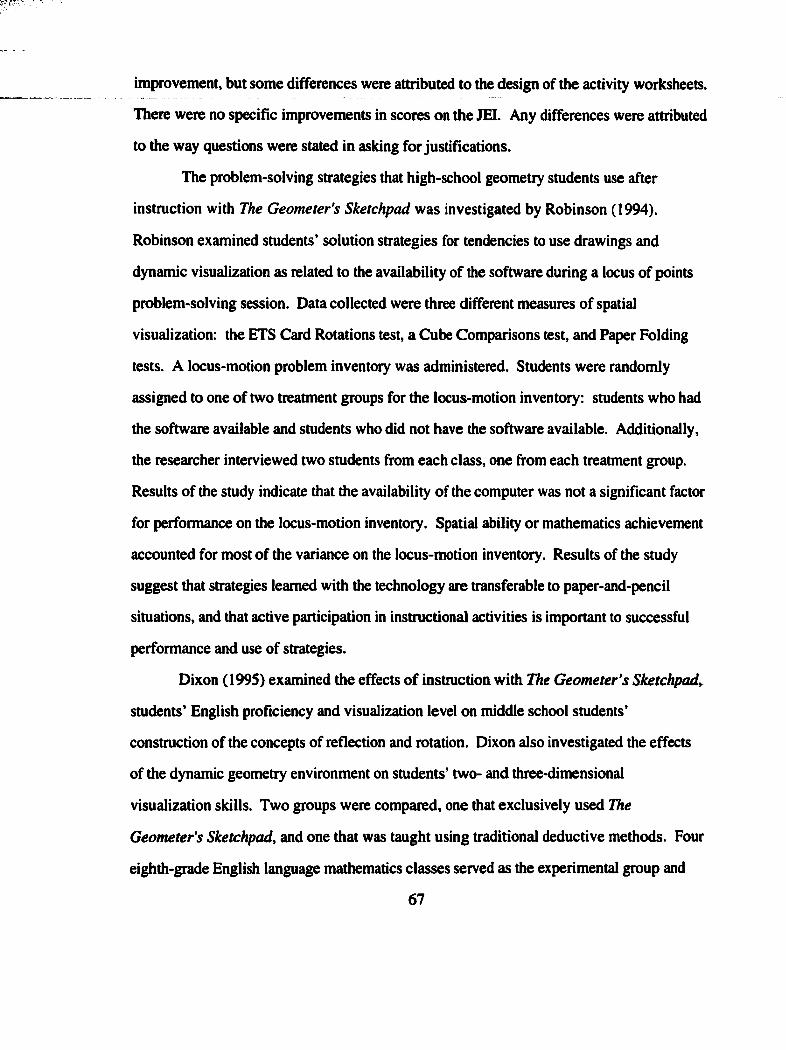
improvement, but some differences were attributed to the design of the activity worksheets.
There were no specific improvements in scores on the JEI. Any differences were attributed
to the way questions were stated in asking for justifications.
The problem-solving strategies that high-school geometry students use after
instruction with The Geometer's Sketchpad was investigated by Robinson (1994).
Robinson examined students’ solution strategies for tendencies to use drawings and
dynamic visualization as related to the availability of the software during a locus of points
problem-solving session. Data collected were three different measures of spatial
visualization; the ETS Card Rotations test, a Cube Comparisons test, and Paper Folding
tests. A locus-motion problem inventory was administered. Students were randomly
assigned to one of two treatment groups for the locus-motion inventory: students who had
the software available and students who did not have the software available. Additionally,
the researcher interviewed two students from each class, one from each treatment group.
Results of the study indicate that the availability of the computer was not a significant factor
for performance on the locus-motion inventory. Spatial ability or mathematics achievement
accounted for most of the variance on the locus-motion inventory. Results of the study
suggest that strategies learned with the technology are transferable to paper-and-pencil
situations, and that active participation in instructional activities is important to successful
performance and use of strategies.
Dixon (1995) examined the efiects of instruction with The Geometer’s Sketchpad^
students’ English proficiency and visualization level on middle school students’
construction of the concepts of reflection and rotation. Dixon also investigated the effects
of the dynamic geometry environment on students’ two- and three-dimensional
visualization skills. Two groups were compared, one that exclusively used The
Geometer's Sketchpad, and one that was taught using traditional deductive methods. Four
eighth-grade English language mathematics classes served as the experimental group and
67

five similar classes served as the control group. The researcher taught all of the treatment
classes while the control group classes were taught by other mathematics teachers at the
school. The Sketchpad group used lessons designed to allow students to discover
properties of reflections and rotations. Results of the study indicate that the students in the
experimental group significantly outperformed the control group on content measures of the
concepts of reflection and rotation as well as on measures of two-dimensional visualization.
No significant differences existed between the groups on measures of three-dimensional
visualization. There were no significant differences on any of the dependent variables
between limited English proficient students and students who are proficient in English.
The effects of using The Geometer's Sketchpad on high school students’
geometric knowledge, constructions, and conjectures were studied by Lester (1996).
Forty-seven students were the subjects of the study, with 20 students in the experimental
group and 27 in the control group. The experimental group used The Geometer’s
Sketchpad to explore topics related to circles. The control group used traditional methods
and tools to explore the same topics. Both groups were taught by the same teacher. The
duration of the study was 20 class days. Data sources were class observations, student
work (experimental group students saved their sketches on disks), teacher and researcher
meetings, student interviews, and a posttest. The posttest was given to the students
following instruction on the unit on circles and was scored on the three dependent
variables: geometric knowledge, geometric constructions, and geometric conjectures.
Results of the study indicate that difierences between the groups were not statistically
significant at the p < .05 level on the variables geometric knowledge and geometric
constructions. A significant difference did exist on the variable geometric conjectures, with
the experimental group outperforming the control group.
68
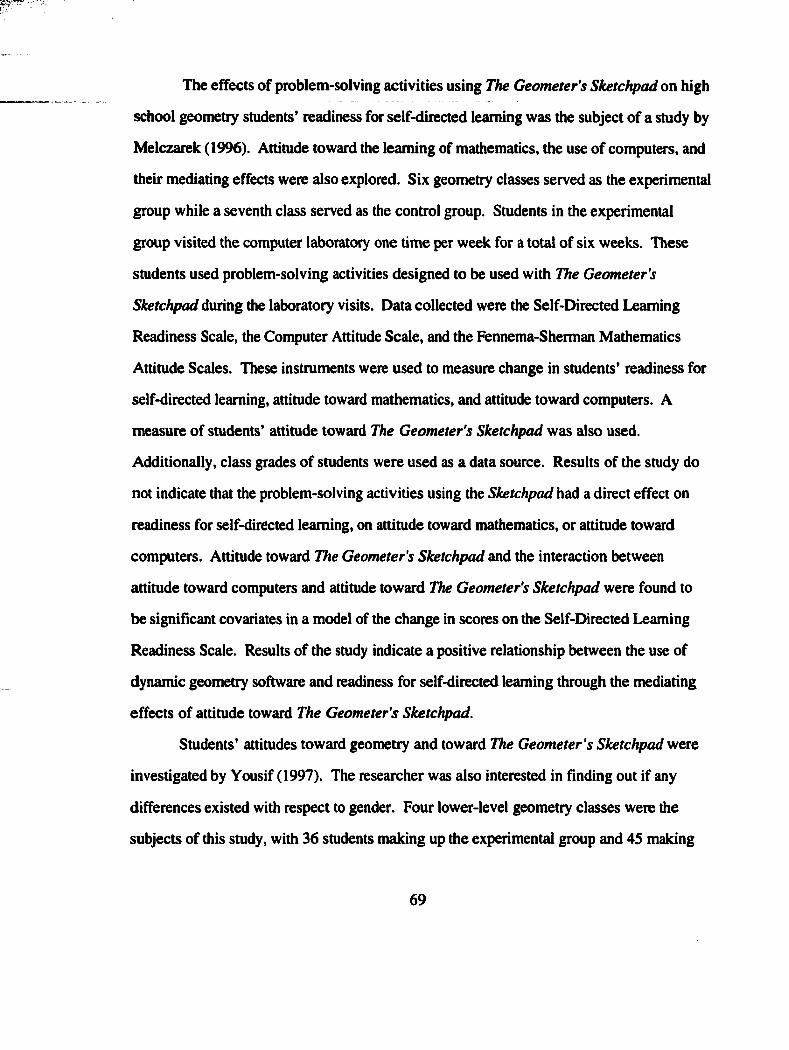
The effects of problem-solving activities using The Geometer's Sketchpad on high
school geometry students’ readiness for self-directed leaming was the subject of a study by
Melczarek (1996). Attitude toward the leaming of mathematics, the use of computers, and
their mediating effects were also explored. Six geometry classes served as the experimental
group while a seventh class served as the control group. Students in the experimental
group visited the computer laboratory one time per week for a total of six weeks. These
students used problem-solving activities designed to be used with The Geometer's
Sketchpad during the laboratory visits. Data collected were the Self-Directed Leaming
Readiness Scale, the Computer Attitude Scale, and the Fennema-Sherman Mathematics
Attitude Scales. These instmments were used to measure change in students’ readiness for
self-directed leaming, attitude toward mathematics, and attitude toward computers. A
measure of students’ attitude toward The Geometer's Sketchpad was also used.
Additionally, class grades of students were used as a data source. Results of the study do
not indicate that the problem-solving activities using the Sketchpad had a direct effect on
readiness for self-directed leaming, on attitude toward mathematics, or attitude toward
computers. Attitude toward The Geometer's Sketchpad and the interaction between
attitude toward computers and attitude toward The Geometer's Sketchpad were found to
be significant covariates in a model of the change in scores on the Self-Directed Leaming
Readiness Scale. Results of the study indicate a positive relationship between the use of
dynamic geometry software and readiness for self-directed leaming through the mediating
effects of attitude toward The Geometer's Sketchpad.
Students’ attitudes toward geometry and toward The Geometer's Sketchpad were
investigated by Yousif (1997). The researcher was also interested in fînding out if any
differences existed with respect to gender. Four lower-level geometry classes were the
subjects of this study, with 36 students making up the experimental group and 45 making
69
up the control group. Two different teachers participated in the study, each teaching one
class in the experimental group and one class in the control group. Topics studied by the
students during the time of the investigation were polygons, areas, the Pythagorean
Theorem, and ratios and proportions. Results of the study indicate that attitude scores
between the groups were significantly different on the pretest and the posttest, and there
was a significant difference between the gain in attitude scores between the two groups.
Results did not indicate any significant differences with respect to gender. Interview
techniques were used to determine students’ attitudes toward the software. The interview
results showed positive attitudes toward working with the software and a positive change
in students’ attitudes toward geometry. The investigator observed that students in the
experimental group seemed to enjoy the exploration activities more than students in the
control group.
Bell (1998) used The Geometer's Sketchpad to investigate the relationship of an
inquiry-based dynamic geometry software environment on students’ van Hiele levels,
achievement, basic geometry knowledge, conjecturing ability, and dispositions toward
mathematics and technology. Students in the experimental group (40 students) used The
Geometer's Sketchpad to formulate and test conjectures in a laboratory setting for an
average of two classes per week. Laboratory activities were mostly written by the
researcher, using a guided inquiry approach (students had to complete a construction, take
measurements, manipulate the construction, and formulate conjectures). Students in the
control groups (55 students) were taught using traditional deductive methods and then used
The Geometer's Sketchpad to reinforce the ideas. Control group students were in the
computer lab at most once per week. Data collected were scores on a van Hiele level test
and an Entering Geometry test (also used by Frerking, as described earlier, and in the
current study), scores on a county semester geometry examination, and Likert-type surveys
70
to measure dispositions toward mathematics and technology. Results of the study indicate
a signifîcant difference between the groups in the increase on students’ van Hiele level and
on the gain in scores on the Entering Geometry test. Both differences favored the
experimental group. There were no signifîcant differences between the groups on
achievement on the county semester geometry examination. There was a significant
relationship between pre- and post- van Hiele levels and scores on the county achievement
test and semester grades. Laboratory activities that appeared to be the most effective for the
generation of students’ conjectures were those that were step-by-step. Activities that had
leading questions and provided space for student responses tended to be more successful
than open-ended activities. Qualitative analysis did not suggest improvement in students’
abilities to write conjectures. Signifîcant differences were reported in changes in students’
dispositions toward technology and toward mathematics. The investigator called for more
research involving treatment groups using an inductive conjecturing approach to determine
if time spent improves conjecturing ability.
Several research studies have used C(ü)ri as the medium through which to look at
student leaming in geometry. Jones (1998) reports on the mediation of leaming in a
dynamic geometry environment. Jones discusses choices that the software designers had
to make while designing Cabri. One of the things he mentions is the default cursor
operation, which is to drag, rather than create, a point. Jones comments that this is not a
critique of Cabri, but that certain decisions must be made, and they do, in fact, mediate
student leaming. Jones reports on results from a longitudinal study, and states that certain
outcomes are similar to those that have been reported on student leaming using Logo.
Jones discusses 1) students’ needs to invent terms, 2) students’ perspectives of certain
aspects of the dynamic environment, 3) the relationship of earlier successes in constmcting
fîgures to new constructions, 4) the procedural eHect of dynamic geometry software on
71
student leaming, 5) students’ lack of appreciation of the drag mode’s capability to focus on
invariance, and 6) challenges that teachers face in providing input that serve the students’
communicative needs. In another report on research, Jones (1997) commented on the
importance of the role of the teacher in helping students to complete certain constructions
using Cabri. Jones observed that a pair of twelve-year-old students successfully completed
a construction task, but needed input from the researcher.
Arzarello, Micheletti, Olivero, Robutti, Paola, and Gallino (1998) conducted
research with 15-year-old students to analyze the type of dragging that students do when
using Cabri to investigate certain topics. The authors distinguish between wandering
dragging (dragging randomly to discover something interesting) and lieu muet dragging (a
locus is built by dragging a draggable point, in a way which preserves some regularity of
certain fîgures). Students constructed a quadrilateral and each of its angle bisectors. If the
original quadrilateral is called ABCD, then a new quadrilateral, HKLM, is formed by the
intersections of consecutive angle bisectors. This is illustrated in Figure 2.17.
72
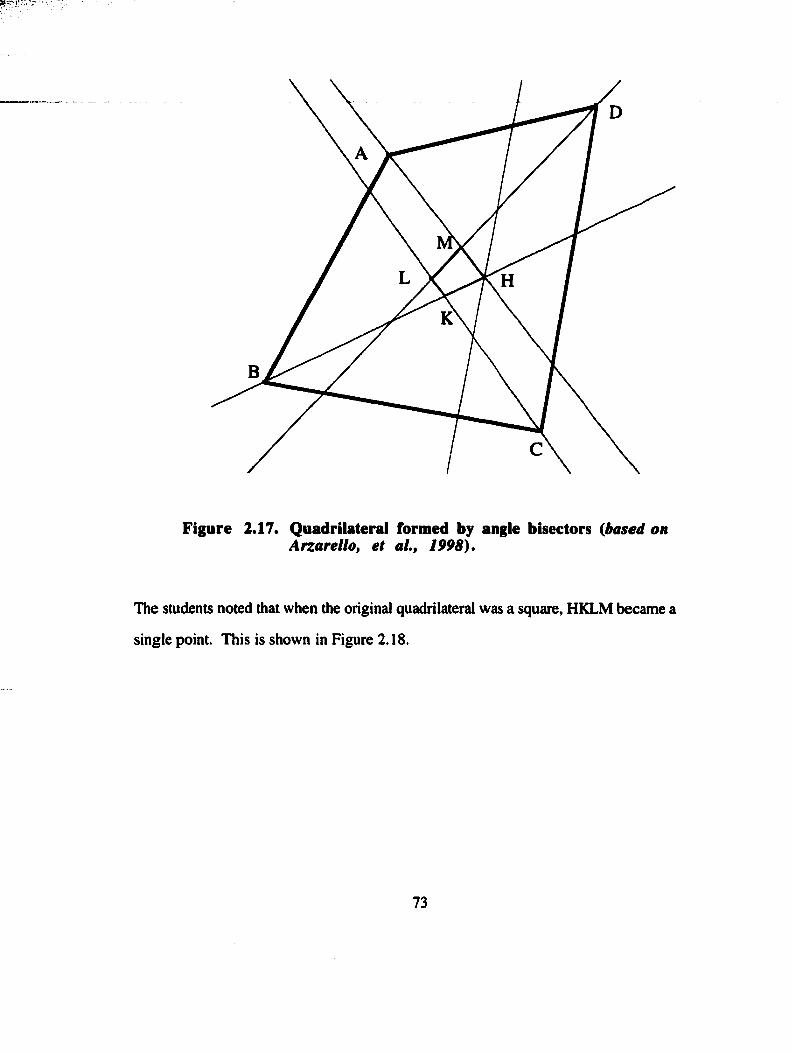
Figure 2.17. Quadrilateral formed by angle bisectors {based on Arzarello, et al., 1998).
The students noted that when the original quadrilateral was a square, HKLM became a
single point. This is shown in Figure 2.18.
73
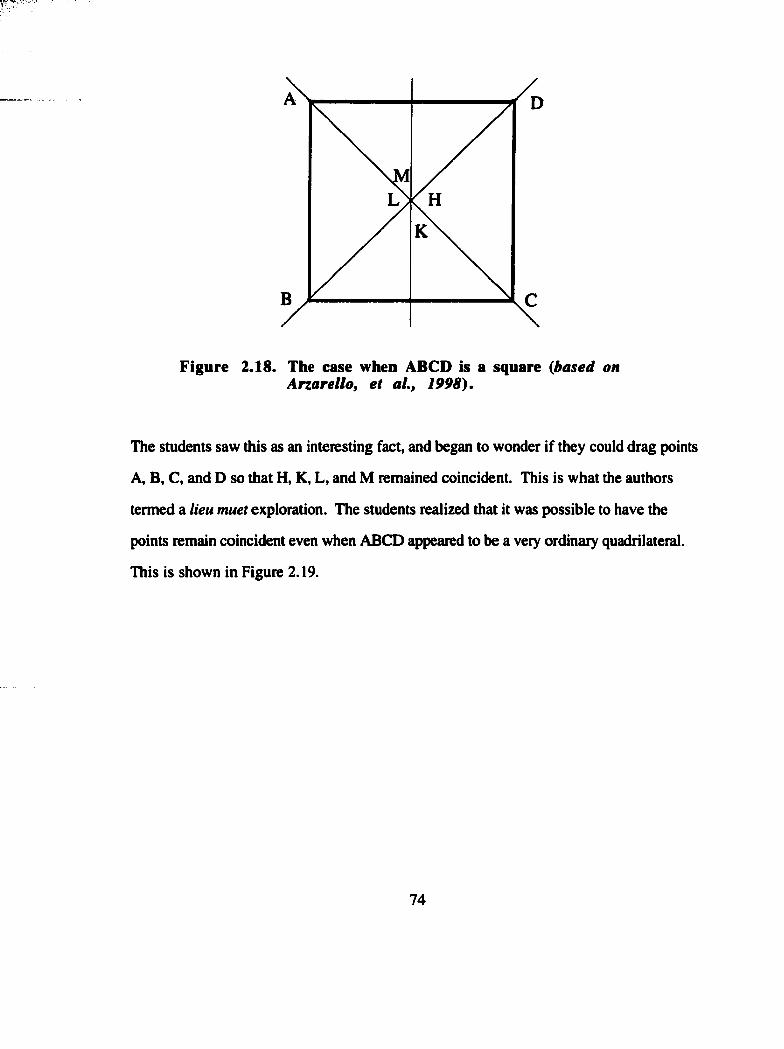
Figure 2.18. The case when ABCD is a square {based on Arzarello, et al., 1998).
The students saw this as an interesting fact, and began to wonder if they could drag points
A, B, C, and D so that H, K, L, and M remained coincident. This is what the authors
termed a lieu muet exploration. The students realized that it was possible to have the
points remain coincident even when ABCD appeared to be a very ordinary quadrilateral.
This is shown in Figure 2.19.
74
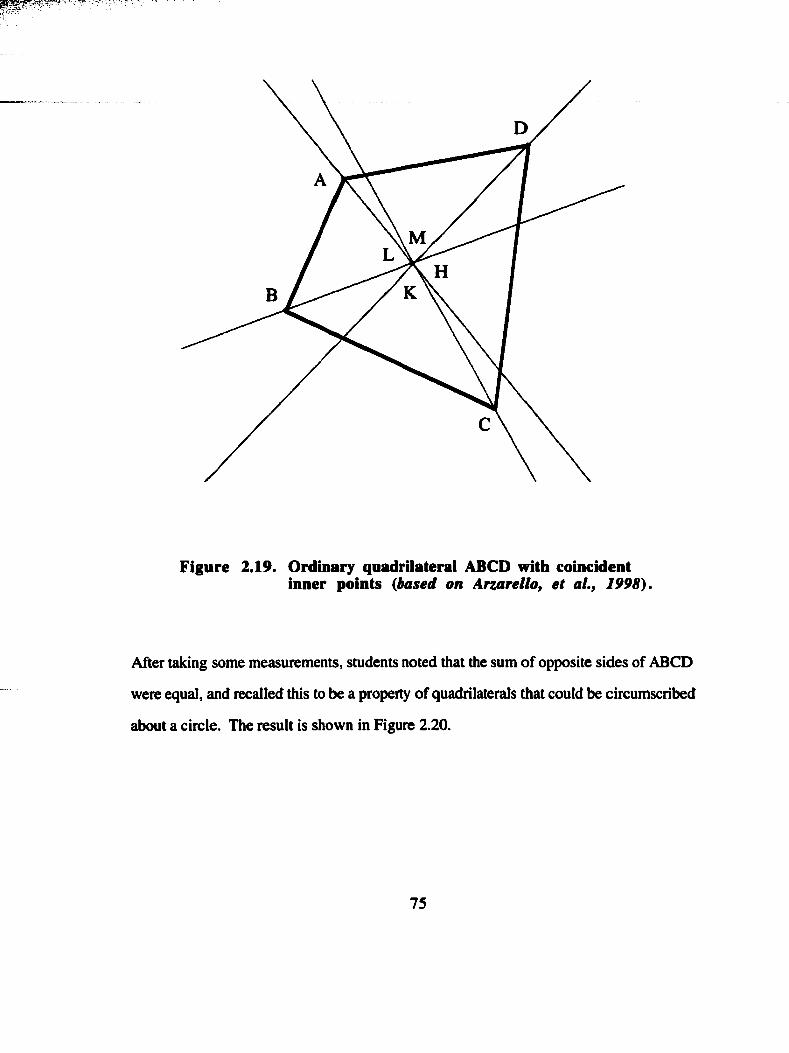
Figure 2.19. Ordinary quadrilateral ABCD with coincidentinner points {based on Arzarello, et al., 1998).
After taking some measurements, students noted that the sum of opposite sides of ABCD
were equal, and recalled this to be a property of quadrilaterals that could be circumscribed
about a circle. The result is shown in Figure 2.20.
75
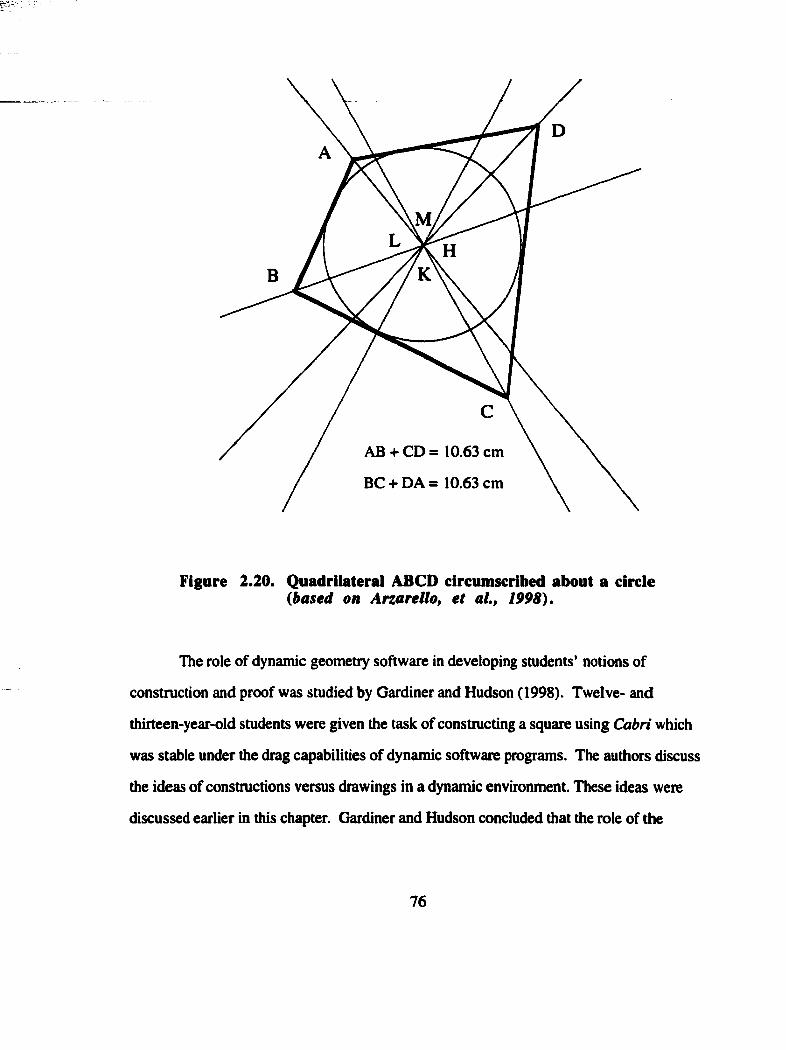
AB + CD = 10.63 cm
BC + DA = 10.63 cm
Figure 2.20. Quadrilateral ABCD circumscribed about a circle (based on Arzarello, et al., 1998).
The role of dynamic geometry software in developing students’ notions of
construction and proof was studied by Gardiner and Hudson (1998). Twelve- and
thirteen-year-old students were given the task of constructing a square using Cabri which
was stable under the drag capabilities of dynamic software programs. The authors discuss
the ideas of constructions versus drawings in a dynamic environment. These ideas were
discussed earlier in this chapter. Gardiner and Hudson concluded that the role of the
76
teacher is important in assisting students in moving from common conceptions of geometric
fîgures toward more scientific conceptions.
Vincent (1998) reports on research with 11~ and 12-year-old students with regard to
the effect of dynamic geometry software and changes in students’ van Hiele levels.
Students completed lessons which were structured Cabri worksheets. Vincent reports that
all students in the study increased their van Hiele levels for some or all of the concepts
studied. Vincent and McCrae (1999) describe two of the participants in the previous study
in more depth and recommend that more research is needed to explore the impact of
dynamic geometry software on development of higher levels of geometric understanding.
Vincent and McCrae discuss the difficulties students have with constructing particular drag-
resistant shapes such as rectangles and equilateral triangles as their constructions seem to be
based on visual appearance of the shapes.
Cabri software is found as an application on the Texas Instruments TI-92
calculator. The current study and a study by Round (1998) both used TI-92 calculators,
but in different circumstances. While the entire experimental group in the current study
used individual TI-92 calculators on a regular basis, the study by Round used one TI-92
for demonstration purposes after students had some individual experience with the
calculators. Round investigated whether students in a class which used one TI-92 for
whole-class demonstration could overcome obstacles to the use of diagrams, become
proficient in conjecturing and proof, and whether any differences existed by gender. The
study also investigated student attitudes with regards to several factors associated with the
leaming and doing of mathematics. The study was conducted in two high school geometry
classes taught by the researcher. Students used individual TI-92 calculators for one week
prior to the calculator being used for demonstration purposes only for the rest of the
course. Data collected were attitude surveys, homework assignments, quizzes, tests, and
worksheets completed by students, and student interviews. Additionally, student groups
77
made presentations on theorems related to areas of polygons near the end of the course.
Round assessed the initial position of the students regarding the use of diagrams and
conjecturing by means of a worksheet, homework assignment, and quiz. Results of the
study indicate that some students made progress overcoming the obstacles to the use of
diagrams while others continued to exhibit difficulty. The student group presentations
demonstrated that a number of students were profîcient in constructing and manipulating
diagrams even though they had very limited personal experience with the TI-92. Males
scored significantly higher on the Pythagorean Theorem worksheet, indicating that the
treatment may have had a larger positive impact on males than on Females with regard to
overcoming the obstacles associated with the use of diagrams in geometry. Females scored
significantly higher than males on the worksheet on circles given toward the end of the
course. For this topic, the calculator may have had a greater positive Impact on females
than on males. Round discusses how a number of students still thought that a number of
true examples constituted a proof even toward the end of the year. Proof writing abilities
were low both at the beginning and the end of the study, a result that the researcher
indicated may be associated with students’ attitudes toward proof problems. Round stated
that hands-on experience with the TI-92 seemed to help students to gain a better
understanding of conjecturing. Students fared better on conjecturing problems late in the
course when they were asked to make conjectures about specific parts of a diagram.
While many articles and studies have been discussed on the topic of generalization,
it is also important to think about situations in which students generalize, when in fact, they
should not. One author termed this idea “over-generalization” (Feinstein, 1979). Feinstein
points out that for students to be able to discriminate effectively when generalizing, several
nonexamples should be included in their experiences. Taback (1996) warns against
overgeneralizing, claiming that students need ample opportunity to discover that there exist
78
situations that seem as if they will adhere to a general rule, but in fact, after a few instances,
they deviate from the rule. Taback gives a numerical example and one from geometry. The
geometry example involves the maximum number of regions into which a circle is divided
by drawing all possible chords with n points on the circle. After examining some data from
the early cases, students are led to believe that the general rule for the maximum number of
regions is 2” “ where n is the number of points on the circle. This rule works for two,
three, four, and fîve points on the circle. The corresponding number of regions is two,
four, eight, and sixteen. The rule, however, does not work for six points, where the
corresponding number of regions is 3 1 instead of the predicted 32.
Zbiek (1996) discusses a problem in which students may be led to make certain
generalizations when, in fact, they should not. This problem is discussed in a dynamic
geometry software setting. Dynamic geometry software packages have the capability of
controlling the number of decimal places that the user sees when taking measurements.
Zbiek presents a problem in which successive midpoints of a pentagon are connected to
form a new pentagon. The process is repeated to form a second pentagon, which lies in the
interior of the newly created pentagon. A dynamic geometry sketch of the problem is
shown in Figure 2.21. Students are asked to take measurements regarding perimeter and
area and to make conjectures. Students who observe the data in Figure 2.21 may be led to
make certain conjectures that, in fact, are not true. The data in Figure 2.21 suggest that
certain perimeter and area ratios are equal. All measurements and computations in Figure
2.21 are rounded to one decimal place, using a feature of the software that allows the user
to control the number of decimal places shown in the display. If the same measurements
are displayed to two decimal place precision, as shown in Figure 2.22, the reader will see
that although the perimeter and area ratios are approximately equal, they are, in fact, not
equal to each other.
79
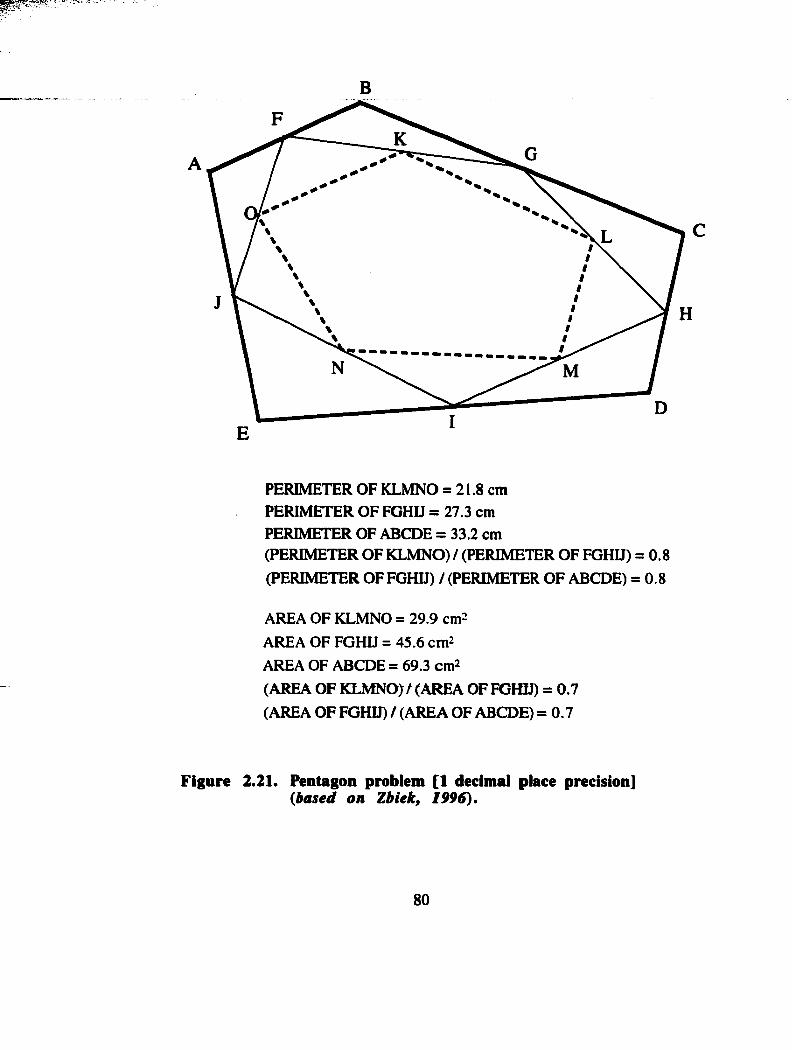
B
A
PERIMETER OF KLMNO = 21.8 cmPERIMETER OF FGHU = 27.3 cmPERIMETER OF ABODE = 33.2 cm(PERIMETER OF KLMNO) / (PERIMETER OF FGHU) = 0.8(PERIMETER OF FGHU) / (PERIMETER OF ABODE) = 0.8
AREA OF KLMNO = 29.9 cm^AREA OF FGHU = 45.6 cm^AREA OF ABODE = 69.3 cm2(AREA OF KLMNO)/ (AREA OF FGHU) = 0.7(AREA OF FGHU) / (AREA OF ABODE) = 0.7
Figure 2.21. Pentagon problem [1 decimal place precision] {based on Zbiek, 1996).
80
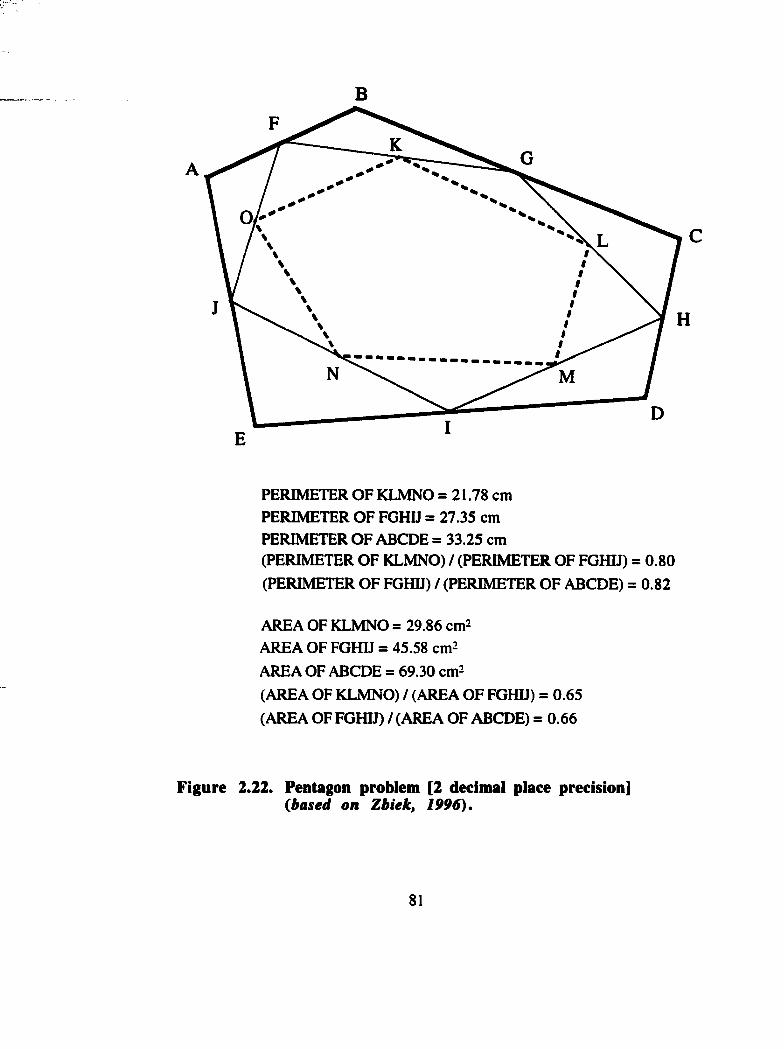
B
PERIMETER OF KLMNO =21.78 cmPERIMETER OF FGHU = 27.35 cmPERIMETER OF ABODE = 33.25 cm(PERIMETER OF KLMNO) / (PERIMETER OF FGHU) = 0.80(PERIMETER OF FGHU) / (PERIMETER OF ABODE) = 0.82
AREA OF KLMNO = 29.86 cm^AREA OF FGHU = 45.58 cm^AREA OF ABODE = 69.30 cm^(AREA OF KLMNO) / (AREA OF FGHU) = 0.65 (AREA OF FGHU) / (AREA OF ABODE) = 0.66
Figure 2.22. Pentagon problem [2 decimal place precision] (based on Zbiek, 1996).
81
Examples such as this clearly make a case for being careful with certain issues in a
dynamic geometry environment so that students do not make generalizations in cases where
they should not. Laborde (1993) stated that computer use could easily lead to the “triumph
of inductivism.” Problems such as these seem to support her position.
SIGNIFICANCE OF THE STUDY
While several dissertation studies have examined the role of geometry software in
conjecturing or generalizing in geometry (Yerushalmy, 1986; Elchuck, 1992; Frerking,
1994; Lester, 1996; Bell, 1998; Round 1998), the present study differs from each of the
listed studies in important ways. While Yerushalmy compared a software class to a non-
software class in the context of induction and generalization, the present study utilized a
different type of geometry software (dynamic vs. static representation) and utilized a
different type of data source (task-based interviews). Elchuck studied conjecturing ability
with varied levels of the software treatment, but did not have a control group in which the
software was not used. Frerking examined conjecturing with three varying levels of
software treatment, but used no non-software group for comparison purposes. Lester
researched conjecturing in a dynamic versus traditional atmosphere, but the present study
differs in length, type of software used, and in the type of data collected (task-based
interviews). Bell studied conjecturing with two different levels of software treatment, but
both groups used dynamic software. Round examined conjecturing in a dynamic
environment, and used TI-92 calculators, like the present study, but conducted research in
a single classroom. Additionally, the present study differs from Round’s in the type of
data collected (task-based interviews).
It is critical that high school students develop their abilities to make generalizations.
Although students have been generalizing for many years in geometry without the aid of
geometry software programs, these tools give us an opportunity to look anew at this
82
important topic. Studies such as the present one can only help to broaden what is known
about student learning in geometry. If there exists any possibility that dynamic geometry
software programs help students see geometry in a different way and positively impact their
abilities to make generalizations, then studies such as the present one are important.
The mathematics learning theory of Dienes provides a theoretical framework for the
study. Dynamic geometry software embodies each of Dienes’ principles (the Dynamic
Principle, the Constructivity Principle, the Mathematical Variability Principle, and the
Perceptual Variability or Multiple Embodiment Principle) in unique and important ways as
discussed earlier. Student learning via Dienes’ mathematics learning theory was examined
through the lens of dynamic geometry software. In particular, students’ abilities to make
generalizations in geometry were studied through the use of a particular dynamic geometry
software program, Cabri Geometry II.
83
CHAPTER 3
METHODOLOGY
This study investigated the differences in students’ abilities to make generalizations
in geometry when immersed in a dynamic geometry software environment versus a
traditional environment. The study was conducted from September 2000 to March 2001,
and considered both quantitative and qualitative data. Two groups, one that used dynamic
geometry software on a regular basis and one that used traditional methods, were compared
to determine if there were differences in their abilities to make generalizations in geometry.
The quantitative part of the study used scores on an entering geometry test, a generalization
pre- and posttest, and task-based interviews with a subset of students to compare the
groups at the beginning of the study and to look for differences in students’ abilities to
generalize. The qualitative part of the study examined differences between the classrooms
of the experimental and control groups and described some comments made by students in
the interviews in greater detail. Lesson vignettes of the experimental and control group
classrooms are given to familiarize the reader with differences between the two classrooms.
S U E
The study took place at a small high school in a large urban district in central Ohio.
The student body consists of approximately six hundred students in grades nine through
twelve. The school is one of three alternative high schools in the district. The student
84

- r
body is completely selected by a lottery. The special focus of the school is two-fold; a
community internship program and a strong college preparatory focus. The internship
program gives students the opportunity to experience learning in a very different way for
three years. Students participate in an internship experience one day a week (for
approximately three-fourths of the school year) during their sophomore, junior, and senior
years. The internship program gives students from this school the opportunity to have a
very different high school experience than their peers in other schools. Students work in a
variety of settings: schools, hospitals, doctors’ offices, businesses, law offices,
government offices, and other types of settings.
SU B JEC TS
The subjects were enrolled in three Geometry classes during the first semester of
the 2(X)0-2(X)1 school year. As the school operates on a semester block schedule, the entire
Geometry course is completed over a period of one semester. Class periods are 80 minutes
in length and classes meet four days per week for the majority of the semester, due to the
internship program described earlier. Most of the subjects were in the 9th or 10th grade,
with a few subjects in the 11th and 12th grades. Almost all of the subjects were taking
Geometry for the fîrst time.
Two Geometry sections were taught by the researcher and one section was taught
by another mathematics teacher. The sections taught by the researcher will hereafter be
referred to as the experimental group. The experimental group had a total of 67 students.
The section taught by the other mathematics teacher will be hereafter referred to as the
control group. The control group had a total of 26 students. Although both the
experimental group and the control group followed the district-approved course of study,
the experimental group extensively used Cabri for the purpose of exploring geometric
ideas. The control group followed a traditional approach to exploring the ideas of
85
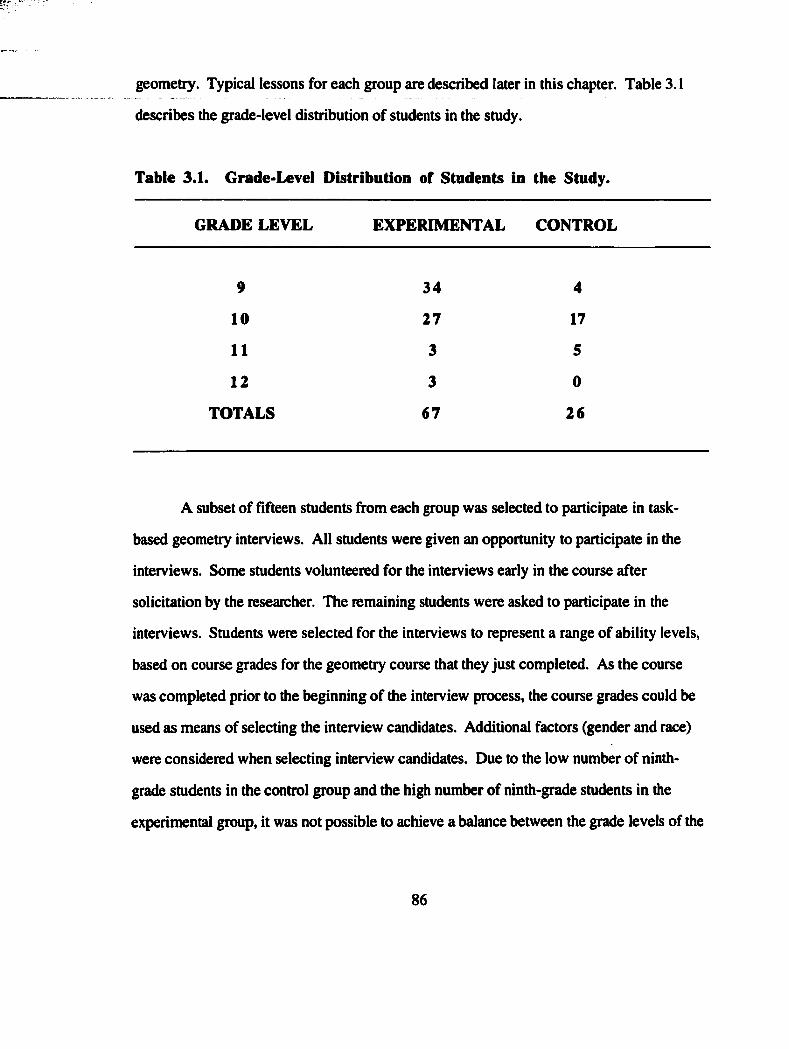
geometry. Typical lessons for each group are described later in this chapter. Table 3.1
describes the grade-level distribution of students in the study.
Table 3.1. Grade-Level Distribution of Students in the Study.
GRADE LEVEL EXPERIMENTAL CONTROL
9 34 4
10 27 17
11 3 5
12 3 0
TOTALS 67 26
A subset of fifteen students from each group was selected to participate in task-
based geometry interviews. All students were given an opportunity to participate in the
interviews. Some students volunteered for the interviews early in the course after
solicitation by the researcher. The remaining students were asked to participate in the
interviews. Students were selected for the interviews to represent a range of ability levels,
based on course grades for the geometry course that they just completed. As the course
was completed prior to the beginning of the interview process, the course grades could be
used as means of selecting the interview candidates. Additional factors (gender and race)
were considered when selecting interview candidates. Due to the low number of ninth-
grade students in the control group and the high number of ninth-grade students in the
experimental group, it was not possible to achieve a balance between the grade levels of the
86
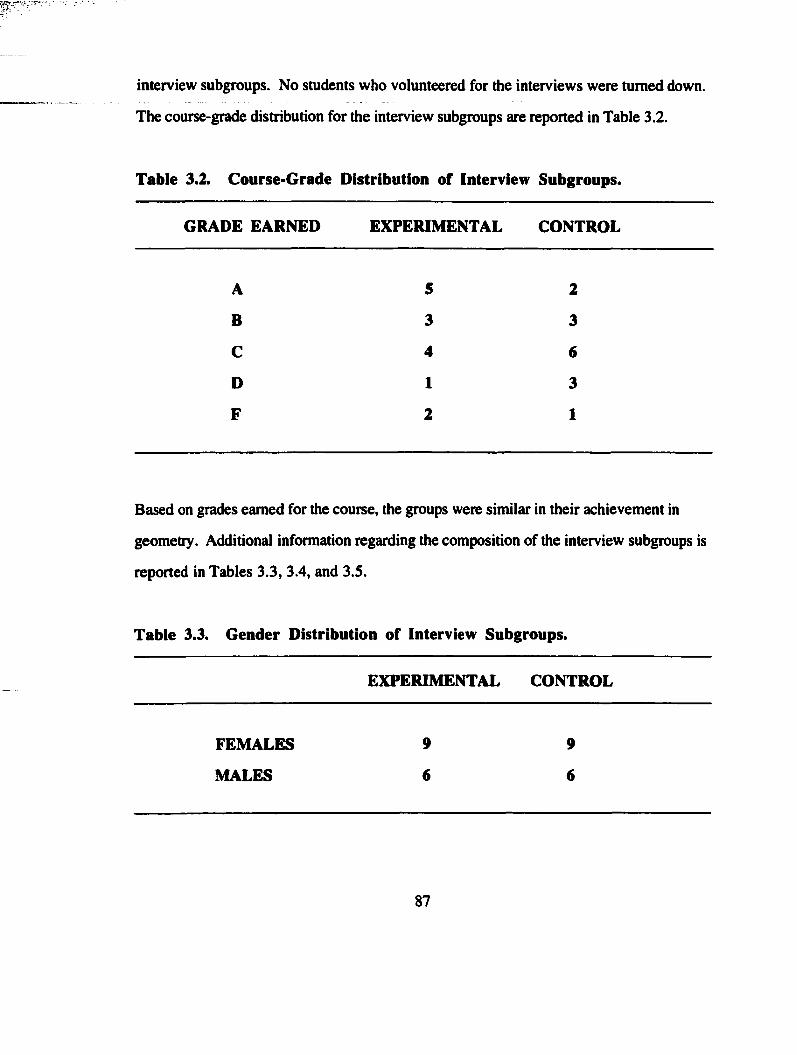
interview subgroups. No students who volunteered for the interviews were turned down.
The course-grade distribution for the interview subgroups are reported in Table 3.2.
T able 3.2. C ourse-G rade D istribution of Interview Subgroups.
GRADE EARNED EXPERIMENTAL CONTROL
A 5 2
B 3 3
C 4 6
D 1 3
F 2 1
Based on grades earned for the course, the groups were similar in their achievement in
geometry. Additional information regarding the composition of the interview subgroups is
reported in Tables 3.3, 3.4, and 3.5.
T able 3.3. G ender D istribution of Interview Subgroups.
EXPERIMENTAL CONTROL
FEMALES 9 9
MALES 6 6
87
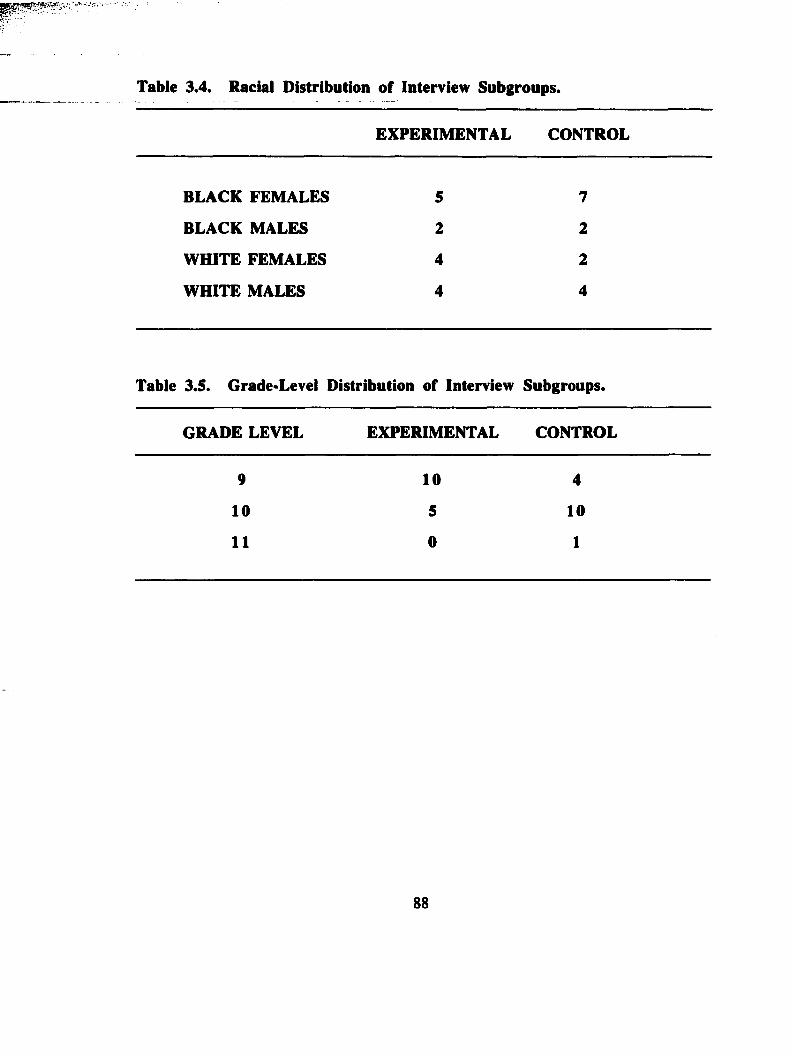
Table 3.4. Racial D istribution o f Interview Subgroups.
EXPERIM ENTAL CONTROL
BLACK FEMALES 5 7
BLACK MALES 2 2
W HITE FEMALES 4 2
W HITE MALES 4 4
Table 3.5. Grade-Level D istribution of Interview Subgroups.
GRADE LEVEL EXPERIMENTAL CONTROL
9 10 4
10 5 10
11 0 1
88
INSTRUMENTATION
Entering Geometry Student Test. In order to compare the experimental group to the
control group at the beginning of the course, the Entering Geometry Student Test was
administered to both groups. The test is a twenty-item, multiple-choice test containing
some geometry content that students may have been introduced to while in middle school.
Basic geometry content such as linear pairs of angles, parallel and perpendicular lines, area
and perimeter, and circles are among the topics tested. The test was scored on a 100-point
scale, with each correct answer worth five points. The Entering Geometry Student Test
was originally developed for use by the CDASSG Project (1980) at the University of
Chicago (2[alman Usiskin, Director). The complete Entering Geometry Student Test is
found in Appendix A.
Generalization Tests. Two researcher-developed generalization tests that were
parallel in format (Geometry Challenge—Form A and Geometry Challenge—Form B) were
given to both groups to compare the generalization abilities of the groups at the beginning
and at the end of the study. Complete versions of both of the generalization tests can be
found in Appendix B. Half of the students in each group were given Form A at the
beginning of the course while the remaining students in each group were given Form B.
Students that took Form A (Generalization Pretest) at the beginning of the course took
Form B (Generalization Posttest) at the end of the course and students that took Form B
(Generalization Pretest) at the beginning of the course took.Form A (Generalization
Posttest) at the end of the course. Students were selected to take a particular form based on
their assigned seat. Alternating rows of students were given each form of the test.
The tests contained five questions that required extending tables and using inductive
reasoning to generalize to the nth term in a sequence. Some of the questions involved
problem situations such as the well-known handshake problem, while others had geometric
figures from which data were to be collected by the student in order to extend the
89
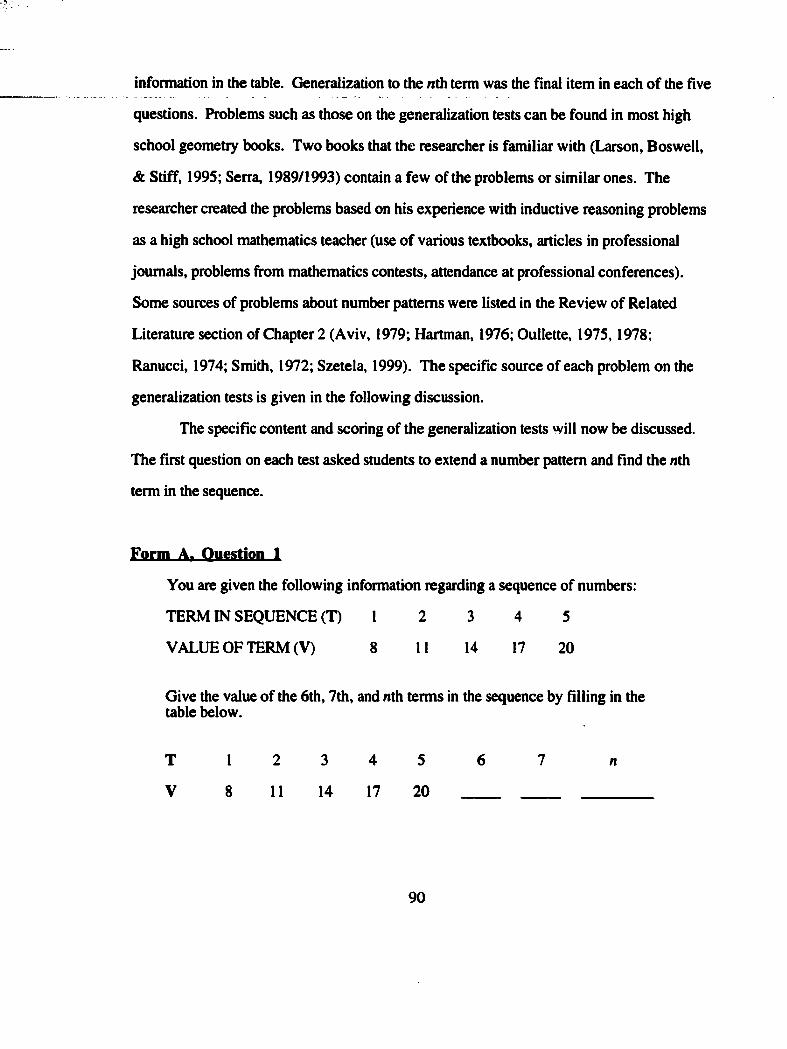
information in the table. Generalization to the nth term was the Anal item in each of the five
questions. Problems such as those on the generalization tests can be found in most high
school geometry books. Two books that the researcher is familiar with (Larson, Boswell,
& Stiff, 1995; Serra, 1989/1993) contain a few of the problems or similar ones. The
researcher created the problems based on his experience with inductive reasoning problems
as a high school mathematics teacher (use of various textbooks, articles in professional
joumals, problems from mathematics contests, attendance at professional conferences).
Some sources of problems about number patterns were listed in the Review of Related
Literature section of Chapter 2 (Aviv, 1979; Hartman, 1976; Oullette, 1975,1978;
Ranucci, 1974; Smith, 1972; Szetela, 1999). The specific source of each problem on the
generalization tests is given in the following discussion.
The specific content and scoring of the generalization tests will now be discussed.
The first question on each test asked students to extend a number pattern and find the nth
term in the sequence.
Form A. Question 1
You are given the following information regarding a sequence of numbers:
TERM IN SEQUENCE (T) 1 2 3 4 5
VALUE OF TERM (V) 8 11 14 17 20
Give the value of the 6th, 7th, and nth terms in the sequence by filling in the table below.
T 1 2 3 4 5
V 8 11 14 17 20
90
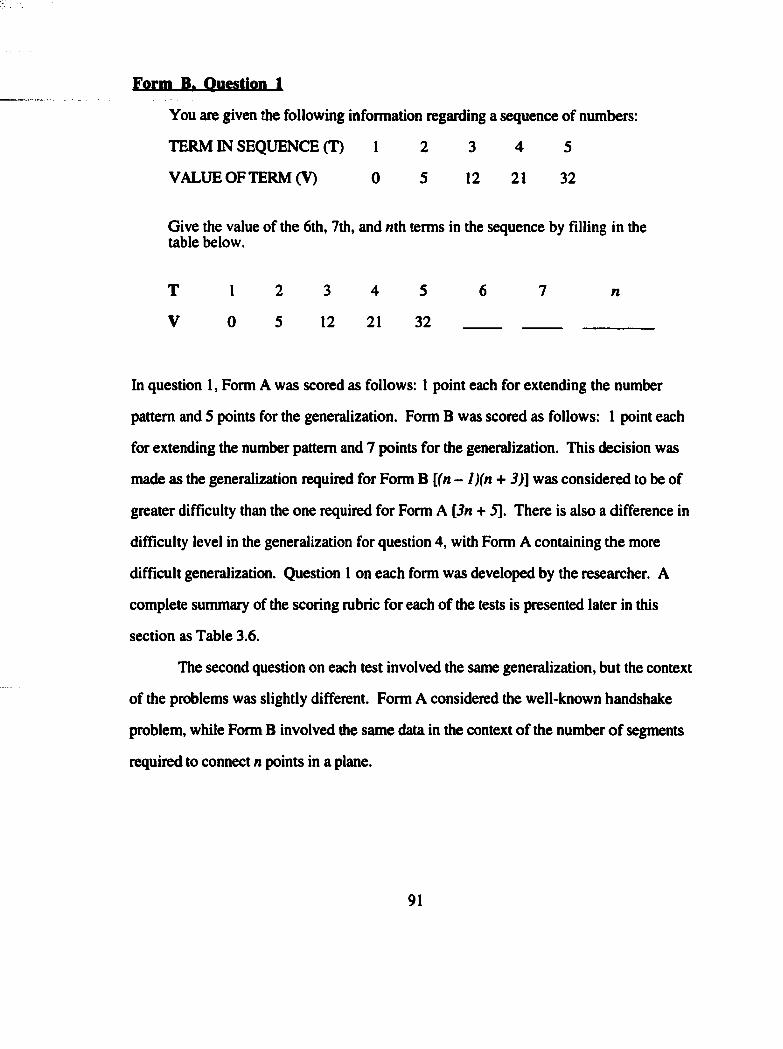
Form B. Question 1
You are given the following information regarding a sequence of numbers;
TERM IN SEQUENCE (T) 1 2 3 4 5
VALUE OF TERM (V) 0 5 12 21 32
Give the value of the 6th, 7th, and nth terms in the sequence by filling in the table below.
T 1 2 3 4 5 6 7 n
V 0 5 12 21 32 _____ _____ _____
In question 1, Form A was scored as follows: 1 point each for extending the number
pattern and 5 points for the generalization. Form B was scored as follows: 1 point each
for extending the number pattern and 7 points for the generalization. This decision was
made as the generalization required for Form B [fn - /Jfn + 3)] was considered to be of
greater difficulty than the one required for Form A [3n + 5]. There is also a difference in
difficulty level in the generalization for question 4, with Form A containing the more
difficult generalization. Question 1 on each form was developed by the researcher. A
complete summary of the scoring rubric for each of the tests is presented later in this
section as Table 3.6.
The second question on each test involved the same generalization, but the context
of the problems was slightly different. Form A considered the well-known handshake
problem, while Form B involved the same data in the context of the number of segments
required to connect n points in a plane.
91
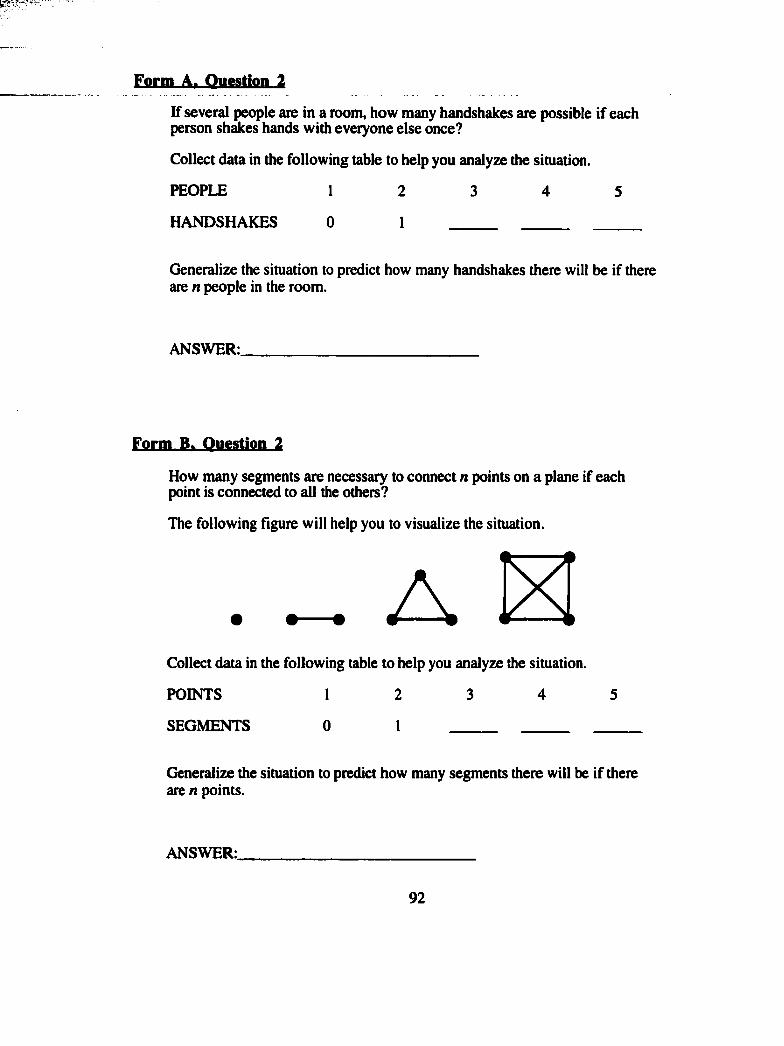
Effrm A. Qwtstfon 2If several people ate in a room, how many handshakes are possible if each person shakes hands with everyone else once?
Collect data in the following table to help you analyze the situation.
PEOPLE 1 2 3 4 5
HANDSHAKES 0 1_____ ______ ______ ______
Generalize the situation to predict how many handshakes there will be if there are n people in the room.
ANSWER:
Form B. Question 2
How many segments are necessary to connect n points on a plane if each point is connected to all the others?
The following figure will help you to visualize the situation.
Collect data in the following table to help you analyze the situation.
POINTS 1 2 3 4 5
SEGMENTS 0 1 ______ ______ ___
Generalize the situation to predict how many segments there will be if there are n points.
ANSWER:_________________________
92
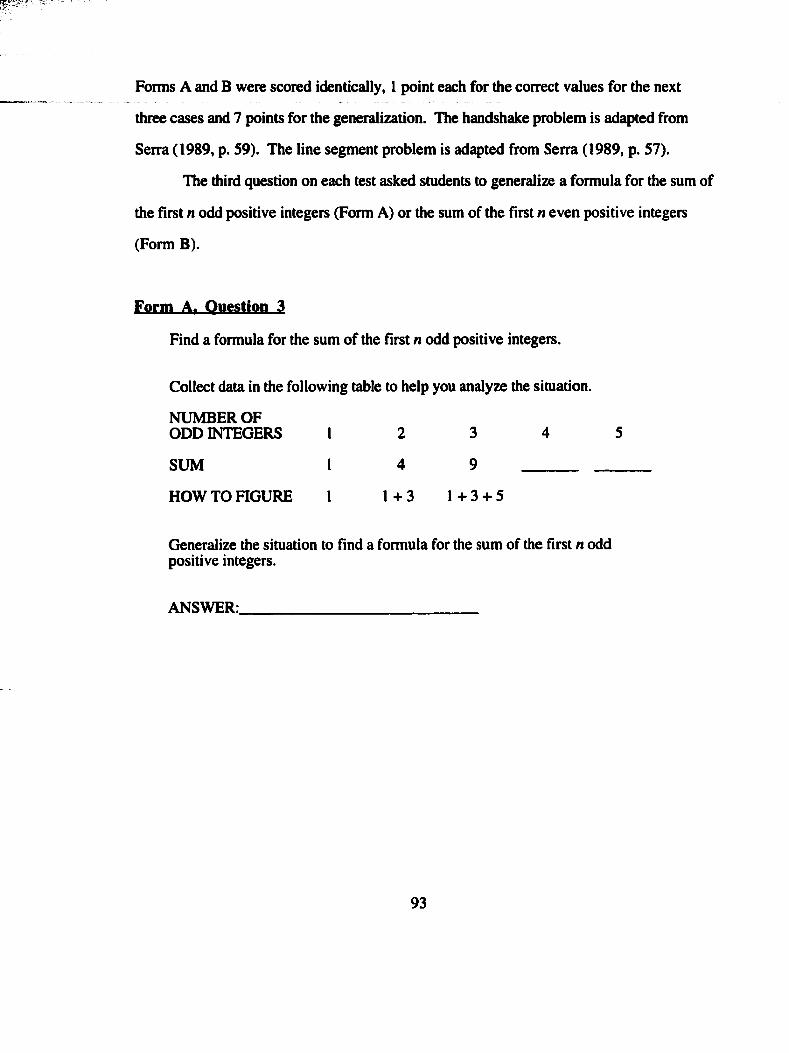
Forms A and B were scored identically, I point each for the correct values for the next
three cases and 7 points for the generalization. The handshake problem is adapted from
Serra (1989, p. 59). The line segment problem is adapted from Serra (1989, p. 57).
The third question on each test asked students to generalize a formula for the sum of
the fîrst n odd positive integers (Form A) or the sum of the first n even positive integers
(Form B).
Form A. Question 3
Find a formula for the sum of the fîrst n odd positive integers.
Collect data in the following table to help you analyze the situation.
NUMBER OFODD INTEGERS 1 2 3 4 5
SUM 1 4 9 _______ _______
HOW TO FIGURE 1 1 + 3 1 + 3 + 5
Generalize the situation to find a formula for the sum of the first n odd positive integers.
ANSWER:_______________________________
93
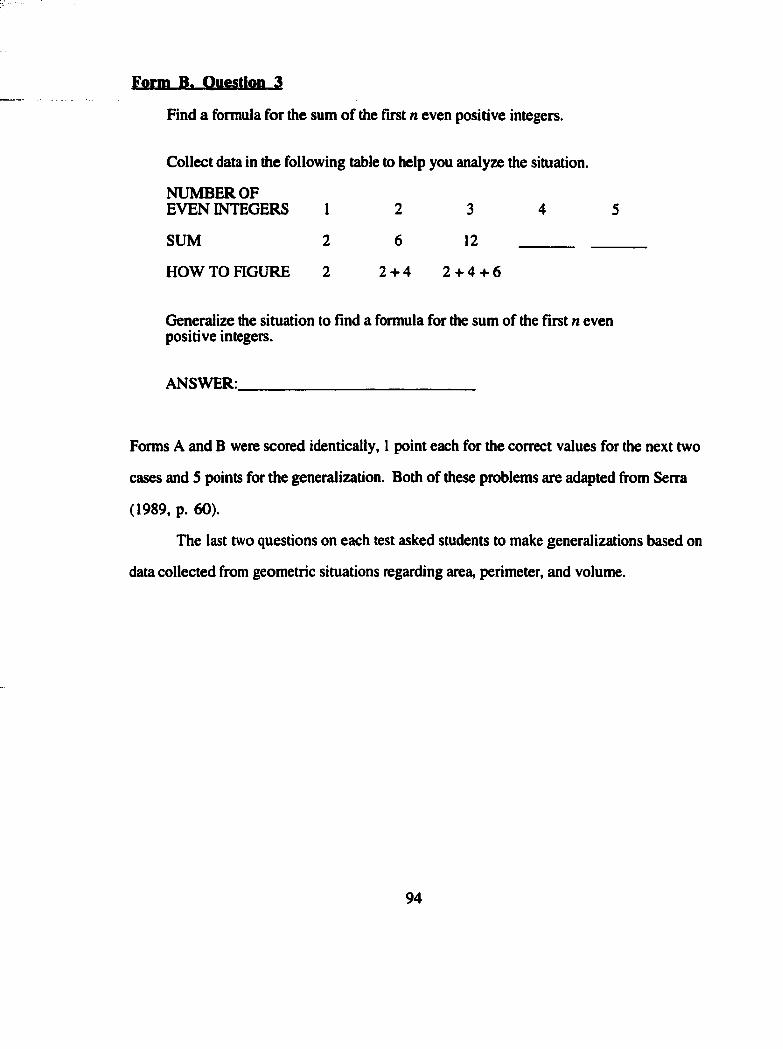
Form P« Oufsdon 3
Find a formula for the sum of the fîrst n even positive integers.
Collect data in the following table to help you analyze the situation.
NUMBER OFEVEN INTEGERS 1 2 3 4 5
SUM 2 6 12 _______ ____
HOW TO HGURE 2 2 + 4 2 + 4 + 6
Generalize the situation to find a formula for the sum of the first n even positive integers.
ANSWER:_______________________________
Forms A and B were scored identically, 1 point each for the correct values for the next two
cases and 5 points for the generalization. Both of these problems are adapted from Serra
(1989, p. 60).
The last two questions on each test asked students to make generalizations based on
data collected from geometric situations regarding area, perimeter, and volume.
94
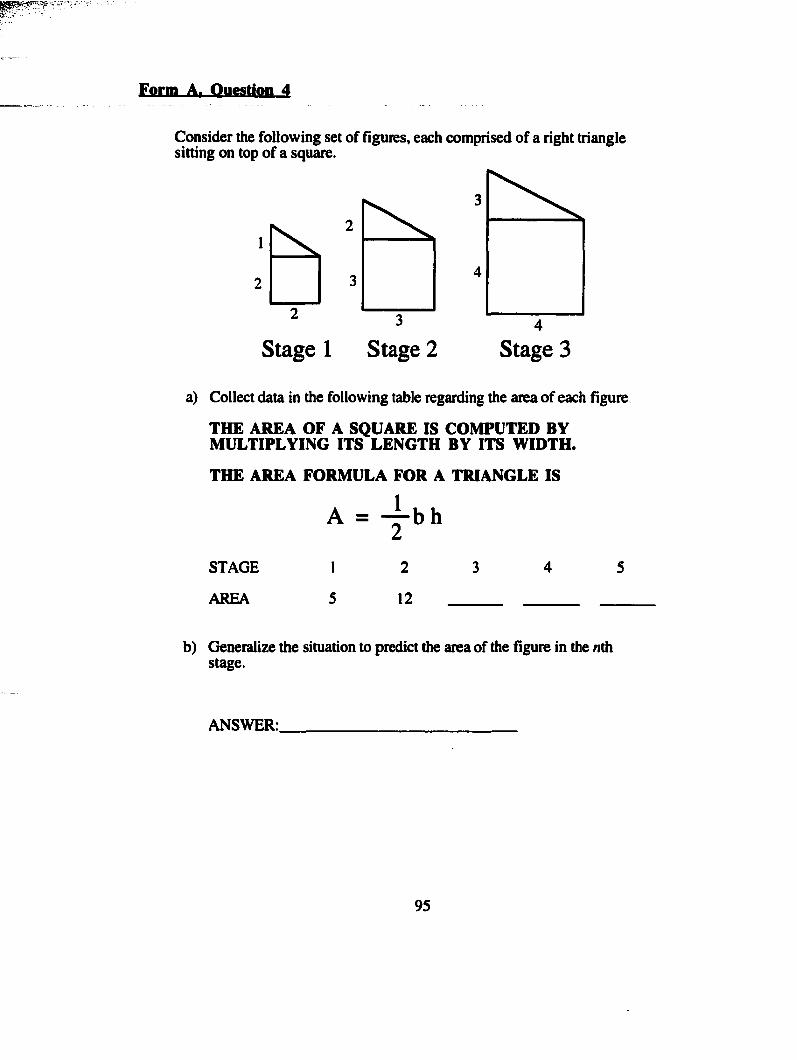
Form A. Question 4
Consider the following set of fîguies, each comprised of a right triangle sitting on top of a square.
2
3
3
3
4
4
Stage 1 Stage 2 Stage 3
a) Collect data in the following table regarding the area of each fîgure
THE AREA OF A SQUARE IS COMPUTED BY MULTIPLYING ITS LENGTH BY ITS WIDTH.
THE AREA FORMULA FOR A TRIANGLE IS
A = ^ b h
STAGE
AREA
1
5
2
12
b) Generalize the situation to predict the area of the fîgure in the nth stage.
ANSWER:
95
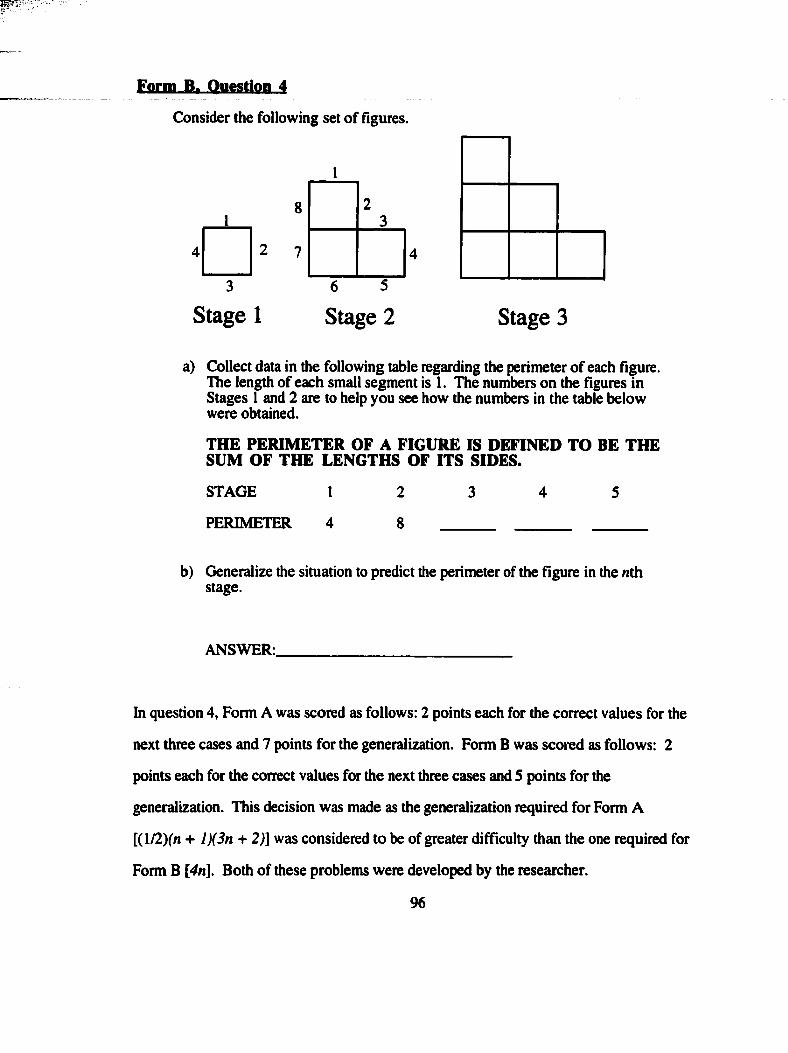
Fprm P, Qwstton 4
Consider the following set of fîgures.
1
Stage 16 5
Stage 2 Stage 3
a) Collect data in the following table regarding the perimeter of each figure. The length of each small segment is 1. The numbers on the figures in Stages 1 and 2 are to help you see how the numbers in the table below were obtained.
THE PERIMETER OF A FIGURE IS DEFINED TO BE THE SUM OF THE LENGTHS OF ITS SIDES.
STAGE
PERIMETER
1
4
2
8
b) Generalize the situation to predict the perimeter of the figure in the nth stage.
ANSWER:
In question 4, Form A was scored as follows: 2 points each for the correct values for the
next three cases and 7 points for the generalization. Form B was scored as follows: 2
points each for the correct values for the next three cases and 5 points for the
generalization. This decision was made as the generalization required for Form A
+ l)(3n + 2)] was considered to be of greater difficulty than the one required for
Form B [4n]. Both of these problems were developed by the researcher.
96
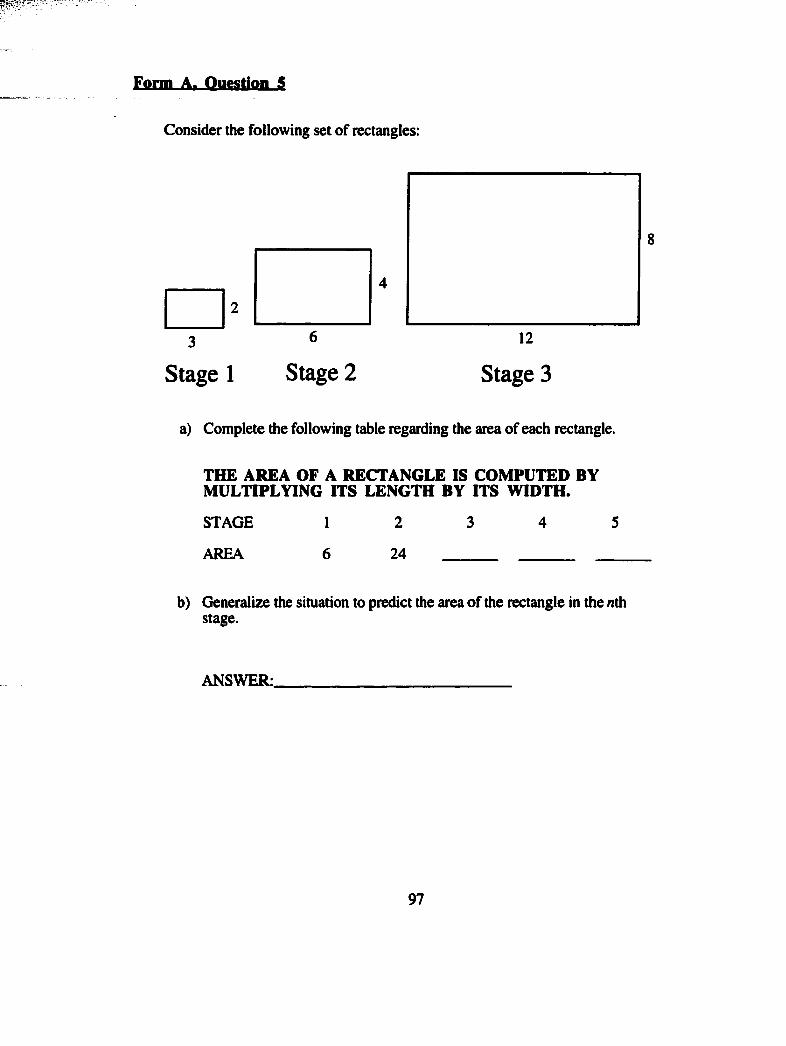
Efirm-A,-Qw8tion g
Consider the following set of rectangles;
Stage 1 Stage 2 Stage 3
a) Complete the following table regarding the area of each rectangle.
THE AREA OF A RECTANGLE IS COMPUTED BY MULTIPLYING ITS LENGTH BY ITS WIDTH.
STAGE
AREA
1
6
2
24
b) Generalize the situation to predict the area of the rectangle in the nth stage.
ANSWER:
97
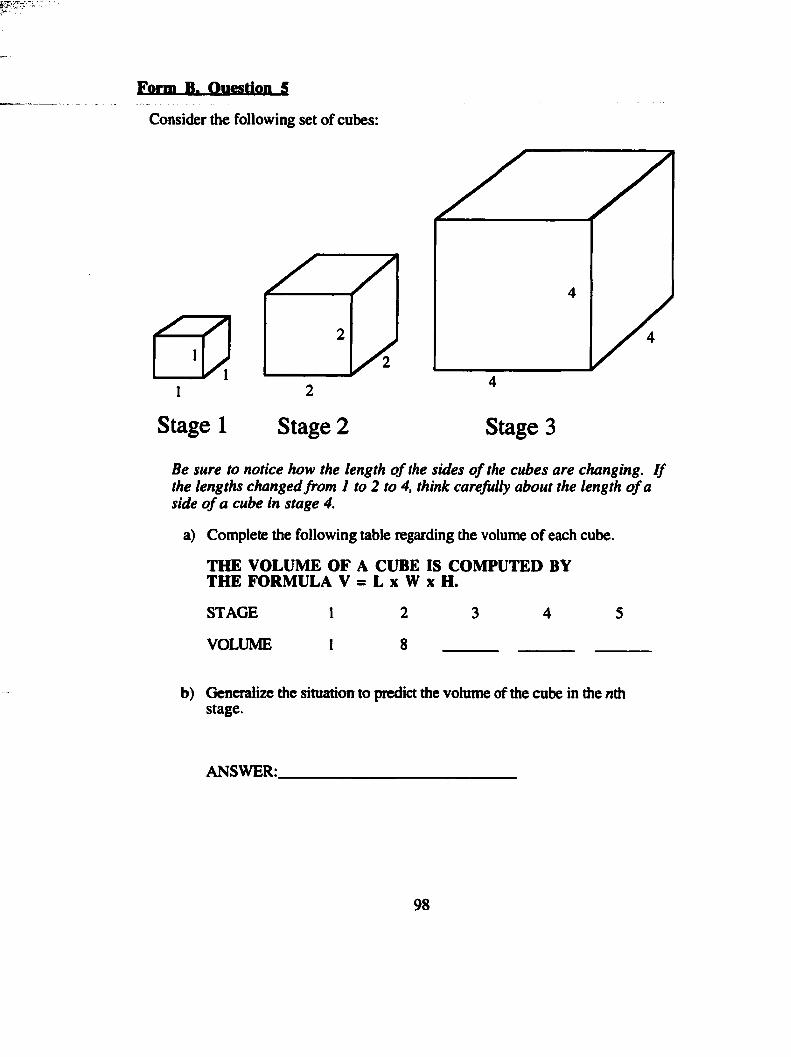
Eflrm .B» Qiifistion SConsider the following set of cubes:
2 4
Stage 1 Stage 2 Stage 3Be sure to notice how the length o f the sides o f the cubes are changing. I f the lengths changed from 1 to 2 to 4, think carefully about the length o f a side o f a cube in stage 4.
a) Complete the following table regarding the volume of each cube.
THE VOLUME O F A CUBE IS COMPUTED BY TH E FORMULA V = L x W x H.
STAGE
VOLUME
2
8
b) Generalize the situation to predict the volume of the cube in the nth stage.
ANSWER:.
98
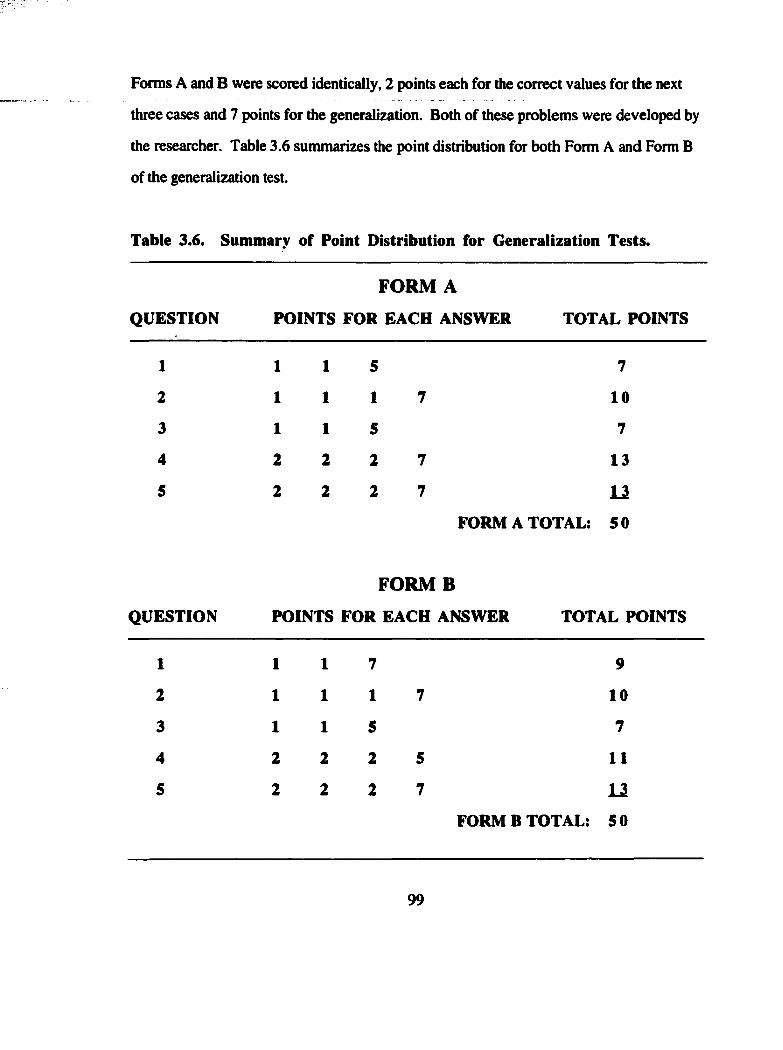
Forms A and B were scored identically, 2 points each for the correct values for the next
three cases and 7 points for the generalization. Both of these problems were developed by
the researcher. Table 3.6 summarizes the point distribution for both Form A and Form B
of the generalization test.
Table 3.6. Summary of Point Distribution for Generalization Tests.
FORM A
QUESTION POINTS FOR EACH ANSWER TOTAL POINTS
1 1 1 5 7
2 1 1 1 7 10
3 1 1 5 7
4 2 2 2 7 13
S 2 2 2 7 U
FORM A TOTAL: 50
FORM B
QUESTION POINTS FOR EACH ANSWER TOTAL POINTS
1 1 1 7 9
2 1 1 1 7 10
3 1 1 5 7
4 2 2 2 5 11
5 2 2 2 7 l iFORM B TOTAL: 50
99
Interview tasks. The researcher developed some of the interview tasks, while
others were adapted from 92 Geometric Explorations on the TI-92 (Keyton, 1996). The
interview consisted of six geometry tasks in which students were provided opportunities to
make generalizations. Complete versions of the tasks can be found in Appendix C.
Condensed versions of the tasks are presented in Chapter 4 along with the analysis of
student responses from each task. Task 1 and Task 3 were adapted from Keyton (1996).
All of the remaining tasks were developed by the researcher. In Tasks 1 and 3, students
were given three geometric figures with measurements of segment lengths on the figures.
There was a fourth fîgure with all of the information except one missing value. Students
were asked to study the information on the first three examples and to try to fînd the
missing value in the fourth example. In Task 2 and in Task 4, students were asked to try to
relate two theorems. In each case, one theorem could be thought of as a generalization of
the other one. Students were asked to interpret the theorems and then relate the two
theorems to one another. In Task S, four examples were given with various measurements
indicated on the figures. There was no missing value in the fourth example, as there was in
the earlier tasks. Instead, students were asked to study the examples and make any
observations that they could make. Task 6 involved the Pythagorean Theorem and was
longer than the other tasks. Students were asked to interpret the Pythagorean Theorem in
terms of the areas of squares constructed on each side of the triangle. In subsequent parts
of Task 6, students explored if the area argument would hold if certain procedures were
done to each square. For example, once students confirmed that the areas of the two
smaller squares added together yielded the area of the large square, they were asked if the
area argument would still hold if each of the squares were cut in half. Various other figures
were explored in the task, with ample opportunity for students to suggest figures that they
thought would work. The task was designed to see if students would recognize that as
long as the figures on each side were similar, the area argument would still work.
100
INSTRUCTIONAL MATERIALS
The experimental group used Texas Instruments TI-92 calculators on a regular basis
(see Table 3.7) throughout the course for exploration and discovery of geometric ideas.
The TI-92 has Cabri Geometry / / as a built-in application. One pedagogically useful
feature of the TI-92 is that any TI-92 can be connected to an overhead display unit, making
it possible for students to display their work for the entire class. This happened
approximately one out of every three times that the experimental group used the TI-92.
Both the experimental and control groups used the same textbook, (Geometry: An
Integrated Approach. 1995, Larson, Boswell, & Stiff). Both the researcher and the control
group teacher used various geometry resource materials to supplement the textbook. The
researcher did not ask the teacher of the control group to document the use of
supplementary resource materials. The researcher does, however, estimate that an
extremely high percentage of the supplementary resources used in the two groups were the
same. When the researcher used a supplementary resource, the resource was shared with
the teacher of the control group. This was done to help control the effect of any mediating
influences on the two groups, other than the use of Cabri.
As discussed more fully later in this chapter, the control group used traditional
methods of geometry instruction, including compass and straightedge constructions. Due
to the pmphasis of the research study on using Cabri for explorations, no compass and
straightedge constructions were done with the experimental group. All constructions were
done using Cabri.
List of topics. Table 3.7 provides a list of topics for which the researcher used
Cabri in doing explorations with the experimental group. The table is organized to show
three types of explorations.
101
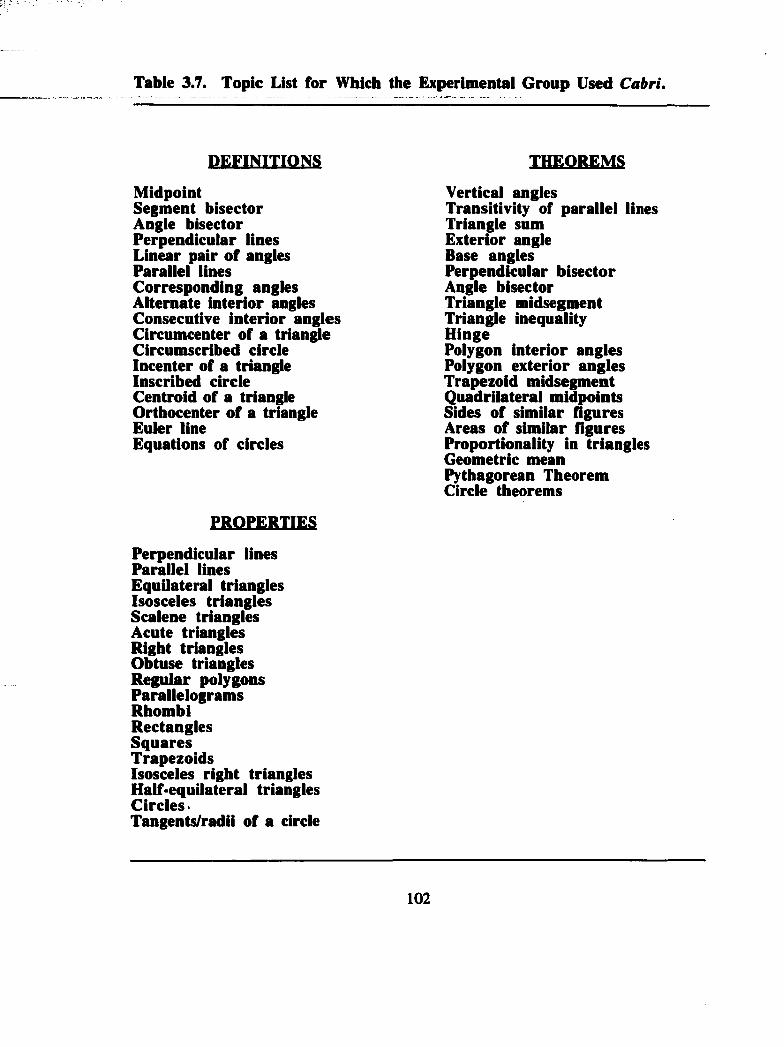
Table 3.7. Topic List for Which the Experimental Group Used Cabri.
DEFINITIONSMidpoint Segment bisector Angie bisector Perpendicular lines Linear pair of angles Parallel lines Corresponding angles Alternate interior angles Consecutive interior angles Circumcenter of a triangle Circumscribed circle Incenter of a triangle Inscribed circle Centroid of a triangle Orthocenter of a triangle Euler lineEquations of circles
PROPERTIES
Perpendicular lines Parallel lines Equilateral triangles Isosceles triangles Scalene triangles Acute triangles Right triangles Obtuse triangles Regular polygons Parallelograms Rhombi Rectangles Squares TrapezoidsIsosceles right triangles Half equilateral triangles Circles •Tangents/radii of a circle
THEOREMSVertical angles Transitivity of parallel lines Triangie sum Exterior angle Base angles Perpendicular bisector Angle bisector Triangle midsegment Triangle inequality HingePolygon interior angles Polygon exterior angles Trapezoid midsegment Quadrilateral midpoints Sides of similar figures Areas of similar figures Proportionality in triangles Geometric mean Pythagorean Theorem Circle theorems
102
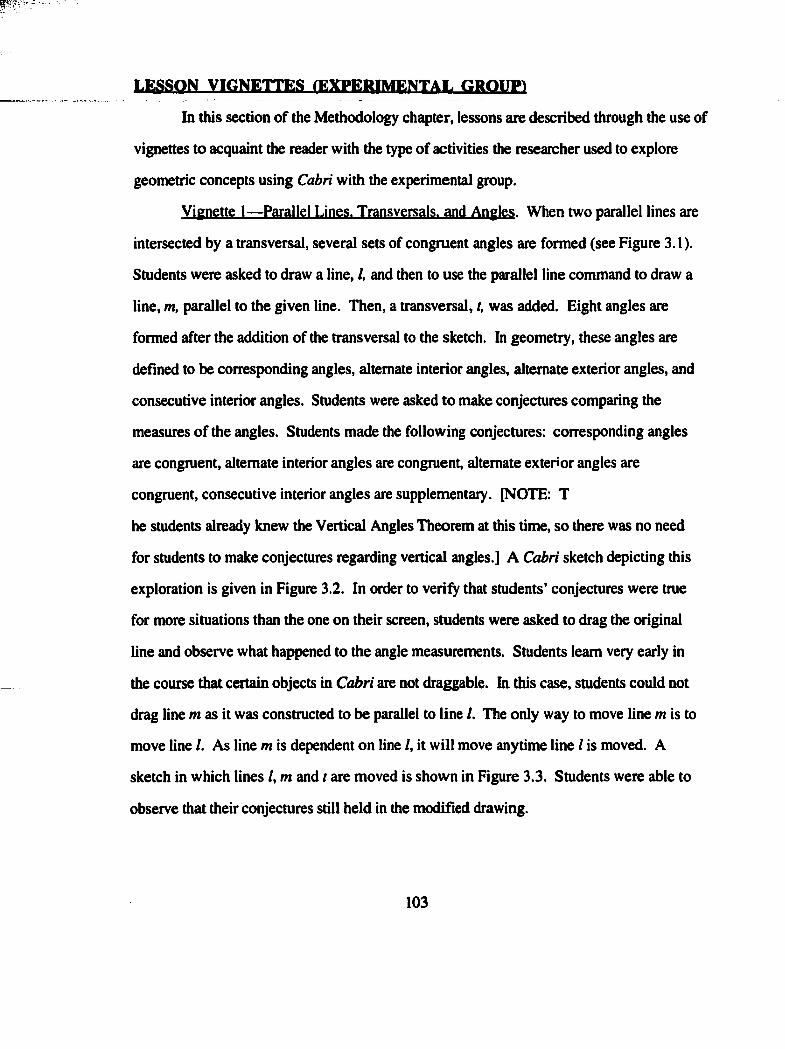
LESSON VIGNETTES (EXPERIMENTAL GROUP)
In this section of the Methodology chapter, lessons are described through the use of
vignettes to acquaint the reader with the type of activities the researcher used to explore
geometric concepts using Cabri with the experimental group.
Vignette 1—Parallel Lines. Transversals, and Angles. When two parallel lines are
intersected by a transversal, several sets of congruent angles are formed (see Figure 3.1).
Students were asked to draw a line, /, and then to use the parallel line command to draw a
line, m, parallel to the given line. Then, a transversal, r, was added. Eight angles are
formed after the addition of the transversal to the sketch. In geometry, these angles are
defined to be corresponding angles, alternate interior angles, alternate exterior angles, and
consecutive interior angles. Students were asked to make conjectures comparing the
measures of the angles. Students made the following conjectures; corresponding angles
are congruent, alternate interior angles are congruent, alternate exterior angles are
congruent, consecutive interior angles are supplementary. [NOTE: T
he students already knew the Vertical Angles Theorem at this time, so there was no need
for students to make conjectures regarding vertical angles.] A Cabri sketch depicting this
exploration is given in Figure 3.2. In order to verify that students’ conjectures were true
for more situations than the one on their screen, students were asked to drag the original
line and observe what happened to the angle measurements. Students learn very early in
the course that certain objects in Cabri are not draggable. In this case, students could not
drag line m as it was constructed to be parallel to line /. The only way to move line m Is to
move line /. As line m is dependent on line /, it will move anytime line / is moved. A
sketch in which lines /, m and t are moved is shown in Figure 3.3. Students were able to
observe that their conjectures still held in the modiried drawing.
103
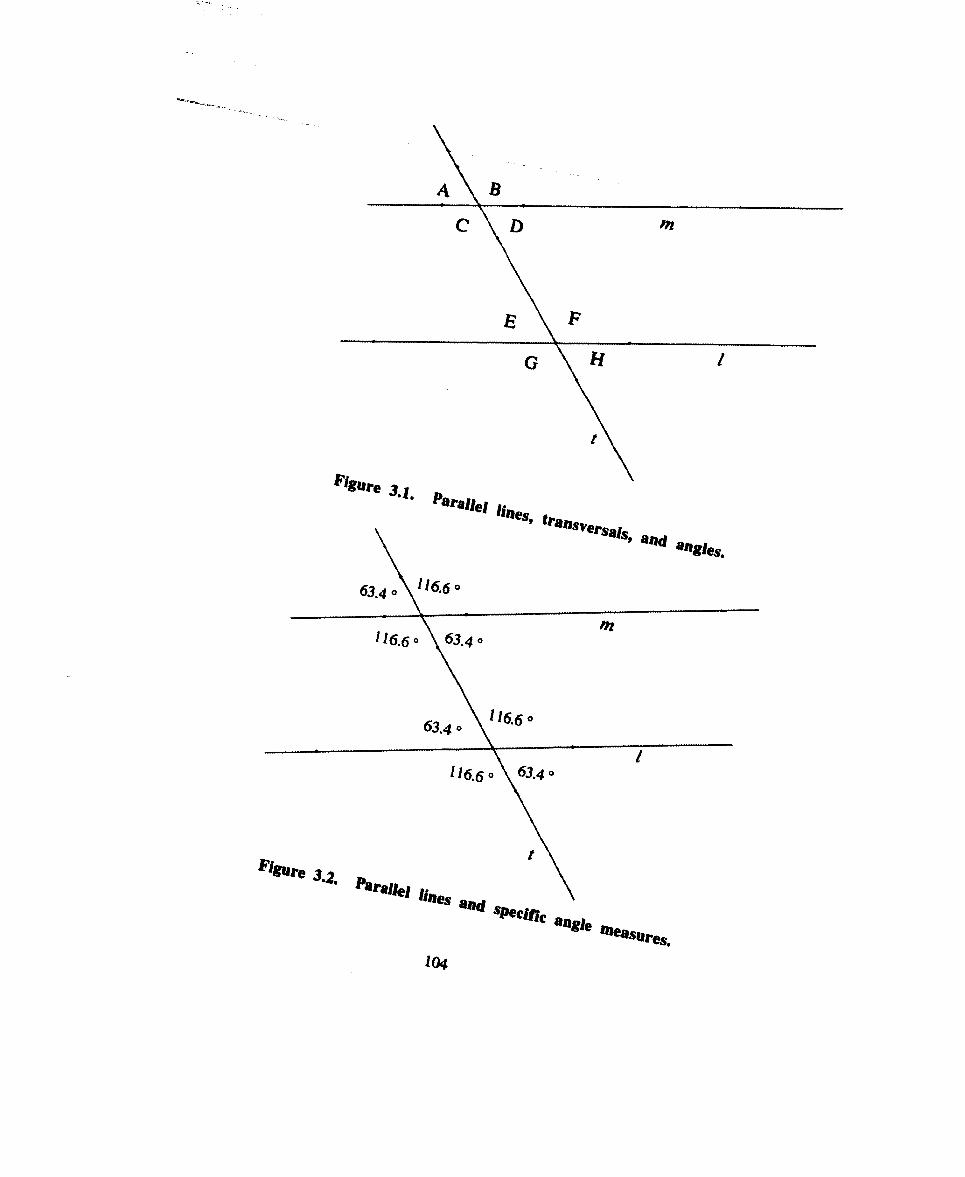
63.4° y
104
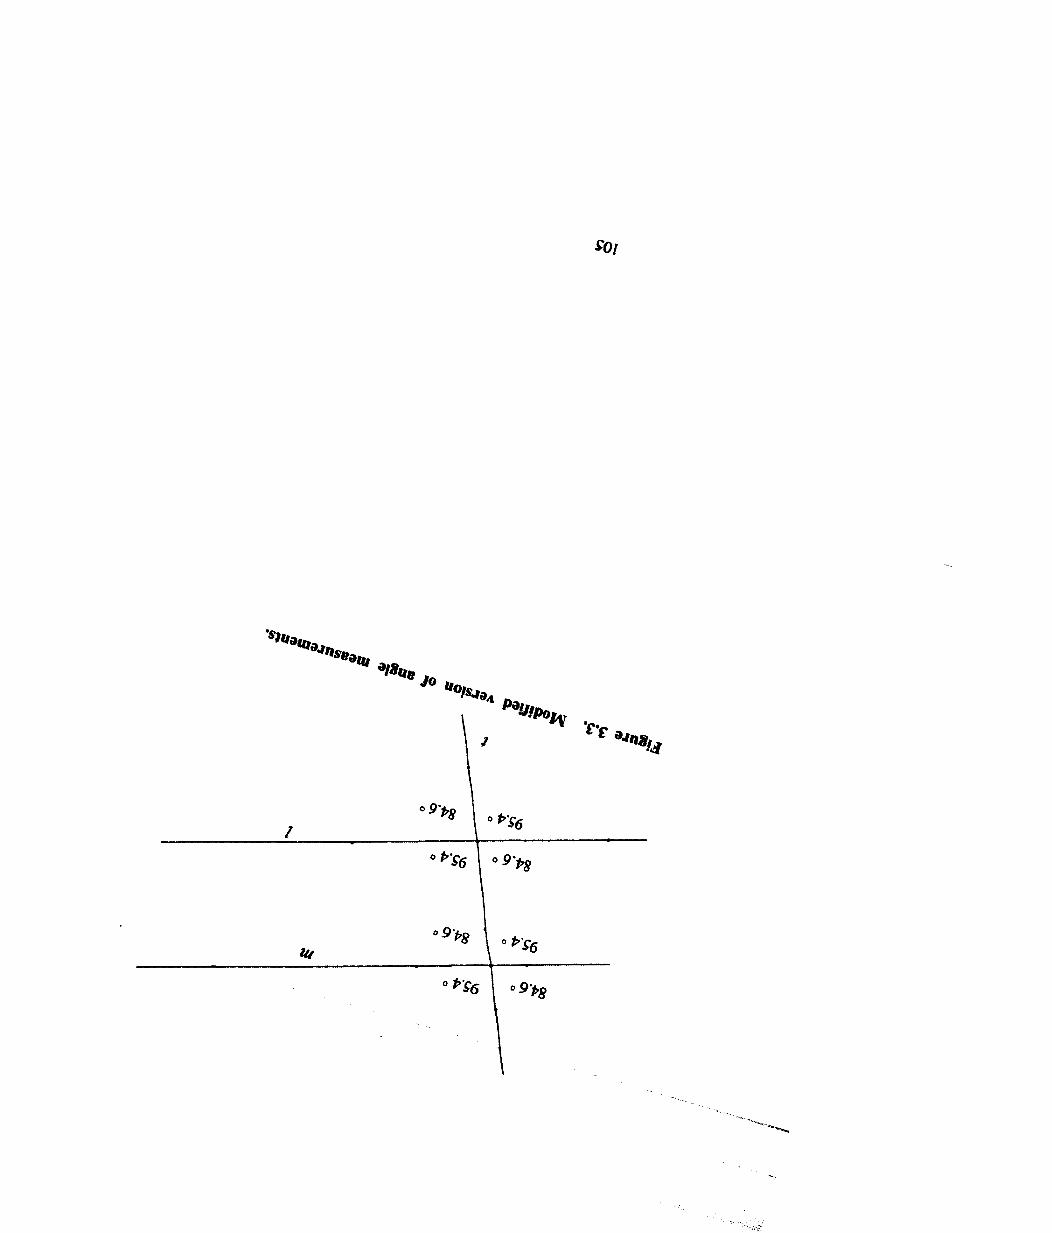
^0 /
Vignette 2—Special Case Right Triangles. In isosceles right triangles (4S°-45°-90°)
and in half-equilateral triangles (30°-60°-90°), well-known relationships exist among the
lengths of the sides. In isosceles right triangles, the ratio of the length of the hypotenuse to
the length of a leg is V2:1. In half-equilateral triangles, the ratio of the length of the
hypotenuse to the length of the shorter leg is 2:1 while the ratio of the length of the longer
leg to the length of the shorter leg is V3:1. Students can discover these relationships using
Cabri.
Students were asked to construct isosceles right triangles and half-equilateral
triangles, and to measure the lengths of the sides. Even though this topic was studied late
in the course, many students had some difficulty constructing an isosceles right triangle that
is a construction instead of a drawing. Many students also had difficulty constructing the
half-equilateral triangle. These difficulties that students had with the constructions are
consistent with results reported by studies in Chapter 2. Once the appropriate figures were
constructed (with guidance from the researcher), students were asked to make comparisons
regarding the lengths of sides and to make any conjectures that they could.
Students noted that relationships did exist between the side lengths, but students did
not recognize these numbers to be V2 and V3. Generally, many students are not familiar
with decimal approximations to square roots that are irrational numbers. Students tend to
be familiar with the decimal approximation for only one irrational number, 7C. Therefore,
some class discussion had to take place when students saw decimal tqiproximations for ' i l
and V3 on their calculator screens.
A Cabri sketch of an isosceles right triangle is given in Figure 3.4 while a half-
equilateral triangle is shown in Figure 3.S.
106
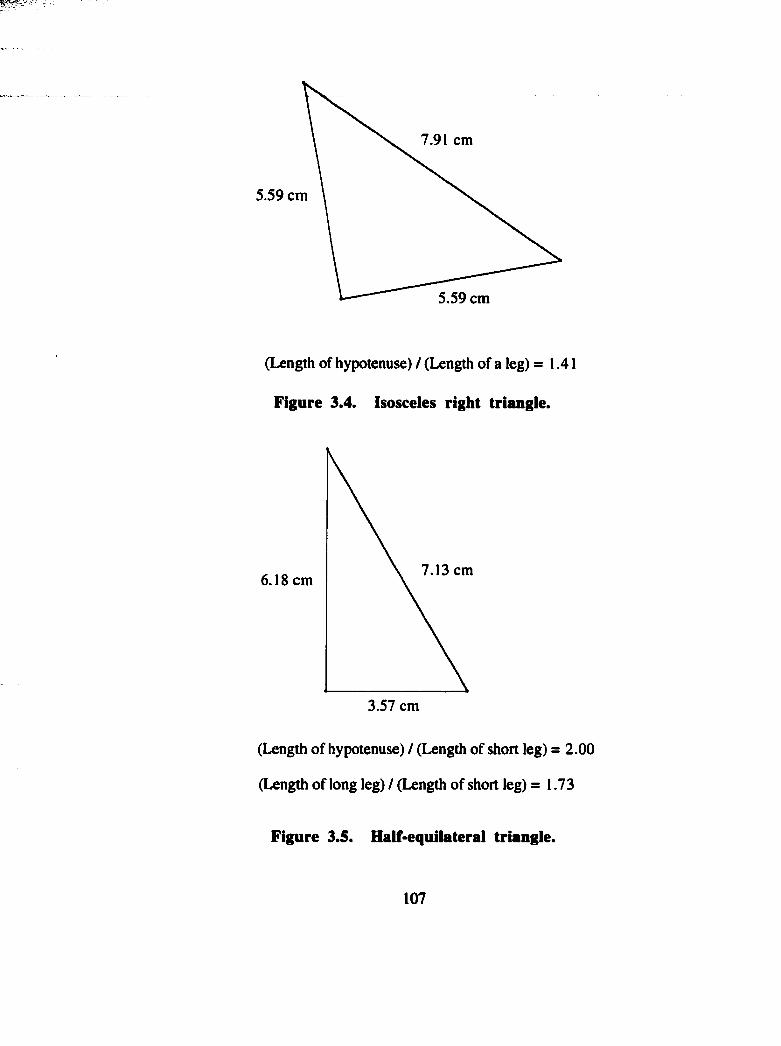
7.91 cm
5.59 cm
5.59 cm
(Length of hypotenuse) / (Length of a leg) =1.41
Figure 3.4. Isosceles right triangle.
7.13 cm6.18 cm
3.57 cm
(Length of hypotenuse) / (Length of short leg) = 2.00
(Length of long leg) / (Length of short leg) =1.73
Figure 3.5. Half equilateral triangle.
107
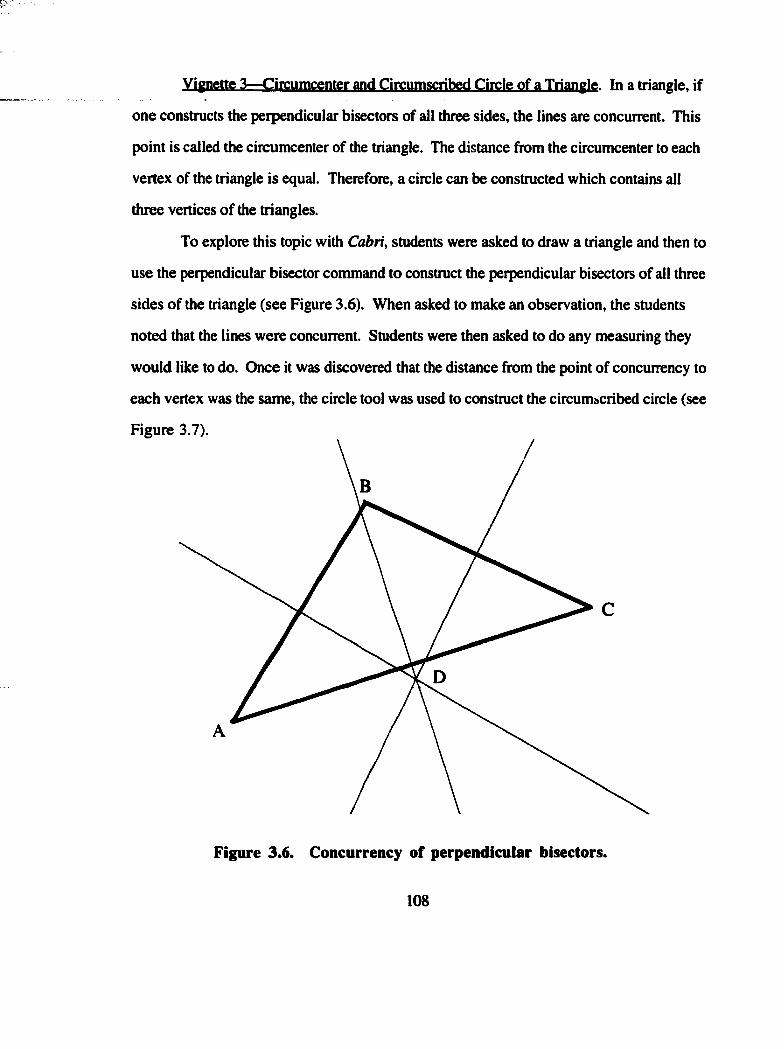
Vignette 3—Ciroumcenter and Circumscribed Circle of a Triangle. In a triangle, if
one constructs the perpendicular bisectors of all three sides, the lines are concurrent. This
point is called the circumcenter of the triangle. The distance from the circumcenter to each
vertex of the triangle is equal. Therefore, a circle can be constructed which contains all
three vertices of the triangles.
To explore this topic with Cabri, students were asked to draw a triangle and then to
use the perpendicular bisector command to construct the perpendicular bisectors of all three
sides of the triangle (see Figure 3.6). When asked to make an observation, the students
noted that the lines were concurrent. Students were then asked to do any measuring they
would like to do. Once it was discovered that the distance from the point of concurrency to
each vertex was the same, the circle tool was used to construct the circumscribed circle (see
Figure 3.7).
Figure 3.6. Concurrency of perpendicular bisectors.
108
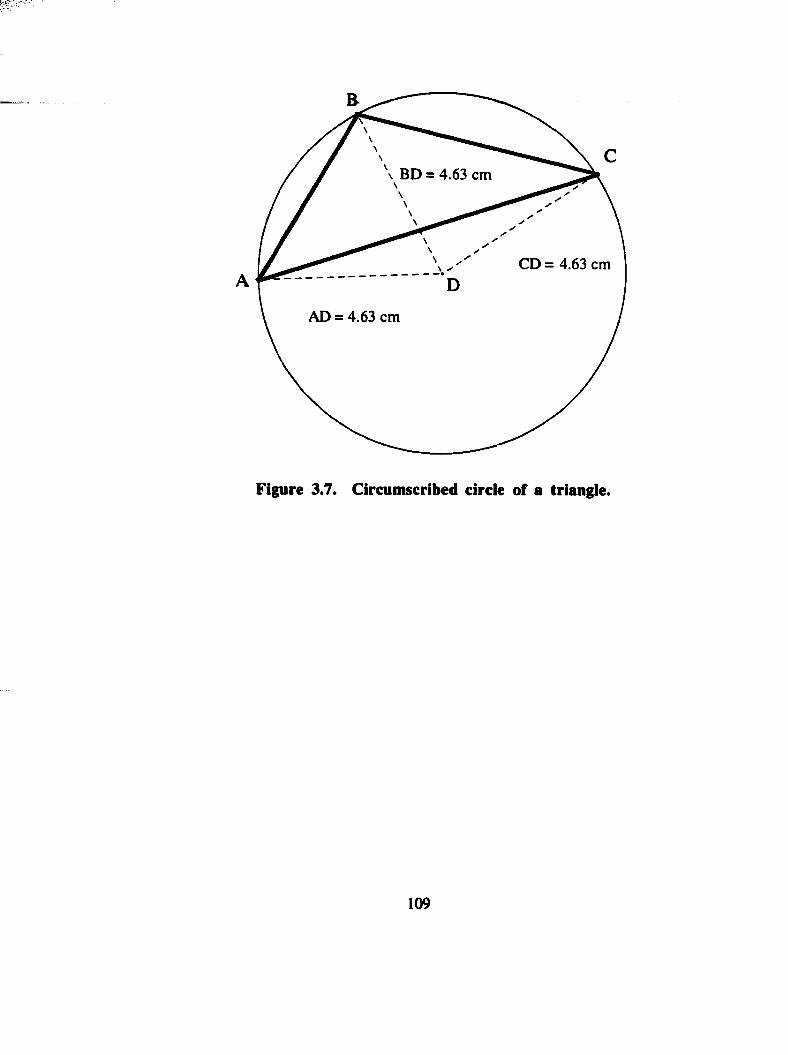
\ BD = 4.63 cm
CD = 4.63 cmA
AD = 4.63 cm
Figure 3.7. Circumscribed circle of a triangle.
109
Vignette 4—Incenter and Inscribed Circle of a Triangle. In a triangle, if one
constructs the angle bisectors of all three angles of the triangle, the rays are concurrent.
This point is called the incenter of the triangle. The distance from the incenter to each side
of the triangle is equal. Therefore, a circle can be constructed which is tangent to all three
sides of the triangles.
Students were asked to draw a triangle and then to use the angle bisector command
to construct the angle bisectors of all three angles of the triangle (see Figure 3.8). The
students noted that the rays were concurrent. Students were then asked to do any
measuring they would like to do. Once it was discovered that the distance from this point
to each side of the triangle is the same, the circle tool was used to construct the inscribed
circle (see Figure 3.9). Students could then modify their sketch to observe that the circle
remained tangent to the sides of the triangle even when the original triangle was modified.
It should be noted that students needed to be given some guidance on what to measure in
this exploration. In the previous vignette, the distances that were equal involved points that
were already on the sketch, while in this situation, the equal distances involve points that
were not on the original sketch.
110
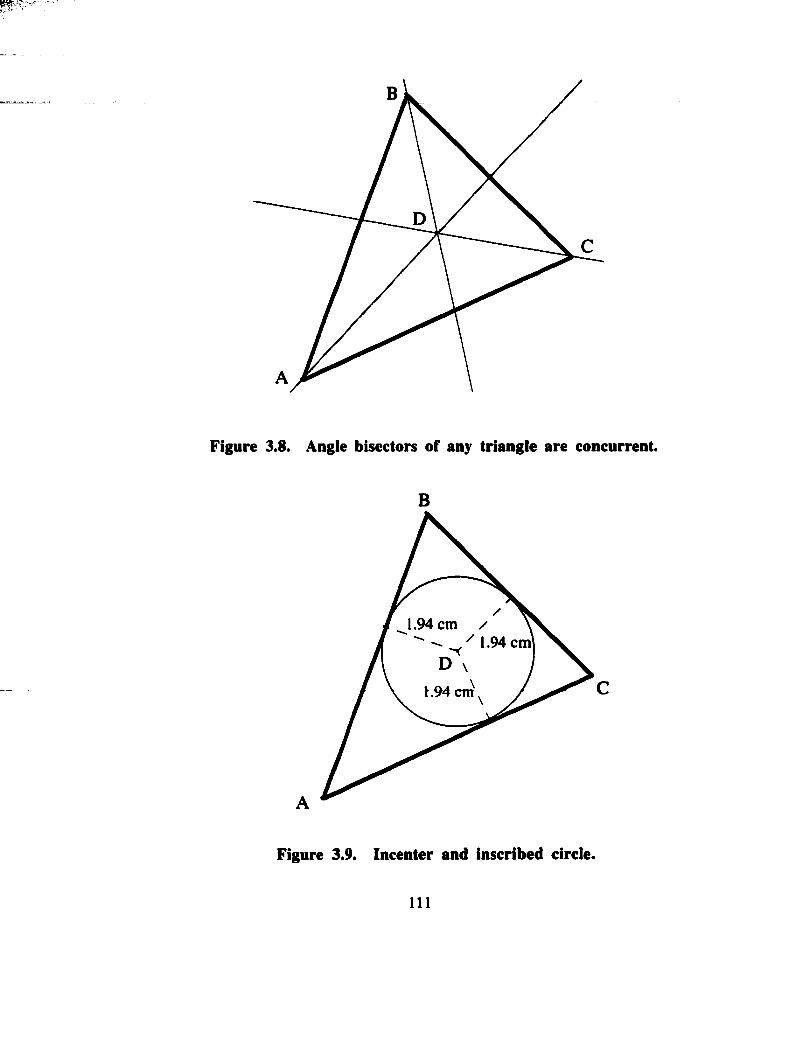
Figure 3.8. Angle bisectors of any triangle are concurrent.
B
1.94 cm /1.94 cm'
1.94 cm
Figure 3.9. Incenter and inscribed circle.
i l l
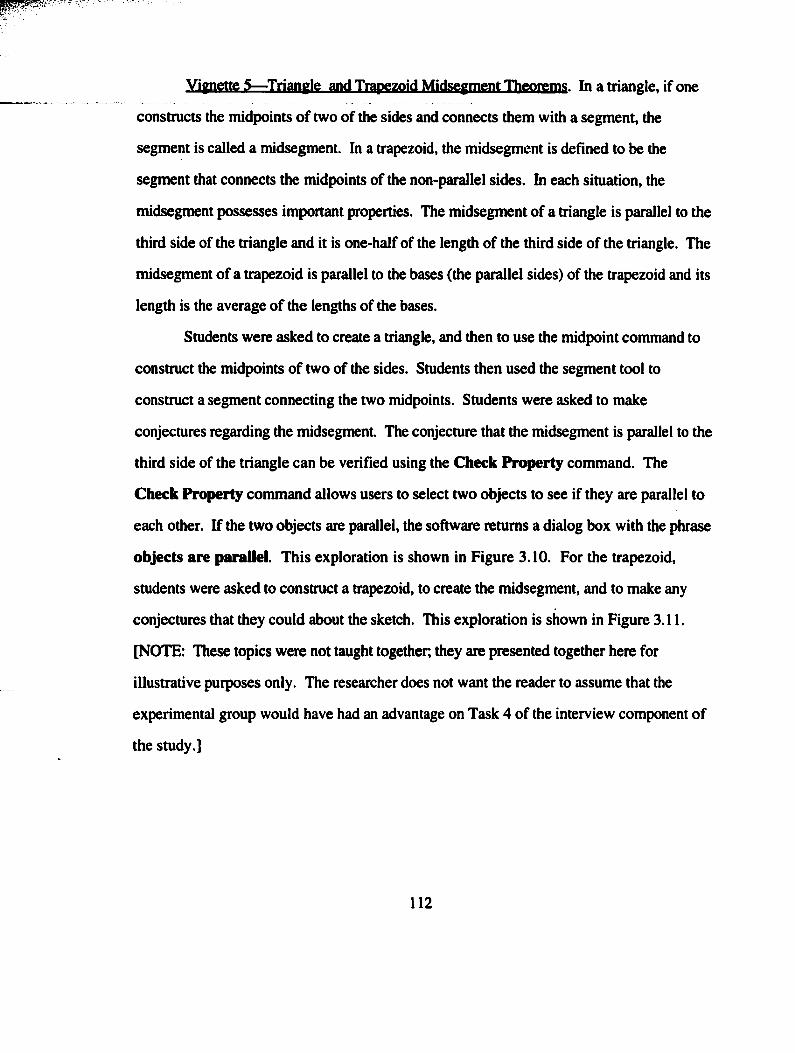
Vignette 5—Triangle and Trapezoid Midsegment Theorems. In a triangle, if one
constructs the midpoints of two of the sides and connects them with a segment, the
segment is called a midsegment. In a trapezoid, the midsegment is defined to be the
segment that connects the midpoints of the non-parallel sides. In each situation, the
midsegment possesses important properties. The midsegment of a triangle is parallel to the
third side of the triangle and it is one-half of the length of the third side of the triangle. The
midsegment of a trapezoid is parallel to the bases (the parallel sides) of the trapezoid and its
length is the average of the lengths of the bases.
Students were asked to create a triangle, and then to use the midpoint command to
construct the midpoints of two of the sides. Students then used the segment tool to
construct a segment connecting the two midpoints. Students were asked to make
conjectures regarding the midsegment. The conjecture that the midsegment is parallel to the
third side of the triangle can be verified using the Check Property command. The
Check Property command allows users to select two objects to see if they are parallel to
each other. If the two objects are parallel, the software returns a dialog box with the phrase
objects are parallel. This exploration is shown in Figure 3.10. For the trapezoid,
students were asked to construct a trapezoid, to create the midsegment, and to make any
conjectures that they could about the sketch. This exploration is shown in Figure 3.11.
[NOTE: These topics were not taught together; they are presented together here for
illustrative purposes only. The researcher does not want the reader to assume that the
experimental group would have had an advantage on Task 4 of the interview component of
the study.]
112
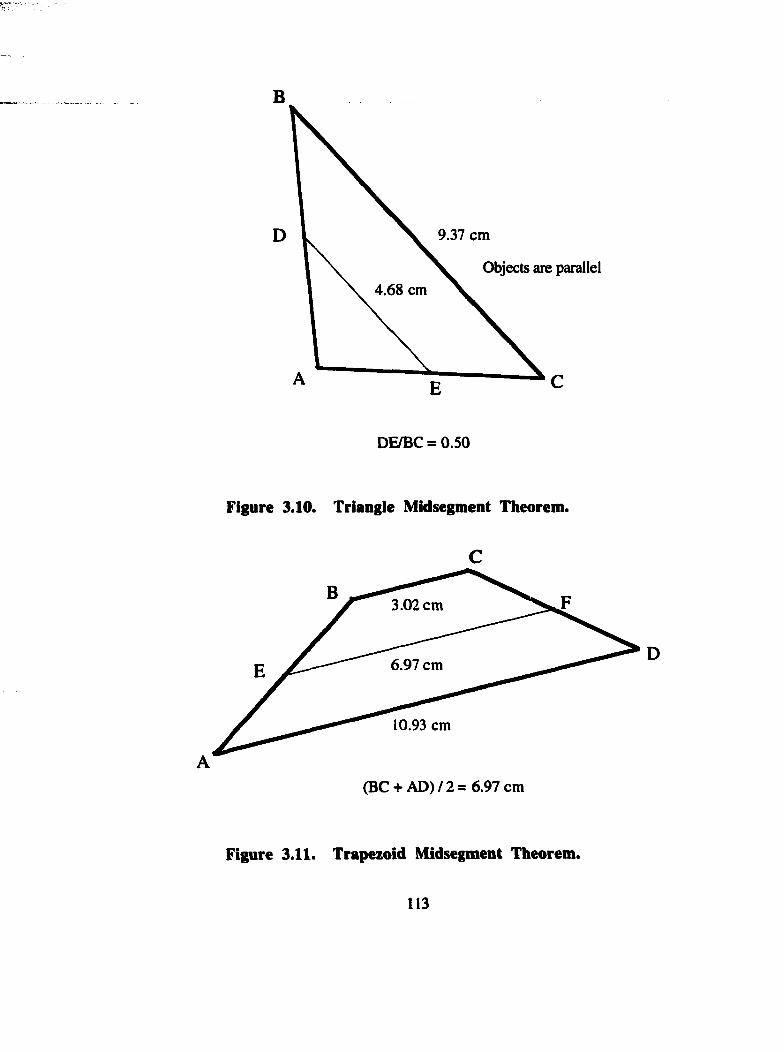
B
D 9.37 cm
Objects are parallel4,68 cm
DE/BC = 0.50
Figure 3.10. Triangle Midsegment Theorem.
C
3.02 cm
6.97 cm
10.93 cm
A(BC + A D ) /2 = 6.97 cm
D
Figure 3.11. Trapezoid Midsegment Theorem.
113
Vignette 6^PoLvgon Interior Angles Theorem and Polygon Exterior Angles
Theorem. The formula [180(/i - 2)]° is used to compute the sum of the interior angles of
any convex polygon, where n is the number of sides of the polygon. This theorem
provided opportunities for students to explore the interior angle sum of various polygons
and bring their individual TI-92 calculators to the front of the classroom so that the entire
class could view their polygon and its interior angle sum. Different students displayed their
sketches, so that the class was able to see the interior angle sum for a quadrilateral, a
pentagon, a hexagon, a heptagon, an octagon, a nonagon, and even a decagon. Students
already knew the Triangle Sum Theorem at this point in the course, which is why a triangle
was not constructed as part of this exploration. The researcher collected information
regarding the data and a class discussion helped to arrive at a generalization regarding the
sum of the interior angles of any convex polygon. Students were asked to move a vertex
so that the polygon was concave. They could then see that this result holds only for
convex polygons. A Cabri sketch depicting parts of this exploration is shown in Figure
3.12.
The sum of the exterior angles, one at each vertex, for any convex polygon is 360°.
Students were asked to volunteer for different polygons to create and measure the exterior
angles. Students created polygons, extended each side using the ray tool, and then
measured each of the exterior angles. The calculator feature was used to find the sum of
the exterior angles. Several students brought their sketches up to show the entire class.
The researcher collected data as the students showed their sketches to the entire class and
the class arrived at a generalization regarding the sum of the exterior angles of a polygon.
A Cabri sketch depicting parts of this exploration is shown in Figure 3.13.
114
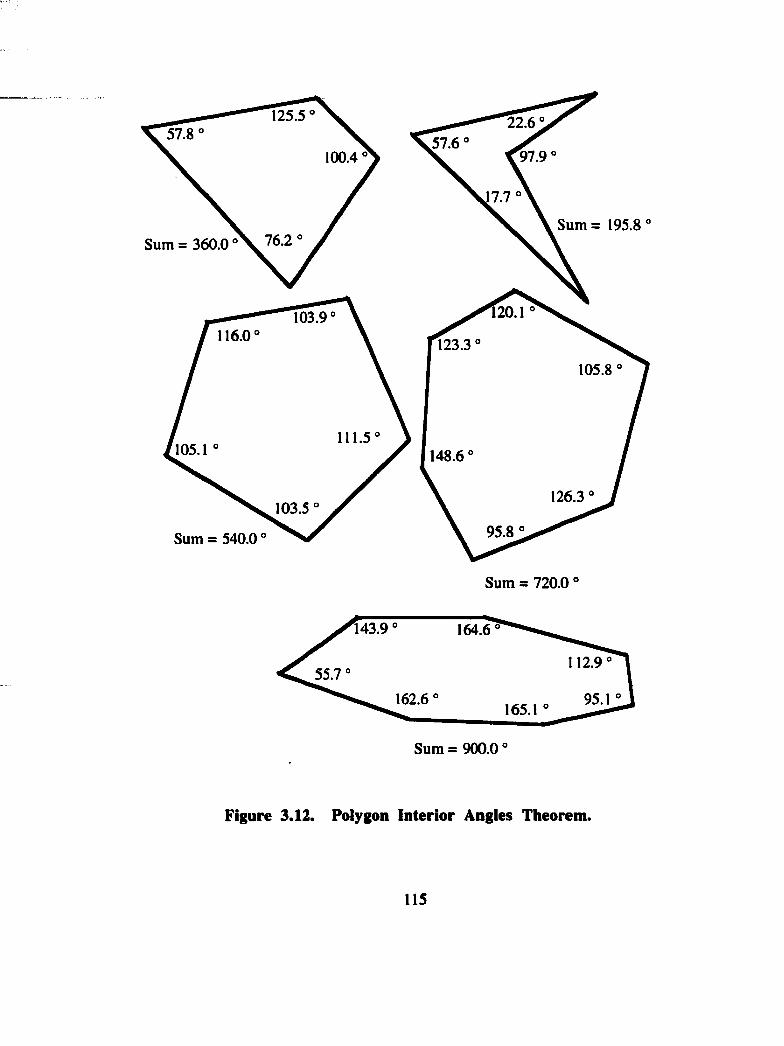
125.5 22.657.8 57.6
97.9100.4
Sum = 195.876.2Sum = 360.0
103.9116.0 123.3
105.8
105.1 148.6
126.3103.5
95.8Sum = 540.0
J7.7
120.1
Sum = 720.0
143.9 164.6
112.955.7
162.6 95.1165.1
Sum = 900.0 °
Figure 3.12. Polygon Interior Angles Theorem.
115
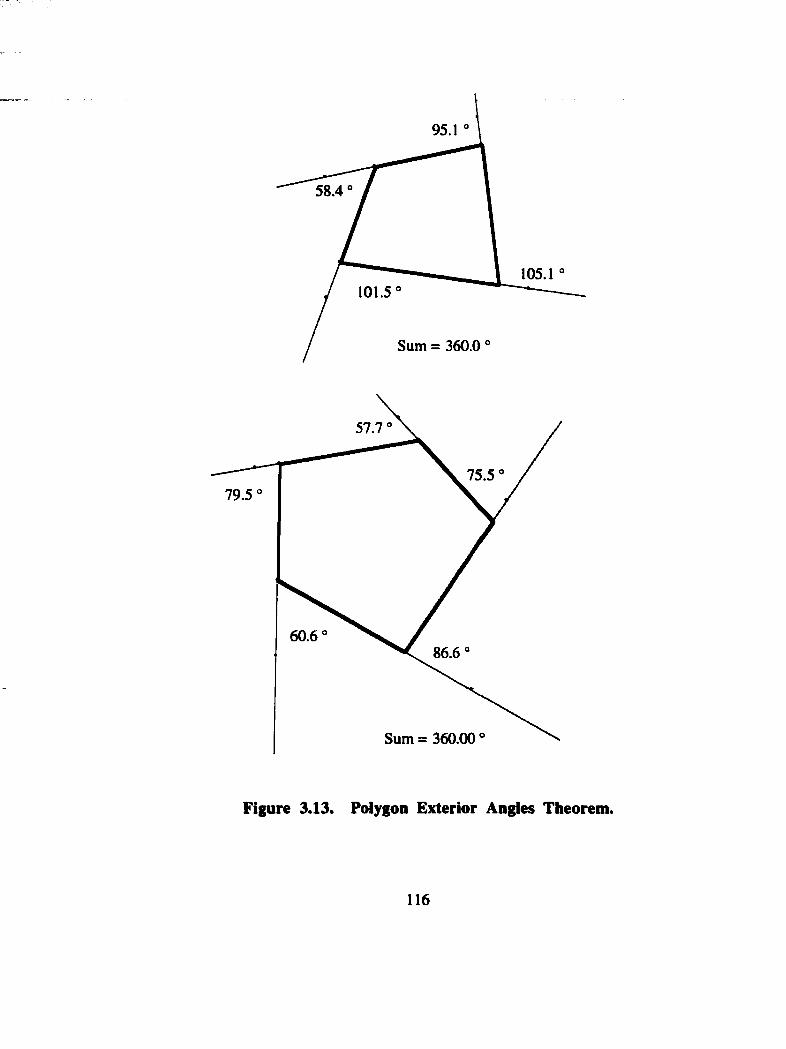
95.1
58.4
105.1101.5
Sum = 360.0
57.7
75.579.5
60.686.6
Sum = 360.00
Figure 3.13. Polygon Exterior Angies Theorem.
1 1 6
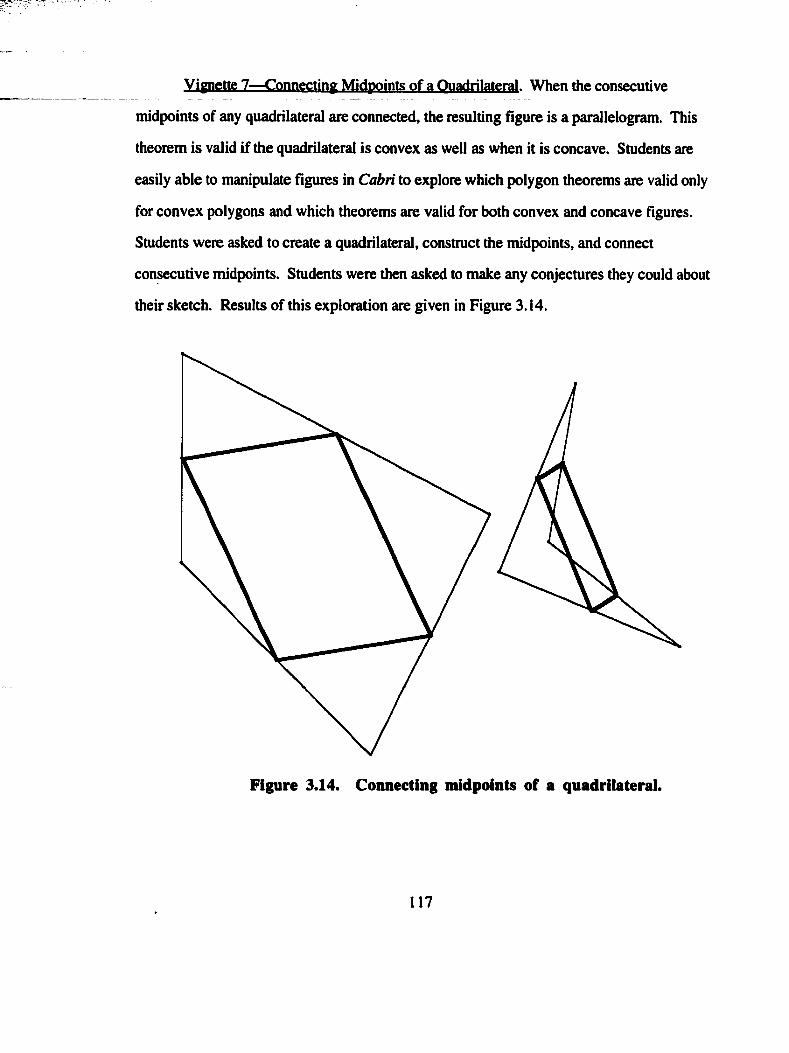
V '
Vignette 7—Connecting Midpoints of a Quadrilateral. When the consecutive
midpoints of any quadrilateral are connected, the resulting figure is a parallelogram. This
theorem is valid if the quadrilateral is convex as well as when it is concave. Students are
easily able to manipulate figures in Cabri to explore which polygon theorems are valid only
for convex polygons and which theorems are valid for both convex and concave figures.
Students were asked to create a quadrilateral, construct the midpoints, and connect
consecutive ntidpoints. Students were then asked to make any conjectures they could about
their sketch. Results of this exploration are given in Figure 3.14.
Figure 3.14. Connecting midpoints of a quadrilateral.
117
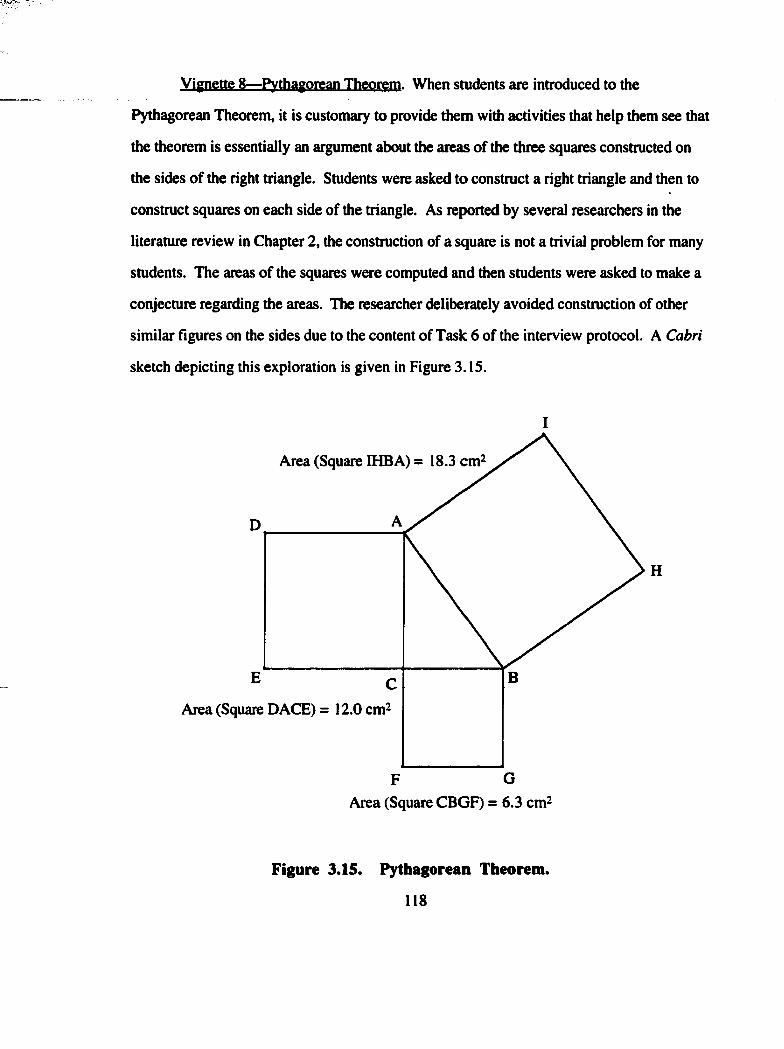
Vignette 8—Pythagorean Theorem. When students are introduced to the
Pythagorean Theorem, it is customary to provide them with activities that help them see that
the theorem is essentially an argument about the areas of the three squares constructed on
the sides of the right triangle. Students were asked to construct a right triangle and then to
construct squares on each side of the triangle. As reported by several researchers in the
literature review in Chapter 2, the construction of a square is not a trivial problem for many
students. The areas of the squares were computed and then students were asked to make a
conjecture regarding the areas. The researcher deliberately avoided construction of other
similar figures on the sides due to the content of Task 6 of the interview protocol. A Cabri
sketch depicting this exploration is given in Figure 3.15.
I
Area (Square IHBA) = 18.3 cm-
Area (Square DACE) = 12.0 cm-
GF
H
Area (Square CBGF) = 6.3 cm^
Figure 3.15. Pythagorean Theorem.
118

LESSON VIGNETTES (CONTROL GROUP)
In this section of the Methodology chapter, lessons are described through the use of
vignettes to acquaint the reader with the experiences of students in the control group during
the geometry course. While this is by no means a comprehensive description of the nature
of learning in the control group classroom, it should give the reader some idea of how
topics were presented by the control group teacher. The reader can make comparisons
between these lessons and the same lessons from the experimental group, which were
described in the previous section. The researcher observed each of these lessons in the
control group classroom.
Vignette 9—Triangle Sum Theorem and Exterior Angle Theorem. The control
group teacher chose a hands-on investigation for this lesson. Students were given blank
paper, scissors, and tape to do the investigation. The teacher asked students to draw three
points anywhere on the paper and to connect the points with segments. The teacher then
instructed students to open their notebooks and to draw a line in it. Students were asked to
cut off one of the angles and to tape it to the line in their notebooks, as shown in Figure
3.16.
Figure 3.16. Beginning of Triangle Sum Theorem investigation.
119
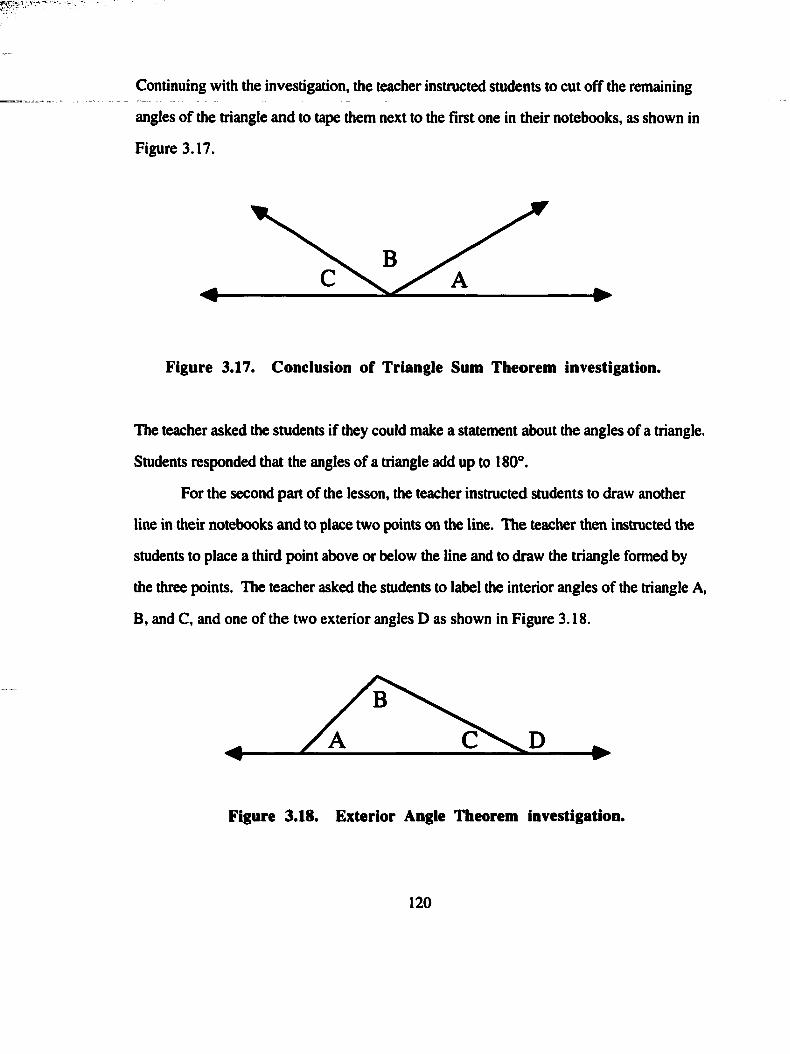
Continuing with the investigation, the teacher instructed students to cut off the remaining
angles of the triangle and to tape them next to the first one in their notebooks, as shown in
Figure 3.17.
Figure 3.17. Conclusion of Triangle Sum Theorem investigation.
The teacher asked the students if they could make a statement about the angles of a triangle.
Students responded that the angles of a triangle add up to 180°.
For the second part of the lesson, the teacher instructed students to draw another
line in their notebooks and to place two points on the line. The teacher then instructed the
students to place a third point above or below the line and to draw the triangle formed by
the three points. The teacher asked the students to label the interior angles of the triangle A,
B, and C, and one of the two exterior angles D as shown in Figure 3.18.
Figure 3.18. Exterior Angle Theorem investigation.
120
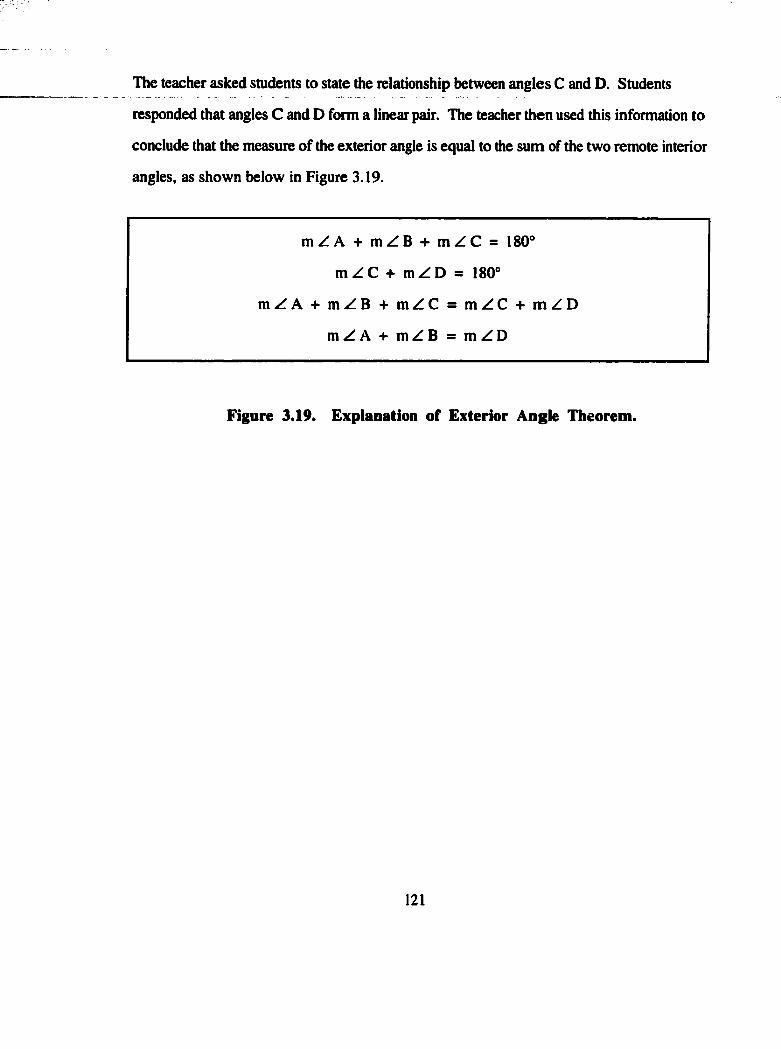
The teacher asked students to state the relationship between angles C and D. Students
responded that angles C and D form a linear pair. The teacher then used this information to
conclude that the measure of the exterior angle is equal to the sum of the two remote interior
angles, as shown below in Figure 3.19.
m Z A + m Z B + m Z C = 180'
m Z C + m Z D = 180
m Z A + m Z B + m Z C = m Z C + m Z D
m Z A + m Z B = m Z D
Figure 3.19. Explanation of Exterior Angie Theorem.
121
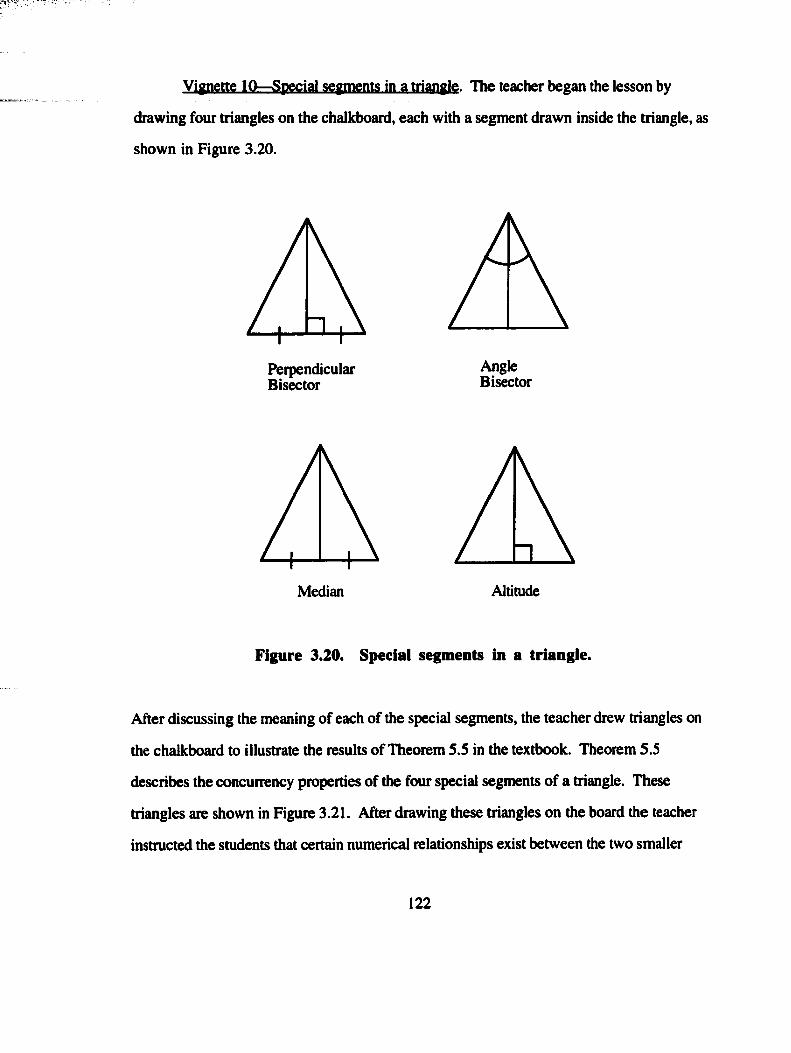
Vignette 10—Special segments in a triangle. The teacher began the lesson by
drawing four triangles on the chalkboard, each with a segment drawn inside the triangle, as
shown in Figure 3.20.
PerpendicularBisector
AngleBisector
Median Altitude
Figure 3.20. Special segments in a triangle.
After discussing the meaning of each of the special segments, the teacher drew triangles on
the chalkboard to illustrate the results of Theorem 5.5 in the textbook. Theorem 5.5
describes the concurrency properties of the four special segments of a triangle. These
triangles are shown in Figure 3.21. After drawing these triangles on the board the teacher
instructed the students that certain numerical relationships exist between the two smaller
122
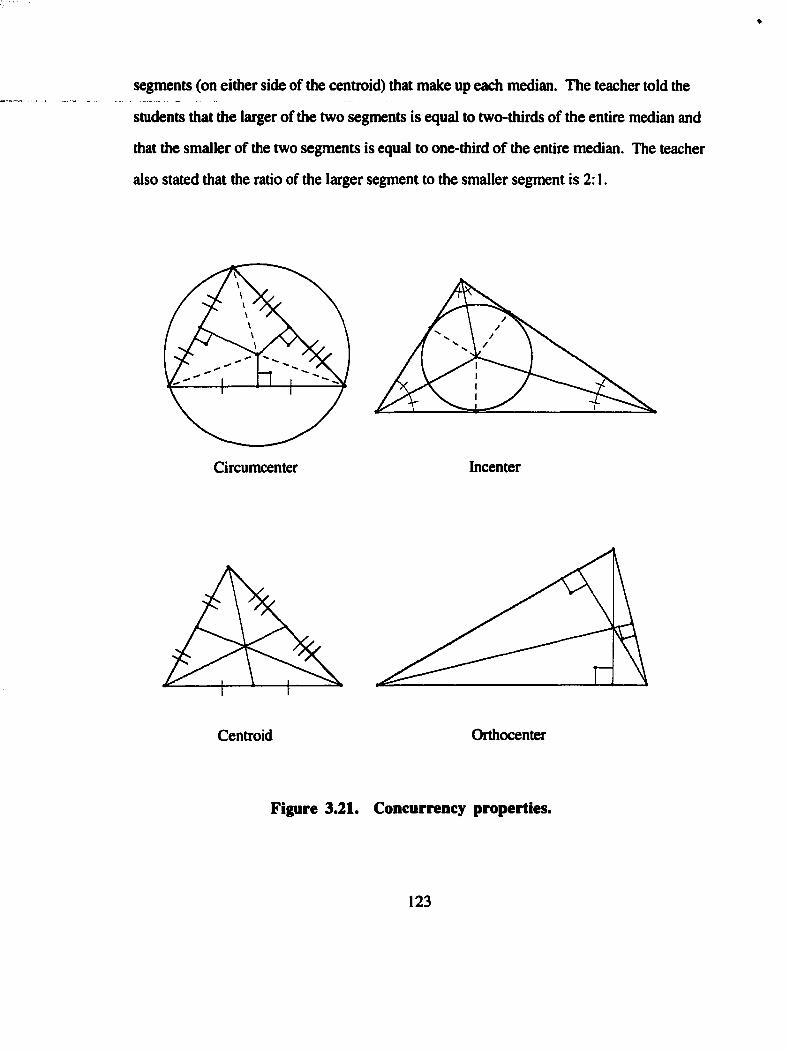
segments (on either side of the centroid) that make up each median. The teacher told the
students that the larger of the two segments is equal to two-thirds of the entire median and
that the smaller of the two segments is equal to one-third of the entire median. The teacher
also stated that the ratio of the larger segment to the smaller segment is 2:1.
Circumcenter Incenter
Centroid Orthocenter
Figure 3.21. Concurrency properties.
123
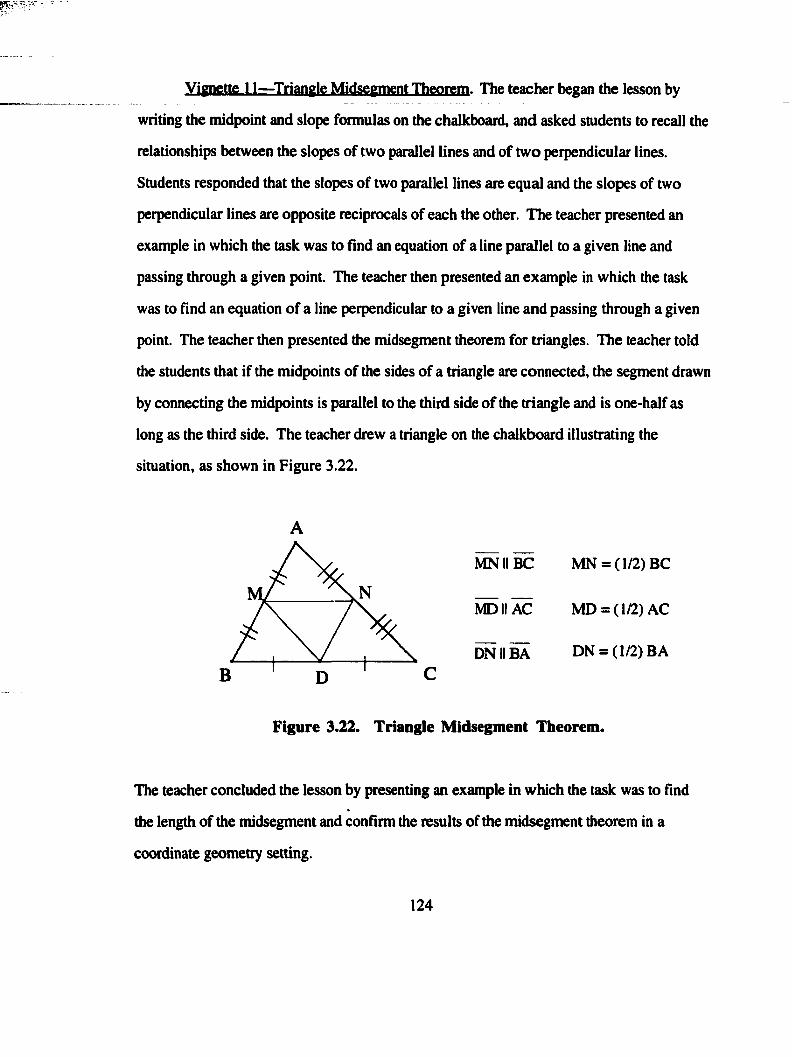
Vignette 11—Triangle Midseement Theorem. The teacher began the lesson by
writing the midpoint and slope formulas on the chalkboard, and asked students to recall the
relationships between the slopes of two parallel lines and of two perpendicular lines.
Students responded that the slopes of two parallel lines are equal and the slopes of two
perpendicular lines are opposite reciprocals of each the other. The teacher presented an
example in which the task was to find an equation of a line parallel to a given line and
passing through a given point. The teacher then presented an example in which the task
was to find an equation of a line perpendicular to a given line and passing through a given
point. The teacher then presented the midsegment theorem for triangles. The teacher told
the students that if the midpoints of the sides of a triangle are connected, the segment drawn
by connecting the midpoints is parallel to the third side of the triangle and is one-half as
long as the third side. The teacher drew a triangle on the chalkboard illustrating the
situation, as shown in Figure 3.22.
MNIIBC MN = (1/2)BC
MDIIÂC MD = (1/2)AC
rô^IlBÂ DN = (1/2)BAc
Figure 3.22. Triangle Midsegment Theorem.
The teacher concluded the lesson by presenting an example in which the task was to find
the length of the midsegment and confirm the results of the midsegment theorem in a
coordinate geometry setting.
124
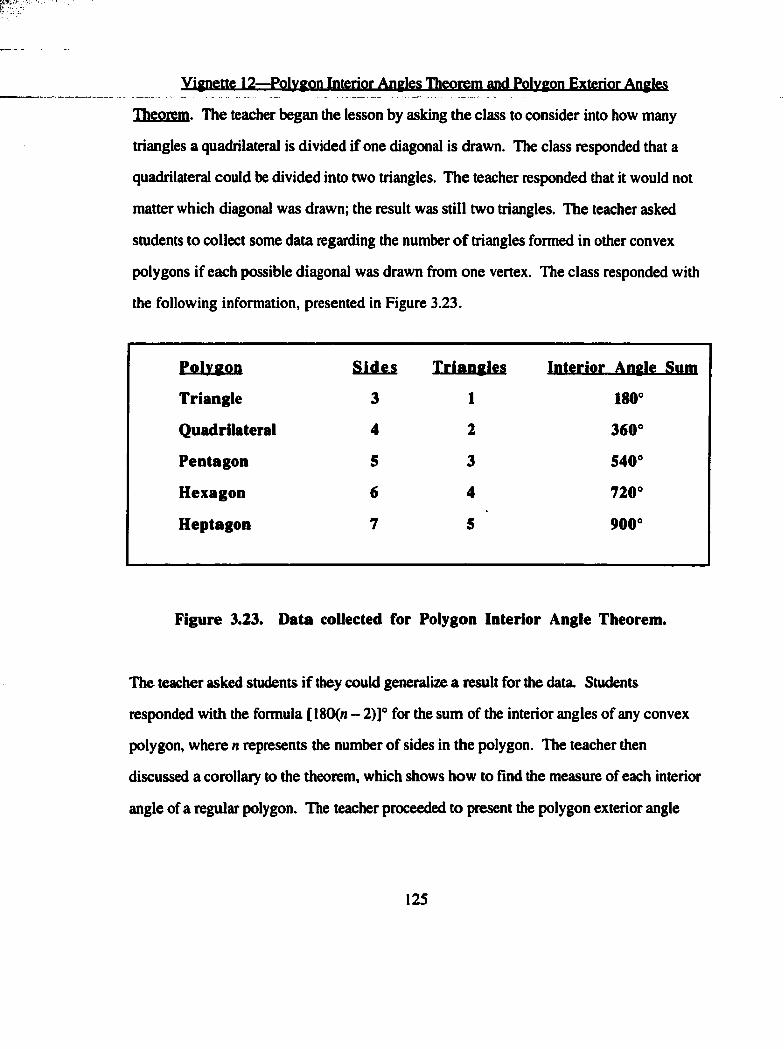
Vignette 12—Polygon Interior Angles Theorem and Polygon Exterior Angles
Theorem. The teacher began the lesson by asking the class to consider into how many
triangles a quadrilateral is divided if one diagonal is drawn. The class responded that a
quadrilateral could be divided into two triangles. The teacher responded that it would not
matter which diagonal was drawn; the result was still two triangles. The teacher asked
students to collect some data regarding the number o f triangles formed in other convex
polygons if each possible diagonal was drawn from one vertex. The class responded with
the following information, presented in Figure 3.23.
ESÜXSAD S id es Triangles Interior Angle Sum
Triangle 3 1 180°
Quadrilateral 4 2 360°
Pentagon 5 3 540°
Hexagon 6 4 720°
Heptagon 7 5 900°
Figure 3.23. Data collected for Polygon Interior Angie Theorem.
The teacher asked students if they could generalize a result for the data. Students
responded with the formula [180(n - 2)]° for the sum of the interior angles of any convex
polygon, where n represents the number of sides in the polygon. The teacher then
discussed a corollary to the theorem, which shows how to fînd the measure of each interior
angle of a regular polygon. The teacher proceeded to present the polygon exterior angle
125
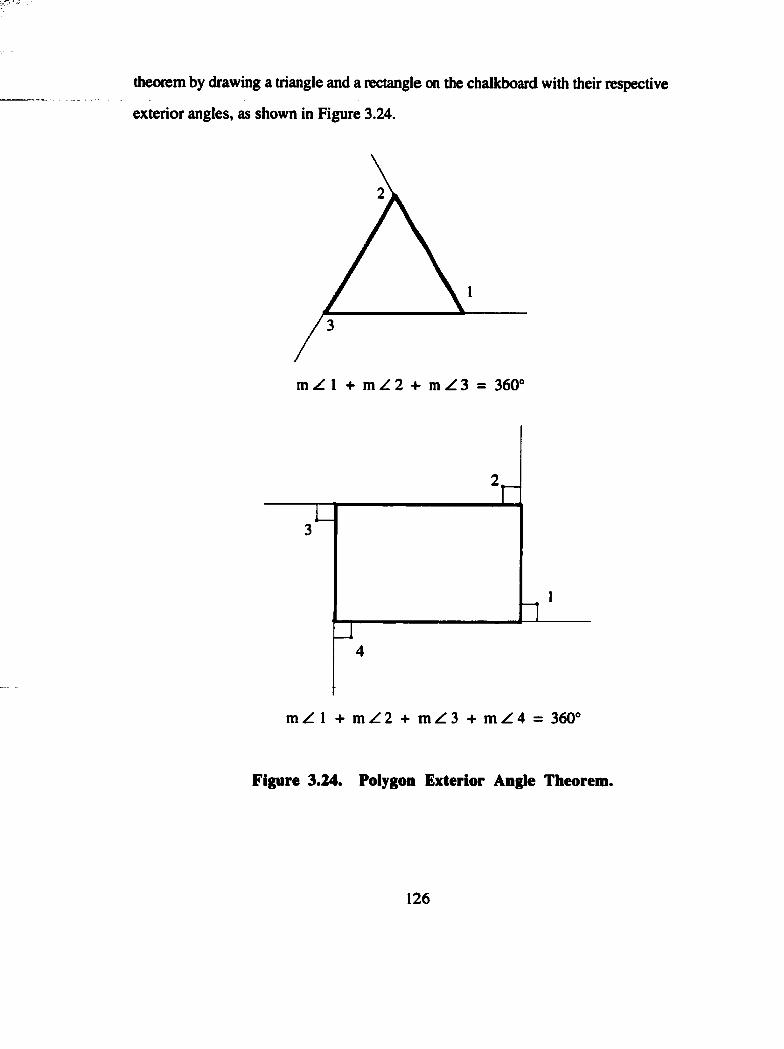
theorem by drawing a triangle and a rectangle on the chalkboard with their respective
exterior angles, as shown in Figure 3.24.
m Z I + m Z 2 + m Z 3 = 360°
m Z l + m Z 2 + m Z 3 + m Z 4 = 360°
Figure 3.24. Polygon Exterior Angle Theorem.
126
The teacher then presented the corollary to the Polygon Exterior Angle Theorem, which
shows how to find the measure of an exterior angle o f a regular polygon. The teacher
continued the lesson with an example of the Polygon Interior Angle Theorem that involved
variables. The teacher concluded the lesson with an example in which students were asked
to find how many sides a regular polygon had if they were given the measure of one of its
interior angles.
CONNECTING TH E LESSONS TO PIENES» THEORY
Dienes’ Mathematics Learning Theory served as the theoretical basis for the current
study. In this section, connections are drawn between the lesson vignettes of the
experimental group and Dienes’ Theory. Contrasts are made between lessons of the
experimental group and the control group.
Four principles constitute Dienes’ Mathematics Learning Theory: the Dynamic
Principle, the Constructivity Principle, the Mathematical Variability Principle, and the
Perceptual Variability or Multiple Embodiment Principle. When the experimental group
used Cabri, each of these principles was present nearly all of the time. Without exception,
the Dynamic Principle was present each time the students created any figure using Cabri.
Students were routinely asked to drag points and to manipulate figures as they made
conjectures using Cabri.
The Constructivity Principle was evident in some, but not all o f the lessons. While
investigating the Triangle Midsegment Theorem, for example, the student could use the
Triangle command of Cabri to construct a triangle. In cases like this, there is no
construction being performed by the student. In the case of the Trapezoid Midsegment
Theorem, however, the Constructivity Principle is evident, as students must learn how to
construct a trapezoid, rather than draw one. A construction of a trapezoid would be stable
under the drag capabilities of the software, whereas a drawing of a trapezoid could be
127
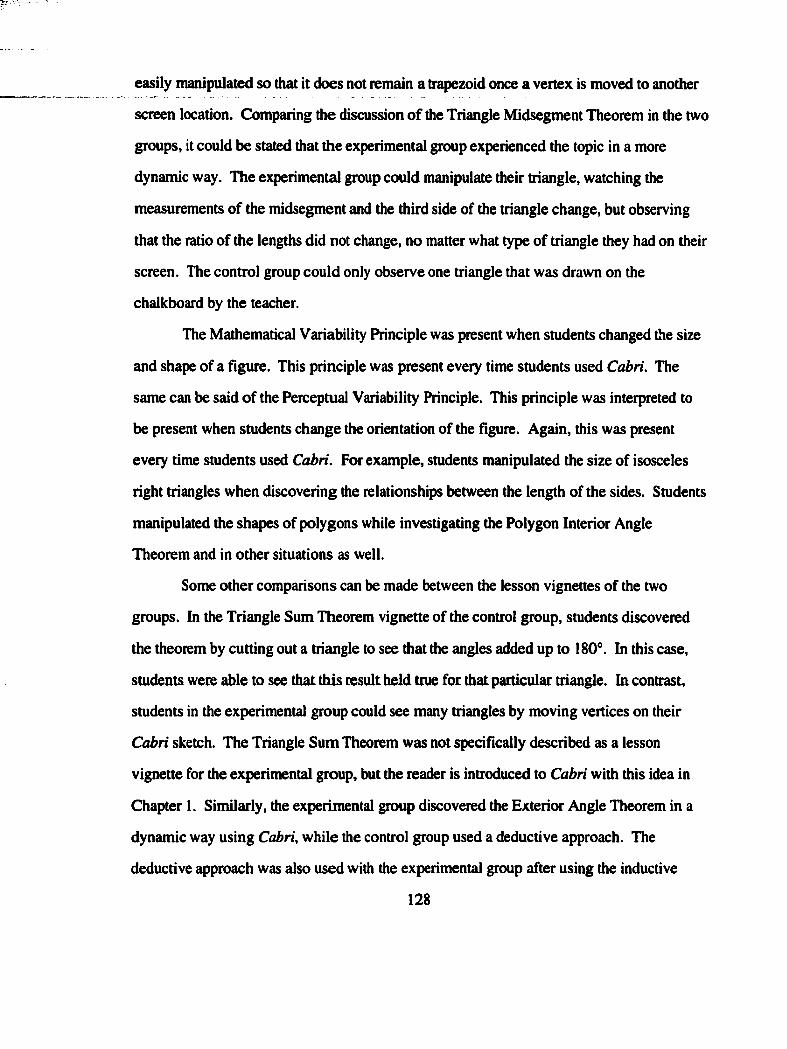
easily manipulated so that it does not remain a trapezoid once a vertex is moved to another
screen location. Comparing the discussion of the Triangle Midsegment Theorem in the two
groups, it could be stated that the experimental group experienced the topic in a more
dynamic way. The experimental group could manipulate their triangle, watching the
measurements of the midsegment and the third side of the triangle change, but observing
that the ratio of the lengths did not change, no matter what type of triangle they had on their
screen. The control group could only observe one triangle that was drawn on the
chalkboard by the teacher.
The Mathematical Variability Principle was present when students changed the size
and shape of a figure. This principle was present every time students used Cabri. The
same can be said of the Perceptual Variability Principle. This principle was interpreted to
be present when students change the orientation of the figure. Again, this was present
every time students used Cabri. For example, students manipulated the size of isosceles
right triangles when discovering the relationships between the length of the sides. Students
manipulated the shapes of polygons while investigating the Polygon Interior Angle
Theorem and in other situations as well.
Some other comparisons can be made between the lesson vignettes of the two
groups. In the Triangle Sum Theorem vignette of the control group, students discovered
the theorem by cutting out a triangle to see that the angles added up to 180°. In this case,
students were able to see that this result held true for that particular triangle. In contrast,
students in the experimental group could see many triangles by moving vertices on their
Cabri sketch. The Triangle Sum Theorem was not specifîcally described as a lesson
vignette for the experimental group, but the reader is introduced to Cabri with this idea in
Chapter I. Similarly, the experimental group discovered the Exterior Angle Theorem in a
dynamic way using Cabri, while the control group used a deductive approach. The
deductive approach was also used with the experimental group after using the inductive
128
approach with Cabri. Using Cabn, therefore, potentially enhances what students learn, as
they are able to see theorems from different perspectives.
Comparing the lessons on the points of concurrency of a triangle, the experimental
group was able to see this theorem come to life with Cabri. Rather than seeing drawings
on the chalkboard drawn by the teacher, the experimental group was able to observe the
fact, for example, that the perpendicular bisectors of the sides are concurrent. The
experimental group could see the bisectors being drawn and how they intersected at a single
point. By manipulating the triangle, they could see that the point of intersection (the
circumcenter) sometimes is located inside the triangle, sometimes outside the triangle, and
sometimes even on the triangle itself. These observations were not discussed by the
control group.
From the lesson vignettes of the experimental and control group, it seems clear that
using Cabri can only enhance the types of experiences student have when learning concepts
in geometry.
PROCEPURES
Recruitment. Intact geometry classes were used as the experimental and control
groups for the study. Students were recruited for participation in the interviews first on a
volunteer basis, and then by solicitation according to criteria described earlier in this
chapter. All students who volunteered to participate in the interviews were selected for
participation. All students who participated in the interviews were asked to return a signed
permission slip prior to the administration of the interview.
Pre-instruments. The geometry courses began on August 3 1 ,20(X) and ended on
January 19,2001. Both groups were administered the Entering Geometry Student Test on
the first day of classes. The researcher introduced the experimental group to Cabri on the
TI-92 on the fîrst day of class after students had completed the Entering Geometry Student
129
Test. Both groups were administered the Generalization Pretests (Geometry Challenge—
Form A or Geometry Challenge—Form B) at the end of the fîrst week of the course.
Instruction. As the research site has two class sets of TI-92 calculators, the
students in the experimental group were able to use their own TI-92 each time that Cabri
was used in class. The researcher used Cabri for exploration and discovery for every topic
possible in the course. Naturally, dynamic geometry software is not applicable for certain
topics in traditional geometry textbooks, such as triangle congruence proofs. Therefore,
the software was not used for every section of the textbook, but wherever applicable, it
was used to develop understanding of geometric ideas. Typically, students in the
experimental group were given a geometric object to construct using Cabri and then asked
to perform certain constructions on the object, or to take certain measurements, and in some
cases, both. Students in the experimental group were then routinely asked to make
conjectures about relationships that they observed. Students in the control group used the
same textbook, but the teacher used traditional methods of instruction in the course.
Students in the control group did not use geometry software in any form, but were
permitted to use calculators (scientific or graphing) whenever they wanted to use them.
The vignettes presented in this chapter provide examples of the type of instruction both
groups received.
Observations by the researcher served as the basis for data regarding lessons of the
experimental and control groups. Lesson plan data served as the source of data for the
experimental group, while observations of the control group by the researcher served as the
source of data for the control group.
Post-instruments. Both groups were administered the Generalization Posttests
during the last week of the course. As described earlier, students who took Form A at the
beginning of the course as a pretest took Form B at the end of the course as a posttest, and
vice versa.
130
Interviews took place from January 31, 2001 to March 14,2001. The interviews
varied in length firom approximately 40 minutes to approximately two and one half hours.
Most interviews were approximately one hour in length. The interviews were audio-taped
by the researcher. All interview candidates had a copy of the interview questions, and were
permitted to write on the interview packet if they so desired. The researcher attempted to
put each student at ease at the beginning of the interview by thanking them for being willing
to participate and by stating that they would be asked them some questions about geometry.
The students were told that some of the content would be familiar to them, but that there
were some questions that involved content that they had not studied in geometry. The
students were asked to try their best to answer each question. The students knew that the
results of the interviews could not possibly impact their course grade, as the geometry
courses had ended by the time the interviews had begun. Students were permitted to use
calculators during the interviews.
131
CHAPTER 4
DATA ANALYSIS
This chapter presents an analysis of data collected during the research study. The
internal consistency reliability of each instrument used in the study is reported. Students’
scores on the Entering Geometry Student Test, the Generalization pre- and posttests, as
well as results of the interviews are reported. Individual student perfomiances on the
interviews are reported in several tables with additional information such as course grades
and time spent on the interviews.
RELIABILITY OF INSTRUMENTS
Each of the instruments used in the study, the Entering Geometry Student Test,
Geometry Challenge—Form A (as a pretest). Geometry Challenge—Form B (as a pretest),
Geometrv Challenge—Form A (as a posttest), and Geometry Challenge—Form B (as a
posttest), and the interview tasks were examined for internal consistency. Thirty students
participated in task-based interviews after the conclusion of the course. The reliability
results (Cronbach’s Alpha) of all of the instruments in the study are presented in Table 4.1.
As all of the values of Cronbach’s Alpha are higher than .70, with most being greater than
.80, it can be stated that the reliability of the instruments used in the study is of an
acceptable value.
132
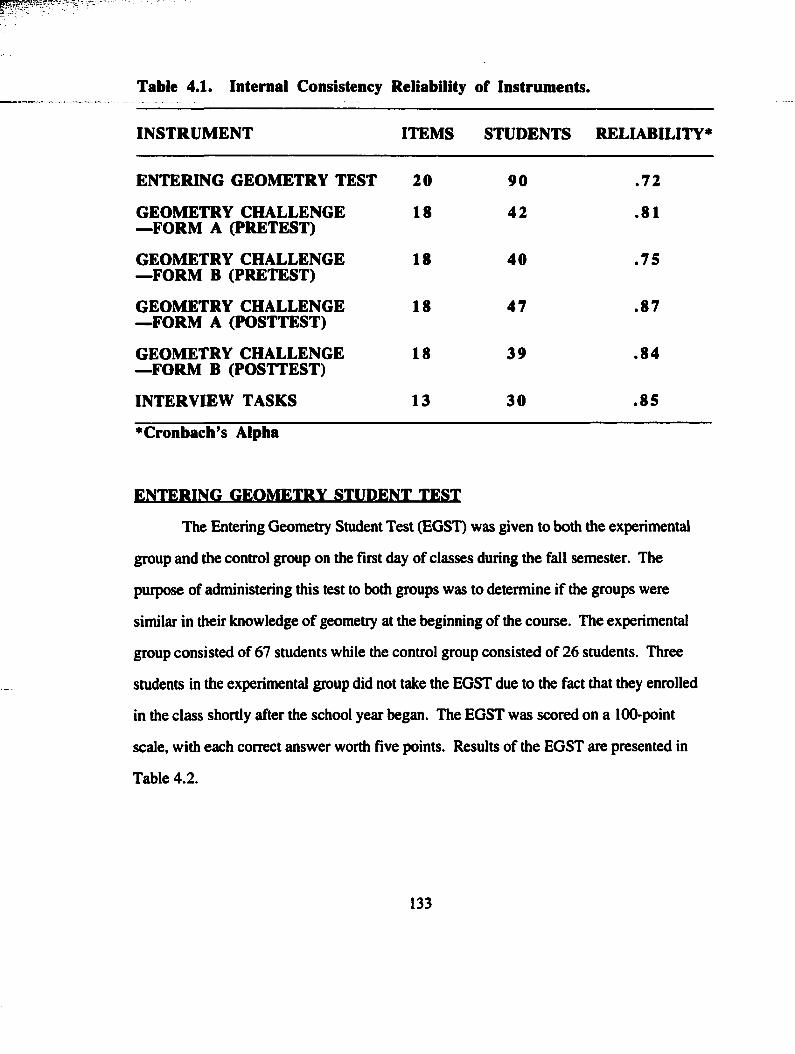
Table 4.1. Internai Consistency Reliability of Instruments.
INSTRUMENT ITEMS STUDENTS RELIABILITY*
ENTERING GEOMETRY TEST 20 90 .72
GEOMETRY CHALLENGE —FORM A (PRETEST)
18 42 .81
GEOMETRY CHALLENGE —FORM B (PRETEST)
18 40 .75
GEOMETRY CHALLENGE —FORM A (POSTTEST)
18 47 .87
GEOMETRY CHALLENGE —FORM B (POSTTEST)
18 39 .84
INTERVIEW TASKS 13 30 .85
*Cronbach’s Alpha
ENTERING GEOMETRY STUDENT TEST
The Entering Geometry Student Test (HOST) was given to both the experimental
group and the control group on the first day of classes during the fall semester. The
purpose of administering this test to both groups was to determine if the groups were
similar in their knowledge of geometry at the beginning of the course. The experimental
group consisted of 67 students while the control group consisted of 26 students. Three
students in the experimental group did not take the HOST due to the fact that they enrolled
in the class shortly after the school year began. The EGST was scored on a 100-point
scale, with each correct answer worth rive points. Results of the EGST are presented in
Table 4.2.
133
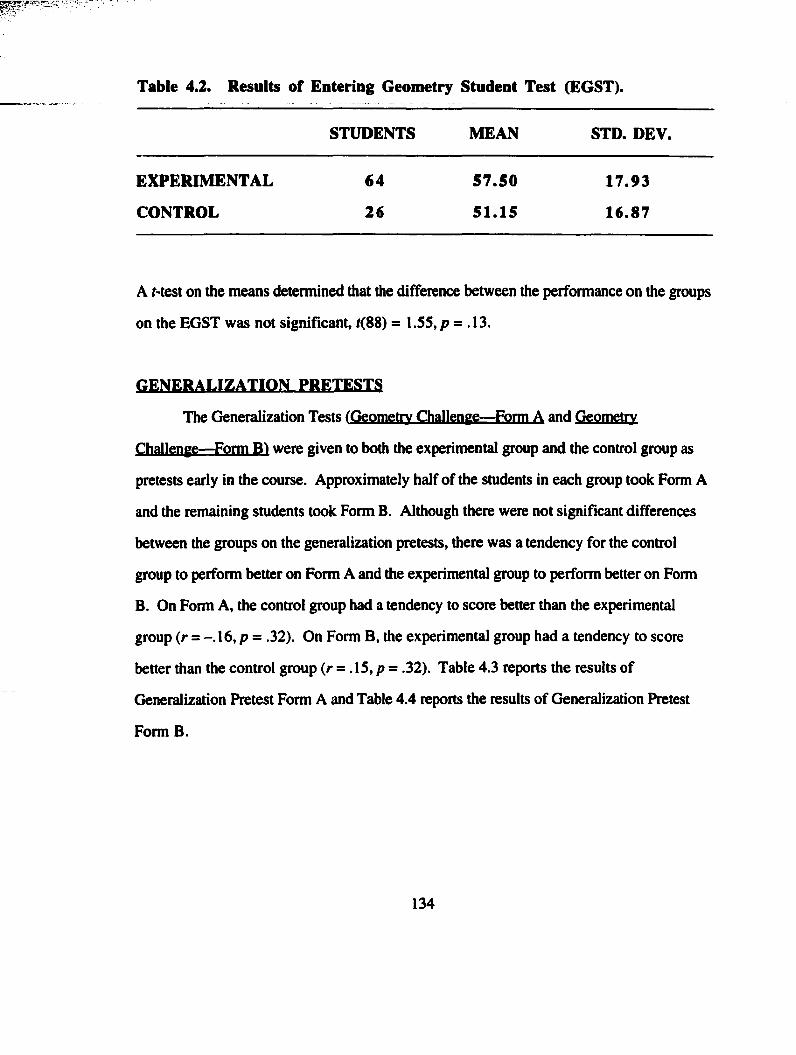
Table 4.2. Results of Entering Geometry Student Test (EGST).
STUDENTS MEAN STD. DEV.
EXPERIMENTAL 64 57 .50 17.93
CONTROL 26 51.15 16.87
A Hest on the means determined that the difference between the performance on the groups
on the EGST was not significant, /(88) = 1.55, p = .13.
GENERALIZATION PRETESTS
The Generalization Tests (Geometry Challenge—Form A and Geometry
Challenge—Form B) were given to both the experimental group and the control group as
pretests early in the course. Approximately half of the students in each group took Form A
and the remaining students took Form B. Although there were not signiAcant differences
between the groups on the generalization pretests, there was a tendency for the control
group to perform better on Form A and the experimental group to perform better on Form
B. On Form A, the control group had a tendency to score better than the experimental
group (r = - . 16, p = .32). On Form B, the experimental group had a tendency to score
better than the control group (r = . 15, p = .32). Table 4.3 reports the results of
Generalization Pretest Form A and Table 4.4 reports the results of Generalization Pretest
Form B.
134
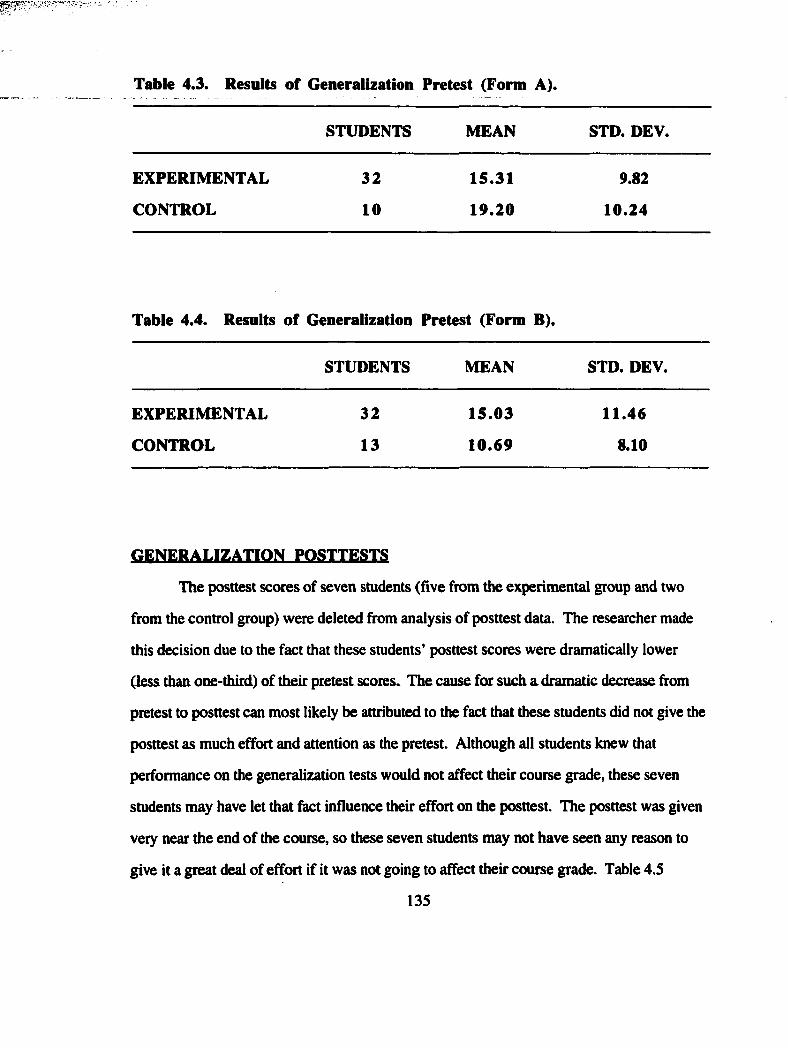
Table 4.3. Results of Generalization Pretest (Form A).
STUDENTS MEAN STD. DEV.
EXPERIMENTAL 32 15.31 9.82
CONTROL 10 19.20 10.24
Table 4.4. Results of Generalization Pretest (Form B).
STUDENTS MEAN STD. DEV.
EXPERIMENTAL 32 15.03 11.46
CONTROL 13 10.69 8.10
GENERALIZATION POSTTESTS
The posttest scores of seven students (five from the experimental group and two
from the control group) were deleted from analysis of posttest data. The researcher made
this decision due to the fact that these students’ posttest scores were dramatically lower
(less than one-third) of their pretest scores. The cause for such a dramatic decrease from
pretest to posttest can most likely be attributed to the fact that these students did not give the
posttest as much effort and attention as the pretest. Although all students knew that
performance on the generalization tests would not affect their course grade, these seven
students may have let that fact influence their effort on the posttest. The posttest was given
very near the end of the course, so these seven students may not have seen any reason to
give it a great deal of effort if it was not going to affect their course grade. Table 4.5
135
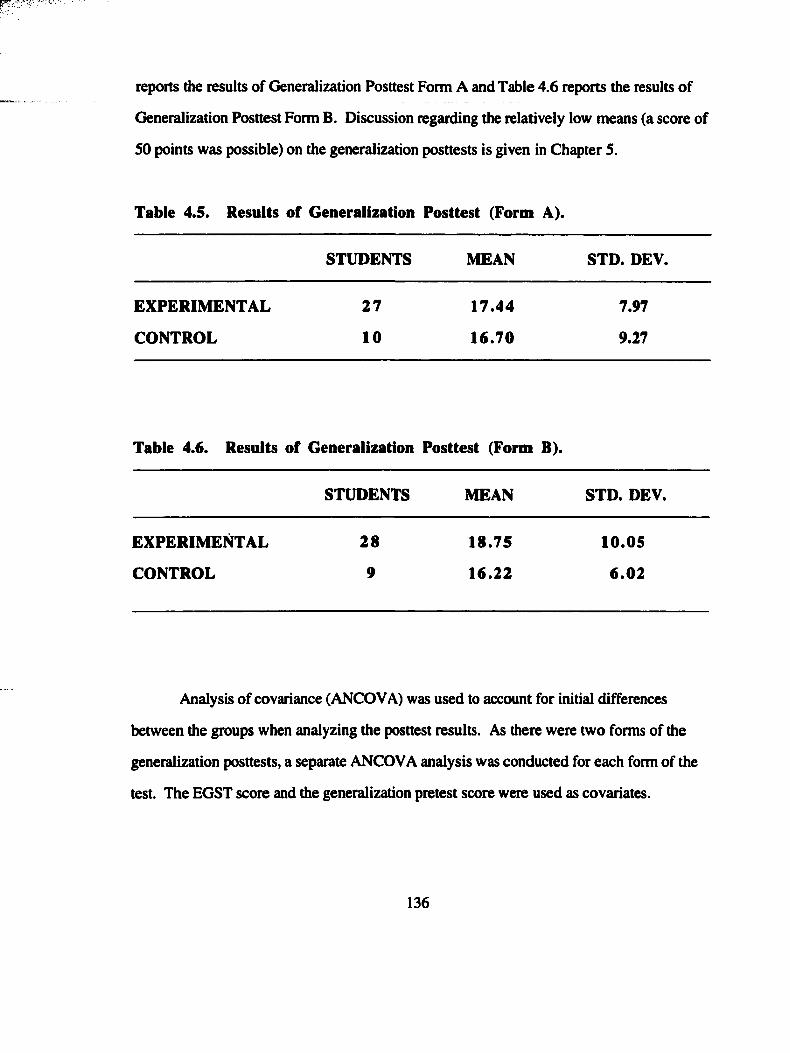
reports the results of Generalization Posttest Form A and Table 4.6 reports the results of
Generalization Posttest Form B. Discussion regarding the relatively low means (a score of
SO points was possible) on the generalization posttests is given in Chapter 5.
Table 4.5. Results of Generalization Posttest (Form A).
STUDENTS MEAN STD. DEV.
EXPERIMENTAL 27 17.44 7.97
CONTROL 10 16.70 9.27
Table 4.6. Results of Generalization Posttest (Form B).
STUDENTS MEAN STD. DEV.
EXPERIMENTAL 28 18.75 10.05
CONTROL 9 16.22 6 .02
Analysis of covariance (ANCOVA) was used to account for initial differences
between the groups when analyzing the posttest results. As there were two forms of the
generalization posttests, a separate ANCOVA analysis was conducted for each form of the
test. The EGST score and the generalization pretest score were used as covariates.
136
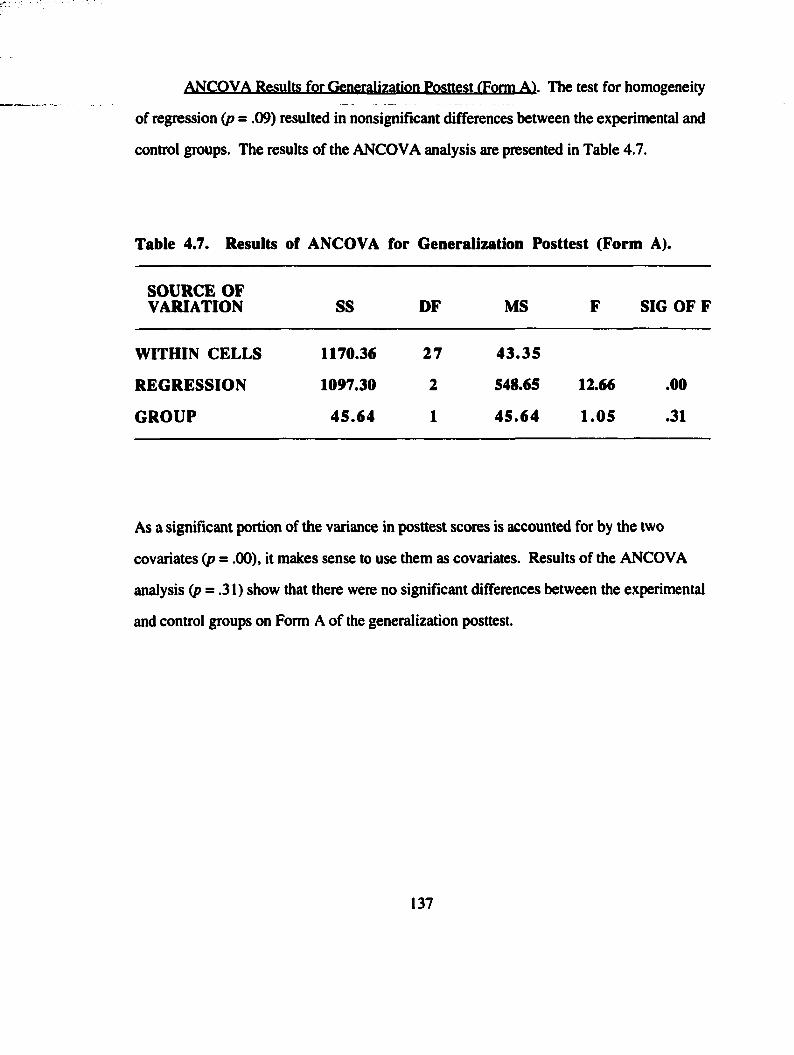
ANCOVA Results for Generalization Posttest (Form A). The test for homogeneity
of regression {p - .09) resulted in nonsignifîcant differences between the experimental and
control groups. The results of the ANCOVA analysis are presented in Table 4.7.
Table 4.7. Results of ANCOVA for Generalization Posttest (Form A).
SOURCE OF VARIATION SS DF MS F SIG OF F
WITHIN CELLS 1170.36 27 43.35
REGRESSION 1097.30 2 548.65 12.66 .00
GROUP 45.64 1 45 .64 1.05 .31
As a significant portion of the variance in posttest scores is accounted for by the two
covariates {p - .00), it makes sense to use them as covariates. Results of the ANCOVA
analysis (p = .31) show that there were no significant differences between the experimental
and control groups on Form A of the generalization posttest.
137
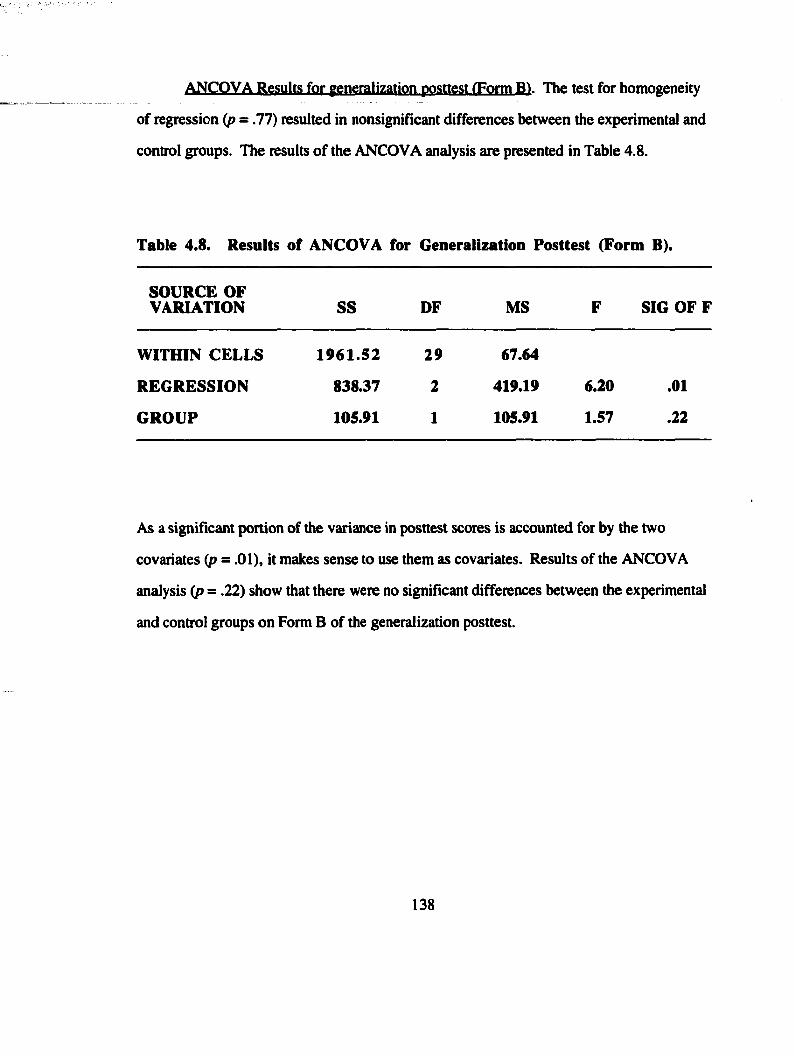
ANCOVA Results for generalization posttest (Form B). The test for homogeneity
of regression {p = .77) resulted in nonsignifîcant differences between the experimental and
control groups. The results of the ANCOVA analysis are presented in Table 4.8.
Table 4.8. Results of ANCOVA for Generalization Posttest (Form B).
SOURCE OF VARIATION SS DF MS F SIG OF F
WITHIN CELLS 1961.52 29 67.64
REGRESSION 838.37 2 419.19 6.20 .01
GROUP 105.91 1 105.91 1.57 .22
As a significant portion of the variance in posttest scores is accounted for by the two
covariates (p = .01), it makes sense to use them as covariates. Results of the ANCOVA
analysis (p = .22) show that there were no significant differences between the experimental
and control groups on Form B of the generalization posttest.
138
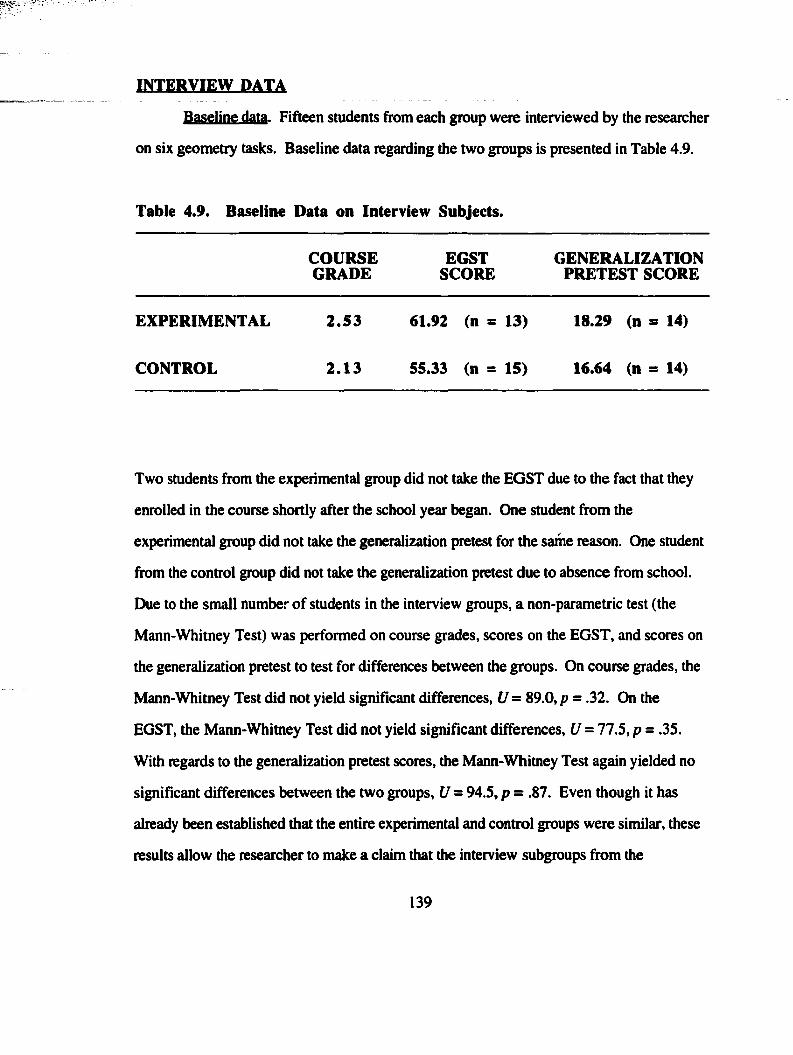
INTERVIEW DATA
Baseline data. Fifteen students from each group were interviewed by the researcher
on six geometry tasks. Baseline data regarding the two groups is presented in Table 4.9.
Table 4.9. Baseline Data on Interview Subjects.
COURSE EGST GENERALIZATIONGRADE SCORE PRETEST SCORE
EXPERIMENTAL 2.53 61.92 (n = 13) 18.29 (n = 14)
CONTROL 2.13 55.33 (n = 15) 16.64 (n = 14)
Two students from the experimental group did not take the EGST due to the fact that they
enrolled in the course shortly after the school year began. One student from the
experimental group did not take the generalization pretest for the same reason. One student
from the control group did not take the generalization pretest due to absence from school.
Due to the small number of students in the interview groups, a non parametric test (the
Mann-Whitney Test) was performed on course grades, scores on the EGST, and scores on
the generalization pretest to test for differences between the groups. On course grades, the
Mann-Whimey Test did not yield signifîcant differences, U = 89.0, p = .32. On the
EGST, the Mann-Whitney Test did not yield significant differences, U = 77.5, p = .35.
With regards to the generalization pretest scores, the Mann-Whimey Test again yielded no
significant differences between the two groups, U - 94.5, p = .87. Even though it has
already been established that the entire experimental and control groups were similar, these
results allow the researcher to make a claim that the interview subgroups from the
139
experimental and control groups were also similar. All thirty students in the interview
subgroups participated in the interviews, so all data was included in the analyses in the
upcoming sections.
Scoring. The interviews were scored by the researcher by means of sorting student
responses into high, medium, and low response categories. A rubric describing essential
elements of each level of response as well as sample responses is given for each interview
task. Summary data for each group is organized in a table. A chi-square test of
independence (Siegel, 1956; Ferguson, 1959; Fraenkel & Wallen, 1990; Hopkins, Glass,
& Hopkins, 1987) was performed on the summary data for each task to determine if there
was a significant relationship (p < 0.05) between group membership and performance on
the interview tasks. Siegel (1956) discusses the requirements for the use of the chi-square
test. Siegel uses Cochran’s (1954) criteria: fewer than 20 percent of the cells should have
an expected frequency of less than 5, and no cells should have an expected frequency of
less than 1. The current study violates the first criterion in all cases and the second one in
three cases. The researcher followed the recommendations of Roscoe and Briars (1971)
which state that the average expected frequency should be equal to n/k where n is the
sample size (in this case 30), and k is the number of cells (in this case 6). Following this
rule, the average expected frequency for this analysis is five, which is satisfied in the
current study.
Inter-rater reliability. A colleague of the researcher (a recent graduate of the
mathematics education doctoral program at the same university) assisted in documenting
inter-rater reliability. Creswell (1994) discusses the need for another investigator to audit
key decisions made by the researcher and validate that they were good decisions. The
responses of six students (three from the experimental group and three from the control
group) were examined by the colleague of the researcher. The six students were randomly
selected from the groups. The group membership of each student was unknown to the
140
colleague. As each interview consisted of thirteen components (one each for Tasks 1
through Task 5, and eight for Task 6), a total of 78 student responses were examined. The
researcher and his colleague agreed on 72 out of the 78 responses, for an inter-rater
reliability rate of 92.3%. After discussion of the six responses on which there was
disagreement, all six differences were resolved. Five of the six researcher’s ratings
remained the same and one was changed.
TASK PY TASK ANALYStS-OLJNIER-VIEW. D ATA
In the next section, each task is presented, including a rubric identifying
sample responses for each category, and the results of the chi-square analysis.
Following the individual tasks, a summary table of all of the chi-square results is
presented.
141
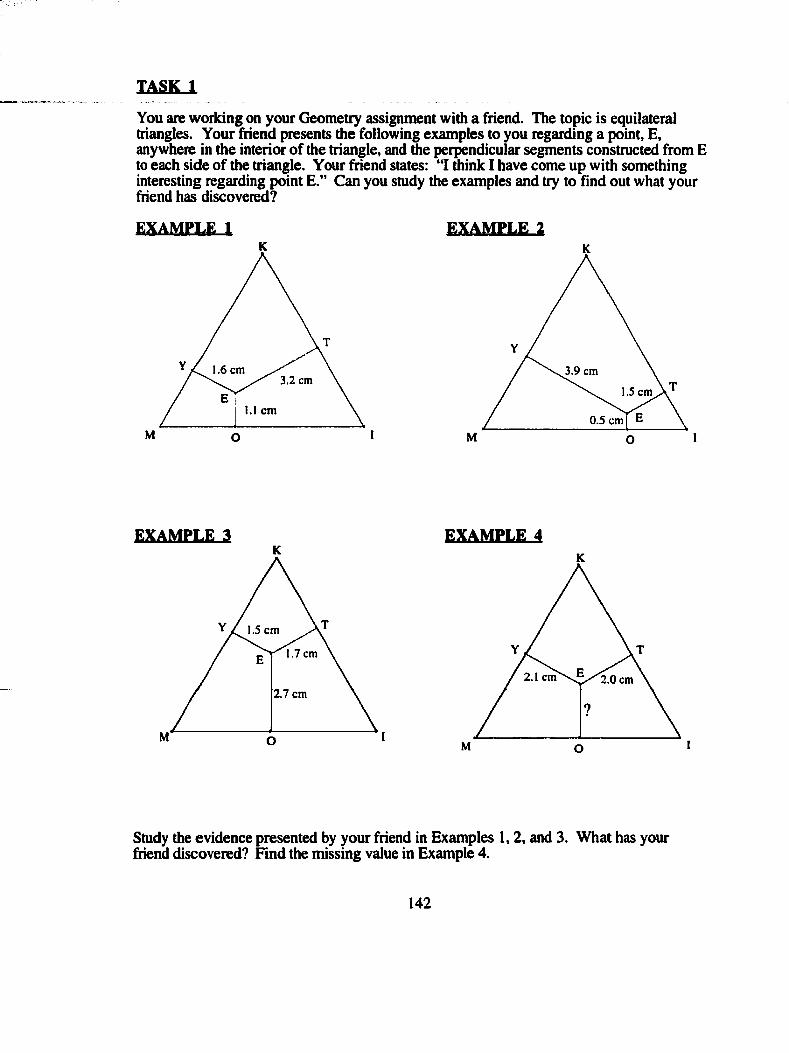
TASK 1
You are working on your Geometry assignment with a friend. The topic is equilateral triangles. Your friend presents the following examples to you regarding a point, E, anywhere in the interior of the triangle, and the perpendicular segments constructed from E to each side of the triangle. Your friend states; “I think I have come up with something interesting regarding point E." Can you study the examples and try to find out what your friend has discovered?
EXAMPLE I EXAMPLE 2
1.6 cm3.2 cm
1.1 cm
M IO
3.9 cm
1.5 cm
0.5 cmM O
EXAMPLE 3 EXAMPLE 4
1.5 cm
1.7 cm
2.7 cm
M
2.1 cm 2.0 cm
IM O
Study the evidence presented by your friend in Examples 1,2, and 3. What has your friend discovered? Find the missing value in Example 4.
142
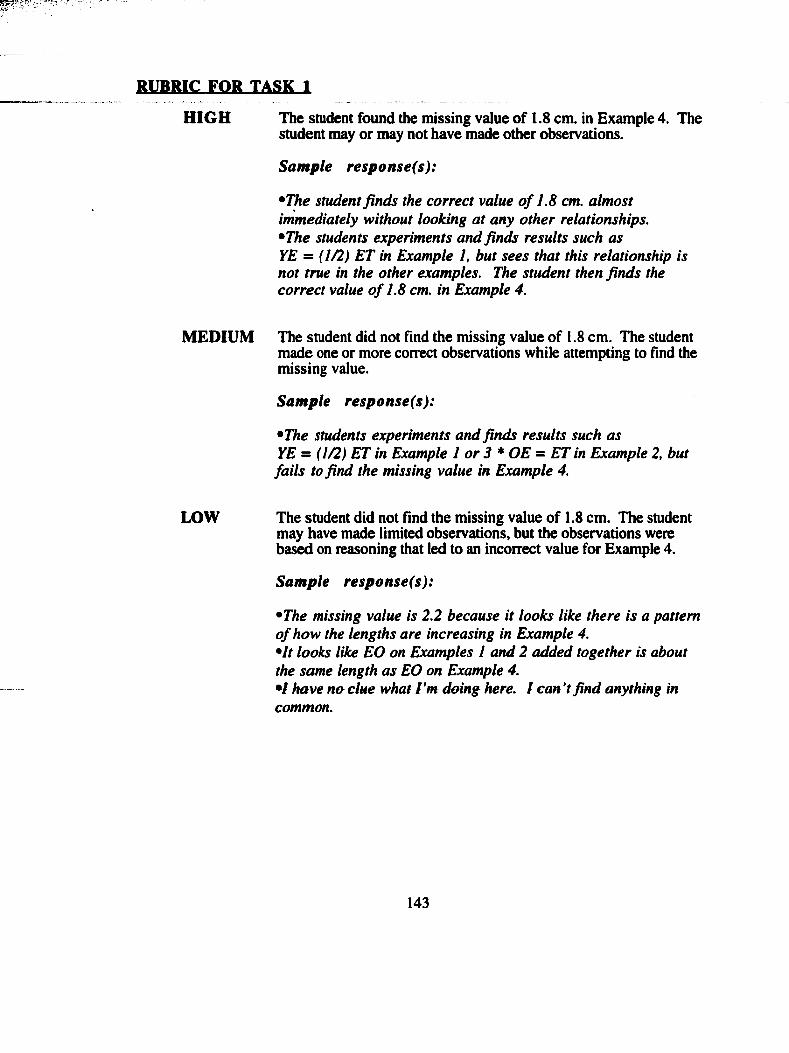
RUBRIC FOR TASK 1
H IG H The student found the missing value of 1.8 cm. in Example 4. The student may or may not have made other observations.
Sample response(s):
•The student finds the correct value o f 1.8 cm. almost immediately without looking at any other relationships.•The students experiments and finds results such as YE — {1/2) ET in Example I, but sees that this relationship is not true in the other examples. The student then finds the correct value o f 1.8 cm. in Example 4.
MEDIUM The student did not find the missing value of 1.8 cm. The student made one or more correct observations while attempting to find the missing value.
Sample response(s):
•The students experiments and finds results such asYE = ( 1/2) ET in Example I or 3 * OE = ET in Example 2, butfails to find the missing value in Example 4.
LOW The student did not find the missing value of 1.8 cm. The studentmay have made limited observations, but the observations were based on reasoning that led to an incorrect value for Example 4.
Sample response(s):
•The missing value is 2.2 because it looks like there is a pattern o f how the lengths are increasing in Example 4.•It looks like EO on Examples I and 2 added together is about the same length as EO on Example 4.•I have no clue what I ’m doing here. I can't find anything in common.
143
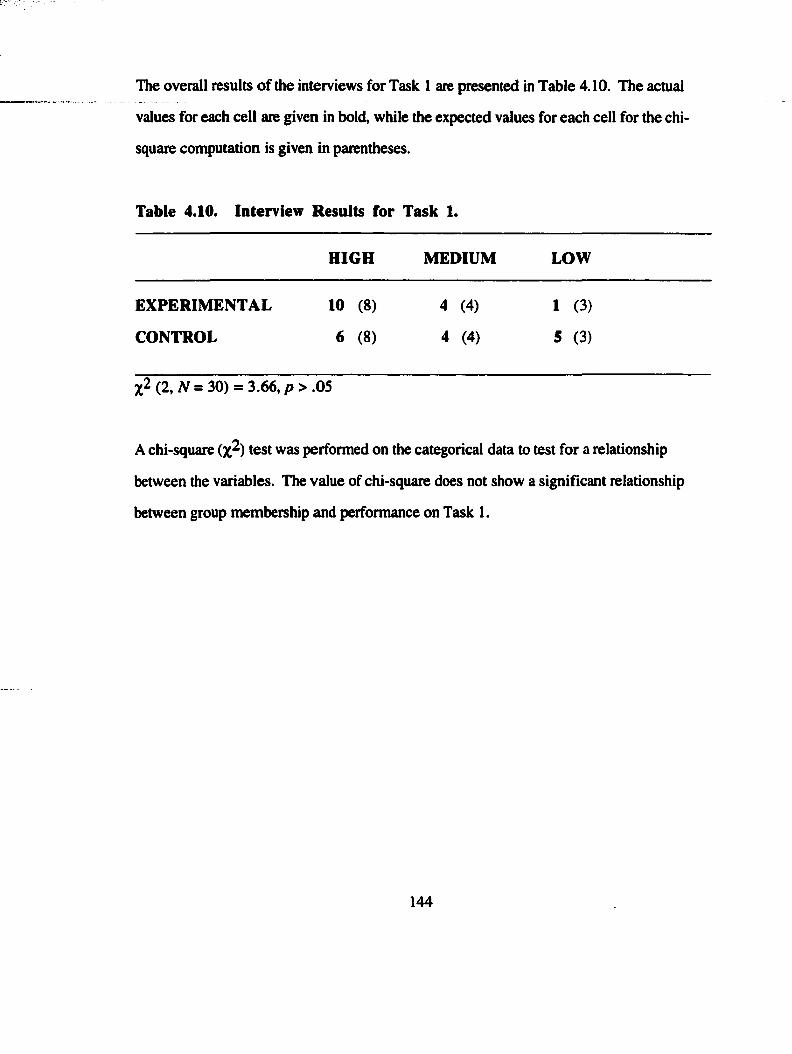
The overall results of the interviews for Task 1 are presented in Table 4.10. The actual
values for each cell are given in bold, while the expected values for each cell for the chi-
square computation is given in parentheses.
Table 4.10. Interview Results for Task 1.
H IG H MEDIUM LOW
EXPERIM ENTAL 10 (8) 4 (4) 1 (3)
CONTROL 6 (8) 4 (4) 5 (3)
(2,A^=30) = 3 .6 6 ,p > .0 5
A chi-square (% )̂ test was performed on the categorical data to test for a relationship
between the variables. The value of chi-square does not show a signifîcant relationship
between group membership and performance on Task 1.
144
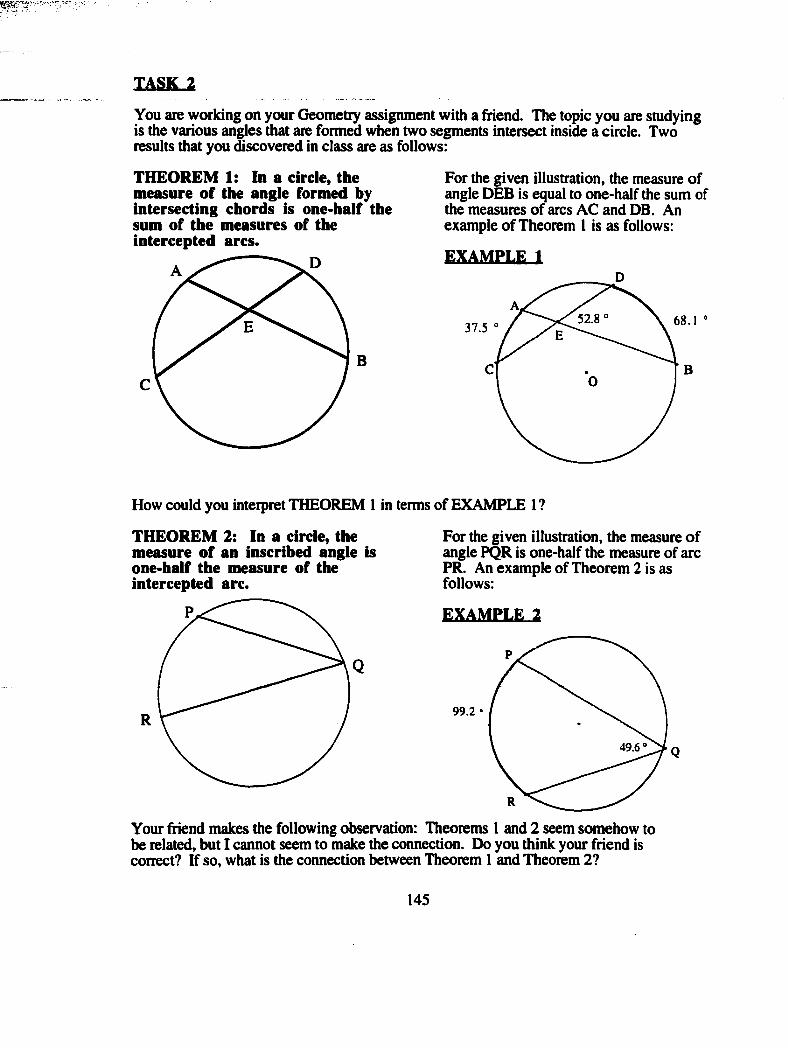
TASK 2
You are working on your Geometry assignment with a friend. The topic you are studying is the various angles that are formed when two segments intersect inside a circle. Two results that you discovered in class are as follows:
THEOREM 1: In a circle, the measure of the angle formed by Intersecting chords Is one-half the sum of the measures of the Intercepted arcs.
C
For the given illustration, the measure of angle DEB is equal to one-half the sum of the measures of arcs AC and DB. An example of Theorem 1 is as follows:
EXAMPLE 1
B
52.837.5 “
How could you interpret THEOREM 1 in terms of EXAMPLE 1 ?
THEOREM 2: In a circle, the measure of an Inscribed angle Is one-half the measure of the Intercepted arc.
R
For the given illustration, the measure of angle PQR is one-half the measure of arc PR. An example of Theorem 2 is as follows:
EXAMPLE 2
99.2 “
4 9 .6“
Your fnend makes the following observation: Theorems 1 and 2 seem somehow to be related, but I cannot seem to make the connection. Do you think your friend is correct? If so, what is the connection between Theorem 1 and Theorem 2?
145
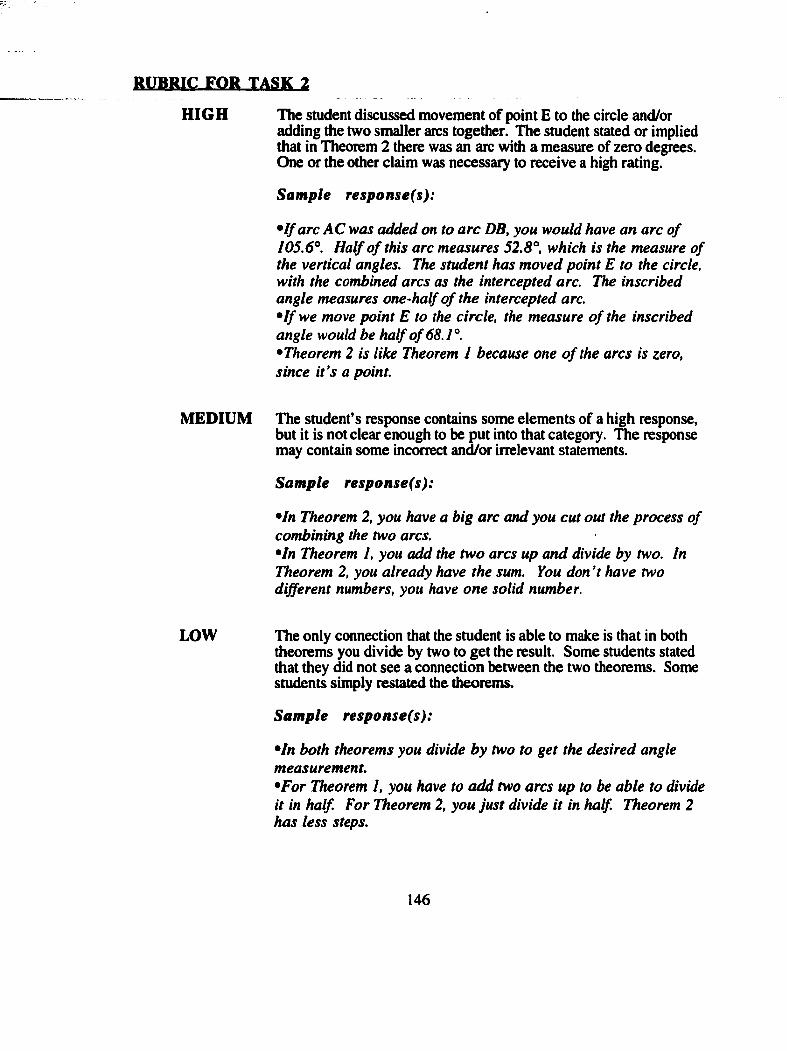
RUBRIC FOR TASK 2
H IG H The student discussed movement of point E to the circle and/oradding the two smaller arcs together. The student stated or implied that in Theorem 2 there was an arc with a measure of zero degrees. One or the other claim was necessary to receive a high rating.
Sample response(s):
• I f arc AC was added on to arc DB, you would have an arc o f 105.6°. Half o f this arc measures 52.8°, which is the measure of the vertical angles. The student has moved point E to the circle, with the combined arcs as the intercepted arc. The inscribed angle measures one-half o f the intercepted arc.• I f we move point E to the circle, the measure o f the inscribed angle would be half o f 68.1°.•Theorem 2 is like Theorem I because one o f the arcs is zero, since it’s a point.
MEDIUM The student’s response contains some elements of a high response, but it is not clear enough to be put into that category. The response may contain some incorrect and/or irrelevant statements.
Sample response(s):
•In Theorem 2, you have a big arc and you cut out the process of combining the two arcs.•In Theorem 1, you add the two arcs up and divide by two. In Theorem 2, you already have the sum. You don’t have two different numbers, you have one solid number.
LOW The only connection that the student is able to make is that in boththeorems you divide by two to get the result. Some students stated that they did not see a connection between the two theorems. Some students simply restated the theorems.
Sample response(s):
•In both theorems you divide by two to get the desired angle measurement.•For Theorem I, you have to add two arcs up to be able to divide it in half. For Theorem 2, you just divide it in half. Theorem 2 has less steps.
146
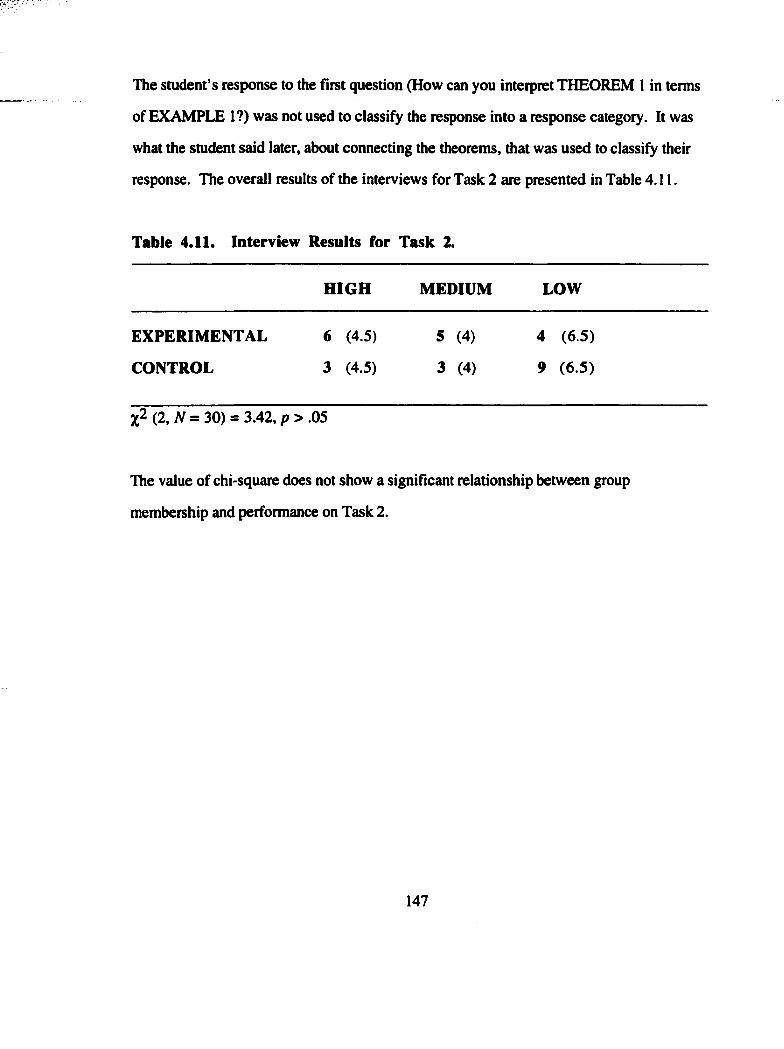
The student’s response to the first question (How can you interpret THEOREM 1 in terms
of EXAMPLE 1?) was not used to classify the response into a response category. It was
what the student said later, about connecting the theorems, that was used to classify their
response. The overall results of the interviews for Task 2 are presented in Table 4.11.
Table 4.11. Interview Results for Task 2.
HIGH MEDIUM LOW
EXPERIMENTAL 6 (4.5) 5 (4) 4 (6.5)
CONTROL 3 (4.5) 3 (4) 9 (6.5)
(2, N = 3 0 )- 3.42, p > .05
The value of chi-square does not show a significant relationship between group
membership and performance on Task 2.
147
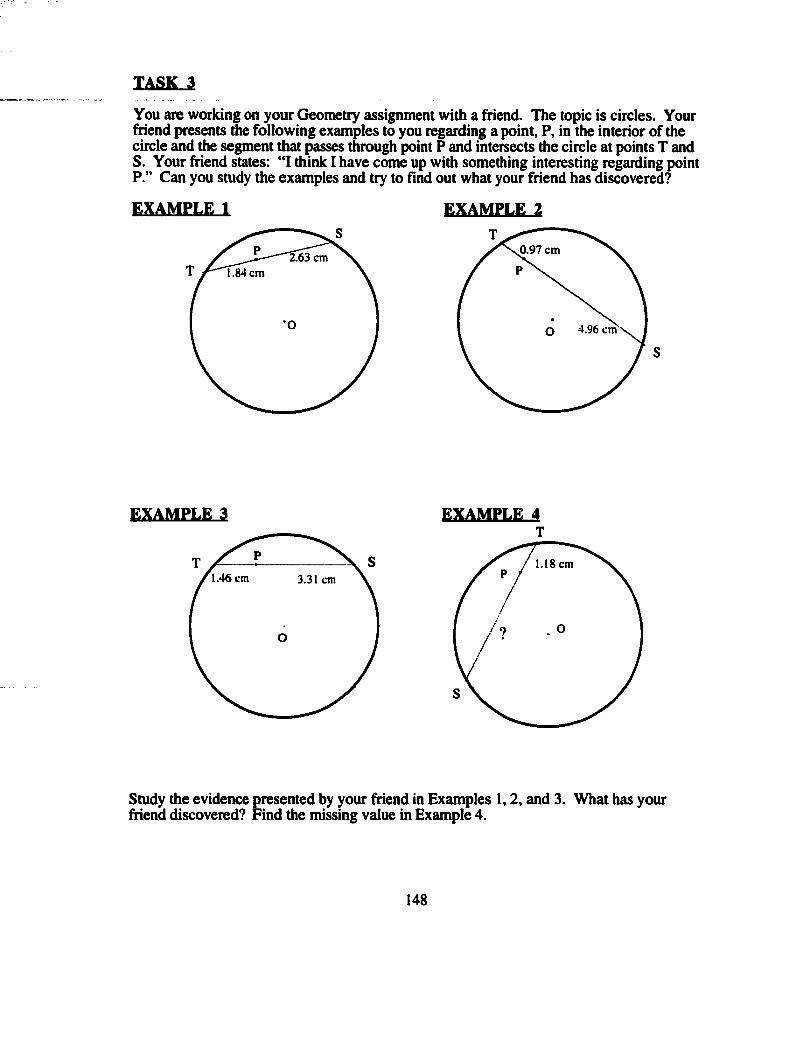
IASK.3
You are working on your Geometry assignment with a friend. The topic is circles. Your friend presents die following examples to you regarding a point, P, in the interior of the circle and the segment that passes through point P and intersects the circle at points T and S. Your friend states: ‘T think I have come up with something interesting regarding point P.” Can you study the examples and try to find out what your friend has discovered?
EXAMPLE 1
2.63 cm1.84 cm
*0
EXAMPLE 2
0.97 cm
4.96 cm
EXAMPLE 3 EXAMPLE 4
1.46 cm 3.31 cm1.18 cm
Study the evidence presented by your friend in Examples 1,2, and 3. What has your friend discovered? Find the missing value in Example 4.
148
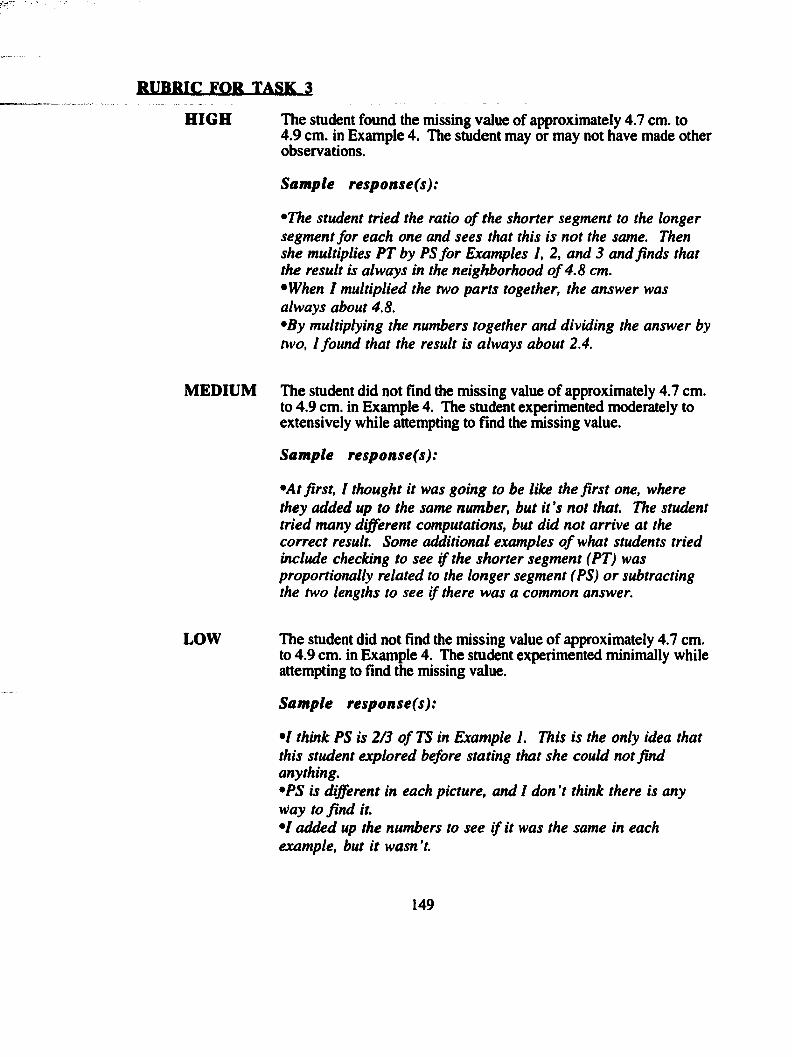
RUBRIC FOR TASK 3
H IG H The student found the missing value of approximately 4.7 cm. to4.9 cm. in Example 4. The student may or may not have made other observations.
Sample response(s):
•The student tried the ratio o f the shorter segment to the longer segment for each one and sees that this is not the same. Then she multiplies PT by PS for Examples 1, 2, and 3 and finds that the result is always in the neighborhood o f 4.8 cm.•When I multiplied the two parts together, the answer was always about 4.8.•By multiplying the numbers together and dividing the answer by two, I found that the result is always about 2.4.
MEDIUM The student did not And the missing value of approximately 4.7 cm.to 4.9 cm. in Example 4. The student experimented moderately to extensively while attempting to And the missing value.
Sample response(s):
•At first, I thought it was going to be like the first one, where they added up to the same number, but i t’s not that. The student tried many different computations, but did not arrive at the correct result. Some additional examples o f what students tried include checking to see if the shorter segment (PT) was proportionally related to the longer segment (PS) or subtracting the two lengths to see if there was a common answer.
LOW The student did not find the missing value of approximately 4.7 cm. to 4.9 cm. in Example 4. The student experimented minimally while attempting to find the missing value.
Sample response(s):
•I think PS is 2/3 o f TS in Example 1. This is the only idea that this student explored before stating that she could not find anything.•PS is different in each picture, and I don't think there is any way to find it.•I added up the numbers to see if it was the same in each example, but it wasn’t.
149
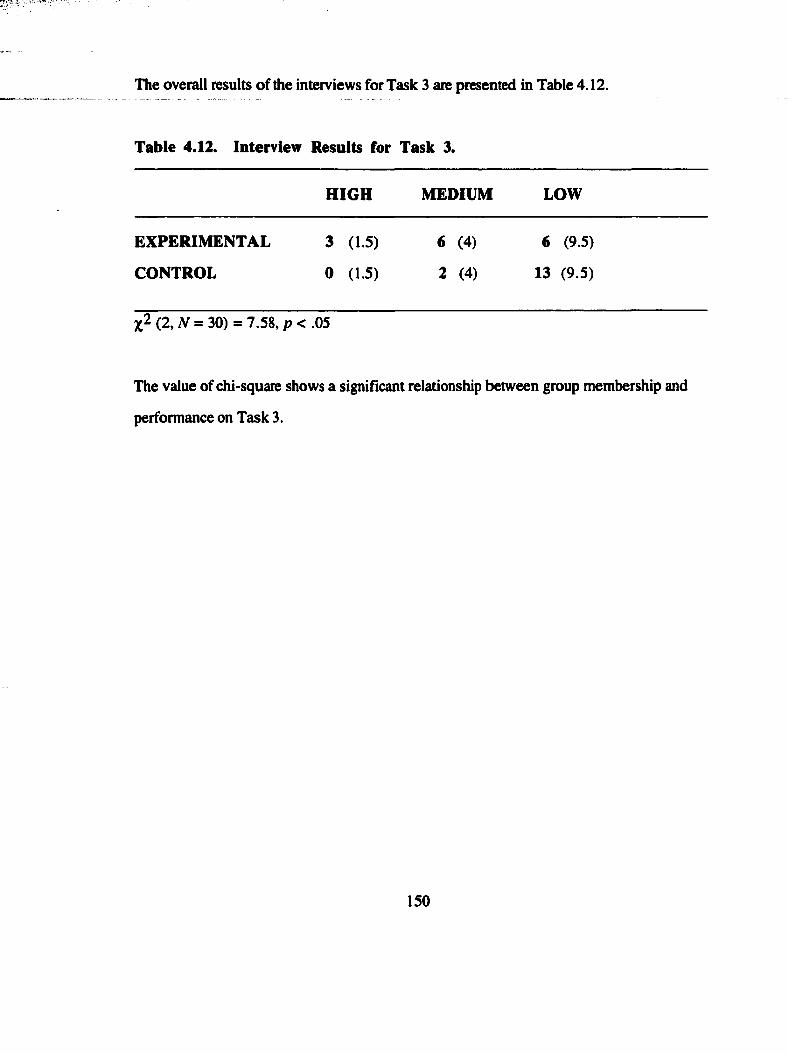
The overall results of the interviews for Task 3 are presented in Table 4.12.
Table 4.12. Interview Results for Task 3.
H IG H MEDIUM LOW
EXPERIM ENTAL 3 (1.5) 6 (4) 6 (9.5)
CONTROL 0 (1.5) 2 (4) 13 (9.5)
(2, N=3Q) = 7.58, p < .05
The value of chi-square shows a signifîcant relationship between group membership and
performance on Task 3.
150
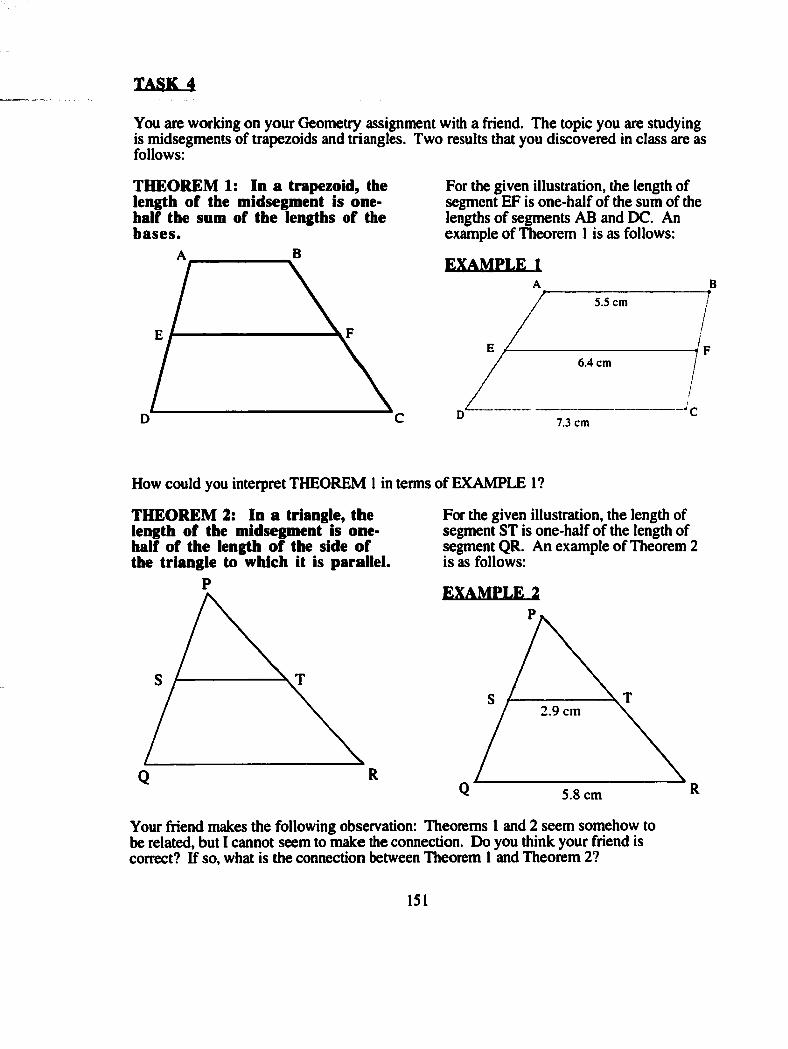
TASK 4
You are working on your Geometry assignment with a friend. The topic you are studying is midsegments of trapezoids and triangles. Two results that you discovered in class are as follows:
THEOREM 1: In a trapezoid, the length of the midsegment Is one- half the sum of the lengths of the bases.
For the given illustration, the length of segment EF is one half of the sum of the lengths of segments AB and DC. An example of Theorem 1 is as follows:
EXAMPLE 1A
5.5 cm
6.4 cm
7.3 cm
How could you interpret THEOREM 1 in terms of EXAMPLE 1?
THEOREM 2: In a triangle, the length of the midsegment is one- half of the length of the side of the triangle to which it is parallel.
P
RQ
For the given illustration, the length of segment ST is one-half of the length of segment QR. An example of Theorem 2 is as follows:
EXAMPLE 2
2.9 cm
Q 5.8 cm
Your friend makes the following observation: Theorems 1 and 2 seem somehow to be related, but I cannot seem to make the connection. Do you think your friend is correct? If so, what is the connection between Theorem 1 and Theorem 2?
151
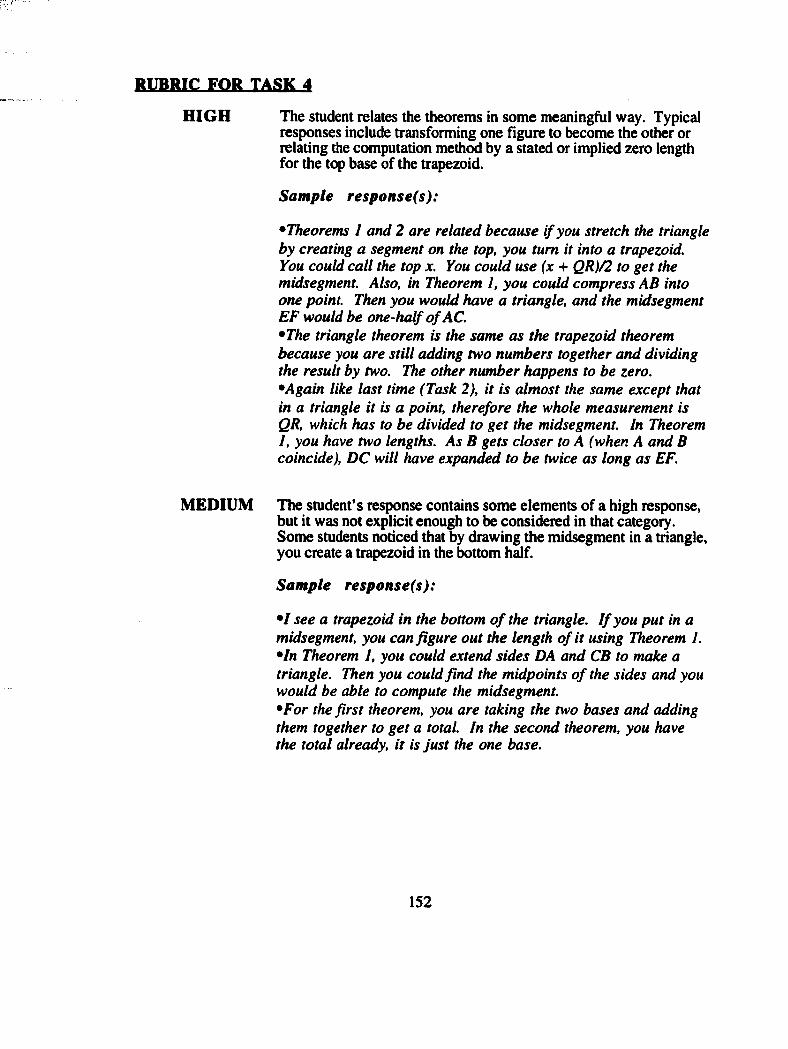
MIBRIC EQR TASK 4H IG H The student relates the theorems in some meaningful way. Typical
responses include transforming one fîgure to become the other or relating the computation method by a stated or implied zero length for the top base of the trapezoid.
Sample response(s):
•Theorems I and 2 are related because if you stretch the triangle by creating a segment on the top, you turn it into a trapezoid.You could call the top x. You could use (x + QR)/2 to get the midsegment. Also, in Theorem 1, you could compress AB into one point. Then you would have a triangle, and the midsegment EF would be one-half o f AC.•The triangle theorem is the same as the trapezoid theorem because you are still adding two numbers together and dividing the result by two. The other number happens to be zero.•Again like last time (Task 2), it is almost the same except that in a triangle it is a point, therefore the whole measurement is QR, which has to be divided to get the midsegment. In Theorem I, you have two lengths. As B gets closer to A (when A and B coincide), DC will have expanded to be twice as long as EF.
M EDIUM The student’s response contains some elements of a high response, but it was not explicit enough to be considered in that category. Some students noticed that by drawing the midsegment in a triangle, you create a trapezoid in the bottom half.
Sample response(s):
• I see a trapezoid in the bottom o f the triangle. I f you put in a midsegment, you can figure out the length o f it using Theorem I. •In Theorem I, you could extend sides DA and CB to make a triangle. Then you could find the midpoints o f the sides and you would be able to compute the midsegment.•For the first theorem, you are taking the two bases and adding them together to get a total. In the second theorem, you have the total already, it is just the one base.
152
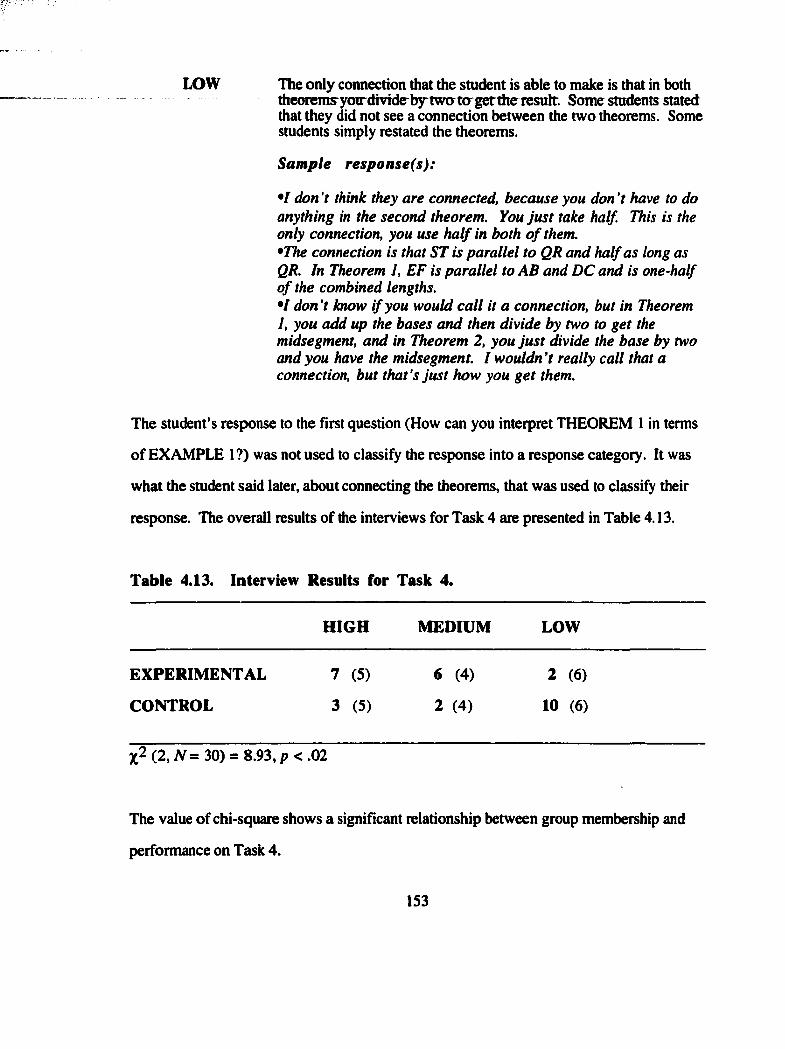
LOW The only connection that the student is able to make is that in boththeorems^yomdmde^bjrtwatagetthrresult Some students stated that they did not see a connection between the two theorems. Some students simply restated the theorems.
Sample response(s):
• / don't think they are connected, because you don’t have to do anything in the second theorem. You ju st take half. This is the only connection, you use half in both o f them.•The connection is that ST is parallel to QR and half as long as QR. In Theorem I, EF is parallel to AB and DC and is one-half o f the combined lengths.• / don’t know i f you would call it a connection, but in Theorem 1, you add up the bases and then divide by two to get the midsegment, and in Theorem 2, you Just divide the base by two and you have the midsegment. I wouldn’t really call that a connection, but that’s just how you get them.
The student’s response to the first question (How can you interpret THEOREM 1 in terms
of EXAMPLE 1?) was not used to classify the response into a response category. It was
what the student said later, about connecting the theorems, that was used to classify their
response. The overall results of the interviews for Task 4 are presented in Table 4.13.
Table 4.13. Interview Results for Task 4.
HIGH MEDIUM LOW
EXPERIMENTAL 7 (5) 6 (4) 2 (6)
CONTROL 3 (5) 2 (4) 10 (6)
%2(2,Af= 30) = 8.93,p<.02
The value of chi-square shows a signiEcant relationship between group membership and
performance on Task 4.
153
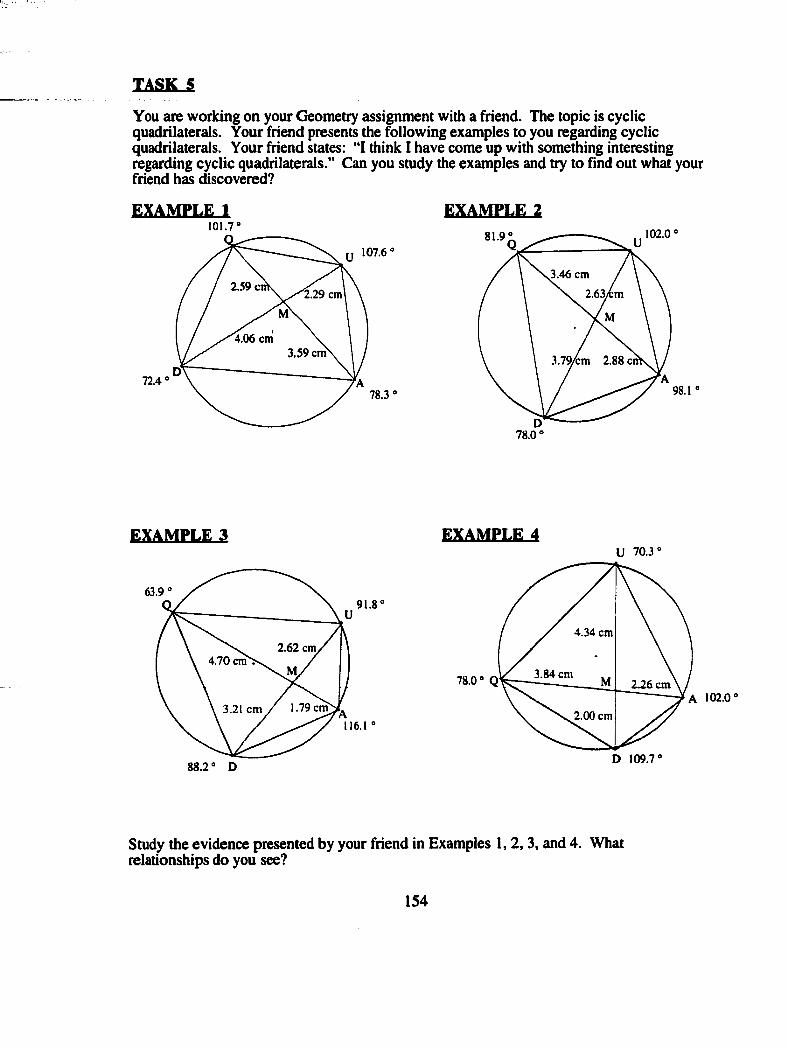
TASK S
You ate working on your Geometry assignment with a friend. The topic is cyclic quadrilaterals. Your fnend presents the following examples to you regarding cyclic quadrilaterals. Your friend states: “I think I have come up with something interesting regarding cyclic quadrilaterals.” Can you study the examples and try to find out what your friend has discovered?
EXAMPLE 1101.7 ‘
EXAMPLE 2
107.6
2.59 Cl2.29 cm
4.06 cm3,59 cm
72.478 .3“
102.0 “81.9
3.46 cm
2.63/cm
3.79/cm 2.88 ci
98.1 “
78 .0“
EXAMPLE 3 EXAMPLE 4
63.991.8
2.62 cm.4.70 cnrV
.79 cm3.21 cm
88.2 “ D
U 70 .3 '
4.34 cm
3.84 cm78.0 “ Q
A 102.0“
2.00 cm
D 109.7“
Study the evidence presented by your friend in Examples 1, 2, 3, and 4. What relationships do you see?
154
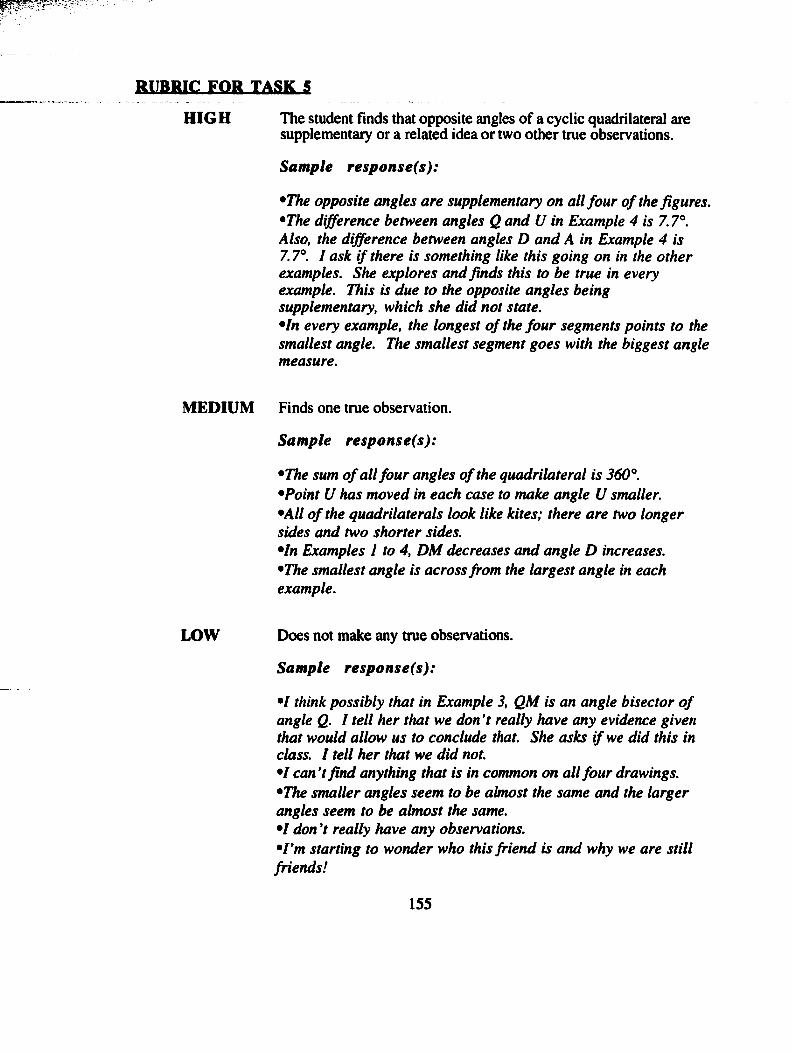
RWRIC FOR TASK gH IG H The student finds that opposite angles of a cyclic quadrilateral are
supplementary or a related idea or two other true observations.
Sample response(s):
•The opposite angles are supplementary on all four o f the figures. •The difference between angles Q and U in Example 4 is 7.7°. Also, the difference between angles D and A in Example 4 is 7.7°. 7 ask i f there is something like this going on in the other examples. She explores and finds this to be true in every example. This is due to the opposite angles being supplementary, which she did not state.•In every example, the longest o f the four segments points to the smallest angle. The smallest segment goes with the biggest angle measure.
MEDIUM Finds one true observation.
Sample response(s):
•The sum o f all four angles o f the quadrilateral is 360°.•Point U has moved in each case to make angle U smaller. •All o f the quadrilaterals look like kites; there are two longer sides and two shorter sides.•In Examples 1 to 4, DM decreases and angle D increases. •The smallest angle is across from the largest angle in each example.
LOW Does not make any true observations.
Sample response(s):
•I think possibly that in Example 3, QM is an angle bisector o f angle Q. I tell her that we don’t really have any evidence given that would allow us to conclude that. She asks i f we did this in class. I tell her that we did not.•I can’t find anything that is in common on all four drawings. •The smaller angles seem to be almost the same and the larger angles seem to be almost the same.•I don’t really have any observations.• I ’m starting to wonder who this friend is and why we are still friends!
155
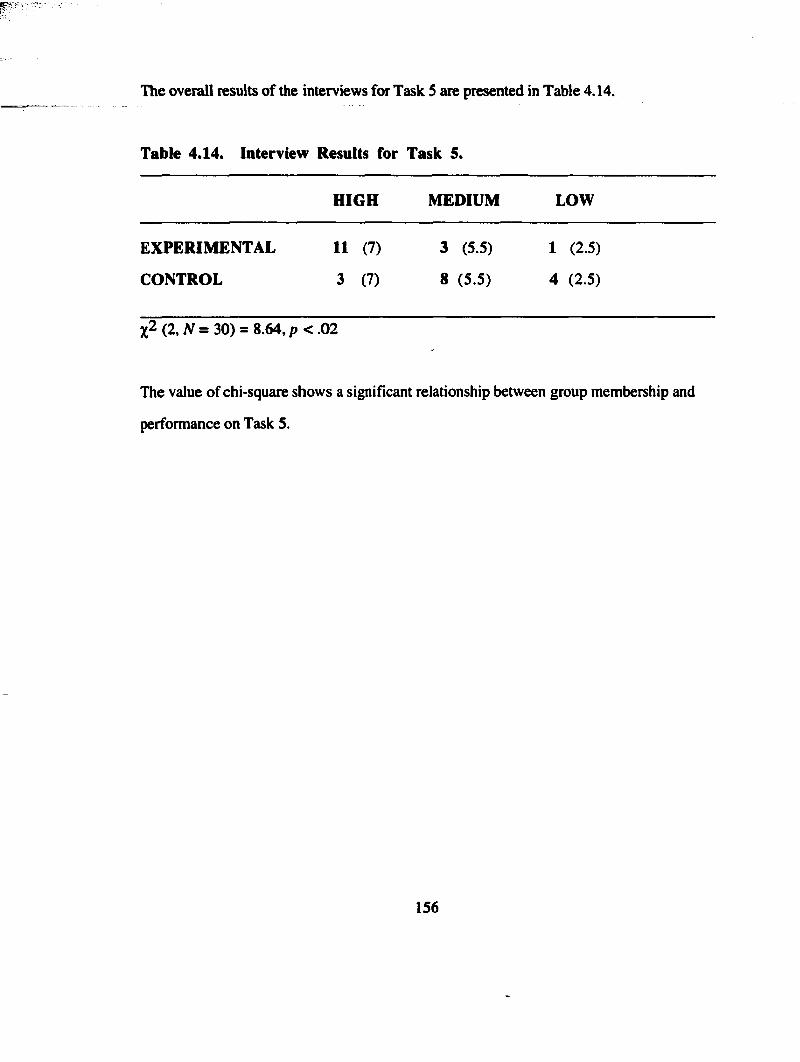
The overall results of the interviews for Task 5 are presented in Table 4.14.
Table 4.14. Interview Results for Task 5.
HIGH MEDIUM LOW
EXPERIMENTAL 11 (7) 3 (5.5) 1 (2.5)
CONTROL 3 (7) 8 (5.5) 4 (2.5)
(2,A^=30) = 8 .6 4 ,p < .0 2
The value of chi-square shows a significant relationship between group membership and
performance on Task 5.
156
TASK $
The sixth task is comprised of eight components. Accordingly, data is reported
separately for the eight components of Task 6 first, and then overall results for Task 6 are
given. The focus of Task 6 was to explore student understanding of the area interpretation
of the Pythagorean Theorem. The task began with asking students to interpret a diagram of
a right triangle with squares constructed on each side, followed by asking students to
consider if the area argument still worked if the squares were cut in half. Then, the
students were asked to consider if any rectangles could be constructed on the sides of the
right triangle and still have the area argument hold. The drawing that was shown to the
students purposely had a half-square rectangle constructed on one of the legs, a one-fourth
square rectangle on the other leg, and a one-third square rectangle constructed on the
hypotenuse. Students were then asked if they thought any other figures could be
constructed on the sides of the right triangle and still have the area argument hold. Next,
students were asked to consider isosceles triangles constructed on the sides. The following
question asked students to consider if any triangles could be constructed on the sides and
have the relationship hold. The final parts of the task were to ask students if they thought
that trapezoids could be constructed on each side and have the relationship hold, and finally
if there was anything else they could think of that would work that we had not discussed.
157
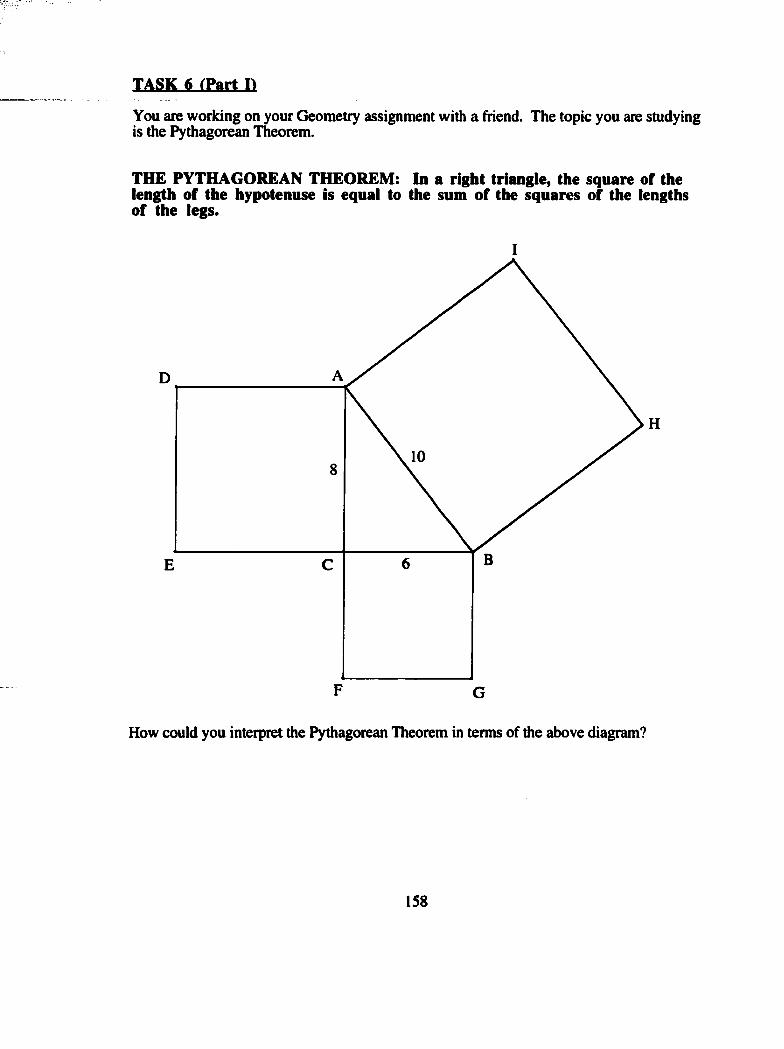
TASK 6 (Part I>
You are working on your Geometry assignment with a friend. The topic you are studying is the Pythagorean Theorem.
THE PYTHAGOREAN THEOREM: In a right triangle, the square of the length of the hypotenuse is equal to the sum of the squares of the lengths of the legs.
I
F G
H
How could you interpret the Pythagorean Theorem in terms of the above diagram?
158
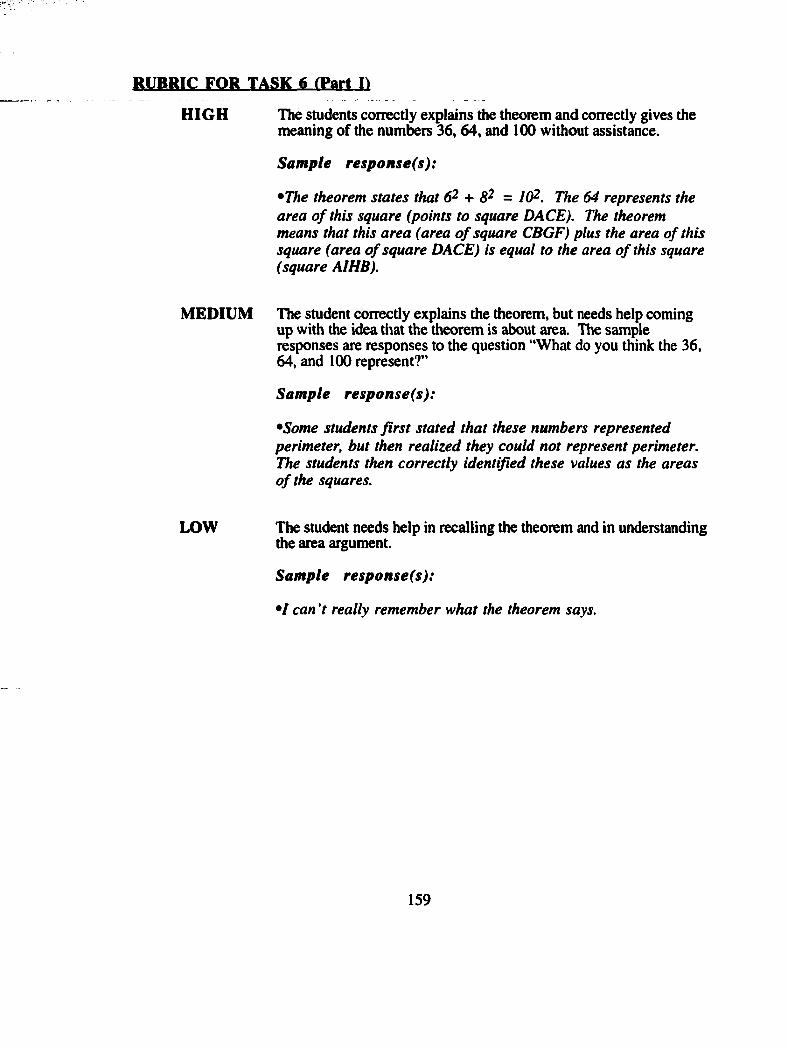
RUBRIC FOR TASK 6 (Part I)
H IG H The students correctly explains the theorem and correctly gives the meaning of the numbers 36, 64, and 100 without assistance.
Sample response(s):
•The theorem states that 6^ + 8^ - 1(P. The 64 represents the area o f this square (points to square DACE). The theorem means that this area (area o f square CBGF) plus the area o f this square (area o f square DACE) is equal to the area o f this square (square AIHB).
MEDIUM The student correctly explains the theorem, but needs help coming up with the idea Uiat the theorem is about area. The sample responses are responses to the question “What do you think the 36, 64, and 100 represent?”
Sample response(s):
•Some students firs t stated that these numbers represented perimeter, but then realized they could not represent perimeter. The students then correctly identified these values as the areas o f the squares.
LOW The student needs help in recalling the theorem and in understandingthe area argument.
Sample response(s):
• / can't really remember what the theorem says.
159
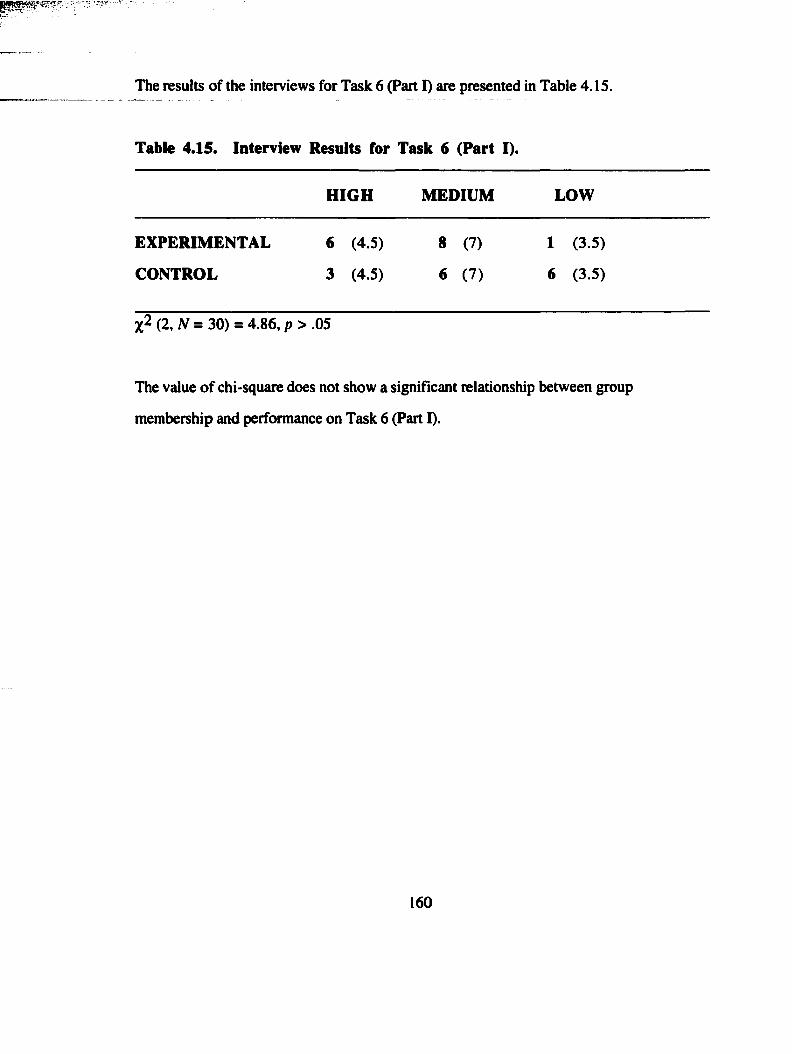
The results of the interviews for Task 6 (Part I) are presented in Table 4.15.
Table 4.15. Interview Results for Task 6 (Part I).
H IG H MEDIUM LOW
EXPERIM ENTAL 6 (4.5) 8 (7) 1 (3.5)
CONTROL 3 (4.5) 6 (7) 6 (3.5)
(2, AT =30) = 4.86, p > .05
The value of chi-square does not show a significant relationship between group
membership and performance on Task 6 (Part I).
160
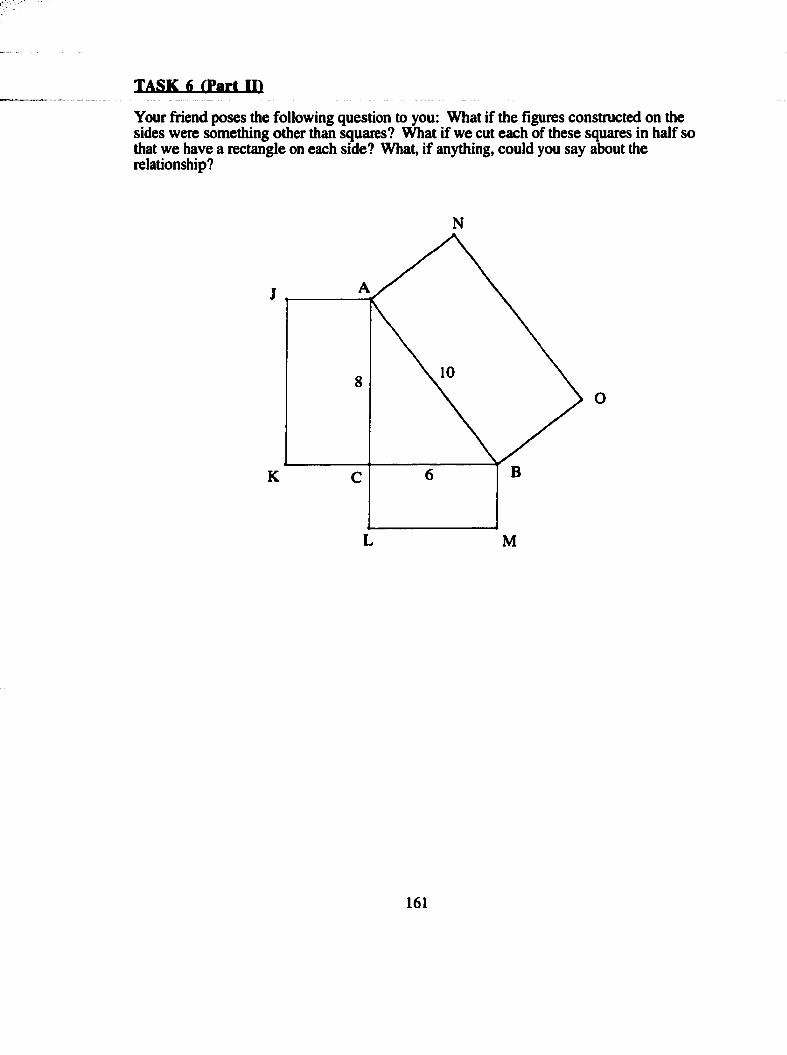
TASK $ (Part II)
Your friend poses the following question to you: What if the figures constructed on the sides were something other than squares? What if we cut each of these squares in half so that we have a rectangle on each side? What, if anything, could you say about the relationship?
N
J
K
L M
O
161
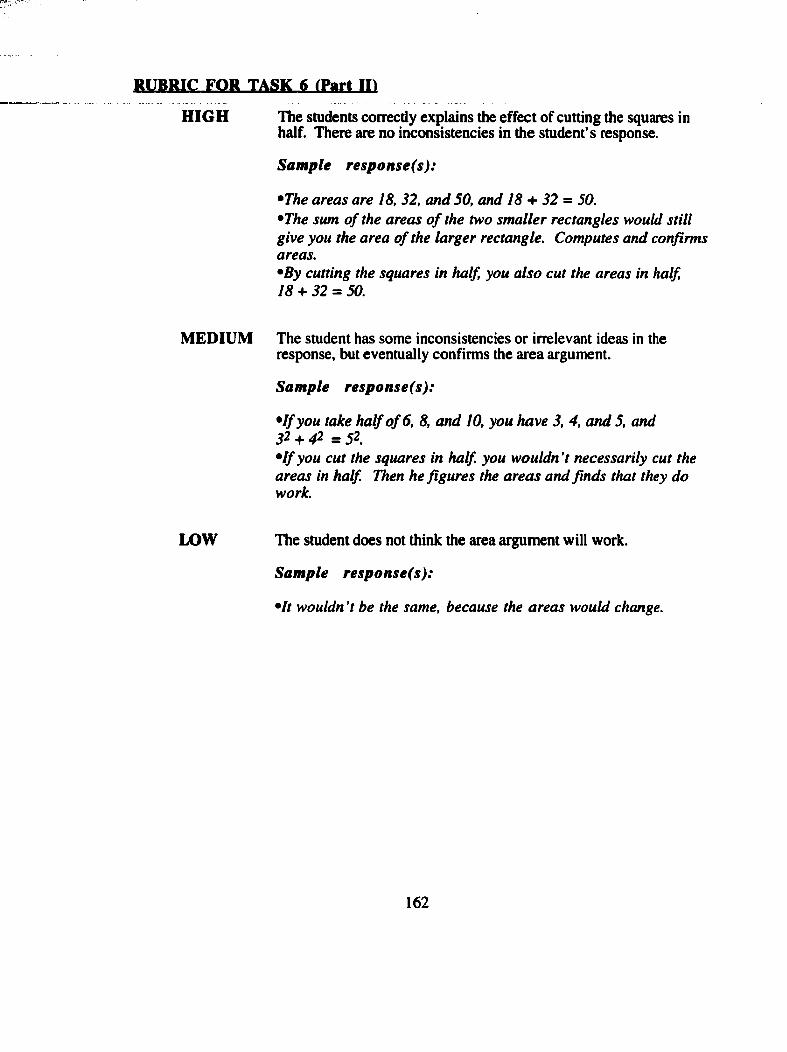
RUBRIC FOR TASK ( (Part II)
H IG H The students correctly explains the effect of cutting the squares in half. There are no inconsistencies in the student’s response.
Sample response(s):
•The areas are 18, 32, and 50, and 18 + 32 = 50.•The sum o f the areas o f the two smaller rectangles would still give you the area o f the larger rectangle. Computes and confirms areas.•By cutting the squares in half, you also cut the areas in half,18 + 32 = 50.
MEDIUM The student has some inconsistencies or irrelevant ideas in the response, but eventually confirms the area argument.
Sample response(s):
•I f you take half o f 6, 8, and 10, you have 3, 4, and 5, and32 + 42 = 52.•I f you cut the squares in half, you wouldn't necessarily cut the areas in half. Then he figures the areas and finds that they do work.
LOW The student does not think the area argument will work.
Sample response(s):
•It wouldn 't be the same, because the areas would change.
1 6 2
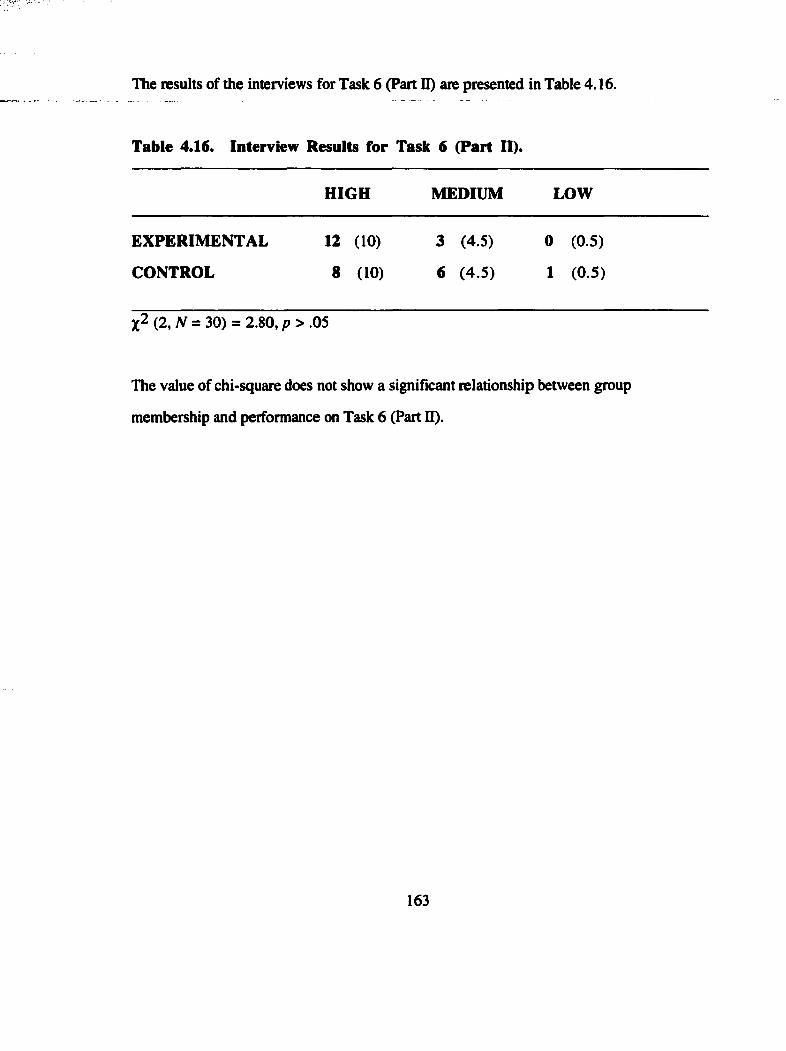
The results of the interviews for Task 6 (Part II) are presented in Table 4.16.
Table 4.16. Interview Results for Task 6 (Part II).
H IG H MEDIUM LOW
EXPERIM ENTAL 12 (10) 3 (4.5) 0 (0.5)
CONTROL 8 (10) 6 (4.5) 1 (0.5)
(2, AA = 30) = 2.80, p > .05
The value of chi-square does not show a significant relationship between group
membership and performance on Task 6 (Part II).
163
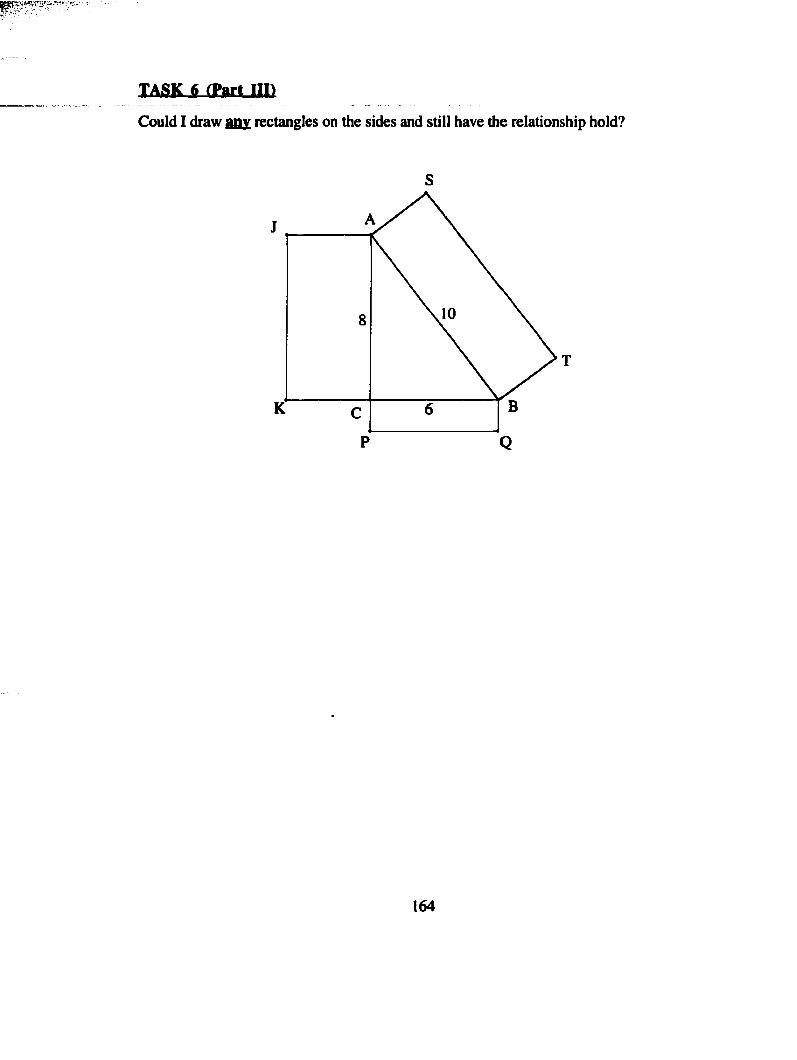
TASK $ (Part ffl)
Could I draw any rectangles on the sides and still have the relationship hold?
QP
164
RUBRIC FOR TASK 6 (Part HI)
H IG H The student explicitly states that the squares must be cut proportionally or that the rectangles must be similar.
Sam ple response(s):
•You can’t put any rectangles on the sides and have the relationship hold. They have to be proportional or else the area o f the smaller rectangles won’t add up to the area o f the rectangle o ff o f the hypotenuse.•The rectangles must be similar in order for the area argument to work.
MEDIUM The student confîrms that the area argument does not work for this particular drawing, but fails to state that it can work for other rectangles than the half-square rectangles.
Sam ple response(s);
•No, you can’t put any rectangles on the sides. On this drawing, this one (rectangle CBPQ) might be 1/4, this one (rectangle ASTB) might be 1/3, and this one (rectangle JACK) might be 1/2. •Any rectangles will not work because the side lengths are Just random amounts and the others were specific. We took half o f the squares.
LOW The student thinks the area argument will work for any rectangles.
Sam ple response(s):
•Yes, it will work for any rectangles, because that is what the theorem is stating.•Yes, you could draw any rectangles. As long as the Pythagorean Theorem holds true, then it wouldn’t matter what size rectangles you draw.
165
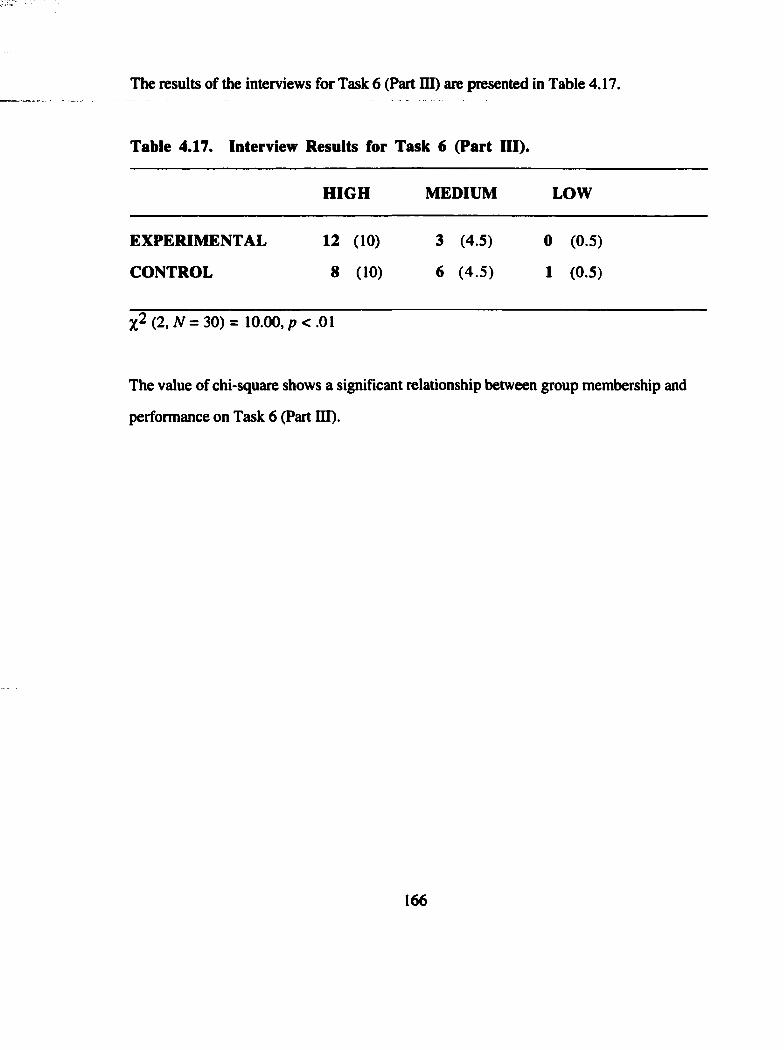
The results of the interviews for Task 6 (Part m ) are presented in Table 4.17.
Table 4.17. Interview Results for Task 6 (Part III).
H IG H MEDIUM LOW
EXPERIM ENTAL 12 (10) 3 (4.5) 0 (0.5)
CONTROL 8 (10) 6 (4.5) 1 (0.5)
(2 ,A (= 30)= 10.00,p <.01
The value of chi-square shows a significant relationship between group membership and
performance on Task 6 (Part III).
166
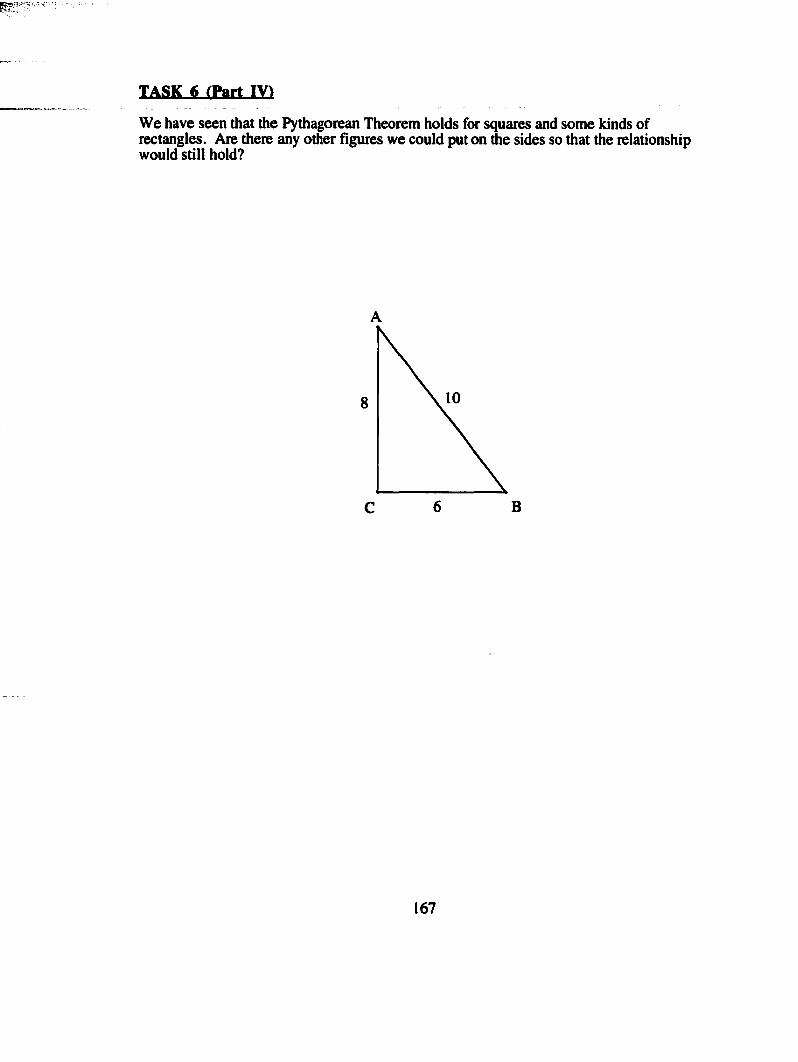
TASK 6 (Part IV)
We have seen that the Pythagorean Theorem holds for squares and some kinds of rectangles. Are there any other figures we could put on die sides so that the relationship would still hold?
8
6 BC
167
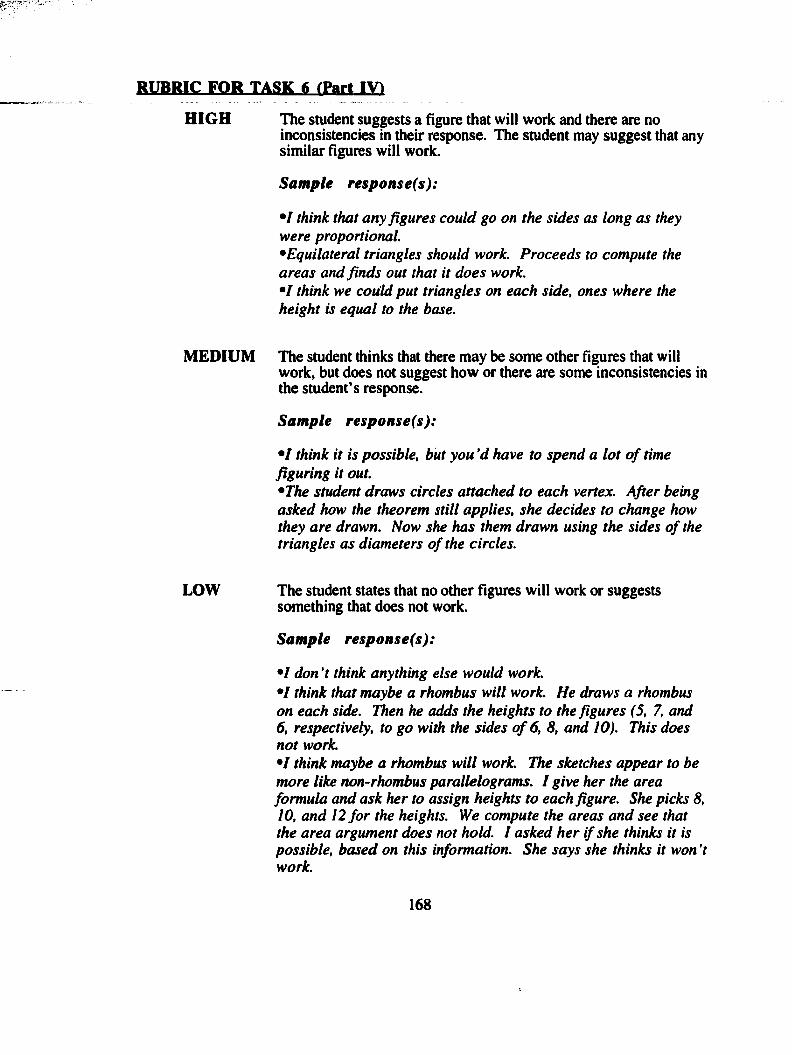
RUBRIC FOR TASK 6 (Part :V)
H IG H The student suggests a fîgure that will work and there are noinconsistencies in their response. The student may suggest that any similar figures will work.
Sample response(s):
• / think that any figures could go on the sides as long as they were proportional.•Equilateral triangles should work. Proceeds to compute the areas and finds out that it does work.• / think we could put triangles on each side, ones where the height is equal to the base.
MEDIUM The student thinks that there may be some other fib res that willwork, but does not suggest how or there are some inconsistencies in the student’s response.
Sample response(s):
• I think it is possible, but you ’d have to spend a lot o f time figuring it out.•The student draws circles attached to each vertex. After being asked how the theorem still applies, she decides to change how they are drawn. Now she has them drawn using the sides o f the triangles as diameters o f the circles.
LOW The student states that no other figures will work or suggestssomething that does not work.
Sample response(s):
•I don't think anything else would work.•I think that maybe a rhombus wilt work. He draws a rhombus on each side. Then he adds the heights to the figures (5, 7, and 6, respectively, to go with the sides o f 6, 8, and 10). This does not work.•I think maybe a rhombus will work. The sketches appear to be more like non-rhombus parallelograms. I give her the area formula and ask her to assign heights to each figure. She picks 8, 10, and 12 fo r the heights. We compute the areas and see that the area argument does not hold. / asked her if she thinks it is possible, based on this information. She says she thinks it won't work.
168
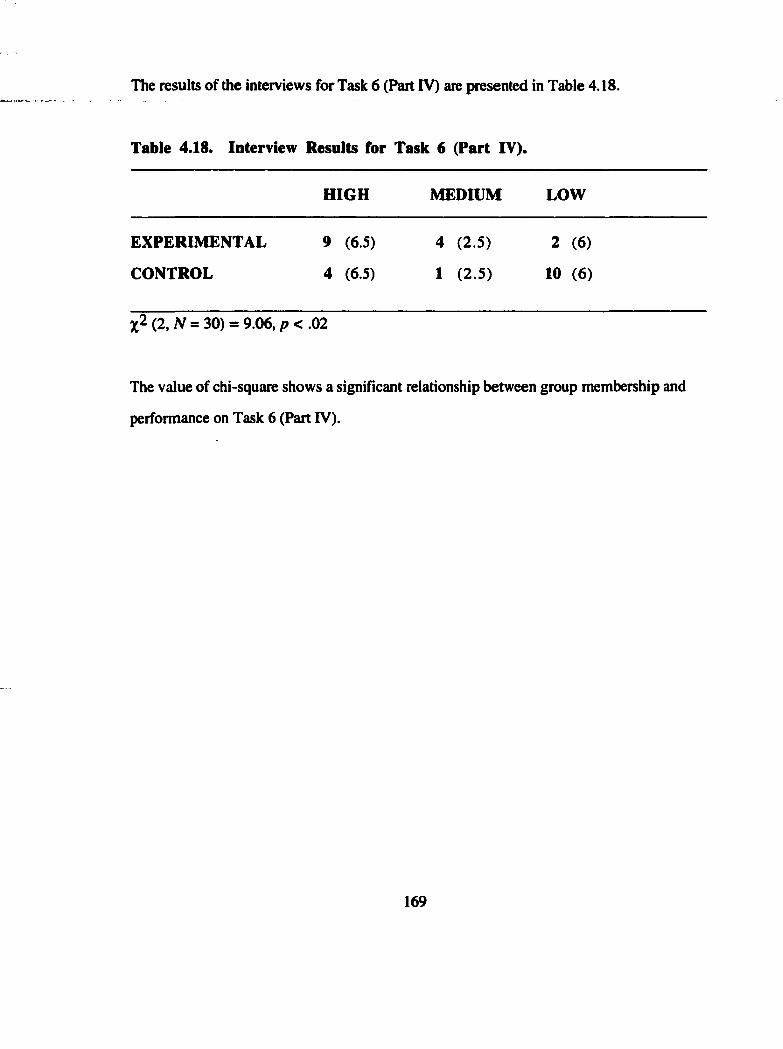
The results of the interviews for Task 6 (Part IV) are presented in Table 4.18.
Table 4.18. Interview Results for Task 6 (Part IV).
H IG H MEDIUM LOW
EXPERIM ENTAL 9 (6.5) 4 (2.5) 2 (6)
CONTROL 4 (6.5) 1 (2.5) 10 (6)
(2, V = 30) = 9.06, p < .02
The value of chi-square shows a signifîcant relationship between group membership and
performance on Task 6 (Part IV).
169
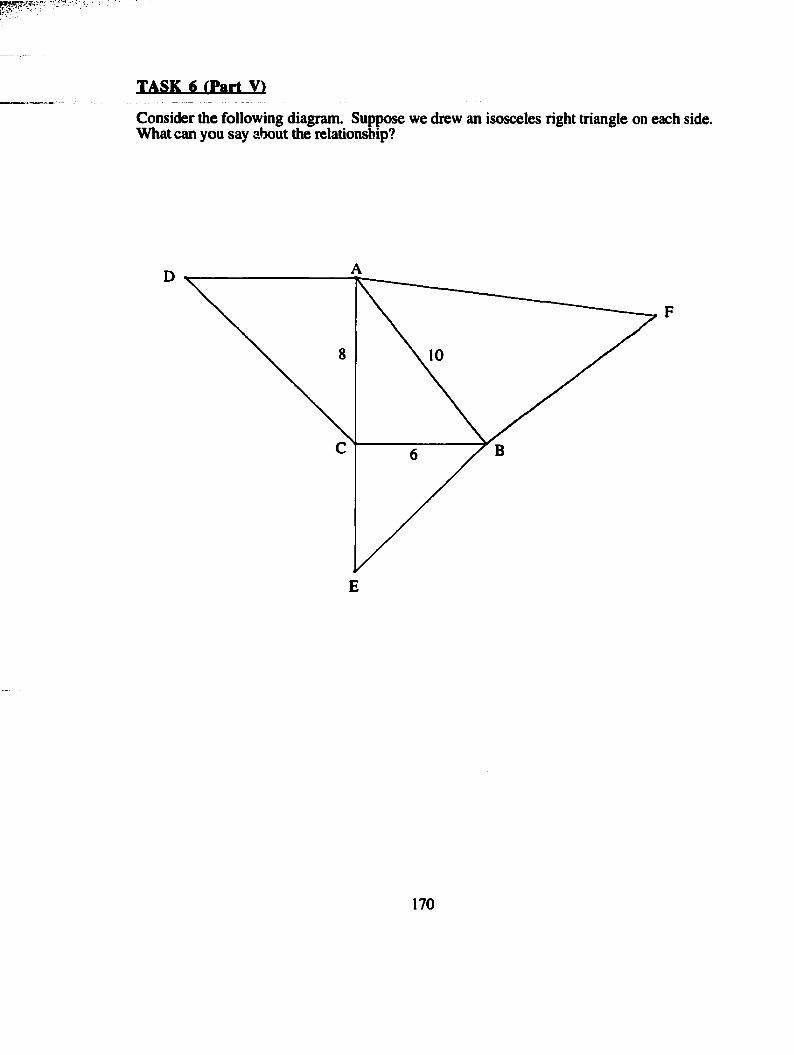
TASK 6 (Part V)
Consider the following diagram. Suppose we drew an isosceles right triangle on each side. What can you say about the relationship?
D
E
170
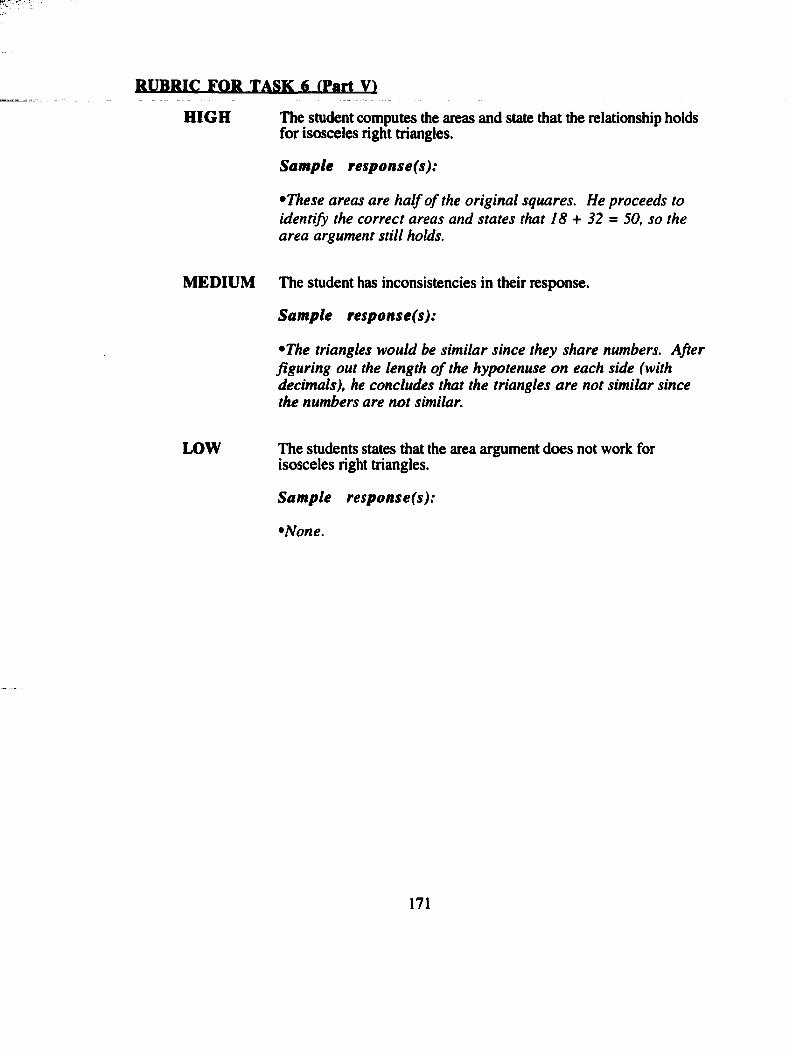
RUBRIC FOR TASK 6 (Part V)
HIGH The student computes the areas and state that the relationship holds for isosceles right triangles.
Sample response(s):
•These areas are half o f the original squares. He proceeds to identify the correct areas and states that 18 -t- 32 = 50, so the area argument still holds.
MEDIUM The student has inconsistencies in their response.
Sample response(s):
•The triangles would be similar since they share numbers. After figuring out the length o f the hypotenuse on each side (with decimals), he concludes that the triangles are not similar since the numbers are not similar.
LOW The students states that the area argument does not work forisosceles right triangles.
Sample response(s):
•None.
171
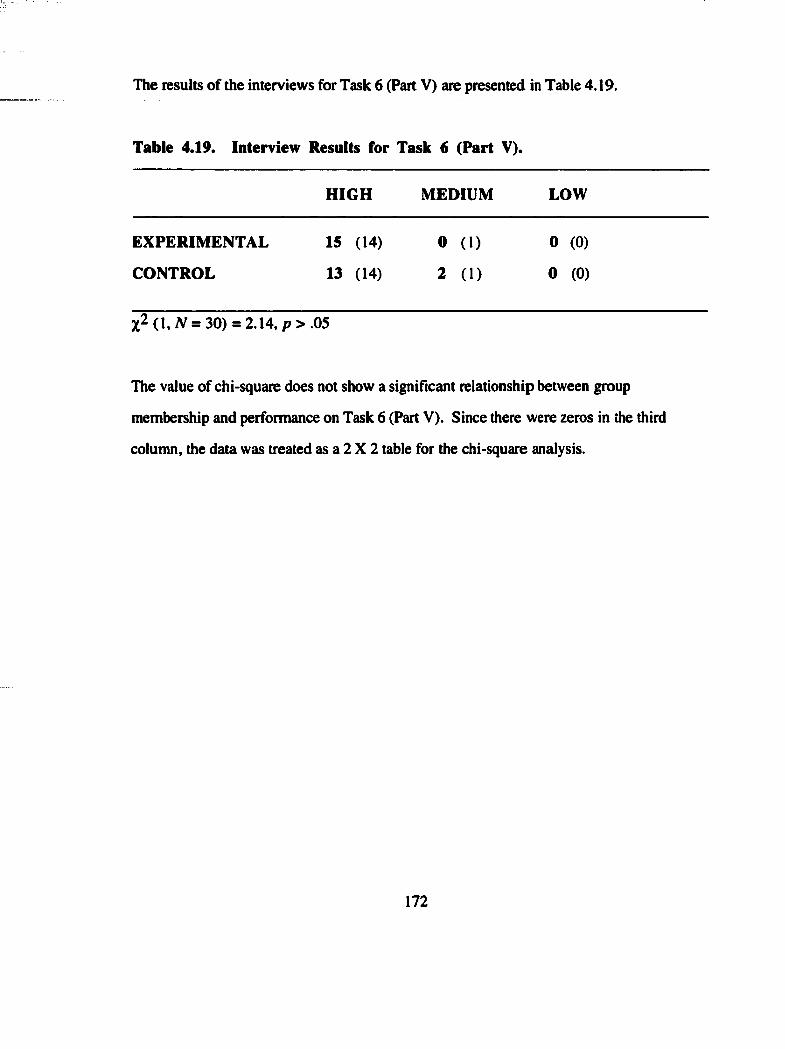
The results of the interviews for Task 6 (Part V) are presented in Table 4.19.
Table 4.19. Interview Results for Task 6 (Part V).
H IG H MEDIUM LOW
EXPERIM ENTAL 15 (14) 0 (1) 0 (0)
CONTROL 13 (14) 2 (1) 0 (0)
% 2 (l,N = 3 0 ) = 2 .1 4 ,p > .0 5
The value of chi-square does not show a significant relationship between group
membership and performance on Task 6 (Part V). Since there were zeros in the third
column, the data was treated as a 2 X 2 table for the chi-square analysis.
172
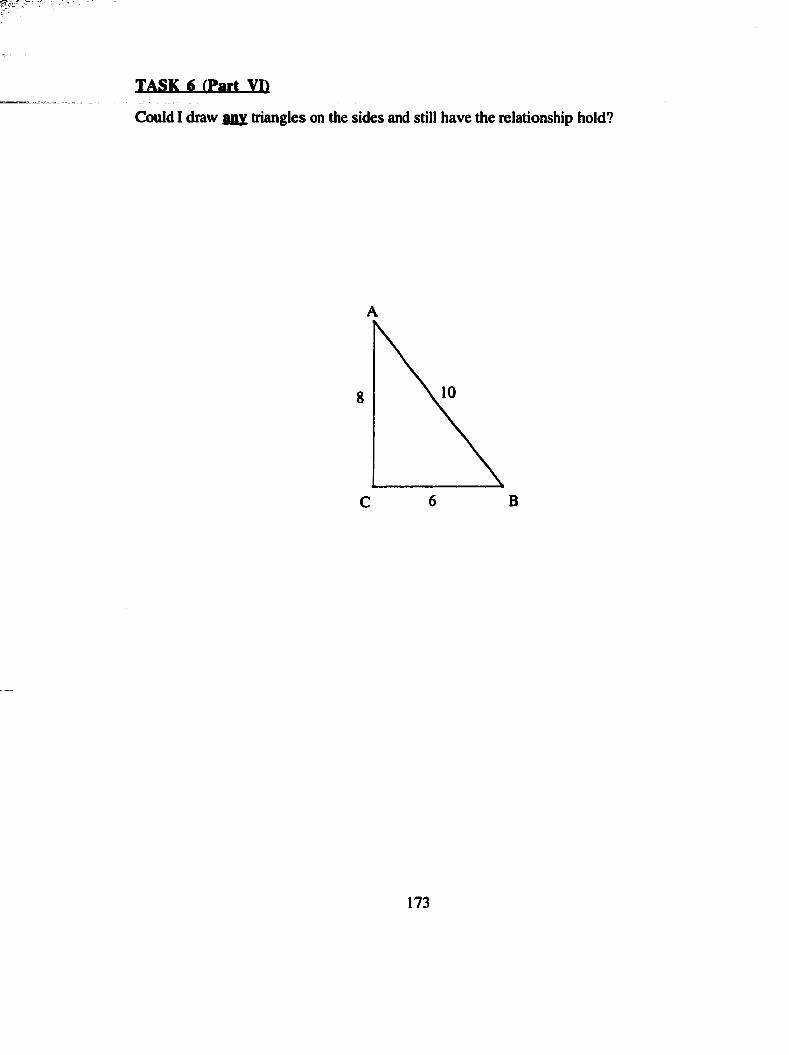
TASK ( (Part VI)
Could I draw anx triangles on the sides and still have the relationship hold?
8
6 BC
173
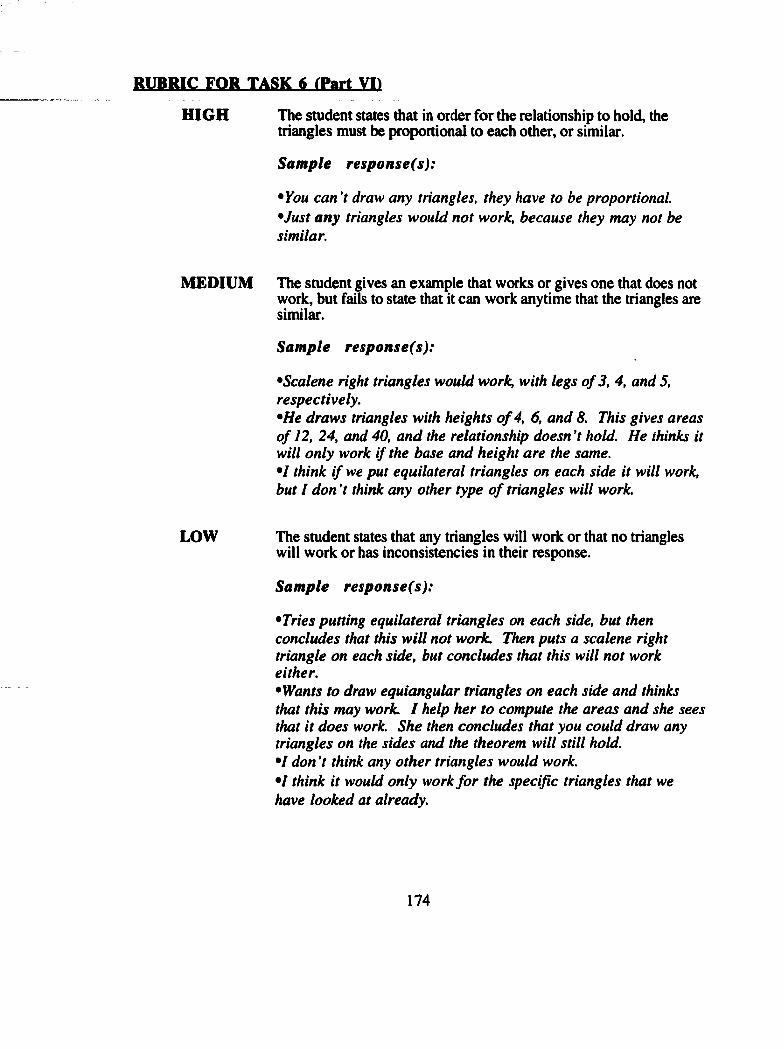
RUBRIC FQR-TASK.^ (Part VI)
H IG H The student states that in order for the relationship to hold, the triangles must be proportional to each other, or similar.
Sam ple response(s):
•You can’t draw any triangles, they have to be proportional. •Just any triangles would not work, because they may not be similar.
MEDIUM The student gives an example that works or gives one that does not work, but fails to state that it can work anytime that the triangles are similar.
Sam ple response(s):
•Scalene right triangles would work, with legs o f 3, 4, and 5, respectively.•He draws triangles with heights o f 4, 6, and 8. This gives areas o f 12, 24, and 40, and the relationship doesn 7 hold. He thinks it will only work if the base and height are the same.•I think i f we put equilateral triangles on each side it will work, but I don’t think any other type o f triangles will work.
LOW The student states that any triangles will work or that no triangleswill work or has inconsistencies in their response.
Sam ple response(s):
•Tries putting equilateral triangles on each side, but then concludes that this will not work. Then puts a scalene right triangle on each side, but concludes that this will not work either.•Wants to draw equiangular triangles on each side and thinks that this may work. I help her to compute the areas and she sees that it does work. She then concludes that you could draw any triangles on the sides and the theorem will still hold.•I don 7 think any other triangles would work.•I think it would only work fo r the specific triangles that we have looked at already.
174
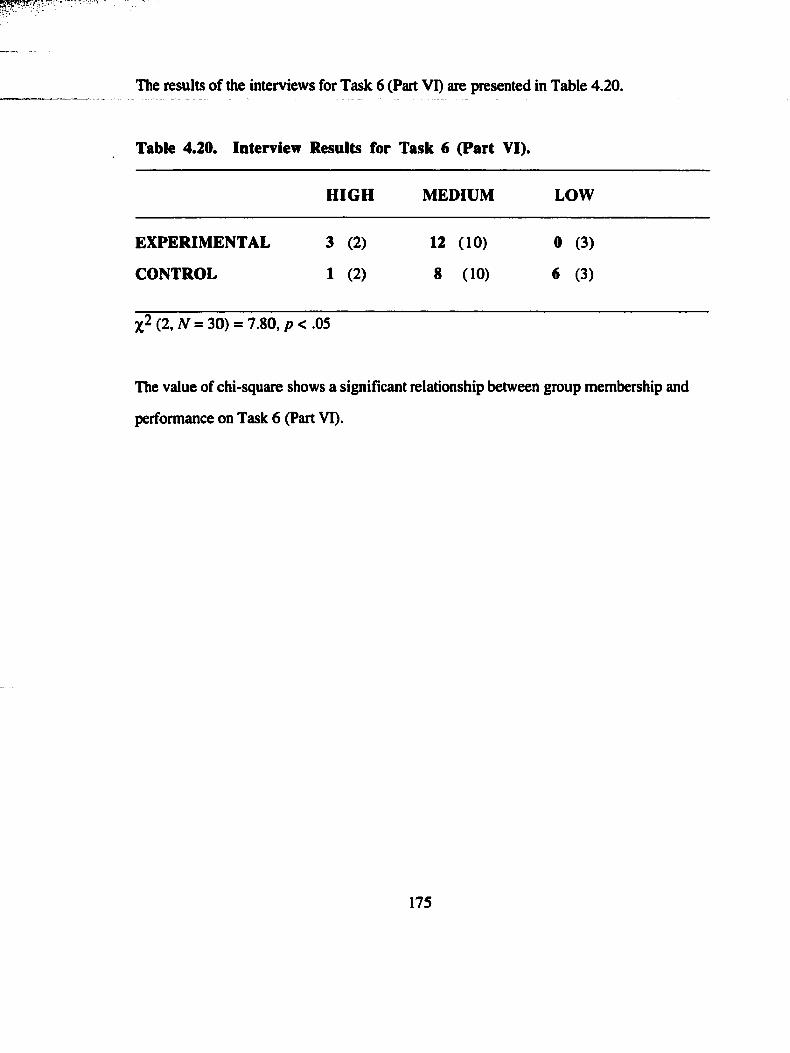
The results of the interviews for Task 6 (Part VI) are presented in Table 4.20.
Table 4.20. Interview Results for Task 6 (Part VI).
H IG H MEDIUM LOW
EXPERIM ENTAL 3 (2) 12 (10) 0 (3)
CONTROL 1 (2) 8 (10) 6 (3)
(2, V = 3 0 ) = 7 .8 0 ,p < .05
The value of chi-square shows a significant relationship between group membership and
performance on Task 6 (Part VI).
175
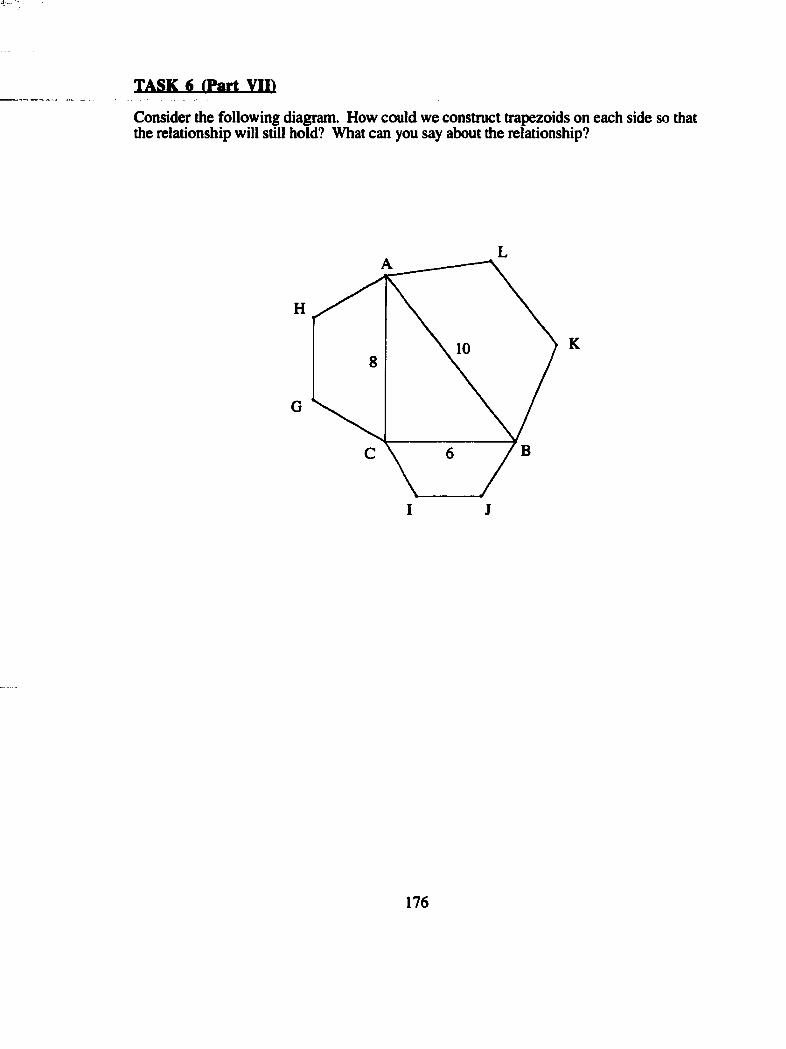
TASK 6 (Part VID
Consider the following diagram. How could we construct trapezoids on each side so that the relationship will still hold? What can you say about the relationship?
H
G
I J
K
176
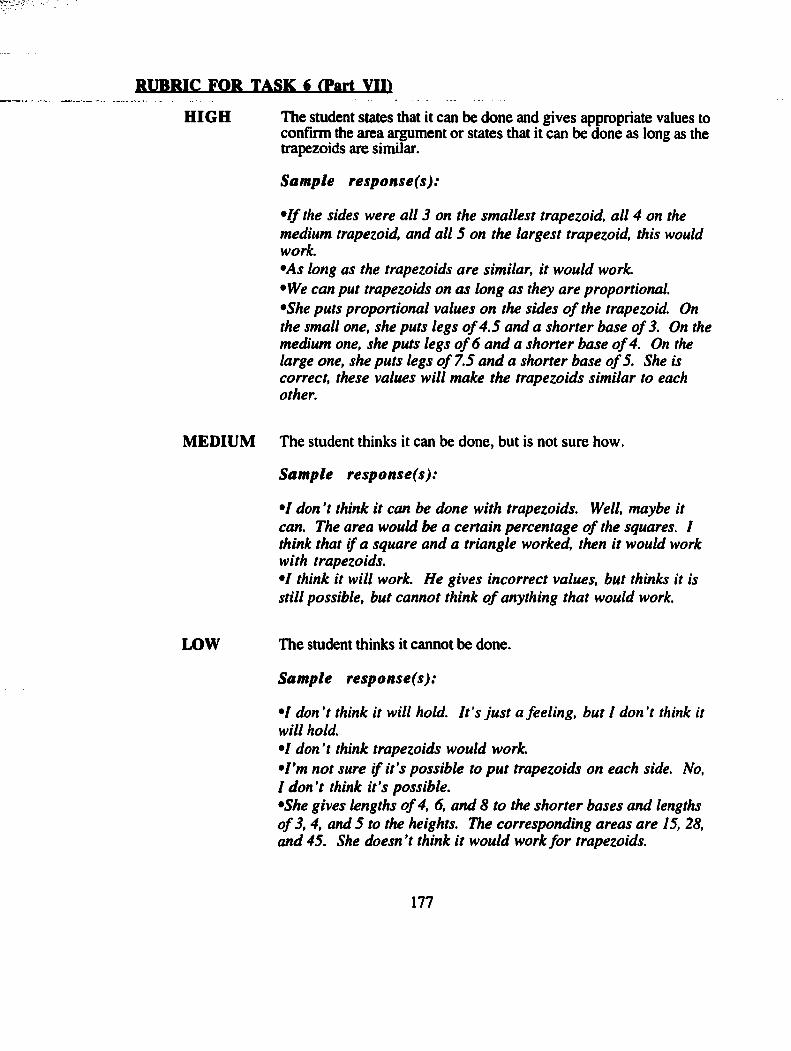
BVPBIC-EQR TASK ( (Part VII)
H IG H The student states that it can be done and gives appropriate values to confirm the area argument or states that it can be done as long as the trapezoids are similar.
Sample response(s):
• I f the sides were all 3 on the smallest trapezoid, all 4 on the medium trapezoid, and all 5 on the largest trapezoid, this would work.•As long as the trapezoids are similar, it would work.•We can put trapezoids on as long as they are proportional.•She puts proportional values on the sides o f the trapezoid. On the small one, she puts legs o f 4.5 and a shorter base o f 3. On the medium one, she puts legs o f 6 and a shorter base o f 4. On the large one, she puts legs o f 7.5 and a shorter base o f 5. She is correct, these values will make the trapezoids similar to each other.
MEDIUM The student thinks it can be done, but is not sure how.
Sample response(s):
•I don 7 think it can be done with trapezoids. Well, maybe it can. The area would be a certain percentage o f the squares. / think that i f a square and a triangle worked, then it would work with trapezoids.•I think it will work. He gives incorrect values, but thinks it is still possible, but cannot think o f anything that would work.
LOW The student thinks it cannot be done.
Sample response(s):
•I don’t think it will hold. I t ’s just a feeling, but I don't think it will hold.•I don’t think trapezoids would work.• I ’m not sure i f it’s possible to put trapezoids on each side. No, I don’t think it’s possible.•She gives lengths o f 4, 6, and 8 to the shorter bases and lengths o f 3, 4, and 5 to the heights. The corresponding areas are 15, 28, and 45. She doesn’t think it would work fo r trapezoids.
177
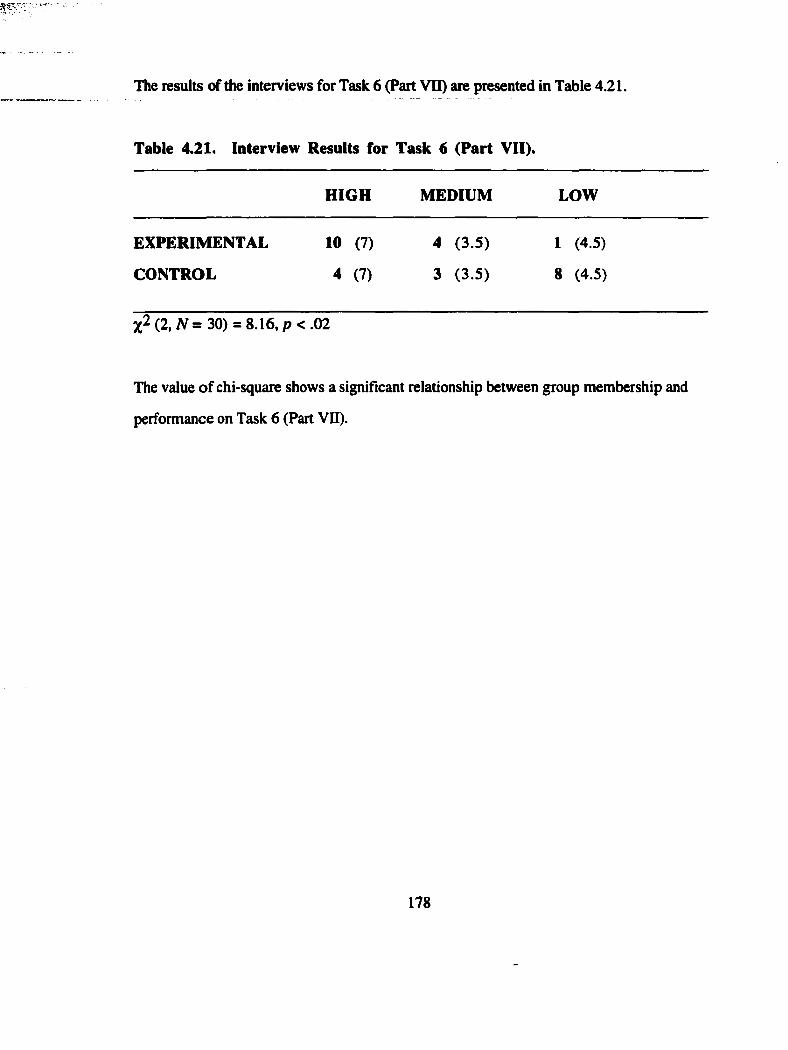
The results of the interviews for Task 6 (Part VII) are presented in Table 4.21.
Table 4.21. Interview Results for Task 6 (Part VII).
H IG H MEDIUM LOW
EXPERIM ENTAL 10 (7) 4 (3.5) 1 (4.5)
CONTROL 4 (7) 3 (3.5) 8 (4.5)
(2,AT=30) = 8 .1 6 ,p < .0 2
The value o f chi-square shows a significant relationship between group membership and
performance on Task 6 (Part VII).
178
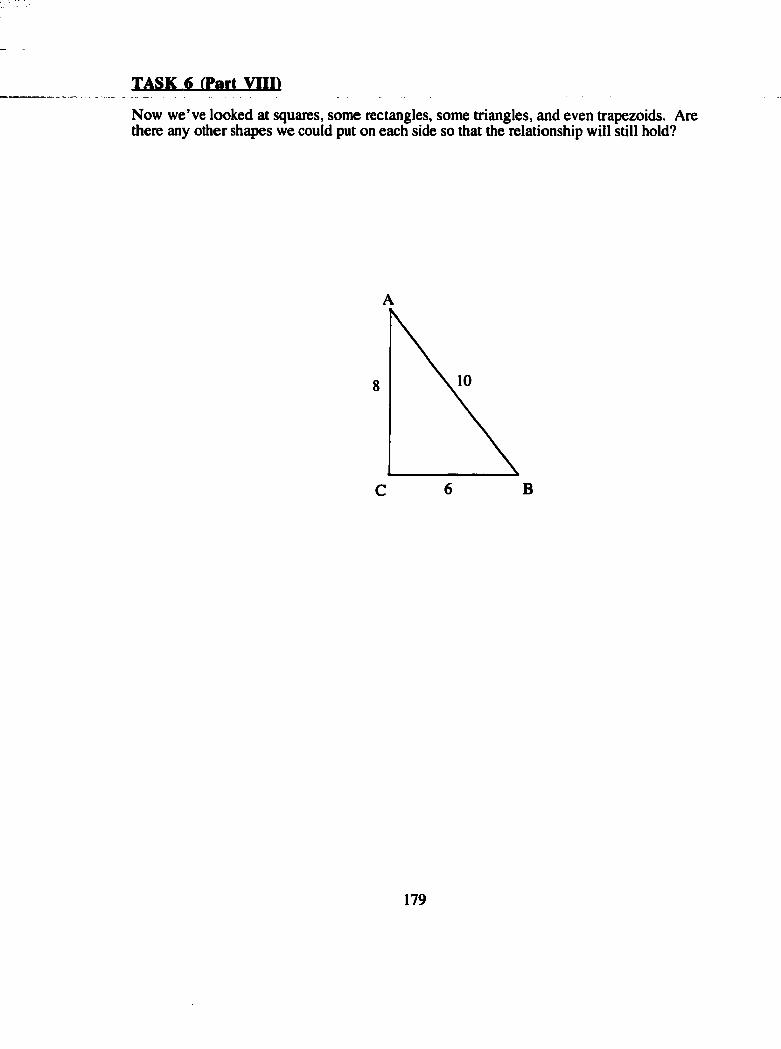
TASK ^ (Part Vni)Now we’ve looked at squares, some rectangles, some triangles, and even trapezoids. Are there any other shapes we could put on each side so that the relationship will still hold?
8
6 BC
179
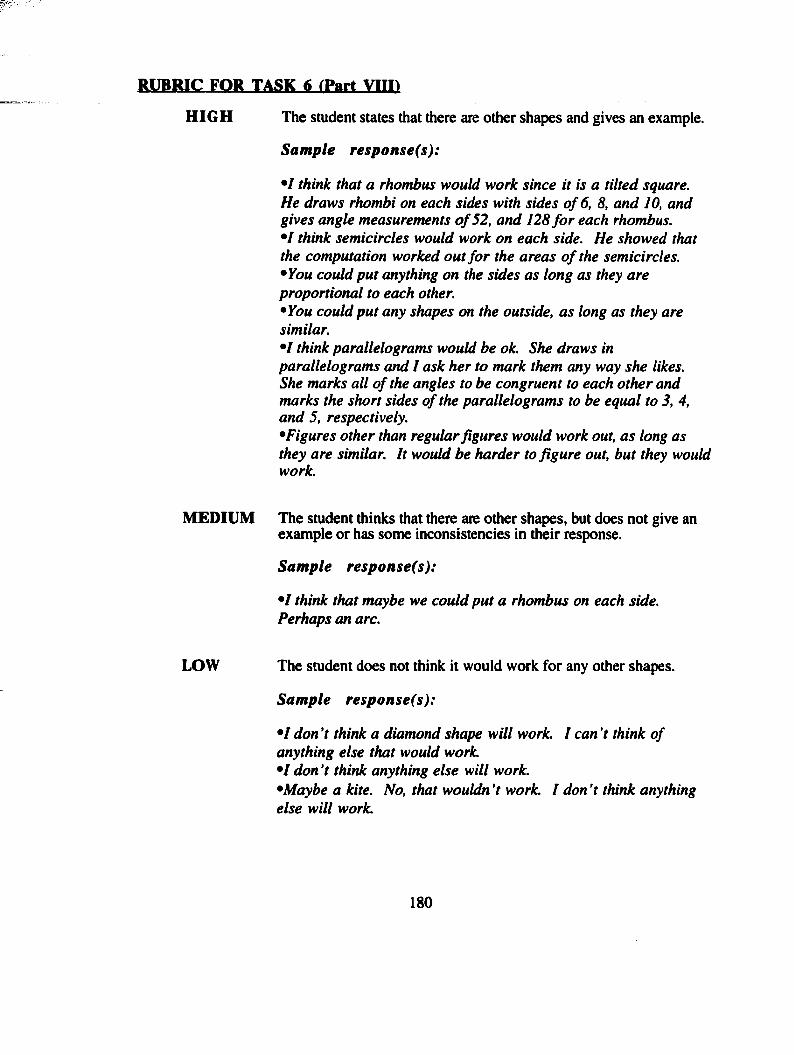
RUBRIC FOR TASK 6 (Part VlID
HIGH The student states that there are other shapes and gives an example.
Sample response(s):
•I think that a rhombus would work since it is a tilted square.He draws rhombi on each sides with sides o f 6, 8, and JO, and gives angle measurements o f 52, and 128 fo r each rhombus.• / think semicircles would work on each side. He showed that the computation worked out fo r the areas o f the semicircles.•You could put anything on the sides as long as they are proportional to each other.•You could put any shapes on the outside, as long as they are similar.•I think parallelograms would be ok. She draws in parallelograms and I ask her to mark them any way she likes.She marks all o f the angles to be congruent to each other and marks the short sides o f the parallelograms to be equal to 3, 4, and 5, respectively.•Figures other than regular figures would work out, as long as they are similar. It would be harder to figure out, but they would work.
MEDIUM The student thinks that there ate other shapes, but does not give an example or has some inconsistencies in their response.
Sample response(s):
•I think that maybe we could put a rhombus on each side. Perhaps an arc.
LOW The student does not think it would work for any other shapes.
Sample response(s):
•I don’t think a diamond shape will work. I can't think o f anything else that would work.•I don’t think anything else will work.•Maybe a kite. No, that wouldn’t work. I don't think anything else will work.
180
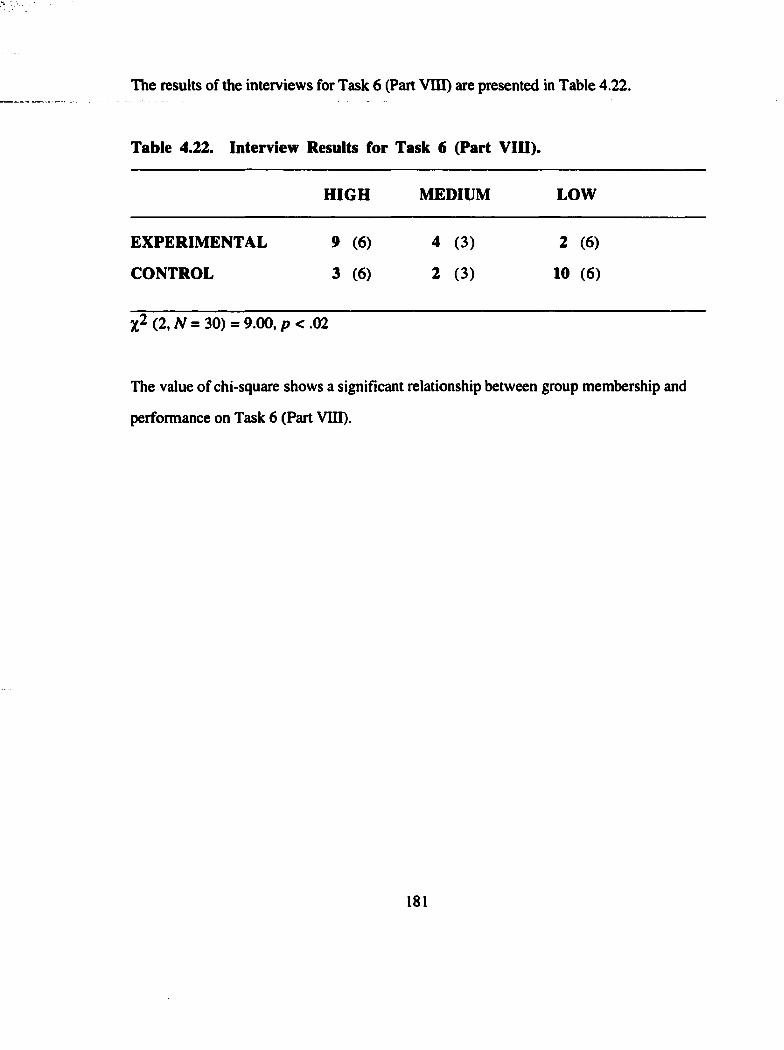
The results of the interviews for Task 6 (Part Vni) are presented in Table 4.22.
Table 4.22. Interview Results for Task 6 (Part VIII).
H IG H MEDIUM LOW
EXPERIM ENTAL 9 (6) 4 (3) 2 (6)
CONTROL 3 (6) 2 (3) 10 (6)
( 2 , N = 3 0 ) = 9 . 0 0 ,p < .0 2
The value of chi-square shows a significant relationship between group membership and
performance on Task 6 (Part VUI).
181
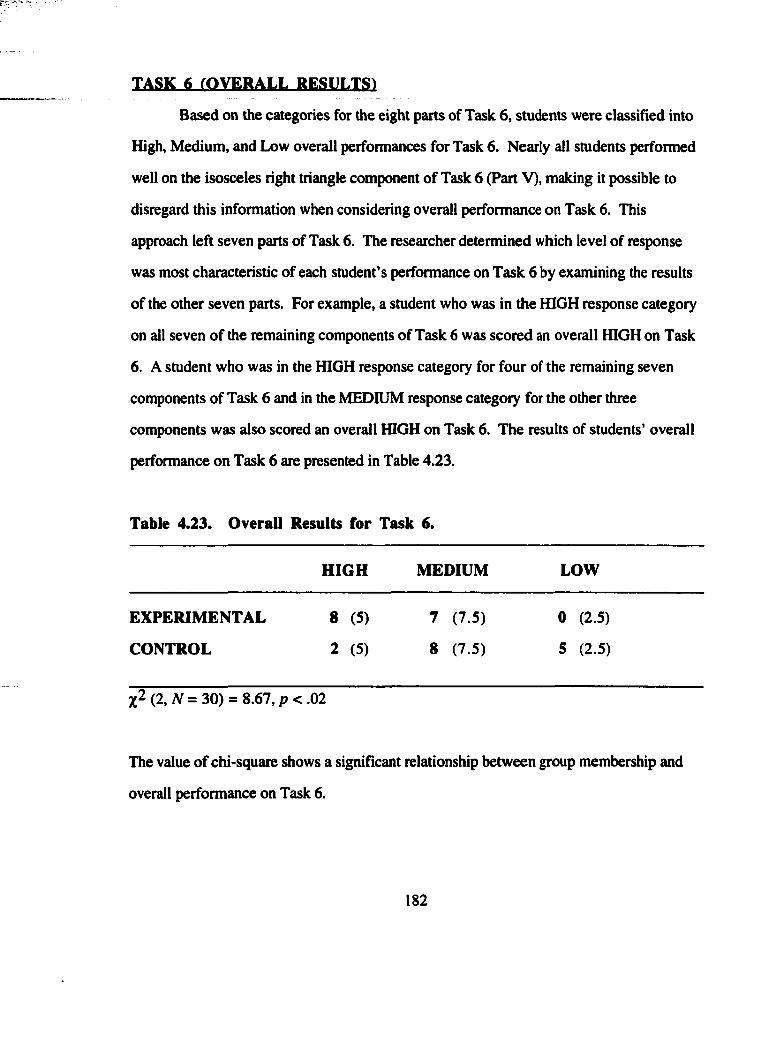
lASK ̂ (OYERALL. RESULTS)
Based on the categories for the eight parts of Task 6, students were classified into
High, Medium, and Low overall performances for Task 6. Nearly all students performed
well on the isosceles right triangle component of Task 6 (Part V), making it possible to
disregard this information when considering overall performance on Task 6. This
approach left seven parts of Task 6. The researcher determined which level of response
was most characteristic of each student’s performance on Task 6 by examining the results
of the other seven parts. For example, a student who was in the HIGH response category
on all seven of the remaining components of Task 6 was scored an overall HIGH on Task
6. A student who was in the HIGH response category for four of the remaining seven
components of Task 6 and in the MEDIUM response category for the other three
components was also scored an overall HIGH on Task 6. The results of students’ overall
performance on Task 6 are presented in Table 4.23.
Table 4.23. Overall Results for Task 6.
HIGH MEDIUM LOW
EXPERIMENTAL 8 (5) 7 (7.5) 0 (2.5)
CONTROL 2 (5) 8 (7.5) 5 (2.5)
(2 ,N = 30) = 8.67,p<.02
The value of chi-square shows a significant relationship between group membership and
overall performance on Task 6.
182
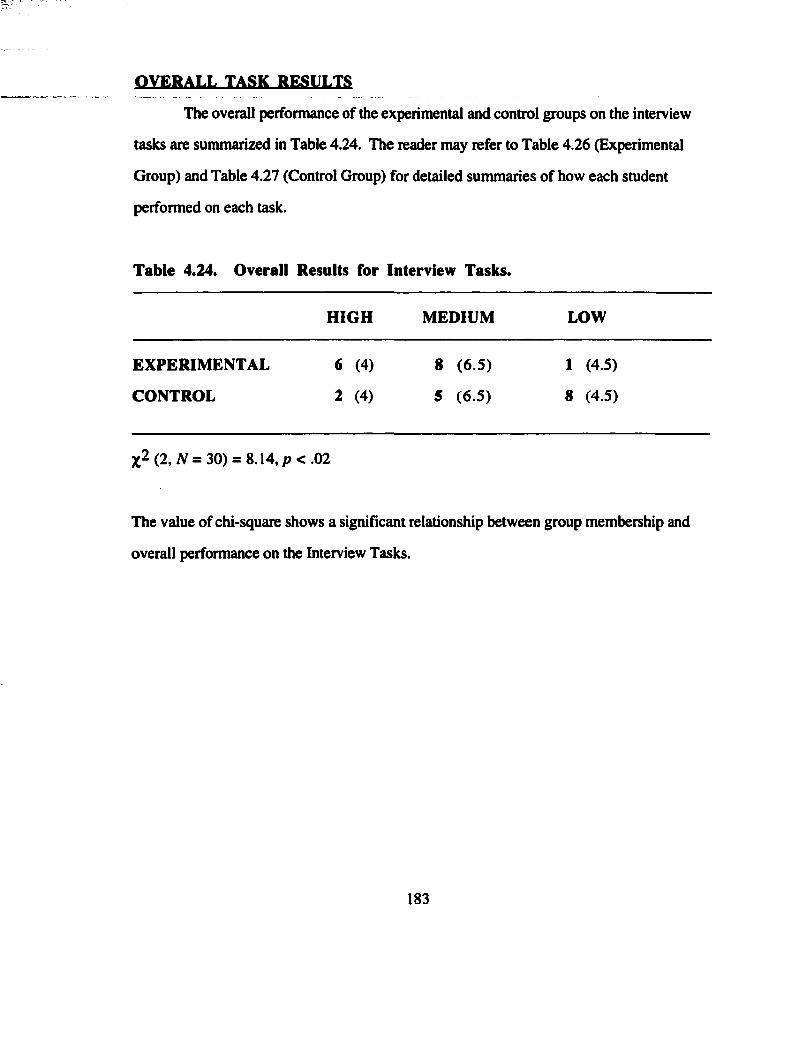
OVERALL TASK RESULTS
The overall performance of the experimental and control groups on the interview
tasks are summarized in Table 4.24. The reader may refer to Table 4.26 (Experimental
Group) and Table 4.27 (Control Group) for detailed summaries of how each student
performed on each task.
Table 4.24. Overall Results for Interview Tasks.
HIGH MEDIUM LOW
EXPERIMENTAL 6 (4) 8 (6.5) 1 (4.5)
CONTROL 2 (4) 5 (6.5) 8 (4.5)
(2,iV=30) = 8.14,p< .02
The value of chi-square shows a significant relationship between group membership and
overall performance on the Interview Tasks.
183
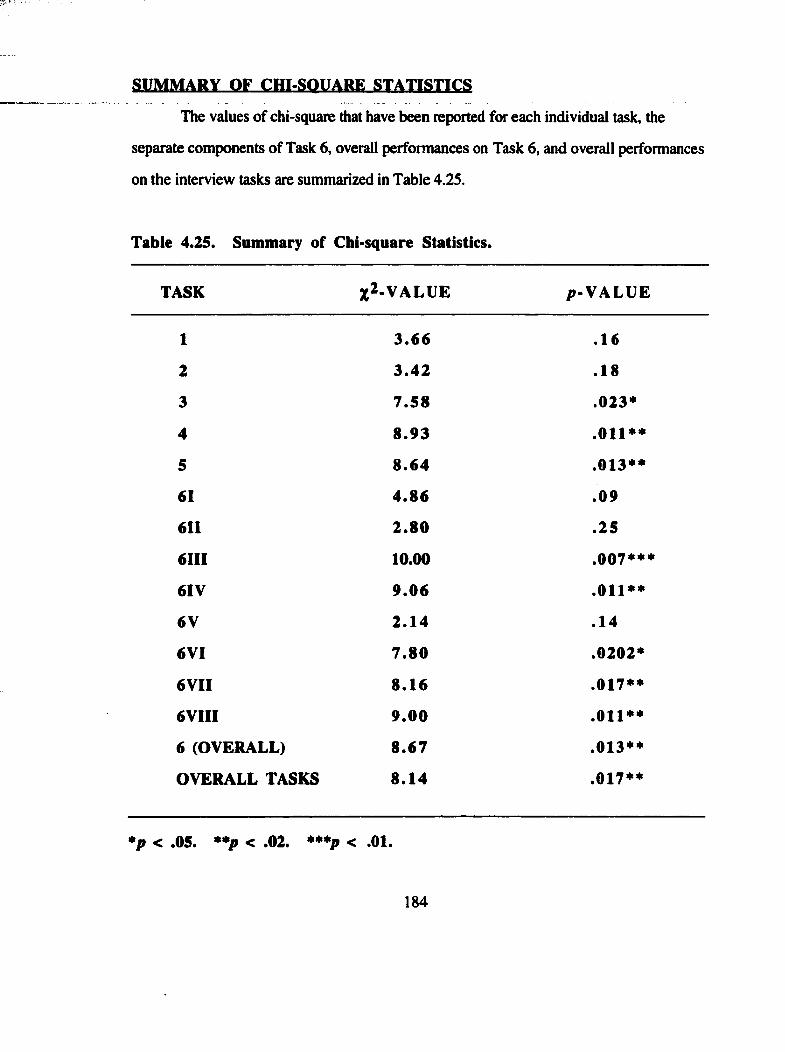
SUMMARY OF CHI-SQUARE STATISTICS
The values of chi-square that have been reported for each individual task, the
separate components of Task 6, overall performances on Task 6, and overall performances
on the interview tasks are summarized in Table 4.25.
Table 4.25. Summary of Chi-square Statistics.
TASK %2-VALUE p-V A L U E
1 3 .6 6 .16
2 3 .4 2 .18
3 7 .5 8 .023*
4 8 .9 3 .011**
5 8 .6 4 .013**
61 4 .8 6 .09
611 2 .8 0 .25
6III 10.00 .007***
6IV 9 .0 6 .011**
6V 2 .1 4 .1 4
6VI 7 .8 0 .0202*
6VII 8 .1 6 .017**
6VIII 9 .0 0 .011**
6 (OVERALL) 8 .6 7 .013**
OVERALL TASKS 8 .1 4 .017**
*p < .05. **p < .02. ***p < .01.
184
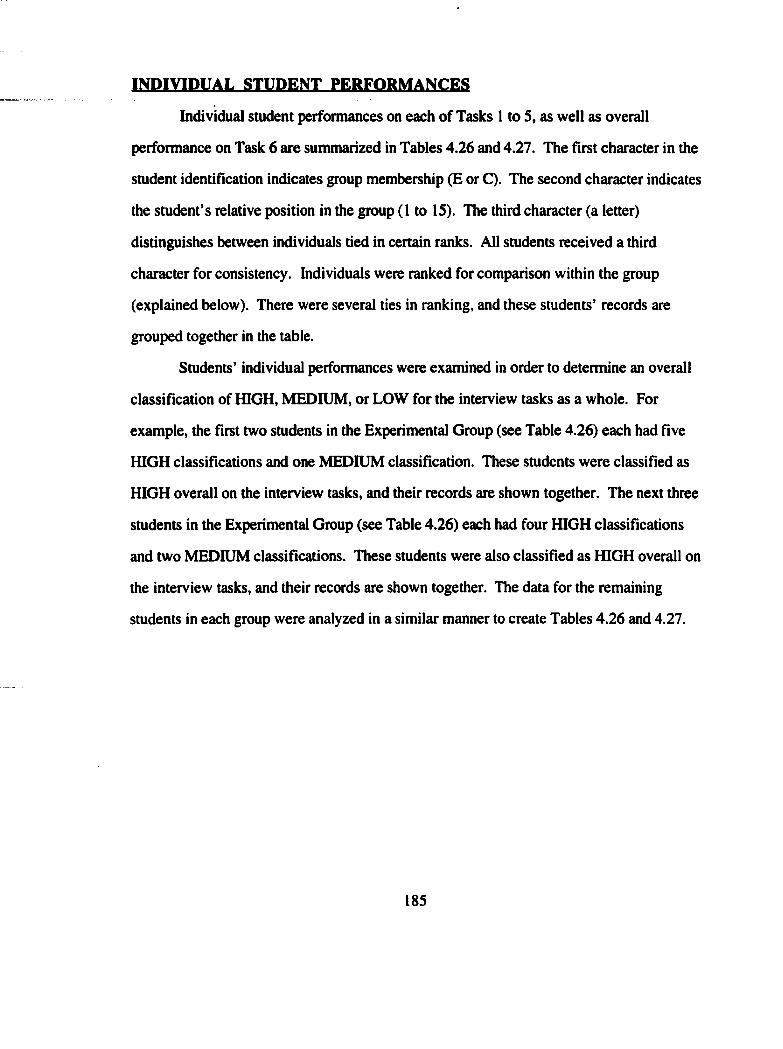
INDIVIDUAL STUDENT PERFORMANCES
Individual student performances on each of Tasks 1 to 5, as well as overall
performance on Task 6 are summarized in Tables 4.26 and 4.27. The first character in the
student identification indicates group membership (E or C). The second character indicates
the student’s relative position in the group (1 to IS). The third character (a letter)
distinguishes between individuals tied in certain ranks. All students received a third
character for consistency. Individuals were ranked for comparison within the group
(explained below). There were several ties in ranking, and these students’ records are
grouped together in the table.
Students’ individual performances were examined in order to determine an overall
classifîcation of HIGH, MEDIUM, or LOW for the interview tasks as a whole. For
example, the first two students in the Experimental Group (see Table 4.26) each had five
HIGH classifications and one MEDIUM classification. These students were classified as
HIGH overall on the interview tasks, and their records are shown together. The next three
students in the Experimental Group (see Table 4.26) each had four HIGH classifications
and two MEDIUM classifications. These students were also classified as HIGH overall on
the interview tasks, and their records are shown together. The data for the remaining
students in each group were analyzed in a similar manner to create Tables 4.26 and 4.27.
185

Table 4.26. Individual Performances on Tasks (Experimental Group).
EXPERIMENTAL GROUP
STUDENT Task 1 Task 2 Task 3 Task 4 Task 5 Task 6 OVERALL
E lA H H M H H H HIGHE lB M H H H H H HIGH
E3A H H M M H H HIGHE3B H M H M H H HIGHE3C M H M H H H HIGH
E6A H L L H H H HIGH
E7A H M H M H M MEDIUME7B H M M H H M MEDIUM
E9A H H L M H M MEDIUM
ElOA H H L L H M MEDIUMElOB H L L H H M MEDIUM
E12A M M M H M H MEDIUM
E13A H L M M M M MEDIUM
E14A M M L M L M MEDIUM
EISA L L L L M H LOW
186
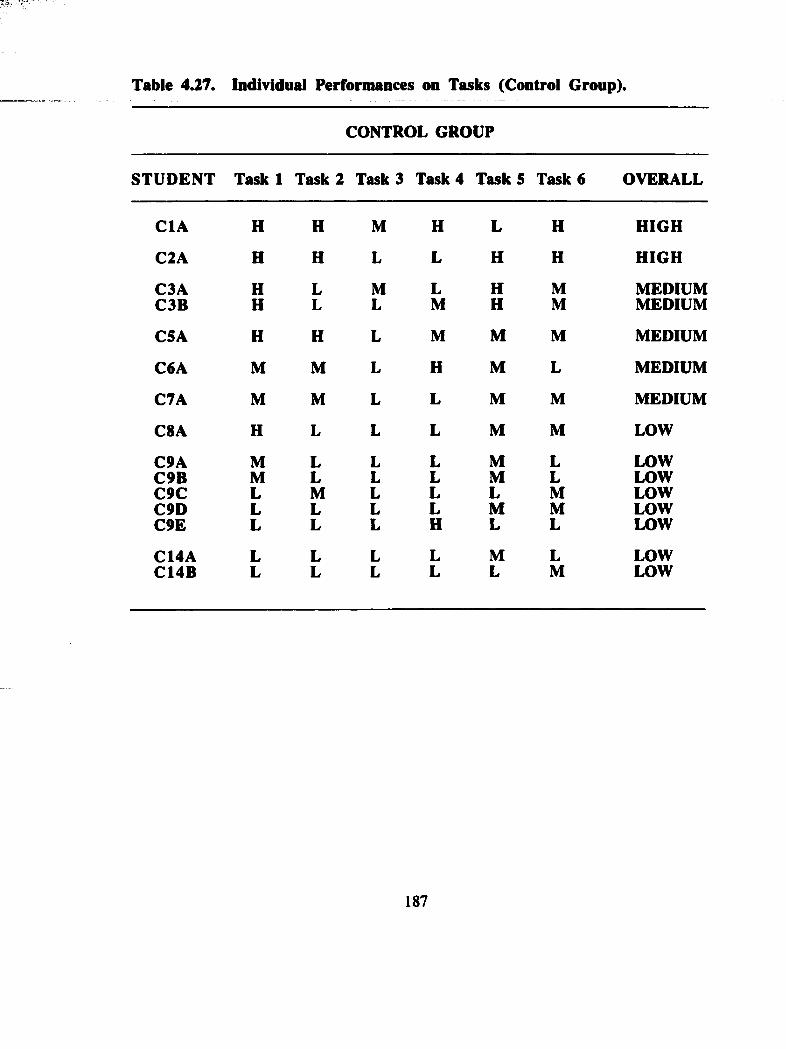
Table 4.27. Individual Performances on Tasks (Control Group).
CONTROL GROUP
STUDENT Task 1 Task 2 Task 3 Task 4 Task 5 Task 6 OVERALL
CIA H H M H L H HIGH
C2A H H L L H H HIGH
C3A H L M L H M MEDIUMC3B H L L M H M MEDIUM
C5A H H L M M M MEDIUM
C6A M M L H M L MEDIUM
C7A M M L L M M MEDIUM
C8A H L L L M M LOW
C9A M L L L M L LOWC9B M L L L M L LOWC9C L M L L L M LOWC9D L L L L M M LOWC9E L L L H L L LOW
C14A L L L L M L LOWC14B L L L L L M LOW
187
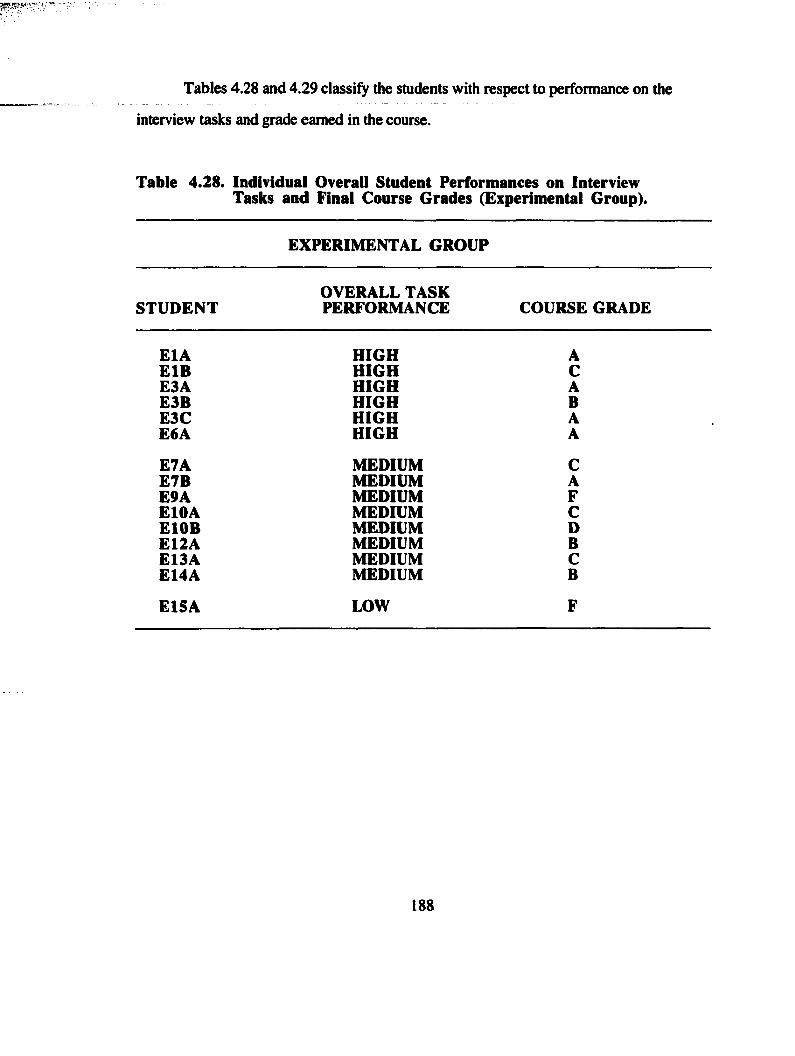
Tables 4.28 and 4.29 classify the students with respect to performance on the
interview tasks and grade earned in the course.
Table 4.28. Individual Overall Student Performances on Interview Tasks and Finai Course Grades (Experimental Group).
EXPERIMENTAL GROUP
STUDENTOVERALL TASK PERFORMANCE COURSE GRADE
ElA HIGH AE lB HIGH CE3A HIGH AE3B HIGH BE3C HIGH AE6A HIGH A
E7A MEDIUM CE7B MEDIUM AE9A MEDIUM FElOA MEDIUM CElOB MEDIUM DE12A MEDIUM BE13A MEDIUM CE14A MEDIUM B
EISA LOW F
188
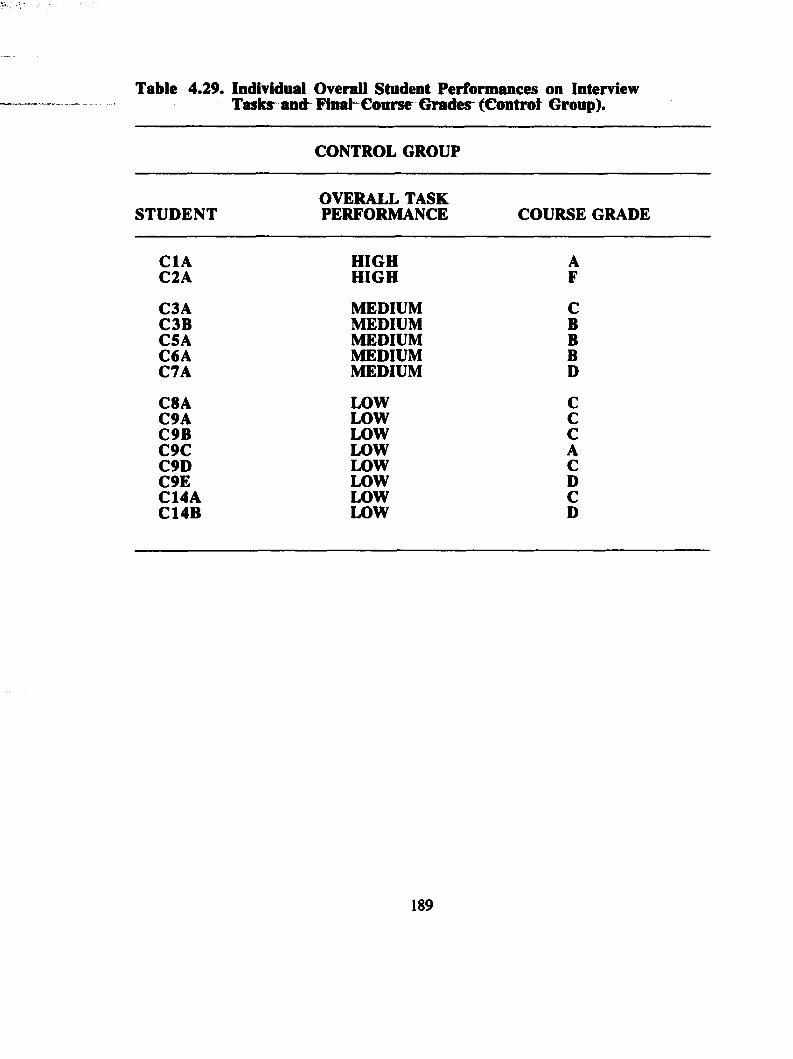
Table 4.29. Individual Overall Student Performances on Interview Taskr and FfamhConrse Grader (Control Group).
CONTROL GROUP
STUDENTOVERALL TASK PERFORMANCE COURSE GRADE
CIA HIGH AC2A HIGH F
C3A MEDIUM CC3B MEDIUM BC5A MEDIUM BC6A MEDIUM BC7A MEDIUM D
C8A LOW CC9A LOW CC9B LOW CC9C LOW AC9D LOW CC9E LOW DC14A LOW CC14B LOW D
189
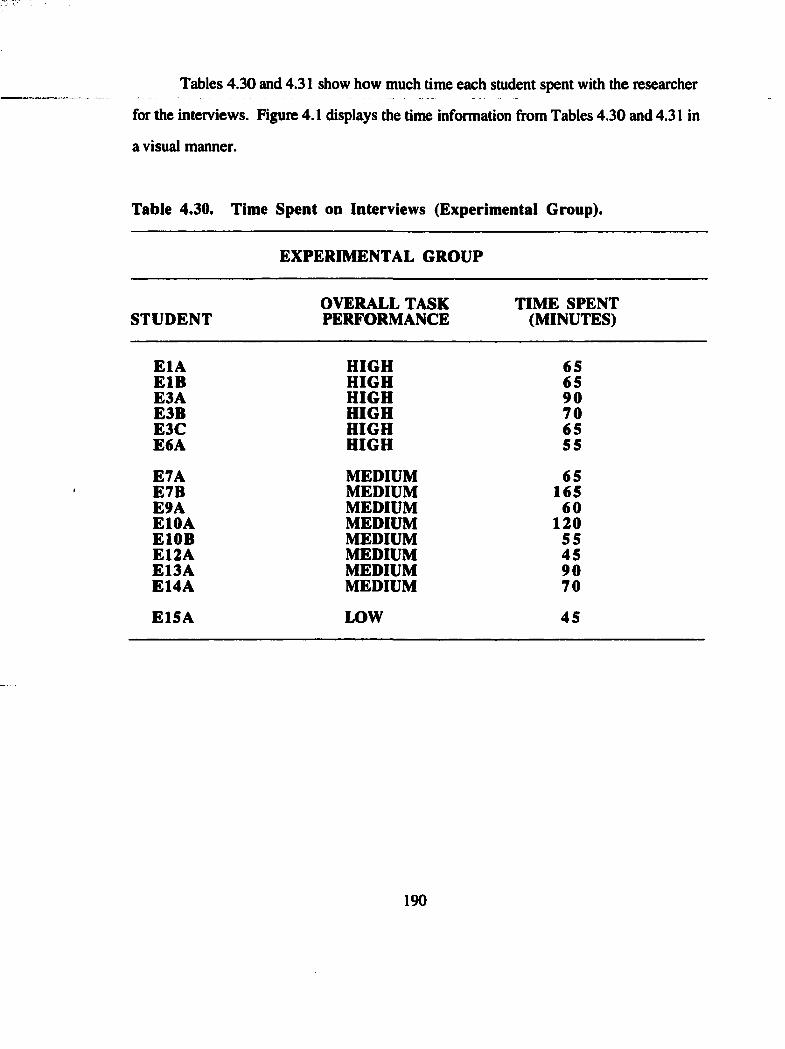
Tables 4.30 and 4.31 show how much time each student spent with the researcher
for the interviews. Figure 4.1 displays the time information from Tables 4.30 and 4.31 in
a visual manner.
Table 4.30. Time Spent on Interviews (Experimental Group).
EXPERIMENTAL GROUP
OVERALL TASK TIME SPENTSTUDENT PERFORMANCE (MINUTES)
E lA HIGH 65E lB HIGH 65E3A HIGH 90E3B HIGH 70E3C HIGH 65E6A HIGH 55
E7A MEDIUM 65E7B MEDIUM 165E9A MEDIUM 60ElOA MEDIUM 120ElOB MEDIUM 55E12A MEDIUM 45E13A MEDIUM 90E14A MEDIUM 70
EISA LOW 45
190
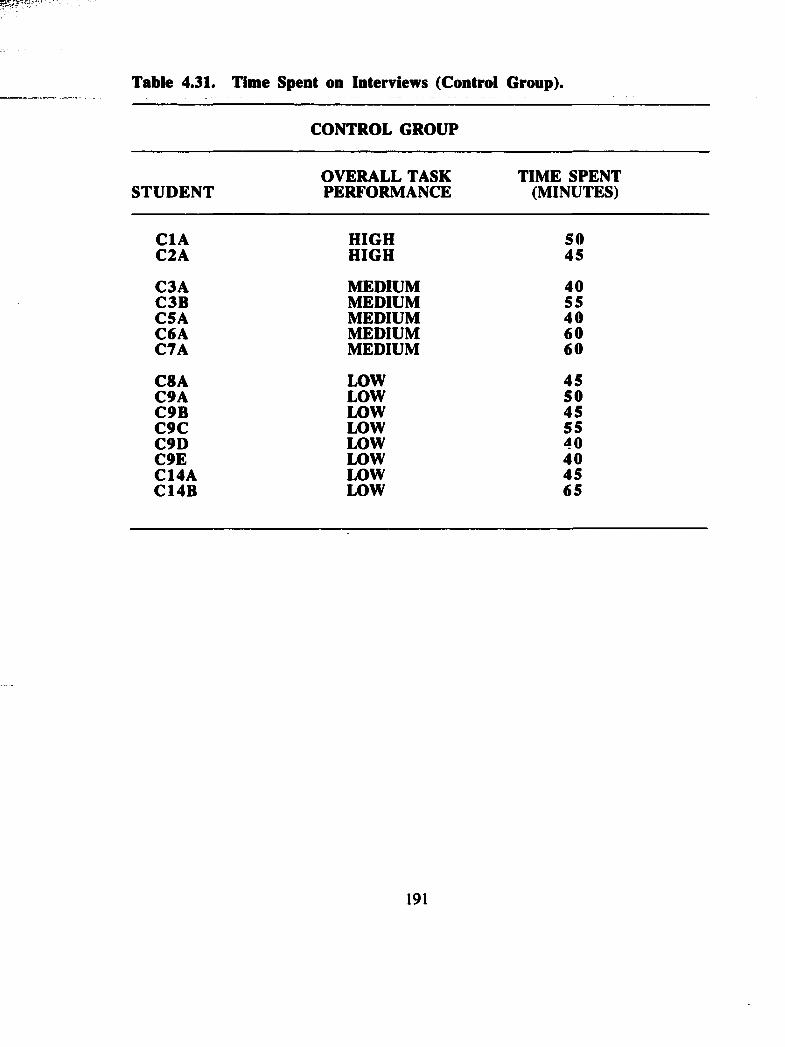
Table 4.31. Time Spent on Interviews (Control Group).
CONTROL GROUP
OVERALL TASK TIME SPENTSTUDENT PERFORMANCE (MINUTES)
CIA HIGH SOC2A HIGH 45
C3A MEDIUM 40C3B MEDIUM 55C5A MEDIUM 40C6A MEDIUM 60C7A MEDIUM 60
C8A LOW 45C9A LOW 50C9B LOW 45C9C LOW 55C9D LOW 40C9E LOW 40C14A LOW 45C14B LOW 65
191
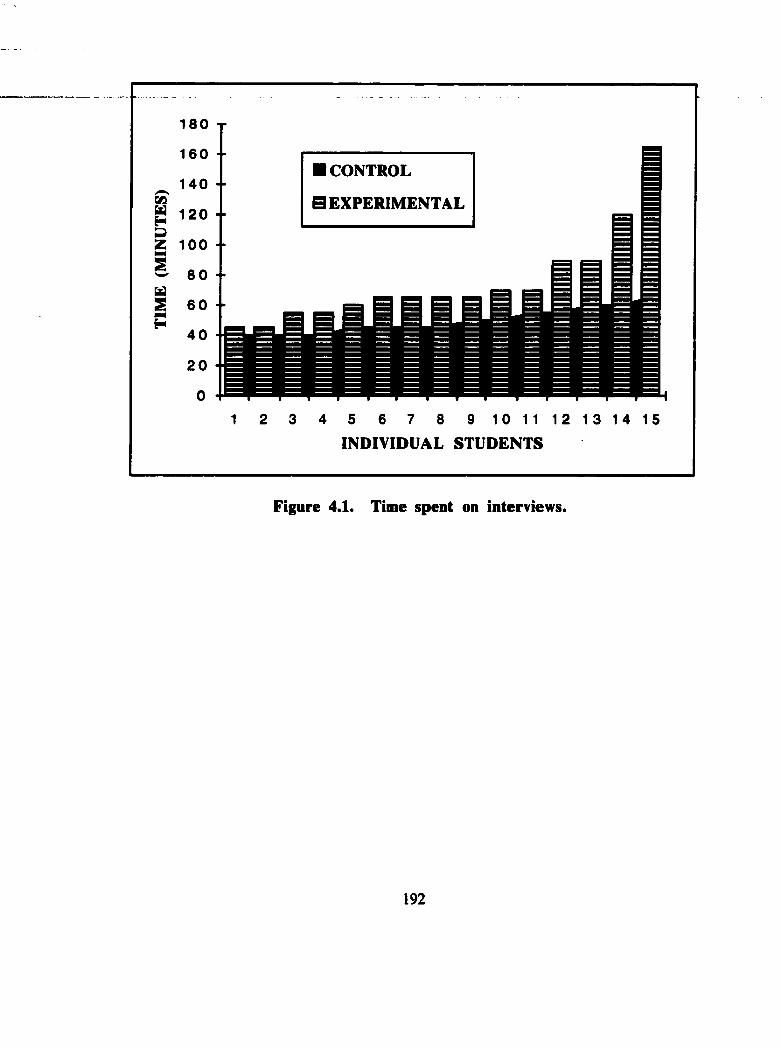
180 T
160
140%g 120a5 100s
8 0 ••Eds 6 0H
4 0 ■
20 ■
0 4
■ CONTROL
■ EXPERIMENTAL
3 4 5 6 7 8 9 1 0 1 1 1 2 1 3INDIVIDUAL STUDENTS
14 15
Figure 4.1. Time spent on interviews.
192
CHAPTER 5
DISCUSSION OF RESULTS, RECOMMENDATIONS, AND CONCLUSIONS
This dissertation investigated students’ abilities to make generalizations in geometry
through the use of a generalization test and task-based interviews. Two groups of
geometry students were compared in the study: an experimental group that made extensive
use of Cabri Geometry II dynamic geometry software (on the TI-92) for the purpose of
exploring concepts in geometry and a control group that did not use any geometry software
during the course. This chapter discusses the findings of the study, comparisons with
previous research, recommendations for research, recommendations for teaching,
implications for theory, limitations of the study, and conclusions.
RESEARCH QUESTIONS
One overall research question and two subquestions guided the study. Each of
these questions shall be restated and discussed in this section. Prior to discussing the
findings of the study, baseline data regarding the students in the study shall be presented.
Baseline data. Three classes of students participated in this study. Two classes
were taught by the researcher and received the experimental treatment. One class was
taught by another mathematics teacher at the same school and served as a control group.
193
Based on pretest information (the Entering Geometry Student Test and the generalization
pretest), it can be stated that the two groups (the experimental group and the control group)
are similar. No signifîcant differences were found between the experimental group and the
control group on pretest data. The focus of the study was to take two similar groups and
try to determine if regular use of dynamic geometry software seemed to enhance students’
abilities to make generalizations in geometry.
RESEARCH QUESTION: Does experience with Cabri enhance
students’ abilities to make generalizations in geometry? Two primary sources
of data (the generalization posttest data and results of the interview tasks) and another
source of data (observations made by the researcher during the period of data collection
with the experimental group) will help to answer this question. While more detail will be
given to the discussion of the generalization posttest and the interview tasks when reporting
on the research subquestions later in this chapter, some comments will be made here to help
answer the research question. No significant differences were found between the groups
on the generalization posttest. If this were the only source of data available to inform the
research question, the answer would have to be that the experience with Cabri did not seem
to enhance students’ abilities to make generalizations in geometry. Based on data obtained
from the interview tasks, however, a different answer seems appropriate. Results of the
interview tasks show a relationship between group membership and performance on the
interview tasks in ten out of fifteen categories reported (see Table 4.25). These results
favor the experimental group. Considering Tasks 1 to 5 and overall performance on Task
6 as six categories, results favor the experimental group statistically in four of the six
categories. Additionally, results from Tasks I and 2 favor the experimental group in their
raw form (see Tables 4.10 and 4.11), but the results were not statistically significant.
Therefore, it can be argued that results of the interview tasks overall do favor the
experimental group.
194
Should one or the other of these results be given greater consideration in answering
the research question? In the opinion of the researcher, the results of the interview tasks
weigh more heavily in answering the research question. Even though the interview tasks
involved only a subset of all of the students in the study, the nature of the questions on
each instrument leads the researcher to make this conclusion. The type of generalizations
required on the generalizations pre- and posttest were algebraic in nature. Beyond the time
students actually spent taking the generalizations tests and some attention to these types of
questions in Chapter 2 of the textbook, little attention was given to these types of
generalizing questions during the course by either the researcher or the control group
teacher. Sometimes, these types of generalizations occurred naturally in the course of
study, but not often. The example that comes to mind is the Polygon Interior Angle Sum
Theorem. Additionally, in this example, there is overlap on whether the generalization is
algebraic or geometric. The generalization of [180(n - 2)]° for the sum of the interior
angles of any convex polygon is algebraic in nature, but the origin of the data is geometric.
The researcher feels, therefore, that the interview tasks should weigh more heavily
in answering the research question. With this in mind, it can be stated that the experience
with Cabri does seem to enhance students abilities to make generalizations in geometry.
Additional corroboration for this claim comes from observations that the researcher made
during the course of data collection with the experimental group. With Cabri at their
disposal, students were prone to experiment and make generalizations. One situation that
merits discussion is when students were constructing the perpendicular bisectors of the
sides of a triangle. In this situation, it was clear that dynamic geometry software offered
much more to investigating the topic than any traditional method could hope to offer. Once
students noted that the perpendicular bisectors were concurrent at the circumcenter, it was
natural for them to grab a vertex and manipulate the triangle. In a matter of minutes,
several observations were made regarding the circumcenter. Students noted that for acute
195
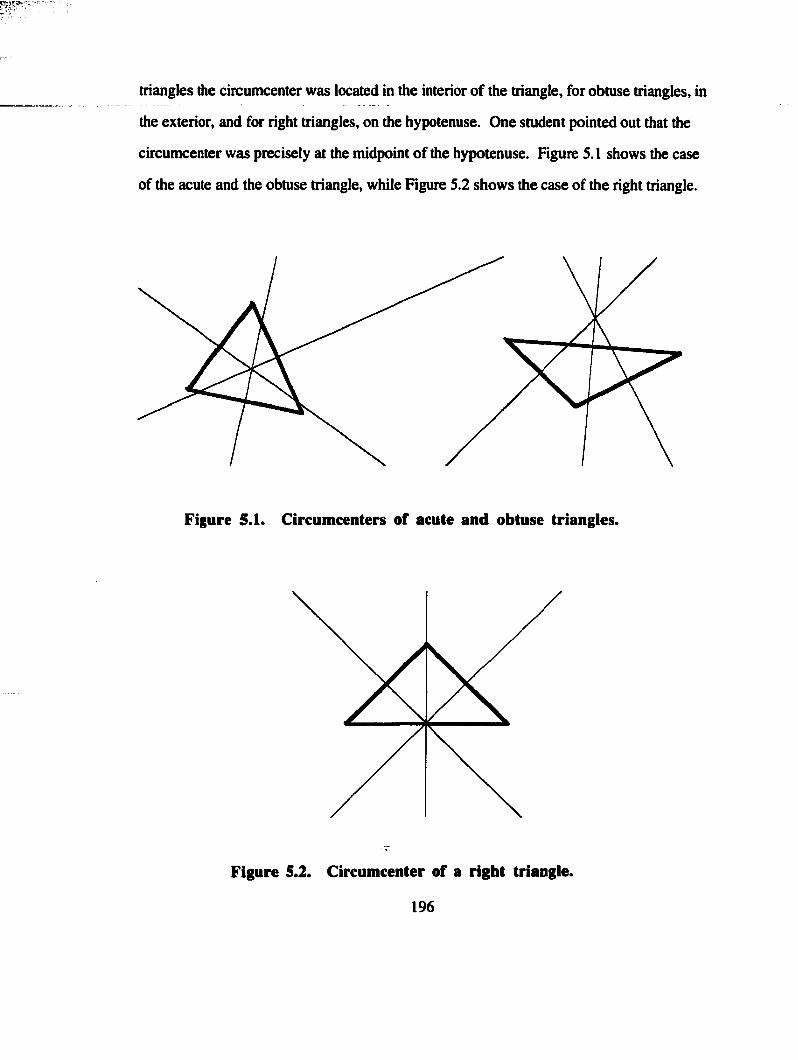
triangles the circumcenter was located in the interior of the triangle, for obtuse triangles, in
the exterior, and for right triangles, on the hypotenuse. One student pointed out that the
circumcenter was precisely at the midpoint of the hypotenuse. Figure 5.1 shows the case
of the acute and the obtuse triangle, while Figure 5.2 shows the case of the right triangle.
Figure 5.1. Circumcenters of acute and obtuse triangles.
Figure 5.2. Circumcenter of a right triangle.
196
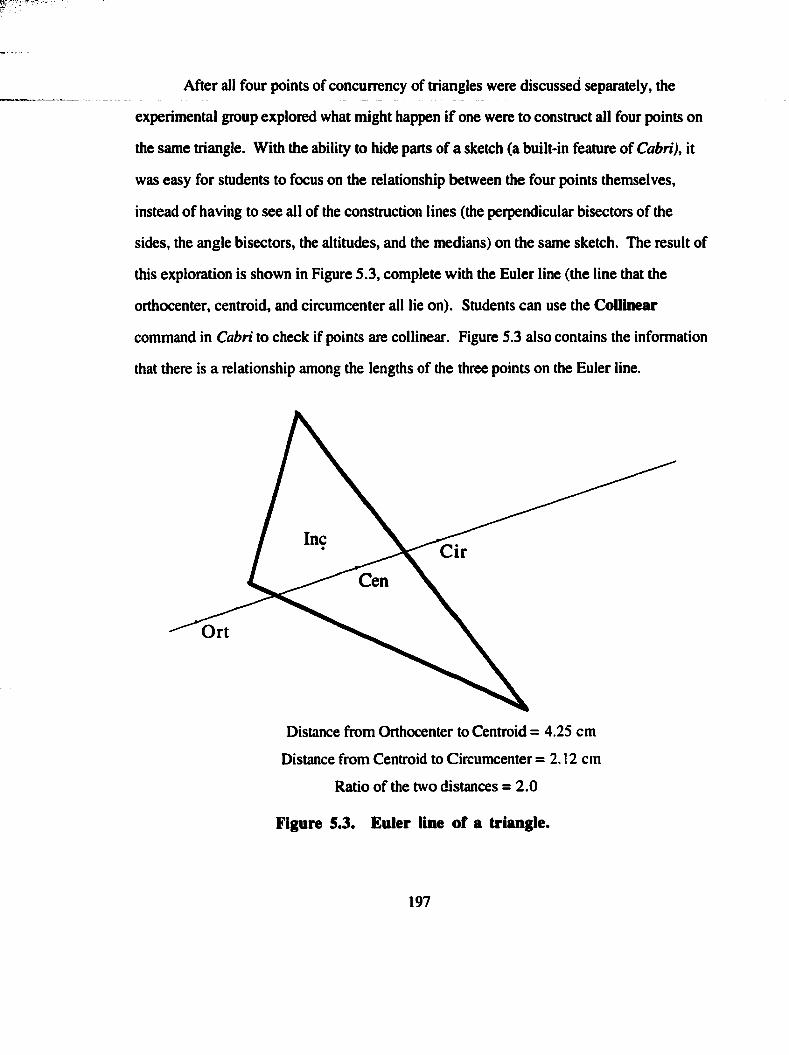
After all four points of concurrency of triangles were discussed separately, the
experimental group explored what might happen if one were to construct all four points on
the same triangle. With the ability to hide parts of a sketch (a built-in feature of Cabri), it
was easy for students to focus on the relationship between the four points themselves,
instead of having to see all of the construction lines (the perpendicular bisectors of the
sides, the angle bisectors, the altitudes, and the medians) on the same sketch. The result of
this exploration is shown in Figure 5.3, complete with the Euler line (the line that the
orthocenter, centroid, and circumcenter all lie on). Students can use the CoUinear
command in Cabri to check if points are collinear. Figure 5.3 also contains the information
that there is a relationship among the lengths of the three points on the Euler line.
IncCir
Cen
Ort
Distance from Orthocenter to Centroid = 4.25 cm
Distance from Centroid to Circumcenter = 2.12 cm
Ratio of the two distances = 2.0
Figure 5.3. Euler line of a triangle.
197
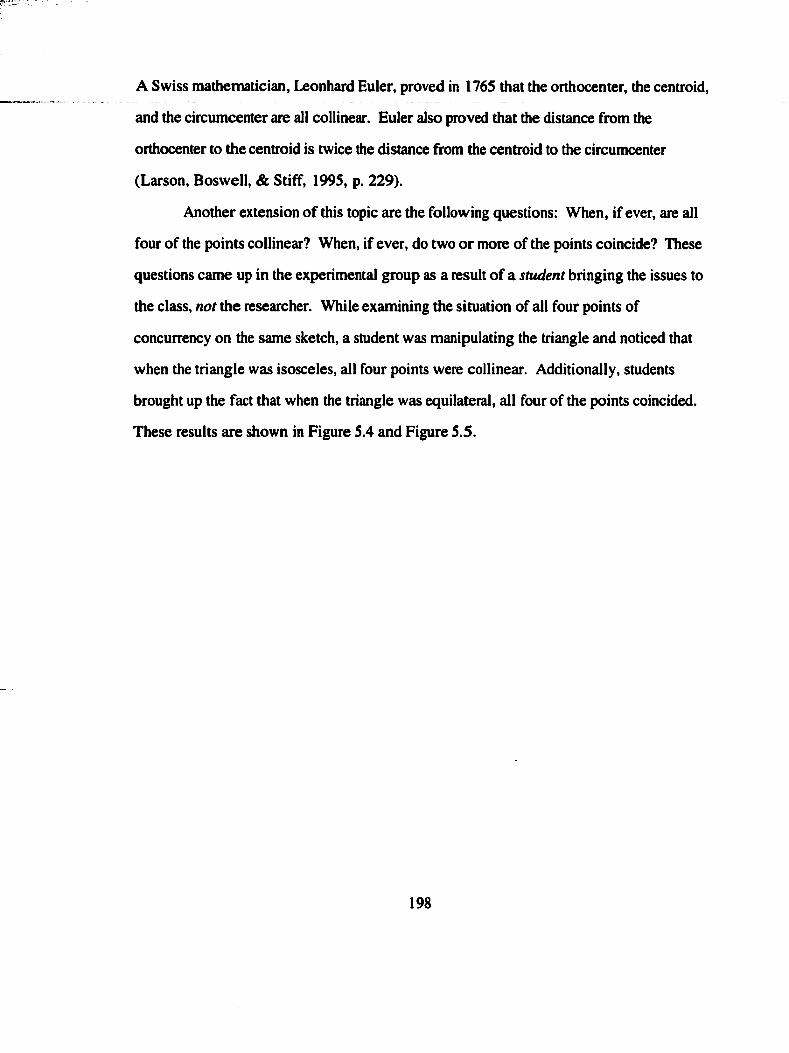
A Swiss mathematician, Leonhard Euler, proved in 1765 that the orthocenter, the centroid,
and the circumcenter are all collinear. Euler also proved that the distance fiom the
orthocenter to the centroid is twice the distance from the centroid to the circumcenter
(Larson, Boswell, & Stiff, 1995, p. 229).
Another extension of this topic are the following questions: When, if ever, are all
four of the points collinear? When, if ever, do two or more of the points coincide? These
questions came up in the experimental group as a result of a student bringing the issues to
the class, not the researcher. While examining the situation of all four points of
concurrency on the same sketch, a student was manipulating the triangle and noticed that
when the triangle was isosceles, all four points were collinear. Additionally, students
brought up the fact that when the triangle was equilateral, all four of the points coincided.
These results are shown in Figure 5.4 and Figure 5.5.
198
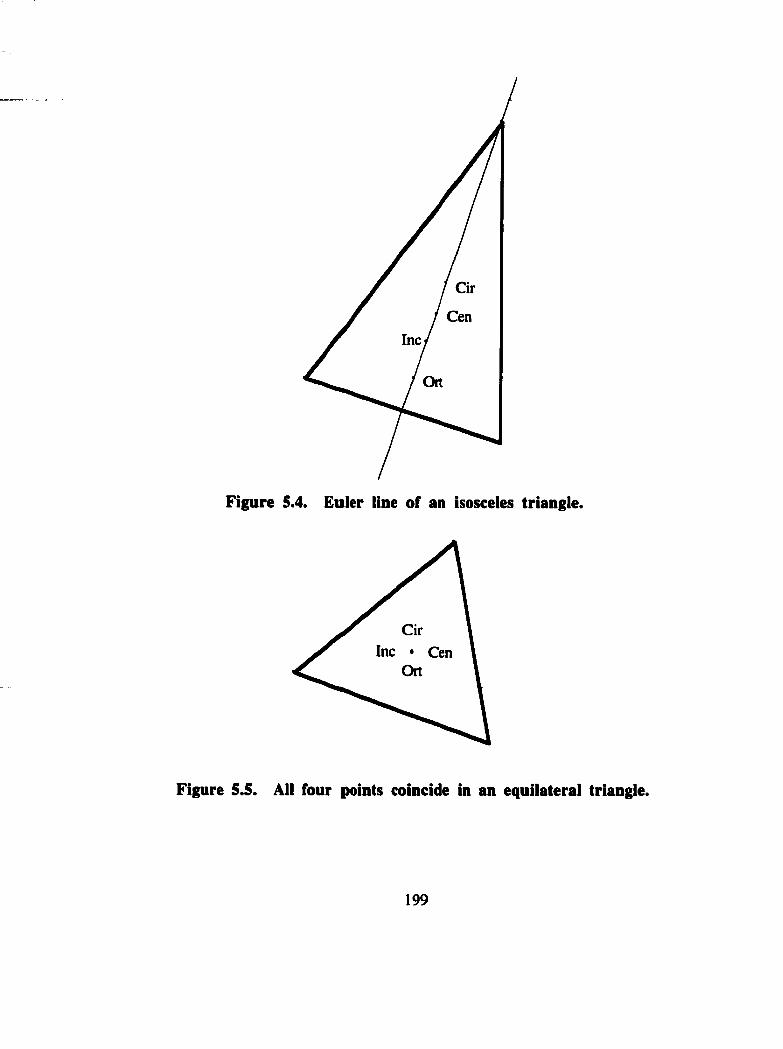
Cir
CenInc
Ort
Figure 5.4. Euler line of an isosceles triangle.
Cir
Ort
Figure 5.5. Ail four points coincide in an equilateral triangle.
199
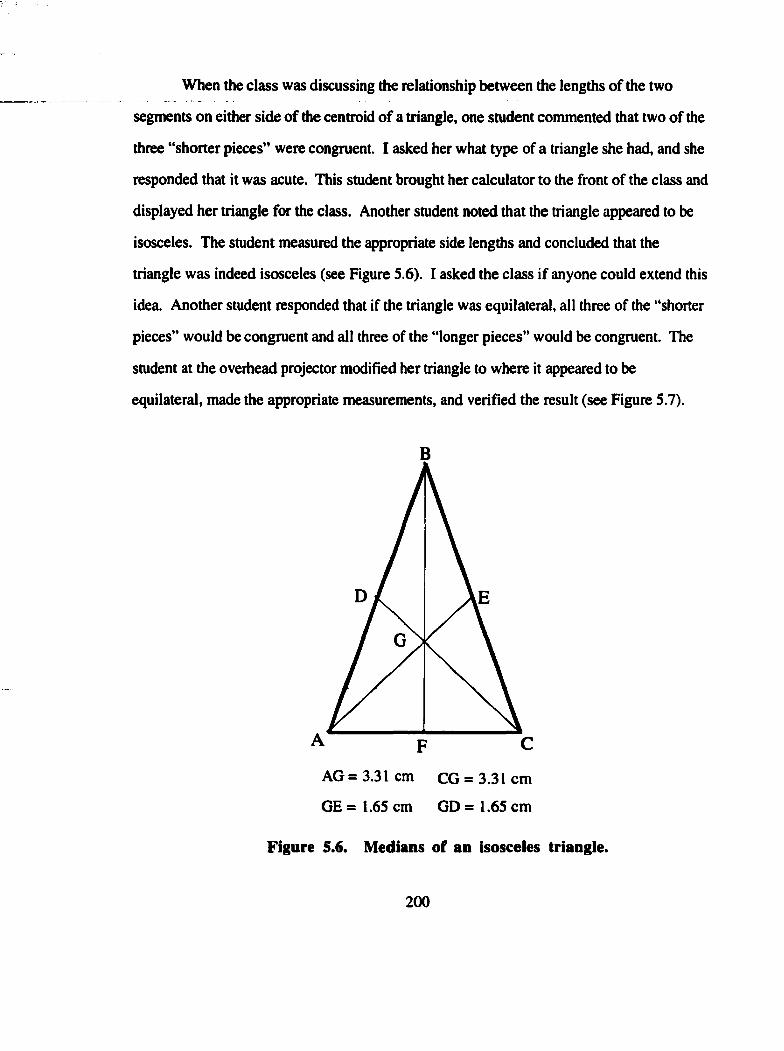
When the class was discussing the relationship between the lengths of the two
segments on either side of the centroid of a triangle, one student commented that two of the
three “shorter pieces” were congruent. I asked her what type of a triangle she had, and she
responded that it was acute. This student brought her calculator to the front of the class and
displayed her triangle for the class. Another student noted that the triangle appeared to be
isosceles. The student measured the appropriate side lengths and concluded that the
triangle was indeed isosceles (see Figure 5.6). I asked the class If anyone could extend this
idea. Another student responded that if the triangle was equilateral, all three of the “shorter
pieces” would be congruent and all three of the “longer pieces” would be congruent. The
student at the overhead projector modified her triangle to where it appeared to be
equilateral, made the appropriate measurements, and verified the result (see Figure 5.7).
B
A CFAG = 3.31 cm CG = 3.31 cm
GE = 1.65 cm GD = 1.65 cm
Figure 5.6. Medians of an isosceles triangle.
200
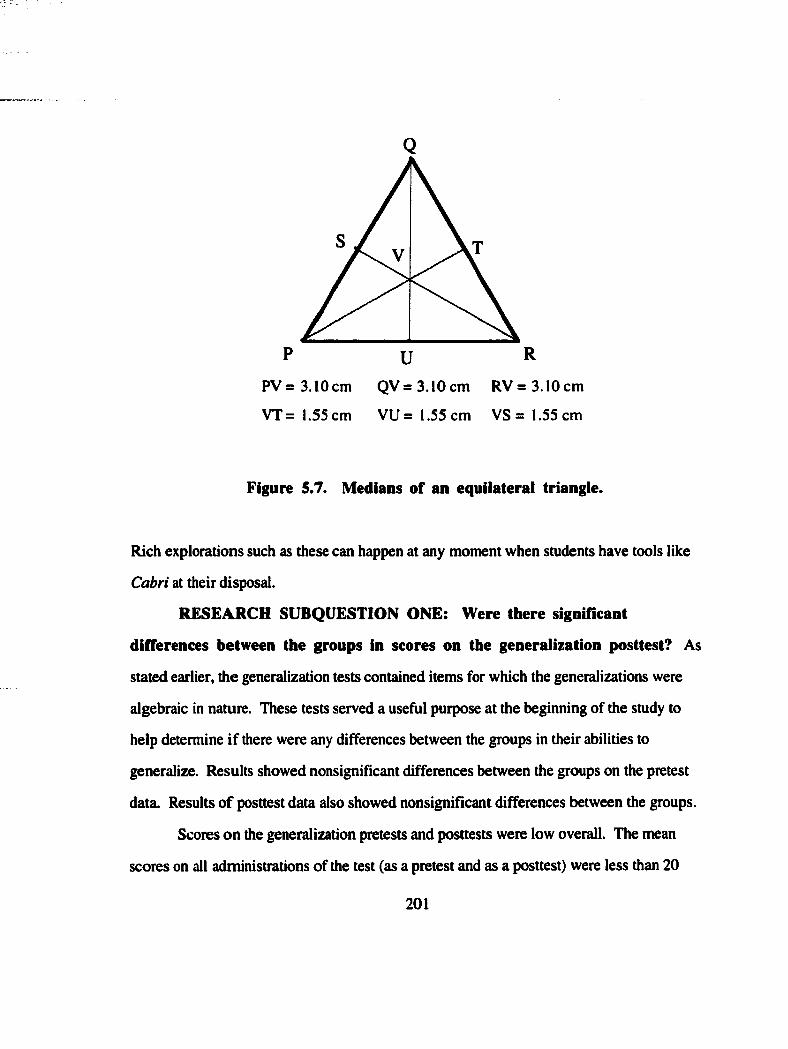
p R
PV = 3.10 cm QV = 3.10 cm RV = 3.10 cm
VT = 1.55 cm VU =1.55 cm VS =1.55 cm
Figure 5.7. Medians of an equilateral triangle.
Rich explorations such as these can happen at any moment when students have tools like
Cabri at their disposal.
RESEARCH SUBQUESTION ONE: Were there significant
differences between the groups in scores on the generalization posttest? As
stated earlier, the generalization tests contained items for which the generalizations were
algebraic in nature. These tests served a useful purpose at the beginning of the study to
help determine if there were any differences between the groups in their abilities to
generalize. Results showed nonsignifîcant differences between the groups on the pretest
data. Results o f posttest data also showed nonsignificant differences between the groups.
Scores on the generalization pretests and posttests were low overall. The mean
scores on all administrations of the test (as a pretest and as a posttest) were less than 20
201
(out of possible 50 points). The scores were relatively low on the pretest and did not show
much improvement over the course of the study. This can be attributed, as mentioned
earlier, to a lack of particular focus on these types of questions during the geometry course.
Some problems like these occur in the text, but they are not a primary emphasis. Another
reason the scores were low can be attributed to the method used for scoring the tests.
Students could earn a total of 19 points (out of SO) for extending patterns, which is a much
easier task than arriving at a generalization for the nth term of a sequence. Accordingly, nth
term generalizations made up 31 points out of the 50 point total. This scoring was the same
on each form of the test. Most students in both groups demonstrated some degree of
success on extending patterns and collecting data, but only a few students from either
group demonstrated a high degree of success on the generalizing questions.
One particular issue that merits discussion is regarding Form B, Question 5. The
question is about the volume of several cubes whose sides start out with the pattern 1,2,4.
The instructions state for the students to think carefully about the length of a side of the
cube in Stage 4. The researcher created the question with doubling of side lengths in mind.
Therefore, the next two cubes would have side lengths of 8 and 16, and corresponding
volumes of 512 and 4096. One student in the experimental group interpreted the change in
side lengths a diAerent, yet valid, way. This student considered 7 and 11 to be the next
two cases, by thinking of the side lengths changing by adding one, two, three, and then
four to the length of the previous side length. The researcher did not consider this until the
papers were scored. This student received full credit for this interpretation. The reader
may refer to Appendix B for the full test, or to Chapter 3 for an item by item discussion of
how the generalization tests were scored.
The problems on the generalization tests are excellent vehicles for teaching
generalization, and could be the focus of future work by the researcher. To emphasize
these problems any more than occurred with typical coverage of the text, however, would
202
have biased the results of the study. There have been occasions in the researcher’s prior
experience where a unit of study was taught that emphasized these types of generalization
problems. On these occasions, students showed remarkable improvement in their ability to
generalize from the beginning of the unit to the end of the unit.
RESEARCH SUBQUESTION TWO: Was there a significant
relationship between group membership and performance on the interview
tasks? In the opinion of the researcher, this question should be answered affirmatively.
The summary of the chi-square statistics reported in Chapter 4 (see Table 4.25) show a
relationship between group membership and performance on the interview tasks in ten of
fifteen categories of analysis. The raw data favors the experimental group in all fifteen
categories. These are important results which address the generalizing ability of students
immersed in a Cabri environment. The task-by-task descriptions in this chapter further
illustrate differences between the two groups. One of the most notable differences is the
greater willingness of the experimental group to be persistent in looking for generalizations.
The experimental group spent more time and tested a greater variety of conjectures when
looking for generalizations during the interview tasks. Further discussion on time data is
provided later in this chapter. Differences between the groups on each task shall now be
discussed.
Task 1. Even though the chi-square value did not show a significant relationship
between group membership and performance on the task, ̂more students (66.67% vs. 40%)
from the experimental group scored in the high category on this task. Students had to
arrive at the correct value for the missing length in the fourth figure to be scored as a high
for this task. Some students in both groups found the result very quickly, while others
who found the correct value spent a fair amount of time experimenting with various
computations (noting proportional relationships in some of the examples and looking for
commonalities between the first three examples). Even though time spent on each
203
particular task was not recorded, it is clear from the interview summaries prepared by the
researcher that more students in the experimental group spent considerable time examining
the data.
Task 2. Again, the chi-square value cannot lead to the conclusion of a relationship
between group membership and task performance. However, more students from the
experimental group (40%) than the control group (20%) were classified in the high
category for this task. Most students correctly interpreted Theorem 1, but there was a
slightly higher tendency in the experimental group to do so. Four students in the control
group needed help interpreting the theorem, while only one student in the experimental
group needed help. Some students made a connection between the two theorems that was
hoped for by the researcher. These students discussed the movement of point E either to
some place on the circle, or to coincide with point C. Three students in the experimental
group and two students from the control group made this connection. The reason that the
researcher hoped for this connection is that Theorem 2 can be thought of as a special case
of Theorem I. Both theorems are about the angle(s) formed by the intersection of two
chords. In the second theorem, the chords happen to intersect on the circle. In this
situation, the measure of the “second arc” is zero, which two students (one from each
group) specifically stated.
Task 3. The value of chi-square shows a significant relationship between group
membership and performance on Task 3. This task proved to be harder than Task 1. where
the goal was also to find a missing value. Only three students found the correct value in
Example 4 (all horn the experimental group). Multiplicative relationships seem harder for
students to discover than additive relationships. Many students in both groups added up
the lengths of the two parts of segment TS to see if there was a common sum. The notion
of a common sum was the only idea that many students in the control group considered
before giving up on the task. Once they found out that the sum was not the same in
204
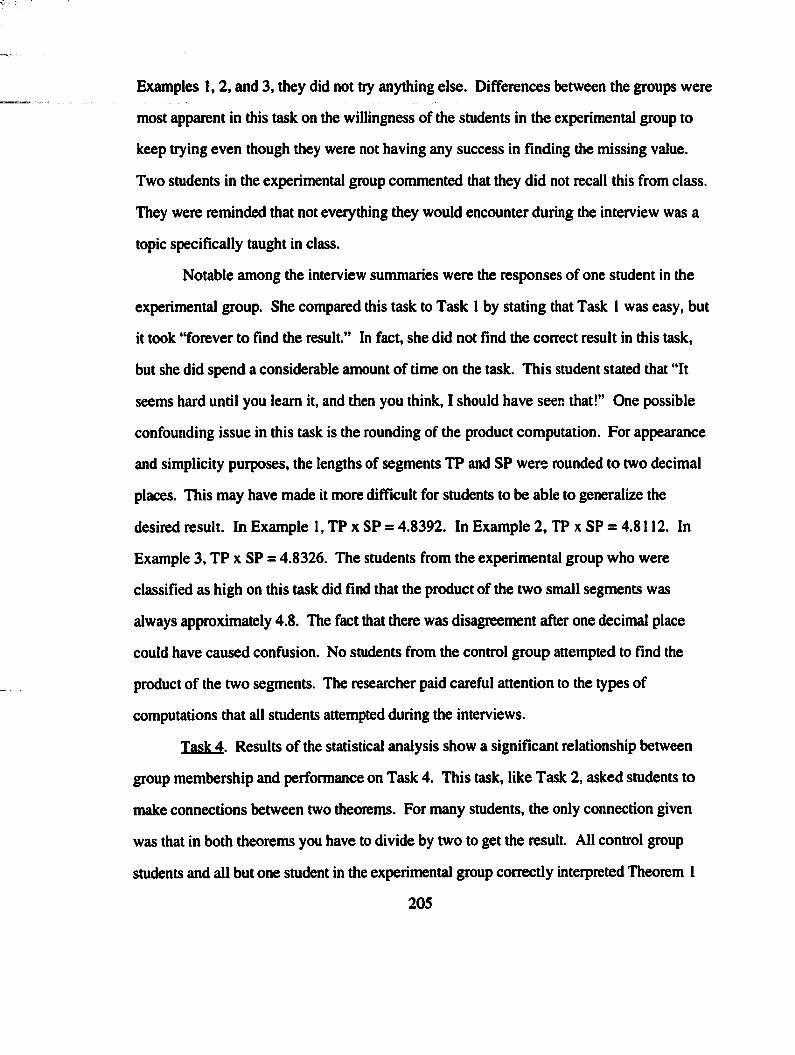
Examples 1,2, and 3, they did not try anything else. Differences between the groups were
most apparent in this task on the willingness of the students in the experimental group to
keep trying even though they were not having any success in Ending the missing value.
Two students in the experimental group commented that they did not recall this from class.
They were reminded that not everything they would encounter during the interview was a
topic specifically taught in class.
Notable among the interview summaries were the responses of one student in the
experimental group. She compared this task to Task 1 by stating that Task 1 was easy, but
it took “forever to find the result.” In fact, she did not find the correct result in this task,
but she did spend a considerable amount of time on the task. This student stated that “It
seems hard until you learn it, and then you think, I should have seen that!” One possible
confounding issue in this task is the rounding of the product computation. For appearance
and simplicity purposes, the lengths of segments TP and SP were rounded to two decimal
places. This may have made it more difficult for students to be able to generalize the
desired result. In Example I, TP x SP = 4.8392. In Example 2, TP x SP = 4.8112. In
Example 3, TP x SP = 4.8326. The students from the experimental group who were
classified as high on this task did find that the product of the two small segments was
always approximately 4.8. The fact that there was disagreement after one decimal place
could have caused confusion. No students from the control group attempted to End the
product of the two segments. The researcher paid careful attention to the types of
computations that all students attempted during the interviews.
Task 4 . Results of the statistical analysis show a signiEcant relationship between
group membership and performance on Task 4. This task, like Task 2, asked students to
make connections between two theorems. For many students, the only connection given
was that in both theorems you have to divide by two to get the result. All control group
students and all but one student in the experimental group correctly interpreted Theorem 1
205
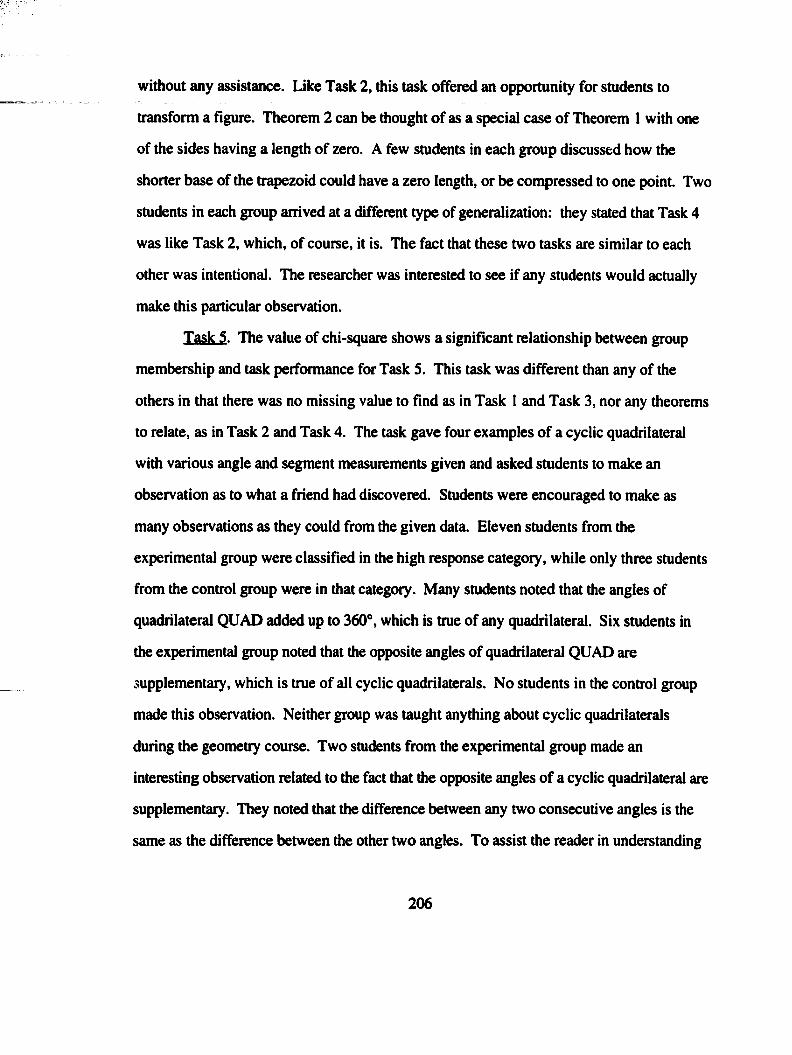
without any assistance. Like Task 2, this task offered an opportunity for students to
transform a figure. Theorem 2 can be thought of as a special case of Theorem 1 with one
of the sides having a length of zero. A few students in each group discussed how the
shorter base of the trapezoid could have a zero length, or be compressed to one point. Two
students in each group arrived at a different type of generalization: they stated that Task 4
was like Task 2, which, of course, it is. The fact that these two tasks are similar to each
other was intentional. The researcher was interested to see if any students would actually
make this particular observation.
Task 5. The value of chi-square shows a significant relationship between group
membership and task performance for Task S. This task was different than any of the
others in that there was no missing value to find as in Task 1 and Task 3, nor any theorems
to relate, as in Task 2 and Task 4. The task gave four examples of a cyclic quadrilateral
with various angle and segment measurements given and asked students to make an
observation as to what a friend had discovered. Students were encouraged to make as
many observations as they could from the given data. Eleven students from the
experimental group were classified in the high response category, while only three students
from the control group were in that category. Many students noted that the angles of
quadrilateral QUAD added up to 360°, which is true of any quadrilateral. Six students in
the experimental group noted that the opposite angles of quadrilateral QUAD are
supplementary, which is true of all cyclic quadrilaterals. No students in the control group
made this observation. Neither group was taught anything about cyclic quadrilaterals
during the geometry course. Two students from the experimental group made an
interesting observation related to the fact that the opposite angles of a cyclic quadrilateral are
supplementary. They noted that the difierence between any two consecutive angles is the
same as the difference between the other two angles. To assist the reader in understanding
2 0 6
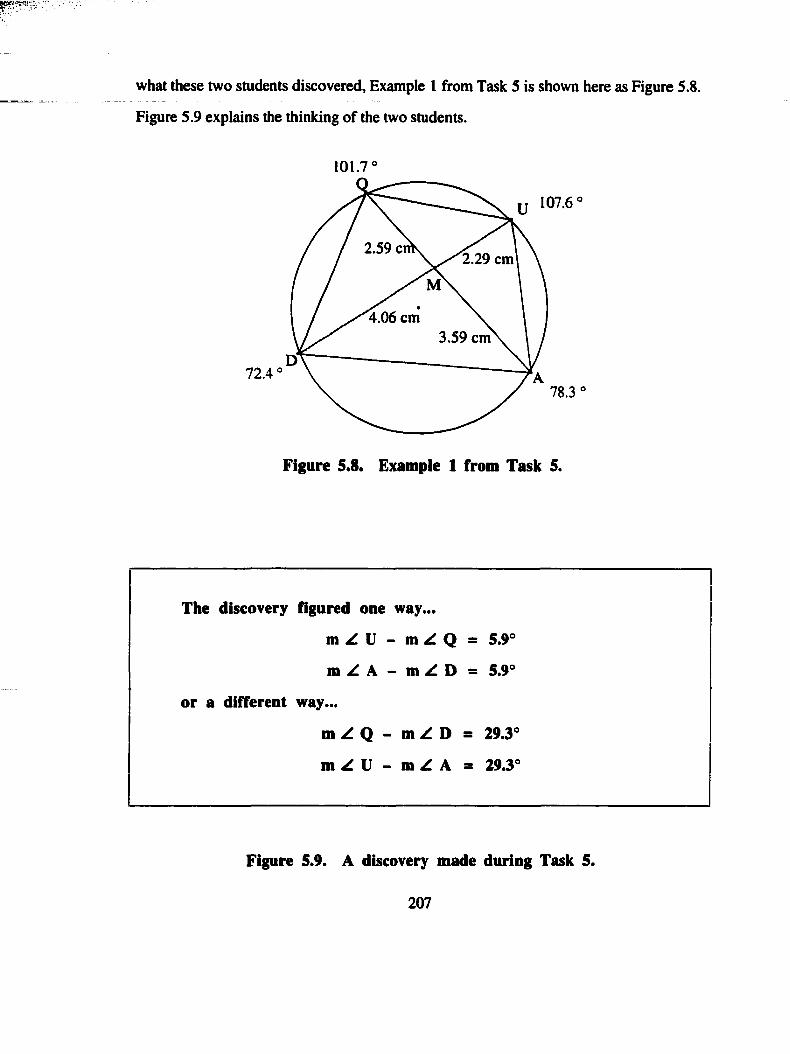
what these two students discovered. Example 1 from Task 5 is shown here as Figure 5.8.
Figure 5.9 explains the thinking of the two students.
101.7
107.6
2.59 Cl2.29 cm
4.06 cm3.59 cm
72.478.3
Figure 5.8. Example 1 from Task 5.
The discovery figured one way...
m Z U - m Z Q = 5.9°
m Z A - m Z D = 5.9°
or a dil^erent way...
m Z Q - m Z D = 29.3°
m Z U - m Z A = 29.3°
Figure 5.9. A discovery made during Task 5.
207
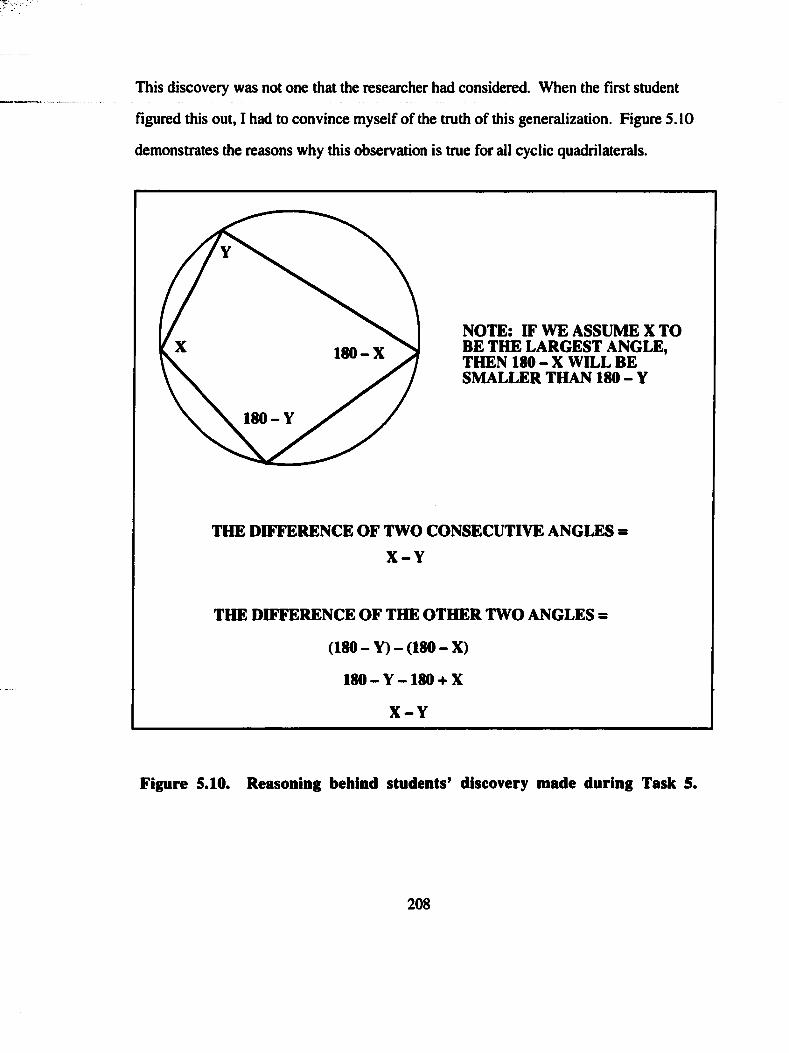
This discovery was not one that the researcher had considered. When the first student
figured this out, I had to convince myself of the truth of this generalization. Figure S. 10
demonstrates the reasons why this observation is true for all cyclic quadrilaterals.
NOTE; IF WE ASSUME X TO BE THE LARGEST ANGLE, THEN 180- X WILL BE SMALLER THAN 180 - Y
180-X
180- V
THE DIFFERENCE OF TWO CONSECUTIVE ANGLES =X -Y
THE DIFFERENCE OF THE OTHER TWO ANGLES =
(180-Y ) - (1 8 0 -X )
1 8 0 -Y -1 8 0 + X
X -Y
Figure 5.10. Reasoning behind students’ discovery made during Task 5.
208

Two students in the experimental group and one student from the control group made a
different observation. Each of the three students expressed the idea in a slightly different
way. A student from the experimental group expressed the relationship between an angle
and a small segment that was “across from it.” In Example 1, this student noted that
segment UM, the shortest of the four interior segments originating from point M, is “across
from” angle D, the smallest of the four angles. A second student in the experimental group
stated that the longest segment (in Example 1 this is segment DM) “points to” the smallest
angle (angle D). A student from the control group stated that the shortest length (segment
UM) is associated with the largest angle (angle U). Even though this discussion has
centered around Example 1, each of these students verified that the discovery was true in
each of the four examples. This task is related to the discovery in Task 3, as we have
chords of a circle and a point on the chord. Even though three students made the
appropriate generalization in Task 3, none of these students observed that the same
relationship was present in Task S. Several students tried adding the segment lengths
together (more students from the experimental group than the control group did this), but
found only that the sum of the four small segments was about approximately 12. It was
not a common number to each example. Some students computed the lengths of the
diagonals in each example. These students found that in Example 2, the diagonals were
very close to each other in length (QA = 6.34 and DU = 6.42).
Task 6. Overall results for this task show a significant relationship between group
membership and task performance. One of the notable things about this task is that so
many students did not seem to have a grasp of the Pythagorean Theorem as an area
argument. In the experimental group, seven students correctly interpreted the theorem with
no help, four needed only a little help, and four needed to be told what the theorem
represented. In the control group, four students correctly interpreted the theorem with no
help, and eleven needed to be told what the theorem represented. The entire experimental
209
group and all but three students in the control group realized that we cannot put just any
rectangles on the sides and have the area argument hold. Students found several ways to
express their ideas: the rectangles must be similar; the rectangles must be proportional to
each other; the squares must all be “cut the same way” (like 1/2, 1/3, or 1/4). Some
students gave speciOc counterexamples. When asked if other figures might work, several
students (fîve from the experimental group and two from the control group) suggested an
equilateral triangle. On the last question of Task 6, three students hom the experimental
group and one student from the control group specihcally stated that any figures would
work as long as they were similar to each other. A majority of the students in the
experimental group gave suggestions for other figures that could be constructed on the
sides of the triangle and still have the area argument work. A majority of students in the
control group felt that there were no other figures that would work (other than what had
already been discussed in the task).
A brief discussion of the time spent on the interview tasks will now be given.
Tables 4.30 and 4.31 report the length the interviews. Figure 4.1 shows these data in a
visual manner. The experimental group spent more time overall in the interviews. Part of
this might be attributed to the fact that they had the researcher as their geometry teacher,
while the control group did not know the researcher, except as another teacher at the
school. Part of the time difference, however, might be attributed to the fact that the
experimental group spent a great deal of time during the course conjecturing while using
Cabri. Some of this inquisitiveness may have carried over to the interview situation when
they were asked to make generalizations without having the software in front of them.
Students in the experimental group were routinely given tasks in class in which some level
of generalization was the desired outcome. While not a daily occurrence, students in the
experimental group were regularly asked to look at geometric situations using Cabri, take
measurements, and to try to make some sense of what they saw on their calculator screen.
210
One fînal issue that merits discussion regarding the interview task data are the
differences in grade levels of the students in the interview subgroups. The experimental
subgroup consisted of ten freshmen and rive sophomores. The control group consisted of
four freshmen, ten sophomores, and one junior. Even though data were presented in
Chapter 3 showing that there were nonsigniricant differences in the make-up of the two
subgroups, some readers may feel that the groups were somewhat different based on their
grade-level distribution. In the opinion of the researcher, this difference did not have any
major impact on the results of the study. All students were offered an opportunity to
participate in the interviews, knowing that not all who volunteered would be chosen. As it
turns out, not enough students volunteered for the interviews, and some students had to be
solicited for participation. From a humanitarian standpoint, the researcher did not wish to
turn away students from his classes (the experimental group) who volunteered to participate
in the interview sessions. All students enrolled in Geometry had previously earned credit
in Algebra I. No effort was made to use students’ Algebra I course grades as a
consideration as to whether the interview subgroups were similar. The researcher feels that
adequate controls were in place (course grades, scores on the Entering Geometry Student
Test, and scores on the generalization pretest) to argue that the interview subgroups were
similar.
COMPARISONS W ITH PREVIOUS RESEARCH
Previous research using some type geometry software can be traced back to the
1980s. Programs such as Logo, The Geometric Supposer, The Geometer’s Sketchpad,
Geometry Inventor, and Cabri have been used to examine teaching and learning issues in
geometry classrooms. The study by Yerushalmy (1986) focused on induction and
generalization in conjunction with use of The Geometric Supposer. The results of that
study indicated that the computer-intensive environment positively impacted the
211
generalization ability of the students in the study. Results of the study by Yerushalmy,
Chazan, and Gordon (1987) indicate a favorable impact on students’ abilities to develop
generalizations when The Geometric Supposer was used. The results of the present study
also indicate a favorable impact on students’ generalization abilities.
Roberts and Stephens (1999) reported on results of a study which compared the
effect of differing levels of software implementation on students’ geometry achievement.
The study used Geometry Inventor, which is comparable to The Geometric Supposer.
Few significant differences were reported, leading the researchers to claim that using
computer software may not be beneficial when teaching certain topics in geometry. These
findings support the claim by the researcher that dynamic geometry software may not be the
best method for teaching certain topics in geometry.
Robinson (1994) concluded that strategies learned by students in a technological
environment (The Geometer’s Sketchpad) are transferable to paper-and-pencil situations.
While the present study did not directly investigate the idea of transfer, it seems as though
this is an underlying idea in the study. Students used dynamic geometry software on a
regular basis during the course. During the interview tasks, however, students were not
permitted to use the software. This was done in order to ensure an equal opportunity for
both groups of students. Students in the experimental group would have been at an
advantage during the interviews if they had access to Cabri. As the results of data analysis
favored students in the experimental group, it seems that students were indeed able to
transfer their conjecturing ability to a paper-and-pencil environment.
Some of the research studies in the literature review (Smyser, 1994; Bell, 1998;
Round, 1998) have called for a more intense exposure to the software used in the study.
By using Cabri to explore geometric ideas on a regular basis, this study has capitalized on
those recommendations.
212
The present study compared a software group to a non-software group and found
results that generally favored the software group. In the literature review in Chapter 2,
several studies were discussed that compared a software group to a non-software group in
some aspect of geometry learning (Yerushalmy, 1986; Yerushalmy, Chazan, & Gordon,
1987; Smyser, 1994; Dixon, 1995; Lester, 1996; Melczarek, 1996; Roberts & Stephens,
1999). All of these studies reported some positive results (some were nonsignifîcant, yet
positive) favoring the software group. Further research needs to be conducted which
considers questions posed by these researchers to more fully determine the impact of
geometry software on student learning in geometry.
Several studies have examined the generalization abilities of the subjects in the
study. Many of these studies involved finding the nth term of a sequence (Stacey, 1989;
Hitt, 1994; Orton & Orton, 1994; Taplin & Robertson, 1995; Dossey, Swafford, Langrall,
& Kersaint, 1997; Garcfa-Cruz & Martinôn, 1998), as did the present study. Some of
these studies involved adults rather than school-aged children. As reported by these studies
and confirmed by the present study, generalizing to the nth term of a sequence is a
challenging task for people of all ages. Further studies may wish to consider various
treatments that may potentially have a positive impact on subjects’ generalization abilities.
Subjects in many of these studies could extend a sequence, but had difficulty generalizing
to the nth term, a result found in the present study. Several of these studies asked subjects
to find terms such as the 20th, 50th, and l(X)th terms prior to asking subjects to find the nth
term. In the present study, students were asked to find the nth term after extending the
sequence by a few terms. Future work by this researcher may consider these issues as they
are of particular interest to the researcher, and generalization is an important aspect of
school mathematics.
213
RECOMMENDATIONS FOR RESEARCH
As an education research community, we are just beginning to see the power of
using dynamic geometry software in schools. While several studies have now been
completed that have had some level of dynamic software as a component, there is much
work to be done as we continue to learn about students’ learning using this type of
technology. It is difficult to recommend specifîc studies that should be done when the field
is so wide open with what can be done. Conjecturing and generalizing are important
processes in school mathematics, and especially important in geometry.
Further studies can be conducted to explore the role of dynamic geometry software
with respect to conjecturing and generalizing. The present study could be replicated in
other schools to add generalizability to the study. If the current study is replicated, this
researcher recommends that the teacher in the study and the researcher be two different
people. Circumstances in the present situation prevented this from occurring. If the
current study is replicated, an additional consideration might be to give the Entering
Geometry Student Test again at the end of the course to test for differences in the two
groups on that instrument as a posttest. Replications of the study may wish to consider
written data instead of interview data for the tasks merely as an alternative method of data
collection. Replications may wish to consider replacing Task 3 with another task, as it
proved quite difficult for the majority of the students in the study. The researcher
recommends utilization of a secondary method of data collection during class time with,
each group. A separate observer may have been able to share some insight on differences
between the groups that the researcher was unable to notice or document. Further studies
can also be conducted with regards to different notions of mathematical learning (problem
solving, for example) using dynamic geometry software. As stated earlier, the Held for
research is wide open, and very promising.
214
RECOMMENDATIONS FOR TEACHING
The results of the study indicate promise for the use of dynamic geometry software
in geometry classrooms. I strongly recommend using dynamic geometry software in the
teaching and learning of geometric ideas. As the current study focused on dynamic
software, I consciously did not use the traditional tools of compasses and straightedges for
constructions in geometry. All constructions were done using Cabri. While there is no
doubt in my mind as to the power of dynamic geometry software to positively impact
student learning, I feel that there is still a place for compass and straightedge constructions
in geometry instruction. I feel that using both types of construction tools can only add to
students’ learning experiences in geometry. In fact, experience with compass and
straightedge constructions may help students to be able to construct figures when using
dynamic geometry software programs.
Traditional tools may have an advantage in teaching certain topics. In the current
study, for example, dynamic geometry software was not used to teach students about the
triangle congruence patterns (Side-Side-Side, Side-Angle-Side, Angle-Side-Angle, and
Angle-Angle-Side). On other occasions prior to the study, I have used traditional tools to
help students learn about the triangle congmence patterns. An example of this type of
teaching might be to give students a paper with three segments so that they can construct a
triangle. Students can be asked to choose a different segment to start the construction than
the person next to them, for example. When the two students have finished their
constructions, their triangles can be compared to see that these three segments do indeed
form a unique triangle.
This study focused on whether dynamic geometry software can positively impact
students’ abilities to make generalizations in geometry. Another factor that must be
considered is the disposition of the geometry teacher toward generalizing. The disposition
of the teacher toward generalizing is a major factor in whether or not students increase their
215
level of generalization ability during a particular course. Teachers who routinely ask
students to make conjectures create a different classroom environment than teachers who do
not ask their students to make conjectures. Students in the experimental group were
routinely asked to make observations and conjectures. The fact that these students were
asked to make observations on a regular basis was certainly enabled by the use o f Cabri. It
is possible, of course, to ask students to make observations and conjectures without the use
of dynamic geometry software. Observations of the control group teacher showed that
students were asked to make conjectures in that classroom as well.
The idea of inductive versus deductive reasoning is a key Issue in terms of
generalization in mathematics. When students make conjectures from data they observe,
inductive reasoning is used. When students prove conjectures using reasoning involving
postulates, theorems, and definitions, deductive reasoning is used. There were many times
during explorations with the experimental group that I highlighted the difference between
the two reasoning processes. Students in the experimental group were often asked to prove
results discovered using Cabri. Both inductive and deductive reasoning are important in
the teaching and learning of geometry and neither should be ignored for the sake of the
other.
This researcher strongly recommends (as has the National Council of Teachers of
Mathematics and other professional organizations) the use of dynamic geometry software in
the teaching and learning of geometry. Dynamic geometry software brings a new
dimension to teaching geometry. The power of visualization is in each student’s hands
when they use dynamic geometry software to explore ideas in geometry. Students enjoy
working with dynamic geometry software, and as the present study indicates, it positively
impacts generalization ability, a key goal of school mathematics.
216
IMPLICATIONS FOR THEORY
This dissertation drew upon the Mathematics Learning Theory of Dienes, adapting
it to a secondary situation with dynamic geometry software as a vehicle for helping students
to develop generalization skills. Dienes’ theory is summarized into four principles: the
Dynamic Principle, the Constructivity Principle, the Mathematical Variability Principle, and
the Perceptual Variability (or Multiple Embodiment) Principle. This researcher believes that
the essence of Dienes’ Mathematics Learning Theory is captured in Cabri. In Chapter 2,
details are presented as to how Cabri embodies each of Dienes’ principles. In Chapter 3,
lesson vignettes from the experimental group further explicate how Dienes’ principles are
apparent when students use Cabri to explore concepts in geometry. Earlier in this chapter,
some important classroom experiences detailing how Cabri enabled students in the
experimental group to make generalizations are described. Results o f this study indicate a
favorable impact on generalization ability when students use dynamic geometry software
such as Cabri.
Dynamic geometry software has the potential to impact students’ abilities to
generalize on another level. As discussed in Chapter 2, software such as Cabri can be used
to investigate Dienes’ ideas of abstraction as class formation and generalization as class
extension. An example using Cabri that clarifies Dienes’ ideas on this topic is given in
Chapter 2. While investigating this particular aspect of Dienes’ theory was beyond the
scope of this dissertation study, it remains an ardent interest of the researcher, and could be
the subject of some future work of the researcher. It seems clear that dynamic geometry
software is a very promising tool for exploring Dienes’ ideas of class extension.
217
LIMITATIONS OF THE STUDY
A major limitation of the study is that the researcher was also a participant in the
study as the teacher of the experimental group. Although I (the researcher) feel that
appropriate controls were used to minimize bias, I also understand that there are individuals
who may feel the results are somewhat biased due to the researcher and the teacher of the
experimental group being the same person.
Another limitation is that the experimental and control groups were taught by
diMerent individuals. Every teacher has an individual style of teaching which cannot help
but impact the way students learn. It is possible that differences found in the study can
partially be attributed to differences in the teaching styles of the researcher and the control
group teacher. Lampert (1988) emphasized the importance of the role of the teacher in a
technological learning environment. As discussed in Chapter 2, Lampert feels that the
power of geometry software lies not in what the software itself can do, "but in what it
enables teachers to do if they are both able and disposed to use it in the way it was
intended” (1988, p. 2).
Even though the planned content studied by both groups was the same, it is
possible that very slight differences existed in the actual content covered. Again this is due
to the fact that the two groups had different teachers. Both teachers used the same textbook
and the same course of study. There are always slight differences, however, in what
instructors plan to teach and what actually is taught. Any potential differences in this area
were minimized by constant communication between the researcher and the control group
teacher. Along these same lines, even minor issues such as particular homework problems
assigned could bring about very slight differences in the content covered by both groups.
Questions brought up by students, such as the circumcenter situation discussed earlier in
this chapter, can cause differences in content coverage. Realistically, however, even if
218
both groups had been taught by the same individual, it would be virtually impossible to
guarantee that there were absolutely no differences in content and delivery of instruction.
The sample size limits the generalizability of results. While it would have been
advisable to include more students in the interviews, practical considerations prevented this
from happening. Considering the time available in which to conduct the interviews, it was
impossible to make the interview subgroups any larger than they were.
Another limitation is that it was difficult for the researcher to conduct the interviews
in a reasonable time frame after the course ended. Interviews were mostly conducted
during the researcher’s planning period and some interviews were not completed until
March. This may have had an impact on the participants’ recall of geometric knowledge, as
the geometry course ended in January.
CO N CLU SIO N S
This research study addressed one of the key issues of school mathematics today;
the ability of students to make generalizations. Several studies have utilized geometry
software programs to add to the research literature in geometry and technology. This study
has added one more piece to the puzzle of studying students’ learning of geometry in a
technological era. Using a theoretical framework developed by Dienes and adapted to the
use of dynamic geometry software, the generalization ability of high school geometry
students was the focus of the study. Even though students have been making
generalizations in geometry for many years without the use of dynamic geometry software,
this new tool provides a wealth of opportunities to take students further than they have
gone before. Recommendations of professional organizations such as NCTM have
stressed the use of dynamic geometry in the teaching and learning of geometry. The results
of this study indicate that the use of dynamic geometry software seems to enhance students’
219
abilities to make generalizations in geometry. The future of geometry learning has taken a
new turn with the introduction o f geometry software programs. In particular, dynamic
software programs such as Cabri seem to positively impact student learning in the area of
generalizations, a critical aspect of mathematics learning. For now, we must continue to
study teaching and learning geometry with exciting software such as Cabri. In the future,
we can only dream of how new technologies will impact geometry learning. Euclid would
be surprised to see the technological tools of today. We will likely be surprised to see the
technological advancements of tomorrow.
220
LIST OF REFERENCES
Arzarello, F., Micheletti, C., Olivero, P., Robutti, O., Paola, D., & Gallino, G. (1998). Dragging in Cabri and modalities of transition from conjectures to proof in geometry. Proceedings o f the Annual Conference o f the International Group fo r the Psychology o f Mathematics Education, South Africa, 22 (2), 32-39.
Aviv, C. A. (1979). Pattern gazing. Mathematics Teacher, 72, 39-43.
Battista, M. T., & Clements, D. H. (1995). Geometry and proof. Mathematics Teacher, 88, 48-54.
Bechem, W. J. (1979). Tower trainees. Mathematics Teacher, 72, 679-682, 700.
Bell, M. D. (1998). Impact of an inductive conjecturing approach in a dynamic geometry- enhanced environment (Doctoral dissertation, Georgia State University, 1998). Dissertation Abstracts International, 59, 1498A.
Brock, C , Cappo, M., Arvel, A., & Dromi, D. (1992). Geometry Inventor [Computer Software]. Pleasantville, NY: Wings for Learning and Logal Educational Software.
Brown, A. R. (1999). Geometry’s giant leap. Mathematics Teacher, 92 (9), 816-819.
CDASSG Project. (1980). Entering geometry student test. Chicago: University of Chicago. (ERIC Document Reproduction Service No. ED 220288)
Chazan, D. (1988). Similarity: Exploring the understanding o f a geometric concept. (Technical Report 88-15). Cambridge, MA: Educational Technology Center.
Chazan, D., & Houde, R. (1989). How ta use conjecturing and microcomputers to teach geometry. Reston, VA: National Council of Teachers of Mathematics.
Clements, D. H., & Battista, M. T. (1989). Learning o f geometric concepts in a Logo environment. Journal fo r Research in Mathematics Education, 20, 450-467.
Clements, D. H., & Battista, M. T. (1992). Geometry and spatial reasoning. In D. Grouws (Ed.), Handbook o f research on mathematics teaching and learning (pp. 420-464). New York: Macmillan.
Clements, D. H., & Battista, M. T. (1994). Computer environments for learning geometry. Journal o f Educational Computing Research, 10(2), 173-197.
221
Cochran, w. G. (1954). Some methods for strengthening the common tests. Biometrics, 10, 417-451. ^
Coleman, D. (1989). The silver ratio: A vehicle for generalization. Mathematics Teacher, 82 (I), 54-59.
College Entrance Examination Board. (1985). Academic preparation in mathematics: Teaching fo r transition from high school to college. New York: Author.
Committee for Economic Development. (1995). Connecting students to a changing world: A technology strategy fo r improving mathematics and science education. New York: Author.
Cooney, T. J., & Davis, E. J. (1976). Teaching concepts and generalizations in mathematics and science. School Science and Mathematics, 76(3), 215-220.
Creswell, J. W. (1994). Research design: Qualitative and quantitative approaches. Thousand Oaks, CA: Sage Publications, Inc.
Cuoco, A., Goldenberg, E., & Mark, J. (1994). Technology tips: Technology in perspective. Mathematics Teacher, 87 (6), 450-452.
Davydov, V. V. (1990). The problem of generalization in traditional psycholoev and didactics. In J. Kilpatrick (Ed.) and J. Teller (Trans ), Soviet studies in mathematics education: Types o f generalization in instruction (Vol. 2, pp. 9-36). Reston, VA: National Council of Teachers of Mathematics. (Original work published in 1972)
Dienes, Z. P. (1960). Building up mathematics. London: Hutchinson Educational Ltd.
Dienes, Z. P. (1961). On abstraction and generalization. Harvard Educational Review, 31 (3), 281-301.
Dixon, J. K. (1995). English language profîciency and spatial visualization in middle school students’ construction of the concepts of reflection and rotation using The Geometer’s Sketchpad (Doctoral dissertation. University of Florida, 1995). Dissertation Abstracts International, 56, 4307A.
Dorfler, W. (1991). Forms and means of generalization in mathematics. In A. J. Bishop,S. Mellin-Olson, & J. van Dormolen OBds.), Mathematical knowledge: Its growth through teaching (pp. 63-85). Dordrecht, The Netherlands: Kluwer Academic Publishers.
Dossey, J., Swafford, J., Langrall, C., & Kersaint, G. (1997, October). Generalization o f patterns and relationships by prospective elementary teachers. Poster session presented at the annual meeting of the North American Chapter of the International Group for the Psychology of Mathematics Education, Bloomington-Normal, IL, 19.
222
Dreyfiiss, T„ & Hadas, N. (1996). Proof as answer to the question why. Zentralblatt fu r Didaktik der Mathematik/tnrernafiomtReviews on Mathematical Education, 28 (1), 1-5.
Elchuck, L. M. (1992). The effects of software type, mathematics achievement, spatial visualization, locus-of-control, independent time of investigation, and van Hiele level on geometric conjecturing ability (Doctoral dissertation, Pennsylvania State University, 1992). Dissertation Abstracts International, 53, 1435A.
Elmore, W. J. (1992). Teaching geometiy to inner city secondary school students using Logo (Inner city students) (Doctoral dissertation, Columbia University Teachers College, 1992). Dissertation Abstracts International, 53, 3833A.
Euclid. (1956). The thirteen books of Euclid’s Elements, Volume I. Translated from the text o f Hieberg, with introduction and commentary by Sir Thomas L Heath. New York: Dover ̂ blications. Inc.
Feinstein, I. K. (1979). Dare we discover or the dangers of over-generalization. School Science and Mathematics, 79 (1), 22-33.
Ferguson, G. A. (1959). Statistical analysis in psychology and education. New York: McGraw-Hill.
Finzer, W. F. (1995). Network neighbors. Mathematics Teacher, 88 5-All.
Finzer, W. F., & Bennett, D. S. (1995). Technology tips: From drawing to construction with the Geometer’s Sketchpad. Mathematics Teacher, 88 (5), 428-431.
Foletta, G. M. (1994). Technology and guided inquiry: Understanding of students’ thinking while using a cognitive computer tool. The Geometer’s Sketchpad, in a geometry class (Doctoral dissertation. University of Iowa, 1994). Dissertation Abstracts International, 55, 2311 A.
Foletta, G. M., & Leep, D. B. (2000). Isoperimetric quadrilaterals: Mathematical reasoning with technology. Mathematics Teacher, 93 (2), 144-147.
Fraenkel, J. R., & Wallen, N. E. (1990). How to design and evaluate research in education. New York: McGraw-Hill.
Frerking, B. G. (1994). Conjecturing and proof-writing in dynamic geometry (Doctoral dissertation, Georgia State University, 1994). Dissertation Abstracts International, 55, 3772A.
Galindo, E. (1998). Assessing justification and proof in geometry classes taught using dynamic software. Mathematics Teacher, 91 (2), 76-82.
223
Galindo, E. (with Birgisson, G., Cenet, J-M., Krumpe, N., & Lutz, M.). (1997). The development of students’ notkms^of proof in^higthschootclasses using dynamic geometry software. Proceedings o f the Annual Meeting o f the North American Chapter o f the International Group fo r the Psychology o f Mathematics Education, Bloomington-Normal, IL, 19, 207-214.
Gannon, G., & Martelli, M. (1993). The farmer and the goose—a generalization. Mathematics Teacher, 86 (3), 202-203.
Garcfa-Cruz, J. A., & Martinôn, A. (1998). Levels of generalizations in linear patterns. Proceedings o f the Annual Conference o f the International Group fo r the Psychology o f Mathematics Education, South Africa, 22 (2), 329-336.
Gardiner, J., & Hudson, B. (1998). The evolution of pupils’ ideas of construction and proof using hand-held dynamic geometry technology. Proceedings o f the Annual Conference o f the International Group fo r the Psychology o f Mathematics Education, South Africa, 22 (2), 337-344.
Giamati, C. (1995). Conjectures in geometry and the Geometer’s Sketchpad. Mathematics Teacher, 88 (6), 456-458.
Gnepp, A., & Maher, C A. (1988). Teaching experiment examining the relationship between operational level and generalizing ability in the context of mathematical problem solving. Proceedings o f the Annual Meeting o f the North American Chapter o f the International Group fo r the Psychology o f Mathematics Education, DeKalb, IL, 10, 207-214.
Green, D. (1992). Cabri-Géomètre: Euclid’s revenge. Mathematics in School, 21 {2), 46-50.
Hanna, G. (1998). Proof as explanation in geometry. Focus on Learning Problems in Mathematics, 20 (2-3), 4-13.
Harris, D. (2000). Dynamic geometry as a cognitive tool: A cautionary tale. Micromath, 76(2), 18-23.
Hartman, J. (1976). Figurate numbers. Mathematics Teacher, 69, A1-50.
Hazzan, O., & Goldenberg, E. P. (1997). An expression of the idea of successive refinement in dynamic geometry environments. Proceedings o f the Annual Conference o f the International Group fo r the Psychology o f Mathematics Education, Finland, 21 (3), 49-56.
Higginson, W. (1981). Mathematizing “frogs”: Heuristics, proof, and generalization in the context of a recreational problem. Mathematics Teacher, 74 (7), 505-515.
Hirsch, C. R. (1980). Poinsot stars. Mathematics Teacher, 73 (1), 41-44.
224
Hitt, F. (1994). Visualization, anchorage, availability, and natural image: polygonal numbers in computer environments; Vbwmaf ofSfathematicalEducation in Science and Technology, 25 (3), 447-455.
Hopkins, K. D., Glass, G. V., & Hopkins, B. R. (1987). Basic statistics fo r the behavioral sciences. Needham Heights, MA: Allyn and Bacon.
Hoyles, C., & Noss, R. (1994). Technology tips: Dynamic geometry environments: What’s the Point? Mathematics Teacher, 87 (9), 716-717.
International Association for the Evaluation of Education. (1995). Third international mathematics and science study. The Hague, The Netherlands: Author.
Iwasaki, H., & Yamaguchi, T. (1997). The cognitive and symbolic analysis of the generalization process: The comparison of sdgebraic signs with geometric figures. Proceedings o f the Annual Conference o f the International Group fo r the Psychology o f Mathematics Education, Finland, 21 (3), 105-112.
Izen, S. (1998). Proof in modem geometry. Mathematics Teacher, 91 (8), 718-720.
Jackiw, N. (1991). The Geometer’s Sketchpad [Computer Software]. Berkeley, CA: Key Curriculum Press.
Johnston, W. I. (1992). Cover design. Mathematics Teacher 85 (2), Cover.
Jones, K. (1997). Children learning to specify geometrical relationships using a dynamic geometry package. Proceedings o f the Annual Conference o f the International Group fo r the Psychology o f Mathematics Education, Finland, 21 (3), 121-128.
Jones, K. (1998). The mediation of learning within a dynamic geometry environment. Proceedings o f the Annual Conference o f the International Group fo r the Psychology o f Mathematics Education, South Africa, 22 (3), 96-103.
Kabanova-Meller, E. N. (1970). The role of the diagram in the application of geometric theorems. In J. Kilpatrick & I. Wirszup (Eds.), Soviet studies in the psychology o f learning and teaching mathematics (Vol. 4) (pp. 7-49). Chicago: University of Chicago.
Kaput, J. J. (1992). Technology and mathematics education. In D. Grouws (Ed.), Handbook of research on mathematics teaching and learning (pp. 515-556). New York: Macmillan.
Keyton, M. (1996). 92 geometric explorations on the Tl-92. Austin, TX: Texas Instruments.
Klein, R., & Hamilton, I. (1997). Using technology to introduce radian measure. Mathematics Teacher, 90 (2), 168-172.
225
Laborde, c. (1993). The computer as part of the learning environment: The case of“ geometiy. In C. Keitefan(fKrRiithveir(Bds:), fSîsmmg^om computers:
Mathematics education and technology (pp. 48-67). Berlin, Germany: Springer- Verlag.
Laborde, J-M., & Bellemain, F. (1988-97). Cabri Geometry II [Computer Software]. Dallas, TX: Texas Instruments.
Lampert, M. (1988). Teachers’ thinking about students’ thinking about geometry:The effects o f new teaching tools. (Technical Report 88-1). Cambridge, MA: Educational Technology Center.
Larson, R. E., Boswell, L., & Stiff, L. (1995). Geometry: An integrated approach. Lexington, MA: D. C. Heath and Company.
Lester, M. L. (1996). The effects of the Geometer’s Sketchpad software on achievement of geometric knowledge of high school geometry students (Doctoral dissertation. University of San Francisco, 1996). Dissertation Abstracts International, 57,2343A.
Linchevski, L., Olivier, A., Sasman, M., & Liebenberg, R. (1998). Moments of conflict and moments of conviction in generalizing. Proceedings o f the Annual Conference o f the International Group for the Psychology o f Mathematics Education, South Africa, 22 (3). 215-222.
Manouchehri, A., Enderson, M. C., & Pugnucco, L. A. (1998). Exploring geometry with technology. Mathematics Teaching in the Middle School, 3 (6), 436-442.
Mariotti, M. A., & Bartolini Bussi, M. G. (1998). From drawing to construction: Teachers’ mediation within the Cabri environment. Proceedings o f the Annual Conference o f the International Group fo r the Psychology o f Mathematics Education, South Africa, 22 (3), 247-254.
Mathematical Sciences Educational Board. (1990). Reshaping school mathematics: A philosophy and framework fo r change. Washington, DC: National Academy Press.
McGehee, J. J. (1998). Interactive technology and classic geometry problems. Mathematics Teacher, 91 (3>, 204-208.
Melczarek, R. J. (1996). The effects of problem-solving activities using dynamic geometry computer software on readiness for self-directed learning (Geometer’s Sketchpad) (Doctoral dissertation. University of Florida, 1996). Dissertation Abstracts International, 58, 2611A.
Mitchelmore, M. (1999). How to teach generalisations in mathematics? Proceedings o f the Annual Conference o f the Mathematics Education Research Group o f Australasia Incorporated, Australia, 22, 373-379.
2 2 6
National Council of Teachers of Mathematics. (1989). Curriculum and evaluation sfandards fo r schootmafhenaftest Reston, VA: Author.
National Council of Teachers of Mathematics. (1991a). Geometry from multiple perspectives. Reston, VA: Author.
National Council of Teachers of Mathematics. (1991b). Professional standards fo r teaching mathematics. Reston, VA: Author.
National Council of Teachers of Mathematics. (1995). Assessment standards fo r school mathematics. Reston, VA: Author.
National Council of Teachers of Mathematics. (2000). Principles and standards for school mathematics. Reston, VA: Author.
National Research Council. (1989). Everybody counts: A report to the nation on the future o f mathematics education. Washington, DC: National Academy Press.
Olmstead, E. (1998). Exploring the locus definitions of the conic sections. Mathematics Teacher, 91 (5), 428-434.
Olson, M., & White, G. (1989). Activities: Interesting area ratios within a triangle. Mathematics Teacher, 82 (8), 630-636.
Orton, A., & Orton, J. (1994). Students’ perception and use of pattern and generalization. Proceedings o f the Annual Conference o f the International Group fo r the Psychology o f Mathematics Education, Portugal, 18, 407-414.
Oullette, H. (1975). Number triangles—A discovery. Mathematics Teacher, 68, 61 \- 674.
Oullette, H. (1978). Discovery with number triangles. Mathematics Teacher, 71, 61%- 682.
Oullette, H., & Bennett, G. (1979). The discovery of a generalization: An example in problem solving. Two Year College Mathematics Journal, 10 (2), 1(X)-106.
Perham, A. E., Perham, B. H., & Perham, F. L. (1997). Creating a learning environment for geometric reasoning. Mathematics Teacher, 90 (7), 521-526.
Peterson, B. E. (1997). A new angle on stars. Mathematics Teacher, 90 (8), 634-639.
Pokay, P. A., & Tayeh, C. (1997). Integrating technology in a geometry classroom:Issues for teaching. Computers in the Schools, 13 (1-2), 117-123.
Ranucci, E. (1974). Fruitful mathematics. Mathematics Teacher, 67 (I), 5-\4.
227
Roberts, D. L., & Stephens, L. J. (1999). The effect of the frequency of usage of computer software nr high schoof geometry Tournât o f Compufers in Mathematics and Science Teaching 18 (1), 23-30.
Robinson, S. O. (1994). The effect of the availability of “The Geometer’s Sketchpad” on locus-motion problem-solving performance and strategies (Doctoral dissertation. University of Florida, 1994). Dissertation Abstracts International, 56, 4309A.
Roscoe, J. T., & Briars, J. A. (1971). An investigation of the restraints with respect to sample size commonly imposed on the use of the chi-square statistic. Journal o f the American Statistical Association, 66, 755-759.
Round, E. L. (1998). A study of the potential benefits of using interactive software in high school geometry solely for whole class demonstration and discussion (Doctoral dissertation. The Ohio State University, 1998). Dissertation Abstracts International, 59, 0115A.
Scally, S. P. (1990). The impact of experience in a Logo learning environment on adolescents’ understanding of angle: A van Hiele-based clinical assessment (Doctoral dissertation, Emory University, 1990). Dissertation Abstracts International, 52, 0835A.
Scher, D. (1996). Technology tips: Theorems in Motion: Using dynamic geometry to gain fresh insights. Mathematics Teacher, 89 (4), 330-332.
Schoaff, E. K. (1993). How to develop a mathematics lesson using technology. Journal o f Computers in Mathematics and Science Teaching, 12 (1), 19-27.
Schumann, H. (1991). Interactive theorems fînding through continuous variation of geometric confîgurations. Journal o f Computers in Mathematics and Science Teaching, 10 (3), 81-105.
Schumann, H. (1992). Didactic aspects of geometry learning in secondary education using the computer as an interactive tool. Journal o f Computers in Mathematics and Science Teaching, I I (2), 217-242.
Schumann, H., & Green, D. (2000). New protocols for solving geometric calculation problems incorporating dynamic geometry and computer algebra software. International Journal o f Mathematical Education in Science and Technology, 31 (3), 319-339.
Schwartz, J. L. (1993). A personal view of the Supposer: Reflections on particularities and generalities in education reform. In J. L. Schwartz, M. Yerushalmy, & B. Wilson (Eds.), The Geometric Supposer: What is it a case of? (pp. 3-15). Hillsdale, NJ: Lawrence Earlbaum Associates.
Schwartz, J. L., & Yerushalmy, M. (1985-88). The Geometric Supposer [Computer Software]. Pleasantville, NY: Sunburst.
228
Schwartz, J. L., Yerushalmy, M., & Wilson, B. (1993). The Geometric Supposer: WKafis It a case of? KITsdale, NT: Lawrence EarlBaum Associates.
ScottForesman. (1992). GeoExplorer: A Geometry Drawing Tool [Computer Software]. Glenview, IL: Author.
Serra, M. (1989/1993). Discovering geometry: An inductive approach. Berkeley, CA: Key Curriculum Press.
Shepard, J. W., & Wiske, M. S. (1989). Extending technological innovations in schools: Three case studies and analysis. (Technical Report 88-29). Cambridge, MA: Educational Technology Center.
Shilgalis, T. W. (1998). Finding buried treasures— An application of the Geometer’s Sketchpad. Mathematics Teacher, 91 (2), 162-165.
Siegel, S. (1956). Nonparametric statistics fo r the behavioral sciences. New York: McGraw-Hill.
Silver, J. A. (1998). Can computers be used to teach proofs? Mathematics Teacher, 91(8), 660-663.
Smith, J. K. (1972). The mh polygonal number. Mathematics Teacher, 65 (3), 221- 225.
Smyser, E. M. (1994). The effects of “The Geometric Supposers” : Spatial ability, van Hiele levels, and achievement (Doctoral dissertation, TTie Ohio State UniversiQ', 1994). Dissertation Abstracts International, 55, 1498A.
Stacey, K. (1989). Finding and using patterns in linear generalizing problems. Educational Studies in Mathematics, 20, 147-164.
Staib, J., & Staib, L. (1978). The Pascal pyramid. Mathematics Teacher, 71 (6), 505- 510.
Stones, I. D. (1983). The harmonic triangle: Opportunities for pattern identification and generalization. Mathematics Teacher, 76 (5), 350-354.
Suydam, M. N. (1985). The shape of instruction in geometry: Some highlights from research. Mathematics Teacher, 78, 481-486.
Szetela, W. (1999). Triangular numbers in problem solving. Mathematics Teacher, 92(9), 820-824.
Taback, S. F. (1996). Developing mathematical power. New York State Mathematics Teachers’ Journal, 46 (2), 85-89.
229
Taplin, M. L., & Robertson, M. E. (1995). Spatial patterning: A pilot study of pattern fofmatfon antf generalization Ffdceectmgs ofthe Anniiat Conference o f the International Group fo r the Psychology o f Mathematics Education, Brazil, 19 (3), 42-49.
Taylor, L. (1992). Teaching mathematics with technology. The Arithmetic Teacher, 40 (3), 87-91.
Thompson, J. E. (1934). Geometry fo r the practical man. New York: D. Van Nostrand Company, Inc.
Tikoo, M. (1998). Integrating geometry in a meaningful way (a point of view).International Journal o f Mathematical Education in Science and Technology, 29 (5), 663-675.
Truran, T. P. (1972). A generalization of Pascal’s triangle. Mathematics Teaching, 60, 16-18.
Tumau, S. (1976). On a class-room incident. Educational Studies in Mathematics, 7 (1-2), 147-155.
United States Department of Education. (1997). The NAEP Guide, NCES 97-990. Washington, D. C : Author.
Usnick, V. E., Lamphere, P. M., & Bright, G. W. (1992). A generalized area formula. Mathematics Teacher, 85 (9), 752-754.
Vincent, J. (1998). Progressing through the van Hiele levels with Cabri-Géomètre. Proceedings o f the Annual Conference o f the Mathematics Education Research Group o f Australasia Incorporated, Australia, 21, 645-654.
Vincent, J., & McCrae, B. (1999). Cabri Geometry: A catalyst for growth in geometric understanding. Proceedings o f the Annual Conference o f the Mathematics Education Research Group o f Australasia Incorporated, Australia, 22, 507-514.
Vinner, S., & Hershkowitz, R. (1980). Concept images and common cognitive paths in the development of some simple geometrical concepts. Proceedings o f the Annual Cotrference o f the International Group fo r the Psychology o f Mathematics Education, USA, 4, 177-184.
Vonder Embse, C., & Yoder, V. W. (1998). Multiple representations and connections using technology. Mathematics Teacher, 91 (1), 62-67.
Watanabe, T., Hanson, R., & Nowosielski, F. D. (1996). Morgan’s theorem. Mathematics Teacher, 89 (5), 420-423.
Wiske, M. S., & Houde, R. (1988). From recitation to construction: Teachers change with new technologies, (Technical Report 88-28). Cambridge, MA: Educational Technology Center.
230
Yerushalmy, M. (1986). Induction and generalization: An experiment in teaching and leamin^ high school geometFy-(Doetoral-dissertation; Harvard University, 1986).
Dissertation Abstracts International, 47, 1641 A.
Yerushalmy, M. (1993). Generalization in geometry. In Schwartz, J. L., Yerushalmy, M. & Wilson, B. (Eds.), The Geometric Supposer: What is it a case of? (pp. 57- 84). Hillsdale, NJ: Lawrence Earlbaum Associates.
Yerushalmy, M., & Chazan, D. (1993). Overcoming visual obstacles with the aid of the Supposer. In Schwartz, J. L., Yerushalmy, M. & Wilson, B. (Eds.), The Geometric Supposer: What is it a case of? (pp. 25-56). Hillsdale, NJ: Lawrence Earlbaum Associates.
Yerushalmy, M., Chazan, D., & Gordon, M. (1987). Guided inquiry and technology: A year long study of children and teachers using the Geometric Supposer. (Technics Report 88-6). Cambridge, MA: Educational Technology Center.
Yerushalmy, M., Chazan, D., & Gordon, M. (1988). Posing problems: One aspect of bringing inquiry into the classroom. (Technical Report 88-21). Cambridge, MA: Educational Technology Center.
Yousif, A. E. (1997). The effect of the Geometer’s Sketchpad on the attitude toward geometry of high school students (Doctoral dissertation, Ohio University, 1997). Dissertation Abstracts International, 58, 1631 A.
Yusuf, M. M. (1990). Effects of Logo-based instruction on the learning of selected geometry concepts at the secondary school level (Doctoral dissertation. University of Cincinnati, 1990). Dissertation Abstracts International, 51, 3660A.
Zbiek, R. M. (1996). The pentagon problem: Geometric reasoning with technology. Mathematics Teacher, 89 (2), 86-90.
231
APPENDIX A
ENTERING GEOMETRY STUDENT TEST
232
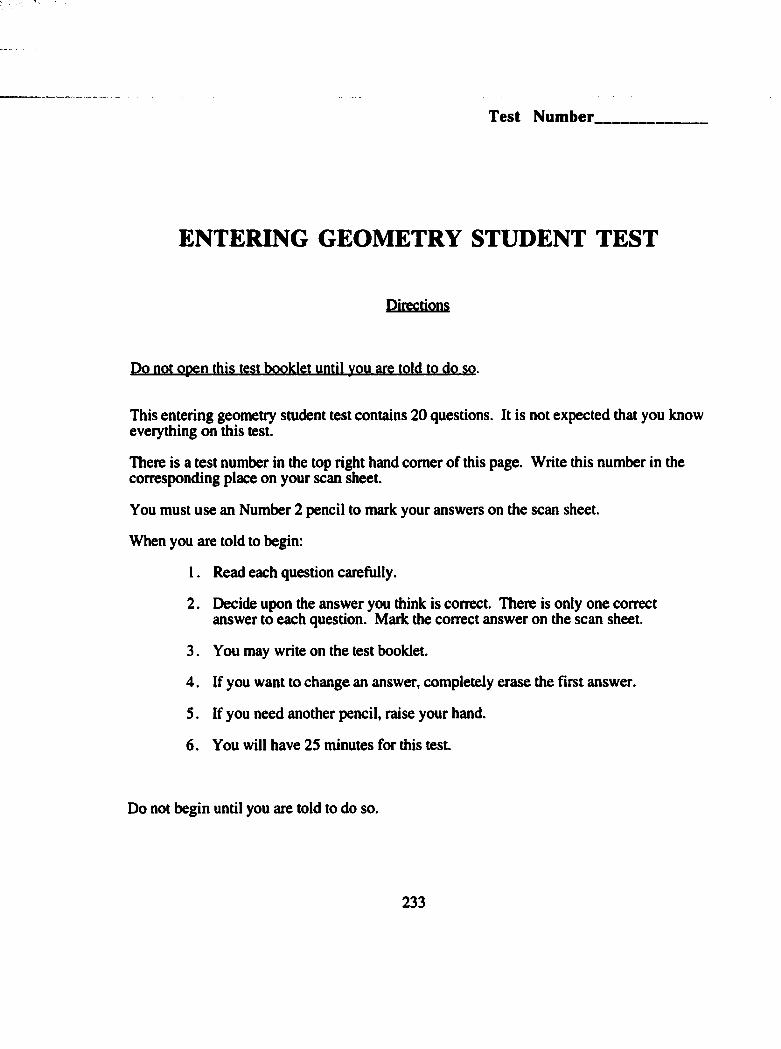
Test Number
ENTERING GEOMETRY STUDENT TEST
Directions
Do not open this test booklet until you are told to do so.
This entering geometry student test contains 20 questions. It is not expected that you know everything on this test.
There is a test number in the top right hand comer of this page. Write this number in the corresponding place on your scan sheet.
You must use an Number 2 pencil to mark your answers on the scan sheet.
When you are told to begin:
1. Read each question carefully.
2. Decide upon the answer you think is correct. There is only one correct answer to each question. Mark the correct answer on the scan sheet.
3. You may write on the test booklet.
4. If you want to change an answer, completely erase the first answer.
5 . If you need another pencil, raise your hand.
6. You will have 25 minutes for this test.
Do not begin until you are told to do so.
233

ENTERING GEOMETRY STUDENT TEST1. Perpendicular lines
A. intersect to form four right anglesB . intersect to form two acute and two obtuse anglesC . do not intersect at allD. intersect to form four acute anglesE . none of the above
2. The area of a rectangle with length 3 inches and width 12 inches is
A. 18 square inchesB. 72 square inchesC. 36 square inchesD. IS square inchesE. 30 square inches
3. If two fîgures are similar but not congruent, then they
A. have congruent bases and congruent altitudesB . have the same heightC . both have horizontal basesD. have a different shape but the same sizeE . have a different size but the same shape
4. The measure of an obtuse angle is
A. 90PB . between 45® and 90°C. less than 90°D. between 90° and 180°E. more than 180°
234
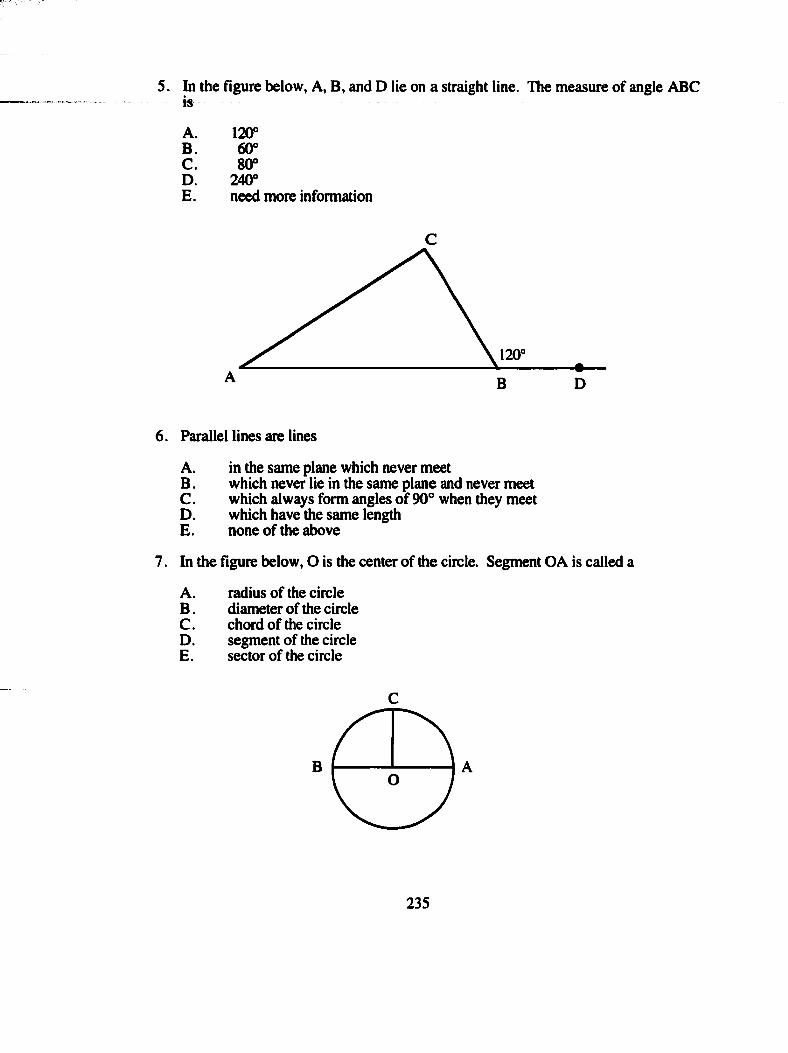
In the figure below, A, B, and D lie on a straight line. The measure of angle ABCis
A. 120PB. 60°C. 80°D. 240°E. need more information
120'
A
6. Parallel lines are lines
A. in the same plane which never meetB . which never lie in the same plane and never meetC . which always form angles of 90° when they meetD. which have the same lengthE. none of the above
7. In the figure below, O is the center of the circle. Segment OA is called a
A. radius of the circleB . diameter of the circleC . chord of the circleD. segment of the circleE . sector of the circle
C
B
235
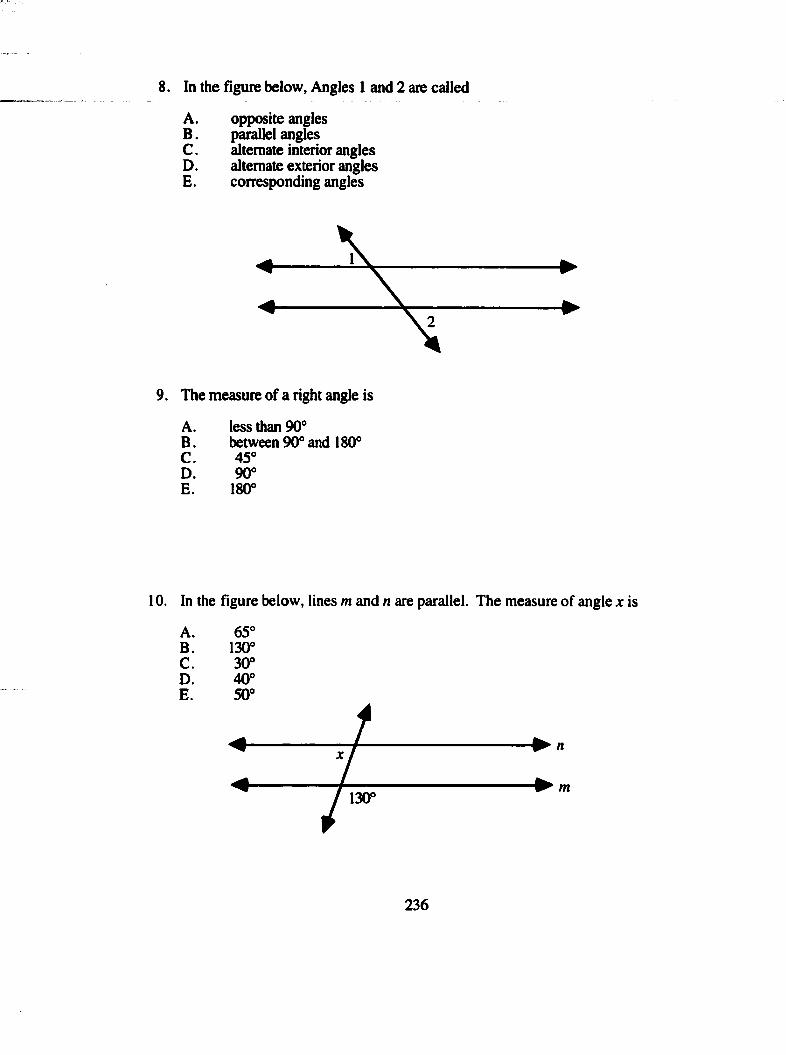
8. In the figure below, Angles 1 and 2 are called
A. opposite anglesB. parallel anglesC . alternate interior anglesD. alternate exterior anglesE. corresponding angles
9. The measure of a right angle is
A. less than 90°B . between 90° and 180°C. 45°D. 90°E. 180°
10. In the figure below, lines m and n are parallel. The measure of angle x is
A. 65°B. 130°C. 30°D. 40°E. 50°
236
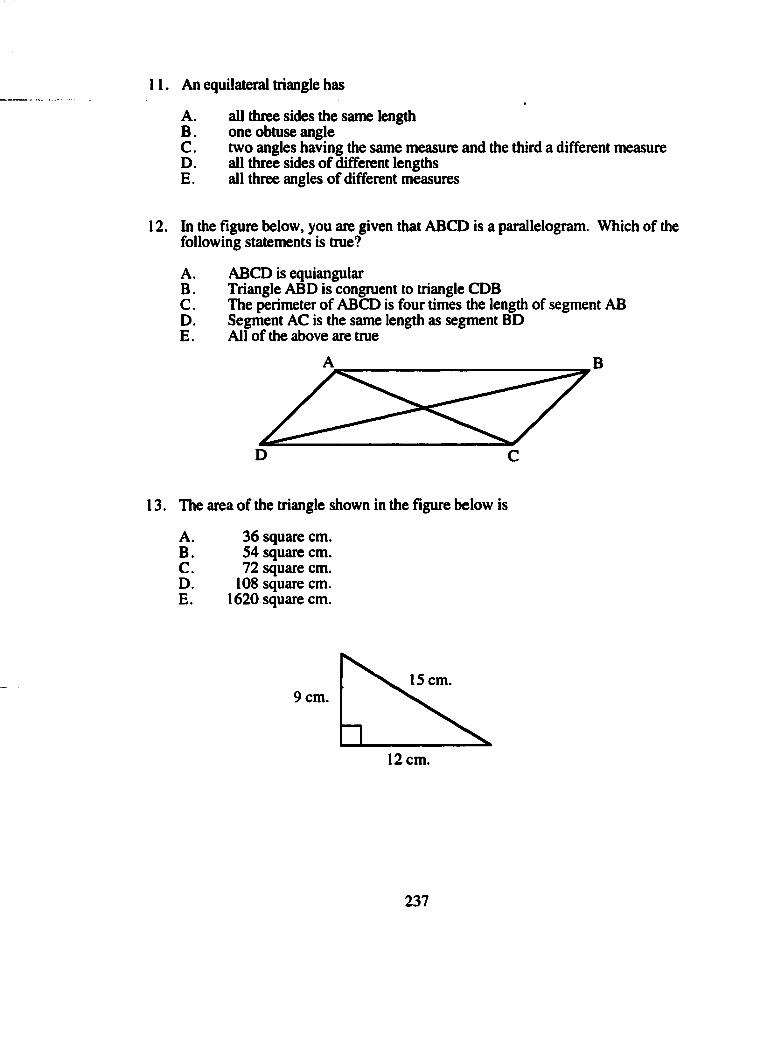
11. An equilateral triangle has
A. all three sides the same lengthB . one obtuse angleC . two angles having the same measure and the third a different measureD. all three sides of different lengthsE. all three angles of different measures
12. In the figure below, you are given that ABCD is a parallelogram. Which of the following statements is true?
A. ABCD is equiangularB . Triangle ABD is congruent to triangle CDBC . The perimeter of ABCD is four times the length of segment ABD. Segment AC is the same length as segment BDE . All of the above are true
B
D C
13. The area of the triangle shown in the figure below is
A. 36 square cm.B. 54 square cm.C. 72 square cm.D. 108 square cm.E. 1620 square cm.
15 cm.9 cm.
12 cm.
237
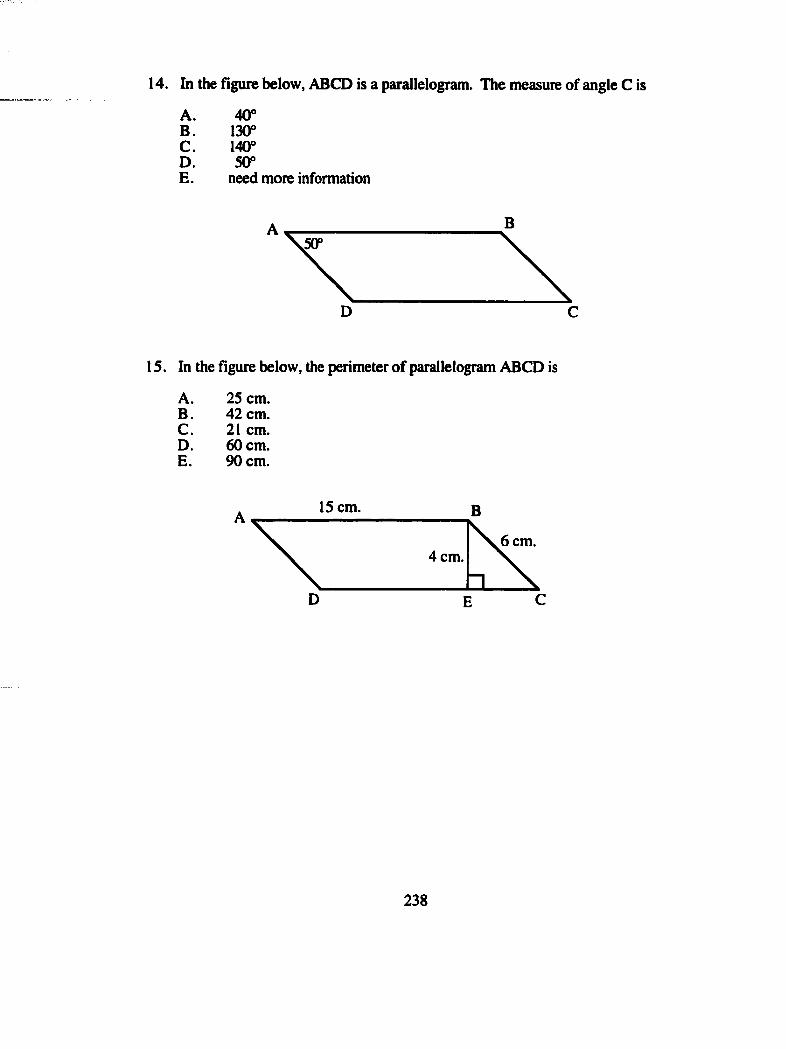
14. In the fîgure below, ABCD is a parallelogram. The measure of angle C is
A.B.
40“130“
C. 140“D. 50“E . need more information
A
D C
15. In the fîgure below, the perimeter of parallelogram ABCD is
A. 25 cm.B. 42 cm.C. 21 cm.D. 60 cm.E. 90 cm.
15 cm.A
6 cm.4 cm.
D CE
238
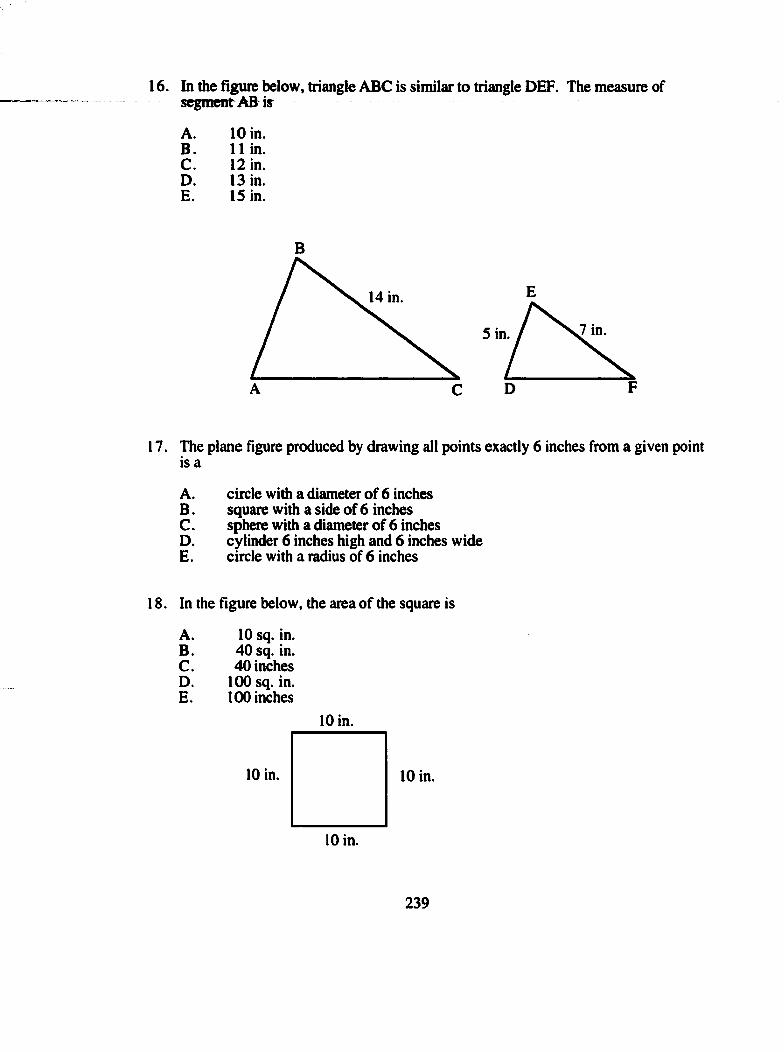
16. In the fîgure below, triangle ABC is similar to triangle DBF. The measure of segment AB is
A. 10 in.B. 11 in.C. 12 in.D. 13 in.E. 15 in.
B
14 in.
A C
7 in.5 in.
FD
17. The plane figure produced by drawing all points exactly 6 inches from a given point is a
A. circle with a diameter of 6 inchesB . square with a side of 6 inchesC . sphere with a diameter of 6 inchesD. cylinder 6 inches high and 6 inches wideE. circle with a radius of 6 inches
18. In the figure below, the area of the square is
A.B.C.D.E.
10 sq.in. 40 sq. in. 40 inches
100 sq. in. 100 inches
10 in.
10 in.
10 in.
10 in.
239
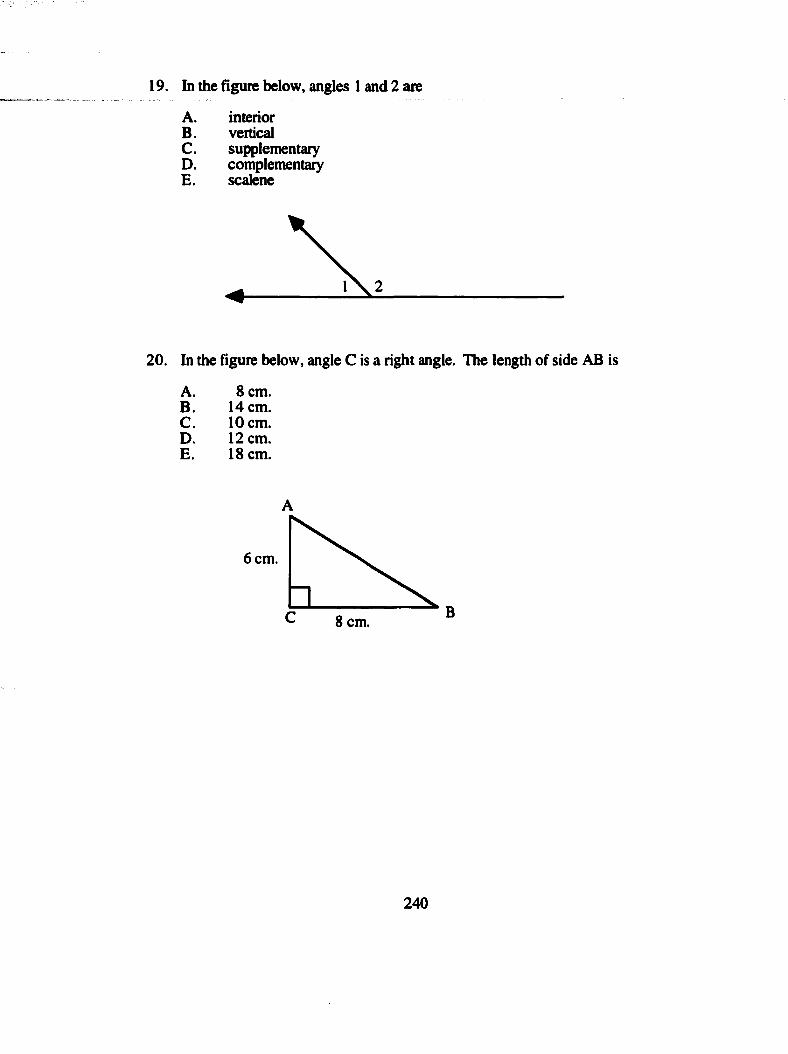
19. In the fîgure below, angles 1 and 2 are
A. interiorB. verticalC. supplementaryD. complementaryE. scalene
20. In the figure below, angle C is a right angle. The length of side AB is
A.B.C. D E.
8 cm. 14 cm. 10 cm. 12 cm. 18 cm.
6 cm.
BC 8 cm.
240
APPENDIX B
GENERALIZATION TESTS
241

GEOMETRY CHALLENGE-Form A
NAME____________________________
1. You are given the following information regarding a sequence of numbers;
TERM IN SEQUENCE (T) 1 2 3 4 5
VALUE OF TERM (V) 8 11 14 17 20
Give the value of the 6th, 7th, and nth terms in the sequence by filling in the table below.
T 1 2 3 4 5 6 7 n
V 8 11 14 17 20 _____ _____ _____
SPACE FOR FIGURING
242

2. If several people are in a room, how many handshakes are possible if each person shaker handr with everyonrelse^once?^
Collect data in the following table to help you analyze the situation.
PEOPLE 1 2 3 4 5
HANDSHAKES 0 1 ______ ______ ______
Generalize the situation to predict how many handshakes there will be if there are n people in the room.
ANSWER:
SPACE FOR FIGURING
243

3. Find a formula for the sum of the fîrst n odd positive integers.
Collect data in the following table to help you analyze the situation.
NUMBER OFODD INTEGERS 1 2 3 4 5
SUM 1 4 9 _______ ____
HOWTO FIGURE 1 1 + 3 1 + 3 + 5
Generalize the situation to fînd a formula for the sum of the fîrst n odd positive integers.
ANSWER:
SPACE FOR FIGURING
244
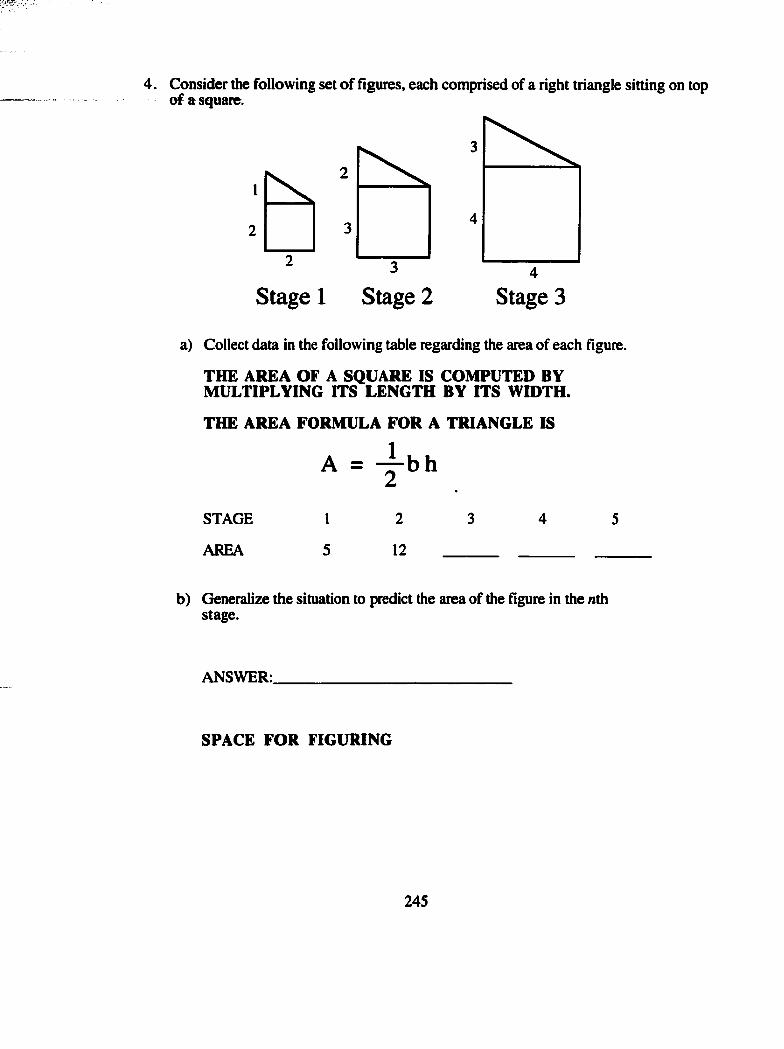
4. Consider the following set of fîgures, each comprised of a right triangle sitting on top ofasquare.
2
3
3
3
4
4
Stage 1 Stage 2 Stage 3
a) Collect data in the following table regarding the area of each figure.
THE AREA OF A SQUARE IS COMPUTED BY M ULTIPLYING ITS LENGTH BY ITS WIDTH.
THE AREA FORMULA FO R A TRIANGLE IS
A = -^ b h
STAGE
AREA
1
5
2
12
b) Generalize the situation to predict the area of the fîgure in the nth stage.
ANSWER:
SPACE FO R FIGURING
245
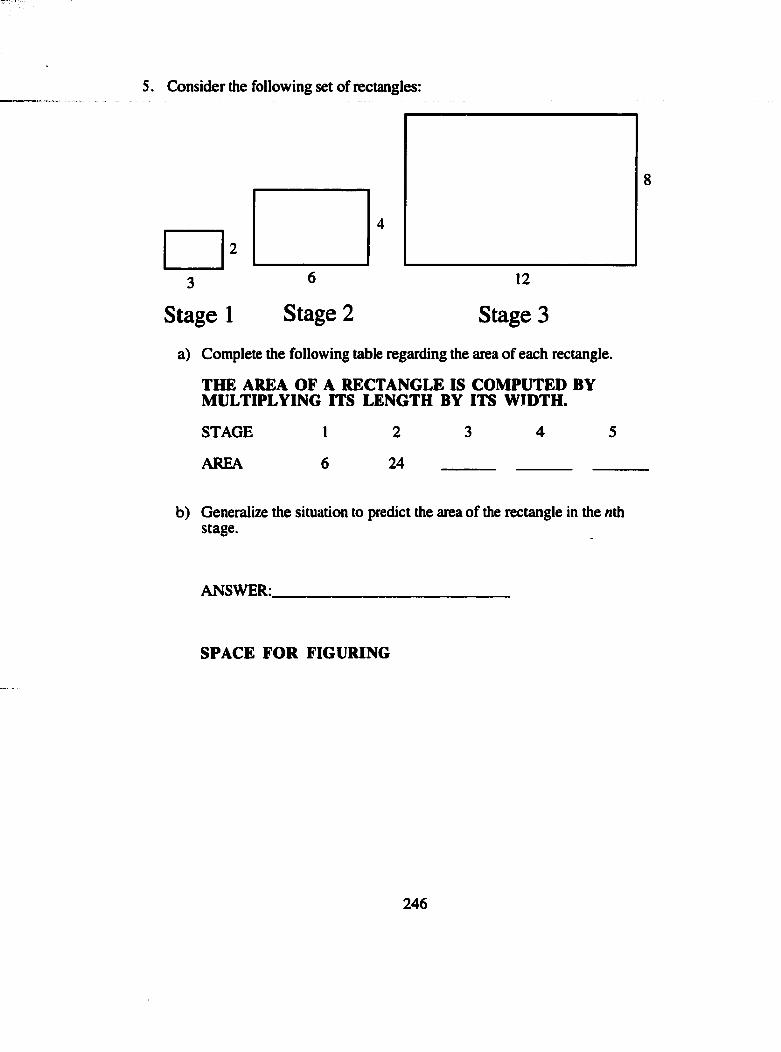
s . Consider the following set of rectangles:
Stage 1 Stage 2 Stage 3a) Complete the following table regarding the area of each rectangle.
THE AREA OF A RECTANGLE IS COMPUTED BY MULTIPLYING ITS LENGTH BY ITS WIDTH.
STAGE
AREA
1
6
2
24
b) Generalize the situation to predict the area of the rectangle in the nth stage.
ANSWER:.
SPACE FOR FIGURING
246
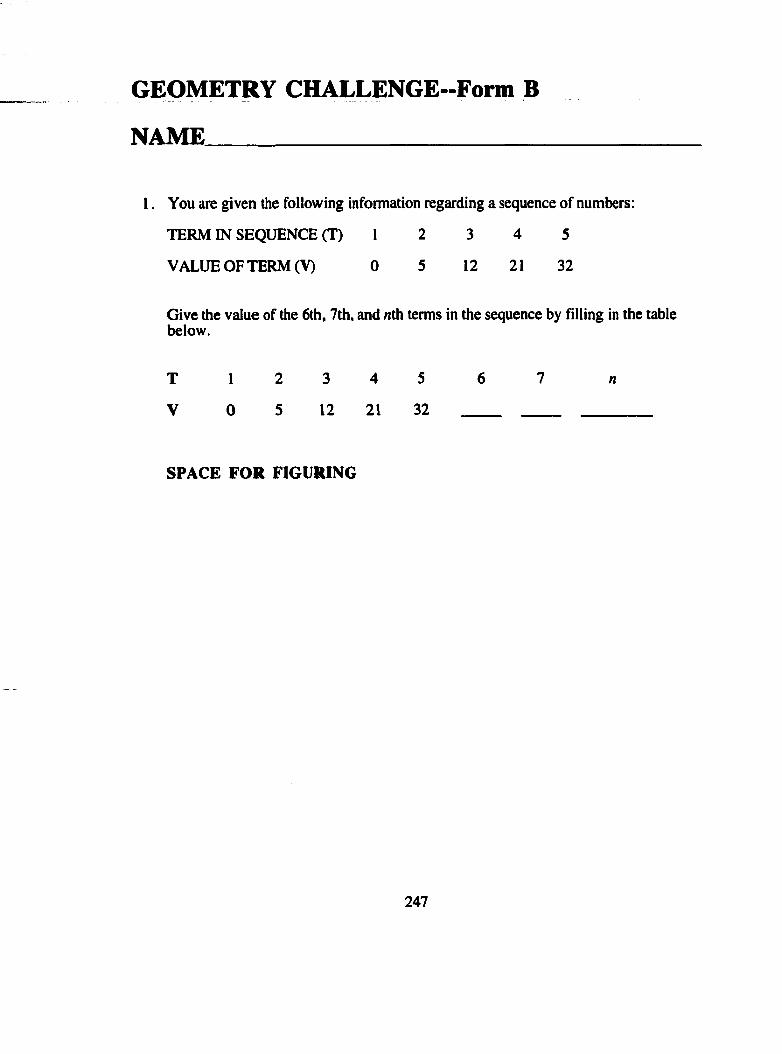
GEOMETRY CHALLENGE-Fonn B
NAME____________________________
1, You are given the following information regarding a sequence of numbers;
TERM IN SEQUENCE (T) 1 2 3 4 5
VALUE OF TERM (V) 0 5 12 21 32
Give the value of the 6th, 7th, and nth terms in the sequence by filling in the table below.
T 1 2 3 4 5 6 7 n
V 0 5 12 21 32 _____ _____ _____
SPACE FOR FIGURING
247
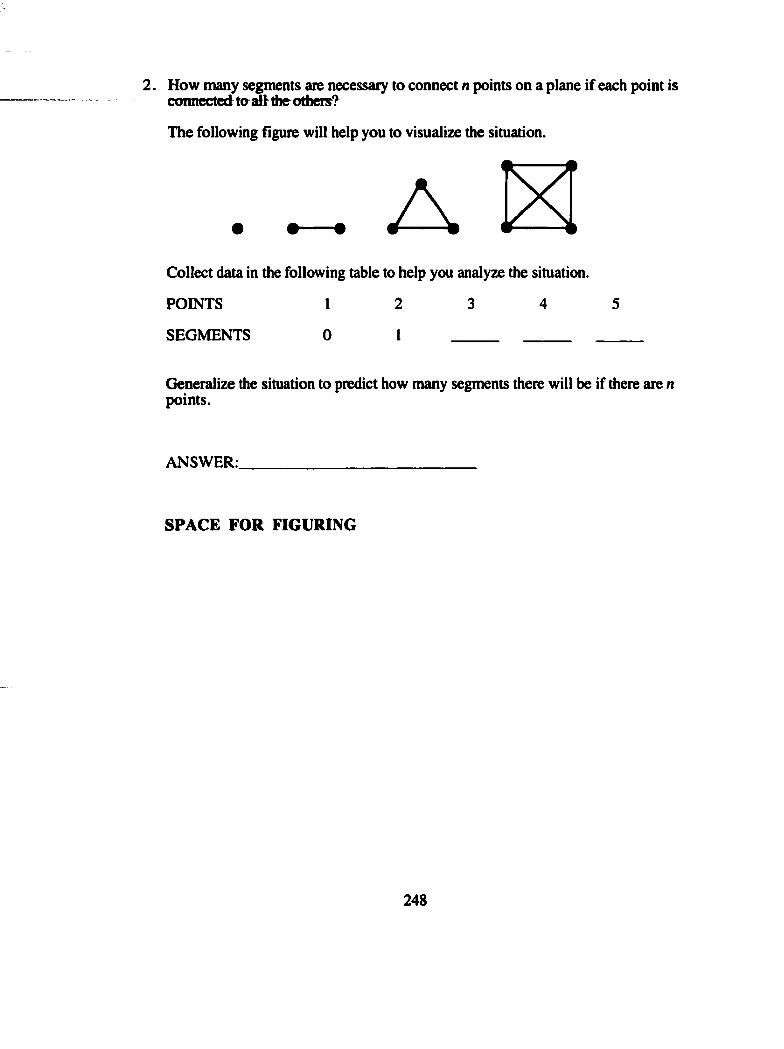
2. How many segments ate necessary to connect n points on a plane if each point is connected tatrffthfr others?
The following figure will help you to visualize the situation.
Collect data in the following table to help you analyze the situation.
POINTS 1 2 3 4 5
SEGMENTS 0 1 ______ ______ ___
Generalize the situation to predict how many segments there will be if there are n points.
ANSWER:
SPACE FOR FIGURING
248
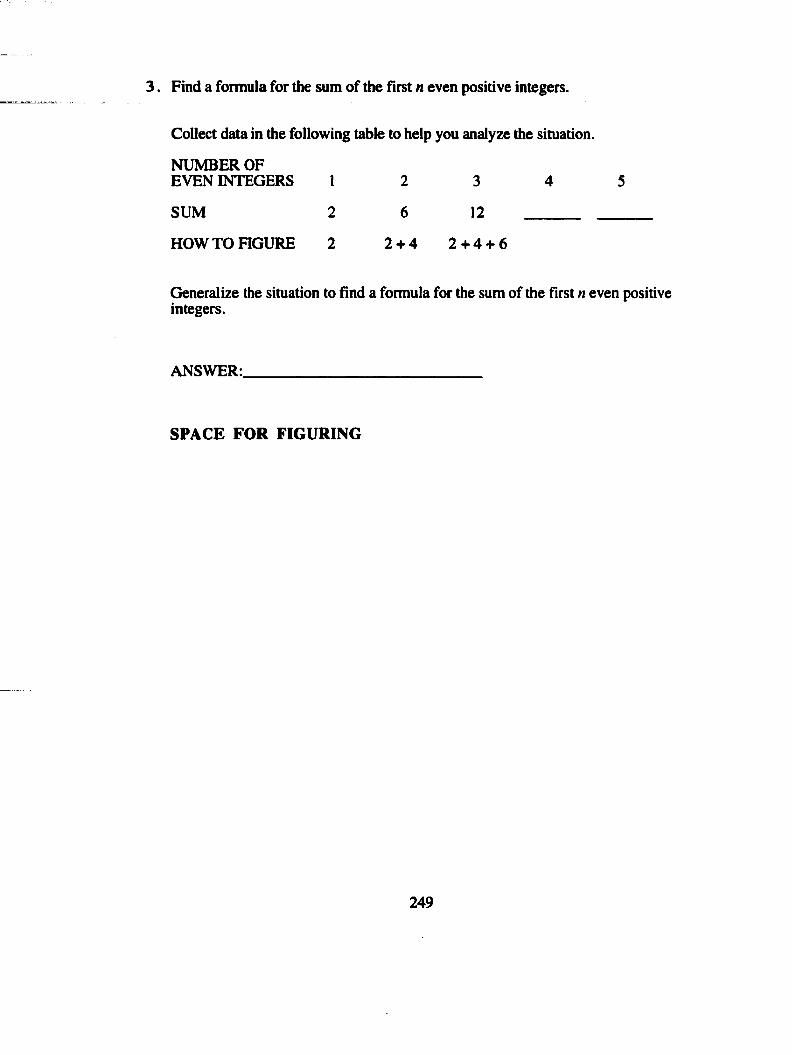
3. Find a formula for the sum of the fîrst n even positive integers.
Collect data in the following table to help you analyze the situation.
NUMBER OFEVEN INTEGERS 1 2 3 4 5
SUM 2 6 12
HOW TOHGURE 2 2 + 4 2 + 4 + 6
Generalize the situation to find a formula for the sum of the first n even positive integers.
ANSWER:
SPACE FOR FIGURING
249
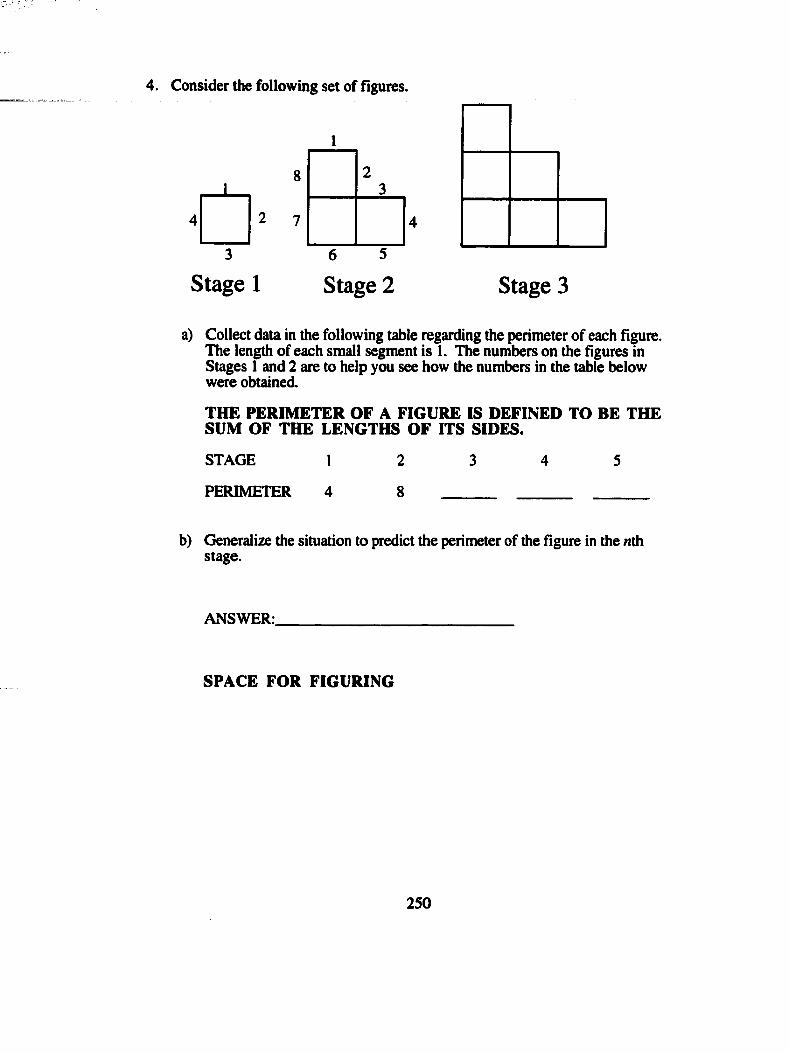
4. Consider the following set of fîgures.
Stage 16 5
Stage 2 Stage 3
a) Collect data in the following table regarding the perimeter of each fi^ re . The length of each small segment is 1. The numbers on the figures in Stages 1 and 2 are to help you see how the numbers in the table below were obtained.
THE PERIMETER OF A FIGURE IS DEFINED TO BE THE SUM OF THE LENGTHS OF ITS SIDES.
STAGE 1
PERIMETER 4
2
8
b) Generalize the situation to predict the perimeter of the fîgure in the nth stage.
ANSWER:
SPACE FOR FIGURING
250
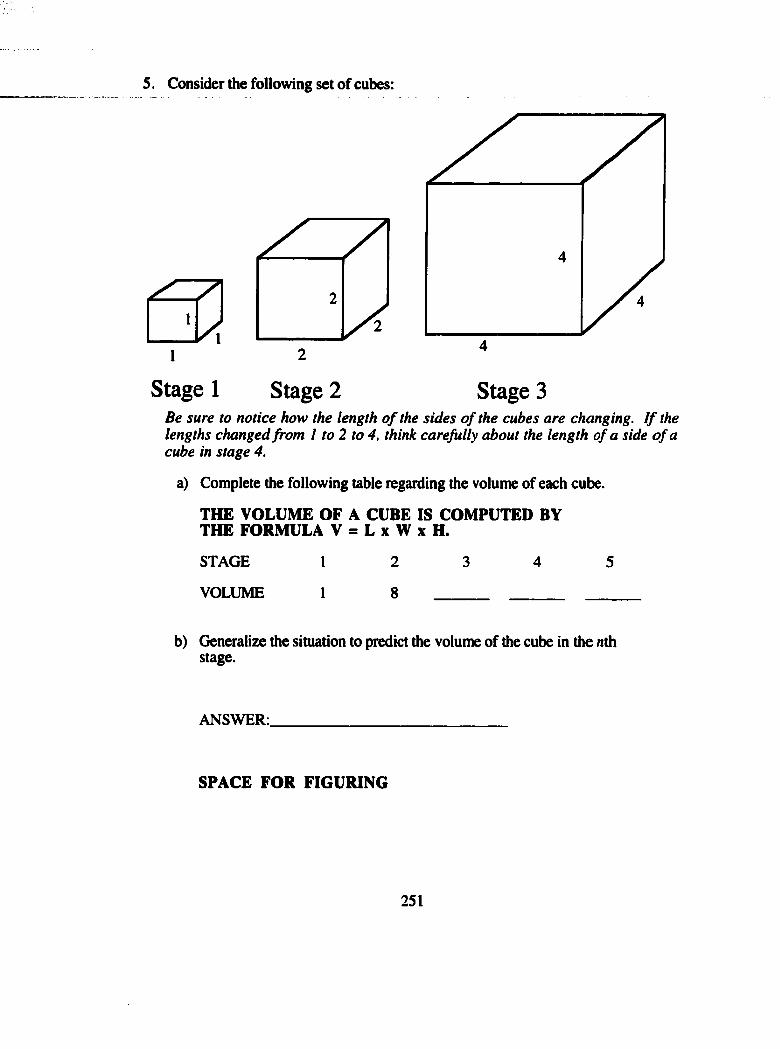
s . Consider the following set of cubes:
2
Stage 1 Stage 2
4
Stage 3Be sure to notice how the length o f the sides o f the cubes are changing. I f the lengths changed from I to 2 to 4, think carefully about the length of a side o f a cube in stage 4.
a) Complete the following table regarding the volume of each cube.
THE VOLUME OF A CUBE IS COMPUTED BY THE FORMULA V = L x W x H.
STAGE
VOLUME
2
8
b) Generalize the situation to predict the volume of the cube in the nth stage.
ANSWER:
SPACE FOR FIGURING
251
APPENDIX C
INTERVIEW TASKS
252
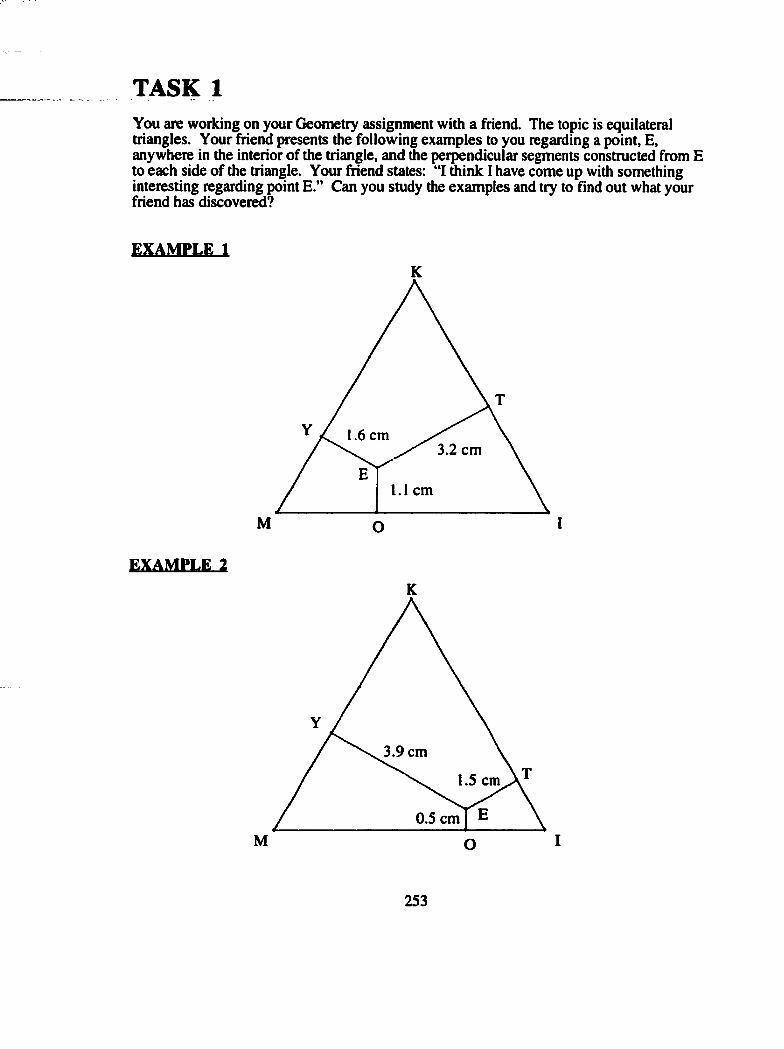
TASK 1You are working on your Geometry assignment with a friend. The topic is equilateral triangles. Your friend presents the following examples to you regarding a point, E, anywhere in the interior of the triangle, and the perpendicular segments constructed from E to each side of the triangle. Your friend states; “I think I have come up with something interesting regarding point E.” Can you study the examples and try to find out what your friend has discovered?
EXAMPLE 1K
1.6 cm3.2 cm
1.1 cm
M IO
EXAMPLE 2K
3.9 cm
1.5 cm
0.5 cmIM O
253
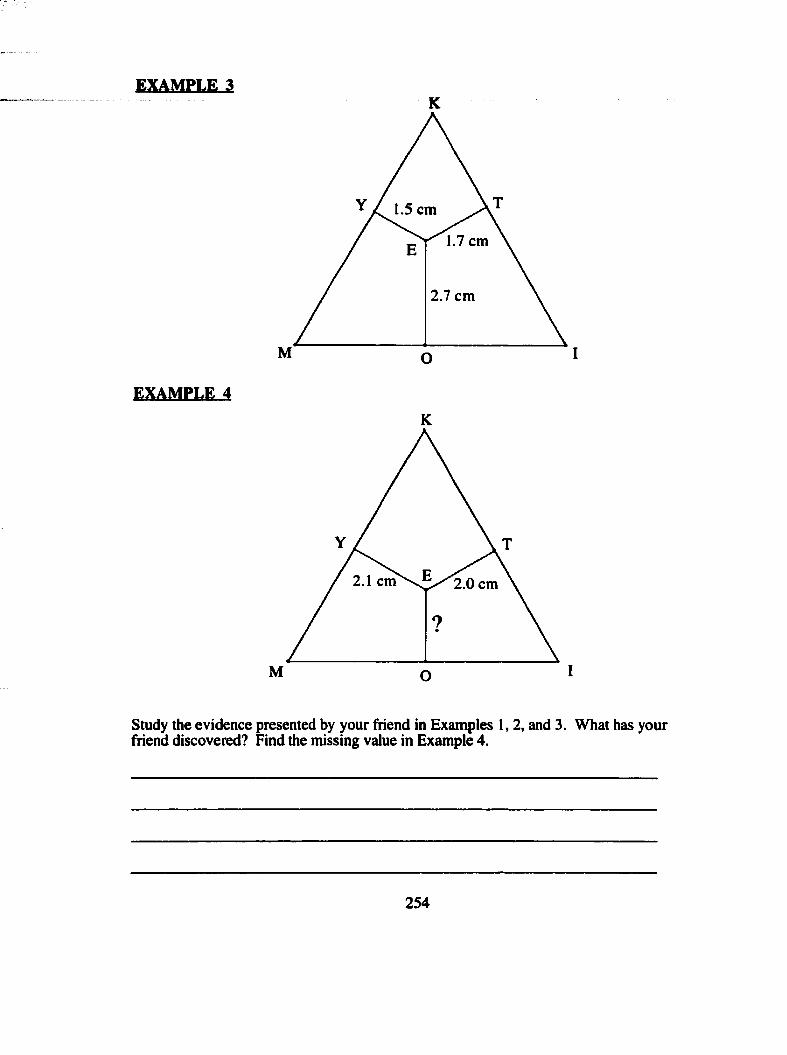
EXAMPLE 3
1.5 cm
1.7 cm
2.7 cm
M
EXAMPLE 4K
2.1 cm 2.0 cm
IM O
Study the evidence presented by your friend in Examples 1, 2, and 3. What has your fnend discovered? Find the missing value in Example 4.
254
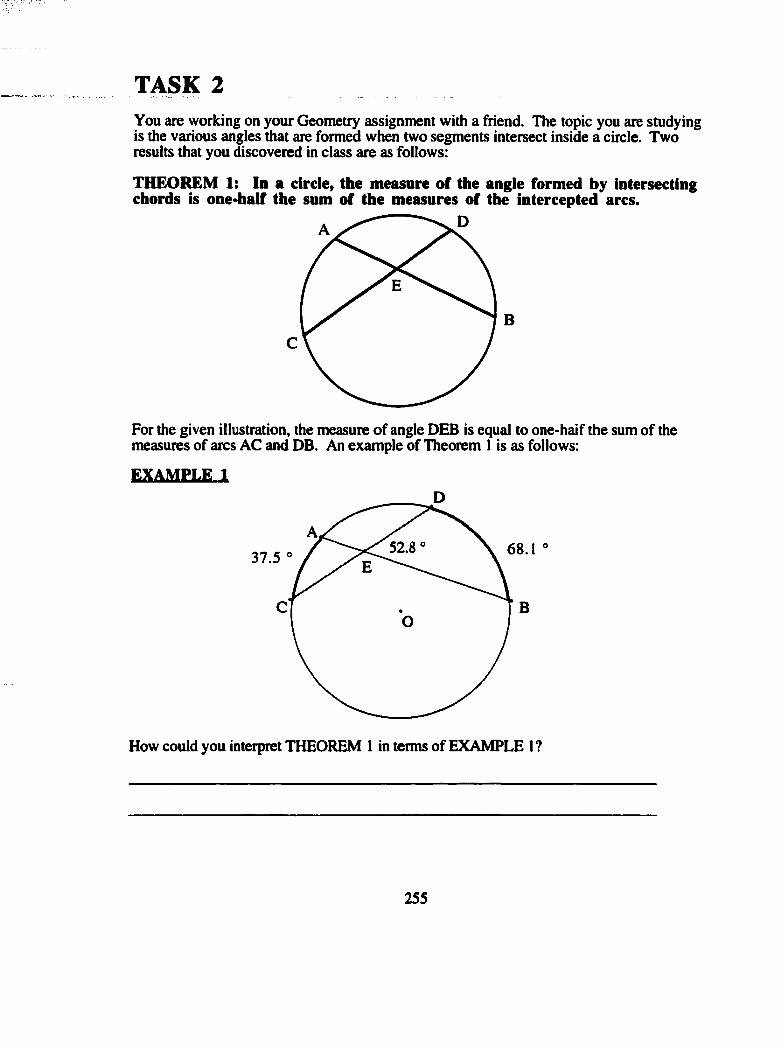
TASK 2You are working on your Geometry assignment with a friend. The topic you are studying is the various angles that are formed when two segments intersect inside a circle. Two results that you discovered in class are as follows;
THEOREM 1: In a circle, the measure of the angle formed by intersecting chords is one-half the sum of the measures of the intercepted arcs.
CB
For the given illustration, the measure of angle DEB is equal to one-haif the sum of the measures of arcs AC and DB. An example of Theorem 1 is as follows:
EXAMPLE 1
52.8 68.137.5
How could you interpret THEOREM 1 in terms of EXAMPLE 1?
255
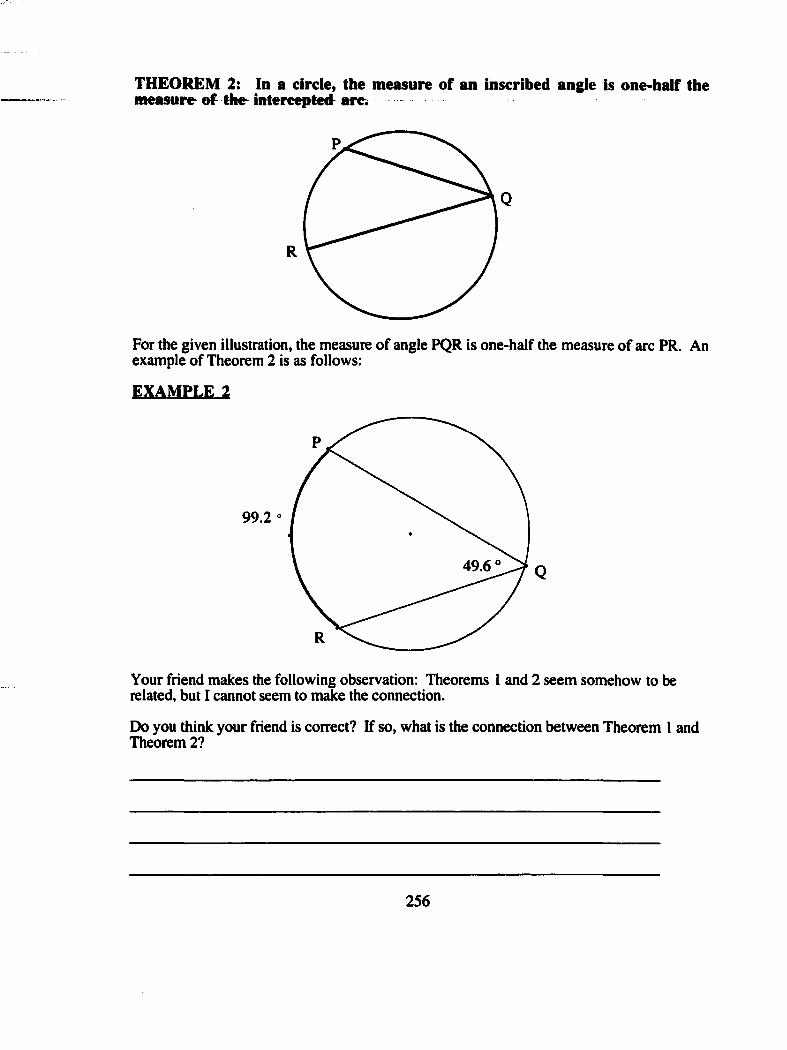
THEOREM 2: In a circle, the measure of an inscribed angle is one-half the measure of the intercepted are.
R
For the given illustration, the measure of angle PQR is one-half the measure of arc PR. An example of Theorem 2 is as follows:
EXAMPLE 2
99.2 =
49.6
Your friend makes the following observation: Theorems 1 and 2 seem somehow to be related, but I cannot seem to make the connection.
Do you think your friend is correct? If so, what is the connection between Theorem 1 and Theorem 2?
256
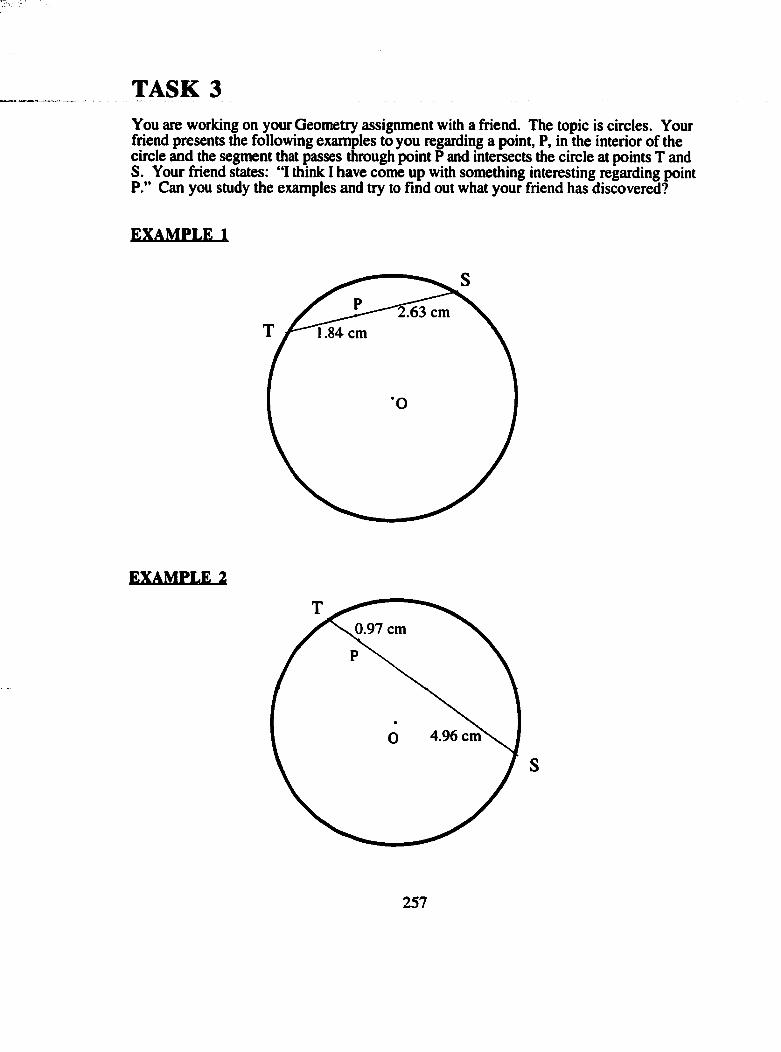
TASK 3You are working on your Geometry assignment with a friend. The topic is circles. Your friend presents the following examples to you regarding a point, P, in the interior of the circle and the segment that passes through point P and intersects the circle at points T andS. Your friend states: "I think I have come up with something interesting regarding point P.” Can you study the examples and try to find out what your friend has discovered?
EXAMPLE 1
2.63 cm1.84 cm
EXAMPLE 2
0.97 cm
4.96 cm
257
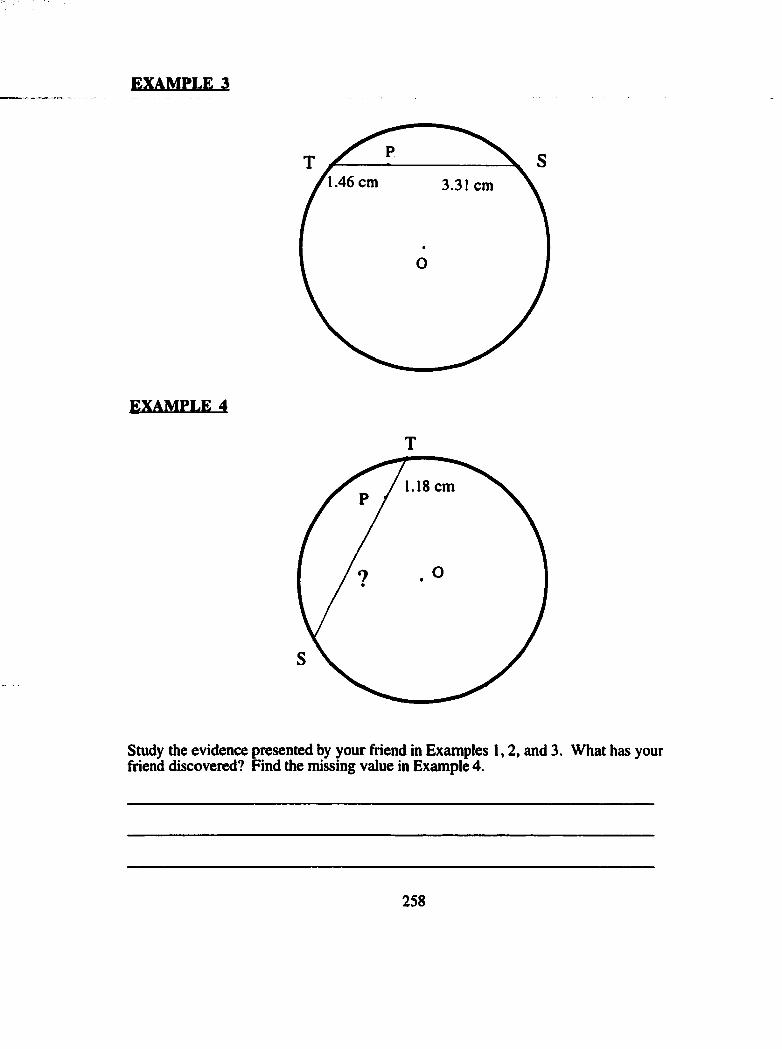
EXAMPLE 3
1.46 cm 3.31 cm
EXAMPLE 4
1.18 cm
Study the evidence presented by your friend in Examples 1,2, and 3. What has your friend discovered? Find the missing value in Example 4.
258
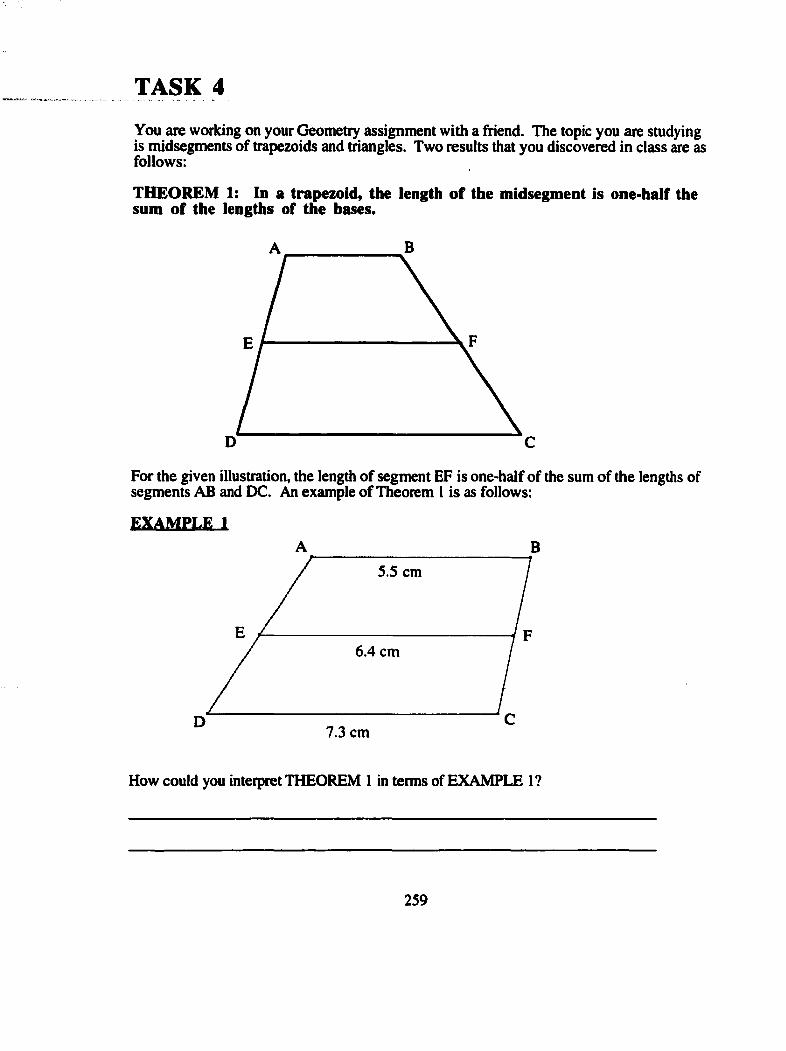
TASK 4
You are working on your Geometry assignment with a fnend. The topic you are studying is midsegments of trapezoids and triangles. Two results that you discovered in class are as follows:
THEOREM 1: In a trapezoid, the length of the midsegment is one-half the sum of the lengths of the bases.
C
For the given illustration, the length of segment EF is one-half of the sum of the lengths of segments AB and DC. An example of Theorem 1 is as follows:
EXAMPLE 1B
5.5 cm
6.4 cm
7.3 cm
How could you interpret THEOREM 1 in terms of EXAMPLE 1?
259
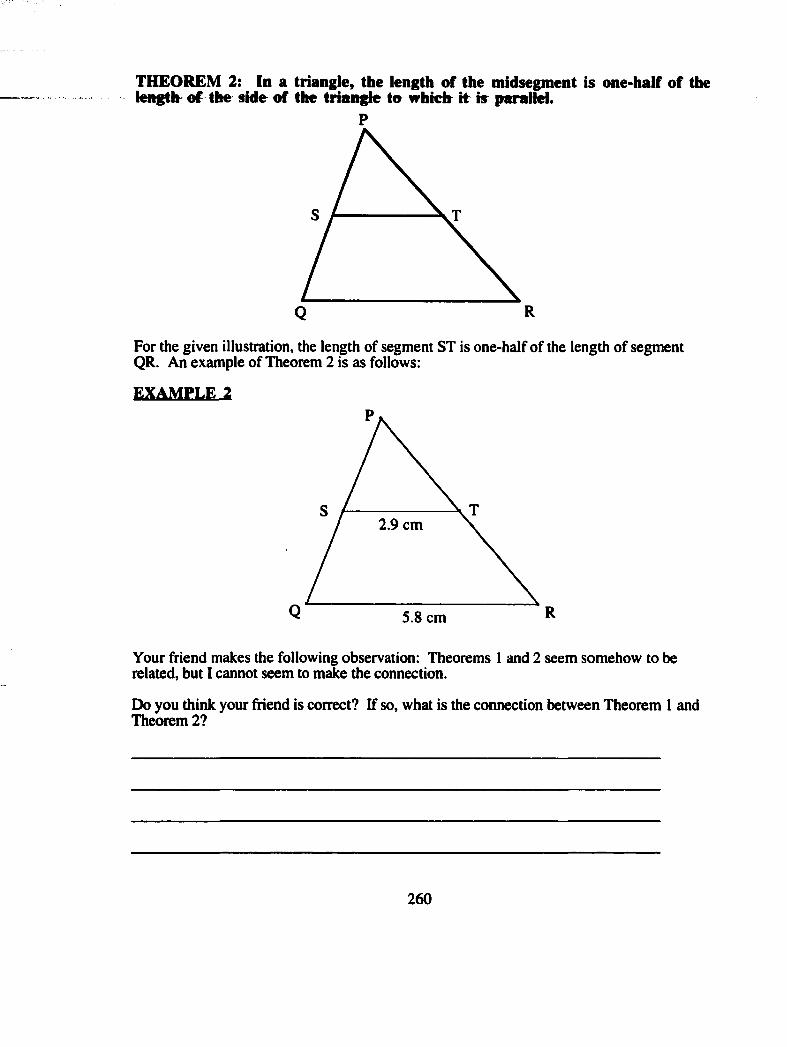
THEOREM 2: In a triangle, the length of the midsegment is one half of the iengtlr o f the side o f the Iriangieto- whicir it̂ ia parallel
P
RQ
For the given illustration, the length of segment ST is one-half of the length of segment QR. An example of Theorem 2 is as follows:
EXAMPLE 2
2.9 cm
Q 5.8 cm R
Your friend makes the following observation: Theorems 1 and 2 seem somehow to be related, but I cannot seem to make the connection.
Do you think your friend is correct? If so, what is the connection between Theorem 1 and Theorem 2?
2 6 0
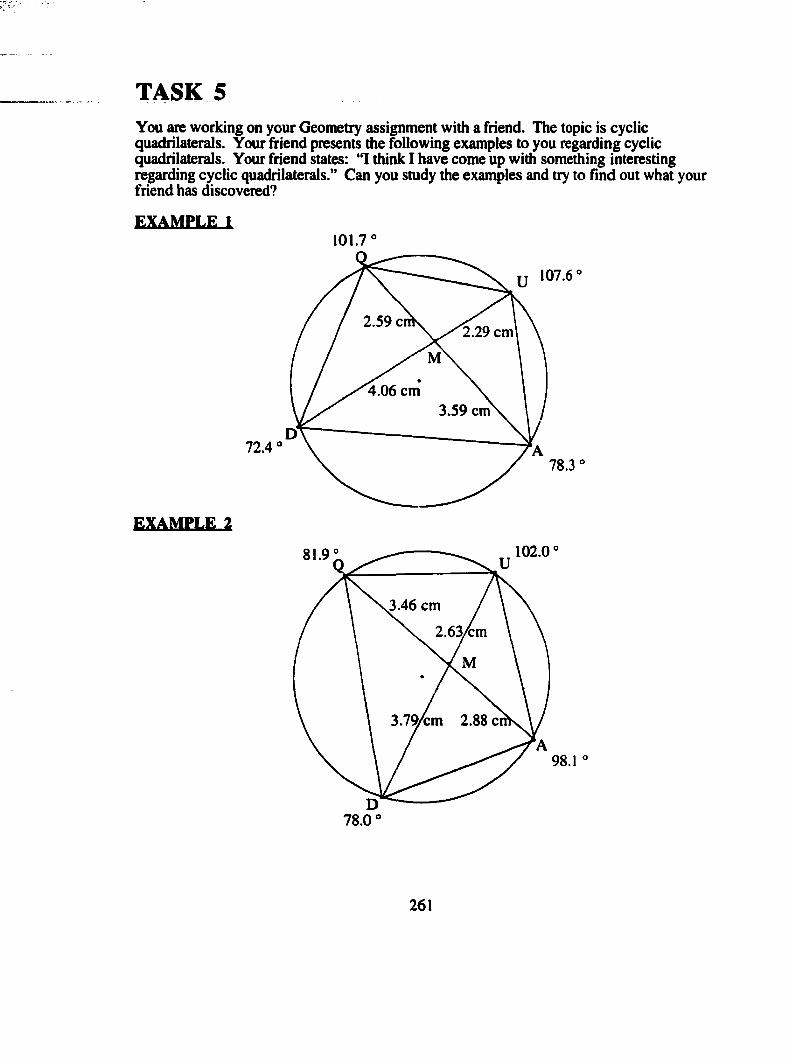
TASK 5You are working on your Geometry assignment with a friend. The topic is cyclic quadrilaterals. Your friend presents the following examples to you regarding cyclic quadrilaterals. Your friend states: T think I have come up with something interesting regarding cyclic quadrilaterals.” Can you study the examples and try to find out what your friend has discovered?
EXAMPLE I101.7
107.6
2.59 C l2.29 cm
4.06 cm3.59 cm
72.4°78.3
EXAMPLE 2
102.081.9
3.46 cm
3.79/cm 2.88 ci
98.1
78.0°
261
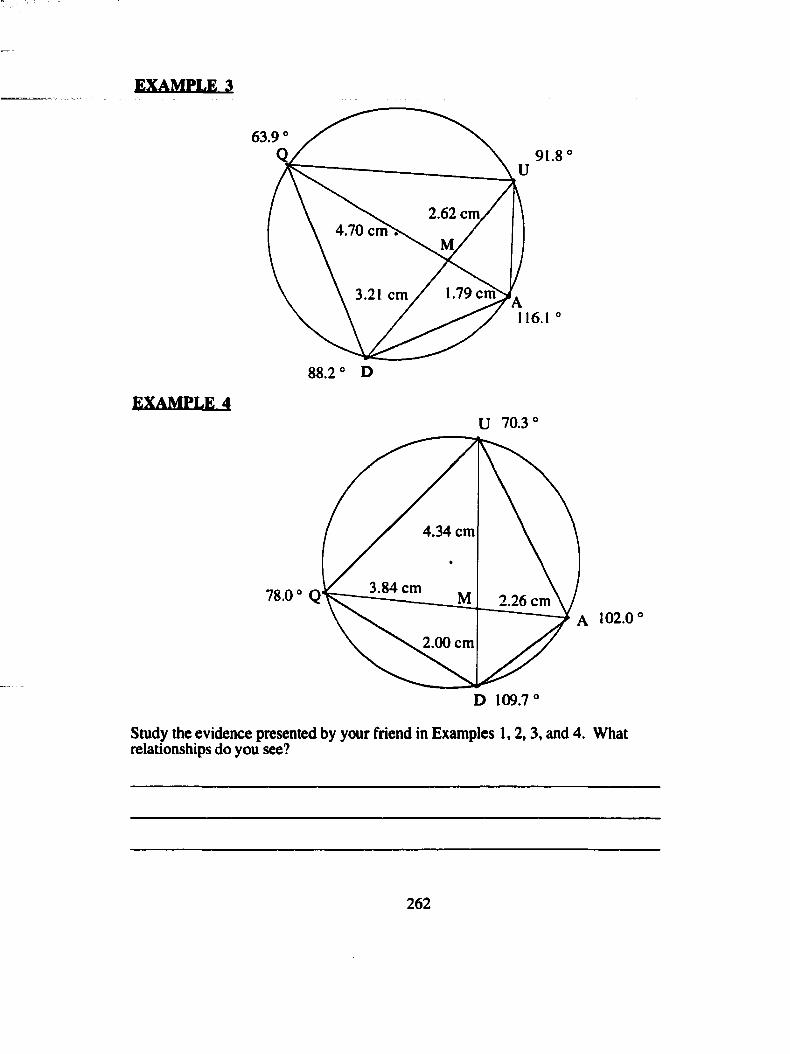
EXAMPLE 3
63.991.8
2.62 cm.
1.79 cm3.21 cm16.
88.2 ° D
EXAMPLE 4U 70.3
4.34 cm
3.84 cm78.0 ° Q 2.26 cmA 102.0
2.00 cm
D 109.7°
Study the evidence presented by your friend in Examples 1 ,2 ,3 , and 4. What relationships do you see?
262
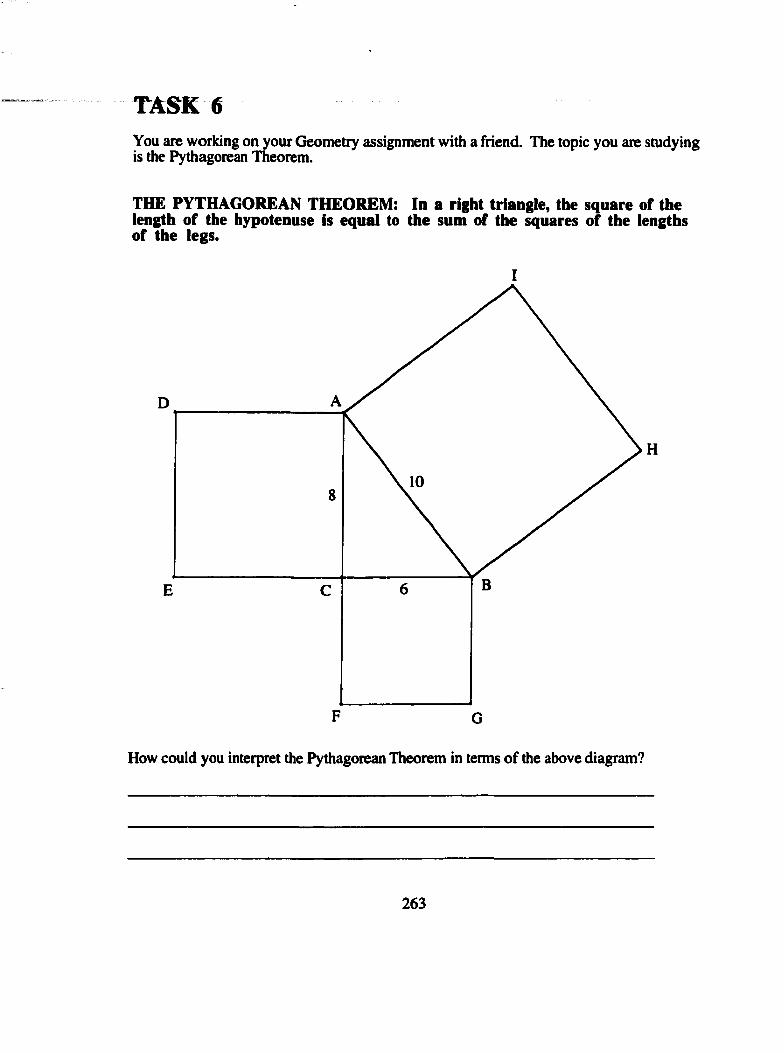
TASK 6You are working on your Geometry assignment with a friend. The topic you are studying is the Pythagorean Theorem.
THE PYTHAGOREAN THEOREM: In a right triangle, the square of the length of the hypotenuse is equal to the sum of the squares of the lengths of the legs.
D
8\ 10
C 6
How could you interpret the Pythagorean Theorem in terms of the above diagram?
263
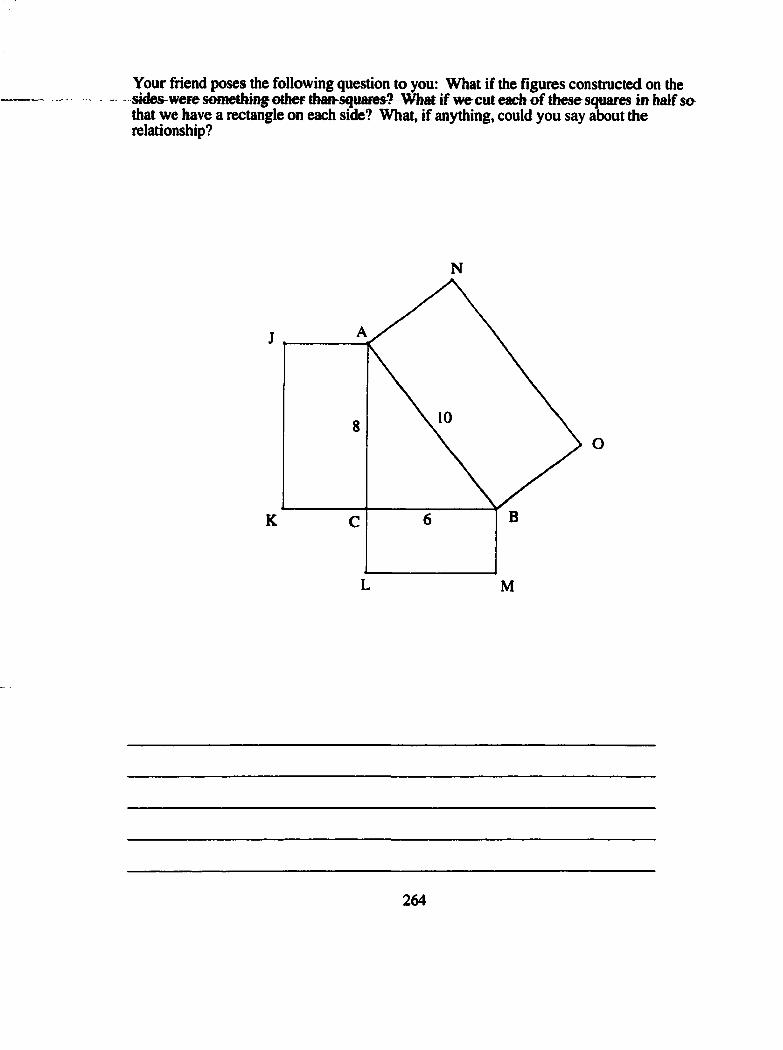
Your friend poses the following question to you: What if the figures constructed on the sides^weie something other than^squares?^ Whar if w eeuf each of these squares to half so that we have a rectangle on each side? What, if anything, could you say about the relationship?
K
8 \ 10
C 6
O
M
264
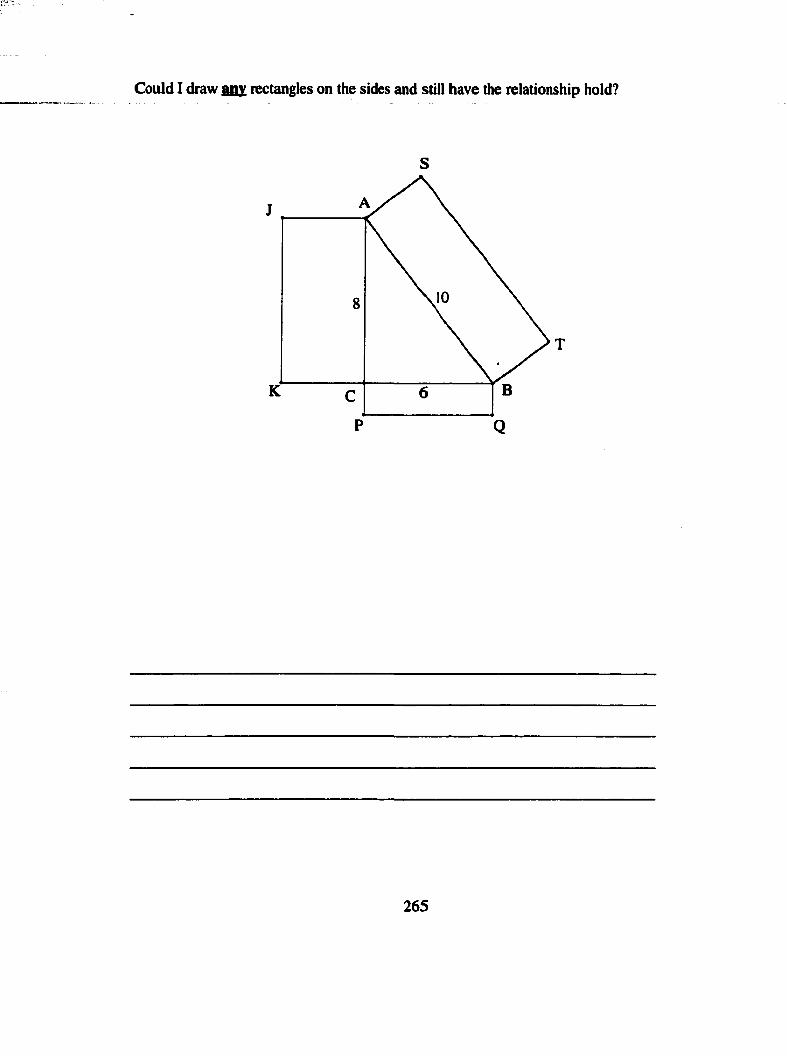
Could I draw aux rectangles on the sides and still have the relationship hold?
8 \ i o
C 6
265
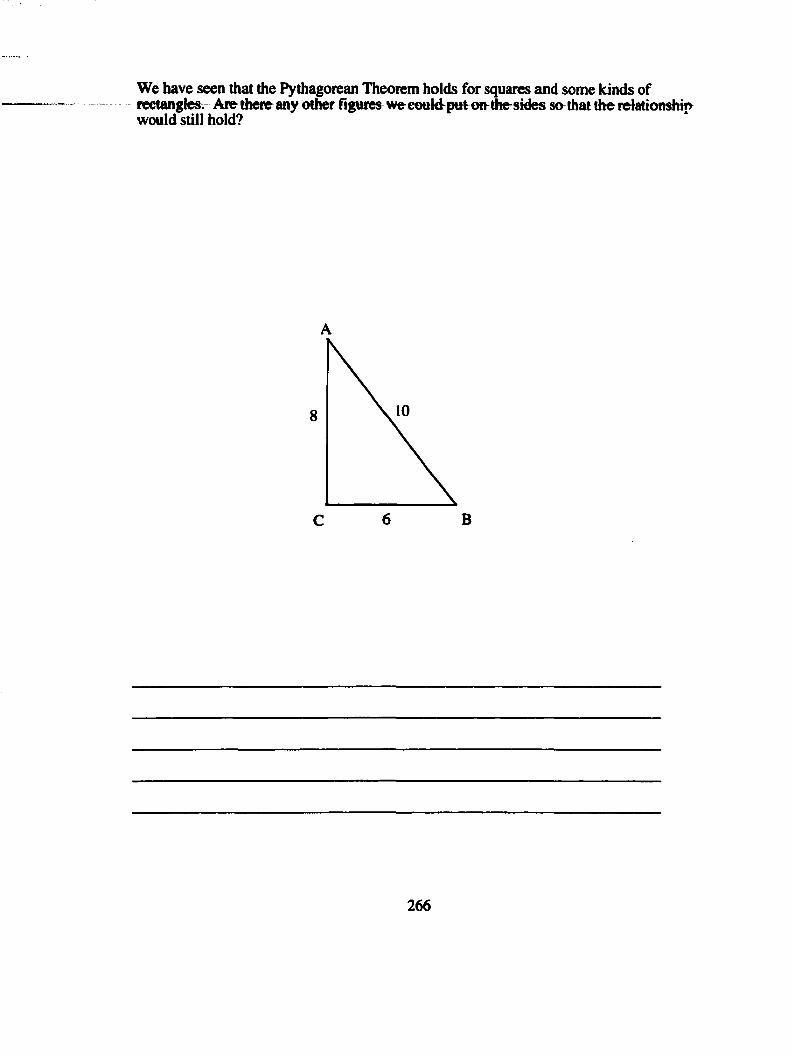
We have seen that the Pythagorean Theorem holds for squares and some kinds of rectangles. Are there any other figures wecouldpur on^the-sides so that the relationship would still hold?
8
6 BC
266
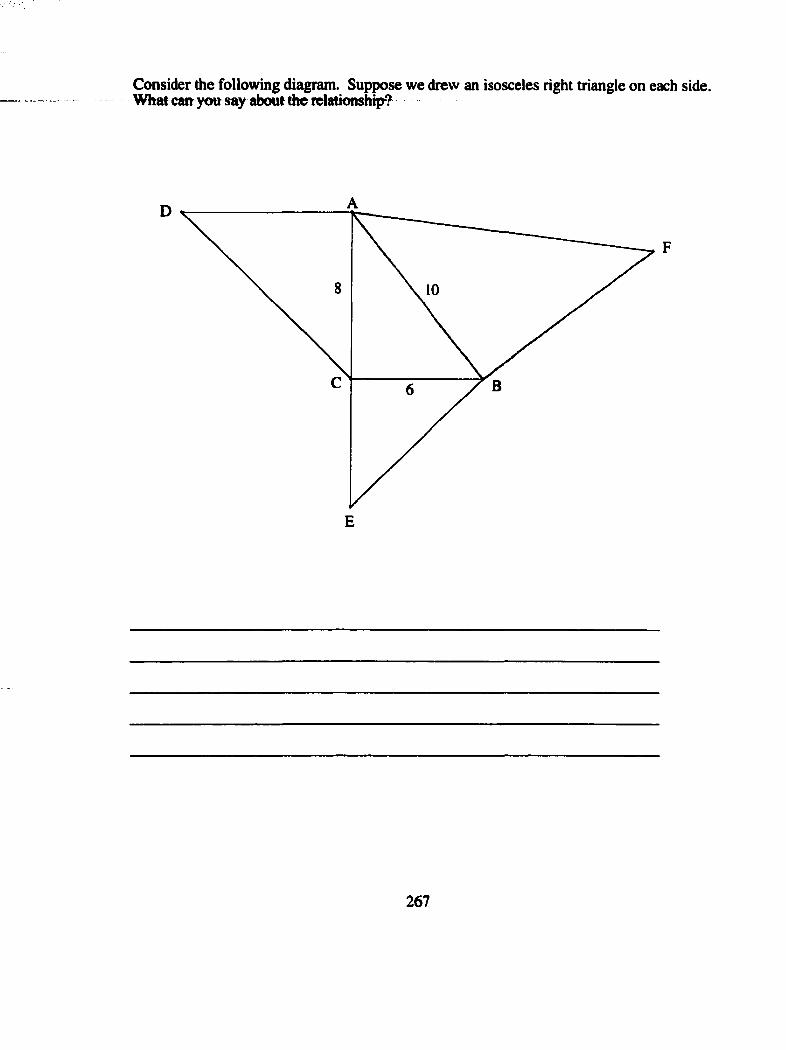
Consider the following diagram. Suppose we drew an isosceles right triangle on each side.Whafcan^you say about the relationship?
D
E
267
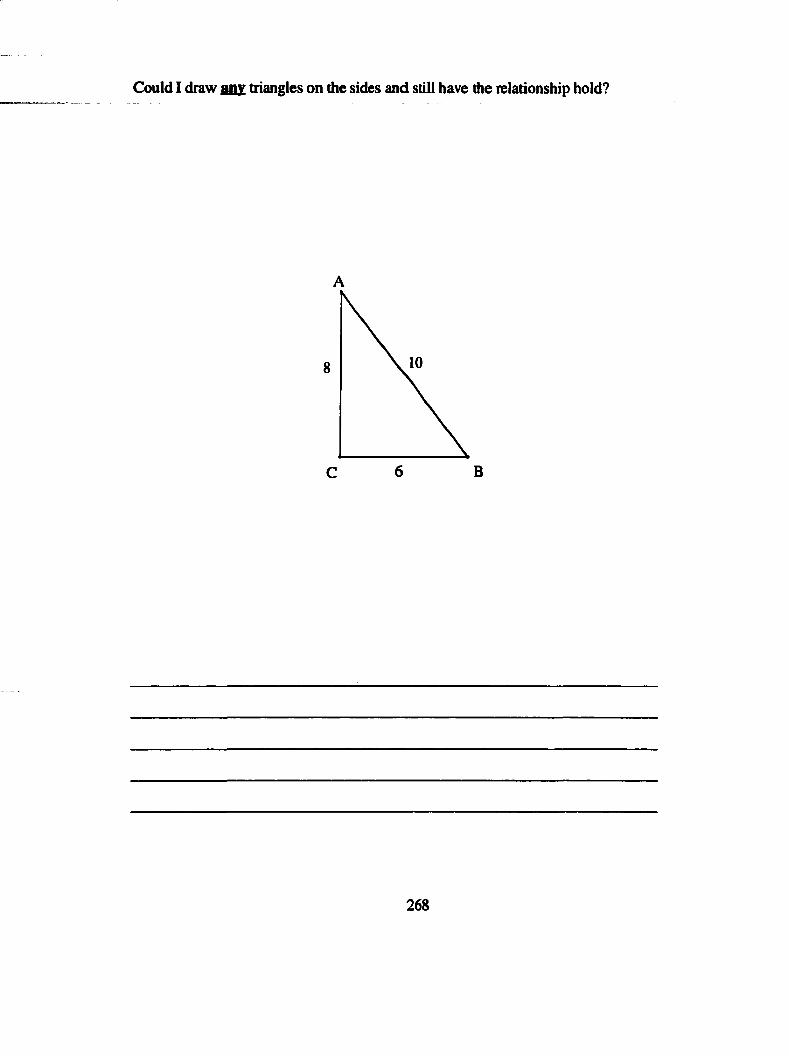
Could I draw aox triangles on the sides and still have the relationship hold?
8
6 BC
268
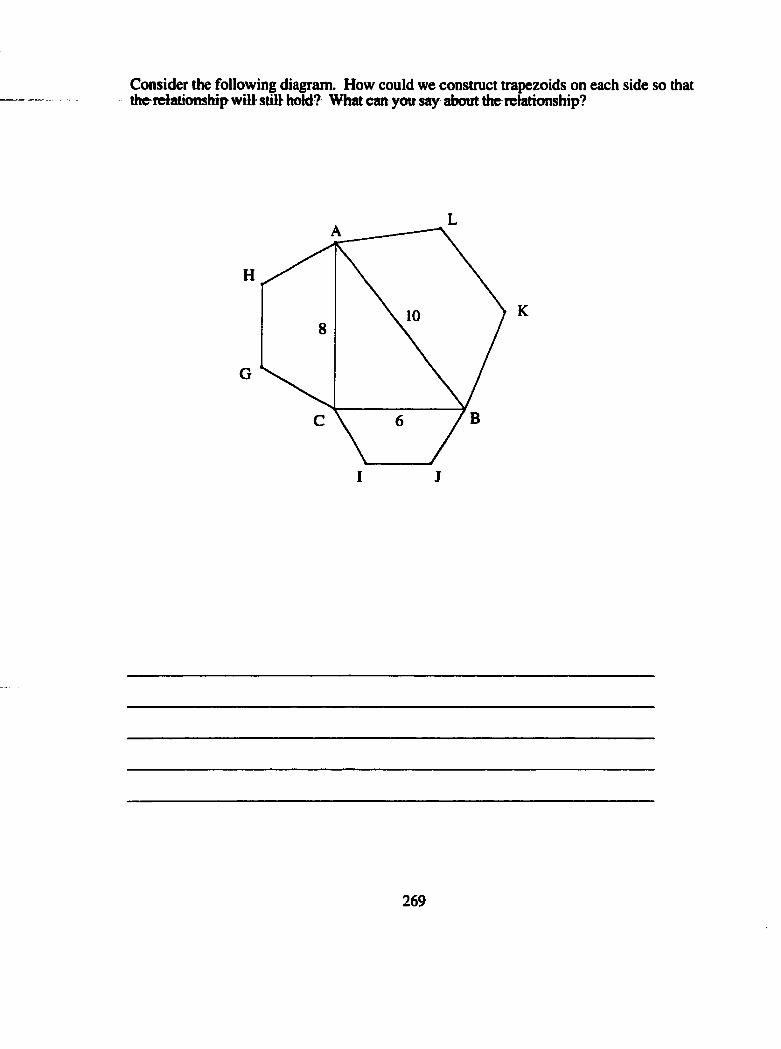
Consider the following diagram. How could we construct trapezoids on each side so thatthe-reiatkmship wilfstilihold? What can̂ you^sa)r t*out the relationship?
H
G
I J
K
269
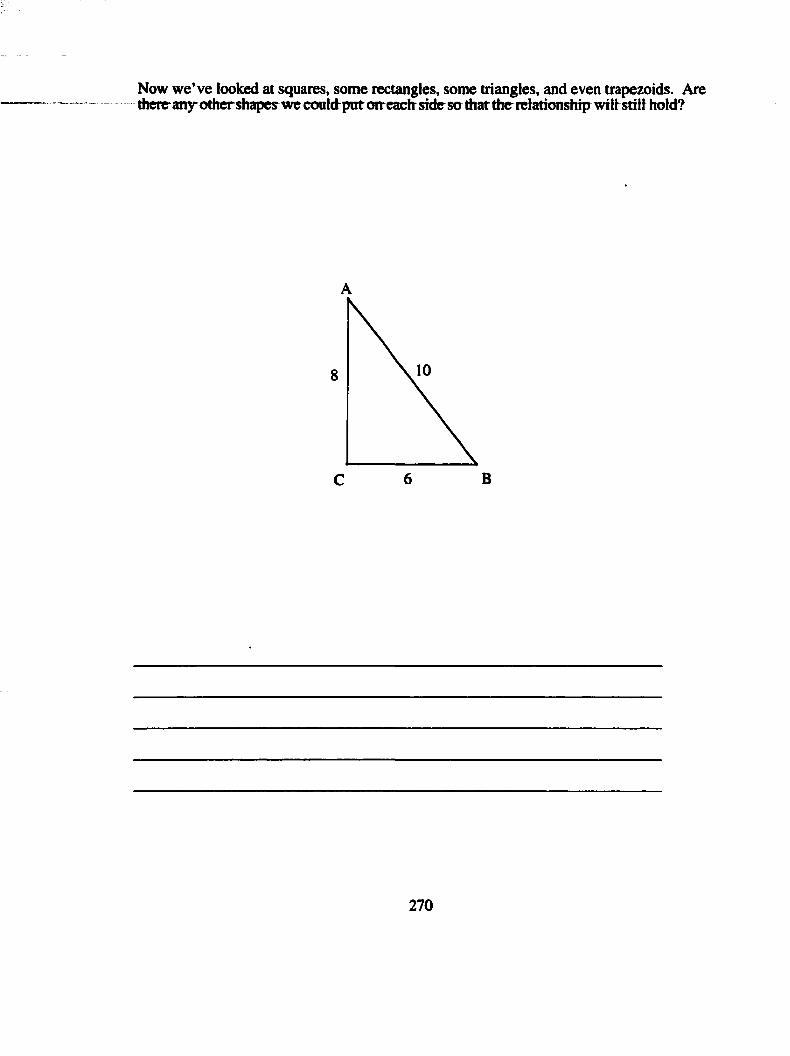
Now we’ve looked at squares, some rectangles, some triangles, and even trapezoids. Are therranyothershapes^ we could^pnt omeaclr side sa that the relationship wilt still hold?
8
B6C
270