Influence of the chemical structure on the fluorescence lifetime ...
199
Dissertation zur Erlangung des Doktorgrades der Fakultät für Chemie und Pharmazie der Ludwig-Maximilians-Universität München Influence of the Chemical Structure on the Fluorescence Lifetime of Dicarboxylic Imides and Oligothiophenes Thorben Schlücker aus München, Deutschland 2016
-
Upload
khangminh22 -
Category
Documents
-
view
1 -
download
0
Transcript of Influence of the chemical structure on the fluorescence lifetime ...

Dissertation zur Erlangung des Doktorgrades
der Fakultät für Chemie und Pharmazie
der Ludwig-Maximilians-Universität München
Influence of the Chemical Structure on the Fluorescence
Lifetime of Dicarboxylic Imides and Oligothiophenes
Thorben Schlücker
aus
München, Deutschland
2016

Erklärung
Diese Dissertation wurde im Sinne von § 7 der Promotionsordnung vom 28. November 2011
von Herrn Prof. Dr. Heinz Langhals betreut.
Eidesstattliche Versicherung
Diese Dissertation wurde eigenständig und ohne unerlaubte Hilfe erarbeitet.
München, 21. Oktober 2016
Thorben Schlücker
Dissertation eingereicht am 21.10.2016
1. Gutachter: Prof. Dr. Heinz Langhals
2. Gutachter: Prof. Dr. Manfred Heuschmann
Mündliche Prüfung am 16.12.2016


Acknowledgement
Acknowledgement
Seneca vermeldete er sei dankbar, nicht weil es vorteilhaft sei, sondern weil es Freude mache. Mit
eben dieser Freude danke ich allen, die mich auf dem Weg meiner Promotion begleitet und diese eben
dadurch erst möglich gemacht haben.
Die vorliegende Arbeit entstand in der Zeit von Mai 2012 bis Dezember 2016 am Department Chemie
und Pharmazie der Ludwig-Maximilians-Universität München unter Anleitung von Herrn Prof. Dr. Heinz
Langhals. Zuvorderst bedanke ich mich herzlichst bei Ihnen, Herr Prof. Dr. Heinz Langhals, für die
freundliche Aufnahme in Ihren Arbeitskreis, die interessante Themenstellung und ausgezeichnete
fachliche Unterstützung. Ihre dauernde Diskussionsbereitschaft und große Nähe zu Ihren Mitarbeitern
haben mich beeindruckt und sehr gefreut. Mein Dank geht auch an Prof. Dr. Manfred Heuschmann für
die freundliche Übernahme des Co-Referats. Ebenfalls danke ich den übrigen Mitgliedern der
Prüfungskommission Prof. Dr. Konstantin Karaghiosoff, Dr. Henry Dube, Prof. Dr. Rudolf Knorr und Dr.
Dina Fattakhova-Rohlfing für Ihre Zeit und Mühe. Ich bedanke mich bei allen Mitarbeitern des
Arbeitskreises für ihr kollegiales Verhalten und ihre Hilfsbereitschaft. Im Besonderen möchte ich mich
bei meinen Laborkollegen Dr Dominik Zgela, Moritz Eberspächer und Markus Herman, aber auch bei
Ludwig Huber und Kevin Weiland für die angenehme Atmosphäre bedanken, die so manchen langen
Labortag kurz erscheinen ließ. Für die zahlreichen Analysen und Messungen bedanke ich mich bei
Claudia Dubler und Dr. David Stephenson für die Aufnahme der NMR-Spektren und bei Susanne
Sauerer und Robert Eicher für die Elementaranalysen. Brigitte Breitenstein, Carola Draxler, Dr. Werner
Spahl und besonders Sonja Kosak danke ich herzlich für die äußerst schnelle Durchführung der
Massenspektrometrie. Dr. Moritz Ehrl und Prof. Dr. Pablo Docampo danke ich für die freundliche
Unterstützung in technischen Belangen zur Messung von Fluoreszenzlebensdauern. Außerdem
möchte ich meine Dankbarkeit gegenüber allen Bachelor- und PraktikumsstudentInnen aussprechen,
die mich zumindest stets Geduld und Nachsicht gelehrt haben, ohne deren Engagement die Arbeit aber
sicher auch weniger Freude und Kurzweil bedeutet hätte. Nicht zuletzt danke ich allen Projektpartnern
und Co-Autoren für ihre durchweg kooperative Arbeitweise. Hervorzuheben si nd hier Prof. Dr. Hans
Poisel, Dr. Alexander Bachmann und Florian Winkler.
Mein ganz persönlicher Dank geht auch an meine langjährigen Freunde Tim Büsch, Josef Rossa und
Maximilian Legat. Ihr habt mir viele schöne und interessante Tage und Abende verschafft und mich so
auch immer wieder motiviert. Ich möchte meiner Familie aus tiefstem Herzen danken, dass sie mir
mein Studium ermöglicht und mir stets sowohl finanziell als auch moralisch geholfen hat. Ich weiß zu
schätzen, dass ihr immer hinter mir steht und mich in allem was ich mache unterstützt. Abschließend
danke ich meiner lieben Freundin Dr. Ksenia Fominykh für alles. Fachlich wie moralisch hat mir Deine
Liebe immer neue Kraft gegeben und dadurch wesentlich mehr als nur diese Arbeit erst ermöglicht.


Es suchten lang vor uns die Alten
nach Raum und Zeit und den Gestalten
Doch Zeit, so kommt es einem vor
die lernt man erst in dem Labor.
Nun weiß man was davon zu halten

Table of Contents
Table of Contents
I List of Abbreviations and Physical Quantities I
II List of Figures III
III List of Schemes VIII
IV List of Tables X
V List of Equations XI
VI List of Compounds XII
1 General and Theoretical Section 1
1.1 Fundamentals of Fluorescence 2
1.2 Fluorescent Dyes 9
1.3 Objectives 12
2 Results and Discussion 13
2.1 Modifications of Perylene Diimides: Shortening the Fluorescence Lifetime via
Intramolecular Interactions in Axial-Linked Di- and Trichromophores 15
2.2 Influence of Intramolecular Dynamics on Fluorescence Properties 29
2.2.1 Intramolecular Dynamics of 4-Aryl Naphthalimides 30
2.2.2 Synthesis and Characterization of Substituted Anthracene Dicarboximides 51
2.2.2.1 N-Substituted 10-Aminoanthracene-1,9-dicarboximides 54
2.2.2.2 Transition Metal-Free Homo-Coupling Reactions of Anthracen- and Naphthalene
Dicarboximides 65
2.3 Concentration Dependency of the Fluorescence Lifetime: Long-Range
Electromagnetic Molecular Interactions Indicated by the Process of Light Emission 69
2.4 Efficient Recycling of Unmarked Polymers by Means of their Auto-Fluorescent
Decay 81
2.4.1 Development of an Optical Method for the Recycling of Unmarked Polymers 82
2.4.2 Studies on the Fluorescence of Ce(IV). A Universal Probe for Sorting Polymers 94
2.5 Synthesis and Characterization of Oligothiophenes with Short Fluorescence
Lifetimes and High Stokes’ Shifts 99
2.5.1 Adamantyl Substituted Oligothiophenes 100
2.5.2 Alkyl and Aryl Substituted Oligothiophenes 109
3 Summary 117
4 Experimental Section 121
Table of Contents
4.1 General Working Techniques 121
4.2 Analytical Methods and Instruments 122
4.3.1 9,9'-(2,3,5,6-Tetramethyl-1,4-phenylene)bis(2-(nonadecan-10-yl)anthra[2,1,9-
def:6,5,10-d'e'f']diisoquinoline-1,3,8,10(2H,9H)-tetraone) (9) 123
4.3.2 2,9-Bis(4-amino-2,3,5,6-tetramethylphenyl)anthra[2,1,9-def:6,5,10-
d'e'f']diisoquinoline 1,3,8,10(2H,9H)-tetraone (12) 124
4.3.3 9,9'-((1,3,8,10-Tetraoxo-1,3,8,10-tetrahydroanthra[2,1,9-def:6,5,10-
d'e'f']diisoquinoline-2,9-diyl)bis(2,3,5,6-tetramethyl-4,1-phenylene))bis(2-
(tridecan-7-yl)anthra[2,1,9-def:6,5,10-d'e'f']diisoquinoline-1,3,8,10(2H,9H)-
tetraone) (13) 125
4.3.4 1,2,4,5-Tetrakis(bromomethyl)benzene (15) 126
4.4.1.1 6-(4-Cyanophenyl)-2-(tridecan-7-yl)-1H-benzo[de]isoquinoline-1,3(2H)-dione (30) 127
4.4.1.2 8-Methoxy-4-methyl-1,2-dihydronaphthalene (precursor of 28) 128
4.4.1.3 1-Methoxy-5-methylnaphthalene (precursor of 28) 129
4.4.2.1 Aceanthrylene-1,2-dione (38) 130
4.4.2.2 1H,3H-Dibenzo[de,h]isochromene-1,3-dione (39) 131
4.4.2.3 2-(Tridecan-7-yl)-1H-dibenzo[de,h]isoquinoline-1,3(2H)-dione (40) 132
4.4.2.4 7-(Hexylamino)-2-(tridecan-7-yl)-1H-dibenzo[de,h]isoquinoline-1,3(2H)-dione (41) 133
4.4.2.5 7-((2-Aminoethyl)amino)-2-(tridecan-7-yl)-1H-dibenzo[de,h]isoquinoline-1,3(2H)-
dione (42) 134
4.4.2.6 7-(Phenylamino)-2-(tridecan-7-yl)-1H-dibenzo[de,h]isoquinoline-1,3(2H)-dione
(43) 135
4.4.2.7 7-(Methyl(2-(methylamino)ethyl)amino)-2-(tridecan-7-yl)-1H-
dibenzo[de,h]isoquinoline-1,3(2H)-dione (44) 136
4.4.2.8 7-(Piperidin-1-yl)-2-(tridecan-7-yl)-1H-dibenzo[de,h]isoquinoline-1,3(2H)-dione
(45) 137
4.4.2.9 7-(1H-Indol-1-yl)-2-(tridecan-7-yl)-1H-dibenzo[de,h]isoquinoline-1,3(2H)-dione
(46) 138
4.4.2.10 7-(3,4,6,7-Tetrahydropyrrolo[1,2-a]pyrimidin-1(2H)-yl)-2-(tridecan-7-yl)-1H-
dibenzo[de,h]isoquinoline-1,3(2H)-dione (47) 140
4.4.2.11 7-Hydroxy-2-(tridecan-7-yl)-1H-dibenzo[de,h]isoquinoline-1,3(2H)-dione (48) 141
4.4.2.12 2,9-Di(tridecan-7-yl)tetrapheno[8,9-ab]benzo[5,6,7-def:10,11,12-
d'e'f']diisoquinoline-1,3,8,10(2H,9H)-tetraone (49a) 142
4.4.2.13 2,9-di(Tridecan-7-yl)tetrapheno[5,6,7-def]isoquinoline[10,11,12-d'e'f']([7,8-
a,b]benzoisoquinoline-1,3,8,10(2H,9H)-tetraone (49b) 143

Table of Contents
4.4.2.14 2-(Tridecan-7-yl)-1H-benzo[de]isoquinoline-1,3(2H)-dione (50) 144
4.4.2.15 5-Amino-2-(tridecan-7-yl)-1H-benzo[de]isoquinoline-1,3(2H)-dione (51) 145
4.4.2.16 5,13-Di(tridecan-7-yl)-8,16-dihydrodiisoquinolino[5,4-ab:5',4'-hi]phenazine-
4,6,12,14(5H,13H)-tetraone (52) 146
4.5.1.1 5,5'''-Di(adamantan-1-yl)-2,2':5',2'':5'',2'''-quaterthiophene (59a) 148
4.5.1.2 5,5'''''-Di(adamantan-1-yl)-2,2':5',2'':5'',2''':5''',2'''':5'''',2'''''-sexithiophene (59b) 149
4.5.1.3 5,5’’’’’’’-Di(adamantan-1-yl)-
2,2’:5’,2’’:5’’,2’’’:5’’’,2’’’’:5’’’’,2’’’’’:5’’’’’,2’’’’’’:5’’’’’’,2’’’’’’’-octithiophene (59c) 150
4.5.2.1 2,2':5',2''-Terthiophene (60) 151
4.5.2.2 General procedure for the preparation of 1,1’-([2,2’:5’,2’’-terthiophene]-5,5’’-
diyl)bisketones (61-62) 152
4.5.2.3 1,1'-[(2,2':5',2''-Terthiophene)-5,5''-diyl]bis(propan-1-on) (61a) 154
4.5.2.4 1,1'-[(2,2':5',2''-Terthiophene)-5,5''-diyl]bis(butan-1-on) (61b) 155
4.5.2.5 1,1'-[(2,2':5',2''-Terthiophene)-5,5''-diyl]bis(pentan-1-on) (61c) 156
4.5.2.6 1,1'-[(2,2':5',2''-Terthiophene)-5,5''-diyl]bis(2,2-dimethylpropan-1-on) (61d) 157
4.5.2.7 1,1'-([2,2':5',2''-Terthiophene]-5,5''-diyl)bis(phenylmethanon) (61e) 158
4.5.2.8 1-([2,2'-Bithiophen]-5-yl)-2,2,3,3,4,4,4-heptafluorbutan-1-on (62a) 159
4.5.2.9 1-([2,2':5',2''-Terthiophen]-5-yl)-2,2,3,3,4,4,4-heptafluorbutan-1-on (62b) 160
4.6 Preparation of Solid Poly(methyl methacrylate) Samples 161
4.6.1 Standard Polymerization Reaction for the Preparation of Dye-Doped Poly(methyl
methacrylate) (PMMA) 161
4.6.2 Preparation of Dye-Doped Poly(methyl methacrylate) (PMMA) Films 161
5 References 163

Preface
I
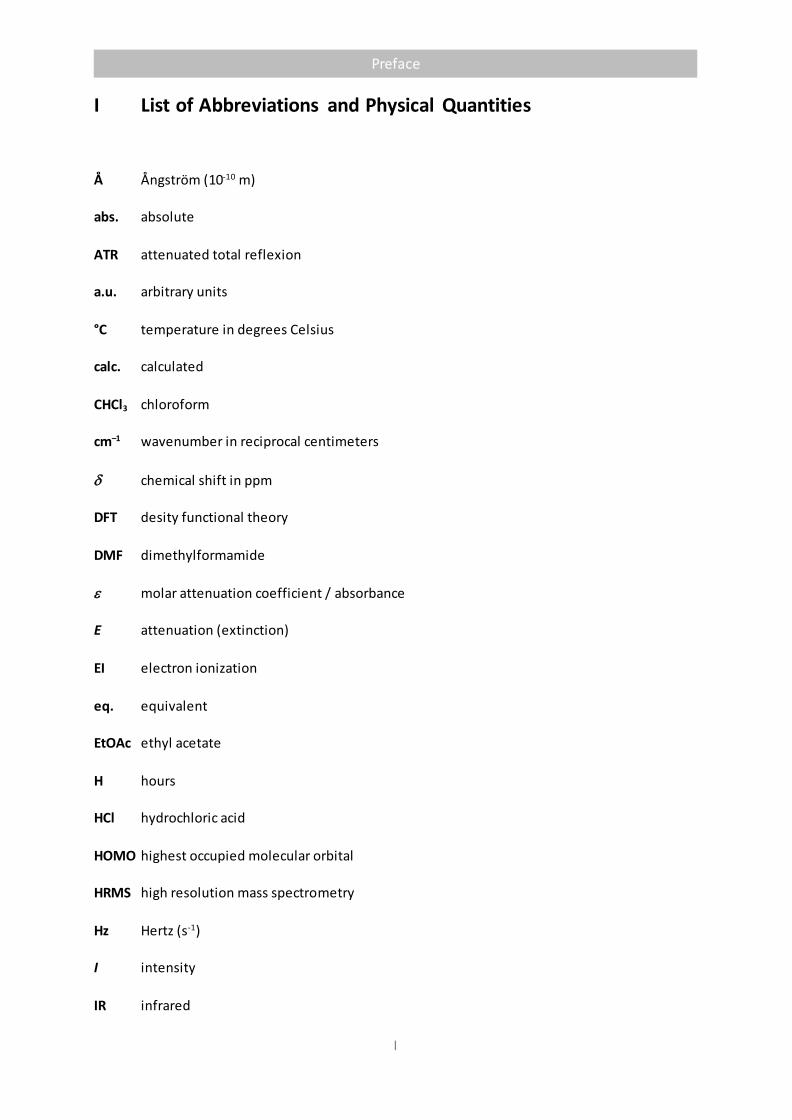
I List of Abbreviations and Physical Quantities
Å Ångström (10-10 m)
abs. absolute
ATR attenuated total reflexion
a.u. arbitrary units
°C temperature in degrees Celsius
calc. calculated
CHCl3 chloroform
cm–1 wavenumber in reciprocal centimeters
chemical shift in ppm
DFT desity functional theory
DMF dimethylformamide
molar attenuation coefficient / absorbance
E attenuation (extinction)
EI electron ionization
eq. equivalent
EtOAc ethyl acetate
H hours
HCl hydrochloric acid
HOMO highest occupied molecular orbital
HRMS high resolution mass spectrometry
Hz Hertz (s-1)
I intensity
IR infrared

Preface
II
IUPAC International Union of Pure and Applied Chemistry
J coupling constant
wavelength in nm
exc excitation wavelength
LUMO lowest unoccupied molecular orbital
M molar (mol L-1)
MALDI matrix-assisted laser desorption/ionization
mg milligram (10-6 kg)
min. minute
mL milliliter (10-6 m3)
MMA methyl methacrylate
mol% mol percent
MS mass spectrometry
NMR nuclear magnetic resonance (spectroscopy)
fluorescence quantum yield
PMMA poly(methyl methacrylate)
ppm parts per million
Rf retardation factor
rt room temperature
fluorescence lifetime
THF tetrahydrofuran
TMS tetramethylsilane
UV ultraviolet
UV/Vis absorption spectroscopy in the ultraviolet and visible spectral region
Preface
III
II List of Figures
Figure 1 Schematic Jablonski diagram. Caused by absorption of a photon an electron is
electronically excited into the singlet 1E1-state (blue). Usually an internal
conversion from an elevated vibronic state into the vibronic ground state takes
place. Subsequently, the excited electron relaxes (red) by emission of fluorescence
light into an excited vibronic state of the electronic ground state 1E0.
Phosphorescence occurs after intersystem crossing of the excited electron into the
triplet 3E1-state under spin inversion. The spin-forbidden relaxation into the
ground state (grey) causes the emission of phosphorescence radiation. 3
Figure 2 Franck-Condon energy diagram. Schematic wave functions (red) are given for
anharmonic oscillators E0 (electronic ground state) and E1 (1st electronically excited
state) representing the energy potential of the chemical bond, respecticely.
Absorption (blue) and fluorescence (grey) take place vertically. 4
Figure 3 Fluorescence decay of N,N’-bis(tridecan-7-yl)perylene-3,4:9,10-tetracarboxylic
diimide (1) in chloroform. Logarithmic scaled exitation puls (grey), fluorescence
decay (red) and monoexponential fit (black, mainly covered by decay). Insert:
Normalized monoexponential fit and resulting fluorescence lifetime of 3.92 ns. 8
Figure 4 Absorption (left) and fluorescence (right) spectra of perylen diimide
dichromophore 9 (red) vs. those of S-13 (grey) in chloroform. 20
Figure 5 Absorptivity of the two main maxima of dichromophore 9 in a dilution series from
3 to 27 x 10-7 mol L-1 in chloroform. Both maxima at 530.0 nm (red) and 492.0 nm
(grey) display linear behavior. 21
Figure 6 Absorption (left) and fluorescence (right) spectra of perylene diimide
trichromophore 13 (red) vs. those of S-13 (1) (grey) and trichromophore 8 (black)
in chloroform. 22
Figure 7 Absorptivity of the main maxima of triichromophore 13 in a dilution series from
1.7 to 13 x 10-7 mol L-1 in chloroform. All maxima at 527.0 nm (red), 491.0 nm (grey)
and 589 nm (black) display linear behavior. Insert: Detail of the spectrum
emphasizing the linear dependency of the absorptivity on the concentration. 23
Figure 8 a) UV/Vis absorption (left) and fluorescence (right) spectra of 23 in various
solvents. From left to right: hexane (thick solid red), tetradecane (dotted blue),
toluene (dashed grey), chloroform (solid black), undecanol (dotted dashed
turquoise) DMF (diffuse yellow), 1-butanol (double dotted dashed green). b)
Linear relationship of the solvatochromism (ET) of 23 (diamonds), 24 (triangles)
and 37 (circles), respectively to the ET(30) solvent polarity scale. Closed symbols:
Aprotic solvents; open symbols: protic solvents, neglected for regression. c) Aryl
naphthalene carboximides 23-30, 32 and 34 in CHCl3 under UV-light (366 nm).
From left to right: 32, 30, 24, 34, 23, 29, 28, 27, 26, 25.
38
Preface
IV
Figure 9 UV/Vis absorption (left) and fluorescence (right) spectra of 27 in various solvents.
From left to right: hexane (thick solid red), tetradecane (dotted blue), toluene
(dashed grey), chloroform (thin solid black), undecanol (dotted dashed turquise)
DMF (diffuse yellow), 1-butanol (double dotted dashed green). 40
Figure 10 Comparison of 27 and 28. a) Absortion (left) and fluorescence spectra of 27 (black)
and 28 (red); b-e) Optimized structures of 27 and 28 (B3LYP 6-311**G); b)
Electronic ground state of 27; c) Electronically excited state of 27; d) Electronic
ground state of 28; e) Electronically excited state of 28. 41
Figure 11 Linear correlations of the Stokes' shift abs-flu (in 1000 cm-1) of 23-30 and 34 versus
fBK to obtain m1 and of the sum abs+flu versus fBK+2gBK to obtain m2. 46
Figure 12 Time resolved anisotropy of naphthalimides 24, 27 and 28 in PMMA films. a)
Anisotropy (red), parallel fluorescence decay (black) and perpendicular
fluorescence decay (grey) of 24; b) Anisotropy (red), parallel fluorescence decay
(black) and perpendicular fluorescence decay (grey) of 27; c) Anisotropy (red),
parallel fluorescence decay (black) and perpendicular fluorescence decay (grey) of
28; d) Comparison of the anisotropy of 24 (black), 27 (red) and 28 (grey). 49
Figure 13 Temperature dependent fluorescence spectra of 32 in diethylene glycol diethyl
ether. Temperatures approx. 25 °C (grey), 100 °C (black), 200 °C (red). 50
Figure 14 Absorption (red) and fluorescence (grey) spectra of N-(tridecan-7-yl)anthracene
dicarboximide (40) in chloroform. 53
Figure 15 Positions of the fluorescence maxima of N-(tridecan-7-yl)anthracene
dicarboximide (40) in different solvents in relation to the ET(30)-values[56] of the
respective solvent. 54
Figure 16 Reaction of N-(tridecan-7-yl)antracene dicarboximide (40) in 0.1 M DMF with
selected amines after different reaction times at room temperature. From top to
bottom: a) Directly after addition; b) after 1 h; c) after 4 h; d) after 1 week. From
left to right: 4-Amino-N-methylphthalimid, aniline, triethylamine, diethylamine,
pyrrolidine, (S)-proline, (S)-lysine, 1-hexylamine, 1,2-diaminoethane. 57
Figure 17 UV/Vis absorption (left) and fluorescence (right) spectra of the amination products
from 1-aminohexane (41) (red) and 1,2-diaminoethane (42) (grey) in chloroform.
10-(phenylamino)anthracene dicarboximide (43) exhibited no fluorescence but
absorption (black) only. 58
Figure 18 UV/Vis absorption (left) and fluorescence (right) spectra of amines 44 (red), 45
(grey) and 46 (black) in chloroform. The yellow spectrum displays the unstable -
adduct with pyrrolidine. 59
Figure 19 UV/Vis-absorption (red) and fluorescence (grey) spectra of amine 47 in
chloroform. 60
Figure 20 UV/Vis absorption (red) and fluorescence (grey) spectra of 48 in chloroform. 64
Figure 21 UV/Vis (left) and fluorescence (right) spectra of trans-aceanthrene green 49a
(red), cis-aceanthrene green 49b (grey) and dihydrophenazine 52 (balck) in
chloroform.
68

Preface
V
Figure 22 UV/Vis absorption spectra of 1 in chloroform with increasing dilution. Insert:
Verification of Lambert-Beer’s law by the linear correlation of the absorptivity E as
a function of the concentration c; circles: 527 nm, slope 0.810 x 10⁵ L mol-1,
standard deviation 0.0049 , correlation number 0.99995, coefficient of
determination 0.9999, 7 measurements) and diamonds: 490 nm (slope
0.504 x 10⁵ L mol-1, standard deviation 0.0044, correlation number 0.99988,
coefficient of determination 0.9998, 7 measurements). 71
Figure 23 Fluorescence spectra of 1 in chloroform with optical excitation at 490 nm and
increasing dilution. Insert: Linear correlation of the intensity of fluorescence as a
function of the concentration of 1; diamonds: Slit for excitation 2.5 nm (slope
3.38 x 10⁸ L mol-1, standard deviation 3.1, correlation number 0.9995, coefficient
of determination 0.9991, 11 measurements) and steep line, circles: Slit for
excitation 10 nm (slope 4.11 x 10⁹ L mol-1, standard deviation 0.33, correlation
number 0.999998, coefficient of determination 0.999997, 8 measurements). 72
Figure 24 Concentration dependency of of the fluorescence lifetime of fluorophores 1 (red),
53 (blue), 54 (green) and 55 (violet). 74
Figure 25 Dependence of the fluorescence lifetime of 1 in chloroform on the concentration
c (circles; see Table 1). Insert: Linear correlation according to equation (8)
(ED = 1.17 ns, c* = 1.17·10-5 mol L-1 and o = 3.77 ns), (standard deviation 0.015,
correlation number 0.9992, coefficient of determination 0.9984, 11
measurements). 76
Figure 26 Optical properties of nile blue (53) in ethanol. a) Concentration dependent
fluorescence lifetime. b) Dilution series of 53 in ethanol. c) Linear correlation
between concentration and absorptivity in agreement with Lambert-Beer’s law. 77
Figure 27 Dependency of the fluorescence lifetime of S-13 (1) doped PMMA nanoperticles
on the concentration (represented by attenuation E). Applied nanoparticles
(rounded average values): 25 ppm 1, 200 nm (black); 25 ppm 1, 300 nm (red);
100 ppm 1, 200 nm (grey); 300 ppm 1, 200 nm (yellow); 300 ppm 1, 300 nm (blue). 78
Figure 28 Fluorescence spectra of the auto fluorescence of Luran® (blue, dotted curve),
Delrin® (red, dashed curve) and Ultramid® (black, solid curve) with optical
excitation at 365 nm. 83
Figure 29 Fluorescence decay of polymers (excitation: 356 nm, detection: 460 nm) in linear
(left) and logarithmic scales (right). Mono-exponentially fitted functions of decay
as solid lines (mainly covered by actual measurement points). Fluorescence decay
of Luran® (red), Delrin® (grey) and Ultramid® (black). 85
Figure 30 Time-resolved fluorescence spectra of selected polymers: HDPE ( red), Delrin®
(black), PC (yellow), PET (blue), PMMA (green) and Tectosil® (violet) Light curves
represent the time slots from 2 ns to 3 ns, solid curves those from 4 ns to 100 ns. 86
Figure 31 Fluorescence lifetimes in ns of technical polymers. Reproducibility is given within
±1%.
Figure 32 For determination of 1 and 2 the decay was split in two branches, one
representing the short relaxation processes from tmax to tmax+3 (black). IRF (grey
line) and non-relevant measuring points (light grey) are given for completion.
89
91

Preface
VI
Figure 33 Two-dimensional characterization of polymers by means of their constants 1 and
2 attained by bi-exponential evaluation of the fluorescence decay. Filled circles:
polyethylenes LDPE, HDPE and UHDPE; squares: PET; diamonds: Silicones;
triangles: silicone elastomer Tectosil®. 92
Figure 34 Fluorescence lifetimes of pre-treated PET; expanded range. 93
Figure 35 Two-dimensional characterization of PET with various pre-treatment by means of
their constants 1 and 2 after bi-exponential evaluation of the fluorescence decay. 93
Figure 36 Fluorescence spectra of highly disperse silica excited at 405 nm. Colors indicate
the applied dispersant: Neat film (red), water (grey), methanol (yellow), DMF
(blue), toluene (green), hexane (violet). The top respective curve is for Cab-o-sil©
from Merck (Acros), the accompanying bottom curve for HDK© H 15 from Wacker.
The bottom black curve represents the spectrum of Ludox© from sigma aldrich, a
highly pure aqueous silica standard for optical scattering. 95
Figure 37 Fluorescence spectra of cerium(IV)sulfate in aqueous solution at different
concentrations. Lighter colors represent lower concentration. The excitation
wavelength was set to 405 nm. 96
Figure 38 Correlation of relative fluorescence intensities and concentration of aqueous
solutions of cerium(IV)sulfate. Very high concentrations completely quench
fluorescence (grey). At lower concentrations (red) the relative intensity of the
fluorescence band at 460 nm increases. 97
Figure 39 UV/Vis-Spectra in chloroform (for 59a) or C2H2Cl4 (for 59b-c). Blue 59a (n = 4), red
59b (n = 6), green 59c (n = 8). Left absorption spectra with scale Erel., right
fluorescence spectra with scale I. 103
Figure 40 UV/Vis-Spectra in chloroform. Blue 57b (n = 2), red 57c (n = 3), green 57d (n = 4).
Left absorption spectra with scale Erel., right fluorescence spectra with scale I. 105
Figure 41 Schematic process causing the increased Stokes’ shifts. i) Vertical transition by
light absorption (h) from the electronic ground state S0 (top left) to reach the
electronically excited state S1. ii) Relaxation to a geometrically more favorable,
energetically lower excited state S1’. iii) Bathochromically shifted fluorescence (-
h’) from S1’ to So’. iv) Relaxation to the energetically more favored initial state
from So’ to So. 106
Figure 42 UV/Vis-Spectrum (blue), fluorescence excitation spectrum (red) and fluorescence spectrum (green) of 57d in solid PMMA. Absorption spectrum with scale Erel., Fluorescence spectra with scale I. 107
Figure 43 Comparison of optical spectra of 57d. a) Absorption (grey), fluorescence excitation
(red) and fluorescence (black) spectra in chloroform; b) Fluorescence lifetime in
chloroform. Excitation pulse (grey), decay (red) and mono-exponential
deconvolution fit (black). Insert: Logarithmic decay; c) Fluorescence excitation
(red) and fluorescence (black) spectra in PMMA; b) Fluorescence lifetime in
PMMA. Excitation pulse (grey), decay (red) and mono-exponential deconvolution
fit (black). Insert: Logarithmic decay. 108
Figure 44 Left: Absorption (right) and fluorescence (left) spectra of 61a (black), 61d (red) and
61e (grey) in chloroform;Right: Fluorescence lifetime of 61d in chloroform. IRF
(grey), fluorescence decay (red), deconvolutional fit (black). Insert: Exponential fit
of 61d resulting in a fluorescence lifetime of 0.403 ns. 112

Preface
VII
Figure 45 Quantumchemical calculations of 61d (B3LYP 6-311**G and CAM-B3LYP 6-
311**G). Left: Planar structure of the electronic ground state (bottom) and the
electronically excited state (top) in either of the applied methods. Right:
Calculated HOMO and LUMO of 61d. 113
Figure 46 Crystal structure of terthiophenediyl bisketone 61d. The thiophene units are
twisted to each other with dihydral angles of about 10°. 113
Figure 47 Left: Absorption (in chloroform, grey), fluorescence excitation (in PMMA, black)
and fluorescence (in PMMA, red) spectra of 61d; Right: Fluorescence lifetime of
61d in PMMA fiber. IRF (grey), fluorescence decay (red), deconvolutional fit
(black). Insert: Exponential fit of 61d in PMMA resulting in a fluorescence lifetime
of 0.388 ns. 114
Figure 48 PMMA fluorescent optical fiber (FOF) with 35 ppm of 61d. 115

Preface
VIII
III List of Schemes
Scheme 1 Alkaline hydrolysis of perylene diimide 1. The resulting N,N’-bis(tridecan-7-
yl)perylene-3,4-dicarboimide-9,10-dicarboxylic anhyride (2) can be condensed
with various functional amines. 10
Scheme 2 Orthogonally fixed perylene diimide – benzoperylene triimide dichromophor 3
(left). The chromophores are linked via an aromatic 2,3,5,6-
tetramethylpenylene moiety. Below the linearly N-N-linked perylene diimide –
perylen diimide dichromophore 4 consisting of the same subunit. 11
Scheme 3 General preparation procedure for N-N’-linked perylene diimide based di- and
trichromophores according to the literature. [32] 17
Scheme 4 Preparation of 2,3,5,6-tetramethylbenzene-linked perylene diimide di- and
trichromophores 9 and 13. 19
Scheme 5 Investigated reaction pathways to obtain 1,2,4,5-tetrapentylbenzene (20). 24
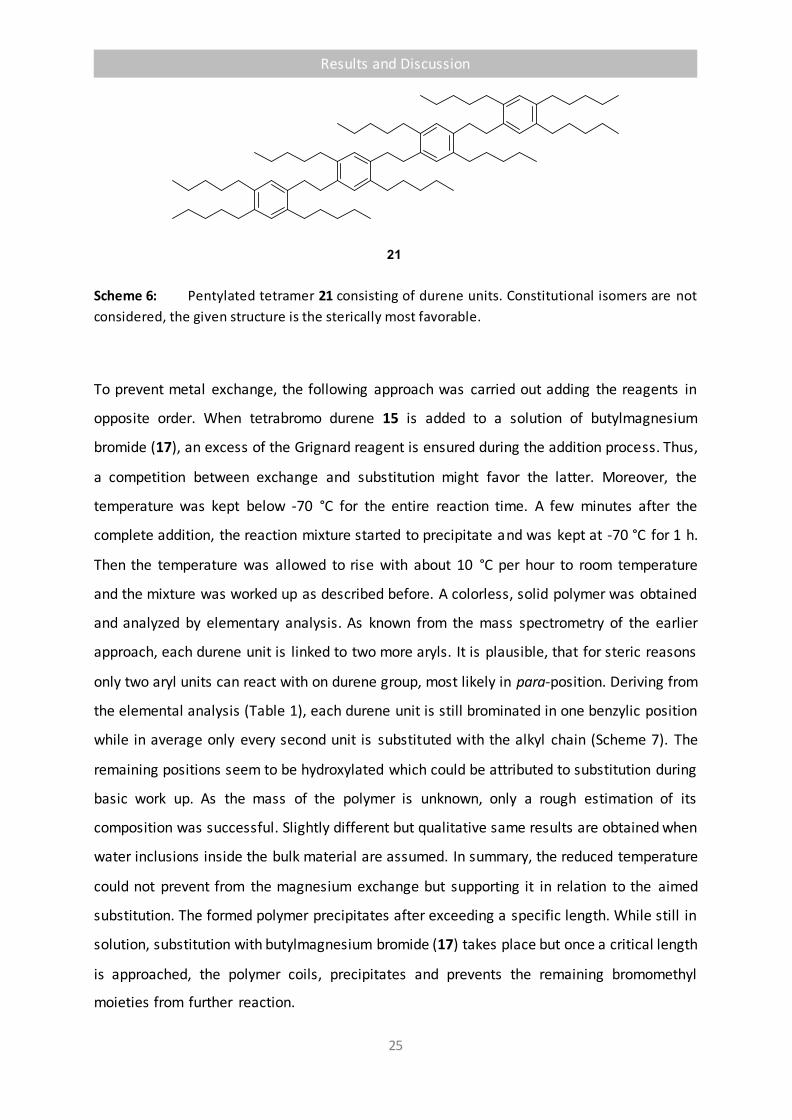
Scheme 6 Pentylated tetramer 21 consisting of durene units. Constitutional isomers are
not considered, the given structure is the sterically most favorable. 25
Scheme 7 Representative schematic section of the discussed polymer from the Grignard
reaction of 15 and 17. 26
Scheme 8 Synthesis of arylated naphthalene carboximides 23-30. a) 4-
(Trimethylsilyl)phenylboronic acid and 4-cyanophenylboronic acid was used for
29 and 30, respectively. 31
Scheme 9 Bromination of 26 and subsequent cross-coupling with MeZnCl gives 32 (top);
cyanation and Negishi cross-coupling of 33 leads to 34. 30 was alternatively
obtained via Pd-catalyzed cyanation (bottom). 32
Scheme 10 4-Amino-N-methylphthalimide (35) and 4-methoxy-N-methylnaphthalimide
(36) as reference for fluorescence data comparison. 37
Scheme 11 Two possible mesomeric resonance structures indicate the electrophilicity of
antracene-1,9-dicarboximide in C-10 position. 52
Scheme 12 Synthesis of N-(tridecan-7-yl)anthracene dicarboximide (40) starting from
anthracene (37) in 3 steps.[55] 52
Scheme 13 Proposed reaction mechanism for the formation of amine 47. 60
Scheme 14 Proposed Chichibabin-like reaction mechanism of amines with N-(tridecan-7-
yl)anthracene imide. Two possible reactions either form the product ( red) or
lead to the collapse of the -adduct to recover starting material (yellow). 61
Scheme 15 Isolated products of the reaction of anthracene dicarboximid with the
corresponding amines (appr. No. for reference in Table 11). 63
Scheme 16 Reaction of KOH or KOtBu with anthracen dicarboximide to 10-
hydroxyanthracen dicarboximide 48. 64
Scheme 17 Synthesis of N,N’-aceanthrene green tetracarboxylic diimide 49. 66
Scheme 18 Structure of 5,13-bis(tridecan-7-yl)-8,16-dihydrodiisoquinolino[5,4-ab:5',4'-
hi]phenazine-4,6,12,14(5H,13H)-tetraone (52). 67
Scheme 19 Chemical structures of the applied fluorophores 53-55. 73
Preface
IX
Scheme 20 Determination of a time-resolved emission spectrum with custom time slots.
The range from TimeGate1First to TimeGate1Last was set up for control of the
short fluorescent components. The second time range in red considers all
components with lifetimes of the excited state of more than 4 ns. The top limit
of 100 ns is set to a value where all molecules are estimated to have already
relaxed. 87
Scheme 21 Preperation of 1-adamantyl substituted oligothiophenes 57a-c (n = 1-3) via
Negishi cross coupling reactions. Further bromination with NBS leads to the
readily soluble 5-bromo oligothiophenes 58a-c. 101
Scheme 22 Preparation of higher homologues (n = 4,6,8) of (1-adamantyl)oligothiophene.
The well soluble mono-alkylated quaterthiophene 57d was obtained via a
Negishi cross-coupling reaction of 2-thienylzinc chloride with 5’’-(1-adamantyl)-
5-bromoterthiophene (58c). Treatment of mono-(1-
adamantyl)oligothiophenes (n = 2-4) with FeCl3 leads to the respective mirror
symmetrical coupling products 59a-c. 102
Scheme 23 Synthesis of ([2,2’:5’,2’’-terthiophene]-5,5’’-diyl)bisketones 61a-e under two
different conditions. 110
Scheme 24 Synthesis of bi- and terthienylheptafluorobutanone 62a-b. 110

Preface
X
IV List of Tables
Table 1 Elementary analysis of the polymer forming at low temperatures. The indicated
hydroxyl group can also be interpreted as non-covalent aqueous inclusion. 26
Table 2 Fluorescence quantum yields and lifetimes of naphthalimides 23-30 and 34. 34
Table 3 Absorption and fluorescence maxima of naphthalimides 23-30 and 34. 35
Table 4 FWHM*-values of absorption and fluorescence spectra of naphthalimides 23-
30 and 34 in nm. 36
Table 5 FWHM*-values of absorption and fluorescence spectra of naphthalimides 23-
30 and 34 in eV. 36
Table 6 Solvatochromism of the fluorescence of the dicarboxylic imides 23-30, 32 and
34-36. 39
Table 7 Quantumchemical calculations of 23-30, 32 and 34. 42
Table 8 Comparision of quantum chemically calculated optical values with
experimental results. 44
Table 9 Slopes m1 and m2. 45
Table 10 Calculated parameters XYZ0, s, d, a and b by means of least square fits of the
experimental ET values of fluorescence according to equation (12). Solvents: 1-
Butanol, N,N-dimethylformamide, chloroform, toluene, n-hexane. 47
Table 11 Optimized parameters A0, b, c, d and e of equation (13) by means of least square
fitting of the experimental ET-values of the fluorescence of 3 in the solvents 1-
butanol, 1-undecanol, N,N-dimethylformamide, chloroform, toluene, n-
hexane, n-tetradecane (N,N-dimethylformamide was excluded for 3c because
of lack of fluorescence). 48
Table 12 Overview on the applied amines and the most appropriate reaction conditions
used for the conversion with N-(tridecan-7-yl)anthracene dicarboximide 40. 55
Table 13 Optical data of isolated amino compounds 41 – 47. 62
Table 14 Fluorescence lifetimes of 1 in chloroform depending on the concentration c
and the calculated average molecular distance d, respectively. Fluorescence
excitation at 490 nm and detection at 535 nm. 75
Table 15 Fluorescence lifetimes of 53 in ethanol depending on the concentration c.
Fluorescence excitation at 628 nm and detection at 667 nm. 77
Table 16 Fluorescence lifetimes of the studied polymers Luran®, Delrin® and Ultramid®. 84
Table 17 Time constants for the auto-fluorescence decay of technical polymers. 90
Table 18 Fluorescence lifetimes of different silica dispersions. 98
Table 19 Optical properties of (1-adamantyl)oligothiophenes. 104
Table 20 Ketoterthiophenes 61 and 62. Spectroscopic measurements in chloroform. 111
Preface
XI
V List of Equations
Equation (1) 𝛷 = 𝑘𝑟
𝑘𝑟 + 𝑘𝑛 5
Equation (2) 𝐼(𝑡) = 𝐼0 𝑒−𝑡𝜏 6
Equation (3) 𝜏 = 1
𝑘𝑟 + 𝑘𝑛 6
Equation (4) 𝜏𝑛 =1
𝑘𝑟 6
Equation (5) 𝑘𝑟 =1
𝜏𝑛≅ 2.88 𝑠−1 x 10⁻⁹𝑛2
∫ 𝐼(𝜎)𝑑𝜎
∫ 𝐼(𝜎)𝜎−3𝑑𝜎∫
휀(𝜎)
𝜎𝑑𝜎 7
Equation (6) 𝛷 =𝜏
𝜏𝑛 7
Equation (7) 𝐸T =28591 𝑘𝑐𝑎𝑙 𝑛𝑚 𝑚𝑜𝑙−1
𝜆𝑚𝑎𝑥 37
Equation (8) 𝐸T = 𝑎 𝐸T(30) + 𝑏 37
Equation (9) 𝑓BK =2𝑛2 + 1
𝑛2 + 2(
휀 − 1
휀 + 2−
𝑛2 − 1
𝑛2 + 2) 45
Equation (10) 𝑔BK =3
2
𝑛4 − 1
(𝑛2 + 2)2 45
Equation (11) 𝜇e
𝜇g=
|𝑚1| + |𝑚2|
|𝑚2| − |𝑚1| 46
Equation (12) 𝐸T = 𝑋𝑌𝑍 = 𝑋𝑌𝑍0 + 𝑠(𝜋∗ + 𝑑𝛿) + 𝑎𝛼 + 𝑏𝛽 47
Equation (13) 𝐸T = 𝐴 = 𝐴0 + 𝑏SA + 𝑐SB + 𝑑SP + 𝑒SdP 47
Equation (14) 𝑟 =𝐼‖ − 𝐺 𝐼Ʇ
𝐼‖ + 2 𝐺 𝐼Ʇ 48
Equation (15) 𝐸 = 𝑙𝑜𝑔𝐼0
𝐼= 휀 𝑐 𝑑 71
Equation (16) 𝜏 = 𝐸𝐷 ln(𝑐
𝑐∗ + 1) + 𝜏0 76

Preface
XII
VI List of Compounds
All chemical compounds discussed in this work are listed below named according to IUPAC standards
with support of the chemical software ChemDraw 13©. Within the main text, trivial names published
in literature are used referring to the core chromophore for more clarity.
1 2,9-Di(tridecan-7-yl)anthra[2,1,9-def:6,5,10-d'e'f']diisoquinoline-1,3,8,10(2H,9H)-tetraone
2 9-(Tridecan-7-yl)-1H-isochromeno[6',5',4':10,5,6]anthra[2,1,9-def]isoquinoline-1,3,8,10(9H)-
tetraone
3 N2,N3-Bis(tridec-7-yl)-N1-[N-(tridec-7-yl)-N′-(2,3,5,6-tetramethylphenyl-4-yl)perylene-
3,4:9,10-tetracarboxylic bisimide]benzo[ghi]perylene-2,3:8,9:11,12-hexacarboxylic trisimide
4 9,9'-Di(tridecan-7-yl)-1H,1'H-[2,2'-bisanthra[2,1,9-def:6,5,10-d'e'f']diisoquinolin]-
1,1',3,3',8,8',10,10'(9H,9'H)-octaone
5 Anthra[2,1,9-def:6,5,10-d'e'f']diisochromene-1,3,8,10-tetraone
6 2-Amino-9-(tridecan-7-yl)anthra[2,1,9-def:6,5,10-d'e'f']diisoquinoline-1,3,8,10(2H,9H)-
tetraone
7 9-Amino-9'-(tridecan-7-yl)-1H,1'H-[2,2'-bianthra[2,1,9-def:6,5,10-d'e'f']diisoquinolin]-
1,1',3,3',8,8',10,10'(9H,9'H)-octaone
8 9,9''-Di(tridecan-7-yl)-1H,1''H-[2,2':9',2''-teranthra[2,1,9-def:6,5,10-d'e'f']diisoquinoline]-
1,1',1'',3,3',3'',8,8',8'',10,10',10''(9H,9''H)-dodecaone
9 9,9'-(2,3,5,6-Tetramethyl-1,4-phenylene)bis(2-(nonadecan-10-yl)anthra[2,1,9-def:6,5,10-
d'e'f']diisoquinoline-1,3,8,10(2H,9H)-tetraone)
10 2,3,5,6-Tetramethylbenzene-1,4-diamine
11a 9-(Tridecan-7-yl)-1H-isochromeno[6',5',4':10,5,6]anthra[2,1,9-def]isoquinoline-1,3,8,10(9H)-
tetraone
11b 9-(Nonadecan-10-yl)-1H-isochromeno[6',5',4':10,5,6]anthra[2,1,9-def]isoquinoline-
1,3,8,10(9H)-tetraone
12 2,9-bis(4-amino-2,3,5,6-tetramethylphenyl)anthra[2,1,9-def:6,5,10-d'e'f']diisoquinoline-
1,3,8,10(2H,9H)-tetraone
13 9,9'-((1,3,8,10-tetraoxo-1,3,8,10-tetrahydroanthra[2,1,9-def:6,5,10-d'e'f']diisoquinoline-2,9-
diyl)bis(2,3,5,6-tetramethyl-4,1-phenylene))bis(2-(tridecan-7-yl)anthra[2,1,9-def:6,5,10-
d'e'f']diisoquinoline-1,3,8,10(2H,9H)-tetraone)
14 1,2,4,5-Tetramethylbenzene
15 1,2,4,5-Tetrakis(bromomethyl)benzene

Preface
XIII
16 1,2,4,5-Tetrakis(methylenmagnesium bromide)benzene
17 Butylmagnesiumbromide
18 Benzene-1,2,4,5-tetracarbonitrile
19 1,1',1'',1'''-(Benzene-1,2,4,5-tetrayl)tetrakis(pentan-1-one)
20 1,2,4,5-Tetrapentylbenzene
21 1,2-Bis(2,5-dipentyl-4-(2,4,5-tripentylphenethyl)phenyl)ethane
22 6-Bromo-2-(tridecan-7-yl)-1H-benzo[de]isoquinoline-1,3(2H)-dione
23 6-Phenyl-2-(tridecan-7-yl)-1H-benzo[de]isoquinoline-1,3(2H)-dione
24 6-(4-Methoxyphenyl)-2-(tridecan-7-yl)-1H-benzo[de]isoquinoline-1,3(2H)-dione
25 6-(4-(Dimethylamino)phenyl)-2-(tridecan-7-yl)-1H-benzo[de]isoquinoline-1,3(2H)-dione
26 2-(Tridecan-7-yl)-6-(3,4,5-trimethoxyphenyl)-1H-benzo[de]isoquinoline-1,3(2H)-dione
27 6-(4-Methoxynaphthalen-1-yl)-2-(tridecan-7-yl)-1H-benzo[de]isoquinoline-1,3(2H)-dione
28 6-(4-Methoxy-8-methylnaphthalen-1-yl)-2-(tridecan-7-yl)-1H-benzo[de]isoquinoline-1,3(2H)-
dione
29 2-(Tridecan-7-yl)-6-(4-(trimethylsilyl)phenyl)-1H-benzo[de]isoquinoline-1,3(2H)-dione
30 4-(1,3-Dioxo-2-(tridecan-7-yl)-2,3-dihydro-1H-benzo[de]isoquinolin-6-yl)benzonitrile
31 6-(2,6-Dibromo-3,4,5-trimethoxyphenyl)-2-(tridecan-7-yl)-1H-benzo[de]isoquinoline-1,3(2H)-
dione
32 2-(Tridecan-7-yl)-6-(3,4,5-trimethoxy-2,6-dimethylphenyl)-1H-benzo[de]isoquinoline-1,3(2H)-
dione
33 6-(4-Iodophenyl)-2-(tridecan-7-yl)-1H-benzo[de]isoquinoline-1,3(2H)-dione
34 6-(4'-Methoxy-[1,1'-biphenyl]-4-yl)-2-(tridecan-7-yl)-1H-benzo[de]isoquinoline-1,3(2H)-dione
35 5-Amino-2-methylisoindoline-1,3-dione
36 6-Methoxy-2-methyl-1H-benzo[de]isoquinoline-1,3(2H)-dione
37 Anthracene
38 Aceanthrylene-1,2-dione
39 1H,3H-Dibenzo[de,h]isochromene-1,3-dione
40 2-(Tridecan-7-yl)-1H-dibenzo[de,h]isoquinoline-1,3(2H)-dione
41 7-(Hexylamino)-2-(tridecan-7-yl)-1H-dibenzo[de,h]isoquinoline-1,3(2H)-dione
42 7-((2-Aminoethyl)amino)-2-(tridecan-7-yl)-1H-dibenzo[de,h]isoquinoline-1,3(2H)-dione
43 7-(Phenylamino)-2-(tridecan-7-yl)-1H-dibenzo[de,h]isoquinoline-1,3(2H)-dione
Preface
XIV
44 7-(Methyl(2-(methylamino)ethyl)amino)-2-(tridecan-7-yl)-1H-dibenzo[de,h]isoquinoline-
1,3(2H)-dione
45 7-(Piperidin-1-yl)-2-(tridecan-7-yl)-1H-dibenzo[de,h]isoquinoline-1,3(2H)-dione
46 7-(1H-Indol-1-yl)-2-(tridecan-7-yl)-1H-dibenzo[de,h]isoquinoline-1,3(2H)-dione
47 7-(3,4,6,7-Tetrahydropyrrolo[1,2-a]pyrimidin-1(2H)-yl)-2-(tridecan-7-yl)-1H-
dibenzo[de,h]isoquinoline-1,3(2H)-dione
48 7-Hydroxy-2-(tridecan-7-yl)-1H-dibenzo[de,h]isoquinoline-1,3(2H)-dione
49a 2,9-Di(tridecan-7-yl)tetrapheno[8,9-ab]benzo[5,6,7-def:10,11,12-d'e'f']diisoquinoline-
1,3,8,10(2H,9H)-tetraone
49b 2,9-di(Tridecan-7-yl)tetrapheno[5,6,7-def]isoquinoline[10,11,12-d'e'f']([7,8-
a,b]benzoisoquinoline-1,3,8,10(2H,9H)-tetraone
50 2-(Tridecan-7-yl)-1H-benzo[de]isoquinoline-1,3(2H)-dione
51 5-Amino-2-(tridecan-7-yl)-1H-benzo[de]isoquinoline-1,3(2H)-dione
52 5,13-Di(tridecan-7-yl)-8,16-dihydrodiisoquinolino[5,4-ab:5',4'-hi]phenazine-
4,6,12,14(5H,13H)-tetraone
53 Bis(9-(diethylamino)-5H-benzo[a]phenoxazin-5-iminium) sulfate
54 Disodium 2-(6-oxido-3-oxo-3H-xanthen-9-yl)benzoate
55 N-(9-(2-Carboxyphenyl)-6-(diethylamino)-3H-xanthen-3-ylidene)-N-ethylethanaminium
chloride
56a 2-Bromothiophene
56b 5-Bromo-2,2'-bithiophene
56c 5-Bromo-2,2':5',2''-terthiophene
57a 2-(Adamantan-1-yl)thiophene
57b 5-(Adamantan-1-yl)-2,2’-dithiophene
57c 5-(Adamantan-1-yl)-2,2':5',2''-terthiophene
57d 5(Adamantan-1-yl)-2,2’:5’,2’’:5’’,2’’’-quaterthiophene
58a 2-(Adamantan-1-yl)-5-bromothiophene
58b 5-(Adamantan-1-yl)-5’-bromo-2,2’-dithiophene
58c 5-(Adamantan-1-yl)-5''-bromo-2,2':5',2''-terthiophene
59a 5,5'''-Di(adamantan-1-yl)-2,2':5',2'':5'',2'''-quaterthiophene
59b 5,5'''''-Di(adamantan-1-yl)-2,2':5',2'':5'',2''':5''',2'''':5'''',2'''''-sexithiophene
59c 5,5’’’’’’’-Di(adamantan-1-yl)-2,2’:5’,2’’:5’’,2’’’:5’’’,2’’’’:5’’’’,2’’’’’:5’’’’’,2’’’’’’:5’’’’’’,2’’’’ ’’’-
octithiophene
Preface
XV
60 2,2':5',2''-terthiophene
61a 1,1'-([2,2':5',2''-terthiophene]-5,5''-diyl)bis(propan-1-one)
61b 1,1'-([2,2':5',2''-terthiophene]-5,5''-diyl)bis(butan-1-one)
61c 1,1'-([2,2':5',2''-terthiophene]-5,5''-diyl)bis(pentan-1-one)
61d 1,1'-([2,2':5',2''-terthiophene]-5,5''-diyl)bis(2,2-dimethylpropan-1-one)
61e [2,2':5',2''-terthiophene]-5,5''-diylbis(phenylmethanone)
62a 1-([2,2'-bithiophen]-5-yl)-2,2,3,3,4,4,4-heptafluorobutan-1-one
62b 1-([2,2':5',2''-terthiophen]-5-yl)-2,2,3,3,4,4,4-heptafluorobutan-1-one

Preface
XVI

General and Theoretical Section
1
1 General and Theoretical Section
Everybody gets so much information
all day long that they lose their common sense.
– Gertrude Stein
Our modern information and communication society relies more and more on constantly
increasing data volumes.[1] No matter whether in public or private networks, in the automotive
or industrial section – the demand for higher data flow increases.[2] Whereas ten to twenty
years ago local storage space was a main concern, nowadays most data are located
decentralized and data processing is dominated by cloud computing.[3] The interaction
between the separated devices requires very high Bit rates to ensure real-time
communication. Thus, the demand for high-speed data transmission promotes the
development of optoelectronic solutions based on the interaction of mater with light, due to
the high frequency of light. For these devices themselves applications such as for organic
semiconductors, i.e. organic light-emitting diods (OLED),[4] are still at the research stage[5]
whereas the connection between the computing units are widely spread realized through
optical fiber technology. In the field of telecommunication glass fibers already represent a
significant percentage of the network in OECD countries.[6] For home applications, polymer
optical fibers[7] are of increasing interest.[8] The high mechanical flexibility and very low
production costs propose polymer optical fibers to short-range data transmission and sensor
technology.[9]
Besides those advantages, polymer host materials can be doped with primarily organic
fluorescent dyes to create fibers with enhanced optical properties. Those fluorescent optical
fibers are widely disseminated as ion sensors,[10] or wavelength shifter.[11] Furthermore,
fluorescent optical fibers display one characteristic difference to undoped light guides: The
light as the information carrier does not need to be launched from the terminal closing edge
such as in glass fibers but can be injected from all directions and then be absorbed. The
penetrating light excites the fluorescence dyes which subsequently emit fluorescence
General and Theoretical Section
2
radiation isotropically in all directions. A significant share is now trapped inside the fiber due
to the laws of refraction. The operating principle corresponds to that of fluorescence solar
collectors[12] and enables contactless transmission of information in versatile, particularly
rotating, devices. Such optical slip rings have potential for implementation in the automotive
sector or medical technology such as computed tomography scanners.
The performance of optical slip rings is mainly equated with the data transmission rate. This
in turn is physically limited by the fluorescence properties of the applied dyes. Particularly the
fluorescence lifetime determines the data rates as the maximum pulse frequency is limited by
the fluorescence decay time of the fluorophore. Most fluorescent dyes exhibit fluorescence
lifetimes of about 5 ns.[13-14] As a consequence, a slip ring with 100 Mbit s-1 already could be
realized using many fluorescent dyes such as Nile Blue as the fluorophore. With sub-nano
second fluorescence lifetimes data rates of more than 1 GBit s-1 are feasible. The development
of such customized fluorescent dyes and for many more special applications requires a
profound understanding of both, the basic physical processes as well as the relation between
chemical structure and optical properties.
1.1 Fundamentals of Fluorescence
The emission of light from any substance is called luminescence. It occurs from electronically
excited states and can formally be divided in two categories; fluorescence and
phosphorescence, depending on the nature of the excited state. If the excited electron is
paired to the electron in the corresponding ground state orbital by opposed spin we observe
singlet states causing fluorescence. The return of the electron into the ground state is spin-
allowed and takes place rapidly by emission of a photon (Figure 1). Phosphorescence
conversely describes the light-emitting process from triplet states.[14-15]
Following light absorption, several processes may occur. A fluorophore is usually excited to
some higher vibrational level of 1E1. With a few rare exceptions, molecules rapidly relax to the
lowest vibrational level of 1E1. This process is called internal conversion and occurs within
10-12 s or less. Since fluorescence lifetimes are typically near 10–8 s, internal conversion is
generally complete prior to emission. Hence, fluorescence emission results from a thermally
equilibrated excited state, that is, the lowest energy vibrational state of 1E1. Return to the

General and Theoretical Section
3
electronic ground state typically occurs to a higher excited vibrational ground state level,
which then quickly (10–12 s) reaches thermal equilibrium (Figure 1). The fluorescence spectrum
is commonly a mirror image of the absorption spectrum of the 1E0 – 1E1 transition. This
similarity occurs because electronic excitation does not importantly alter the nuclear
geometry. Hence the spacing of the vibrational energy levels of the excited states is simi lar to
that of the ground state. As a result, the vibrational structures seen in the absorption and the
emission spectra are mirror-type very similar. Some molecules in the 1E1 state can also
undergo a spin conversion to the first triplet state 3E1. Emission from that state is termed
phosphorescence, and is generally shifted to longer wavelengths (lower energy difference)
relative to the fluorescence. The conversion of 1E1 to 3E1 is called intersystem crossing.
Transition from the triplet to the singlet ground state is spin-forbidden and as a result the rate
constants for triplet emission are several orders of magnitude smaller than those for
fluorescence resulting in longer excited lifetimes. Molecules containing heavy atoms such as
bromine and iodine are frequently phosphorescent. The heavy atoms facilitate intersystem
crossing and thus enhance phosphorescence quantum yields.[14]
Figure 1: Schematic Jablonski diagram. Caused by absorption of a photon an electron is
electronically excited into the singlet 1E1-state (blue). Usually an internal conversion from an elevated
vibronic state into the vibronic ground state takes place. Subsequently, the excited electron relaxes
(red) by emission of fluorescence light into an excited vibronic state of the electronic ground state 1E0.
Phosphorescence occurs after intersystem crossing of the excited electron into the triplet 3E1-state
under spin inversion. The spin-forbidden relaxation into the ground state (grey) causes the emission
of phosphorescence radiation.

General and Theoretical Section
4
A more quantum chemical view on vibronic (simultaneously electronic and vibrational)
transitions is represented by the Franck-Condon-Scheme(Figure 2). The respective electronic
states are represented by anharmonic oscillators visualizing the potential energy (ordinate) of
a chemical bond (or more complex approximations such as Morse potential) in relation to the
nuclear coordinates (abscissa). Vibrational states are represented by their respective wave
function. The principle presumes a significant difference between the time needed for
electronic transitions (about 10-15 s) and that required for changes in the nuclear coordinates
(approx. 10-12 s). Thus, the transition occurs vertically and the probability of a specific
transition depends on the electron probability density of the respective vibrational state.
Figure 2: Franck-Condon energy diagram. Schematic wave functions (red) are given for
anharmonic oscillators E0 (electronic ground state) and E1 (1st electronically excited state) representing
the energy potential of the chemical bond, respecticely. Absorption ( blue) and fluorescence (grey) take
place vertically.

General and Theoretical Section
5
The International Union of Pure and Applied Chemistry (IUPAC) defines: “Classically, the
Franck–Condon principle is the approximation that an electronic transition is most likely to
occur without changes in the positions of the nuclei in the molecular entity and its
environment. The resulting state is called a Franck-Condon state, and the transition involved,
a vertical transition. The quantum mechanical formulation of this principle is that the intensity
of a vibronic transition is proportional to the square of the overlap integral between the
vibrational wavefunctions of the two states that are involved in the transition.” [16]
The wavelength of the absorption depends on the energy difference between the ground
state 1E0 and the excited singlet state (generally the 1st, called 1E1). A relation between that
difference and the chemical structure is given by König and Ismailsky for the majority of
dyes.[17] According to Figures 1 and 2, fluorescence occurs slightly shifted to longer
wavelengths. This observation was first described by Stokes in 1852[18] and is now called
Stokes’ shift. Usually it describes the difference between the global maxima of absorption and
fluorescence and is given in nm (non-linear scale) or eV (linear scale).
There are two further important characteristics besides the wavelength of fluorescence
spectra, the fluorescence quantum yield and the fluorescence lifetime . The first indicates
the quotient of the number of emitted photons divided by the number of absorbed photons,
see equation (1). Substances with high quantum yields close to unity, such as rhodamines or
perylendiimides, display colors under common scattered daylight dominanted by their
fluorescence. The rate constants kr (radiative) and kn (non-radiative) both depopulate the
excited state. A fluorescence quantum yield according to equation (1) can be close to = 1.00,
in this case the non-radiative constant is negligible and all absorbed photons are re-emitted
as fluorescence radiation.
𝛷 =
𝑘𝑟
𝑘𝑟 + 𝑘𝑛
(1)
The lifetime of the excited state is defined by the time a molecule spends in the excited state
prior to return to the ground state. The fluorescence decay is an exponential function of the
number of relaxing photons versus time t. For single exponential behavior the fluorescence

General and Theoretical Section
6
lifetime is described by equation (2). The number of electrons relaxing by fluorescence in a
specific time interval equals the intensity I of the emitted light. In a variant form of
presentation as in equation (3) the fluorescence lifetime can be expressed reciprocal to the
sum of kr and kn.
𝐼(𝑡) = 𝐼0 𝑒
−𝑡𝜏
(2)
𝜏 =
1
𝑘𝑟 + 𝑘𝑛
(3)
The fluorescence lifetime of a dye in theoretical absence of non-radiative processes is called
intrinsic or natural lifetime n and is given in equation (4). Analogously to equation (3), the
natural lifetime equals the reciprocal radiative rate constant kr.
𝜏𝑛 =
1
𝑘𝑟
(4)
Theoretically, the natural lifetime can be calculated from the absorption spectrum, molar
attenuation coefficient (also called molar extinction coefficient) and emission spectrum of a
fluorescent compound. According to Strickler and Berg,[19] the radiative decay kr can be
determined using equation (5). The integrals refer to those below the spectra plotted on the
wavenumber (cm-1) scale, I() is the fluorescence spectrum whereas () describes the
absorption spectrum of the 1E0 to 1E1 transition. The refractive index of the solvent is
represented by n. When roughly neglecting the shape of the spectra, the integral of the
absorption spectrum is represented by the molar attenuation coefficient . Thus, the
qualitative predication of this equation is the reciprocal correlation between the fluorescence
lifetime t and the molar absorptivity . Furthermore, the fluorescence lifetime
proportionally depends on the ratio of these spectra given by the fluorescence quantum yield
. This interrelation is expressed in equation (6).
General and Theoretical Section
7
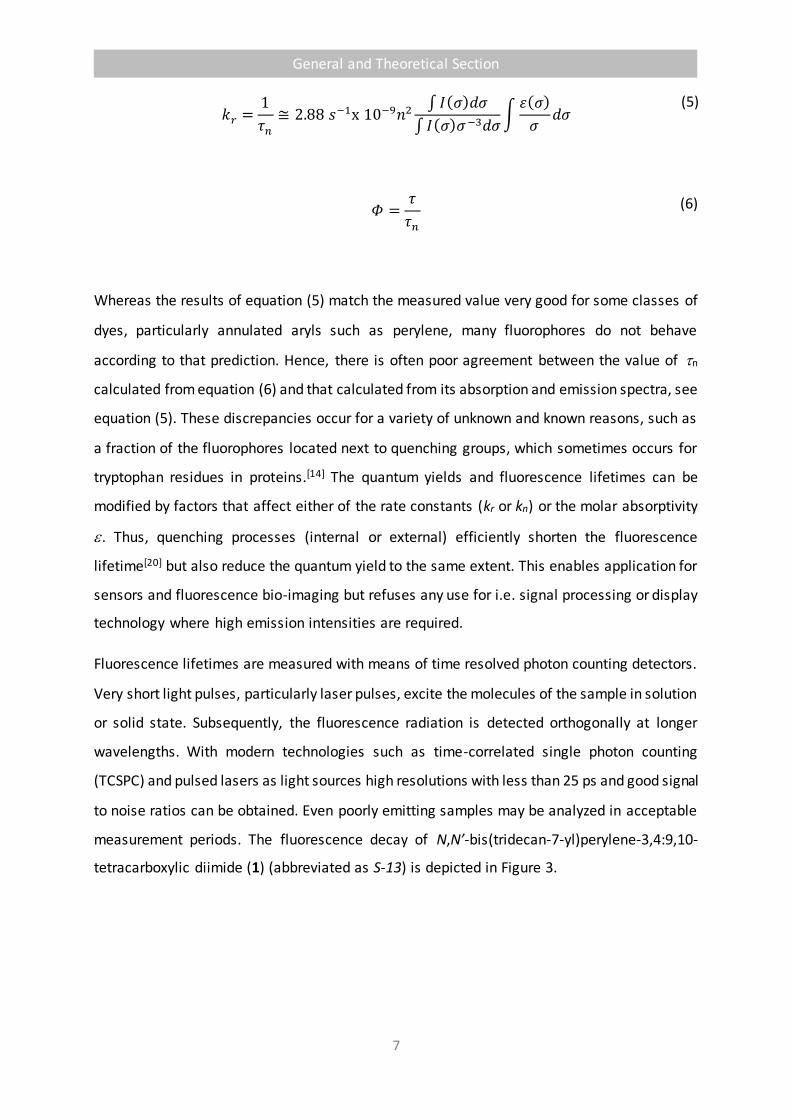
𝑘𝑟 =
1
𝜏𝑛
≅ 2.88 𝑠−1x 10⁻⁹𝑛2 ∫ 𝐼(𝜎)𝑑𝜎
∫ 𝐼(𝜎)𝜎 −3𝑑𝜎∫
휀(𝜎)
𝜎𝑑𝜎
(5)
𝛷 =𝜏
𝜏𝑛
(6)
Whereas the results of equation (5) match the measured value very good for some classes of
dyes, particularly annulated aryls such as perylene, many fluorophores do not behave
according to that prediction. Hence, there is often poor agreement between the value of n
calculated from equation (6) and that calculated from its absorption and emission spectra, see
equation (5). These discrepancies occur for a variety of unknown and known reasons, such as
a fraction of the fluorophores located next to quenching groups, which sometimes occurs for
tryptophan residues in proteins.[14] The quantum yields and fluorescence lifetimes can be
modified by factors that affect either of the rate constants (kr or kn) or the molar absorptivity
. Thus, quenching processes (internal or external) efficiently shorten the fluorescence
lifetime[20] but also reduce the quantum yield to the same extent. This enables application for
sensors and fluorescence bio-imaging but refuses any use for i.e. signal processing or display
technology where high emission intensities are required.
Fluorescence lifetimes are measured with means of time resolved photon counting detectors.
Very short light pulses, particularly laser pulses, excite the molecules of the sample in solution
or solid state. Subsequently, the fluorescence radiation is detected orthogonally at longer
wavelengths. With modern technologies such as time-correlated single photon counting
(TCSPC) and pulsed lasers as light sources high resolutions with less than 25 ps and good signal
to noise ratios can be obtained. Even poorly emitting samples may be analyzed in acceptable
measurement periods. The fluorescence decay of N,N’-bis(tridecan-7-yl)perylene-3,4:9,10-
tetracarboxylic diimide (1) (abbreviated as S-13) is depicted in Figure 3.

General and Theoretical Section
8
Figure 3: Fluorescence decay of N,N’-bis(tridecan-7-yl)perylene-3,4:9,10-tetracarboxylic
diimide (1) in chloroform. Logarithmic scaled exitation puls (grey), fluorescence decay (red) and
monoexponential fit (black, mainly covered by decay). Insert: Normalized monoexponential fit and
resulting fluorescence lifetime of 3.92 ns.
0 20 40 60
I/ a
.u.
t / ns
I = A e-t/3.922 ns
0 10 20 30
I/ a
.u.
t / ns
General and Theoretical Section
9
1.2 Fluorescent Dyes
A fluorescent dye or fluorophore is a chemical compound that efficiently re-emits light upon
optical excitation. Whereas light emitting structures can consist of a variety of elements such
as metals or metalloids and their compounds [21], the term fluorescent dye refers generally to
organic molecules. The efficiency of fluorescence depends on the chemical structure of the
chromophore. A rigid geometry is required to avoid non-radiative relaxation. Moreover,
intersystem crossing processes leading to triplet states are promoted by heavy atoms in
particular and have to be avoided. Thus, typical fluorophores consist of annulated aromatic
rings and highly inflexible moieties within the actual chromophoric system.
The usage of fluorophores is diverse and ranges from simple aesthetic effects to specialized
applications in research and technology. Prominent representatives are the xanthene
derivatives fluorescein (54) and rhodamine B (55). Both are water-soluble and thus, are
applied in fluorescence bio-imaging.[22] Various other classes such as coumarins[23],
cyanines[24], oxazines[25] or biomolecules like the green fluorescent protein (GFP)[26] are used
as probes for analytical purposes. However, for long-term applications most fluorescent dyes
are far too unstable.
Highly long-term stable and lightfast fluorophores with quantum yields close to unity are
perylenediimides. To prevent the expanded aryl system from -stacking enabling good
solubility, sterically demanding flexible alkyl chains are attached to the nitrogen of the imide.
Very good results are obtained for secondary alkyls such as tridecan-7-yl moieties.[27] The
resulting perylene diimide 1 excels with a high molar attenuation coefficient of = 87 000 and
a fluorescence quantum yield of = 0.99. Hence, it serves as fluorescence standard[28] and
starting material for further derivatization.

General and Theoretical Section
10
Scheme 1: Alkaline hydrolysis of perylene diimide 1. The resulting N,N’-bis(tridecan-7-
yl)perylene-3,4-dicarboimide-9,10-dicarboxylic anhyride (2) can be condensed with various functional
amines.
The molecular structure of perylene diimides displays interesting effects on the optical
spectra. Quantum chemical calculations [29] have shown that in both, HOMO and LUMO of the
molecule, the imide nitrogen atoms are located on nodal planes. Thus, derivatization does not
influence the absorption or fluorescence spectra. This enables asymmetric substitution
without affecting the optical properties.
Particularly multichromophores based on perylene diimides (Scheme 2) display interesting
optical behavior. Orthogonally arranged and rigid molecules such as 3 were proved[30] to
exhibit fluorescence resonance energy transfer (FRET)[31] rates of nearly 1.00. This contradicts
present theory and requires additional studies. Dyads with linear geometry such as 4 display
increased values for the molar absorptivity caused by exciton effects. [32] This in turn affects
the fluorescence lifetime and motivates for further investigation.

General and Theoretical Section
11
Scheme 2: Orthogonally fixed perylene diimide – benzoperylene triimide dichromophor 3
(left). The chromophores are linked via an aromatic 2,3,5,6-tetramethylphenylene moiety.
Below the linearly N-N-linked perylene diimide – perylene diimide dichromophore 4 consisting
of the same subunit.

General and Theoretical Section
12
1.3 Objectives
Linear perylene diimide multichromophores and their optical characterization
Development of a synthetic strategy for perylene based multichromophores
Preparation of short and stable linkers with solubilizing alkyl moieties
Characterization of the optical properties mainly focused on the molar attenuation
coefficient and the fluorescence lifetime
Dynamic effects in naphthalene dicarboximides and anthracene dicarboximides with
electron rich substituents
Investigation of fluorescent solvatochromism in substituted 4-arylnaphthalimides
resulting in large Stokes’ shifts
Conclusions on the geometrical intramolecular dynamics
Synthesis and optical characterization of derivatives of 10-aminoanthracene
dicarboximides and studies on the reaction conditions
Studies on homo-coupling reactions of carboxylic imides to larger aromatic -systems
under metal-free conditions
Long-range electromagnetic molecular interactions indicated by fluorescence
Determination of fluorescence lifetimes depending on the concentration
Development of a theoretical model
Efficient recycling of unmarked polymers by means of the fluorescence decay
Investigation of auto-fluorescence in technical polymers
Development of a method for detection of the fluorescence decay for reliable
identification of different polymers
Oligothiophenes with short fluorescence lifetimes
Synthesis of highly soluble 2,5-substituted oligothiophenes
Studies on the optical properties, particularly the fluorescence lifetime
Synthesis of long-term stable derivatives of bisketoterthiophenes with large Stokes’
shift and very short fluorescence lifetimes

Results and Discussion
13
2 Results and Discussion
The following section discusses optical investigations such as absorption, fluorescence and
fluorescence lifetime spectroscopy. All measurements were carried out in concentrations
below 10-5 mol L-1 if not stated otherwise, were reabsorption or quenching effects are
generally accepted to be negligible. Particularly in the case of fluorescence lifetimes it was
found, that the concentration of the sample severely affects the obtained values. However,
for better comparability the reported lifetimes are given as simple numbers because within
the range of differences between the respective dilutions the results can be assumed as
constant. For more detailed evaluation of the data the concentration of the respective
measurement is given in the experimental section. For identical compounds, the same
solution was applied for fluorescence decay measurements and for the determination of the
fluorescence quantum yield. Thus, the actual concentration of the sample can be extracted
from the report on fluorescence quantum yields in Chapter 4.

Results and Discussion
14

Results and Discussion
15
2.1
Modifications of Perylene
Diimides:
Shortening the Fluorescence
Lifetime via Intramolecular
Interactions in Axial-Linked
Di- and Trichromophores
Results and Discussion
16
For applications such as data transmission the crucial property of an applied fluorescent dye
is the fluorescence lifetime. However, little thereof is known and converted into significant
theories. In the literature, many data were reported but mostly as simple facts. More detailed
investigation is carried out for special applications or bio-environmental performance.
Examinations of fluorescence quenching effects are often limited to one chromophore[33].
There are two equations describing the dependency of the fluorescence decay from
assessable and measurable parameters. First, the proportional correlation of the fluorescence
quantum yield to the fluorescence lifetime, expressed in equation (6). Second, the reciprocal
dependency of the latter from the electronic transition probability expressed in the molar
attenuation coefficient , see equation (5). Both theories are valid, but they proved to be
limited to considerations within the same substance or at least, class of substances. Moreover,
no concept exists describing the relation between fluorescence lifetime and molecular
structure, i.e. as there is such for the correlation of absorption wavelengths and molecular
structure.[17] Hereinafter, the known theories were assigned to perylene diimides, a well-
studied class of fluorescent dyes. Very high fluorescence quantum yields close to unity and a
high light-fastness are advantageous properties for studying structural influences on opto-
physical processes.
According to equation (5), the fluorescence lifetime of perylene diimides is indirectly
proportional to the oscillator strength indicated by the molecular absorptivity . Langhals and
Jona[32] describe the superelevation of the molar absorptivity caused by exciton effects in
perylene diimide di- and trichromophores. This in turn leads to shorter fluorescence lifetimes
of about 2.4 ns compared to about 3.95 ns for N,N’-bis(tridecan-7-yl)perylene-3,4:9,10-
tetracarboximide (1). Increasing the number of perylene units to more than n = 3 should even
further decrease the fluorescence decay.

Results and Discussion
17
Scheme 3: General preparation procedure for N-N’-linked perylene diimide based di- and
trichromophores according to the literature.[32]
Additional prolongation to higher oligomers according to this approach is described to fail
(Scheme 3). Hydrolysis of the inward carboximides is favored[32] over the terminal ones of 8.
Obviously, the electron-withdrawing effect of the carbonyl groups on the second imide moiety
dominates over the steric hindrance. In further experiments the stepwise construction of 8
via 7 in single reactions was studied. Unfortunately, hydrazine displays an antagonistic
behavior between its nucleophilic and basic attributes. The condensation which is enhancing
the growth process to higher oligomers competes with the degrading alkaline hydrolysis.
Again, the N-N-junction between the chromophores is hydrolyzed and only the starting

Results and Discussion
18
material could be detected besides newly formed N-aminoperylene-3,4-carboximide-9,10-
dicarboxylic anhydride as byproduct.[32] Hence, in this study an approach was followed using
more sterical hindered but still short linkers for the connection of the single dyes. 1,4-Diamino-
2,3,5,6-tetramethylbenzol (10) is an easily accessible building block for linked carboximides.[34]
To increase the solubility of the multichromophore product, a prolonged secondary “swallow-
tail” alkyl chain[27] containing 19 carbon atoms was introduced for most approaches.
Double condensation of two units of perylene monoimide mono anhydride 11b with the above
mentioned amine 10 yields 47% of the corresponding dichromophore 9 (Scheme 4). The target
compound was isolated via column chromatography and the structure verified by means of
MALDI and FAB mass spectrometry and 1H NMR spectroscopy. A precise elemental analysis
failed indicating minor impurities.

Results and Discussion
19
Scheme 4: Preparation of 2,3,5,6-tetramethylbenzene-linked perylene diimide di- and
trichromophores 9 and 13.
Results and Discussion
20
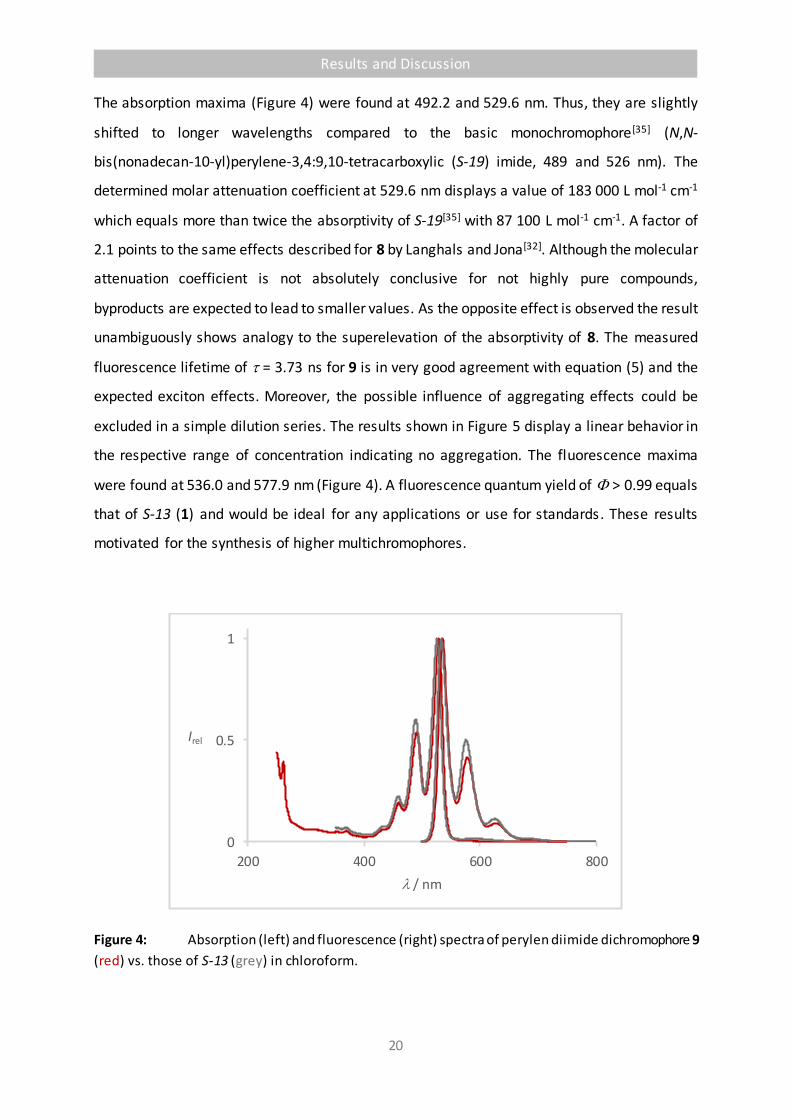
The absorption maxima (Figure 4) were found at 492.2 and 529.6 nm. Thus, they are slightly
shifted to longer wavelengths compared to the basic monochromophore[35] (N,N-
bis(nonadecan-10-yl)perylene-3,4:9,10-tetracarboxylic (S-19) imide, 489 and 526 nm). The
determined molar attenuation coefficient at 529.6 nm displays a value of 183 000 L mol-1 cm-1
which equals more than twice the absorptivity of S-19[35] with 87 100 L mol-1 cm-1. A factor of
2.1 points to the same effects described for 8 by Langhals and Jona[32]. Although the molecular
attenuation coefficient is not absolutely conclusive for not highly pure compounds,
byproducts are expected to lead to smaller values. As the opposite effect is observed the result
unambiguously shows analogy to the superelevation of the absorptivity of 8. The measured
fluorescence lifetime of = 3.73 ns for 9 is in very good agreement with equation (5) and the
expected exciton effects. Moreover, the possible influence of aggregating effects could be
excluded in a simple dilution series. The results shown in Figure 5 display a linear behavior in
the respective range of concentration indicating no aggregation. The fluorescence maxima
were found at 536.0 and 577.9 nm (Figure 4). A fluorescence quantum yield of > 0.99 equals
that of S-13 (1) and would be ideal for any applications or use for standards. These results
motivated for the synthesis of higher multichromophores.
Figure 4: Absorption (left) and fluorescence (right) spectra of perylen diimide dichromophore 9
(red) vs. those of S-13 (grey) in chloroform.
0
0.5
1
200 400 600 800
Irel
l / nm

Results and Discussion
21
Figure 5: Absorptivity of the two main maxima of dichromophore 9 in a dilution series from 3 to
27 x 10-7 mol L-1 in chloroform. Both maxima at 530.0 nm (red) and 492.0 nm (grey) display linear
behavior.
Further increase of the number of perylene units to the trichromophore 13 was realized by
the condensation of 5 equivalents N,N’-bis(tridecan-7-yl)perylene monoamide 11a with N,N’-
bis(4-amino-2,3,5,6-tetramethylphenyl)perylene-3,4:9,10-tetracarboxylic imide[36] 12. Using
harsh conditions in quinolone at 220 °C for 6 h lead to only 7% yield. More moderate
conditions as for the bichromophore 9 did not succeed in any product. The isolation of the
trichromophore proved to be very challenging due to the low solubility of the product.
Aggregation on the column during chromatography seems to impede the formation of well -
defined fractions. Furthermore, the 1H NMR spectrum displays a multitude of broad signals.
Hence, a determination of the purity via NMR spectroscopy failed. The product was verified
by MALDI mass spectroscopy and exhibited a single spot in thin layer chromatography on silica
and aluminum oxide in highly diluted chromatograms.
0
0.2
0.4
0.6
0 10 20 30
E
c / 10-7 mol L-1

Results and Discussion
22
The absorption of 13 (Figure 6) exhibits maxima at 490.8 and 527.2 nm, respectively.
Compared to S-13 (1), the minima are slightly bathochromically shifted. The molar attenuation
coefficent (154 200 L mol-1 cm-1) displayed values considerably below the expected threefold
absorptivity of S-13 (1) (about 260 000 L mol-1 cm-1). First, this can be attributed to the notable
impurities. Second, the respective absorption bands are not only broadened compared to
both, the N-N’-trichromophore 8 and even S-13 (1) there is also a significant further
absorption band at 589.0 nm. This is typical for the formation of J-type aggregates [37]
explaining the band-shape and the low absorptivity at shorter wavelengths. Moreover,
aggregation might be the key problem of the chromatographical purification where no distinct
fractions could be obtained. To investigate the aggregation a dilution series down to
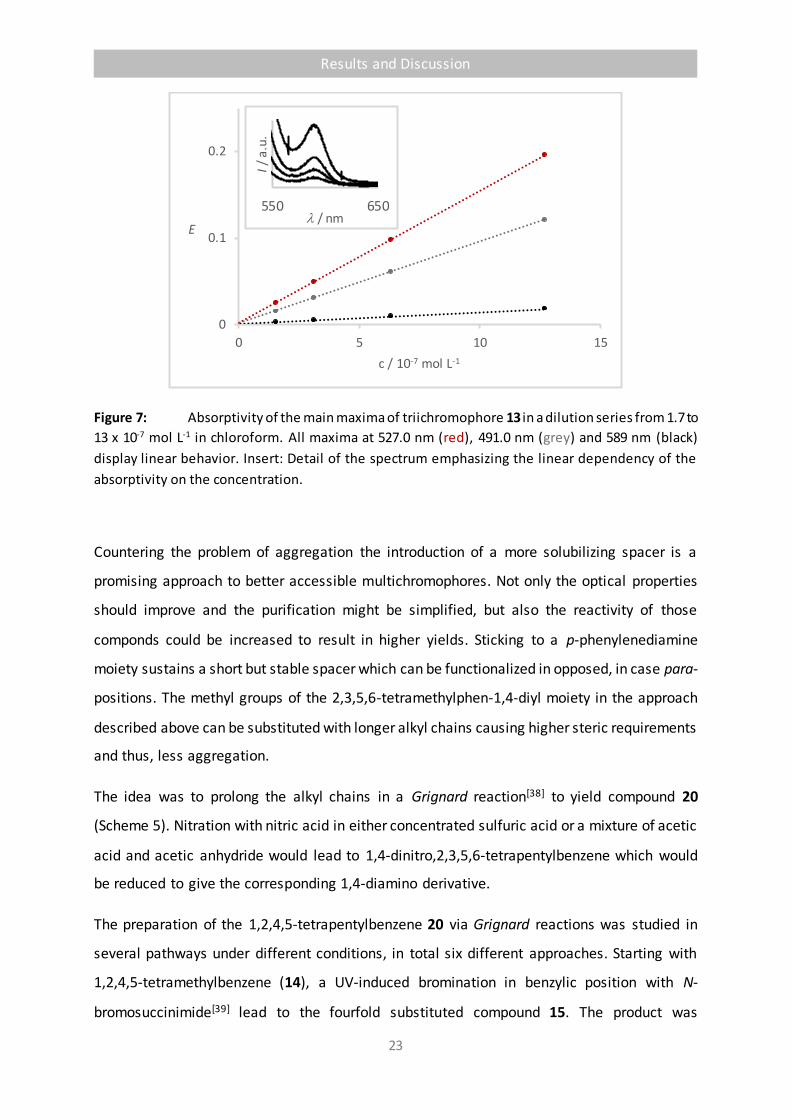
concentrations of less than 2 x 10⁻⁷ mol L-1 was measured (Figure 7). Surprisingly, the
intensities of all maxima, even that at 589.0 nm exhibits linear behavior. Thus, aggregation
sees to occur even in highly diluted solutions and application for fiber-doping is
disadvantageous. The fluorescence displays maxima at 534.8 and 577.6 nm, respectively and
a quantum yield of = 0.86. The lower fluorescence strength compared to 9 is also in good
agreement with the results indicating aggregation.
Figure 6: Absorption (left) and fluorescence (right) spectra of perylene diimide trichromophore
13 (red) vs. those of S-13 (1) (grey) and trichromophore 8 (black) in chloroform.
0
0.5
1
200 400 600 800
Irel
l / nm
Results and Discussion
23
Figure 7: Absorptivity of the main maxima of triichromophore 13 in a dilution series from 1.7 to
13 x 10-7 mol L-1 in chloroform. All maxima at 527.0 nm (red), 491.0 nm (grey) and 589 nm (black)
display linear behavior. Insert: Detail of the spectrum emphasizing the linear dependency of the
absorptivity on the concentration.
Countering the problem of aggregation the introduction of a more solubilizing spacer is a
promising approach to better accessible multichromophores. Not only the optical properties
should improve and the purification might be simplified, but also the reactivity of those
componds could be increased to result in higher yields. Sticking to a p-phenylenediamine
moiety sustains a short but stable spacer which can be functionalized in opposed, in case para-
positions. The methyl groups of the 2,3,5,6-tetramethylphen-1,4-diyl moiety in the approach
described above can be substituted with longer alkyl chains causing higher steric requirements
and thus, less aggregation.
The idea was to prolong the alkyl chains in a Grignard reaction[38] to yield compound 20
(Scheme 5). Nitration with nitric acid in either concentrated sulfuric acid or a mixture of acetic
acid and acetic anhydride would lead to 1,4-dinitro,2,3,5,6-tetrapentylbenzene which would
be reduced to give the corresponding 1,4-diamino derivative.
The preparation of the 1,2,4,5-tetrapentylbenzene 20 via Grignard reactions was studied in
several pathways under different conditions, in total six different approaches. Starting with
1,2,4,5-tetramethylbenzene (14), a UV-induced bromination in benzylic position with N-
bromosuccinimide[39] lead to the fourfold substituted compound 15. The product was
0
0.1
0.2
0 5 10 15
E
c / 10-7 mol L-1
550 650
I/ a
.u.
l / nm

Results and Discussion
24
obtained elementary analytically pure in 46% yield and served as starting material in the first
approaches.
Scheme 5: Investigated reaction pathways to obtain 1,2,4,5-tetrapentylbenzene (20).
Pathway i: A freshly prepared solution of 10 equivalents butylmagnesium bromide (17) in THF
was added to a solution of 1,2,4,5-tetra(bromomethyl) benzene 14 in THF slowly at -78°C.
Under copper iodide catalysis [40] the reaction mixture was allowed to warm to room
temperature, stirred for 17 h and subsequntly heated to 80°C for additional 7 h. The reaction
was quenched with 1 M aqueous hydrochloric acid, extracted with chloroform and purified via
multiple column chromatography on aluminum oxide. The product was found in significant
percentage in 1H NMR and mass spectra. However, impurities of oligomers were also found
and could not be removed chromatographically. Obviously, an intermolecular metal exchange
took place to form a Grignard species of the durene moiety which reacted with other
bromodurenes left. In EI-MS, peaks for the di-, tri, and tetramer 21 (Scheme 6) were found at
m/z = 602, 846 and 1090. Higher homologues might also form but are outside the detectable
range of the analytical method.
Results and Discussion
25
Scheme 6: Pentylated tetramer 21 consisting of durene units. Constitutional isomers are not
considered, the given structure is the sterically most favorable.
To prevent metal exchange, the following approach was carried out adding the reagents in
opposite order. When tetrabromo durene 15 is added to a solution of butylmagnesium
bromide (17), an excess of the Grignard reagent is ensured during the addition process. Thus,
a competition between exchange and substitution might favor the latter. Moreover, the
temperature was kept below -70 °C for the entire reaction time. A few minutes after the
complete addition, the reaction mixture started to precipitate and was kept at -70 °C for 1 h.
Then the temperature was allowed to rise with about 10 °C per hour to room temperature
and the mixture was worked up as described before. A colorless, solid polymer was obtained
and analyzed by elementary analysis. As known from the mass spectrometry of the earlier
approach, each durene unit is linked to two more aryls. It is plausible, that for steric reasons
only two aryl units can react with on durene group, most likely in para-position. Deriving from
the elemental analysis (Table 1), each durene unit is still brominated in one benzylic position
while in average only every second unit is substituted with the alkyl chain (Scheme 7). The
remaining positions seem to be hydroxylated which could be attributed to substitution during
basic work up. As the mass of the polymer is unknown, only a rough estimation of its
composition was successful. Slightly different but qualitative same results are obtained when
water inclusions inside the bulk material are assumed. In summary, the reduced temperature
could not prevent from the magnesium exchange but supporting it in relation to the aimed
substitution. The formed polymer precipitates after exceeding a specific length. While still in
solution, substitution with butylmagnesium bromide (17) takes place but once a critical length
is approached, the polymer coils, precipitates and prevents the remaining bromomethyl
moieties from further reaction.

Results and Discussion
26
Table 1: Elementary analysis of the polymer forming at low temperatures. The indicated
hydroxyl group can also be interpreted as non-covalent aqueous inclusion.
Elemental analysis C H Br
Calc. for (C10H10)a(C4H9)0.4Br1.1(OH)0.5)n 55.86 5.70 35.24
found 54.66 5.81 35.23
a) Durene units are estimated to form a polymer chain. Two positions per unit are occupied with either
a butyl, bromo or hydroxyl group.
Scheme 7: Representative schematic section of the discussed polymer from the Grignard reaction
of 15 and 17.
As a consequence, the reaction temperature was increased to 80 °C. Thus, the
thermodynamically favored substitution is promoted. Both variants were performed, addition
of the butyl-Grignard reagent to the tetrabromodurene and vice versa. In both cases a highly
viscous oil was obtained indicating the formation of oligomers which were discarded.
Pathway ii: The results discussed above suggest the benzylmagnesium bromide to be
energetically more favored compared to the alkyl Grignard compound. Switching the roles of
electrophile and nucleophile, a fourfold magnesium insertion was performed to obtain 16.
Subsequently, an excess of bromobutane was slowly added at 80 °C. The reaction was stirred
at 80 °C for 90 minutes and quenched with 1 M hydrochloric acid. Again, a solid polymer was
isolated and investigated by means of elemental analysis. The percentage of bromine was
found at 14.72% whereas the values for carbon and hydrogen increased to 62.70% and 7.87%,

Results and Discussion
27
respectively. Compared to the product in pathway i at low temperatures, the aimed reaction
is more favored. However, metal exchange takes place in both directions significantly. Thus,
the strategy of coupling two bromo moieties was not further pursued.
Pathway iii: 1,2,4,5-Tetracyanobenzene (18) is a low-cost and well available precursor. The
cyano groups are good electrophiles concerning primary alkylmagnesium bromides.
Moreover, no metal insertion is possible and thus, no homo-coupling is anticipated. After
protic-aqueous treatment of the product the corresponding tetraketone should be obtained.
A Wolff-Kishner type reduction leads to the respective tetraalkylbenzene.
Two equivalents of a freshly prepared solution of butylmagnesium bromide (17) in THF were
treated with a solution of tetracyanobenzene (18) in THF at 0 °C. The reaction was heated to
60 °C and first turned green at room temperature, later red at elevated temperatures (> 50 °C).
The reaction was quenched with 1 M hydrochloric acid and extracted with chloroform. After
chromatographic purification on silica the product 19 could be verified with mass
spectrometry (EI and MALDI) and 1H NMR spectroscopy. Whereas most byproducts were
removed, an isolation of 19 from the less converted compounds such as 1-cyano-2,4,5-
tripentanoylbenzene did not succeed due to the very similar behavior in column
chromatography. A consecutive Wolff-Kishner-reaction of the obtained mixture failed.
Transmetallation, particularly Negishi zinc insertion did not succeed particularly due to the
reduced reactivity. Generally, the fourfold reaction requires highly reactive species to obtain
acceptable yields. Furthermore, the separation of the product from various similar but less
substituted byproduct proofed to be extremely difficult. A distillation could not be performed
under the given circumstances with an aromatic compound of that molecular weight.
Conclusion
The approach to reduce the fluorescence lifetime by increasing the molar attenuation
coefficient by exciton effects resulted in two main recognitions. The concept presented by
Langhals and Jona[32] can be transferred to longer-range spacers. Although the relative
orientation of the chromophores is different (parallel vs. orthogonal along the lateral axis),
same results are found for the dichromophores. The trichromophore 13 however, evades
from any comparison as it displays significant aggregation. Introduction of sterically more
demanding spacers failed. In most approaches the reaction itself leads to product. Multi-site

Results and Discussion
28
reactions are impeding good yields and purification via column chromatography was not
successful as no distinct spots are obtained.
The poor solubility of the dyads complicated the handling of these compound and is a huge
disfavor for isolation and futher reactions. Thus, the focus shifted from perylene diimide
mulitchromophores to smaller fluorophores.

Results and Discussion
29
2.2
Influence of Intramolecular
Dynamics on
Fluorescence Properties
H. Langhals, T. Schlücker, R. Greiner, D. Zgela, Ger. Offen. DE 102016004396.2 (Apr. 7th 2016).

Results and Discussion
30
Intramolecular dynamics and high fluorescence quantum yield usually contradict each other.
In most cases, dynamic processes are caused by rotational degrees of freedom preventing any
detectable fluorescence. However, in some cases this intramolecular motion can be limited in
its range and, more important, controlled by the interaction with light. This results in two
different arrangements, one for the ground state and one for the excited state. Both
geometric situations, particularly the one of the electronically excited state, can be rigid
enough to exhibit fluorescence. Langhals and Hofer demonstrated[41] a C-C-coupled perylene
dichromophor with an increased Stokes’ shift of 70.3 nm (0.277 eV) and a quantum yield of
> 0.99%. The fluorescence lifetime was found to be = 3.76 ns and thus slightly below the
value of S-13 (3.95 ns). Regarding the dynamic impact on the fluorescence key properties,
Stokes’ shift and fluorescence lifetime, investigations on molecular dynamics and its effects
on the optical properties were intensified.
2.2.1 Intramolecular Dynamics of 4-Aryl Naphthalimides
N-alkyl naphthalene-1,8-dicarboxylic imides are the simplest representatives of well soluble
peri-arylene imides. Substitution with aryl moieties in peri-position introduces an extended
aromatic -system, however steric repulsion between the hydrogen atoms of the subunits in
ortho- or peri-position induce considerable twists interfering good orbital overlap. Hence, the
dihedral angle should depend on the electronic state of the molecule. There are two concepts
concerning this dynamics, in particular for push-pull chromophores. Langhals et al. presented
a theory[41] where the dihedral angle diminishes after excitation. The electron deficiency in
the HOMO results in a shorter C-C bond and a more planar geometry between the subunits.
This effects a large Stokes’ shift due to better delocalization of the -electrons in the exited
state. In contrast, the TICT-theory[42] (twist induced charge transfer) predicts a
orthogonalization caused by electronic excitation. This twist in turn induces a charge transfer
from the donor to the acceptor moiety. Also a large Stokes’ shift is obtained but quantum
yields are usually below = 0.3 due to competing non-radiative relaxation.
In 4-arylnaphthalimides, a photo-induced shift of electron density from the donor to the
carboximide is responsible for inducing a large dipole moment. Sensitivity of the energy of the
excited state towards solvation with polar solvents causes a bathochromic shift of the
fluorescence. This process corresponds to the positive solvatochromism of 4-amino-N-
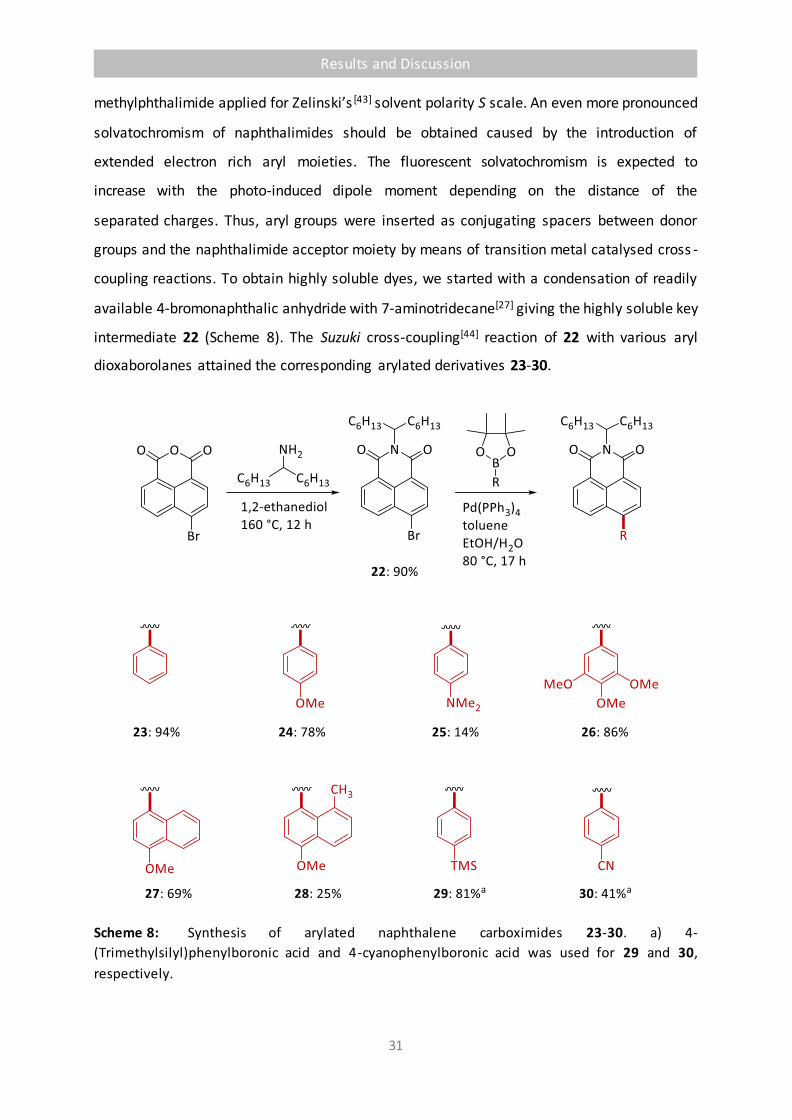
Results and Discussion
31
methylphthalimide applied for Zelinski’s [43] solvent polarity S scale. An even more pronounced
solvatochromism of naphthalimides should be obtained caused by the introduction of
extended electron rich aryl moieties. The fluorescent solvatochromism is expected to
increase with the photo-induced dipole moment depending on the distance of the
separated charges. Thus, aryl groups were inserted as conjugating spacers between donor
groups and the naphthalimide acceptor moiety by means of transition metal catalysed cross -
coupling reactions. To obtain highly soluble dyes, we started with a condensation of readily
available 4-bromonaphthalic anhydride with 7-aminotridecane[27] giving the highly soluble key
intermediate 22 (Scheme 8). The Suzuki cross-coupling[44] reaction of 22 with various aryl
dioxaborolanes attained the corresponding arylated derivatives 23-30.
Scheme 8: Synthesis of arylated naphthalene carboximides 23-30. a) 4-
(Trimethylsilyl)phenylboronic acid and 4-cyanophenylboronic acid was used for 29 and 30,
respectively.

Results and Discussion
32
Substitution with the sterically hindered 2,6-dimethyl phenyl boronate failed where synthesis
could be alternatively realised by stepwise peripheral introduction of the demanding methyl
groups. The easily accessible trimethoxy derivative 26 was brominated with N-
bromosuccinimide to give 31 and then further treated with methylzinc chloride under typical
Negishi cross-coupling conditions [45] to provide 32 (Scheme 9). Since also the borylation of
more complex aryl halides proved to be difficult, we converted the trimethylsilyl derivative 29
to the corresponding aryl iodide 33 in order to extend the conjugated system.
Scheme 9: Bromination of 26 and subsequent cross-coupling with MeZnCl gives 32 (top);
cyanation and Negishi cross-coupling of 33 leads to 34. 30 was alternatively obtained via Pd-
catalyzed cyanation (bottom).

Results and Discussion
33
A typical Negishi cross-coupling of 33 with p-anisylzinc chloride[46] (prepared from the reaction
of 4-iodoanisole with iPrMgCl·LiCl, followed by ZnCl2) gave the methoxy biphenyl derivative
34 in very good yield of 89%. Further, the cyanation of 33 led to the corresponding
arylnaphthyl cyanide 30 in an improved yield (Scheme 9).
Fluorescence lifetimes of naphthalimides 23-30 and 34 were determined and found to depend
on both, the chemical structure and on the applied solvent (Table 2). In chloroform,
fluorescence lifetimes of about 3-4 ns were found. Strong donor groups such as N,N-
dimethylaminophenyl (25) and trimethoxyphenyl (26) increase the fluorescence lifetime to
nearly 7 ns whereas electron withdrawing groups (29-30) decrease these values. The
prolonged compound 34 also exhibits shorter lifetimes which is attributed to the higher molar
attenuation coefficient in accordance to equation (5). However, comparison of highly
fluorescent compounds such as 24 with the weaker emitting 27-28 reveal that the
fluorescence lifetime is not strictly predictable with equation (5). The absorption is nearly
same in intensity and spectral shape (Figures 8a and 9-10) however, the natural lifetimes n
(according to equation (6)) are significantly different to each other. In fact the measured
lifetimes are comparable which raises the question if fluorescence lifetimes are more
dependant on the chemical structure than strictly on optical spectra. Moreover, taking into
account the discussed properties of S-13 (1) one can see the similarity of the fluorescence
lifetime while absorbance (approx. factor 5) and quantum yields (factor 1-2) are very different
and far from compensating each other. This confirms the assumption that the fluorescence
lifetime is mainly of structural significance. Equations (5) and (6) are valid (at lea st
qualitatively, see Table 2) but limited to comparisions within a narrow field of structural quite
similar compounds.
The fluorescence lifetimes of naphthalimides 23-30 and 34 rely on their chemical structure
and can be adjusted by substitution. However, there is no distinct difference between the
actual values of for different substituent which could be assigned to molecular dynamics.
Although different lifetimes were obtained in diverse solvents, this is mainly attributed to
fluorescence quenching according to equation (5). Much more intense impact of solvent
effects were found for the wavelength of fluorescence (Table 3, FWHM given in Tables 4-5). A
pronounced positive fluorescent solvatochromism was observed and associated with
molecular dynamics and geometry.
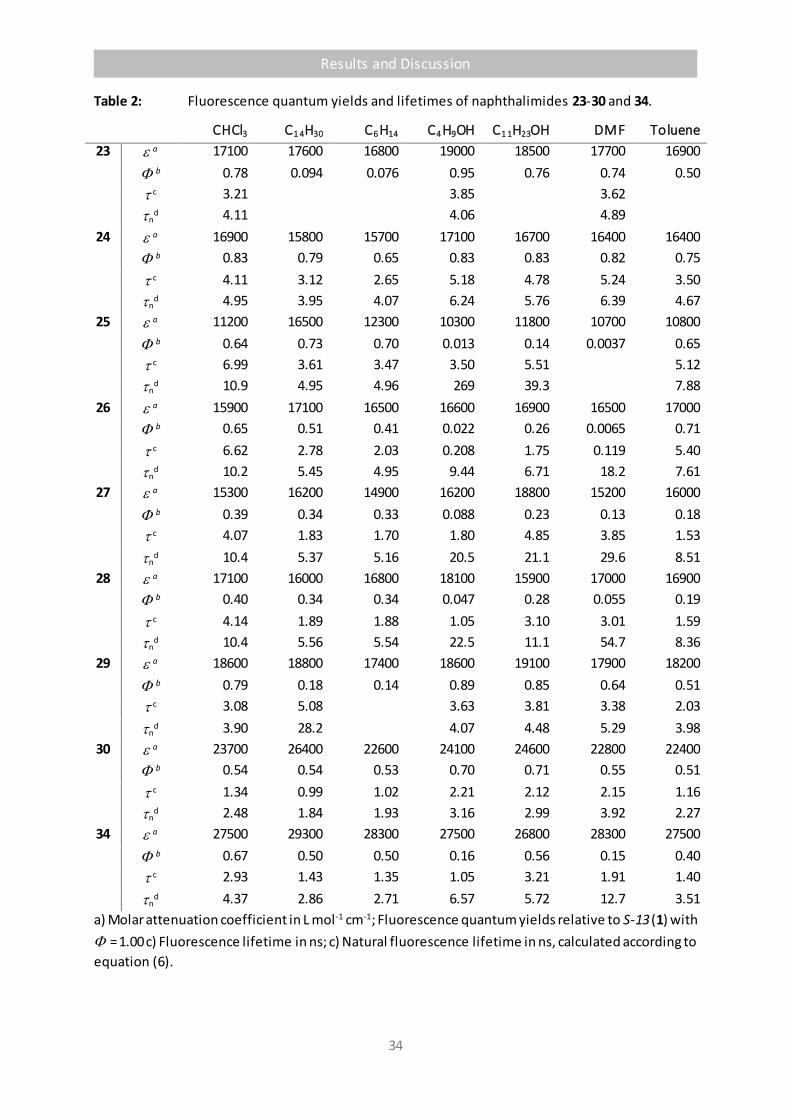
Results and Discussion
34
Table 2: Fluorescence quantum yields and lifetimes of naphthalimides 23-30 and 34.
CHCl3 C1 4H30 C6 H14 C4 H9OH C1 1H23OH DMF Toluene
23 a 17100 17600 16800 19000 18500 17700 16900
b 0.78 0.094 0.076 0.95 0.76 0.74 0.50
c 3.21 3.85 3.62
nd 4.11 4.06 4.89
24 a 16900 15800 15700 17100 16700 16400 16400
b 0.83 0.79 0.65 0.83 0.83 0.82 0.75
c 4.11 3.12 2.65 5.18 4.78 5.24 3.50
nd 4.95 3.95 4.07 6.24 5.76 6.39 4.67
25 a 11200 16500 12300 10300 11800 10700 10800
b 0.64 0.73 0.70 0.013 0.14 0.0037 0.65
c 6.99 3.61 3.47 3.50 5.51 5.12
nd 10.9 4.95 4.96 269 39.3 7.88
26 a 15900 17100 16500 16600 16900 16500 17000
b 0.65 0.51 0.41 0.022 0.26 0.0065 0.71
c 6.62 2.78 2.03 0.208 1.75 0.119 5.40
nd 10.2 5.45 4.95 9.44 6.71 18.2 7.61
27 a 15300 16200 14900 16200 18800 15200 16000
b 0.39 0.34 0.33 0.088 0.23 0.13 0.18
c 4.07 1.83 1.70 1.80 4.85 3.85 1.53
nd 10.4 5.37 5.16 20.5 21.1 29.6 8.51
28 a 17100 16000 16800 18100 15900 17000 16900
b 0.40 0.34 0.34 0.047 0.28 0.055 0.19
c 4.14 1.89 1.88 1.05 3.10 3.01 1.59
nd 10.4 5.56 5.54 22.5 11.1 54.7 8.36
29 a 18600 18800 17400 18600 19100 17900 18200
b 0.79 0.18 0.14 0.89 0.85 0.64 0.51
c 3.08 5.08 3.63 3.81 3.38 2.03
nd 3.90 28.2 4.07 4.48 5.29 3.98
30 a 23700 26400 22600 24100 24600 22800 22400
b 0.54 0.54 0.53 0.70 0.71 0.55 0.51
c 1.34 0.99 1.02 2.21 2.12 2.15 1.16
nd 2.48 1.84 1.93 3.16 2.99 3.92 2.27
34 a 27500 29300 28300 27500 26800 28300 27500
b 0.67 0.50 0.50 0.16 0.56 0.15 0.40
c 2.93 1.43 1.35 1.05 3.21 1.91 1.40
nd 4.37 2.86 2.71 6.57 5.72 12.7 3.51
a) Molar attenuation coefficient in L mol-1 cm-1; Fluorescence quantum yields relative to S-13 (1) with
= 1.00 c) Fluorescence lifetime in ns; c) Natural fluorescence lifetime in ns, calculated according to
equation (6).
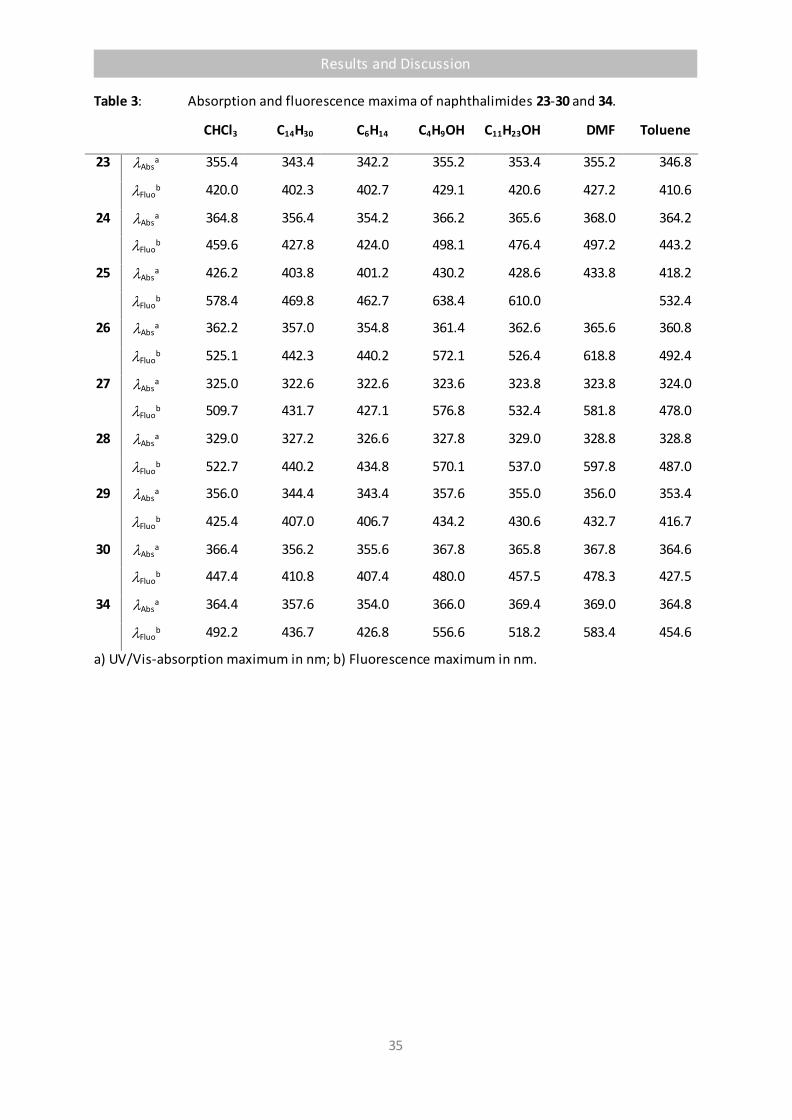
Results and Discussion
35
Table 3: Absorption and fluorescence maxima of naphthalimides 23-30 and 34.
CHCl3 C14H30 C6H14 C4H9OH C11H23OH DMF Toluene
23 lAbsa 355.4 343.4 342.2 355.2 353.4 355.2 346.8
lFluob 420.0 402.3 402.7 429.1 420.6 427.2 410.6
24 lAbsa 364.8 356.4 354.2 366.2 365.6 368.0 364.2
lFluob 459.6 427.8 424.0 498.1 476.4 497.2 443.2
25 lAbsa 426.2 403.8 401.2 430.2 428.6 433.8 418.2
lFluob 578.4 469.8 462.7 638.4 610.0 532.4
26 lAbsa 362.2 357.0 354.8 361.4 362.6 365.6 360.8
lFluob 525.1 442.3 440.2 572.1 526.4 618.8 492.4
27 lAbsa 325.0 322.6 322.6 323.6 323.8 323.8 324.0
lFluob 509.7 431.7 427.1 576.8 532.4 581.8 478.0
28 lAbsa 329.0 327.2 326.6 327.8 329.0 328.8 328.8
lFluob 522.7 440.2 434.8 570.1 537.0 597.8 487.0
29 lAbsa 356.0 344.4 343.4 357.6 355.0 356.0 353.4
lFluob 425.4 407.0 406.7 434.2 430.6 432.7 416.7
30 lAbsa 366.4 356.2 355.6 367.8 365.8 367.8 364.6
lFluob 447.4 410.8 407.4 480.0 457.5 478.3 427.5
34 lAbsa 364.4 357.6 354.0 366.0 369.4 369.0 364.8
lFluob 492.2 436.7 426.8 556.6 518.2 583.4 454.6
a) UV/Vis-absorption maximum in nm; b) Fluorescence maximum in nm.
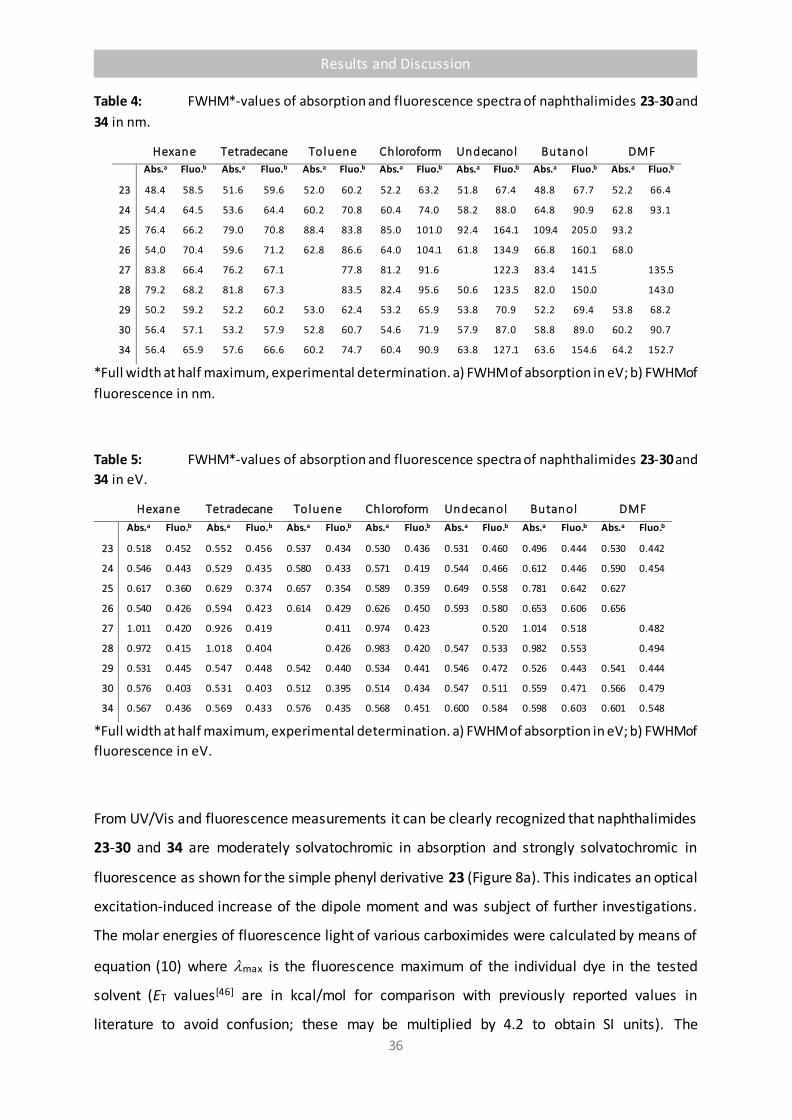
Results and Discussion
36
Table 4: FWHM*-values of absorption and fluorescence spectra of naphthalimides 23-30 and
34 in nm.
Hexane Tetradecane Toluene Chloroform Undecanol Butanol DMF
Abs.a Fluo.b Abs.a Fluo.b Abs.a Fluo.b Abs.a Fluo.b Abs.a Fluo.b Abs.a Fluo.b Abs.a Fluo.b
23 48.4 58.5 51.6 59.6 52.0 60.2 52.2 63.2 51.8 67.4 48.8 67.7 52.2 66.4
24 54.4 64.5 53.6 64.4 60.2 70.8 60.4 74.0 58.2 88.0 64.8 90.9 62.8 93.1
25 76.4 66.2 79.0 70.8 88.4 83.8 85.0 101.0 92.4 164.1 109.4 205.0 93.2
26 54.0 70.4 59.6 71.2 62.8 86.6 64.0 104.1 61.8 134.9 66.8 160.1 68.0
27 83.8 66.4 76.2 67.1 77.8 81.2 91.6 122.3 83.4 141.5 135.5
28 79.2 68.2 81.8 67.3 83.5 82.4 95.6 50.6 123.5 82.0 150.0 143.0
29 50.2 59.2 52.2 60.2 53.0 62.4 53.2 65.9 53.8 70.9 52.2 69.4 53.8 68.2
30 56.4 57.1 53.2 57.9 52.8 60.7 54.6 71.9 57.9 87.0 58.8 89.0 60.2 90.7
34 56.4 65.9 57.6 66.6 60.2 74.7 60.4 90.9 63.8 127.1 63.6 154.6 64.2 152.7
*Full width at half maximum, experimental determination. a) FWHM of absorption in eV; b) FWHM of
fluorescence in nm.
Table 5: FWHM*-values of absorption and fluorescence spectra of naphthalimides 23-30 and
34 in eV.
Hexane Tetradecane Toluene Chloroform Undecanol Butanol DMF
Abs.a Fluo.b Abs.a Fluo.b Abs.a Fluo.b Abs.a Fluo.b Abs.a Fluo.b Abs.a Fluo.b Abs.a Fluo.b
23 0.518 0.452 0.552 0.456 0.537 0.434 0.530 0.436 0.531 0.460 0.496 0.444 0.530 0.442
24 0.546 0.443 0.529 0.435 0.580 0.433 0.571 0.419 0.544 0.466 0.612 0.446 0.590 0.454
25 0.617 0.360 0.629 0.374 0.657 0.354 0.589 0.359 0.649 0.558 0.781 0.642 0.627
26 0.540 0.426 0.594 0.423 0.614 0.429 0.626 0.450 0.593 0.580 0.653 0.606 0.656
27 1.011 0.420 0.926 0.419 0.411 0.974 0.423 0.520 1.014 0.518 0.482
28 0.972 0.415 1.018 0.404 0.426 0.983 0.420 0.547 0.533 0.982 0.553 0.494
29 0.531 0.445 0.547 0.448 0.542 0.440 0.534 0.441 0.546 0.472 0.526 0.443 0.541 0.444
30 0.576 0.403 0.531 0.403 0.512 0.395 0.514 0.434 0.547 0.511 0.559 0.471 0.566 0.479
34 0.567 0.436 0.569 0.433 0.576 0.435 0.568 0.451 0.600 0.584 0.598 0.603 0.601 0.548
*Full width at half maximum, experimental determination. a) FWHM of absorption in eV; b) FWHM of
fluorescence in eV.
From UV/Vis and fluorescence measurements it can be clearly recognized that naphthalimides
23-30 and 34 are moderately solvatochromic in absorption and strongly solvatochromic in
fluorescence as shown for the simple phenyl derivative 23 (Figure 8a). This indicates an optical
excitation-induced increase of the dipole moment and was subject of further investigations.
The molar energies of fluorescence light of various carboximides were calculated by means of
equation (10) where lmax is the fluorescence maximum of the individual dye in the tested
solvent (ET values[46] are in kcal/mol for comparison with previously reported values in
literature to avoid confusion; these may be multiplied by 4.2 to obtain SI units). The
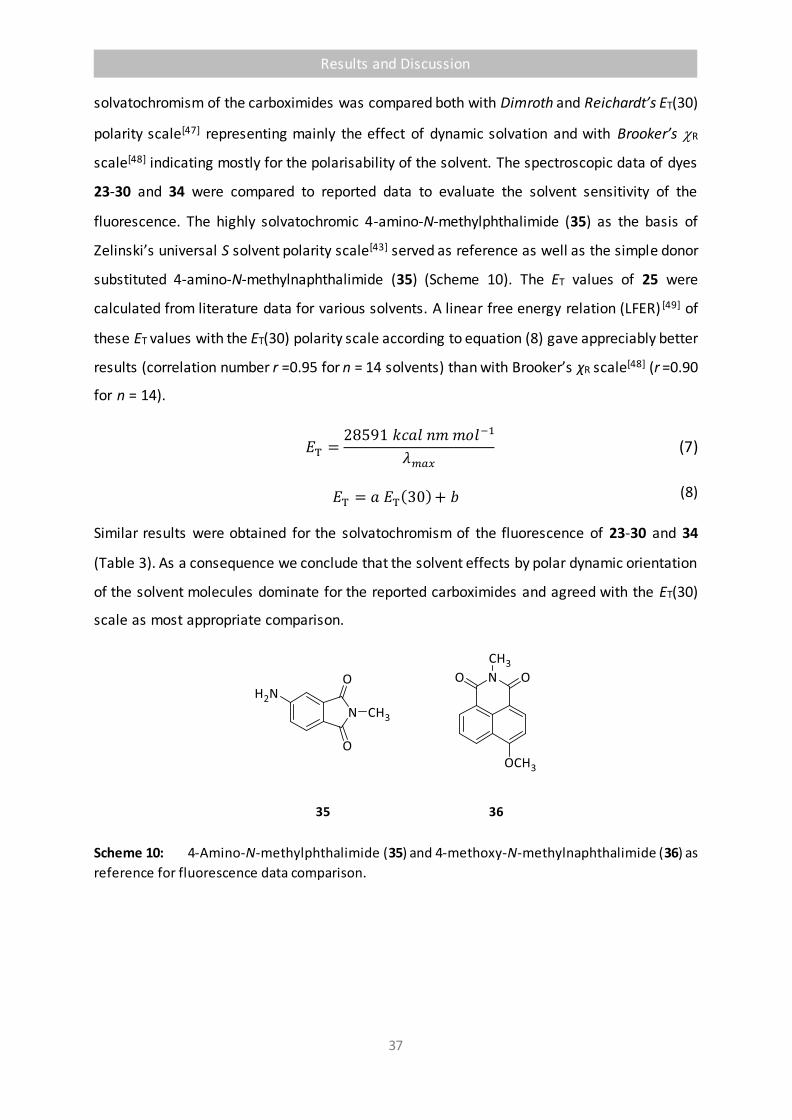
Results and Discussion
37
solvatochromism of the carboximides was compared both with Dimroth and Reichardt’s ET(30)
polarity scale[47] representing mainly the effect of dynamic solvation and with Brooker’s R
scale[48] indicating mostly for the polarisability of the solvent. The spectroscopic data of dyes
23-30 and 34 were compared to reported data to evaluate the solvent sensitivity of the
fluorescence. The highly solvatochromic 4-amino-N-methylphthalimide (35) as the basis of
Zelinski’s universal S solvent polarity scale[43] served as reference as well as the simple donor
substituted 4-amino-N-methylnaphthalimide (35) (Scheme 10). The ET values of 25 were
calculated from literature data for various solvents. A linear free energy relation (LFER) [49] of
these ET values with the ET(30) polarity scale according to equation (8) gave appreciably better
results (correlation number r =0.95 for n = 14 solvents) than with Brooker’s χR scale[48] (r =0.90
for n = 14).
𝐸T =28591 𝑘𝑐𝑎𝑙 𝑛𝑚 𝑚𝑜𝑙−1
𝜆𝑚𝑎𝑥
𝐸T = 𝑎 𝐸T(30) + 𝑏
(7)
(8)
Similar results were obtained for the solvatochromism of the fluorescence of 23-30 and 34
(Table 3). As a consequence we conclude that the solvent effects by polar dynamic orientation
of the solvent molecules dominate for the reported carboximides and agreed with the ET(30)
scale as most appropriate comparison.
Scheme 10: 4-Amino-N-methylphthalimide (35) and 4-methoxy-N-methylnaphthalimide (36) as
reference for fluorescence data comparison.

Results and Discussion
38
Figure 8: a) UV/Vis absorption (left) and fluorescence (right) spectra of 23 in various solvents.
From left to right: hexane (thick solid red), tetradecane (dotted blue), toluene (dashed grey),
chloroform (solid black), undecanol (dotted dashed turquoise) DMF (diffuse yellow), 1-butanol (double
dotted dashed green). b) Linear relationship of the solvatochromism (ET) of 23 (diamonds), 24
(triangles) and 37 (circles), respectively to the ET(30) solvent polarity scale. Closed symbols: Aprotic
solvents; open symbols: protic solvents, neglected for regression. c) Aryl naphthalene carboximides
23-30, 32 and 34 in CHCl3 under UV-light (366 nm). From left to right: 32, 30, 24, 34, 23, 29, 28, 27, 26,
25.
The solvents n-tetradecane, n-hexane, toluene, chloroform, N,N-dimethyl formamide (DMF),
1-undecanol and 1-butanol were investigated for an overview of solvent effects where the
two protic solvents were applied for studying the influence of hydrogen bonds. Linear
correlations of the ET values with the ET(30) values were obtained. Larger deviations to higher
ET were observed for hydrogen bond-donating solvents such as 1-butanol and 1-undecanol
indicating the specific influence of such interactions; the solvent viscosity seems to have a
minor influence (compare hexane with tetradecane and 1-butanol with 1-decanol) and large
Stokes' shifts are even observed in a solid glassy matrix of PMMA. As a consequence, the
further discussion was concentrated on the non- hydrogen bond-donating solvents.

Results and Discussion
39
Table 6: Solvatochromism of the fluorescence of the dicarboxylic imides 23-30, 32 and 34-36.
Dye αa rb ϑc ϑexd EHOMO
e ELUMOe EHOMO(E1)f ELUMO(E1)f Dipoleg DipoleE1
h
23 -0.34 -0.99 57.80 39.64 -6.667 -2.884 -8.027 0.082 5.52 7.75
24 -0.74 -0.99 55.61 35.86 -6.395 -2.803 -7.771 0.166 6.40 9.82
25 -1.49 -0.96 51.35 31.43 -5.606 -2.667 -7.211 0.354 9.20 14.86
26 -1.43 -0.98 57.34 35.67 -6.340 -2.857 -7.837 0.082 6.77 9.22
27 -1.36 -0.98 71.60 43.34 -6.095 -2.830 -7.510 0.245 6.47 12.21
28 -1.37 -0.99 75.38 44.94 -5.987 -2.830 -7.347 0.272 6.03 12.20
29 -0.34 -0.99 57.31 36.39 -6.640 -2.857 -7.946 0.082 6.01 8.53
30 -0.80 -0.99 57.95 36.57 -6.993 -3.184 -8.354 -0.327 0.47 1.66
32 87.42 89.36 -6.531 -2.857 -8.296 0.199 6.08 7.22
34 -1.33 -0.98 56.66 39.56i
32.24 31.92i
-6.177 -2.857 -7.592 0.082 6.94 11.26
35 -0.60 -0.95 -6.384 -2.466 -8.485 0.700 5.20 8.92
36 -0.27 -0.89 -6.515 -2.723 -8.113 0.411 6.29 7.96
Applied solvents: n-tetradecane, n-hexane, toluene, chloroform, dimethylformamide (DMF); a) Slope
of the linear regression; b) Coefficient r of correlation for applications of equation (2); c) Calculated
dihedral angle ϑ between the naphthalimide and the aryl substituent in the electronic ground state
(DFT B3LYP 6-311**G); d) Calculated dihedral angle ϑ between the naphthalimide and the aryl
substituent in the first electronically excited state (CIS B3LYP 6-311**G); e) Calculated energy of HOMO
and LUMO in eV in the electronic ground state, respectively (CIS 6-311**G); f) Calculated energy of
HOMO and LUMO in eV in the electronically excited state, respectively (CIS B3LYP 6-311**G); g) Dipole
moment of the electronic ground state in Debye; h) Dipole moment of the electronically excited state
in Debye; i) dihedral angle between phenyl moieties.
A slope of -0.60 is found for 4-amino-N-methylphthalimide (dye 35, Table 6) and
characterises the sensitivity of this highly solvatochromic fluorescent dye to polar solvent
effects. In comparison, this interaction is appreciably lower for the methoxynaphthalimide 36
( = -0.27) and indicates a smaller alteration of the molecular dipole moment with optical
excitation. An extension of the conjugated system of the naphthalimide with a phenyl group
in 23 increases the slope slightly to = -0.34 (Figure 8b). Further introduction of a donor group
into the p-position of the phenyl substituent to obtain 24 establishes a donor acceptor system
between the methoxy- and the carbonyl groups and enhances the sensitivity ( = -0.74) to
exceed the solvatochromism of 35 by far. The dimethylamino group of derivative 25 causes
an even higher sensitivity towards solvents, however, the fluorescence quantum yield strongly
decreases in polar solvents. Multiple donor groups as in 26 also display a remarkably high

Results and Discussion
40
solvatochromism with comparably high fluorescence quantum yields; even though weak
fluorescence was still observed in polar DMF. A substitution with larger aryl groups like the 4-
methoxynaphthyl moiety leads to 27 which displays a very distinct solvatochromism
( = -1.36) while still exhibiting high fluorescence quantum yields in polar solvents. Further
extension of the conjugated framework to the methoxybiphenyl derivative 34 also induces
such a pronounced fluorescent solvatochromism ( = -1.33) exceeding that of the anisyl-
substituted species 24. Finally, the effect of the donor acceptor motif in 24, was further tested
with 30 where the electron donating methoxy group was exchanged by an electron
withdrawing cyano group. There is still a comparably high sensitivity to solvent polarity
( = -0.80), but as expected, the effect of the donor-substituted derivatives was not reached
(Table 6).
Figure 9: UV/Vis absorption (left) and fluorescence (right) spectra of 27 in various solvents. From
left to right: hexane (thick solid red), tetradecane (dotted blue), toluene (dashed grey), chloroform
(thin solid black), undecanol (dotted dashed turquise) DMF (diffuse yellow), 1-butanol (double dotted
dashed green).
The electronic properties of the 4-methoxynaphthyl derivative 27 are comparable to
those of compound 24. However, the slope parameter α is found to be nearly twice as
much. This observation made us focussing more intensely on the geometrical arrangement
of the chromophores and prompted us to investigate the influence of steric hindrance on
mesomerism. In comparison, the optical properties of 27 (Figure 9) and its methylated
analogue 28 are only slightly different from each other (Figure 10a). This indicates a similar
0.0
0.5
1.0
250 350 450 550 l in nm
I rel

Results and Discussion
41
intramolecular geometry. A skew arrangement of the aromatic systems seems to be mainly
influenced by peri hydrogen atoms of the naphthalene subunits. These findings were further
confirmed by quantum-chemical calculations (DFT B3LYP 6-311**G, N-alkyl was replaced by
methyl) as shown in Figure 10b-e. Hence, the steric influence of the methyl group in 28 is only
subordinated (dihedral angle 75.38°) and does not affect the geometry significantly (71.60°
for 27). Comparison of the 3,4,5-trimethoxyphenyl naphthalimides 26 (57.34°) and 32 exhibits
much more pronounced effects. The absorption properties of both trimethoxy-derivatives
display comparable behavior with maxima at 362.2 nm ( = 15900 L mol-1 cm-1) and 344.8 nm
(e = 16200 L mol-1 cm-1). Steric repulsion of the methyl groups in 32 arranges the two aromatic
systems statically fixed. The nearly orthogonal geometry (87.42°) results in a strong quenching
of the fluorescence. This is attributed to the lack of orbital overlap. Calculated structures and
molecular orbitals are depicted in Table 7.
Figure 10: Comparison of 27 and 28. a) Absortion (left) and fluorescence spectra of 27 (black) and
28 (red); b-e) Optimized structures of 27 and 28 (B3LYP 6-311**G); b) Electronic ground state of 27; c)
Electronically excited state of 27; d) Electronic ground state of 28; e) Electronically excited state of 28.

Results and Discussion
42
Table 7: Quantumchemical calculations of 23-30, 32 and 34.
Struct. E0a Struct. E1
b HOMO E0c LUMO E0
d HOMO E1e LUMO E1
f
23
24
25
26
27

Results and Discussion
43
28
29
30
32
34
Optimized structures and electron density of HOMO and LUMO (DFT B3LYP and CIS 6-311**G basis
set). a) Optimized structure in electronic groundstate; b) Optimized structure in electronically excited
state; c) HOMO in electronic groundstate; d) LUMO in electronic ground state; e) HOMO in
electronically excited state; f) LUMO in electronically excited state.

Results and Discussion
44
The proposed planarization of the molecule in the excited state is supported by DFT
calculation (CIS 6-311G**) and summarized in Table 6-7. Differences of the dihedral angles of
up to 24° (34) are calculated for phenyl-substitution. Napththyl derivatives 27 and 28 exhibit
stronger planarization with angle differences of 28° and 30°. The quantum chemical
calculations are in good agreement to the expectations from measured optical spectra.
Changes in dipole moments also fit the experimental data. A qualitative tendency associates
large changes in the dipol moment with large experimental Stokes’ shifts and pronounced
fluorescent solvatochromism. However, values of 26 and 30 are too small to explain the
observed strong solvatochromism of the fluorescence. Furthermore, the calculated orbital
energies were compared to experimental optical data in Table 8. Whereas absorption is
represented quite well within the range of unpredicted influences such as s olvent effects,
fluorescence energy values would exceed the respective energies of the band gap in the
ground state by far. Thus, calculated MO energies were not regarded for dynamic analysis.
In addition to analysis according to the ET(30) concept of Dimroth and Reichardt and Brooker’s
R scale above the concepts of Kawski[50], Kamlet, Taft and Abboud[51] and Catalán[52] were
applied.
Table 8: Comparision of quantum chemically calculated optical values with experimental
results.
Eabsa labs (calc.)b labs (meas.)c
23 3.782 327.8 355.4
24 3.592 345.2 364.8
25 2.939 421.9 426.2
26 3.483 356.0 362.2
27 3.265 379.7 325.0
28 3.157 392.8 329.0
29 3.782 327.8 356.0
30 3.810 325.5 366.4
32 3.674 337.5 344.8
34 3.320 373.5 364.4
a) Calculated HOMO-LUMO difference in eV (DFT B3LYP 6-311**G); b) Calculated HOMO-LUMO
difference in nm; c) Experimentally determined absorption maxima in chloroform.
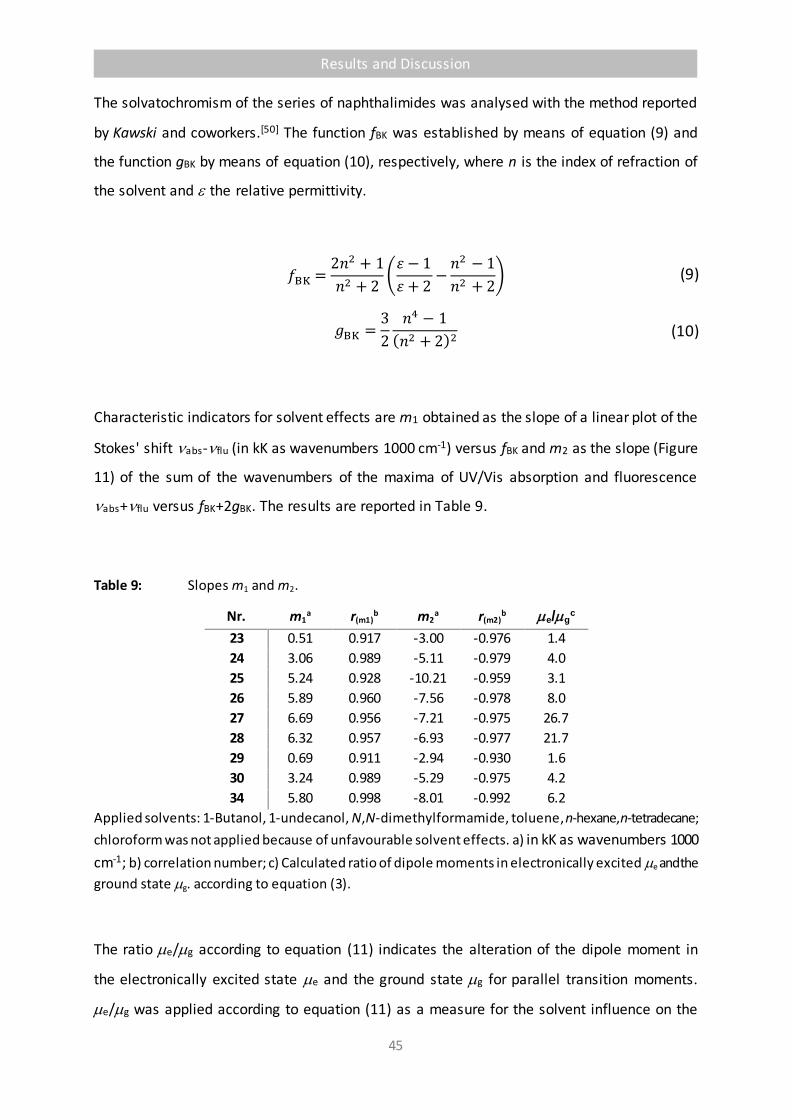
Results and Discussion
45
The solvatochromism of the series of naphthalimides was analysed with the method reported
by Kawski and coworkers.[50] The function fBK was established by means of equation (9) and
the function gBK by means of equation (10), respectively, where n is the index of refraction of
the solvent and the relative permittivity.
𝑓BK =2𝑛2 + 1
𝑛2 + 2(
휀 − 1
휀 + 2−
𝑛2 − 1
𝑛2 + 2)
𝑔BK =3
2
𝑛4 − 1
(𝑛2 + 2)2
(9)
(10)
Characteristic indicators for solvent effects are m1 obtained as the slope of a linear plot of the
Stokes' shift abs-flu (in kK as wavenumbers 1000 cm-1) versus fBK and m2 as the slope (Figure
11) of the sum of the wavenumbers of the maxima of UV/Vis absorption and fluorescence
abs+flu versus fBK+2gBK. The results are reported in Table 9.
Table 9: Slopes m1 and m2.
Nr. m1a r(m1)
b m2a r(m2)
b e/gc
23 0.51 0.917 -3.00 -0.976 1.4
24 3.06 0.989 -5.11 -0.979 4.0
25 5.24 0.928 -10.21 -0.959 3.1
26 5.89 0.960 -7.56 -0.978 8.0
27 6.69 0.956 -7.21 -0.975 26.7
28 6.32 0.957 -6.93 -0.977 21.7
29 0.69 0.911 -2.94 -0.930 1.6
30 3.24 0.989 -5.29 -0.975 4.2
34 5.80 0.998 -8.01 -0.992 6.2
Applied solvents: 1-Butanol, 1-undecanol, N,N-dimethylformamide, toluene, n-hexane, n-tetradecane;
chloroform was not applied because of unfavourable solvent effects. a) in kK as wavenumbers 1000
cm-1; b) correlation number; c) Calculated ratio of dipole moments in electronically excited e and the
ground state g. according to equation (3).
The ratio e/g according to equation (11) indicates the alteration of the dipole moment in
the electronically excited state e and the ground state g for parallel transition moments.
e/g was applied according to equation (11) as a measure for the solvent influence on the

Results and Discussion
46
electronic spectra. A clear maximum was found for 27 verifying the concept of twisted donor
acceptor systems enhancing strong fluorescent solvatochromism. The value of 27 exceeds
even the effect of the prolonged electronic system in 34 due to higher intra-molecular
dynamics. The linear correlations on the basis of fBKand gBK are reported in Figure 11.
𝜇e
𝜇g
=|𝑚1| + |𝑚2|
|𝑚2| − |𝑚1|
(11)
Figure 11: Linear correlations of the Stokes' shift abs-flu (in 1000 cm-1) of 23-30 and 34 versus fBK
to obtain m1 and of the sum labs+lflu versus fBK+2gBK to obtain m2.
The series of peri-aryl naphthalimides was further analysed by means of the multi parameter
approach of equation (12) developed by Kamlet, Taft and Abboud[51] where solvent effects
were generalized to any solvent-dependent property XYZ. The sensitivity to dipolar-
polarizability term is characterized by s where a correction d concerns the polarizability. The
paramers a and b are attributed to hydrogen acceptor and donor properties. Equation (12)
was applied to the ET values (see equation(7)) of the fluorescence of 23-30 and 34 and we
optimized the parameters of equation (12) by least square fitting. The results are reported in
Table 10 where the values s indicates a generally pronounced sensitivity to solvent effects.

Results and Discussion
47
Large s-values were found for the intensively discussed 27 as well as for 26, 28 and 34. A minor
variation is found for the parameter d except for the dimethylaminophenyl derivative 25. A
high value of a is found for the latter as one my expect for acceptors of hydrogen bonds. There
are only minor variations for the other values of a and b in accordance with the lack of
pronounced effects of hydrogen bonds.
𝐸T = 𝑋𝑌𝑍 = 𝑋𝑌𝑍0 + 𝑠(𝜋 ∗ + 𝑑𝛿) + 𝑎𝛼 + 𝑏𝛽 (12)
Table 10: Calculated parameters XYZ0, s, d, a and b by means of least square fits of the
experimental ET values of fluorescence according to equation (12). Solvents: 1-Butanol, N,N-dimethylformamide, chloroform, toluene, n-hexane.
Nr. XYZ0 s d a b
23 70.71 -3.64 -0.27 -2.30 -0.83
24 66.85 -7.32 -0.28 -3.25 -4.20
25 61.29 -6.29 0.60 -14.37 -3.80
26 63.62 -16.68 -0.23 -3.26 -3.95
27 65.80 -14.22 -0.17 -6.00 -6.02
28 64.48 -15.94 -0.20 -4.92 -3.80
29 70.00 -3.75 -0.20 -2.24 -0.91
30 69.51 -8.41 -0.27 -4.25 -3.38
34 65.77 -15.18 -0.39 -4.12 -4.94
Finally, the multi parameter approach of equation (13) of Catalán[52] with the generalized
solvent effect A was applied to the ET-values (equation (7)) of the solvatochromism of
fluorescence of the naphthalimides 23-30 and 34.
𝐸T = 𝐴 = 𝐴0 + 𝑏SA + 𝑐SB + 𝑑SP + 𝑒SdP (13)
Equation (13) was applied and the parameters A0, b, c, d and e were optimized by means of
least square fitting (Table 11).
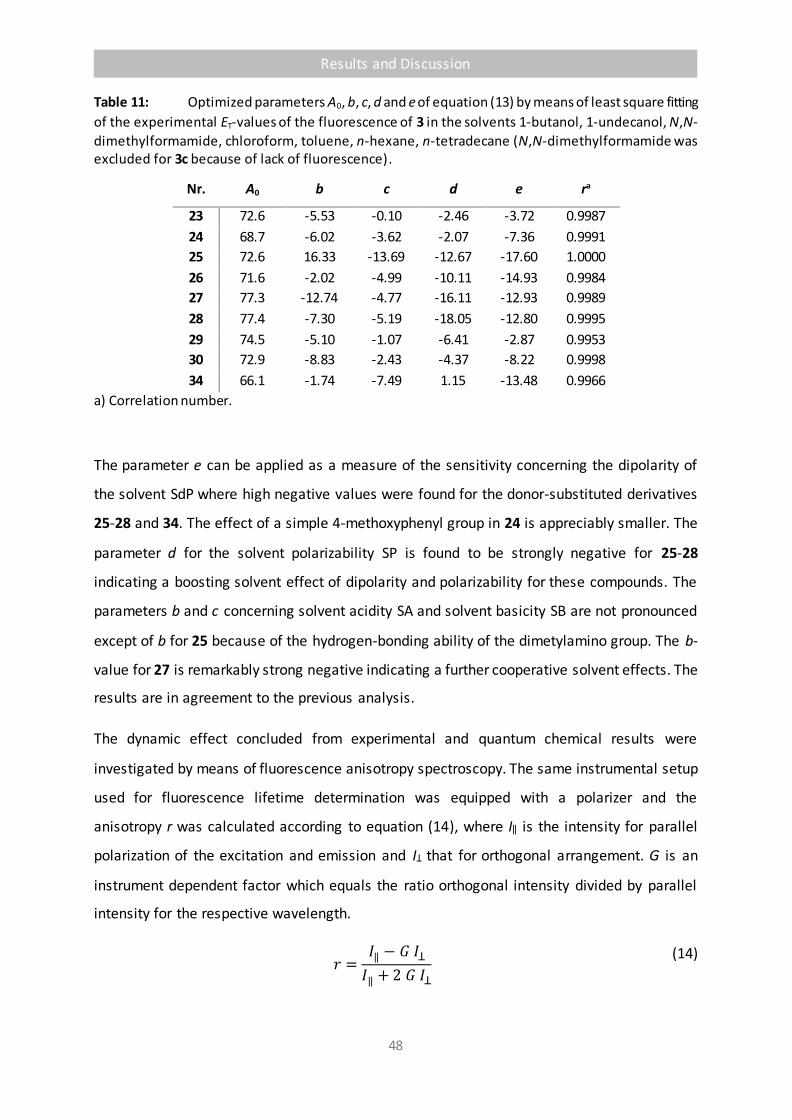
Results and Discussion
48
Table 11: Optimized parameters A0, b, c, d and e of equation (13) by means of least square fitting
of the experimental ET-values of the fluorescence of 3 in the solvents 1-butanol, 1-undecanol, N,N-
dimethylformamide, chloroform, toluene, n-hexane, n-tetradecane (N,N-dimethylformamide was excluded for 3c because of lack of fluorescence).
Nr. A0 b c d e ra
23 72.6 -5.53 -0.10 -2.46 -3.72 0.9987
24 68.7 -6.02 -3.62 -2.07 -7.36 0.9991
25 72.6 16.33 -13.69 -12.67 -17.60 1.0000
26 71.6 -2.02 -4.99 -10.11 -14.93 0.9984
27 77.3 -12.74 -4.77 -16.11 -12.93 0.9989
28 77.4 -7.30 -5.19 -18.05 -12.80 0.9995
29 74.5 -5.10 -1.07 -6.41 -2.87 0.9953
30 72.9 -8.83 -2.43 -4.37 -8.22 0.9998
34 66.1 -1.74 -7.49 1.15 -13.48 0.9966
a) Correlation number.
The parameter e can be applied as a measure of the sensitivity concerning the dipolarity of
the solvent SdP where high negative values were found for the donor-substituted derivatives
25-28 and 34. The effect of a simple 4-methoxyphenyl group in 24 is appreciably smaller. The
parameter d for the solvent polarizability SP is found to be strongly negative for 25-28
indicating a boosting solvent effect of dipolarity and polarizability for these compounds. The
parameters b and c concerning solvent acidity SA and solvent basicity SB are not pronounced
except of b for 25 because of the hydrogen-bonding ability of the dimetylamino group. The b-
value for 27 is remarkably strong negative indicating a further cooperative solvent effects. The
results are in agreement to the previous analysis.
The dynamic effect concluded from experimental and quantum chemical results were
investigated by means of fluorescence anisotropy spectroscopy. The same instrumental setup
used for fluorescence lifetime determination was equipped with a polarizer and the
anisotropy r was calculated according to equation (14), where I‖ is the intensity for parallel
polarization of the excitation and emission and IꞱ that for orthogonal arrangement. G is an
instrument dependent factor which equals the ratio orthogonal intensity divided by parallel
intensity for the respective wavelength.
𝑟 =
𝐼‖ − 𝐺 𝐼Ʇ𝐼‖ + 2 𝐺 𝐼Ʇ
(14)

Results and Discussion
49
Measurements in solution did not display any specific behaviour because rotation of the
molecules influences their global orientation and results in a fast decay of the measured
anisotropy. Thus, naphthalimides 24, 27 and 28 were incorporated in PMMA-films with
thicknesses of several 100 m to prevent rotation. The time-resolved anisotropy of 24, 27 and
28 is compared in Figure 12.
Figure 12: Time resolved anisotropy of naphthalimides 24, 27 and 28 in PMMA films. a)
Anisotropy (red), parallel fluorescence decay (black) and perpendicular fluorescence decay (grey) of
24; b) Anisotropy (red), parallel fluorescence decay (black) and perpendicular fluorescence decay
(grey) of 27; c) Anisotropy (red), parallel fluorescence decay (black) and perpendicular fluorescence
decay (grey) of 28; d) Comparison of the anisotropy of 24 (black), 27 (red) and 28 (grey).
The fluorescence anisotropy starts with the intrinsic anisotropy at the maximum at t = 0
(Figure 12d). Typical values between 0.3 and 0.4 are observed. The methylated naphylimide
28 displays slightly lower anisotropy. The methoxyphenyl derivative 24 exhibits much longer
persistence of the initial anisotropy than the methoxynaphthyl derivatives 27-28. This is
attributed to longer fluorescence lifetimes in comparably low polar PMMA (Table 2) which
were determined to be 3.63 ns (24), 1.56 ns (27) and 1.67 ns (28). There is no reason to assume
higher mobility of the structural comparable and even larger naphthylimides 27-28. Hence, a
slight tendency of lower fluorescence anisotropy values for more twisted molecules can be
observed but is insufficient for validation and analysis of molecular dynamics.
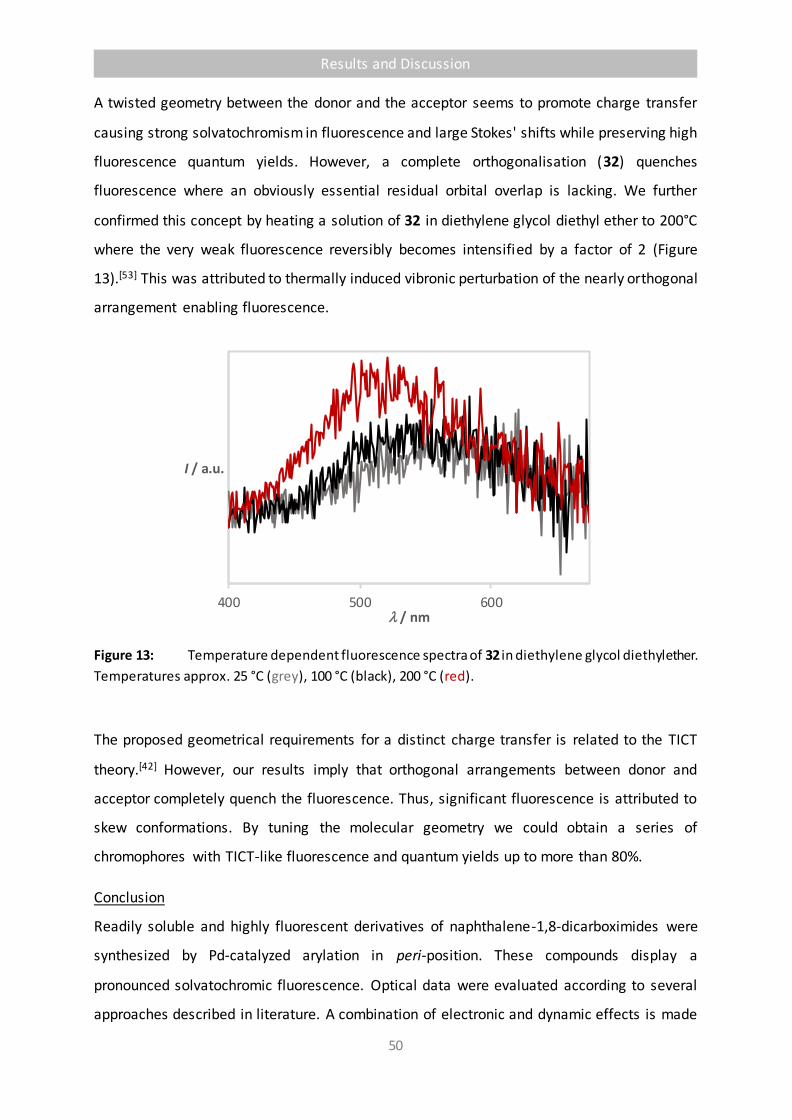
Results and Discussion
50
A twisted geometry between the donor and the acceptor seems to promote charge transfer
causing strong solvatochromism in fluorescence and large Stokes' shifts while preserving high
fluorescence quantum yields. However, a complete orthogonalisation (32) quenches
fluorescence where an obviously essential residual orbital overlap is lacking. We further
confirmed this concept by heating a solution of 32 in diethylene glycol diethyl ether to 200°C
where the very weak fluorescence reversibly becomes intensified by a factor of 2 (Figure
13).[53] This was attributed to thermally induced vibronic perturbation of the nearly orthogonal
arrangement enabling fluorescence.
Figure 13: Temperature dependent fluorescence spectra of 32 in diethylene glycol diethyl ether.
Temperatures approx. 25 °C (grey), 100 °C (black), 200 °C (red).
The proposed geometrical requirements for a distinct charge transfer is related to the TICT
theory.[42] However, our results imply that orthogonal arrangements between donor and
acceptor completely quench the fluorescence. Thus, significant fluorescence is attributed to
skew conformations. By tuning the molecular geometry we could obtain a series of
chromophores with TICT-like fluorescence and quantum yields up to more than 80%.
Conclusion
Readily soluble and highly fluorescent derivatives of naphthalene-1,8-dicarboximides were
synthesized by Pd-catalyzed arylation in peri-position. These compounds display a
pronounced solvatochromic fluorescence. Optical data were evaluated according to several
approaches described in literature. A combination of electronic and dynamic effects is made
400 500 600
I / a.u.
l / nm

Results and Discussion
51
responsible for these properties and was confirmed by quantum chemical calculations. The
photo-induced charge transfer from the electron rich aryl moiety to the naphthalimide is
enhanced in polar solvents and causes a bathochromic shift of the fluorescence. This in turn
strongly depends on the molecular geometry of the fluorophore. The intramolecular
arrangement influences the intensity of the charge transfer. A skew geometry between donor
and acceptor still allows high fluorescent quantum yields and favours a more pronounced
charge transfer resulting in both, distinct solvatochromism and large Stokes’ shifts,
corresponding to the TICT mechanism. However, nearly orthogonal orientation leads to
strongly quenched fluorescence being attributed to a lack of orbital overlap. Thus, an opposed
mechanism is found to be more likely where the electronic ground state exhibits high dihedral
angles that planarize in the excited state. Still, the sensitivity toward solvent polarity is caused
by intra-molecular charge transfer and a geometric twist occurs after excitation. However, the
mechanism works vice versa to common TICT theory. This interplay of electronic and
geometric effects results in highly fluorescent compounds such as 24 and 27 with easily
adjustable emission spectra controlled by medium effects. This provides very large Stokes'
shifts exceeding 200 nm (approx. 1.6 eV) being of interest for various applications such as for
frequency converters, fluorescence optical fibers and highly tunable light sources.
2.2.2 Synthesis and Characterization of Substituted Anthracene Dicarboximides
Langhals et al. report on amination reactions of perylene tetracarboxylicdiimides at low
temperatures.[54] The same behavior was investigated in this work for smaller annulated aryls
to result in geometrically and electronically dynamic asymmetrical fluorophores. Anthracen-
1,9-dicarboximides are readily accessible fluorescent dyes. This class of dyes was chosen due
to its high reactivity and the structural comparability to well-studied annulated aryls such as
perylenes. However, the smaller aromatic -system causes less aggregation and thus enables
a wider range of modifications. Nevertheless, the absorption extends to the visible region. A
highly reactive site in anthracene dicarboximide is found at the C-10 carbon atom enabling
substitution reactions under mild conditions, shown in Scheme 11. A mesomeric resonance
structure induces a positive partial charge increasing the electrophilicity in that position.
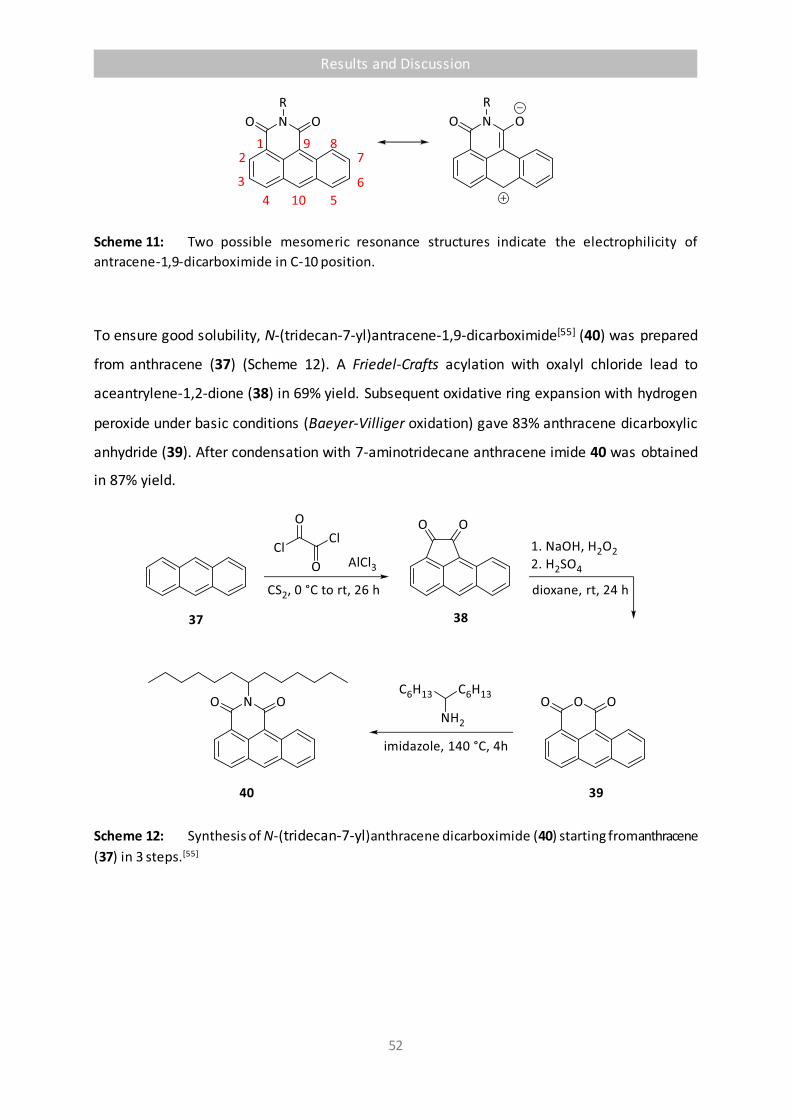
Results and Discussion
52
Scheme 11: Two possible mesomeric resonance structures indicate the electrophilicity of
antracene-1,9-dicarboximide in C-10 position.
To ensure good solubility, N-(tridecan-7-yl)antracene-1,9-dicarboximide[55] (40) was prepared
from anthracene (37) (Scheme 12). A Friedel-Crafts acylation with oxalyl chloride lead to
aceantrylene-1,2-dione (38) in 69% yield. Subsequent oxidative ring expansion with hydrogen
peroxide under basic conditions (Baeyer-Villiger oxidation) gave 83% anthracene dicarboxylic
anhydride (39). After condensation with 7-aminotridecane anthracene imide 40 was obtained
in 87% yield.
Scheme 12: Synthesis of N-(tridecan-7-yl)anthracene dicarboximide (40) starting from anthracene
(37) in 3 steps.[55]

Results and Discussion
53
Figure 14: Absorption (red) and fluorescence (grey) spectra of N-(tridecan-7-yl)anthracene
dicarboximide (40) in chloroform.
The absorption maximum of anthracene imide 40 is found at 435.2 nm (Figure 14). The
compound displays a structured fluorescence with peaks at 482.5 nm and 512.8 nm. The
Stokes’ shift is comparably pronounced with 47.3 nm (0.273 eV). This can be attributed to the
polarizability promoted by the anthraquinoid resonance structure presented in Scheme 11.
This causes different dipole moments for the ground state and the excited state. The same
electronical behavior results a moderate solvatochromism of the fluorescence illustrated in
Figure 15.
0
0.5
1
300 400 500 600 700
Irel
l / nm

Results and Discussion
54
Figure 15: Positions of the fluorescence maxima of N-(tridecan-7-yl)anthracene dicarboximide
(40) in different solvents in relation to the ET(30)-values[56] of the respective solvent.
2.2.2.1 N-Substituted 10-Aminoanthracene-1,9-dicarboximides
Substitution of anthracene imide 40 in position 10 would lead to more distinct solvatochromic
effects. An electron donating groups forms a narrow push-pull system with the opposed
electron withdrawing carbonyl moiety. Particularly amines can not only serve as electron
donors, but also take part in dynamic effects. Analogously to the highly solvatochromic 4-
amino-N-methylphthalimide as the basis of Zelinski’s universal S solvent polarity scale[43] and
4-methoxynaphthalene dicarboximide[57] electronic excitation induces an alteration of the
dipole moment resulting in large Stokes’ shifts.
Several amines were converted with anthracene imide 40 (summarized in Table 12). The
reaction conditions were varied between 0 °C and 120 °C but did not seem to influence the
reactions or yields significantly. As a consequence, most reactions were performed at room
temperature for 1.5 h up to 14 d. Reactions were carried out with and without additional base
(K2CO3 or KOtBu). When no differences between the conditions were recognized the more
moderate option was studied. Liquid amines were used under solvent free conditions whereas
solid amines were dissolved in a minimum amount of DMF.
cyclohexane
diethyl ethertoluene
ethyl acetate
mesitylene
chloroform
acetone
acetonitrile
DMF
N-Methyl-2-pyrrolidine
n-butanol
DMSO
methanol
30
40
50
60
450 470 490 510
ET(30)
l / nm
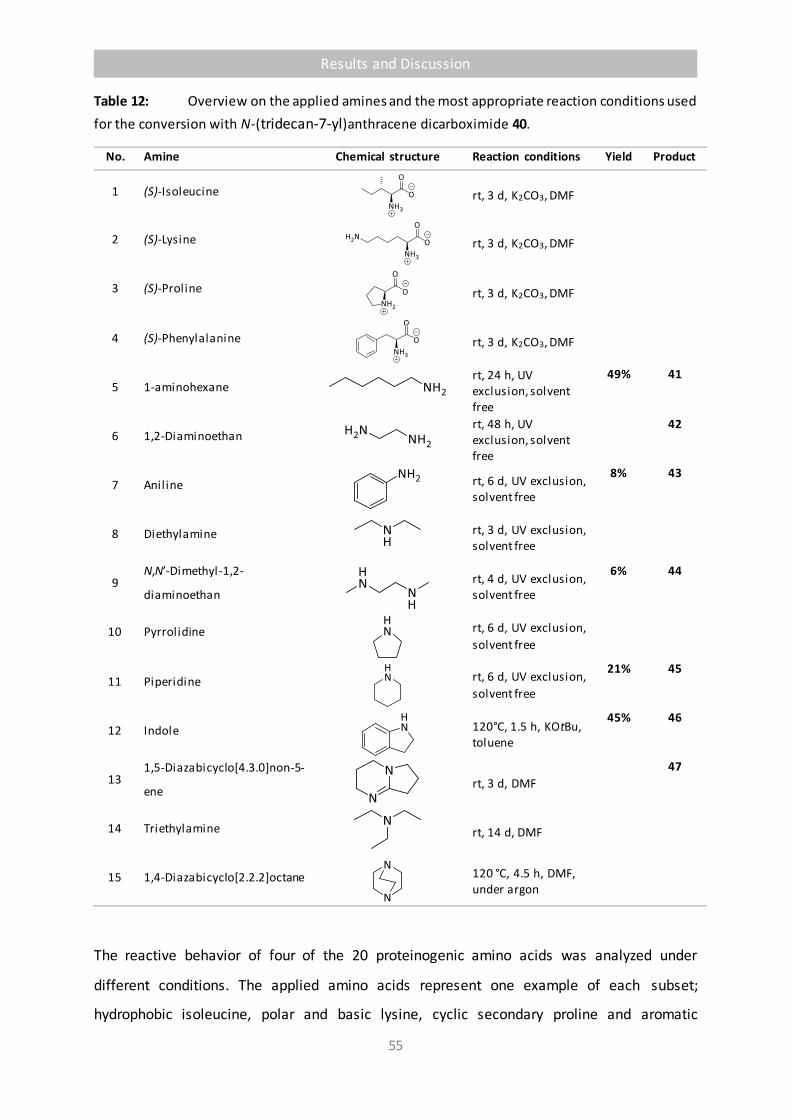
Results and Discussion
55
Table 12: Overview on the applied amines and the most appropriate reaction conditions used
for the conversion with N-(tridecan-7-yl)anthracene dicarboximide 40.
No. Amine Chemical structure Reaction conditions Yield Product
1 (S)-Isoleucine
rt, 3 d, K2CO3, DMF
2 (S)-Lysine
rt, 3 d, K2CO3, DMF
3 (S)-Proline
rt, 3 d, K2CO3, DMF
4 (S)-Phenylalanine
rt, 3 d, K2CO3, DMF
5 1-aminohexane
rt, 24 h, UV exclusion, solvent free
49% 41
6 1,2-Diaminoethan
rt, 48 h, UV exclusion, solvent free
42
7 Aniline
rt, 6 d, UV exclusion, solvent free
8% 43
8 Diethylamine
rt, 3 d, UV exclusion, solvent free
9 N,N’-Dimethyl-1,2-
diaminoethan
rt, 4 d, UV exclusion, solvent free
6% 44
10 Pyrrolidine
rt, 6 d, UV exclusion,
solvent free
11 Piperidine
rt, 6 d, UV exclusion,
solvent free
21% 45
12 Indole
120°C, 1.5 h, KOtBu, toluene
45% 46
13 1,5-Diazabicyclo[4.3.0]non-5-
ene
rt, 3 d, DMF
47
14 Triethylamine
rt, 14 d, DMF
15 1,4-Diazabicyclo[2.2.2]octane
120 °C, 4.5 h, DMF, under argon
The reactive behavior of four of the 20 proteinogenic amino acids was analyzed under
different conditions. The applied amino acids represent one example of each subset;
hydrophobic isoleucine, polar and basic lysine, cyclic secondary proline and aromatic
Results and Discussion
56
phenylalanine. The reactions were performed in DMF and ethanol, in each case with and
without potassium carbonate addition. In both approaches, temperatures were varied
between room temperature and 120 °C (for DMF) or 80 °C (for ethanol), respectively. The
reaction times were kept between 1 h and 3 d. In all reactions a slight intensification of the
yellow color was observed. However, neither of these approaches succeed in a reaction.
Terminal and aromatic primary amines were applied without solvent and display a more
pronounced reactivity towards anthracene carboximide 40. Both, 1-aminohexane and 1,2-
diaminoethan turn red directly after addition at room temperature without solvent or
auxiliary base. The reaction with aniline was more slowly, first discoloration was recognized
after a few minutes. After 1-6 d at room temperature water was added to all batches followed
by extraction with chloroform and purification via column chromatography. For all three
batches, red solids were obtained (Scheme 15) and analyzed with mass spectrometrie and
optical spectroscopy (Figure 17). However, they seem to decompose within severals days
under UV-radiation. Hence, the reactions and isolation steps were carried out under UV
exclusion.
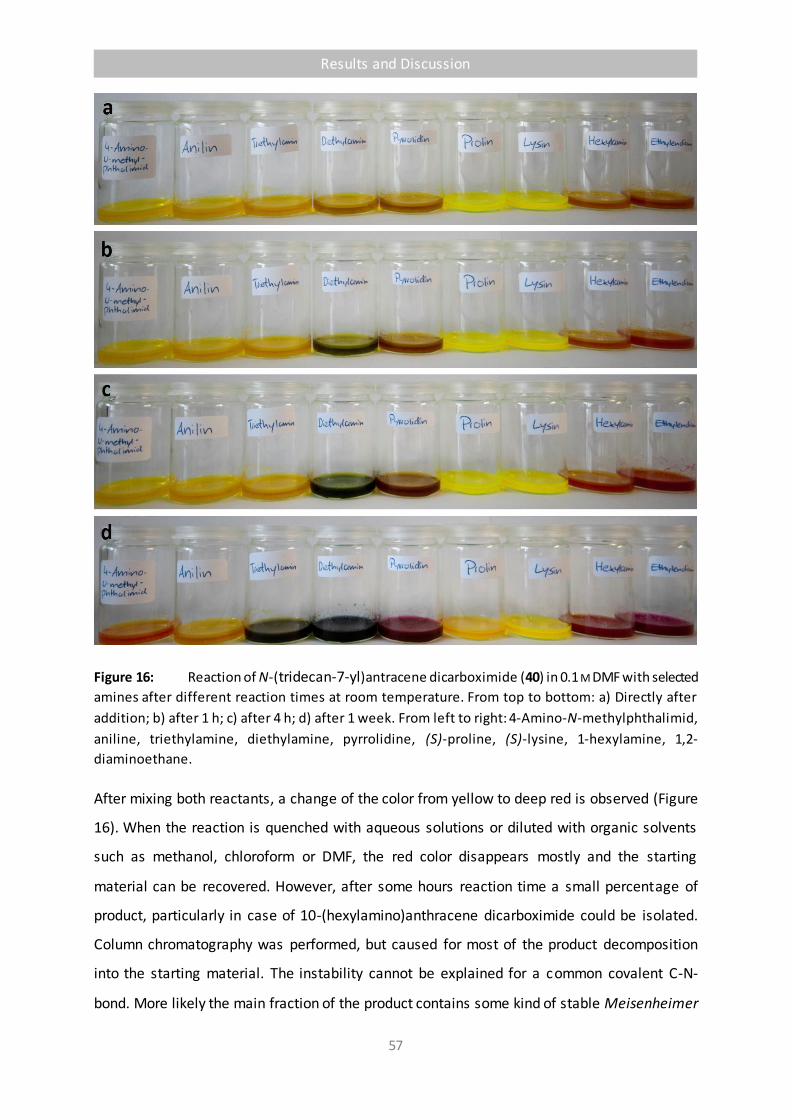
Results and Discussion
57
Figure 16: Reaction of N-(tridecan-7-yl)antracene dicarboximide (40) in 0.1 M DMF with selected
amines after different reaction times at room temperature. From top to bottom: a) Directly after
addition; b) after 1 h; c) after 4 h; d) after 1 week. From left to right: 4-Amino-N-methylphthalimid,
aniline, triethylamine, diethylamine, pyrrolidine, (S)-proline, (S)-lysine, 1-hexylamine, 1,2-
diaminoethane.
After mixing both reactants, a change of the color from yellow to deep red is observed (Figure
16). When the reaction is quenched with aqueous solutions or diluted with organic solvents
such as methanol, chloroform or DMF, the red color disappears mostly and the starting
material can be recovered. However, after some hours reaction time a small percentage of
product, particularly in case of 10-(hexylamino)anthracene dicarboximide could be isolated.
Column chromatography was performed, but caused for most of the product decomposition
into the starting material. The instability cannot be explained for a common covalent C-N-
bond. More likely the main fraction of the product contains some kind of stable Meisenheimer

Results and Discussion
58
adduct. Surprisingly, most species exhibited significant fluorescence. The ecaxt fluorescence
quantum yield could not be determined but are rated in the area of approximately 0.10.
Optical spectra of the isolated compounds were reported in Figure 17. Further reactions below
will be discussed regarding these aspects.
Figure 17: UV/Vis absorption (left) and fluorescence (right) spectra of the ami nation products
from 1-aminohexane (41) (red) and 1,2-diaminoethane (42) (grey) in chloroform. 10-
(phenylamino)anthracene dicarboximide (43) exhibited no fluorescence but absorption (black) only.
For secondary amines, the same observations were made as for primary ones. Simple
diethylamine and N,N’-dimethyl-1,2-diaminoethene (DMEDA) were applied as aliphatic
amines. As cyclic representatives pyrrolidine, piperidine and the partial aromatic indole were
investigated. All reactions took place at room temperature for 3-6 d, exept the solid indole
had to be dissolved in toluene and was treated with potassium tert-butoxide and heated to
120 °C for 90 min. Changes in color were observed for every approach after a short period of
time. After treatment with water or dilution with organic solvents mostly the starting
materials were recovered. In case of DMEDA, piperidine and indole, the respective products
(Scheme 15) could be isolated in moderate yields and were verified via mass spectrometry.
Optical spectra are given in Figure 18.
0
0.5
1
300 500 700
Irel
l / nm

Results and Discussion
59
Figure 18: UV/Vis absorption (left) and fluorescence (right) spectra of amines 44 (red), 45 (grey)
and 46 (black) in chloroform. The yellow spectrum displays the unstable -adduct with pyrrolidine.
Reactions of anthracene dicarboximide 40 with tertiary amines such as 1,5-
Diazabicyclo[4.3.0]non-5-ene (DBN), triethylamine or 1,4-Diazabicyclo[2.2.2]octane (DABCO)
aslo exhibit a strong color shift (Figure 16). However, only in the first example the strongly
fluorescent ( = 0.96 in chloroform, 0.63 in methanol) product 47 (Scheme 15) could be
isolated and analyzed.
The reactivity of tertiary amines is generally very different compared to primary or secondary
amines. The lone pair still acts for a nucleophile. Thus, if steric hindrance does not occur, the
formation of a Meisenheimer -adduct is also possible. The absence of an abstractable proton
impedes the rearomatization of the anthracene unit and thus the reaction. In the reaction
with DBN, the cleavage of H2 can be realized alternatively (Scheme 13) and might be a reason
that only this tertiary amine was converted successfully. The optical spectra are shown in
Figure 19.
0
0.5
1
300 500 700
Irel
l / nm

Results and Discussion
60
Scheme 13: Proposed reaction mechanism for the formation of amine 47.
Figure 19: UV/Vis-absorption (red) and fluorescence (grey) spectra of amine 47 in chloroform.
All approaches except those using amino acids (Table 12) have some key behavior in common.
Mixing anthracene dicarboximide 40 with different amines results in a bathochromic change
of the color. The obtained color is brilliant (Figure 16) indicating a single substance. Addition
of water or organic solvent causes the disappearance of that color shift and mostly the starting
materials are recovered. This pleads for adduct formation such as a Meisenheimer -adduct
(Scheme 14) being responsible for the observed color. Novikov et al. report evidence for
electron transfer[58] in such adducts by the examples of simple N-hetero arenes such as
pyridine and quinoline. Radical scavengers inhibit the formation which can be an explanation
for the failure of any reaction of amino acids with anthracene dicarboximide 40.
0
0.5
1
300 500 700
Irel
l / nm

Results and Discussion
61
The reaction of amines with anthracene imides proceeds most probably in a Chichibabin-like
mechanism[59]. The lone pair of the amine (or nucleophile in general) attacks the partially
positive C-10 carbon of the anthracene imide. With the exclusion of redox reactions, in
particular under inert gas, H2 must be lost and may evolve. In contrast to the standard
Chichibabin reaction a neutral amine attacks the aryl, not an amide anion. The favorable
mesomeric resonance of the anthracene imide favors the formation of a -adduct under these
conditions. Opposed to most described mechanisms [58], hydride cleavage is hindered under
these circumstances as two positive charges (at least partial positive at C-10 due to mesomeric
resonance) would be directly next to each other. Furthermore, successful reaction at low
temperatures (room temperature) contradicts most empirical descriptions. Thus, the H2
evolution would be concerted or starts with the abstraction of the N-proton. Basic self-
catalysis would develop a formal amide in agreement with the initial hydride cleavage
described in literature. However, addition of supplemental base did not seem to interfere with
the reaction (except for amino acids to recover the nitrogen lone pair in zwitter-ionic
structure).
Scheme 14: Proposed Chichibabin-like reaction mechanism of amines with N-(tridecan-7-
yl)anthracene imide. Two possible reactions either form the product ( red) or lead to the collapse of
the -adduct to recover starting material (yellow).

Results and Discussion
62
Furthermore, the formation of the Meisenheimer adduct also takes place for tertiary amines
such as triethylamine (compare Figure 16). Addition of water causes the protonation of the
amine subunit and/or oxygen atom of the enolate at the imide and thus, induces the
elimination of the amine from the aryl skeleton. However, mass spectrometry proofed the
molecular mass of the isolated oxidized fully aromatic products. When quenched, the reaction
might have two options to evolve (Scheme 14). One is the described collapse into the starting
materials, the other is the thermodynamically favored, but, due to the formation of hydride,
kinetically hindered formation of the C-N bond.
The isolated and characterized compounds resulted from reaction approaches no. 5-7,9 and
11-13 (compare Table 12). The corresponding products are listed in Scheme 15. Optical data
of the UV-sensitive compounds can be found in Table 13.
Table 13: Optical data of isolated amino compounds 41 – 47.
Compound Abs. a l / nm (Irel) Fluo. b l / nm (Irel)
41 515.4 (1.00) 614.0 (1.00)
42 509.4 (1.00) 583.1 (1.00)
43 343.2 (1.00), 518.2 (0.13) -
44 471.4 (1.00) 577.9 (1.00)
45 486.2 (1.00) 591.2 (1.00)
46 452.8 (1.00), 596.2 (0.28), 653.2 (0.46) 580.0 (1.00)
47 526.4 (0.28), 564.2 (0.68), 608.0 (1.00) 618.1 (1.00), 666.1 (0.25)
a) Relative maxima of absorption, b) relative maxima of fluorescence.

Results and Discussion
63
Scheme 15: Isolated products of the reaction of anthracene dicarboximid with the corresponding
amines (appr. No. for reference in Table 12).
An analogue type of addition-elimination reaction was observed for O-nucleophiles,
particularly potassium hydroxide and potassium tert-butoxide. The reactions were performed
in toluene at 120 °C for 30 min under the exclusion of water. Both resulted in the same
product, 10-hydroxy-anthracen dicarboximid (48). The UV-sensitive product was obtained in
only <5% yield in case of using KOH, whereas application of KOtBu resulted in 56%. Minor
traces of the corresponding 10-tert-butoxy deritative were found in mass spectrometry. The
dealkylation is supposed to be an acid induced iso-butene elimination due to the remaining
water contend of the potassium-tert-butylate or induced during the quenching process using
2 M hydrochloric acid (Scheme 16).

Results and Discussion
64
Scheme 16: Reaction of KOH or KOtBu with anthracen dicarboximide to 10-hydroxyanthracen
dicarboximide 48.
The UV-Vis absortion maximum (Figure 20) of 48 in chloroform is found to be at 473.2 nm and
therefor considerably bathochromically shifted compared to anthracene dicarboximide 40.
However, the shift is slightly less pronounced than in the N-alkyl substituted derivatives above
due to oxygen being the weaker electron donor. A significant fluorescence is detected at
541.0 nm with a second peak at 565.8 nm (Irel = 0.85). The fluorescence quantum yield was
determined to be = 0.30.
Figure 20: UV/Vis absorption (red) and fluorescence (grey) spectra of 48 in chloroform.
0
0.5
1
300 500 700
Irel
l / nm

Results and Discussion
65
Conclusion
Anthracen-1,9-dicarboximid was shown to promptly react with most amines at comparably
low temperature. However, in spite of the spontaneous reaction the rate determining step is
the conversion of the intermediate into the final, oxidized fully aromatic compound. This
requires the formal cleavage of a hydride ion. Reaction temperature did not seem to have a
significant influence on the formation of the product. Some amines already reacted at room
temperature and the product could be isolated and characterized. Unfortunately, all obtained
compounds are unstable concerning UV-radiation limiting the applications as dyes.
Chromatographic methods for purification failed as collected single fractions decomposed
within minutes and exhibited multiple spots in thin layer chromatography, often with much
smaller Rf-values that those of the initial fraction. This lability disables accurate optical
measurements as the compound already decomposes during the investigation and prevents
10-aminoanthracen dicarboximides from serving as valuable fluorescent probes.
2.2.2.2 Transition Metal-Free Homo-Coupling Reactions of Anthracen- and
Naphthalene Dicarboximides
Harsh conditions with elevated temperatures and strong basic conditions further enable
metal-free C-C coupling reactions. Very careful exclusion of moisture and even oxygen allows
a homo-coupling reaction of anthracene dicarboximide (40) at 120 °C. The resulting
aceanthrene green (49) exists in two constitutional isomers, cis and trans (Scheme 17). The
homo-coupling of 40 is described in literature[55] applying a KOH melt at 240 °C. Yao et al.
succeeded to apply Sakamoto’s “Green Route” using KOtBu and DBN.[60] Waiving DBN also
leads to the product in yields comparable to literature. Direct comparison of the reaction with
or without DBN under else same conditions demonstrated even better results omitting DBN.
Thus, the uncertain role of DBN might get obsolete as it does not need to take part in the
presented coupling reaction.
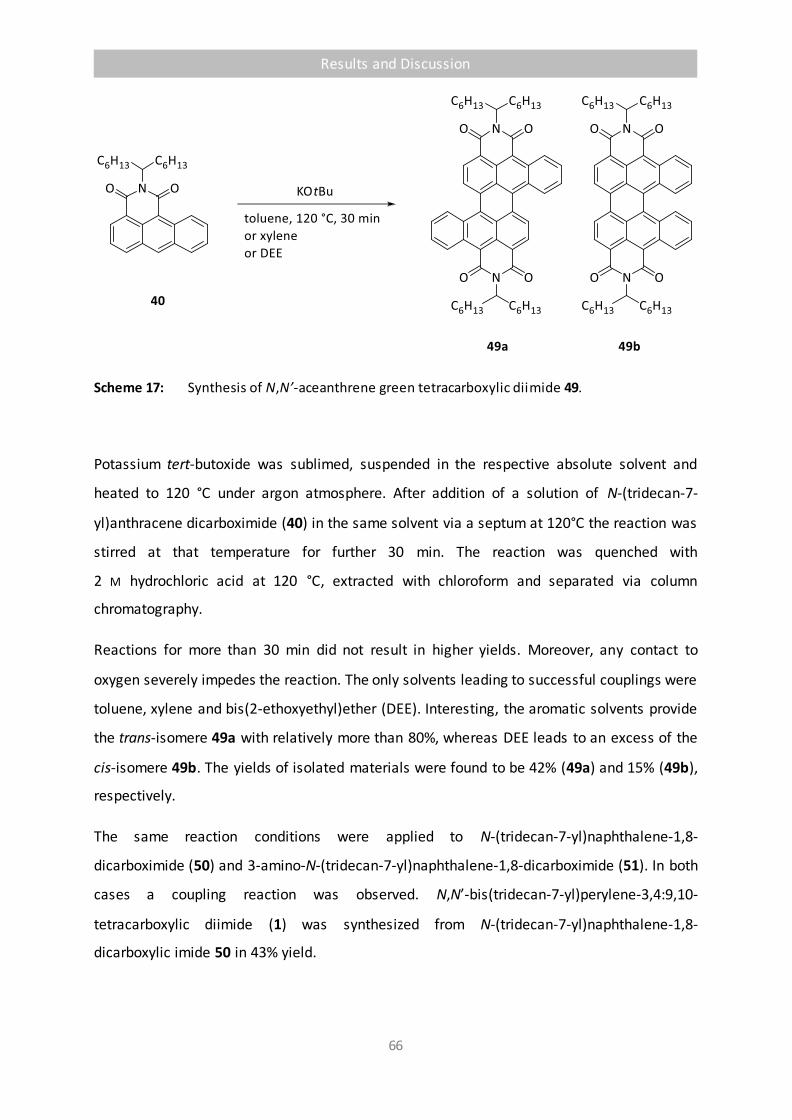
Results and Discussion
66
Scheme 17: Synthesis of N,N’-aceanthrene green tetracarboxylic diimide 49.
Potassium tert-butoxide was sublimed, suspended in the respective absolute solvent and
heated to 120 °C under argon atmosphere. After addition of a solution of N-(tridecan-7-
yl)anthracene dicarboximide (40) in the same solvent via a septum at 120°C the reaction was
stirred at that temperature for further 30 min. The reaction was quenched with
2 M hydrochloric acid at 120 °C, extracted with chloroform and separated via column
chromatography.
Reactions for more than 30 min did not result in higher yields. Moreover, any contact to
oxygen severely impedes the reaction. The only solvents leading to successful couplings were
toluene, xylene and bis(2-ethoxyethyl)ether (DEE). Interesting, the aromatic solvents provide
the trans-isomere 49a with relatively more than 80%, whereas DEE leads to an excess of the
cis-isomere 49b. The yields of isolated materials were found to be 42% (49a) and 15% (49b),
respectively.
The same reaction conditions were applied to N-(tridecan-7-yl)naphthalene-1,8-
dicarboximide (50) and 3-amino-N-(tridecan-7-yl)naphthalene-1,8-dicarboximide (51). In both
cases a coupling reaction was observed. N,N’-bis(tridecan-7-yl)perylene-3,4:9,10-
tetracarboxylic diimide (1) was synthesized from N-(tridecan-7-yl)naphthalene-1,8-
dicarboxylic imide 50 in 43% yield.
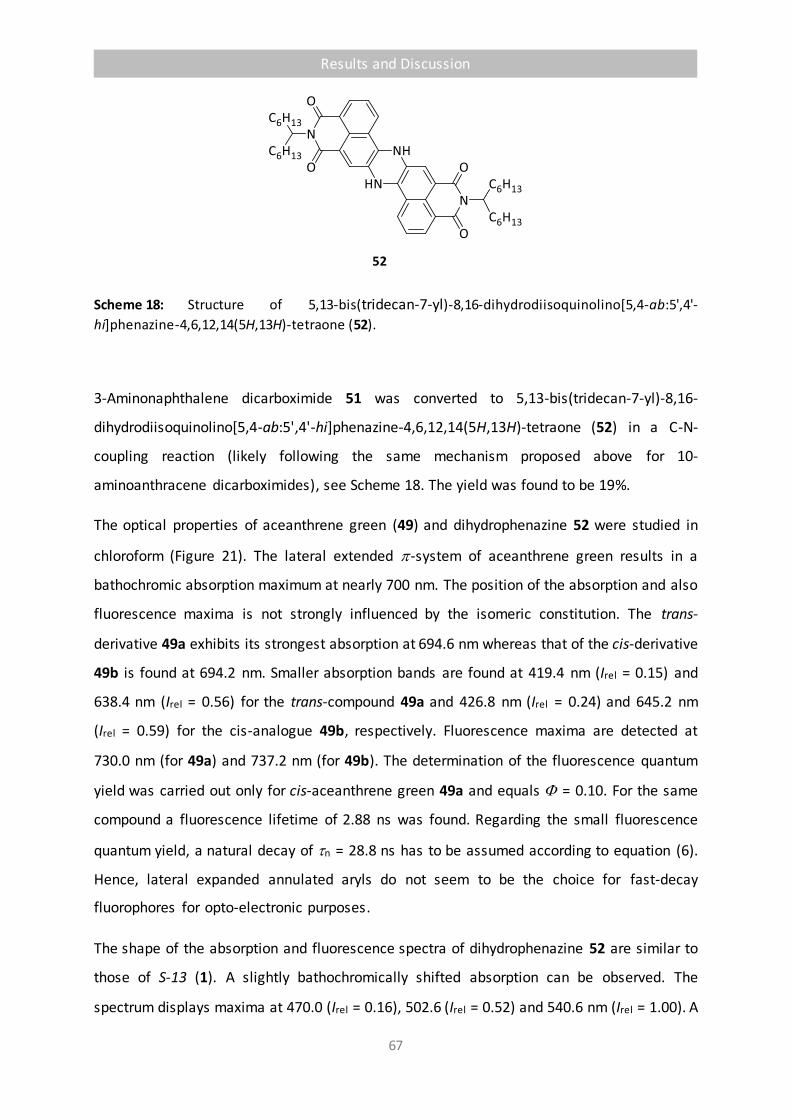
Results and Discussion
67
Scheme 18: Structure of 5,13-bis(tridecan-7-yl)-8,16-dihydrodiisoquinolino[5,4-ab:5',4'-
hi]phenazine-4,6,12,14(5H,13H)-tetraone (52).
3-Aminonaphthalene dicarboximide 51 was converted to 5,13-bis(tridecan-7-yl)-8,16-
dihydrodiisoquinolino[5,4-ab:5',4'-hi]phenazine-4,6,12,14(5H,13H)-tetraone (52) in a C-N-
coupling reaction (likely following the same mechanism proposed above for 10-
aminoanthracene dicarboximides), see Scheme 18. The yield was found to be 19%.
The optical properties of aceanthrene green (49) and dihydrophenazine 52 were studied in
chloroform (Figure 21). The lateral extended -system of aceanthrene green results in a
bathochromic absorption maximum at nearly 700 nm. The position of the absorption and also
fluorescence maxima is not strongly influenced by the isomeric constitution. The trans-
derivative 49a exhibits its strongest absorption at 694.6 nm whereas that of the cis-derivative
49b is found at 694.2 nm. Smaller absorption bands are found at 419.4 nm (Irel = 0.15) and
638.4 nm (Irel = 0.56) for the trans-compound 49a and 426.8 nm (Irel = 0.24) and 645.2 nm
(Irel = 0.59) for the cis-analogue 49b, respectively. Fluorescence maxima are detected at
730.0 nm (for 49a) and 737.2 nm (for 49b). The determination of the fluorescence quantum
yield was carried out only for cis-aceanthrene green 49a and equals = 0.10. For the same
compound a fluorescence lifetime of 2.88 ns was found. Regarding the small fluorescence
quantum yield, a natural decay of n = 28.8 ns has to be assumed according to equation (6).
Hence, lateral expanded annulated aryls do not seem to be the choice for fast-decay
fluorophores for opto-electronic purposes.
The shape of the absorption and fluorescence spectra of dihydrophenazine 52 are similar to
those of S-13 (1). A slightly bathochromically shifted absorption can be observed. The
spectrum displays maxima at 470.0 (Irel = 0.16), 502.6 (Irel = 0.52) and 540.6 nm (Irel = 1.00). A

Results and Discussion
68
strong fluorescence with its maxima at 546.6 (Irel = 1.00) and 592.5 nm (Irel = 0.29) is detected
with a fluorescence quantum yield of = 0.76. The fluorescence lifetime was found to be
3.77 ns and thus, considering the fluorescence quantum yield, slightly longer (n = 4.96 ns,
calculated) than for perylene diimides ( > 0.99, = 3.95 Ns).
Figure 21: UV/Vis (left) and fluorescence (right) spectra of trans-aceanthrene green 49a (red), cis-
aceanthrene green 49b (grey) and dihydrophenazine 52 (balck) in chloroform.
Conclusion
The presented coupling reactions bear the huge advantage of transition-metal free conditions
for C-C coupling reactions. On the downside, they are very limited in the scope of applications.
Only small, well soluble carboximides resulted in any reaction. Anhydrides or simple arenes
such as naphthalene did not take part under the applied conditions. Furthermore, only homo-
coupling was observed. The conversion of N-(tridecan-7-yl)naphthalene-1,8-dicarboximide
(50) with N,N’-bis(tridecan-7-yl)perylene-3,4-dicarboximide for a cross-coupling gave nothing
but starting material. In this case, Sakamoto conditions are reported to work.[34, 61]. However,
selected aryl-aryl-couplings succeeded in acceptable yields of up to 42%. In these cases
standard procedures such as Suzuki-coupling require more steps and much more expensive
reagents and thus, favors the described method for such reactions.
0
0.5
1
200 400 600 800
Irel
l / nm

Results and Discussion
69
2.3
Concentration Dependency
of the Fluorescence Lifetime:
Long-Range Electromagnetic
Molecular Interactions
Indicated by the Process of
Light Emission
H. Langhals, T. Schlücker, Ger. Offen. DE 102014006209.0 (Apr. 29th 2014).
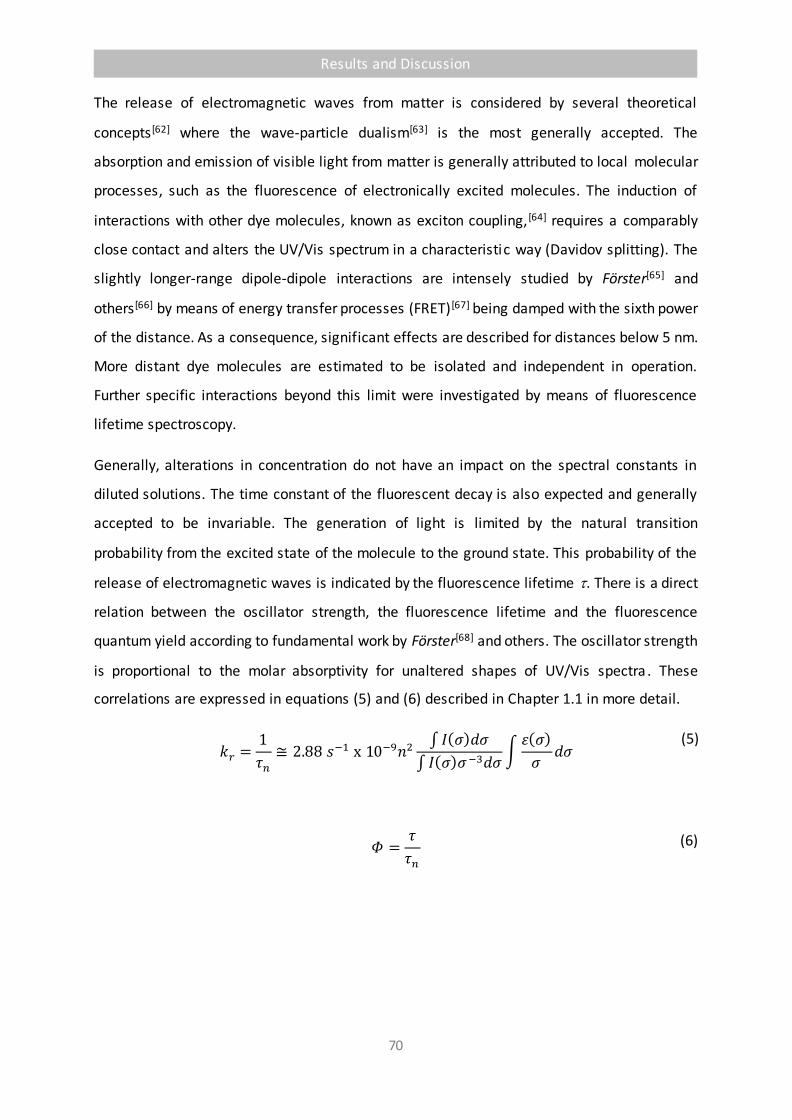
Results and Discussion
70
The release of electromagnetic waves from matter is considered by several theoretical
concepts[62] where the wave-particle dualism[63] is the most generally accepted. The
absorption and emission of visible light from matter is generally attributed to local molecular
processes, such as the fluorescence of electronically excited molecules. The induction of
interactions with other dye molecules, known as exciton coupling,[64] requires a comparably
close contact and alters the UV/Vis spectrum in a characteristic way (Davidov splitting). The
slightly longer-range dipole-dipole interactions are intensely studied by Förster[65] and
others[66] by means of energy transfer processes (FRET)[67] being damped with the sixth power
of the distance. As a consequence, significant effects are described for distances below 5 nm.
More distant dye molecules are estimated to be isolated and independent in operation.
Further specific interactions beyond this limit were investigated by means of fluorescence
lifetime spectroscopy.
Generally, alterations in concentration do not have an impact on the spectral constants in
diluted solutions. The time constant of the fluorescent decay is also expected and generally
accepted to be invariable. The generation of light is limited by the natural transition
probability from the excited state of the molecule to the ground state. This probability of the
release of electromagnetic waves is indicated by the fluorescence lifetime . There is a direct
relation between the oscillator strength, the fluorescence lifetime and the fluorescence
quantum yield according to fundamental work by Förster[68] and others. The oscillator strength
is proportional to the molar absorptivity for unaltered shapes of UV/Vis spectra . These
correlations are expressed in equations (5) and (6) described in Chapter 1.1 in more detail.
𝑘𝑟 =
1
𝜏𝑛
≅ 2.88 𝑠−1 x 10⁻⁹𝑛2 ∫ 𝐼(𝜎)𝑑𝜎
∫ 𝐼(𝜎)𝜎 −3𝑑𝜎∫
휀(𝜎)
𝜎𝑑𝜎
(5)
𝛷 =𝜏
𝜏𝑛
(6)

Results and Discussion
71
In diluted solution, aggregation and reabsorption can be neglected and the quantum yields
are found to be independent on the concentration. Thus, the fluorescence lifetime only
depends on the molar attenuation which is also constant for diluted concentrations. The
correlation of the attenuation E from the molar absorptivity and the concentration c is given
by equation (15). The attenuation E is defined as logarithmic quotient of the initial intensity
of light I0 and the measured intensity I for the respective wavelength after passing through
the sample with a thickness of d in cm (usually 1 cm). According to Lambert-Beer’s law
(equation (15)), the extinction coefficient is invariable in diluted concentrations . Thus, the
concentration c does not affect the extinction coefficient e which in turn should correlate to a
constant fluorescence lifetime t. Hence, there should be no theoretical reason to expect a
dependency of the fluorescence lifetime on the concentration of the measured chromophore.
𝐸 = 𝑙𝑔
𝐼0
𝐼= 휀 𝑐 𝑑
(15)
Figure 22: UV/Vis absorption spectra of 1 in chloroform with increasing dilution. Insert:
Verification of Lambert-Beer’s law by the linear correlation of the absorptivity E as a function of the
concentration c; circles: 527 nm, slope 0.810 x 10⁵ L mol-1, standard deviation 0.0049 , correlation
number 0.99995, coefficient of determination 0.9999, 7 measurements) and diamonds: 490 nm (slope
0.504 x 10⁵ L mol-1, standard deviation 0.0044, correlation number 0.99988, coefficient of
determination 0.9998, 7 measurements).
0
1
2
300 400 500 600
l (nm)
E
c
0
1
0.0 1.0c (10
-5 mol•L
-1)
E527 nm
490 nm

Results and Discussion
72
We tested the validity of Lambert-Beer’s law for N,N’-bis(tridecan-7-yl)perylene-3,4:9,10-
tetracarboxylic diimide (1) and found both an invariance of the shape of the absorption
spectrum concerning dilution and a perfect linear relation of the absorptivity with the molar
concentration of 1 confirming the expectations made from theory.
Furthermore, we tested the invariance of the shape of the fluorescence spectrum of 1 with
concentration and also found both, unaltered shapes of the fluorescence spectra and a linear
correlation between the fluorescence intensity I and the molar concentration c until as low as
9 x 10⁻¹⁰ mol L-1 verifying a constant fluorescence quantum yield (Figure 23). This corresponds
to literature[69] where the linearity between the concentration and the fluorescence signal of
some other perylene derivatives in a glassy matrix was confirmed down to a dilution of
10-13 mol L-1.
Figure 23: Fluorescence spectra of 1 in chloroform with optical excitation at 490 nm and
increasing dilution. Insert: Linear correlation of the intensity of fluorescence as a function of the
concentration of 1; diamonds: Slit for excitation 2.5 nm (slope 3.38 x 10⁸ L mol-1, standard deviation
3.1, correlation number 0.9995, coefficient of determination 0.9991, 11 measurements) and steep line,
circles: Slit for excitation 10 nm (slope 4.11 x 10⁹ L mol-1, standard deviation 0.33, correlation number
0.999998, coefficient of determination 0.999997, 8 measurements).
Thus, we conclude that there is no indication for any interactions caused by a possible direct
contact of dye molecules such as in aggregates: There are operating isolated molecules even
at the higher reported concentrations. Finally, the influence of the concentration on the
refractive index of the solution was investigated. A value of nD20 = 1.444 was measured for
0
200
400
600
800
1000
500 600 700
l (nm)
I
c
0
500
0 100c (10-8
mol•L-1
)
I
fluorescence at 535 nm
slit 2.5 nm
slit 10 nm

Results and Discussion
73
Chloroform, that was successively substituted by a 10-4 M solution of 1 in chloroform. The
variation amounted less than 0.002 which is within the range of the alteration caused by the
temperature decrease due to evaporation. Furthermore, this leads to even higher
concentrations exceeding the discussed range for optical measurements by far. Thus, the
refractive index can be estimated as independent from the concentration for diluted
solutions.
The fluorescence lifetime of a solution of 1 with a fluorescence quantum yield of > 0.99 in
chloroform was measured at different concentrations. The fluorescence lifetime was found
to be 5.00 ns in 2.5 x 10⁻⁵ molar solution. Remarkably, the fluorescence lifetimes of 1 decrease
with further dilution and decreasing concentration c to reach 3.81 ns at 1.6 x 10⁻⁷ mol L-1. The
alterations of the fluorescence lifetime is far beyond any experimental error with 31% within
the studied range. Long-range interactions of the dye molecules must be taken into account
as a cause for the alterations of the fluorescence lifetime .
The investigation was extended to further highly fluorescent dyes as suitable probes for the
investigation of the formation of electromagnetic waves. The well-studied, commonly used
fluorophores nile blue A sulfate (53), fluorescein (54) and rhodamine B (55) were investigated
in different solvents. Moreover, the high inertness of 53-55 excludes any interference by
unspecified chemical reactions in the required diluted solutions and their high photo stability
allows the registration of spectra without photo bleaching.
Scheme 19: Chemical structures of the applied fluorophores 53-55.
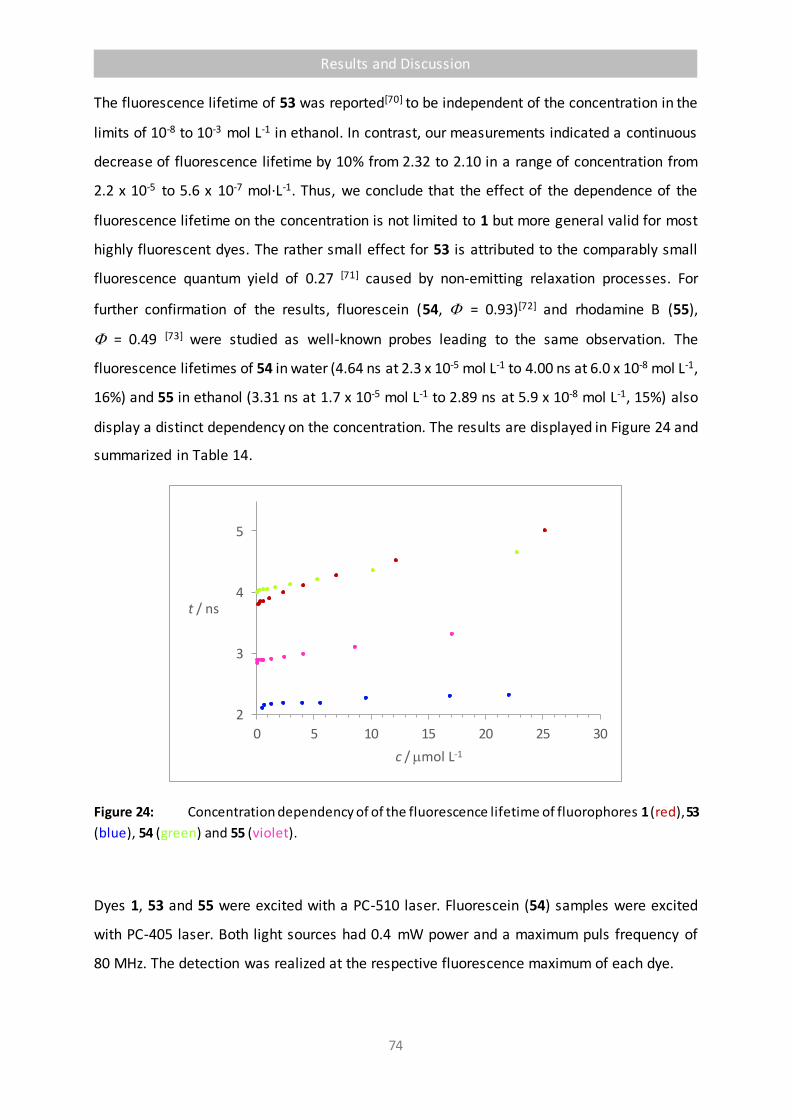
Results and Discussion
74
The fluorescence lifetime of 53 was reported[70] to be independent of the concentration in the
limits of 10-8 to 10-3 mol L-1 in ethanol. In contrast, our measurements indicated a continuous
decrease of fluorescence lifetime by 10% from 2.32 to 2.10 in a range of concentration from
2.2 x 10⁻⁵ to 5.6 x 10⁻⁷ mol·L-1. Thus, we conclude that the effect of the dependence of the
fluorescence lifetime on the concentration is not limited to 1 but more general valid for most
highly fluorescent dyes. The rather small effect for 53 is attributed to the comparably small
fluorescence quantum yield of 0.27 [71] caused by non-emitting relaxation processes. For
further confirmation of the results, fluorescein (54, = 0.93)[72] and rhodamine B (55),
= 0.49 [73] were studied as well-known probes leading to the same observation. The
fluorescence lifetimes of 54 in water (4.64 ns at 2.3 x 10⁻⁵ mol L-1 to 4.00 ns at 6.0 x 10⁻⁸ mol L-1,
16%) and 55 in ethanol (3.31 ns at 1.7 x 10⁻⁵ mol L-1 to 2.89 ns at 5.9 x 10⁻⁸ mol L-1, 15%) also
display a distinct dependency on the concentration. The results are displayed in Figure 24 and
summarized in Table 14.
Figure 24: Concentration dependency of of the fluorescence lifetime of fluorophores 1 (red), 53
(blue), 54 (green) and 55 (violet).
Dyes 1, 53 and 55 were excited with a PC-510 laser. Fluorescein (54) samples were excited
with PC-405 laser. Both light sources had 0.4 mW power and a maximum puls frequency of
80 MHz. The detection was realized at the respective fluorescence maximum of each dye.
2
3
4
5
0 5 10 15 20 25 30
t / ns
c / mol L-1
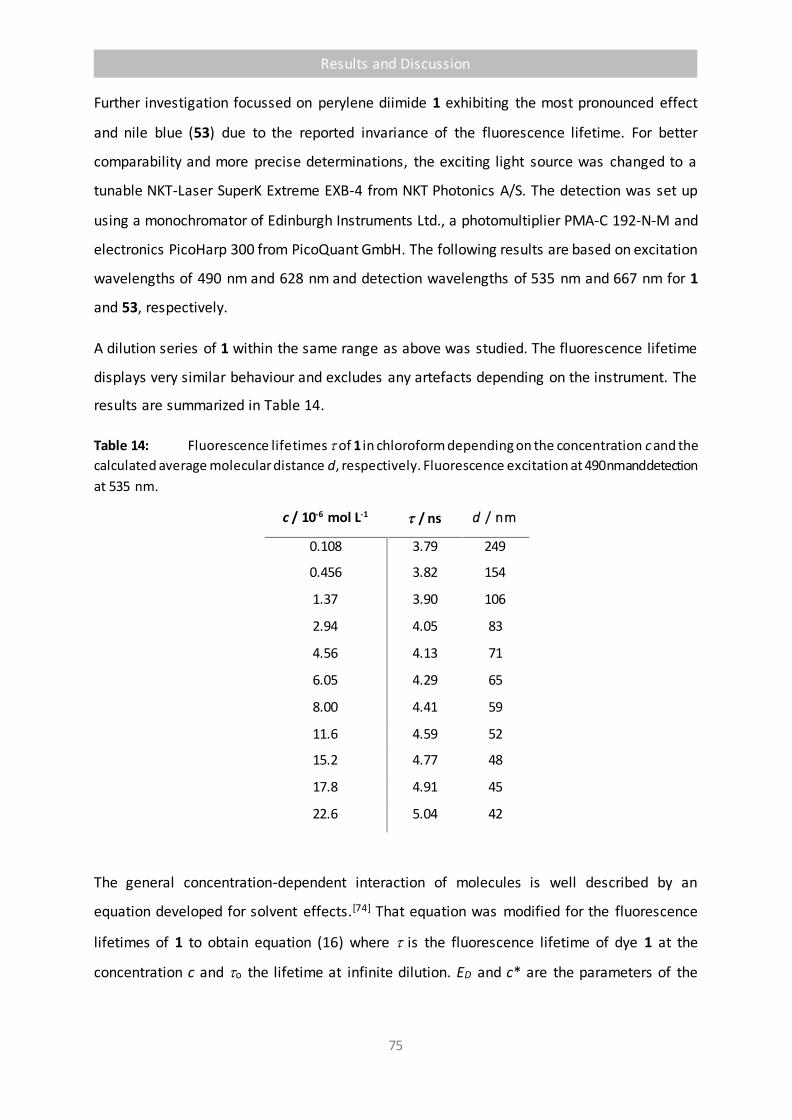
Results and Discussion
75
Further investigation focussed on perylene diimide 1 exhibiting the most pronounced effect
and nile blue (53) due to the reported invariance of the fluorescence lifetime. For better
comparability and more precise determinations, the exciting light source was changed to a
tunable NKT-Laser SuperK Extreme EXB-4 from NKT Photonics A/S. The detection was set up
using a monochromator of Edinburgh Instruments Ltd., a photomultiplier PMA-C 192-N-M and
electronics PicoHarp 300 from PicoQuant GmbH. The following results are based on excitation
wavelengths of 490 nm and 628 nm and detection wavelengths of 535 nm and 667 nm for 1
and 53, respectively.
A dilution series of 1 within the same range as above was studied. The fluorescence lifetime
displays very similar behaviour and excludes any artefacts depending on the instrument. The
results are summarized in Table 14.
Table 14: Fluorescence lifetimes of 1 in chloroform depending on the concentration c and the
calculated average molecular distance d, respectively. Fluorescence excitation at 490 nm and detection
at 535 nm.
c / 10-6 mol L-1 / ns d / nm
0.108 3.79 249
0.456 3.82 154
1.37 3.90 106
2.94 4.05 83
4.56 4.13 71
6.05 4.29 65
8.00 4.41 59
11.6 4.59 52
15.2 4.77 48
17.8 4.91 45
22.6 5.04 42
The general concentration-dependent interaction of molecules is well described by an
equation developed for solvent effects.[74] That equation was modified for the fluorescence
lifetimes of 1 to obtain equation (16) where is the fluorescence lifetime of dye 1 at the
concentration c and o the lifetime at infinite dilution. ED and c* are the parameters of the

Results and Discussion
76
equation where ED is the slope of a correlation according to equation (16) and c* the onset
concentration where interactions become important.
𝜏 = 𝐸𝐷 ln(𝑐
𝑐∗+ 1) + 𝜏0 (16)
Equation (16) describes the fluorescence lifetime of 1 as a function of the concentration c with
high precision with a characteristic concentration c* of 10-5 mol L-1 corresponding to a
molecular distance d of 50 nm; see Figure 25. As a consequence, long-range intermolecular
interactions are made responsible for such alterations of the fluorescence lifetime. Even large
mean molecular distances of more than 40 nm were spanned and effects were found until as
high as about 250 nm. A direct interaction of the dye molecules with the electromagnetic field
of the forming wave in its whole extension given by its wavelengths seems to be the most
probable cause for the effect.
Figure 25: Dependence of the fluorescence lifetime of 1 in chloroform on the concentration c
(circles; see Table 14). Insert: Linear correlation according to equation (8) (ED = 1.17 ns, c* = 1.17·10-
5 mol L-1 and o = 3.77 ns), (standard deviation 0.015, correlation number 0.9992, coefficient of
determination 0.9984, 11 measurements).
3
4
5
0 10 20
c (10-6
mol•L-1
)
(ns)
3
4
5
0 1ln (c /c *+1)
(ns)
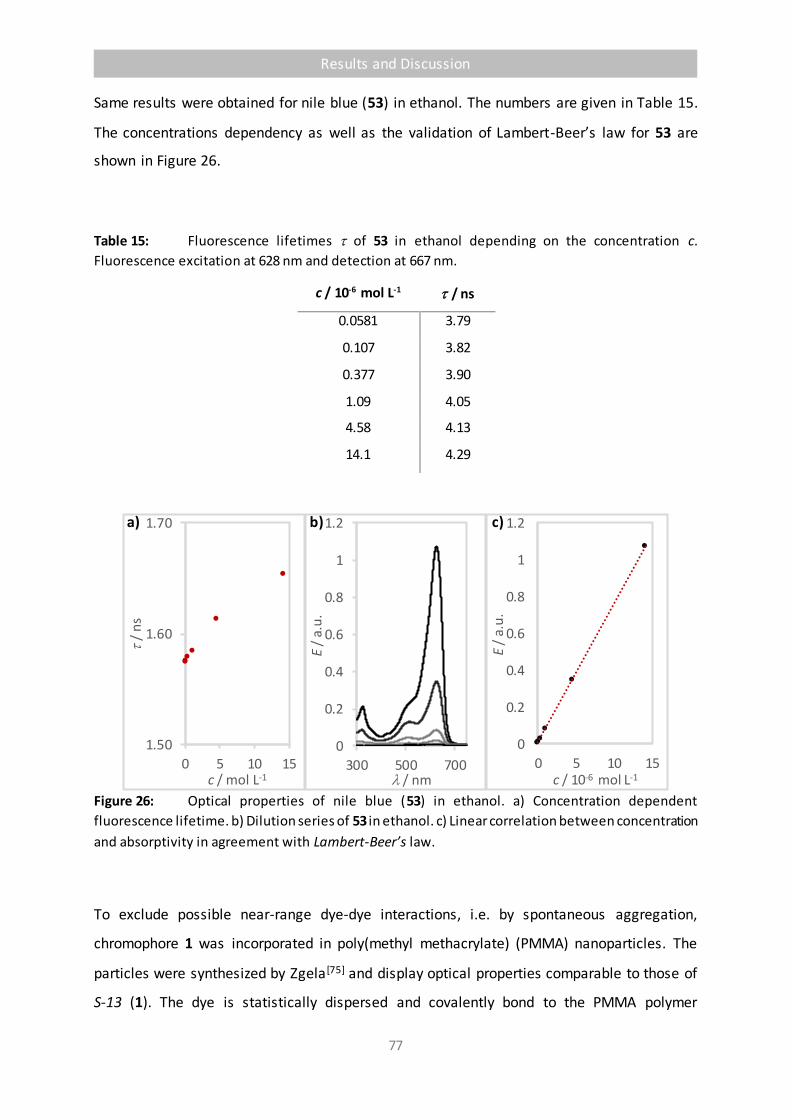
Results and Discussion
77
1.50
1.60
1.70
0 5 10 15
/
ns
c / mol L-1
0
0.2
0.4
0.6
0.8
1
1.2
300 500 700
E /
a.u
.
l / nm
0
0.2
0.4
0.6
0.8
1
1.2
0 5 10 15
E/
a.u
.
c / 10-6 mol L-1
Same results were obtained for nile blue (53) in ethanol. The numbers are given in Table 15.
The concentrations dependency as well as the validation of Lambert-Beer’s law for 53 are
shown in Figure 26.
Table 15: Fluorescence lifetimes of 53 in ethanol depending on the concentration c.
Fluorescence excitation at 628 nm and detection at 667 nm.
c / 10-6 mol L-1 / ns
0.0581 3.79
0.107 3.82
0.377 3.90
1.09 4.05
4.58 4.13
14.1 4.29
a) b) c)
Figure 26: Optical properties of nile blue (53) in ethanol. a) Concentration dependent
fluorescence lifetime. b) Dilution series of 53 in ethanol. c) Linear correlation between concentration
and absorptivity in agreement with Lambert-Beer’s law.
To exclude possible near-range dye-dye interactions, i.e. by spontaneous aggregation,
chromophore 1 was incorporated in poly(methyl methacrylate) (PMMA) nanoparticles. The
particles were synthesized by Zgela[75] and display optical properties comparable to those of
S-13 (1). The dye is statistically dispersed and covalently bond to the PMMA polymer
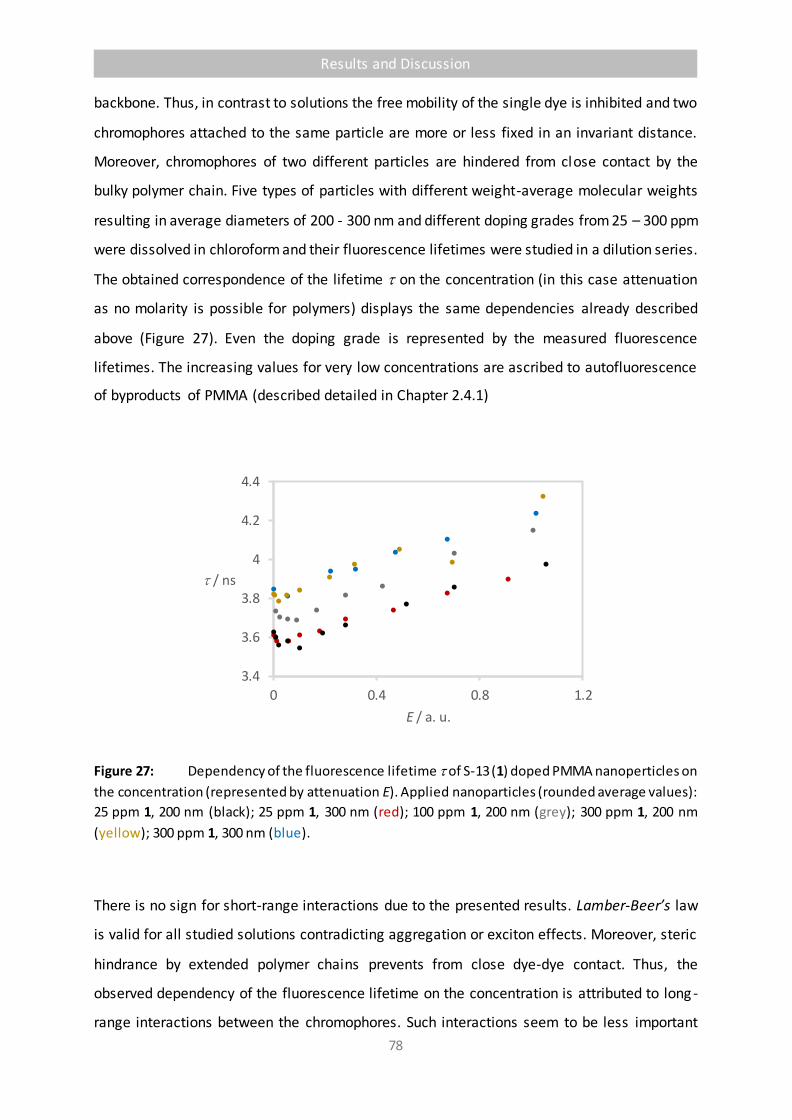
Results and Discussion
78
backbone. Thus, in contrast to solutions the free mobility of the single dye is inhibited and two
chromophores attached to the same particle are more or less fixed in an invariant distance.
Moreover, chromophores of two different particles are hindered from close contact by the
bulky polymer chain. Five types of particles with different weight-average molecular weights
resulting in average diameters of 200 - 300 nm and different doping grades from 25 – 300 ppm
were dissolved in chloroform and their fluorescence lifetimes were studied in a dilution series.
The obtained correspondence of the lifetime on the concentration (in this case attenuation
as no molarity is possible for polymers) displays the same dependencies already described
above (Figure 27). Even the doping grade is represented by the measured fluorescence
lifetimes. The increasing values for very low concentrations are ascribed to autofluorescence
of byproducts of PMMA (described detailed in Chapter 2.4.1)
Figure 27: Dependency of the fluorescence lifetime of S-13 (1) doped PMMA nanoperticles on
the concentration (represented by attenuation E). Applied nanoparticles (rounded average values):
25 ppm 1, 200 nm (black); 25 ppm 1, 300 nm (red); 100 ppm 1, 200 nm (grey); 300 ppm 1, 200 nm
(yellow); 300 ppm 1, 300 nm (blue).
There is no sign for short-range interactions due to the presented results. Lamber-Beer’s law
is valid for all studied solutions contradicting aggregation or exciton effects. Moreover, steric
hindrance by extended polymer chains prevents from close dye-dye contact. Thus, the
observed dependency of the fluorescence lifetime on the concentration is attributed to long -
range interactions between the chromophores. Such interactions seem to be less important
3.4
3.6
3.8
4
4.2
4.4
0 0.4 0.8 1.2
/ ns
E / a. u.

Results and Discussion
79
for the absorption of light because neither the line-type nor the validity of Lambert-Beer’s law
were influenced by dilution as shown in Figures 22 an 26. The very short time of the process
of light absorption proceeding in about 10-15 s acts like a flashlight concerning the orientation
of the involved dye molecules where relaxation processes remain unimportant.
There are completely different conditions for the emission of light. The fluorescence lifetime
of several ns is long enough to allow relaxation processes. Obviously, not only the
electronically excited dye molecule (the “hot” molecule) is involved in the generation of the
electromagnetic light wave, but also the neighbouring molecules in the electronic ground
state (the “cold” molecules) and these interactions lead to a retardation of the evolution of
light reported in Table 14. This effect resembles the function of Yagi-Uda antennae[76] for
radio-TV-transmission at UHF frequencies where there is one “hot” resonating dipole with
dimensions of about l/2 and further “cold” dipoles slightly off resonance parallel arranged in
a ladder with distances of slightly more than l/10. The dimensions of visible light waves with
about half a micrometer are still macroscopic and may be treated in the same way. A
realization of such arrangements was proposed for nano particles [77] where l/2 would extend
to about 250 nm and relevant distances of the single “hot” molecule to the “cold” neighbours
would be in the range of 50 nm. This value corresponds to that of c* found in the correlation
of Figure 25. As a consequence, the emission of light from electronically excited molecules
seems to be a complex process where neighbours in the electronic ground state are involved
in the formation of the finally propagating wave. At least, molecular electromagnetic
interactions should not be treated as processes between the directly involved molecules, but
the complete surrounding volume with a pattern of l/10 and an extension in the dimension
of the wavelengths or even more should be taken into account.
Conclusion
The process of emission of fluorescence light from electronically excited molecules seems to
be extended in macroscopic dimensions such as l/2 and does not remain localized to single
molecules. Interactions of the excited molecules with surrounding non-excited ones prolong
the fluorescence decay with decreasing inter-molecular distance and becomes important even
for more than l/10. An analogy to the Yagi-Uda antennae for UHF applications was
established. The results may be important for the interpretation and construction of light-
collecting and light-harvesting arrangements of chromophores. Reported measurements of

Results and Discussion
80
fluorescence lifetimes should be re-evaluated because of possible dependence of
concentration. On the other hand, decay times can be precisely and efficiently measured even
in optically inhomogeneous samples and allow a precise optical determination of the local
concentration.

Results and Discussion
81
2.4
Efficient Recycling of
Unmarked Polymers
by Means of their
Auto-Fluorescent Decay
H. Langhals, D. Zgela, T. Schlücker, Green Sustainable Chem. 2015, 5, 92-100.
H. Langhals, D. Zgela, T. Schlücker, Green Sustainable Chem. 2014, 4, 144-150.
H. Langhals, T. Schlücker, D. Zgela, Ger. Offen. DE 10 2016 001 546.2 (Feb. 10th 2016).
H. Langhals, T. Schlücker, D. Zgela, Ger. Offen. DE 102015001525.7 (Feb. 6th, 2015).
H. Langhals, D. Zgela, T. Schlücker, Ger. Offen. DE 102015001524.9 (Feb. 6th, 2015).
H. Langhals, T. Schlücker, D. Zgela, Ger. Offen. DE 102015001523.0 (Feb. 6th 2015).
H. Langhals, T. Schlücker, D. Zgela, Ger. Offen. DE 102015001522.2 (Feb. 6th 2015).
H. Langhals, T. Schlücker, D. Zgela, Ger. Offen. DE 102014004529.3 (Mar. 27th 2014).
Industriepreis 2015, 1st place in energy and environment
Results and Discussion
82
The fluorescence lifetimes of fluorophores depend on their environment. Interactions with
surrounding molecules, the refractive index of the sample and even changes in concentration
have impact on the fluorescent decay. This draws lifetime spectroscopical methods in the
UV/Vis-region into the focus for applications in analyzing and sorting approaches. Unmarked
polymers were investigated and proved to display a measurable fluorescence induced by UV
radiation. The emission is traced back to impurities and additives or even byproducts evolving
during the production process. This composition might lead to characteristic fluorescence
spectra and lifetimes. For such applications, the effecting compounds within the analyzed
material may not necessarily have to be identified. A distinct fluorescent decay at a constant
detection wavelength would allow efficient recycling even of unmarked polymers.
2.4.1 Development of an Optical Method for the Recycling of Unmarked Polymers
Recycling of polymeric waste still presents a challenge in both, research and technology. There
is a necessity for the development and improvement of efficient processes because of
increasing amounts of waste caused by polymers (“plastic planet”). The pacific trash vortex,
named Great Pacific Garbage Patch, is one of the most prominent and impressive examples
for environmental pollution. Moreover, recycling of cheap plastic waste may open an
economic source for organic materials. The majority of technical polymers are thermoplasts
and melt and moulding again is attractive for their easy re-use. However, the immiscibility and
incompatibility of organic polymers are therefore the main obstacles because lacking
uniformity as low as 5% lowers the value of polymers appreciably and an even higher
uniformity is required for high performance materials. Pure polymers for recycling may be
collected in polymer-processing manufactories, however, the majority of collected material
forms mixtures where an efficient sorting is required before processing. The machine-based
recognition of polymers is a prerequisite for such processes where methods using the density
or electrostatic properties were described.[78] Optical methods are more attractive because of
simple, stable and efficient technology where fluorescence is advantageous [79] because of
unproblematic light path and detection. The doping of polymers with fluorescent markers [80]
and their re-identification by the spectral resolution of their fluorescence in combination with
a binary coding was described by Langhals et al.[81] This demonstrated the efficiency of the
application of fluorescence. However, there are two topics for a fundamental improvement.

Results and Discussion
83
First, only doped material can be recycled where the recycling has to be already targeted in
the production of final products whereas undefined wastes cannot be recycled in this way.
Second, the spectral resolution for every flake for recycling costs appreciable efforts for
detection and signal processing. Fast optical processes such as lifetime spectroscopy for the
sorting of undoped material would bring about an appreciable progress and would even allow
working up deposited material.
The investigation of the recycling efficiency of fluorescence lifetime methods was
concentrated on the technical polymers Luran® (styrene, polyacrylonitile copolymer from
BASF), Delrin® (polyoxymethylene from DuPont) and Ultramid® (polyamide with glass fibre
from BASF). The polymers were applied without further treatment. Fluorescence decays were
measured with an Edinburgh Analytical Instruments CD900 and a tungsten flashlight nF900.
Figure 28: Fluorescence spectra of the auto fluorescence of Luran® (blue, dotted curve), Delrin®
(red, dashed curve) and Ultramid® (black, solid curve) with optical excitation at 365 nm.
An appreciable strong auto fluorescence (Figure 28) of these technical materials was found
for standard optical exciting at 365 nm where tungsten or mercury lamps and laser diods
(AlINGaN) may be applied as accessible light sources. Slight variations of the wavelengths of
excitation do not alter the spectra significantly. The investigated polymers exhibit individual
shapes of their auto fluorescence spectra. Hence, further investigation were executed using
an excitation wavelength of 365 nm. These spectra already may be used for the identification
and sorting of polymers by means of methods of pattern search. Thus, identification of

Results and Discussion
84
undoped material was successful, however, this requires still an appreciable effort of
calculation and measuring time.
As an alternative, the fluorescence lifetimes of the auto fluorescence were investigated and
found to be remarkable different for various polymers (Table 16). The fluorescence decay was
evaluated by first order in time with the time constant . This represents a non-arithmetic
average of a multi-exponential decay caused by several fluorescent species.
Less intense mono-exponential components (2) were detected for longer lifetimes (t > 12 ns)
as displayed in Figure 29. The decay curves can be easily splitted into two branches ( for t
<12 ns, 2 for t > 12 ns) representing each a majority of the single components of the
fluorescence lifetime. However, a mono-exponential interpretation is sufficient for the distinct
identification by far. Factors of about two distinguish the decay times for Delrin®, Ultramid®
and Luran® allowing an unambiguous identification of the polymers. The decay curves of the
auto fluorescence of the polymers are reported in Figure 29 and clearly indicate their
pronounced differences. A simple logarithmic representation of the flat, right branch
(represented by 2) of the decay curves is shown to exhibit mainly mono-exponential behavior.
Table 16: Fluorescence lifetimes of the studied polymers Luran®, Delrin® and Ultramid®.
Polymer a/ ns 2 b/ ns
Luran® 3.53 5.78
Delrin® 0.74 8.42
Ultramid® 1.96 7.83
Excitation wavelength: 365 nm, detection wavelength: 460 nm. a) Mono-exponential evaluation of the
fluorescence lifetime; b) Mono-exponential fluorescence lifetime of long-life components (t > 12 ns).

Results and Discussion
85
Figure 29: Fluorescence decay of polymers (excitation: 356 nm, detection: 460 nm) in linear (left)
and logarithmic scales (right). Mono-exponentially fitted functions of decay as solid lines (mainly
covered by actual measurement points). Fluorescence decay of Luran® (red), Delrin® (grey) and
Ultramid® (black).
The presented method was further extended to polymers with higher volumes of production,
such as poly ethylene (PE) or poly styrene (PS). The setup of the instrument was changed to a
more intense light sources using a PC-405 laser with 405 nm and 0.4 mW, max. 80 MHz. The
detection was realized with a PicoQuant FluoTime 300 and a PicoQuant PicoHarp 300 TCSPC
unit.
The preferred wavelengths for the detection of the fluorescence decays were located by
means of lifetime dependent fluorescence spectroscopy. A fluorescence spectrum was
recorded regarding all emissive components with lifetimes between 2 and 3 ns as well as
between 4 and 100 ns (Figure 30) using the script depicted in Scheme 20 below. The maximum
of the obtained spectrum was intended to be the detection maximum for lifetime
determination to accent the slower components as those carrying the main information about
the material. However, most reproducable results (within tolerance of ±1%) were obtained
for detection at 460 nm. All spectra display appreciable fluorescence at this wavelength thus ,
all fluorescence decays were detected at this experimentally found wavelength.
1
10
100
1000
10000
0 10 20 30 40 50
I / a.u.I / a.u.
t / ns

Results and Discussion
86
Figure 30: Time-resolved fluorescence spectra of selected polymers: HDPE (red), Delrin® (black),
PC (yellow), PET (blue), PMMA (green) and Tectosil® (violet) Light curves represent the time slots from
2 ns to 3 ns, solid curves those from 4 ns to 100 ns.
0
0.5
1
400 600 800
Irel
l / nm
460
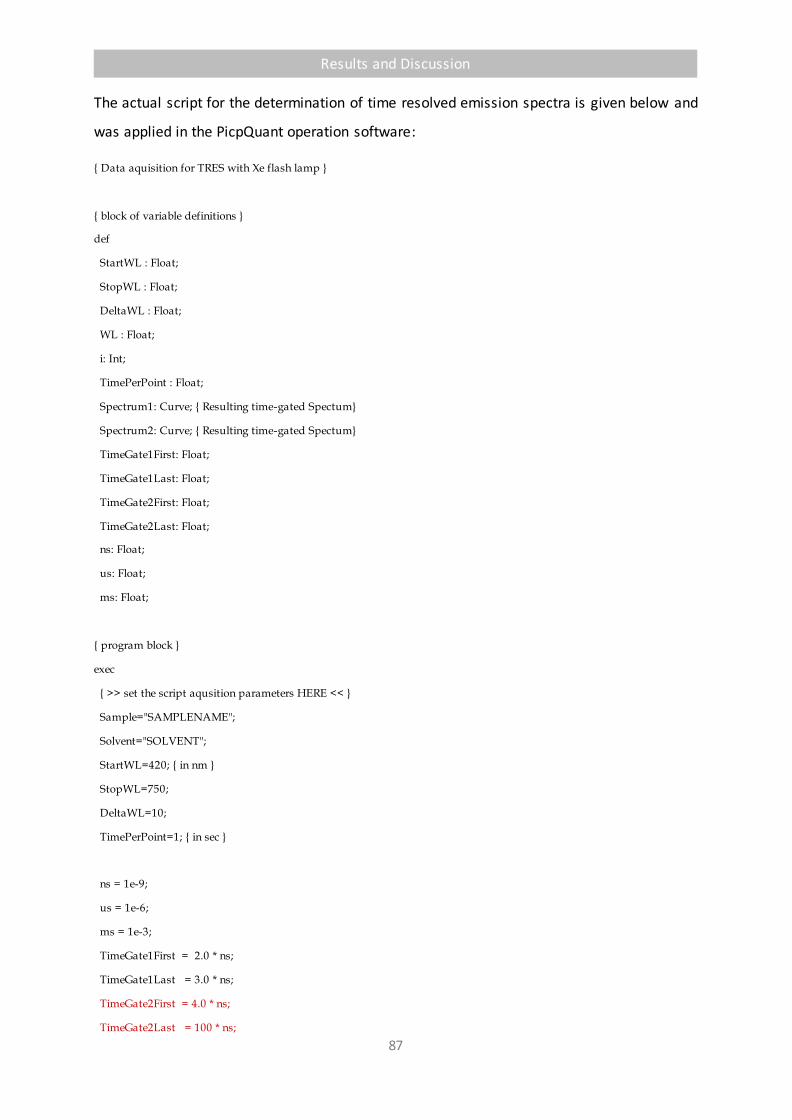
Results and Discussion
87
The actual script for the determination of time resolved emission spectra is given below and
was applied in the PicpQuant operation software:
{ Data aquisition for TRES with Xe flash lamp }
{ block of variable definitions }
def
StartWL : Float;
StopWL : Float;
DeltaWL : Float;
WL : Float;
i: Int;
TimePerPoint : Float;
Spectrum1: Curve; { Resulting time-gated Spectum}
Spectrum2: Curve; { Resulting time-gated Spectum}
TimeGate1First: Float;
TimeGate1Last: Float;
TimeGate2First: Float;
TimeGate2Last: Float;
ns: Float;
us: Float;
ms: Float;
{ program block }
exec
{ >> set the script aqusition parameters HERE << }
Sample="SAMPLENAME";
Solvent="SOLVENT";
StartWL=420; { in nm }
StopWL=750;
DeltaWL=10;
TimePerPoint=1; { in sec }
ns = 1e-9;
us = 1e-6;
ms = 1e-3;
TimeGate1First = 2.0 * ns;
TimeGate1Last = 3.0 * ns;
TimeGate2First = 4.0 * ns;
TimeGate2Last = 100 * ns;

Results and Discussion
88
DETECTOR_1.DETShutterPos=FALSE;
Spectrum1.NumPoints = ((StopWL - StartWL)/ DeltaWL) + 1;
Spectrum2.NumPoints = ((StopWL - StartWL)/ DeltaWL) + 1;
for i = 0 to Spectrum1.NumPoints - 1 step 1
Spectrum1.x[i] = StartWL + DeltaWL * i;
Spectrum1.y[i] = 0;
Spectrum1.Valid[i] = FALSE;
Spectrum2.x[i] = StartWL + DeltaWL * i;
Spectrum2.y[i] = 0;
Spectrum2.Valid[i] = FALSE;
end;
i = 0;
for WL=StartWL to StopWL step DeltaWL
DisplayStatus("Wavelength: " + WL + " nm (" + StartWL + " nm -> " + StopWL + " nm)");
DETECTION_MONO.MCRGratingWavelength=WL*1E-9; { in meter }
DETECTOR_1.DETShutterPos=TRUE;
Histogram(TimePerPoint,-1);
Spectrum1.y[i] = integral(crv[LastMeasCurveIndex] from TimeGate1First to TimeGate1Last);
Spectrum1.Valid[i] = TRUE;
Spectrum2.y[i] = integral(crv[LastMeasCurveIndex] from TimeGate2First to TimeGate2Last);
Spectrum2.Valid[i] = TRUE;
Spectrum1.y[i] = Spectrum1.y[i] / (crv[LastMeasCurveIndex].x[1] - crv[LastMeasCurveIndex].x[0] + 1e-30);
Spectrum2.y[i] = Spectrum2.y[i] / (crv[LastMeasCurveIndex].x[1] - crv[LastMeasCurveIndex].x[0] + 1e-30);
Plot(Spectrum1, 0); // second parameter = 0 for clearing the plot
Plot(Spectrum2, -1); // second parameter < 0 for redrawing the plot
i = i + 1;
end;
StoreAsSpectrum(Spectrum1);
StoreAsSpectrum(Spectrum2);
EXCITATION_ATTENUATOR.ACTPos=1;
DETECTOR_1.DETShutterPos=FALSE;
end.
Scheme 20: Determination of a time-resolved emission spectrum with custom time slots. The
range from TimeGate1First to TimeGate1Last was set up for control of the short fluorescent
components. The second time range in red considers all components with lifetimes of the excited state
of more than 4 ns. The top limit of 100 ns is set to a value where all molecules are estimated to have
already relaxed.

Results and Discussion
89
Fluorescence decays were obtained with a repetition rate of 20 MHz for a span of 10 s, slightly
increased noise is obtained for a shortened accumulation time of 1.0 ms. Polymer material
contains different unknown fluorophores in small concentration with the result of globally
multi-exponential decays. The reported fluorescence lifetimes, hence the time constants for
monoexponentially fitted decays, were obtained by exponential fitting (exponential tail fit) of
the respective sections according to the equation (2) (Chapter 1.1) by means of the software
FluoFit from PicoQuant. The shape of the laser pulse was neglected due to its small FWHM. A
broad range of different values for between 0.2 until 5 ns is observed. The individual time
constants shown in Figure 31 are as characteristic as fingerprints. Remarkably, the chemically
very similar and otherwise difficult to discriminate types of polyethylene, LDPE (low-density
polyethylene), HDPE (high-density polyethylene) and UHDPE (ultra- high-density
polyethylene) can be unambiguously distinguished. This may be a consequence of different
microscopic rigidities of these materials. Moreover, different methods of manufacturing such
as PET for bottles and for PET plates or different types of sil icones can be well categorized; see
Figure 31. The various types of silicone dehesives result in distinguishable, however similar
lifetimes τ. The availability of a further criterion for characterization would be of interest.
Figure 31: Fluorescence lifetimes in ns of technical polymers. Reproducibility is given within
±1%.
Although the obtained data depend on the instrument and applied methods, a very good
reproducibility allows identification of unmarked technical polymers. The mono-exponential
decay dominates resulting in the quite well acceptable first order kinetics. However, there is
at least a second fluorescent component in the decay process. Thus, the lifetimes from Figure
31 mean an averaging of both components depending on their relative contributions. The
fluorescence decay was analyzed bi-exponentially and the two time constants 1 and 2 were
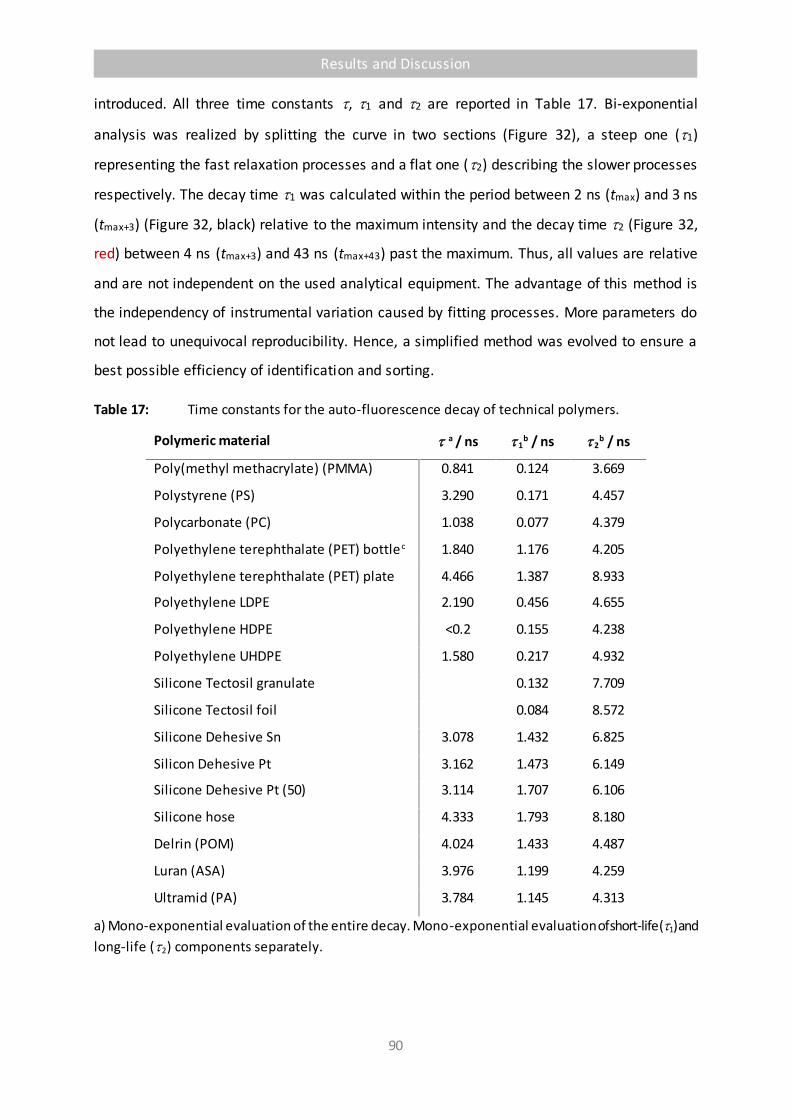
Results and Discussion
90
introduced. All three time constants , 1 and 2 are reported in Table 17. Bi-exponential
analysis was realized by splitting the curve in two sections (Figure 32), a steep one (1)
representing the fast relaxation processes and a flat one (2) describing the slower processes
respectively. The decay time 1 was calculated within the period between 2 ns (tmax) and 3 ns
(tmax+3) (Figure 32, black) relative to the maximum intensity and the decay time 2 (Figure 32,
red) between 4 ns (tmax+3) and 43 ns (tmax+43) past the maximum. Thus, all values are relative
and are not independent on the used analytical equipment. The advantage of this method is
the independency of instrumental variation caused by fitting processes. More parameters do
not lead to unequivocal reproducibility. Hence, a simplified method was evolved to ensure a
best possible efficiency of identification and sorting.
Table 17: Time constants for the auto-fluorescence decay of technical polymers.
Polymeric material a / ns 1b / ns 2
b / ns
Poly(methyl methacrylate) (PMMA) 0.841 0.124 3.669
Polystyrene (PS) 3.290 0.171 4.457
Polycarbonate (PC) 1.038 0.077 4.379
Polyethylene terephthalate (PET) bottle c 1.840 1.176 4.205
Polyethylene terephthalate (PET) plate 4.466 1.387 8.933
Polyethylene LDPE 2.190 0.456 4.655
Polyethylene HDPE <0.2 0.155 4.238
Polyethylene UHDPE 1.580 0.217 4.932
Silicone Tectosil granulate 0.132 7.709
Silicone Tectosil foil 0.084 8.572
Silicone Dehesive Sn 3.078 1.432 6.825
Silicon Dehesive Pt 3.162 1.473 6.149
Silicone Dehesive Pt (50) 3.114 1.707 6.106
Silicone hose 4.333 1.793 8.180
Delrin (POM) 4.024 1.433 4.487
Luran (ASA) 3.976 1.199 4.259
Ultramid (PA) 3.784 1.145 4.313
a) Mono-exponential evaluation of the entire decay. Mono-exponential evaluation of short-life (1) and
long-life (2) components separately.

Results and Discussion
91
Figure 32: For determination of 1 and 2 the decay was split in two branches, one representing
the short relaxation processes from tmax to tmax+3 (black). IRF (grey line) and non-relevant measuring
points (light grey) are given for completion.
The two time constants 1 and 2 of the bi-exponential data evaluation allow a two-
dimensional characterization of the polymers as is shown in Figure 33. Luran® is omitted for
clearness because recording the very high value of 1 would compress the abscissa. The two-
dimensional presentation of the fluorescence lifetimes 1 and 2 in Figure 33 allows a clear
distinguishing of the analyzed polymers. Even for similar materials and supplements with close
values (Figure 31) a discrimination is possible. It also becomes more distinct to distinguish as
well between the widely applied polyethylenes LDPE, HDPE and UHDPE (filled circles) as
between differently processed materials such as the silicone elastomer Tectosil® (triangles)
and PET (squares). The differently processed silicone dehesives (diamonds) become more
clearly separated where the applied catalyst for cross-linking (Sn or Pt) seems to influence
predominantly 2, whereas the addition of a hardener (Pt (50)) increases 1. This corresponds
to the very low values of 1 for the elastomer Tectosil®.
10
100
1000
10000
0 10 20 30 40 50
I / a.u.
t / ns

Results and Discussion
92
Figure 33: Two-dimensional characterization of polymers by means of their constants 1 and 2
attained by bi-exponential evaluation of the fluorescence decay. Filled circles: polyethylenes LDPE,
HDPE and UHDPE; squares: PET; diamonds: Silicones; triangles: silicone elastomer Tectosil®.
Different manufacturing processes and physical conditions of the polymers such as in case of
PE were proved to lead to characteristic fluorescence lifetimes. Besides these pre-use factors
it is likely to also detect differences of the fluorescence decays caused by varied usage. PET is
widely applied for both, for foodstuff such as bottles for water and soft drinks and for technical
liquids such as the mineral oils diesel or engine oil. The latter lipophilic liquids can diffuse into
the polymeric material such as a plasticizer and would be slowly released. As a consequence,
PET for foodstuff must be carefully separated from the latter material. Such contaminations
were simulated by the contact with the mineral oils diesel and engine oil for one week and
subsequent purification of PET with alkaline detergents according to a technical standard
procedure. The contaminated PET-Flakes were treated under stirring with a mixture of 3%
aqueous NaOH (100 mL) and 15% aqueous sodiumdodecyl sulphate solution (SDS, 50 mL) at
85 ˚C for 2 h, washed with distilled water, dried in air at room temperature and then at 60 ˚C
for 16 h. Figure 34 clearly indicates that a pre-treatment of PET results in a lowering of the
fluorescence lifetime . This is most pronounced for diesel with low molecular weight and low
viscosity and slightly less pronounced for engine oil with higher molecular weight and
viscosity. This corresponds to observations with silicone dehesives and Tectosil® (Figure 33).
A technical cleaning of the contaminated PET increases the fluorescence lifetime again,
however, it does not reach the high value of the neat material by far. Even clean commercial
recycling flakes exhibit a slightly diminished fluorescence lifetime.

Results and Discussion
93
Figure 34: Fluorescence lifetimes of pre-treated PET; expanded range.
Figure 35: Two-dimensional characterization of PET with various pre-treatment by means of their
constants 1 and 2 after bi-exponential evaluation of the fluorescence decay.
The detection of contaminations becomes more extended by means of the two-dimensional
presentation of the fluorescence lifetimes 1 and 2 in Figure 35. The recycling flake with
close to the neat material also given in Figure 34 becomes much more separated by 1 and 2
in Figure 35. The alterations by means of purifying exhibit different effects for diesel and
engine oil. As a consequence, neat material can be well separated from contaminated and
foodstuff pureness can be ensured after sorting by means of fluorescence lifetime analysis .
Results and Discussion
94
2.4.2 Studies on the Fluorescence of Ce(IV). A Universal Probe for Sorting Polymers
The fluorescence spectra of the studied polymers (Figure 30, above) exhibited various
differences. However, a few small but distinct emission bands were found predominantly in
the weakly fluorescent samples, most noticeable at 460, 480 and 717 nm. Additionally, the
best reproducibility of determination of fluorescence lifetimes for most samples was observed
at a detection wavelength of 460 nm. These results prompted to test for a universal
fluorescent species that can be used as versatile probe in various polymers. Potential additives
such as transition metal catalysts or fillers such as highly dispersed silica were investigated by
means of fluorescence spectroscopy as film or in different solvents (Figure 36). The
characteristic bands at 460, 480 and 720 nm were found to be also emitted by most technical
silica materials such as Carb-o-sil© (Merck) and HDK® (Wacker).

Results and Discussion
95
Figure 36: Fluorescence spectra of highly disperse silica excited at 405 nm. Colors indicate the
applied dispersant: Neat film (red), water (grey), methanol (yellow), DMF (blue), toluene (green),
hexane (violet). The top respective curve is for Cab-o-sil© from Merck (Acros), the accompanying
bottom curve for HDK© H 15 from Wacker. The bottom black curve represents the spectrum of
Ludox© from sigma aldrich, a highly pure aqueous silica standard for optical scattering.
400 500 600 700 800
I / a.u.
l / nm
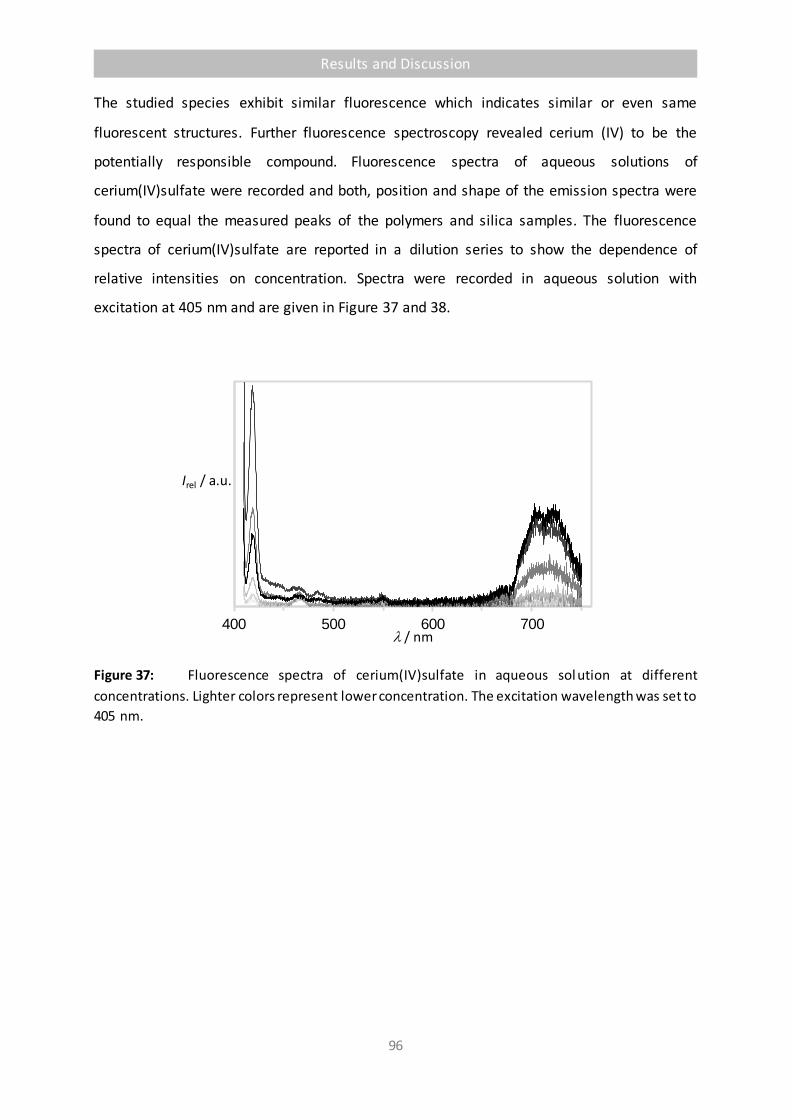
Results and Discussion
96
The studied species exhibit similar fluorescence which indicates similar or even same
fluorescent structures. Further fluorescence spectroscopy revealed cerium (IV) to be the
potentially responsible compound. Fluorescence spectra of aqueous solutions of
cerium(IV)sulfate were recorded and both, position and shape of the emission spectra were
found to equal the measured peaks of the polymers and silica samples. The fluorescence
spectra of cerium(IV)sulfate are reported in a dilution series to show the dependence of
relative intensities on concentration. Spectra were recorded in aqueous solution with
excitation at 405 nm and are given in Figure 37 and 38.
Figure 37: Fluorescence spectra of cerium(IV)sulfate in aqueous sol ution at different
concentrations. Lighter colors represent lower concentration. The excitation wavelength was set to
405 nm.
400 500 600 700
Irel / a.u.
l / nm
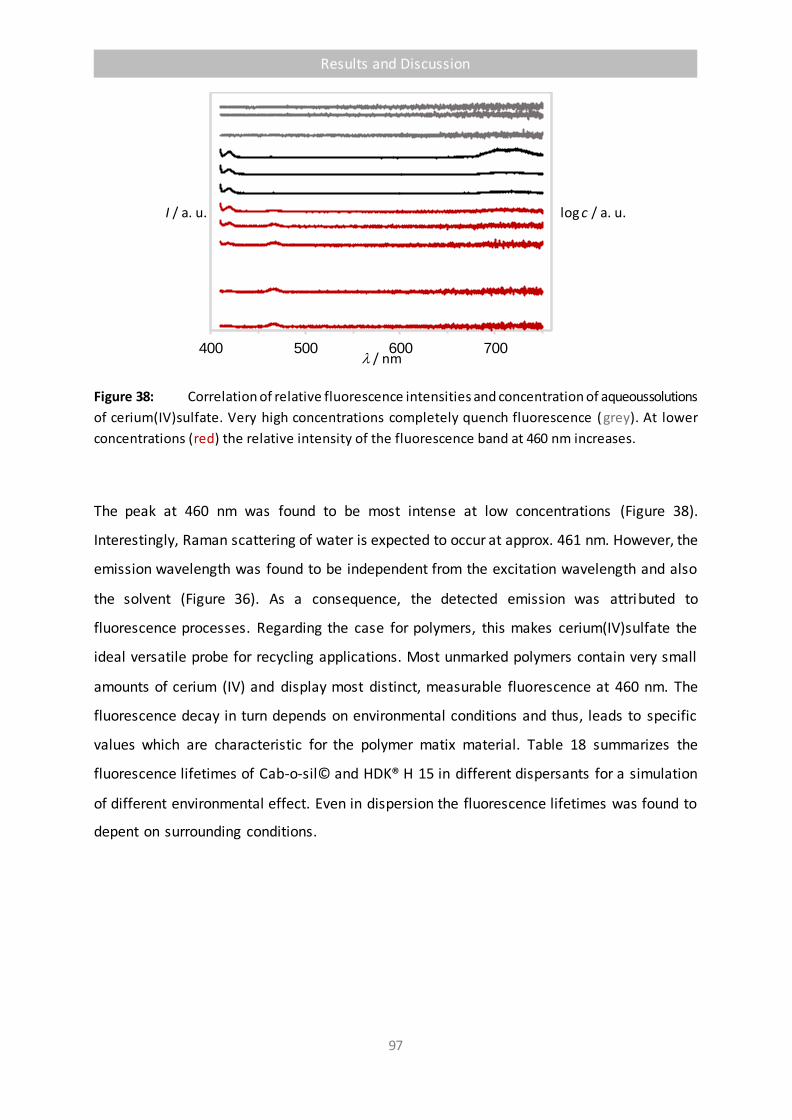
Results and Discussion
97
Figure 38: Correlation of relative fluorescence intensities and concentration of aqueous solutions
of cerium(IV)sulfate. Very high concentrations completely quench fluorescence (grey). At lower
concentrations (red) the relative intensity of the fluorescence band at 460 nm increases.
The peak at 460 nm was found to be most intense at low concentrations (Figure 38).
Interestingly, Raman scattering of water is expected to occur at approx. 461 nm. However, the
emission wavelength was found to be independent from the excitation wavelength and also
the solvent (Figure 36). As a consequence, the detected emission was attributed to
fluorescence processes. Regarding the case for polymers, this makes cerium(IV)sulfate the
ideal versatile probe for recycling applications. Most unmarked polymers contain very small
amounts of cerium (IV) and display most distinct, measurable fluorescence at 460 nm. The
fluorescence decay in turn depends on environmental conditions and thus, leads to specific
values which are characteristic for the polymer matix material. Table 18 summarizes the
fluorescence lifetimes of Cab-o-sil© and HDK® H 15 in different dispersants for a simulation
of different environmental effect. Even in dispersion the fluorescence lifetimes was found to
depent on surrounding conditions.
400 500 600 700
log c / a. u.I / a. u.
l / nm

Results and Discussion
98
Table 18: Fluorescence lifetimes of different silica dispersions.
Silica type 1a / ns 2
a / ns
HDK® H 15 in water 8.815 3.060
HDK® H 15 in methanol 8.709 3.116
HDK® H 15 in DMF 10.104 3.292
HDK® H 15 in toluene 8.550 2.692
HDK® H 15 in hexane 6.713 0.897
Cab-o-sil© in water 9.244 3.139
Cab-o-sil© in methanol 10.091 3.390
Cab-o-sil© in DMF 10.250 3.324
Cab-o-sil© in toluene 9.262 2.640
Cab-o-sil© in hexane
Ludox© (in water) 5.686b
a) Excitation at 405 nm, detection at 460 nm. 1 and 2 were determined in bi-exponential tailfits
starting from 3 ns after the intensity maximum with FluoFit software; b) No results could be generated
by bi-exponential fitting of the decay. For comparability the mono-exponential value (in this case a
non-arithmetic mean) is given.
Conclusion
Technical polymers were efficiently identified by means of their auto-fluorescence lifetime.
Mono-exponential evaluation allows reliable and reproducible values for sorting of unmarked
batches of mixed polymers. Bi-exponential and pseudo bi-exponential analysis improves the
accuracy and enables advanced classification. The additional information is useful for the
discrimination of chemical similar materials such as LDPE, HDPE and UHDPE or even different
processing or recognition of contaminates. This enables efficient sorting applications using UV
or visible light. Easy signal processing, fast measurements and well -known detector
technology draw the presented method in focus for high throughput recycling solutions.
Cerium (IV) was found to be a versatile fluorescence probe which is already found in many
technical polymers due to production techniques. The wide distribution of cerium allows the
development of standardized procedures for the realization of light-based polymer sorting by
means of fluorescence lifetime spectroscopy.
Results and Discussion
99
2.5
Synthesis and Characterization
of Oligothiophenes
with Short Fluorescence Lifetimes
and High
Stokes’ Shifts
T. Schlücker, V. Dhayalan, H. Langhals, C. Sämann, P. Knochel, Asian J. Org. Chem. 2015, 4, 763-769;
H. Langhals, T. Schlücker, PCT/EP2016/051211, Ger. Offen. DE 102015000815.3 (Jan. 21st, 2015).
H. Langhals, T. Schlücker, P. Knochel, Ger. Offen. DE 102014009757.9 (Jun. 26th 2014).
H. Langhals, P. Knochel, V. Dhayalan, T. Schlücker, C. Sämann, Ger. Offen. DE 102014009756.0 (Jun. 26th, 2014).

Results and Discussion
100
The fluorescent lifetime of a compound was shown to depend on several environmental
effects, such as concentration or medium. However, only minor effects are obtained by
variation of these factors. The main cause for fast or slow relaxation is chemical structure of
the chromophore. A validity of equation (5) was found within same classes of dyes but there
is no precise prediction of fluorescence lifetimes possible from only chemicals structure. The
studies were expanded to repetitive oligomer structures such as oligoenes and
oligothiophenes and fluorescence lifetimes of less than 1 ns were found frequently. On the
basis of comparably stable oligothiophenes a series of highly soluble derivatives was
developed with absorption maxima in the visible region.
2.5.1 Adamantyl Substituted Oligothiophenes
The covering of increasing volumes in data processing draws optical systems such as the
popular internet trans-continental cable lanes more and more into the focus of interest. [68]
Fluorescent materials are principally useful as frequency converters in optical devices or
polymer optical fibers. However, their frequency of operating is fundamentally limited by the
time constant of the fluorescence decay and one may ask how far this decay time can be
shortened. According to Förster[2] this time constant is indirectly proportional both to the
fluorescence quantum yield and the oscillator strengths where the latter is interrelated with
the molar absorptivity. Fluorescence decay times of about 4 ns were found in solution[13] for
highly fluorescent dyes with quantum yields close to 100% and high color strengths with molar
absorptivities of about 100 000 such as for perylene dyes.[27]
Shorter decay times in the sub-nano second region were found frequntly for
oligothiophenes[82]. Particularly quaterthiophene displays fluorescence lifetimes of about
0.4 ns[83] while its optical spectra matches the requirements given by commercially available
inexpensive light sources (e.g. GaN-LEDs). Furthermore, when incorporated in polymers the
emission spectrum fits the highly transparent spectral regions of the solid matrices (preferably
poly(methyl methacrylate) (PMMA). However, the solubility[84] in organic solvents and
polymer materials is deficient for most applications. Herein, a new approach for increasing
the solubility of oligothiophenes by the attachment of a bulky adamantyl group via Negishi
cross-coupling reactions [45,85] is reported briefly. The suitability of such oligothiophenes as

Results and Discussion
101
ultra-fast frequency converters for optical data processing is shown, particularly in polymer
optical fibers.
The preparation of fluorescent dyes for doped polymer optical fibers requests two key
properties: a good solubility of the dye in the corresponding monomer and a high stability
towards polymerization reactions. To increase the solubility, oligothiophenes were terminally
capped with bulky subtituents [86] using 1-adamantyl moieties. With this system, radical side-
reactions are impeded by avoiding hydrogen atoms in benzylic position.[87] Moreover, the
bridgehead nature[88] of the 1-adamantyl group[89] will also efficiently prevent from de-
alkylation of the terminal groups due to the bridgehead strain.[90]
Scheme 21: Preperation of 1-adamantyl substituted oligothiophenes 57a-c (n = 1-3) via Negishi
cross coupling reactions. Further bromination with NBS leads to the readily soluble 5-bromo
oligothiophenes 58a-c.
In literature,[91] 1-adamantylzinc chloride was shown to react smoothly in a Pd-catalyzed
Negishi cross-coupling with bromoaryl derivatives. According to Scheme 21, the brominated
compounds 56a-c were mono-alkylated with 1-adamantylzinc chloride using 1% Pd(OAc)2 and
2% of the ligand SPhos, introduced by Buchwald[92] as a catalytic system.
1-(Adamantyl)thiophenes 57a-c, bearing 1-3 thiophene units respectively, have been
prepared in 58-64% yield. The (1-adamantyl)thiophenes were brominated with NBS (CHCl3, rt,
12 h, 98% yield) to obtain activated derivatives suitable for further reactions. The alkylated
bromooligothiophenes 58a-c display an excellent solubility in organic solvents, even for
extended -systems like the 5-(1-adamantyl)-5’’-bromoterthiophene (58c). To shift the
absorption wavelength into the visible the chromophore needs to be further extended
(Scheme 22). The solubility of 5-bromoquaterthiophene is by far too poor for the following
organometallic couplings. Thus, the highly soluble 5’’-(1-adamantyl)-5-bromoterthiophene

Results and Discussion
102
57c was reacted with 2-thienylzinc chloride in the presence of 5% Pd(PPh3)4 (THF, 50 °C, 3 h).
The prolongation by one thiophene unit leads to 5-(1-adamantyl)quaterthiophene (57d) in
55% yield.
Scheme 22: Preparation of higher homologues (n = 4,6,8) of (1-adamantyl)oligothiophene. The well
soluble mono-alkylated quaterthiophene 57d was obtained via a Negishi cross-coupling reaction of 2-
thienylzinc chloride with 5’’-(1-adamantyl)-5-bromoterthiophene (58c). Treatment of mono-(1-
adamantyl)oligothiophenes (n = 2-4) with FeCl3 leads to the respective mirror symmetrical coupling
products 59a-c.
Moreover, oligothiophenes 59a-c, bearing two terminal adamantyl substituents and 4, 6 and
8 thiophene units, respectively, could be prepared by treatment of 57b-d with FeCl3. Whereas
5,5’-di(adamantan-1-yl)-2,2’-dithiophene could only be obtained in traces, the higher
oligomers 59a-c were prepared in yields up to 98%. While mono-substitution leads to readily
soluble oligothiophenes 57a-d, ,-capping with two 1-adamantyl moieties significantly
decreases the solubility. The compounds 59a-c exhibit an even lower solubility than the
completely unsubstituted derivatives of oligothiophenes. Although impurities substantially
promote their solubility in chloroform, once the compounds of type 59 are isolated, they
become nearly insoluble in common solvents. Therefore, they might be useful as high
performance fluorescent pigments.
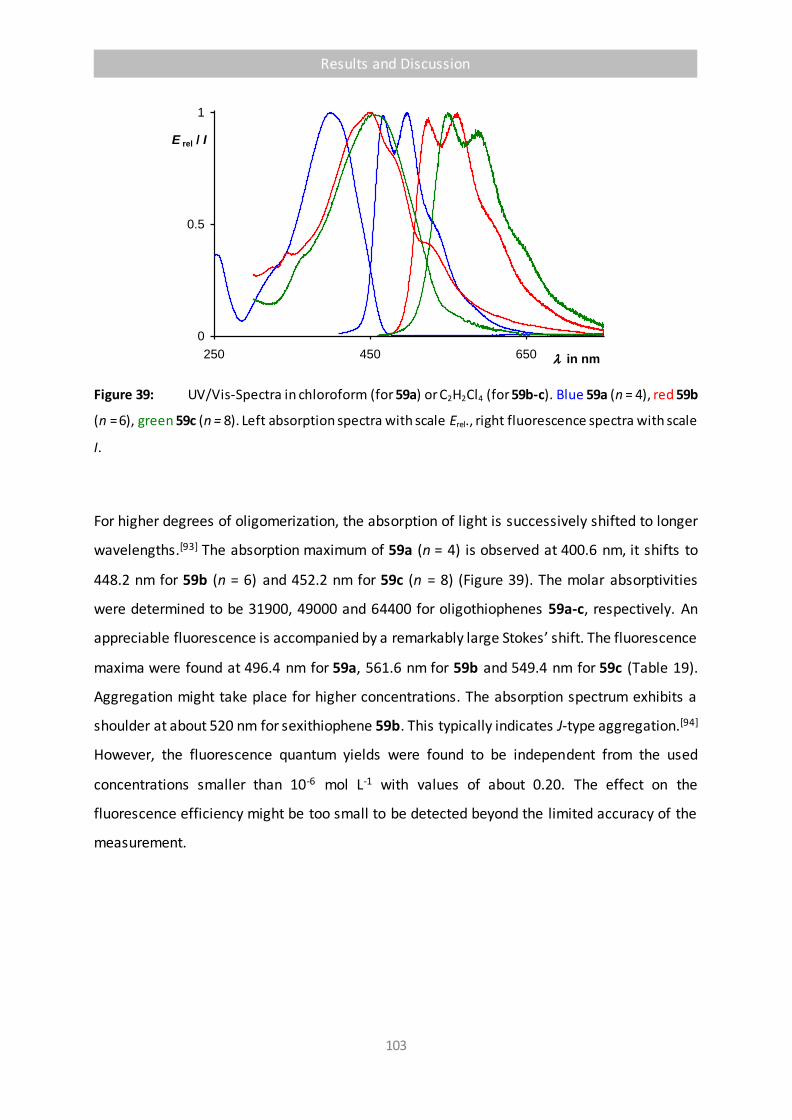
Results and Discussion
103
Figure 39: UV/Vis-Spectra in chloroform (for 59a) or C2H2Cl4 (for 59b-c). Blue 59a (n = 4), red 59b
(n = 6), green 59c (n = 8). Left absorption spectra with scale Erel., right fluorescence spectra with scale
I.
For higher degrees of oligomerization, the absorption of light is successively shifted to longer
wavelengths.[93] The absorption maximum of 59a (n = 4) is observed at 400.6 nm, it shifts to
448.2 nm for 59b (n = 6) and 452.2 nm for 59c (n = 8) (Figure 39). The molar absorptivities
were determined to be 31900, 49000 and 64400 for oligothiophenes 59a-c, respectively. An
appreciable fluorescence is accompanied by a remarkably large Stokes’ shift. The fluorescence
maxima were found at 496.4 nm for 59a, 561.6 nm for 59b and 549.4 nm for 59c (Table 19).
Aggregation might take place for higher concentrations. The absorption spectrum exhibits a
shoulder at about 520 nm for sexithiophene 59b. This typically indicates J-type aggregation.[94]
However, the fluorescence quantum yields were found to be independent from the used
concentrations smaller than 10-6 mol L-1 with values of about 0.20. The effect on the
fluorescence efficiency might be too small to be detected beyond the limited accuracy of the
measurement.
0
0.5
1
250 450 650 l in nm
E rel / I
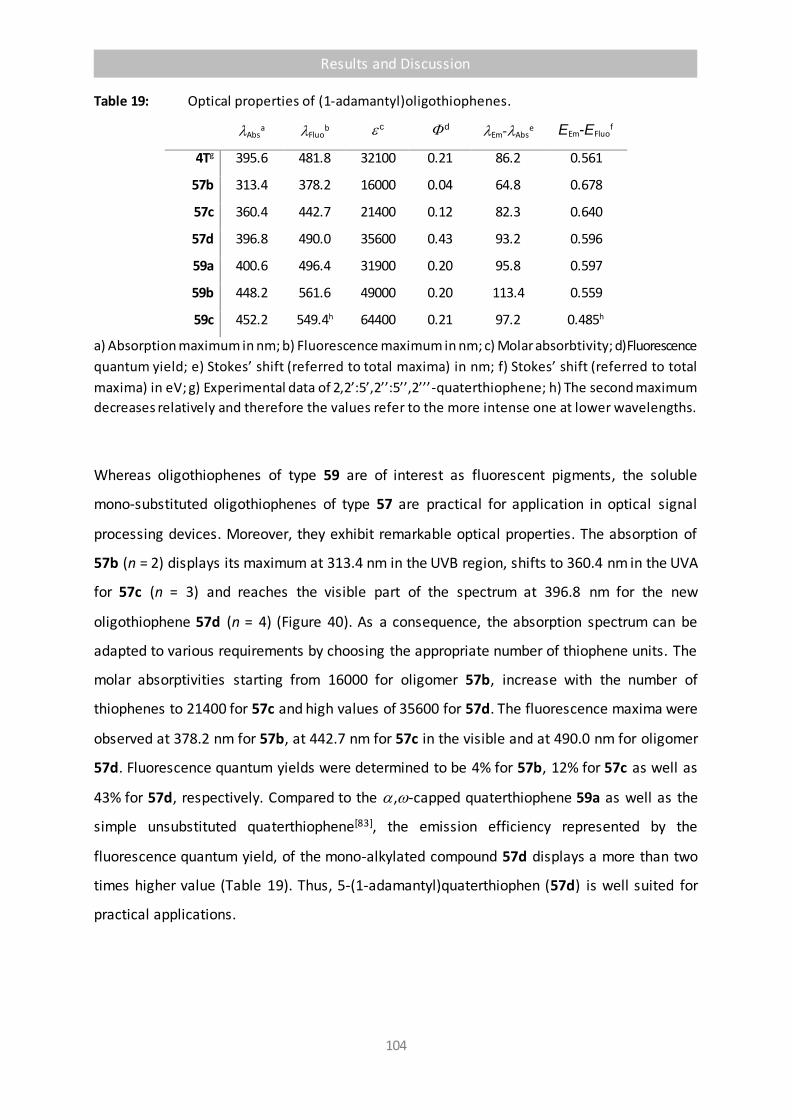
Results and Discussion
104
Table 19: Optical properties of (1-adamantyl)oligothiophenes.
lAbsa lFluo
b c d lEm-lAbse EEm-EFluo
f
4Tg 395.6 481.8 32100 0.21 86.2 0.561
57b 313.4 378.2 16000 0.04 64.8 0.678
57c 360.4 442.7 21400 0.12 82.3 0.640
57d 396.8 490.0 35600 0.43 93.2 0.596
59a 400.6 496.4 31900 0.20 95.8 0.597
59b 448.2 561.6 49000 0.20 113.4 0.559
59c 452.2 549.4h 64400 0.21 97.2 0.485h
a) Absorption maximum in nm; b) Fluorescence maximum in nm; c) Molar absorbtivity; d) Fluorescence
quantum yield; e) Stokes’ shift (referred to total maxima) in nm; f) Stokes’ shift (referred to total
maxima) in eV; g) Experimental data of 2,2’:5’,2’’:5’’,2’’’-quaterthiophene; h) The second maximum
decreases relatively and therefore the values refer to the more intense one at lower wavelengths.
Whereas oligothiophenes of type 59 are of interest as fluorescent pigments, the soluble
mono-substituted oligothiophenes of type 57 are practical for application in optical signal
processing devices. Moreover, they exhibit remarkable optical properties. The absorption of
57b (n = 2) displays its maximum at 313.4 nm in the UVB region, shifts to 360.4 nm in the UVA
for 57c (n = 3) and reaches the visible part of the spectrum at 396.8 nm for the new
oligothiophene 57d (n = 4) (Figure 40). As a consequence, the absorption spectrum can be
adapted to various requirements by choosing the appropriate number of thiophene units. The
molar absorptivities starting from 16000 for oligomer 57b, increase with the number of
thiophenes to 21400 for 57c and high values of 35600 for 57d. The fluorescence maxima were
observed at 378.2 nm for 57b, at 442.7 nm for 57c in the visible and at 490.0 nm for oligomer
57d. Fluorescence quantum yields were determined to be 4% for 57b, 12% for 57c as well as
43% for 57d, respectively. Compared to the ,-capped quaterthiophene 59a as well as the
simple unsubstituted quaterthiophene[83], the emission efficiency represented by the
fluorescence quantum yield, of the mono-alkylated compound 57d displays a more than two
times higher value (Table 19). Thus, 5-(1-adamantyl)quaterthiophen (57d) is well suited for
practical applications.

Results and Discussion
105
Figure 40: UV/Vis-Spectra in chloroform. Blue 57b (n = 2), red 57c (n = 3), green 57d (n = 4). Left
absorption spectra with scale Erel., right fluorescence spectra with scale I.
The combination of a large Stokes’ shift, comparably strong fluorescence, ultra -short
fluorescence decay and appreciable photo-stability makes particularly 57d appropriate as
fluorescent component in light collectors[12] and frequency converters for optical data
systems. Polymer optical fibers, doped with fluorescent dyes, can be applied in slip ring
arrangements[2] for the transmission of information. In dye doped light guides used in slip
rings, the information is transmitted stepless and contactless from any position of the axis.
Therefore, the fluorescent dye has to be dissolved within the polymeric fiber. The 1-adamantyl
moiety confers not only high solubility in common organic solvents, it also avoids aggregation
in most liquid monomers such as methyl methacrylate (MMA) in concentrations higher than
50 ppm. It is worth mentioning the tolerance of 57 towards standard polymerization reactions.
2-(1-Adamantyl)oligothiophene 57d was dissolved in MMA that subsequently was
polymerized with azobisisobutyronitrile (AIBN) at comparatively high temperatures up to
70 °C. The oligothiophene has exibited no sign of decomposition or participation in radical
processes. Combining this stability with high solubility should allow easy technical processing
using the reported adamantyl oligothiophenes.
0
0.5
1
250 450 650 l in nm
E rel / I

Results and Discussion
106
Oligothiophene 57d exhibits a very short[95] fluorescence decay of 0.39 ns in chloroform and
0.42 ns in polymethylmethacrylate (PMMA), respectively. With respect to the fluorescence
decay as the limiting factor for optical frequencies of modulation, this allows a very high data
throughput compared to known chromophores for this applications.
Obviously, the large Stokes’ shift is advantageous as it avoids re-absorption within the light
guide and thus reduces attenuation. Geometric relaxation processes that occur after the
electronic excitation seem to be responsible for the increased Stokes’ shift (Figure 41). The
thiophene rings are planar in oligothiophenes and slightly twisted against each other with
reported dihedral angles between 3 and 9°.[96] A diminishing of the dihedral angle between
the thiophene units and a shortening of the single bond between the rings are probable
relaxation processes in the optically excited state leading to a bathochromically shifted
fluorescence (compare to Section 2.4.1).
Figure 41: Schematic process causing the increased Stokes’ shifts. i) Vertical transition by light
absorption (h) from the electronic ground state S0 (top left) to reach the electronically excited state
S1. ii) Relaxation to a geometrically more favorable, energetically lower excited state S1’. iii)
Bathochromically shifted fluorescence (-h’) from S1’ to So’. iv) Relaxation to the energetically more
favored initial state from So’ to So.
In solution -alkylation further increases the Stokes’ shift by decreasing the conjugation in the
ground state leading to shorter absorption wavelengths while displaying nearly same
fluorescence properties.[97] In contrast, bulky substituents in these positions would strongly
suppress the dynamics in polymer glass matrices. Moreover, extinction values and
fluorescence quantum yields decrease with steric hindrance due to reduced -electron
delocalization.
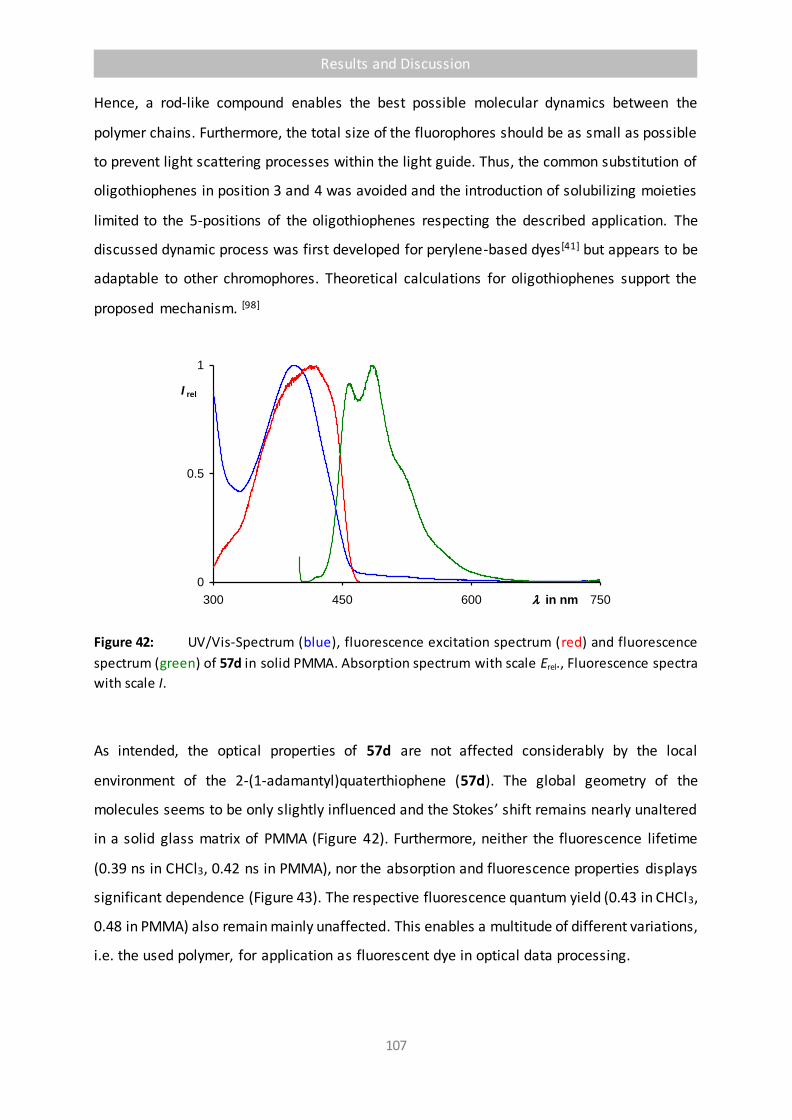
Results and Discussion
107
Hence, a rod-like compound enables the best possible molecular dynamics between the
polymer chains. Furthermore, the total size of the fluorophores should be as small as possible
to prevent light scattering processes within the light guide. Thus, the common substitution of
oligothiophenes in position 3 and 4 was avoided and the introduction of solubilizing moieties
limited to the 5-positions of the oligothiophenes respecting the described application. The
discussed dynamic process was first developed for perylene-based dyes[41] but appears to be
adaptable to other chromophores. Theoretical calculations for oligothiophenes support the
proposed mechanism. [98]
Figure 42: UV/Vis-Spectrum (blue), fluorescence excitation spectrum (red) and fluorescence
spectrum (green) of 57d in solid PMMA. Absorption spectrum with scale Erel., Fluorescence spectra
with scale I.
As intended, the optical properties of 57d are not affected considerably by the local
environment of the 2-(1-adamantyl)quaterthiophene (57d). The global geometry of the
molecules seems to be only slightly influenced and the Stokes’ shift remains nearly unaltered
in a solid glass matrix of PMMA (Figure 42). Furthermore, neither the fluorescence lifetime
(0.39 ns in CHCl3, 0.42 ns in PMMA), nor the absorption and fluorescence properties displays
significant dependence (Figure 43). The respective fluorescence quantum yield (0.43 in CHCl3,
0.48 in PMMA) also remain mainly unaffected. This enables a multitude of different variations,
i.e. the used polymer, for application as fluorescent dye in optical data processing.
0
0.5
1
300 450 600 750l in nm
I rel

Results and Discussion
108
Figure 43: Comparison of optical spectra of 57d. a) Absorption (grey), fluorescence excitation
(red) and fluorescence (black) spectra in chloroform; b) Fluorescence lifetime in chloroform. Excitation
pulse (grey), decay (red) and mono-exponential deconvolution fit (black). Insert: Logarithmic decay; c)
Fluorescence excitation (red) and fluorescence (black) spectra in PMMA; b) Fluorescence lifetime in
PMMA. Excitation pulse (grey), decay (red) and mono-exponential deconvolution fit (black). Insert:
Logarithmic decay.
Conclusion
5-(1-adamantyl)oligothiophenes 57a-d were readily prepared by cross-coupling reactions.
Whereas the homo-coupling products 59a-c behave as pigments, mono-substitution with the
1-adamantyl moiety confers 57a-d an excellent solubility in most organic solvents. These
compounds, particularly the 5-(1-adamantyl)quaterthiophene 57d, exhibit remarkable optical
properties in solution and in solid PMMA like an increased Stokes’ shift and high fluorescence
quantum yields. This makes them interesting for applications in frequency converting systems.
Focussing on the very fast fluorescence decay of 0.39 ns of 57d, these properties may allow
using this substance as a highly soluble fluorescent dye in high throughput optical signal
processing units exceeding the benchmark of 1 GBit/s.
0
0.5
1
250 450 650
I relo
r I re
l
l / nm
Irel = 24925e-t/0.4029
0 1 2 3 4
I/ a
.u.
t / ns
0
0.5
1
250 450 650
E rel
or
I rel
/ ns
0 5 10
I/ a
.u.
/ ns
0 5 10I/
a.u
.
/ ns
Irel = 23146e-t/0.3877
0 1 2 3 4
I/ a
.u.
/ ns
a b
c d

Results and Discussion
109
2.5.2 Alkyl and Aryl Substituted Oligothiophenes
2-Alkyloligothiophenes such as the 5-(1-adamantyl)quaterthiophene 57d presented above
exhibits high chemical stability and can be added to radical polymerization reactions without
any sign of decomposition. However, long-term exposure to light, particularly to exciting
wavelengths, leads to considerable photo bleaching. For application in optical data processing
a high stability towards photons is essential for long-life components. Thus, the focus was laid
on more electron deficient oligothiophenes. Terminal substitution with electron withdrawing
moieties should not only increase the stability, moreover, variation of these groups offers a
viable option for the spectral adaption, particularly to common light sources such as GaN-
diodes with emission wavelengths in the region of 405 nm.
Electron withdrawing moieties cause a bathochromic shift of the absorption of
oligothiophenes[99]. To reach visible regions of more than 400 nm, the synthesis of less soluble
quaterthiophenes can be avoided and replaced by the more readily accessible terthiophenes.
A simple and efficient synthesis of terminal bisketo-2,2’-terthiophenes was targeted. The
positions 3 and 4 were left unsubstituted for supporting molecular dynamics of the excited
states. Furthermore, a rod-like shape causes less defects in the glassy structure of the
polymer, preferably poly(methyl methacrylate) (PMMA) to realize minimal scattering of the
guided light. Carbonyl derivatives such as the diacetyl terthiophene[100] were sparingly
investigated. Only the poorly soluble carboxylic acid and some esters were reported more
detailed[101].
Synthesis was started with readily available mono- and dibromo thiophene to carry out a
double Kumada coupling reaction, shown in Scheme 23. Using 0.2 mol% of Pd(dppf)Cl2 as
catalyst led to a very satisfacting yield of 82%. The resulting terthiophene 60 was isolated and
treated with acyl chlorides in Friedel-Crafts reactions to obtain the respective terminal
bisketones 61a-e. Two different conditions were applied. One was following a standard
procedure using an excess of water-free aluminum chloride as Lewis acid in carbon
disulphide.[102] An alternative route applied simple solid zinc oxide in sub-stoichiometric
amounts (0.25 equivalent per reactive center). The catalytic potency of zinc oxide is already
described for few reactions[103] however, in most cases activated species such as nanorods [104],
nanoparticles[105] or hollow spheres [106] had to be prepared previously or the method was

Results and Discussion
110
restricted to solvent free conditions [107]. The electron rich terthiophene reacts using half an
equivalent of low-cost plain powder of zinc oxide to obtain the (terthiophenediyl)bisketones
61a-e in yields clearly exceeding those of the AlCl3 approach. Further advantages of the ZnO-
pathway are the application of more convenient solvents such as chloroform and the
prevention of the formation of byproducts. The reduced activity of ZnO results only in product
and starting material which can easily be recovered.
Scheme 23: Synthesis of ([2,2’:5’,2’’-terthiophene]-5,5’’-diyl)bisketones 61a-e under two different
conditions.
To further decrease the electron density in the chromophore extension with
perfluoroalkylacyl chlorides [108] was investigated. Using ZnO as Lewis acid led to no significant
reaction. However, the reaction could be catalyzed with AlCl3 in CS2 but stopped at the stage
of mono substitution due to the influence of the desactivating perfluoroketo group. The
monosubstituted derivatives 62a-b (Scheme 24) were obtained.
Scheme 24: Synthesis of bi- and terthienylheptafluorobutanone 62a-b.
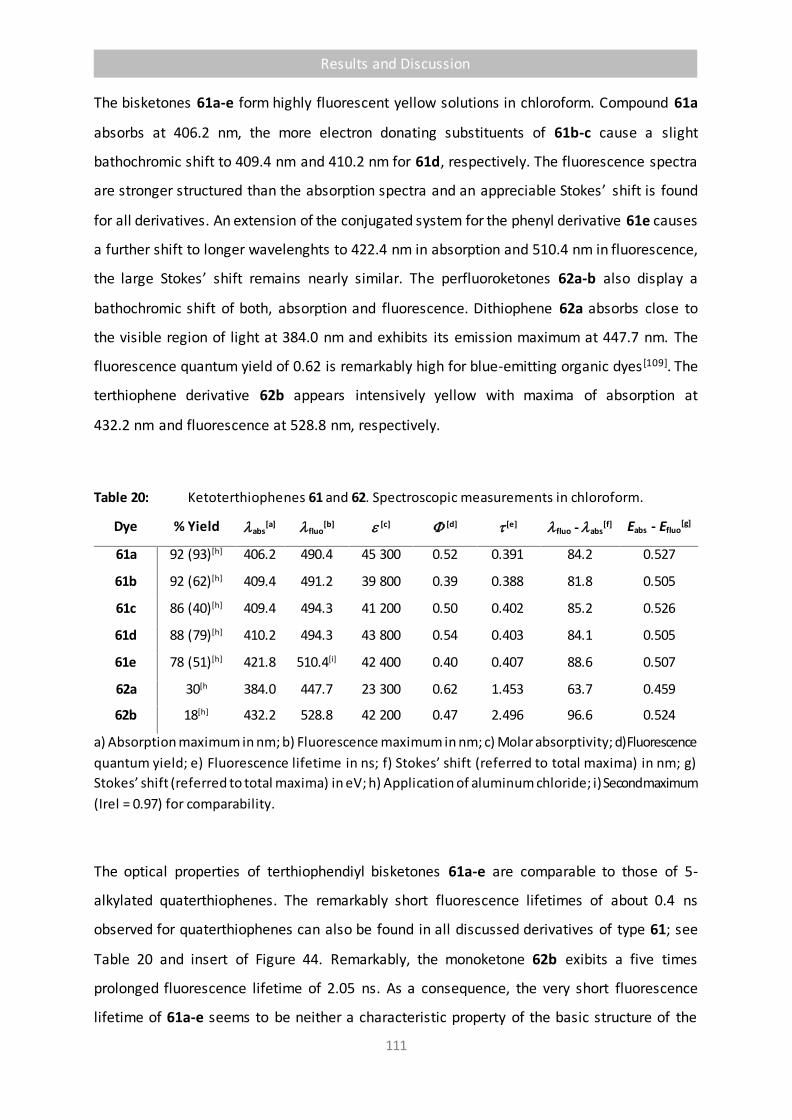
Results and Discussion
111
The bisketones 61a-e form highly fluorescent yellow solutions in chloroform. Compound 61a
absorbs at 406.2 nm, the more electron donating substituents of 61b-c cause a slight
bathochromic shift to 409.4 nm and 410.2 nm for 61d, respectively. The fluorescence spectra
are stronger structured than the absorption spectra and an appreciable Stokes’ shift is found
for all derivatives. An extension of the conjugated system for the phenyl derivative 61e causes
a further shift to longer wavelenghts to 422.4 nm in absorption and 510.4 nm in fluorescence,
the large Stokes’ shift remains nearly similar. The perfluoroketones 62a-b also display a
bathochromic shift of both, absorption and fluorescence. Dithiophene 62a absorbs close to
the visible region of light at 384.0 nm and exhibits its emission maximum at 447.7 nm. The
fluorescence quantum yield of 0.62 is remarkably high for blue-emitting organic dyes [109]. The
terthiophene derivative 62b appears intensively yellow with maxima of absorption at
432.2 nm and fluorescence at 528.8 nm, respectively.
Table 20: Ketoterthiophenes 61 and 62. Spectroscopic measurements in chloroform.
Dye % Yield labs[a] lfluo
[b] [c] [d] [e] lfluo - labs[f] Eabs - Efluo
[g]
61a 92 (93)[h] 406.2 490.4 45 300 0.52 0.391 84.2 0.527
61b 92 (62)[h] 409.4 491.2 39 800 0.39 0.388 81.8 0.505
61c 86 (40)[h] 409.4 494.3 41 200 0.50 0.402 85.2 0.526
61d 88 (79)[h] 410.2 494.3 43 800 0.54 0.403 84.1 0.505
61e 78 (51)[h] 421.8 510.4[i] 42 400 0.40 0.407 88.6 0.507
62a 30[h 384.0 447.7 23 300 0.62 1.453 63.7 0.459
62b 18[h] 432.2 528.8 42 200 0.47 2.496 96.6 0.524
a) Absorption maximum in nm; b) Fluorescence maximum in nm; c) Molar absorptivity; d) Fluorescence
quantum yield; e) Fluorescence lifetime in ns; f) Stokes’ shift (referred to total maxima) in nm; g)
Stokes’ shift (referred to total maxima) in eV; h) Application of aluminum chloride; i) Second maximum
(Irel = 0.97) for comparability.
The optical properties of terthiophendiyl bisketones 61a-e are comparable to those of 5-
alkylated quaterthiophenes. The remarkably short fluorescence lifetimes of about 0.4 ns
observed for quaterthiophenes can also be found in all discussed derivatives of type 61; see
Table 20 and insert of Figure 44. Remarkably, the monoketone 62b exibits a five times
prolonged fluorescence lifetime of 2.05 ns. As a consequence, the very short fluorescence
lifetime of 61a-e seems to be neither a characteristic property of the basic structure of the

Results and Discussion
112
terthiophene, nor a consequence of the attached perfluoroalkyls. Even alkyl substituents
which mainly affect the -electrons of the chromophore by induction strongly influence the
fluorescence lifetimes of similar chromophores. Fluorescence liftimes of more than 1 ns are
also desbribed for monoketo di- and terthiophenes.[103b]
Figure 44: Left: Absorption (right) and fluorescence (left) spectra of 61a (black), 61d (red) and 61e
(grey) in chloroform;Right: Fluorescence lifetime of 61d in chloroform. IRF (grey), fluorescence decay
(red), deconvolutional fit (black). Insert: Exponential fit of 61d resulting in a fluorescence lifetime of
0.403 ns.
The stability of bisketo-terthiophenes exceed that of the alkylated species. No sign of
decomposition could be detected for the bisketon derivative 61d, whereas
alkylquaterthiophene 57d exhibits decreasing fluorescence quantum yields after exposure to
sunlight for several months. This difference is further confirmed by the energies (DFT B3LYP
6-311**G) of the respective HOMO[110] with values of -6.022 eV for 61d compared to -5.277 eV
for 57d. A difference of 0.745 eV represents higher stability towards photo oxidation in the
order of about one magnitude.
Quantum chemical calculations (DFT B3LYP 6-311**G and CAM 6-311**G) propose a
complete planar structure for both, ground state and excited state and is shown in Figure 45,
left. HOMO and LUMO are shown in Figure 45, right. However, crystallographic data presented
in Figure 46 exhibit slightly twisted rings with dihedral angles of 9.53 and 10.53°, respectively.
These results agree with literature confirming the assumed mechanism which is made
responsible for the increased Stokes’ shift.[96]
0
0.5
1
250 500 750
I rel
l / nm0 5 10
I/ a
.u.
t / ns
I = Ae-t/0.403ns
0 1 2
I/ a
.u.
t / ns

Results and Discussion
113
TDSCF B3LYP 6-311**G (excited state) CAM-B3LYP 6-311**G LUMO (ground state)
CIS 6-311**G (excited state) CAM-B3LYP 6-311**G HOMO (ground state)
CAM-B3LYP 6-311**G (ground state) B3LYP 6-311**G LUMO (ground state)
B3LYP 6-311**G (ground state) B3LYP 6-311**G HOMO (ground state)
Figure 45: Quantumchemical calculations of 61d (B3LYP 6-311**G and CAM-B3LYP 6-311**G).
Left: Planar structure of the electronic ground state (bottom) and the electronically excited state (top)
in either of the applied methods. Right: Calculated HOMO and LUMO of 61d.
Figure 46: Crystal structure of terthiophenediyl bisketone 61d. The thiophene units are twisted
to each other with dihydral angles of about 10°.

Results and Discussion
114
The bisketones 61a-e are of general interest for data processing due to their short
fluorescence lifetimes, their high lightfastness and comparably high fluorescence quantum
yields. Furthermore, they can be efficiently synthesised and chemically purified. Particularly
dye 61d is attractive for such applications because there are no enolisable hydrogen atoms
inhibiting side reactions. The high solubility of all derivatives (increasing from 61a to 61d)
enables easy processing of polymer fibers. The phenyl derivative 61e is an alternative if more
bathochromic spectra are required and proves the potential of the synthetic method to
achieve arylated oligothiophenes.
Figure 47: Left: Absorption (in chloroform, grey), fluorescence excitation (in PMMA, black) and
fluorescence (in PMMA, red) spectra of 61d; Right: Fluorescence lifetime of 61d in PMMA fiber. IRF
(grey), fluorescence decay (red), deconvolutional fit (black). Insert: Exponential fit of 61d in PMMA
resulting in a fluorescence lifetime of 0.388 ns.
PMMA is a preferred organic polymer for fibre optics because of its low absorptivity where
there is even a spectral window with very low optical damping of yellow light. As a
consequence, 61d was incorporated into PMMA to study the optical properties. The chemical
inertness of 61d allows a dissolution in monomeric MMA and subsequent radical
polymerisation without any measureable destructive effect to the dye. The fluorescence and
fluorescence excitation spectra of 61d in a PMMA fiber (Figure 48) are reported in Figure 47.
A comparison of the fluorescence excitation of 61d in PMMA with the absorption spectrum in
solution indicates a bathochromic shift in the polymer and slightly diminishes the Stokes’ shift
compared with the liquid phase. This is attributed to limited dynamic processes in solid glass
structures. However, there is still a very good spectral separation. The total width of the
absorption spectrum determines the reabsorption and in both, solution and solid matrix, the
baseline is reached at approximately the same values.
0 5 10
I/ a
.u.
t / ns
0
0.5
1
250 500 750
Irel
l / nm
I = Ae-t/o.388ns
0 1 2 3
I/ a
.u.
t / ns
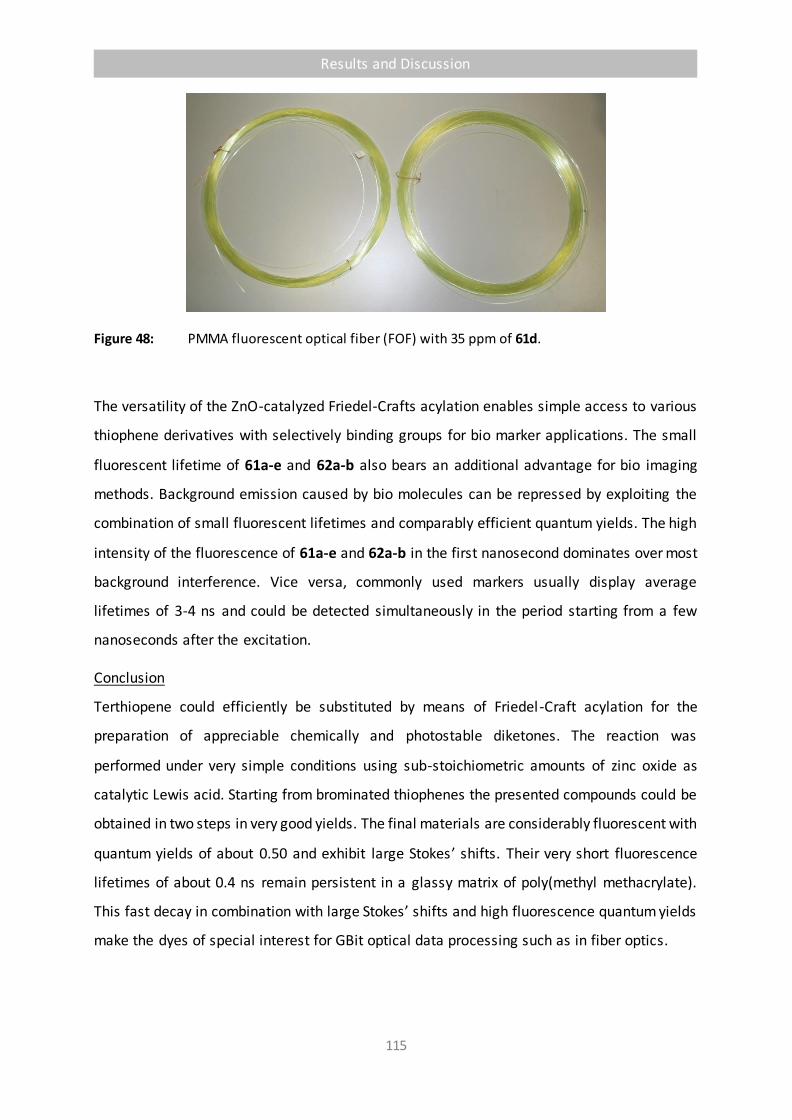
Results and Discussion
115
Figure 48: PMMA fluorescent optical fiber (FOF) with 35 ppm of 61d.
The versatility of the ZnO-catalyzed Friedel-Crafts acylation enables simple access to various
thiophene derivatives with selectively binding groups for bio marker applications. The small
fluorescent lifetime of 61a-e and 62a-b also bears an additional advantage for bio imaging
methods. Background emission caused by bio molecules can be repressed by exploiting the
combination of small fluorescent lifetimes and comparably efficient quantum yields. The high
intensity of the fluorescence of 61a-e and 62a-b in the first nanosecond dominates over most
background interference. Vice versa, commonly used markers usually display average
lifetimes of 3-4 ns and could be detected simultaneously in the period starting from a few
nanoseconds after the excitation.
Conclusion
Terthiopene could efficiently be substituted by means of Friedel-Craft acylation for the
preparation of appreciable chemically and photostable diketones. The reaction was
performed under very simple conditions using sub-stoichiometric amounts of zinc oxide as
catalytic Lewis acid. Starting from brominated thiophenes the presented compounds could be
obtained in two steps in very good yields. The final materials are considerably fluorescent with
quantum yields of about 0.50 and exhibit large Stokes’ shifts. Their very short fluorescence
lifetimes of about 0.4 ns remain persistent in a glassy matrix of poly(methyl methacrylate).
This fast decay in combination with large Stokes’ shifts and high fluorescence quantum yields
make the dyes of special interest for GBit optical data processing such as in fiber optics.

Results and Discussion
116
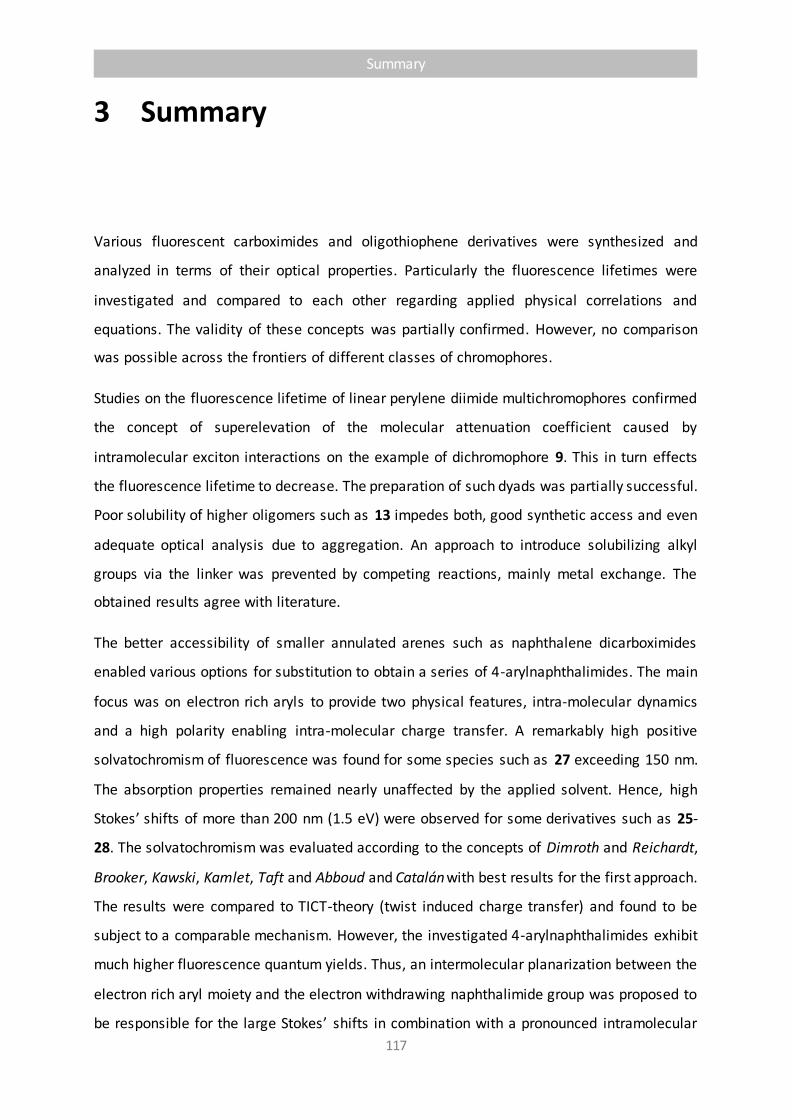
Summary
117
3 Summary
Various fluorescent carboximides and oligothiophene derivatives were synthesized and
analyzed in terms of their optical properties. Particularly the fluorescence lifetimes were
investigated and compared to each other regarding applied physical correlations and
equations. The validity of these concepts was partially confirmed. However, no comparison
was possible across the frontiers of different classes of chromophores.
Studies on the fluorescence lifetime of linear perylene diimide multichromophores confirmed
the concept of superelevation of the molecular attenuation coefficient caused by
intramolecular exciton interactions on the example of dichromophore 9. This in turn effects
the fluorescence lifetime to decrease. The preparation of such dyads was partially successful.
Poor solubility of higher oligomers such as 13 impedes both, good synthetic access and even
adequate optical analysis due to aggregation. An approach to introduce solubilizing alkyl
groups via the linker was prevented by competing reactions, mainly metal exchange. The
obtained results agree with literature.
The better accessibility of smaller annulated arenes such as naphthalene dicarboximides
enabled various options for substitution to obtain a series of 4-arylnaphthalimides. The main
focus was on electron rich aryls to provide two physical features, intra-molecular dynamics
and a high polarity enabling intra-molecular charge transfer. A remarkably high positive
solvatochromism of fluorescence was found for some species such as 27 exceeding 150 nm.
The absorption properties remained nearly unaffected by the applied solvent. Hence, high
Stokes’ shifts of more than 200 nm (1.5 eV) were observed for some derivatives such as 25-
28. The solvatochromism was evaluated according to the concepts of Dimroth and Reichardt,
Brooker, Kawski, Kamlet, Taft and Abboud and Catalán with best results for the first approach.
The results were compared to TICT-theory (twist induced charge transfer) and found to be
subject to a comparable mechanism. However, the investigated 4-arylnaphthalimides exhibit
much higher fluorescence quantum yields. Thus, an intermolecular planarization between the
electron rich aryl moiety and the electron withdrawing naphthalimide group was proposed to
be responsible for the large Stokes’ shifts in combination with a pronounced intramolecular
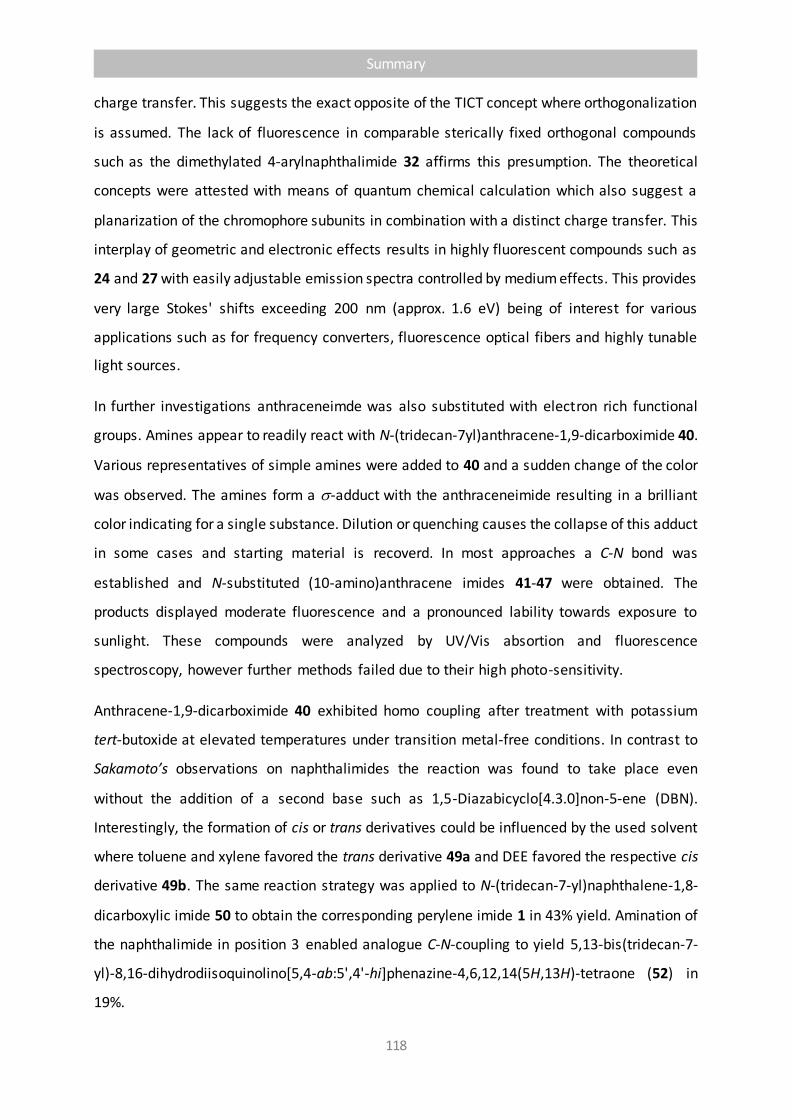
Summary
118
charge transfer. This suggests the exact opposite of the TICT concept where orthogonalization
is assumed. The lack of fluorescence in comparable sterically fixed orthogonal compounds
such as the dimethylated 4-arylnaphthalimide 32 affirms this presumption. The theoretical
concepts were attested with means of quantum chemical calculation which also suggest a
planarization of the chromophore subunits in combination with a distinct charge transfer. This
interplay of geometric and electronic effects results in highly fluorescent compounds such as
24 and 27 with easily adjustable emission spectra controlled by medium effects. This provides
very large Stokes' shifts exceeding 200 nm (approx. 1.6 eV) being of interest for various
applications such as for frequency converters, fluorescence optical fibers and highly tunable
light sources.
In further investigations anthraceneimde was also substituted with electron rich functional
groups. Amines appear to readily react with N-(tridecan-7yl)anthracene-1,9-dicarboximide 40.
Various representatives of simple amines were added to 40 and a sudden change of the color
was observed. The amines form a -adduct with the anthraceneimide resulting in a brilliant
color indicating for a single substance. Dilution or quenching causes the collapse of this adduct
in some cases and starting material is recoverd. In most approaches a C-N bond was
established and N-substituted (10-amino)anthracene imides 41-47 were obtained. The
products displayed moderate fluorescence and a pronounced lability towards exposure to
sunlight. These compounds were analyzed by UV/Vis absortion and fluorescence
spectroscopy, however further methods failed due to their high photo-sensitivity.
Anthracene-1,9-dicarboximide 40 exhibited homo coupling after treatment with potassium
tert-butoxide at elevated temperatures under transition metal-free conditions. In contrast to
Sakamoto’s observations on naphthalimides the reaction was found to take place even
without the addition of a second base such as 1,5-Diazabicyclo[4.3.0]non-5-ene (DBN).
Interestingly, the formation of cis or trans derivatives could be influenced by the used solvent
where toluene and xylene favored the trans derivative 49a and DEE favored the respective cis
derivative 49b. The same reaction strategy was applied to N-(tridecan-7-yl)naphthalene-1,8-
dicarboxylic imide 50 to obtain the corresponding perylene imide 1 in 43% yield. Amination of
the naphthalimide in position 3 enabled analogue C-N-coupling to yield 5,13-bis(tridecan-7-
yl)-8,16-dihydrodiisoquinolino[5,4-ab:5',4'-hi]phenazine-4,6,12,14(5H,13H)-tetraone (52) in
19%.

Summary
119
Investigation of the fluorescence lifetime of perylene diimide 1 revealed a strong dependence
of the actually measured decay on the concentration. However, no such effects were observed
for the fluorescence quantum yield in the respective concentrations. Opposed to quenching
effects, an increase of the fluorescence quantum yield by a factor of up to 1.5 was found for
higher concentrations. The experiments were expanded to well-known fluorophores such as
fluorescein (54) or rhodamine B (55) and led to the same results. The linear correlation of
attenuation and concentration given by Lambert-Beer’s law was verified and no
inconsistencies to this theory were found. Neither viscosity nor refractive indices were
measurably influenced in the respective range of dilution. The results imply to not consider
fluorescence lifetime for a constant as done in literature. Moreover, all equations regarding
fluorescence lifetime that are presented in this work do not include concentration as an
unknown quantity. Long-range interactions between the highly separated (up to 250 nm in
average) fluorophores seem to be responsible for a temporal stabilization of the excited state.
The emitted light wave is of macroscopic dimensions and thus, not localized to a single
molecule. Analogously to Yagi-Uda antenna for UHF applications the excited molecule might
interact with the surrounding molecules and result in a kind of stabilizing resonance which
prolongs the lifetime of the excited state.
Not only concentration varies the fluorescence lifetime of chromophores. Environmental
influences such as the refractive index mentioned above also have a strong impact. Polymers
were found to display a weak but detectable auto-fluorescence. Even unmarked technical,
aliphatic polymers such as polyethylene can be irradiated with light pulses and identified by
distinct fluorescent decays. These decays exhibit multi-exponential behavior which can be
used to ensure an unequivocal fingerprint of the time-resolved fluorescence. The high
reliability even expands to distinguish between contaminated and mainly pure polymers. The
method of using light enables sorting of recycling material by means of well-known technology
in very high repetition frequencies. Cerium (IV) was found to be a universal probe found in
most technical products. The wide distribution of cerium allows standardized procedures for
the identification of polymers and draws fluorescence lifetime analysis into the focus of
industrial plastic recycling solutions.

Summary
120
The implementation of fluorophores into polymers is generally interesting for opto-electronic
applications. In optical slip rings a fluorescent dye is incorporated into a glassy polymer matrix,
preferably poly(methyl methacrylate) (PMMA). Short lifetimes of the excited state enable high
pulse frequencies and thus, high data transmission rates. In contrast to most fluorescent dyes
with appreciable quantum yields, --oligothiophenes exhibit very short fluorescence
lifetimes of about 1 ns. The poor solubility of higher oligomers with absorption maxima in the
visible range (n ≥ 4) was increased by organometallic substitution with 1-adamantyl moieties
in position 5. The mono-alkylated derivatives display high solubility in the monomeric methyl
methacrylate and (adamantyl)quaterthiophene 57d was implemented into a PMMA fiber. The
optical properties characterized by a high Stokes’ shift and a short fluorescence lifetime of
0.4 ns match the requirements for data transmission in slip ring arrangements.
For better accessibility and higher long-term stability at the same time, the degree of
oligomerization was decreased to 3. To shift the absorption maximum into the visible region
where low-cost and fast light sources are available (GaN laser diods with emission maxima at
about 405 nm) the terthiophenes were terminally substituted with alkyl-keto groups. The
reactions were realized in zinc oxide-mediated Friedel-Crafts acylations where the applied
Lewis’ acid led to higher yields compared to classic approaches such as with aluminum
chloride. The obtained ,-bisketones 61a-e display similar optical spectra compared to 57d
and also the short fluorescence lifetime of 0.4 ns remains unaltered. The considerably
fluorescent terthiophenes 61a-e exhibit fluorescence quantum yields of about 0.50 and large
Stokes’ shifts that avoid re-absorption within the fiber. Thus, tert-butyl derivative 61d was
incorporated into a PMMA fiber to be tested in prototype stage for high speed data processing
with rates of more than 1 GBit s-1.

Experimental Section
121
4 Experimental Section
4.1 General Working Techniques
All reactions carried out under argon atmosphere were performed using Schlenk technique in
flame-dried (T > 300 °C) glassware applying medium vacuum of less than 10-2 mbar (1 Pa).
Syringes for the transfer of anhydrous solvents or reagents were purged with argon prior to
use. THF was continuously refluxed over sodium and freshly distilled from sodium
benzophenone ketyl under nitrogen. All remaining solvents attributed “dry” were purchased
in 98+% purity and dried and distilled according to standard procedures. Yields refer to
isolated compounds estimated to be >98% pure as determined by 1H NMR (27 °C) and/or
capillary GC. Chemical shifts are reported as -values in ppm relative to the solvent peak. NMR
spectra were recorded in deuterated solvents (>99%). For the characterization of the observed
signal multiplicities the following abbreviations were used: s (singlet), d (doublet), t (triplet),
q (quartet), dd (doublet of a doublet), ddd (doublet of a doublet of a doublet), dt (doublet of
triplet), tt (triplet of triplet), m (multiplet) and br (broad signal). Column chromatography was
performed using silica (SiO2) (0.040 – 0.063 mm or 0.63 – 0.200 mm particle size) from Merck
and aluminum oxide (activity as indicated) from Merck. All reagents were obtained from
commercial sources with > 95% purity and used without further purification if not indicated
otherwise. Masses and quantities are given with 3 valid digits or less respecting the limitations
of the accuracy of instruments. Fluorescence spectra were obtained by excitation at the
respective absorption maximum (> 320 nm) if not noted otherwise. Fluorescence quantum
yields were determined according to literature.[111]

Experimental Section
122
4.2 Analytical Methods and Instruments
IR-Spectra: Perkin Elmer Spektrum B XII FT-IR System
NMR spectroscopy: Varian Vnmrs 600 (600 MHz), Varian Mercury 200 (200 MHz)
UV/Vis-Spectra: Varian Cary 5000
Fluorescence spectra: Varian Cary Eclispe
Fluorescence lifetimes: PicoQuant FluoTime 300, PicoQuant PicoHarp 300, PC-405 and PC-510
laser with 0.4 mW power and a puls frequency of 80 MHz; Edinburgh Analytical Instruments
CD900, nF900 tungsten flashlight; NKT-Laser SuperK Extreme EXB-4 from NKT Photonics A/S,
monochromator from Edinburgh Instruments Ltd., photomultiplier PMA-C 192-N-M and
electronics PicoHarp 300 from PicoQuant GmbH. Fluorescence lifetimes were obtained by
exponential fitting of the deconvoluted fluorescence decays with a resulting resolution of up
to 8 ps;
Mass spectrometry: Finnigan MAT 95
Elemental analysis: Elementar vario EL, Elementar vario microcube.
Fluorescence quantum yields were determined according to literature.[8001]
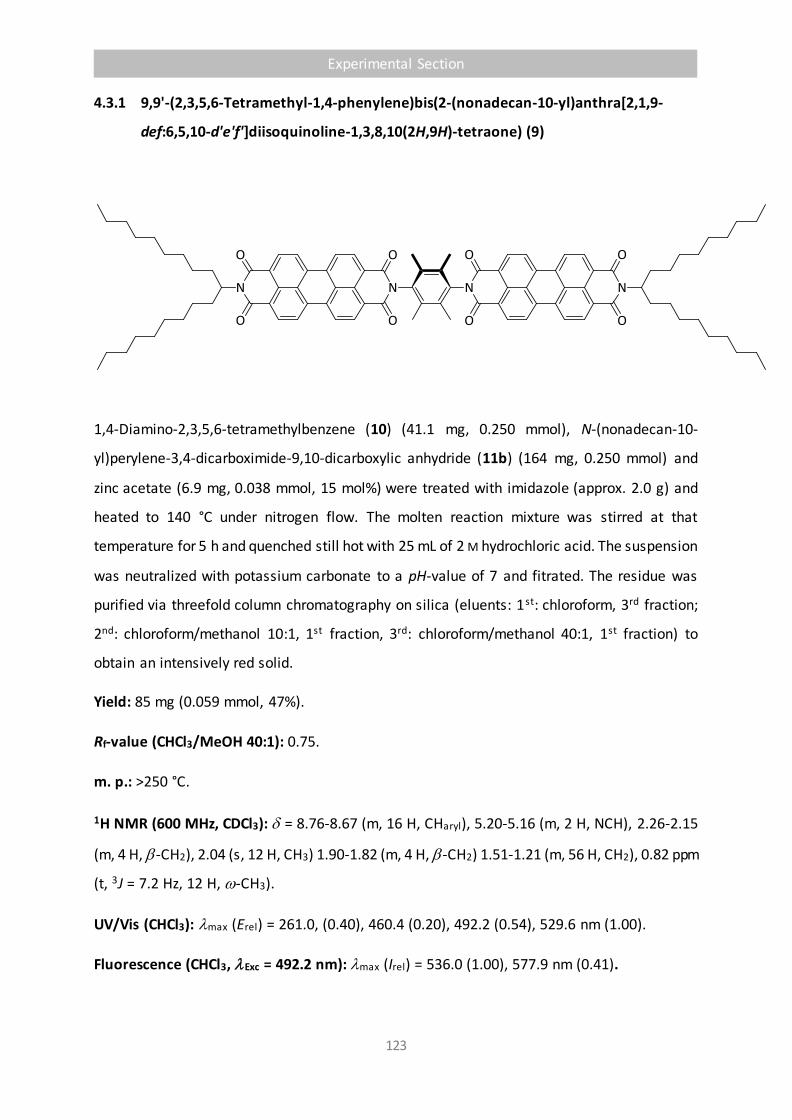
Experimental Section
123
4.3.1 9,9'-(2,3,5,6-Tetramethyl-1,4-phenylene)bis(2-(nonadecan-10-yl)anthra[2,1,9-
def:6,5,10-d'e'f']diisoquinoline-1,3,8,10(2H,9H)-tetraone) (9)
1,4-Diamino-2,3,5,6-tetramethylbenzene (10) (41.1 mg, 0.250 mmol), N-(nonadecan-10-
yl)perylene-3,4-dicarboximide-9,10-dicarboxylic anhydride (11b) (164 mg, 0.250 mmol) and
zinc acetate (6.9 mg, 0.038 mmol, 15 mol%) were treated with imidazole (approx. 2.0 g) and
heated to 140 °C under nitrogen flow. The molten reaction mixture was stirred at that
temperature for 5 h and quenched still hot with 25 mL of 2 M hydrochloric acid. The suspension
was neutralized with potassium carbonate to a pH-value of 7 and fitrated. The residue was
purified via threefold column chromatography on silica (eluents: 1st: chloroform, 3rd fraction;
2nd: chloroform/methanol 10:1, 1st fraction, 3rd: chloroform/methanol 40:1, 1st fraction) to
obtain an intensively red solid.
Yield: 85 mg (0.059 mmol, 47%).
Rf-value (CHCl3/MeOH 40:1): 0.75.
m. p.: >250 °C.
1H NMR (600 MHz, CDCl3): = 8.76-8.67 (m, 16 H, CHaryl), 5.20-5.16 (m, 2 H, NCH), 2.26-2.15
(m, 4 H, -CH2), 2.04 (s, 12 H, CH3) 1.90-1.82 (m, 4 H, -CH2) 1.51-1.21 (m, 56 H, CH2), 0.82 ppm
(t, 3J = 7.2 Hz, 12 H, -CH3).
UV/Vis (CHCl3): lmax (Erel) = 261.0, (0.40), 460.4 (0.20), 492.2 (0.54), 529.6 nm (1.00).
Fluorescence (CHCl3, lExc = 492.2 nm): lmax (Irel) = 536.0 (1.00), 577.9 nm (0.41).
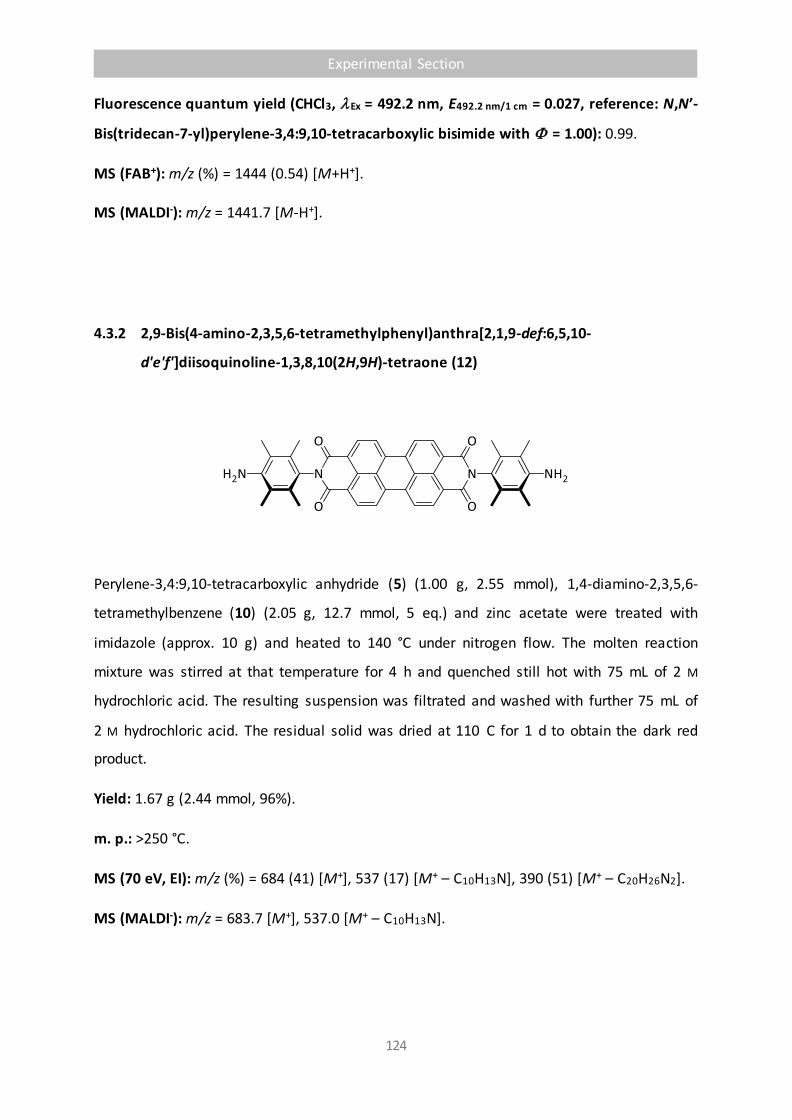
Experimental Section
124
Fluorescence quantum yield (CHCl3, lEx = 492.2 nm, E492.2 nm/1 cm = 0.027, reference: N,N’-
Bis(tridecan-7-yl)perylene-3,4:9,10-tetracarboxylic bisimide with = 1.00): 0.99.
MS (FAB+): m/z (%) = 1444 (0.54) [M+H+].
MS (MALDI-): m/z = 1441.7 [M-H+].
4.3.2 2,9-Bis(4-amino-2,3,5,6-tetramethylphenyl)anthra[2,1,9-def:6,5,10-
d'e'f']diisoquinoline-1,3,8,10(2H,9H)-tetraone (12)
Perylene-3,4:9,10-tetracarboxylic anhydride (5) (1.00 g, 2.55 mmol), 1,4-diamino-2,3,5,6-
tetramethylbenzene (10) (2.05 g, 12.7 mmol, 5 eq.) and zinc acetate were treated with
imidazole (approx. 10 g) and heated to 140 °C under nitrogen flow. The molten reaction
mixture was stirred at that temperature for 4 h and quenched still hot with 75 mL of 2 M
hydrochloric acid. The resulting suspension was filtrated and washed with further 75 mL of
2 M hydrochloric acid. The residual solid was dried at 110 C for 1 d to obtain the dark red
product.
Yield: 1.67 g (2.44 mmol, 96%).
m. p.: >250 °C.
MS (70 eV, EI): m/z (%) = 684 (41) [M+], 537 (17) [M+ – C10H13N], 390 (51) [M+ – C20H26N2].
MS (MALDI-): m/z = 683.7 [M+], 537.0 [M+ – C10H13N].

Experimental Section
125
4.3.3 9,9'-((1,3,8,10-Tetraoxo-1,3,8,10-tetrahydroanthra[2,1,9-def:6,5,10-
d'e'f']diisoquinoline-2,9-diyl)bis(2,3,5,6-tetramethyl-4,1-phenylene))bis(2-(tridecan-
7-yl)anthra[2,1,9-def:6,5,10-d'e'f']diisoquinoline-1,3,8,10(2H,9H)-tetraone) (13)
N,N’-Bis-(4-amino-2,3,4,5-tetramethylphenyl)perylene-3,4:9,10-tetracarboxylic imide (12)
(20.4 mg, 0.0296 mmol) and N,N’-bis(tridecan-7-yl)perylene-3,4-dicarboximide-9,10-
dicarboxylic anhydride (11a) (84.3 mg, 0.147 mmol, 5 eq.) were dissolved in 0.5 mL of
quinoline and stirred at 220 °C for 6 h. The reaction mixture was quenched with 15 mL of half
concentrated hydrochloric acid and filtrated. The residue was dried at 110 °C overnight and
purified via repeated column chromatography (silica, chloroform/methanol 7:1). The 1st
fraction was collected each time to obtain a red solid.
Yield: 3.7 mg (0.0021 mmol, 7%).
Rf-value (CHCl3/MeOH 7:1): 0.60.
m. p.: >250 °C.
UV/Vis (CHCl3): lmax (Erel) = 261.4 (0.66), 490.8 (0.62), 527.2 nm (1.00), 589.0 (0.09).
UV/Vis (EtOAc): lmax (Erel) = 483.8 (0.63), 519.0 nm (1.00).
Fluorescence (CHCl3, lExc = 490.8 nm): lmax (Irel) = 534.8 (1.00), 577.6 nm (0.50).
Fluorescence quantum yield (CHCl3, lEx = 490.8 nm, E490.8 nm/1 cm = 0.122, reference: N,N’-
Bis(tridecan-7-yl)perylene-3,4:9,10-tetracarboxylic bisimide with = 1.00): 0.86.
MS (MALDI-): m/z = 1794 [M-H+].

Experimental Section
126
4.3.4 1,2,4,5-Tetrakis(bromomethyl)benzene (15)
N-Bromosuccinimide (71.2 g, 400 mmol, 4 eq.) was dissolved in 300 mL of dichloromethane.
After addition of 1,2,4,5-tetramethylbenzene (14) (13.4 g, 100 mmol), the reaction mixture
was stirred at 50 °C under reflux and exposed to UV-radiation (254 nm, 366 nm, 3 W each)for
22 h. Subsequently, the reaction mixture was filtrated and washed with 200 mL of
dichloromethane. The residue was treated with 150 mL of methanol and stirred at room
temperature overnight. After further filtration the residue was collected and dried at 80 °C for
1 d. The coloress product was obtained as powder.
Yield: 20.7 g (45.8 mmol, 46%).
m. p.: 162 °C.
IR (ATR): 𝜈 = 3020, 2974, 1503, 1453, 1443, 1435, 1306, 1229, 1208 (s), 1085, 909, 898,
797 cm-1.
1H NMR (400 MHz, CDCl3): = 7.37 (s, 2 H, CHaryl), 4.69 ppm (s, 8 H, CH2).
MS (70 eV, EI): m/z (%) = 450 (6) [M+], 369 (100) [M+ – Br], 290 (24) [M+ – 2 Br], 211 (37) [M+
– 3 Br], 130 (31) [M+ – 4 Br].
HRMS (EI, C10H10Br4): m/z = calc. 445.7516, found 445.7519, = +0.3 mmu.
Elemental analysis C10H10Br4 (449.8 g mol-1): calc. C: 26.70, H: 2.24, Br: 71.06;
found C: 26.88, H: 2.23, Br: 70.35.
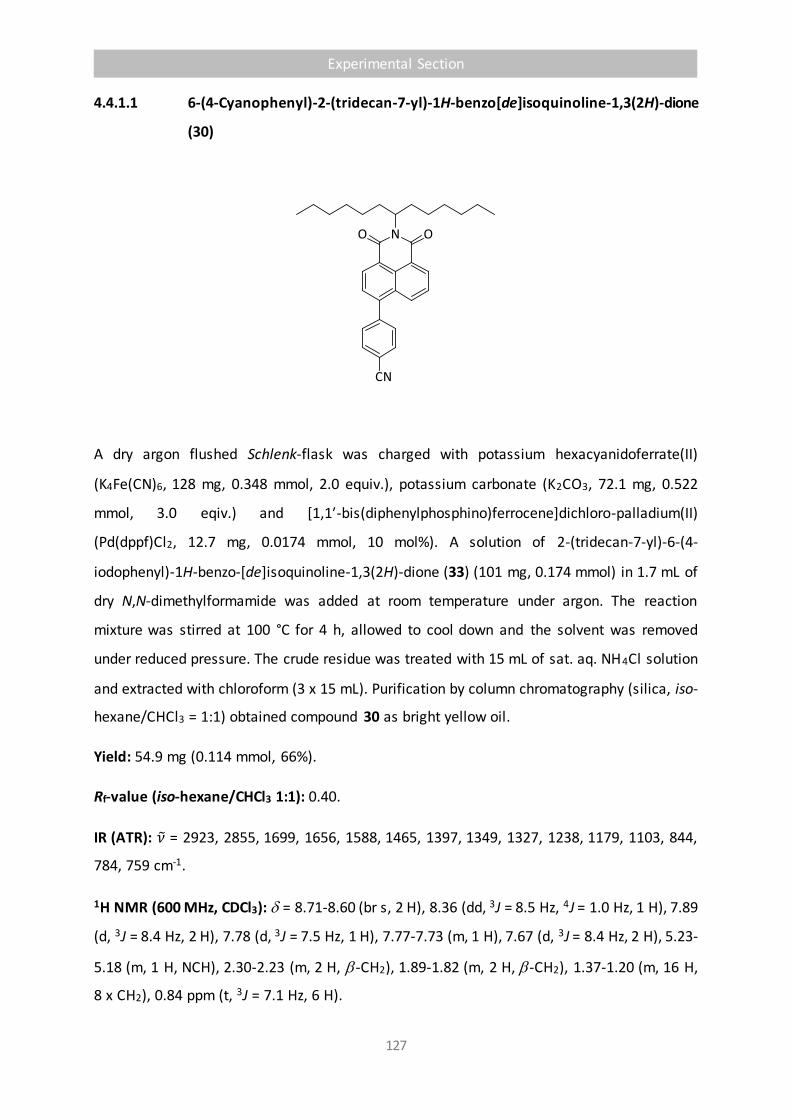
Experimental Section
127
4.4.1.1 6-(4-Cyanophenyl)-2-(tridecan-7-yl)-1H-benzo[de]isoquinoline-1,3(2H)-dione
(30)
A dry argon flushed Schlenk-flask was charged with potassium hexacyanidoferrate(II)
(K4Fe(CN)6, 128 mg, 0.348 mmol, 2.0 equiv.), potassium carbonate (K2CO3, 72.1 mg, 0.522
mmol, 3.0 eqiv.) and [1,1′-bis(diphenylphosphino)ferrocene]dichloro-palladium(II)
(Pd(dppf)Cl2, 12.7 mg, 0.0174 mmol, 10 mol%). A solution of 2-(tridecan-7-yl)-6-(4-
iodophenyl)-1H-benzo-[de]isoquinoline-1,3(2H)-dione (33) (101 mg, 0.174 mmol) in 1.7 mL of
dry N,N-dimethylformamide was added at room temperature under argon. The reaction
mixture was stirred at 100 °C for 4 h, allowed to cool down and the solvent was removed
under reduced pressure. The crude residue was treated with 15 mL of sat. aq. NH4Cl solution
and extracted with chloroform (3 x 15 mL). Purification by column chromatography (silica, iso-
hexane/CHCl3 = 1:1) obtained compound 30 as bright yellow oil.
Yield: 54.9 mg (0.114 mmol, 66%).
Rf-value (iso-hexane/CHCl3 1:1): 0.40.
IR (ATR): 𝜈 = 2923, 2855, 1699, 1656, 1588, 1465, 1397, 1349, 1327, 1238, 1179, 1103, 844,
784, 759 cm-1.
1H NMR (600 MHz, CDCl3): = 8.71-8.60 (br s, 2 H), 8.36 (dd, 3J = 8.5 Hz, 4J = 1.0 Hz, 1 H), 7.89
(d, 3J = 8.4 Hz, 2 H), 7.78 (d, 3J = 7.5 Hz, 1 H), 7.77-7.73 (m, 1 H), 7.67 (d, 3J = 8.4 Hz, 2 H), 5.23-
5.18 (m, 1 H, NCH), 2.30-2.23 (m, 2 H, -CH2), 1.89-1.82 (m, 2 H, -CH2), 1.37-1.20 (m, 16 H,
8 x CH2), 0.84 ppm (t, 3J = 7.1 Hz, 6 H).
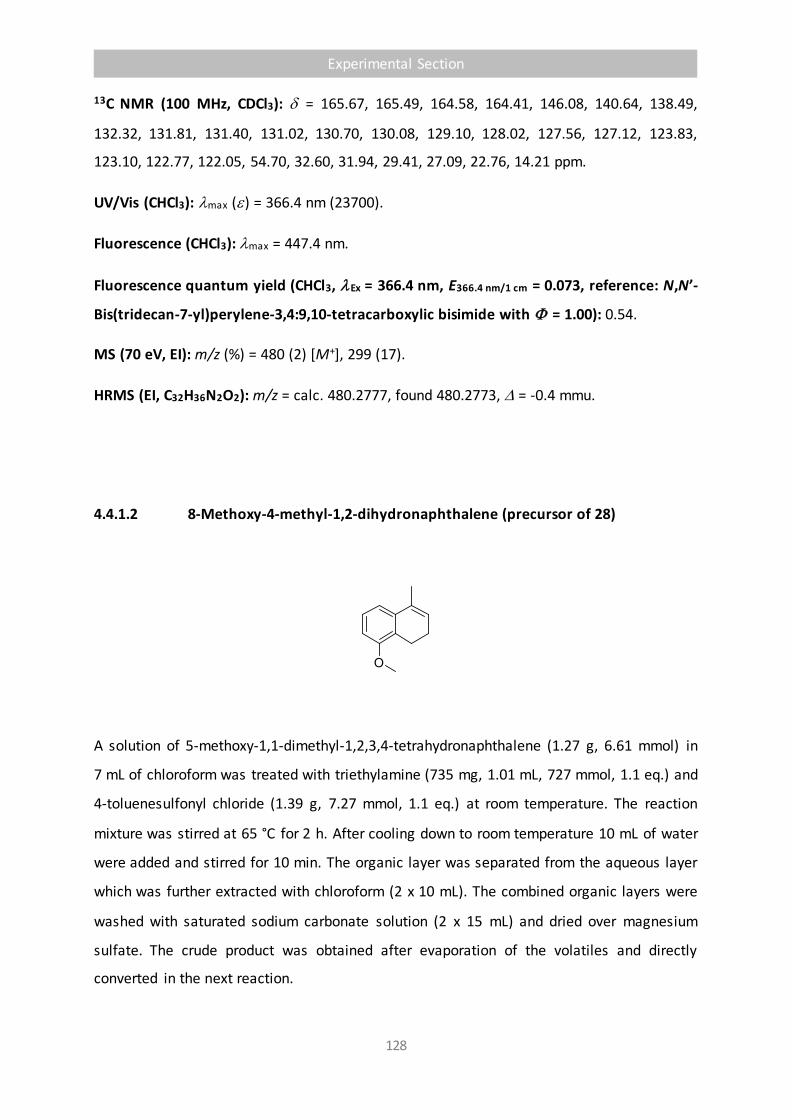
Experimental Section
128
13C NMR (100 MHz, CDCl3): = 165.67, 165.49, 164.58, 164.41, 146.08, 140.64, 138.49,
132.32, 131.81, 131.40, 131.02, 130.70, 130.08, 129.10, 128.02, 127.56, 127.12, 123.83,
123.10, 122.77, 122.05, 54.70, 32.60, 31.94, 29.41, 27.09, 22.76, 14.21 ppm.
UV/Vis (CHCl3): lmax () = 366.4 nm (23700).
Fluorescence (CHCl3): lmax = 447.4 nm.
Fluorescence quantum yield (CHCl3, lEx = 366.4 nm, E366.4 nm/1 cm = 0.073, reference: N,N’-
Bis(tridecan-7-yl)perylene-3,4:9,10-tetracarboxylic bisimide with = 1.00): 0.54.
MS (70 eV, EI): m/z (%) = 480 (2) [M+], 299 (17).
HRMS (EI, C32H36N2O2): m/z = calc. 480.2777, found 480.2773, = -0.4 mmu.
4.4.1.2 8-Methoxy-4-methyl-1,2-dihydronaphthalene (precursor of 28)
A solution of 5-methoxy-1,1-dimethyl-1,2,3,4-tetrahydronaphthalene (1.27 g, 6.61 mmol) in
7 mL of chloroform was treated with triethylamine (735 mg, 1.01 mL, 727 mmol, 1.1 eq.) and
4-toluenesulfonyl chloride (1.39 g, 7.27 mmol, 1.1 eq.) at room temperature. The reaction
mixture was stirred at 65 °C for 2 h. After cooling down to room temperature 10 mL of water
were added and stirred for 10 min. The organic layer was separated from the aqueous layer
which was further extracted with chloroform (2 x 10 mL). The combined organic layers were
washed with saturated sodium carbonate solution (2 x 15 mL) and dried over magnesium
sulfate. The crude product was obtained after evaporation of the volatiles and directly
converted in the next reaction.

Experimental Section
129
4.4.1.3 1-Methoxy-5-methylnaphthalene (precursor of 28)
Crude 8-methoxy-4-methyl-1,2-dihydronaphthalene (6.61 mmol) was dissolved in 7 mL of
toluene and 2,3,5,6-tetrachlorocyclohexa-2,5-diene-1,4-dione (24.4 g, 9.92 mmol, 1.5 eq.) was
added at room temperature. Subsequently, the reaction mixture was stirred at 130 °C for 2 h,
cooled to room temperature and treated with 20 mL of water. The organic layer was separated
and the aqueous layer was extracted with chloroform (2 x 30 mL). The combined organic layers
were washed with water (2 x 50 mL), dried over magnesium sulfate and evaporated. The
residual oil was purified via column chromatography (silica, iso-hexane/ethyl acetate 10:1) to
obtain a colorless oil in the first fraction which crystallizes within several hours.
Yield: 393 mg (2.28 mmol, 35% after 2 steps).
Rf-value (iso-hexane/EtOAc 10:1): 0.30.
1H NMR (400 MHz, CD2Cl2): = 8.12 (dd, 3J = 7.2 Hz, 4J = 2.6 Hz, 1 H), 7.58 (d, 3J = 8.5 Hz, 1 H),
7.44 (dd, 3J = 8.5 Hz, 3J = 7.7 Hz, 1 H), 7.38-7.32 (m, 2 H), 6.87 (d, 3J = 7.6 Hz, 1 H), 4.00 (s, 3 H,
OCH3), 2.67 ppm (s, 3 H, CH3).
13C NMR (100 MHz, CDCl3): = 155.9, 134.0, 133.6, 127.1, 125.6, 125.6, 124.7, 120.0, 116.3,
103.7, 55.5, 19.5 ppm.
MS (70 eV, EI): m/z (%) = 172 (100) [M+], 157 (32) [M+ – CH3], 129 (34).
HRMS (EI, C12H12O): m/z = calc. 172.0888, found 172.0877, = -1.1 mmu.

Experimental Section
130
4.4.2.1 Aceanthrylene-1,2-dione (38)
Anthracene (37) (10 g, 56.1 mmol) is dissolved in 75 mL of carbon disulfide and cooled to 0 °C.
Under argon atmosphere oxalyl chloride (25.0 mL, 37.0 g, 291 mmol, 5.2 eq.) is added.
Subsequently, aluminum chloride (7.48 g, 56.1 mmol, 1 eq.) is added and a dark, viscous mass
forms. The reaction mixture is stirred at 0 °C for 2 h and then diluted with further 75 mL of
carbon disulfide. Again aluminum chloride (7.48 g, 56.1 mmol, 1 eq.) is added and stirred at
room temperature for further 24 h. After addition of 200 mL of 2 M hydrochloric acid the
carbon disulfide is removed at 60 °C at atmosphere pressure. The residual suspension is
filtrated, washed with water and treated with a 3% potassium carbonate solution (2 x stirred
at 70 °C for 30 minutes each). After filtration a yellow to orange solid is obtained.
Yield: 8.95 g (38.5 mmol, 69%).
m. p.: 223 °C.
IR (ATR): 𝜈 = 1729, 1697 (s), 1573, 1085, 751 (s), 740 cm-1.
1H NMR (400 MHz, DMSO): = 9.81 (s, 1 H), 8.96 (d, 3J = 8.0 Hz, 1 H), 8.51 (d, 3J = 7.8 Hz, 1 H),
8.38 (d, 3J = 8.1 Hz, 1 H), 8.05 (d, 3J = 7.8 Hz, 1 H), 7.90 (t, 3J = 8.0 Hz, 1 H), 7.84 (t, 3J = 8.0 Hz,
1 H), 7.75 ppm (d, 3J = 7.8 Hz, 1 H).
13C NMR (100 MHz, CDCl3): = 188.38, 187.52, 145.60, 124.03, 132.34, 130.52, 129.97,
128.12, 127.90, 127.58, 127.28, 126.46, 123.47, 122.91, 121.39 ppm.
MS (70 eV, EI): m/z (%) = 232 (49) [M+], 204 (93) [M+ – CO], 176 (100) [M+ – C2O2].

Experimental Section
131
4.4.2.2 1H,3H-Dibenzo[de,h]isochromene-1,3-dione (39)
Aceanthrylene-1,2-dione (38) (8.13 g, 35.0 mmol) is dissolved in 175 mL of dioxane and treated
with 50 mL of a 2 M sodium hydroxide solution. Subsequently, hydrogen peroxide 30%
(40.8 mL, 45.3 g, 400 mmol) is added dropwisen to the stirred reaction mixture over a period
of 15 min. The reaction is quenched with 175 mL of water and treated with 350 mL of 2 M
sulfuric acid and stirred overnight. The suspension is filtrated and the residue is washed with
2 M sulfuric acid. The solid is dissolved in 1 L of 3 M potassium hydroxide and the solution is
filtrated. The filtrate is acidified with concentrated hydrochloric acid until no further
precipitation occurs. The precipitate is collected by filtration to obtain an orange solid.
Yield: 7.17 g (28.9 mmol, 83%).
m. p.: 281 °C.
1H NMR (400 MHz, DMSO): = 9.71 (d, 3J = 11.8 Hz, 1 H), 8.97 (s, 1 H), 8.76 (d, 3J = 11.8 Hz,
1 H), 8.47 (d, 3J = 8.2 Hz, 1 H), 8.18 (d, 3J = 8.2 Hz, 1 H), 7.92 (m, 1 H), 7.78 (m, 1 H), 7.72 ppm
(m, 1 H).
13C NMR (100 MHz, CDCl3): = 161.32, 160.75, 138.91, 137.22, 135.69, 133.34, 132.71,
132.33, 131.10, 130.94, 129.06, 127.34, 126.56, 125.53, 119.29, 111.85 ppm.
MS (70 eV, EI): m/z (%) = 248 (100) [M+], 204 (72) [M+ – CO2], 176 (70) [M+ – C2O3].
HRMS (EI, C16H8O3): m/z = calc. 248.0473, found 248.0513, = +4.0 mmu.

Experimental Section
132
4.4.2.3 2-(Tridecan-7-yl)-1H-dibenzo[de,h]isoquinoline-1,3(2H)-dione (40)
1H,3H-Dibenzo[de,h]isochromene-1,3-dione (39) (2.48 g, 10.0 mmol), zinc acetate (367 mg,
2.00 mmol, 20 mol%) and imidazole (20.0 g) are placed under argon and UV-exclusion.
7-Aminotridecane (3.99 g, 20.0 mmol, 2 eq.) is added the the reaction mixture is stirred at
140 °C for 4 h. The reaction is quenched with 300 mL of half concentrated hydrochloric acid
and extracted with chloroform (3 x 200 mL). The solvent is removed and the residue is purified
via column chromatography (silica, chloroform) under light exclusion to obtain a yellow solid.
Yield: 3.72 mg (8.66 mmol, 87%).
Rf-value (CHCl3): 0.90.
m. p.: 247 °C.
1H NMR (400 MHz, CDCl3): = 9.99 (d, 3J = 9.3 Hz, 1 H), 8.85 (s, 1 H), 8.75 (m, 1 H), 8.38-8.35
(m, 1 H), 8.14 (dd, 3J = 8.4 Hz, 4J = 1.3 Hz, 1 H), 7.88-7.77 (m, 1 H), 7.75 (dd, 3J = 8.3 Hz,
4J = 7.0 Hz, 1 H), 7.67-7.62 (m, 1 H), 5.29 (m, 1 H, CHN), 2.33-2.26 (m, 2 H, -CH2), 1.93-1.87
(m, 2 H, -CH2), 1.39-1.19 (m, 16 H, CH2), 0.81 ppm (t, 3J = 7.1 Hz, 6 H, CH3).
13C NMR (100 MHz, CDCl3): = 134.60, 132.61, 131.03, 129.71, 128.82, 128.56, 127.01,
126.37, 125.51, 77.19, 76.98, 76.77, 32.56, 29.25, 26.99, 22.56, 14.01 ppm.
UV/Vis (CHCl3): lmax () = 435.2 nm (1200).
Fluorescence (CHCl3): lmax (Irel) = 482.5 (1.00), 512.8 nm (0.90).
MS (70 eV, EI): m/z (%) = 429 (15) [M+], 344 (3) [M+ – C6H13], 247 () [M+ – C13H26].
HRMS (EI, C29H35NO2): m/z = calc. 429.2668, found 429.2661, = -0.7 mmu.
Elemental analysis C29H35NO2 (429.6 g mol-1): calc. C: 81.08, H: 8.21, N: 3.26;
found C: 80.93, H: 7.90, N: 3.37.

Experimental Section
133
4.4.2.4 7-(Hexylamino)-2-(tridecan-7-yl)-1H-dibenzo[de,h]isoquinoline-1,3(2H)-
dione (41)
2-(Tridecan-7-yl)-1H-dibenzo[de,h]isoquinoline-1,3(2H)-dione (40) (43 mg, 0.10 mmol) was
dissolved in 1-Aminohexane (1.5 mL, 11 mmol). The reaction took place under light exclusion
at room temperature and without solvent or stirring. After 24 h the reaction was stopped by
removing the excessive amine in medium vacuum. The crude product was purified via column
chromatography (silica, chloroform) to obtain a red solid.
Yield: 26 mg (0.049 mmol, 49%).
Rf-value (CHCl3): 0.45.
1H NMR (400 MHz, CDCl3): = 10.10-9.90 (m, 1 H), 8.85-8.45 (m, 2 H), 8.25-8.07 (m, 1 H), 7.88-
7.48 (m, 3 H), 5.33-5.26 (m, 1 H, CHN), 2.40-2.15 (m, 2 H, -CH2), 2.00-1.76 (m, 2 H, -CH2),
1.83-1.70 (m, 2 H, CH2, NCH2), 1.45-1.14 (m, 24 H), 0.88-0.84 (m, 3 H, CH3) 0.80 ppm (t,
3J = 7.7 Hz, 6 H, CH3).
UV/Vis (CHCl3): lmax (Erel) = 360.6 (0.26), 380.4 (0.39), 445.0 (0.61), 469.0 (0.81), 515.4 nm
(1.00).
Fluorescence (CHCl3): lmax = 614.0 nm.
Fluorescence quantum yield (CHCl3, lEx = 515.4 nm, E515.4 nm/1 cm = 0.347, reference: N,N’-
Bis(tridecan-7-yl)perylene-3,4:9,10-tetracarboxylic bisimide with = 1.00): 0.11.
MS (70 eV, EI): m/z (%) = 528 (93) [M+], 346 (100) [M+ – C13H26], 275 (20).
HRMS (EI, C35H34N2O2): m/z = calc. 528.3716, found 528.3727, = +1.1 mmu.
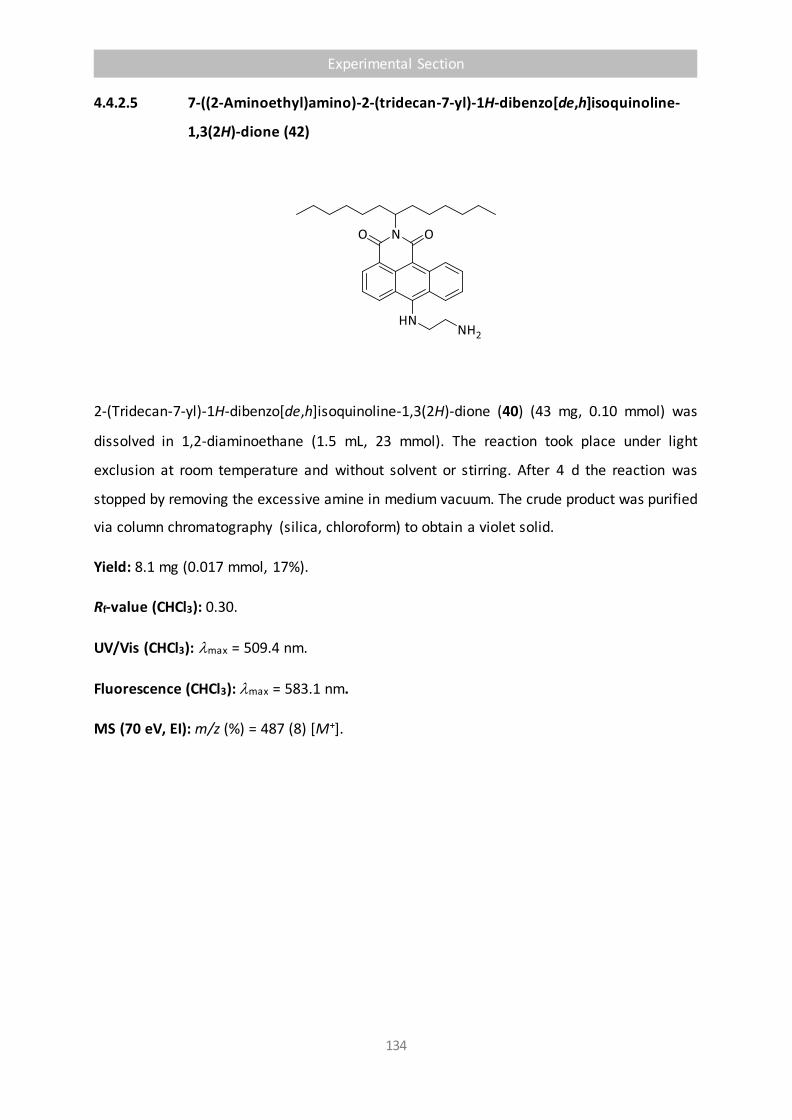
Experimental Section
134
4.4.2.5 7-((2-Aminoethyl)amino)-2-(tridecan-7-yl)-1H-dibenzo[de,h]isoquinoline-
1,3(2H)-dione (42)
2-(Tridecan-7-yl)-1H-dibenzo[de,h]isoquinoline-1,3(2H)-dione (40) (43 mg, 0.10 mmol) was
dissolved in 1,2-diaminoethane (1.5 mL, 23 mmol). The reaction took place under light
exclusion at room temperature and without solvent or stirring. After 4 d the reaction was
stopped by removing the excessive amine in medium vacuum. The crude product was purified
via column chromatography (silica, chloroform) to obtain a violet solid.
Yield: 8.1 mg (0.017 mmol, 17%).
Rf-value (CHCl3): 0.30.
UV/Vis (CHCl3): lmax = 509.4 nm.
Fluorescence (CHCl3): lmax = 583.1 nm.
MS (70 eV, EI): m/z (%) = 487 (8) [M+].

Experimental Section
135
4.4.2.6 7-(Phenylamino)-2-(tridecan-7-yl)-1H-dibenzo[de,h]isoquinoline-1,3(2H)-
dione (43)
2-(Tridecan-7-yl)-1H-dibenzo[de,h]isoquinoline-1,3(2H)-dione (40) (43 mg, 0.10 mmol) was
dissolved in aniline (1.5 mL, 16 mmol). The reaction took place under light exclusion at room
temperature and without solvent or stirring. After 6 d the reaction was stopped by removing
the excessive amine in medium vacuum. The crude product was purified via column
chromatography (silica, chloroform) to obtain a red solid.
Yield: 4 mg (0.008 mmol, 8%).
Rf-value (CHCl3): 0.50.
UV/Vis (CHCl3): lmax = 343.2 nm.
MS (70 eV, EI): m/z (%) = 520 (55) [M+], 328 (100) [M+ – C13H26].

Experimental Section
136
4.4.2.7 7-(Methyl(2-(methylamino)ethyl)amino)-2-(tridecan-7-yl)-1H-
dibenzo[de,h]isoquinoline-1,3(2H)-dione (44)
2-(Tridecan-7-yl)-1H-dibenzo[de,h]isoquinoline-1,3(2H)-dione (40) (43 mg, 0.10 mmol) was
dissolved in N,N’-dimethyl-1,2-diaminoethane (1.5 mL, 14 mmol). The reaction took place
under light exclusion at room temperature and without solvent or stirring. After 4 d the
reaction was stopped by removing the excessive amine in medium vacuum. The crude product
was purified via column chromatography (silica, chloroform) to obtain a red solid.
Yield: 3 mg (0.006 mmol, 6%).
Rf-value (CHCl3): 0.40.
UV/Vis (CHCl3): lmax (Erel) = 364.0 (0.31), 383.4 (0.64), 445.0 (0.61), 470.0 nm (1.00).
Fluorescence (CHCl3): lmax(Irel) = 488.0 (0.60), 518.4 nm (1.00).
Fluorescence quantum yield (CHCl3, lEx = 470.0 nm, E470.0 nm/1 cm = 0.223, reference: N,N’-
Bis(tridecan-7-yl)perylene-3,4:9,10-tetracarboxylic bisimide with = 1.00): 0.02.
MS (70 eV, EI): m/z (%) = 515 (100) [M+], 332 (95) [M+ – C13H27], 236 (83).
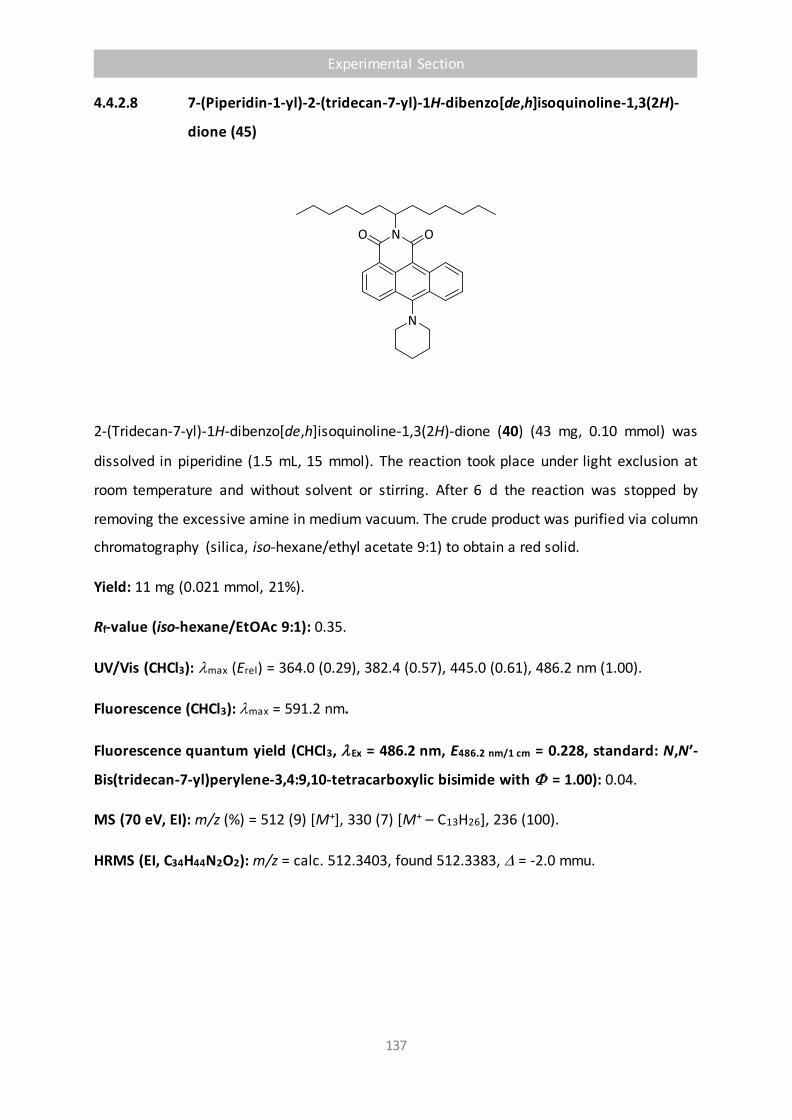
Experimental Section
137
4.4.2.8 7-(Piperidin-1-yl)-2-(tridecan-7-yl)-1H-dibenzo[de,h]isoquinoline-1,3(2H)-
dione (45)
2-(Tridecan-7-yl)-1H-dibenzo[de,h]isoquinoline-1,3(2H)-dione (40) (43 mg, 0.10 mmol) was
dissolved in piperidine (1.5 mL, 15 mmol). The reaction took place under light exclusion at
room temperature and without solvent or stirring. After 6 d the reaction was stopped by
removing the excessive amine in medium vacuum. The crude product was purified via column
chromatography (silica, iso-hexane/ethyl acetate 9:1) to obtain a red solid.
Yield: 11 mg (0.021 mmol, 21%).
Rf-value (iso-hexane/EtOAc 9:1): 0.35.
UV/Vis (CHCl3): lmax (Erel) = 364.0 (0.29), 382.4 (0.57), 445.0 (0.61), 486.2 nm (1.00).
Fluorescence (CHCl3): lmax = 591.2 nm.
Fluorescence quantum yield (CHCl3, lEx = 486.2 nm, E486.2 nm/1 cm = 0.228, standard: N,N’-
Bis(tridecan-7-yl)perylene-3,4:9,10-tetracarboxylic bisimide with = 1.00): 0.04.
MS (70 eV, EI): m/z (%) = 512 (9) [M+], 330 (7) [M+ – C13H26], 236 (100).
HRMS (EI, C34H44N2O2): m/z = calc. 512.3403, found 512.3383, = -2.0 mmu.
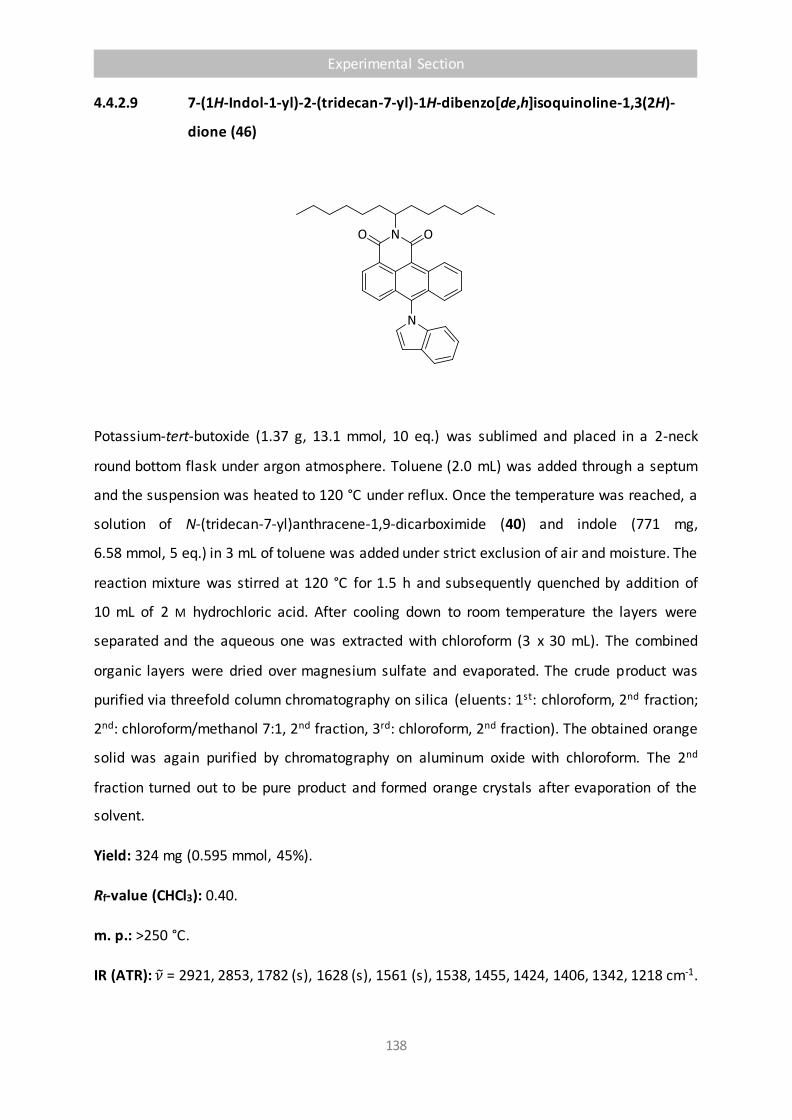
Experimental Section
138
4.4.2.9 7-(1H-Indol-1-yl)-2-(tridecan-7-yl)-1H-dibenzo[de,h]isoquinoline-1,3(2H)-
dione (46)
Potassium-tert-butoxide (1.37 g, 13.1 mmol, 10 eq.) was sublimed and placed in a 2-neck
round bottom flask under argon atmosphere. Toluene (2.0 mL) was added through a septum
and the suspension was heated to 120 °C under reflux. Once the temperature was reached, a
solution of N-(tridecan-7-yl)anthracene-1,9-dicarboximide (40) and indole (771 mg,
6.58 mmol, 5 eq.) in 3 mL of toluene was added under strict exclusion of air and moisture. The
reaction mixture was stirred at 120 °C for 1.5 h and subsequently quenched by addition of
10 mL of 2 M hydrochloric acid. After cooling down to room temperature the layers were
separated and the aqueous one was extracted with chloroform (3 x 30 mL). The combined
organic layers were dried over magnesium sulfate and evaporated. The crude product was
purified via threefold column chromatography on silica (eluents: 1st: chloroform, 2nd fraction;
2nd: chloroform/methanol 7:1, 2nd fraction, 3rd: chloroform, 2nd fraction). The obtained orange
solid was again purified by chromatography on aluminum oxide with chloroform. The 2nd
fraction turned out to be pure product and formed orange crystals after evaporation of the
solvent.
Yield: 324 mg (0.595 mmol, 45%).
Rf-value (CHCl3): 0.40.
m. p.: >250 °C.
IR (ATR): 𝜈 = 2921, 2853, 1782 (s), 1628 (s), 1561 (s), 1538, 1455, 1424, 1406, 1342, 1218 cm-1.
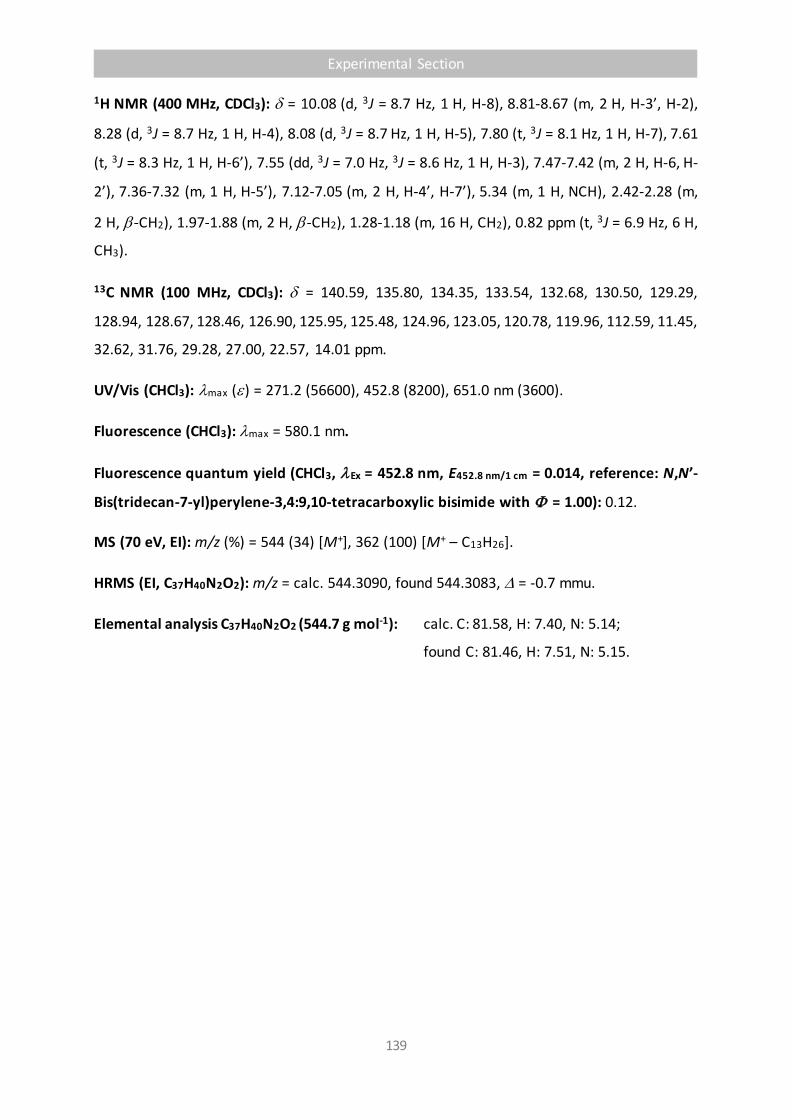
Experimental Section
139
1H NMR (400 MHz, CDCl3): = 10.08 (d, 3J = 8.7 Hz, 1 H, H-8), 8.81-8.67 (m, 2 H, H-3’, H-2),
8.28 (d, 3J = 8.7 Hz, 1 H, H-4), 8.08 (d, 3J = 8.7 Hz, 1 H, H-5), 7.80 (t, 3J = 8.1 Hz, 1 H, H-7), 7.61
(t, 3J = 8.3 Hz, 1 H, H-6’), 7.55 (dd, 3J = 7.0 Hz, 3J = 8.6 Hz, 1 H, H-3), 7.47-7.42 (m, 2 H, H-6, H-
2’), 7.36-7.32 (m, 1 H, H-5’), 7.12-7.05 (m, 2 H, H-4’, H-7’), 5.34 (m, 1 H, NCH), 2.42-2.28 (m,
2 H, -CH2), 1.97-1.88 (m, 2 H, -CH2), 1.28-1.18 (m, 16 H, CH2), 0.82 ppm (t, 3J = 6.9 Hz, 6 H,
CH3).
13C NMR (100 MHz, CDCl3): = 140.59, 135.80, 134.35, 133.54, 132.68, 130.50, 129.29,
128.94, 128.67, 128.46, 126.90, 125.95, 125.48, 124.96, 123.05, 120.78, 119.96, 112.59, 11.45,
32.62, 31.76, 29.28, 27.00, 22.57, 14.01 ppm.
UV/Vis (CHCl3): lmax () = 271.2 (56600), 452.8 (8200), 651.0 nm (3600).
Fluorescence (CHCl3): lmax = 580.1 nm.
Fluorescence quantum yield (CHCl3, lEx = 452.8 nm, E452.8 nm/1 cm = 0.014, reference: N,N’-
Bis(tridecan-7-yl)perylene-3,4:9,10-tetracarboxylic bisimide with = 1.00): 0.12.
MS (70 eV, EI): m/z (%) = 544 (34) [M+], 362 (100) [M+ – C13H26].
HRMS (EI, C37H40N2O2): m/z = calc. 544.3090, found 544.3083, = -0.7 mmu.
Elemental analysis C37H40N2O2 (544.7 g mol-1): calc. C: 81.58, H: 7.40, N: 5.14;
found C: 81.46, H: 7.51, N: 5.15.
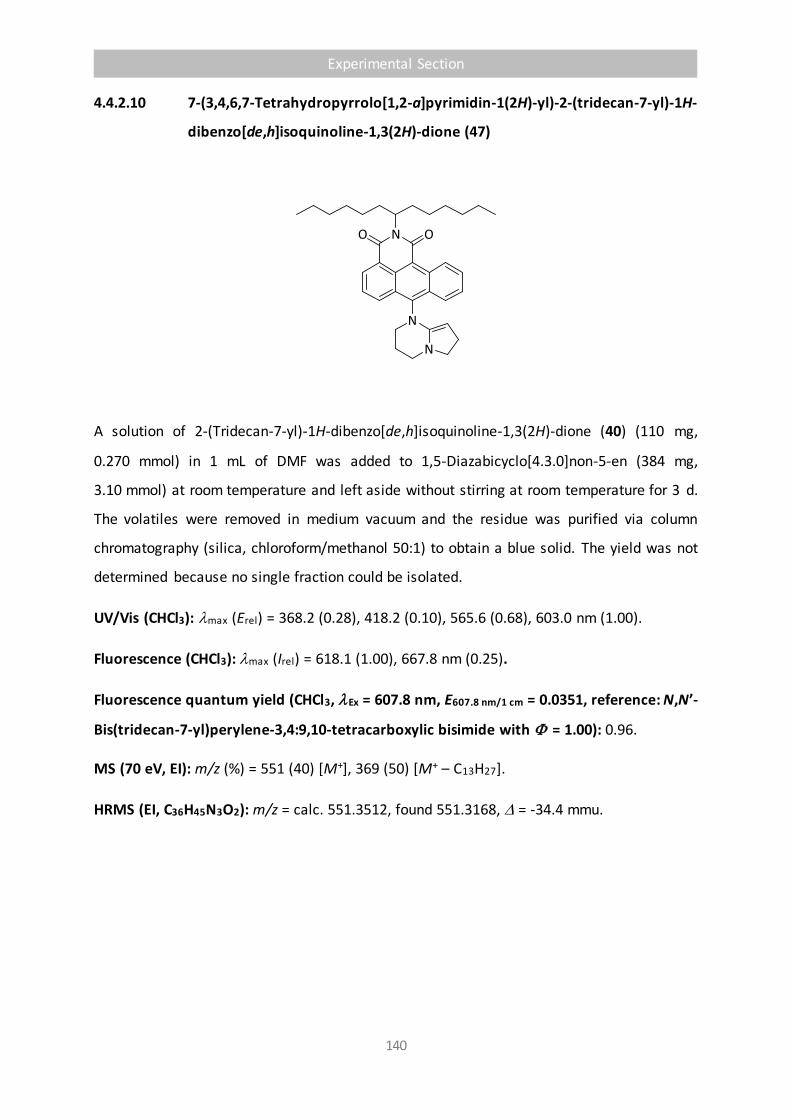
Experimental Section
140
4.4.2.10 7-(3,4,6,7-Tetrahydropyrrolo[1,2-a]pyrimidin-1(2H)-yl)-2-(tridecan-7-yl)-1H-
dibenzo[de,h]isoquinoline-1,3(2H)-dione (47)
A solution of 2-(Tridecan-7-yl)-1H-dibenzo[de,h]isoquinoline-1,3(2H)-dione (40) (110 mg,
0.270 mmol) in 1 mL of DMF was added to 1,5-Diazabicyclo[4.3.0]non-5-en (384 mg,
3.10 mmol) at room temperature and left aside without stirring at room temperature for 3 d.
The volatiles were removed in medium vacuum and the residue was purified via column
chromatography (silica, chloroform/methanol 50:1) to obtain a blue solid. The yield was not
determined because no single fraction could be isolated.
UV/Vis (CHCl3): lmax (Erel) = 368.2 (0.28), 418.2 (0.10), 565.6 (0.68), 603.0 nm (1.00).
Fluorescence (CHCl3): lmax (Irel) = 618.1 (1.00), 667.8 nm (0.25).
Fluorescence quantum yield (CHCl3, lEx = 607.8 nm, E607.8 nm/1 cm = 0.0351, reference: N,N’-
Bis(tridecan-7-yl)perylene-3,4:9,10-tetracarboxylic bisimide with = 1.00): 0.96.
MS (70 eV, EI): m/z (%) = 551 (40) [M+], 369 (50) [M+ – C13H27].
HRMS (EI, C36H45N3O2): m/z = calc. 551.3512, found 551.3168, = -34.4 mmu.
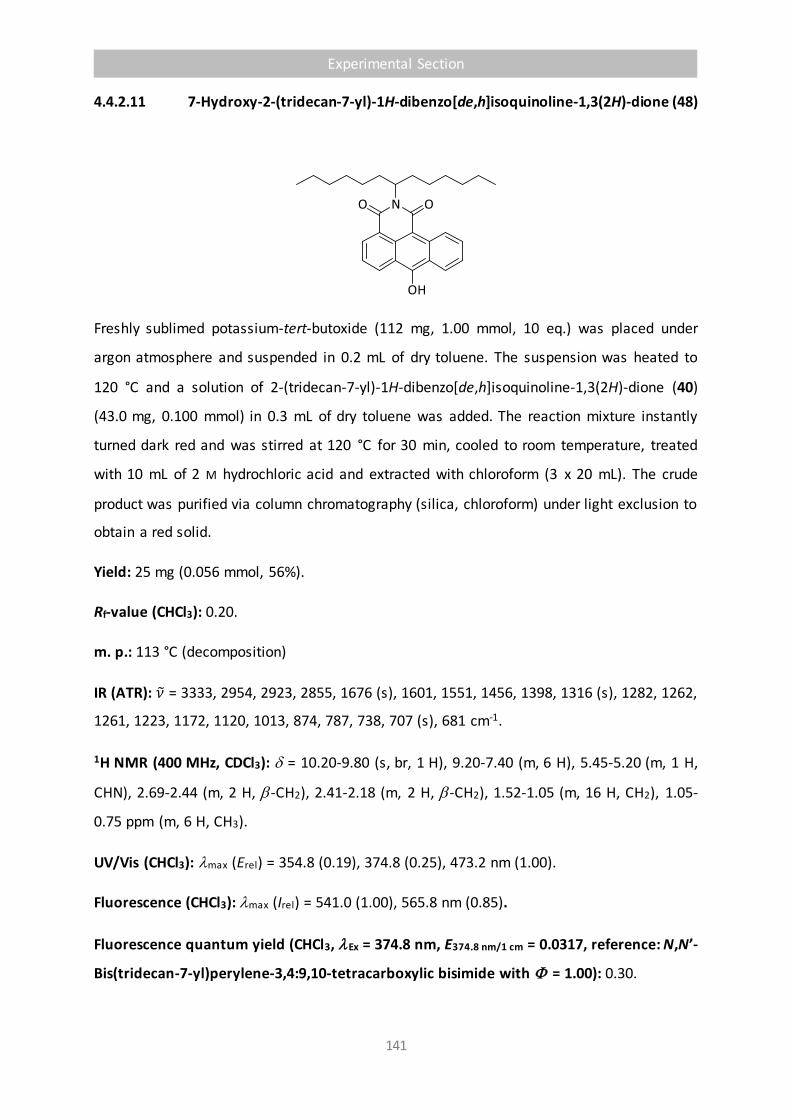
Experimental Section
141
4.4.2.11 7-Hydroxy-2-(tridecan-7-yl)-1H-dibenzo[de,h]isoquinoline-1,3(2H)-dione (48)
Freshly sublimed potassium-tert-butoxide (112 mg, 1.00 mmol, 10 eq.) was placed under
argon atmosphere and suspended in 0.2 mL of dry toluene. The suspension was heated to
120 °C and a solution of 2-(tridecan-7-yl)-1H-dibenzo[de,h]isoquinoline-1,3(2H)-dione (40)
(43.0 mg, 0.100 mmol) in 0.3 mL of dry toluene was added. The reaction mixture instantly
turned dark red and was stirred at 120 °C for 30 min, cooled to room temperature, treated
with 10 mL of 2 M hydrochloric acid and extracted with chloroform (3 x 20 mL). The crude
product was purified via column chromatography (silica, chloroform) under light exclusion to
obtain a red solid.
Yield: 25 mg (0.056 mmol, 56%).
Rf-value (CHCl3): 0.20.
m. p.: 113 °C (decomposition)
IR (ATR): 𝜈 = 3333, 2954, 2923, 2855, 1676 (s), 1601, 1551, 1456, 1398, 1316 (s), 1282, 1262,
1261, 1223, 1172, 1120, 1013, 874, 787, 738, 707 (s), 681 cm-1.
1H NMR (400 MHz, CDCl3): = 10.20-9.80 (s, br, 1 H), 9.20-7.40 (m, 6 H), 5.45-5.20 (m, 1 H,
CHN), 2.69-2.44 (m, 2 H, -CH2), 2.41-2.18 (m, 2 H, -CH2), 1.52-1.05 (m, 16 H, CH2), 1.05-
0.75 ppm (m, 6 H, CH3).
UV/Vis (CHCl3): lmax (Erel) = 354.8 (0.19), 374.8 (0.25), 473.2 nm (1.00).
Fluorescence (CHCl3): lmax (Irel) = 541.0 (1.00), 565.8 nm (0.85).
Fluorescence quantum yield (CHCl3, lEx = 374.8 nm, E374.8 nm/1 cm = 0.0317, reference: N,N’-
Bis(tridecan-7-yl)perylene-3,4:9,10-tetracarboxylic bisimide with = 1.00): 0.30.

Experimental Section
142
MS (70 eV, EI): m/z (%) = 545 (17) [M+], 263 (100) [M+ – C13H26].
HRMS (EI, C29H35NO3): m/z = calc. 445.2617, found 445.2591, = -2.6 mmu.
4.4.2.12 2,9-Di(tridecan-7-yl)tetrapheno[8,9-ab]benzo[5,6,7-def:10,11,12-
d'e'f']diisoquinoline-1,3,8,10(2H,9H)-tetraone (49a)
Freshly sublimed potassium-tert-butoxide (90.0 mg, 0.800 mmol, 8 eq.) was placed in a 2-neck
flask under argon atmosphere and suspended in 0.5 mL of dry toluene. A solution of 2-
(tridecan-7-yl)-1H-dibenzo[de,h]isoquinoline-1,3(2H)-dione (40) (43.0 mg, 0.100 mmol) in
0.5 mL of dry toluene was added. The reaction mixture was heated to 120 °C and stirred for
30 min, treated with 20 mL of 2 M hydrochloric acid when hot, cooled to room temperature
and extracted with chloroform (3 x 30 mL). The crude product was purified via column
chromatography (silica, chloroform) to obtain a green solid.
Yield: 18 mg (0.21 mmol, 42%).
Rf-value (CHCl3): 0.80.
m. p.: >250 °C.
1H NMR (600 MHz, CDCl3): = 10.01 (d, 3J = 9.0 Hz, 2 H), 8.98-8.80 (m, 4 H), 8.69-8.55 (m, 4 H)
8.11 ppm (t, 3J = 6.9 Hz, 2 H).
UV/Vis (CHCl3): lmax (Erel) = 419.4 (0.15), 638.4 (0.56), 694.6 nm (1.00).

Experimental Section
143
Fluorescence (CHCl3): lmax = 730.0 nm.
MS (FAB): m/z (%) = 856 (45) [M+H+], 855 (37) [M+], 674 (74) [M+ – C13H26]
HRMS (FAB, C58H66N2O4): m/z = calc. 854.5023, found 854.5005, = -1.8 mmu.
4.4.2.13 2,9-di(Tridecan-7-yl)tetrapheno[5,6,7-def]isoquinoline[10,11,12-d'e'f']([7,8-
a,b]benzoisoquinoline-1,3,8,10(2H,9H)-tetraone (49b)
Freshly sublimed potassium-tert-butoxide (1.12 g, 10.0 mmol, 10 eq.) was placed in a 2-neck
flask under argon atmosphere and suspended in 2.0 mL of dry bis(2-ethoxyethyl) ether. The
suspension was heated to 130 °C and a solution of 2-(tridecan-7-yl)-1H-
dibenzo[de,h]isoquinoline-1,3(2H)-dione (40) (430 mg, 1.00 mmol) in 3.0 mL of dry bis(2-
ethoxyethyl) ether was added. The reaction mixture was stirred at 130 °C for 30 min, treated
with 200 mL of 2 M hydrochloric acid when hot, cooled to room temperature and extracted
with chloroform (3 x 100 mL). The crude product was purified via twofold column
chromatography (silica, 1st: chloroform, 2nd: toluene) to obtain a green solid.
Yield: 66.0 mg (0.771 mmol, 15%).
Rf-value (CHCl3): 0.80.
m. p.: >250 °C.
1H NMR (200 MHz, CDCl3): = 9.82-9.77 (m, 2 H,), 8.92-8.72 (m, 4 H), 7.81-7.33, (m, 6 H), 5.36-
5.24 (m, 2 H, CHN), 2.39-2.33 (m, 4 H, -CH2), 1.96-1.93 (m, 4 H, -CH2), 1.36-1.24 (m, 32 H,
CH2), 0.83 ppm (t, 12 H, 3J = 7.2 Hz, CH3).
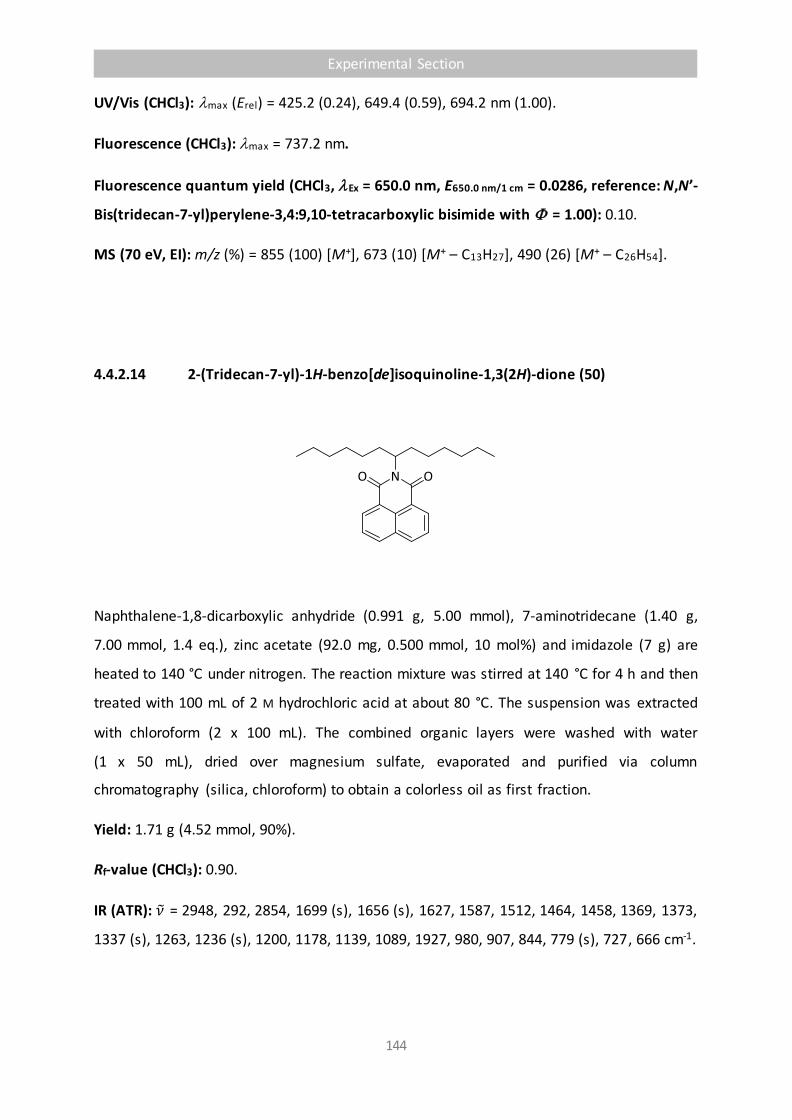
Experimental Section
144
UV/Vis (CHCl3): lmax (Erel) = 425.2 (0.24), 649.4 (0.59), 694.2 nm (1.00).
Fluorescence (CHCl3): lmax = 737.2 nm.
Fluorescence quantum yield (CHCl3, lEx = 650.0 nm, E650.0 nm/1 cm = 0.0286, reference: N,N’-
Bis(tridecan-7-yl)perylene-3,4:9,10-tetracarboxylic bisimide with = 1.00): 0.10.
MS (70 eV, EI): m/z (%) = 855 (100) [M+], 673 (10) [M+ – C13H27], 490 (26) [M+ – C26H54].
4.4.2.14 2-(Tridecan-7-yl)-1H-benzo[de]isoquinoline-1,3(2H)-dione (50)
Naphthalene-1,8-dicarboxylic anhydride (0.991 g, 5.00 mmol), 7-aminotridecane (1.40 g,
7.00 mmol, 1.4 eq.), zinc acetate (92.0 mg, 0.500 mmol, 10 mol%) and imidazole (7 g) are
heated to 140 °C under nitrogen. The reaction mixture was stirred at 140 °C for 4 h and then
treated with 100 mL of 2 M hydrochloric acid at about 80 °C. The suspension was extracted
with chloroform (2 x 100 mL). The combined organic layers were washed with water
(1 x 50 mL), dried over magnesium sulfate, evaporated and purified via column
chromatography (silica, chloroform) to obtain a colorless oil as first fraction.
Yield: 1.71 g (4.52 mmol, 90%).
Rf-value (CHCl3): 0.90.
IR (ATR): 𝜈 = 2948, 292, 2854, 1699 (s), 1656 (s), 1627, 1587, 1512, 1464, 1458, 1369, 1373,
1337 (s), 1263, 1236 (s), 1200, 1178, 1139, 1089, 1927, 980, 907, 844, 779 (s), 727, 666 cm-1.

Experimental Section
145
1H NMR (400 MHz, CDCl3): = 8.57 (d, 3J = 8.1 Hz, 2 H, H-2, H-7), 8.19 (d, 3J = 8.4 Hz, 2 H, H-4,
H-5), 7.74 (t, 3J = 7.7 Hz, 2 H, H-3, H-6), 5.70 (tt, 3J = 5.8 Hz, 3J = 9.4 Hz, 1 H, CHN), 2.27-2.19
(m, 2 H, -CH2), 1.86-1.80 (m, 2 H, -CH2), 1.35-1.16 (m, 16 H, CH2), 0.81 ppm (t, 3J = 7.1 Hz,
6 H, CH3).
MS (70 eV, EI): m/z (%) = 379 (8) [M+], 198 (100) [M+ – C13H27].
HRMS (EI, C25H33NO2): m/z = calc. 379.2511, found 379.25,6 = -0.5 mmu.
4.4.2.15 5-Amino-2-(tridecan-7-yl)-1H-benzo[de]isoquinoline-1,3(2H)-dione (51)
2-(Tridecan-7-yl)-1H-benzo[de]isoquinoline-1,3(2H)-dione (50) (1.31 g, 3.46 mmol) is
dissolved in 3.7 mL of concentrated sulfuric acid (96%) and slowly treated with a mixture of
fuming nitric acid (> 90%, 0.261 g, 4.15 mmol,) and concentrated sulfuric acid (96%, 0.407 g,
4.15 mmol). The temperature was kept below 40 °C controlled by dropwise addition. After
complete addition the reaction mixture was stirred at 45 °C for 1 h. Subsequently, the resulting
solution was poured into 50 mL of ice water and extracted with chloroform (3 x 100 mL). The
combined organic layers were washed with water (1 x 100 mL), dried over magnesium sulfate
and evaporated to obtain the nitrated species. This intermediate was dissolved in 45 mL of
concentrated acetic acid. Addition of stannous(II)chloride (6.25 g, 27.7 mmol, 8 eq.) was
followed by addition of 15 mL of concentrated hydrochloric acid. The reaction mixture was
stirred at 60 °C for 2 h and consecutively cooled down to room temperature and treated with
200 mL of water. The pH-value was adjusted to 5-6 with sodium carbonate and the aqueous
suspension was extracted with chloroform (3 x 150 mL). The combined organic layers were
dried over magnesium sulfate and evaporated. The crude product was purified via colum
chromatography (silica, chloroform) to obtain a yellow oil as the first fraction.
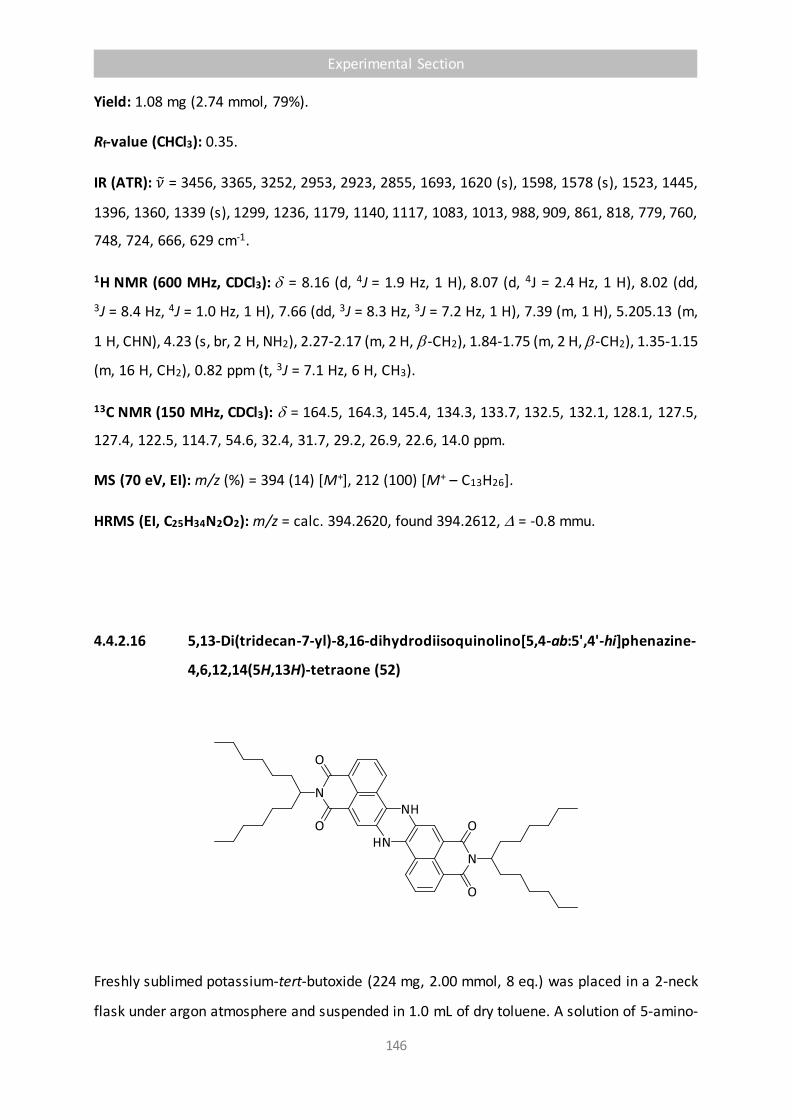
Experimental Section
146
Yield: 1.08 mg (2.74 mmol, 79%).
Rf-value (CHCl3): 0.35.
IR (ATR): 𝜈 = 3456, 3365, 3252, 2953, 2923, 2855, 1693, 1620 (s), 1598, 1578 (s), 1523, 1445,
1396, 1360, 1339 (s), 1299, 1236, 1179, 1140, 1117, 1083, 1013, 988, 909, 861, 818, 779, 760,
748, 724, 666, 629 cm-1.
1H NMR (600 MHz, CDCl3): = 8.16 (d, 4J = 1.9 Hz, 1 H), 8.07 (d, 4J = 2.4 Hz, 1 H), 8.02 (dd,
3J = 8.4 Hz, 4J = 1.0 Hz, 1 H), 7.66 (dd, 3J = 8.3 Hz, 3J = 7.2 Hz, 1 H), 7.39 (m, 1 H), 5.205.13 (m,
1 H, CHN), 4.23 (s, br, 2 H, NH2), 2.27-2.17 (m, 2 H, -CH2), 1.84-1.75 (m, 2 H, -CH2), 1.35-1.15
(m, 16 H, CH2), 0.82 ppm (t, 3J = 7.1 Hz, 6 H, CH3).
13C NMR (150 MHz, CDCl3): = 164.5, 164.3, 145.4, 134.3, 133.7, 132.5, 132.1, 128.1, 127.5,
127.4, 122.5, 114.7, 54.6, 32.4, 31.7, 29.2, 26.9, 22.6, 14.0 ppm.
MS (70 eV, EI): m/z (%) = 394 (14) [M+], 212 (100) [M+ – C13H26].
HRMS (EI, C25H34N2O2): m/z = calc. 394.2620, found 394.2612, = -0.8 mmu.
4.4.2.16 5,13-Di(tridecan-7-yl)-8,16-dihydrodiisoquinolino[5,4-ab:5',4'-hi]phenazine-
4,6,12,14(5H,13H)-tetraone (52)
Freshly sublimed potassium-tert-butoxide (224 mg, 2.00 mmol, 8 eq.) was placed in a 2-neck
flask under argon atmosphere and suspended in 1.0 mL of dry toluene. A solution of 5-amino-
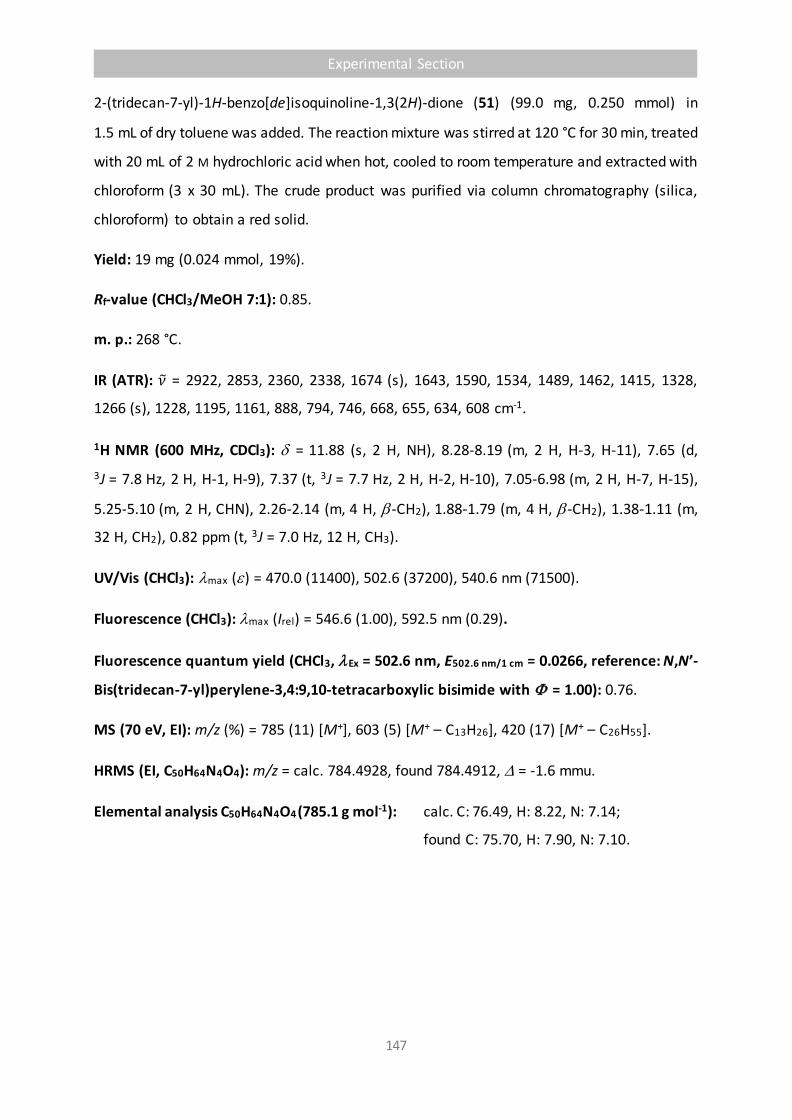
Experimental Section
147
2-(tridecan-7-yl)-1H-benzo[de]isoquinoline-1,3(2H)-dione (51) (99.0 mg, 0.250 mmol) in
1.5 mL of dry toluene was added. The reaction mixture was stirred at 120 °C for 30 min, treated
with 20 mL of 2 M hydrochloric acid when hot, cooled to room temperature and extracted with
chloroform (3 x 30 mL). The crude product was purified via column chromatography (silica,
chloroform) to obtain a red solid.
Yield: 19 mg (0.024 mmol, 19%).
Rf-value (CHCl3/MeOH 7:1): 0.85.
m. p.: 268 °C.
IR (ATR): 𝜈 = 2922, 2853, 2360, 2338, 1674 (s), 1643, 1590, 1534, 1489, 1462, 1415, 1328,
1266 (s), 1228, 1195, 1161, 888, 794, 746, 668, 655, 634, 608 cm-1.
1H NMR (600 MHz, CDCl3): = 11.88 (s, 2 H, NH), 8.28-8.19 (m, 2 H, H-3, H-11), 7.65 (d,
3J = 7.8 Hz, 2 H, H-1, H-9), 7.37 (t, 3J = 7.7 Hz, 2 H, H-2, H-10), 7.05-6.98 (m, 2 H, H-7, H-15),
5.25-5.10 (m, 2 H, CHN), 2.26-2.14 (m, 4 H, -CH2), 1.88-1.79 (m, 4 H, -CH2), 1.38-1.11 (m,
32 H, CH2), 0.82 ppm (t, 3J = 7.0 Hz, 12 H, CH3).
UV/Vis (CHCl3): lmax () = 470.0 (11400), 502.6 (37200), 540.6 nm (71500).
Fluorescence (CHCl3): lmax (Irel) = 546.6 (1.00), 592.5 nm (0.29).
Fluorescence quantum yield (CHCl3, lEx = 502.6 nm, E502.6 nm/1 cm = 0.0266, reference: N,N’-
Bis(tridecan-7-yl)perylene-3,4:9,10-tetracarboxylic bisimide with = 1.00): 0.76.
MS (70 eV, EI): m/z (%) = 785 (11) [M+], 603 (5) [M+ – C13H26], 420 (17) [M+ – C26H55].
HRMS (EI, C50H64N4O4): m/z = calc. 784.4928, found 784.4912, = -1.6 mmu.
Elemental analysis C50H64N4O4 (785.1 g mol-1): calc. C: 76.49, H: 8.22, N: 7.14;
found C: 75.70, H: 7.90, N: 7.10.

Experimental Section
148
4.5.1.1 5,5'''-Di(adamantan-1-yl)-2,2':5',2'':5'',2'''-quaterthiophene (59a)
5-(Adamantyl-1-yl)-2,2’-dithiophene (98.7 mg, 0.328 mmol) was dissolved in chloroform (1.0
mL) and treated with ferrous(III)chloride (79.9 mg, 0.493 mmol). The reaction mixture was
stirred at room temperature (25 °C) for 18 h. Chloroform was evaporated, the residue
suspended in 2 M hydrochloric acid (5 mL), stirred for 2 h, and washed with 2 M hydrochloric
acid (100 mL) and water (20 mL). The solid was dissolved in chloroform (100 mL) and filtrated,
evaporated and again suspended in a mixture of iso-hexane/ethyl acetate 9:1 (20 mL). After
filtation, the residue was purified by flash chromatography (silica gel, iso-hexane/chloroform
1:1) to obtain a yellow solid.
Yield: 28.1 mg (0.0469 mmol, 29%).
Rf-value (iso-hexane/EtOAc 9:1): 0.25.
m. p.: >250 °C.
IR (ATR): 𝜈 = 2899, 2846, 1507, 1447, 1356, 1342, 1314, 1258, 1216, 1183, 1164, 1100, 1100,
1066, 1002, 975, 880, 826, 808, 788, 684, 667 cm-1.
UV/Vis (CHCl3): lmax () = 400.6 nm (31900).
Fluorescence (CHCl3): lmax (Irel) = 466.4 (0.98), 496.4 (1.00) nm.
Fluorescence quantum yield (CHCl3, lEx = 400.6 nm, E400.6 nm/1 cm = 0.0176, reference:
Tetramethyl perylene-3,4:9,10-tetracarboxylate with = 1.00): 0.20.
MS (70 eV, EI): m/z (%) = 598 (100) [M+], 541 (8), 328 (5), 299 (5), 135 (11).
HRMS (EI, C36H38S4): m/z = calc. 598.1856, found 598.1865, = +0.9 mmu.
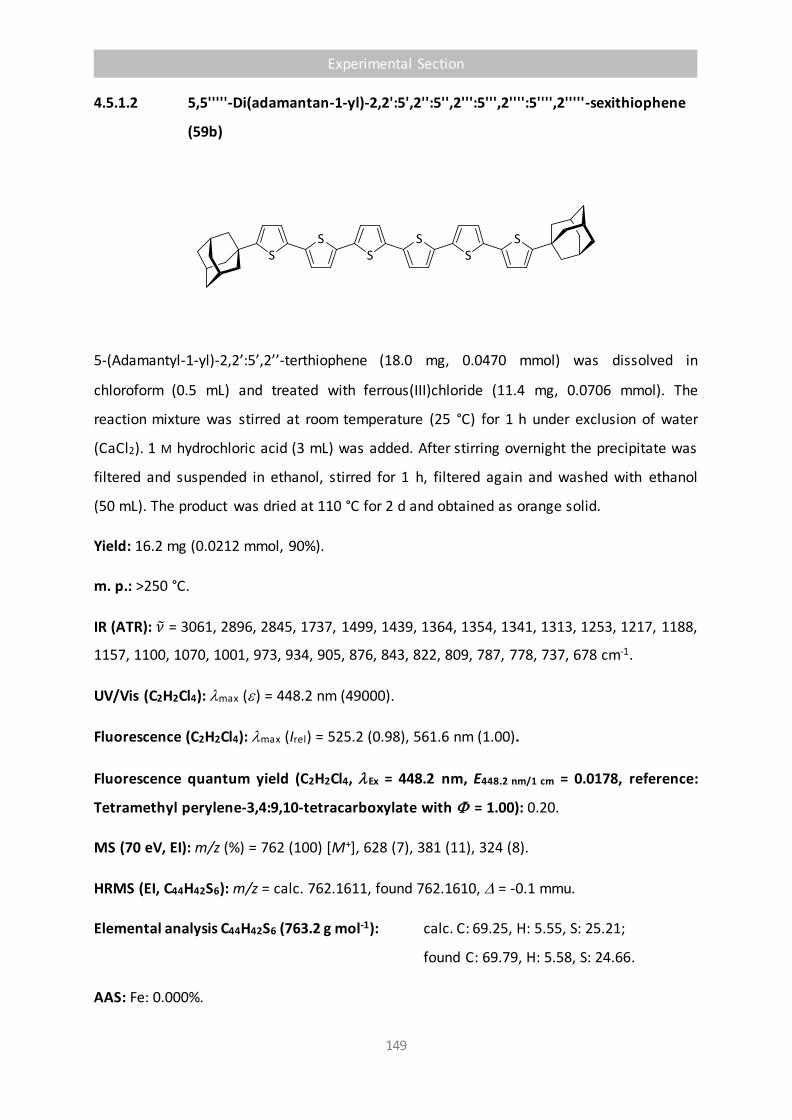
Experimental Section
149
4.5.1.2 5,5'''''-Di(adamantan-1-yl)-2,2':5',2'':5'',2''':5''',2'''':5'''',2'''''-sexithiophene
(59b)
5-(Adamantyl-1-yl)-2,2’:5’,2’’-terthiophene (18.0 mg, 0.0470 mmol) was dissolved in
chloroform (0.5 mL) and treated with ferrous(III)chloride (11.4 mg, 0.0706 mmol). The
reaction mixture was stirred at room temperature (25 °C) for 1 h under exclusion of water
(CaCl2). 1 M hydrochloric acid (3 mL) was added. After stirring overnight the precipitate was
filtered and suspended in ethanol, stirred for 1 h, filtered again and washed with ethanol
(50 mL). The product was dried at 110 °C for 2 d and obtained as orange solid.
Yield: 16.2 mg (0.0212 mmol, 90%).
m. p.: >250 °C.
IR (ATR): 𝜈 = 3061, 2896, 2845, 1737, 1499, 1439, 1364, 1354, 1341, 1313, 1253, 1217, 1188,
1157, 1100, 1070, 1001, 973, 934, 905, 876, 843, 822, 809, 787, 778, 737, 678 cm-1.
UV/Vis (C2H2Cl4): lmax () = 448.2 nm (49000).
Fluorescence (C2H2Cl4): lmax (Irel) = 525.2 (0.98), 561.6 nm (1.00).
Fluorescence quantum yield (C2H2Cl4, lEx = 448.2 nm, E448.2 nm/1 cm = 0.0178, reference:
Tetramethyl perylene-3,4:9,10-tetracarboxylate with = 1.00): 0.20.
MS (70 eV, EI): m/z (%) = 762 (100) [M+], 628 (7), 381 (11), 324 (8).
HRMS (EI, C44H42S6): m/z = calc. 762.1611, found 762.1610, = -0.1 mmu.
Elemental analysis C44H42S6 (763.2 g mol-1): calc. C: 69.25, H: 5.55, S: 25.21;
found C: 69.79, H: 5.58, S: 24.66.
AAS: Fe: 0.000%.

Experimental Section
150
4.5.1.3 5,5’’’’’’’-Di(adamantan-1-yl)-
2,2’:5’,2’’:5’’,2’’’:5’’’,2’’’’:5’’’’,2’’’’’:5’’’’’,2’’’’’’:5’’’’’’,2’’’’’’’-octithiophene (59c)
5-(Adamantyl-1-yl)-2,2’:5’,2’’:5’’,2’’’-quaterthiophene (42.4 mg, 0.0912 mmol) was dissolved
in chloroform (1.5 mL) and treated with ferrous(III)chloride (22.2 mg, 0.137 mmol). The
reaction mixture was stirred at room temperature (25 °C) for 24 h. Water (2 mL) and 2 M
hydrochloric acid (2 mL) were added. After stirring overnight the precipitate was filtered and
suspended in ethanol (5 mL), stirred for 3 h, filtered again and washed with ethanol (100 mL).
The product was dried at 110 °C for 1 d and obtained as red solid.
Yield: 41.3 mg (0.0446 mmol, 98%).
m. p.: >250 °C.
IR (ATR): 𝜈 = 3060, 2896, 2843, 2358, 2337, 1497, 1439, 1434, 1341, 1313, 1216, 1099, 1070,
1001, 973, 877, 842, 821, 786, 778, 736, 681, 667 cm-1.
UV/Vis (C2H2Cl4): lmax () = 452.2 nm (64400).
Fluorescence (C2H2Cl4): lmax (Irel) = 549.4 (1.00), 565.6 nm (0.92).
Fluorescence quantum yield (C2H2Cl4, lEx = 452.2 nm, E452.2 nm/1 cm = 0.00859, reference:
Tetramethyl perylene-3,4:9,10-tetracarboxylate with = 1.00): 0.21.
MS (70 eV, EI): m/z (%) = 926 (54) [M+], 464 (24), 268 (21), 256 (22).
HRMS (EI, C52H46S8): m/z = calc. 926.1365, found 926.1380, = +1.5 mmu.
AAS: Fe: 0.007%.
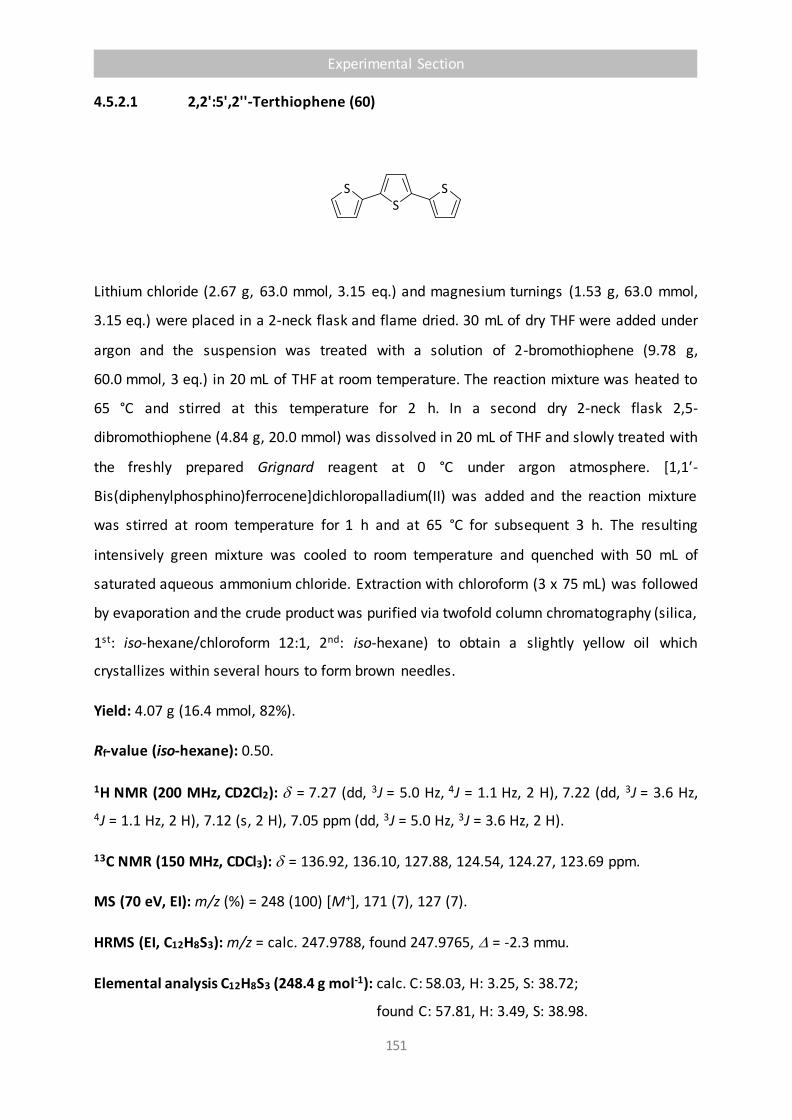
Experimental Section
151
4.5.2.1 2,2':5',2''-Terthiophene (60)
Lithium chloride (2.67 g, 63.0 mmol, 3.15 eq.) and magnesium turnings (1.53 g, 63.0 mmol,
3.15 eq.) were placed in a 2-neck flask and flame dried. 30 mL of dry THF were added under
argon and the suspension was treated with a solution of 2-bromothiophene (9.78 g,
60.0 mmol, 3 eq.) in 20 mL of THF at room temperature. The reaction mixture was heated to
65 °C and stirred at this temperature for 2 h. In a second dry 2-neck flask 2,5-
dibromothiophene (4.84 g, 20.0 mmol) was dissolved in 20 mL of THF and slowly treated with
the freshly prepared Grignard reagent at 0 °C under argon atmosphere. [1,1′-
Bis(diphenylphosphino)ferrocene]dichloropalladium(II) was added and the reaction mixture
was stirred at room temperature for 1 h and at 65 °C for subsequent 3 h. The resulting
intensively green mixture was cooled to room temperature and quenched with 50 mL of
saturated aqueous ammonium chloride. Extraction with chloroform (3 x 75 mL) was followed
by evaporation and the crude product was purified via twofold column chromatography (silica,
1st: iso-hexane/chloroform 12:1, 2nd: iso-hexane) to obtain a slightly yellow oil which
crystallizes within several hours to form brown needles.
Yield: 4.07 g (16.4 mmol, 82%).
Rf-value (iso-hexane): 0.50.
1H NMR (200 MHz, CD2Cl2): = 7.27 (dd, 3J = 5.0 Hz, 4J = 1.1 Hz, 2 H), 7.22 (dd, 3J = 3.6 Hz,
4J = 1.1 Hz, 2 H), 7.12 (s, 2 H), 7.05 ppm (dd, 3J = 5.0 Hz, 3J = 3.6 Hz, 2 H).
13C NMR (150 MHz, CDCl3): = 136.92, 136.10, 127.88, 124.54, 124.27, 123.69 ppm.
MS (70 eV, EI): m/z (%) = 248 (100) [M+], 171 (7), 127 (7).
HRMS (EI, C12H8S3): m/z = calc. 247.9788, found 247.9765, = -2.3 mmu.
Elemental analysis C12H8S3 (248.4 g mol-1): calc. C: 58.03, H: 3.25, S: 38.72;
found C: 57.81, H: 3.49, S: 38.98.

Experimental Section
152
4.5.2.2 General procedure for the preparation of 1,1’-([2,2’:5’,2’’-terthiophene]-5,5’’-
diyl)bisketones (61-62)
Route 1:
In a dry glass apparatus flushed with argon, 2,2’:5’,2’’-terthiophene (60) (62.1 mg,
0.250 mmol) was dissolved in 1.0 mL of carbon disulfide, stirred, cooled to 0 °C and treated
with 10 eq of the respective acyl chloride (2.50 mmol) and 2.5 eq of aluminum chloride
(83.3 mg, 0.625 mmol). The reaction mixture instandly turned red and was allowed to warm
to rt. After 1 h as well as after 2 h, additional 2.5 eq aluminum chloride were added each. After
an overall reaction time of 3 h the remaining volatiles were evaporated, the residue was
treated with 5 mL of a solution of saturated ammonium chloride and extracted with
chloroform (2 x 10 mL). After evaporation of the solvent, the crude product was purified by
column chromatography (respective conditions given below) and filtrated through neutral
aluminum oxide.
Yields:
61a: 93% (83.8 mg, 0.233 mmol)
61b: 62% (60.2 mg, 0.155 mmol)
61c: 40% (42.1 mg, 0.101 mmol)
61d: 79% (82.5 mg, 0.198 mmol)
61e: 51% (58.2 mg, 0.128 mmol)
62a: 30% (27.2 mg, 0.0751 mmol)
62b: 18% (20.0 mg, 0.0450 mmol)

Experimental Section
153
Route 2:
2,2’:5’,2’’-Terthiophene (60) (62.1 mg, 0.250 mmol) was dissolved in 1.0 mL of chloroform.
Zinc oxide (31.1 mg, 50% (w/w)) was added and the stirred suspension was treated with 8 eq
of the respective acyl chloride (2.00 mmol) at rt. The reaction mixture turned purple and was
allowed to react for 4 h at rt. Subsequently, the volatiles were removed at reduced pressure.
The residue was treated with 5 mL of sat. aqueous sodium carbonate solution and extracted
with chloroform (2 x 10 mL). The combined organic layers were washed with sat. aqueous
sodium carbonate (1 x 10 mL) and water (1 x 10 mL). The solvent was evaporated and the
crude product was purified by column chromatography (respective conditions given below)
and filtrated through neutral aluminum oxide.
Yields:
61a: 92 % (82.6 mg, 0.229 mmol)
61b: 92% (89.4 mg, 0.229 mmol)
61c: 86% (89.6 mg, 0.216 mmol)
61d: 88% (91.7 mg, 0.220 mmol)
61e: 78% (89 mg,.0 0195 mmol)
62a: < 5%
62b: < 5%

Experimental Section
154
4.5.2.3 1,1'-[(2,2':5',2''-Terthiophene)-5,5''-diyl]bis(propan-1-on) (61a)
Purification: Silica, chloroform/iso-hexane 2:1.
Rf-value (CHCl3/iso-hexane 2:1): 0.65.
m. p.: 222 °C.
IR (ATR): 𝜈 = 2977, 2938, 2877, 1655 (s), 1507, 1441, 1412, 1378, 1354, 1254, 1221, 1086,
1060, 912, 882, 854, 787 (vs), 744, 724, 666 cm-1.
1H NMR (400 MHz, CD2Cl2): = 7.63 (d, 3J = 4.0 Hz, 2 H), 7.29 (s, 2 H), 7.24 (d, 3J = 4.0 Hz, 2 H),
2.92 (q, 3J = 7.3 Hz, 4 H), 1.21 ppm (t, 3J = 7.3 Hz, 6 H).
13C NMR (100 MHz, CD2Cl2): = 133.0, 127.0, 125.2, 32.7, 8.8 ppm.
UV/Vis (CHCl3): lmax () = 406.2 nm (45300).
Fluorescence (CHCl3): lmax (Irel) = 463.3 (0.91), 490.4 nm (1.00).
Fluorescence quantum yield (CHCl3, lEx = 406.2 nm, E406.2 nm/1 cm = 0.0248, reference:
Tetramethyl perylene-3,4:9,10-tetracarboxylate with = 1.00): 0.52.
MS (70 eV, EI): m/z (%) = 360 (85) [M+], 331 (100) [M+ – C2H5], 303 (16) [M+ – C3H5O], 259 (42).
HRMS (EI, C18H16O2S3): m/z = calc. 360.0312, found 360.0314, = +0.2 mmu.
Elemental analysis C18H16O2S3 (360.5 g mol-1): calc. C: 59.97, H: 4.47, S: 26.68;
found C: 60.20, H: 4.53, S: 26.82.
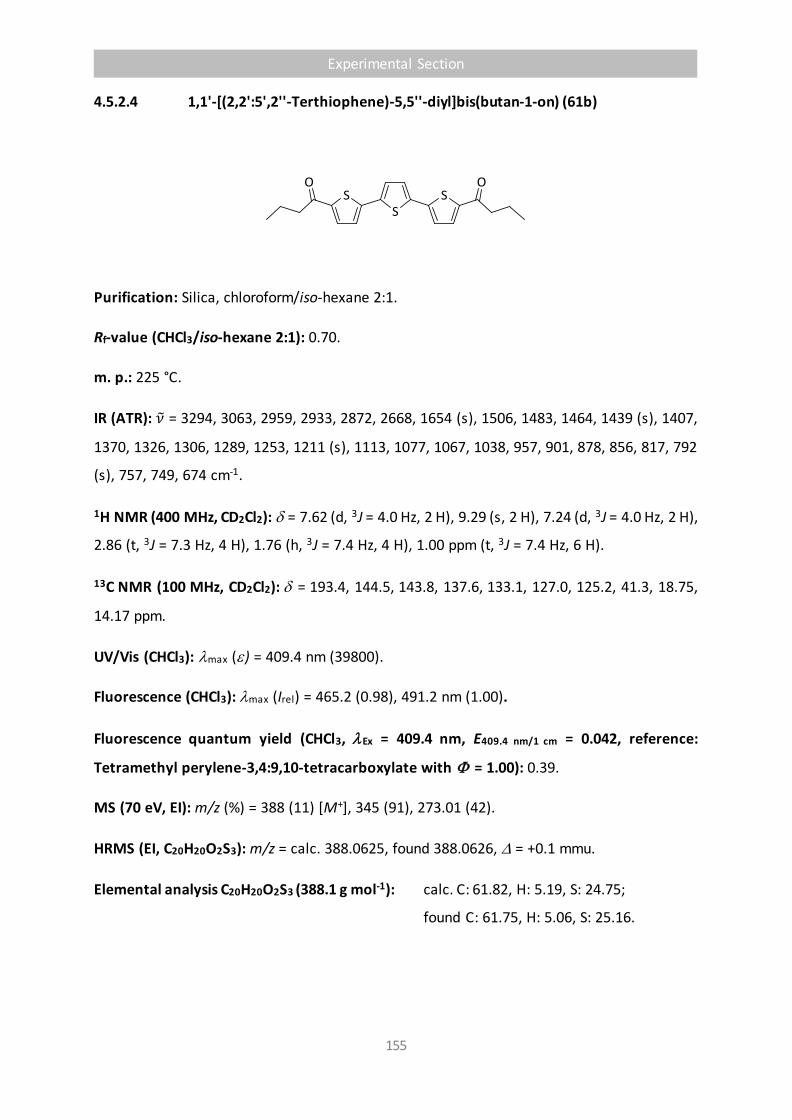
Experimental Section
155
4.5.2.4 1,1'-[(2,2':5',2''-Terthiophene)-5,5''-diyl]bis(butan-1-on) (61b)
Purification: Silica, chloroform/iso-hexane 2:1.
Rf-value (CHCl3/iso-hexane 2:1): 0.70.
m. p.: 225 °C.
IR (ATR): 𝜈 = 3294, 3063, 2959, 2933, 2872, 2668, 1654 (s), 1506, 1483, 1464, 1439 (s), 1407,
1370, 1326, 1306, 1289, 1253, 1211 (s), 1113, 1077, 1067, 1038, 957, 901, 878, 856, 817, 792
(s), 757, 749, 674 cm-1.
1H NMR (400 MHz, CD2Cl2): = 7.62 (d, 3J = 4.0 Hz, 2 H), 9.29 (s, 2 H), 7.24 (d, 3J = 4.0 Hz, 2 H),
2.86 (t, 3J = 7.3 Hz, 4 H), 1.76 (h, 3J = 7.4 Hz, 4 H), 1.00 ppm (t, 3J = 7.4 Hz, 6 H).
13C NMR (100 MHz, CD2Cl2): = 193.4, 144.5, 143.8, 137.6, 133.1, 127.0, 125.2, 41.3, 18.75,
14.17 ppm.
UV/Vis (CHCl3): lmax () = 409.4 nm (39800).
Fluorescence (CHCl3): lmax (Irel) = 465.2 (0.98), 491.2 nm (1.00).
Fluorescence quantum yield (CHCl3, lEx = 409.4 nm, E409.4 nm/1 cm = 0.042, reference:
Tetramethyl perylene-3,4:9,10-tetracarboxylate with = 1.00): 0.39.
MS (70 eV, EI): m/z (%) = 388 (11) [M+], 345 (91), 273.01 (42).
HRMS (EI, C20H20O2S3): m/z = calc. 388.0625, found 388.0626, = +0.1 mmu.
Elemental analysis C20H20O2S3 (388.1 g mol-1): calc. C: 61.82, H: 5.19, S: 24.75;
found C: 61.75, H: 5.06, S: 25.16.

Experimental Section
156
4.5.2.5 1,1'-[(2,2':5',2''-Terthiophene)-5,5''-diyl]bis(pentan-1-on) (61c)
Purification: Silica, chloroform/iso-hexane 1:1.
Rf-value (CHCl3/iso-hexane 1:1): 0.50.
m. p.: 208 °C.
IR (ATR): 𝜈 = 2960, 2929, 2872, 1655, 1507, 1464, 1445, 1409, 1380, 1347, 1259, 1209, 1088,
1016 (s), 930, 858, 789 (s), 751, 735, 701, 673 cm-1.
1H NMR (400 MHz, CD2Cl2): = 7.62 (d, 3J = 4.0 Hz, 2 H), 7.29 (s, 2 H), 7.24 (d, 3J = 4.0 Hz, 2 H),
2.88 (t, 3J = 7.3 Hz, 4 H), 1.75-167 (m, 4 H), 1.52-1.37 (m, 4H), 0.96 ppm (t, 3J = 7.3 Hz, 6 H).
13C NMR (100 MHz, CD2Cl2): = 193.5, 144.5, 143.7, 137.5, 133.1, 127.0, 125.2, 39.2, 27.4,
23.0, 14.2, 1.3 ppm.
UV/Vis (CHCl3): lmax () = 409.4 nm (34700).
Fluorescence (CHCl3): lmax (Irel) = 464.2 (0.98), 491.2 nm (1.00).
Fluorescence quantum yield (CHCl3, lEx = 409.4 nm, E409.4 nm/1 cm = 0.0421, reference:
Tetramethyl perylene-3,4:9,10-tetracarboxylate with = 1.00): 0.71.
MS (70 eV, EI): m/z = 416.02 [M+], 374.00 [M+ – C3H6], 331.98 [M+ – C6H12], 316.97[M+ – C7H15].
HRMS (EI, C22H24O2S3): m/z = calc. 416.0933, found 416.0934, = +0.1 mmu.
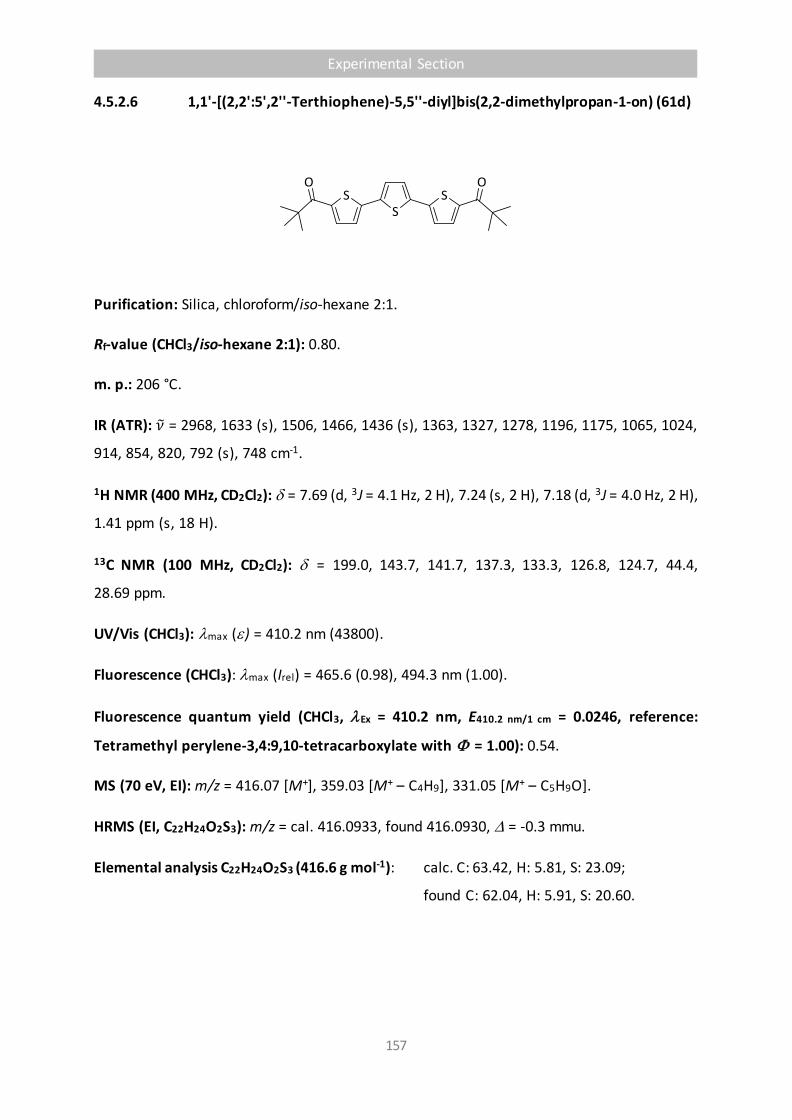
Experimental Section
157
4.5.2.6 1,1'-[(2,2':5',2''-Terthiophene)-5,5''-diyl]bis(2,2-dimethylpropan-1-on) (61d)
Purification: Silica, chloroform/iso-hexane 2:1.
Rf-value (CHCl3/iso-hexane 2:1): 0.80.
m. p.: 206 °C.
IR (ATR): 𝜈 = 2968, 1633 (s), 1506, 1466, 1436 (s), 1363, 1327, 1278, 1196, 1175, 1065, 1024,
914, 854, 820, 792 (s), 748 cm-1.
1H NMR (400 MHz, CD2Cl2): = 7.69 (d, 3J = 4.1 Hz, 2 H), 7.24 (s, 2 H), 7.18 (d, 3J = 4.0 Hz, 2 H),
1.41 ppm (s, 18 H).
13C NMR (100 MHz, CD2Cl2): = 199.0, 143.7, 141.7, 137.3, 133.3, 126.8, 124.7, 44.4,
28.69 ppm.
UV/Vis (CHCl3): lmax () = 410.2 nm (43800).
Fluorescence (CHCl3): lmax (Irel) = 465.6 (0.98), 494.3 nm (1.00).
Fluorescence quantum yield (CHCl3, lEx = 410.2 nm, E410.2 nm/1 cm = 0.0246, reference:
Tetramethyl perylene-3,4:9,10-tetracarboxylate with = 1.00): 0.54.
MS (70 eV, EI): m/z = 416.07 [M+], 359.03 [M+ – C4H9], 331.05 [M+ – C5H9O].
HRMS (EI, C22H24O2S3): m/z = cal. 416.0933, found 416.0930, = -0.3 mmu.
Elemental analysis C22H24O2S3 (416.6 g mol-1): calc. C: 63.42, H: 5.81, S: 23.09;
found C: 62.04, H: 5.91, S: 20.60.
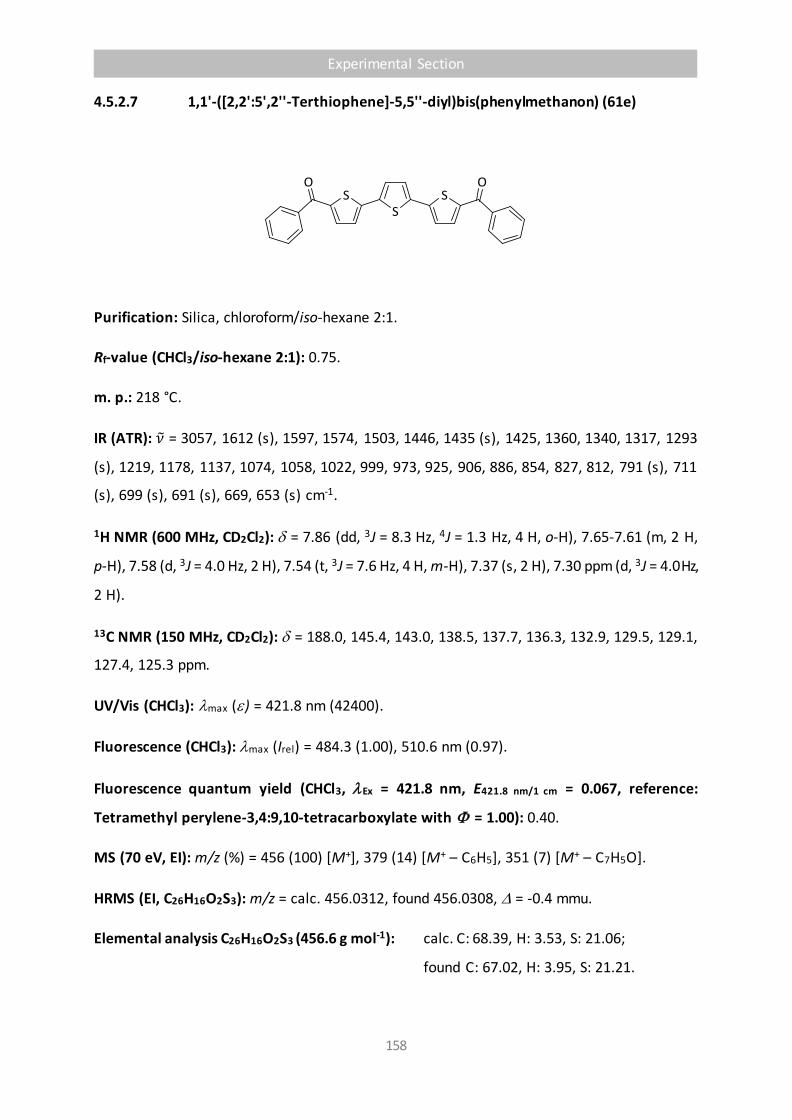
Experimental Section
158
4.5.2.7 1,1'-([2,2':5',2''-Terthiophene]-5,5''-diyl)bis(phenylmethanon) (61e)
Purification: Silica, chloroform/iso-hexane 2:1.
Rf-value (CHCl3/iso-hexane 2:1): 0.75.
m. p.: 218 °C.
IR (ATR): 𝜈 = 3057, 1612 (s), 1597, 1574, 1503, 1446, 1435 (s), 1425, 1360, 1340, 1317, 1293
(s), 1219, 1178, 1137, 1074, 1058, 1022, 999, 973, 925, 906, 886, 854, 827, 812, 791 (s), 711
(s), 699 (s), 691 (s), 669, 653 (s) cm-1.
1H NMR (600 MHz, CD2Cl2): = 7.86 (dd, 3J = 8.3 Hz, 4J = 1.3 Hz, 4 H, o-H), 7.65-7.61 (m, 2 H,
p-H), 7.58 (d, 3J = 4.0 Hz, 2 H), 7.54 (t, 3J = 7.6 Hz, 4 H, m-H), 7.37 (s, 2 H), 7.30 ppm (d, 3J = 4.0 Hz,
2 H).
13C NMR (150 MHz, CD2Cl2): = 188.0, 145.4, 143.0, 138.5, 137.7, 136.3, 132.9, 129.5, 129.1,
127.4, 125.3 ppm.
UV/Vis (CHCl3): lmax () = 421.8 nm (42400).
Fluorescence (CHCl3): lmax (Irel) = 484.3 (1.00), 510.6 nm (0.97).
Fluorescence quantum yield (CHCl3, lEx = 421.8 nm, E421.8 nm/1 cm = 0.067, reference:
Tetramethyl perylene-3,4:9,10-tetracarboxylate with = 1.00): 0.40.
MS (70 eV, EI): m/z (%) = 456 (100) [M+], 379 (14) [M+ – C6H5], 351 (7) [M+ – C7H5O].
HRMS (EI, C26H16O2S3): m/z = calc. 456.0312, found 456.0308, = -0.4 mmu.
Elemental analysis C26H16O2S3 (456.6 g mol-1): calc. C: 68.39, H: 3.53, S: 21.06;
found C: 67.02, H: 3.95, S: 21.21.
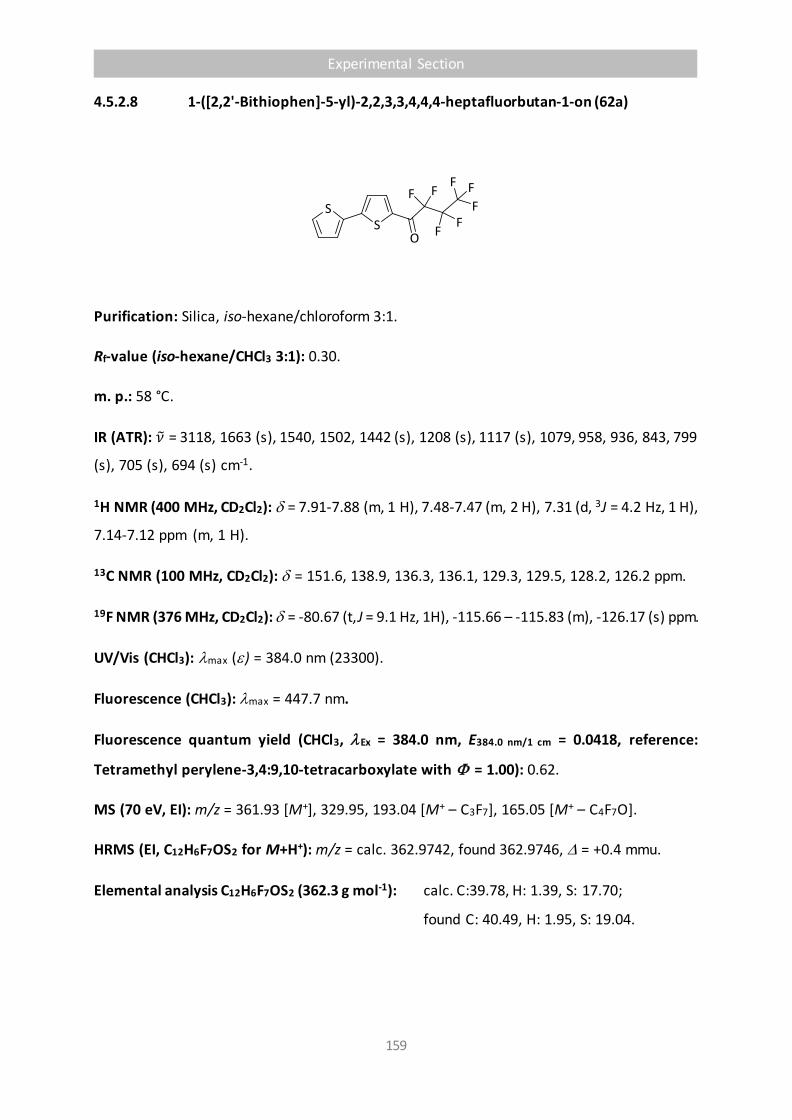
Experimental Section
159
4.5.2.8 1-([2,2'-Bithiophen]-5-yl)-2,2,3,3,4,4,4-heptafluorbutan-1-on (62a)
Purification: Silica, iso-hexane/chloroform 3:1.
Rf-value (iso-hexane/CHCl3 3:1): 0.30.
m. p.: 58 °C.
IR (ATR): 𝜈 = 3118, 1663 (s), 1540, 1502, 1442 (s), 1208 (s), 1117 (s), 1079, 958, 936, 843, 799
(s), 705 (s), 694 (s) cm-1.
1H NMR (400 MHz, CD2Cl2): = 7.91-7.88 (m, 1 H), 7.48-7.47 (m, 2 H), 7.31 (d, 3J = 4.2 Hz, 1 H),
7.14-7.12 ppm (m, 1 H).
13C NMR (100 MHz, CD2Cl2): = 151.6, 138.9, 136.3, 136.1, 129.3, 129.5, 128.2, 126.2 ppm.
19F NMR (376 MHz, CD2Cl2): = -80.67 (t, J = 9.1 Hz, 1H), -115.66 – -115.83 (m), -126.17 (s) ppm.
UV/Vis (CHCl3): lmax () = 384.0 nm (23300).
Fluorescence (CHCl3): lmax = 447.7 nm.
Fluorescence quantum yield (CHCl3, lEx = 384.0 nm, E384.0 nm/1 cm = 0.0418, reference:
Tetramethyl perylene-3,4:9,10-tetracarboxylate with = 1.00): 0.62.
MS (70 eV, EI): m/z = 361.93 [M+], 329.95, 193.04 [M+ – C3F7], 165.05 [M+ – C4F7O].
HRMS (EI, C12H6F7OS2 for M+H+): m/z = calc. 362.9742, found 362.9746, = +0.4 mmu.
Elemental analysis C12H6F7OS2 (362.3 g mol-1): calc. C:39.78, H: 1.39, S: 17.70;
found C: 40.49, H: 1.95, S: 19.04.

Experimental Section
160
4.5.2.9 1-([2,2':5',2''-Terthiophen]-5-yl)-2,2,3,3,4,4,4-heptafluorbutan-1-on (62b)
Purification: Silica, iso-hexane.
Rf-value (iso-hexane): 0.35.
m. p.: 107 °C.
IR (ATR): 𝜈 = 1663 (s), 1500, 1449, 1433, 1344, 1228 (s), 1208 (s), 1171, 1119, 1069, 968, 938,
823, 793 (s), 787 (s), 750, 698 (s) cm-1.
1H NMR (800 MHz, CD2Cl2): = 7.90-7.89 (m, 1 H), 7.40 (d, 3J = 3.8 Hz, 1 H), 7.34 (dd, 3J = 5.1 Hz,
4J = 1.1 Hz, 1 H), 7.30 (d, 3J = 4.2 Hz, 1 H), 7.29 (dd, 3J = 3.6 Hz, 4J = 1.1 Hz, 1 H), 7.20 (d,
3J = 3.9 Hz, 1 H), 7.08 ppm (dd, 3J = 5.1 Hz, 3J = 3.6 Hz, 1 H).
13C NMR (201 MHz, CD2Cl2): = 175.2, 150.9, 141.0, 138.7, 136.6, 135.9, 134.1, 128.7, 126.5,
125.6, 125.5 ppm.
UV/Vis (CHCl3): lmax () = 432.2 nm (42200).
Fluorescence (CHCl3): lmax = 528.8 nm.
Fluorescence quantum yield (CHCl3, lEx = 432.2 nm, E432.2 nm/1 cm = 0.0470, reference:
Tetramethyl perylene-3,4:9,10-tetracarboxylate with = 1.00): 0.47.
MS (70 eV, EI): m/z = 443.80 [M+], 274.97 [M+ – C3F7].
HRMS (EI, C16H7F7OS3): m/z = calc. 443.9547, found 443.9539, = -0.8 mmu.
Elemental analysis C16H7F7OS3 (444.4 g mol-1): calc. C: 43.24, H: 1.59, S: 21.64;
found C: 43.19, H: 2.27, S: 23.27.

Experimental Section
161
4.6 Preparation of Solid Poly(methyl methacrylate) Samples
4.6.1 Standard Polymerization Reaction for the Preparation of Dye-Doped Poly(methyl
methacrylate) (PMMA)
The respective dye was dissolved in freshly distillated methyl methacrylate (MMA, about 20
g) in concentrations of 5 to 200 ppm. Azobisisobutyronitrile (AIBN) (200 ppm (m/m) referring
to MMA) was added and stirred at 25 °C for 30 min. The solution was filterd into a form
determining the shape of the product and the filtrate polymerized at 70 °C for 2.5 h followed
by 5-7 d at 45 °C to obtain dye-doped poly(methyl methacrylate).
4.6.2 Preparation of Dye-Doped Poly(methyl methacrylate) (PMMA) Films
About 1 g of poly(methy methacrylate; Acros, MW:33000 g mol-1) was dissolved in the 20-fold
amount (m/m) of toluene overnight under stirring. After filtration, the solution was treated
with the respective dye (50 ppm (m/m)) and stirred until complete dissolution. A second
filtration was followed by drop-coating the filtrate on glass (approx. 10 x 10 x 1 mm, silica
glass). One drop from a Pasteur pipette per sample was placed in the middle of the carrier and
left aside at room temperature on a plane and even surface for at least 6 h. The resulting
samples displayed thicknesses of about 0.2 mm and were measured as obtained on the glass
surface.

Experimental Section
162

References
163
5 References
[1] M. Hilbert, P. López, Science 2011, 332, 60-65.
[2] O. Ziemann, J. Krauser, P. E. Zamzow, W. Daum, POF-Handbuch Optische
Kurzstreckenübertragung, 2nd ed., Springer-Verlag Berlin Heidelberg 2007.
[3] S. Gogouvitis, K. Konstanteli, S. Waldschmidt, G. Kousiouris, G. Katsaros, A. Menychtas,
D. Kyriazis, T. Varvarigou, Future Gener. Comp. Sy. 2012, 28, 193–209.
[4] a) R. Visbal, M. C. Gimeno, Chem. Soc. Rev. 2014, 43, 3551-3574; b) H. Nakanotani, T.
Higuchi, T. Furukawa, K. Masui, K. Morimoto, M. Numata, H. Tanaka, Y. Sagara, T.
Yasuda, C. Adachi, Nat. Commun. 2014, 5, 4016.
[5] a) H. Sirringhaus, Adv. Mat. 2014, 26, 1319-1335; b) H. E. Katz, A. J. Lovinger, J. Johnson,
C. Kloc, T. Slegrist, W. Li, Y.-Y. Lin, A. Dodabalapur, Nature 2000, 404, 478-481; c) T.
Bourgeteau, D. Tondelier, B. Geffroy, R. Brisse, S. Campidelli, R. Cornut, B. Jousselme,
J. Mat. Chem. A 2016, 4, 4831-4839.
[6] https://de.statista.com/infografik/3553/anteil-von-glasfaseranschluessen-in-der-der-
oecd/; accessed on Aug. 23rd 2016.
[7] a) C. Emslie, J. Mat. Sci. 1988, 23, 2281-2293; b) J. Zubia, J. Arrue, Opt. Fiber Tech. 2001,
101-140.
[8] I. Möllers, D. Jäger, R. Gaudino, A. Nocivelli, H. Kragl, O. Ziemann, N. Weber, T. Koonen,
C. Lezzi, A. Bluschke, S. Randel, IEEE Commun. Mag. 2009, 47, 58–68.
[9] a) D. Siebler, P. Rohwetter, R. Brusenbach, R. Plath, Porcedia Eng. 2015, 120, 845-848;
b) K. Kalli, D. J. Webb, Adv. Fiber Opt. 2011, 345-388.
[10] a) T. H. Nguyen, S. A. Hardwick, T. Sun, K. T. V. Kenneth, IEEE Sens. J. 2012, 12, 255-260;
b) M. R. Shortreed, S. Dourado, R. Kopelman, Sensor Actuat. B-Chem. 1997, 8-12; c) C.
Preininger, I. Klimant, O. S. Wolfbeis, Anal. Chem. 1994, 66, 1841-1846.
[11] P. K. Mohanty, S. R. Dugad, S. K. Gupta, Rev. Sci. Instrum. 2012, 83, 043301/1-
043301/10.
[12] a) H. Langhals, Nachr. Chem. Tech. Lab. 1980, 28, 716-718; Chem. Abstr. 1981, 95,
R9816q; b) S. Knabe, N. Soleimani, T. Markvart, G. H. Bauer, Phys. Status Solidi RRL
2010, 4, 118-120.
[13] a) T. Förster, Umwandlung der Anregungsenergie in W. Foerst (Herausg.), 2.
Internationales Farbensymposium:Optische Anregung organischer Systeme. Aufnahme
und Umwandlung von Lichtenergie durch Farbstoffe und die Einflüsse des Mediums, p.
516, Verlag Chemie GmbH, Weinheim 1966; Chem. Abstr. 1967, 67, 103925;
References
164
[14] J. R. Lakowicz, Principles of Fluorescence Spectroscopy, 3rd ed., Springer, New York
2006.
[15] a)K. Jahn, V. Buschmann, C. Hille, Sci. Rep. 2015, 5, 14334; b) X. Dong, L. Wei, Y. Su, Z.
Li, H. Geng, C. Yanga, Y. Zhang, J. Mater. Chem. C 2015, 3, 2798-2801.
[16] International Union of Pure and Applied Chemistry (IUPAC), Compendium of Chemical
Terminology, 2nd ed., 1997.
[17] a) W. König, J. Prakt. Chem. 1925, 112, 1-36; b) W. Ismailsky, Dissertation, 1913, Univ.
Dresden.
[18] G. G. Stokes, Phil. Trans. R. Soc. 1852, 142,463–562.
[19] S. J. Strickler, R. A. Berg, J. Chem. Phys. 1962, 37, 814-822.
[20] a) S. R. Phillips, L. J. Wilson, R. F. Borkman, Curr. Eye Res. 1986, 5, 611-619; b) X. Peng,
D. R. Draney, W. M. Volcheck, Proc. SPIE 2006, 6097; c) R. Weissleder, C. H. Tung, U.
Mahmood, A. Bogdanov, Nat. Biotechnol. 1999, 17, 375–378.
[21] a) L. Mangolini, E. Thimsen, U. Kortshagen, Nano Lett. 2005, 5, 655-659; b) G. Beane,
K. Boldt, N. Kirkwood, P. Mulvaney, J. Phys. Chem. C 2014, 118, 18079-18086; c) V. C.
Gupta, N. Chaudhary, R. Srivastava, G. D. Sharma, R. Bhardwaj, S. Chand, J. Am. Chem.
Soc. 2011, 133, 9960-9963; d) G. G. Stokes, Phil. Trans. R. Soc. 1953, 143, 385-396.
[22] a) E. J. Noga, P. Udomkusonsri, Vet Pathol. 2012, 39, 726-731; b) D. Slate, T. P. Algeo,
K. M. Nelson, R. B. Chipman, D. Donovan, J. D. Blanton, M. Niezgoda, C. E. Rupprecht,
J. M. Bethony, PLoS Negl. Trop. Dis. 2009, 3, e549.
[23] a) A. Guillemette, J. Pharmacie 1835, 21, 172-178; b) W. H. Perkin, J. Chem. Soc. 1868,
21, 53-63; c) F. J. Duarte, L. S. Liao, K. M. Vaeth, A. M. Miller, J. Opt. A: Pure Appl. Opt.
2006, 8, 172-174; d) U. S. Weber, B. Steffen, C. P. Siegers, Res. Commun. Mol. Pathol.
Pharmacol. 1998, 99, 193-206.
[24] a) B. Mujumdar, A. Ernst, S. R. Mujumdar, C. J. Lewis, A. S. Waggoner, Bioconjugate
Chem. 1993, 4, 105-111; b) K. Umezawa, A. Matsui, Y. Nakamura, D. Citterio, K. Suzuki,
Chem. Eur J. 2009, 15, 1096-1106.
[25] T. Eicher, S. Hauptmann, A. Speicher, The Chemistry of Heterocycles: Structures,
Reactions, Synthesis, and Applications, p. 442, 3rd ed., John Wiley & Sons 2013.
[26] a) F. G. Prendergast, K. G. Mann, Biochem. 1978, 17, 3448-3453; b) R. Y. Tsien, Ann.
Rev. Biochem. 1998, 67, 509-544.
[27] a) H. Langhals, Helv. Chim. Acta 2005, 88, 1309-1343; b) H. Langhals, Chromophores for
picoscale optical computers in K. Sattler (ed.), Fundamentals of picoscience , p. 705,
Taylor & Francis Inc. CRC Press Inc., Bosa Roca/US 2013; ISBN : 9781466505094; c)
Demmig, H. Langhals, Chem. Ber. 1988, 121, 225-230.
References
165
[28] H. Langhals, L. B-Å. Johansson, J. Chem. Soc. Faraday Trans. 1998, 94, 2919-2922.
[29] H. Langhals, S. Demmig, H. Huber, Spectrochim. Acta 1988, 44A, 1189-1193.
[30] a) H. Langhals, A. J. Esterbauer, A. Walter, E. Riedle, I. Pugliesi, J. Am. Chem. Soc. 2010,
132, 16777-16782; b) P. Kölle, I. Pugliesi, H. Langhals, R. Wilcken, A. Esterbauer, R. de
Vivie-Riedle, E. Riedle, Phys. Chem. Chem. Phys. 2015, 17, 25061-25072; c) H. Langhals,
S. Poxleitner, O. Krotz, T. Pust, A. Walter, Eur. J. Org. Chem. 2008, 4559-4562.
[31] a) T. Förster, Ann. Phys. 1948, 437, 55-75; b) H. Edelhoch, L. Brand, M. Wilchek,
Biochem. 1967, 6, 547-559; c) A. N. Bader, E. G. Hofman, J. Voortman, P. M. P. Van
Bergen En Henegouwen, H. C. Gerritsen, Biophys. J. 2009, 97, 2613-2622.
[32] H. Langhals, W. Jona, Angew. Chem. Int. Ed. 1998, 37, 952-955.
[33] a) J. R. Lakowicz, G. Weber, Biochemistry 1973, 12, 4161-4170; b) H. Yang, G. Luo, P.
Karnchanaphanurach, T.-M. Louie, I. Rech, S. Cova, L. Xun,X. S. Xie, Science 2003, 302,
262-266; c) U. Resch-Genger, M. Grabolle, S. Cavaliere-Jaricot, R. Nitschke, T Nann,
Nat. Methods 2008, 5, 763-775; d) M. Y. Berezin, S. Achilefu, Chem. Rev. 2010, 110,
2641-2684.
[34] a) L. I. Smith, Org. Synth. 1930, 10, 40-42; b) H. Langhals, A. Walter, E. Rosenbaum, L.
B.-A. Johansson, Phys. Chem. Chem. Phys. 2011, 13, 11055-11059.
[35] H. Langhals, S. Demmig, T. Potrawa, J. Prakt. Chem. 1991, 333, 733-748.
[36] H. Langhals, A. Hofer, J. Org. Chem 2011, 78, 5889-5897.
[37] a) G. Scheibe, Angew. Chem. 1937, 50, 212-219; b) E. E. Jelley, Nature 1937, 139, 631-
631; c) F. Würthner, T. E. Kaiser, C. R. Saha-Möller, Angew. Chem. Int. Ed. 2011, 50,
3376-3410.
[38] a) V. Grignard, Compt. Rend. 1900, 130, 1322-1325; M. B. Smith, J. March, Advanced
Organic Reactions, Mechanisms and Structure, 6th ed., Wiley-Interscience, New York
2007.
[39] H. Kawai, T. Umehara, K. Fujiwara, T. Tsuji, T. Suzuki, Angew. Chem. Int. Ed. 2006, 45,
4281-4286.
[40] a) A. J. Kennedy, T. P. Mathews, Y. Kharel, S. D. Field, M. L. Moyer, J. E. East, J. D. Houck,
K. R. Lynch, T. L. Macdonald, J. Med. Chem. 2011, 54, 3524-3548; b) S. Araki, Y.
Butsugan, J. Chem. Soc. Perkin Trans. 1 1984, 969-972; c) E. L. Stangeland, T. Sammakia,
Tetrahedron 1997, 53, 16503-16510.
[41] H. Langhals, A. Hofer, J. Org. Chem. 2012, 77, 9585-9592.

References
166
[42] a) W. Rettig, Angew. Chem. Int. Ed. 1986, 25, 971-988; b) D. Oesch, N. W. Luedtke,
Chem. Commun. 2015, 51, 12641-12644; c) Z. H. Guo, Z.-X. Jin, J.-Y. Wang, J. Pei, Chem.
Commun. 2014, 50, 6088-6090; d) S. Chevreux, R. Paulino Neto, C. Allain, K. Nakatani,
P. Jacques, I. Ciofini, G. Lemercier, Phys. Chem. Chem. Phys. 2015, 17, 7639-7642; e) R.
Ghosh, A. Nandi, D. K. Palit, Phys. Chem. Chem. Phys. 2016, 18, 7661-7671; f) H. Tanaka,
K. Shizu, H. Nakanotani, C. Adachi, Chem. Mater. 2013, 25, 3766-3771.
[43] a) I. A. Zhmyreva, V. V. Zelinskii, V. P. Kolobkov, N. D. Krasnitskaya, Dokl. Akad. Nauk.
SSSR 1959, 129, 1089; Chem. Abstr. 1961, 55, 141336; b) K. Schwetlick, Kinetic methods
for studying reaction mechanisms, p. 165, VEB Deut. Verlag Wiss., Berlin 1971; Chem.
Abstr. 1972, 77, 79990; c) C. Reichardt, T. Welton, Solvents and Solvent Effects in
Organic Chemistry; 4th ed.; Wiley-VCH: Weinheim 2011; ISBN 3-527-26805-7.
[44] a) N. Miyaura, A. Suzuki, Chem. Rev. 1995, 95, 2457-2483; b) N. Miyaura, K. Yamada,
A. Suzuki, Tetrahedron Lett. 1979, 20, 3437-3440; c) J. H. Kirchhoff, M. R. Netherton, I.
D. Hill, G. C. Fu, J. Am. Chem. Soc. 2002, 124, 13662-13663.
[45] a) D. Haas, J. M. Hammann, R. Greiner and P. Knochel, ACS Catalysis 2016, 6, 1540-
1552; b) E.-i. Negishi, L. F. Valente and M. Kobayashi, J. Am. Chem. Soc. 1980, 102,
3298-3299; c) E.-i. Negishi, Acc. Chem. Res. 1982, 15, 340-348; d) A. de Meijere and F.
Diederich, Metal-Catalyzed Cross-Coupling Reactions, Wiley-VCH, Weinheim, 2004.
[46] a) N. Barl, V. Werner, C. Saemann, P. Knochel, Heterocycles 2014, 88, 827-844; b) A.
Krasovskiy, P. Knochel, Angew. Chem. Int. Ed. 2004, 43, 3333-3336.
[47] a) K. Dimroth, C. Reichardt, T. Siepmann, F. Bohlmann, Liebigs Ann. Chem. 1963, 661,
1-37; b) C. Reichardt, Angew. Chem. Int. Ed. 1965, 4, 29-40; c) C. Reichardt, R. Müller,
Liebigs Ann. Chem. 1976, 1937-1952; d) C. Reichardt, Pure Appl. Chem. 2008, 80, 1415-
1432; e) V. G. Machado, R. I. Stock, C. Reichardt, Chem. Rev. 2014, 114, 10429-10475;
f) J. P. Cerón-Carrasco, D. Jacquemin, C. Laurence, A. Planchat, C. Reichardt, K. Sraïdi,
J. Phys. Org. Chem. 2014, 27, 512-518; g) M. Afri, H. E. Gottlieb, A. A. Frimer, Canad. J.
Chem. 2014, 92, 128-134; h) T. Etienne, C. Michaux, A. Monari, X. Assfeld, E. A. Perpète,
Dyes Pigments 2014, 100, 24-31.
[48] L. G. S. Brooker, A. C. Craig, D. W. Heseltine, P. W. Jenkins, L. L. Lincoln, J. Am. Chem.
Soc. 1965, 87, 2443-2450.
[49] N. B. Chapman, J. Shorter (Eds.), Correlation Analysis in Chemistry - Recent Advances,
Plenum Press: New York, London, 1978; ISBN 0-306-31068-6.
[50] A. Kawski, P. Bojarski, B. Kukliński, Chem. Phys. Lett. 2008, 463, 410–412.
[51] J.-L. M. Abboud, R. W. Taft, M. J. Kamlet, J. Chem. Soc. Perkin Trans. II 1985, 815-819.
[52] J. Catalán, J. Phys. Chem. B 2009, 113, 5951-5960.

References
167
[53] C. Cao, X. Liu, Q. Qiao, M. Zhao, W. Yin, D. Mao, H. Zhang, Z. Xu, Chem. Commun. 2014,
50, 15811-15814.
[54] H. Langhals, S. Christian, A. Hofer, J. Org. Chem. 2013, 78, 9883-9891.
[55] H. Langhals, G. Schönmann, K. Polborn, Chem. Eur. J. 2008, 14, 5290-5303.
[56] a) R. Eberhardt, S. Löbbecke, B. Neidhardt, C. Reichardt, Liebigs Ann./Recueil 1997,
1195-1199; b) C. Reichardt, Chem. Rev. 1994, 94, 2319-2358; c) C. Reichardt, Green
Chem. 2005, 7, 339-351; d) C. Reichardt, G. Schäfer, Liebigs Ann. 1995, 1579-1582.
[57] a) I. G. Farbenindustrie AG, Brit. Patent GB 402309 (Mar 24, 1933); Chem. Abstr., 1934,
28, 27267; b) Gevaert PhotoProducten N.V. (inv. W. K. Koerber, F. L. Schouteden) Ger.
Patent DE 1108560 (June 6, 1957); Chem. Abstr. 1962, 56, 32447; c) B.M. Krasovitskii,
D. G. Pereyaslova, E. G. Yushko, G. V. Tatsii, Monokrist. Stsintill. Org. Lyuminafory 1967,
1, 92; Chem. Abstr. 1968, 69, 60030.
[58] b) C. McGill, A. Rappa, Adv. Heterocycl. Chem. 1988, 44, 1-79.
[59] a) A. E. Chichibabin, O. A. Zeide, Zhur. Russ. Fiz. Khim. Obshch (J. Russ. Phys. Chem. Soc.)
1914, 46, 1216-1236; b) R. A. Abramovitch, F. Helmer, J. G. Saha, Can. J. Chem. 1965,
43, 725-731; c) M. Wozniak, H.C. van der Plas, J. Heterocycl. Chem. 1978, 15, 731-736.
[60] a) J. H. Yao, C. Chi, J. Wu, K.-P. Loh, Chem. Eur. J. 2009, 15, 9299-9302; b) S. Moez,
Dissertation 2011, LMU München.
[61] A. M. Walter, Dissertation 2011, LMU München.
[62] A. A. Martínez, Phys. perspect. 2004, 5, 4-28.
[63] a) A. Einstein, Zürich. Physik. Z. 1910, 10, 817-826; b) A. Einstein, Über die Entwicklung
unserer Anschauungen über das Wesen und die Konstitution der Strahlung, in: 81.
Versammlung Deutscher Naturforscher und Ärzte zu Salzburg, 1909.
[64] a) A. S. Davydov, Zhur. Eksptl. i Teoret. Fiz. 1948, 18, 210-218; Chem. Abstr. 1949, 43,
24604; b) A. S. Davydow, Theory of molecular excitations, Transl. H. Kasha, M.
Oppenheimer Jr., McGraw-Hill, New York 1962.
[65] a) T. Förster, Naturwiss. 1946, 33, 166-175; Chem. Abstr. 1947, 41, 36668; b) T. Förster,
Ann. Phys. 1948, 6(2), 55-75; Chem. Abstr. 1949, 43, 31172. c) T. Förster, Z.
Elektrochem. 1949, 53, 93-99; Chem. Abstr. 1949, 43, 33629; d) T. Förster, Zeitschr.
Naturforsch. 1949, 4a, 321-327; Chem. Abstr. 1950, 44, 43074.
[66] J. B. Perrin, Fluorescence et radiochimie Conseil de Chemie. 2nd ed., Solvay, Paris, 1924,
Gauthier & Villar. pp 322-398; Chem. Abstr. 1926, 20, 29565.
[67] R. M. Clegg, Reviews in Fluorescence 2006, (C. D. Geddes, J. R. Lakowicz, eds.), Springer
US, New York, 2006; DOI 10.1007/0-387-33016-X_1, ISBN 978-0-387-29342-4.
References
168
[68] T. Förster, Fluoreszenz organischer Verbindungen, Göttingen, Vandenhoeck &
Ruprecht, 1951; Chem. Abstr. 1951, 45, 26285.
[69] C. Aubert, J. Fünfschilling, I. Zschokke-Gränacher, H. Langhals, Zeitschr. Analyt. Chem.
1985, 320, 361-364.
[70] a) J. Jose, K. Burgess, Tetrahedron 2006, 62, 11021–11037; b)
http://en.wikipedia.org/wiki/Nile_blue Nile blue. (July 8, 2014).
[71] R. Sens, K. H. Drexhage, J. Lumin. 1981, 24-25, 709-712.
[72] R. Sjöback, J. Nygren, M. Kubista, Spectrochim. Acta A 1995, 51, L7-L21.
[73] K. G. Casey, E. L. Quitevis, J. Phys. Chem. 1988, 92, 6590–6594.
[74] H. Langhals, Angew. Chem. Int. Ed. 1982, 21, 724-733.
[75] D. Zgela, Dissertation, LMU München, 2015.
[76] a) H. Yagi, Proc. of the IRE 1928, 16, 715-740; b) K. Rothammel, Antennenbuch. 5th ed.,
Telekosmos Verlag, Stuttgart 1976.
[77] a) J. Li, A. Salandrino, N. Engheta, Phys. Rev. B 2007, 76, 245403-245407; b) J. Li, A.
Salandrino, N. Engheta, Phys. Rev. B 2009, 79, 195104.
[78] a) E. Nemeth, G. Schubert, V. Albrecht, F. Simon, Aufbereitungs-Technik 2005, 46, 35-
46; b) E. Nemeth, F. Simon, V. Albrecht, G. Schubert, Ger. Patent No. 102004024754
B3; Chemical Abstracts 2004, 144, 392348; c) U. Gohs, V. Albrecht, K. Husemann, E.
Reinsch, R. Schuenemann, F. Simon, Ger. Offen. No. DE 102007055765 A1; Chemical
Abstracts 2009, 151, 57663.
[79] a) E. C. Corbet, J. G. Frey, R. I. Groce, P. J. Hendra, Plast. Rubber Compos. Process. Appl.
1994, 21, 5-11; b) S. Rafi Ahmad, Assem. Autom. 2000, 20, 58-65; c) M. K. Alam, S. L.
Stanton, G. A. Hebner, J. Spectrosc. 1994, 9, 31-39; d) D. M. Scott, Meas. Sci. Technol.
1995, 6, 156-159; e) S. F. Hubbard, R. A. Potyrailo, P. Schottland, V. Thomas, US Patent
No. 2005/0095715 (2003); Chem. Abstr. 2005, 142, 412287.
[80] S. F. Hubbard, R. A. Potyrailo, P. Schottland, V. Thomas, PCT Int. Appl., WO 2003006965
A1 20030123 (2003); Chem. Abstr. 2005, 138, 107667.
[81] a) H. Langhals, T. Schmid, M. Herman, M. Zwiener, A. Hofer, Int. J. Environ. Eng. 2013,
7, 124-132; b) H. Langhals, T. Schmid, M. Herman, M. Zwiener, A. Hofer, Ger. Offen. DE
102012012772.3; Chemical Abstracts 2014, 160, 63983.
References
169
[82] a) G. Schopf, G. Koßmehl, Polythiophenes: Electrically Conductive Polymers, Springer,
Berlin 1997, ISBN 3-540-61483-4; ISBN 0-387-61483-4; b) A. J. Heeger, N. S. Sariciftci,
E. B. Namdas, Semiconducting and Metallic Polymers, Oxford University Press, Oxford,
2010; ISBN 978-0-19-852864-7; c) D. Fichou, Handbook of Oligo- and Polythiophenes,
Wiley-VCH, Weinheim 1999, ISBN 3-527-29445-7. d) M. Weidelener, C. D. Wessendorf,
J. Hanisch, E. Ahlswede, G. Goetz, M. Linden, G. Schulz, E. Mena-Osteritz, A. Mishra, P.
Baeuerle, Chem. Commun. 2013, 49, 10865-10867; e) T. Keisuke, K. Masayoshi, K.
Mutsumi, ACS applied materials & interfaces 2012, 4, 6289-6294; f) S. E. Koh, C. Risko,
D. A. da Silva Filho, O. Kwon, A. Facchetti, J.-L. Bredas, T. J. Marks, M. A. Ratner, Adv.
Funct. Mater. 2008, 18, 332-340.
[83] R. S. Becker, J. Seixas de Melo, A. L. Maçanita, F. Elisei, J. Phys. Chem. 1996, 100, 18683.
[84] a) H. Dong, X. Fu, J. Liu, Z. Wang, W. Hu, Wenping, Adv. Mater. 2013, 25, 6158-6183;
b) D. M. DeLongchamp, R. J. Kline, D. A. Fischer, L. J. Richter, M. F. Toney, Adv. Mater.
2011, 23, 319-337.
[85] a) A. Krasovskiy, V. Malakhov, A. Gavryushin, P. Knochel, Angew. Chem., Int. Ed. 2006,
45, 6040-6044; b) T. D. Blümke, F. M. Piller; P. Knochel, Chem. Commun. 2010, 46,
4082-4084.
[86] a) T. Otani, M. Hachiya, D. Hashizume, T. Matsuo, K. Tamao, Chem. Asian J. 2011, 6,
350-354; b) Y. Shibata, T. Kono, N. Komura, Y. Yoshida, Org. Electron. 2013, 14(4), 1073-
1080; c) T. Inubushi, Y. Hattori, Y. Yamanoi, H. Nishihara, J. Org. Chem. 2014, 79, 2974-
2979; d) Y.-X. Peng, T. Tao, X.-X. Wang, B.-B. Ma, K. Zhang, W. Huang , Chem. Asian J.
2014, 9, 3593-3603; e) M. Lu, S. Nagamatsu, Y. Yushida, M. Chikamatsu, R. Azumi, K.
Yase, Chem. Lett. 2010, 39, 60-61.
[87] a) H. Hock, H. Kropf, Angew. Chem. 1957, 69, 313–321; b) H. Hock, S. Lang, Ber. dtsch.
chem. Ges. B 1944, 77B, 257–264; Chem. Abstr. 1945, 39, 22122; c) H.-J. Arpe, K.
Weissermel, Industrielle Organische Chemie: Bedeutende Vor- und Zwischenprodukte,
6. Ed., Wiley-VCH, New York, 2007, pp. 418.
[88] a) P. D. Bartlett, L. H. Knox, J. Am. Chem. Soc. 1939, 61, 3184-3192; b) U. Schöllkopf,
Angew. Chem.1960, 72, 147-159; c) R. C. Fort, P. v. R. Schleyer in H. Hart, G. J.
Karabatsos, Advances in Alicyclic Chemistry, 1966, 1; d) R. C. Fort in G. A. Olah, P. v. R.
Schleyer, Carbonium Ions, J. Wiley-Interscience, New York, 1973, Vol. IV, pp. 1783.
[89] a) W. Hoek, J. Strating, H. Wynberg, Rec. Trav. Chim. Pays-Bas 1966, 85, 1045-1053; b)
S. Brase, B. Waegell, A. De Meijere, Synthesis 1998, 148-152; c) V. V. Kovalev, Y. N.
Luzikov, Y. I. Savel’ev, Neftekhimiya 1989, 29, 628-643.
[90] H. Langhals, C. Rüchardt, Chem. Ber. 1981, 114, 3831-3854.
[91] C. Sämann, V. Dhayalan, P. Schreiner, P. Knochel, Org. Lett. 2014, 16, 2418-2421.
[92] J. E. Milne, S. L. Buchwald, J. Am. Chem. Soc. 2004, 126, 13028-13032.

References
170
[93] a) S. L. Bondarev, I. I. Ivanov, Y. N. Romashin, O. G. Kulinkovich, Zh. Prikl. Spektrosk.
1992, 56, 739-744; Chem. Abstr. 1992, 117, 180817; b) J. Gierschner, H.-G. Mack, H.-J.
Egelhaaf, S. Schweizer, B. Doser, D. Oelkrug, Synth. Met. 2003, 138, 311-315; c) D.
Wasserberg, P. Marsal, S. C. J. Meskers, R. A. J. Janssen, D. Beljonne, J. Phys. Chem. B
2005, 109, 4410-4415.
[94] a) S. Ellinger, U. Ziener, U. Thewalt, K. Landfester, M. Möller, Chem. Mater. 2007, 19(5),
1070-.1075; b) M. Kirkus, L. Wang, S. Mothy, D. Beljonne, J. Cornil, R. A. J. Janssen, S.
C. J. Meskers, J. Phys. Chem. A 2012, 116, 7927−7936; c) J. Mizuguchi, J. Imaging Sci.
Technol. 2002, 46, 257−261; d) J. Mizuguchi, J. Phys. Chem. A 2000, 104, 1817−1821.
[95] a) J. C. Horne, G. J. Blanchard, E. LeGoff, J. Am. Chem. Soc. 1995, 117, 9551-9558; b) H.
Tang, L. Zhu, Y. Harima, K. Yamashita, K. L: Kazuo, N. A. Kyung, M. Ishikawa, J. Chem.
Soc., Perkin 2 2000, 1976-1979.
[96] a) F. Van Bolhuis, H. Wynberg, Synth. Met. 1989, 30, 381–389; b) C. Y. Yang, Y. Yang,
Mol. Cryst. Liq. Cryst. 1995, 270, 113-122; c) L. Antolini, G. Horowitz, F. Kouki, F.
Garnier, Adv. Mater. 1998, 10, 382-385; d) G. Horowitz, B. Bachet, A. Yassar, P. Lang,
F. Demanze, J.-L. Fave, F. Garnier, Chem. Mater. 1996, 7, 1337-1341.
[97] a) N. DiCésare, M. Belletête, A. Donat-Bouillud, M. Leclerc, G. Durocher,
Macromolecules 1998, 31, 6289-6296; b) N. DiCésare, M. Belletête, A. Donat-Bouillud,
M. Leclerc, G. Durocher, J. Lumin. 1999, 81, 111-125.
[98] F. Costanzo, D. Tonelli, G. Scalmani, J. Cornil, Polymer 2006, 47, 6692-6697.
[99] (a) R. H. Abu-Eittah, F. A. Al-Sugeir, Bull. Chem. Soc. Jpn. 1985, 58, 2126-2132; b) J.-Y.
Balandier, F. Quist, C. Amato, S. Bouzakraoui, J. Cornil, S. Sergeyev, Y. Geerts,
Tetrahedron 2010, 66, 9560-9572; c) F. Effenberger, F. Würthner, F. Steybe, J. Org.
Chem. 1995, 60, 2082-2091; d) P. Garcia, J. M. Pernaut, P. Hapiot, V. Wintgens, P. Valat,
F. Garnier, D. Delabouglise, J. Phys. Chem. 1993, 97, 513-516; e) S. Li, J. Yan, C.-Z. Li, F.
Liu, M. Shi, H. Chen, T. P. Russell, J. Mater. Chem. A 2016, 4, 3777-3783; f) T.
Vikramaditya, M. Saisudhakar, K. Sumithra, J. Mol. Struct. 2015, 1081, 114-123.
[100] a) H. Wynberg, A. Bantjes, J. Am. Chem. Soc. 1960, 82, 1447-1450; b) M. A. Hempenius,
B. M. W. Langeveld-Voss, J. A. H. van Haare, R. A. J. Janssen, S. S. Sheiko, J. P. Spatz, M.
Möller, E. W. Meijer, J. Am. Chem. Soc. 1998, 120, 2798-2804; c) J. Kagan, S. K. Arora,
A. Üstünol, J. Org. Chem. 1983, 48, 4076-4078.
[101] M. Treiber, S. Giebeler, T. Lessing, T. J. J. Müller, Organ. Biomol. Chem. 2013, 11, 3541-
3552.
[102] a) S. Joshi, R. M. Patel, P.M. Patel, J. Polym. Res. 2003, 10(4), 235-239; b) W. E. Truce,
C. W. Vriesen, J. Am. Chem. Soc. 1953, 75, 5032-5036.
[103] a) S. M. Hosseini, S. Hashem, J. Org. Chem. 2004, 69(20), 6953-6956; b) V. Lukeš, M.
Danko, A. Andicsová, P. Hrdlovič, D. Végh, Synt. Met. 2013, 165, 17-26.
References
171
[104] M. Hosseini-Sarvari, M. Tavakolian, Appl. Cat. A 2012, 441-442, 65-71.
[105] a) S. J. T. Rezaei, M. R. Nabid, S. Z. Hosseini, M. Abedi, Synth. Commun. 2012, 42(10),
1432-1444. (b) M. Raula, M. H. Rashid, T. K. Paira, E. Dinda, T. K. Mandal, Langmuir
2010, 26, 8769-8782.
[106] S. Ashoka, P. Chithaiah, K. V. Thipperudraiah, G. T. Chandrappa, Inorg. Chim. Acta 2010,
363(13), 3442-3447.
[107] M. H. Sarvari, H. Sharghi, J. Org. Chem. 2004, 69, 6953-6956.
[108] S. Portnoy, H. Gisser, J. Org. Chem. 1967, 233-234.
[109] a) D. Karthik; K.R. Justin Thomas; J.-H. Jou, S. Kumar, Y.-L. Chen; Y.-C. Jou, RCS Advances
2015, 5, 8727-8738; b) S. N. Lee, S. J. Lee, Y. K. Kim, D. M. Shin, Mol. Cryst. Liq. Cryst.
2013, 581, 59-69; c) K. H. Lee, S. O. Kim, S. Kang, J. Y. Lee, K. S. Yook, J. Y. Lee, S. S. Yoon,
J. Org. Chem. 2012, 77, 2748-2755.
[110] a) G. Schnurpfeil, A. K. Sobbi, W. Spiller, H. Kliesch, D. Wöhrle, J. Porphyrins
Phthalocyanines 1997, 1, 159–167; b) K. Yoshida, M. Nakamura, Y. Kazue, N.
Tachikawa, S. Tsuzuki, S. Seki, K. Dokko, M. Watanabe, J. Am. Chem. Soc. 2011, 133,
13121-13129.
[111] H. Langhals, J. Karolin, L. B.-Å. Johansson, J. Chem. Soc. Faraday Trans. 1998, 94, 2919-
2922.
Images:
p. 15 Prism: https://globalleadershipprograms.files.wordpress.com/2012/08/prisma.jpg,
accessed on Oct. 3rd 2016.
p. 69 Waves: http://static.nautil.us/2895_6b8b8e3bd6ad94b985c1b1f1b7a94cb2.jpg,
accessed on Oct. 6th 2016.
p. 81 Polymer flakes: http://www.instituteofmaking.org.uk/
assets/_files/uploads/IMG_5867.jpg, accessed on Oct. 3rd 2016
Laser: http://i.imgur.com/mq0TZxJ.jpg, accessed on Oct. 6th 2016.
p. 99 Registered Jacks: http://newatlas.com/optical-fiber-throughput-breakthrough/30038;
accessed on Oct. 5th 2016.