United States Marine Corps Physical Fitness, Combat Fitness ...
Upload
khangminh22Category
view
0download
0
ABSTRACT
Effectiveness of Lifetime Fitness Course Activities at Improving
Movement Efficiency through Fusionetics Movement Efficiency Test
Sarah K. Ruckman, M.S.
Mentor: Jaeho Shim, Ph.D.
Exercise has lifelong benefits, specifically increased quality of life. University
physical activity courses are designed to instruct on fundamental principles of exercise
form and specific sports. Yet, in these courses there is a lack of evidence of improving
movement efficiency (ME) that may highlight poor movement quality. The main purpose
of this study was to determine how effective lifetime fitness (LF) activities at Baylor
University are at improving ME. Eleven participants were recruited to perform a
Fusionetics movement efficiency test at the beginning, middle, and end of the academic
semester. Significance was found in overall ME scores from the pre and the post-test (pre
75.33 ± 6.34, post 70.69 ± 4.96). Within subgroups, a significant decrease was found
between tests of the 2-leg squat (pre 78.786 ± 10.883, mid 89.19 ± 6.906) and the 1-leg
squat (mid 47.72, post, 27.27). A significant increase was found between left (pre 54.55,
mid 75.7) and right (pre 27.28, mid 60.6) hip symmetry. Future research should include a
longer testing period to determine the effectiveness of ME testing detecting muscular or
movement deficits in a sedentary university population.

Copyright © 2022 by Sarah K. Ruckman
All rights reserved
iv
TABLE OF CONTENTS
LIST OF FIGURES ........................................................................................................... iv
LIST OF TABLES .............................................................................................................. v
ACKNOWLEDGMENTS ................................................................................................. vi
CHAPTER ONE ................................................................................................................. 1
Introduction ..................................................................................................................... 1
Introduction................................................................................................................. 1
Purpose ....................................................................................................................... 3
Hypotheses .................................................................................................................. 3
Delimitations ............................................................................................................... 4
Limitations .................................................................................................................. 4
Assumptions ................................................................................................................ 4
CHAPTER TWO ................................................................................................................ 5
Literature Review ........................................................................................................... 5
Introduction................................................................................................................. 5
Purpose of Movement Screenings ............................................................................... 6
Screening for Exercise Prescription ........................................................................... 7
Movement Screening Requirements ............................................................................ 9
Functional Movement Screening .............................................................................. 10
Limitations of Functional Movement Screening ....................................................... 12
Fusionetics ................................................................................................................ 13
CHAPTER THREE .......................................................................................................... 15
Methods ........................................................................................................................ 15
Participants ............................................................................................................... 15
Study Sites ................................................................................................................. 16
Variables ................................................................................................................... 16
Fusionetics Movement Efficiency Test ...................................................................... 16
Testing Visits ............................................................................................................. 21
Data Collection ......................................................................................................... 24
Statistical Analysis .................................................................................................... 24
v
CHAPTER FOUR ............................................................................................................. 26
Results ........................................................................................................................... 26
Participant Characteristics ....................................................................................... 26
Overall ME Score ..................................................................................................... 27
Overall ME Subgroup Data ...................................................................................... 29
Subgroup Symmetry Scores....................................................................................... 35
CHAPTER FIVE .............................................................................................................. 42
Discussion ..................................................................................................................... 42
Introduction............................................................................................................... 42
Overall ME Scores .................................................................................................... 42
Subgroups ................................................................................................................. 45
Limitations ................................................................................................................ 50
Future Research ........................................................................................................ 50
Conclusion ................................................................................................................ 51
APPENDIX ....................................................................................................................... 53
BIBLIOGRAPHY ............................................................................................................. 59

vi
LIST OF FIGURES
Figure 4.1. Comparison of Overall ME Test Scores ..........................................................28
Figure 4.2. Percentage of Change Between Overall ME Test Scores Averages ...............29
Figure 4.3. Overall Subgroup Division Between All Tests ...............................................29
Figure 4.4. Mean Participant 2-Leg Squat Scores .............................................................31
Figure 4.5. Mean Participant 2-Leg Squat with Heel Lift Scores .....................................31
Figure 4.6. Mean Participant 1-Leg Squat Scores .............................................................32
Figure 4.7. Mean Participant Push-Up Scores ...................................................................33
Figure 4.8. Mean Participant Shoulder Movements Scores ...............................................33
Figure 4.9. Mean Participant Trunk and Lumbar Spine Movements Scores .....................34
Figure 4.10. Mean Participant Cervical Movements Scores..............................................35
Figure 4.11. Overall Joint Symmetry Averages................................................................35
Figure 4.12. Left and Right Joint Symmetry Scores for the Neck/Cervical Spine ............37
Figure 4.13. Left and Right Joint Symmetry Scores for the Shoulder ...............................38
Figure 4.14. Left and Right Joint Symmetry Scores for the Trunk/Lumbar Spine ...........39
Figure 4.15. Left and Right Joint Symmetry Scores for the Hip .......................................39
Figure 4.16. Left and Right Joint Symmetry Scores for the Knee .....................................40
Figure 4.17. Left and Right Joint Symmetry Scores for the Foot/ Ankle ..........................41
vii
LIST OF TABLES
Table 3.1. Fusionetics Movement Efficiency Test Guidelines ..........................................17
Table 3.2. Testing Timeline ...............................................................................................22
Table 3.3. Rotations/ Activities for the First Half of FTP .................................................23
Table 3.4. Rotations/ Activities for the Second Half of FTP .............................................24
Table 4.1. Group Specific Participant Baseline Characteristics ........................................26
Table 4.2. One-Way ANOVA Results for Overall ME Score ...........................................27
Table 4.3. Overall ME Symmetry Between Left and Right ..............................................28
Table 4.4. Percentage of Change Between Tests ...............................................................28
Table 4.5. Subgroup One-Way ANOVA Results ..............................................................30
Table 4.6. Joint Symmetry One-Way ANOVA Results ....................................................36
viii
ACKNOWLEDGMENTS
I would like to first like to thank my Fiancé, Daniel Hardman, and my family for
their endless support to me and this project. I would also like to thank my thesis
committee chairperson, Dr. Jaeho Shim, for the guidance through this process. Further
thanks to the thesis committee Dr. Yunsuk Koh and Dr. Teresa Bachman for their
contribution to this project. Finally, I would like to thank the Department of Health,
Human Performance and Recreation, Robbins College of Health and Human Sciences,
Baylor University, for its support of this project.
1
CHAPTER ONE
Introduction
Introduction
The benefits of exercise have been proven in multiple studies highlighting the
increased quality of life from lifelong fitness (Ozturk & Unver, 2020; Nasui & Popescu,
2014). Benefits specifically for university students include sleep quality, mental health,
and academic performance (Ozturk & Unver, 2020; Nasui & Popescu, 2014). Currently,
39% of university students are considered active according to the American College of
Sports Medicine’s (ACSM) criteria for active people (Ozturk & Unver, 2020;). The
ACSM recommends either 150 minutes of moderate activity or 75 minutes of vigorous
activity per week and participating in physical activity at least 3 days per week (Riebe et
al., 2018). Unfortunately, statistics show that 61% of students are not meeting this
criterion (Ozturk & Unver, 2020). The injury prevalence in physical education courses
has been shown to be higher in adolescents (ages 13-17) than children (ages 8-12), with
adolescents sustaining more severe injuries (Abernethy, 2003). One explanation for the
higher injury risk in adolescence is a higher-performance concentration leading to stress-
related injuries, growth plate injuries, and trauma injuries (Maffulli et al., 2010). Severe
injuries have negative consequences later in life and may limit the ability to benefit from
physical activity (Maffulli et al., 2010).

2
Screenings in the health care setting are used to identify a pathological condition
that may cause an individual to become susceptible to injury prior to an individual’s
showing of the specific symptoms of that condition (Bahr, 2016). A movement screening
is specifically designed to identify movement deficits that could impact injury (Bennett et
al., 2020). The importance of early identification is to allow for intervention to mitigate
the risk of the specific condition (Bennett et al., 2020). Some movement screenings that
have been proven effective in athletic populations are both Functional Movement
Screening (FMS) (Triplett et al., 2021) and Fusionetics (Quick-Royal, 2020; Cornell &
Ebersole, 2018). Neither movement screening has been studied in sedentary university
students. FMS, although effective for athletic populations, has conflicting evidence
surrounding inactive populations, including the inability to distinguish between injured
and non-injured individuals (Karuc et al., 2021). A meta-analysis on FMS effectiveness
found poor sensitivity for athletes with a high injury risk while also reporting a limited
predictive ability, concluding that FMS was not a valid test for predictive injury risk
(Moore et al., 2019).
Fusionetics has been thoroughly tested as an intervention program in addition to a
screening assessment (Quick-Royal, 2020). It has been proven effective in finding
movement deficits in elite athletes, military and tactics, youth athletics, healthcare
systems, and fitness communities (Quick-Royal, 2020). Fusionetics is a superior
movement screening to FMS based on intra-rater reliability (Cornell & Ebersole, 2018).
Research shows that 92% of individual movement compensations hold high intra-rater
reliability (Cornell & Ebersole, 2018). Fusionetics also provides a solution to the
concerns with injury predictive value associated with FMS (Bonazza et al., 2017).
3
Cornell and Ebersole (2018) suggest there are no consistent values, including optimized
sensitivity, necessary to use as a cutoff point between injury risk and no risk within FMS.
Fusionetics uses a scale of 1-100 instead of a scale of 0-21, used with FMS (Bonazza et
al., 2017, Cornell & Ebersole, 2018). Although new, Fusionetics offers a more effective
solution to detecting movement deficits in multiple populations compared to FMS.
Purpose
The purpose of this study was to determine if a Fusionetics Movement Efficiency
Test could be used to determine the effectiveness of lifetime fitness (LF) course activities
in sedentary university students. Specifically, the goal was to identify how effective
activities in Fitness Theory and Practice (FTP) at Baylor university are at improving
movement efficiency (ME) in a sedentary university population. A secondary purpose
was to determine specific movement and muscular deficits in this population.
Hypotheses
Ho: There will be no significant difference in overall ME test scores between pre, mid,
and post-test.
Ho: There will be no significant difference between the overall left and right symmetry.
Ho: There will be no significant difference in the leg ME tests scores between the pre,
mid, and post-test.
Ho: There will be no significant difference between in symmetry ME test scores between
left and right sides of the hop joint.
4
Delimitations
1. 3 males and 8 females for a total of 11 participants
2. Age: 18 years and older
3. Baylor students enrolled in FTP
4. Must complete FTP
Limitations
1. Participation in exercise more than 3 days of activity or 150 minutes of
moderate activity per week (Riebe et al., 2018)
2. Musculoskeletal injury limiting activity in the past 5 years
3. Does not complete FTP course
Assumptions
All research team members will be adequately trained in all necessary study
protocols.

5
CHAPTER TWO
Literature Review
Introduction
Movement efficiency assessments have been tested on multiple populations,
including youth athletics, professional and college athletics, military and tactical skills,
and healthcare or rehabilitation settings (Quick-Royal, 2020; Moore et al., 2019; Lopez-
Valenciano et al., 2018; Pollen, Keitt, & Tojian, 2018; Bonazza et al., 2017). Yet, there is
a gap in the literature concerning sedentary university students. A study on mortality rates
and physical activity throughout life found a 29-36% lowered risk of all-cause mortality
when participating in physical activity through adolescence into adulthood (Saint-
Maurice et al., 2019). This finding explains a partial reasoning behind university major
programs requiring at least 1 credit hour of physical activity to complete the degree. One
beginning level course at Baylor University is FTP. The course contains a pre-fitness test
that covers the cardiovascular endurance, muscular strength, and basic flexibility of the
students (Ruckman, 2021). ME test add a component of the student’s movement that
provides pertinent performance information to enhance not only learning, but also
performance.
6
Current literature aims to examine ME at an elite, collegiate, or high school
athletics and healthcare population. However, current research lacks the investigation of
effectiveness of ME testing in a sedentary collegiate population. Karuc et al. (2021)
suggests that FMS was unable to predict injury in adolescents but recommends future
research in cross-validation with different ME assessments. Emery and Pasanen (2019)
recommends examining educational settings. With supporting research proving improved
movement quality with participation in multiple sports (Triplett et al., 2021) and evidence
of ME assessment related to injury risk (Bennet et al., 2017), a sedentary population may
benefit from ME testing in physical activity courses.
Purpose of Movement Screenings
Among various movement assessments, the primary goal is to guide safe and
effective exercise prescription rather than highlighting injury risk (Bennett et al., 2020).
The individualized exercise prescription allows for early intervention and therefore may
mitigate the risk of further or new injuries (Bennett et al., 2020). Poor movement quality
during strength training demands the need for movement screenings (Bennett et al., 2020)
because in absence, it may lead to the development of undesirable motor patterns,
muscular imbalances, and postural deviations (Bennett et al., 2020; Riebe et al., 2018) In
the educational setting underdeveloped movement patterns support the need for a
movement screening because students with multiple backgrounds ranging from beginner
to self-taught to advanced are enrolled in the course. With a variety of backgrounds,
students may have limited knowledge on correct movement forms, highlighting the need
of a movement screening at the beginning of the course.
7
The optimal approach to sports injury prevention is modeled in 4 steps; (1)
establish the extent of the injury, (2) Establish the mechanism of injury, (3) introduce a
preventative measure, and (4) Assess effectiveness by repeating step 1 (Emery &
Pasanen, 2019). In addition, behavior, defined as a controlled reaction driven by the
intention to perform a specific behavior, may be considered a risk factor in the previous
model (Verhagen et al., 2010). School settings are targeting these injury prevention
strategies (Emery & Pasanen, 2019), therefore a useful setting for ME testing. The injury
prevention model introduces the framework to fully understand injury prevention
strategies, but ultimately the most useful assessment is the one that will continue to
prevent injuries in athletes (Emery & Pasanen, 2019). This concept encourages ME
testing to guide not only neuromuscular training, but instead specific behavior training
(Verhagen et al., 2010). To prevent injuries in real-life situations, one must look beyond
isolated injuries and focus on underlying factors to the student as a whole (Verhagen et
al., 2010). Therefore, the purpose of movement screenings is to determine underlying
factors of movement and muscular deficits that may aid in preventing future injury.
Screening for Exercise Prescription
To receive optimal benefits from physical activity, specifically resistance
exercise, correct technique is necessary to achieve this outcome (Bennett et al., 2020).
Technique will ensure the musculoskeletal system is safely loaded and the correct
muscles, joints, and motor patterns are being trained (Bennett et al., 2020). Among
inactive populations, a movement screening may provide pertinent information on how
the student moves, therefore providing opportunities to improve their technique. The
longer a student continues in a sedentary state following adolescent or high school sports,
8
the weaker their motor function (Ge et al., 2021). Ge et al. (2021) using FMS shows that
most students meet the minimum requirement for ME, but with small margin. Their study
implies that future research should focus on improving these poor scores (Ge et al.,
2021). The movement screening is also useful for intervention strategies. Exercise
prescription can be personalized to the individual needs of the student in volume, load,
and exercise selection. Movement screenings, when used appropriately, determine sites
of muscular dysfunction (muscle weakness or neuromuscular imbalances), restrictions in
joint mobility or excessive muscle tightness. Identifying areas of risk in student
movement screenings will provide a measurement of movement quality and an
improvement in training effectiveness (Bennett et al., 2020). Correcting movement
quality has been proven effective in reducing injury (Cornell, 2016). The goal of ME
testing in a sedentary population is to build a solid foundation of technique in movements
outlined in ME assessments.
Some physical education courses use a pre and post fitness test to evaluate
improvements in fitness levels. Specifically, Baylor’s LF course, FTP, uses tests such as
push-up to failure, 1 minute of sit-ups test, sit-and-reach test, and 1-mile Rockport
walking test to assess student fitness (Ruckman, 2021) These tests measure upper body
and core strength, hamstring and low back flexibility, and endurance, but not ME. The
tests do not include any form or movement quality of any kind, allowing students to
receive a higher score with poorer movement quality. Instructors may correct form
through class periods, but an advantage of a movement assessment is a more reliable
measure of taught ME (Bennett et al., 2020). Another advantage is instructors can clearly
see which movements are misunderstood in a practical and applicable measurement, to
9
enhance the student’s experience in the fitness course and the instructor’s teaching. A
final strength is that once the foundation of movement quality is established, instructors
can then challenge students by adding variations of movements to increase strength and
capacity (Bennett et al., 2020). It has been proven that by improving movement quality,
performance is enhanced (Chapman et al., 2014). Long-term functional and performance
outcomes will be increased by using a movement screening to enhance movement quality
in physical education courses (Bennett et al., 2020).
Movement Screening Requirements
Two of the primary purposes for movement screenings are to evaluating
movement quality and to develop exercise prescription (Bahr, 2016). Many variations of
movement screenings have been created for these specific purposes. The two most
popular movement screenings currently are FMS and Fusionetics. There are three key
principles to consider for a movement screening; (a) strong association between a marker
from a screening test and injury risk, (b) test properties must investigate in relevant
populations with appropriate statistics, and (c) integration of an intervention program
structured to improve movement deficits found in the screening (Bahr, 2016). A strong
association between a marker from a screening test and injury risk is necessary to
determine whether the screening is accurate (Bahr, 2016). These strong associations are
necessary to provide accuracy in identifying muscular and movement deficits (Bahr,
2016). Without these three necessary components, movement screenings are incapable of
accurately providing information on movement efficiency.
10
Functional Movement Screening
FMS is the most common injury assessment thus far. The assessment has been
proven effective in identifying at risk athletes in professional, collegiate, and youth
athletics through determined movement compensations correlated to injury (Lopez-
Valenciano et al., 2018; Pollen et al., 2018; Bonazza et al., 2017). FMS is considered
most effective for college populations who perform multiple sports (Moore et al., 2019).
Therefore, FMS can also be effective in a physical activity course as it involves a variety
of activities, sports, and games. The test is composed of seven movement tests designed
to observe performance of basic locomotor, manipulative, and stabilizing movements.
The test focuses on identifying weaknesses and imbalances of stability and mobility
(Cook et al., 2014). The intended purposes are to identify at risk individuals, systemically
correct and improve fundamental movement patterns, monitor progress and development
in the presence of injury and fitness level and create a functional movement baseline for
statistical observation (Cook et al., 2014). The test begins with the deep squat, measuring
bilateral, symmetrical, and functional mobility of the hips, knees, and ankles (McCunn et
al., 2016). It also assesses bilateral and symmetrical mobility of the shoulders by holding
a dowel overhead (Cook et al., 2014). The second test is the hurdle step challenging the
body’s proper stride mechanics, requiring proper coordination and stability of the hips
and torso (Cook et al., 2014). The test also includes single leg stance ability, assessing
bilateral functional mobility and stability of the hips, knees, and ankles (Cook et al.,
2014). The in-line lunge is an attempt to place the body in a stimulated stressed position
to assess hip and ankle mobility and stability, quadriceps flexibility, and knee stability
(Cook et al., 2014). Shoulder mobility is used to assess bilateral and reciprocal shoulder
11
range of motion, combining internal rotation with adduction and external rotations with
abduction. Finally, assessing normal scapular mobility and thoracic spine extension
(Cook et al., 2014). The active straight leg raise is used to determine the ability to
disassociate the lower extremity from the trunk, while maintaining stability in the torso
(Cook et al., 2014). Specifically, active hamstring and gastro-soleus flexibility with
stability in pelvis and core. Next, the trunk stability push-up is used to test the ability of
trunk stability in the sagittal plane with a symmetrical upper extremity push-up (Cook et
al., 2014). Finally, rotary stability is used to challenge proper neuromuscular coordination
and energy transfer from one body segment to another through the torso. Measuring
multi-planar trunk stability during combined upper and lower extremity motion (Cook et
al., 2014).
Scoring of the test involves scoring of each subdivision ranging from zero to
three, with three being the highest possible score (Cook et al., 2014). A score of zero is
given if any pain is experienced during the movement (Cook et al., 2014). A score of one
is given to those who cannot complete or assume the movement position (Cook et al.,
2014). A score of two is given if the movement is incorrectly completed but requires
compensation and a score of three is given when the movement is correctly completed
without compensation (Cook et al., 2014). scores are documented on both the right and
left sides to identify symmetry (Cook et al., 2014). The highest possible total score is
twenty-one and is scored on the minimal standard, not “perfect” movement (Cook et al.,
2014). The scoring is to be used to statistically compare areas of movement concern
throughout intervention/ training programs (Cook et al., 2014).
12
A key concept to understand from this test is the meaning of the test title. The
function is representing the absence of dysfunction with movement quality. The
movement designates what the test is measuring and screen to discern risk of injury. The
screening is meant to be used to determine and identify at risk areas and levels of
competency.
Limitations of Functional Movement Screening
Although FMS is one of the most well-known movement screenings, it includes
limitations. In a meta-analysis on sporting populations, there was a significant
relationship between the number of sports played during high school and the FMS score
(Triplett et al., 2021). The greater number of sport participation, the higher the FMS
score, indicating the increased movement variety directly relates to total scores and
asymmetries (Triplett et al., 2021). The relation between higher total scores and
asymmetries suggests that FMS cannot be used for sport specific movements or indicate
specific injuries. Research on FMS has been advocated to understand why injuries
happen and to determine which participants are at risk for an injury (Bahr, 2016). Yet, a
study done on adolescents using FMS with machine learning strongly suggest that FMS
is not valuable for an average adolescent population with an average age of 16.6 (Karuc
et al., 2021). The predictive value of FMS has been undermined in multiple populations
including athletes, college students, and adults (Triplett et al., 2021, Moore et al., 2019;
Pollen et al., 2018), in some cases even finding a higher risk after performing FMS
(Bennett et al., 2020). Criteria for movement screenings require accurate measurements
in multiple populations. FMS has been tested in elite athletes, collegiate athletes, and
adolescents with inconclusive effectiveness (Pollen et al., 2018). FMS composite scores
13
do not vary despite differences in age and proficiency of sport, even with reportedly
differing injury rates (Pollen et al., 2018). High school athletes on average score lower
than elite athletes, with less injuries occurring in high school athletics than elite athletics
(Pollen et al., 2018). Instead of correlating lower FMS composite scores with increased
injury rates, the higher FMS scores found correlation with increased injury rates, an
inverse relationship to that which was expected (Pollen et al., 2018). FMS, although
popular, is not an accurate measurement of injury prediction.
Fusionetics
Fusionetics ME test is a novel and upcoming assessment. Like FMS, Fusionetics
focuses on seven different movements including four separate areas of focus (Lower
body, upper body, cervical, and trunk/ lumbar) (Cornell & Ebersole, 2018; Eckard et al.,
2018). The seven movements include a double-leg squat, double leg squat with heel lift,
single leg squat, push-up, shoulder motions, cervical spine motions, and trunk/lumbar
motions (Cornell & Ebersole, 2018; Eckard et al., 2018). The test is scored by assessing
individual movements and providing a score from 1-100. The scores are deducted if
compensations are used during specific movements (Cornell & Ebersole, 2018; Eckard et
al., 2018). This screening is proven to overcome limitations suggested from FMS such as
targeting corrective movements in training programming (Cornell & Ebersole, 2018).
Another strength is the increased sensitivity of the test by expanding the scoring from the
total score of twenty-one used in FMS to a scale of 0-100 used in Fusionetics (Cornell &
Ebersole, 2018; Eckard et al., 2018). This expansion allows for the assessment to target
specific deficits in functional movement quality to use corrective exercise intervention
(Cornell & Ebersole, 2018; Eckard et al., 2018). The assessment is also recommended for
14
“excellent” inter-rater reliability for movement quality (Pollen et al, 2018). Fusionetics is
best used for rehabilitation purposes, finding strength in identifying movement quality
improvements (Harris et al., 2019). This screening is still a new test and requires more
research to determine its practicality in educational purposes (Eckard et al., 2018).
15
CHAPTER THREE
Methods
Participants
There were 13 total participants in the study (10 females and 3 males). One
participant dropped out from a non-sports related injury, not associated with the study,
and another dropped out from incompletion of FTP, finishing with a total of 11
participants (8 females and 3 males). Participants were sedentary young adults between
the ages of 18 and 22 enrolled in Baylor University’s LF course, FTP. Participants were
recruited in the first week of classes via class visits. All participants signed an informed
consent form and inclusion/ exclusion criteria form that had been approved by the Baylor
University Institutional Review Board for the Protection of Human Subjects in Research.
All interested participants met the following criteria.
• Baylor students enrolled in FTP
• Age 18 and over
• Must Complete FTP
• Does not exercise more than 3 days or 150 minutes of moderate to vigorous
activity per week (Riebe et al., 2018)
• No musculoskeletal injury limiting movement in the past 5 years

16
Study Sites
All data collection and participant sessions took place in the weight room in
Russell Gym at Baylor University, Waco, TX.
Variables
The independent variables were the timing of the test (pre, mid, and post-test) and
symmetry (left and right). The dependent variable was the ME score.
Fusionetics Movement Efficiency Test
The test was administered according to the guidelines provided by Fusionetics,
LLC (Table 3.1). All participants performed the screening in athletic apparel. Athletic
apparel includes a loose shirt, athletic shorts, and no shoes. Each screening was
performed in the following order: 2-leg squat, 2-leg squat with heel lift, 1-leg squat,
push-up, shoulder movements, trunk movements, and cervical movements (see Table
3.1). Each participant completed 5 reps of the 2-leg squat, 2-leg squat with heel lift, 1-leg
squat, and push-up each sub-test. Any observed compensations were recorded for scoring
purposes. The shoulder movements, trunk and lumbar spine movements, and cervical
movements were performed once for each movement and recorded any observed
compensations for scoring purposes.
ME Test Scoring
When scoring the Fusionetics ME test, the final score is the average of all
subgroup scores out of 100. Each subgroup has a list of compensations to observe, and
the score is decreased based on compensations detected during the subgroup test. The
instructions for all subgroups are described in Table 3.1.

17
Table 3.1.
Fusionetics Movement Efficiency Test Guidelines
Sub-Tests Participant Positioning Tester Instructions/ Participant Actions
2-Leg Squat
Feet shoulder-width apart
Toes pointing straight ahead Perform 5 squats as if sitting into chair
Observe: Front, side, and back views
2-Leg Squat
with Heel
Lift
Elevate heels approximately 2”
Feet shoulder-width apart
Toes pointed straight ahead
Perform 5 squats as if sitting into chair
Observe: Front, side, and back views
1-Leg Squat
(Completed
bilaterally)
Balancing on 1-leg, with hands on
hips
Toes pointing straight ahead
Non-involved foot and leg are
neutral
Perform 5 squats as if sitting into chair
Observe: Front, side, and back views
Push-up
Assume a push-up position
Hands outside shoulder, even with
chest
Head looking at ground, cervical
spine at neutral
Perform 5 push-ups
Observe: Side view
Shoulder
Movements
(4 total
movements
completed
bilaterally)
Standing with back to wall
Feet hip-width apart, arms by sides
Heels, buttocks, shoulders, and back
of head touching wall
1. Flexion: Raise arms straight overhead,
touch thumb to wall
2. Internal rotation: Elbows at 90, rotate
shoulder taking wrists forward toward
mid-line of body
3. External rotation: Elbows at 90, rotate
shoulder taking back of wrist to wall
4. Horizontal abduction: hands together in
front of body, reach back of wrist to wall
All of the above: Observe front and side
views, perform one arm at a time
Trunk
Movements
(2 total
movements
completed
bilaterally)
Standing with back to wall
Feet shoulder-width apart, arms by
sides
Heels, buttocks, shoulders, and back
of head touching wall
Rotation: Individual steps away
from wall, places hands across
shoulders
1. Lateral flexion: side bend and slide hand
down outside of leg to lateral knee joint
line
2. Rotation: Rotate upper body
(maintaining a neural pelvis/ hips) each
direction as far as possible)
All of the above: Observe front and side
views; perform movement in each direction
Cervical
Movements
(2 total
movements
completed
bilaterally)
Feet shoulder-width apart, arms by
sides
Head in neutral position
1. Lateral flexion: Tip head, taking ear to
shoulder
2. Rotation: Rotate head and look over
shoulder
All of the above: Observe front and side
views; Perform movement in each direction
18
2-Leg Squat Compensations
For the 2-leg squat, there are three different views and ten different possible
compensations to look for. Within the foot and ankle, the compensations are either the
foot turns out or flattens. This is viewed from the front. The foot turning out is defined as
any lateral deviation from the starting position. The flattened foot would occur if the
lateral aspect of the foot lifts off the floor. The next compensations involve either varus
or valgus of the knee. The criterion for the knee valgus is the mid-patella moving inside
the big toe. For knee varus, the criterion is the knee is outside of the fifth metatarsal. The
second view is from the side/ lateral view. The first potential compensation is excessive
forward trunk lean. This is characterized by the inability for the participant to keep the
torso and lower leg parallel through the motion of the squat. Another compensation is the
low back arch or low back round. The low back arch is characterized by any movement
into lumbar extension from the starting position. The low back round is defined as an
increased lumbar flexion or posterior pelvic tilt prior to 90 degrees of hip flexion. The
final view is from the rear. The two compensations from this view are asymmetrical
weight shift and heel lifting. The heel lifting compensation is when there is visible space
between the calcaneus and the floor. The asymmetrical weight shift is characterized as
the gross movement of the squat. Whichever side the weight is shifting to, is where the
compensation would be recorded.
2-Leg Squat with Heel Lift Compensations
For the 2-leg squat with heel lift, the compensation criterion is the same as the 2-
leg squat. The only compensation that is not included is the heel of the foot lifting.
19
1-Leg Squat Compensations
The 1-leg squat is observed only in the front view. The first possible
compensation is the foot flattening. The flattened foot is occurring when the lateral aspect
of the foot lifts off the floor. Similar to the 2-leg squat and 2-leg squat with heel lift, the
next two compensation are knee valgus and varus. The criterion for knee valgus is the
mid-patella moving inside the big toe. For knee varus, the criterion is the knee is outside
the fifth metatarsal. Finally, specific to the 1-leg squat, the compensations are an
uncontrolled trunk including flexion, rotation, and/ or hip shift. This first noticeable
movement is a lateral hip shift. This is separate from a valgus movement in the knee.
Additional movements could be movement (either towards or away) of the torso in the
transverse plane. Finally, another movement could potentially be excessive forward
migration of the trunk. This is characterized by the inability for the participant to keep the
torso and lower leg parallel through the motion of the squat. Finally, the final
compensation is the loss of balance. This can be characterized by the hands coming off
the hips or repeated touching of the non-stance foot on the floor at least two or more
times.
Push-up Compensations
There are four separate compensations for the push-up. The first observed
compensation is the knees bend compensation. This is if the participant is not able to
perform all repetitions on their toes. If the participant chooses to perform all repetitions
on their toes and the knees bend towards the ground, it will be recorded as a
compensation. The second compensation is the head moving forward. This is defined as
any deviation from the starting position including the head moving into hyperextension,

20
or head dropping towards the floor. The next compensation is scapular winging. This is
looking for the medial or inferior aspects of the scapula are elevating from the ribcage or
if there is any asymmetrical movement of the scapula. If there is more than one fingers-
breath off the ribcage. Finally, low back arching or stomach protruding is the final
potential compensation.
Shoulder Movement (4 total) Compensations
The shoulder movement has four separate movement patterns: flexion, internal
rotation, external rotation, and horizontal abduction. The common compensation for
shoulder flexion is elbow flexion. The elbow must be locked out during the motion.
Another potential compensation is excessive or early shrugging/ elevation of the
shoulder. Finally, the low back may arch, or ribcage may flare increasing space between
the pelvis and the ribcage. The second movement is shoulder internal rotation. The goal is
to reach the wrist in line medially with the ribcage. A common compensation is anterior
tipping of the scapula to compensate for not reaching the full rotation. The third
movement is external rotation. This is the opposite movement of internal rotation, and the
participant is attempting to touch the back of the wrist to the wall. The compensations are
an inability to reach the wall with a straight wrist and may reach their fingers towards the
wall. Another compensation is a shrugging of the shoulders or rib flare to attempt the
reach their hand back. The final movement is horizontal abduction. A compensation is
the inability to touch the back of hand to wall, elevating or deviation above the shoulder,
bending of the elbow and finally, rotation of the trunk towards the side of rotation.

21
Trunk and Lumbar Spine Movement (2 total) Compensations
The trunk and lumbar spine movements are trunk lateral flexion and trunk
rotation. For trunk lateral flexion the potential compensations are the inability to
complete the movement, any movement outside of the frontal plane including leaning
forward or backwards. Finally, any hip shifting or movement of the opposite foot to
complete the movement. When complete, trunk rotation compensations are the inability
to complete the movement, any movement outside of the trunk to assist with the rotation,
and any movement outside of the transverse plane.
Cervical Movements (2 total) Compensations
The two cervical motions are cervical lateral flexion and cervical rotation.
Compensations for lateral flexion is the inability to reach approximately 45 degrees of
flexion. Other compensations are any accessory movement of the head and neck outside
of the frontal plane or shoulder shrugging. Compensations for cervical rotation are again
inability to complete the movement defined as the lateral side of the mouth reaching the
line of the anterior aspect of the shoulder. Other compensations are excessive flexion of
the head or head extension.
Testing Visits
For the pre-test, participants were tested on the second-class day, before they had
participated in activity for the class. Participants were instructed to wear comfortable
athletic clothing and shoes. During this session the demographics sheet and consent form
were filled out. Each participant was given instructions on how to perform each subgroup
test and then allowed to try the movements prior to the observation period. Each test was
22
observed by one rater, trained through Fusionetics to properly administer the ME test.
The full timeline can be viewed in Table 3.2.
The mid-test was performed following the fourth rotation. The test (Table 3.1)
was performed in the same format as the pre-test. All tests were performed prior to class
activity. The total time for the mid-test was 15 minutes.
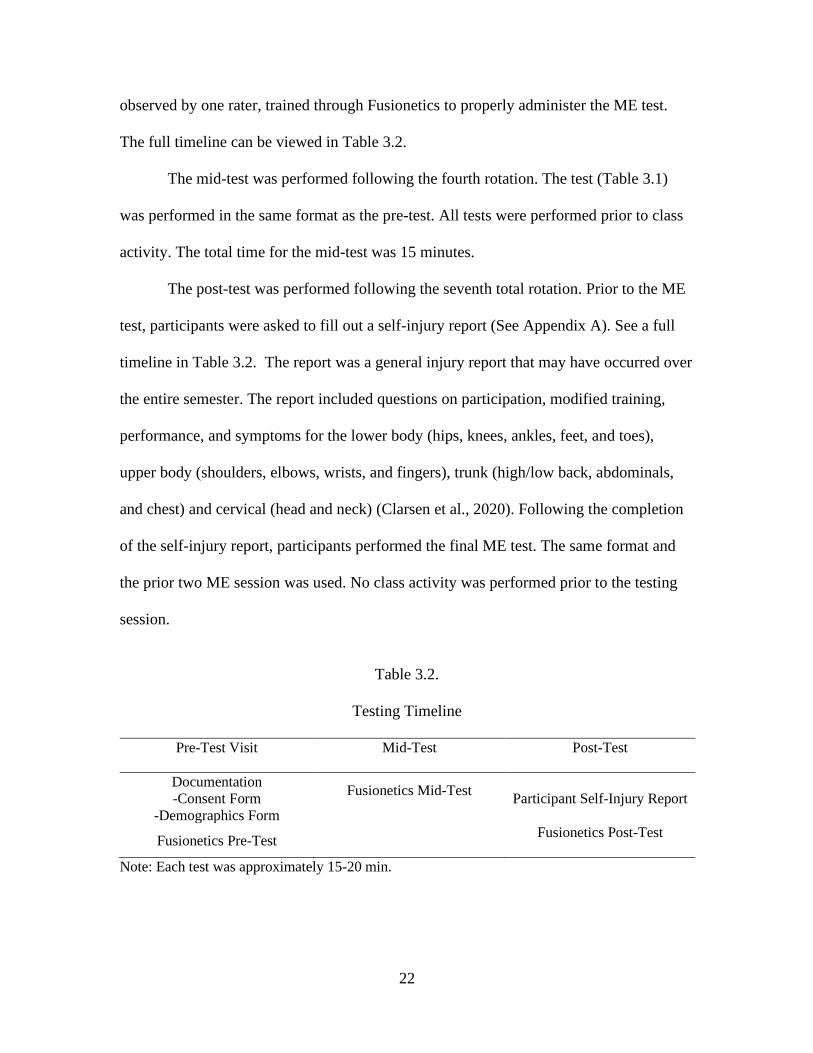
The post-test was performed following the seventh total rotation. Prior to the ME
test, participants were asked to fill out a self-injury report (See Appendix A). See a full
timeline in Table 3.2. The report was a general injury report that may have occurred over
the entire semester. The report included questions on participation, modified training,
performance, and symptoms for the lower body (hips, knees, ankles, feet, and toes),
upper body (shoulders, elbows, wrists, and fingers), trunk (high/low back, abdominals,
and chest) and cervical (head and neck) (Clarsen et al., 2020). Following the completion
of the self-injury report, participants performed the final ME test. The same format and
the prior two ME session was used. No class activity was performed prior to the testing
session.
Table 3.2.
Testing Timeline
Pre-Test Visit Mid-Test Post-Test
Documentation
-Consent Form
-Demographics Form
Fusionetics Mid-Test Participant Self-Injury Report
Fusionetics Pre-TestFusionetics Post-Test
Note: Each test was approximately 15-20 min.
23
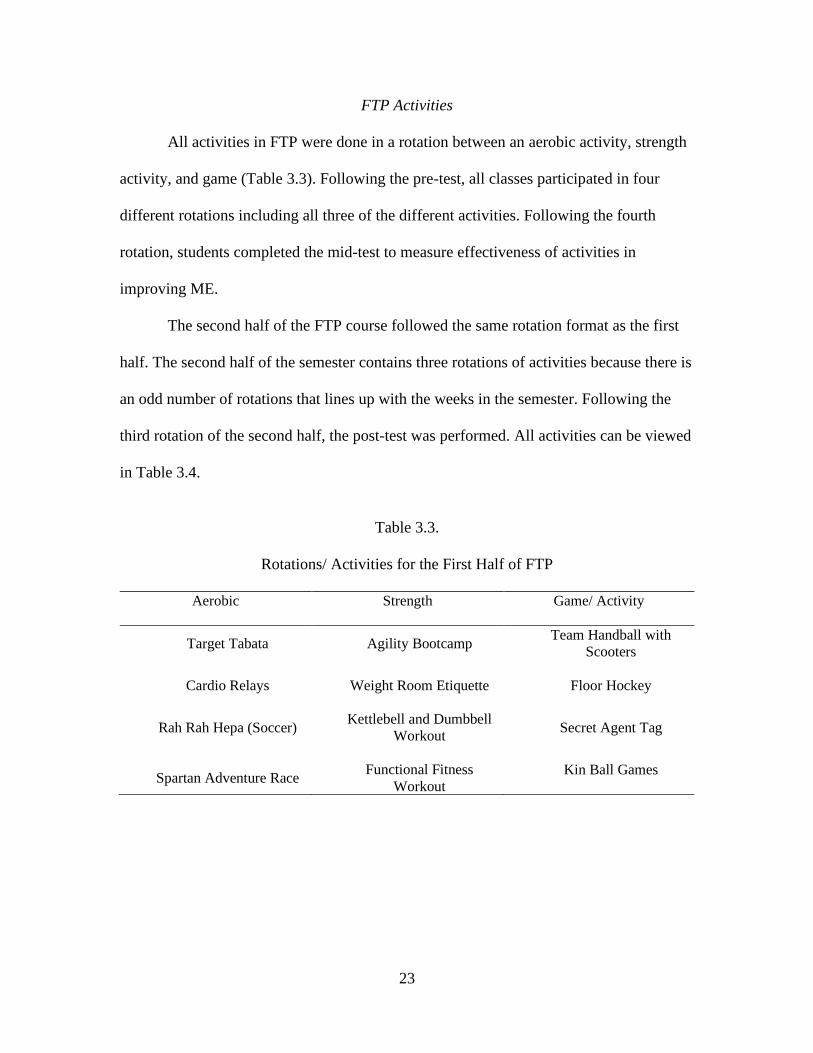
FTP Activities
All activities in FTP were done in a rotation between an aerobic activity, strength
activity, and game (Table 3.3). Following the pre-test, all classes participated in four
different rotations including all three of the different activities. Following the fourth
rotation, students completed the mid-test to measure effectiveness of activities in
improving ME.
The second half of the FTP course followed the same rotation format as the first
half. The second half of the semester contains three rotations of activities because there is
an odd number of rotations that lines up with the weeks in the semester. Following the
third rotation of the second half, the post-test was performed. All activities can be viewed
in Table 3.4.
Table 3.3.
Rotations/ Activities for the First Half of FTP
Aerobic Strength Game/ Activity
Target Tabata Agility Bootcamp Team Handball with
Scooters
Cardio Relays Weight Room Etiquette Floor Hockey
Rah Rah Hepa (Soccer) Kettlebell and Dumbbell
Workout Secret Agent Tag
Spartan Adventure Race Functional Fitness
Workout
Kin Ball Games

24
Table 3.4.
Rotations/ Activities for the Second Half of FTP
Aerobic Strength Game/ Activity
Aerobic Bootcamp Weight Room Workout Team Handball
Free Cardio Day Bands and Bodyweight
Stations Ultimate Frisbee
Baylor Scavenger Hunt Power Yoga Kickball
Data Collection
Data collection occurred in three separate sessions. The inclusion/ exclusion
criteria form was given prior to the first session. During the first session, participants
completed the informed consent form, demographic form including age, gender, height,
and weight and the ME test. This test took place prior to the pre-testing session of the
class. At each following session they performed the same ME test. At the final session,
participants completed the self-injury report (Clarsen et al., 2020) before they performed
the same ME test as the prior two sessions. The self-injury report can be found in
appendix A. The self-injury report has been reported with high internal consistency
proven through a Chronbach’s α of 0.91 (Clarsen et al., 2013). The test was also
considered valid (Jorgenson et al., 2016) and allows for appropriate severity tested
through multiple studies (Jorgenson et al., 2016; Clarsen et al., 2013).
Statistical Analysis
All statistical analysis was performed in SPSS 28. An analysis of variance
(ANOVA) with repeated measures on the test was performed on all ME and subgroups.
A two-way ANOVA with repeated measures was performed on the symmetry scores.
25
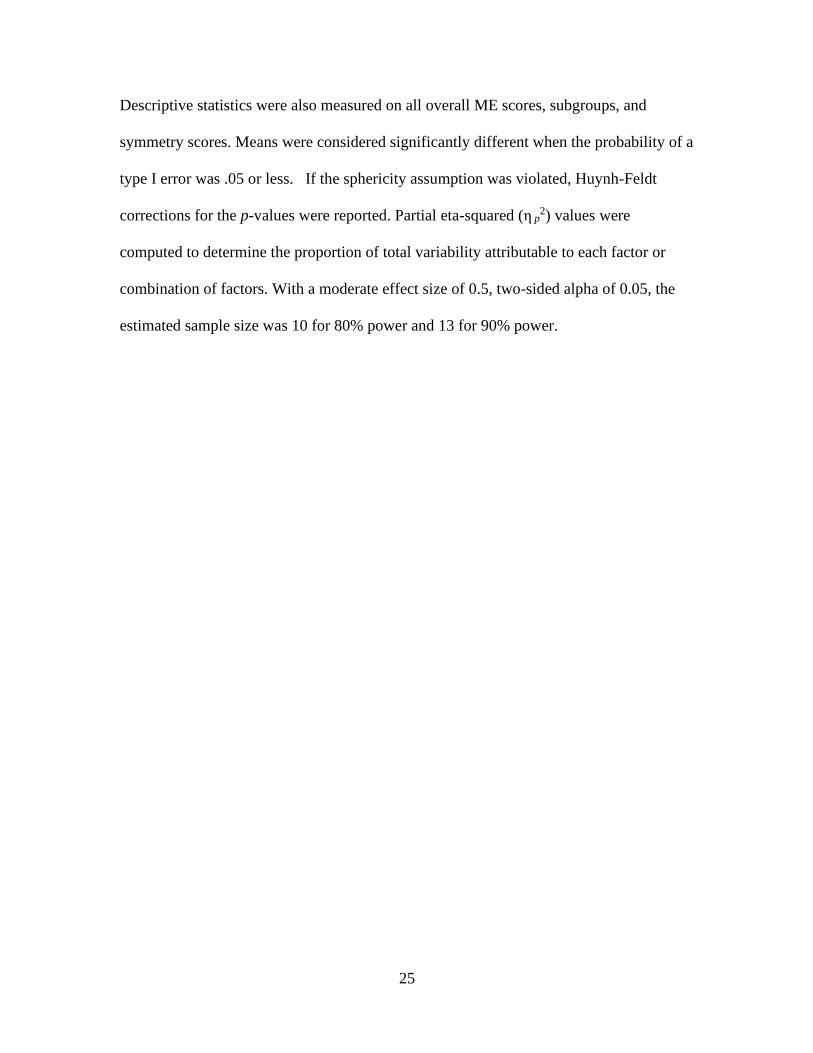
Descriptive statistics were also measured on all overall ME scores, subgroups, and
symmetry scores. Means were considered significantly different when the probability of a
type I error was .05 or less. If the sphericity assumption was violated, Huynh-Feldt
corrections for the p-values were reported. Partial eta-squared (η p2) values were
computed to determine the proportion of total variability attributable to each factor or
combination of factors. With a moderate effect size of 0.5, two-sided alpha of 0.05, the
estimated sample size was 10 for 80% power and 13 for 90% power.
26
CHAPTER FOUR
Results
Participant Characteristics
The participants recruited for this study were sedentary students for a minimum of
three months as defined by ACSM (Riebe et al., 2018). All participants were recruited
from Baylor University’s LF course, FTP. In total, the study included 13 participants.
One participant was removed for not completing the FTP course and another participant
was removed for a non-sports injury unrelated to the study. Of these 11 participants, 3
were men and 8 were women. The baseline anthropometric data describing the 11
participants who completed the study is in Table 4.1.
Table 4.1.
Group Specific Participant Baseline Characteristics.
Participant Baseline Characteristics Men Women
Sample Size (n) 3 8
Age (years) 18.33 ± 0.577 20.13 ± 1.55
Height (cm) 180.67 ± 1.15 163.25 ± 4.2
Body Weight (kg) 73 ± 24.88 63.75 ± 15.42
Note: cm = centimeters; kg = kilograms
27
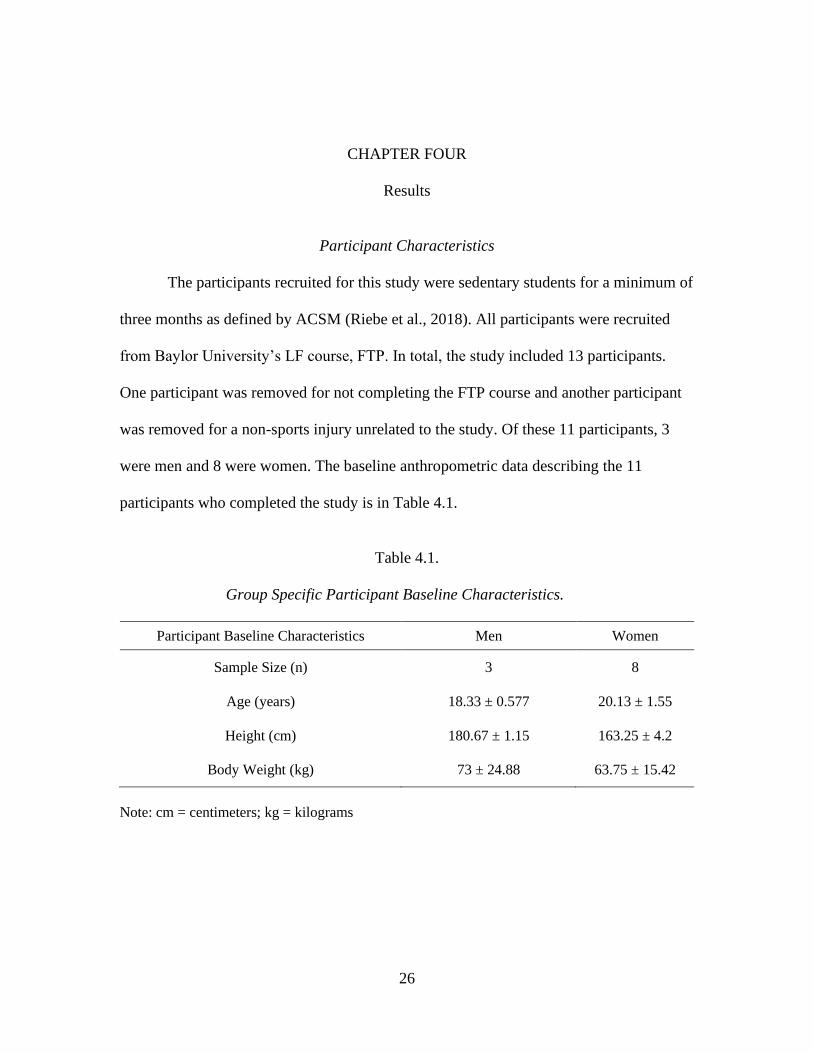
Overall ME Score
Fusionetics ME test is scored on a scale from 1-100 and each score is classified as
good (75-100), moderate (50-74.99) or poor (0-49.99). The pre and mid-test averages for
the overall ME score were classified as good (pre 75.33 ± 6.34, mid 79.87 ± 8.22), and
the post-test average was in the moderate category (post 70.69 ± 4.96). These results are
illustrated in Figure 4.1 and Table 4.1. There was statistically significant effect found on
tests (F = 4.764, P = 0.020, ηp2 = 0.323). The pre and mid-tests were higher than the post-
test (P < 0.05). These results are also shown in Table 4.2.
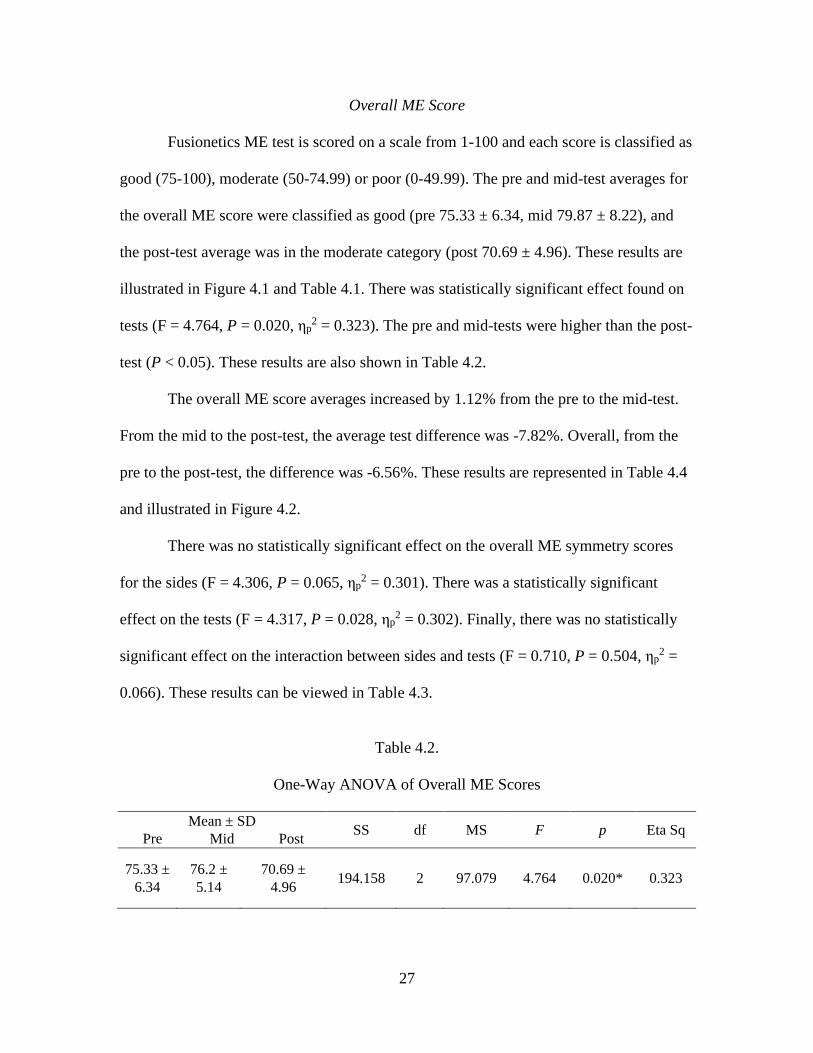
The overall ME score averages increased by 1.12% from the pre to the mid-test.
From the mid to the post-test, the average test difference was -7.82%. Overall, from the
pre to the post-test, the difference was -6.56%. These results are represented in Table 4.4
and illustrated in Figure 4.2.
There was no statistically significant effect on the overall ME symmetry scores
for the sides (F = 4.306, P = 0.065, ηp2 = 0.301). There was a statistically significant
effect on the tests (F = 4.317, P = 0.028, ηp2 = 0.302). Finally, there was no statistically
significant effect on the interaction between sides and tests (F = 0.710, P = 0.504, ηp2 =
0.066). These results can be viewed in Table 4.3.
Table 4.2.
One-Way ANOVA of Overall ME Scores
Mean ± SD SS df MS F p Eta Sq Pre Mid Post
75.33 ±
6.34
76.2 ±
5.14
70.69 ±
4.96 194.158 2 97.079 4.764 0.020* 0.323
28
Figure 4.1. Comparison of Overall ME Test Scores
Table 4.3.
Overall ME Symmetry Between Left and Right
Variable Source SS df MS F p Eta Sq
Symmetry
Side 178.6 1 178.56 4.306 0.065 0.301
Test 440.153 2 220.08 4.317 0.028* 0.302
Side * test 47.306 2 23.653 0.710 0.504 0.066
Table 4.4
Percentage of Change Between Tests
Test Percentage of Change
Pre to Mid-Test 1.17%
Mid to Post-Test -7.82%
Pre to Post-Test -6.56%
0
10
20
30
40
50
60
70
80
90
100
1 2 3 4 5 6 7 8 9 10 11
To
tal
ME
Sco
re
Participants
Pre Mid Post
29
Figure 4.2. Percentage of Change Between Overall ME Test Score Averages
Note: The trendline represents the percentage of change between tests.
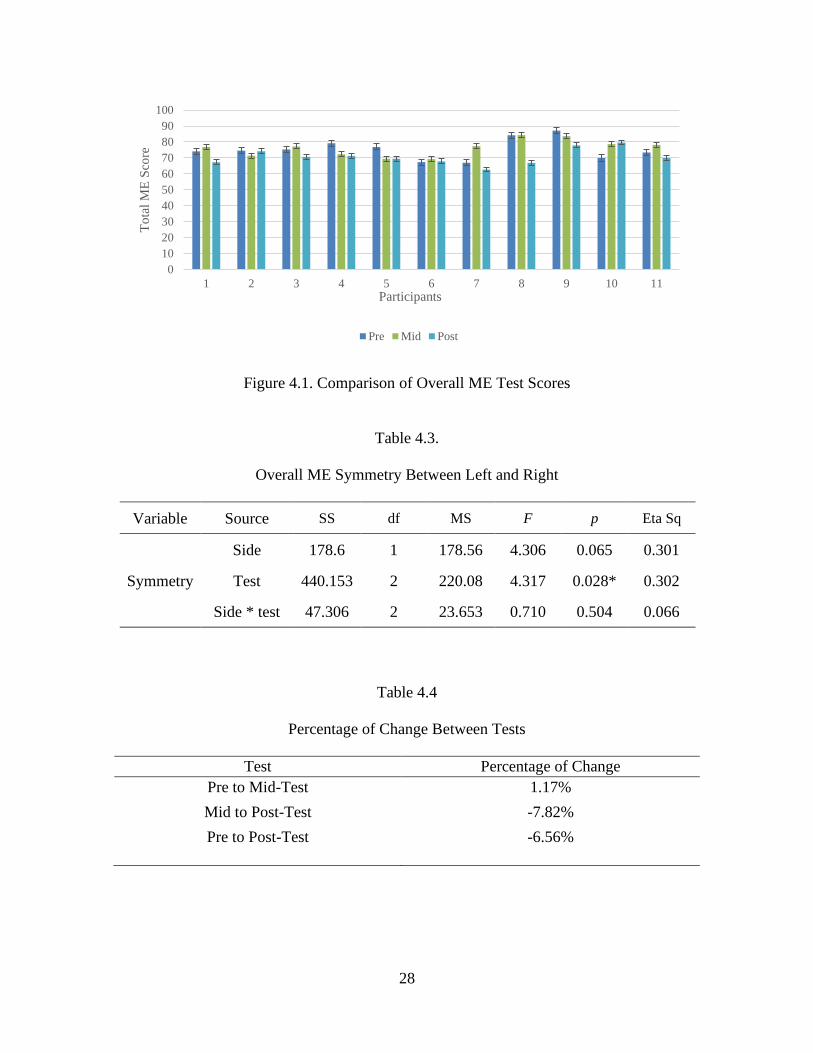
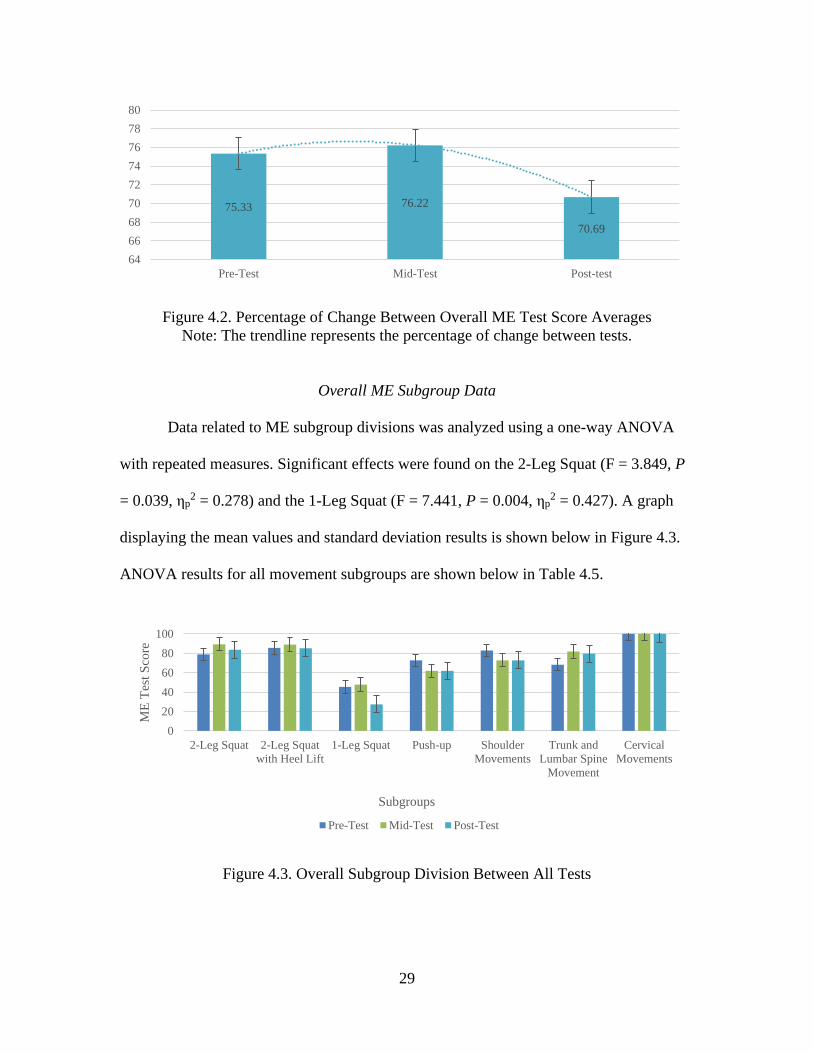
Overall ME Subgroup Data
Data related to ME subgroup divisions was analyzed using a one-way ANOVA
with repeated measures. Significant effects were found on the 2-Leg Squat (F = 3.849, P
= 0.039, ηp2 = 0.278) and the 1-Leg Squat (F = 7.441, P = 0.004, ηp
2 = 0.427). A graph
displaying the mean values and standard deviation results is shown below in Figure 4.3.
ANOVA results for all movement subgroups are shown below in Table 4.5.
Figure 4.3. Overall Subgroup Division Between All Tests
75.33 76.22
70.69
64
66
68
70
72
74
76
78
80
Pre-Test Mid-Test Post-test
0
20
40
60
80
100
2-Leg Squat 2-Leg Squat
with Heel Lift
1-Leg Squat Push-up Shoulder
Movements
Trunk and
Lumbar Spine
Movement
Cervical
Movements
ME
Tes
t S
core
Subgroups
Pre-Test Mid-Test Post-Test

30
Table 4.5.
Subgroup One-Way ANOVA with Repeated Measures Results
Subgroup SS df MS F p Eta Sq
2-Leg Squat 596.32 2 298.16 3.849 0.039* 0.278
2-Leg Squat with Heel Lift 92.645 2 46.322 0.752 0.484 0.070
1-Leg Squat 2765.3 2 1382.65 7.441 0.004* 0.427
Push-Up 872.727 2 436.364 1.440 0.260 0.126
Shoulder Movements 767.045 2 383.523 2.404 0.116 0.194
Trunk/ Lumbar Spine
Movements 1174.242 2 587.121 1.270 0.302 0.113
Cervical Movements 0 2 0 - - -
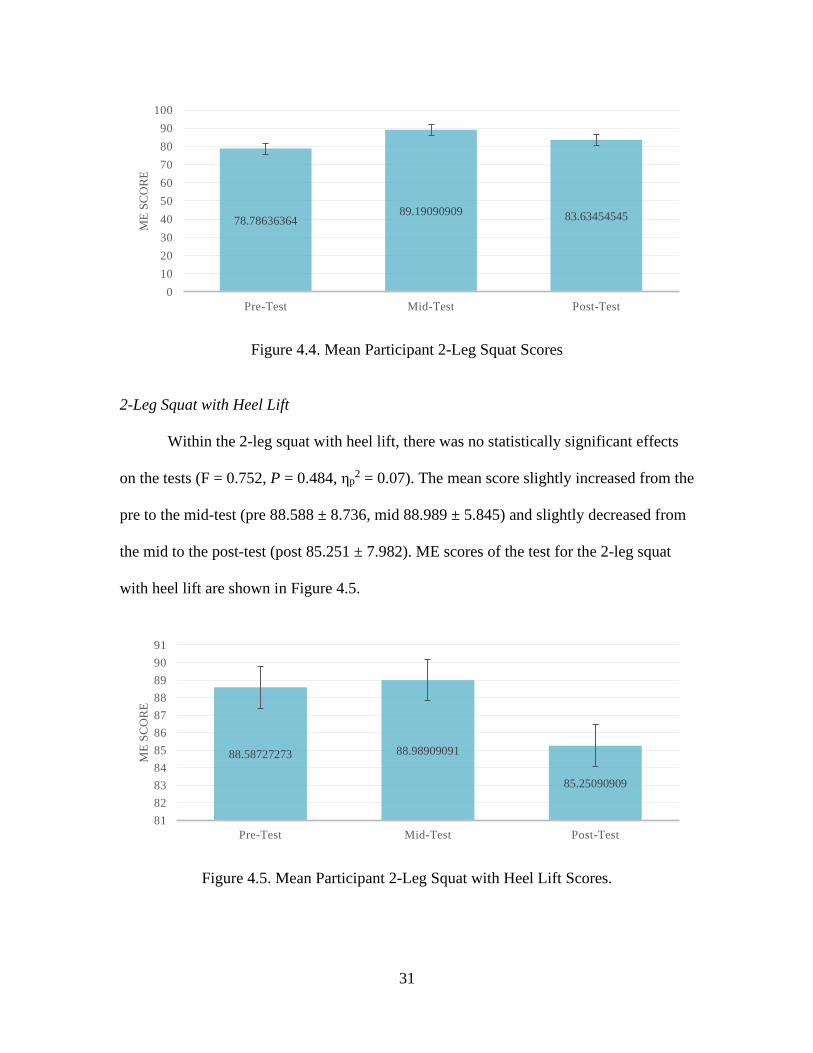
2-Leg Squat
Within the 2-leg squat the variance between tests was statistically significant (F =
3.849, P = 0.039, ηp2 = 0.278). The mid-test was higher than the pre-test (P < 0.05). The
mean score increased from the pre to the mid-test (pre 78.786 ± 10.883, mid 89.19 ±
6.906) and decreased from the mid to the post-test (post, 83.635 ± 11.802). ME scores of
the test for the 2-leg squat are shown in Figure 4.4.
31
Figure 4.4. Mean Participant 2-Leg Squat Scores
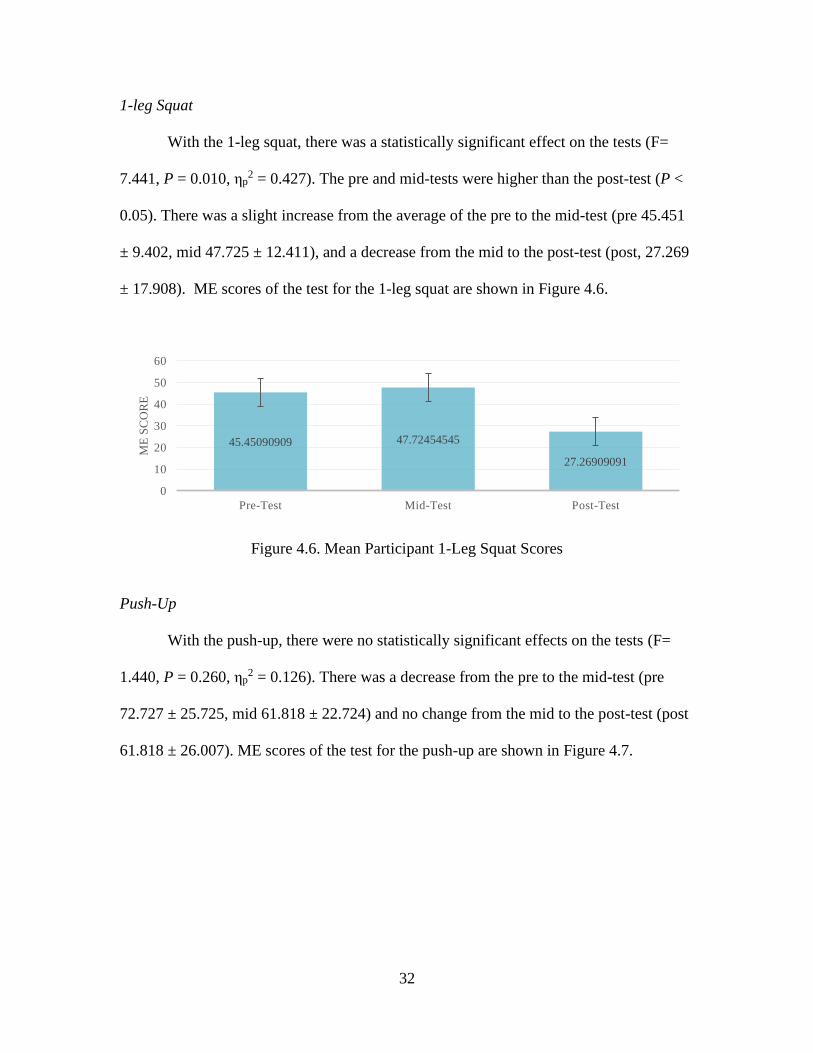
2-Leg Squat with Heel Lift
Within the 2-leg squat with heel lift, there was no statistically significant effects
on the tests (F = 0.752, P = 0.484, ηp2 = 0.07). The mean score slightly increased from the
pre to the mid-test (pre 88.588 ± 8.736, mid 88.989 ± 5.845) and slightly decreased from
the mid to the post-test (post 85.251 ± 7.982). ME scores of the test for the 2-leg squat
with heel lift are shown in Figure 4.5.
Figure 4.5. Mean Participant 2-Leg Squat with Heel Lift Scores.
78.7863636489.19090909 83.63454545
0
10
20
30
40
50
60
70
80
90
100
Pre-Test Mid-Test Post-Test
ME
SC
OR
E
88.58727273 88.98909091
85.25090909
81
82
83
84
85
86
87
88
89
90
91
Pre-Test Mid-Test Post-Test
ME
SC
OR
E
32
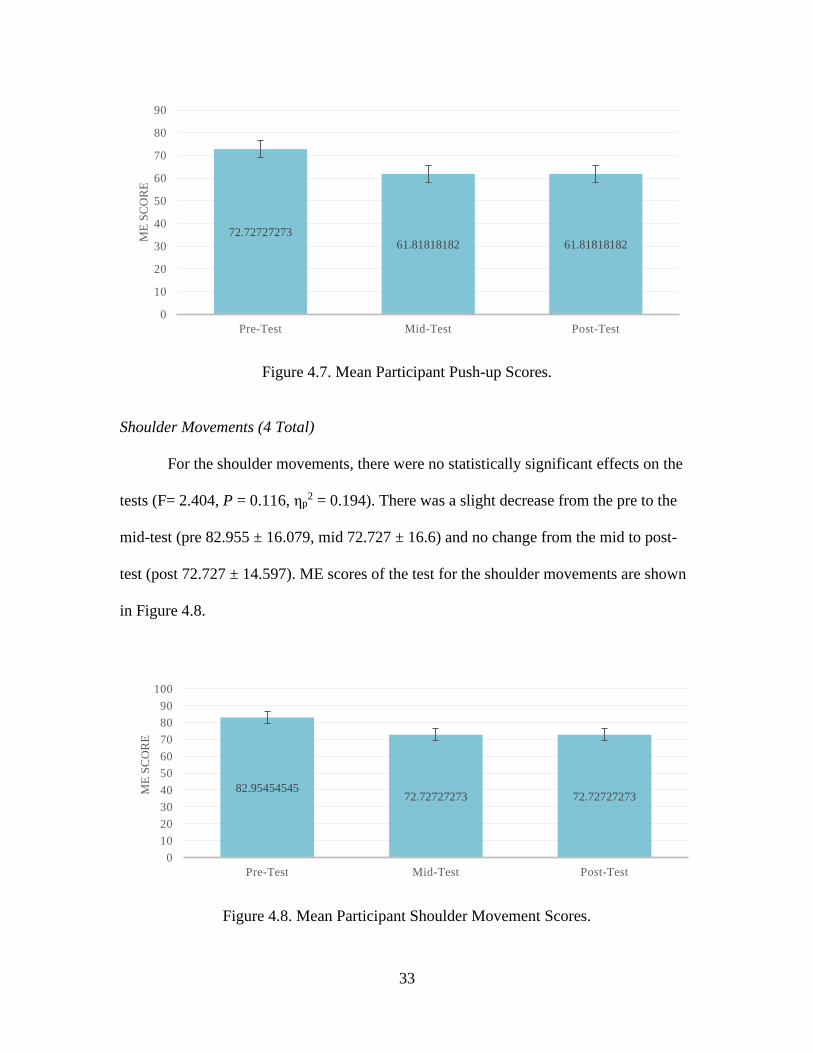
1-leg Squat
With the 1-leg squat, there was a statistically significant effect on the tests (F=
7.441, P = 0.010, ηp2 = 0.427). The pre and mid-tests were higher than the post-test (P <
0.05). There was a slight increase from the average of the pre to the mid-test (pre 45.451
± 9.402, mid 47.725 ± 12.411), and a decrease from the mid to the post-test (post, 27.269
± 17.908). ME scores of the test for the 1-leg squat are shown in Figure 4.6.
Figure 4.6. Mean Participant 1-Leg Squat Scores
Push-Up
With the push-up, there were no statistically significant effects on the tests (F=
1.440, P = 0.260, ηp2 = 0.126). There was a decrease from the pre to the mid-test (pre
72.727 ± 25.725, mid 61.818 ± 22.724) and no change from the mid to the post-test (post
61.818 ± 26.007). ME scores of the test for the push-up are shown in Figure 4.7.
45.45090909 47.72454545
27.26909091
0
10
20
30
40
50
60
Pre-Test Mid-Test Post-Test
ME
SC
OR
E
33
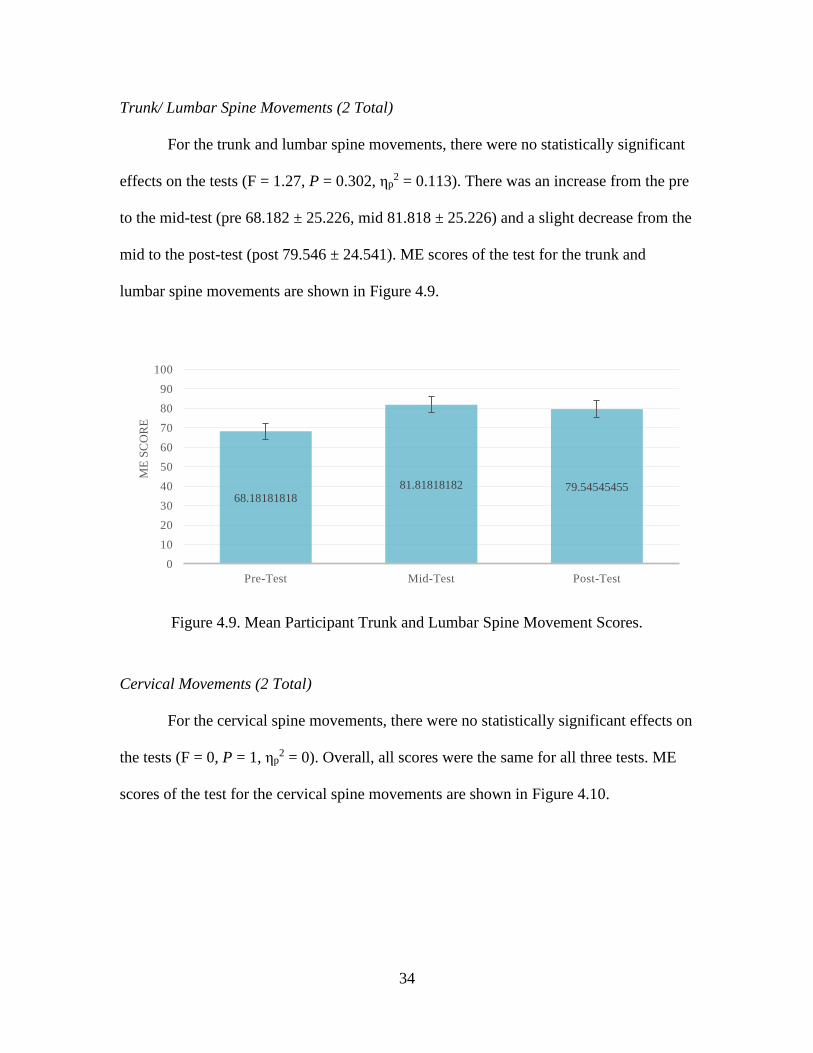
Figure 4.7. Mean Participant Push-up Scores.
Shoulder Movements (4 Total)
For the shoulder movements, there were no statistically significant effects on the
tests (F= 2.404, P = 0.116, ηp2 = 0.194). There was a slight decrease from the pre to the
mid-test (pre 82.955 ± 16.079, mid 72.727 ± 16.6) and no change from the mid to post-
test (post 72.727 ± 14.597). ME scores of the test for the shoulder movements are shown
in Figure 4.8.
Figure 4.8. Mean Participant Shoulder Movement Scores.
72.7272727361.81818182 61.81818182
0
10
20
30
40
50
60
70
80
90
Pre-Test Mid-Test Post-Test
ME
SC
OR
E
82.9545454572.72727273 72.72727273
0
10
20
30
40
50
60
70
80
90
100
Pre-Test Mid-Test Post-Test
ME
SC
OR
E
34
Trunk/ Lumbar Spine Movements (2 Total)
For the trunk and lumbar spine movements, there were no statistically significant
effects on the tests (F = 1.27, P = 0.302, ηp2 = 0.113). There was an increase from the pre
to the mid-test (pre 68.182 ± 25.226, mid 81.818 ± 25.226) and a slight decrease from the
mid to the post-test (post 79.546 ± 24.541). ME scores of the test for the trunk and
lumbar spine movements are shown in Figure 4.9.
Figure 4.9. Mean Participant Trunk and Lumbar Spine Movement Scores.
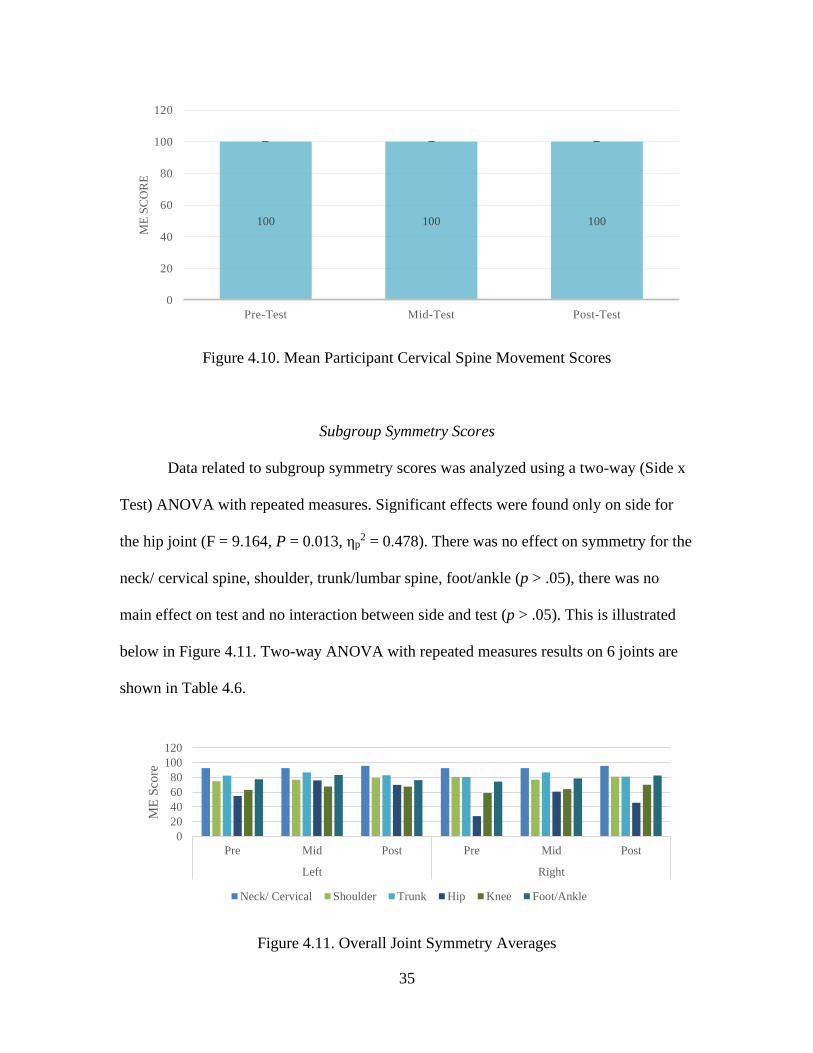
Cervical Movements (2 Total)
For the cervical spine movements, there were no statistically significant effects on
the tests (F = 0, P = 1, ηp2 = 0). Overall, all scores were the same for all three tests. ME
scores of the test for the cervical spine movements are shown in Figure 4.10.
68.1818181881.81818182 79.54545455
0
10
20
30
40
50
60
70
80
90
100
Pre-Test Mid-Test Post-Test
ME
SC
OR
E
35
Figure 4.10. Mean Participant Cervical Spine Movement Scores
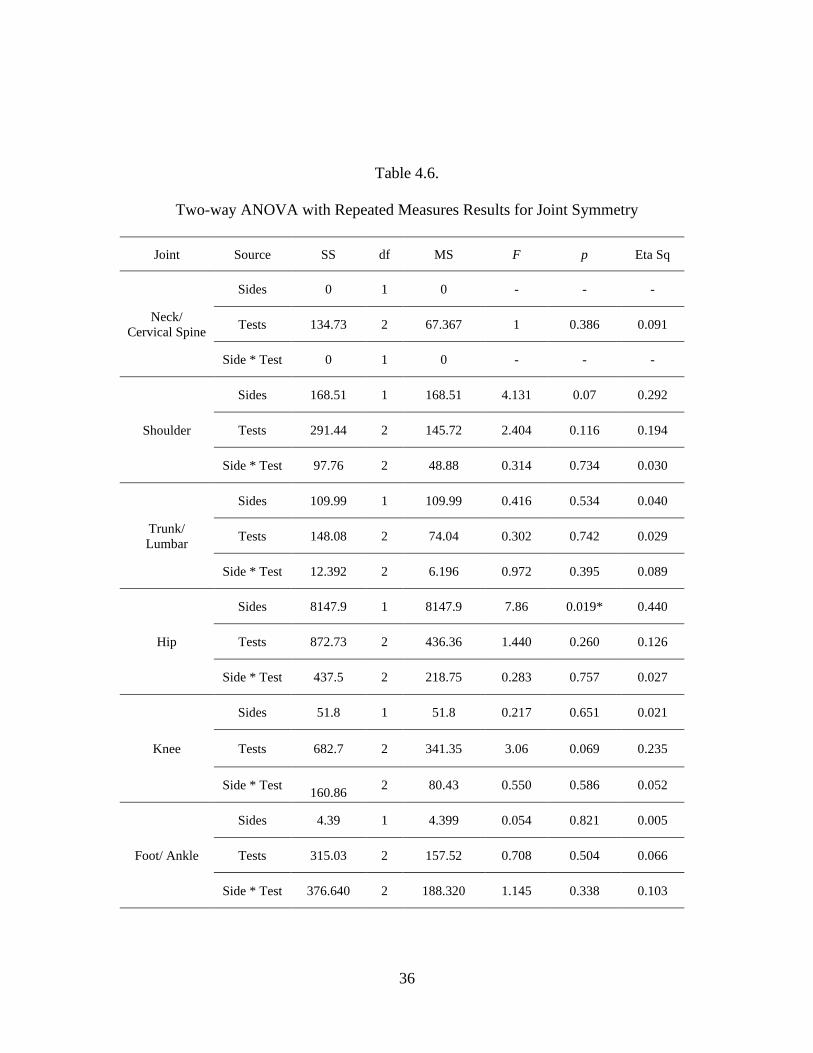
Subgroup Symmetry Scores
Data related to subgroup symmetry scores was analyzed using a two-way (Side x
Test) ANOVA with repeated measures. Significant effects were found only on side for
the hip joint (F = 9.164, P = 0.013, ηp2 = 0.478). There was no effect on symmetry for the
neck/ cervical spine, shoulder, trunk/lumbar spine, foot/ankle (p > .05), there was no
main effect on test and no interaction between side and test (p > .05). This is illustrated
below in Figure 4.11. Two-way ANOVA with repeated measures results on 6 joints are
shown in Table 4.6.
Figure 4.11. Overall Joint Symmetry Averages
100 100 100
0
20
40
60
80
100
120
Pre-Test Mid-Test Post-Test
ME
SC
OR
E
0
20
40
60
80
100
120
Pre Mid Post Pre Mid Post
Left Right
ME
Sco
re
Neck/ Cervical Shoulder Trunk Hip Knee Foot/Ankle
36
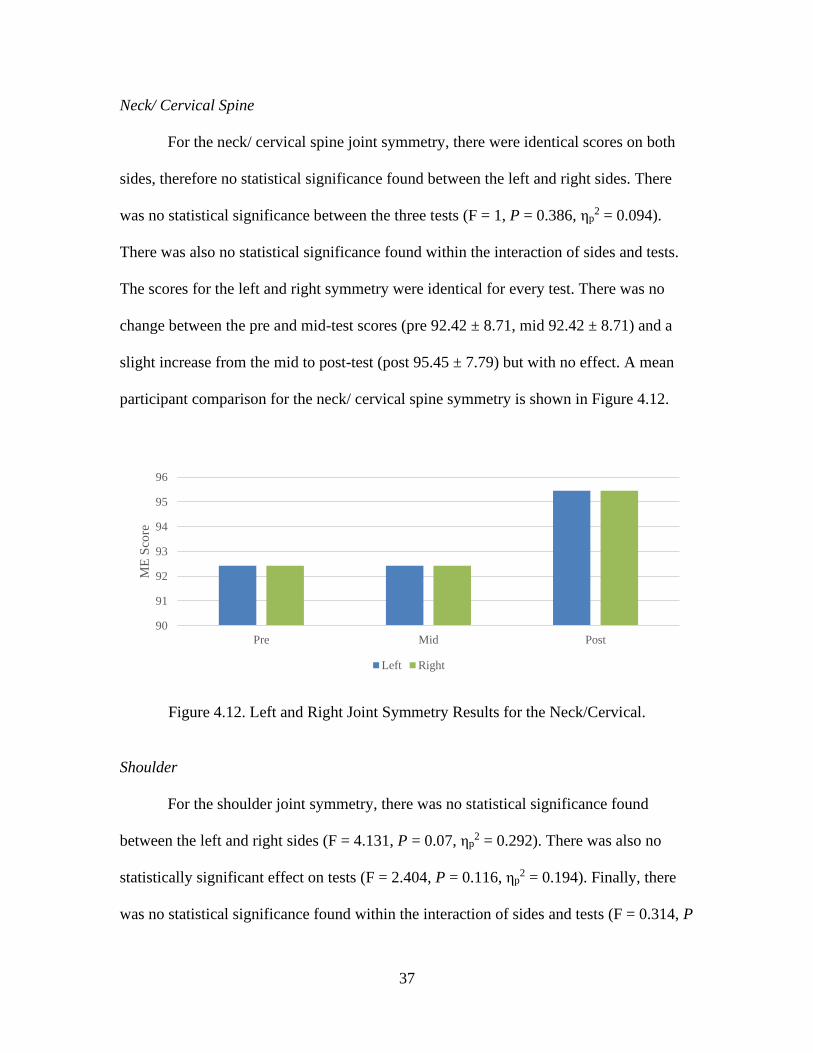
Table 4.6.
Two-way ANOVA with Repeated Measures Results for Joint Symmetry
Joint Source SS df MS F p Eta Sq
Neck/
Cervical Spine
Sides 0 1 0 - - -
Tests 134.73 2 67.367 1 0.386 0.091
Side * Test 0 1 0 - - -
Shoulder
Sides 168.51 1 168.51 4.131 0.07 0.292
Tests 291.44 2 145.72 2.404 0.116 0.194
Side * Test 97.76 2 48.88 0.314 0.734 0.030
Trunk/
Lumbar
Sides 109.99 1 109.99 0.416 0.534 0.040
Tests 148.08 2 74.04 0.302 0.742 0.029
Side * Test 12.392 2 6.196 0.972 0.395 0.089
Hip
Sides 8147.9 1 8147.9 7.86 0.019* 0.440
Tests 872.73 2 436.36 1.440 0.260 0.126
Side * Test 437.5 2 218.75 0.283 0.757 0.027
Knee
Sides 51.8 1 51.8 0.217 0.651 0.021
Tests 682.7 2 341.35 3.06 0.069 0.235
Side * Test 160.86
2 80.43 0.550 0.586 0.052
Foot/ Ankle
Sides 4.39 1 4.399 0.054 0.821 0.005
Tests 315.03 2 157.52 0.708 0.504 0.066
Side * Test 376.640 2 188.320 1.145 0.338 0.103
37
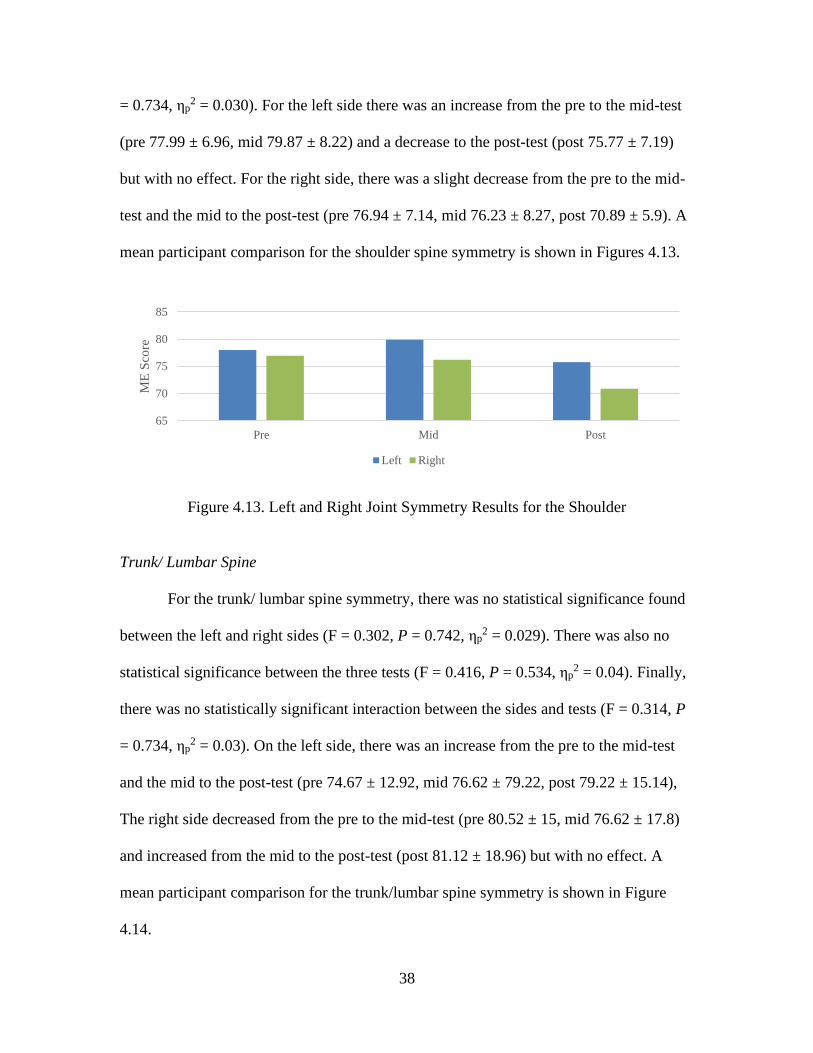
Neck/ Cervical Spine
For the neck/ cervical spine joint symmetry, there were identical scores on both
sides, therefore no statistical significance found between the left and right sides. There
was no statistical significance between the three tests (F = 1, P = 0.386, ηp2 = 0.094).
There was also no statistical significance found within the interaction of sides and tests.
The scores for the left and right symmetry were identical for every test. There was no
change between the pre and mid-test scores (pre 92.42 ± 8.71, mid 92.42 ± 8.71) and a
slight increase from the mid to post-test (post 95.45 ± 7.79) but with no effect. A mean
participant comparison for the neck/ cervical spine symmetry is shown in Figure 4.12.
Figure 4.12. Left and Right Joint Symmetry Results for the Neck/Cervical.
Shoulder
For the shoulder joint symmetry, there was no statistical significance found
between the left and right sides (F = 4.131, P = 0.07, ηp2 = 0.292). There was also no
statistically significant effect on tests (F = 2.404, P = 0.116, ηp2 = 0.194). Finally, there
was no statistical significance found within the interaction of sides and tests (F = 0.314, P
90
91
92
93
94
95
96
Pre Mid Post
ME
Sco
re
Left Right
38
= 0.734, ηp2 = 0.030). For the left side there was an increase from the pre to the mid-test
(pre 77.99 ± 6.96, mid 79.87 ± 8.22) and a decrease to the post-test (post 75.77 ± 7.19)
but with no effect. For the right side, there was a slight decrease from the pre to the mid-
test and the mid to the post-test (pre 76.94 ± 7.14, mid 76.23 ± 8.27, post 70.89 ± 5.9). A
mean participant comparison for the shoulder spine symmetry is shown in Figures 4.13.
Figure 4.13. Left and Right Joint Symmetry Results for the Shoulder
Trunk/ Lumbar Spine
For the trunk/ lumbar spine symmetry, there was no statistical significance found
between the left and right sides (F = 0.302, P = 0.742, ηp2 = 0.029). There was also no
statistical significance between the three tests (F = 0.416, P = 0.534, ηp2 = 0.04). Finally,
there was no statistically significant interaction between the sides and tests (F = 0.314, P
= 0.734, ηp2 = 0.03). On the left side, there was an increase from the pre to the mid-test
and the mid to the post-test (pre 74.67 ± 12.92, mid 76.62 ± 79.22, post 79.22 ± 15.14),
The right side decreased from the pre to the mid-test (pre 80.52 ± 15, mid 76.62 ± 17.8)
and increased from the mid to the post-test (post 81.12 ± 18.96) but with no effect. A
mean participant comparison for the trunk/lumbar spine symmetry is shown in Figure
4.14.
65
70
75
80
85
Pre Mid Post
ME
Sco
re
Left Right
39
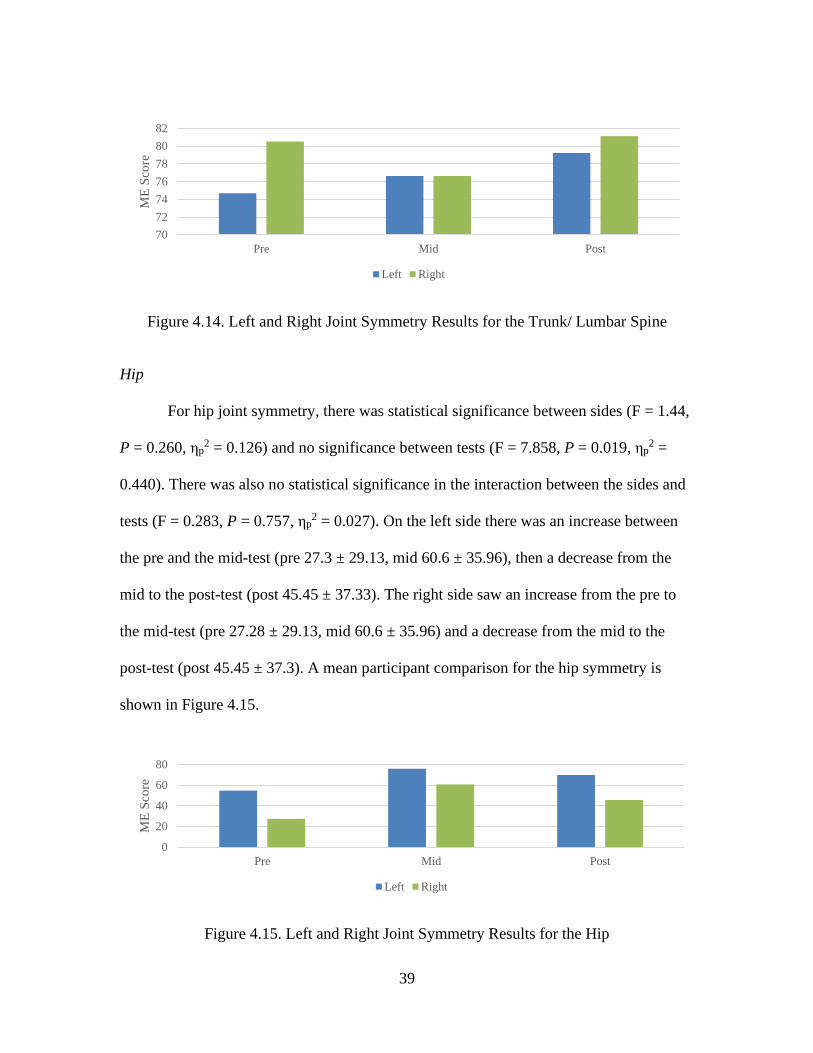
Figure 4.14. Left and Right Joint Symmetry Results for the Trunk/ Lumbar Spine
Hip
For hip joint symmetry, there was statistical significance between sides (F = 1.44,
P = 0.260, ηp2 = 0.126) and no significance between tests (F = 7.858, P = 0.019, ηp
2 =
0.440). There was also no statistical significance in the interaction between the sides and
tests (F = 0.283, P = 0.757, ηp2 = 0.027). On the left side there was an increase between
the pre and the mid-test (pre 27.3 ± 29.13, mid 60.6 ± 35.96), then a decrease from the
mid to the post-test (post 45.45 ± 37.33). The right side saw an increase from the pre to
the mid-test (pre 27.28 ± 29.13, mid 60.6 ± 35.96) and a decrease from the mid to the
post-test (post 45.45 ± 37.3). A mean participant comparison for the hip symmetry is
shown in Figure 4.15.
Figure 4.15. Left and Right Joint Symmetry Results for the Hip
70
72
74
76
78
80
82
Pre Mid Post
ME
Sco
re
Left Right
0
20
40
60
80
Pre Mid Post
ME
Sco
re
Left Right
40
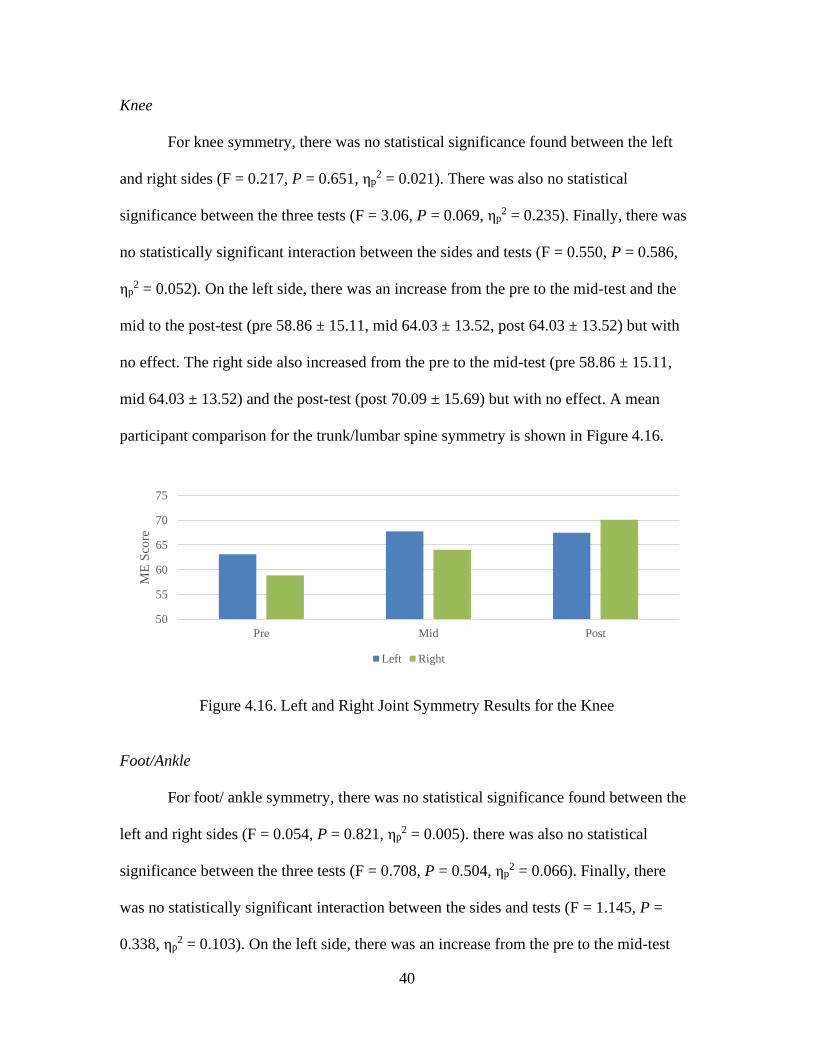
Knee
For knee symmetry, there was no statistical significance found between the left
and right sides (F = 0.217, P = 0.651, ηp2 = 0.021). There was also no statistical
significance between the three tests (F = 3.06, P = 0.069, ηp2 = 0.235). Finally, there was
no statistically significant interaction between the sides and tests (F = 0.550, P = 0.586,
ηp2 = 0.052). On the left side, there was an increase from the pre to the mid-test and the
mid to the post-test (pre 58.86 ± 15.11, mid 64.03 ± 13.52, post 64.03 ± 13.52) but with
no effect. The right side also increased from the pre to the mid-test (pre 58.86 ± 15.11,
mid 64.03 ± 13.52) and the post-test (post 70.09 ± 15.69) but with no effect. A mean
participant comparison for the trunk/lumbar spine symmetry is shown in Figure 4.16.
Figure 4.16. Left and Right Joint Symmetry Results for the Knee
Foot/Ankle
For foot/ ankle symmetry, there was no statistical significance found between the
left and right sides (F = 0.054, P = 0.821, ηp2 = 0.005). there was also no statistical
significance between the three tests (F = 0.708, P = 0.504, ηp2 = 0.066). Finally, there
was no statistically significant interaction between the sides and tests (F = 1.145, P =
0.338, ηp2 = 0.103). On the left side, there was an increase from the pre to the mid-test
50
55
60
65
70
75
Pre Mid Post
ME
Sco
re
Left Right
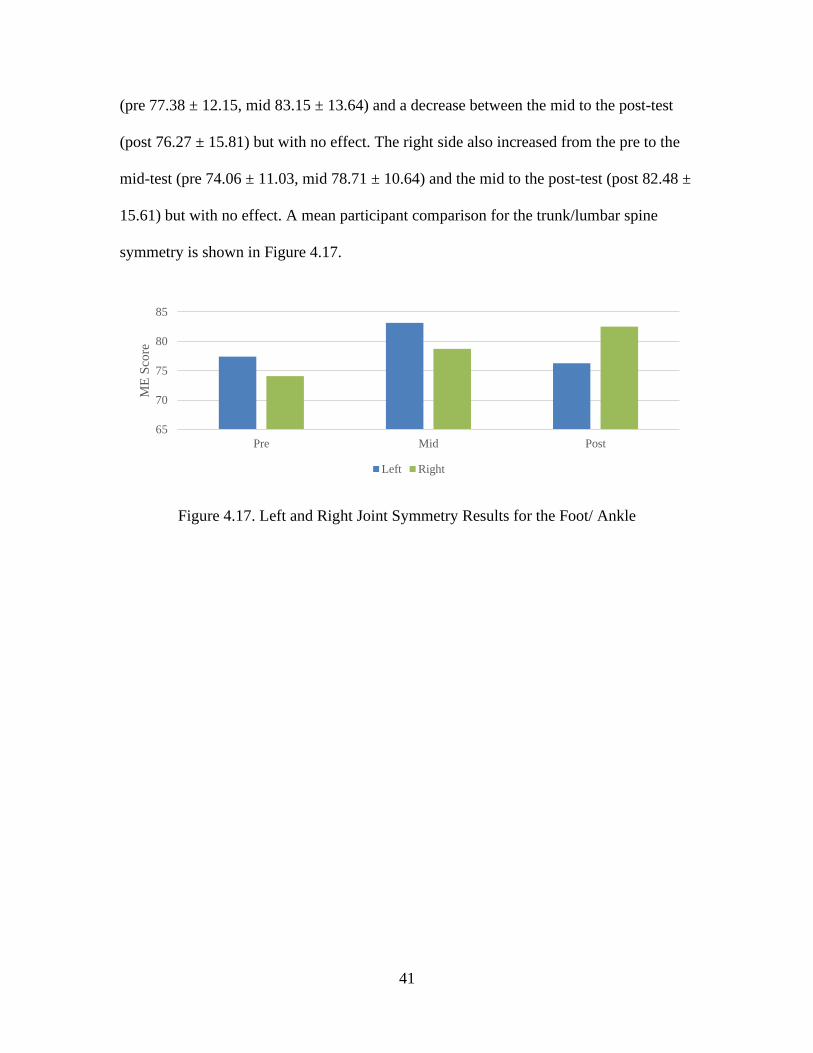
41
(pre 77.38 ± 12.15, mid 83.15 ± 13.64) and a decrease between the mid to the post-test
(post 76.27 ± 15.81) but with no effect. The right side also increased from the pre to the
mid-test (pre 74.06 ± 11.03, mid 78.71 ± 10.64) and the mid to the post-test (post 82.48 ±
15.61) but with no effect. A mean participant comparison for the trunk/lumbar spine
symmetry is shown in Figure 4.17.
Figure 4.17. Left and Right Joint Symmetry Results for the Foot/ Ankle
65
70
75
80
85
Pre Mid Post
ME
Sco
re
Left Right

42
CHAPTER FIVE
Discussion
Introduction
The purpose of this study was to determine if a Fusionetics movement efficiency
test could be used to determine the effectiveness of lifetime fitness (LF) course activities
in sedentary university students. Specifically, the goal was to determine how effective
activities in FTP at Baylor University are at improving movement efficiency (ME).
Statistical significance was found within the three tests of the overall ME scores, the tests
of the overall symmetry, subgroups of the 2-leg squat and the 1 leg-squat, and between
right and left symmetry of the hip joint.
Overall ME Scores
The main purpose of this study was to determine how effective FTP activities at
Baylor University are at improving ME. Significance was found within the tests of the
overall ME scores (see Table 4.2). The average ME score increased from the pre to the
mid-test and decreased from the mid to the post-test. The pre and the mid-test scored
were placed the good category and the post-test scores declined into the moderate
category according to categorization specified by Fusionetics. Despite the participants
representing sedentary college students, their results did not differ from athletic
43
populations also averaging on the cusp of the good and moderate categories (Quick-
Royal, 2020; Cornell & Ebersole, 2018). Between the pre and the mid-test, the average
increased by an average of 1.59% ± 8.02 based on the amount and focus of activities in
class while the post-test decreased by an average of -7.82% ± 7.85 from a greater
percentage of endurance-based activities compared to strength-based.
One explanation for these results is the types of activities used in FTP (See Tables
3.3 and 3.4). In the first six weeks of the semester the students completed a Tabata
workout, agility bootcamp, cardio relays, weight room basics (Hinge, Squat, and Bench
Press), a running activity, kettlebell/ dumbbell workout, an obstacle course, another
weight room, and 4 separate aerobic games (Table 3.3). These activities were between
30-45 minutes long and the students were involved two days a week either Monday and
Wednesday or Tuesday and Thursday. The strength workouts included some of the same
movements that the ME test uses such as squatting and push-ups. This increasing
familiarity with the movements may have contributed to the increase in overall ME
scores from the pre to the mid-test. On the other hand, the last six weeks of class did not
contain as many of these types of workouts. The second half of the semester included a
bootcamp workout (aerobic), weight room day, free cardio day (walk, run, bike, or
elliptical), resistance bands workout, outdoor aerobic walking, power yoga, and again,
four aerobic games (see Table 3.4). The aerobic activities did not include as much
strength or similar movements as the first half of the semester. The strength workouts
contained some of the same movements, but they were less common due to less class
periods in the second half. The focus of the second half schedule was endurance based
compared to the strength focus of the first half. Knowing this, the significance of the
44
types of activities in physical activity courses is important to determine the ME in
sedentary university students. Strength style activities improved ME scores at a greater
rate than aerobic focused activities. Another interesting result is the degree to which the
ME scores improved and worsened. There was a slight improvement in ME scores after
six weeks of activity, two days a week. However, there was a greater decrement in ME
scores with different activities despite same length of training. Physical activity was still
occurring, but the type of the activity may determine the ME’s rate of change. One
purpose of intervention programs is to target and improve specific movement and
muscular deficits (Cornell & Ebersole, 2018; Eckard et al., 2018). Fusionetics offers a
two-part program including a ME test and intervention program. The program
recommended by Fusionetics was not used in this study but may be effective for future
research.
Regarding the overall ME symmetry, there were no statistically significant effects
on side or interaction between test and side. There was a statistically significant effect on
the tests. The overall ME symmetry scores increased from the pre to the mid-test and then
decreased with the post-test. Overall right symmetry scores saw a slight decrease from
the pre to the mid-test and a larger decrease from the mid to the post-test. In addition, for
both right and left symmetry, the pre and mid-tests were categorized as good then the
post-test declined into the moderate category. The types of activities could have
contributed to this decline as there were more strength-based activities in the first half
and more aerobically based activities in the second half.
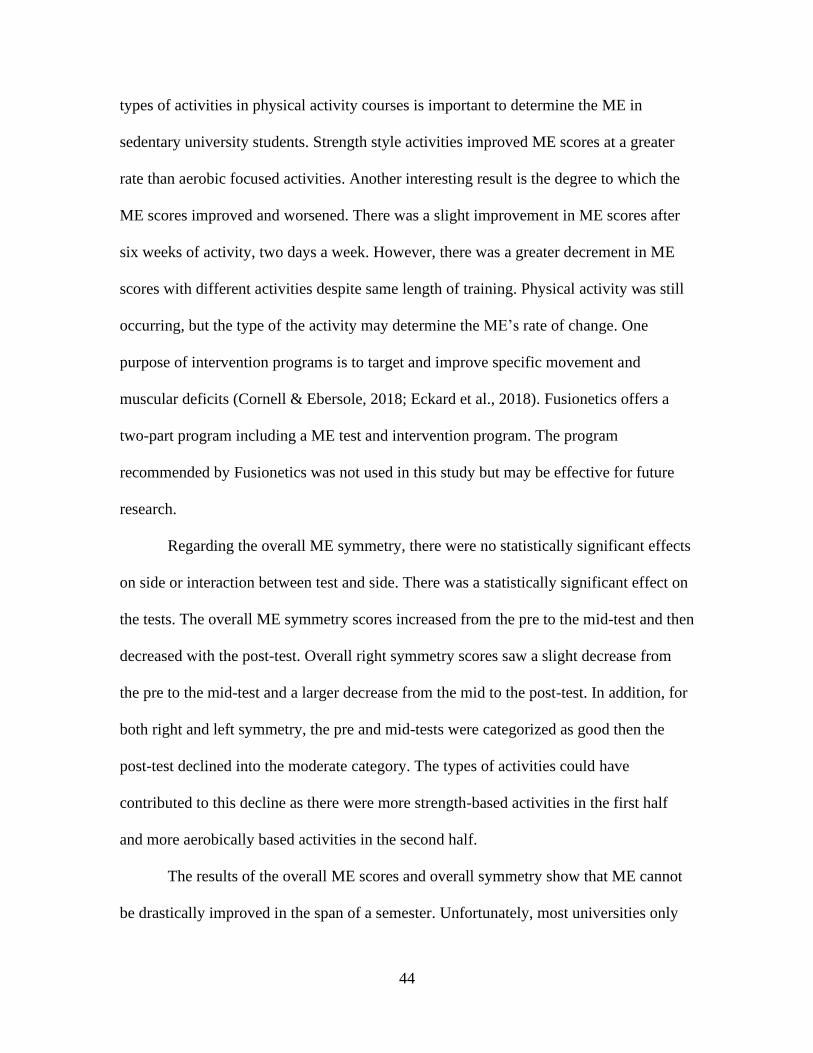
The results of the overall ME scores and overall symmetry show that ME cannot
be drastically improved in the span of a semester. Unfortunately, most universities only
45
require a minimum of 1 credit hour of physical activity courses. One semester may not
allow enough time with an instructor for students to improve ME. In addition, endurance-
based activities were not proven effective in improving ME.
Subgroups
A secondary purpose of this study is to determine specific movement and
muscular deficits of a sedentary university population. Each individual score was divided
into the seven separate subgroups and then averaged across individuals for each test. Our
findings indicate that there were a statistically significant effects on test in the 2-leg squat
and the 1-leg squat (See Table 4.5). Regarding subgroup symmetry scores, statistically
significance effects were found between sides for the hip joint.
Lower Body
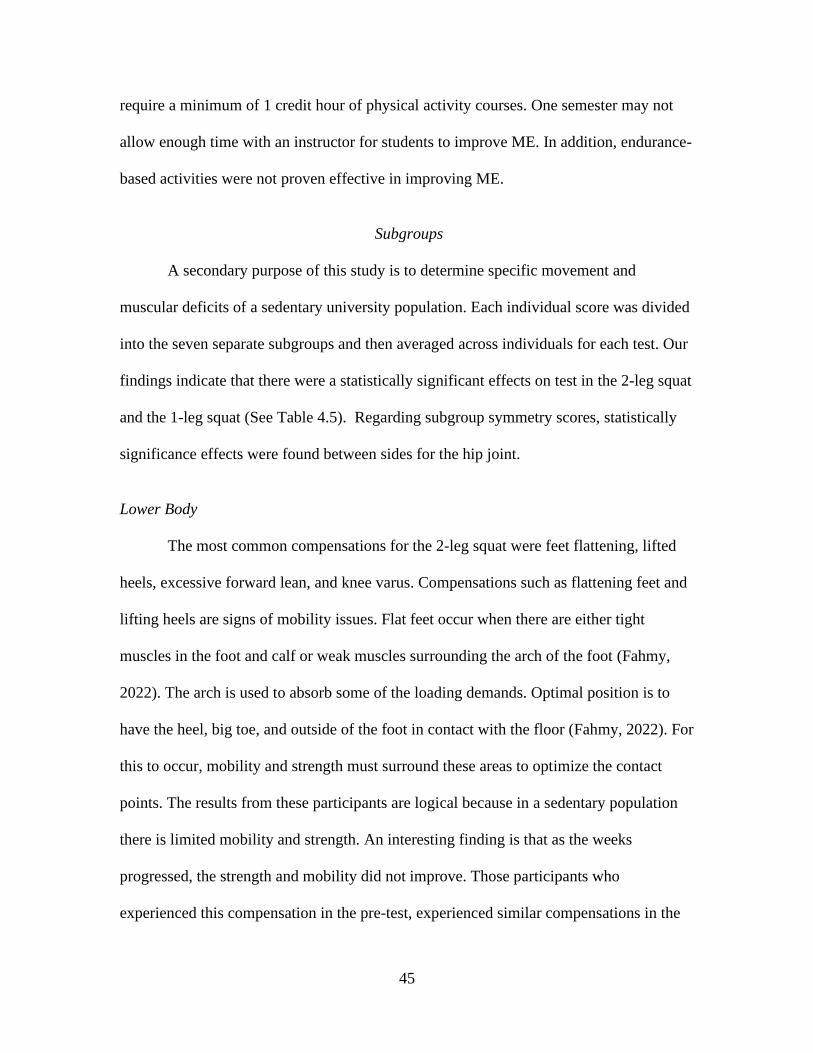
The most common compensations for the 2-leg squat were feet flattening, lifted
heels, excessive forward lean, and knee varus. Compensations such as flattening feet and
lifting heels are signs of mobility issues. Flat feet occur when there are either tight
muscles in the foot and calf or weak muscles surrounding the arch of the foot (Fahmy,
2022). The arch is used to absorb some of the loading demands. Optimal position is to
have the heel, big toe, and outside of the foot in contact with the floor (Fahmy, 2022). For
this to occur, mobility and strength must surround these areas to optimize the contact
points. The results from these participants are logical because in a sedentary population
there is limited mobility and strength. An interesting finding is that as the weeks
progressed, the strength and mobility did not improve. Those participants who
experienced this compensation in the pre-test, experienced similar compensations in the
46
post-test. This trend shows that more endurance activities (see table 3.5) are not effective
at increasing foot/ankle mobility.
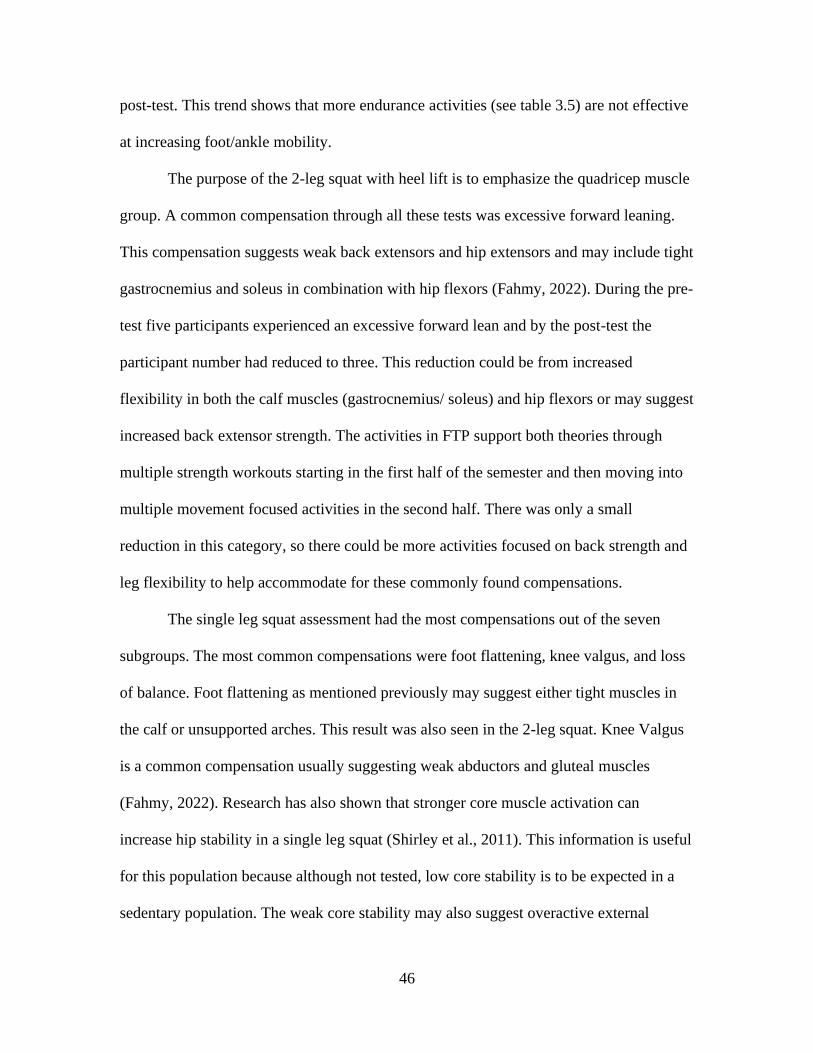
The purpose of the 2-leg squat with heel lift is to emphasize the quadricep muscle
group. A common compensation through all these tests was excessive forward leaning.
This compensation suggests weak back extensors and hip extensors and may include tight
gastrocnemius and soleus in combination with hip flexors (Fahmy, 2022). During the pre-
test five participants experienced an excessive forward lean and by the post-test the
participant number had reduced to three. This reduction could be from increased
flexibility in both the calf muscles (gastrocnemius/ soleus) and hip flexors or may suggest
increased back extensor strength. The activities in FTP support both theories through
multiple strength workouts starting in the first half of the semester and then moving into
multiple movement focused activities in the second half. There was only a small
reduction in this category, so there could be more activities focused on back strength and
leg flexibility to help accommodate for these commonly found compensations.
The single leg squat assessment had the most compensations out of the seven
subgroups. The most common compensations were foot flattening, knee valgus, and loss
of balance. Foot flattening as mentioned previously may suggest either tight muscles in
the calf or unsupported arches. This result was also seen in the 2-leg squat. Knee Valgus
is a common compensation usually suggesting weak abductors and gluteal muscles
(Fahmy, 2022). Research has also shown that stronger core muscle activation can
increase hip stability in a single leg squat (Shirley et al., 2011). This information is useful
for this population because although not tested, low core stability is to be expected in a
sedentary population. The weak core stability may also suggest overactive external
47
rotators (Fahmy, 2022; Shirley et al., 2011). In addition, weak surrounding hip muscles
and low core stability may have caused a loss of balance. Future research should include
more in-depth reasoning behind a higher occurrence of knee varus in this population. Due
to the setup of FTP activities and ACSM’s recommendation of 2-3 days of strength
training and 3-5 days of aerobic training per week (Riebe et al., 2018), there is not
enough time in class for adaptations in this subgroup. Although increases in strength,
endurance, and flexibility are a focus of the course (Ruckman, 2021), ME is not
improving through the chosen activities. Activities need to teach and include more
effective strength in the lower body, specifically gluteal muscles.
Explanations for symmetry differences are compensations used in these three
lower body exercises. Paterno et al. (2007) mentions the assessment of lower body
asymmetries are used to determine mechanical stability, isokinetic strength, and
functional performance. The increased frequency of knee valgus during the lowering
phase of the squats can be related to the landing phase of a jump. Cone and Lee (2021)
state that greater knee instability was evident during frontal knee landings, causing a
more forceful strain on the knee. The knee valgus in the lowering phase of the squat of
this study shows knee instability and weak surrounding muscles causing this
compensation. Another explanation could be the types of activities in FTP. The first half
of the semester contained more bilateral power, speed, and agility activities whereas the
second half was more sport-oriented utilizing unilateral movements. The muscular
imbalances and weak core strength mentioned earlier, in addition to unilateral activities
may have contributed to a difference between right and left symmetry in the hip joint.

48
Upper Body
The common compensation for the push-up test was low back arching and head
moving forward. The reasoning behind the low back arching is the muscles in the lumbo-
pelvic-hip-complex (LPHS) are imbalanced (Ambler-Wright, 2022). These muscles
include the hip flexor complex, erector spinae, and latissimus dorsi. The muscle
imbalance may cause limited range of motion in the LPHS and incorrectly stabilize the
spine. The muscles that need to be strengthened to overcome this compensation are the
anterior core, the gluteus maximus, and the hamstrings (Ambler-Wright, 2022). This will
allow for the body to lift into the correct position. The head moving forward
compensation is caused by overactive upper trapezius, levator scapulae, and
sternocleidomastoid (Ambler-Wright, 2022). The underactive muscles are deep cervical
flexors (Ambler-Wright, 2022). When the head moves forward there is a disconnection
between the upper thoracic spine and the cervical spine, requiring a compensation to
complete the full push-up (Ambler-Wright, 2022).
The shoulders movements consist of shoulder flexion, internal rotation, external
rotation, and horizontal abduction. Of these four motions, horizontal abduction contained
the most compensations. When comparing the separate tests, there was not a large
increase in flexibility as expected. A study on sedentary females concluded that
resistance training was not an effective mechanism for increasing shoulder flexibility
(Santos et al., 2010). When looking at the FTP schedule, most of the activities were
focused on aerobic capacity and lower body strength. Although flexibility was
incorporated into warm-ups and cool-downs, time associated specifically to shoulder
flexibility was not proven effective at increasing ME scores. For future
49
recommendations, a consistent cooldown should be put in place for every workout
including major muscle groups of both lower body and upper body, specifically
shoulders.
Regarding upper body symmetry, there was no statistically significant effects on
the tests, sides, or the interaction between tests and sides. One explanation is the lack of
upper body strength and game activities. In the first half of the semester (see Table 3.3), a
majority of the aerobic and strength activities were lower body dominant. In addition,
three out of the four games included upper body. Activities in the second half of the
semester (see Table 3.4) also contained limited upper body work. The left side contained
higher symmetry scores throughout the tests than the right side. Right side symmetry
could have been affected by the dominant use in games through throwing balls and
frisbees. The left side symmetry may be higher due to a natural increase from activity,
compared to a sedentary state. The overall pattern of decline of symmetry in both sides
could be caused by the difference in number of activities using upper body between the
first and second half of the semester .
Spine
Trunk and Lumbar Spine flexion and rotation had some of the highest scores from
all the subgroups. In the pre-test, six out of eleven participants used a compensation for
trunk rotation on both the right and left side of the body. This may suggest low flexibility
in the thoracic and lumbar spine. These individual measures are not descriptive enough to
indicate low back function (Schenk, 2004). There was improvement from the pre-test to
the post-test which indicates that FTP activities are effective in increasing trunk
50
rotation. This may be caused by including flexibility training before and after activities to
increase range of motion in trunk rotation.
The cervical movement had no issues in the pre-test and remained constant
through the post-test. There were no reported issues with cervical movement through the
testing and through activities done in FTP.
Limitations
The first limitation of this study was the inequality between the first and second
half activities. The class is structured around the number of rotations and limited amount
of time in class. This semester, the rotations added up unevenly causing an unequal
number of activities in the first and second half. This limitation may have been a cause in
the declines in ME scores for the post-tests. Another limitation is the study exclusion
criteria. The criteria limited students who had a previous injury in the past five years.
Excluding this population may have reduced the data surrounding muscular and
movement deficits and may have limited results in symmetry differences. Another
limitation was variance in instruction. Although FTP is supervised by the same director
and given the same activities, every section was taught by a different instructor. This
variance in instruction between sections may have contributed to differences in results.
Future Research
Future research should include testing of sedentary students in university physical
activity courses to determine if Fusionetics can detect ME problems. In addition,
including testing over a longer period to determine what activities and duration will be
more beneficial to improving ME. Future research should also focus on more consistent
51
activity schedule, a wider inclusion criterion, and including a more specific intervention
program to improve ME scores.
Conclusion
Physical activity courses in the university setting have importance in providing
valuable information on health and fitness to the students. Physical activity courses may
benefit from activities focused on movement and muscular deficits seen in students to
improve ME. By improving ME, students will have more opportunities to enjoy lifelong
fitness outside of the course and university.

52
APPENDIX
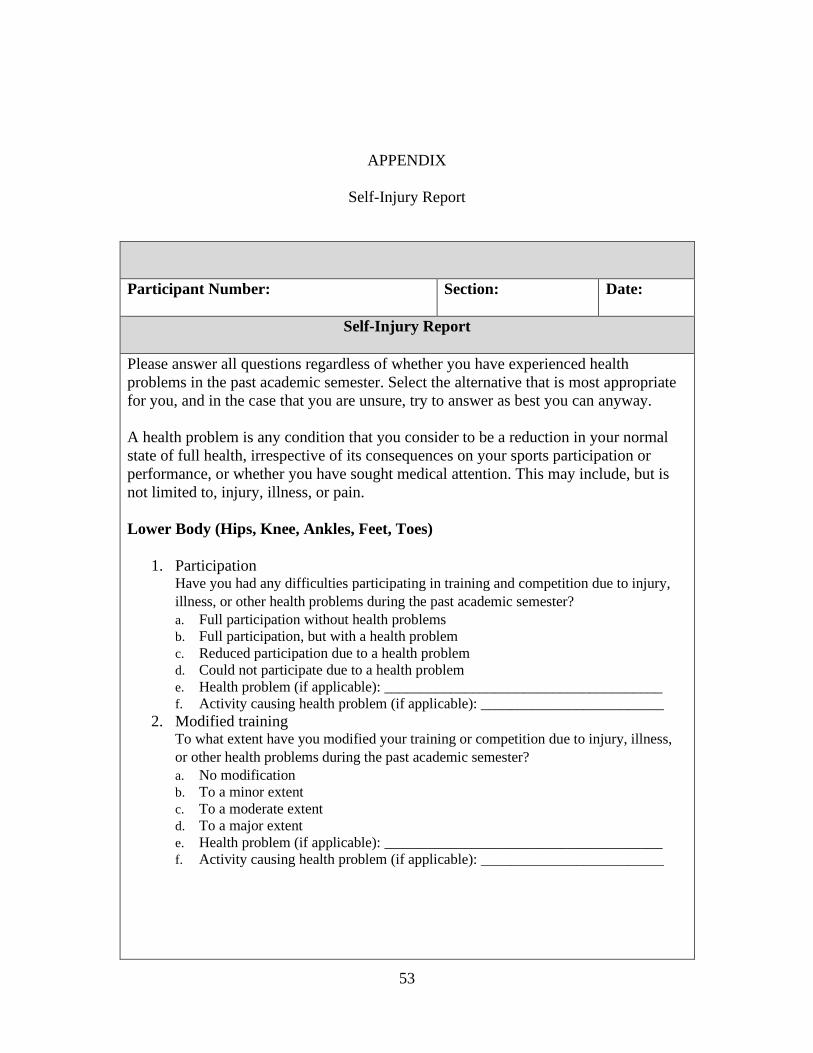
53
APPENDIX
Self-Injury Report
Participant Number: Section: Date:
Self-Injury Report
Please answer all questions regardless of whether you have experienced health
problems in the past academic semester. Select the alternative that is most appropriate
for you, and in the case that you are unsure, try to answer as best you can anyway.
A health problem is any condition that you consider to be a reduction in your normal
state of full health, irrespective of its consequences on your sports participation or
performance, or whether you have sought medical attention. This may include, but is
not limited to, injury, illness, or pain.
Lower Body (Hips, Knee, Ankles, Feet, Toes)
1. ParticipationHave you had any difficulties participating in training and competition due to injury,
illness, or other health problems during the past academic semester?
a. Full participation without health problems
b. Full participation, but with a health problem
c. Reduced participation due to a health problem
d. Could not participate due to a health problem
e. Health problem (if applicable): ______________________________________
f. Activity causing health problem (if applicable): _________________________
2. Modified trainingTo what extent have you modified your training or competition due to injury, illness,
or other health problems during the past academic semester?
a. No modification
b. To a minor extent
c. To a moderate extent
d. To a major extent
e. Health problem (if applicable): ______________________________________
f. Activity causing health problem (if applicable): _________________________
54
3. Performance
To what extent has injury, illness or other health problems affected your performance
during the past academic semester?
a. No effect
b. To a minor extent
c. To a moderate extent
d. To a major extent
e. Health problem: ______________________________________
f. Activity causing health problem (if applicable): _________________________
4. SymptomsTo what extent have you experienced symptoms/health complaints during the past
academic semester?
a. No symptoms/ health complaints
b. To a mild extent
c. To a moderate extent
d. To a severe extent
e. Health problem (if applicable): ______________________________________
f. Activity causing health problem (if applicable): _________________________
Upper Body (Shoulders, Elbows, Wrists, Fingers)
1. ParticipationHave you had any difficulties participating in training and competition due to injury,
illness, or other health problems during the past academic semester?
a. Full participation without health problems
b. Full participation, but with a health problem
c. Reduced participation due to a health problem
d. Could not participate due to a health problem
e. Health problem (if applicable): ______________________________________
f. Activity causing health problem (if applicable): _________________________
2. Modified trainingTo what extent have you modified your training or competition due to injury, illness,
or other health problems during the past academic semester?
a. No modification
b. To a minor extent
c. To a moderate extent
d. To a major extent
e. Health problem (if applicable): ______________________________________
f. Activity causing health problem (if applicable): ______________________
3. PerformanceTo what extent has injury, illness or other health problems affected your performance
during the past academic semester?
a. No effect
b. To a minor extent
c. To a moderate extent
d. To a major extent
e. Health problem (if applicable): ______________________________________
f. Activity causing health problem (if applicable):
55
4. SymptomsTo what extent have you experienced symptoms/health complaints during the past
academic semester?
a. No symptoms/ health complaints
b. To a mild extent
c. To a moderate extent
d. To a severe extent
e. Health problem (if applicable): ______________________________________
f. Activity causing health problem (if applicable): _________________________
Trunk (High/ Low Back, Abdominals, Chest)
1. ParticipationHave you had any difficulties participating in training and competition due to injury,
illness, or other health problems during the past academic semester?
a. Full participation without health problems
b. Full participation, but with a health problem
c. Reduced participation due to a health problem
d. Could not participate due to a health problem
e. Health problem (if applicable): ______________________________________
f. Activity causing health problem (if applicable): _________________________
2. Modified trainingTo what extent have you modified your training or competition due to injury, illness,
or other health problems during the past academic semester?
a. No modification
b. To a minor extent
c. To a moderate extent
d. To a major extent
e. Health problem (if applicable): ______________________________________
f. Activity causing health problem (if applicable): _________________________
3. PerformanceTo what extent has injury, illness or other health problems affected your performance
during the past academic semester?
a. No effect
b. To a minor extent
c. To a moderate extent
d. To a major extent
e. Health problem (if applicable): ______________________________________
f. Activity causing health problem (if applicable): _________________________
4. SymptomsTo what extent have you experienced symptoms/health complaints during the past
academic semester?
a. No symptoms/ health complaints
b. To a mild extent
c. To a moderate extent
d. To a severe extent
e. Health problem (if applicable): ______________________________________
f. Activity causing health problem (if applicable): __

56
Cervical (Neck and Head)
1. ParticipationHave you had any difficulties participating in training and competition due to injury,
illness, or other health problems during the past academic semester?
a. Full participation without health problems
b. Full participation, but with a health problem
c. Reduced participation due to a health problem
d. Could not participate due to a health problem
e. Health problem (if applicable): ______________________________________
f. Activity causing health problem (if applicable): _________________________
2. Modified trainingTo what extent have you modified your training or competition due to injury, illness or
other health problems during the past academic semester?
a. No modification
b. To a minor extent
c. To a moderate extent
d. To a major extent
e. Health problem (if applicable): ______________________________________
f. Activity causing health problem (if applicable): _________________________
3. PerformanceTo what extent has injury, illness or other health problems affected your performance
during the past academic semester?
a. No effect
b. To a minor extent
c. To a moderate extent
d. To a major extent
e. Health problem (if applicable): ______________________________________
f. Activity causing health problem (if applicable): _________________________
4. SymptomsTo what extent have you experienced symptoms/health complaints during the past
academic semester?
a. No symptoms/ health complaints
b. To a mild extent
c. To a moderate extent
d. To a severe extent
e. Health problem (if applicable): ______________________________________
f. Activity causing health problem (if applicable): _________________________
Student’s Initials: _____________________
Completers Initials: _________________
Date: ____________________________
57
BIBLIOGRAPHY
Abernethy, L. (2003). Impact of school sports injury. British Journal of Sports Medicine,
37(4), 354–355. https://doi.org/10.1136/bjsm.37.4.354
Amber-Wright, T. (n.d.). How to Get Better at Push-Ups | NASM Guide to Push-ups
[Part 2]. NASM.Org. Retrieved January 27, 2022, from
https://blog.nasm.org/nasm-guide-to-push-ups/getting-better-at-pushups
Annesi, J. J., Porter, K. J., Hill, G. M., & Goldfine, B. D. (2017). Effects of Instructional
Physical Activity Courses on Overall Physical Activity and Mood in University
Students. Research quarterly for exercise and sport, 88(3), 358–364.
https://doi.org/10.1080/02701367.2017.1336280
Bahr, R. (2016). Why screening tests to predict injury do not work—and probably never
will. . .: a critical review. British Journal of Sports Medicine, 50(13), 776–780.
https://doi.org/10.1136/bjsports-2016-096256
Baylor University. (2021). LF 1134: Fitness theory and syllabus course syllabus. Waco,
Texas: Sarah Ruckman.
Bennett, H., Arnold, J., Norton, K., & Davison, K. (2020). Are we really “screening”
movement? The role of assessing movement quality in exercise settings. Journal
of Sport and Health Science, 9(6), 489–492.
https://doi.org/10.1016/j.jshs.2020.08.002
Bonazza, N. A., Smuin, D., Onks, C. A., Silvis, M. L., & Dhawan, A. (2016). Reliability,
Validity, and Injury Predictive Value of the Functional Movement Screen: A
Systematic Review and Meta-analysis. The American Journal of Sports Medicine,
45(3), 725–732. https://doi.org/10.1177/0363546516641937
Chapman, R. F., Laymon, A. S., & Arnold, T. (2014). Functional Movement Scores and
Longitudinal Performance Outcomes in Elite Track and Field Athletes.
International Journal of Sports Physiology and Performance, 9(2), 203–211.
https://doi.org/10.1123/ijspp.2012-0329
Claiborne, T. L., Armstrong, C. W., Gandhi, V., & Pincivero, D. M. (2006). Relationship
between Hip and Knee Strength and Knee Valgus during a Single Leg Squat. Journal
of Applied Biomechanics, 22(1), 41–50. https://doi.org/10.1123/jab.22.1.41
58
Clarsen B, Myklebust G, Bahr R. Br J Sports Med 2013;47:495– 502.
Cone SM, Lee S. Lower Limb Force Asymmetries During Landing and Jumping
Exercises: A Pilot Study. Int J Exerc Sci. 2021 Apr 1;14(1):544-551. PMID:
34055145; PMCID: PMC8136551.
Cook, G., Burton, L., Hoogenboom, B. J., & Voight, M. (2014). Functional Movement
Screening: the use of fundamental movements as an assessment of function - part 1.
The International Journal of Sports Physical Therapy, 9(3), 396–409.
Cook, G., Burton, L., Hoogenboom, B. J., & Voight, M. (2014). Functional Movement
Screening: the use of fundamental movements as an assessment of function - part 2.
The International Journal of Sports Physical Therapy, 9(4), 549–563.
Cornell, David James, "Influence of a Corrective Exercise Training Program on Measures
of Functional Movement Among Active-Duty Firefighters" (2016). Theses and
Dissertations. 1129.https://dc.uwm.edu/etd/1129
Cornell, D. J., & Ebersole, K. T. (2018). Intra-Rater Test-Retest Reliability and Response
Stability of the Fusionetics Movement Efficiency Test. International Journal of
Sports Physical Therapy, 13(4), 618–632. https://doi.org/10.26603/ijspt20180618
Cornell, D. J., Ebersole, K. T., Azen, R., Zalewski, K. R., Earl-Boehm, J. E., & Alt, C. A.
(2021). Measures of Functional Movement Quality Among Firefighters. Athletic
Training & Sports Health Care, 13(5). https://doi.org/10.3928/19425864-
20201117-01
Eckard, T., Padua, D., Mauntel, T., Frank, B., Pietrosimone, L., Begalle, R., Goto, S.,
Clark, M., & Kucera, K. (2018). Association between double-leg squat and
single-leg squat performance and injury incidence among incoming NCAA
Division I athletes: A prospective cohort study. Physical Therapy in Sport, 34,
192–200. https://doi.org/10.1016/j.ptsp.2018.10.009
Emery, C. A., & Pasanen, K. (2019). Current trends in sport injury prevention. Best
Practice & Research Clinical Rheumatology, 33(1), 3–15.
https://doi.org/10.1016/j.berh.2019.02.009
Fahmy, R. (2022). NASM Essentials of Corrective Exercise Training by National
Academy of Sports Medicine (2010–09-25). LWW; 1 Har/Psc edition (2010–09-
25).
Ge, S., Song, C., & Yao, W. (2021). The Motor Function Evaluation of College Students’
Physical Activity State From the Perspective of Educational Psychology.
Frontiers in Psychology, 12. https://doi.org/10.3389/fpsyg.2021.593285
59
Harriss, J., Khan, A., Song, K., Register-Mihalik, J. K., & Wikstrom, E. A. (2019).
Clinical movement assessments do not differ between collegiate athletes with and
without chronic ankle instability. Physical Therapy in Sport, 36, 22–27.
https://doi.org/10.1016/j.ptsp.2018.12.009
Hensley, L. D. (2000). Current Status of Basic Instruction Programs in Physical
Education at American Colleges and Universities. Journal of Physical Education,
Recreation & Dance, 71(9), 30–36.
https://doi.org/10.1080/07303084.2000.10605719
Jorgensen, J. E., Rathleff, C. R., Rathleff, M. S., & Andreasen, J. (2015). Danish
translation and validation of the Oslo Sports Trauma Research Centre
questionnaires on overuse injuries and health problems. Scandinavian Journal of
Medicine & Science in Sports, 26(12), 1391–1397.
https://doi.org/10.1111/sms.12590
Karuc, J., Mišigoj-Duraković, M., ŠArlija, M., Marković, G., Hadžić, V., Trošt-Bobić,
T., & Sorić, M. (2021). Can Injuries Be Predicted by Functional Movement
Screen in Adolescents? The Application of Machine Learning. Journal of
Strength and Conditioning Research, 35(4), 910–919.
https://doi.org/10.1519/jsc.0000000000003982
López-Valenciano, A., Ayala, F., Puerta, J. M., DE Ste Croix, M., Vera-Garcia, F. J.,
Hernández-Sánchez, S., Ruiz-Pérez, I., & Myer, G. D. (2018). A Preventive
Model for Muscle Injuries. Medicine & Science in Sports & Exercise, 50(5), 915–
927. https://doi.org/10.1249/mss.0000000000001535
Maffulli, N., Longo, U. G., Gougoulias, N., Caine, D., & Denaro, V. (2010). Sport
injuries: a review of outcomes. British Medical Bulletin, 97(1), 47–80.
https://doi.org/10.1093/bmb/ldq026
Moore, E., Chalmers, S., Milanese, S., & Fuller, J. T. (2019). Factors Influencing the
Relationship Between the Functional Movement Screen and Injury Risk in
Sporting Populations: A Systematic Review and Meta-analysis. Sports Medicine,
49(9), 1449–1463. https://doi.org/10.1007/s40279-019-01126-5
Năsui B, & Popescu C. (2014). The assessment of the physical activity of Romanian
university students in relation to nutritional status and academic performance.
Palestrica of the third millennium – Civilization and Sport, 15:2, 107-111.
Nazan Ozturk, & Fatma Unver. (2020). Investigation of Leisure Time, Life and Sleep
Quality in University Students. Journal of Life Sciences, 14(1).
https://doi.org/10.17265/1934-7391/2020.01.001
60
Olivier, B., Lala, B., & Gillion, N. (2020). The cricketer’s shoulder and injury:
Asymmetries in range of movement and muscle length. South African Journal of
Physiotherapy, 76(1). https://doi.org/10.4102/sajp.v76i1.754
Paterno, M. V., Ford, K. R., Myer, G. D., Heyl, R., & Hewett, T. E. (2007). Limb
Asymmetries in Landing and Jumping 2 Years Following Anterior Cruciate
Ligament Reconstruction. Clinical Journal of Sport Medicine, 17(4), 258–262.
https://doi.org/10.1097/jsm.0b013e31804c77ea
Pollen, T. R., Keitt, F., & Trojian, T. H. (2018). Do Normative Composite Scores on the
Functional Movement Screen Differ Across High School, Collegiate, and
Professional Athletes? A Critical Review. Clinical Journal of Sport Medicine,
Publish Ahead of Print. https://doi.org/10.1097/jsm.0000000000000672
Quick-Royal ZM. Fushionetics Movement Efficiency Test as a Tool for Lower Extremity
Injury Prediction in Division I Collegiate Athletes. 2020.
Ruckman, S. K. (2021). LF 1134 – Fitness Theory and Practice [Syllabus]. Department
of Lifetime Fitness, Baylor University.
Saint-Maurice, P. F., Coughlan, D., Kelly, S. P., Keadle, S. K., Cook, M. B., Carlson, S.
A., Fulton, J. E., & Matthews, C. E. (2019). Association of Leisure-Time Physical
Activity Across the Adult Life Course With All-Cause and Cause-Specific
Mortality. JAMA Network Open, 2(3), e190355.
https://doi.org/10.1001/jamanetworkopen.2019.0355
Santos, E., Rhea, M. R., Simão, R., Dias, I., de Salles, B. F., Novaes, J., Leite, T., Blair,
J. C., & Bunker, D. J. (2010). Influence of Moderately Intense Strength Training
on Flexibility in Sedentary Young Women. Journal of Strength and Conditioning
Research, 24(11), 3144–3149. https://doi.org/10.1519/jsc.0b013e3181e38027
Schenk, P., Klipstein, A., Spillmann, S., Strøyer, J., & Laubli, T. (2004). The role of back
muscle endurance, maximum force, balance and trunk rotation control regarding
lifting capacity. European Journal of Applied Physiology, 96(2), 146–156.
https://doi.org/10.1007/s00421-004-1262-7
Shirey, M., Hurlbutt, M., Johansen, N., Wilkinson, S. G., King, G. W., & Hoover, D.
(2011). Influence of Core Musculature Engagement on Knee Kinematics of
Females During a Single Leg Squat. Medicine & Science in Sports & Exercise,
43(5), 501. https://doi.org/10.1249/01.mss.0000401382.61642.9c
Simon, J. E., Lorence, M., & Docherty, C. L. (2020). Health-Related Quality of Life in
Former National Collegiate Athletic Association Division I Collegiate Athletes
Compared With Noncollegiate Athletes: A 5-Year Follow-Up. Journal of Athletic
Training, 56(3), 331–338. https://doi.org/10.4085/107-20

61
The level of physical activity of university students. (2015). Proedia-Social and
Behavioral Sciences, 197(1), 1454–1457.
Triplett, C. R., Dorrel, B. S., Symonds, M. L., Selland, C. A., Jensen, D. D., & Poole, C.
N. (2021). Functional Movement Screen Detected Asymmetry & Normative
Values Among College-Aged Students. International Journal of Sports Physical
Therapy. https://doi.org/10.26603/001c.19443
Verhagen, E. A., van Stralen, M. M., & van Mechelen, W. (2010). Behaviour, the Key
Factor for Sports Injury Prevention. Sports Medicine, 40(11), 899–906.
https://doi.org/10.2165/11536890-000000000-00000
Vilhjalmsson, R. (2019). Physical education, leisure time physical activity, and
psychological distress in adolescence. European Journal of Public Health,
29(Supplement_4). https://doi.org/10.1093/eurpub/ckz186.599
Copyright © 2022 FDOKUMEN