Anomalous temperature dependence of the fluorescence lifetime of phycobiliproteins
10
Anomalous temperature dependence of the fluorescence lifetime of phycobiliproteins This article has been downloaded from IOPscience. Please scroll down to see the full text article. 2013 Laser Phys. Lett. 10 055602 (http://iopscience.iop.org/1612-202X/10/5/055602) Download details: IP Address: 90.155.158.170 The article was downloaded on 16/04/2013 at 17:36 Please note that terms and conditions apply. View the table of contents for this issue, or go to the journal homepage for more Home Search Collections Journals About Contact us My IOPscience
-
Upload
independent -
Category
Documents
-
view
1 -
download
0
Transcript of Anomalous temperature dependence of the fluorescence lifetime of phycobiliproteins

Anomalous temperature dependence of the fluorescence lifetime of phycobiliproteins
This article has been downloaded from IOPscience. Please scroll down to see the full text article.
2013 Laser Phys. Lett. 10 055602
(http://iopscience.iop.org/1612-202X/10/5/055602)
Download details:
IP Address: 90.155.158.170
The article was downloaded on 16/04/2013 at 17:36
Please note that terms and conditions apply.
View the table of contents for this issue, or go to the journal homepage for more
Home Search Collections Journals About Contact us My IOPscience

IOP PUBLISHING LASER PHYSICS LETTERS
Laser Phys. Lett. 10 (2013) 055602 (9pp) doi:10.1088/1612-2011/10/5/055602
LETTER
Anomalous temperature dependence ofthe fluorescence lifetime ofphycobiliproteins
E G Maksimov1, F-J Schmitt2, P Hatti3, K E Klementiev1,V Z Paschenko1, G Renger2,4 and A B Rubin1
1 Department of Biophysics, Faculty of Biology, M V Lomonosov Moscow State University, 119992,Moscow, Russia2 Institute of Chemistry, Biophysical Chemistry, Berlin Institute of Technology, D-10623 Berlin,Germany3 Institute of Optics and Atomic Physics, Berlin Institute of Technology, D-10623 Berlin, Germany
E-mail: [email protected]
Received 6 November 2013Accepted for publication 2 January 2013Published 16 April 2013Online at stacks.iop.org/LPL/10/055602
AbstractUsing a single photon counting technique we have investigated fluorescence decay spectra ofphycobiliproteins with picosecond time resolution. The studies were performed in a widerange of temperatures—from 4 to 300 K. Comparing the fluorescence decay kinetics ofsamples rapidly frozen in liquid nitrogen with samples that were frozen slowly revealed thatthe temperature-dependent changes of phycobiliproteins fluorescence lifetime reflect thepresence of three different stages, with a phase transition between 273 and 263 K that stronglydepends on the rate of freezing. When the temperature decreases from 300 to 273 K, thefluorescence lifetime increases from 1.6 to 1.8 ns. In the region from 273 to 263 K weobserved a decrease of the fluorescence lifetime, which strongly depends on the freezing rate:a slight decrease at high freezing rate and a drop down to 200 ps lifetime at slow freezing rate.In the low-temperature regime from 263 to 4 K a linear increase in the fluorescence lifetimewas observed for all samples. It was found that the strong temperature dependence of thephycobiliprotein fluorescence, especially in the range between 263 and 273 K, is due to theinteraction of the solvent with the chromophore bound to the protein. This feature is explainedby a photoisomerization of the phycobiliproteins into a quenching form which is naturallyprevented by the protein environment. The formation of ice microcrystals at low freezing rateeliminates this ‘protective’ effect of the protein environment.
(Some figures may appear in colour only in the online journal)
List ofabbreviations
PBP Phycobiliprotein
4 Deceased.
PCB PhycocyanobilinAPC AllophycocyaninPC PhycocyaninPE Phycoerythrinα-PEC α-phycoerythrocyaninPVB Phycoviolobilin
11612-2011/13/055602+09$33.00 c© 2013 Astro Ltd Printed in the UK & the USA
Laser Phys. Lett. 10 (2013) 055602 E G Maksimov et al
τ Fluorescence lifetimeϕfl Fluorescence quantum yieldFWHM Full width at half maximumTCSPC Time-correlated single photon countingPDB Protein data bank
1. Introduction
Efficient photosynthesis requires the controlled input ofsolar energy into the photochemical reaction centers. Theoptical absorption cross-section of the photochemicallyactive pigments is greatly increased by functional couplingwith specialized light harvesting pigment–protein complexeswhich can bind hundreds of pigments and are optimized forefficient excitation energy transfer [1–3].
Phycobiliproteins (PBP), which are the constituentsof phycobilisomes, the peripheral antenna complexes incyanobacteria and red algae, contain up to 400 functionallycoupled chromophores [2, 4]. They absorb light quantaand efficiently transfer the electronic excitation energy tophotosynthetic reaction centers. Phycobiliproteins enhancethe optical cross-section of the reaction centers by more thanone order of magnitude [4–6].
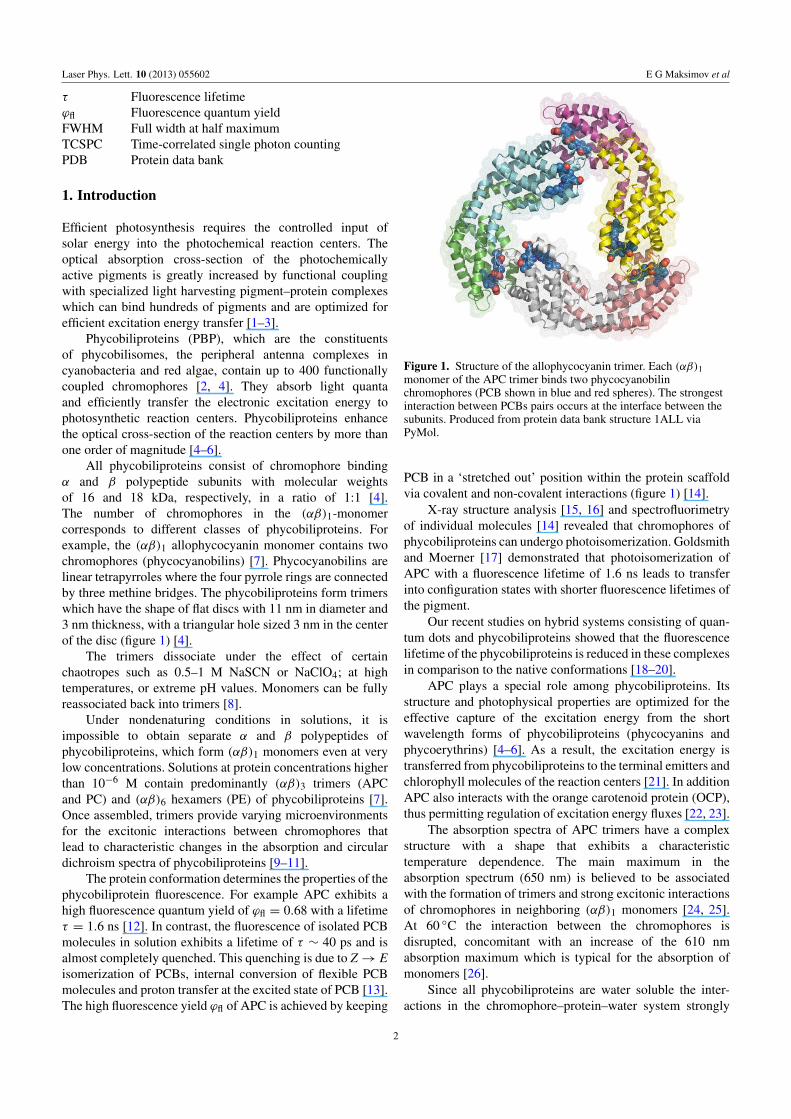
All phycobiliproteins consist of chromophore bindingα and β polypeptide subunits with molecular weightsof 16 and 18 kDa, respectively, in a ratio of 1:1 [4].The number of chromophores in the (αβ)1-monomercorresponds to different classes of phycobiliproteins. Forexample, the (αβ)1 allophycocyanin monomer contains twochromophores (phycocyanobilins) [7]. Phycocyanobilins arelinear tetrapyrroles where the four pyrrole rings are connectedby three methine bridges. The phycobiliproteins form trimerswhich have the shape of flat discs with 11 nm in diameter and3 nm thickness, with a triangular hole sized 3 nm in the centerof the disc (figure 1) [4].
The trimers dissociate under the effect of certainchaotropes such as 0.5–1 M NaSCN or NaClO4; at hightemperatures, or extreme pH values. Monomers can be fullyreassociated back into trimers [8].
Under nondenaturing conditions in solutions, it isimpossible to obtain separate α and β polypeptides ofphycobiliproteins, which form (αβ)1 monomers even at verylow concentrations. Solutions at protein concentrations higherthan 10−6 M contain predominantly (αβ)3 trimers (APCand PC) and (αβ)6 hexamers (PE) of phycobiliproteins [7].Once assembled, trimers provide varying microenvironmentsfor the excitonic interactions between chromophores thatlead to characteristic changes in the absorption and circulardichroism spectra of phycobiliproteins [9–11].
The protein conformation determines the properties of thephycobiliprotein fluorescence. For example APC exhibits ahigh fluorescence quantum yield of ϕfl = 0.68 with a lifetimeτ = 1.6 ns [12]. In contrast, the fluorescence of isolated PCBmolecules in solution exhibits a lifetime of τ ∼ 40 ps and isalmost completely quenched. This quenching is due to Z→ Eisomerization of PCBs, internal conversion of flexible PCBmolecules and proton transfer at the excited state of PCB [13].The high fluorescence yield ϕfl of APC is achieved by keeping
Figure 1. Structure of the allophycocyanin trimer. Each (αβ)1monomer of the APC trimer binds two phycocyanobilinchromophores (PCB shown in blue and red spheres). The strongestinteraction between PCBs pairs occurs at the interface between thesubunits. Produced from protein data bank structure 1ALL viaPyMol.
PCB in a ‘stretched out’ position within the protein scaffoldvia covalent and non-covalent interactions (figure 1) [14].
X-ray structure analysis [15, 16] and spectrofluorimetryof individual molecules [14] revealed that chromophores ofphycobiliproteins can undergo photoisomerization. Goldsmithand Moerner [17] demonstrated that photoisomerization ofAPC with a fluorescence lifetime of 1.6 ns leads to transferinto configuration states with shorter fluorescence lifetimes ofthe pigment.
Our recent studies on hybrid systems consisting of quan-tum dots and phycobiliproteins showed that the fluorescencelifetime of the phycobiliproteins is reduced in these complexesin comparison to the native conformations [18–20].
APC plays a special role among phycobiliproteins. Itsstructure and photophysical properties are optimized for theeffective capture of the excitation energy from the shortwavelength forms of phycobiliproteins (phycocyanins andphycoerythrins) [4–6]. As a result, the excitation energy istransferred from phycobiliproteins to the terminal emitters andchlorophyll molecules of the reaction centers [21]. In additionAPC also interacts with the orange carotenoid protein (OCP),thus permitting regulation of excitation energy fluxes [22, 23].
The absorption spectra of APC trimers have a complexstructure with a shape that exhibits a characteristictemperature dependence. The main maximum in theabsorption spectrum (650 nm) is believed to be associatedwith the formation of trimers and strong excitonic interactionsof chromophores in neighboring (αβ)1 monomers [24, 25].At 60 ◦C the interaction between the chromophores isdisrupted, concomitant with an increase of the 610 nmabsorption maximum which is typical for the absorption ofmonomers [26].
Since all phycobiliproteins are water soluble the inter-actions in the chromophore–protein–water system strongly
2

Laser Phys. Lett. 10 (2013) 055602 E G Maksimov et al
affect their properties. Temperature is one of these factorsinfluencing the conformation of such systems. In thisreport we present data on the anomalous temperaturedependence of the fluorescence lifetime of phycobiliproteins.We found that, due to complex interactions of water andpigment–protein complexes under different freezing rates,different spectral forms of phycobiliproteins are obtainedwhich are characterized by different values of the fluorescencelifetime, most likely due to different conformations of thechromophore.
2. Materials
The unicellular cyanobacteria Gloeobacter violaceus weregrown in the BG-11 medium under steady-state conditions,as described elsewhere [27]. The cell culture was keptat 25 ◦C in 100 ml flasks under a white light emittingluminescent lamp that provided a constant illumination of10 µE m−2 s−1. Phycoerythrin was extracted from G.violaceus according to the procedure described in [28].The G. violaceus cells were resuspended in a 0.65 MNa-phosphate buffer (pH 7.5) and disrupted in a Frenchpress at 100 MPa. The protein fraction containing mainlyphycoerythrin was obtained by salting out from the cellularsupernatant with ammonium sulfate to a saturation degree of35%. The sediment was collected by centrifuging, dissolvedin a minimal volume of distilled water, and dialyzed throughthree changes of the 5 mM Na-phosphate buffer (pH 7.5)to achieve complete dissolution of the pigment-containingsediment. Phycoerythrin was extracted by highly efficient(high-pressure) liquid chromatography (HPLC) with theuse of the anion-exchange column High Trap Q 5 ml(Amersham Biosciences) balanced with the same buffer.After loading with the dialyzate, the column was washed offfrom nonsorbed proteins with a balancing buffer of a lowconductivity (below 5–7 mS cm−1). Then the bound proteinswere eluted with a smooth (0–400 mM) NaCl concentrationgradient (20 volumes of the column) at an elution rate of2 ml min−1. The eluated fractions were gathered in volumealiquots of 1.5 ml in volume, and their composition wasanalyzed by performing SDS (sodium dodecyl sulfate) gelelectrophoresis according to Laemmli [29] and recordingthe absorption spectra. The fractions that exhibited anabsorption spectrum with peaks at 498 and 565 and the550 nm shoulder characteristic of phycoerythrin of G.violaceus were combined and used for the experiments.The phycoerythrin content in the solutions was determinedby using the molar extinction coefficient reported in [28].Preparations of trimeric phycocyanin (PC) were isolated fromSpirulina platensis, as described in [30]. Allophycocyaninwas isolated from the supernatant of the cyanobacteriumArthrospira platensis obtained after disruption by a French-press procedure, by using three successive chromatographicsteps [31]. The APC obtained at 0.10 M Na-phosphatebuffer pH 7.0 was used in the experiment. The isolatedpigment–protein preparation according to the control SDSgel electrophoresis showed absorption and fluorescencespectra were free from contamination by other proteins. In
addition, comparative experiments with allophycocyanin fromSigma-Aldrich (USA) lead to similar results as with APCfrom A. platensis.
3. Methods
Fluorescence measurements were performed by time- andwavelength-correlated single photon counting with the equip-ment described in [32, 33]. The setup consists of a photomul-tiplier system with a Hamamatsu R5900 16-channel multi-anode photomultiplier tube with 16 separate output (anode) el-ements and a common cathode and dynode system (PML-16,Becker and Hickl, Berlin, Germany). The polychromator wasequipped with a 600 or 1200 grooves mm−1 grating, resultingin a spectral bandwidth of the PML-16 of about 200 or 100 nm(resolution of 12.5–6.25 nm/channel, respectively). Excitationwas performed with a pulsed 405 nm laser diode (LDH-405,Picoquant, Berlin, Germany) delivering 60 ps FWHM pulses,driven at a repetition rate of 20 MHz. For time-integratedmeasurements we used Fluoromax 4 (Horiba Jobin Yvon,France) and a USB-connected fluorometer system with CCDarray (EPP2000, Scientific Instruments, Berlin, Germany).Absorption spectra were recorded using a spectrophotometerequipped with an integrating sphere, designed on the basisof spectrometer USB2000 (Ocean Optics, USA) at theDepartment of Biophysics, Biological Faculty of the M VLomonosov Moscow State University.
The samples were frozen in liquid nitrogen. It is knownthat conformation of protein molecules may depend on therate of temperature changes [34]. In this paper, we changedthe rate of freezing of samples by a factor of ∼50. This wasachieved by the following procedure:
Fast freezing. A reservoir adjacent to the camera withthe sample via heat conducting material was filled withliquid nitrogen. The temperature was decreased at a rateof 2–3 ◦C s−1 so that the minimum value of −180 ◦C wasreached within several minutes. The subsequent temperatureincrease started as a result of heat exchange with theenvironment, reaching room temperature (25 ◦C) within∼120 min. Simultaneously with the rewarming of the sample,the fluorescence decay kinetics were recorded at intervalsof 10–15 ◦C. Since the temperature increased by 0.5–2 ◦Cduring the time of the measurement, each point on theplots corresponds to the averaged temperature interval. Thedescribed method of fast freezing permits investigations ofthe temperature dependency of the fluorescence propertiesof samples frozen in liquid nitrogen when the temperatureincreases from −180 to 25 ◦C.
Slow freezing. Liquid nitrogen was administered insmall aliquots of 2–3 ml, each of them added after theprevious portion had been completely evaporated. As aresult, the temperature of the sample was reduced by 3–5 ◦Cwithin 1–2 min. During freezing, we recorded time-resolvedfluorescence spectra of the phycobiliproteins. The procedurewas continued until the temperature of the sample reached−180 ◦C. Similar to the spectra recorded after fast freezing,the temperature was changed in the opposite direction andthe dependence was also recorded during warming up of the
3

Laser Phys. Lett. 10 (2013) 055602 E G Maksimov et al
Figure 2. Effect of freezing rate and solvent on the average lifetimeof allophycocyanin fluorescence at λ = 660 nm after excitation at405 nm. Red circles—slow freezing (Na-phosphate buffer, pH 7.0),filled squares—fast freezing (Na-phosphate buffer, pH 7.0), opentriangles—slow freezing in 90% glycerol, open diamonds—slowfreezing of a dehydrated sample. Numerals 1–3 indicate differentregions of the temperature dependence.
samples in 10–15 ◦C steps. It was found that the temperaturedependences obtained by slow freezing and subsequentwarming are almost perfectly identical.
Measurements were also performed at widely varyingtemperatures in the range between 10 K and room temperatureby using a self-built variable-temperature closed-loop heliumcryostat (10–300 K, CTI-Cryogenics 8001/8300) as a mobilecryostatic system [33].
In addition, measurements were performed on phyco-biliprotein solutions containing the cryoprotectant glycerol ata volume ratio of 1:9 (v/v). Furthermore, APC was also addedto 0.10 M Na-Phosphate buffer prepared in D2O, or dried ina desiccator under vacuum to investigate isotopic effects andthe fluorescence kinetics in an environment free of water.
In the time-resolved fluorescence spectra, we analyzedthe fluorescence decay kinetics in the channel correspondingto the maximum fluorescence of PBP. The fluorescence decaykinetics were approximated by the sum of two exponentialfunctions. To compare different kinetic patterns, we calculatedthe average decay time according to the expression: τav =
τ1a1 + τ2a2, where τi is the lifetime of the ith component andai is the fraction of the amplitude of the ith component of thefluorescence decay normalized to a1 + a2 = 1. To obtain thetime-integrated fluorescence spectra, the number of photonsin each spectral channel was summed up.
All calculations were performed using the Origin 8.0(OriginLab Corporation, United States) and SPCImage(Becker and Hickl, Germany) software packages.
4. Results
The temperature dependences of τav of APC samples recordedduring slow (filled circles) and fast freezing in Na–Pi buffer(filled squares) are shown in figure 2 and compared with
Figure 3. Temperature dependence of the average fluorescencelifetime of allophycocyanin (APC), phycocyanin (PC) andphycoerythrin (PE) under slow freezing.
APC in Na–Pi buffer containing 90% glycerol (open triangles)and dehydrated APC (open diamonds). The temperaturedependence of the fluorescence lifetime of APC solutions inNa–Pi buffer can be divided into three regions (figure 2).At room temperature, the fluorescence lifetime τav wasfound to be 1.6 ns, which is typical for APC in the nativeconformation [9]. In the case of fast freezing, the decreasein temperature was accompanied by an increase in τav up to2.0–2.1 ns at −180 ◦C. Subsequent rewarming of the samplesto 25 ◦C led to a reversible decrease in τav to the initial value of1.6 ns. Cooling from 25 to 4 ◦C entails an increase of τav from1.6 to 1.8 ns, both in the case of fast and slow freezing. In thetemperature range from 4 to −15 ◦C, only a slight decrease inthe τav value is observed. However, in the case of fast freezingwe found a strong decrease in the τav down to 0.6 ns. ForPC and PE a similar behavior is observed (see figure 3). Inthe temperature range from −15 to −192 ◦C, the τav valuegradually increases both in slow and fast frozen samples byapproximately 0.2 ns. The temperature dependence of τav ofallophycocyanin solutions in 90% glycerol and in vacuumdried samples did not show the anomalous sharp decrease ofthe fluorescence lifetime typical for slow freezing in aqueousmedia (figure 2), but behave like the rapidly frozen APC inNa–Pi buffer.
These results suggest that the anomalously sharp dropof the lifetime τav of allophycocyanin (region 2) dependson the presence of water molecules in the immediatemicroenvironment of the protein and chromophores. Toillustrate this assumption, we measured the allophycocyaninfluorescence lifetime in sodium-phosphate buffer preparedwith heavy water (D2O). As can be seen from figure 4,the replacement of H2O with D2O increased the initialfluorescence lifetime at 25 ◦C by approximately 0.6 ns(i.e., by 34%). This effect may be due to the fact that thefrequency of stretching vibrations of D–O bonds is by about35% lower than the frequency of H–O vibrations due to
4

Laser Phys. Lett. 10 (2013) 055602 E G Maksimov et al
Figure 4. Temperature dependence of the average lifetime of APCfluorescence in the 660 nm channel under slow freezing. Excitation:405 nm. Red circles—slow freezing of APC in H2O Na-phosphatebuffer; black squares—slow freezing in D2O Na-phosphate buffer.
the greater mass of the deuterium atom [35], thus leadingto a decrease of the integrated overlap of the vibrationalwavefunctions of S1 and S0 states. As a consequence, theprobability of internal nonradiative conversion [36] decreasesand concomitantly the lifetime of the excited state S1 andthe fluorescence quantum yield increases. The data presentedin figure 4 clearly show that the presence of water in theprotein–chromophore complex is responsible for the observedanomalous temperature dependence of τav of allophycocyaninunder slow freezing. We propose that this phenomenon is dueto the water effect on the APC protein structure under slowfreezing.
Temperature changes cause different populations ofvibrational levels of molecules and, as a result, changes intheir fluorescence spectra. In fact, if a decrease in temperaturealters the conformation of the protein matrix of chromophores,it should be manifested as a change in the peak positionand half-width of the fluorescence spectrum [37]. Followingthis suggestion, we studied the changes of the fluorescencespectra of aqueous APC solutions during fast and slowfreezing. For a detailed quantitative analysis, time-integratedfluorescence spectra were approximated by a Gaussian curve,which made it possible to determine more accurately theposition of the maximum and the half-width of the spectra.Figure 5 shows the time integrated fluorescence spectra ofAPC in Na-Phosphate buffer, recorded during slow freezingat +6, −24, and −180 ◦C. Slow freezing from +6 to −24 ◦Cleads to inhomogeneous broadening of the APC fluorescencespectrum due to the increase of fluorescence intensity in thelow-frequency oscillations region. The subsequent decreasein temperature from −24 to −180 ◦C causes a decreasein fluorescence intensity in the region of high-frequencyoscillations of the APC fluorescence spectra. These changesin the APC fluorescence spectra are illustrated by thetemperature dependence of FWHM shown in figure 6. Asin the case of the temperature dependence of τav (figure 2),the dependence of FWHM can be divided into three sections.During fast and slow freezing, an increase in τav (figure 2)
Figure 5. Fluorescence spectra of APC obtained by integrating thetime-resolved spectra in different regions of the temperaturedependence of slow freezing. For comparison, the inset shows thesteady-state APC fluorescence spectra monitored with a Hitachi 850(solid red curve) and the integrated TCSPC data (dotted black line)at room temperature.
Figure 6. Effect of freezing rate and solvent on the half-width ofthe fluorescence spectrum of allophycocyanin in Na-phosphatebuffer (pH 7.0). The black squares and red circles correspond to fastand slow freezing, respectively. Numerals 1–3 indicate differentregions of the temperature dependence.
was accompanied by a smooth decrease in the FWHM(figure 6) in regions 1 and 3 due to the reduced contribution ofemission in the shortwave part of the fluorescence spectrum(high-frequency transitions). A strikingly different featureemerges in region 2 for the slowly frozen samples, where asharp widening in the red region of the fluorescence spectrum(low-frequency transitions) is observed when the temperaturedecreases (figures 5–6). Both for the slow and fast freezing,the direction of changes (figure 6) were opposite to that ofτav (figure 2). The calculated correlation coefficients for thetemperature dependences of τav and FWHM were −0.89 and−0.91 in the case of both fast and slow freezing modes,respectively (the same results were obtained for PE and PC,data not shown).
The differences in changes of τav during fast and slowfreezing are suggestive of principally different mechanisms
5

Laser Phys. Lett. 10 (2013) 055602 E G Maksimov et al
Figure 7. Average fluorescence lifetime (τav) and FWHM ofphycoerythrin at different pH values.
of changes in the intramolecular mobility of the PCBchromophores under these conditions. The freezing rate has adramatic effect on the temperature dependence of τav only inaqueous solutions of phycobiliproteins. Therefore, the aquaticenvironment is responsible for the anomalous dependenceof these parameters on the freezing rate. The increase ofτav in regions 1 and 3 (figure 2) at low temperatures inboth cases can probably be explained by the depopulation ofhigher vibrational levels of allophycocyanin. This assumptionis confirmed by the decrease of the half-width and theshift of the maximum of the fluorescence spectrum of APC(figure 5) in these temperature ranges due to ‘freezing off’the high-frequency modes. The same feature was observedfor other phycobiliproteins (data not shown). The discoveredanomalously abrupt change of τav in region 2 of thetemperature dependence in the case of the slow freezing ofthe sample may be related to the ice–water phase transitionthat occurs in this temperature region. It is known that thefluorescence quantum yield ϕfl of phycobiliproteins stronglydepends on the spatial structure of the chromophore. Underconditions when the chromophore has a native conformation,ϕfl attains maximum values (0.6–0.7). As a result of APCdenaturation caused by concentrated urea solution, the proteinmolecule becomes a loose globule and the chromophoreswitches from the Z to E form. As a consequence ϕfl isreduced dramatically [13, 38]. Under these conditions, wefound that the τav value was also reduced by approximatelyfive times (data not shown). We assume that slow freezing ofthe chromophore–protein–water system enables the networkof water molecules in the protein to form microcrystals,thus causing a reversible change in the quaternary andtertiary structures of the protein, which, in turn, gives rise toconformational changes of the chromophore, similar to thoseoccurring during denaturation.
Another factor which affects the protein conformationis pH. It is known that many proteins retain their nativeconformation and physiological activity only within a certainpH range. The protein conformation become disruptedoutside of this region, so that the activity decreasesdramatically [34]. We found that the phycoerythrin exhibitsa high stability within a wide pH range from 5 to 8, where we
Figure 8. Influence of the pH on circular dichroism spectra of thephycoerythrin.
recorded practically constant fluorescence lifetime values (seefigure 7) (we have obtained similar results for other PBPs).Outside of this range we determined shorter fluorescencelifetimes concomitant with an increase of the FWHM ofthe fluorescence spectrum (figure 7) and a significant shiftof the emission maximum to shorter wavelengths. Thisfeature is similar to that found in the case of freezing. Weobserved a strong correlation upon changes of pH betweenτav and FWHM of the fluorescence spectrum (correlationcoefficient = −0.94 in range from 2.3 to 9.3).
We observed a sharp increase in the half-width ofthe fluorescence spectrum at extreme pH values, similarto the effect described for the slow freezing experiment.We suggest that pH-induced conformational changes of theprotein structure lead to the isomerization of the chromophorefrom the native Z to E form.
CD spectra were recorded in order to check changes ofstrong chromophore coupling that occur due to the formationof trimers. Figure 8 shows CD spectra of phycoerythrin atpH 7 and pH 2.3. Drastic changes are observed, which areindicative of a disruption of the excitonic interactions betweenthe chromophores caused by trimer–monomer transition atlow pH [9].
Measurements of the size distribution were performedat the Nano-ZS (Malvern, UK). Scattered light (632.8 nmof a helium–neon laser) is detected at an angle of173◦ (backscattering). The experiments performed at 20 ◦Creveal that the peak corresponding to monomers ofphycoerythrin in the distribution of particle sizes is visibleat about 30 nm at pH 3. Thus lowering the pH from 7to 2.3 leads most probably to a trimer–monomer transition,followed by protein aggregation. It should be noted thatthe hydrodynamic size of particles is different from theparticle size obtained by x-ray diffraction crystallography. Itis obvious that pH changes the surface charge of proteins.We constructed equipotential surfaces for pH 7 and pH3 to illustrate this phenomenon (figure 10). (We used ahome-made plugin for PyMol, negative charges are shown inred and positive changes in blue; the structure used for thecalculation is monomer of allophycocyanin 1ALL from PDB,
6

Laser Phys. Lett. 10 (2013) 055602 E G Maksimov et al
Figure 9. Distribution of hydrodynamic size of phycoerythrinparticles at different pH values.
see figure 1.) The results depicted in figure 10 show that adrop of pH leads to a reduction in the number of negativelycharged sites of the protein. Probably the formation of trimerfrom monomers is due to electrostatic interactions of specificsites in the protein structure. Thus, the change of pH is a factorthat alters the native structure of proteins and chromophoresof phycobiliproteins.
In addition we recorded the change in the lifetime ofpure allophycocyanin at a slow freezing rate after excitationat 635 nm (figure 11). Contrary to expectations we found noreduction in fluorescence lifetime during the slow freezingprocess.
These results suggest that changes in protein con-formation during slow freezing itself do not change theconformation of the chromophore. Probably, the observedanomalous reduction of fluorescence lifetimes of phyco-biliproteins are the result of photo-induced isomerizationof the chromophores within the protein of destabilizedconformation. Important factors determining the possibility ofa conformational transition are the photon energy and photonflux density. This dependences will be analyzed in futurestudies.
5. Discussion
α-phycoerythrocyanin (α-PEC) is capable of photoisomer-ization. In the trimeric state, the photoreactivity of α-PECis strongly suppressed by interactions with neighboringsubunits, whereas the isolated α-subunit is fully photoac-tive [39]. Excitation of the α-subunit in the E-configurationat 500 nm shifts the absorption maximum to 567 nm ofthe Z-configuration, and vice versa. The prerequisite forthe reversible Z to E isomerization of the phycoviolobilin(PVB) is a high protein flexibility, especially of the extendedloop between helices H4 and H5. A comparison of thestructures of α-E-PEC and α-Z-PEC illustrates the Z toE transitions in biliproteins. The photochemistry in α-PECis coupled to two regions, the H4–H5 and H7–H8 loopswhere large structural changes occur [15, 16, 39, 40].
Figure 10. Equipotential surfaces of (αβ)1 allophycocyaninmonomer at pH 7 and 3. Obtained via home-made plugin forPyMol, negative charges are shown in red and positive changes inblue; the structure used for the calculation is monomer ofallophycocyanin 1ALL, (see figure 1).
Figure 11. Average lifetime of allophycocyanin fluorescence at660 nm under slow freezing conditions. Red circles and bluetriangles reflect data obtained under excitation at 635 nm and405 nm, respectively.
Since the structures of α-phycoerythrocyanin and otherphycobiliproteins are very similar, we can assume that theisomerization of the chromophores can occur under the
7
Laser Phys. Lett. 10 (2013) 055602 E G Maksimov et al
influence of different environmental factors [17, 41]. It seemslikely that not only photoisomerization of the chromophorescan lead to a change in protein conformation, but alsochanges in the protein conformation due to slow freezingor extreme pH values might facilitate Z to E transitionsof the chromophores. Thus, different types of effects (pH,freezing or light) can lead to similar changes in spectralcharacteristics of the phycobiliproteins. In the native statethe photo-induced Z to E isomerization is suppressed bythe protein environment. This protection mechanism issuppressed, if the water-containing protein environment isfreezing slowly in buffer without glycerol, thus allowing theformation of microcrystals of water. The hydrated protein atroom temperature has a stabilizing effect on the molecularstructure of the chromophores.
Several features can change the conformation of thephycobiliproteins. At first, the hydrophobic interactions thathold the protein compact are considerably weaker at lowtemperatures [34]. The loosening of the native structureof the protein leads to the appearance of new vibrationaldegrees of freedom. This probably can explain the observedinhomogeneous broadening of the fluorescence spectrum ofallophycocyanin (figure 4). Secondly, slow freezing yieldslarge ice crystals [42]. The emergence of such a crystal (forexample, in the inner cavity of the phycobiliprotein trimer,which is ∼3 nm) can lead to a change in the geometry ofthe protein and eventually disrupt the interaction betweenthe monomers within the trimer. As a consequence, theconformation of chromophores can change. The thermaleffects accompanying these rearrangements can be quitesmall, and therefore occur in a small temperature range.Even a small change in the number of bonds can entail arearrangement of the whole system in certain structures [43].From this point of view, the phase transition of watermay be accompanied by the rupture of a small number ofhydrogen bonds that fix the α-helices in the phycobiliproteinstructure relative one to another. As a result of this effect,a conformational change, accompanied by a sharp changein the quantum yield and lifetime of fluorescence of thepigment molecule, could occur. The experiments performedafter excitation at 635 nm have shown that the slow freezingper se does not cause the strong reduction of the fluorescencelifetime. Based on these considerations we assume that theobserved effects may include several steps: slow freezingalters the conformation of monomeric subunits, followed bya weakening of the interaction between the monomers in thetrimer of the PBPs, eventually leading to photoisomerizationof the chromophores. In this way the slow freezing is likelyto cause mechanical changes in protein conformation that canfacilitate the photoisomerization of the chromophores. Thisphenomenon observed on samples in a hydrated environmentis suppressed by fast freezing or addition of glycerol.
Thus, we experimentally found that the spectralcharacteristics and the lifetime of aqueous solutions ofthe phycobiliprotein fluorescence anomalously depend ontemperature and rate of freezing. These data indicate areversible change in the phycobiliprotein conformation duringslow freezing as a result of the water–ice phase transition.
Acknowledgments
The financial support by BMBF RUS 10/026 is gratefullyacknowledged. V Z Paschenko and E G Maksimov thankalso the Russian Foundation for Basic Research (projectno. 11-04-01617 and no. 12-04-31100) and the Ministry ofEducation, Russian Federation (project no. 16.513.11.3078)for the partial support of this work.
References
[1] McGregor A, Klartag M, David L and Adir N 2008Allophycocyanintrimer stability and functionality areprimarily due to polar enhanced hydrophobicity of thephycocyanobilin binding pocket J. Mol. Biol. 384 406–21
[2] Debreczeny M P, Sauer K, Zhou J and Bryant D A 1995Comparison of calculated and experimentally resolved rateconstants for excitation energy transfer in c-phycocyanin 2.Trimers J. Phys. Chem. 99 8420
[3] Lambrev P H, Schmitt F-J, Kussin S, Schoengen M,Varkonyi Z, Eichler H J, Garab G and Renger G 2011Functional domain size in isolated aggregates oflight-harvesting complex II and thylakoid membranesBiochim. Biophys. Acta 1807 1022–31
[4] Glazer A 1984 Phycobilisome. A macromolecular complexoptimized for light energy transfer Biochim. Biophys. Acta768 29–51
[5] Maksimov E G, Kuzminov F I, Konyuhov I V,Elanskaya I V and Paschenko V Z 2011 Photosystem 2effective fluorescence cross-section of cyanobacteriumSynechocystis sp. PCC6803 and its mutants J. Photochem.Photobiol. B 104 285–91
[6] Mullineaux C W and Holzwarth A R 1991 Kinetics ofexcitation energy transfer in the cyanobacterialphycobilisome-photosystem II complex Biochim. Biophys.Acta 1098 68–78
[7] Liu J-Y, Jiang T, Zhang J-P and Liang D-C 1999 Crystalstructure of allophycocyanin from red algae porphyrayezoensis at 2.2-A resolution J. Biol. Chem. 274 16945–52
[8] MacColl R, Csatorday K, Berns D S and Traeger E 1980Chromophore interactions in allophycocyanin Biochemistry19 2817–20
[9] MacColl R, Eisele L E and Menikh A 2003 Allophycocyanin:trimers, monomers, subunits, and homodimers Biopolymers72 352–65
[10] Edington M D, Riter R E and Beck W F 1995 Evidence forcoherent energy transfer in allophycocyanin trimers J. Phys.Chem. 99 15699–704
[11] Renger T, Trostmann I, Theiss C, Madjet M E, Richter M,Paulsen H, Eichler H J, Knorr A and Renger G 2007Refinement of a structural model of a pigment-proteincomplex by accurate optical line shape theory andexperiments J. Phys. Chem. B 111 10487
[12] Loos D, Cotlet M, De Schryver F, Habuchi S and Hofkens J2004 Single-molecule spectroscopy selectively probesdonor and acceptor chromophores in the phycobiliproteinallophycocyanin Biophys. J. 87 2598–608
[13] Bischoff M, Hermann G, Rentsch S, Strehlow D, Winter S andChosrowjan H 2000 Excited-state processes in phyco-cyanobilin studied by femtosecond spectroscopyJ. Phys. Chem. B 104 1810–6
[14] Brejc K, Ficner R, Huber R and Steinbacher S 1995 Isolation,crystallization, crystal structure analysis and refinement ofallophycocyanin from the cyanobacterium Spirulinaplatensis at 2.3 A resolution J. Mol. Biol. 249 424–40
8
Laser Phys. Lett. 10 (2013) 055602 E G Maksimov et al
[15] Schmidt M, Patel A, Zhao Y and Reuter W 2007 Structuralbasis for the photochemistry of α-phycoerythrocyaninBiochemistry 46 416–23
[16] Schmidt M, Krasselt A and Reuter W 2005 Local proteinflexibility as a prerequisite for reversible chromophoreisomerization in alpha-phycoerythrocyanin Biochim.Biophys. Acta 1764 55–62
[17] Goldsmith R H and Moerner W E 2010 Watchingconformational- and photodynamics of single fluorescentproteins in solution Nature Chem. 2 179–86
[18] Schmitt F-J, Maksimov E G, Suedmeyer H, Jeyasangar V,Theiss C, Paschenko V Z, Eichler H J and Renger G 2010Time resolved temperature switchable excitation energytransfer processes between CdSe/ZnS nanocrystals andphycobiliprotein antenna from Acaryochloris marinaPhoton. Nanostruct.: Fundam. Appl. 9 190–5
[19] Maksimov E G, Gostev T S, Kuz’minov F I, Sluchanko N N,Stadnichuk I N, Pachenko V Z and Rubin A B 2010 Hybridsystems of quantum dots mixed with the photosensitiveprotein phycoerythrin Nanotechnol. Russ. 5 531–7
[20] Schmitt F-J, Maksimov E G, Hatti P, Weißenborn J,Jeyasangar V, Razjivin A P, Paschenko V Z,Friedrich T and Renger G 2012 Coupling of differentisolated photosynthetic light harvesting complexes andCdSe/ZnS nanocrystals via Forster resonance energytransfer Biochim. Biophys. Acta 1817 1461–70
[21] Porter G, Tredwell C J, Searle G F W and Barber J 1978Picosecond time-resolved energy transfer in porphyridiumcruentum Biochim. Biophys. Acta 501 232–45
[22] Stadnichuk I N, Yanyushin M F, Maksimov E G,Lukashev E P, Zharmukhamedov S K, Elanskaya I V andPaschenko V Z 2012 Site of non-photochemical quenchingof the phycobilisome by orange carotenoid protein in thecyanobacterium synechocystis sp. pcc 6803 Biochim.Biophys. Acta 1817 1436–45
[23] Kerfeld C A and Kirilovsky D 2011 Photoptotection incyanobacteria: the orange carotenoid protein and energydissipation Bioenergetic Processes of Cyanobacteriaed G A Peschek, C Obinger and G Renger (Dodrecht:Springer)
[24] Sharkov A V, Kryukov I, Khoroshilov E V, Kryukov P G,Fischer R, Scheer H and Gillbro T 1994 Femtosecondspectral and anisotropy study of excitation energy transferbetween neighbouring α-80 and β-81 chromophores ofallophycocyanin trimers Biochim. Biophys. Acta1188 349–56
[25] Sharkov V, Gulbinas V, Gottschalk L, Scheer H andGillbro T 1996 Dipole–dipole interaction inphycobiliprotein trimers. femtosecond dynamics ofallophycocyanian. Excited state absorption Braz. J. Phys.26 553–9
[26] Leclerc J C, Hoarau J and Remy R 1979 Analysis ofabsorption spectra changes induced by temperaturelowering on phycobilisomes, thylakoids andchlorophyll-protein complexes Biochim. Biophys.Acta—Bioenerg. 547 398–409
[27] Rippka R, Waterbury J and Cohen-Bazire G 1974A cyanobacterium which lacks thylakoids Arch. Microbiol.100 419–36
[28] Guglielmi G, Cohen-Bazire G and Bryant D A 1981The structure of gloeobacter violaceus and itsphycobilisomes Arch. Microbiol. 129 181–9
[29] Laemmli U K 1970 Cleavage of structural proteins during theassembly of the head of bacteriophage T4 Nature227 680–5
[30] Li L, Zhang J, Jiang T, Guo B, Chang W and Liang D 2001Purification, crystallization and preliminarycrystallographic investigations of selenium-containingphycocyanin from selenium-rich algae (Spirulina platensis)Sci. China C Life Sci. 44 337–44
[31] Gottschalk L, Lottspeich F and Scheer H 1993 Reconstitutionof allophycocyanin from Mastigocladus laminosus withisolated linker polypeptide Photochem. Photobiol. 58 761–7
[32] Becker & Hickl GmbH 2006 PML-16-C 16 channel detectorhead for time correlated single photon counting UserHandbook Berlin (www.becker-hickl.de/pdf/pml16c21.pdf)
[33] Schmitt F J 2011 Picobiophotonics for the investigation ofpigment–pigment and pigment–protein interactions inphotosynthetic complexes Thesis Technische UniversitatBerlin
[34] Rubin A B 1999 Biophysics: Theoretical Biophysics: ATextbook for High Schools 2nd edn (Moscow: MoscowUniversity) p 448
[35] Lobyshev V N and Kalinichenko L P 1978 Isotope Effects ofD2O in Biological Systems (Moscow: Nauka) p 215
[36] Birks J B and Munro I H 1967 The fluorescence lifetimes ofaromatic molecules Progress in Reaction Kineticsvol 4 (Oxford: Pergamon) p 239
[37] Pieper J, Schodel R, Irrgang K, Voigt J and Renger G 2001Electron–phonon coupling in solubilized LHCII complexesof green plants investigated by line-narrowing andtemperature-dependent fluorescence spectroscopy J. Phys.Chem. B 105 7115
[38] Holzwarth A R 1991 Structure-function relationships andenergy transfer in phycobiliprotein antennae Physiol. Plant.83 518–28
[39] Siebzehnrubl S, Fischer S F, Kufer W and Scheer H 1989Photochemistry of phycobiliproteins: reciprocity ofreversible photochemistry and aggregation inphycoerythrocyanin from Mastigocladus laminosusPhotochem. Photobiol. 49 753–61
[40] Duerring M, Huber R, Bode W, Ruembeli R and Zuber H1990 Refined three-dimensional structure ofphycoerythrocyanin from the cyanobacteriumMastigocladus laminosus at 2.7 A J. Mol. Biol. 211 633–44
[41] Ohad I, Clayton R K and Bogorad L 1979 Photoreversibleabsorbance changes in solutions of allophycocyaninpurified from F. diplosiphon: temperature dependence andquantum efficiency Proc. Natl Acad. Sci. USA 76 5655–9
[42] Schulson E M 1999 The structure and mechanical behavior ofice JOM 51 21–7
[43] Chernavskaya N M and Chernavskii D S 1999Protein-Machine. Biological Macromolecular Structure1st edn (Moscow: Moscow University Press)
Chernavskaya N M and Chernavskii D S 1999Protein-Machine. Biological Macromolecular Structure2nd edn (Moscow: Janus) p 254
9