Novel Application of Fluorescence Lifetime and Fluorescence Microscopy Enables Quantitative Access...
13
Novel Application of Fluorescence Lifetime and Fluorescence Microscopy Enables Quantitative Access to Subcellular Dynamics in Plant Cells Kirstin Elgass 1 , Katharina Caesar 2 , Frank Schleifenbaum 1,2 , York-Dieter Stierhof 3 , Alfred J. Meixner 1 *, Klaus Harter 2 * 1 Institute for Physical and Theoretical Chemistry, University of Tu ¨ bingen, Tu ¨ bingen, Germany, 2 Center for Plant Molecular Biology, Department of Plant Physiology, University of Tu ¨ bingen, Tu ¨ bingen, Germany, 3 Center for Plant Molecular Biology, Microscopy, University of Tu ¨ bingen, Tu ¨ bingen, Germany Abstract Background: Optical and spectroscopic technologies working at subcellular resolution with quantitative output are required for a deeper understanding of molecular processes and mechanisms in living cells. Such technologies are prerequisite for the realisation of predictive biology at cellular and subcellular level. However, although established in the physical sciences, these techniques are rarely applied to cell biology in the plant sciences. Principal Findings: Here, we present a combined application of one-chromophore fluorescence lifetime microscopy and wavelength-selective fluorescence microscopy to analyse the function of a GFP fusion of the Brassinosteroid Insensitive 1 Receptor (BRI1-GFP) with high spatial and temporal resolution in living Arabidopsis cells in their tissue environment. We show a rapid, brassinolide-induced cell wall expansion and a fast BR-regulated change in the BRI1-GFP fluorescence lifetime in the plasmamembrane in vivo. Both cell wall expansion and changes in fluorescence lifetime reflect early BR-induced and BRI1-dependent physiological or signalling processes. Our experiments also show the potential of one-chromophore fluorescence lifetime microscopy for the in vivo monitoring of the biochemical and biophysical subcellular environment using GFP fusion proteins as probes. Significance: One-chromophore fluorescence lifetime microscopy, combined with wavelength-specific fluorescence microscopy, opens up new frontiers for in vivo dynamic and quantitative analysis of cellular processes at high resolution which are not addressable by pure imaging technologies or transmission electron microscopy. Citation: Elgass K, Caesar K, Schleifenbaum F, Stierhof Y-D, Meixner AJ, et al. (2009) Novel Application of Fluorescence Lifetime and Fluorescence Microscopy Enables Quantitative Access to Subcellular Dynamics in Plant Cells. PLoS ONE 4(5): e5716. doi:10.1371/journal.pone.0005716 Editor: Markus Grebe, Umea ˚ Plant Science Centre, Sweden Received October 31, 2008; Accepted April 30, 2009; Published May 27, 2009 Copyright: ß 2009 Elgass et al. This is an open-access article distributed under the terms of the Creative Commons Attribution License, which permits unrestricted use, distribution, and reproduction in any medium, provided the original author and source are credited. Funding: The funders had no role in study design, data collection and analysis, decision to publish, or preparation of the manuscript. This work was funded by Ph.D. fellowships from the state Baden-Wuerttemberg to KE and KC and a DFG grant to KH (HA2146/10-1). Competing Interests: The authors have declared that no competing interests exist. * E-mail: [email protected] (AJM); [email protected] (KH) Introduction Fluorescence microscopy is a powerful tool for studying the subcellular partitioning and intracellular dynamics of fluorophor- tagged proteins in living cells [1–3]. It has become possible to combine fluorescence microscopy with new time-resolved laser spectroscopic methods. Higher-order pulsed laser irradiation (Stim- ulated Emission Depletion microscopy, STED) [4–5] or single molecule blinking statistics (PhotoActivated Localization Microscopy, PALM) [6] and high resolution colocalization of single molecules (STORM) [7] are used for obtaining ultra-high spatial resolution far below the diffraction limit. For observing dynamic processes associated with single molecules, techniques such as fluorescence correlation spectroscopy (FCS) are available [8–13]. However, the high resolution and sensitive fluorescence microscopy of proteins, such as membrane-bound receptor kinases, is difficult to carry out in living plant cells, especially in the context of their tissue, due to the autofluorescence of cellular compartments such as the cell wall. This problem is usually circumvented by studying proteins of higher plants in mammalian cells [14], plant protoplasts [15–16] or plant cells after plasmolysis [17]. An in vivo FCS analysis of phytochrome mobility was reported for moss protonemal tip cells [18]. However, protoplast preparation and plasmolysis induce stress responses and may modify the subcellular partitioning, intracellular dynamics and activity of the receptors. Furthermore, expression of plant receptors in heterologous systems may lead to artificial results. Due to these limitations, our knowledge on cell biological mechanisms, by which, for instance, membrane-associated receptors act at the plant cell surface, traffic inside the plant cell and induce early cellular responses, is restricted. To overcome these limitations, we applied one-chromophore fluorescence lifetime microscopy (ocFLM), combined with wave- length-selective fluorescence microscopy, to plant cells in their tissue environment in Arabidopsis thaliana at high local resolution. Our ocFLM system consisted of a confocal sample scanning microscope (CSSM), a spectrally integrating detector for measur- ing fluorescence intensity and a time-correlated single-photon counting board for recording fluorescence lifetime decays, which was custom-built in our lab [19–20]. For plant material, light- PLoS ONE | www.plosone.org 1 May 2009 | Volume 4 | Issue 5 | e5716
-
Upload
uni-tzuebingen -
Category
Documents
-
view
0 -
download
0
Transcript of Novel Application of Fluorescence Lifetime and Fluorescence Microscopy Enables Quantitative Access...
Novel Application of Fluorescence Lifetime andFluorescence Microscopy Enables Quantitative Access toSubcellular Dynamics in Plant CellsKirstin Elgass1, Katharina Caesar2, Frank Schleifenbaum1,2, York-Dieter Stierhof3, Alfred J. Meixner1*,
Klaus Harter2*
1 Institute for Physical and Theoretical Chemistry, University of Tubingen, Tubingen, Germany, 2 Center for Plant Molecular Biology, Department of Plant Physiology,
University of Tubingen, Tubingen, Germany, 3 Center for Plant Molecular Biology, Microscopy, University of Tubingen, Tubingen, Germany
Abstract
Background: Optical and spectroscopic technologies working at subcellular resolution with quantitative output arerequired for a deeper understanding of molecular processes and mechanisms in living cells. Such technologies areprerequisite for the realisation of predictive biology at cellular and subcellular level. However, although established in thephysical sciences, these techniques are rarely applied to cell biology in the plant sciences.
Principal Findings: Here, we present a combined application of one-chromophore fluorescence lifetime microscopy andwavelength-selective fluorescence microscopy to analyse the function of a GFP fusion of the Brassinosteroid Insensitive 1Receptor (BRI1-GFP) with high spatial and temporal resolution in living Arabidopsis cells in their tissue environment. Weshow a rapid, brassinolide-induced cell wall expansion and a fast BR-regulated change in the BRI1-GFP fluorescence lifetimein the plasmamembrane in vivo. Both cell wall expansion and changes in fluorescence lifetime reflect early BR-induced andBRI1-dependent physiological or signalling processes. Our experiments also show the potential of one-chromophorefluorescence lifetime microscopy for the in vivo monitoring of the biochemical and biophysical subcellular environmentusing GFP fusion proteins as probes.
Significance: One-chromophore fluorescence lifetime microscopy, combined with wavelength-specific fluorescencemicroscopy, opens up new frontiers for in vivo dynamic and quantitative analysis of cellular processes at high resolutionwhich are not addressable by pure imaging technologies or transmission electron microscopy.
Citation: Elgass K, Caesar K, Schleifenbaum F, Stierhof Y-D, Meixner AJ, et al. (2009) Novel Application of Fluorescence Lifetime and Fluorescence MicroscopyEnables Quantitative Access to Subcellular Dynamics in Plant Cells. PLoS ONE 4(5): e5716. doi:10.1371/journal.pone.0005716
Editor: Markus Grebe, Umea Plant Science Centre, Sweden
Received October 31, 2008; Accepted April 30, 2009; Published May 27, 2009
Copyright: � 2009 Elgass et al. This is an open-access article distributed under the terms of the Creative Commons Attribution License, which permitsunrestricted use, distribution, and reproduction in any medium, provided the original author and source are credited.
Funding: The funders had no role in study design, data collection and analysis, decision to publish, or preparation of the manuscript. This work was funded byPh.D. fellowships from the state Baden-Wuerttemberg to KE and KC and a DFG grant to KH (HA2146/10-1).
Competing Interests: The authors have declared that no competing interests exist.
* E-mail: [email protected] (AJM); [email protected] (KH)
Introduction
Fluorescence microscopy is a powerful tool for studying the
subcellular partitioning and intracellular dynamics of fluorophor-
tagged proteins in living cells [1–3]. It has become possible to
combine fluorescence microscopy with new time-resolved laser
spectroscopic methods. Higher-order pulsed laser irradiation (Stim-
ulated Emission Depletion microscopy, STED) [4–5] or single
molecule blinking statistics (PhotoActivated Localization Microscopy,
PALM) [6] and high resolution colocalization of single molecules
(STORM) [7] are used for obtaining ultra-high spatial resolution far
below the diffraction limit. For observing dynamic processes
associated with single molecules, techniques such as fluorescence
correlation spectroscopy (FCS) are available [8–13]. However, the
high resolution and sensitive fluorescence microscopy of proteins,
such as membrane-bound receptor kinases, is difficult to carry out in
living plant cells, especially in the context of their tissue, due to the
autofluorescence of cellular compartments such as the cell wall. This
problem is usually circumvented by studying proteins of higher plants
in mammalian cells [14], plant protoplasts [15–16] or plant cells after
plasmolysis [17]. An in vivo FCS analysis of phytochrome mobility was
reported for moss protonemal tip cells [18]. However, protoplast
preparation and plasmolysis induce stress responses and may modify
the subcellular partitioning, intracellular dynamics and activity of the
receptors. Furthermore, expression of plant receptors in heterologous
systems may lead to artificial results. Due to these limitations, our
knowledge on cell biological mechanisms, by which, for instance,
membrane-associated receptors act at the plant cell surface, traffic
inside the plant cell and induce early cellular responses, is restricted.
To overcome these limitations, we applied one-chromophore
fluorescence lifetime microscopy (ocFLM), combined with wave-
length-selective fluorescence microscopy, to plant cells in their
tissue environment in Arabidopsis thaliana at high local resolution.
Our ocFLM system consisted of a confocal sample scanning
microscope (CSSM), a spectrally integrating detector for measur-
ing fluorescence intensity and a time-correlated single-photon
counting board for recording fluorescence lifetime decays, which
was custom-built in our lab [19–20]. For plant material, light-
PLoS ONE | www.plosone.org 1 May 2009 | Volume 4 | Issue 5 | e5716

grown seedlings expressing a BRI1-GFP fusion protein were used.
BRI1, a plasmalemma-bound receptor kinase for plant steroids
like brassinolide (BL) [21], recycles through endosomes [22–23]
and regulates many aspects of growth and differentiation,
including cell expansion [24].
As shown here, our combined optical-spectroscopic application,
together with a novel data analysis approach using BRI1-GFP as a
model receptor, provides unprecedented insight into cells and
opens up new frontiers for in vivo dynamic, quantitative analysis of
molecular and subcellular processes at high local resolution.
Results
Differentiation of GFP and fluorescence backgroundTo differentiate between background fluorescence and the
BRI1-GFP signal, we recorded a two-dimensional fluorescence
intensity image over the plasmalemma-cell wall area of BRI1-
GFP-expressing and wild type seedlings in root and shoot
(cotyledon) cells. In contrast to the spectra of non-transformed
wild type cells (Fig. 1A and B, black dots), the spectra of the BRI1-
GFP-expressing cells showed a higher overall intensity and two
main peaks (Fig. 1A and B, green dots). These two peaks are
typical of and specific for GFP in aqueous solution (Figure S1)
[25]. However, the spectra recorded from the plants differed
significantly and the shoulder amplitudes and intensity ratios of the
two maxima varied between root and cotyledon cells (Fig. 1A and
B). These data indicate that the degree and properties of
autofluorescence depend on the cell type and the autofluorescence
strongly interferes with the spectrum of GFP fluorescence
emission. Secondly, we recorded fluorescence lifetime decay traces
from a selected probe volume with pulsed laser excitation in living
plant cells. At the maximum of fluorescence emission between 500
Figure 1. Differentiation of autofluorescence and the GFP signal in BRI1-GFP-expressing and wildtype Arabidopsis cells. (A–B)Wavelength-resolved fluorescence spectra from plasmalemma-cell wall sections of BRI1-GFP-expressing cells (green) and wildtype cells (black). Thespectra were recorded in root, A, or cotyledon cells, B. The areas (50650 mm) used for recording are shown in the inlets. (C) In vivo decay trace offluorescence lifetime from BRI1-GFP expressing hypocotyl cells fitted by a mono-exponential function (black line). The lifetime decay was measured atthe peak of fluorescence intensity at 500 to 512 nm. (D) In vivo decay trace of autofluorescence lifetime in the plasmalemma-cell wall area of wildtypehypocotyl cells fitted by a mono-exponential function (black line). (E) In vivo decay trace of autofluorescence lifetime in the plasmalemma-cell wallarea of wildtype hypocotyl cells fitted by a multi-exponential function (black line). The lifetime decay was measured at around 500 to 512 nm. Theresiduals indicate the deviation between the measured and the model decay function. In a good fit the residuals are distributed symmetrically around0. IRF, instrument response function.doi:10.1371/journal.pone.0005716.g001
Subcellular Dynamics in Plants
PLoS ONE | www.plosone.org 2 May 2009 | Volume 4 | Issue 5 | e5716

and 512 nm of BRI1-GFP expressing hypocotyl cells (Fig. 1B), the
lifetime was characterized by a mono-exponential decay (Fig. 1C)
typical for GFP (Figure S1) [26–27]. In contrast, the background
autofluorescence, which was recorded at the identical wavelength
range in wildtype hypocotyl cells, strongly deviated from the
mono-exponential decay function (Fig. 1D). An acceptable fit to
the experimental data with respect to the average lifetime and
amplitude could only be achieved by a multi-exponential decay
function (Fig. 1E, see Table S1 for additional information on the
fitting parameters of all lifetime decay traces shown here).
Furthermore, we were faced with the problem that the cell wall
in the CSSM images appeared to be much thicker than when it
was determined by transmission electron microscopy (TEM)
(Fig. 2). However, one has to take into account the non-point-
shaped dimension of the confocal laser beam focus. When this is
considered, the measured full width at half maximum (FWHM)
values of the Gaussian fits of the fluorescence intensity distribution
of 425 nm for the periclinal cell wall (Fig. 2A) and 774 nm for the
anticlinal cell wall (Fig. 2B) reflect a thickness of 83 nm and
432 nm, respectively (see Text S1 for calculation). The values of
the periclinal cell walls are, therefore, consistent with those
determined by TEM (about 45 to 100 nm; Fig. 2C; Table S5).
The width of the anticlinal walls detected by our fluorescence
intensity approach was still too large to correspond to our TEM
measurements. However, to understand the values determined for
the longer anticlinal walls, one has to take into account that a cell
wall slanted to a few degrees appears to have a higher CSSM-
measured thickness. For instance, imaging cell membranes
bordering a cell wall with a real thickness of 100 nm at a slant
of 30u generates a FWHM value of around 730 nm (see Text S1
for calculation). Thus, the prevailing larger FWHM values of the
anticlinal cell wall measurements can be explained by their higher
bending probability which results in higher slanting effects in the
focus of the confocal microscope. Therefore, for an accurate
determination of small changes in the expansion of plasmamem-
brane-cell wall areas, the selected section has to be kept in tight
focus during the entire analysis, which is enabled by our
experimental CSSM setup.
In addition, the differences of GFP and background fluores-
cence with respect to their spectra and fluorescence lifetime
enabled us to choose the appropriate experimental set-up for the
distinction of subcellular compartments such as the plasmalemma
and the cell wall (Fig. 3). Thus, we used the emission range at
around 500 nm for recording GFP fluorescence and the range at
around 600 nm for recording cell wall autofluorescence (hatched
bars in Fig. 3A).
Rapid BL-induced cell wall expansion in vivoWe next addressed the problem of real-time measurement of
possible physiological effects of BRI1-GFP at subcellular level in
living plant cells. Former studies have shown that BL does not alter
the fluorescence intensity, the number of vesicles in the endosomal
pool and the intracellular distribution of BRI1-GFP in root cells
[22]. This is in agreement with our observations (Fig. 4A to C,
Fig. 5 and data not shown). However, the local fluorescence
intensity of BRI1-GFP as a function of BL, time and a defined
Figure 2. Dimensional appearance of periclinal and anticlinal cell walls in confocal and TEM images. (A) Fluorescence intensity curverecorded over a plasmalemmata-wall section of the periclinal wall of BRI1-GFP expressing Arabidopsis root cells. The full width at half maximum value(FWHM) of the Gaussian fitting revealed an apparent wall thickness of 425630 nm. (B) Fluorescence intensity curve recorded over a plasmalemmata-wall section of the anticlinal wall of the identical root cell described in A. The FWHM of the Gaussian fitting revealed an apparent wall thickness of773633 nm. (C) Ultrathin TEM image of a tissue section cutting three different root cells. Two anticlinal and one periclinal cell walls (CW) are shown.CO, cortical cell; EP, epidermal cell; ER, endoplasmatic reticulum; EB, ER body; M, mitochondrium; V, vacuole. The arrow heads point to Golgi-derivedvesicles. The bar represents 500 nm.doi:10.1371/journal.pone.0005716.g002
Subcellular Dynamics in Plants
PLoS ONE | www.plosone.org 3 May 2009 | Volume 4 | Issue 5 | e5716

subcellular area was not yet studied. We therefore, recorded
fluorescence intensity profiles over selected plasmalemmata-cell
wall sections before and after treating the cells for 15 to 30 min
with 10 nM BL. The intensity profiles enabled us to discriminate
between the fluorescence signal of the proper plasmalemmata-cell
wall section and membrane vesicles, which budded from the
plasmalemmata during the incubation time. As shown in Fig. 4A–
D and Fig. 5, the treatment of seedlings with BL induced an
expansion of the BRI1-GFP signal in the plasmalemma-cell wall
section of the root cells within 30 min. This response was also
observed in hypocotyl cells, where BL induced an expansion of the
BRI1-GFP signal of two neighboring cells, so that the plasma-
lemmata became optically distinguishable (Fig. 4E and F). The
degree of expansion did not only depend on the cell type but also
on the position of the measured section along the cell wall of
individual cells (Fig. 5). The Gaussian fitting of the GFP intensity
profiles of more than 30 independent sections measured in several
individual cells from 5 seedlings revealed that the fluorescence
signals expanded around 34622% (n = 31, p = 0,0003) in response
to BL treatment (see Table S2 for the single measurement values).
The spatial separation of the plasmalemmata could have been
caused by BL-induced plasmolysis or BL-induced cell wall
expansion. Therefore, we determined the spatial behavior of the
cell wall in response to BL treatment in BRI1-GFP-expressing
seedlings. The measurement of fluorescence from different
subcellular origins was possible as demonstrated before (Fig. 3).
The cell wall autofluorescence expanded around 41624% (n = 29,
p = 0,0145) after brassinolide treatment coincidentally with the
separation of the plasmalemmata in the analysed cells (see Table
S3 for the single measurement values and Fig. 6A as an example).
Figure 3. Measurement ranges for comparison between GFP-fluorescence and cell wall-derived autofluorescence. (A) Overlap of thefluorescence spectrum of purified GFP in water (green) and the autofluorescence spectrum (blue) of wildtype Arabidopsis hypocotyl cells. The broadband of the spectrum (500–640 nm, blue) originates from the cell wall, the sharp peak at 680 nm originates from chlorophyll. The grey hatched areasshow the spectral ranges used for recording GFP-fluorescence (around 500 nm) and autofluorescence, respectively (around 600 nm). (B) Fluorescencedecay trace recorded in the 500 nm region (left hatched bar in A) in a BRI1-GFP expressing hypocotyl cell, fitted by a mono-exponential function(black line), proves the main presence of GFP-fluorescence. (C) Fluorescence decay trace recorded in the 600 nm region (right hatched bar in A) in aBRI1-GFP expressing hypocotyl cell, fitted by a mono-exponential function (black line), proves the dominant presence of autofluorescence. IRF,instrument response function.doi:10.1371/journal.pone.0005716.g003
Subcellular Dynamics in Plants
PLoS ONE | www.plosone.org 4 May 2009 | Volume 4 | Issue 5 | e5716
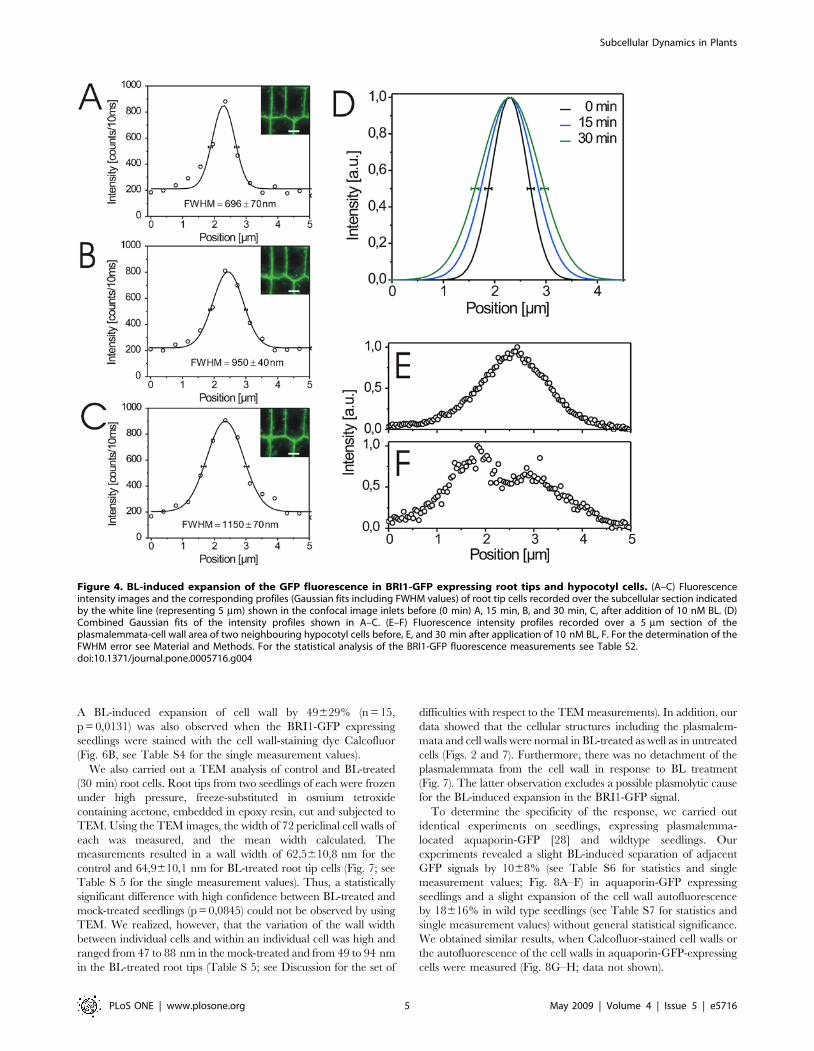
A BL-induced expansion of cell wall by 49629% (n = 15,
p = 0,0131) was also observed when the BRI1-GFP expressing
seedlings were stained with the cell wall-staining dye Calcofluor
(Fig. 6B, see Table S4 for the single measurement values).
We also carried out a TEM analysis of control and BL-treated
(30 min) root cells. Root tips from two seedlings of each were frozen
under high pressure, freeze-substituted in osmium tetroxide
containing acetone, embedded in epoxy resin, cut and subjected to
TEM. Using the TEM images, the width of 72 periclinal cell walls of
each was measured, and the mean width calculated. The
measurements resulted in a wall width of 62,5610,8 nm for the
control and 64,9610,1 nm for BL-treated root tip cells (Fig. 7; see
Table S 5 for the single measurement values). Thus, a statistically
significant difference with high confidence between BL-treated and
mock-treated seedlings (p = 0,0845) could not be observed by using
TEM. We realized, however, that the variation of the wall width
between individual cells and within an individual cell was high and
ranged from 47 to 88 nm in the mock-treated and from 49 to 94 nm
in the BL-treated root tips (Table S 5; see Discussion for the set of
difficulties with respect to the TEM measurements). In addition, our
data showed that the cellular structures including the plasmalem-
mata and cell walls were normal in BL-treated as well as in untreated
cells (Figs. 2 and 7). Furthermore, there was no detachment of the
plasmalemmata from the cell wall in response to BL treatment
(Fig. 7). The latter observation excludes a possible plasmolytic cause
for the BL-induced expansion in the BRI1-GFP signal.
To determine the specificity of the response, we carried out
identical experiments on seedlings, expressing plasmalemma-
located aquaporin-GFP [28] and wildtype seedlings. Our
experiments revealed a slight BL-induced separation of adjacent
GFP signals by 1068% (see Table S6 for statistics and single
measurement values; Fig. 8A–F) in aquaporin-GFP expressing
seedlings and a slight expansion of the cell wall autofluorescence
by 18616% in wild type seedlings (see Table S7 for statistics and
single measurement values) without general statistical significance.
We obtained similar results, when Calcofluor-stained cell walls or
the autofluorescence of the cell walls in aquaporin-GFP-expressing
cells were measured (Fig. 8G–H; data not shown).
Figure 4. BL-induced expansion of the GFP fluorescence in BRI1-GFP expressing root tips and hypocotyl cells. (A–C) Fluorescenceintensity images and the corresponding profiles (Gaussian fits including FWHM values) of root tip cells recorded over the subcellular section indicatedby the white line (representing 5 mm) shown in the confocal image inlets before (0 min) A, 15 min, B, and 30 min, C, after addition of 10 nM BL. (D)Combined Gaussian fits of the intensity profiles shown in A–C. (E–F) Fluorescence intensity profiles recorded over a 5 mm section of theplasmalemmata-cell wall area of two neighbouring hypocotyl cells before, E, and 30 min after application of 10 nM BL, F. For the determination of theFWHM error see Material and Methods. For the statistical analysis of the BRI1-GFP fluorescence measurements see Table S2.doi:10.1371/journal.pone.0005716.g004
Subcellular Dynamics in Plants
PLoS ONE | www.plosone.org 5 May 2009 | Volume 4 | Issue 5 | e5716

Monitoring the environment of plasmalemma-boundGFP fusion proteins in vivo
The lifetime of GFP fluorescence provides information about
the physical and chemical environment of the fluorophore and,
thus, the GFP fusion protein [29–30]. In addition to fluorescence
intensity, we recorded GFP fluorescence lifetime decay traces
across plasmalemmata-cell wall sections in hypocotyl cells of
aquaporin-GFP and BRI1-GFP expressing seedlings at up to
200 nm intervals. The measurements were based on a different
but sufficient number of fluorescence counts (Table S1), which is
reflected in the error calculation [31]. We observed significant
differences in GFP fluorescence lifetime across plasmalemma-cell
wall sections and regularly also between adjacent cells for both
aquaporin-GFP and BRI1-GFP (Fig. 9A and B). A detailed
subcellular analysis revealed that the most significant differences in
BRI1-GFP lifetime existed within the cell between the cytoplasm,
plasmalemma and cell wall (Fig. 9C).
To determine whether BL also induces changes in the
environment of BRI1-GFP, we analysed the fluorescence lifetime
of the receptor fusion. After the addition of BL, we again observed
cell wall expansion (Fig. 10A). Furthermore, BRI1-GFP fluores-
cence lifetime at the plasmalemmata strongly decreased within
20 min of BL addition and then remained constant (Fig. 10B, C;
Figure S2). In contrast, fluorescence lifetime in the subcellular
areas adjacent to the plasmalemma region remained largely
unchanged (Fig. 10B). By the spatial extension of our measure-
ments, BL-induced changes in BRI1-GFP lifetime were not only
observed in sections over the plasmalemma-wall areas but also
over larger cell areas (Fig. 10C). Significant changes in GFP
fluorescence lifetime were never measured after mock-treatment of
the BRI1-GFP line or in the BL-treated aquaporin-GFP
expressing cells (Fig. 10D and E; data not shown).
BR-induced responses are cell physiological processesRecent studies suggested that the endosomal pool of BRI1 is
critical for the signaling and regulation of BL-responsive genes in
Arabidopsis as shown by treatment with Brefeldin A (BFA) [22–23].
BFA inhibits the function of ARF-GTPases by interacting with
their associated GEFs and, thus, has strong effects on the integrity
of subcellular compartments and the endosomal vesicle pool by
inhibiting intracellular trafficking pathways [32–33]. We, there-
fore, addressed the question whether BFA treatment also interferes
with BL-induced cell wall expansion and BRI-GFP fluorescence
lifetime. In the presence of the inhibitor BFA compartments
appeared and both processes were strongly inhibited, suggesting
that an intact intracellular trafficking system is required for their
execution (Fig. 11 and Figure S3).
Figure 5. BL-induced expansion of the GFP fluorescence signal in BRI1-GFP expressing root tip cells. (A) Confocal image of root tip tissuebefore (left) and 30 min after addition of 10 nM BL (right). Fluorescence intensity curves were recorded over the plasmalemmata-cell wall sectionsindicated by the white, alphabetically numbered lines and the FWHM values of their Gaussian fits calculated before and 30 min after addition of BL. (B–J)FWHM values of the plasmalemmata-cell wall sections indicated in A before (0 min) and 30 min after addition of 10 nM BL. For the determination of theFWHM error in B to J see Material and Methods. For the statistical analysis of the BRI1-GFP fluorescence measurements see Table S2.doi:10.1371/journal.pone.0005716.g005
Subcellular Dynamics in Plants
PLoS ONE | www.plosone.org 6 May 2009 | Volume 4 | Issue 5 | e5716

Discussion
Specific GFP versus unspecific compartmentfluorescence
As shown in Figure 1, there is a significant, cell-type specific
background fluorescence signal which mainly derives from the wall
of the plant cell. This unspecific background fluorescence can be
differentiated from the GFP signal by its spectra and also by its
characteristic fluorescence decay pattern. Whereas GFP fluores-
cence shows a prototypical monoexponential decay function,
background fluorescence can only be described by a multi-
exponential decay function. This suggests that the unspecific
background fluorescence at the excitation wavelength of 473 nm
originates from different components inside the cell wall, which
have different excited-state lifetimes. Thus, the combination of
wavelength- and time-resolved fluorescence spectroscopy enables
us to distinguish unambiguously between a specific signal and
background fluorescence in a cell type-specific manner, dispensing
with the use of additional fluorescent dyes, which might interfere
with cellular processes. These differences in lifetime also allowed
us to establish a procedure for the efficient background correction
and, thus, the improvement of the signal-to-background ratio in
living plant cells (patent application no. 10 2009 005 953 from
19.01.09; F. Schleifenbaum, K. Elgass, M. Sackrow, K. Caesar, K.
Berendzen, K. Harter, A. Meixner, manuscript in preparation)
Measurement of cell wall extension at subcellularresolution
Our data demonstrate that the cell walls significantly expand
within a few minutes of BL treatment in BRI1-GFP expressing
cells. A slight expansion response was also observed in aquaporin-
GFP expressing and wildtype seedlings which was without clear
overall statistical significance. However, when determined at single
cell level, almost every cell showed a BL-induced wall expansion.
This suggests that BRI1-GFP is necessary for the rapid BL-
induced expansion of the cell wall but its over-expression is
required to produce a significant effect. A more detailed analysis of
many cells from independent seedlings showed that there is a
linear relationship between BRI1-GFP fluorescence intensity and
the degree of cell wall expansion (K. Elgass, A. Meixner, K.
Harter, unpublished). BL is known to alter the biophysical
properties of the cell wall, such as its relaxation via BRI1-mediated
transcriptional and post-transcriptional activation of cell wall-
loosening enzymes [24,34]. However, such an early BL-responsive
spatio-temporal and BL-dependent expansion has not yet been
reported in the cell wall sections of living Arabidopsis cells.
From the resolution point of view, it should, in principle, also be
possible to determine cell wall expansions of the observed
dimension by TEM. However, it is not technically possible to
produce a series of TEM sections at the identical subcellular
region before and after the addition of BL. Thus, different
seedlings have to be used for the comparative physiological
analysis using TEM. The set of difficulties is documented by our
own TEM analysis, which demonstrates a high variability of cell
wall thicknesses between individual cells and even individual
periclinal walls. The high variability is probably due to the
different age of the cells, which have different wall dimensions, and
the difficulty to exactly localize the site of the measurement along
the wall. For instance, the wall thickness at the edge of a cell is
different form the width in the middle. In addition, although we
used cryofixation and freeze-substitution for the preparation of the
probes, we can not entirely exclude the possibility that this
treatment may influence the water status and spatial dimension of
the cell wall. On the one hand, we conclude that it is almost
impossible to determine weak, dynamic changes in cell wall
expansion using a TEM approach. On the other hand, these
findings unequivocally demonstrate the potential of our approach
for the analysis of the dynamics of subcellular processes in vivo.
Changes in the close environment of membrane-boundGFP fusion proteins
The observed differences in BRI1-GFP and aquaporin-GFP
fluorescence lifetime suggest strong gradients of physico-chemical
parameters, such as membrane potential, pH-value, osmotic
conditions and refraction index [30], within subcelluar compart-
Figure 6. BL-induced expansion of the cell wall in BRI1-GFPexpressing hypocotyl cells. (A) FWHM values of the anticlinal wallautofluorescence from hypocotyl cells recorded over the subcellularsection indicated by the white line (10 mm) shown in the confocalimage inlet at 0 min and 30 min after addition of 10 nM BL. (B) FWHMvalues of Calcofluor-stained anticlinal wall from hypocotyl cellsrecorded over the subcellular section indicated by the white line(11 mm) shown in the confocal image inlet at 0, 15 and 30 min afteraddition of 10 nM BL. For the determination of the FWHM error in A andB see Material and Methods. For the statistical analysis of the cell wallautofluorescence and Calcofluor fluorescence measurements see TablesS3 and S4.doi:10.1371/journal.pone.0005716.g006
Subcellular Dynamics in Plants
PLoS ONE | www.plosone.org 7 May 2009 | Volume 4 | Issue 5 | e5716

ments of a single cell and between adjacent cells. Thus,
membrane-bound GFP fusion proteins have the potential to be
highly sensitive probes for determining such parameters at sub-
cellular resolution in vivo. Ongoing experiments are aimed at
discovering which parameters may influence the fluorescence
lifetime of BRI1-GFP, aquaporin-GFP and other fluorophore-
tagged proteins in vivo.
After the addition of BL, we observed a significant change in the
fluorescence lifetime of BRI1-GFP with time, which was not
detected in BL-treated aquaporin-GFP expressing plants. These
results can be interpreted to suggest that the activation of BRI1-
GFP by BL could alter the physico-chemical properties of the
plasmalemma or plasmalemma/cytoplasm interface, which do not
affect the fluorescence lifetime of aquaporin-GFP. The observed
changes would then be a cell physiological response initiated by
BL-activated BRI1-GFP. This idea is substantiated by the fact that
BFA inhibits the BL-induced change in BRI1-GFP fluorescence
lifetime. As BL was shown to inhibit inwardly rectifying K+
currents in guard cell protoplasts of Vicia faba and to increase
ATPase activity in Azuki bean epicotyls and maize roots, leading
to proton extrusion [24,34–35], it is possible that the observed
change in the fluorescence lifetime of BRI1-GFP might reflect a
hormone-induced alteration in ion currents and membrane
potential in Arabidopsis cells which depends on the presence of
BRI1-GFP. The causal relationship between BL-induced BRI1-
GFP activation, the change in BRI1-GFP fluorescence lifetime and
cell wall expansion is currently under elucidation.
Summary and concluding remarksCompared to pure imaging techniques with ultra-high spatial
resolution, such as STED [4–5], PALM [6] and STORM [7], our
application of ocFLM in combination with wavelength-selective
fluorescence microscopy and a novel method of data analysis
allows the recording of the spectroscopic and fluorescence lifetime
data of GFP fusion proteins in vivo, providing new information
about their molecular properties, cell physiological function and
subcellular environment. This enables the unambiguous identifi-
cation and clear intracellular localisation of GFP fusion proteins in
plant cells. Furthermore, ligand-induced physiological responses in
plant cells and receptor dynamics at subcellular resolution can be
quantitatively recorded. The use of autofluorescence as ‘‘native’’
fluorophore avoids the use of additional chromophors or the
Figure 7. TEM images of ultrathin sections from different root cells of BRI1-GFP expressing seedlings. (A) Ultrathin section of a root cellfrom a seedling high-pressure frozen 30 min after the addition of 10 nM BL. (B) Ultrathin section of an independent root cell from a mock-treated,high-pressure frozen seedling. The cell walls of epidermal cells (upper cells) facing cortex cells (lower cell) are shown. PM, plasmalemma; CW, cell wall;PD, plasmadesmon. The bar represents 100 nm. For the statistical analysis of the cell wall measurements see Table S5.doi:10.1371/journal.pone.0005716.g007
Subcellular Dynamics in Plants
PLoS ONE | www.plosone.org 8 May 2009 | Volume 4 | Issue 5 | e5716

expression of further markers which might interfere with the plant
cell’s physiology. This is a marked advantage of our approach over
STED, PALM and STORM. In addition, with an image
acquisition time of approximately 3 h, PALM and STORM do
not allow the fast recording of subcellular processes. We, therefore,
propose that high resolution ocFLM combined with wavelength-
selective fluorescence microscopy will not only lead to new
experimental abilities in plants but also is a valuable novel tool for
the accomplishment of cell biology in any cell system.
Materials and Methods
Plant material and growth conditionsBRI1-GFP [22] and aquaporin-GFP [28] expressing seedlings
were grown for 5 days at 22uC and under a regime of 14 h light and
10 h darkness on agar containing 0.5 MS media. For measurements
seedlings were carefully removed from the plates and transferred
onto microscopic slides and covered with water. The BL solutions at
the indicated concentrations and Calcofluor (1% w/v) were applied
to side of the microscopic slide and allowed to diffuse to the seedling
sample. For the response of the cell walls in presence of BFA, the
seedlings were pre-incubated for 1 h in 50 mM BFA solution.
Optical and spectroscopic measurementsThe measurements were performed with a homemade CSSM,
based on a Zeiss Axiovert, and equipped with a pulsed 473 nm
diode laser operating at a repetition rate of 10 MHz as source for
excitation light and a high numerical aperture oil immersion
objective (Zeiss Plan-Neofluar, 1006/1.30) [19–20]. The system
was equipped with an avalanche photodiode (APD, SPCM-AQR-
14) as a spectrally integrating detector to record fluorescence
intensity. Spectra were obtained by a spectrograph (Princeton
Instruments Acton Spectra Pro 300i, 300 grid grating) coupled to a
thermo-electric cooled CCD-camera (Roper Scientific). Lifetime
decays were recorded using a time-correlated single-photon
counting board (Timeharp 200, Picoquant) for data acquisition
and the APD as a detector. Fluorescence intensity images were
obtained by raster-scanning the sample and detecting emission
intensity for every spot on the sampled area. Distinct spots were
addressed to record the corresponding spectra. The pulsed 473 nm
diode laser (Picoquant LDH-P-C470), operating at a repetition rate
of 10 MHz served as source. The setup was equipped with a
480 nm long pass filter (Semrock Razor Edge LP02-473RU-25) to
block back-scattered excitation light, with a 500 nm bandpass filter
(Semrock BrightLine BL500/24) to detect GFP-fluorescence or with
a 600 nm bandpass filter (Semrock BrightLine BL607/36) to detect
autofluorescence. The lifetime data were recorded sequentially to
invesitgate the emission lifetime of the GFP label and the
autofluorescence background independently from each other.
Acquisition time was 5 seconds per measurement. The pixel size
is diffraction-limited and the distance between each measurement
point was 250 nm. Processing of fluorescence intensity images was
accomplished with the WSxM software (Nanotec Electronica) [36].
The intensity decay curves were deconvolved from the instrument
Figure 8. BL-induced changes in the cell wall width of aquaporin-GFP expressing Arabidopsis cells. (A) Confocal image of root tip tissuebefore (left) and 30 min after addition of 10 nM BL (right). Fluorescence intensity curves were recorded over the plasmalemmata-cell wall sectionsindicated by the white, alphabetically numbered lines and the FWHM values of their Gaussian fits calculated. (B–F) FWHM values of theplasmalemmata-cell wall sections indicated in A before (0 min) and 30 min after addition of 10 nM BL. (G) FWHM values of Calcofluor-stainedanticlinal wall from hypocotyl cells recorded over the subcellular section indicated by the white line (8 mm) shown in the confocal image inlet at 0, 15and 30 min after addition of 10 nM brassinolide. (H) FWHM values of the anticlinal wall autofluorescence from hypocotyl cells recorded over thesubcellular section indicated by the white line (5 mm) shown in the confocal image inlet at 0 min and 30 min after addition of 10 nM BL. For thedetermination of the FWHM error in B to H see Material and Methods. For the statistical analysis of the aquaporin-GFP fluorescence measurementssee Table S6.doi:10.1371/journal.pone.0005716.g008
Subcellular Dynamics in Plants
PLoS ONE | www.plosone.org 9 May 2009 | Volume 4 | Issue 5 | e5716

Figure 9. ocFLM of BRI1-GFP and aquaporin-GFP reveals gradients in their subcellular environment. (A) GFP fluorescence lifetimes(filled squares) and the corresponding intensity profiles (open circles) recorded over 5.0 mm plasmalemma-cell wall sections of two differenthypocotyl cells from two independent BRI1-GFP expressing Arabidopsis seedlings. (B) GFP fluorescence lifetimes (filled squares) and thecorresponding intensity profiles (open circles) recorded over 4.0 mm plasmalemma-cell wall sections of two different hypocotyl cells from twoindependent aquaporin-GFP expressing Arabidopsis seedlings. (C) GFP fluorescence lifetime (filled squares) and the corresponding intensity profile(open circles) over a 6.0 mm plasmalemma-cell wall area of a hypocotyl cell from a BRI1-GFP expressing Arabidopsis seedling. The white line in theconfocal image inlet shows the recorded section. For the calculation of the fluorescence lifetime values and error bars see Material and Methods.Additional BRI1-GFP and aquaporin-GFP fluorescence lifetime measurements are presented in Fig. 10D and E.doi:10.1371/journal.pone.0005716.g009
Subcellular Dynamics in Plants
PLoS ONE | www.plosone.org 10 May 2009 | Volume 4 | Issue 5 | e5716

response function (IRF) measured without the long pass filter and
then fitted by a mono- or multi-exponential decay function.
The cell physiological experiments (cell wall expansion, BRI1-
GFP and aquaporin lifetime measurements) were repeated at least
3 times using independent seedling samples.
Probe preparation and transmission electron microscopy(TEM)
Seedlings were incubated in water or 10 nM brassinolide solution
for 30 min at room temperature. Thereafter, root tips were high-
pressure frozen and freeze-substituted in acetone containing 2.5%
osmium tetroxide (60 h at 290uC, 8 h at 260uC and 8 h 235uC)
before transfer for 60 min to 0uC [37]. Then, the root tips were
washed five times with acetone followed by infiltration with 10%
(4 h), 25% (12 h), 50% (12 h), 75% (12 h) and 100% (2 times for
15 h, each) epoxy resin. The resin was allowed to polymerise for 2
days at 60uC. Ultrathin sections of the root tip samples were stained
with 3% uranyl acetate in ethanol and lead citrate and viewed in a
LEO 906 transmission electron microscope [37]. 72 walls derived
from two independent, mock-treated BRI1-GFP expressing seed-
lings and 72 walls derived from two independent, BL-treated BRI1-
GFP expressing seedlings were measured.
Data analysisThe standard deviations in the Gaussian fits of the intensity
profiles, as represented by the error bars, reflect the accuracy of
the fit and rest on the different signal-to-noise ratio of the
measurements. The FWHM-based and TEM-based wall mea-
surements of cells before/without and after treatment with BL
were performed as indicated in the Tables S 2, S3, S4, S5, S6 and
Figure 10. BL-induced cell wall expansion is paralleled by changes in the BRI1-GFP fluorescence lifetime. (A) BL-induced cell wallexpansion of BRI1-GFP expressing hypocotyl cells from Arabidopsis seedlings before (black circles) and 30 min after (green circles) hormoneapplication. The fluorescence intensity was recorded over a 7.0 mm section as indicated by the white line in the confocal image inlet. (B) Fluorescencelifetimes of BRI1-GFP in the identical plasmalemma-cell wall section shown in A before (black squares), 10 (red squares), 20 (blue squares) and 30 min(green squares) after addition of 25 nM BL. The minima in the lifetime curves correspond to the maxima in the intensity profiles shown in A asindicated by the dashed lines. (C) Fluorescence lifetimes of BRI1-GFP in root tip cells 0 to 30 min after application of 25 nM BL. Lifetimes wereobtained by integrating over all recorded pixels of the confocal image. (D) GFP fluorescence lifetime (filled squares) and the corresponding intensityprofile (open circles) recorded over a 3.0 mm plasmalemma-cell wall section of a BRI1-GFP expressing hypocotyl cell before (black squares), 15 min(blue squares) and 30 min (green squares) after onset of mock treatment. (E) GFP fluorescence lifetime (filled squares) and the correspondingintensity profile (open circles) recorded over a 3.0 mm plasmalemma-cell wall section of an aquaporin-GFP expressing hypocotyl cell before (blacksquares) and 30 min (green squares) after application of 25 nM BL. For the calculation of the lifetime values and error bars see Material and Methods.The experiments in B and C were repeated three times using cells from three independent seedlings. Representative results are shown. The results ofthe additional BRI1-GFP lifetime measurements along plasmalemma-cell wall sections are presented in Figure S2.doi:10.1371/journal.pone.0005716.g010
Subcellular Dynamics in Plants
PLoS ONE | www.plosone.org 11 May 2009 | Volume 4 | Issue 5 | e5716
S7. For statistical evaluation, the data were analysed by one-sided
t-test. The number of independent measurements (n), the p-values
and the number of independent seedlings are given in the legends
of the Tables S2, S3, S4, S5, S6 and S7 and in Results.
The lifetime values derived from mono- or multi-exponential
decay fittings. The error bars were calculated according to [31]
taking into account the number of photons and the time resolution
of the measurements. The BRI1-GFP and aquaporin-GFP
fluorescence lifetime measurements were repeated at least three
times using individual cells from at least three independent
seedlings and representative results are shown. The results of the
additional experiments are presented in the Figures S2 and S3.
Supporting Information
Figure S1 Reference fluorescence spectrum and lifetime decay
rate of purified GFP. (A) Fluorescence spectrum of GFP at a
concentration of 1025 M after pulse excitation with light of
473 nm. The spectrum shows a peak at 510 nm and a shoulder at
540 nm. (B) Fluorescence decay rate of GFP at a concentration of
1027 M in 20 mM TRIS (pH = 6.8) after pulse excitation with
light of 473 nm. The decay shows a mono-exponential function.
The residuals indicate the deviation between the measured and the
model decay function. In a good fit the residuals are distributed
symmetrically around 0. IRF, instrument response function.
Found at: doi:10.1371/journal.pone.0005716.s001 (0.07 MB
PDF)
Figure S2 BL induces changes in the BRI1-GFP fluorescence
lifetime in plant cells. (A–B) Fluorescence lifetimes of BRI1-GFP in
4.0 mm plasmalemma-cell wall sections of two hypocotyl cells from
two independent seedlings (A, B) before (black squares) and 10 (red
squares), 20 (blue squares) and 30 min (green squares) after
addition of 25 nM BL.
Found at: doi:10.1371/journal.pone.0005716.s002 (0.08 MB
PDF)
Figure S3 BL-induced cell wall expansion and change in BRI1-
GFP fluorescence lifetime require a functional intracellular
trafficking system. (A–C) FWHM values of GFP intensity profiles
(left) and fluorescence lifetime decays (right) recorded over
plasmalemmata-cell wall sections of three hypocotyl cells (A, B,
C) from three independent, BRI1-GFP expressing Arabidopsis
seedlings in the presence of 50 mM BFA before (black) and 30 min
(green) after application of 25 nm BL.
Found at: doi:10.1371/journal.pone.0005716.s003 (0.15 MB
PDF)
Table S1 Fitting parameters of lifetime decay traces.
Found at: doi:10.1371/journal.pone.0005716.s004 (0.17 MB
XLS)
Table S2 FWHM changes in the widening of the plasmalemma-
bound GFP fluorescence signal in BRI1-GFP expressing hypocotyl
and root cells before (0 min) and 30 min after application of
10 nM BL (30 min.).
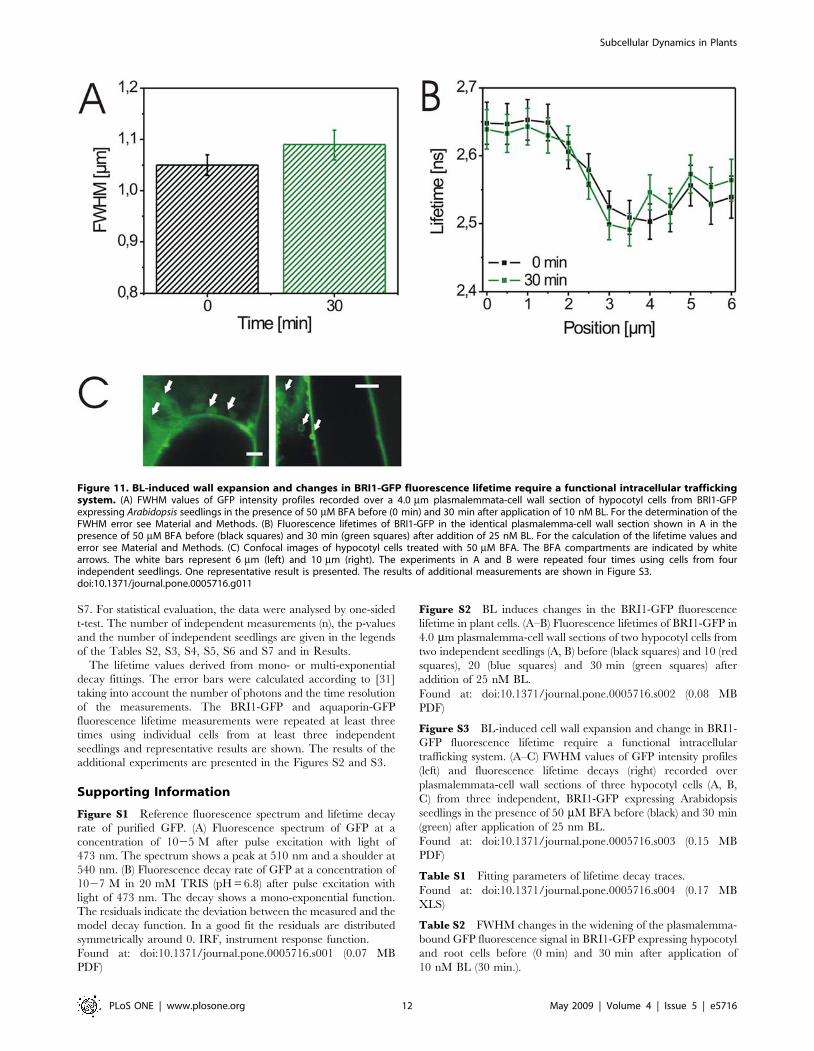
Figure 11. BL-induced wall expansion and changes in BRI1-GFP fluorescence lifetime require a functional intracellular traffickingsystem. (A) FWHM values of GFP intensity profiles recorded over a 4.0 mm plasmalemmata-cell wall section of hypocotyl cells from BRI1-GFPexpressing Arabidopsis seedlings in the presence of 50 mM BFA before (0 min) and 30 min after application of 10 nM BL. For the determination of theFWHM error see Material and Methods. (B) Fluorescence lifetimes of BRI1-GFP in the identical plasmalemma-cell wall section shown in A in thepresence of 50 mM BFA before (black squares) and 30 min (green squares) after addition of 25 nM BL. For the calculation of the lifetime values anderror see Material and Methods. (C) Confocal images of hypocotyl cells treated with 50 mM BFA. The BFA compartments are indicated by whitearrows. The white bars represent 6 mm (left) and 10 mm (right). The experiments in A and B were repeated four times using cells from fourindependent seedlings. One representative result is presented. The results of additional measurements are shown in Figure S3.doi:10.1371/journal.pone.0005716.g011
Subcellular Dynamics in Plants
PLoS ONE | www.plosone.org 12 May 2009 | Volume 4 | Issue 5 | e5716

Found at: doi:10.1371/journal.pone.0005716.s005 (0.01 MB PDF)
Table S3 FWHM changes in the expansion of the cell wall
autofluorescence in BRI1-GFP expressing hypocotyl and root cells
before (0 min) and 30 min after application of 10 nM BL (30 min).
Found at: doi:10.1371/journal.pone.0005716.s006 (0.01 MB
PDF)
Table S4 FWHM changes in the expansion of Calcofluor-stained
cell walls in BRI1-GFP expressing hypocotyl and root cells before
(0 min) and 30 min after application of 10 nM BL (30 min).
Found at: doi:10.1371/journal.pone.0005716.s007 (0.01 MB
PDF)
Table S5 Statistics of 72 periclinal cell wall width measurements,
each, derived from ultrathin TEM sections of BRI-GFP
expressing, high-pressure-frozen root cells, which were either
mock-treated or treated for 30 min with 10 nM BL.
Found at: doi:10.1371/journal.pone.0005716.s008 (0.01 MB
PDF)
Table S6 FWHM changes in the widening of the plasmalemma-
bound GFP fluorescence signal in aquaporin-GFP expressing
hypocotyl and root cells before (0 min) and 30 min after
application of 10 nM BL (30 min.).
Found at: doi:10.1371/journal.pone.0005716.s009 (0.01 MB
PDF)
Table S7 FWHM changes in the widening of the cell wall
autofluorescence in wildtype hypocotyl and root cells before
(0 min) and 30 min after application of 10 nM BL (30 min).
Found at: doi:10.1371/journal.pone.0005716.s010 (0.01 MB
PDF)
Text S1 Calculation of the width of plasmalemma-cell wall
sections from apparent GFP fluorescence data (FWHM values).
Found at: doi:10.1371/journal.pone.0005716.s011 (0.23 MB
PDF)
Acknowledgments
We thank Felicity de-Courcy for proofreading the manuscript, N Geldner
for seeds and K Schumacher for helpful suggestions.
Author Contributions
Conceived and designed the experiments: KE FS YDS AM KH.
Performed the experiments: KE KC YDS. Analyzed the data: KE KC
FS YDS AM KH. Wrote the paper: KE AM KH.
References
1. Hood L, Heath JR, Phelps ME, Lin B (2004) Systems biology and new
technologies enable predictive and preventative medicine. Science 306: 640–643.
2. Liu ET (2005) Systems biology, integrative biology, predictive biology. Cell 121:
505–506.
3. Miyawaki A, Sawano A, Kogure T (2003) Ligthing up cells: labelling proteins
with fluorophores. Nature Cell Biol 5: S1–7.
4. Willig KI, Rizzoli SO, Westphal V, Jahn R, Hell SW (2006) STED microscopy
reveals that synaptotagmin remains clustered after synaptic vesicle exocytosis.
Nature 440: 935–939.
5. Westphal V, Rizzoli SO, Lauterbach MA, Kamin D, Jahn R, et al. (2008)
Video-rate far-field optical nanoscopy dissects synaptic versicle movement.
Science 320: 246–249.
6. Betzig E, Patterson GH, Sougrat R, Lindwasser OW, Olenych S, et al. (2006)
Imaging intracellular fluorescent proteins at nanometer resolution. Science 313:
1642–1645.
7. Heinlein T, Biebricher A, Schluter P, Herten DP, Wolfram J, et al. (2005) High-
resolution colocalization of single molecules within the resolution gap of far-field
microscopy. Chem Phys Chem 6: 949–955.
8. Ries J, Schwille P (2008) New concepts for fluorescence correlation spectroscopy
on membranes. Phys Chem Chem Phys 10: 3487–3497.
9. Vale RD (2008) Microscopes for Fluorimeters: The Era of Single Molecule
Measurements. Cell 135: 779–785.
10. Fernandez-Suarez, Ting AY (2008) Fluorescent probes for super-resolution
imaging in living cells. Nat Rev Mol Cell Biol 9 (12): 929–943.
11. Slaughter BD, Schwartz JW, Li R (2007) Mapping dynamic protein interactions
in MAP kinase signaling using live-cell fluorescence fluctuation spectroscopy and
imaging. Proc Natl Acad Sci USA 104: 20320–20325.
12. Slaughter BD, Huff JM, Wiegraebe W, Schwartz JW, Li R (2008) SAM domain-
based protein oligomerization observed by live-cell fluorescence fluctuation
spectroscopy. PLoS One 3 (4): e1931.
13. Maeder CI, Hink MA, Kinkhabwala A, Mayr R, Bastiaens PIH, et al. (2007)
Spatial regulation of Fus3 MAP kinase activity through a reaction-diffusion
mechanism in yeast pheromone signalling. Nature Cell Biol 9: 1319–1326.
14. Muto H, Kinjo M, Yamamoto KT (2009) Fluorescence cross-correlation
spectroscopy of plant proteins. Methods Mol Biol 479: 203–215.
15. Hink MA, Shah K, Russinova E, de Vries SC, Visser AJWG (2008) Fluorescence
fluctuation analysis of Arabidopsis thaliana somatic embryogenesis receptor-like
kinase and brassinosteroid sensitive 1 receptor oligomerization. Biophysical J 94:
1052–1062.
16. Martini J, Schmied K, Palmisano R, Toensing K, Anselmetti D, et al. (2007)
Multifocal two-photon laser scanning microscopy combined with photo-
activatable GFP for in vivo monitoring of intracellular protein dynamics in
real time. J Struct Biol 158: 401–409.
17. Li J, Wen JQ, Lease KA, Doke JT, Tax FE, et al. (2002) BAK1, an Arabidopsis
LRR receptor-like protein kinase, interacts with BRI1 and modulates
brassinosteroid signalling. Cell 110: 213–222.
18. Bose G, Schwille P, Lamparter T (2004) The mobility of phytochrome within
protonemal tip cells of the moss Ceratodon purpureus, monitored by
fluorescence correlation spectroscopy. Biophys J 87 (3): 2013–2021.
19. Blum C, Stracke F, Becker S, Mullen K, Meixner AJ (2001) Discrimination and
Interpretation of Spectral Phenomena by Room-Temperature Single-MoleculeSpectroscopy. J Phys Chem A 105: 6983–6990.
20. Schleifenbaum F, Blum C, Elgass K, Subramanian V, Meixner AJ (2008) New
insights into the photophysics of DsRed by multiparameter spectroscopy onsingle proteins. J Phys Chem B 112: 7669–7674.
21. Wang Z-Y, Seto H, Fujioka S, Yoshida S, Chory J (2001) BRI1 is a criticalcomponent of a plasmamembrane receptor for plant steroids. Nature 410: 380–383.
22. Geldner N, Hyman DL, Wang X, Schumacher K, Chory J (2007) Endosomal
signaling of plant steroid receptor BRI1. Genes Develop 21: 1598–1602.23. Robert S, Chary SN, Drakakaki G, Li SD, Yang ZB, et al. (2008) Endosidin 1
defines a compartment involved in endocytosis of the brassinosteroid receptorBRI1 and the auxin transporters PIN2 and Aux1. Proc Natl Acad Sci U S A
105: 8464–8469.24. Clouse SD (1998) Brassinosteroids: Essential Regulators of Plant Growth and
Development. Annu Rev Plant Physiol Plant Mol Biol 49: 427–451.
25. Tsien RY (1998) The green fluorescent protein. Annu Rev Biochem 67:509–544.
26. Lakowicz JR (1999) Principles of fluorescence spectroscopy. New York: KluwerAcademic.
27. Striker G, Subramaniam V, Seidel CAM, Volkmer A (1999) Photochromicity
and fluorescence lifetimes of green fluorescent protein. J Phys Chem B 103:8612–8617.
28. Cutler SR, Ehrhardt DW, Griffitts JS, Somerville CR (2000) Random GFP:cDNA fusions enable visualization of subcellular structures in cells of Arabidopsis
at a high frequency. Proc Natl Acad Sci U S A 97: 3718–3723.29. Nakabayashi T, Wang HP, Kinjo M, Ohta N (2008) Application of fluorescence
lifetime imaging of enhanced green fluorescent protein to intracellular pH
measurements. Photochem Photobiol Sci 7: 668–670.30. van Manen HJ, Verkuijlen P, Wittendorp P, Subramaniam V, van den Berg TK,
et al. (2008) Refractive index sensing of green fluorescent proteins in living cellsusing fluorescence lifetime imaging microscopy. Biophysical J 94: L67–L69.
31. Zander C, Sauer M, Drexhage KH, Ko DS, Schulz A, et al. (1996) Detection
and characterization of single molecules in aqueous solution. Appl Phys B 63:517–523.
32. Anders N, Jurgens G (2008) Large ARF guanine nucleotide exchange factors inmembrane trafficking. Cell Mol Life Sci; doi: 10.1007/s00018-008-8227-7.
33. Robinson DG, Jiang LW, Schumacher K (2008) The endosomal system of
plants: Charting new and familiar territories. Plant Phys 147: 1482–1492.34. Haubrick LL, Assmann SM (2006) Brassinosteroids and plant function: some
clues, more puzzles. Plant Cell Environment 29 (3): 446–457.35. Haubrick LL, Torsethaugen G, Assmann SM (2006) Effect of brassinolide, alone
and in concert with abscisic acid, on control of stomatal aperture and potassiumcurrents of Vicia faba guard cell protoplasts. Physiol Plantarum 128: 134–143.
36. Horcas I, Fernandez R, Gomez-Rodriguez JM, Colchero J, Gomez-Herrero J, et
al. (2007) WSXM: A software for scanning probe microscopy and a tool fornanotechnology. Rev Sci Instrum 78: e013705.
37. Dettmer J, Hong-Hermesdorf A, Stierhof Y-D, Schumacher K (2006) VacuolarH+-ATPase activity is required for endocytic and secretory trafficking in
Arabidopsis. Plant Cell 18: 715–730.
Subcellular Dynamics in Plants
PLoS ONE | www.plosone.org 13 May 2009 | Volume 4 | Issue 5 | e5716