The study of-consumer behaviour enables marketers to ...
78
1 CHAPTER ONE INTRODUCTION 1.1 Background of the study The study of-consumer behaviour enables marketers to understand and predict consumer's consuming and disposing activities. Consumer behaviour is defined as the behaviour that consumers display in searching for, purchasing, using, evaluating, and disposing of products, services and ideas that they expect 'will satisfy their needs. Consumers and customers are diverse in nature. Customers stand for those who regularly purchase from a particular store, company, organization or place. But consumers are those who regularly purchase and use by themselves. Customers may or may not be consumers, but consumers are always being customers. Consumers are mainly of two types; individual consumers and organizational consumers. Individual consumers buy goods and services for their own use and for household use. Organizational consumers include profit and non-profit businesses, government agencies and institution. Both consumers purchase goods, services, and ideas for their own use. But in consumer behaviour, individual consumers are the main focus of the study. In general, consumers are both buyers and users. But in some extent, at least one person can play one or more than one role in purchasing and consuming. These roles may appear in the forms of initiator, influencer, decider, buyer, and user. These roles are explained in table- 1.1 (Zaltman and Buyer 1975:142) Table 1.1 Role as Description Initiator The individual who suggests the idea for product Influencer Provides information and advice about the product. Decider Who makes the buying decision. Buyer The individual, who actually makes the purchase of product. User The person most directly involved in the consumption or use the product.
-
Upload
khangminh22 -
Category
Documents
-
view
0 -
download
0
Transcript of The study of-consumer behaviour enables marketers to ...

1
CHAPTER ONE
INTRODUCTION
1.1 Background of the study
The study of-consumer behaviour enables marketers to understand and
predict consumer's consuming and disposing activities. Consumer behaviour is defined as
the behaviour that consumers display in searching for, purchasing, using, evaluating, and
disposing of products, services and ideas that they expect 'will satisfy their needs.
Consumers and customers are diverse in nature. Customers stand for those who
regularly purchase from a particular store, company, organization or place. But consumers
are those who regularly purchase and use by themselves. Customers may or may not be
consumers, but consumers are always being customers.
Consumers are mainly of two types; individual consumers and organizational
consumers. Individual consumers buy goods and services for their own use and for
household use. Organizational consumers include profit and non-profit businesses,
government agencies and institution. Both consumers purchase goods, services, and ideas
for their own use. But in consumer behaviour, individual consumers are the main focus of
the study.
In general, consumers are both buyers and users. But in some extent, at least one
person can play one or more than one role in purchasing and consuming. These roles may
appear in the forms of initiator, influencer, decider, buyer, and user. These roles are
explained in table- 1.1 (Zaltman and Buyer 1975:142)
Table 1.1
Role as Description
Initiator The individual who suggests the idea for product
Influencer Provides information and advice about the product.
Decider Who makes the buying decision.
Buyer The individual, who actually makes the purchase of product.
User The person most directly involved in the consumption or use the product.

2
For example, a wife as an initiator and influencer may ask her husband (buyer)
pick up a box of total cereal on his shopping trip because their child (user) said she
wanted it.
Consumer behaviour is an exciting and dynamic field of study. Consumer
behaviour is a young discipline; the first textbook was written in the 1960s. Its intellectual
forefathers, however, are much older. For example, Thorstein Veblen talked about
conspicuous consumption in 1899. Similarly, in the early 1900s writers began to discuss
how psychological principles could be used by advertiser. (Ward and Robertsom, 1973:3-
42)
Consumer behaviour was a relatively new field of study in the mid-to-cate 1960s.
With no history or body of research of its own, the new discipline was brrowed heavily
from concept developed in other scientific disciplines, such as economics, psychology,
social psychology, anthropology and demography. In psychology, we have to study the
behaviour and mental process of individuals. In sociology, we have to study the collective
behaviour of people in group. Is social psychology, how individuals influence and are
influenced by group is studied. In Economics, people's production, exchange, and
consumption of goods and services are dealt in. And, in Anthropology, how people are
related to their culture is mentioned.
The study of consumer behaviour has three levels of analysis: (I) individual level,
(III) Micro environmental level, and (III) Macro environmental level. Individual level of
analysis focuses on identifying the processes that influence a person in the acquisition,
consumption, and disposition. In fact problem recognition, information search and
evaluation, purchasing problem, decision process, post purchase behaviour, and feedback
are studied in individual analysis. Micro environmental levels of study consist of those
interpersonal and situational factors, which are outside of the person, that influence
consumer behaviour at any particular point of time. In it, we have to study on information
processing, learning and memory, motivation and involvement, attitudes, personality, self
concept and leadership. Macro environment levels of study consist of the broad set of
forces that influence a large number of consumers to act similarly. The type of macro-

3
environment includes the effects of culture, subculture, social class, social group, family
and personal, economic and government conditions.
The study of consumer behaviour provides benefit for consumers, marketers, and
even students. As consumers and marketers are diverse in nature, the reasons why people
study consumer behaviour are also diverse.
Consumers' insight into their own consumption- related decision; what they buy,
why they buy, and the promotional influences that persuade consumer to buy by showing
their behaviour.
Marketers recognize why and how individuals make their consumption decisions
by studying consumer behaviour. They can make better strategic marketing decisions. If
marketers understand consumers' behaviour, they are able to predict how consumers are
likely to react various informational and environmental clues, and are able to shape their
marketing strategies. Marketers who understand consumer behaviour have great
comparative advantage in the market place.
Students gain insights into why individuals act in certain consumption related ways
and with learning what internal and external influences impel them to act as they do.
The interdisciplinary background in which the consumer behaviour discipline is
rooted, it is not surprising that academicians from a verity of contributing disciplines,
including marketing itself have become interested in the study of consumer behaviour not
necessarily from a managerial or applied perspective, but simply to understand the
consumer better. From the point of view of understanding consumption behaviour and the
meanings behind such behaviour is called interpretivism.
Interpretivists have expanded the boundaries of study to include many subjective
aspects of consumer behaviour such as the effects of moods, emotions and type of
situation on consumer behaviour, the role of fantasy of rituals, even of the sensory
pleasures that certain products and services provide. Many interpretivists consider each
purchase experience unique, because of the diverse set of variables that play at a particular
moment in time. Because of its focus on the consumption experience, the interpretive
approach is also known as experimentalism.

4
Despite the apparent diversity in context with consumer behaviour, some common
approaches should be taken into account while studying consumer behaviour.
Consumer analysis provides the foundation of marketing management. It assists
managers in designing the marketing mix: segmenting the market place; predicting
product positioning and differentiation; performing environmental analysis; and
developing market and research study.
Consumer analysis plays a critical role on public policy development
Knowledge of consumer behaviour improves personal ability to be a more effective
consumer.
Consumer analysis provides Knowledge of human behaviour.
The study of human behaviour provides three types of information.
Consumer orientation, fact about behaviour, and theories to recognize the thinking
process.
Consumer decision process varies considerably in its complexity. Most of the
decisions consumers require to make are probably rather simple ones, such as the
purchase of staple foods. However, consumers also must make decisions that are
comparatively complicated, such as buying durable goods. The range of difficulty of
consumer decision process extends even further to problem solving that may be
characterized as being highly complex, such as might well typify the consumer's purchase
of a very expensive item like a home. (Ludaon and Della Bitta, 1993:485-486)
The range of consumer problem solving approaches can be placed on a spectrum
from routing problem solving to limited problem solving, and to extensive problem
solving as follows. ( Howard 1989:361-364)
Routine problem solving (RPS)
In routine problem solving when consumers buy a new brand they have purchased before,
it usually involves little or no information seeking and performed quickly. Consumers are
brand loyal and trend to buy in a habitual, automatic, and unthinking way.
5
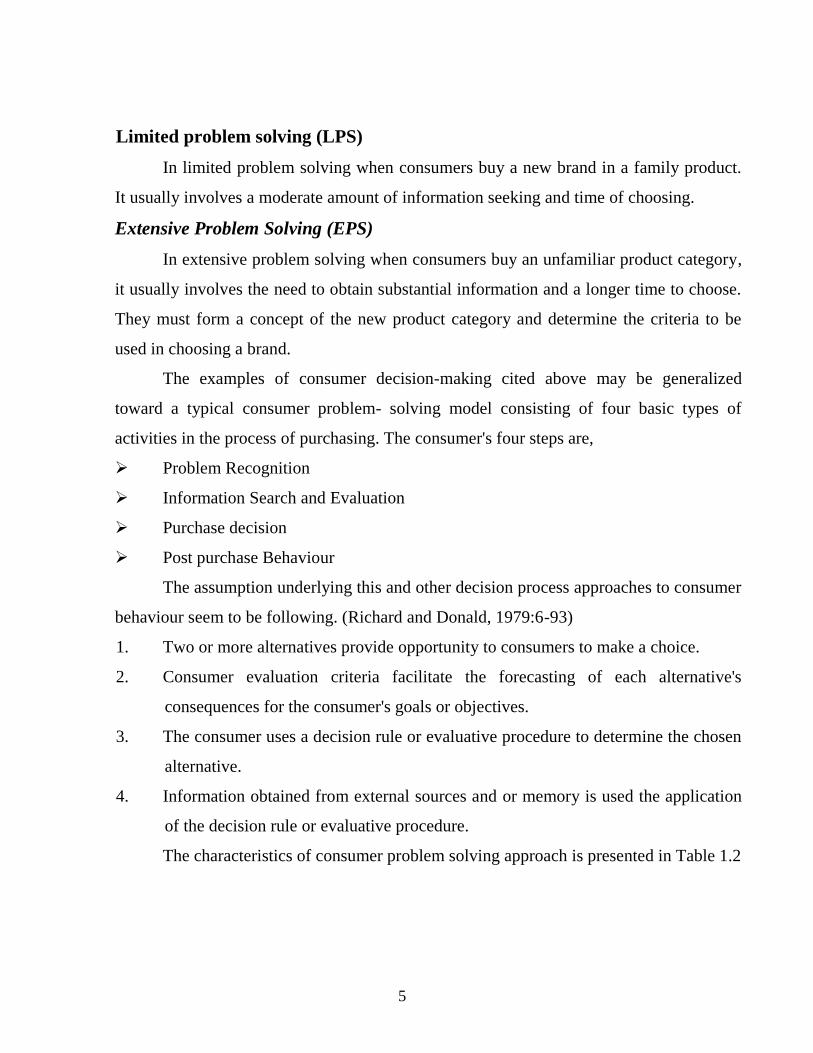
Limited problem solving (LPS)
In limited problem solving when consumers buy a new brand in a family product.
It usually involves a moderate amount of information seeking and time of choosing.
Extensive Problem Solving (EPS)
In extensive problem solving when consumers buy an unfamiliar product category,
it usually involves the need to obtain substantial information and a longer time to choose.
They must form a concept of the new product category and determine the criteria to be
used in choosing a brand.
The examples of consumer decision-making cited above may be generalized
toward a typical consumer problem- solving model consisting of four basic types of
activities in the process of purchasing. The consumer's four steps are,
Problem Recognition
Information Search and Evaluation
Purchase decision
Post purchase Behaviour
The assumption underlying this and other decision process approaches to consumer
behaviour seem to be following. (Richard and Donald, 1979:6-93)
1. Two or more alternatives provide opportunity to consumers to make a choice.
2. Consumer evaluation criteria facilitate the forecasting of each alternative's
consequences for the consumer's goals or objectives.
3. The consumer uses a decision rule or evaluative procedure to determine the chosen
alternative.
4. Information obtained from external sources and or memory is used the application
of the decision rule or evaluative procedure.
The characteristics of consumer problem solving approach is presented in Table 1.2

6
Table 1.2
Characteristics of Consumer Problem Solving Approach
RoutineProblemSolving
Limited ProblemSolving
Extensive ProblemSolving
Purchaseinvolvementlevel
Low Medium High
Problem
Recognition
Automatic Semi-Automatic Complex
Information
search and
Evaluation
Minimal Limited Extensive
Purchasing
orientation
Convenience Mix Sopping
Post Purchase
processes
Very limited
Habit Brand
Loyalty
Limited inertia to
repurchase Brand
switching if dissatisfied
Complex Loyalty if satisfied
Complain if dissatisfied
Consumer behaviour is a broad field that studies how individuals, families and
groups acquire, consume and dispose of goods, ideas, and experience. (Mowen, 1990)
1.2 Background of the company
RS. 2.5 billions soft drinks market offer immense potential, as there are only two
major players, Pepsi and Coke. There is tremendous opportunity for these two companies
as Global population, income level, life style and consumption ratio are growing fast. The
total annual sales of aerated drinks in the market are estimated at some 6.5 million cases
(each case contains 24 bottles). There is tremendous opportunity in this industry in Nepal
because there is growing trend of drinking in Cinema Halls, Stadiums, consumer's daily
travels, social gathering, restaurant, bear bar, hotel etc.

7
Pepsi co. inc. a New York based multinational company. Which produces and sales
its products in about 190 countries, began its operation in Nepal in 1986 through the local
bottler, Swastika Area led Pvt. Ltd. It was introduced to Nepalese market about 10 years
later than Coca-cola. Now Pepsi products have been growing popularity and capturing its
good market share.
The management of Pepsi bottler in Nepal was under taken by Varun Bevarages
(Nepal) Pvt. Ltd. In 1999, Varun Beverages (Nepal) Pvt. Ltd. was controlled and managed
by Jaipuria Group India. Its territorial head office and Factory was situated at Sinamangal,
Kathmandu.
The purpose of Varun Beverages (Nepal) Pvt. Ltd. Is to make availability of
deferent brands of beverage all over the kingdom to fulfill the consumer's taste and their
changing preferences. Its target consumers mainly comprise and temporarily are presented
in table 1.3 in the classified fashion.
Table 1.3
Employment Profile
Employment Permanent Temporary Total
Male 471 191 662
Female 165 68 233
Total 636 259 895
(source:- Internal unpublished data of the company)
Hence there are eight hundred ninety five employees all together. Among them 73%
employees are male and 27% employees are female similarly near about 71% employees
are permanent and 29% employees are temporary.

8
CEO
GM(Marketing)
GM(Sales) GM(Finance)
GM(Plant)
Asst.Manager
MerchandisingExecutive
MarketingExecutives
TerritoryDepot
manager
ProductAvailabilitycoordinator
Financemanager
Shippingmanager
Productionmanager
Qualitycontrol
manager
Area Sales
CustomerExecutive
Rough Ride
Pre- salesRepresentat
ive
Asst. Asst. FinanceExecutives
AssistantFinance
Executives
ShippingExecutives
Assistant
Drivers
Helpers
Assistant
ExecutiveEngineers
ForemanTechnician
Helpers
Asst.Manager
Executives
Lab asst.
Helpers
Figure 1.1 Organizational Structure of the company (Source : Company's Unpublished Record)
These employees are organized in flow chart structure, which is presented below :-

9
Production capacity of Pepsi is 420 Bottle per minute (BPM) and its capacity
utilization is 90,70,000 crates. The producer of Pepsi in Nepal claims that it holds 40% of
the market, and the rest by is Coke.
The company has been the leader for producing new pack size such as 1.5 liters, 2
liters pet bottle and 200 ml. Phuchche flavors such as Slice and mountain Dew, which
have helped to increase market share. Now the company is producing seven brands in
different flavor and pack, which are presented below.
Table 1.4
Brand, flavor, and Pack Size of the Company's Products
Brand Flavor Pack
Pepsi Cola 200ml, 250ml, 300ml, 1.5ltr,
2ltr,500ml.
Mirinda Orange, lemon 200ml, 250ml, 1.5ltr, 2ltr,
500ml.
7 up/ Mountain Dew Lime 200ml, 250ml, 500ml, 1.5ltr,
2ltr.
Slice Mango 200ml, 300ml, 1ltr,500ml.
Soda 250ml
Evervess Soda 1.5ltr,500ml.
These products are distributed all over the kingdom through distributors and
retailers. These are 67 distributors all over the Nepal. Most of distributors operate by
direct observation of the company. These distributors, Most of distributors operate by
direct observation of the company.
In context of Birgunj "New Jagdamba Trader" is the authorized distributer of the Varun
beverage Nepal Pvt. Ltd. It is situated in Birgunj Jail road -6. Now it has got authority to

10
sale almost all items of Pepsi product like; Pepsi, 7up, Mirinda, Soda, Mountin Dew,
slice etc.
Its target customers mainly comprise the young generation across the country. In
terms of competition, the different brands of Coca-Cola are its prime competitors.
Marketing strategy, Investment pattern, brand outlook, and acceptance of the
brand by the public are all different from competitors. The company is also implementing
deferent and very aggressive marketing strategies to enhance its competitiveness.
Consumer schemes have always proved to be effective tools of promotion. The company
has set different strategy than Coke, offered a pack of WAI WAI noodles for these
customers who buy a 1.5 and 2 liter bottle of Pepsi. In other size bottle the company has
offered MaMa bhujiya (Karat, Shyam k., Business age : val 4,2004)
Since the establishment of the company, its flay ship brand Pepsi is doing very
well. Mountain Dew has also proved to be a good flavor and attractive packaging. Its has
been very well received by consumers. Also, there is no competitor for Mountain Dew.
So that the market of mountain dew increasing day by day also.
1.3 Statement of the problem.
Pepsi and Coke are mainly two competitors in cold drinks market in Nepal. The
prestigious growth of the market between these Cola giants has been growing ever since
Pepsi to Nepal in 1999. Since Coke entered Nepal in 1997, it had been enjoying market
leadership in soft drink industry. So Coke had a sort of monopoly in the market till then.
The total annual sale of aerated drinks in the market is estimated at some 6.5
million cases. The producer of Pepsi in Nepal claims that the Pepsi holds 40% of the
market. The rest is attributed to Bottler's Nepal (Shyam, 2004). So, the Varun Beverages
(Nepal) Pvt. Ltd. must affectively use its marketing strategies for growing their market
share.

11
But to what extent it is effortful in boosting up Nepalese consumer's behaviour in
the intervals of time remains always a question to be answered from time to time.
Therefore, this research starts with the following problems.
What is the buying behaviour of consumers (age group, sex group, and
occupational group)?
Which are the most effective factors that consumers consider while making buying
decision?
What are the consumption patterns of consumers (age group, sex group, and
occupational group)?
Are the Nepalese consumers of Pepsi product satisfied with what they get in the
market?
Which are the important promotional activities carried out by the company?
Which advertising media are most effective to remote consumer?
Does the location, brand awareness, and shop awareness affect the purchase
behaviour of consumers?
1.4 Objectives of the study
Keeping in view the statement of research of problems, the objectives of the study
are set as follows;
To ascertain and compare buying behaviour of age group, sex group, and occupation
group consumers.
To find our consumption patterns of these categories of consumers.
To ascertain the degree of satisfaction that consumers get from Pepsi products.
To evaluate the effective promotional activities that the company uses.
To measure the effectiveness of advertising media, used by the company.
To examine of what extent the location, brand awareness, and shop awareness of
consumers influence their purchasing decision.
To evaluate factors that influence consumer purchase decision.
To provide suggestions on findings of the study.

12
1.5 Research Hypothesis.
This research has the following hypotheses:
Ho: There is no significant difference between the views expressed by different
groups of respondents relating to consumption pattern, price, quality, quantity, brand
image, Advertising media, and promotional activities.
HA: There is significant difference between the views expressed by different
groups of respondents relating to consumption pattern, price, quantity, quality, Brand
image, Advertising media, and promotional activities.
1.6 Significance of the Study
Consumers are the king of the market so consumer's satisfaction is the main
motto of any organization or producer. Consumer's behaviour plays a significant role in
consumption patterns. Consumption is the optimum use of the product. For knowing the
complexity of the consumer's behaviour, studies are conducted from time to time.
The Nepalese market has been gradually heading towards cut-throat competition.
In this context, different types of product with a large number of alternative brands are
available in the market. It is essential for the manufacturers and/or marketers of the
products to know the buying behaviour of target customers to achieve its goods.
The focus of the study, therefore, is on buying behaviour of Pepsi products of
different groups of customers having their own values, belief, and customs. The research
therefore, will occupy the following importance.
This study will be a good assets for the library.
This research will help other researchers while reviewing their literature.
This study will also be useful for Varun Beverages (Nepal) Pvt. Ltd. As it will
mention same suggestions.
The research will meet the partial requirement of completing master degree.
13
1.7 Limitations of the Study
This research has the following limitations.
Since convenience sampling is used, it may not reach some areas of true
representation of soft drinks users.
The findings have been derived from only those data which were responded by the
sampled consumers and the organization.
The researcher limited the uses of statistical tests because of small sample size.
Due to various reasons the primary data are mainly collected from Birgunj Sub-
Metropolitan city.
1.8 Chapter Scheme
This thesis has been prepared under five specific chapters.
The first chapter includes background of the study, background of the company,
statement of the problem, objectives of the study, research hypothesis, significance of the
study, limitation of the study, and chapter scheme.
The second chapter contains review, and review of previous studies. Conceptual
review includes introduction of consumer behaviour traditional models of consumer
behaviour, and contemporary models of consumer behaviour, introduction of advertising
of promotional activities.
The third chapter presents research design, nature and sources of data, sampling
plan, data collection procedure, and analytical tools and procedure.
The fourth chapter is explanatory in nature and deals with consumption pattern
of Pepsi consumers, degree of consumer satisfaction, effectiveness of promotional
schemes of the company, effectiveness of the media advertising of the company,
locations, stress, and brand awareness of the company, and factors influencing consumer
purchase decision.
The fifth chapter provides summary, conclusions and major finding of the study,
and recommendations.
In addition to these chapters, bibliography and references, and appendices have
also been attached with at the end.

14
CHAPTER –TWO
REVIEW OF LITERATURE
The purpose of reviewing the literature is to develop some expertise in one’s area to see
what new contributions can be made and to receive some ideas for developing a research
design.
Scientific research must be based on past knowledge. The previous studies cannot
be ignored because they provide the foundation to the present study in other words, there
has to be continuity in research studies.
Thus, the purpose of literature review is to find out what research studies have
been conducted in one’s chosen field of study, and what remains to done. It provides the
foundation for developing a comprehensive theoretical framework form which hypothesis
can be developed for testing ( H.K.Wolff and P.R. Pant 1999, 30)
In this section the researcher has tried to review the findings of a few
past researches in consumer buying decision making along with the textual review.
2.1 Conceptual review
In this part, concept of the topic and its related meaning are presented which help
to know the research and its findings in this study, conceptual review includes
introduction of consumer behaviour, and models of consumer behaviour.
2.1.1 Introduction of consumer Behaviour.
Consumer behaviour in simple terms means the behaviour shown by
consumer before purchase, while purchasing and after purchase of the product. The term
consumer behaviour refers to searching for purchasing using evaluating and deposing of
products and service that they expect will satisfy.
Consumer behaviour is the study of the decision making units and processes
involved in acquiring consuming and disposing of goods and services, experiences and
ideas ( mayan, J.C 2nd p5 )

15
The term consumer behaviour refer to the behaviour of that consumers display in
searching for purchasing using, evaluating and disposing of products and service that
they expects will satisfy their needs ( seiffman, L.G1995, 5th P-7)
Study consumer behaviour is quite complex, especially because of many variables
involved and their tendency to interact. Consumer behaviour is an exciting and dynamic
field of study. A wonderful aspect of taking a course in consumer behaviour is those
examples are everywhere. Because all of us are consumers, we can draw on our everyday
experiences in the market place to understand consumer behaviour concepts and theories.
In order to study consumer behaviour, it is necessary to make up one’s mind with
different behaviour models so that it will be easier latter to find out the satiability of cold
drink consumers behaviour. these models have been separately briefed out.
In order to study consumer’s behaviour, it is necessary to make up one’s mind
with deferent behavioural models so that it will be easier to understand it. A model can be
defined as a simplified representation of reality. it simplifies by incorporating only those
aspects of reality that interest model builder. Other aspects that are not of interest only
add to the complexity of the situation and can be ignored, thus an architect’s model of a
building’s design. Similarly in modeling consumers we should feel free to exclude any
aspects that are not relevant to their behaviour. Since we have defined consumer
behaviour as involving in a decision process, models that focus on this process will be of
considerable interest to us ( * Engel, James and Black well, 1993 : P 599)
There are two types of consumer behaviour models : Traditional models and
contemporary models.
2.1.2 Traditional Models of consumer Behaviour.
The earliest comprehensive consumer models were actually devised by economists
seeking to understand economic systems. Economics involves the study of how scarce

16
resources are allocated among unlimited wants and needs. ( Michael, 1965,P-4) its tow
majour disciplines – Macroeconomics and Microeconomics – have each developed
alternative views of consumers
Economics
Behavioural model
2.1.2.1. Economics Models – They are also of two types
Micro Economic model.
Macro economic model.
Micro economic model :
The classical microeconomic approach, developed early in the nineteenth century,
focused on the pattern of goods and prices in the entire economy. it involved making a
series of assumptions about the nature of the “ average’’ consumer and then developing a
theory useful in explaining the workings of an economy made up of many such people.
Focus was placed on the consumer’s act of purchase, which of course is only a portion of
what we have defined as consumer behaviour. Thus micro economists concentrated on
explaining what consumers would purchase and in what qualities these purchases would
be made. the tastes and preferences leading to these purchase were assumed to be known
already. There fore, micro economists chose to ignore why consumers develop various
needs and preferences and how consumers rank these needs and preferences.
The resulting theory was based on a number of assumptions about consumers.
Primary among these were the following :
Consumer wants and needs are in total unlimited and therefore cannot be fully
satisfied.
Given a limited budget, consumers goals are to allocate available purchasing
dollars in a way that maximizes satisfaction of their wants and needs.

17
Consumers independently develop their own preferences, without the influence of
other, and these preferences are consistent over time.
Consumers have prefect knowledge of the utility of an item ; that is they know
exactly how much satisfaction the product can give them.
As additional units of a the units of a given product ro service are acquired the
marginal ( additional ) satisfaction or utility provided by the next unit will be less
than she marginal satisfaction or activity provided by previously purchased units.
this is referred to as the low of diminishing marginal utility.
Consumer use the price of a good as the sole measure of the sacrifice involved in
obtaining it price plays no other role in the purchase decision.
Consumer are perfectly rational in that given their subjective preferences ; they
will always act in a deliberate manner to maximize their satisfaction.
Given these assumptions economists argued that perfectly rational consumers will
always purchase the good that provides them with the highest ratio of additional
benefit to cost ( Eagel, James, Reger, 1993; p 600-601)
Macroeconomic models
Macroeconomic focus on aggregate flows in the economy –the monetary value of
goods and resources, where they are directed and how they change over time (
Richard, 1966, p-8 ) from such a facous, the macroeconomist draws conclusions about
the behaviour of consumers who influence these flows. Although the discipline has
not generated a full unified model of consumers it does offer a number of insists into
their behaviour.
One interest centers on how consumers divide their income between consumption
and savings. This deals with two economic facts of life higher income families spend
a smaller proportion of their disposable income than do lower –income families but as
economic progress raises all income levels over time these proportion do not seem to
change. That is lower –income groups do not significantly change the proportion of
income devoted to spending as economic progress result in an increase in their

18
income. The relative –income hypothesis explains this apparent contradiction by
arguing that people’s consumption standards are mainly influenced by their peers and
social groups rather than their absolute income levels ( J.J. Duesenberry, 1949).
Therefore, the proportion of a family’s income devoted to consumption is expected to
change only when an income change places the family in different social setting. This
will not happen when an income levels are rising at the same time.
Another macroeconomic proposition, the permanent –income
hypothesis explains why specific individuals are slow to change their consumption
patterns even when their incomes do suddenly change. It proposes that consumers do
not use actual income in any period to determine the amount of their consumption
expenditures, but instead are influenced by their accumulated wealth ( J. William :
1980, p-55-66 ) suddenly increases or decreases in income are viewed by the
consumer as temporary and therefore are expected to have little influence on
consumption activity.
2.1.2.2 Behavioural Economics models
Behavioural influence on consumers were viewed as complication factors
which could be assumed to cancel each other out. George Katona found this approach
lacking and argued that an appreciation of how psychological variables influence
consumers could lead to a deeper understanding of the behaviour of economic agents
( Katona : 1963). Katona’s viewpoint now known as behavioural economics was
fostered by important changes which occurred in our economy, especially after World
war II.Rising income levels had given a large number of consumer’s significant
discretionary income spending power available after necessities had been purchased,
In short, our economy had changed from one characterized as “ much for few ‘’ to
one described as more for many ‘’ ( Katona 1980,-6) A very simplified representation
of Katonah, viewpoint appears in figure.
2.1 As in traditional models, actual economic conditions are shown as influencing
consumers. These economic condtions include the rates of interst inflation and
19
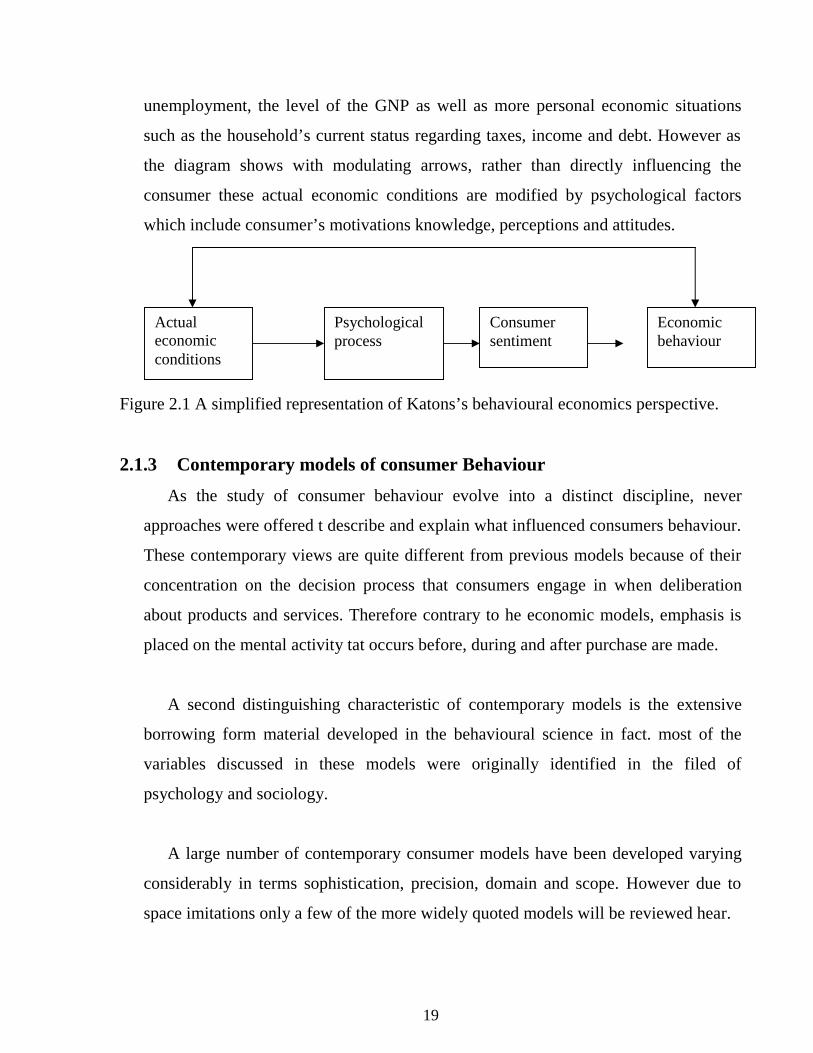
unemployment, the level of the GNP as well as more personal economic situations
such as the household’s current status regarding taxes, income and debt. However as
the diagram shows with modulating arrows, rather than directly influencing the
consumer these actual economic conditions are modified by psychological factors
which include consumer’s motivations knowledge, perceptions and attitudes.
Figure 2.1 A simplified representation of Katons’s behavioural economics perspective.
2.1.3 Contemporary models of consumer Behaviour
As the study of consumer behaviour evolve into a distinct discipline, never
approaches were offered t describe and explain what influenced consumers behaviour.
These contemporary views are quite different from previous models because of their
concentration on the decision process that consumers engage in when deliberation
about products and services. Therefore contrary to he economic models, emphasis is
placed on the mental activity tat occurs before, during and after purchase are made.
A second distinguishing characteristic of contemporary models is the extensive
borrowing form material developed in the behavioural science in fact. most of the
variables discussed in these models were originally identified in the filed of
psychology and sociology.
A large number of contemporary consumer models have been developed varying
considerably in terms sophistication, precision, domain and scope. However due to
space imitations only a few of the more widely quoted models will be reviewed hear.
Actualeconomicconditions
Psychologicalprocess
Consumersentiment
Economicbehaviour

20
2.1.3.1 Nicosia model
Francesco Nicosia was one of the first consumer – behaviour modelers to shi8f
focus from the act of purchase itself to the more complex decision process that
consumers engage in about products and services ( Nicosia 1966 ) The model is
presented in flow – chart format, resembling the steps in a computer program. Also all
variables are viewed as interacting with none being inherently ependent or
independent. Thus the model describes a circular flwo of influences where each
component provides input to the next.
The model is viewed as representing a situation where a firm is designing
communications ( ads, product, etc ) to deliver to consumers and consumers responses
will influence subsequent actions of the firm. Generally as shown in figure 1.2 the
model contains four major components or fields :
The firm’s attributes and output or communications and the consumer’s
psychological attributes.
The consumer’s search for and for and evaluation of the firm’s output and
other available alternatives.
The consumers motivated act of purchase.
The consumers shortage or use of the product.
Nicosia assumes that the consumers seeks to fulfill specific goals and that initially there
is no history between the consumer and the firm, so no positive or negative
predispositions towards the firm exist in the consumer’s mind.

21
Field one
Attitude
Field two
Experience
Motivation
Field Three
Field four
Purchasing behaviour
Figure – 2.2 A summary view of the Nicosia model of consumer behaviour.
As shown in the figure, the firm produces some communications that the
consumers are exposed to attributes of the message and the consumer determines the
nature of consumer’s exposure to it and it influence on him. one consequence is that the
message will influence the consumer’s attitude towards the brand. this attitude is the
input to field two.
Sub field one
Firm’sattributes
Massageexposure
Sub field two
Consumersattributes (especiallypredispositions
Searchevaluation
Decision ( action )Consumptionstorage

22
The consumer will probably become motivated to gain information at that point,
and search activity is likely to occur. Some search activity will involve searching internal
memory for relevant information about the communication. external search may also
occur where the consumer visit store, reds, etc. This is likely to lead to evaluation. if
consumer processes relevant information and. begins to favor the firms’s brand he will be
motivation towards it. if nothing intervenes, this motivation is likely to lead to sopping
activity and purchase of the brand. At this point a number of out comes can occur. One
outcomes is that the firm receives feedback and another is that the consumers attitudes
towards the brand may change because he gain experience with the product during its
storage and use. The product experience is feedback to the consumer’s predispositions.
2.1.3.2 Howard – sheth Model
The Howard –sheth model is a very sophisticated comprehensive theory of
consumer behaviour ( Howard and sheth the theory of Buyer Behaviour 1996 ) It should
be noted that the authors actually use the term ‘’ Buyer” in the their model to industrial
purchase as well as ultimate consumers. Thus it can be seen that their interest was to
develop a unified theory useful for understanding a great variety of behaviour.
The model attempts to depict rational brand choice behaviour by buyers
under conditions of incomplete information and limited abilities It distinguishes three
levels of decision making.
* Extensive problem solving.
Extensive problem solving is the early stages of decision making in which
the buyer has little information about brand and has not yet developed well defined and
structured criteria by which to choose among products ( choice Criteria )
* Limited problem solving
In this more advantage stage choice criteria are well defined but the buyer is still
undecided about which set of brand will best serve him. Thus the consumer still
experiences uncertainty about which brand is “ best”

23
Routinized Response Behaviour
In routinized respose behaviour buyers have well defined choice criteria and also
have strong predispositions towards one brand. Little confusion exists in the consumers
mind and he is ready to purchase a particular brand with little evaluation of alternatives.
The models borrowed from learning theory concepts to explain brand
choice behaviour over time as learning takes place and the buyer moves from expensive
to reutilized problem solving behaviour. Four major components have been explained as
under.
Input Variables
Input variable are the stimuli in the environment significant stimuli are actual
elements of brands that the buyer confronts, while symbolic stimuli are generated by
produces representing their products in symbolic form, such as in advertisements. Social
stimuli are generated by the social environment including family and group.
Output variables
Out put variables in the right hand portion of the model are the buyers observable
responses to stimulus inputs. They are arranged in order from attention to actual purchase
and are defined as follows.
Attention – The magnitude of the buyer’s information intake.
Comprehension – The buyers store of information about a brand.
Attitude - The buyers evaluation of a particular brand’s potential to satisfy his or her
motives.
Purchase behaviour – The actual purchase act which reflects the buyers predisposition
to buy as modified by any inhibitors.
Hypothetical constructs -
Hypothetical constructs are categorized into two major groups.

24
Preceptual constructs which deals with information processing.
Leaning constructs which deals the buyer’s formulation of concept
The three perceptual constructs of the model are as follows :
Sensitivity to information – The degree to which the buyers regulates the stimulus
information flow.
Perceptual bias – distorting or altering information
Search for information – active seeking of information about brands or their
characteristics.
The buyers six learning constructs are defined as:
Motive – general or specific goals impelling action.
Brand potential of the evoked set - the buyers perception of the ability of brands in his
or her evoked set ( those that actively considered ) to satisfy his or her goals.
Decision mediator - The buyers mental rules for matching and ranking purchase
alternatives according to his or her motives.
Predisposition – a preference toward brand in he evoked set expressed as an attitude
towards them.
Inhibitors – environmental forces such as price and time pressure which restrain
purchase of a preferred brand.
Satisfaction - the degree to which consequences of a purchase measure up to the buyer’s
expectation for it.
Exogenous variables
At the top of the black box the model lists a number of external variables that can
significantly influence buyer decisions. These variables are not as well defined as other
aspects of the model because they are external to buyer.

25
Although there are various aspects of the model that are beyond the scope of this
report a brief review of its operation is appropriate. The process starts when the buyer
confronts as input stimulus and it achieves attention the stimulus is subjected to
perceptual bias as a result of the influence of the buyers predispositions as affected by
his or her motives decision mediators and evoked set. The modified information will also
influence these variables which in turn will influence his or her predispositions to
purchase
The actual purchase is influenced by the buyers intentions and inhibitors which are
confronted. A purchase leads the buyers to evaluate his or her satisfaction with it and
satisfaction increase the buyer’s predisposing toward the brand ; As less external search
for information and exhibits more routine purchase behaviour.
2.1.3.3 Engle – Blackwell – Miniard Model
The Eagle – Blackwell – miniard model was originally developed in 1968 by eagle
Kollat and Blackwell and has gone through numerous revision ( Eagle Kollat, Blackwll :
consumer behaviour : 1990 ) Most recently the model has been developed by minard in
conjunction with engel and Blackwell ( Engle, Blackwell and miniard, consumer
behaviour 1990)

26
Input Information Decision Influencing
Processing Process decision
Process
Figure-2.3 The engel Blackwell Minard Model of consumer behaviour.
Similar to the Howard –sheth engel blackwell and miniard model recognize to
significantly different modes of operation by consumer One is describe as extended
problem solving behaviour ( EPS ) which is characterize by high levels of involvement
and or high levels of perceived risk. Under EPS the products evaluation process will be
rigorous and if necessary the consumer will shop at many outlets. In addition satisfaction
with the brand is crucial for continued commitment to use the brand. In limited problem
Stimuli:MarketerDominatedOther
External Search
Exposure NeedRecognition
Attention
Comprehension
Acceptance
Retention
Mem
ory
InternalSearch
Search
Beliefs
Attitude
Intention
Purchase
Out comes
Dissatisfaction Satisfaction
Alternativeevaluation
EnvironmentalInfluenceCultureSocial ClassPersonalInfluences
IndividualdifferencesConsumerResourcesKnowledgeAttitudePersonalityLife styleDemographics

27
solving behaviour ( LPS ) the consumer is operation under low levels of involvement and
/ or low levels of perceived risk. Consequently he has low motivation to search for brand
information and is only willing to engage in a no rigorous evaluation of alternatives. He
is not motivated to shop at many outlets and satisfaction with the purchase will encourage
repurchase because of inertia not real loyalty with the product.
First the consumer searches internal memory to determine what is known about
the alternatives and how auto choose among them. External search for information will
be activated if the consumer dies not feel comfortable with his existing knowledge. The
likelihood of external search is also affected by characteristics of the individual ( low risk
takers will tend to seek more information etc ) and environmental influences such as the
urgency of need.
Any informational inputs are subject to information processing activities which the
consumer uses to derive meaning from stimuli. The first step in processing involves
exposure to such stimuli. Exposure can happen on an involuntary basis-such as when one
sees a billboard next to a highway or though the active search for information. After
exposure, stimuli must capture the consumers conscious attention to significantly
influence extensive problem solving. The attention stage is highly selective since it tens
to ignore most stimuli and admits only those that the individual believes are important.
The comprehension stage ten involves deriving meaning form information that has been
attended to and holding this meaning in what is termed short term memory where it can
be retained briefly to allow further processing. The final two steps of information
processing are related to the third stage of the decision process – alternatives evaluation.
The alternative evaluation ; stage involves comparing information about alternative
brands gained through the search process to evaluation criteria which are product judging
standard that have been stored in permanent memory. The first information –processing
step associated with this evaluation task is termed acceptance. Acceptance occurs when
information is compared to evaluation criteria and as a result, existing beliefs held in

28
permanent memory are either reinforced or changed. whether the information tends to
reinforce or to change existing beliefs is a function of how consistent it is with the beliefs
and the degree to which the consumer generates supportive or negative thoughts about
the information being received. In either case, acceptance results in the retention of
information in permanent memory while a lack of acceptance results in the loss of such
information.
Generally the most common path is the information acquired is used to
evaluation alternatives and this leads to changes in beliefs about the brands this in turn,
leads to change in attitudes and intentions to purchase
Brand judged against evaluation criteria are likely to have some features either
positive or negative. In EPS these result tend to compensate for one another so that the
consumer develops an overall weighted judgment or each brand.
The alternative evaluation process leads to an intention to make a purchase of the
most favorably evaluated brand. Unless situations ( lack of money uncertainty about
future income etc) intervene to postpone or stop the process, intentions will lead to actual
purchase behaviour. At this point the consumer beings to use3 the product and evaluation
continues by comparing performance to expectations. One outcome is satisfaction but if
the alternative does not meet expectations dissatisfaction is the result. These results may
lead to further search for information about the brand and change in beliefs. Thus the
process is seen as a continuous one that does not stop with a purchase.
In limited problem – solving situations the consumer is not highly involved and a
number of the stages are shortened or pursued by the consumer with less just run out of
the product. External search is also likely to be minimal and often information is acquired
by just seeing ads and “running into” the sources of product information. Alternatives are
often evaluated by determining whether they meet some minimal level of acceptability
and purchase is made with minimal deliberation. IF the brand meets expectation
repurchase is likely but brand loyalty is not likely due to the lack of involvement.

29
Bettman’s Information Processing Model of Consumer Choice (Bettman, 1990:
p. 659-663)
The Bettman’s model has seven basic components
i) Processing capacity. ii) Motivation
iii) Attention and perceptual iv) Information acquisition and evaluation.
v) Memory vi) Decision Processes
vii) consumption and learning processes viii) Scanner and interrupt mechanisms
Figure 2.4 Bettman’s Information Processing Model of Consumer Choice.
Motivation GoalHierarchy
ProcessingCapacity
Attention PerceptualEncoding
Scanner andinterruptMechanism
InterruptInterpretationand response
InformationacquisitionandEvaluation
MemorySearch
ExternalSearch
ScannerandInterruptMechanism
InterruptInterpretationand response
DecisionProcess
ScannerandInterrupt
Interruptinterpretationand response
Consumptionand Learningprocess
Scanner andInterruptMechanism
Interruptinterpretationand response
30
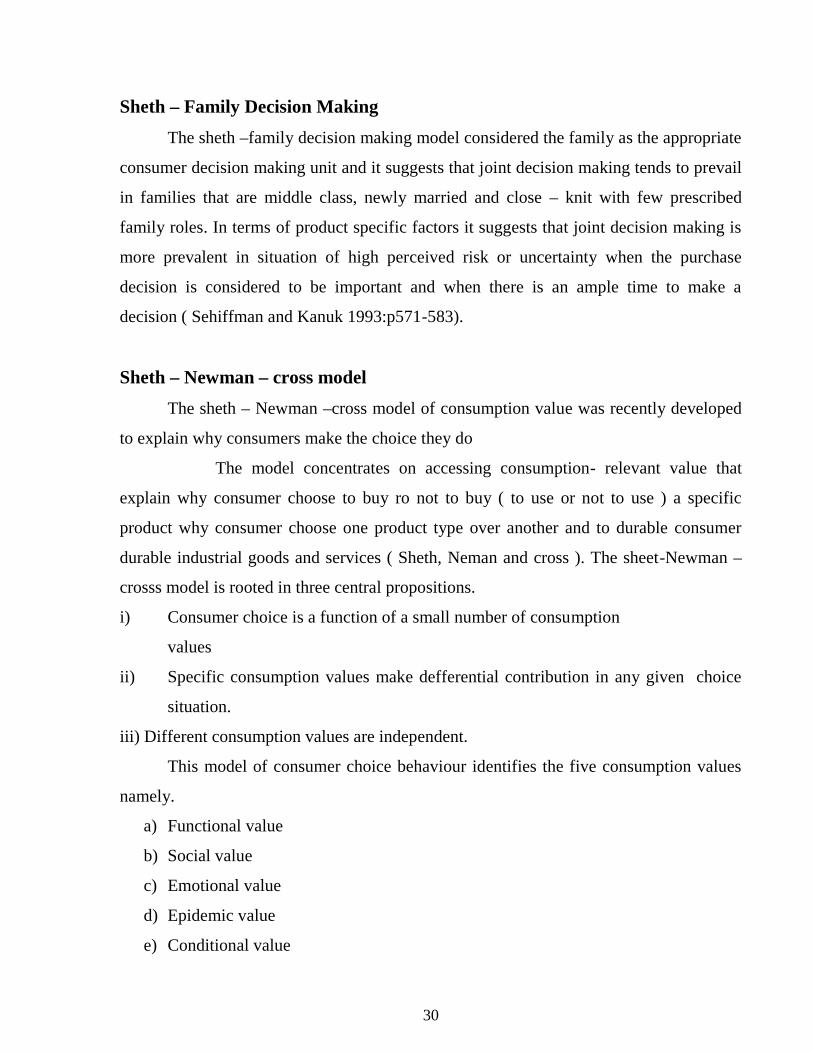
Sheth – Family Decision Making
The sheth –family decision making model considered the family as the appropriate
consumer decision making unit and it suggests that joint decision making tends to prevail
in families that are middle class, newly married and close – knit with few prescribed
family roles. In terms of product specific factors it suggests that joint decision making is
more prevalent in situation of high perceived risk or uncertainty when the purchase
decision is considered to be important and when there is an ample time to make a
decision ( Sehiffman and Kanuk 1993:p571-583).
Sheth – Newman – cross model
The sheth – Newman –cross model of consumption value was recently developed
to explain why consumers make the choice they do
The model concentrates on accessing consumption- relevant value that
explain why consumer choose to buy ro not to buy ( to use or not to use ) a specific
product why consumer choose one product type over another and to durable consumer
durable industrial goods and services ( Sheth, Neman and cross ). The sheet-Newman –
crosss model is rooted in three central propositions.
i) Consumer choice is a function of a small number of consumption
values
ii) Specific consumption values make defferential contribution in any given choice
situation.
iii) Different consumption values are independent.
This model of consumer choice behaviour identifies the five consumption values
namely.
a) Functional value
b) Social value
c) Emotional value
d) Epidemic value
e) Conditional value

31
Of the entire consumer behaviour model presented here, only the howard sheth model
have been subject to more than a minimum of systematic testing. The Engle, Kollat,
Blackwell model ha received only modest small. scal testing and the Nicosia and Bettman
model have not been tested at all ( schiffman and Kanuk, 1992:p664 ) sheth family
decision model deals family decision –making and sheth, Neman- cross model is
concered with consumption values especially why consumers choose to buy a specific
product or a specific brand.
Although the number and complexity of operations carried out by a consumer
caries with the type of purchase involved the consumer buying in general has been
regarded as a problem solving i.e extensive problem solving limited problem solving and
routinized response behaviour the consumer decision process involves myriad of
decisions made with repect to the choice of the product brand vendor buying quantity
delivery time mode of payment etc.
A normative consumer decision process model as postulated by howard and sheth
( 1969) Nicosia ( 1969) Engel Kollat and blackweel ( 1968) and Andreessen ( 1966)
involves five step of problem recognitions information search alternative evaluation
choice and outcomes. As argued by Bettman ( 1978) these steps however need not be
sequential. According to him it is too simplistice a view to say that decisions are made
after all necessary information regarded has been gathered because choice and
information acquisition occur simultaneously. Moreover the stages decision processes are
also affected by decision inputs ( Marketing mix offered by the forms ) and socio –
cultural background of the decision maker ( schiffamn and Kanuk 1990). the chief
assumption of such flwo chart model of consumer decision marking is that alternatives
exists for a buyer and he/ she is rational enough to judge the consequences of each action
on him/ her by evaluating them on the basis of information available either in their
memory or form external sources of information A brief description of different
components of consumer decision process follows which might be able provide an

32
understanding of the entire complete scale of consumer decision and the specific aspects
there of reviewed in this chapter..
Figure 2.6 Simplified summary of Consumer decision process.
Problem Recognition
The existence of a problem ( ungratified needs ) trigger off a series of activities
that end up with a choice made by the buyers consumer’s needs for a product or product
class many be aroused either by internal stimuli such as hunger thirst or sex or by internal
stimuli resulting from consumers interaction with the external environment for example
raining may cause a consumer considered the purchase of a raincoat or umbrella.
Information Search
Unlike in reutilized response behaviour in which problem in which problem
recognition automatically leads to choice behaviour due to previous learning in the
purchase of low involvement items like groceries in a unique purchase situation devoid of
previous learning and experiences problem recognition leads to search for information
either from internal source ( memory or from external sources such as friend relatives
colleagues reference groups advertisements dealers product testing organization.
Information search enables consumers to develop a set of buying alternative form
among which they can make a choice. The emergence this situation pushes them ahead to
the next step of decision process.
ProblemRecognition
InformationSearch
Evaluation ofAlternative
PurchaseDecision
Feedback

33
Evaluation of Alternative
Having come up with a set of buying alternatives consumers tend to evaluate
each of them on their attributes and their relative worth to them to arrive at the final
choice. consumers many use various compensatory and non compensatory models while
evaluating alternatives on different dimensions. No matter how they are evaluated
consumers at this stage are able to come up with the decisions as to the brand they would
buy.
Purchase Decision and Outcomes.
Consumers evaluate their preferences across alternative brand and they are
likely to choose the brand which is most preferred. At this stage consumers execute their
purchase intention.
Satisfaction or dissatisfaction with the newly bought product may be
the outcome of the execution of purchase intention. While positive experiences tend to
routinized decision process the negative experience may stimulate buyers to consider new
alternatives and undertake increased amount of search in similar buying situation in
future.
To the best of our knowledge, no attempt has been made so far to empirically test the
validity of flow chart process of consumer decision making as theorized by Howard and
Sheth and other. Some of iths components have been empirically examined. In particular,
search and choice behaviour are the aspects.
2.1.4 Introduction of Advertising
Advertising is directed toward a group of people who are also called prospects of
influence in the buying decision this view may be clear by the view of Kenneth A
Longman. He has said “ when a persuasive communication is directed toward large group
of individuals it is called advertising.
Advertising media is the vehicle thorough which advertiser’s massage goes to
target audiences, it is the vital connection between the company th company that
manufacturing a product and consumer who buy it. Advertising media is a type of
communication. Producer want to give a lot of information about his products but he

34
cannot do so by is personal efforts by personal contact or by mail “ The advertising media
is the career of the advertising message.
i) Newspapersii) Magazine-Customers Magazine- Business Publications-Professional Journals
iii) Radioiv) T.Vv) Direct Mailvi. Out doorvii. Other- Dealers Display- Package labels, insert- Theaters Screen- Novelties.
The medium or communication channels can be impersonal or interpersonal “ (
Leon G. Schiffman, Kanuk, Lazor 2002). Mass media consists. budget. It is possible to
achieve a given sales level with varying promotional mixes ( Philip Kottler, 1980 P622)
It is the variable that communicates to the consumer about other variable of
marketing mix for their need of satisfaction. It consists of advertising, publicity, personal
selling and sales promotion. In this study promotion schemes are under the crown ( UTC)
x Percent quantity extra or free X item free with purchase of pet bottle rupees X discount
on popular music concert and submission of special wrapper is launched by the
organization. ( Not : X denotes certain. )
2.2. Review of Previous Students in Nepal
Some researcher have conduct research on consumer behaviour in Nepal.
The researcher have tried to highlight only on a single aspect of cold drinks consumer
behaviour or their market.

35
A dissertation entitled “ The marketing of cold Drinks in Narayanghat” has
addressed on the following major objectives ( Ratna Prasad 1998 )
To examine the potential consumers in purchasing cold drinks.
To identify the purchase behaviour who purchase cold drinks.
To estimate demand of cold drinks in Narayanghat.
To identify the best choice of consumers on cold drink on the basis of selecting
brands and advertising, habitual testing, asking question and personal inspection
To find the relationship between brand preference and advertising.
To find out the popular media of advertising for the cold drinks which can easily
attract the potential consumers on each company’s branded cold drink.
To estimate sale of cold drinks in Narayanghat.
The Major findings of the study are :
Pepsi- cola is increasing gradually while coca-cola is highly increased among the
cold drinks due to different advertising strategies.
Advertisement expenditure of coca-cola is much higher than that of Pepsi-cola in
each fiscal year.
Most of the consumers have been found consuming cold drinks of coca- cola
brand in the market.
NTV is the most popular media in Narayanghat city, while Radio Nepal hold the
second position and wall painting the third.
Consumers give more preference to the brand but less preference to the quality
and taste.
Advertisement of Coca-cola in NTV and on Radio is much more attractive than
that to Pepsi-cola.
Cinema halls advertising techniques also have greater influence of coca-cola’s
consumers.

36
Another dissertation entitled “ advertising Through Television : Impact on
consumer Behaviour” has presented on the following major objective ( Ram Bahadur
2000)
To identify the present situation of TV, advertising of NTV
To know what kind of advertising they prefer.
To know how the different group of people perceive the advertisement from
television and their reaction about advertising.
The Major finding of the study are :
Mostly children young age and old age people prefer musical
advertisement where as others prefer good wording advertisements.
Considering the education factor of the people mostly below S.L.C and
uneducated People prefer musical advertisements where as other people
prefers good wording advertisements.
Considering the sex femal consumer prefers musical advertisement rather
people prefers good wording and vice – versa.
Most People gave first preference to advertisement from TV followed by
newspaper radio, magazine and cinema respectively.
Many people watch the NTV advertisements.
Most the people buy the products when they need and watch the
advertisement.
Repetition of advertisement attracted people’s attention.
Few TV advertisement are good few are boring.
People prefer to choose advertised peoducts if the price and quality of
both products are same.
Advertisement helps to recall the brand or product name while buying.
One another dissertation entitled “A study on Buyer’s behaviour of
India Gorkhas and local people" : has addressed on the following
major abjectives ( Jugat Timilsina 1998 )

37
To find out the brand preference and purchase frequency of the clothing
approval.
TO fine out shop awareness purchase frequency of the clothing approval.
To find out the criteria used by the India – Gorkha and local people for
choosing a particular brand product and shop and their importance.
To compare the buying behaviour of the India – Gorkha and the local
people
The major finding of he study are :
Majority of respondents used India and Chinese brand clothing apparels.
The main reasons form selecting these brand were price quality and easily
availability of Nepalese clothing apparels in wide range of variables high
risk for Nepalese brand. Foreign brand is considered as quality brands.
Clothing apparels were bought on either the half – yearly or the yearly
basis.
So far as the shop awareness was concerned majority of Indian
Gorkhas and local people have how level of awareness regarding name
and brand.
Concerning to the purchase location, local market seems to be the
favorite place for purchasing.
So far as the criteria used to choose a product is concerned price
quality durability seemed to be the most prominent decisive criteria for a
brand choice.
Availability of wider varieties of clothing apparels attracts large
number of customer in the shop.
Majority of Indian Gorkhas and local people were involved in
bargaining and have a favorite attitude towards bargaining.
The behaviour of shopkeeper was an important determinant forfavorable response from customers.
38
CHAPTER THREE
RESEARCH METHODOLOGY
Research is the systematic and scientific effort in order to identify the truth. It is a
fact – finding action. Thus research is searching and answer to question. It is a systematic
and organized effort to investigate a specific problem that needs a solution. ( Sekaran
1992 )
Methodology is the set of research method used to collect information analyze and
interpret the data and test the hypothesis. Therefore methodology can be designed as a
systematic procedure of solving the problem. It may be understood as a science of study
how research is done scientifically.
In this study the research methodology includes Research design, Nature and sources
on data, sampling plan Data collection procedure and Data procedures which are
explained and presented below.
3.1 Research Design.
Research design is scheme for doing research work. It is the plan structure and
strategy of investigation conceived so as to obtain answers to research questions and to
control variance.
It is always purposeful scheme of action purposed to be carried out in a sequence
during the process of research, focusing on the management problem to be tackled (
Michacl 2000)
Research design is the plan structure and strategy of investigation conceived so as to
obtain answers to research question and ot control variance ( Karlinger 1986; 275 )
Basically, the research design has two purposes. The first purpose is to answer the
research question or test the research hypothesis. The second purpose of a research design

39
is to control variance. Several typologies have been suggested for classifying a wide
verity of research designs used in social science research. Mc Grath ( 1962 ) Suggested
five models of different types of research design controlled experiment study survey
investigation and action research. Seltzer and other ( 1963 ) suggest three broad
categories of research design exploratory research and descriptive research desing. In this
study research design are to be categories according to Boyd, West and stasch.
There are mainly two type of research design – exploratory and descriptive.
Exploratory design is essential for formulating hypothesis. It is doe to investigate
possible cause and effect relationship by exposing one or more control group to one or
more treatment conditions and comparing the results to one or more control groups but
not receiving the treatment. Descriptive research design is a type of fact – finding
research. It is conducted under respondents options.
The descriptive research designs will be followed in the study. Such designs
provide a description of a specific situation in such a ways as to help the researcher
identify cause and effect relationship.
This study is basically based on survey research. To examine the consumption
behaviour of student businessman and service holder on Pepsi products is the main
objective of the study. Therefore a survey research design was applied to fulfill this
objective.
3.2 Nature and Sources of Data
Data are mainly two types one is primary and another is secondary. Primary
data are the first hand data generated by original research to solve the specific and current
research question the major advantage of primary data is that information is specific
relevant and up-to-data.There are two principle methods of collecting primary data;
observation and questionnaire

40
Secondary data are information that are already collected for other purposes and is
readily available the major advantage of this type is its easy availability. the major
advantage of this type is its availability and lower cost than primary data.
For this study both primary and secondary data and information are used. But the
research is mainly based on primary data or original data collected direct through
questionnaire.
3.3 Sampling plan
Sampling is the practice of selecting group of consumers considered to be
representative of the entire population because it is neither feasible nor practical for
research to contact to all the members of a population.
Sampling plan consists the target population, sampling unit and sample method.
3.3.1 Target population
The target population of this study consists of three distinct groups of consumers ; the
student the businessman and the service holder who are consumers of Pepsi products of
Birgunj sub-metropolitan Parsa district.
3.3.2 Sample Unit
The target population is very large ; there fore the whole population 100 samples were
taken. it is expected to provide a useful basis for understanding consumers behaviour of
Pepsi product. Sampling units for this study were occupational group of consumers
business, students and service who located Birgunj the sample profiles are presented
below categorizing them into sex and education groups.

41
Table 3.1
Sex Group of Consumers
Occupation Sex Business Student Service Total
No
%
No
% No%
No%
Male 15 60 20 40 15 60 50 50
Female 10 40 30 60 10 40 50 50
Total 25 100 50 100 25 100 100 100
Table 3.2
Age Group of Consumer
Occupation
Age
Business Student Service Total
No % No % No % No %
16-20 1 4 22 44 4 16 27 27
21-30 14 56 26 52 14 56 54 54
31-40 5 20 2 4 5 20 12 12
41 to above 5 20 0 0 2 8 7 7
Total 25 100 50 100 25 100 100 100
42
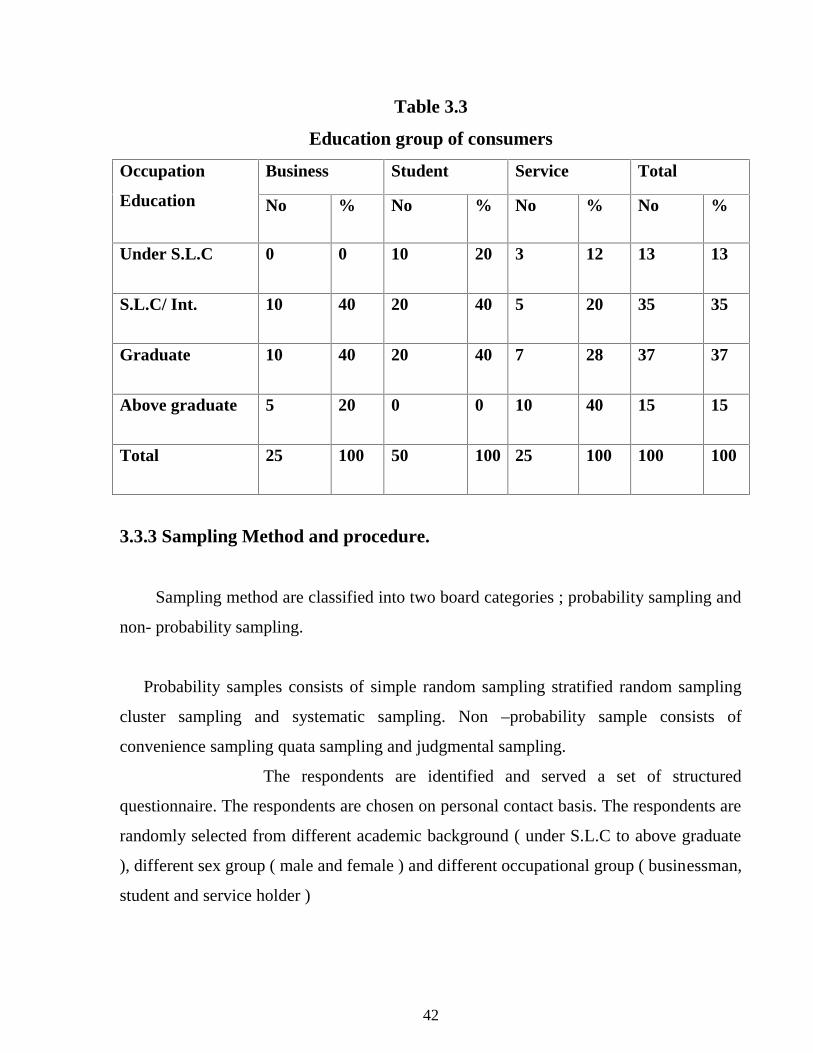
Table 3.3
Education group of consumers
Occupation
Education
Business Student Service Total
No % No % No % No %
Under S.L.C 0 0 10 20 3 12 13 13
S.L.C/ Int. 10 40 20 40 5 20 35 35
Graduate 10 40 20 40 7 28 37 37
Above graduate 5 20 0 0 10 40 15 15
Total 25 100 50 100 25 100 100 100
3.3.3 Sampling Method and procedure.
Sampling method are classified into two board categories ; probability sampling and
non- probability sampling.
Probability samples consists of simple random sampling stratified random sampling
cluster sampling and systematic sampling. Non –probability sample consists of
convenience sampling quata sampling and judgmental sampling.
The respondents are identified and served a set of structured
questionnaire. The respondents are chosen on personal contact basis. The respondents are
randomly selected from different academic background ( under S.L.C to above graduate
), different sex group ( male and female ) and different occupational group ( businessman,
student and service holder )

43
3.4 Data Collection procedure
The data have been collected through a self- administrated questionnaire survey at
respondents place at mutually convenient time. The respondents were supported by oral
explanation at that point where they got confused or unable to understand content of the
questionnaire. Sample of the questionnaire is given in annex A Besides, the researcher
had personally observed the buying activities of the consumer’s of Pepsi products.
3.5 Analytical Tools and procedure.
The primary data and information collected from survey method are grouped into
homogeneous nature. After that required tables have been prepared in an understandable
form. In course of tabulation the collected data have been presented by giving them
different ranks. Similarly the secondary data have been rearranged in tabular from
according to need.
Statistical tools such as percentage and chi-square test are used. they are as follows.
a) Percentage ( %) – percentage is mostly used measurement tools. If helps to analyze
comparatively
b) Chi – square test ( x2)
The chi square test is used basically to test the significant difference between the
actual ( observed ) frequency and the expected frequency based on the null hypothesis. In
other words it is used to test whether more than two population are classified onto several
categories with respect to two attitudes. It can be used a chi-square test to determine if the
two attributes are independent of each other. If we have a set of observe frequencies and
we want to test whether a particular distribution support of hypothesis x2. Test is used to
test the goodness of it.

44
Steps in computing chi- square ( x2) test ( S C Gupta 1990)
Step 1 complete the expected frequencies E1, E2-En corresponding to the observe
frequencies O1 O2 ………. On under some theory or hypothesis.
Step 2 complete the deviation (O-E) for each frequency and then square them to obtain
(O-E)2
Step 3 Divide the square of the deviation ( O-E)2 by the corresponding expected
frequency to obtain ( O-E) 2/E
Step 4 Add the values obtain in step 3 to complete EEox /22
Step 5 Under the null hypothesis that the theory first the data well the above statistic
follows x2 distribution = ( n-l) d.f
Step 6 Look up the tabulated values of x2 for (n-l) d.f.
Significance, usually 5 % from the table. { significance value of x2 at different d.f. are
given in the table )
Critical region of x2 test statistic is obtained from the x2 table which is given for
combination of the level of significance ( o) and the corresponding degrees of freedom (
d.f). case of testing the independence among the attributes in contingency table the d.f = (
r-l), where is the no. of rows and c is the number of columns. If the calculated value of x2
obtained is less than the corresponding tabulated value it is said to be non significant at
the required level of significance. It means data not provide any evidence against the null
hypothesis which may therefore be speed at the required level of significant and we may
conclude that there is good fit between theory and practice.

45
CHAPTER FOUR
DATA PRESENTION AND ANALYSIS
Since this chapter is analytical and interpretive in nature it consists of various activities
that the researcher has undertaken. First, collected data were sorted out in accordance
with their homogeneity. Then they were presented in suitable tables with appropriate
heading to provide clear picture of what was intended to show. While preparing these
tables it was tried to the best to remove complexities. In course of analysis both the
mathematical and statistical tools which were previously explained in the third chapter
were used. The researcher interpreted the table data taking into account three angles in
the first angle simply the exact figurative explanation was made in the second angle what
these data meant for was drawn to But in the last angle various cause why certain
occurrences took place were explored.
This chapter particularly, consists of the analysis of the analysis and interpretation
of the following.
- Consumption pattern of Pepsi consumers
- Degree of consumer’s satisfaction
- Effectiveness of promotional schemes of the company
- Effectiveness of advertising media of the company.
- Location, store and brand awareness of consumers
- Facture influencing consumer’s porches decision.
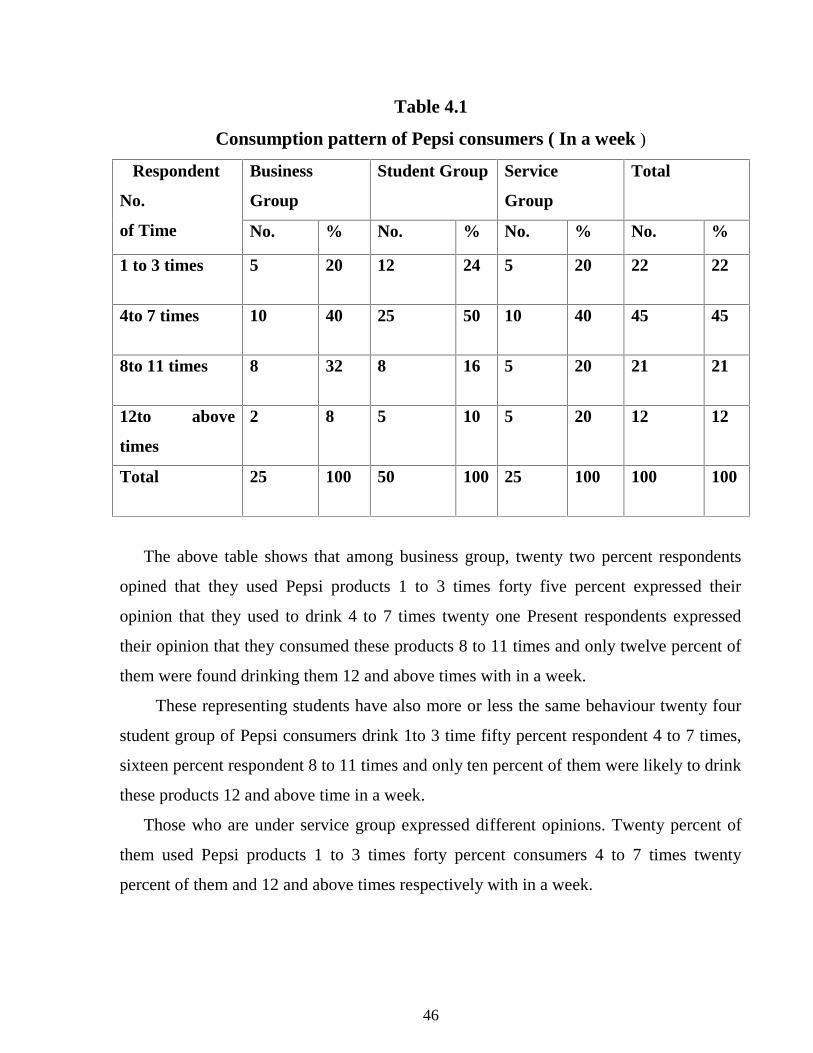
4.1 Consumption pattern of Pepsi consumers.
The opinion survey undertaken by the researcher, relation to their consumption patter
and consumption time, reveals that the respondents have varying consumption behaviour.
The data have been presented in table 4.1 and chat 4.1 makes it more obvious.
46
Table 4.1
Consumption pattern of Pepsi consumers ( In a week )
Respondent
No.
of Time
Business
Group
Student Group Service
Group
Total
No. % No. % No. % No. %
1 to 3 times 5 20 12 24 5 20 22 22
4to 7 times 10 40 25 50 10 40 45 45
8to 11 times 8 32 8 16 5 20 21 21
12to above
times
2 8 5 10 5 20 12 12
Total 25 100 50 100 25 100 100 100
The above table shows that among business group, twenty two percent respondents
opined that they used Pepsi products 1 to 3 times forty five percent expressed their
opinion that they used to drink 4 to 7 times twenty one Present respondents expressed
their opinion that they consumed these products 8 to 11 times and only twelve percent of
them were found drinking them 12 and above times with in a week.
These representing students have also more or less the same behaviour twenty four
student group of Pepsi consumers drink 1to 3 time fifty percent respondent 4 to 7 times,
sixteen percent respondent 8 to 11 times and only ten percent of them were likely to drink
these products 12 and above time in a week.
Those who are under service group expressed different opinions. Twenty percent of
them used Pepsi products 1 to 3 times forty percent consumers 4 to 7 times twenty
percent of them and 12 and above times respectively with in a week.

47
Chart 4.1
Consumption pettern of Pepsiconsumer in total
22%
45%
21%
12%
1 to 3 times4 to 7 times8 to 11 times12 and more
Out of total consumers forty five percent were found drinking Pepsi products 4 to 7
twenty two percent consumers 1 to 3 times, where as twelve percent consumers drank
either 12 times or more with in a week.
From above explanation, it is clear that most of consumers consume Pepsi products
4 to 7 times in a week. However more or less the consumers consume these products 1 to
3 times and 8 to 11 times respectively.
When the hypothesis was tested taking into account x2 test the calculated value
came 5.8684 ( Appendix –B) The table value for 6 degree of freedom ( d.f) at 5% level of
significance is 12.59 ( Appendix – A ) which is greater than the calculated value. so the
null hypothesis is accepted. it means there is independent response of the occupational
group
About time related consumption behaviour the researcher again got various
responses, which are shown in Table 4.2
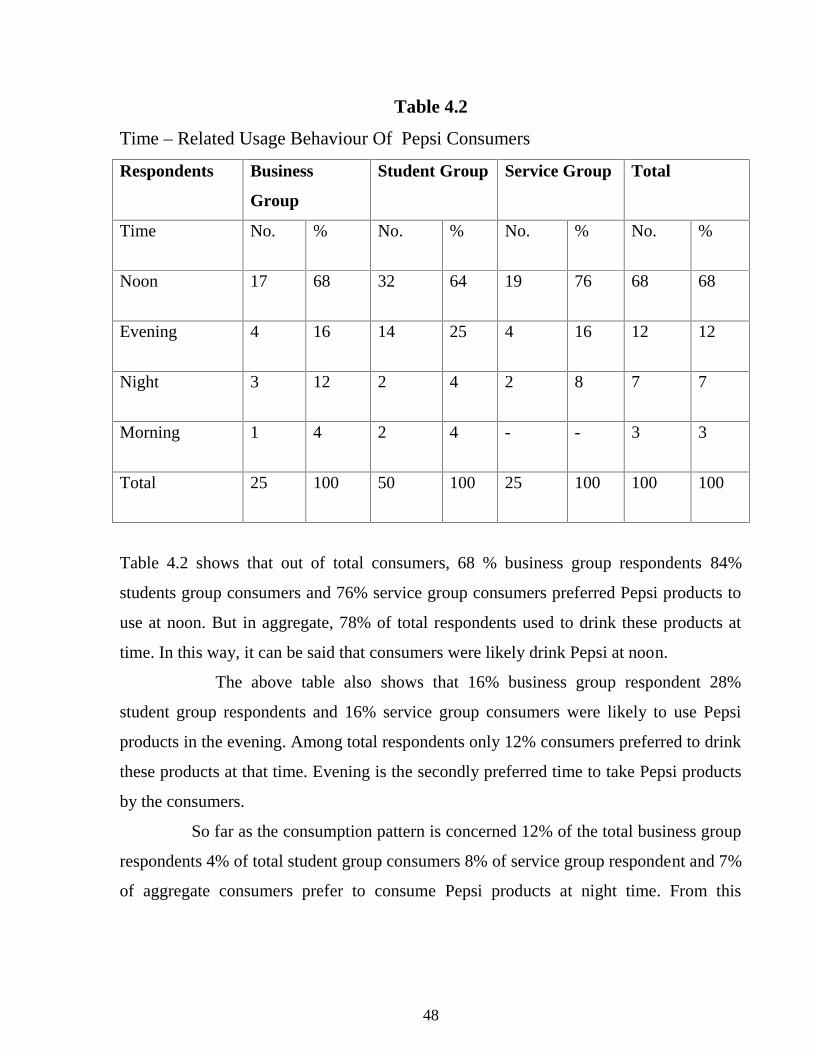
48
Table 4.2
Time – Related Usage Behaviour Of Pepsi Consumers
Respondents Business
Group
Student Group Service Group Total
Time No. % No. % No. % No. %
Noon 17 68 32 64 19 76 68 68
Evening 4 16 14 25 4 16 12 12
Night 3 12 2 4 2 8 7 7
Morning 1 4 2 4 - - 3 3
Total 25 100 50 100 25 100 100 100
Table 4.2 shows that out of total consumers, 68 % business group respondents 84%
students group consumers and 76% service group consumers preferred Pepsi products to
use at noon. But in aggregate, 78% of total respondents used to drink these products at
time. In this way, it can be said that consumers were likely drink Pepsi at noon.
The above table also shows that 16% business group respondent 28%
student group respondents and 16% service group consumers were likely to use Pepsi
products in the evening. Among total respondents only 12% consumers preferred to drink
these products at that time. Evening is the secondly preferred time to take Pepsi products
by the consumers.
So far as the consumption pattern is concerned 12% of the total business group
respondents 4% of total student group consumers 8% of service group respondent and 7%
of aggregate consumers prefer to consume Pepsi products at night time. From this

49
explanation it is clear that according to the respondents nighttime was the third most
preferred time to take Pepsi products.
While studying consumer behaviour of different group of Pepsi users on the basis of
morning time, only 4% business group and student group respondents were in favour of
using at that time. In totality, only 3% of total consumers were likely to drink Pepsi
products at morning. As above analysis morning time is lastly preferred to drink Pepsi
products by the consumers.
Chart 4.2
Time – Related Usage BehaviourOf Pepsi Consumers
3%
68%
22%
7%
MorningNoonEveningNight
In order to test hypothesis x2 was used. The calculate value of x2 at 5% level of
significance appeared 14.4687 and the table value of x2 test for 6 d.f at 5% level of
significance appeared is 12.59 ( Appendix ( H0) is rejected or alternative hypothesis ( HA)
is accepted. In another words the views expressed by respondents group were
significantly different.
4.2 Degree of Consumer satisfaction
In this study the researcher categorized the degree of consumer satisfaction into five
parts ; highly satisfied, satisfied normally satisfied dissatisfied and highly dissatisfied.

50
Here the researcher tried to measure the degree of consumer’s satisfaction with available
Pepsi products. Table 4.3 represents the response obtained.
Table 4.3
Degree of consumers satisfaction with Available Pepsi Product
Among the business group 32% respondents opined that they were satisfied 36%
expressed that they were normally satisfied 16% said that they were highly satisfied with
the available Pepsi products in the market. Both the consumers who were dissatisfied and
highly dissatisfied with the available Pepsi products in the market represented 8% each.
From above analysis we can say that most of the business group consumers were
normally satisfied and satisfied with available Pepsi products.
Twenty percent of student group opined that there is not necessary for improving the
products or they are highly satisfied with available Pepsi products. similarly, thirty eight
percent respondents were satisfied with them. Only four percent respondents opined that
they were dissatisfied with them and six percent of them were found highly dissatisfied
with the available Pepsi products. In this way available Pepsi products in the market.
Respondents Business Group Student Group Service Group Total
Degree ofsatisfaction
No. % No. % No. % No. %
Satisfied 8 32 19 38 12 48 39 39
Normal 9 36 16 32 7 28 32 32Highlysatisfied
4 16 10 20 3 12 17 17
Dissatisfied 2 8 2 4 2 8 6 6Highlydissatisfied
2 8 3 6 1 4 6 6
Total 25 100 50 100 25 100 100 100

51
Service group consumers have been found responds the same behaviour as was
found with respect to student group consumers. Out of total service group consumers
12% respondents opined that they were normally satisfied with the company’s products.
However 8% of respondents were dissatisfied with the Pepsi products and only 4% total
were highly dissatisfied with these products.
The above information is also shown on the simple bar diagram as follows.
39%32%
17%
6% 6%
0%
10%
20%
30%
40%
50%
Satisfied Normal Highlysatisfied
Dissatisfied Highlydissatisfied
Figure 4.3 Degree of consumer satisfaction
Form above explanation, it is clear that most of the consumers were satisfied with
available Pepsi products but only 12% respondents were dissatisfied with them.
For testing dependency between respondents professions chi-square test (x2) was
used. Calculate value of x2 test was 2.743( Appendix –B) which is less than the table i.e.
x2 8d.f.0.05=15.51 ( Appendix A) so the null hypothesis is accepted or the view
expressed by the respondents professions is independently related.
4.3 Effectiveness of Promotional Schemes of The Company.
The researcher also tried to find out the effectiveness of the promotional schemes which
are used by the company. Five major promotional schemes are preferred by the company
for boosting up sales. The response have been presented in table 4.4

52
Table 4.4
Weight Response Of the Respondents About the Promotional Schemes
Respondents BusinessGroup
Student Group Service Group Total
PromotionalSchemes
Wei No (Rank) Wei No (Rank) Wei No (Rank) Wei No (Rank)
Under thecrown UTC
46(1)
113(1)
48(1)
207(1)
X % quantityExtra
75(3)
118(2)
57(2)
250(2)
X Item free 61(2)
142(3)
73(3)
276(3)
Rs X discounton popularmusic consult
85(4)
163(4)
89(4)
337(4)
Submission ofspecial wrapper
108(5)
214(5)
108(5)
430(5)
Total 375 750 375 1500
The above table shows that all of the occupational groups placed the first rank to
under the crown scheme (UTC). X % quantity extra scheme appears in the second rank
for student and service respondents a against X item extra scheme in the third rank. But
business group respondents placed X% quantity extra scheme in the third position.
Again, all of the respondents groups assigned fourth rank to Rs X discount on
popular music consult scheme. similarly submission of special wrapper scheme is the last
priority ( Fifthly ranked ) by the entire consumers group.
From the above explanation we know that to under the crown scheme is in the first
priority and x% quantity extra x item free Rs X discount on popular music consult and
submission of special wrapper scheme.

53
In other orders of preference the calculated value of x 2 text arrived 7.042 ( Appendix
B) where as the table value at 0.05 for x 2 test is lesser than tabulated value. So the null
hypothesis is accepted or the respondents opinions are independently related.
4.4 Effectiveness of the Media Advertising of the company
The company mostly uses four advertising media. the responses relating to their
effectiveness are presented in appendix C but Table 4.5 represents total no of weighted
responses.
Table 4.5
Weighted Responses of the Respondents about the Advertising Media
Respondents
Advertising
Media
Business
Group
Student Group Service Group Total
Wei No (Rank) Wei No (Rank) Wei No (Rank) Wei No (Rank)
TV 5
(2)
73
(1)
51
(2)
177
(1)
FM / Radio 49
(1)
115
(2)
51
(1)
214
(2)
Press 61
(3)
142
(3)
71
(3)
274
(3)
Hoarding
Board
87
(4)
170
(4)
78
(4)
335
(4)
Total 250 500 250 100
Business group and service group respondents preferred t F.M / Radio medium the
most but student group T.V media the most. In total T.V medium stood in the first rank
of preference.
54
Television medium stood in the first rank of preference
Television medium appeared in the second rank or business and service group
respondents as against FM / Radio media for student group respondents in total FM
media stood in the second rank of preference.
All the respondents of Pepsi products put the third rank to press media and fourth to
hording Board.
In aggregate T.V advertising medium has taken the first priority and the most effective
advertising medium; majority of the respondents placed the press medium in the third
rank, where as hoarding board in the fourth.
The calculated value of x 2 test came 8.3 ( Appendix B) where as the table value at 0.5
for 6 d.f is 12.592 since the table value of x 2 test is grater than.
The calculated value the null hypothesis is accepted in another word the views expressed
by the respondent groups have significance difference.
4.5 Locations, Store, and Brand Awareness of Consumers
In Course of finding out locating, store, and brand awareness of consumers, the
researcher converted the obtained responses into weighed form for the analysis purpose.
But the original responses have been presented in appendix C.

55
Table 4.6
Weighted Responses of Pepsi Consumers about the Location.
Respondents BusinessGroup
Student Group ServiceGroup
Total
Advertising Media Wei No.(Rank)
Wei No. (Rank) Wei No.(Rank)
Wei No.(Rank)
Retail shop 67(2) 110(1) 73(2) 250(2)Restaurant and Bar 57(1) 125(2) 61(1) 243(1)Home 98(5) 157(3) 88(5) 343(4)Street Side 84(4) 176(4) 77(4) 337(4)Anywhere 69(3) 182(5) 76(3) 327(3)Total 375 750 375 1500
Table 4.6 depicts that business group and service group consumers along with total
consumers of Pepsi products, have reflected the same behaviour. They preferred to rank
the Retail shop, Restaurant & Bar, Home, Street side and elsewhere the 2nd, the 1st, the
5th, the 4th and the 3rd for choosing places for buying. But the student group respondents
were likely t o take Pepsi products at Retail shop and others at home, at street side and at
elsewhere in that order.
For testing the hypothesis, calculated value of 2x test came 12.703 (Appendix B)
where as table at 0.05 for 8 d.f. is 15.5 (Appendix A). So, the views expressed by the
respondents were independently related.
Consumers buying store have been categorized into only three types grocery,
departmental store, and home delivery jobbers. The responses where from the buy or
which types they prefer are presented in Table 4.7.

56
Table 4.7
Consumers Usually Buying Store
Respondents
Stores
Business Group Student Group Service
Group
Total
No. (%) No. (%) No. (%) No. (%)
Grocery 16(64) 42(72) 18(72) 76(76)
Departmental
Store
7(28) 7(14) 6(24) 20(20)
Home delivery 2(8) 1(2) 1(4) 4(4)
Total 25(100) 50(100) 25(100) 100(100)
Out of total business group consumers of Pepsi products, 64% consumers used to buy
from grocery store, 28% respondents from departmental store, and 8% of them used to
purchase these products from home delivery jobbers.
Among the student group consumers of Pepsi products, 84% used to purchase from
grocery store, 14% from departmental store, and only 2% from home delivery jobbers.
Out of the aggregate service group consumers, seventy two percent consumers used to
buy from grocery store, six percent from departmental store, and four percent from home
delivery jobbers respectively.
In aggregate, most of the consumers (76%) preferred to buy the Pepsi products from
grocery store, and only twenty percent respondent from departmental store and only four
percent from home delivery jobbers.
For testing the hypothesis the calculated value of x2 test arrived 3.922 (Appendix –B)
where as the table value of x2, 0.05,4 d.f. is 9.49 (Appendix-A), so relating to their
responses, there is no relationship between occupational groups responses.

57
The researchers also tried to measure the brand awareness level of Pepsi product
consumers. Their responses have been included in appendix –C, but the total weighted
responses have been presented in Table 4.8
Table 4.8
Brand Awareness and Rank Order of Responses
Respondents
Brand
Business
Group
Student Group Service
Group
Total
Wei No.
(Rank)
Wei No. (Rank) Wei No.
(Rank)
Wei No.
(Rank)
Pepsi Cola 53(1) 95(1) 51(1) 199(1)
Mirinda 79(3) 134(2) 70(3) 283(3)
7’Up 100(5) 195(4) 91(4) 386(4)
Mountain Dew 69(2) 147(3) 67(2) 283(2)
Soda 129(6) 266(6) 137(6) 532(6)
Slice 95(4) 213(5) 109(5) 417(95)
Total 525 1050 525 2100
The above table shows that the entire respondents assigned the first priority to Pepsi-
cola for purchasing and using. Mountain Dew stood in the second rank as all the
respondents under business group and service group, along with the total sampled
respondents expressed their priority for this rank.
Similarly, the business group and the service group respondents placed Mirinda in
the third rank. So was ranked by the total respondents. But the student group of
respondents assigned Mountain Dew the third rank.
7’Up is fourthly preferred item by student group, service group, and total respondents
of Pepsi product consumers. But business group consumers placed Slice in the fourth
rank.

58
Slice appears in the fifth rank for the students and service respondents as against 7’Up
for business group business. In total, Slice stood in the fifth rank of preference.
All the respondents of Pepsi products ranked sixth position to Soda. When
hypothesis was tested taking into account x2 test, the calculated value arrived
3.9614(Appendix-B) where as the table value at 0.005 for 10 degree of freedom (d.f) is
18.3 (Appendix –A), which is greater than the calculated value. So the null hypothesis
accepted. It means the responses are independently interested.
4.6 Factors Influencing Consumers Purchase decisions
When an opinions survey was made relating to factors affecting consumers which
quality remained the prime factor. The obtained responses have been shown in table 4.9.
Table 4.9
Factor influencing the scheme of Pepsi Products
Respondents
Factors
Business
Group
Student
Group
Service
Group
Total
No. (%) No. (%) No. (%) No. (%)
Low price 3(12) 3(6) 2(8) 8(8)
Good quality 9(36) 31(62) 13(52) 53(53)
Convenient Quality 4(16) 7(14) 4(16) 15(15)
Convenient Availability 4(16) 6(12) 2(8) 12(12)
Enjoy scheme 5(20) 3(6) 4(16) 12(12)
Total 25(100) 50(100) 25(100) 100(100)
Among the business group respondents, 12% consumers of Pepsi products preferred
price, 36% of them preferred good quality, 16% respondents emphasized on convenient
quality and convenient availability respectively, But 20% respondents under this group
preferred it due to enjoying schemes associated with the item.

59
Out of total sampled students, 6% gave importance to price factor, 62% to quality,
14% to convenient quality, 12% to convenient availability, and the rest enjoying schemes
associated with the item in selecting the Pepsi products.
Out of the total respondents in service group, 52% were influenced by quality, 16%
by convenient quality and by enjoying schemes associated with the item, where as only
8% of the respondents preferred to convenient availability and the rest 8% the price.
In Aggregate, most of the respondents preferred the Pepsi item due to good quality,
and convenient availability.
For testing dependency between respondents professions chi-square test (x2) was
used. Calculated value of x2 test is 6.7807(appendix-B), which is greater than table, i.e.
x28d.f.0.05=15.51(appendix-A). So the null hypothesis is accepted. In other words, there
is no significance difference the views expressed by the respondents groups.

60
CHAPTER FIVE
SUMMARY, CONSLUSIONS AND RECOMMENDATIONS
This is the last chapter of this study. In this section, the researcher tried to present the
aggregate view expressed by specially the consumers of the Pepsi products and on that
basis, the findings and recommendation have been concluded. Especially this chapter
includes summary, conclusions and recommendation.
5.1 Summary
Consumer is the king of modern business, the success and failure of any business
firm entirely depends on consumer’s reaction to its offers. It is, therefore, essential for the
marketers or manufactures of the products and services to understand the consumer
buying behaviour for term survival on today’s changing and competitive business
environment. However, understanding of consumer behaviour is becoming more complex
and complicated day by day; it requires continuous efforts of investigation and
exploration of consumers. But such practices of investigation and exploration on
consumers buying behaviour are too rare or entirely absent in Nepalese business
perspectives.
Varun Beverages (Nepal) Pvt. Ltd. has been producing Pepsi products under technical
celebration with Pepsi Co, New York. The company is producing seven brands within
different flavors and packs. Pepsi Co. has its competition with cola in terms of Coca Cola
Vs Pepsi Cola, Mirinda Vs Fanta, 7’Up Vs Sprite, Soda Vs Teem and Slice Vs Juice. But
there is no competitor brand or Mountain Dew, so it keeps the monopoly market in soft
drinks.
Nepal is a small and poor country and so Nepalese consumers seem bias and they use
any products depending upon availability. Most of the marketing policies, strategies, and
work forces are heavily borrowed from India. However, Nepalese market is small, the
researcher tried to enhance or support to understand the consumer’s behaviour in Nepal.

61
This study or research is very small. So, the researcher has set limited objectives, In
this study the researcher has tried to find out the consumption pattern of consumers,
degree of consumers satisfaction, effectiveness of promotional schemes, effectiveness of
advertising media, locations, store and brand awareness of consumers, and factors
influencing consumers purchase decision.
Review of literature conceptual review and review of previous studies. In conceptual
review includes introduction and models of consumer behaviour, introduction of
promotional activities, and introduction of advertising.
In this study, the research methodology includes research design, nature and sources
of data, sampling plan, data collection procedure, and data analysis procedure. In data
analysis only two tools (i.e. percentage, and chi-square test) and pie-chart are used.
5.2 Conclusions and Major Findings of the study
Consumers have their own interesting using various types of goods through most of
them have almost the same type of nature for consuming. From the investigation, the
researcher has concluded various findings, which are presented below.
Most of the consumers consume Pepsi products is four to seven times within a week.
Seventy eight percent respondents consume Pepsi products at noon time
Most of the consumers are satisfied with available Pepsi products. And only twelve
percent consumers are dissatisfied.
Under the Crown (UTC) schemes were highly preferred and then X% quantity extra,
X item free, Rs. X Discount on popular music concert and submission of special
wrapper schemes are respectively preferred.
Respondents firstly prefer to T.V. media, and then F.M./Radio media, Press media,
and Hoarding board are respectively preferred second, third and fourth.
Respondents prefer to drink Pepsi products first at Restaurant & Bar and then Retail
Shop, Anywhere, Street side and at Home respectively.
Seventy six percent or more than seventy percent consumers are usually buying Pepsi
products from Grocery Store.

62
Majority of the respondents have placed Pepsi –Cola the first priority and other Pepsi
products like Mountain Dew, Mirinda, 7’Up, Slice and Soda in that order.
Most of the consumers (50%) were influenced by the quality. So the quality is the
most effective factors to increase interest of consumers.
5.3 Recommendations
On the basis of analysis and findings the study has forwarded some
recommendations, which are presented below.
Pepsi products are not available in urban area; therefore, the company should employ
its effort to enlarge its branches in remaining urban areas. It should also focus on
distributing to the remote areas.
Most of the people preferred to further improvement in quality of the available
brands, so this expectation should rightly be considered.
Advertising of the company is dependent on Indian origin but in Nepal, it should be
focus on Nepali origin. In advertising, visuals and slogans should also be oriented
towards Nepalese origin.
Promotional schemes are not efficient; they are only focusing to dealers. Therefore,
the company should improve their promotional policy. Which can direct attract to the
ultimate consumers.

63
Bibliography and References
Books:
Howard, john A. (1989), “Consumer Behaviour in Marketing Strategy”, Printice Hall,
Englewood cliffs, N.J.
Kottler, Philip (1980), “Marketing Management: Planning, analysis and Control”,
Printice Hall of India Pvt. Ltd. New Delhi, 4th edition.
Boyd, h.w., West Fall J.R., and Stasch, S.F. (1998) “Marketing Research: Text and
Cases”, Rechard D. Irwin, Inc. New Delhi.
Gupta, S.C. (1990), “Consumer Behaviour in Marketing Strategy”, New York: Appleton-
Century-Crofts, Inc.
Issac (1972), from J.T. Spence Etal. (1968), “Elementary statistics”, New York:
Appleton-Century-Crofts, Inc.
Kerlinger, F.N. (1986), “Foundation of behavioural research”, New York: Holt, Rimehart
and Winston, Third edition.
Koirala, Kundan Datta(1991), “Marketing Decision”, M.K.Publishers and Distributors
KTM
Loudan, David, L., and Della bitta, Albert J.(1993), “Consumer behaviour” NcGraw Hill
International edition, Marketing series.
Mc Grown. K.L. (1979), “Marketing Research: Text and cases”, Massachustts, Winthrop
Publications.

64
Michael, V.P.(2000), Research Methodology in Management “Himalayan publishing
House, Fifth revised and enlarged edition.
Mowen, J.C. (1990), “Consumer behaviour”, Maxwell Macmillan International.
Sandage, C.H. and Buger, Vernon Fry (1985), “Advertising Theory and Practices”,Richard D. Irwin Inc, Fifth Edition.
Schiffman, Leon G. and Kanuk (2002), “Consumer Behaviour”, Printice hall of India Pvt.Ltd., New Delhi. 7th Edition
Shrestha, Sunity and Silwal, Dhruba pd. (2059), “Statistical methods in Management”,
Winner printing press, KTM.
Sekaran, U. (1992), “Research methods of business” A skill building approach.
Singapore, John wily and sons.
Station W.J. and Futrell, Charles (1998), “Fundamentals of marketing”, Mc Grew hill,
Tokyo, International Edition
Ware, Scott and Robertson, Thomas (1970), “Consumer behaviour Research: promise
and prospects’, N.J.Printice hall Inc.
Wolff, H.K. and Pant, P.R.(1999), “Social Science Research and Thesis writing’ Buddha
Academic Enterprises Pvt. Ltd., KTM, 2nd Edition.

65
Journals:
Kamat, Shyam kumar (2004), Business Age; “The Cold drinks market containing to
boom” vol-4, p.29-32
Moreroe, Kenth B.(1974), “Buyers subject perception”, Journal of marketing research,
vol-8
Olshavsky, Richard W. and Granbois, Donald H. (1979), “Consumer Devision making-
fact or fiction?” Journal of consumer research.
Sheth, Jagdish, M, Bruce, I.Newman and bracara, L. Cross “Why we buy, What we buy:
A theory of consumption values”, A journal of business research.
Wells, W.F. and Lozcinto L.A. “Direct Observation of Purchasing Behaviour”, Journal of
marketing research, vol-3, 1996
Dissertation:
Ghimire, Ram bhakta (2000), “Advertising Through Television: Impact on consumer
behaviour”, An unpublished master’s dissertation, T.U. Kirtipur.
Shrestha, Ratana pd. (1998), “The marketing of Cold dirnks in Narayanghat” an
unpublished Master’s dissertation, T.U.Kritipur.
Timilshina, Jagat (1999), “A study on buyer’s behaviour of India Gorkhas and Local
People; With special reference to the Vyas Municipality”, An unpublished Master’s
Dissertation, T.U. Kritipur.

I
APPENDICES
APPENDIX A
Questionnaire
Dear Respondent,
The researcher, Surendra pd. Kushwaha, MBS. Student of “Tribhuvan University”,
is conducting a research on “A Study on Pepsi Products Consumer Behaviour in Birgunj”.
This Questionnaire is presented for your valuable information about the Pepsi
products consumption patterns and your expectation. Without your kind co-operation it
will be difficult to complete the research.
The researcher assures that the data and information provided by you will be kept
most confidential.
Please fill up these questions.
1. Age:- 16-20 [ ] 21-30 [ ] 31-40 [ ]
2. Sex:- Male [ ] Female [ ]
3. Occupation:- Business man [ ] Student [ ] Service [ ]
4. Education:- Below SLC [ ] Slc/10+2 [ ]
Graduate [ ] Above Graduate [ ]
5. Have you taken Pepsi Products? Yes [ ] No [ ] If yes, please
tick or write number on the box, i.e. [√ ], [1 ]
6. Which products item do you like most? (Please rank them from higher to lower i.e.
1,2,3,-----------,6). Pepsi cola [ ]
Mirinda [ ] 7’Up Mountain Dew [ ]
Soda [ ] Slice [ ]

II
7. How often do you use cold drinks within a week?(Please tick any one)
1 to 3 times [ ] 4 to 7 times [ ]
8 to 11 times [ ] 12 to above times [ ]
8. Why do you select Pepsi products?(Please tick any one)
low price [ ] Good Quality/Test [ ]
Convenient quantity [ ] Convenient availability [ ]
9. When do you have cold drink?(please tick any one)
At morning [ ] At noon [ ]
At evening [ ] At night [ ]
10. Which advertising media have dominance on such effect? Please rank them from
higher to lower i.e. 1,2,3,--------,5)
T.V. [ ] F.M./Radio [ ]
Press [ ] Hoarding Board/Wall paper [ ]
11. Which promotional schemes affect most in your bung decision? Please rank them
from higher to lower i.e. 1,2,3,----5.
Under the Crown [ ] X% quantity extra [ ]
X items free with purchase of pet bottle [ ]
Rs. X discount on popular music concert [ ] Submission of special wrapper [ ]
12. Where do you most likely to drink cold drinks? Please rank them from higher to
lower i.e. 1,2,3,----5. In any retail
shop [ ] In restaurant and bar [ ] At home [ ] on the
street side [ ] Anywhere [ ]
13. From where do you usually buy? Please tick any one.
Grocery Store(Kirana) [ ] From Departmental Store [ ]
Through home Delivery jobbers [ ]

III
Do you want to suggest the manufactures and enhance both the organizational and
product image? If yes what are they?
--------------------------------------------------------------------------------------------------------
--------------------------------------------------------------------------------------------------------
--------------------------------------------------------------------------------------------------------
--------------------------------------------------------------------------------------------------------
--------------------------------------------------------------------------------------------------------
--------------------------------------------------------------------------------------------------------
--------------------------------------------------------------------------------------------------------
--------------------------------------------------------------------------------------------------------
--------------------------------------------------------------------------------------------------------
--------------------------------------------------------------------------------------------------------
--------------------------------------------------------------------------------------------------------
--------------------------------------------------------------------------------------------------------
--------------------------------------------------------------------------------------------------------
--------------------------------------------------------------------------------------------------------
--------------------------------------------------------------------------------------------------------
--------------------------------------------------------------------------------------------------------
--------------------------------------------------------------------------------------------------------
--------------------------------------------------------------------.
Thanks for your kind co-operation.

IV
APPENDIX –B
CHI-SQUARE( x 2)TEST
The table value and calculated value of chi-square(x2) test is as follows:
Table no. Degree of freedom
(d.f)
Tabulated values at 5% level
of Significance
Calculated
value
4-1 6 12.59 5.8684
4-2 6 12.59 14.4687
4-3 8 15.51 2.743
4-4 8 15.51 7.042
4-5 6 12.59 8.3
4-6 8 15.51 12.703
4-7 4 9.49 3.922
4-8 10 18.31 13.3614
4-9 8 15.51 6.787

V
APPENDIX-C
Calculation of chi-squre(x2)values.
Calculation of Expected FrequencyGrandTotal
lColumnTotaRowTotalE n
)(
Table No. 4.1 (Consumption Pattern of Pepsi consumers)
5.5100
550
100
2522)5(
E 5.10
100
1050
100
5012)8(
E
25.11100
1125
100
2545)10(
E 6
100
600
100
2512)5(
E
25.5100
525
100
2521)8(
E 5.5
100
550
100
2522)5(
E
3100
300
100
2512)2(
E 25.11
100
1125
100
2545)10(
E
11100
1100
100
5022)12(
E 25.5
100
525
100
2521)5(
E
50.22100
2250
100
5045)25(
E 3
100
300
100
2512)5(
E
Calculation of Chi-Square(x2) Value
Observed
Frequency(O)
Excepted
frequency(E)
(O-E) (O-E)2 (O-E)2/E
5 5.5 -0.5 0.25 0.0455
10 11.25 -1.25 1.5625 1.3889
8 5.25 2.75 7.5625 1.4405
2 3 -1 1 0.3333
12 11 1 1 0.0909
25 22.50 2.5 6.25 0.2778
8 10.5 -2.5 6.25 0.5952
5 6 1 1 0.1667
5 5.5 -0.5 0.25 0.0455
10 11.25 -1.25 1.5625 0.1389
5 5.75 -0.25 1.5625 0.1389
5 3 2 4 1.3333
8684.5)( 2
E
EOE

VI
Table No. 4.2 (Time Related Usage Behaviours of Pepsi consumers)
75.0100
75
100
253)1(
E 5.19
100
1950
100
2578)17(
E
3100
300
100
2512)4(
E 75.1
100
175
100
257)3(
E
75.0100
75
100
253)2(
E 39
100
3900
100
5078)42(
E
6100
600
100
5012)14(
E 5.3
100
350
100
507)2(
E
75.0100
75
100
253)0(
E 5.19
100
1950
100
2578)19(
E
3100
300
100
2512)4(
E 75.1
100
175
100
257)2(
E
Calculation of Chi-Square(x2) Value
Observed
Frequency(O)
Excepted
frequency(E)
(O-E) (O-E)2 (O-E)2/E
1 0.75 0.25 0.0625 0.0833
17 19.50 -2.5 6.25 0.3205
4 3 1 1 0.3333
3 1.75 1.25 1.5625 0.5606
2 0.75 0.5 0.25 0.1667
42 39 3 9 0.2308
14 6 8 65 10.6667
2 3.5 1.5 2.25 0.6429
0 0.75 -0.75 0.5625 0.75
19 19.5 -0.5 0.25 0.0129
4 3 1 1 0.3333
2 1.75 0.25 0.0625 0.0357
4689.14)( 2
E
EOE
Degree of Freedom(d.f)=(r-1)(c-1) = (4-1)(3-1) = 6

VII
Table No. 4.3 (Degree of consumer Satisfaction with available Pepsi Products)
25.4100
2517)4(
E 75.9
100
2539)8(
E 8
100
2532)9(
E
5.1100
256)2(
E 5.1
100
256)1(
E 25.4
100
2517)10(
E
5.19100
5039)19(
E 16
100
5032)16(
E 3
100
506)2(
E
3100
506)3(
E 25.4
100
2517)3(
E 75.9
100
2539)12(
E
8100
2532)7(
E 5.1
100
256)2(
E 5.1
100
256)1(
E
Calculation of Chi-Square(x2) Value
Observed
Frequency(O)
Excepted
frequency(E)
(O-E) (O-E)2 (O-E)2/E
4 4.25 -0.25 0.0625 0.0147
8 9.75 -1.75 3.0625 0.3141
9 8 1 1 0.125
2 1.5 -0.5 0.25 0.1667
1 1.5 -0.5 0.25 0.1667
10 4.25 1.5 2.25 0.2647
19 19.5 -0.5 0.25 0.0128
16 16 0 0 0
2 3 1 1 0.3333
3 3 0 0 0
3 4.25 -1.75 1.5625 0.3676
12 9.75 225 5.0625 0.5192
7 8 -1 1 0.125
2 1.5 -0.5 0.25 0.1667
1 1.5 -0.5 0.25 0.1667
743.2)( 2
E
EOE
Degree of Freedom(d.f)=(r-1)(c-1) = (5-1)(3-1) = 8

VIII
Table No. 4.4 (Effectiveness of Promotional Scheme)
75.511500
375207)46(
E 5.62
1500
375250)75(
E 69
1500
375276)61(
E
25.841500
375337)85(
E 5.107
1500
375430)108(
E 5.103
1500
750207)133(
E
1251500
750250)118(
E 138
1500
750276)142(
E 5.168
1500
750337)163(
E
2151500
750430)214(
E 75.51
1500
375207)48(
E 5.62
1500
375250)57(
E
691500
375276)73(
E 25.84
1500
375337)89(
E 5.107
1500
375430)108(
E
Calculation of Chi-Square(x2) Value
Observed
Frequency(O)
Excepted
frequency(E)
(O-E) (O-E)2 (O-E)2/E
46 51.75 -5.75 33.0625 0.6389
75 62.5 12.5 156.25 2.5
61 69 -8 64 0.9275
85 84.25 0.75 0.5625 0.0677
108 107.5 0.5 0.25 0.0233
113 103.5 9.5 90.25 0.8720
118 125 -7 49 0.392
142 138 4 16 0.1159
163 168.5 -5.5 30.25 0.1795
214 215 -1 1 0.465
48 51.75 -3.75 14.0625 0.2717
57 62.5 -5.5 30.25 0.1795
73 69 4 16 0.2319
89 84.25 4.75 22.5625 0.2678
108 107.5 0.5 0.25 0.0233
042.7)( 2
E
EOE
Degree of Freedom(d.f)=(r-1)(c-1) = (5-1)(3-1) = 8

IX
Table No. 4.5 (Effectiveness of Advertisement media)
25.441000
250177)53(
E 5.53
1000
250214)49(
E 5.68
1000
250274)61(
E
75.831000
250335)87(
E 5.88
1000
500177)73(
E 107
1000
500214)115(
E
1371000
500274)142(
E 5.167
1000
500335)170(
E 25.44
1000
250177)51(
E
5.531000
250214)50(
E 5.68
1000
250274)71(
E 75.83
1000
250335)78(
E
Calculation of Chi-Square(x2) Value
Observed
Frequency(O)
Excepted
frequency(E)
(O-E) (O-E)2 (O-E)2/E
53 44.25 8.75 76.5625 1.73
49 53.5 -4.5 20.25 0.38
61 68.5 -7.5 56.25 0.82
87 83.75 3.25 10.5625 0.13
73 88.5 -15.5 240.25 2.72
115 107 8 64 0.60
142 137 5 25 0.18
170 167.5 2.5 6.25 0.04
51 44.25 6.75 45.5625 0.03
50 53.5 -3.5 12.25 1.23
71 68.5 2.5 6.25 0.04
78 83.75 -5.75 33.0625 0.40
3.8)( 2
E
EOE
Degree of Freedom(d.f)=(r-1)(c-1)
= (4-1)(3-1)
= 6

X
Table No. 4.6 (Location Affects Their Buying Decision)
5.621500
375250)67(
E 75.60
1500
375243)57(
E 75.85
1500
375343)98(
E
25.841500
375337)84(
E 75.81
1500
375327)69(
E 125
1500
750250)110(
E
5.1211500
750243)125(
E 5.171
1500
750343)157(
E 5.168
1500
750337)176(
E
5.1631500
750327)182(
E 5.62
1500
375250)73(
E 75.60
1500
375243)61(
E
75.851500
375343)88(
E 25.84
1500
375337)77(
E 75.81
1500
375327)76(
E
Calculation of Chi-Square(x2) Value
Observed
Frequency(O)
Excepted
frequency(E)
(O-E) (O-E)2 (O-E)2/E
67 62.5 4.5 20.25 0.324
57 60.75 -3.75 14.0625 0.232
98 85.75 12.25 150.0625 1.75
84 84.25 -0.25 0.0625 0.001
69 81.75 -12.75 162.5625 1.99
110 125 -15 225 1.80
125 121.5 3.5 12.25 0.101
157 171.5 -14.5 210.25 1.226
176 168.5 7.5 56.25 0.334
182 163.5 18.5 342.25 2.093
73 62.5 10.25 110.25 1.764
61 60.75 0.25 0.0625 0.001
88 85.75 2.75 5.0625 0.059
77 84.25 -7.25 52.5625 0.624
76 81.75 -5.25 33.0625 0.404
703.12)( 2
E
EOE
Degree of Freedom(d.f)=(r-1)(c-1) = (5-1)(3-1) = 8

XI
Table No. 4.7 (Consumers Usually Buying Stores)
19100
2576)16(
E 5
100
2520)7(
E 1
100
254)2(
E
38100
5076)42(
E 10
100
5020)7(
E 2
100
54)1(
E
19100
2576)18(
E 5
100
2520)6(
E 1
100
254)1(
E
Calculation of Chi-Square(x2) Value
Observed
Frequency(O)
Excepted
frequency(E)
(O-E) (O-E)2 (O-E)2/E
16 19 -3 9 0.474
7 5 2 4 0.8
2 1 1 1 1
42 38 4 16 0.421
7 10 -3 9 0.474
1 2 -1 1 0.5
18 19 -1 1 0.053
6 5 1 1 0.2
1 1 0 0 0
922.3)( 2
E
EOE
Degree of Freedom(d.f)=(r-1)(c-1)
= (3-1)(3-1)
= 4

XII
Table No. 4.8 (Brand Choice behaviour of Consumers)
75.492100
525199)53(
E 75.70
2100
525283)79(
E 5.96
2100
525386)100(
E
75.702100
525283)69(
E 133
2100
525532)129(
E 25.104
2100
525417)95(
E
5.992100
1050199)95(
E 5.141
2100
1050283)134(
E 193
2100
1050386)95(
E
5.1412100
1050283)147(
E 266
2100
1050532)266(
E 5.208
2100
1050417)213(
E
75.492100
525199)51(
E 75.70
2100
525283)70(
E 5.96
2100
525386)91(
E
75.702100
525283)67(
E 133
2100
525532)137(
E 25.104
2100
525417)109(
E
Calculation of Chi-Square(x2) Value
ObservedFrequency(O)
Exceptedfrequency(E)
(O-E) (O-E)2/E
53 49.75 3.25 0.212379 70.75 8.25 0.962100 96.50 3.5 0.12769 70.75 -1.75 0.0433129 133 -4 0.120395 104.25 -9.25 0.820795 99.5 -4.5 0.2035134 141.5 -7.5 0.3975195 193 2 0.0207147 141.5 6.5 0.2138266 266 0 0213 208.5 5.5 0.097151 49.75 1.25 0.031470 70.75 -0.75 0.00891 96.5 -5.5 0.313567 70.75 -3.75 0.1988137 133 4 0.1203109 104.25 2.75 0.0712
9614.3)( 2
E
EOE
Degree of Freedom(d.f)=(r-1)(c-1) = (6-1)(3-1) = 10

XIII
Table No. 4.9 (Factors Influencing in Selecting Pepsi Products)
2100
258)3(
E 25.13
100
2553)9(
E 75.3
100
2515)4(
E
3100
2512)4(
E 3
100
2512)5(
E 4
100
508)3(
E
5.26100
5053)31(
E 5.7
100
5015)7(
E 6
100
5012)6(
E
6100
5012)3(
E 2
100
258)2(
E 25.13
100
2553)13(
E
75.3100
2515)4(
E 3
100
2512)2(
E 3
100
2512)4(
E
Calculation of Chi-Square(x2) Value
Observed
Frequency(O)
Excepted
frequency(E)
(O-E) (O-E)2/E
3 2 1 0.5
9 13.25 -4.25 1.363
4 3.75 0.25 0.017
4 3 1 0.333
5 3 2 1.333
3 4 -1 0.25
31 26.5 4.5 0.764
7 7.5 -0.5 0.033
6 6 0 0
3 6 -3 1.5
2 2 0 0
13 13.25 -0.25 0.0047
4 3.75 0.25 0.017
2 3 -1 0.333
4 3 1 0.333
7807.6)( 2
E
EOE
Degree of Freedom(d.f)=(r-1)(c-1) = (5-1)(3-1) = 8