Influence of nanoscale Ag2Te precipitates on the thermoelectric properties of the Sn doped P-type...
8
Influence of nanoscale Ag2Te precipitates on the thermoelectric properties of the Sn doped P-type AgSbTe2 compound Rajeshkumar Mohanraman, Raman Sankar, Fang-Cheng Chou, Chih-Hao Lee, Yoshiyuki Iizuka, I. Panneer Muthuselvam, and Yang-Yuan Chen Citation: APL Materials 2, 096114 (2014); doi: 10.1063/1.4896435 View online: http://dx.doi.org/10.1063/1.4896435 View Table of Contents: http://scitation.aip.org/content/aip/journal/aplmater/2/9?ver=pdfcov Published by the AIP Publishing Articles you may be interested in Thermoelectric properties of AgSbTe2 from first-principles calculations J. Appl. Phys. 116, 103705 (2014); 10.1063/1.4895062 Enhanced thermoelectric performance in Bi-doped p-type AgSbTe2 compounds J. Appl. Phys. 114, 163712 (2013); 10.1063/1.4828478 Thermoelectric properties of p-type (Bi2Te3) x (Sb2Te3)1−x single crystals doped with 3wt. % Te J. Appl. Phys. 113, 073709 (2013); 10.1063/1.4792653 Influence of fullerene dispersion on high temperature thermoelectric properties of Ba y Co 4 Sb 12 -based composites J. Appl. Phys. 102, 103709 (2007); 10.1063/1.2811936 Nature of the cubic to rhombohedral structural transformation in ( Ag Sb Te 2 ) 15 ( Ge Te ) 85 thermoelectric material J. Appl. Phys. 101, 053715 (2007); 10.1063/1.2645675 This article is copyrighted as indicated in the article. Reuse of AIP content is subject to the terms at: http://aplmaterials.aip.org/about/rights_and_permissions Downloaded to IP: 140.112.103.167 On: Mon, 08 Dec 2014 11:00:48
Transcript of Influence of nanoscale Ag2Te precipitates on the thermoelectric properties of the Sn doped P-type...

Influence of nanoscale Ag2Te precipitates on the thermoelectric properties of the Sndoped P-type AgSbTe2 compoundRajeshkumar Mohanraman, Raman Sankar, Fang-Cheng Chou, Chih-Hao Lee, Yoshiyuki Iizuka, I. PanneerMuthuselvam, and Yang-Yuan Chen Citation: APL Materials 2, 096114 (2014); doi: 10.1063/1.4896435 View online: http://dx.doi.org/10.1063/1.4896435 View Table of Contents: http://scitation.aip.org/content/aip/journal/aplmater/2/9?ver=pdfcov Published by the AIP Publishing Articles you may be interested in Thermoelectric properties of AgSbTe2 from first-principles calculations J. Appl. Phys. 116, 103705 (2014); 10.1063/1.4895062 Enhanced thermoelectric performance in Bi-doped p-type AgSbTe2 compounds J. Appl. Phys. 114, 163712 (2013); 10.1063/1.4828478 Thermoelectric properties of p-type (Bi2Te3) x (Sb2Te3)1−x single crystals doped with 3wt. % Te J. Appl. Phys. 113, 073709 (2013); 10.1063/1.4792653 Influence of fullerene dispersion on high temperature thermoelectric properties of Ba y Co 4 Sb 12 -basedcomposites J. Appl. Phys. 102, 103709 (2007); 10.1063/1.2811936 Nature of the cubic to rhombohedral structural transformation in ( Ag Sb Te 2 ) 15 ( Ge Te ) 85 thermoelectricmaterial J. Appl. Phys. 101, 053715 (2007); 10.1063/1.2645675
This article is copyrighted as indicated in the article. Reuse of AIP content is subject to the terms at: http://aplmaterials.aip.org/about/rights_and_permissions Downloaded to
IP: 140.112.103.167 On: Mon, 08 Dec 2014 11:00:48

APL MATERIALS 2, 096114 (2014)
Influence of nanoscale Ag2Te precipitates onthe thermoelectric properties of the Sn dopedP-type AgSbTe2 compound
Rajeshkumar Mohanraman,1,2,3,a Raman Sankar,4 Fang-Cheng Chou,4
Chih-Hao Lee,1 Yoshiyuki Iizuka,5 I. Panneer Muthuselvam,4
and Yang-Yuan Chen2,a
1Department of Engineering and System Science, National Tsing Hua University,Hsinchu, Taiwan2Institute of Physics, Academia Sinica, Taipei, Taiwan3Nano Science and Technology, Taiwan International Graduate Program, Institute ofPhysics, Academia Sinica, Taipei, Taiwan4Center for Condensed Matter Sciences, National Taiwan University, Taipei, Taiwan5Institute of Earth Sciences, Academia Sinica, Taipei, Taiwan
(Received 25 July 2014; accepted 15 September 2014; published online 25 September 2014)
We report a maximal figure of merit (ZT) value of 1.1 at 600 K was obtained forthe sample of which x = 0.03, representing an enhancement greater than 20% com-pared with a pristine AgSbTe2 sample. This favorable thermoelectric performanceoriginated from the optimal Sn2+ substitution for Sb3+ in AgSbTe2, which not onlyincreased electrical conductivity but also led to a substantial reduction in thermalconductivity that was likely caused by an enhanced phonon-scattering mechanismthrough the combined effects of lattice defects and the presence of Ag2Te nanopre-cipitates dispersed in the matrix. © 2014 Author(s). All article content, except whereotherwise noted, is licensed under a Creative Commons Attribution 3.0 UnportedLicense. [http://dx.doi.org/10.1063/1.4896435]
Thermoelectric (TE) systems have recently received an increasing amount of attention becausethey facilitate direct and reversible conversion between heat and electrical energy, thus enablingenvironmentally friendly refrigeration and electric power generation.1, 2 The performance of TEmaterials is assessed using a dimensionless figure of merit (ZT) = α2σT/κ , where α, σ , T, α2σ ,and κ are the Seebeck coefficient, electrical conductivity, absolute temperature, power factor (PF),and total thermal conductivity, respectively. Therefore, optimal TE materials must feature a highPF and low thermal conductivity.1 AgSbTe2 is a potential TE material because of its exceptionallylow thermal conductivity (κ of approximately 0.7 W m−1 K−1).3–14 AgSbTe2 is a narrow bandgapsemiconductor that has a disordered NaCl-type structure (Fm-3m), with Ag+ and Sb3+ randomlyoccupying the Na+ site.14 According to electronic structure calculations,15 the top of the valenceband is Ag(4d)–Te(5p) hybridized anti-bonding states, therefore the formation energy of Ag-vacancyV(Ag) is small and can easily be compensated by Sb anti-site defects Sb(Ag), double donor at Ag-site, then following self-regeneration16 occurs: [2V(Ag) + Sb(Ag)]. When we doped Sn-acceptorat Sb-site, this is p-type doping due to the Sn-acceptor, it reduces the formation energy of [2V(Ag)+ Sb(Ag)], then increases the Sb2Te3 and Ag2Te, since 2[AgSbTe2] = Sb2Te3 + Ag2Te. This iscaused by the spinodal nano-decomposition17 of Ag and V(Ag). Numerous recent studies havefocused on the effects of nanostructures and nanoprecipitates on the TE properties of AgSbTe2
especially alloys with other cubic compounds such as PbTe, called lead antimony silver tellurium
aAuthors to whom correspondence should be addressed. Electronic addresses: [email protected], Tel.: 886-2-2817-5274 and [email protected], Tel.: 886-2-2789-6725, Fax: 886-2-2783-4187.
2166-532X/2014/2(9)/096114/7 © Author(s) 20142, 096114-1
This article is copyrighted as indicated in the article. Reuse of AIP content is subject to the terms at: http://aplmaterials.aip.org/about/rights_and_permissions Downloaded to
IP: 140.112.103.167 On: Mon, 08 Dec 2014 11:00:48

096114-2 Mohanraman et al. APL Mater. 2, 096114 (2014)
FIG. 1. (a) Photograph of synthesized crystals of Ag(Sb1−xSnx)Te2 (x = 0.01, 0.03, 0.05, and 0.07) series. (b) disc and bar-shaped samples for thermal and electrical transport measurements, respectively. (c) Powder XRD patterns of Ag(Sb1−xSnx)Te2
samples. The inset shows the composition dependence of lattice parameter fitted using the Rietveld refinement method.(d) DSC curves of Ag(Sb1−xSnx)Te2 samples.
(LAST)18–21 and GeTe, called tellurium antimony germanium silver (TAGS)22, 23 and have success-fully exhibited enhanced TE performance.
We have recently reported that doping with bismuth (Bi) and indium (In) in the AgSbTe2
system has improved TE performance.24, 25 In this paper, Sb3+ was substituted with Sn2+ in p-type Ag(Sb1−xSnx)Te2 systems to optimize the charge-carrier concentration and simultaneouslyreduce lattice thermal conductivity by enhancing phonon scattering through the naturally formedfine dispersion of Ag2Te nanoprecipitates in the matrix. When x = 0.03, the sample exhibited thehighest ZT value of 1.1 at 600 K; therefore, Ag(Sb0.97Sn0.03)Te2 can be used as a p-type TE material.
Samples with a nominal composition of AgSb1−xSnxTe2 (x = 0.01, 0.03, 0.05, and 0.07) weresynthesized using the vertical Bridgman method. The synthesis procedures detailed in our previousreport24 were used to obtain highly dense crystalline ingots with a dark silvery metallic shine asshown in Fig. 1(a). The crystalline ingots were cut into bar shapes of approximately 3 mm × 3 mm× 14 mm, formed into circular discs of 12 mm in diameter and 2–3 mm thick, and polished beforephysical properties were measured (Fig. 1(b)).
The phases of the Ag(Sb1−xSnx)Te2 samples were analyzed using powdered X-ray diffrac-tion (XRD; X’Pert PRO-PANalytical, CuKα radiation) and differential scanning calorimetry (DSC,NETZSCH, STA 449, with a heating rate of 10 K min−1 and a sample mass of 25 mg). The mi-crostructure and quantitative chemical analysis of the bulk samples were determined by performingfield emission electron micro-probe analysis (FE-EPMA: JEOL JXA-8500F). The sample prepara-tion procedure for the EPMA technique is shown in Fig. S2 of the supplementary material.28 Thethermal conductivity κ was calculated using the equation κ = D × Cp × d, where D is the thermal dif-fusivity coefficient measured using the laser flash method (NETZSCH, LFA 457), Cp is the specificheat capacity obtained using DSC (NETZSCH, STA 449), and density d was determined using theArchimedes method. The relative densities of all samples were greater than 99.9% (approximately7.11–7.12 g/cm3). The temperature dependence of the electrical conductivity σ and Seebeck coef-ficient α was measured simultaneously by using commercial equipment (ZEM-3, ULVAC-RIKO,Japan) in a He atmosphere at temperatures ranging from 300 to 600 K. The Hall effect measurementswere performed using a five-probe configuration with the magnetic field sweeping between +5.0
This article is copyrighted as indicated in the article. Reuse of AIP content is subject to the terms at: http://aplmaterials.aip.org/about/rights_and_permissions Downloaded to
IP: 140.112.103.167 On: Mon, 08 Dec 2014 11:00:48
096114-3 Mohanraman et al. APL Mater. 2, 096114 (2014)
TABLE I. Carrier concentration nH, Hall mobility μH, electrical conductivity σ , Seebeck coefficient α, effective mass m∗/mo,occupancy (Sn/Sb site), and EPMA composition of Ag(Sb1−xSnx)Te2 series.
Nominal Occupancy (EPMA) nH μH σ α m∗/composition (Sn/Sb site) composition (1020 cm−3) (cm2 V−1 s−1) (104 S m−1) (μV K−1) m0
AgSbTe2 0 AgSb0.98Te2.01 1.38 16.2 3.6 165 2.08Ag(Sb0.99Sn0.01)Te2 0.075 ± 0.05 AgSb0.99Sn0.01Te2 0.26 16.6 0.7 209 0.84Ag(Sb0.97Sn0.03)Te2 0.028 ± 0.007 Ag0.99Sb0.98Sn0.027Te2 0.77 16.8 2.09 179 1.62Ag(Sb0.95Sn0.05)Te2 0.030 ± 0.009 Ag0.97Sb0.96Sn0.048Te1.99 0.51 17.5 1.45 156 1.075Ag(Sb0.93Sn0.07)Te2 0.031 ± 0.01 Ag0.96Sb0.94Sn0.064Te1.98 0.33 19.2 1.016 121 0.63
and −5.0 T (Quantum Design, PPMS Ever-cool II). The average measurement errors in σ , α, and κ
were estimated to be approximately ±2%, ±3%, and ±3%, respectively.Fig. 1(c) shows the powder XRD patterns of the AgSb1−xSnxTe2 (x = 0.01, 0.03, 0.05, and
0.07) samples at room temperature. All of the main peaks can be indexed into major-phase fccAgSbTe2 structures (reference code: 01-089-3671) except for a low-intensity peak corresponding tothe Ag2Te secondary phases (reference code: 00-004-0795) that were observed in the sample of whichx = 0.05 and 0.07. The lattice parameter as a function of the Sn content x calculated using the Reitveldrefinement is shown in the inset of Fig. 1(c); the lattice parameter decreased substantially from x = 0to 0.03 as expected because the ionic radii of the dopant Sn2+ (0.69 Å) were slightly smaller than thatof the host Sb3+ (0.76 Å). A slight upturn was observed in the specimens of which x ≥ 0.5 (deviationfrom Vegard’s law-type behaviour, red dashed line). The site occupancy as a function of the Sncomposition for the Ag(Sb1−xSnx)Te2 series is shown in Fig. S1 of the supplementary material28
and listed in Table I. Indeed, it is seen that the population of Sn atoms in Sb sites increases withthe Sn content, beyond that it almost remains constant. Therefore, the existence of a second phaseis highly likely for highly doped compositions. To determine the phase transition of the samples,the DSC heat flows were plotted (Fig. 1(d)). We observed endothermic peaks at 422 K and 421.5 Kassociated with α−β structural phase transition of Ag2Te10 in the samples for which x = 0.05 and0.07, respectively. The experimental results of both DSC and XRD analyses implied that Sn dopingwas nearly optimal in Ag(Sb1−xSnx)Te2 samples of which x = 0.03.
Fig. 2 shows EPMA backscattered electron images of the AgSb1−xSnxTe2 (x = 0.01, 0.03, 0.05,and 0.07) samples. The surface of the sample of which x = 0.01 was homogeneous, exhibiting notraces of secondary phases (Fig. 2(a)). Conversely, the surface of the sample of which x = 0.03 in Fig.2(b) exhibited noticeable secondary phase precipitates Ag2Te (dark area) embedded in the AgSbTe2
bulk matrix (light area). As shown in the upper right inset of Fig. 2(b), the Ag2Te precipitates,which had a feature size of 100−500 nm, were dispersed in the matrix. The precipitates coarsenedin samples of which the Sn content was high (i.e., x > 0.03; Figs. 2(c) and 2(d)), as indicated by theincreased precipitate size and decreased number density. Fig. 3(a) shows the elemental distributionof the AgSb0.97Sn0.03Te2 sample determined using EPMA confirming that the grain boundary areaswere rich in Ag and Te. The measurements were obtained at different locations on the matrix ofthe sample and the average total Sn content (x = approximately 0.028) measured in the matrixwas close to that of the nominal composition x = 0.03 (Fig. 3(b) and Table I). However, when theSn content was further increased (x = 0.05 and 0.07), the samples exhibited coarsening of Ag2Teprecipitates as observed using EPMA (see Figs. S3 and S4 of the supplementary material28), thisobservation is consistent with the XRD and DSC data presented in this paper. That macro-scalecharacterization technique, such as XRD and DSC, cannot detect the existence of a small fractionof Ag2Te precipitates in the AgSb0.97Sn0.03Te2 samples was expected.
Fig. 4 shows the temperature dependences of the TE transport properties of the AgSb1−xSnxTe2
(x = 0.01, 0.03, 0.05, and 0.07) samples. Fig. 4(a) shows the electrical conductivity σ of theAg(Sb1−xSnx)Te2 series in the temperature range of 300−600 K. The electrical conductivity de-creased as the temperature increased and then increased, indicating typical degenerate semiconductorbehavior. This behavior was observed in all samples except for the sample of which x = 0.03, whichexhibited conventional semiconductor behavior. The sample of which x = 0.03 exhibited an electrical
This article is copyrighted as indicated in the article. Reuse of AIP content is subject to the terms at: http://aplmaterials.aip.org/about/rights_and_permissions Downloaded to
IP: 140.112.103.167 On: Mon, 08 Dec 2014 11:00:48

096114-4 Mohanraman et al. APL Mater. 2, 096114 (2014)
FIG. 2. Backscattered electron images (BSEI) of Ag(Sb1−xSnx)Te2 bulk samples. Light areas represent AgSbTe2 bulk matrixand dark areas Ag2Te precipitates. (a) x = 0.01 and (b) x = 0.03. The upper-right inset was taken from the grain boundary;Ag2Te nanosized precipitates were found, (c) x = 0.05 and (d) x = 0.07.
FIG. 3. (a) The elemental distribution determined using EPMA of AgSb0.97Sn0.03Te2 samples and (b) average Sn content inAgSb0.97Sn0.03Te2 sample.
conductivity of value of 3 × 10⁴ S m−1 at 543 K, representing the highest value amongst all of thesamples. To explain the electrical transport behavior in this system (Sn-doped AgSbTe2 samples), theHall carrier concentration nH (see Fig S5 of the supplementary material28) and the mobility μH weremeasured on these samples, and the results are listed in Table I. Due to the carrier-carrier scattering,the mobility exhibited contrary composition dependence with carrier concentration. According toprevious study, the p-type carriers in AgSbTe2 are mainly caused by Ag vacancies13 and tendency toform Ag2Te precipitates. So the maximum carrier concentration of 7.7 × 1019 cm−3 was obtainedwith the x = 0.03 because of the presence of nanoscale Ag2Te precipitation6 in the bulk matrix.With the further increase of x value from 0.05 to 0.07, the carrier concentration decreased while
This article is copyrighted as indicated in the article. Reuse of AIP content is subject to the terms at: http://aplmaterials.aip.org/about/rights_and_permissions Downloaded to
IP: 140.112.103.167 On: Mon, 08 Dec 2014 11:00:48

096114-5 Mohanraman et al. APL Mater. 2, 096114 (2014)
FIG. 4. Temperature dependence of the thermoelectric transport properties of Ag(Sb1−xSnx)Te2 samples. (a) Electricalconductivity σ , (b) Seebeck coefficient α, (c) power factor α2σ , (d) thermal diffusivity D, (e) total thermal conductivity κ ,and (f) lattice thermal conductivity κL.
the mobility increased due to the decrease of carrier concentrations. As shown in Fig. 4(b), theSeebeck coefficients (α) of all samples were positive throughout the temperature range indicatingp-type electrical transport behavior. The substantial decrease in the Seebeck coefficient when the Snconcentration increased was caused by the decrease in the calculated effective mass obtained fromthe relationship between nH and α (Table I; detailed calculations are provided in the supplementarymaterial28). The PF (α2σ ) was calculated based on the values of σ and α, as shown in Fig. 4(c).The sample of which x = 0.03 exhibited the maximal value of 1.38 mW m−1 K−2 at 600 K becausethe σ value was enhanced at high temperatures. Overall, the electrical transport properties weremarkedly improved by using the optimal Sn filling fraction probably because of the presence of thenanostructural features in the bulk matrix. Fig. 4(d) shows the thermal diffusivity D measurementsof the Ag(Sb1−xSnx)Te2 samples. The Cp measurements (Fig S6 of the supplementary material28)shows strong agreement with those reported in the literature12 regarding typical AgSbTe2 samples(approximately 0.205 J g−1 K−1). Fig. 4(e) shows the total thermal conductivity κ values for theAg(Sb1−xSnx)Te2 series in the temperature range of 300−600 K. The Sn-doped AgSbTe2 samplesexhibited lower thermal conductivity compared than did pristine AgSbTe2 samples. The electronicthermal conductivity κe can be calculated by using the Wiedmann–Franz law (κe = L ×σ × T), whereL is the Lorentz number. The lattice thermal conductivity κL can be calculated by subtracting κe fromκ , thus κL = κ − L × σ × T. As shown in Fig. 4(f), the sample of which x = 0.03 exhibited a lowκL value of 0.35 W/m K at 510 K, which is lower than those of pristine AgSbTe2 (0.52 W m−1 K−1).The κL of samples of which x ≤ 0.03 decreased substantially as the Sn content increased; however,the κL value increased sharply when x > 0.03 because the Ag2Te precipitate in the matrix coarsened,indicating that x = 0.03 is the optimal doping amount. The low κL achieved in the samples of which
This article is copyrighted as indicated in the article. Reuse of AIP content is subject to the terms at: http://aplmaterials.aip.org/about/rights_and_permissions Downloaded to
IP: 140.112.103.167 On: Mon, 08 Dec 2014 11:00:48
096114-6 Mohanraman et al. APL Mater. 2, 096114 (2014)
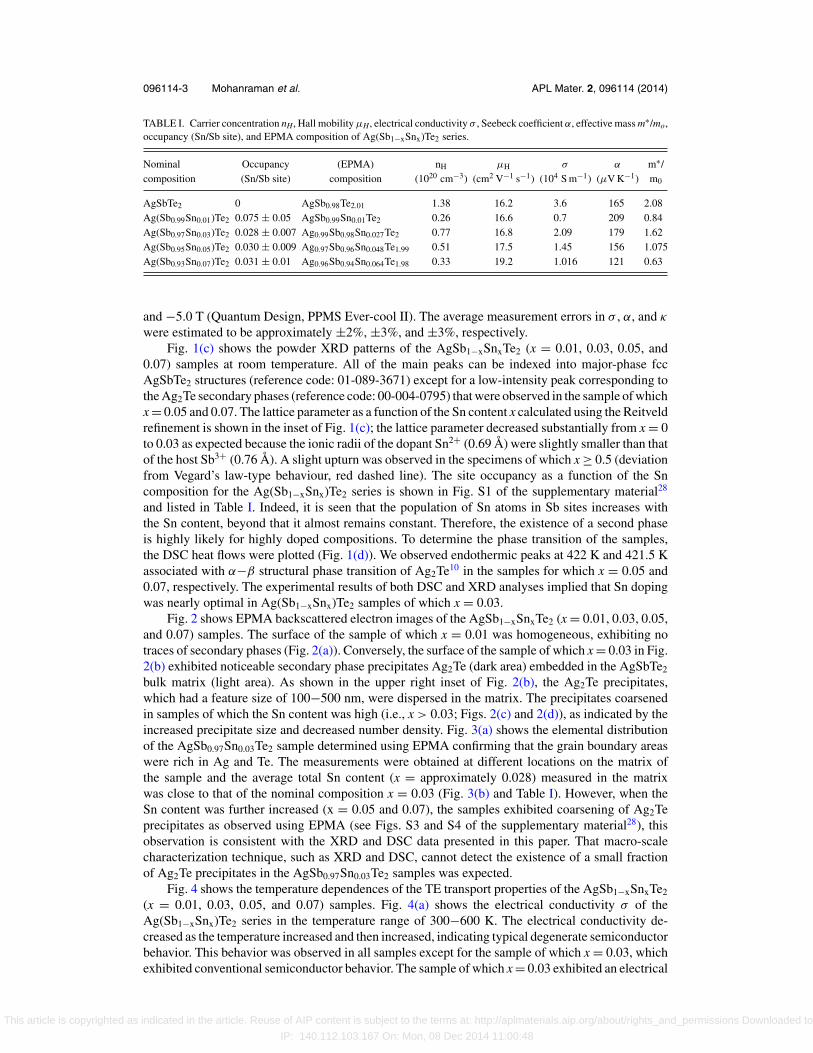
FIG. 5. (a) Temperature dependence of thermoelectric figure of merit ZT of Ag(Sb1−xSnx)Te2 (x = 0.01, 0.03, 0.05, and0.07) samples and (b) the three-dimensional plot of current state of art of various doped elements in AgSbTe2 system in thetemperature range from 300 to 700 K along with references.
x = 0.03 can be attributed to the combined effects of the lattice defects engendered by substitutingSn into the Sb sites in AgSbTe2 systems24, 25 and the presence of nanometer-scale precipitates ofthe Ag2Te phase with a feature size as large as 100–500 nm which was effective for enhancingphonon scattering.9, 26, 27 Further studies like transmission electron microscope (TEM) analyses andultrafast dynamics of sample of which x = 0.03 by ultrafast laser spectroscopy in order to understandnanoscale thermal transport will be subjected to future direction. The values of α2σ and κ wereused to calculate the TE figure of merit ZT which is plotted in Fig. 5(a). The AgSb0.97Sn0.03Te2
sample exhibited a maximal ZT value of 1.1 is achieved at 600 K because of its enhanced PF andreduced thermal conductivity at high temperatures. Fig. 5(b) shows a three-dimensional plot ofrecently reported ZT values for various doping elements in AgSbTe2 systems in the temperaturerange of 300−700 K. This comparison shows that AgSbTe2 compounds featuring the optimal Sndoping concentration are potential candidates for TE applications in the medium temperature range.Thermal stability can be ensured because the TE measurement properties for AgSb0.97Sn0.03Te2
samples exhibited negligible change in repeated thermal cycles (heating and cooling cycles) withina temperature range of 300−600 K (Fig. S7 of the supplementary material28). The main findingof this investigation is that doping an Ag(Sb1−xSnx)Te2 system with an optimal amount of Sn(x = 0.03) is the most effective method for controlling the morphology and size of nanoprecipitatesand achieving high ZT values, and that doping the system with amounts substantially higher thanthe optimal amount yields adverse effects.
In summary, the microstructure and TE properties of Sn-doped AgSbTe2 compounds were in-vestigated and thermal analysis was conducted. According to XRD, DSC, and EPMA analyses, thefilling limit of the Sn content in AgSbTe2 systems is approximately x = 0.03. The lattice thermalconductivity of Ag(Sb1−xSnx)Te2 (x = 0.01 and 0.03) decreased as Sn content increased. The com-pound AgSb0.97Sn0.03Te2 exhibited the lowest lattice thermal conductivity because of the enhancedphonon scattering that is generated by substitutional effects and presence of Ag2Te nanoprecipitatesin the matrix. The AgSb0.97Sn0.03Te2 sample exhibited a higher PF and low thermal conductivity,resulting in a high ZT value of 1.1 at 600 K indicating that this sample is highly suitable for TE powergeneration applications. Our subsequent study will focus on improving the ZT value of AgSbTe2
compounds by optimizing the doping concentration and calibrating nanoscale precipitates.
This work was supported by Academia Sinica and the National Science Council, Taiwan,Republic of China, Grant No. NSC100-2112-M-001-019-MY3.
1 D. M. Rowe, Thermoelectrics Handbook: Macro to Nano (CRC, Boca Raton, FL, 2006) Chap. 1.2 J. Yang and F. Stabler, J. Electron. Mater. 38, 1245 (2009).3 J. Ma, O. Delaire, A. F. May, C. E. Carlton, M. A. McGuire, L. H. VanBebber, D. L. Abernathy, G. Ehlers, T. Hong, A.
Huq, W. Tian, V. M. Keppens, Y. S. Horn, and B. C. Sales, Nat. Nanotechnol. 8, 445 (2013).4 H. Wang, J. F. Li, M. Zhou, and T. Sui, Appl. Phys. Lett. 93, 202106 (2008).5 J. Xu, H. Li, B. Du, X. Tang, Q. Zhang, and C. Uher, J. Mater. Chem. 20, 6138 (2010).
This article is copyrighted as indicated in the article. Reuse of AIP content is subject to the terms at: http://aplmaterials.aip.org/about/rights_and_permissions Downloaded to
IP: 140.112.103.167 On: Mon, 08 Dec 2014 11:00:48

096114-7 Mohanraman et al. APL Mater. 2, 096114 (2014)
6 S. N. Zhang, T. J. Zhu, S. H. Yang, C. Yu, and X. B. Zhao, J. Alloys Compd. 499, 215 (2010).7 P. A. Sharma, J. D. Sugar, and D. L. Medlin, J. Appl. Phys. 107, 113716 (2010).8 S. N. Zhang, T. J. Zhu, S. H. Yang, C. Yu, and X. B. Zhao, Acta Mater. 58, 4160 (2010).9 H. J. Wu, S. W. Chen, T. Ikeda, and G. J. Snyder, Acta Mater. 60, 6144 (2012).
10 B. Du, H. Li, J. Xu, X. Tang, and C. Uher, Chem. Mater. 22, 5521 (2010).11 B. L. Du, H. Li, and X. F. Tang, J. Alloys Compd. 509, 2039 (2011).12 D. T. Morelli, V. Jovovic, and J. P. Heremans, Phys. Rev. Lett. 101, 035901 (2008).13 V. Jovovic and J. P. Heremans, Phys. Rev. B 77, 245204 (2008).14 R. W. Armstrong, J. W. Faust, and W. A. Tiller, J. Appl. Phys. 31, 1954 (1960).15 K. Hoang, S. D. Mahanti, J. R. Salvador, and M. G. Kanatzidis, Phys. Rev. Lett. 99, 156403 (2007).16 S. B. Zhang et al., Phys. Rev. B. 57, 9642 (1998).17 J. Sugar and D. Medlin, J. Alloys Compd. 478, 75–82 (2009).18 K. F. Hsu, S. Loo, F. Guo, W. Chen, J. S. Dyck, C. Uher, T. P. Hogan, E. K. Polychroniadis, and M. G. Kanatzidis, Science
303, 818 (2004).19 X. Z. Ke, C. F. Chen, J. H. Yang, L. J. Wu, J. Zhou, Q. Li, Y. M. Zhu, and P. R. C. Kent, Phys. Rev. Lett. 103, 145502
(2009).20 W. Q. Ao, W. A. Sun, J. Q. Li, F. S. Liu, and Y. Du, J. Alloys Compd. 475, L22 (2009).21 H. Wang, J. F. Li, C. W. Nan, M. Zhou, W. S. Liu, B. P. Zhang, and T. Kita, Appl. Phys. Lett. 88, 092104 (2006).22 B. A. Cook, M. J. Kramer, X. Wei, J. L. Harringa, and E. M. Levin, J. Appl. Phys. 101, 053715 (2007).23 J. R. Salvador, J. Yang, X. Shi, H. Wang, and A. A. Wereszczak, J. Solid State Chem. 182, 2088 (2009).24 R. Mohanraman, R. Sankar, F. C. Chou, C. H. Lee, and Y. Y. Chen, J. Appl. Phys. 114, 163712 (2013).25 R. Mohanraman, R. Sankar, K. M. Boopathi, F. C. Chou, C. W. Chu, C. H. Lee, and Y. Y. Chen, J. Mater. Chem A 2,
2839–2844 (2014).26 Y. Pei, J. F. Lensch, E. S. Toberer, D. L. Medlin, and G. J. Snyder, Adv. Funct. Mater. 21, 241 (2010).27 Y. Pei, N. A. Heinz, A. LaLonde, and G. J. Snyder, Energy Environ. Sci. 4, 3640 (2011).28 See supplementary material at http://dx.doi.org/10.1063/1.4896435 for details about the site occupancy, EPMA images,
nH graph, calculation of effective mass (m*), Cp graph, thermal stability of AgSb0.97Sn0.03Te2 sample.
This article is copyrighted as indicated in the article. Reuse of AIP content is subject to the terms at: http://aplmaterials.aip.org/about/rights_and_permissions Downloaded to
IP: 140.112.103.167 On: Mon, 08 Dec 2014 11:00:48