INFLUENCE OF EL NINO ON THE CLIMATE AND WINE OF EUROPE
93
1 1 Brittia Dartige Du Fournet TCD - Geography dissertation 2009 CONTENT : Abstract : p 1 – A what are they? Bibliography: p. 87 1. WINE AND CLIMATE - THE INFLUENCE OF EL NINO ON EUROPEAN WEATHER ABSTRACT In this dissertation, I propose to examine the possibility that the El Nino - El Nina events influence the climate of Europe, the growing of grapes in France and even, to certain extend the climate of Ireland and Britain. The wine growers of chateau Brion, (south-west of France) in the Bordeaux region (45 º Lattitude) have been kind enough to provide me with detailed records of their meteorological observations for the past century and in particular very detailed record of the past 70 years or so. The weather has been extremely variable in the 20 th century and promises to be just as variable too far in the 21 st . The present global warming may be a reality but the recent El Nino la Nina phenomenon may be also to blame for the excessive heat and excessive rain that we had to endure in the past few years. Indeed, the year 2003 was an El Nino year and the heat killed 30,000 people in Europe, some 1500 of them in France. Several reports state that climate
-
Upload
independent -
Category
Documents
-
view
2 -
download
0
Transcript of INFLUENCE OF EL NINO ON THE CLIMATE AND WINE OF EUROPE

1
1
Brittia Dartige Du Fournet
TCD - Geography dissertation 2009
CONTENT :
Abstract : p 1
– A what are they?
Bibliography: p. 87
1.
WINE AND CLIMATE - THE INFLUENCE OF EL NINO ON
EUROPEAN WEATHER
ABSTRACT
In this dissertation, I propose to examine the possibility that the El Nino - El
Nina events influence the climate of Europe, the growing of grapes in France
and even, to certain extend the climate of Ireland and Britain.
The wine growers of chateau Brion, (south-west of France) in the Bordeaux
region (45 º Lattitude) have been kind enough to provide me with detailed
records of their meteorological observations for the past century and in
particular very detailed record of the past 70 years or so.
The weather has been extremely variable in the 20th
century and promises to
be just as variable too far in the 21st. The present global warming may be a
reality but the recent El Nino la Nina phenomenon may be also to blame for
the excessive heat and excessive rain that we had to endure in the past few
years.
Indeed, the year 2003 was an El Nino year and the heat killed 30,000 people
in Europe, some 1500 of them in France. Several reports state that climate
2
2
phenomena such as El Niño and La Niña will be noticeably different from
those observed in the past.1 The cumulating effect of global warming and the
– a events, might very well have been a
major factor in this disastrous state of affairs.
2. INTRODUCTION
GRAPES HARVESTS AS PROXY FOR PAST CLIMATE
RECONSTITUTION
The weather is not a fixed feature as we know, but even the climate of
individual countries is widely variable in time. It is probably one of the
causes of vast movement of population, such as the Viking invasion of
Britain, France and Ireland and perhaps of the movement of the Celtic
people across Europe and part of Asia. What drive the general climate is not
completely understood. However the record of the past weather and climatic
events in history might add to our understanding of both historic events and
Climatic science. Phenology can give interesting insight into the working of
climate. Phenology is a science dealing with the relations between climate
and periodic biological phenomena. It is the study of the response of living
organisms to seasonal and climatic changes to the environment in which
they live. Seasonal changes include variations in the duration of sunlight,
precipitation, temperature and other life-controlling factors.
Here we are first examining the different climatic forcing and comparing the
record of past climate with the record of the wine growers. Last, we try to
extrapolate the influence of El Niño – La Nina phenomena on the European
climate.
1 http://www.preventionweb.net/english/professional/news/v.php?id=14970

3
3
3. – A what are they?
El Niño is an oscillation of the ocean-atmosphere system in the tropical
Pacific which has important consequences for weather around the globe,
including increased rainfall across the southern US and Peru. This system
has caused destructive flooding or drought in the West Pacific and brush
fires in Australia.
In an El Nino year, the trade winds blowing west from South America
weaken, and a pool of warm water surges eastward across the equatorial
Pacific. This affects storms in the central Pacific, which strengthen and feed
strong, moist winds blowing toward North America

4
4
Observations of conditions in the tropical Pacific are considered essential for
the prediction of short-term (a few months to 1 year) climate variations. To
provide necessary data, NOAA operates a network of buoys which measures
temperatures, currents and winds in the equatorial band. These buoys daily
transmit data which are available to researchers and forecasters around the
world in real time. In normal, non-El Niño conditions (top panel of
schematic diagram), the trade winds blow towards the west across the
tropical Pacific. These winds pile up warm surface water in the west Pacific,
so that the sea surface is about 1/2 meter higher at Indonesia than at Ecuador
(Philander, S.G.H., 1990)
M g " h Ch " “ h B by”
Spanish, El Niño refers to the baby Jesus
and its characteristic Christmas warmer-
than-normal sea temperatures and higher-
than-normal water levels in the tropical
Pacific lead to a change in weather
patterns. La Niña is just the Spanish for
little girl, and it refer to the cold years
which usually follow the warmth of El
Niño. It is a warming of the tropical
Pacific. El Nino occurs every three to seven
years lasting for 12–18 months. It is linked
to the Southern Oscillation. During El
Niño, the trade winds weaken along the
equator as atmospheric pressure rises in the
western Pacific and falls in the eastern Pacific. Weakened trade winds allow
warm surface water, normally confined to the western Pacific, to migrate
eastward.
El Niño events occur in equatorial regions but causes changes in the world
climate. Originally, El Niño was the name used for warmer than normal sea

5
5
surface temperatures in the Pacific Ocean off the coast of South America.
Now, El Niño has come to refer to a whole complex of Pacific Ocean sea-
surface temperature changes and global weather events.i
Since last February 2007, we have entered a La Nina Cycle, and this is
probably why the weather is colder than it has been for the past few years:
“La Niña’s tend to develop from March to June and reach peak intensity
at the end of the year and into the next February, according to Vernon
Kousky,ii NOAA's top El Nino/La Nina expert. La Nina winters tend to be
warmer than normal in the Southeast and colder than normal in the
Northwest.iii
”"We're seeing a shift to the La Nina”2
In normal, non-El Nino conditions, the trade winds blow towards the west
across the tropical Pacific. These winds pile up warm surface water in the
west Pacific, so that the sea surface is about 1/2 meter higher at Indonesia
than at Ecuador. The sea surface temperature is about 8 degrees C higher in
the west, with cool temperatures off South America, due to an upwelling of
cold water from deeper levels.iv
Wind-driven upwelling, a process that brings cold water to the surface along
the equator and along the west coasts of North and South America, is also
greatly reduced, causing sea surface temperatures to rise. Upwelled waters
are rich in nutrients that support biological productivity, so that reduced
upwelling adversely affects marine ecosystems and
economically valuable fish stocks.v
4. EL NINO IN HISTORY
Exceptionally strong El Nino events may have
contributed to the downfall of two early civilisations in
Peru, according to American researchers. Michael
Moseley (right) an anthropologist at the University of
2 NOAA Administrator Conrad Lautenbache

6
6
Florida in Gainesville, has consulted historical records in Peru. He says that
severe flooding devastated coastal cities around AD 600 and AD 1100. The
evidence that this flooding was associated with strong El Nino events comes
from ice cores taken from a glacier about 1000 kilometres to the southwest
of the afflicted cities. The cores indicate that the Andes suffered unusually
severe droughts at around AD 600 and AD 1100. Strong El Nino events may
have caused the downfall of early civilisations in Peru. Dr. Moseley thinks
that severe flooding devastated some peruvian cities around AD 600 and AD
1100.
“The evidence that this flooding was associated with strong El Nino
events comes from ice cores taken from a glacier about 1000 km to the
southwest of the afflicted cities...Normal El Nino events are known to
produce droughts in the highlands”vi.
h o occurs, the waters of the Equatorial Pacific become
warmer than normal, creating rising air that changes wind and weather
patterns. The effects can be worldwide, including drought in the western
Pacific and more rain in Peru and in the west coast of South America.vii

7
7
Lonnie Thompson, (above left) of the Polar Institute at Ohio State
University in Columbus, USA, who studied the ratios of isotopes of oxygen
in these ice cores, also believes that the isotope ratios show that around AD
600 and AD 1100, the climate was warmer than at any time since 1531.
The drought recorded in the ice core between AD 560 and AD 590
corresponds to a decline in the Moche culture on the north coast of Peru.
Their capital city was flooded, rebuilt, and then overrun by sand dunes
related to a drought. The Moche moved their capital north to Pampa Grande
(New scientist, March 1990).
8
8
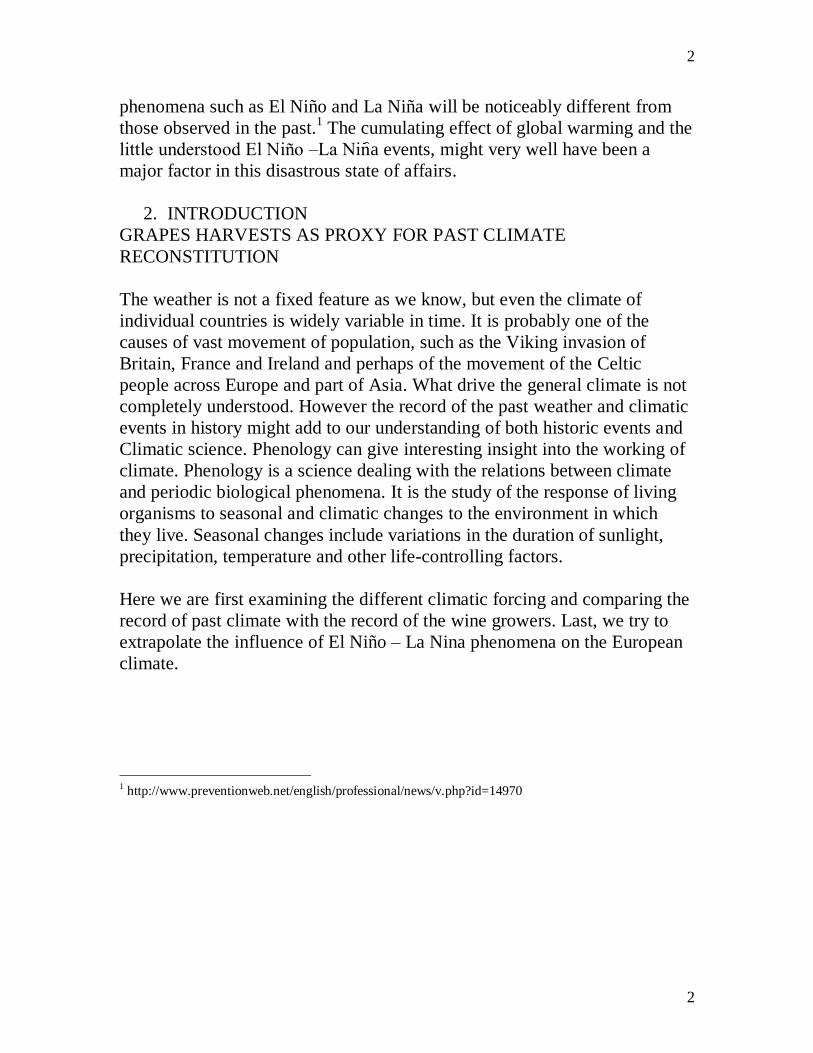
Figure 1-
http://www.bing.com/images/search?q=EL+NINO+LA+NINA+YEARS&FORM=HDRSC2#view=de
tail&id=AEA2FBB1C63A8CEBDE920D6EA8A74388A13569E6&selectedIndex=18
5. DOES EL NIÑO HAVE AN INFLUENCE ON THE CLIMATE IN
EUROPE?
El Niño–Southern Oscillation (ENSO) is one of the most important global
climate patterns. The effects in the Pacific and the tropical regions are
accepted; however, its impacts in the North Atlantic–European sector are
controversialviii
.
The influence of El Niño on the tropical latitudes has been demonstrated
however, the effects on Europe are not clear.

9
9

10
10
Figure 2-Schematic of global temperature and precipitation anomalies
in an El-Niño winter (source: NOAA).
A study of atmospheric weather conditions found that during the winter
(December, January, February) of an El Niño year there is an increased
number of cyclonic weather systems over Europe(Fraedrich, 1994) . This
gives colder weather over central and northern Europe, with increased winter
precipitation from the British Isles to the Black Sea.
A study shows that, in the February of an El Niño year, more rain falls,
compared to the long-term mean (Wilby 1993) but west and south-west
Europe sees less rain ( dry summers). According to Robert Wilby (of
Loughborough University), El ’ during the past century have usually
brought extra rain and snow to Britain in winter.
ENSO events In an El Niño, in the North Atlantic lows follow a more
southerly route, whereas they follow a more northerly one during a La Niña
11
11
event.3 El Nino phases occurred between 1911 and 1914 and again between
1939 and 1942
Stephen Cane of Columbia University, New York, was surprised by the
persistence of the 1994 El Nino. It lasted for 3 years.
Previously the worst El Nino for a century occurred in 1982-83, causing
thousands of deaths during a major African droughtix
.
Cane and Zebiak developed a model of El Nino's dynamics. Their model
predicted, a year in advance, the timing of the next El Nino in 1986-87 and
predicted that the following event would begin in late 1991.
One model rightly predicted that the warming would continue through 1993.
It was developed by the US government's National Oceanographic and
Atmospheric Administration (NOAA). It utilization of new sea and wind
data collected as part of the international Tropical Ocean/Global Atmosphere
(TOGA) research programme.
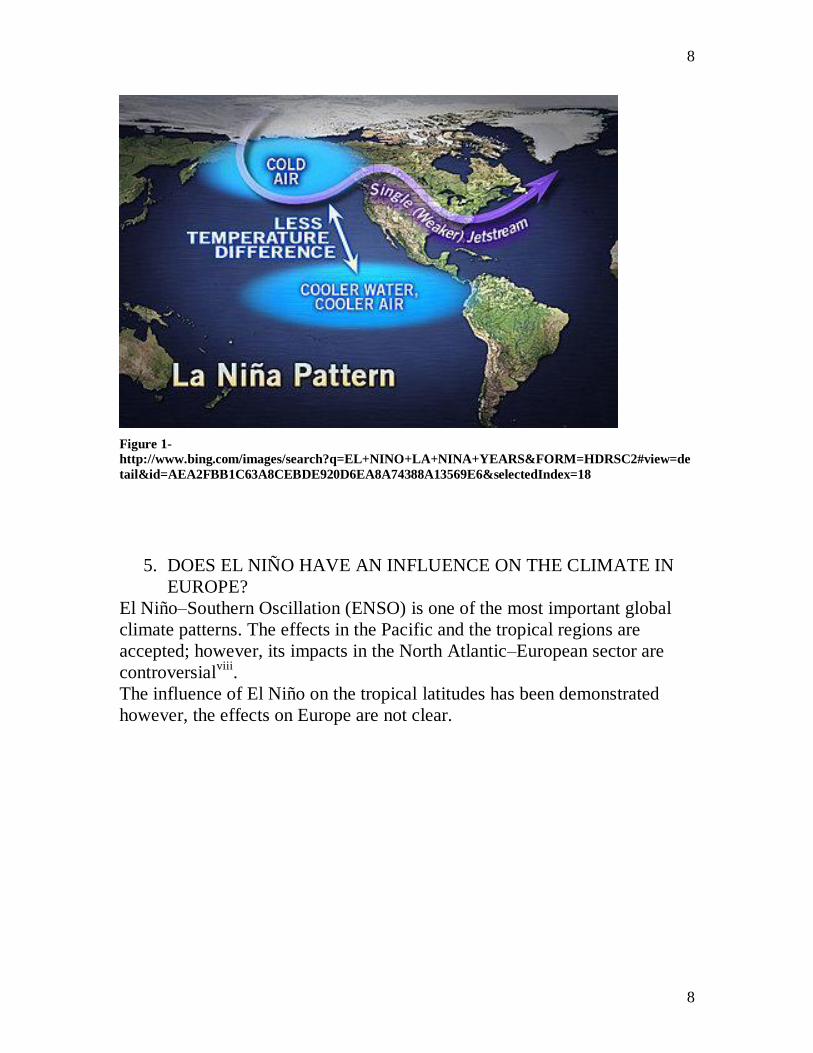
Figure 3-vineyard in winter
3 http://www.mpimet.mpg.de/en/presse/faq-s/das-el-nino-southern-oscillation-enso-phaenomen/hat-el-nino-
einen-einfluss-auf-das-klima-in-europa.html
12
12
6. PHENOLOGY AND WINES
Phenology is the study of the timing of natural events4. It provides
comparisons between years and among different geographic regions. These
records also have scientific value for assessing the impacts of climate change
as well as the reconstitution of past climate. 5
Wine growing developed when the climate was most conducive (Le Roy
Ladurie, 1971; Pfister, 1988; Gladstones, 1992). Records of dates of harvest
and yield for European viticulture have been kept for nearly a 1000 years
(Penning-Roswell, 1989; Le Roy Ladurie, 1971) revealing periods with
more beneficial growing season temperatures and greater productivity.
D g h m v “ p m m” p ( gh y 900-1300 AD)
the data indicate that temperatures were up to 1°C warmer with
vineyards planted as far north as the coastal zones of the Baltic Sea
and southern England(Gladstones, 1992).
During the High Middle Ages (12th and 13th
centuries) harvesting
occurred in early September as compared to early to mid October
today and that growing season temperatures must have been 1.7°C
warmer than today(Pfister, 1988; Gladstones, 1992).
Conversely, temperature declines during the 14th century were
m c g h “Little Ice g ” ( x g h 19 h
century) resulting in northern vineyards dying out and growing
seasons so short that harvesting grapes in southern Europe was
difficult.
4 such as the date that migrating birds return, the first flower dates for plants, and the date on which a lake
freezes in the autumn or opens in the spring 5 http://www.uwgb.edu/biodiversity/phenology/index.htm

13
13
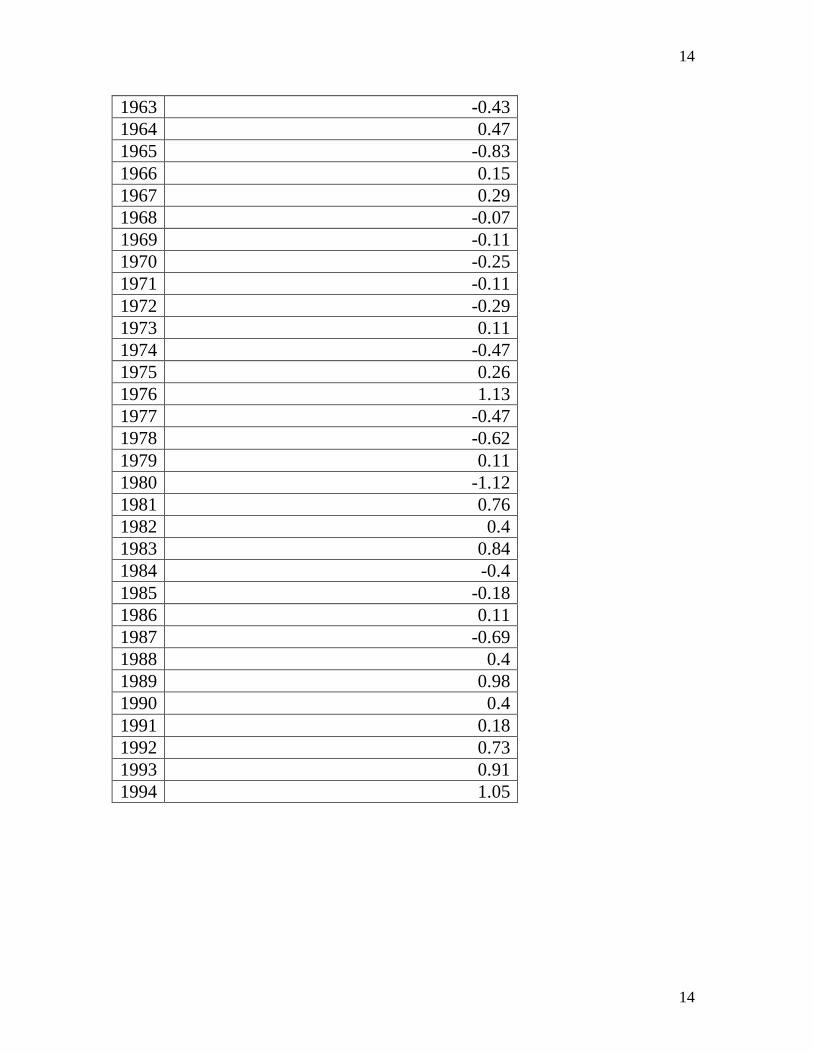
in Switzerland over the last 500 years Phenological grape harvest
observations have been used as a proxy indicator for reconstructing past
temperature variability. The data stem from the Euroclimhist databank of the
Institute of History at the University of Berne6.
This study has created a temperature reconstruction from 1480 to 2005 as a
region average for the Swiss Plateau region. It shows a cooling during the
17th century with lowest values in 1698, a warming until 1718 followed by a
negative trend until the end of the 18th century a cooling with its minimum
in 18167 and a warming until 1868, followed by a positive trend until the late
1940s.
This is an example of their recordx
Swiss record indice of deviation from normal
Year Temperature deviation from normal
1950 0.87
1951 -0.58
1952 0.62
1953 0.33
1954 -1.01
1955 0
1956 -0.76
1957 -0.25
1958 0.26
1959 0.44
1960 0.11
1961 -0.04
1962 -0.33
6 http://www.giub.unibe.ch/klimet/docs/diplom_nmeier.pdf 7 The catastrophic eruption of the Tambora volcano, Indonesia, in 1815 was followed by a so-called "year-without-a-summer." In New England, USA, for example, frost occurred during each of the summer months in 1816.
14
14
1963 -0.43
1964 0.47
1965 -0.83
1966 0.15
1967 0.29
1968 -0.07
1969 -0.11
1970 -0.25
1971 -0.11
1972 -0.29
1973 0.11
1974 -0.47
1975 0.26
1976 1.13
1977 -0.47
1978 -0.62
1979 0.11
1980 -1.12
1981 0.76
1982 0.4
1983 0.84
1984 -0.4
1985 -0.18
1986 0.11
1987 -0.69
1988 0.4
1989 0.98
1990 0.4
1991 0.18
1992 0.73
1993 0.91
1994 1.05

15
15
1995 0.4
1996 0.47
1997 0.55
1998 0.91
1999 0.4
2000 1.2
2001 0.69
2002 0.62
2003 2.43
2004 0.4
2005 0.91
Swiss temperature deviation from normal 1950-2005
10
1112
1314
15
16
1718
192021
2223
24
25
26
27
2829
30
31
32
33
34
35
36
37
38
39
40
41
42
4344
45
464748
49
50
51
5253
54
55
56
7
6
5432
1
89-1.5
-1
-0.5
0
0.5
1
1.5
2
2.5
3
1 3 5 7 9 11 13 15 17 19 21 23 25 27 29 31 33 35 37 39 41 43 45 47 49 51 53 55
16
16
French records of grape-harvest dates8 (vendanges) in Burgundy (north-East
France) have also been used to reconstruct temperatures from 1370 to 2003
using a process-based phenology modeIt indicates that Temperatures as high
as those reached in the 1990s have occurred several times in Burgundy since
1370.
Hoverer the best and most detailed record come from the Bordeaux region of
France which also provide some of the best wines in the world.
Unfortunately it only starts at the 20th
century, with some notes on earlier
years.
The record chosen come from the Gironde department and particularly from
the Haut Brion Domain. This domain produces some of the most expansive
wines available anywhere.
In this dissertation the questions raised are: Are grape harvest observations
such as date of harvest, weather, cold warmth, rain, drought, a trustworthy
past climate indicator? Are the observations collected in France and
Switzerland applicable to the past climate of Ireland and Great Britain? This
is the challenge proposed here.
7. BURGUNDY PINOT-NOIR RECORDS
The Burgundy region can boost to breed some of the best wine in France,
including the famous Beaujolais. French records of grape-harvest dates9 in
8 Grape ripening as a past climate indicator Nature, VoL432, 18 November 2004. -Isabelle Chuine1, Pascal Yiou 2,
Nicolas Viovy 2, Berrd Seguin 3, Valérie Daux 2, Emmanuel Le Roy Ladurie 4 1 CEFE-CNRS, 1919 route de Mende, 34293 Montpellier, France 2 LSCE-CEA-CNRS CE Saclay l'Orme des Merisiers, 91191 Gif-sur-Yvette, France 3 INRA Site Agroparc, domaine Saint-Paul, 84914 Avignon Cedex 9, France 4 Collège de France, 75231 Paris Cedex 05, France
9 Grape ripening as a past climate indicator Nature, VoL432, 18 November 2004. -Isabelle Chuine1, Pascal
Yiou2,Nicolas Viovy2, Berrd Seguin3, Valérie Daux2, Emmanuel Le Roy Ladurie4 1 CEFE-CNRS, 1919 route de Mende, 34293 Montpellier, France 2 LSCE-CEA-CNRS CE Saclay l'Orme des Merisiers, 91191 Gif-sur-Yvette, France 3 INRA Site Agroparc, domaine Saint-Paul, 84914 Avignon Cedex 9, France
17
17
Burgundy (north-East France) have been used to reconstruct temperatures
from 1370 to 2003 using a process-based phenology model developed for
the Pinot Noir grape. Temperatures as high as those reached in the 1990s
have occurred several times in Burgundy since 1370.
The chart shows the number of days after the 1rst of September occurring
before the grapes harvest.
The summer of 2003 appears to have been exteriority, with temperatures that
were probably higher than in any other year since 1370.10
The grape harvest date series is a corrected and updated harvest date series
from Le Roy Ladurie (1983)11
covering 1370 to 1977 and completed in
2003.
In another experiment Grape harvest dates were collected from up to 18
cities or villages in Burgundy (the actual number depends on the year) since
1370.
Dijon, the main town of the area and the longest series overall and the only
one available for some periods - was chosen as the reference series:
“17 other series were used to take into account the regional variability. All
series were standardized such that they present the same average date as
Dijon Over their common recorded period. For each year the harvest date
4 Collège de France, 75231 Paris Cedex 05, France
10 Nature,VoL432, 18 November 2004. 11 Emmanuel L is professor at the Collège de France and, since 1973, chair, department of history of
modern civilization. He has had a distinguished career, serving as Administrateur Général of the
Bibliothèque Nationale de France (1987-94); member of the Institute (Academy of Moral and Political
Sciences); Agrégé of the University, Doctor of Letters; Commander of the Legion of Honor (1996); and has
taught at the universities of Montpellier, the Sorbonne, and Paris VII. Dr. Ladurie is the author of many historical works, including Les Paysans de Languedoc (1966), Histoire du Climat depuis l'An Mil (second
ed., 1983), Montaillou, village occitan (1975), Le Territoire, de l'Historien (2 vols., 1973, 1978), Le
Carnaval de Romans, 1579-1580 (1980), L'Etat royal (1987), L'Ancien Regime (1991), Le Siècle de Platter
(1995), and Saint-Simon, le systeme de la Cour (1997).
http://www.loc.gov/bicentennial/bios/frontiers/bios_ladurie.html

18
18
Ht was computed as the median date among all available standardized dates
including Dijon”.12
These are the Burgundy records of temperature deviation from Normal
1950-2003
1950 0.3
1951 -1.02
1952 0.69
1953 0.16
1954 -1.11
1955 -0.62
1956 -1.49
1957 -0.62
1958 -0.46
1959 0.86
1960 0.31
1961 -0.06
1962 -1.11
1963 -0.96
1964 0.24
1965 -1.43
1966 -0.17
1967 -0.46
1968 -0.54
1969 -0.89
1970 -0.46
1971 0.68
1972 -1.02
1973 0.06
1974 0.08
12 BURGUNDY RECORD: ftp://ftp.ncdc.noaa.gov/pub/data/paleo/historical/france/burgundy2004.txt

19
19
1975 0.07
1976 2.17
1977 -0.78
1978 0.00
1979 -0.01
1980 -1.22
1981 0.02
1982 0.71
1983 0.12
1984 -0.78
1985 -0.2
1986 -0.07
1987 -0.62
1988 0.08
1989 0.88
1990 0.6
1991 0.00
1992 0.6
1993 0.49
1994 0.42
1995 -0.06
1996 0.38
1997 1.04
1998 0.63
1999 0.63
2000 1.03
2001 0.5
2002 0.71
2003 5.86

20
20
Burgundy temperature deviation 1950-2003
10
1112
1314
15
16
171819
20
21
22
23
242526
27
28
2930
31
32
33
34
35
3637
38
39
4041
42
434445
46
47
484950
51
5253
54
76
5432
1
89-2
-1
0
1
2
3
4
5
6
7
1 3 5 7 9 11 13 15 17 19 21 23 25 27 29 31 33 35 37 39 41 43 45 47 49 51 53

21
21
Figure 4- The duchy de Bourgogne 1477
The temperature anomalies are with respect to the April to August meanxi
22
22
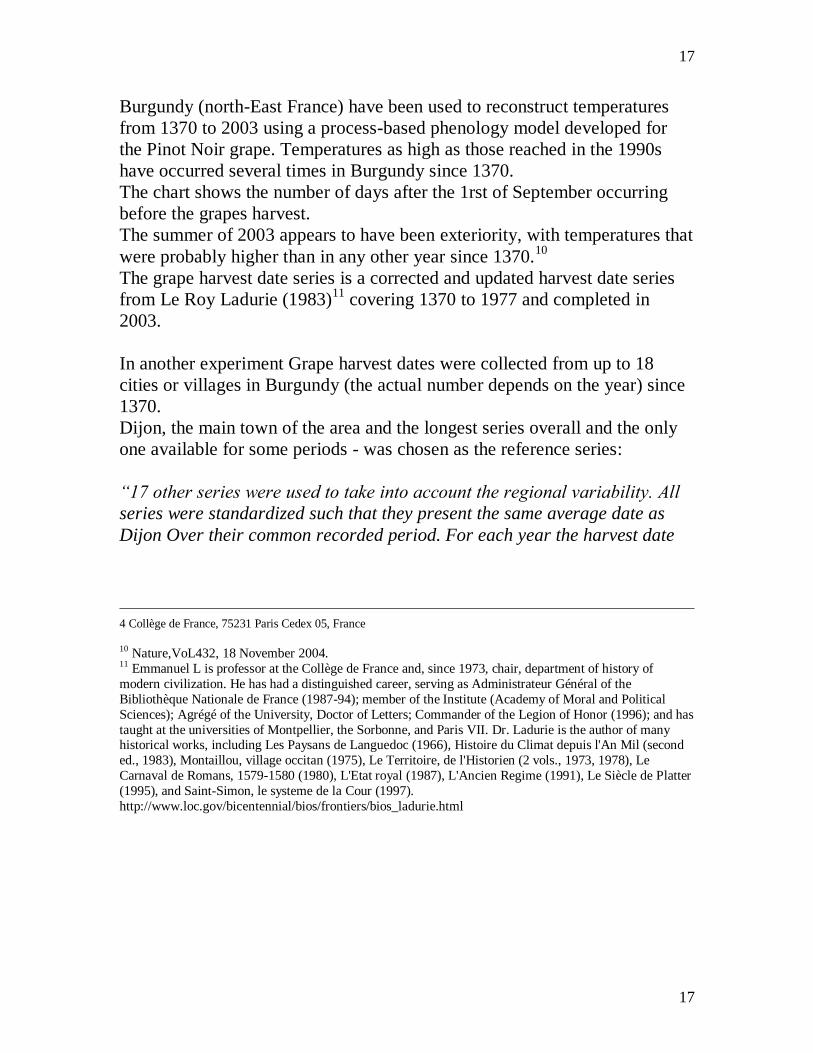
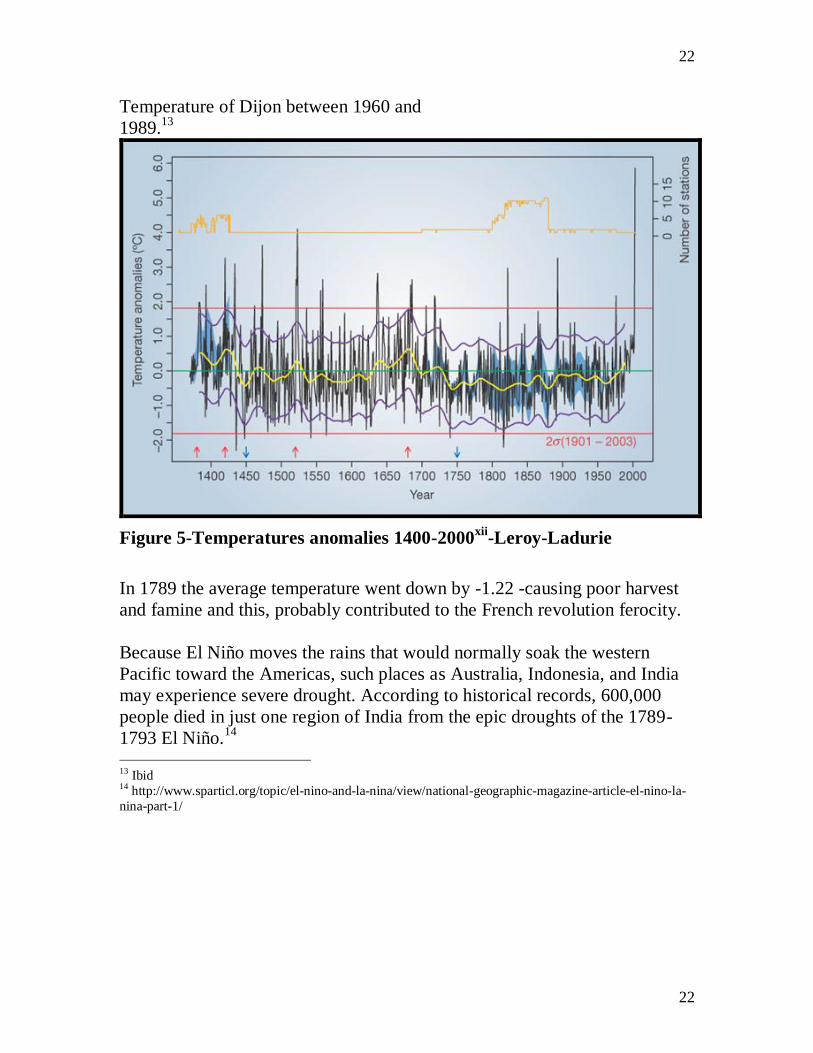
Temperature of Dijon between 1960 and
1989.13
Figure 5-Temperatures anomalies 1400-2000xii
-Leroy-Ladurie
In 1789 the average temperature went down by -1.22 -causing poor harvest
and famine and this, probably contributed to the French revolution ferocity.
Because El Niño moves the rains that would normally soak the western
Pacific toward the Americas, such places as Australia, Indonesia, and India
may experience severe drought. According to historical records, 600,000
people died in just one region of India from the epic droughts of the 1789-
1793 El Niño.14
13 Ibid 14 http://www.sparticl.org/topic/el-nino-and-la-nina/view/national-geographic-magazine-article-el-nino-la-
nina-part-1/

23
23
Figure 6-Bordeaux wines location

24
24
Figure 7-Richard II meet rebels 1381

25
25
Figure 8- Mayor kills Wat Tyler leader of the rebels
The 1381 famine and revolt: During the Peasants' Revolt of 1381, rebels
from Kent stormed London in rebellion against King Richard II. This
illustration (from British Library Royal MS 18, dated c. 1385-1400) depicts
two events at once. In the right half of the illustration, the young Richard
rides out to meet the rebels at Smithfield; in the left half of the illustration,
the Mayor of London kills Wat Tyler, the leader of the rebels, while Richard
watches on.15
15 http://home.gwu.edu/~jhsy/pr.html

26
26
LITTERATURE REVIEW
A team16
from the National Centre of Competence in Research on Climate
(NCCR) and Institute of Geography, University of Bern, Bern, Switzerland
and the Oeschger Centre for Climate Change Research, University of Bern,
Bern, Switzerland studied the
the swiss grapes harvest record17
. Grape harvest dates were used as a proxy
for April to August temperature reconstructions back to AD 1480 18
16 Nicole Meier1, This Rutishauser1, Christian Pfister 2, 3, Heinz Wanner1, 3 and Jürg Luterbacher1, 3
17 http://lwf.ncdc.noaa.gov/paleo/pubs/meier2007/meier2007.html 18 Geophysical Research Letters, VoL34, L20705, doi:10.1029/2007GL031381.

27
27
This record is based on the assumption that a late harvest (as compared with
the average date of 1961-1990) represents a cold year, an early harvest a
warm year. Swiss Grape Harvest Dates and Spring/Summer Temperature
Reconstruction19
ORIGINAL REFERENCE:20
Meier, N., T. Rutishauser, C. Pfister, H. Wanner, and J. Luterbacher. 2007.
Grape harvest dates as a proxy for Swiss April to August temperature
reconstructions back to AD 1480. Geophys. Res. Lett., 34, L20705,
doi:10.1029/2007GL031381.
GEOGRAPHIC REGION: Switzerland
PERIOD OF RECORD: 1480 - 2006 AD
FUNDING SOURCES: Swiss National Science Foundation (project "Past,
Present and Future Climate Impact on spring and Summer Vegetation – a
Phenological Approach"
In Research on Climate (NCCR-Climate), projects PALVAREX and
CAPRICORN
And the Oeschger Centre for Climate Change Research21
.
The Annual median grape harvest dates for 15 locations in the Swiss Plateau
region and north-western Switzerland, plus phonological reconstruction of
April - August temperature.22
19 World Data Center for Paleoclimatology, Boulder and NOAA Paleoclimatology Program 20Swiss Grape Harvest Dates and Spring/Summer Temperature Reconstruction. - IGBP PAGES/World Data Center for
Paleoclimatology - Data Contribution Series # 2008-015.
NOAA/NCDC Paleoclimatology Program, Boulder CO, USA.
21 Ibib : The publication is fincially supported by the Foundation Marchese Francesco Medici del Vascello. 22 Meier, N., et aL 2008.

28
28
The team presented a record of grape harvest dates for Switzerland in ordre
to study The relationship between grape harvest dates and temperatures and
aptempt a reconstruction back to 1480.
A Calibration (1928-1979) was performed with monthly data from the Basel
and Geneva stations and verified over 1980-2006. Twelve days of grape
harvest difference correspond to around 1ºC April-August temperature
difference.
Periods cooler (late grape harvest dates) than the 1961-1990 mean are
reconstructed during the 17th century and at the beginning of the 19th
century.
Warmer conditions were experienced in the early 18th century and
during the recent decades, in agreement with grape harvest
temperature reconstructions from France and other independent
temperature estimates.
The earliest harvests were in the 1580s (2003) and the latest vintages
in the 1740s (1816).
Large tropical volcanic eruptions led to significantly later grape
harvest dates (cooling) one to two years after the event. (see 1816 : -
2.23º)
H STR R DU C M T D PU S ’ M - EMMANUEL LE ROY
LADURIE
Emmanuel Le Roy Ladurie is Professor of Modern History at the Collège de
France23
. He has had a distinguished career, serving as Director of the
23 The Collège de France is a higher education and research establishment located in Paris, France, in the
5th arrondissement, or Latin Quarter, across the street from the historical campus of La Sorbonne. It was
created in 1530 at the request of King Francis I of France.

29
29
Bibliothèque Nationale de France (1987-94); member of the Institute
(Academy of Moral and Political Sciences); and has taught at the
universities of Montpellier, in the south of France and at the prestigious
Sorbonne university, inParis.
Professor Le Roy Ladurie is the author of many historical works, including
Les Paysans de Languedoc (1966), Histoire du Climat depuis l'An Mil
(second ed., 1983), Montaillou, village occitan (1975), Le Territoire, de
l'Historien (2 vols., 1973, 1978), Le Carnaval de Romans, 1579-1580
(1980), L'Etat royal (1987), L'Ancien Regime (1991), Le Siècle de Platter
(1995), Saint-Simon, le systeme de la Cour (1997) and Histoire humaine et
comparée du climat (2004).xiii
Ladurie was a student of Fernand Braudel, and he is one of the greatest
French historians in the twentieth century and is acknowledged in the fields
f v m c h y. “H c m p ’
m ”(1967) b c m c f p f g f h c
climatologists24
.
After his retirement Leroy updated his history of climate.
In 2004 he produced the first part of a account of the history of weather and
climate in Western and Central Europe during the last millennium. His
Histoire du climat (1967) draws evidences from glaciers and vine harvest
dates and construct a picture of long term changes in climate (Little ice age)
. He also looks for impacts of climate on human societies and maintained
that people adapt to a changing climate. On a less positive note his influence
may have slowed some from taking action against climate change.
24 translated into English in 1971

30
30
THE FRENCH BORDEAUX RECORD
The area of Bordeaux in south West France, produce some of the finest and
most expansive wine on the planet. The climate is mild and fairly humid.
The summers are often hot, but as the record show it is very variable from
one year to another. These records have been compiled over the century by
the wine grower of the area.25
25 Contributed by Dr Emile Peyud and Messrs Daniel Lawton and Alain Blanchy, Bordeaux wine brokers from their
persol archives.

31
31
A
DOMAINE HAUT BRION26
General information on Bordeaux vintages
followed by statistical information:27
This figure in millimeters shows the amount of
rainfall in the Bordeaux region for the same period.
The average is 405 mm.
The wettest year was 1992: 697 mm.
The driest year was 2005: 229 mm.
26 http://www.haut-brion.com/home/downloads/la-mission-haut-brion-en.pdf 27 The notes on the vintages m k p b g g h f c f h y ’ w h on the various vintages.

32
32
Blason- note the lion, similar to the English Lion. In fact this is where
the English lion comes from.
THE YEAR OF THE COMET -1811
Total production Gironde28
This figure represents, in millions of hectoliters, the amount of wine
produced in the Gironde department - a hectoliter (hl) = 100 liters).
The smallest harvest: 1885 (1.07 million hectoliters).
The biggest harvest: 1922 (7.19 million hectoliters).
THE RECORDS
1798 An outstanding year -The harvest was not plentiful, but of
exceptional quality.
1811 An outstanding year- The year of the comet. An abundant and
truly exceptional h v , k w “ h w f h c m ”.29
1874 An outstanding year - Perfect weather for the vines. Genuinely
remarkable in quality with a large yield. 30
1899 An outstanding year a very fine outcome. All the wines were
excellent. Total production Gironde: 3.47 million hl
1900 An outstanding year- The first year of the new century! Very
similar to 1899. Total production Gironde: 5.73 million hl
28 Bordeaux modern adminitratives area, corresponding to a county 29 http://en.wikipedia.org/wiki/C/1811_F1 30 P c ch v v b f : 5,500 f c (500 €) p b f h Premiers Crus and
6,000 francs (600€) f Yq m. T p c G : 5.11 m h
33
33
1906 A very good year. Total production Gironde: 3.50 million hl
1918 A very good year .A very healthy year as well . Total production
Gironde: 3.81 million hl
1920 A good years-A success in general, Most of the 1920 vintage-
aged very quickly. Total production Gironde: 3.86 million hl
1921 A good year - A vintage of fine repute. Unfortunately, the very
hot weather during harvesting prevented an all-round success. Total
production Gironde: 3.84 million hl
1922 An average year- Overall record production since harvests have
been chronicled (around 1800). Total production Gironde: 7.19
million hl
1923 An average year .A good vintage that aged too quickly - Total
production Gironde: 4.91 million hl
FROM THEN ON THE RAINFALL HAS BEEN NOTED31
1924 A good year. Rainfall: 361 mm. Total production Gironde: 5.60
million hl
1925 A lesser year, poor .Rainfall: 338 mm. Total production
Gironde: 5.15 million hl
FROM THEN ON THE DATE OF THE HARVEST HAVE BEEN ADDED
31 Although some data are missing

34
34
1926 A very good year- Rainfall: 393 mm Total production Gironde:
2.91 million hl- Date of the harvest: 4th to 11th October.
1927 A lesser year- A very second-rate year. Rainfall: 467 Total
production Gironde: 4.01 million hl
1928 A very good year. Total production Gironde: 4.69 million hl
1929 An outstanding year A hot year, with extensive drought (the
driest year since the start of the century), Rainfall: 225 mm - Total
production Gironde: 4.57 million hl
1930 A lesser year- cool, wet summer weather which was not
conducive to sufficient ripeness. Rainfall: 417 mm. Total production
Gironde: 2.54 million hl
1931 A lesser year-This year was cold and extremely wet. August was
a catastrophe and September poor.
1931 in the Médoc and the Blaye area. A difficult year. Rainfall: 488
Total production Gironde: 3.82 million hl
1932 A lesser year-A relatively cold year which was exceedingly-
wet, holding the record for precipitation: 677 mm in 7 months. It was
difficult to surmount crop diseases and all the wines were of poor
quality. Rainfall: 677 mm - Total production Gironde: 3.62 million
hl32
32 The Holodomor famine that took place in Soviet Ukraine during the 1932-1933 agricultural season when
the devastating famines also took place in several other regions of the USSR. The Holodomor ravaged the
rural population of the Ukrainian SSR, and is considered one of the greatest national catastrophes to affect
the Ukrainian nation in modern history. Estimates for the total number of casualties within Soviet Ukraine
35
35
1933 An average year- A hot but wet year. Few good wines were
produced and this vintage left no lasting memories. Rainfall: 427 mm
Total production Gironde: 3.36 million hl
1934 A very good year- wonderful summer. In terms of rainfall, this
year was normal and was also the vintage of both quality and quantity.
Second highest yield after 1922. Rainfall: 326 Total production
Gironde: 6.84 million hl
1935 An average year, comparable to 1938 and 1939- Rainfall: 326
mm-Total production Gironde: 4.39 million hl
1936 A lesser year- Rainfall: 349 Total production Gironde: 3.28
million hl
1937 A very good year- A very hot year with average rainfall -
Rainfall: 382 mm-Total production Gironde: 3.33 million hl- A
terrible hail storm in June wiped out almost all of the harvest - the
production volume was very low.
1938 An average year. Dry summer- Rainfall: 275 Total production
Gironde: 3.45 million - small harvest, c by h p v y ’
hail storm. - Date of the harvest: 26th September to 7th October.
range between 2.2 million and 3-3.5 million 4.5 to 5 million in the Encyclopedia Britannica , and much
higher figures - up to 20 million - in political debates

36
36
THE WORLD WAR II WINES
1939 An average year- clement weather for the harvest was however
disturbed by the eruption of World War II. (September 1939) -
Rainfall: 303 mm total production Gironde: 6.03 million hDate of the
harvest: 5th to 16th of October.
1940 An average year with above average rainfall; generally
comparable to the 1926 vintage. Rainfall: 339 mm Total production
Gironde: 3.03 million hl- Date of the harvest: 26th September to 5th
October.
Figure 9-John Lennon 1940-1980

37
37
1941 A lesser year- A very wet and cold year. Few good wines
produced. Rainfall: 536 mm Total production Gironde: 2.68 million hl
1942 An average year- Above average yet wet. Hopes for this vintage-
were disappointed, since most wines were harsh.- Rainfall: 414 Total
production Gironde: 2.47 million hl
1943 A good year- A very good, very hot and relatively dry year. The
onslaught of war was detrimental to this vintage, and therefore one
was not able to extract all of its promising potential quality. An early
year with full flowering on the 29th of May. Rainfall: 282 mm Total
production Gironde: 3.29 million hl
1944 An average year- This year was blessed with good weather-. It
was a good year on the whole, yet the wines are relatively modest. -
Rainfall: 302 Total production Gironde: 4.63 million hl
1945 An outstanding year- Victory year. Early growth occurred, but it
snowed on the 2nd of May in Bordeaux, leading to a hard frost which
wiped out 80% of the harvest. A very hot and especially dry summer
made the grapes extremely concentrated. Rainfall: 253 mm Total
production Gironde: 1.48 million hl
Figure 10-Liberation-
History.com
THE POST WAR YEARS

38
38
1946 An average year- This year was average, but the grapes did not
ripen welRainfall: 261 Total production Gironde: 2.88 million hl
1947 An outstanding year- hottest summer in 50 years and part of a
cycle of dry years (45, 46, 47 and 49). Drought - a scourge of
grasshoppers throughout south-west France and even in Bordeaux. 42
days of intense heat - water was rationed in the department of the
Gironde. An extraordinarily powerful wine. Rainfall: 259 Total
production Gironde: 4.17 million hl
1948 An average year - Rainfall: 315 mm - Total production Gironde:
3.2 million hl
1949 An outstanding year- This year was dry, but above all very hot.
A great vintage, but one in which the winemaking process proved
difficult due to the high temperatures. The quality of the vintage was
generally first-rate. A wine of exceptional power. Rainfall: 286 Total
production Gironde: 3.1 million hl

39
39
FROM THEN ON THE NUMBER OF DAYS ABOVE THE
T MP R TUR F 30˚ S T D
1950 A good year. Rainfall: 317 Total production Gironde: 5.5
million hl- Number of days above 30°C: 18.
1951 A lesser year- This second-rate year was relatively cold and
rainy, giving wines lacking character and body. Rainfall: 471 Total
production Gironde: 3.6 million hl - Number of days above 30°C : 6.

40
40
1952 A good year. It all started with the signs of a wonderful vintage:
very hot in June (20.5°C) July (20.6°C) and August (20.6°C). From
the 4th
of September, rain and cold for 28 days in September. Not a
great vintage. Rainfall: 321 mm Total production Gironde: 3.5 million
hl- Number of days above 30°C: 18.
.
1953 A very good year- This is an August vintage, which was a
fabulous month, boasting 15 mm of rainfall and 15 days above 30°C
(86°F):. The September weather was more inclement and the harvest
was marked by rain. Great vintage- Rainfall: 300 Total production
Gironde: 5.5 million hl Number of days above 30°C/86°F: 14. Date of
the harvest: 29th September to 12th October.
1954 -33
A lesser year- very cold and relatively rainy year: July as 3°C
below average and August 2°C below. This was one of the coldest
years since the beginning of the century. A very uneven vintage but
very attractive wine. Rainfall: 319 Total production Gironde: 3.9
million hl- Number of days above 30°C: 3. Date of the harvest: 7th to
18th of October.
1955 A very good year- A glorious year. In fact, the rainfall pattern
was ideal, with June and July rainy, followed by a very hot and dry
August and dry September; ideal conditions for harvesting. Very good
wines comparable to 1949-Rainfall: 415 - Total production Gironde:
5.5 million hl- Number of days above 30°C: 13. Date of the harvest:
28th September to 10th October.
1956 A lesser year - a dramatic winter: -20°C- in February
accompanied by severe snowfalls (80 cm/2.6’) wh ch p yz h
33 1954 Greenland's coldest temperature on record; a reading of -66C is read during the British Greenland
Expedition at Northice (78.04N, 38.29W). http://wmo.asu.edu/western-hemisphere-lowest-temperature

41
41
region and its business. Many vines were wiped out by the cold. The
Garonne River partially iced over. Summer was cold and rainy (July:
112 mm; August: 104 mm). Rainfall: 456 Total production Gironde:
2.1 million hl - Number of days above 30°C: 4. Date of the harvest:
11th to 20th of October.
1957 An average year-Rainfall: 333 Total production Gironde: 2
million hl- Number of days above 30°C: 11. Date of the harvest: 1st to
12th October.
1958 A lesser year- A tragic month of August, during which 126 mm
of rain fell (more than twice the average). But it was followed by good
weather in September. At harvest time, six very hot days. Rainfall:
544 mm Total production Gironde: 2.9 million hl Number of days
above 30°C/86°F: 8. Date of the harvest: 6th to 18th of October. An
attractive bottle today. The wine remains a young wine. Deep colour,
complex wine. Ripe and smooth tannin. A marvelous, very La
Mission wine
1959 An outstanding year - The best year of the century. Harvest time
was very hot. Rainfall: 497 mm Total production Gironde: 3.0 million
hl Number of days above 30°C/86°F: 11. Date of the harvest: 24th
September to 3rd October.
1960 An average year. A very early year: full flowering occurred on
the 30th of May in Gironde. However, the summer was cold and wet,
with hardly any hot days at all: one in July, one in August, and none in
a cool month of September during which 177 mm of rain felRainfall:
489 Total production Gironde: 3.99 million hl- Number of days above
30°C: 5. However, very good wine for this vintage. Date of the
harvest: 19th to 29th September.

42
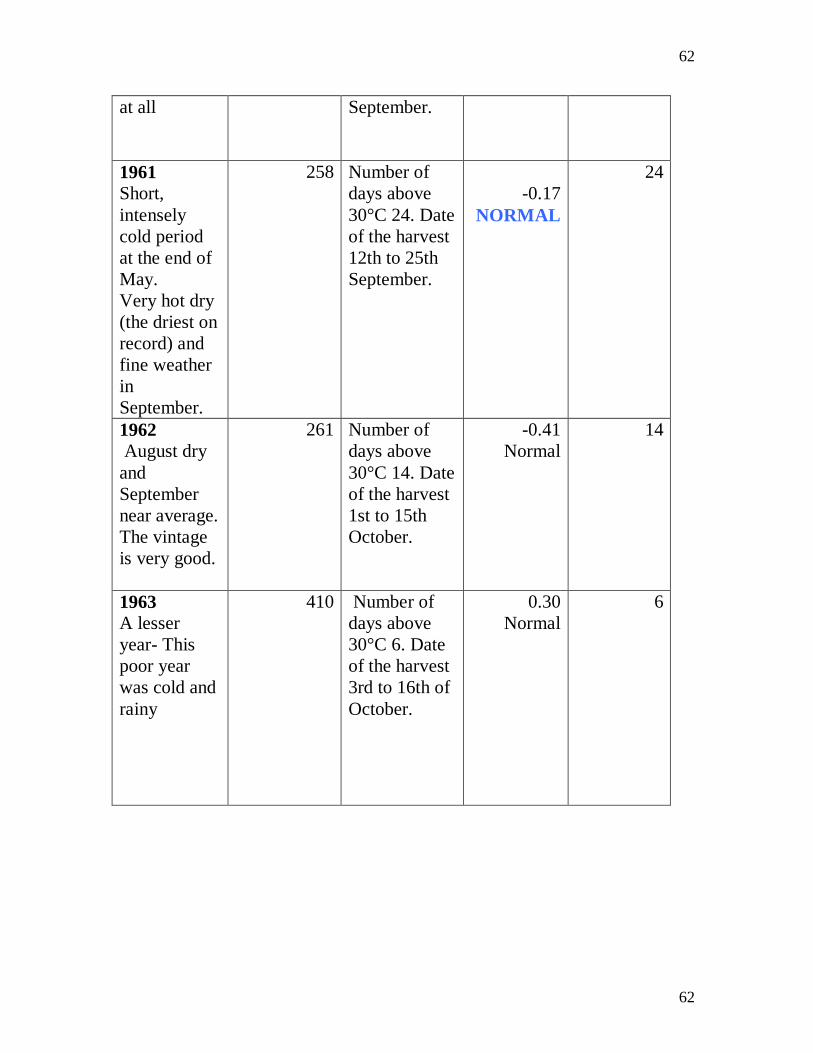
42
1961 An outstanding year. The best vintage since the start of the
century: A short, intensely cold period at the end of May. The very
hot, but especially very dry summer (the driest on record) and fine
weather in September. Rainfall: 258 Total production Gironde: 2.78
million hl- Number of days above 30°C: 24. Date of the harvest: 12th
to 25th September.
1962 A good late year: the onset of ripening occurred around the 22nd
of August and the harvest in October. June was dry, July normal,
August dry, and September near average. The vintage is very good.
Rainfall: 261 Total production Gironde: 5.55 million hl Number of
days above 30°C: 14. Date of the harvest: 1st to 15th October.
Figure 11- Brigitte Bardo in 1963 - Born 1934- A good year for wine!
And for women too
1963 A lesser year- This poor year was cold and rain. Rainfall: 410
mm Total production Gironde: 4.98 million hl - Number of days
above 30°C: 6. Date of the harvest: 3rd to 16th of October.

43
43
1964 A very good year of early growth and good weather. June and
July were dry and hot; there were storms in August and hot weather in
September. It started to rain on the 5th
of October and continued for
three weeks. Rainfall: 301 Total production Gironde: 4.99 million hl-
Number of days above 30°C: 20. Today, the wine is excellent. Date of
the harvest: 28th September to 6th October.
1965 A lesser year- This year saw near normal months of August and
July (not very hot, yet with almost average rainfall – 42 mm in August
against an average of 50 mm), but a catastrophic September in which
212 mm of rain fell : 3 times the normaThe result was very dubious.
Rainfall: 461 mm - Total production Gironde: 4.12 million hl-
Number of days above 30°C: 8. Date of the harvest: 1st to 10th
October.
1966 A very good year- much rain in June, 1966 gradually turned out
to be a great vintage. The hot weather in August and dry and very hot
September determined quality34
. Rainfall: 373 Total production
Gironde: 4.55 million hl- Number of days above 30°C: 8. Date of the
harvest: 23rd September to 5th October.
34 This unusual heat caused the fire which ravaged the Calvet cellars on the 7th of September 1966.
44
44
Figure 12- Belfast musician David Mcwillams had a hit with "Days of
pearly Spencer"
1967 A good year- This year was normal and dry- Rainfall: 283 Total
production Gironde: 4.93 million hl- Number of days above
30°C/86°F: 12. An excellent wine for this vintage. Date of the harvest:
25th September to 4th October.
1968 A lesser year- Late growth but normal temperatures marked this
year. The months of August and September were very rainy, with 161
mm and 97 mm respectively. The grapes were impaired long before
the harvest. Few good wines were produced this year. Rainfall: 568
Total production Gironde: 4.89 million hl- Number of days above
30°C/86°F: 8. - Date of the harvest: 27th September to 7th October.
THE SUMMER OF LOVE 1969

45
45
Janis Joplin Cover 35
Janis was born in 1943 and much like the wine of that year, was not able
to extract all of her promising potential quality (see 1943 wine comments
above)
1969 A lesser but normal year: July hot and dry, as was August-
September very rainy (206 mm of rain fell in 23 days).Rainfall: 585
mm - Total production Gironde: 3.16 million hl- Number of days
above 30°C/86°F: 12.- A very harmonious wine. Date of the harvest:
25th September to 4th October.
1970 A good year- (just 12 very hot days), summer dry and September
pleasant. This produced a plentiful harvest of very high quality. The
region produced excellent wines across the board - Rainfall: 279 Total
35 Scan of part of the Vinyl cover- Fair use – from wikipedia

46
46
production Gironde: 5.49 million hl Number of days above 30°C: 12.
Date of the harvest: 25th September to 2nd October.
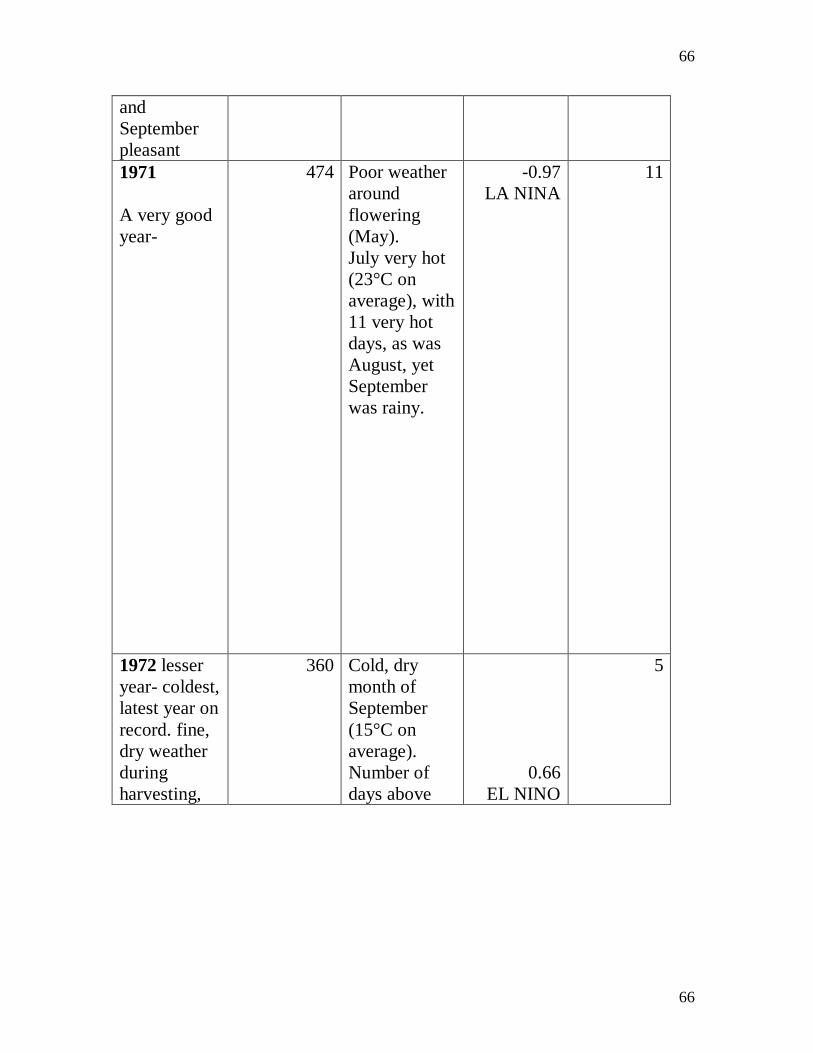
1971 A very good year- poor weather around flowering (May). July
very hot (23°C/73.4°F on average), with 11 very hot days, as was
August, yet September was rainy. Rainfall: 474 mm Total production
Gironde: 3.73 million hl –
Number of days above 30°C/86°F: 11. - Date of the harvest: 28th
September to 4th October.
1972 A lesser year- coldest, latest year on record. Fine, dry weather
during harvesting, lack of sunshine - cold, dry month of September
(15°C on average). Rainfall: 360 Total production Gironde: 3.96
million hl- Number of days above 30°C/86°F: 5. - Date of the harvest:
8th to 14th of October.
1973 An average year 1973 witnessed a very hot August
(22.8°C/73.04°F on average), the hottest since 1949, but July was very
rainy (w h 114 mm/4.49” f ) w September. Rainfall: 369
mm-Total production Gironde: 5.63 million hl- Number of days above
30°C: 18. Date of the harvest: 26th September to 6th October.
1974 An average year - hot or normal months of June and August.
July normal- rains in September (100 mm) along with the cold. The
wines were very good. Rainfall: 359 Total production Gironde: 5.47
million hl- Number of days above 30°C: 14. Date of the harvest: 29th
September to 10th October.
1975 A very good year- June and July were very hot, but September
was more variable. The weather was good during harvesting. Rich,
powerful wines- Rainfall: 325 Total production Gironde: 4.20 million

47
47
hl- Number of days above 30°C/86°F: 15. - Date of the harvest: 25th
September to 8th October.
1976 A good year- Record temperatures were logged for a year that
was the hottest of the last twenty-seven and extremely dry in April (22
mm of rain), June (7 mm/.27”), J y (45 mm/1.77”) August (72
mm/3.03”), wh ch b gh strong storms. Alas, September was
rainy (98 mm/3.85”), R f : 427 mm-Total production Gironde:
5.50 million hl- Number of days above 30°C/86°F: 27. Date of the
harvest: 13th to 24th September.
1977 An average year- Hard frosts at Easter (10th of April). This was
a fairly cold year- erratic weather. Rainfall: 433 mm-Total production
Gironde: 2.48 million hl-Number of days above 30°C: 0. Date of the
harvest: 6th to 16th of October.
1978 A good year- very wet winter and cool, moist spring, a beautiful
summer with 12 very hot days. Dry and fine weather in autumn. The
wines were a great success. Rainfall: 337 mm-Total production
Gironde: 3.96 million hl-Number of days above 30°C: 11.-Date of the
harvest: 5th to 14th of October.
1979 A very good year- wet spring, hot summer in July, cool in
August, but dry weather overal3 very hot days. Rainfall: 427 Total
production Gironde: 6.20 million hl- Number of days above 30°C:
11.a powerful wine. Date of the harvest: 1st to 11th October.
1980 An average year- wet and cold spring - high winds. Fine weather
in September allowing the harvest to take place in good conditions.
Rainfall: 394 Total production Gironde: 3.66 million hl- Number of
days above 30°C: 8. Date of the harvest: 6th to 18th of October.
48
48
1981 A good year- average spring- several very hot days in June.
August was very hot and dry, with constant winds from the north.
September satisfactory apart from some rain before harvesting. The
weather was good during harvesting.-Rainfall: 309 - Total production
Gironde: 4.00 million hl- Number of days above 30°C: 13 - Date of
the harvest: 24th September to 8th October.
Figure 13-The wall- 1982 Album by Pink Flyod

49
49
198236
An outstanding year- dry in April, fine and dry in May, a few
storms in June, before a sunny and hot month of July - on the 8th of
this month the temperatures reached 40°C. August was cooler, but the
weather was fine, and even more so during harvesting. These were
ideal conditions for a great wine. Rainfall: 402 mm. Total production
Gironde: 5.96 million hl - Number of days above 30°C/86°F: 16. A
superb vintage. Date of the harvest: 15th to 24th September.
1983 A good year- A very wet- spring -dry hot month of June - very
hot July, with 2 weeks of extreme heat but also storms, hail on the 3rd
and 4th of July. August was hot and wet, almost tropical - The
weather was good during harvesting. Rainfall: 477 mm Total
production Gironde: 5.1 million hl- Number of days above 30°C/86°F:
21. Date of the harvest: 26th September to 7th October.
1984 An average year- wet, cool spring, a hot dry July with 8 very hot
days. Normal weather in autumn. Rainfall: 422 Total production
Gironde: 3.5 million hl - Number of days above 30°C/86°F: 13.
Harmonious, well structured Date of the harvest: 27th September to
12th October.
1985 A very good year- exceptional autumn and very dry year, one of
the driest of the century: the grapes even started to wither on the vines
at the beginning of September. Several days of early morning- fog in
late September. Rainfall: 368 mm - Total production Gironde: 5.4
million hl - Number of days above 30°C/86°F: 17. An extraordinary
wine. Date of the harvest: 23rd September to 8th October.
1986- A good year- Spring cold, but as of June the fine weather
helped flowering. After a hot and especially dry summer, the good
36 El Chichon eruption - April 1982, Mexico, did not seems to have had an influence on the French climate
at all, it was a good warm year at least in the summer

50
50
weather at harvesting. Rainfall: 386 mm Total production Gironde:
6.7 million hl- Number of days above 30°C/86°F: 18. Good very
tannic wine. Date of the harvest: 29th September to 10th October.
1987- An average year- irregularity- However, September outstanding
with 10 days above the 30°C (86°F) mark. Rainfall: 353 mm Total
production Gironde: 5.26 million hl- Number of days above
30°C/86°F: 24.A very pleasant wine. Date of the harvest: 28th
September to 13th October.
1988 - A very good year - wetness and mildness in winter and spring -
dry and relatively warm summer. Some rain fell in September
.Rainfall: 365 Total production Gironde: 4.99 million hl- Number of
days above 30°C/86°F: 11. This is an exceptionally colorful and
tannic wine; this vintage does not seem to bear resemblance to recent
years. The greatest similarity is over the last thirty years: 1966. Date
of the harvest: 28th September to 14th October.
1989 A very outstanding year- especially warm, sunny and dry. An
outstanding wine. Rainfall: 359 mm Total production Gironde: 6.50
million hl -Number of days above 30°C/86°F: 22. Harvesting took
place in August for the white wine and started on the 31st of the same
month for the red. Date of the harvest: 29th August to 20th
September.
1990 An outstanding year - mild winter - early budding. Spring was
cool, summer months were amongst the hottest and driest on record. A
little rain in September. Rainfall: 291 mm Total production Gironde:
6.81 million hl - Number of days above 30°C/86°F: 31. The wine has
dense tannic structure- Date of the harvest: 4th to 28th September.
1991 A good year- springtime frosts. Early budding in late February,
terrible frosts struck on the night of the 20th and 21st of April (the

51
51
cold lasted throughout the night, reaching -7°C in certain vineyards.
July and August were very hot and dry. Harvesting took place in hot
but rainy weather. Rainfall: 473 Total production Gironde: 2.70
million hl -Number of days above 30°C/86°F: 22. The wine is first-
rate- Date of the harvest: 24th September to 8th October.
1992 - An average year- A dry winter -dry, hot month of May, then a
wet June for flowering. July and August hot, but the latter brought
with it much rain- mildew and botrytis. Rainfall: 697 mm Total
production Gironde: 6.63 million hl- Number of days above
30°C/86°F: 20. j y b k v y ’ m . Date of the
harvest: 17th September to 7th October.
1993 A good year- Mildness in spring- early budding. Summer started
with dry but cool weather. August was fine, hot and dry. Rainfall: 655
mm Total production Gironde: 5.93 million hl -Number of days above
30°C/86°F: 15. Very fine Haut-Brion. Date of the harvest: 16th to
29th September.
1994 - A good year- early growth - mild winter. Spring was rather
cool and wet, slowing growth. A hot summer with some spectacular
storms. Rain in September. Rainfall: 623 mm Total production
Gironde: 5.67 million hl Number of days above 30°C: 27. Harmony
embodies this wine- Date of the harvest: 12th to 24th September.
1995 - A very good and early year. Winter gentle and spring hot and
dry. June, July and August high temperatures and lack of rain. Cooler
weather in September and heavy rains in the middle of the month.
Rainfall: 348 mm Total production Gironde: 6.53 million hl- Number
of days above 30°C: 30. This wine is brimming with tannic structure.
Date of the harvest: 11th to 26th September.

52
52
1996 –
A good year- inconsistency of the weather. No periods of sustained heat
apart from a few days in July. Rains towards the end of August. September,
good weather in the first half and a lot of rain in the second. Rainfall: 516
Total production Gironde: 6.41 million hl Number of days above 30°C: 23.
Temperatures and rainfall were above average this year. A very good wine
overal Date of the harvest: 16th September to 4th October.
1997
- An average year, a hot, dry start to the year led to exceptionally early
growth in the spring. There was unprecedented flowering on the vines at the
end of April. At the beginning of May, showers delayed the end of flowering
by more than a month. The September drought made for a trouble-free
harvest and compensated for the uneven ripening. Rainfall: 472 mm - Total
production Gironde: 6.68 million hl- Number of days above 30°C/86°F: 22.
Good harmony for this vintage. Date of the harvest: 16th September to 4th
October.
1998
A very good year- The rainfall was 3 times higher than the previous thirty-
year average. May dry, June normal, and July normal, two days of storms
produced heavy downpours. August was exceptionally hot, which gave a
great boost to the harvest. Rainfall: 537 - Total production Gironde: 6.58
million hl- A fine wine which will have to be waited for. Number of days
above 30°C: 21. Date of the harvest: 15th to 30th September.37
37 Meanwhile, back in North America, the jet streams that travel 5 to 8 miles [8 to 13 kilometers] above
h’ f c h f m c y. Th p j m y f h h over Canada than usual;
as a result, less cold air moves into the upper United States. In fact, northern-tier states saved an estimated
five billion dollars in heating costs during the 1997-98 El Niño. (http://www.sparticl.org/topic/el-nino-and-
la-nina/view/national-geographic-magazine-article-el-nino-la-nina-part-1/)

53
53
THE YEAR OF THE ECLIPSE OF THE SUN
Figure 14-eclipse 1999-
1999 A good year- The penultimate
year of this millennium was marked
by rare weather conditions. There was
a solar eclipse on the 11th of August.
Then, two very violent storms shook
the South-west: the one on the 7th of
August was furious but very short; the
other, on the 27th of December, was
exceptionally fierce, lasting from
sunset to the middle of the night. It
was on average a hot year, 2°C above
normal temperatures recorded in the
last 40 years. Rainfall: 567 mm -
Total production Gironde: 6.81
million hl- an exceptionally delightful
wine. Number of days above 30°C:
18. Date of the harvest: 30th August
to 24th September.
THE NEW MILLENNIUM
2000 - An outstanding year-A mild start, very wet, hot spring, dry,
scorching summer: Temperature records broken: 1.5°C above average.
September, hot and dry - conditions. Rainfall: 436 mm total
production Gironde: 6.80 million hl- An extraordinary wine. Number
of days above 30°C/86°F: 21. Date of the harvest: 13th to 29th
September.

54
54
2001 A very good year- Weather conditions were fairly similar to
those of 2000. July and August were very hot (22 days where
maximum temperatures exceeded 30°C/86°F), and only two days of
heavy rain were recorded between the 20th of July and 20th
of
September. At the start of harvesting the fruit was perfectly ripe and in
excellent health. During this time the weather stayed very clement,
generally hot and dry, except for two days of heavy storms on the
22nd of September and 3rd of October when harvesting was
suspended. Rainfall: 335 mm –Total production Gironde: 6.56 million
hl - All is mellowness, yet this wine should be left to age to reach its
peak. Number of days above 30°C/86°F: 32. Date of the harvest: 17th
September to 8th October.
2002 A good year- the year was very dry, but the low rainfall as well
spread out. A slightly cool summer delayed ripening, but conditions
became ideal for harvesting from the 9th of September onward:
relatively hot, sunny days, and an unusual north-easterly wind for the
season. Rainfall: 336 mm - Total production Gironde: 5.61 million hl-.
Number of days above 30°C/86°F: 14. Date of the harvest: 19th
September to 8th October. To drink ideally around: 2010/2020.
2003 An outstanding year 2003 was without a doubt a very
exceptional year in terms of the weather. Although it did not beat the
record for lowest rainfall, attained in 1961 (258 mm) for the period
April to September inclusive, 2003 comes immediately afterwards
with 263 mm. The hundred-year average is 410 mm and in the wettest
year; in 1992, 697 mm of rain felHowever, in terms of temperature, all
the records were broken. Accumulated average daily temperatures for
the above period were around 3,161, with the hottest year (1997) until
then reaching 3,494, but for 2003 the figure was 3,696; while the
average for very hot days above 30°C/86°F is 16, there were 49 in
2003, more than three times as many! Rainfall: 263 mm Total
production Gironde: 5.49 million hl Number of days above 30°C: 49.

55
55
Date of the harvest: 19th Aug. to 15th Sept. 2003-Seasons and
Vintages Seasons and Vintages
2004 A very good year- The year 2004 began with an extremely-rainy
month of January. In spite of this-marked humid start up, the year
2004 turned out to be short on the humidity factor. The flowering at
the beginning of June took place under perfect climate conditions and
was swift with a pleasing equilibrium. The August rain was for the
most part concentrated during the last two week. The picking of the
white grapes began on September 6th and the red grapes on
September 16th. Rainfall: 325 mm Total production Gironde: 6.66
million hl- Number of days above 30°C/86°F: 21. Date of the harvest:
6th Sept.-6th Oct.
2005 A very outstanding year 2005 will remain in our memories as a
historically dry year. A year of great heat and drought, this
characteristic showed up already in winter when an important deficit
of humidity was noted. In spite of a wet month in April, rain remained
scarce right up to the vendanges. All year long the temperatures
stayed on the high side. 2005 had climatic conditions very similar to
the legendary vintage of 1949. Because of these elements the vines
were able to produce small grapes of an extraordinary concentration,
actually never before achieved, that would be harvested in a perfect
condition. The vendanges started on August 24th for the whites and
on August 31st for the reds, placing the vintage alongside other years
with unduly early harvests. Rainfall: 229 mm Total production
Gironde: 6 million hl-Number of days above 30°C/86°F: 32. Date of
the harvest: 24th Aug.-26th Sept.
2006 - A year of contrasts and extremes. We have finished harvesting
our grapes at on September 29th. The harvest started on August 29th
with the picking of our white grapes. We started with the Sauvignons

56
56
and followed on with the Semillons on September 4th. After this, we
began harvesting our red grapes beginning with the Merlots on
September 7th and continuing on with the Cabernet Francs on
September 18th. On September 21st we began picking the Cabernet
Sauvignons 2006 was characterized by frequent climactic changes
shifting from one extreme to another. And this pattern continued on
until the end of the harvest. On Tuesday, October 3rd, we were
surprised in the early hours by a huge storm which approached in
intensity the one that hit us in 1999. Fortunately, the ferocity of the
winds did not last as long as in 1999. However, it was sufficiently
strong to bring down quite a number of trees in the park and gardensxiv
The 2007 vintage may the one of the extremes: we experienced
stressful weather last summer, an extremely long vegetative cycle
started very early in April and finished very late (with the harvest of
the cabernets-sauvignons mid-October), a historic Indian summer in
Bordeaux - September will remain the sunniest for the past 60 years. It
is the year of white wine.xv
La Nina years: 1904, 1908, 1910, 1916, 1924, 1928, 1938,
La Niña years: 1950, 1954- 1955, 1964, 1970, 1973, 1975, 1988, 1995 2007-
200838
El Nino years
1951, 1953, 1957-1958, 1965, 1969, 1972-1973, 1976, 1982-1983, 1986-
1987, 1991-1992, 1993-1994 and 1997-1998.39
2001-2002-2003, 2004-2005
and 2006-200740
Normal year : 1984-1985
38 http://www.publicaffairs.noaa.gov/lanina.html 39 http://www.oar.noaa.gov/k12/html/elnino2.html 40 http://en.wikipedia.org/wiki/La_Nina

57
57
YEARS Rainfall
in mm
comments Yearly
index of
average
yearly
temperature
NUMBER
OF DAYS
ABOVE 30
degree C

58
58
1950
A good year.
317 Production
5.5 million hl-
Number of
days above
30°C: 18.
-1.18
LA NINA
18
1951
wines
lacking
character and
body
471 Cold and
rainy,
production
3.6 M. hl -
Number of
days above
30°C: 6.
normal
-0.11
6
1952 not a
great vintage
A good year.
very hot
summer
From the 4th
of
September,
rain and cold
for 28 days
321 Number of
days above
30°C 18.
-0.04
Normal
18
1953
great vintage
A very good
300 Number of
days above
30°C 14. Date
0.36
14

59
59
year- August
vintage,
fabulous
month
of the harvest
29th
September to
12th October.
Normal
1954
Coldest years
since the
beginning of
the century...
rainy year.
but very
attractive
wine
319
July as 3°C
below average
and August
2°C below.
Days above
30°C: 3. Date
of the harvest
7th to 18th of
October.
-0.61
LA NINA
3
1955
great
vintage-
August
vintage,
which was a
fabulous
month
300 Number of
days above
30°C 14. Date
of the harvest
29th
September to
12th October.
-1.11
LA NINA
14

60
60
September
inclement
harvest was
marked by
rain.
1956
A lesser year
- Minus
20°C in
February a
dramatic
winter -
Many vines
were wiped
out by the
cold. cold
and rainy
456 Severe
snowfalls,
The Garonne
river partially
iced over.
(July 112;
August 104).
Number of
days above
30°C 4. Date
of the harvest
11th to 20th
of October.
-0.72
LA NINA
4
1957
An average
year-
333 Days above
30°C 11.
Harvest 1st to
12th October.
0.55
EL NINO
11

61
61
1958
A lesser
year- August,
126 of rain
fell (more
than twice
the average).
Good
weather in
September.
At harvest
time, six
very hot
days.
544 Number of
days above
30°C 8. Date
of the harvest
6th to 18th of
October... 0.66
EL NINO
8
1959
outstanding
year - The
best year of
the century.
Harvest time
was very hot
497 Days above
30°C 11.
Harvest 24th
September to
3rd October.
-0.02
NORMAL
11
1960 average
year.
Very good
wine. the
summer was
cold and wet,
with hardly
any hot days
489 Cool month
of September
177 of rain
felNumber of
days above
30°C 5.
Harvest 19th
to 29th
-0.14
NORMAL
5
62
62
at all September.
1961
Short,
intensely
cold period
at the end of
May.
Very hot dry
(the driest on
record) and
fine weather
in
September.
258 Number of
days above
30°C 24. Date
of the harvest
12th to 25th
September.
-0.17
NORMAL
24
1962
August dry
and
September
near average.
The vintage
is very good.
261 Number of
days above
30°C 14. Date
of the harvest
1st to 15th
October.
-0.41
Normal
14
1963
A lesser
year- This
poor year
was cold and
rainy
410 Number of
days above
30°C 6. Date
of the harvest
3rd to 16th of
October.
0.30
Normal
6

63
63
1964
A very good
year of early
growth and
good
weather.
June and July
were dry and
hot; storms
in August,
and hot
weather in
September
301 Number of
days above
30°C 20. Date
of the harvest
28th
September to
6th October.
-0.42
weak LA
NINA
20
1965
Normal
months of
August and
July (not
very hot) -
average –
catastrophic
September in
which 212 of
rain fell 3
461 The result
was very
dubious. -
Number of
days above
30°C 8. Date
of the harvest
1st to 10th
October.
0.49
Mild EL
NINO
8

64
64
times the
normal.
1966
A very good
year- much
rain in June,
1966
gradually
turned out to
be a great
vintage. The
hot weather
in August
and dry and
very hot
September
determined
quality
373 Number of
days above
30°C 8. Date
of the harvest
23rd
September to
5th October.
0.39
EL NINO
8
1967
A good year-
This year
was normal
and dry-
283
-0.33
NORMAL

65
65
1968
Lesser year.
Late growth
but normal
temperatures
marked this
year...
The months
of August
and
September
were very
rainy.
568
Number of
days above
30°C: 8.
-0.21
NORMAL
8
1969
A lesser but
normal year
July hot and
dry, as was
August-
September
very rainy
585 Number of
days above
30°C 12.-
206 of rain
fell in 23 days
0.69
EL NINO
12
1970
good year-
summer dry
279
12 very hot
days
-0.19
NORMAL
12
66
66
and
September
pleasant
1971
A very good
year-
474 Poor weather
around
flowering
(May).
July very hot
(23°C on
average), with
11 very hot
days, as was
August, yet
September
was rainy.
-0.97
LA NINA
11
1972 lesser
year- coldest,
latest year on
record. fine,
dry weather
during
harvesting,
360 Cold, dry
month of
September
(15°C on
average).
Number of
days above
0.66
EL NINO
5

67
67
lack of
sunshine -
30°C 5
1973
An average
year. a very
hot August
the hottest
since 1949,
369 July was
very rainy
as was
September.
Number of
days above
30°C 18.
-0.31
NORMAL
18
1974 average
year hot or
normal
months of
June and
August. July
normal- the
wines were
very good.
359 Rains in
September
(100)
along with
the cold.
Number of
days above
30°C 14.
-0.94
LA NINA
14
1975
very good
year- June
and July
were very
hot, but
September
325 Variable.
The
weather
was good
during
harvesting.
Rich,
powerful
wines-
Number of
days above
30°C 15
-1.04
LA NINA
15

68
68
1976
good year-
Record
temperatures
hottest of the
last 27 and
extremely
dry in April
427 Strong
storms.
September
was rainy
million hl-
Number of
days above
30°C 27.
-0.32
LA NINA
27
1977 average
year- Hard
frosts at
Easter This
was a fairly
cold year-
erratic
weather.
433 Number of
days above
30°C 0.
0.42
EL NINO
0
1978
Good year-
wet winter
and cool,
moist spring,
a beautiful
summer dry
and fine
weather in
Autumn.
337 Number of
days above
30°C 11.
-0.11
LA NINA
11
1979
A very good
year- wet
spring, hot
summer in
427
Number of
days above
30°C 11.a
powerful
wine.
0.14
11

69
69
July, cool in
August, but
dry weather
overal
EL NINO
1980 average
year- wet and
cold spring -
high winds.
Fine weather
in September
allowing the
harvest to
take place in
good
conditions.
394 Number of
days above
30°C 8. Date
of the harvest
6th to 18th of
October.
0.21
EL NINO
8
1981
Good year-
average
spring-
several very
hot days in
June. August
very hot and
dry, winds
from the
north.
September
rain before
harvesting.
The weather
good during
harvesting.
309 Number of
days above
30°C 13
-0.27
LA NINA
13
1982 402 August 0.73 16

70
70
outstanding
year- dry in
April, fine
and dry in
May, a few
storms in
June, before
a sunny and
hot July -
temperatures
reached
40°C.
cooler,
weather was
fine.
Number of
days above
30°C 16. Date
of the harvest
15th to 24th
September.
EL NINO
1983 good
year- A very
wet- spring -
dry hot
month of
June - very
hot July,
with 2 weeks
of extreme
heat but also
storms, hail
on the 3rd
and 4th of
July. August
was hot and
wet, almost
tropical -
477 Number of
days above
30°C 21. Date
of the harvest
26th
September to
7th October.
The weather
was good
during
harvesting.
0.8
EL NINO
21
1984 422 Number of -0.32 13

71
71
An average
year- wet,
cool spring, a
hot dry July
with 8 very
hot days.
Normal
weather in
autumn.
days above
30°C 13.
Harmonious,
well
structured
Date of the
harvest 27th
September to
12th October.
NORMAL
YEAR
1985 A very
good year-
exceptional
autumn and
very dry
year, one of
the driest of
the century-
fog in late
September.
368 N. of days
above 30°C
17. Date of
the harvest
23rd
September to
8th October.
-0.7
NORMAL
YEAR
17
1986
Good year-
Spring cold,
but as of
June the fine
weather
helped
flowering. A
386
Number of
days above
30°C 18.
Date of the
harvest 29th
September to
10th October.
Good weather
0.05
EL NINO
18
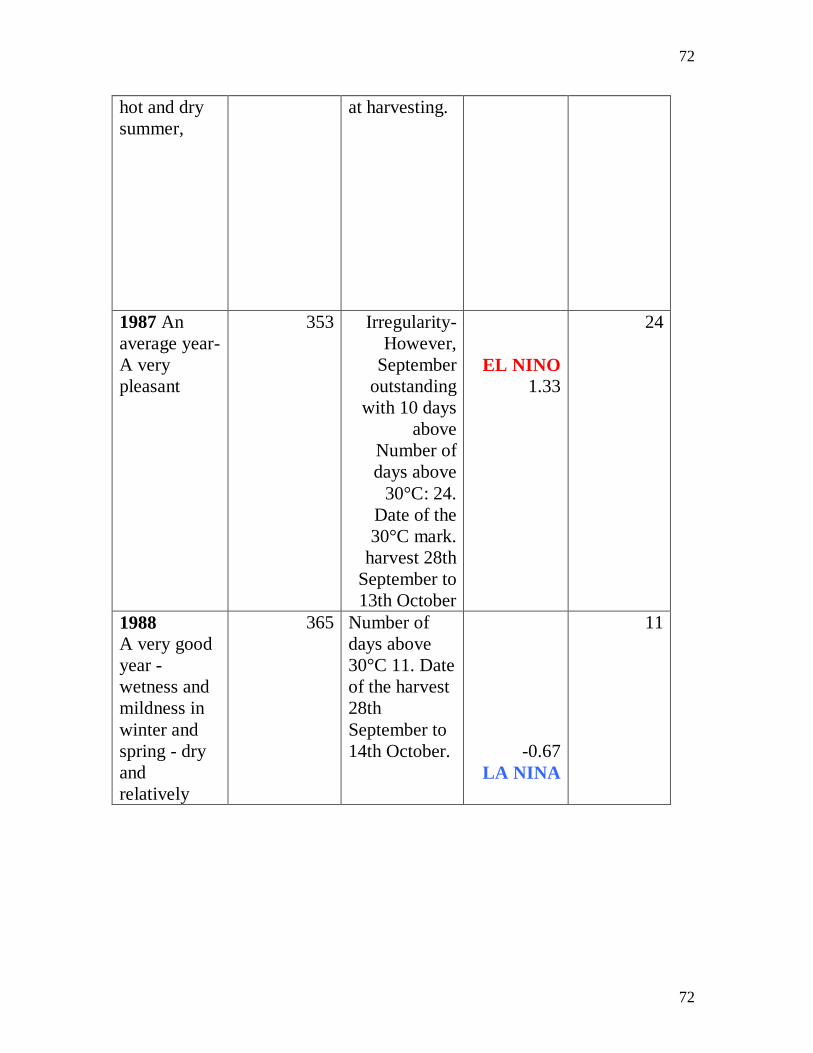
72
72
hot and dry
summer,
at harvesting.
1987 An
average year-
A very
pleasant
353
Irregularity-
However,
September
outstanding
with 10 days
above
Number of
days above
30°C: 24.
Date of the
30°C mark.
harvest 28th
September to
13th October
EL NINO
1.33
24
1988
A very good
year -
wetness and
mildness in
winter and
spring - dry
and
relatively
365 Number of
days above
30°C 11. Date
of the harvest
28th
September to
14th October.
-0.67
LA NINA
11

73
73
warm
summer.
Some rain
September
1989
outstanding
year-
especially
warm, sunny
and dry. An
outstanding
wine.
359 Number of
days above
30°C 22.
Harvesting
took place in
August for the
white wine
and started on
the 31st of the
same month
for the red.
Date of the
harvest 29th
August to
20th
September.
-0.81
LA NINA
22
1990 An
outstanding
year - mild
winter - early
budding.
Spring was
cool, summer
months .The
wine has
dense tannic
structure-
291 Amongst the
hottest and
driest on
record. A
little rain in
September.
Total
production
Number of
days above
30°C 31. Date
of the harvest
0.24
Normal
31
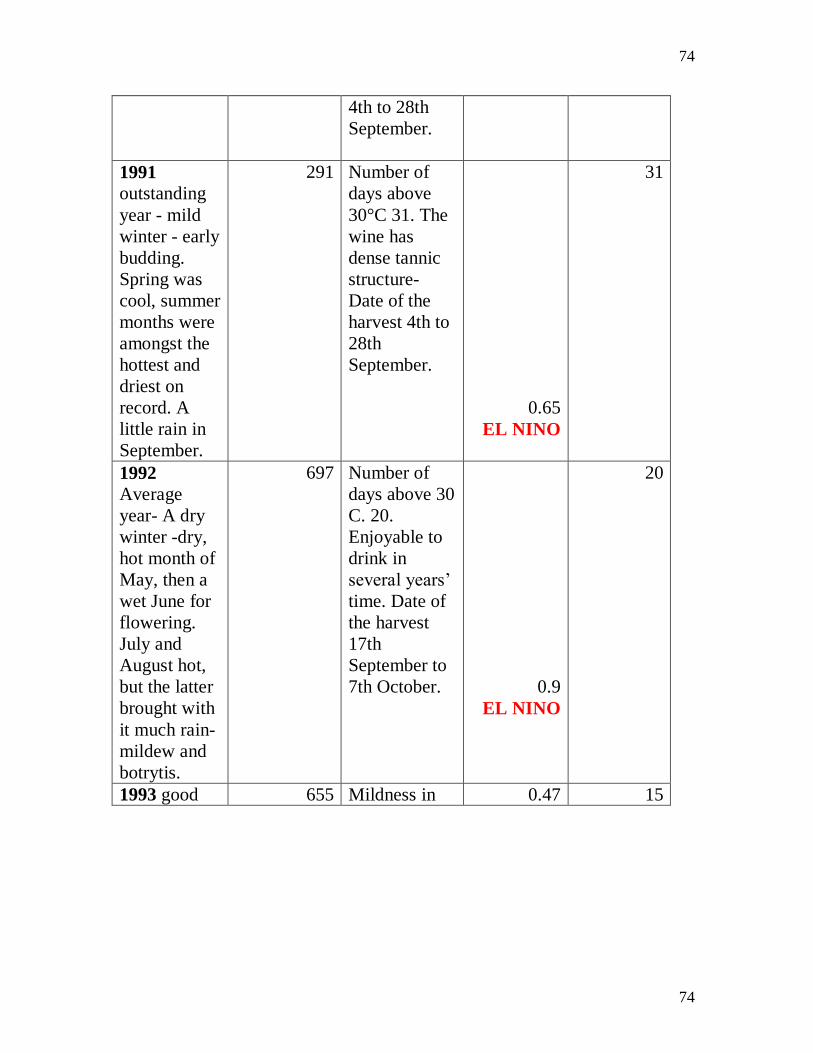
74
74
4th to 28th
September.
1991
outstanding
year - mild
winter - early
budding.
Spring was
cool, summer
months were
amongst the
hottest and
driest on
record. A
little rain in
September.
291 Number of
days above
30°C 31. The
wine has
dense tannic
structure-
Date of the
harvest 4th to
28th
September.
0.65
EL NINO
31
1992
Average
year- A dry
winter -dry,
hot month of
May, then a
wet June for
flowering.
July and
August hot,
but the latter
brought with
it much rain-
mildew and
botrytis.
697 Number of
days above 30
C. 20.
Enjoyable to
drink in
v y ’
time. Date of
the harvest
17th
September to
7th October.
0.9
EL NINO
20
1993 good 655 Mildness in 0.47 15

75
75
year- spring-
early
budding.
Summer
started with
dry but cool
weather.
August was
fine and dry.
hot Number
of days above
30°C 15.
Very fine
Haut-Brion.
Date of the
harvest 16th
to 29th
September.
MILD EL
NINO
1994 A good
year- early
growth -
mild winter.
Spring was
rather cool
and wet,
slowing
growth. A
hot summer
with some
spectacular
storms. Rain
in
September.
623 Number of
days above
30°C 27.
Harmony
embodies this
wine- Date of
the harvest
12th to 24th
September.
0.43
MILD EL
NINO
27
1995 A very
good and
early year.
Winter
gentle and
spring hot
and dry.
June, July
348 Number of
days above
30°C 30. Date
of the harvest
11th to 26th
September.
0.19
Normal
30

76
76
and August
high
temperatures
and lack of
rain. Cooler
weather in
September
and heavy
rains in the
middle of the
month.
1996 A good
year-
inconsistency
of the
weather. No
periods of
sustained
heat apart
from a few
days in July.
Rains
towards the
end of
August.
September,
good weather
in the first
half and a lot
of rain in the
second.
516 Number of
days above
30°C 23.
Temperatures
and were
above average
this year. A
very good
wine
overalDate of
the harvest
16th
September to
4th October.
-0.33
LA NINA
23
1997 An
average year,
472 Number of
days above
0.99
22
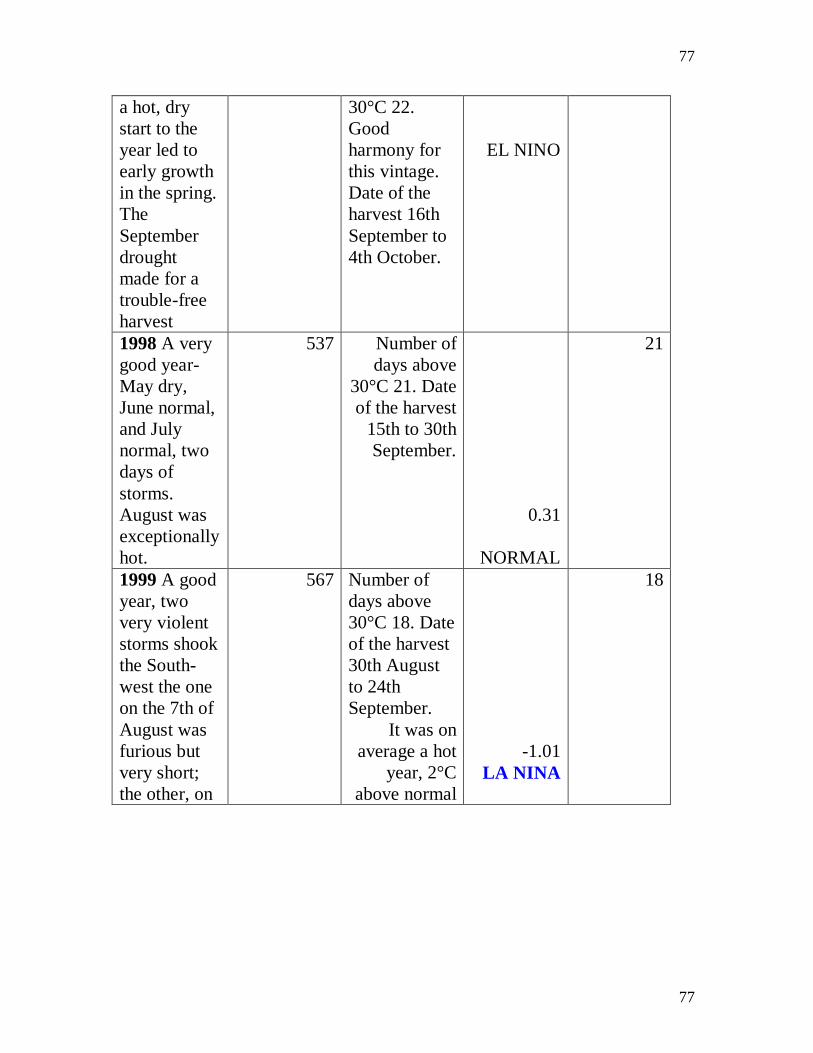
77
77
a hot, dry
start to the
year led to
early growth
in the spring.
The
September
drought
made for a
trouble-free
harvest
30°C 22.
Good
harmony for
this vintage.
Date of the
harvest 16th
September to
4th October.
EL NINO
1998 A very
good year-
May dry,
June normal,
and July
normal, two
days of
storms.
August was
exceptionally
hot.
537 Number of
days above
30°C 21. Date
of the harvest
15th to 30th
September.
0.31
NORMAL
21
1999 A good
year, two
very violent
storms shook
the South-
west the one
on the 7th of
August was
furious but
very short;
the other, on
567 Number of
days above
30°C 18. Date
of the harvest
30th August
to 24th
September.
It was on
average a hot
year, 2°C
above normal
-1.01
LA NINA
18

78
78
the 27th of
December,
was
exceptionally
fierce.
temperatures
recorded in
the last 40
years.
2000
outstanding
year-A mild
start, very
wet, hot
spring, dry,
scorching
Temperature
records
broken 1.5°C
above
average.
September,
hot and dry -
conditions.
summer
436 C 21.
-0.78
LA NINA
21
2001 335 30°C -0.19
LA NINA
32
2002 336 EL NINO
0.62
14
2003 263 EL NINO.
0.43
49
2004. 325
EL NINO
0.49
21
2005 229 EL NINO
0.39
32
2006 EL NINO

79
79
0.12
2007 -Storm in
Brittany 8th
of
December
-0.15
LA NINA
2008 -0.57
LA NINA
Year Average El Nino/La
Nina/normal
1950 -1.18 La Nina
1951 -0.11 La Nina
1952 -0.04 Normal
1953 0.36 Normal
1954 -0.61 La Nina
1955 -1.11 La Nina
1956 -0.72 La Nina
1957 0.55 El Nino
1958 0.66 El Nino
1959 -0.02 La Nina
1960 -0.14 La Nina
1961 -0.17 La Nina
1962 -0.41 La Nina
1963 Eruption
March Mt.
Agung
(Indonesia)
0.3 Normal
1964 -0.42 La Nina
1965 0.49 El Nino

80
80
1966 0.39 El Nino
1967 -0.33 La Nina
1968 -0.21 La Nina
1969 0.69 El Nino
1970 -0.19 La Nina
1971 -0.97 La Nina
1972 0.66 El Nino
1973 -0.31 El Nino
1974 -0.94 La Nina
1975 -1.04 La Nina
1976 -0.32 El Nino
1977 0.42 El Nino
1978 -0.11 La Nina
1979 0.14 Normal
1980 eruption of
Mount St.
Helens,
Washington,
USA, on
May 18,
1980, and a
large
eruption of
Mount
Hekla,
Iceland, on
August 17,
1980.
0.21 Normal
1981 -0.27 Norma
1982 El Chichon
in 1982-
Mexico
0.73 El Nino

81
81
1983 0.8 El Nino
1984 -0.32 La Nina
1985 -0.7 La Nina
1986 0.05 Normal
1987 1.33 El Nino
1988 -0.67 La Nina
1989 -0.81 La Nina
1990 0.24 La Nina
1991 June 1991
eruption of
Mount
Pinatubo,
Philipines
0.65 El Nino
1992 0.9 El Nino
1993 0.47 El Nino
1994 0.43 El Nino
1995 0.19 La Nina
1996 -0.33 La Nina
1997 0.99 El Nino
1998 0.31 El Nino
1999 -1.01 La Nina
2000 -0.78 La Nina
2001 -0.19 La Nina
2002 0.62 El Nino
2003 0.43 El Nino
2004 0.49 El Nino
2005 0.39 El Nino
2006 0.12 mormal
2007 -0.15 La Nina
2008 -0.57 La Nina
2009 cold La Nina

82
82
2010 cold La Nina
2011 cold La Nina
2012 cold La Nina
2013 Heat in
Europe
late
summer
La Nina- El
Nino
2014 Predicted
hot
summer
El Nino
Rainfall Bordeaux 1950-2005
10
1112
1314
15
16
17
18
19
2022
23
25
26272829
3031
32
3334
35
36
37
38
3940424445
4647
4849
50
51
52
53
5455
56
5758
59
60
61
7543
2
1
8
9
0
100
200
300
400
500
600
700
800
1 4 7 10 13 16 19 22 25 28 31 34 37 40 43 46 49 52 55 58 61

83
83
Hots days 1950-2005
1011
12
13
14
15
16
1718 20
212223
24
25
2627
28
29
303132
3334
35
36
3738
39
40
41
4243
44
45
4647
48495051
52
53
54
55
56
57
7
6
5432
1
89-10
0
10
20
30
40
50
60
1 3 5 7 9 11 13 15 17 19 21 23 25 27 29 31 33 35 37 39 41 43 45 47 49 51 53 55 57

84
84
El Nino index 1950-2008
101112
13
14
15
1617
1819
20
21
22
23
24
2526
27
28
29
3031
32
3334
35
36
37
38
3940
41
42
43
4445
46
47
48
49
50
51
52
53
545556
57
58
59
765432
1
8
9-15
-10
-5
0
5
10
15
1 3 5 7 9 11 13 15 17 19 21 23 25 27 29 31 33 35 37 39 41 43 45 47 49 51 53 55 57 59

85
85
RAINFALL BORDEAUX 1950-2005
0
100
200
300
400
500
600
700
800
1940 1950 1960 1970 1980 1990 2000 2010

86
86
Deviation from Average Bordeaux rainfall 1950-2005
1011
1213
14
15
16
17
18
1920
21
22
232425
26
2728
29
30
31
32
33
34
35
3637
383940
4142
43
44
45
46
47
48
49
50
51
5253
54
55
56
7
6
5
432
1
8
9-400
-300
-200
-100
0
100
200
300
1 3 5 7 9 11 13 15 17 19 21 23 25 27 29 31 33 35 37 39 41 43 45 47 49 51 53 55

87
87
Average El Nino Index 1950-1959
10
76
54
3
2
1
8
9
-1.5
-1
-0.5
0
0.5
1
1 2 3 4 5 6 7 8 9 10

88
88
RAINFALL BORDEAUX 1950-1959
1
2
3
4
5
6
7
8
9
10
0
100
200
300
400
500
600
1 2 3 4 5 6 7 8 9 10
CONCLUSION:
El Nino does not affect only the South American coast, but the climate of the
whole planet. It start in the South Pacific, and rapidly travel up the coast of
south America then turns west toward Australia, from there it influence the
climate of Asia and Africa, then perhaps to a less extent to Europe..It takes
about a year and a half for its influence to reach Europe, causing excessive
heat, floods and storms...
If we take the phenomenon into consideration for our medium term climatic
forecast we can more precisely warm the population of possible climatic
extremes and lessen their effects and possibly save lives.

89
89
BIBLIOGRAPHY
1. Budyko, M. I. 1969. The effect of solar radiation on the climate of the
earth. Tellus 21611-619.
2. Climate Science: Investigating Climatic and Environmental Processes
Millennial Scale
3. Druffel, E. M. 1982. Banded corals changes in oceanic Carbon-14
during the little ice age. Science 21813-19.
4. Eddy, J. A. 1976. The Maunder Minimum. Science 1921189-1202.
5. Eddy, J. A. 1977. The case of the missing sunspots. Scientific
American 236(5)80-92.
6. G. Bond, "Persistent Solar Influence on North Atlantic Climate during
the Holocene," Science 294, 2001.
7. Gladstones, J., Viticulture and Environment. Wine-titles, Adelaide,
1992.
8. Hayes, S.P., L.J. Mangum, J. Picaut, A. Sumi, and K. Takeuchi, 1991:
TOGA-TAO: A moored array for real-time measurements in the
tropical Pacific Ocean. BulAm. MeteoroSoc., 72, 339-347. (abstract
available)
9. Jones, G. V. and R. E. Davis, Climate Influences on Grapevine
Phenology, Grape Composition, and Wine Production and Quality for
Bordeaux, France, Am. J. Viti. Eno51, 249-261, 2000.
10. Kerr, R. A. 1982. El Chichon forebodes climate change. Science
2171023-Geophysical Research Letters, Vo34, L20705, doi
10.1029/2007GL031381
11. Kukla, G. and J. Gavin. 1981. Summer ice and carbon dioxide.
Science 214497-503.
12. La Marche, Jr., V. C. 1974. Paleoclimatic inferences from long tree-
ring records. Science 1831043-1048.
13. Lamb, H. H. , 1966, The changing climate, Methuen & Co Ltd,
London
14. Lamb, H. H. 1965. The early Medieval warm epoch and its
sequePaleogeography, Paleoclimatology, Paleoecology 113 Lamb, H.

90
90
H. 1967. Britain's changing climate. Geographical Journal 133445-
468.
15. Lamb, H. H. 1977. Climate-Present, Past and Future. Volume 2.
Climatic history and future. Methuen, London.
16. Le Roy Ladurie, E. Histoire du Climat depuis l'An MiChamps
Historiques Flamarion, Paris, 1983.
17. Le Roy Ladurie, E., Times of Feast, Times of Famine A History of
Climate Since the Year 1000 - Doubleday, Garden City, New York,
1971.
18. Manley, G. 1957. Climatic fluctuations and fuel requirements.
Scottish Geographical Magazine 73(1):19-28.
19. McPhaden, M.J., 1993: TOGA-TAO and the 1991-93 El Niño-
Southern Oscillation Event. Oceanography, 6, 36-44. (entire paper
available)
20. Penning-Roswell, E., Wines of Bordeaux, 6th ed., Penguin Books,
London/New York, 1989.
21. Pfister, C., Variations in the spring-summer climate of central Europe
from the High Middle Ages to 1850, in Long and Short Term
Variability of Climate, H. Wanner, U. Siegenthaler Eds. Springer-
Verlag, Berlin, 1988, pp. 57-82.
22. Philander, S.G.H., 1990: El Niño, La Niña and the Southern
Oscillation. Academic Press, San Diego, CA, 289 pp.
23. Richard D. Tkachuck,1983- Geoscience Research Institute-Origins
10(2):51-65
24. Ruddiman, W. F., 2001. Earth's Climate: past and future. W.H.
Freeman & Sons, New York.
25. Singer and Avery, Unstoppable Global Warming Every 1500 Years
26. Trevelan , G.M. 1942 English social history , Longmass London
27. World Data Center for Paleoclimatology, Boulder and NOAA
Paleoclimatology Program
28. Fraedrich, K., Bantzer, C., Burkhardt, U., 1993. Winter climate
anomalies in Europe and their associated circulation at 500 hPa. Clim.
Dynam. 8, 161–175.

91
91
29. Fraedrich, K., Müller, K., 1992. Climate anomalies in Europe
associatedwith ENSO extremes. Int. J. Climato12, 25–31.
30. Halpert, M.S., Ropelewski, C.F., 1992. Surface temperature patterns
associated with the Southern Oscillation. J. Clim. 5, 577–593.
WEBSITES references
1. http//www.mpimet.mpg.de/en/presse/faq-s/das-el-nino-southern-
oscillation-enso-phaenomen/hat-el-nino-einen-einfluss-auf-das-klima-
in-europa.html
2. ftp//ftp.ncdc.noaa.gov/pub/data/paleo/historical/france/burgundy2004.
txt
3. http//home.gwu.edu/~jhsy/pr.html
4. http//lwf.ncdc.noaa.gov/paleo/pubs/meier2007/meier2007.html
5. http//www.cpc.ncep.noaa.gov/products/analysis_monitoring/ensostuff
/ensoyears shim
6. http//www.giub.unibe.ch/klimet/docs/diplom_nmeier.pdf
7. http//www.haut-brion.com/home/downloads/la-mission-haut-brion-
en.pdf
8. http//www.uwgb.edu/biodiversity/phenology/index.htm
9. http://www.dfg.ca.gov/marine/elnino.asp
10. http://www.enowines.com/MT/archives/000124.html
11. http://www.newscientist.com/article/mg12517063.100-science-el-
nino-events-devastated-two-ancient-civilisations.html
12. http://www.newscientist.com/article/mg14119081.200-fire-and-flood-
greet-el-ninos-third-year-.html
13. ftp://ftp.ncdc.noaa.gov/pub/data/paleo/historical/france/burgundy2004
.txt
14.

92
92
15. http://haut-brion.com/home/en/langflash-en.php-Delmas J.P. Chateau
Haut-Brion
16. http://www.lafragette.com/uk/actualites/index.asp?idactu=6
17. http://www.ncdc.noaa.gov/paleo/ctl/clisci10kb.html
18. http://www.mnh.si.edu/vikings/voyage/subset/greenland/history.html
19. http://www.madmariner.com/news/story/el_nino_may_have_helped_
magellan_051608_ap randolph e. schmid -may 16, 2008 washington
(AP)Published Online 11 April 2008 | Nature |
Doi:10.1038/News.2008.747
20. The volcano that changed the world
21. http//wmo.asu.edu/western-hemisphere-lowest-temperature
22. http//www.elnino.noaa.gov/
23. http//www.ncdc.noaa.gov/paleo/ctl/clisci10kb.html
24. http://www.ncdc.noaa.gov/oa/climate/elnino/elnino.html#overview
25. http://www.cbsnews.com/stories/2007/02/28/tech/main2523483.shtml
26. http://www.atmos.umd.edu/people/faculty.php?view=63
ENDNOTES
Contact details: [email protected]
i http://www.dfg.ca.gov/marine/elnino.asp ii http://www.atmos.umd.edu/people/faculty.php?view=63 iii http://www.cbsnews.com/stories/2007/02/28/tech/main2523483.shtml iv Ibid v El Nino and La Nina Causes and Global Consequences Michael J McPhaden
Volume 1, The Earth system: physical and chemical dimensions of global environmental change,
pp 353–370 vi http://www.newscientist.com/article/mg12517063.100-science-el-nino-events-devastated-two-ancient-
civilisations.html vii viii REVIEWS OF GEOPHYSICS, VOLEROY LADURIE45, RG3003, doi:10.1029/2006RG000199, 2007
Impact of El Niño–Southern Oscillation on European climateS. Brönnimann
Institute for Atmospheric and Climate Science, ETH Zurich, Zurich, Switzerland ix http://www.newscientist.com/article/mg14119081.200-fire-and-flood-greet-el-ninos-third-year-.html x http://www.giub.unibe.ch/klimet/docs/diplom_nmeier.pdf
xi ftp://ftp.ncdc.noaa.gov/pub/data/paleo/historical/france/burgundy2004.txt

93
93
xii Ibid xiii
http://www.nias.knaw.nl/en/press_releases/ladurie/ xiv Delmas J.P. Chateau Haut-Brion- http://haut-brion.com/home/en/langflash-en.php xv http://www.lafragette.com/uk/actualites/index.asp?idactu=6