57 A Food Chem red wine
9
Effect of high pressure treatments on the physicochemical properties of a sulphur dioxide-free red wine Mickael C. Santos a , Cláudia Nunes a,⇑ , João Cappelle a , Fernando J. Gonçalves b , Ana Rodrigues c , Jorge A. Saraiva a , Manuel A. Coimbra a a QOPNA, Department of Chemistry, University of Aveiro, 3810-193 Aveiro, Portugal b Department of Food Industries, Agrarian Higher School, Polytechnic Institute of Viseu, 3500-606 Viseu, Portugal c Dão Sul – Sociedade Vitivinícola, S.A., 3430-909 Carregal do Sal, Portugal article info Article history: Received 18 February 2013 Received in revised form 19 April 2013 Accepted 9 May 2013 Available online 18 May 2013 Keywords: Colour Phenolic compounds Anthocyanins Sensorial analyses High pressure abstract The application of high hydrostatic pressure (HHP) in winemaking for substitution of the use of sulphur dioxide is still at a very early stage of development, since knowledge about the effect on physicochemical and sensorial characteristics of the wine during storage is very scarce. In this work, the evolution of col- our, antioxidant activity and total phenolic compounds of SO 2 -free red wines treated by HHP and aged in bottles was followed for 12 months. The pressurised wines were compared with wine samples prepared with addition of 40 ppm of SO 2 and without any of these two treatments. After 12 months, the pressur- ised wines presented higher values of CIELab parameters (a ⁄ , b ⁄ , and L ⁄ ) and a lower monomeric antho- cyanin content (45–61%) when compared to the unpressurised ones. The pressurised wines showed also a better global sensorial assessment, with the pressure treatments imparting aged-like characteristics to the wines. The wine deposits of pressurised wines had higher total phenolic content, namely proantho- cyanidins (3- to 10-fold). The results demonstrate that HHP can influence long term red wine physico- chemical and sensorial characteristics, hypothesised to be due to an increase of condensation reactions of phenolic compounds, forming compounds with higher degree of polymerisation that became insoluble in wine along storage. Ó 2013 Elsevier Ltd. All rights reserved. 1. Introduction Sulphur dioxide (SO 2 ) is probably one of the most versatile and efficient additives used in winemaking due to its antiseptic and antioxidant properties. This compound inhibits the development of yeasts, lactic acid bacteria, and to a lesser extent, acetic acid bac- teria (Ribéreau-Gayon, Glories, Maujean, & Dubourdieu, 2006). Besides its antiseptic properties, SO 2 plays an important role against oxidation in wine (Karbowiak et al., 2010; Li, Guo, & Wang, 2008) and prevents browning by inactivation of enzymes such as polyphenoloxidase (PPO), peroxidase (PDO), and proteases, and also by inhibition of Maillard reactions (Garde-Cerdan, Marselles- Fontanet, Arias-Gil, Ancin-Azpilicueta, & Martin-Belloso, 2008). In spite of all the advantages of SO 2 , the sulphites resulting from the addition of SO 2 to the wine have been related to allergic reac- tions or intolerance in some consumers. Most non-asthmatic indi- viduals can tolerate up to 5 ppm, whereas sulphite-sensitive individuals react negatively to sulphites ingestion and may experi- ence a range of symptoms including dermatitis, urticaria, angio-oe- dema, abdominal pain, diarrhoea, bronchoconstriction, and anaphylaxis (Vally, Misso, & Madan, 2009). Due to the health re- lated problems that have been associated with SO 2 use, the inter- national organisation of vine and wine (OIV) has progressively reduced the maximum concentration authorised in wines (Garcia-Ruiz et al., 2008), which is 150 mg/L for red wines and 200 mg/L for white wines (regulation (EC) 607/2009). Thus, it is important to search for new healthy safe strategies to replace to- tally or partially the action of sulphur dioxide in wines. New prac- tices have been tested in order to substitute sulphur dioxide, the addition of compounds such as bacteriocins, wine phenolics, chitosan, and lysozyme (Cejudo-Bastante et al., 2010; Rojo-Bezares, Saenz, Zarazaga, Torres, & Ruiz-Larrea, 2007; Sonni, Bastante, Chinnici, Natali, & Riponi, 2009) or the use of physical methods such as power ultrasound, ultraviolet radiation, and pulsed electric fields (Fredericks, du Toit, & Krugel, 2011; Garde-Cerdan et al., 2008; Jiranek, Grbin, Yap, Barnes, & Bates, 2008), but none has shown to be as efficient as SO 2 (Santos, Nunes, Saraiva, & Coimbra, 2012). During the last decade, the use of high hydrostatic pressure (HHP) for food preservation and processing, and also for creating new types of food products, has increased substantially. Foods commercially processed by HHP are submitted to pressures in the order of 400–600 MPa to destroy microorganisms and inactivate enzymes, with minimal effects on food sensorial and 0308-8146/$ - see front matter Ó 2013 Elsevier Ltd. All rights reserved. http://dx.doi.org/10.1016/j.foodchem.2013.05.022 ⇑ Corresponding author. Tel.: +351 234 372581; fax: +351 234 370084. E-mail address: [email protected] (C. Nunes). Food Chemistry 141 (2013) 2558–2566 Contents lists available at SciVerse ScienceDirect Food Chemistry journal homepage: www.elsevier.com/locate/foodchem
Transcript of 57 A Food Chem red wine

Food Chemistry 141 (2013) 2558–2566
Contents lists available at SciVerse ScienceDirect
Food Chemistry
journal homepage: www.elsevier .com/locate / foodchem
Effect of high pressure treatments on the physicochemical propertiesof a sulphur dioxide-free red wine
0308-8146/$ - see front matter � 2013 Elsevier Ltd. All rights reserved.http://dx.doi.org/10.1016/j.foodchem.2013.05.022
⇑ Corresponding author. Tel.: +351 234 372581; fax: +351 234 370084.E-mail address: [email protected] (C. Nunes).
Mickael C. Santos a, Cláudia Nunes a,⇑, João Cappelle a, Fernando J. Gonçalves b, Ana Rodrigues c,Jorge A. Saraiva a, Manuel A. Coimbra a
a QOPNA, Department of Chemistry, University of Aveiro, 3810-193 Aveiro, Portugalb Department of Food Industries, Agrarian Higher School, Polytechnic Institute of Viseu, 3500-606 Viseu, Portugalc Dão Sul – Sociedade Vitivinícola, S.A., 3430-909 Carregal do Sal, Portugal
a r t i c l e i n f o
Article history:Received 18 February 2013Received in revised form 19 April 2013Accepted 9 May 2013Available online 18 May 2013
Keywords:ColourPhenolic compoundsAnthocyaninsSensorial analysesHigh pressure
a b s t r a c t
The application of high hydrostatic pressure (HHP) in winemaking for substitution of the use of sulphurdioxide is still at a very early stage of development, since knowledge about the effect on physicochemicaland sensorial characteristics of the wine during storage is very scarce. In this work, the evolution of col-our, antioxidant activity and total phenolic compounds of SO2-free red wines treated by HHP and aged inbottles was followed for 12 months. The pressurised wines were compared with wine samples preparedwith addition of 40 ppm of SO2 and without any of these two treatments. After 12 months, the pressur-ised wines presented higher values of CIELab parameters (a⁄, b⁄, and L⁄) and a lower monomeric antho-cyanin content (45–61%) when compared to the unpressurised ones. The pressurised wines showed also abetter global sensorial assessment, with the pressure treatments imparting aged-like characteristics tothe wines. The wine deposits of pressurised wines had higher total phenolic content, namely proantho-cyanidins (3- to 10-fold). The results demonstrate that HHP can influence long term red wine physico-chemical and sensorial characteristics, hypothesised to be due to an increase of condensation reactionsof phenolic compounds, forming compounds with higher degree of polymerisation that became insolublein wine along storage.
� 2013 Elsevier Ltd. All rights reserved.
1. Introduction
Sulphur dioxide (SO2) is probably one of the most versatile andefficient additives used in winemaking due to its antiseptic andantioxidant properties. This compound inhibits the developmentof yeasts, lactic acid bacteria, and to a lesser extent, acetic acid bac-teria (Ribéreau-Gayon, Glories, Maujean, & Dubourdieu, 2006).Besides its antiseptic properties, SO2 plays an important roleagainst oxidation in wine (Karbowiak et al., 2010; Li, Guo, & Wang,2008) and prevents browning by inactivation of enzymes such aspolyphenoloxidase (PPO), peroxidase (PDO), and proteases, andalso by inhibition of Maillard reactions (Garde-Cerdan, Marselles-Fontanet, Arias-Gil, Ancin-Azpilicueta, & Martin-Belloso, 2008).
In spite of all the advantages of SO2, the sulphites resulting fromthe addition of SO2 to the wine have been related to allergic reac-tions or intolerance in some consumers. Most non-asthmatic indi-viduals can tolerate up to 5 ppm, whereas sulphite-sensitiveindividuals react negatively to sulphites ingestion and may experi-ence a range of symptoms including dermatitis, urticaria, angio-oe-dema, abdominal pain, diarrhoea, bronchoconstriction, and
anaphylaxis (Vally, Misso, & Madan, 2009). Due to the health re-lated problems that have been associated with SO2 use, the inter-national organisation of vine and wine (OIV) has progressivelyreduced the maximum concentration authorised in wines(Garcia-Ruiz et al., 2008), which is 150 mg/L for red wines and200 mg/L for white wines (regulation (EC) 607/2009). Thus, it isimportant to search for new healthy safe strategies to replace to-tally or partially the action of sulphur dioxide in wines. New prac-tices have been tested in order to substitute sulphur dioxide, theaddition of compounds such as bacteriocins, wine phenolics,chitosan, and lysozyme (Cejudo-Bastante et al., 2010; Rojo-Bezares,Saenz, Zarazaga, Torres, & Ruiz-Larrea, 2007; Sonni, Bastante,Chinnici, Natali, & Riponi, 2009) or the use of physical methods suchas power ultrasound, ultraviolet radiation, and pulsed electric fields(Fredericks, du Toit, & Krugel, 2011; Garde-Cerdan et al., 2008;Jiranek, Grbin, Yap, Barnes, & Bates, 2008), but none has shown tobe as efficient as SO2 (Santos, Nunes, Saraiva, & Coimbra, 2012).
During the last decade, the use of high hydrostatic pressure(HHP) for food preservation and processing, and also for creatingnew types of food products, has increased substantially. Foodscommercially processed by HHP are submitted to pressures inthe order of 400–600 MPa to destroy microorganisms andinactivate enzymes, with minimal effects on food sensorial and
M.C. Santos et al. / Food Chemistry 141 (2013) 2558–2566 2559
nutritional quality characteristics (Ramirez, Saraiva, Lamela, &Torres, 2009). However, due to the complexity of the foodproducts, it is difficult to generalise the effect of HHP processingfor all the different foods.
In the oenological sector, the use of high pressure treatmentshas already been tested for preservation of the quality of grapejuice, must, and wine (Daoudi et al., 2002; Morata et al., 2012;Talcott, Brenes, Pires, & Del Pozo-Insfran, 2003). There are reportsindicating that pressures between 200 and 500 MPa are able toinactivate bacteria and yeasts in red and white wines withoutcausing significant sensorial changes (Buzrul, 2012; Mok et al.,2006). These results suggest that HHP might be an alternative pro-cess to the use of SO2 for preservation of wine. However, Tao et al.(2012) showed, recently, that severe high pressure treatments(650 MPa for 1 and 2 h) changed the physicochemical characteris-tic of red wine, decreasing the colour intensity and phenolic com-pounds content of wine, due to the increase of condensationreactions of phenolic compounds.
The aim of this work is to increase the fundamental knowledgeabout the effect of HHP on wine, contributing for the evaluation ofthe feasibility of using HHP for wine long term preservation in theabsence of SO2. This was pursued by studying the effect of HHP onthe physicochemical and sensorial properties of a red wine alongits storage in bottles during 12 months. Colour, antioxidant activ-ity, total phenolic compounds, and monomeric anthocyanins com-position of the wines were evaluated.
2. Materials and methods
2.1. Chemicals
Absolute ethanol, tartaric acid (99%), and gallic acid (99%) werepurchased from Panreac (Barcelona, Spain). Sodium carbonateanhydrous (99%) and 2,20-azino-bis(3-ethylbenzthiazoline-6-sul-phonic) (ABTS, 99%) were purchased from Fluka (St. Louis, MO).Potassium persulphate (99%), Folin–Ciocalteu reagent, 6-hydroxy-2,5,7,8-tetramethylchroman-2-carboxylic acid (Trolox, 99%), andformic acid (HPLC grade) were purchased from Sigma–Aldrich(Seelze, Germany). Acetonitrile (HPLC grade) was purchased fromLAB-SCAN (Gliwice, Poland).
2.2. Wine samples and high pressure treatments
Red wine samples without the addition of SO2 were producedby Dão Sul SA (Carregal do Sal, Portugal) using Touriga Nacionalgrapes from Dão Appelation, at 2010 and 2011 vintages. An indus-trial batch fermenter of 200 L was used. After alcoholic fermenta-tion, the wine was transferred to polyethylene bottles of 250 mL,stoppered, and were pressurised during 5 min at 20 �C at 425and 500 MPa in a hydrostatic press (Avure Technologies, Model215L-600, USA), giving origin to the samples named 425 and500 MPa, respectively. Two lots of the same wine were also bottledin the polyethylene bottles, one with the addition of 40 ppm of SO2,the typical amount used in the wine industry (sample named asSO2), and another with neither addition of SO2 nor submitted toany high pressure treatment (sample named as untreated). Allwine samples were stored at 80% relative humidity, in the absenceof light at a temperature ranging between 10 and 15 �C. The wineswere analysed in triplicate along storage in the bottles.
2.3. Spectrophotometric determinations
2.3.1. ColourThe measurement of the wine colour was carried out using the
CIELab space. The absorption spectra were recorded using a
Perkin–Elmer Instruments Lambda 35 spectrophotometer and a1 mm optical path glass cell. The whole visible spectrum(380–780 nm) was recorded and Illuminant D65 and 10� observerwere used in the calculations. The CIELab parameters were deter-mined using the original Perkin–Elmer UV WinLab� Softwareaccording to regulations by the International Commission onIllumination: red/green colour (a⁄) and yellow/blue colour (b⁄)components, and luminosity (L⁄). The parameters correlated withthe colour perception, namely the polar coordinates chromaðC�abÞ and hue angle (hab) were determined according to theequations (C�abÞ ¼ ða�2 þ b�2)0.5 and hab = tan�1(b⁄/a⁄). Colour differ-ences (DE⁄) between wines were calculated from the equationDE⁄ = (DL⁄2 + DC⁄2 + DH⁄2)0.5, where DL� ¼ L�ðsampleÞ � L�ðrefÞ;
DC� ¼ C�abðsampleÞ � C�abðrefÞ and DH�ðhue differenceÞ ¼ 2 sinðDhab=2ÞðC�abðrefÞ � C�abðsampleÞÞ, with Dhab = hab(sample) – hab(ref) (hue angledifference) (Berke & de Freitas, 2007).
2.3.2. Total phenolic content and antioxidant activityThe total phenolic (TP) content of the samples was determined
by the Folin–Ciocalteu method, as described by Singleton (1985).The samples were appropriately diluted in a solution of 10% etha-nol. The calibration curve was performed using gallic acid as stan-dard in a concentration range between 50 and 500 mg/L. Theresults were expressed as gallic acid equivalents.
The antioxidant activity (AOA) was determined by the 2,20-azi-no-bis(3-ethylbenzthiazoline-6-sulphonic) acid (ABTS) method(Re et al., 1999). The samples were appropriately diluted in asolution of 10% ethanol. The calibration curve was performed using6-hydroxy-2,5,7,8-tetramethylchroman-2-carboxylic acid (Trolox)as standard in a concentration range between 50 and 400 lM.The results were expressed as Trolox equivalent antioxidantcapacity (TEAC).
2.3.3. Total proanthocyanidins contentTotal proanthocyanidins were estimated according to Chira,
Jourdes, and Teissedre (2012). This method is based on the Bate–Smith reaction, in which the proanthocyanidins in acid medium re-lease anthocyanidins by heating. The wines were diluted to 1:50 ina 10% ethanol solution. One millilitre of the samples was added to0.5 mL of water and 1.5 mL of 12 M HCl and the mixture washomogeneised. Two tubes for each sample were prepared: onewas heated for 30 min in boiled water (sample A), while the otherwas maintained at room temperature (sample B). To each tube,0.25 mL of 95% ethanol were added. The absorbance at 550 nmwas read under 10 mm optical path. The content in proanthocyani-dins was determined using a calibration curve obtained with amixture of procyanidin oligomers as standard, obtained accordingto de Freitas, Glories, Bourgeois, and Vitry (1998).
2.3.4. Anthocyanins contentThe anthocyanin content of samples was estimated using the
pH shift method described by Burns et al. (2000). Two test tubeswere set up, each containing 1 mL of wine and 1 mL of 0.1% HClprepared in 95% ethanol. Ten millilitre of 2% HCl (pH 0.6) wereadded to one tube and 10 mL of phosphate/citrate buffer pH 3.5were added to the other tube. Absorbance was read at 700 nm toallow the correction of the haze and then at 520 nm for anthocya-nin determination. Anthocyanins were quantified as malvidin-3-glucoside equivalents, the major anthocyanin in red wine, usingthe extinction coefficient of e = 28,000 L cm�1 mol�1. At pH <1anthocyanins are in their red flavylium form, allowing the determi-nation of the total anthocyanins. At pH 3.5 the flavylium form ofthe anthocyanin is primarily in equilibrium with the colourlesscarbinol. Therefore, at this pH the absorbance observed is due topolymeric anthocyanins. The free anthocyanin content is estimatedby the difference in absorbance between pH <1 and pH 3.5.

2560 M.C. Santos et al. / Food Chemistry 141 (2013) 2558–2566
All samples were analysed in triplicate for the estimation of TP,AOA, proanthocyanidins, and anthocyanins content.
2.4. Analysis of monomeric anthocyanins by HPLC
The monomeric anthocyanins (MA) present in the wine sampleswere analysed by HPLC using the method described by Gonçalves,Rocha, and Coimbra (2012). A HPLC Dionex Ultimate 3000 Chro-matographic System (Sunnyvale, California, USA), equipped witha quaternary pump Model LPG-3400 A, an ACC-3000 auto sampler,with a thermostatted column compartment (adjusted to 30 �C),and a multiple Wavelength Detector MWD-300, was used. The col-umn (250 � 4.6 mm, particle size 5 lm) was a C18 Acclaim� 120(Dionex, Sunnyvale, California, USA) protected by a guard columnof the same material. The eluents were: (A) 40% formic acid, (B)acetonitrile, and (C) bi-distilled water. The initial conditions were25% A, 10% B, and 65% C, followed by a linear gradient from 10%to 30% B and 65% to 45% C for 40 min with a flow rate at 0.7 mL/
Fig. 1. Evolution of CIELab parameters (a⁄, b⁄, L⁄, C⁄ab and hab), total phenolic compounds12 months of aging in bottle.
min. The injection volume was 20 lL. The detection was made at520 nm and a Chromeleon (version 6.8) software program (Sunny-vale, California, USA) was used.
Anthocyanins were identified according to their UV–visspectrum (Dallas & Laureano, 1994). The chromatographic peaksof all anthocyanins were identified by comparing their retentiontimes with the retention time of the respective standard. Thequantification of the monomeric anthocyanins was done basedon a calibration curve obtained with standard solutions of malvi-din-3-glucoside (Extrasynthese, Genay, France), and the resultsfor each target phenolic component were expressed in equivalentsof the standard used. All analyses were done in triplicate.
2.5. Phenolic extraction of the deposits present in wine bottles
In order to recover the phenolic compounds present in thedeposits and covering the walls of each bottle, an acidic methanolextraction was done on the 2011 vintage wine samples after
content (TP), and antioxidant activity (AOA) of wine simples, 2010 vintage, during

M.C. Santos et al. / Food Chemistry 141 (2013) 2558–2566 2561
6 months of storage. Firstly, the wine samples were decanted, andto the remaining insoluble material 20 mL of methanol/formic acid(99:1, v/v) solution were added and the mixture was left underconstant stirring during 24 h. The methanolic solution was thencentrifuged (3500g for 5 min) to remove the insoluble material.The phenolic extracts were analysed by spectrophotometry todetermine the total phenolic, proanthocyanidin, and anthocyanidincontents.
2.6. Sensorial analysis
A blind tasting test was done to the wine after 9 months of bot-tling by seven expert panellists of the wine producer (five men andtwo women). Wines (30 mL) were presented in transparent glassescoded with a three-digit random code and distributed in a com-pletely randomised order. In each session, a descriptive analysisof each wine was conducted.
All tasters were informed that the wines had different treat-ments, but the panellists did not have any details of the experi-mental design. Each panellist tasted the four samples: untreated,SO2, 425, and 500 MPa. Wines were evaluated on a predefinedscore sheet (scale from 0 to 5) that included 17 descriptors in threecategories: colour (limpidity, red, violet, and brown), aroma attri-butes (balance, fruity, floral, cooked fruit, spices, leather, andmetallic) and taste attributes (body, astringency, bitterness, acid-ity, balance, and persistence). The score sheet was drawn up bythe project team in accordance with the objectives of the trials.Also, a global evaluation was done on a scale from 0 to 20 in fourcategories: colour, aroma, taste, and global attributes. Averagesof the scores for each descriptor were calculated.
2.7. Statistical analysis
Statistical data analysis was performed by Analysis of Variance(ANOVA). Tukey’s HSD Test was used as comparison test when sig-nificant differences were observed by ANOVA (p < 0.05).
Principal components analysis (PCA) was conducted in order toextract the main sources of variability and thus grouping the winesamples. PCA was performed on the normalised values of the fol-lowing parameters: a⁄, b⁄ and L⁄, antioxidant activity, and totalphenolic content for the pressurised and unpressurised wines atthe beginning and after 12 months of storage.
Table 1Monomeric anthocyanins content of the wine samples, 2010 vintage, after 9 and 12 mont
Anthocyanin2 Monomeric anthocyanins content (mg/L)1
9 months
Untreated SO2 425 MPa 500 MPa
Dp3Glc 2.01 ± 0.12a 2.57 ± 0.26b 0.25 ± 0.06c 0.43 ± 0.Pt3Glc 5.04 ± 0.06a 5.98 ± 0.14b 0.95 ± 0.11c 1.44 ± 0.Pn3Glc 2.36 ± 0.16ab 2.61 ± 0.12b 0.81 ± 0.07c 1.15 ± 0.Mv3Glc 81.49 ± 1.55a 89.08 ± 1.92b 29.38 ± 1.42c 36.18 ± 2.Dp3AcGlc 5.01 ± 0.35a 5.91 ± 0.17a 10.75 ± 0.29b 12.49 ± 0.Cy3AcGlc 1.34 ± 0.06ab 1.67 ± 0.13ab 2.18 ± 0.61ac 3.02 ± 0.Pt3AcGlc 1.42 ± 0.25a 1.96 ± 0.21b 0.15 ± 0.01c 0.20 ± 0.Pn3AcGlc 2.84 ± 0.43ab 3.23 ± 0.25b 2.32 ± 0.19a 2.83 ± 0.Mv3AcGlc 17.09 ± 0.90a 18.78 ± 0.99a 5.93 ± 0.29b 8.27 ± 0.Pn3CmGlc 0.87 ± 0.05a 1.01 ± 0.05a 0.18 ± 0.02bc 0.28 ± 0.Mv3CmGlc 4.89 ± 0.36a 5.57 ± 1.58a 1.54 ± 0.12b 2.03 ± 0.Total 124.38 ± 4.30a 138.38 ± 5.86b 54.44 ± 3.19c 68.32 ± 5.
1 All data are expressed as mean value ± standard deviation (n = 3). In the same line,2 Dp3Glc-Delphinidin-3-glucoside, Pt3Glc-petunidin-3-glucoside, Pn3Glc-peonidin-3
aldehyde, Cy3AcGlc-cyanidin-3-glucoside-acetaldehyde, Pt3AcGlc-petunidin-3-glucoside3-glucoside-acetaldehyde, Pn3CmGlc-peonidin-3-(6-p-coumaroyl)-glucoside, Mv3CmGl
3. Results and discussion
3.1. Physicochemical analysis of the 2010 vintage wine
3.1.1. ColourThe CIELab (L⁄, a⁄, and b⁄) parameters calculated for the four
wine samples of 2010 vintage (untreated, with 40 ppm of SO2,and pressurised at 425 and 500 MPa) during 12 months are shownin Fig. 1. An increase in a⁄, b⁄, and L⁄ parameters was observed forthe wines along storage, indicating a change in the wine colour,shifting to more red, yellow, and transparent, respectively. Thischange was also verified through the increment in the ChromaðC�abÞ and hue (hab) values. These results are in agreement with otherreports that observed that during aging, red wine acquires a moreorange and clear colour, corresponding to increments in b⁄, L⁄ andhab (Boido, Alcalde-Eon, Carrau, Dellacassa, & Rivas-Gonzalo,2006; GarcÍa-Falcón, Pérez-Lamela, Martínez-Carballo, & Simal-Gándara, 2007; Gutiérrez, Lorenzo, & Espinosa, 2005). The colourchange during wine ageing is mainly due to the reaction of theanthocyanins, with formation of polymeric compounds. These com-pounds had different physicochemical features that could stabilisewine colour changing it from the red–purple of young wines to themore orange–red hue of aged wines (He, Santos-Buelga, Silva,Mateus, & de Freitas, 2006; Mateus & de Freitas, 2001).
The pressurised samples, at 12 months of storage, presentedhigher values of CIELab parameters, especially b⁄, when comparedwith the unpressurised wines (p < 0.05). This difference was statis-tically different after 9 months of storage for b⁄, while for a⁄ and L⁄
the pressurised samples presented a higher increase at 12 months,leading to more pronounced orange–red hue in the samples. Asconsequence, an increment of the C�ab and hab values in these sam-ples was also observed (p < 0.05) at 12 months of storage.
In order to establish whether the observed changes in the chro-matic parameters were visually relevant, the colour differences(DE⁄) between pressurised and unpressurised samples were calcu-lated. This parameter has been suggested to estimate in CIELabunits how samples are different: DE⁄ values higher than three CIE-Lab units indicate that the differences can be perceived by the hu-man eye (Martinez, Melgosa, Perez, Hita, & Negueruela, 2001).Until 9 months of storage, the DE⁄ values for the wines pressurisedat 425 and 500 MPa were lower than three CIELab units (data notshown), but for 9 months of storage the DE⁄ values were four andsix, respectively, when compared with the unpressurised wines. Atthe end of 12 months of storage, the DE⁄ values increased to 10 and
hs of storage.
12 months
Untreated SO2 425 MPa 500 MPa
01cd 0.41 ± 0.10cd 0.62 ± 0.07d 0.32 ± 0.02cd 0.39 ± 0.03cd
18de 1.76 ± 0.25e 2.39 ± 0.29f 0.94 ± 0.09c 1.12 ± 0.05cd
13cd 1.56 ± 0.17cde 1.94 ± 0.20abd 0.77 ± 0.42c 1.07 ± 0.61c
91d 57.06 ± 7.72e 69.70 ± 3.66f 23.63 ± 0.30c 23.29 ± 0.88c
81b 3.97 ± 1.13a 5.91 ± 0.75a 10.51 ± 0.34b 11.11 ± 1.48b
24c 0.85 ± 0.68b 1.51 ± 0.34ab 2.24 ± 0.30ac 2.33 ± 0.24ac
03c 0.77 ± 0.13d 0.69 ± 0.26de 0.15 ± 0.01c 0.29 ± 0.02ce
31ab 0.48 ± 0.10c 2.90 ± 0.54ab 2.04 ± 0.10a 2.16 ± 0.32a
73c 11.95 ± 0.49d 12.40 ± 0.83d 4.45 ± 0.12b 4.40 ± 0.02b
02bc 0.35 ± 0.13c 0.57 ± 0.09d 0.13 ± 0.02b 0.11 ± 0.02b
10c 3.45 ± 0.40c 4.41 ± 0.51a 1.20 ± 0.14b 1.05 ± 0.17b
48d 82.90 ± 6.26e 103.04 ± 7.53f 46.43 ± 1.86c 47.32 ± 3.84c
different letters indicate significant differences according to a Tukey test (p < 0.05).-glucoside, Mv3Glc-malvidin-3-glucoside, Dp3AcGlc-delphinidin-3-glucoside-acet--acetaldehyde, Pn3AcGlc-peonidin-3-glucoside-acetaldehyde, Mv3AcGlc-malvidin-
c-malvidin-3-(6-p-coumaroyl)-glucoside.

500
MPa
47.1
36.0
19.9
59.3
37.4
9.62
±0.
49d
1587
±57
e
2562 M.C. Santos et al. / Food Chemistry 141 (2013) 2558–2566
8, respectively. These results show that although in the early stagesafter pressurisation, the difference in colour of the pressurisedwines in relation to the unpressurised wines is not perceived bythe human eye. However, after 9 months of storage, a differenceis noticed, increasing along the storage time.
ofst
orag
e.
6m
onth
s
425
MPa
500
MPa
Un
trea
ted
SO2
425
MPa
47.1
44.8
47.2
49.8
48.3
32.9
29.9
30.2
30.8
39.4
20.3
17.3
21.2
21.4
21.8
57.4
53.9
56.1
58.5
62.3
35.0
33.8
32.6
31.7
39.2
.71c
11.3
5±
0.51
ad11
.58
±1.
12a
12.0
0±
0.81
ab13
.11
±0.
66ab
c9.
63±
0.58
d
7b16
33±
48ad
1660
±11
d17
05±
38ad
1753
±21
a15
28±
18e
sign
ifica
nt
diff
eren
ces
acco
rdin
gto
aTu
key
test
(p<
0.05
).
3.1.2. Total phenolic compounds and antioxidant activityThe total phenolics (TP) content and the antioxidant activity
(AOA) of the wine samples during bottle storage are shown inFig. 1. At the beginning of the storage, the wine samples did notshow any statistical differences on TP and AOA. However, alongthe time of storage, the wines showed different evolution of TPand AOA values. In relation to the TP (Fig. 1), the pressurised winespresented a slight decrease (9%) of TP after 9 months of storage(p < 0.05). Regarding the evolution of wines AOA, the untreatedand pressurised samples showed a slight decrease in AOA alongstorage. After 12 months, the untreated, 425 and 500 MPa treatedwine samples had, respectively, 21%, 27%, and 15% lower AOA thanthe wine with SO2 (Fig. 1). The wine with SO2 exhibited at the endof 12 months of storage, 15% higher AOA compared to the value atthe beginning of storage, which is due to the antioxidant capacitythat the SO2 provides to the wine (Burin et al., 2011). During wineaging, different condensation reactions can occur in each wine,leading to different antioxidant activity of the compounds. There-fore, besides the possible occurrence of a higher rate of condensa-tion reactions of phenolic compounds in the pressurised red wine,these reactions should be different to those occurring in untreatedwine and wine with SO2, explaining the different behaviour of theantioxidant activity and total phenolic content observed for thesewines during aging.
Tabl
e2
Evol
utio
nof
the
colo
ur,a
ntio
xida
ntac
tivi
tyan
dto
tal
phen
ols
cont
ent
ofth
ew
ine
sam
ples
,201
1vi
ntag
e,du
ring
6m
onth
s
Para
met
er1
Win
esa
mpl
es
Beg
inn
ing
ofst
orag
e3
mon
ths
Un
trea
ted
SO2
425
MPa
500
MPa
Un
trea
ted
SO2
Col
our
a⁄42
.144
.741
.444
.744
.547
.6b⁄
24.2
24.1
29.7
31.8
27.3
29.3
L⁄15
.717
.615
.613
.416
.918
.9C⁄
ab48
.550
.750
.954
.952
.255
.9h a
b29
.928
.435
.735
.431
.531
.6A
OA
2(T
EAC
mM
)12
.81
±0.
59ab
c13
.64
±0.
89b
c13
.09
±0.
23ab
c12
.69
±0.
16ab
c12
.70
±0.
44ab
c14
.22
±0
TP3
(mg/
L)17
01±
11a
1900
±30
b17
73±
22c
1675
±17
ad18
52±
79b
1918
±5
1A
OA
and
TPda
taar
eex
pres
sed
asm
ean
valu
e±
stan
dard
devi
atio
n(n
=3)
.In
the
sam
eli
ne,
diff
eren
tle
tter
sin
dica
te2
AO
Aan
tiox
idan
tac
tivi
tyda
taar
eex
pres
sed
asm
Mtr
olox
equ
ival
ent
anti
oxid
ant
capa
city
(TEA
C).
3TP
tota
lph
enol
icco
mpo
un
dsda
taar
eex
pres
sed
asm
g/L
gall
icac
ideq
uiv
alen
ts.
3.1.3. Anthocyanins compositionThe pronounced orange–red hue and the lower TP and AOA of
the pressurised wines points to a higher degree of pigmentation/polymerisation of the anthocyanins in these samples (He et al.,2006), when compared with the untreated wine and with the winewith SO2. This indicates that the pressurised wines should presenta higher degree of anthocyanins polymerisation, and a lower con-tent of monomeric anthocyanins (MA). To verify this assumption,the wines were analysed after 9 and 12 months of storage for theircontent in MA. All samples showed from 9 to 12 months of storage,a decrease in the individual anthocyanin content andconsequently, a decrease in total monomeric anthocyanins content(Table 1). This decrease was mainly due to the high decrease ofmalvidin 3-glucoside content, the MA present in high content inred wines.
After 9 months of storage, the pressurised wines presented asignificant lower total MA content (54–68 mg/L) than the unpres-surised wines (124–138 mg/L). The 425 MPa wine presented a totalMA content 56% and 61% lower than the untreated and SO2 wines,respectively, while the 500 MPa wine presented a total MA content45% and 51% lower. These results are in agreement with those re-ported by Morata et al. (2012) which showed that the final antho-cyanin content of red wine is affected by HHP treatments. As thelower monomeric anthocyanin content in the pressurised sampleswas in agreement with the higher CIELab values found, it is possi-ble that the high pressure treatments promote the acceleration ofcondensation reactions during the wine storage period, involvingmonomeric anthocyanins and possibly other phenolic compounds.Accordingly, Boido et al. (2006) suggested that the increase in thehab values along wine aging could be attributed to the decrease ofthe amount of the monomeric anthocyanins. This is also reinforcedby results obtained by Corrales, Butz, and Tauscher (2008), who de-scribed the formation of vitisin A-type derivative by degradation ofcyanidin 3-glucoside after HHP treatment.

M.C. Santos et al. / Food Chemistry 141 (2013) 2558–2566 2563
The higher content of monomeric anthocyanins of the winewith SO2 (Table 2) might be due to the reaction of SO2 with theanthocyanins, as well as with several other constituents, reducingthe rate of phenolic compounds polymerisation and, consequently,the colour alteration usually observed during wine aging (Santoset al., 2012).
3.1.4. Principal component analysisThe principal component analysis (PCA) was performed on the
normalised values of a⁄, b⁄ and L⁄ CIELab values, AOA, and TP forthe pressurised and unpressurised wines at the beginning and after12 months of storage (Fig. 2). At the beginning of storage, the PC1explained 64% of the variation of the data. The scores scatter plot(Fig. 2A) showed that along PC1 axis the samples were separatedaccording to the presence (PC1 positive) or absence (PC1 negative)of SO2. Regarding to the loadings plot (Fig. 2B), it can be seen thatthe variables a⁄, L⁄, and AOA contributed to the samples located onPC1 positive, while b⁄ and TP contributed to the samples locationin PC1 negative. These results suggest that at the beginning of stor-age the addition of SO2 was the main factor to differentiate thewines and comparatively, the high hydrostatic pressure treatmentshave a lower impact on the physicochemical parameters of thewine.
After 12 months of storage, the PCA showed a variation of 86%explained by PC1 (Fig. 2C), positively related to the CIELab param-eters and negatively related to the AOA and TP (Fig. 2D). Contrarilyto the beginning of storage, after 12 months the wines were sepa-rated according to the pressure treatments. The pressurised winesamples were located in PC1 positive, while the unpressurisedwines were located in PC1 negative (Fig. 2C). Moreover, the treat-ment with SO2, that at the beginning of storage was the main
Fig. 2. PC1 � PC2 scatter plots of the wine samples, 2010 vintage, at the beginning (A-scob⁄, L⁄, AOA, and TP.
source of differentiation, was after 12 months of storage, explainedby PC2 (13% variation). Regarding to the loadings plot (Fig. 2D), itcan be seen that the parameters responsible for the differentiationof the pressurised wines from those unpressurised were the CIELabvalues, whereas the AOA was the parameter that influenced thedistinction between untreated wine (PC2 negative) and wine withSO2 (PC2 positive). These results confirm that the high pressuretreated wines presented alterations in the physicochemical proper-ties only after several months of storage, being colour the principalfactor of difference comparing with unpressurised wines. This ef-fect had only been reported for severe high pressure treatments(>30 min and >600 MPa) that modify immediately the physico-chemical properties of the wine (Tao et al., 2012), while possibleeffects during the wine conservation in bottle were never reported.
3.2. Physicochemical analysis of the 2011 vintage wine
In order to confirm, in a different vintage, the changes promotedby HHP treatments in red wine colour explained by the decrease ofthe free anthocyanins content, and consequent polymerisation,wine samples were produced in 2011 using the same conditionsand grapes origin of the 2010 vintage. The wines physicochemicalproperties were analysed along 6 months of bottle storage beingshown in Table 2. As was observed in the 2010 data set, the pres-surised samples presented higher b⁄ values after 6 months of stor-age, when compared to the unpressurised wines, leading to theincrement of the C�ab and hab values, indicating a more orange–red hue colour. The DE⁄ for the 425 and 500 MPa wines were eightand six, respectively, when compared with the unpressurisedwines after 6 months of storage, indicating that the difference ofcolour between unpressurised and pressurised wine samples of
res; B-loadings) and after 12 months of storage (C-scores; D-loadings) related to a⁄,

Tabl
e3
Tota
lph
enol
s,an
thoc
yani
nsan
dpr
oant
hocy
anid
ins
cont
ent
ofth
ew
ine
and
win
ede
posi
tssa
mpl
es,2
011
vint
age,
afte
r6
mon
ths
ofst
orag
e.
Para
met
er1
Win
eW
ine
depo
sit
Un
trea
ted
SO2
425
MPa
500
MPa
Un
trea
ted
SO2
425
MPa
500
MPa
Tota
lph
enol
icco
mpo
un
ds(m
g/bo
ttle
)242
6.26
±9.
54a
438.
13±
5.27
a38
1.93
±4.
50b
396.
70±
13.9
2b3.
02±
0.43
A0.
05±
0.01
B10
.81
±0.
93C
38.9
0±
3.38
D
An
thoc
yan
ins3
(mg/
bott
le)
Free
11.2
8±
0.61
ac21
.16
±2.
17b
9.61
±0.
46c
11.3
1±
0.27
a0.
16±
0.01
A0.
01±
0.01
B0.
24±
0.01
C0.
25±
0.01
C
Poly
mer
ic16
.15
±1.
62ab
18.2
7±
0.41
b14
.79
±0.
46a
15.4
9±
1.33
a0.
84±
0.01
A0.
04±
0.01
B0.
83±
0.02
A0.
92±
0.01
C
Tota
l27
.43
±1.
23a
39.4
2±
2.19
b24
.40
±0.
92c
26.8
0±
1.13
ac1.
00±
0.01
A0.
05±
0.01
B1.
07±
0.01
A1.
18±
0.02
C
Tota
lpr
oan
thoc
yan
idin
s(m
g/bo
ttle
)39
7.3
±68
.6a
372.
1±
58.9
a42
1.5
±12
9.9a
380.
7±
47.9
a9.
17±
0.84
A0.
61±
0.01
B31
.40
±1.
47C
95.2
1±
4.00
D
1A
llda
taar
eex
pres
sed
asm
ean
valu
e±
stan
dard
devi
atio
n(n
=3)
.In
the
sam
eli
ne,
diff
eren
tle
tter
s(n
on-c
apit
als
for
win
ean
dca
pita
lsfo
rbo
ttle
depo
sit)
indi
cate
sign
ifica
nt
diff
eren
ces
acco
rdin
gto
aTu
key
test
(p<
0.05
).2
An
thoc
yan
ins
data
are
expr
esse
das
mg
ofm
alvi
din
3-gl
uco
side
equ
ival
ents
.3
Tota
lph
enol
icco
mpo
un
dsda
taar
eex
pres
sed
asm
gof
gall
icac
ideq
uiv
alen
ts.
2564 M.C. Santos et al. / Food Chemistry 141 (2013) 2558–2566
2011 vintage was also perceptible by the human eye. None ofthese differences were perceived after 3 months of storage. Interms of AOA and TP, the behaviour was also similar to the2010 vintage, since the wine samples presented no significantdifferences (p < 0.05), at the beginning of storage or after3 months, but began to show different AOA and TP content after6 months. The pressurised wines presented an AOA and TParound 20% and 10% lower, respectively, than the unpressurisedwines. These results show that the effect of HHP treatments,namely the increase of the orange–red hue colour, as well asthe decrease of the antioxidant activity and total phenolic con-tent in the pressurised wine samples were similar for the twovintages (2010 and 2011) studied.
3.3. Phenolic characterisation of wine and deposits
During storage it was observed in the pressurised wine bottles alower amount of TP in wine and also a higher formation of depositswhen compared with the unpressurised wines. Therefore, theamount of TP, anthocyanins, and proanthocyanidins present inthe deposits formed in the wine bottles of 2011 vintage were quan-tified after 6 months of storage. The anthocyanins and proanthocy-anidins content were also quantified in the wine samples. Theseresults are presented in Table 3, expressed as amount (mg) per bot-tle (250 mL) for better comparison between the amount of pheno-lic content in the wines and deposits of each bottle.
The pressurised samples presented deposits with higher TP con-tent, 4- and 13-fold higher content in the 425 and 500 MPa samples,respectively, when comparing with the untreated sample. These re-sults are in accordance with the lower TP content present in the pres-surised wines (around 10%). In terms of total anthocyanins content,the wines without SO2 (untreated, 425 and 500 MPa) presented thelower amount in wine (mainly 425 MPa sample), but the higheramount in the deposits (mainly 500 MPa sample). The deposit ofthe wine with SO2 presented a very low amount of phenolic com-pounds when compared with the pressurised and untreated sample,pointing again to a lower rate of phenolic polymerisation and precip-itation due to the presence of SO2. All wine samples presented a sim-ilar proanthocyanidins content in wine (p < 0.05). However,considering that the amount of proanthocyanidins in the depositswere 3- and 10-fold higher for the samples pressurised at 425 and500 MPa, respectively, when compared with the untreated one(Table 3), it seems that the pressure treatments accelerated the poly-merisation of the wine phenolic compounds, forming compoundswith higher degree of polymerisation that became insoluble in winealong the storage time. These results are in accordance with the trans-formations reported to occur to anthocyanins during wine ageing(de Freitas & Mateus, 2011; Gonzalez-Manzano, Mateus, de Freitas,& Santos-Buelga, 2008; Monagas, Gomez-Cordoves, & Bartolome,2006). Therefore, the alterations that occur in the pressurised redwine characteristics, such more orange–red colour, the lower antiox-idant activity, total phenolic content, and anthocyanins content, maybe due to the increase of condensation reactions of phenolic com-pounds, resulting in compounds with higher polymerisation degree,namely anthocyanins and proanthocyanidins, along the wine aging.
3.4. Sensorial properties
The sensorial properties of the wines of 2010 vintage wereanalysed after 9 months of storage in order to assess the organo-leptic characteristics of the pressurised wines in terms of aroma,colour and taste. The results of the average scores of the panel-lists are displayed in Fig. 3.
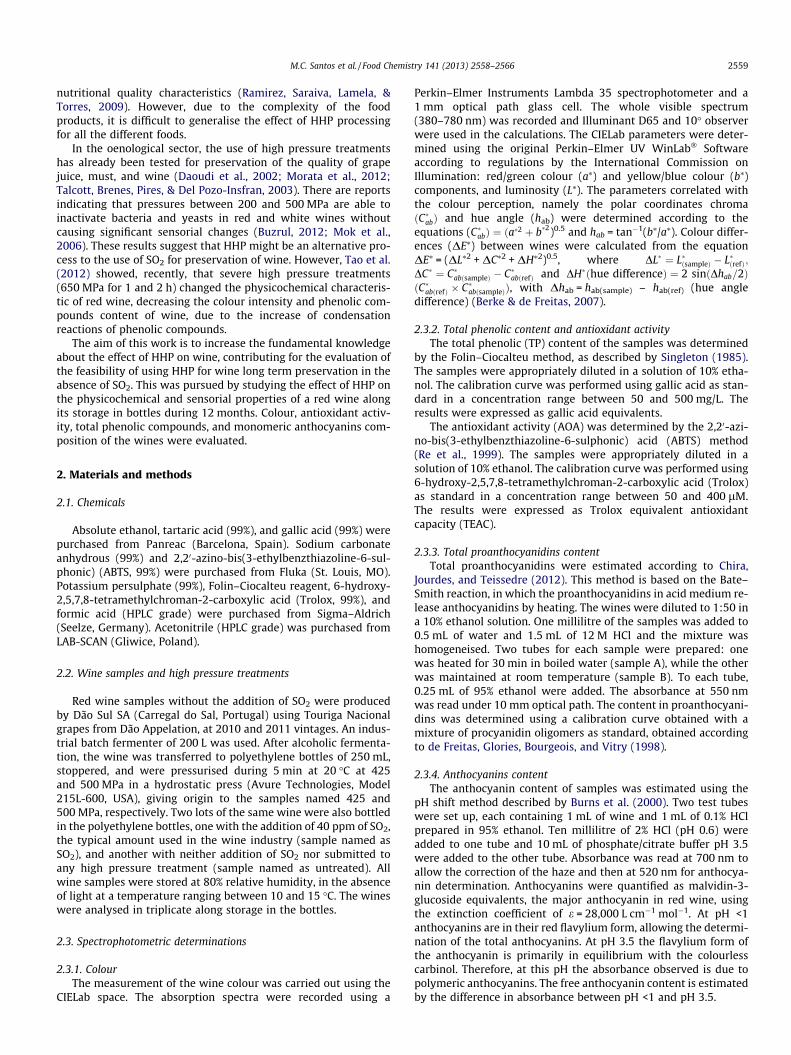
The wines pressurised at 425 MPa presented a very similar ar-oma compared to the wines with SO2 (Fig. 3A). However, the winepressurised at 500 MPa presented more scents of cooked fruit and
Fig. 3. Descriptive sensory analysis of the aroma (A), taste (B), colour (C), and global attributes (D) of wines, 2010 vintage, after 9 months of storage. (For interpretation of thereferences to colour in this figure legend, the reader is referred to the web version of this article.)
M.C. Santos et al. / Food Chemistry 141 (2013) 2558–2566 2565
spices aroma. The untreated wines presented less perceived fruityand floral aroma and had a more pronounced metallic and leatheraroma than the other wines. Comparing the taste assessment ofthe different wine samples, the pressurised wines presented a sim-ilar taste assessment than the wine with SO2 (Fig. 3B). The un-treated wines showed a higher acidity and lower balance. Interms of colour (Fig. 3C), the pressurised wines presented highervalues of brown and limpidity and lower values of violet thanunpressurised wines. These results are in agreement with the col-our analysis by CIELab parameters, since the pressurised wines pre-sented higher values of b⁄, L⁄, and hab. Therefore, the pressurisedwines showed, after 9 months of storage, a similar global assess-ment when compared with the wines with SO2, but a better globalassessment than the untreated wine (Fig. 3D).
The high pressure treatments seems to alter significantly thecolour, aroma, and taste of the wine after several months of stor-age. Although no differences were observed in the aroma, taste,mouth-feel, and overall sensorial quality between HHP treatedand untreated wine samples, immediately after the HHP treatment(Mok et al., 2006).
4. Conclusions
This work demonstrates that high pressure treatments withprocessing time of 5 min and pressures between 400 and500 MPa can influence red wine physicochemical and sensorialcharacteristics. However, the effects are only perceptible after, atleast, 6 months of storage.
The alterations that occur on the pressurised red wine charac-teristics, such as the more orange–red colour and the lower antiox-idant activity, total phenolic content, and anthocyanins content,are due to an increase of condensation reactions of phenolic com-pounds. These changes lead to aged wine-like characteristics anddo not affect negatively the global sensorial appreciation of wines.
This is the first report where physicochemical and sensorialcharacteristics of pressurised wines of two consecutive vintageswere evaluated during one year of bottle aging. The data presentedshowed that the use of HHP to pasteurise wine needs to be appliedwith care to minimise the impact on long term wine quality. Morestudies concerning the chemical reactions promoted by HHP treat-ments in wine are needed to identify the optimal conditions to pre-serve wine by this new technology. This work also shows that HHPtreatments promote reactions that are similar to those observedduring wine aging, giving a perceived sensorial idea of an old wine.It seems possible to exploit commercially the production, with thistechnology, of young red wines with pleasant and distinctcharacteristics.
Acknowledgements
The authors thank the financial support of Projects QREN – SII&DT Co-Promoção WineSulFree (No. 3462) and FCT – WineSulFree(PTDC/AGR-ALI/101251/2008), Research Unit 62/94 QOPNA (Pro-ject PEst-541 C/QUI/UI0062/2011), and FCT for the Grants (SFRH/BPD/46584/2008 and SFRH/BD/70066/2010). The authors alsothank Frubaça-Cooperativa de Hortofruticultores CRL for high pres-
2566 M.C. Santos et al. / Food Chemistry 141 (2013) 2558–2566
sure treatments of the wine samples and Professor Victor de Freitasfor the proanthocyanidins supplied.
References
Berke, B., & de Freitas, V. (2007). A colorimetric study of oenin copigmented byprocyanidins. Journal of the Science of Food and Agriculture, 87(2), 260–265.
Boido, E., Alcalde-Eon, C., Carrau, F., Dellacassa, E., & Rivas-Gonzalo, J. C. (2006).Aging effect on the pigment composition and color of Vitis vinifera L. cv. Tannatwines. Contribution of the main pigment families to wine colour. Journal ofAgricultural and Food Chemistry, 54(18), 6692–6704.
Burin, V. M., Falcao, L. D., Chaves, E. S., Gris, E. F., Preti, L. F., & Bordignon-Luiz, M. T.(2011). Phenolic composition, colour, antioxidant activity and mineral profile ofCabernet Sauvignon wines. International Journal of Food Science and Technology,45(7), 1505–1512.
Burns, J., Gardner, P. T., O’Neil, J., Crawford, S., Morecroft, I., McPhail, D. B., et al.(2000). Relationship among antioxidant activity, vasodilation capacity, andphenolic content of red wines. Journal of Agricultural and Food Chemistry, 48(2),220–230.
Buzrul, S. (2012). High hydrostatic pressure treatment of beer and wine: A review.Innovative Food Science & Emerging Technologies, 13, 1–12.
Cejudo-Bastante, M. J., Sonni, F., Chinnici, F., Versari, A., Perez-Coello, M. S., & Riponi,C. (2010). Fermentation of sulphite-free white musts with added lysozyme andoenological tannins: Nitrogen consumption and biogenic amines compositionof final wines. LWT-Food Science and Technology, 43(10), 1501–1507.
Chira, K., Jourdes, M., & Teissedre, P. L. (2012). Cabernet sauvignon red wineastringency quality control by tannin characterisation and polymerisationduring storage. European Food Research and Technology, 234(2), 253–261.
Corrales, M., Butz, P., & Tauscher, B. (2008). Anthocyanin condensation reactionsunder high hydrostatic pressure. Food Chemistry, 110(3), 627–635.
Dallas, C., & Laureano, O. (1994). Effect of SO2 on the extraction of individualanthocyanins and colored matter of three Portuguese grape varieties duringwinemaking. Vitis, 33(1), 41–47.
Daoudi, L., Quevedo, J. M., Trujillo, A. J., Capdevila, F., Bartra, E., Minguez, S., et al.(2002). Effects of high-pressure treatment on the sensory quality of white grapejuice. High Pressure Research, 22(3–4), 705–709.
de Freitas, V., Glories, Y., Bourgeois, G., & Vitry, C. (1998). Characterisation ofoligomeric and polymeric procyanidins from grape seeds by liquid secondaryion mass spectrometry. Phytochemistry, 49(5), 1435–1441.
de Freitas, V., & Mateus, N. (2011). Formation of pyranoanthocyanins in red wines:A new and diverse class of anthocyanin derivatives. Analytical and BioanalyticalChemistry, 401(5), 1463–1473.
Fredericks, I. N., du Toit, M., & Krugel, M. (2011). Efficacy of ultraviolet radiation asan alternative technology to inactivate microorganisms in grape juices andwines. Food Microbiology, 28(3), 510–517.
GarcÍa-Falcón, M. S., Pérez-Lamela, C., Martínez-Carballo, E., & Simal-Gándara, J.(2007). Determination of phenolic compounds in wines: Influence of bottlestorage of young red wines on their evolution. Food Chemistry, 105(1), 248–259.
Garcia-Ruiz, A., Bartolome, B., Martinez-Rodriguez, A. J., Pueyo, E., Martin-Alvarez, P.J., & Moreno-Arribas, M. V. (2008). Potential of phenolic compounds forcontrolling lactic acid bacteria growth in wine. Food Control, 19(9), 835–841.
Garde-Cerdan, T., Marselles-Fontanet, A. R., Arias-Gil, M., Ancin-Azpilicueta, C., &Martin-Belloso, O. (2008). Effect of storage conditions on the volatilecomposition of wines obtained from must stabilised by PEF during ageingwithout SO2. Innovative Food Science & Emerging Technologies, 9(4), 469–476.
Gonçalves, F. J., Rocha, S. M., & Coimbra, M. A. (2012). Study of the retentioncapacity of anthocyanins by wine polymeric material. Food Chemistry, 134(2),957–963.
Gonzalez-Manzano, S., Mateus, N., de Freitas, V., & Santos-Buelga, C. (2008).Influence of the degree of polymerisation in the ability of catechins to act asanthocyanin copigments. European Food Research and Technology, 227(1), 83–92.
Gutiérrez, I. H., Lorenzo, E. S.-P., & Espinosa, A. V. (2005). Phenolic composition andmagnitude of copigmentation in young and shortly aged red wines made fromthe cultivars, Cabernet Sauvignon, Cencibel, and Syrah. Food Chemistry, 92(2),269–283.
He, J., Santos-Buelga, C., Silva, A. M. S., Mateus, N., & de Freitas, V. (2006). Isolationand structural characterisation of new anthocyanin-derived yellow pigments inaged red wines. Journal of Agricultural and Food Chemistry, 54(25), 9598–9603.
Jiranek, V., Grbin, P., Yap, A., Barnes, M., & Bates, D. (2008). High power ultrasonicsas a novel tool offering new opportunities for managing wine microbiology.Biotechnology Letters, 30(1), 1–6.
Karbowiak, T., Gougeon, R. D., Alinc, J. B., Brachais, L., Debeaufort, F., Voilley, A., et al.(2010). Wine oxidation and the role of cork. Critical Reviews in Food Science andNutrition, 50(1), 20–52.
Li, H., Guo, A., & Wang, H. (2008). Mechanisms of oxidative browning of wine. FoodChemistry, 108(1), 1–13.
Martinez, J. A., Melgosa, M., Perez, M. M., Hita, E., & Negueruela, A. I. (2001). Visualand instrumental color evaluation in red wines. Food Science and TechnologyInternational, 7(5), 439–444.
Mateus, N., & de Freitas, V. (2001). Evolution and stability of anthocyanin-derivedpigments during port wine aging. Journal of Agricultural and Food Chemistry,49(11), 5217–5222.
Mok, C., Song, K. T., Park, Y. S., Lim, S., Ruan, R., & Chen, P. (2006). High hydrostaticpressure pasteurisation of red wine. Journal of Food Science, 71(8), 265–269.
Monagas, M., Gomez-Cordoves, C., & Bartolome, B. (2006). Evolution of the phenoliccontent of red wines from Vitis vinifera L. during ageing in bottle. FoodChemistry, 95(3), 405–412.
Morata, A., Benito, S., González, M. C., Palomero, F., Tesfaye, W., & Suárez-Lepe, J. A.(2012). Cold pasteurisation of red wines with high hydrostatic pressure tocontrol Dekkera/Brettanomyces: Effect on both aromatic and chromatic qualityof wine. European Food Research and Technology, 235, 147–154.
Ramirez, R., Saraiva, J., Lamela, C. P., & Torres, J. A. (2009). Reaction kinetics analysisof chemical changes in pressure-assisted thermal processing. Food EngineeringReviews, 1(1), 16–30.
Re, R., Pellegrini, N., Proteggente, A., Pannala, A., Yang, M., & Rice-Evans, C. (1999).Antioxidant activity applying an improved ABTS radical cation decolorisationassay. Free Radical Biology and Medicine, 26(9–10), 1231–1237.
Ribéreau-Gayon, P., Glories, Y., Maujean, A., & Dubourdieu, D. (2006). Handbook ofenology volume 2: The chemistry of wine stabilisation and treatments (second ed., ).Chichester: John Wiley & Sons Ltd.
Rojo-Bezares, B., Saenz, Y., Zarazaga, M., Torres, C., & Ruiz-Larrea, F. (2007).Antimicrobial activity of nisin against Oenococcus oeni and other wine bacteria.International Journal of Food Microbiology, 116(1), 32–36.
Santos, M., Nunes, C., Saraiva, J., & Coimbra, M. A. (2012). Chemical and physicalmethodologies for the replacement/reduction of sulphur dioxide use duringwinemaking: Review of their potentialities and limitations. European FoodResearch and Technology, 234(1), 1–12.
Singleton, V. L. (1985). Citation classic – colorimetry of total phenolics withphosphomolybdic-phosphotungstic acid reagents. Current Contents/AgricultureBiology & Environmental Sciences (48). 18-18.
Sonni, F., Bastante, M. J. C., Chinnici, F., Natali, N., & Riponi, C. (2009). Replacement ofsulphur dioxide by lysozyme and oenological tannins during fermentation:Influence on volatile composition of white wines. Journal of the Science of Foodand Agriculture, 89(4), 688–696.
Talcott, S. T., Brenes, C. H., Pires, D. M., & Del Pozo-Insfran, D. (2003). Phytochemicalstability and color retention of copigmented and processed muscadine grapejuice. Journal of Agricultural and Food Chemistry, 51(4), 957–963.
Tao, Y., Sun, D.-W., Górecki, A., Blaszczak, W., Lamparski, G., Amarowicz, R., et al.(2012). Effects of high hydrostatic pressure processing on the physicochemicaland sensorial properties of a red wine. Innovative Food Science & EmergingTechnologies, 16, 409–416.
Vally, H., Misso, N. L. A., & Madan, V. (2009). Clinical effects of sulphite additives.Clinical and Experimental Allergy, 39(11), 1643–1651.