Colorado Wine Board Quantitative Wine User Research
67
Colorado Wine Board Quantitative Wine User Research Final Report ~ September 10, 2014
-
Upload
khangminh22 -
Category
Documents
-
view
0 -
download
0
Transcript of Colorado Wine Board Quantitative Wine User Research

Colorado Wine BoardQuantitative Wine User ResearchFinal Report ~ September 10, 2014

Table of ContentsBackground & Objectives p 3Executive Summary p 4Recommendations p 6
Detailed Findings p 8-Total – all wine drinkers p 9-Sub groups:
Weekly vs. monthly wine drinkers p 28Gender & age p 37Core CO Wine drinkers p 47
2

Background & Objectives
Background:The Colorado Wine Industry Development Board (CWIDB) is interested in tracking Colorado wine consumers’ awareness, usage & attitudes toward wine and Colorado wine in particular. Research was conducted in March, 2014
Research Objectives:• Identify core wine drinkers & profile their demographics (age, income, consumption behavior).• Measure incidence levels of Colorado wine drinkers. • Compare core vs. occasional wine drinkers on key measures for Colorado wine awareness,
usage & attitudes.
Methodology:• Online quantitative test using Survey Monkey research tool. • Focus RSI wrote the survey questionnaire & CWIDB staff programmed & collected responses.• Survey Monkey provided respondents via their panel.
Respondent Criteria:• Male & Females• Ages 21-70• Residents of Colorado• Consume wine 1+/month (also collected Special occasion/ Holiday wine drinkers)• Ensure/ quota sub-cell of n=100 1+/week wine drinkers.
3

Executive Summary
4

Key Insights: Wine drinkers are aware of Colorado wine & the majority have tried Colorado wines: But these wine drinkers are not consuming CO wine on a regular basis.• 84% are aware of CO wine & 74% have consumed / tried CO wine. • Only 5% state they purchase CO wine monthly & none on a weekly basis.
Even though many don’t buy CO wine frequently, future purchase interest for CO wine is good:50% purchase CO wine less than once a year, or not at all.• However, 55% are interested in purchasing CO wine in the future – showing upside potential.
Perceptions of quality for CO wine is lower vs. California & Europe: However, wine drinkers believe CO wine is improving in quality.• 37% of wine drinkers associate above average quality with CO wines, 71% for California wines & 69% for Europe
wines. (slide 21)• This holds true among all sub groups - even Core CO wine purchasers.
They are not spending a lot per bottle. 79% spend less than $15 per bottle.• CO wine is on par with California wine in terms of price they expect to pay among all wine drinkers.• Interestingly, among Core Colorado wine drinkers, price expected for CO wine is higher than California wines,
where more people expect to pay $9-$12 per bottle for California wines vs. Colorado wines. (slide 53)
They don’t know what to expect from CO wine: California and European wines set clear expectations of taste characteristics. • A significantly lower number of wine drinkers associate characteristics with Colorado wines. (slide 20)• As a result, a fewer percent of wine drinkers associate Colorado wine with typical wine occasions (slide 17)
5

Key Insights: They don’t know much about Colorado wine growing regions - 50% have never heard of regions. Further, knowledge of wine regions is not a driver when selecting brands of wine. More important in terms of wine selection drivers is price, style of wine, friend recommendation & the ability to taste the wine before buying it. (slide 26)• Wine drinkers do state interest in local growers and wine tasting events, however, the Colorado growers and
wine regions angle alone does not communicate why to buy Colorado wine.
Distribution in on premise accounts for CO wines may be a barrier to consumption. Trial / Sampling are key for Colorado wines in bars & restaurants. • Buying a glass is less risky vs. a bottle when trying a new wine. • However, significantly fewer wine drinkers purchased CO wine from bars & restaurants vs. wine in general. Said
another way – they purchase wine in these locations – but not CO wine. (slide 15)
Among sub groups, Occasional and Holiday consumers are less apt to purchase & consume CO wine. 67% have either “never purchased” or have done so less than once a year. • Likely these occasional wine drinkers are purchasing and consuming popular, mainstream wine brands.
Those who like to experiment, tasting new wines are more apt to purchase Colorado wines. 69% of Core Colorado wine purchasers state they like to experiment (slide 57)• Core CO wine purchasers buy wine monthly or more frequently & have purchased CO wine weekly to several
times per year. (see slide 47 for profile on this key target consumer).
Primary competition to CO wine is California wine. Core Colorado wine purchasers are also interested in purchasing California wine.• They see California wine as higher quality vs. Colorado wine.• Core CO wine drinkers also view CO wine as slightly more expensive – thus, a lesser value. • They do not associate benefits and characteristics with drinking CO wine.
6
Recommendations
7

Recommendations Define taste expectations of Colorado wine.• Wine drinkers do not know what CO wine tastes like; how it’s different vs. other wines. • They don’t understand why it tastes better vs. California wines. • They see California wines as higher in quality vs. Colorado wines – yet priced cheaper. • Wine drinkers are VERY interested in value. • Thus – California wines are a natural choice for most occasions.
Turn Colorado wine into a benefit to consumers – why is it better? • Just as Napa Valley or Sonoma are known for certain characteristics, so could Colorado wines. • Educate consumers on unique characteristics of Colorado wines vs. California wines. • Educate consumers on a specific style of wine (or grape) that only Colorado can produce the best – better than
California, the primary competition. • Turn the local CO wine angle into a consumer benefit that is relevant to wine drinkers based on their perceptions
(which may not always be accurate – as in, “the sulfites give me headaches”). • Fresher tasting – less shipping time• Less tannins; preservatives, sulfites, tyramine (these may be current perceptions among consumers to leverage) • Less headaches due to soil conditions, purer ingredients (yeasts)
Define usage occasions for Colorado wine.• Colorado wines are currently not a strong fit for multiple wine occasions.• Educate wine consumers when to drink CO wine – food pairings, certain occasions and why it’s a better fit for these
occasions vs. competitive wines.
Target “Core” monthly wine consumers that are experimental by nature & who have purchased CO wine in the past:• Increase distribution in bars, restaurants & all on premise accounts. There should be at least one CO wine on the
drink list – just as there are local beers on the beer list. • Where possible, host tastings and wine events – at retail – not at wineries, which are far removed from most core
wine drinkers.
8

Detailed Findings
9
Among total sample of wine drinkers

Who are wine drinkers?: Penetration:• Of all the people entering the survey, 64% indicate they drink wine in the past month. • Spirits are consumed among 51% of respondents entering the survey & beer among 48%.
10
Q.4 Which of the following alcoholic beverages have you consumed in the past month? Please check all that apply.Q. 7 What range does your annual household income fall into?
Past month consumption – among all entering survey% total entering the survey (prior to screening for wine
drinkers, n=1870)Wine 64%
Beer 48%
Spirits/Mixed drinks (whiskey, vodka, rum, gin, tequila, etc.) 51%
11%
9%
15%
20%
18%
17%
10%
NA
<$30k
$30k‐$49k
$50k‐$74k
$75k‐99k
$100k‐$150k
>$150k
Income of wine drinkersAmong wine drinkers (n=1315)Income of wine drinkers:
• 45% of wine drinkers earn $75,000+ in annual household income.

Age & Gender of wine drinkers: Age• 52% of respondents that consume wine are 51+.• Wine consumption is fairly represented by age;
19% are ages 21-35.
11
Gender• 78% of wine drinkers were female – note
that this does not necessarily reflect wine consumption by gender, rather response rates among panel respondents.
22%
78%
Gender(Total wine drinkers, n=1315)
Male Female
19%
29%38%
14%
Age of Respondents(Total wine drinkers, n=1315)
21‐35
36‐50
51‐65
66+
Q.1 What is your gender? Q.2 In which range does your age fall?

Frequency of wine consumption: • 43% consume wine weekly or more frequently.• 30% consume wine 1-3 times per month. • 26% of wine drinkers consume wine on an occasional basis – holidays &
special occasions only.
12
Q.5 On average, how often do you drink wine?Note: Total sample = wine drinkers
17% were screened out of the survey as never drinking wine.
8%
22%
14%
19%
11%
26%
Frequency of Wine Consumption(Total wine drinkers; n=1315)
Daily
More than once a week
Once a week
2‐3 times per month
Once a month
Special occasions,holidays only

Awareness of CO wine production is high:• 84% of wine drinkers know wine is produced in Colorado. 98% know wine is produced in California.• When asked what geographic areas come to mind when thinking about wine production, California, Italy,
Australia and Colorado rise to the top.
13
Q. 8 What geographic areas come to mind when thinking about where wine is produced? Write in.Q. 9 From which of the following geographic areas have you ever heard of wine being produced?
Other (23%) – open ends
98%94% 94%
84%
78%
61%
54% 53%
37%
31%
17%
9%6%
23%
Where heard of wine produced (aided list)(n=1315)
Areas come to mind – open endWord Cloud – most mentioned in larger text

Penetration of CO wine consumption is 74%:• 74% of wine drinkers residing in Colorado have consumed Colorado wine. Note that this is not a frequency
of consumption by region, rather incidence of ever consuming CO wine (refer to slide 18 for frequency).• Said another way, this means 26%* have never consumed CO. wine. • Beyond Colorado, California and European wines rise to the top in terms of consumption.• Under other – open end word cloud show frequent mentions of Australia, Germany, Chile, Greece.
14
Q. 10 From which of the following geographic areas have you consumed wine? Check all that apply.*Note –Q. 16 indicates 22% have never purchased CO wine. And data from Q. 25 indicate that 37% have never consumed or purchased CO wine.
Word CloudOther (25%) – open ends
93%
74% 73% 72%
53%
42% 40% 37%
25%17%
11%3% 2%
25%
From where consumed wine (aided list)(n=1315)

Wine purchase location - wine in general vs. CO wine:• Restaurants show a large % difference between where people buy wine in general vs. where they buy CO wine. • 68% purchase wine in restaurants, however, only 46% purchase CO wine in restaurants. This could be due to a
lack of distribution of CO wines in restaurants. • Large gaps (indicated in red boxes) also exist in bars, large volume discount & neighborhood liquor stores.
15
Q. 11 Approximately what percent of all the wine you bought during the past year, or so, came from the following retail locations? It's OK to enter 0 if you have not purchased wine from a particular location. YOUR ANSWERS MUST TOTAL TO 100%.Q 26 What percent of all the Colorado wine you bought, during the last year or so, was from the following locations? It's OK to enter 0 if you have not purchased wine from a particular location. Again, please give us a quick estimate from memory. YOUR ANSWERS MUST TOTAL TO 100%.
Note: Data adjusted to % population. Survey Monkey did not tally to 100%; thus actual share numbers are incorrect in Survey Monkey data output for these two questions.
% people buying wine at each locationCO wine
(n=833, CO wine purchasers)
Wine in general(n=1513, total
sample)
Neighborhood liquor store 72% 91%
Wine specialty shop 42% 53%
Large, volume discount liquor store 46% 68%
Grocery store that sells wine 33% 51%
Restaurants 46% 73%
Bars 34% 54%
Farmer's markets 36% 44%
Winery or wine tasting room 51% 51%
Internet 30% 43%
Wine Club (on-line, from a winery or mail-order) 32% 46%
Other (e.g. sports/concert venue or wine festival) 30% 39%
DC1

Slide 15
DC1 IT is interesting that 44% of wine in general reported purchased from farmers markets, when only CO wine is available at farmers markets. Yet only 31% of CO wine is reported as coming from farmers markets.
There is either a glitch in the question or the calculation due to the note at the bottom.Doug Caskey, 9/10/2014

79% spend under $15/ bottle:• 34% of wine drinkers typically spend $12-$14.99 on a bottle of wine.• 45% typically spend less than $12 per bottle. • Most (58%) don’t shop for wine in a winery. However, 42% of respondents do and 26% of respondents pay
“somewhat more” for wine from a winery shop.
16
Q. 13 How much do you typically spend on a standard (750 ml) bottle of wine at a liquor store, a grocery store, or a specialty wine shop?Q. 14 If you buy wine directly from a winery (in person or via a winery's website), do you typically spend more or less than you do at a liquor store or wine shop?
12%
33%
34%
14%
5%
2%
0%
% People spending $ on bottle of wine (n=1315)
> $9/bottle
$9‐$11.99
$12‐$14.99
$15‐$19.99
$20‐$24.99
$25‐$39.99
$40+/bottle (0%)
5%
26%
9%
2%0%
58%
Winery spending behavior(n=1315)
Significantly more
Somewhat more
About the same
Somewhat less
Significantly less (0%)
I don't buy wine directlyfrom a winery.
DC2

Slide 16
DC2 Strategy thought: if we can't meet their price point or upsell them on CO wines, how do we target the $15 and above consumer?Doug Caskey, 9/10/2014

Occasions for wine & for Colorado wine: 17
• Respondents participate in a wide variety of wine occasions.
• 86% say they drink / purchase wine for holidays or special occasions. For this same occasion, only 63% say Colorado wine is a “fit.”
• Occasions that best fit CO wine include friend’s house, gift, entertaining guests and holiday meal or special occasions.
• CO wine is more of a “fit” vs. wine in general for outdoor picnics & a gift to a co-worker/casual friend.
Q. 15 In which of the following situations have you consumed or purchased wine over the last year or so? Check all that apply.Q. 28 For which of the following situations or occasions does Colorado wine fit in your opinion? Check all that apply.
43%
64%
40%
52%
64%
65%
58%
63%
31%
46%
54%
57%
67%
74%
77%
86%
Outdoor ‐ picnic or BBQ
As a gift for a co‐worker or casual friend
At home while cooking
At home alone, while relaxing, reading orsome other activity without food
At home entertaining guests
At a friend's house for a meal or a party
At a restaurant before or with a meal
For a holiday meal or special occasion
Where consume wine vs. fit for CO wine(% wine drinkers)
Wine Occasion consumed or purchased (n=1315)
Co Wine Occasion Fits n=833
DC3

Slide 17
DC3 CO is strongest as a gift or shared over a meal, especially outside meals. But not strong when shared for the holidays.
Is sharing the secret of CO wines the hook?Doug Caskey, 9/10/2014

Frequency of wine purchased by region:• California wine is consumed monthly by 22% of wine drinkers, while Colorado wine by only 5% of wine
drinkers. This is the gap to close.• 22% say they have never purchased CO wine. This is another gap number to lower between now and the
next tracking study. • 28% say they purchase CO wine less than once per year – very infrequent. • Only 5% state they purchase CO wine monthly & none on a weekly basis.
18
Q. 16 How often do you typically purchase wine from each of the following geographic areas?
% wine drinkers Have never purchased
Less than once a year
Around once a year
A few times a year Monthly Weekly
European Wine 16% 23% 14% 36% 10% 1%
Californian Wine 5% 13% 15% 40% 22% 5%
Colorado Wine 22% 28% 18% 27% 5% 0%
Washington Wine 49% 21% 12% 15% 3% 0%
Oregon Wine 52% 22% 11% 12% 3% 0%Other American Wine 34% 32% 15% 16% 3% 0%Australian or New Zealand Wine 33% 18% 15% 25% 8% 1%South American (e.g., Argentina, Chile, Uruguay) wine 41% 17% 13% 22% 7% 1%
South African wine 65% 16% 9% 9% 1% 0%
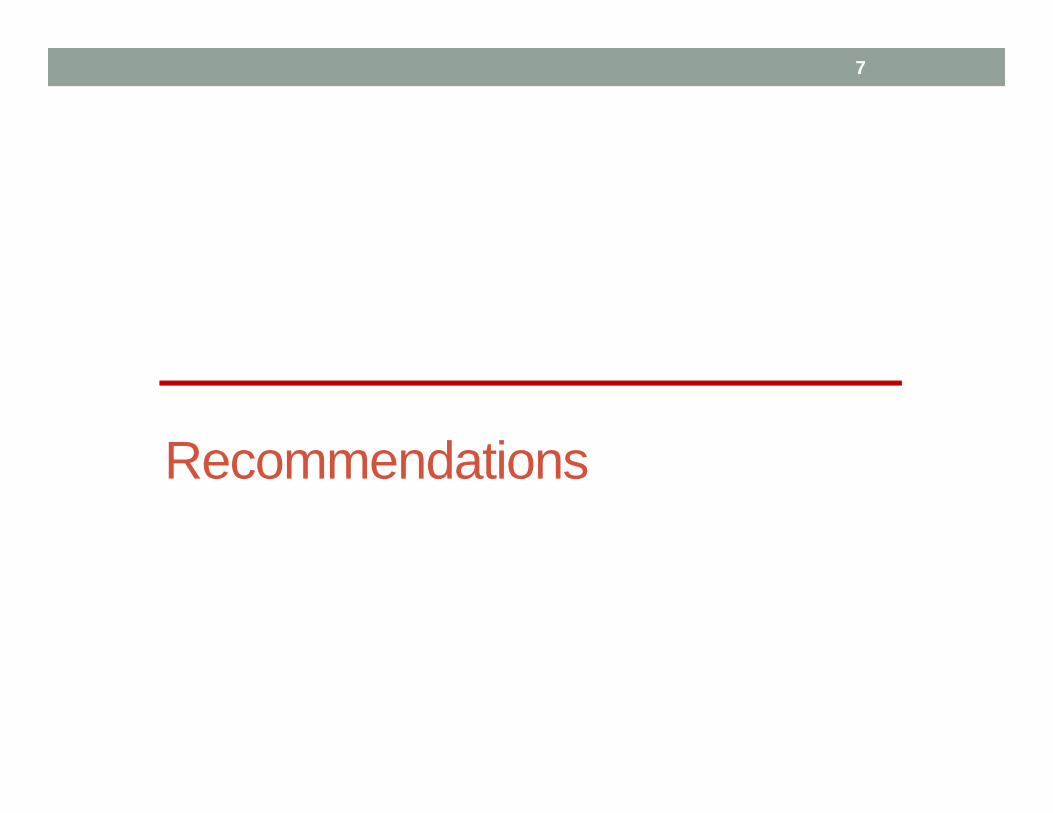
Future Purchase Interest:• 55% of respondents are interested in purchasing CO. wine in the future. • This is on par with European wine and shows upside potential for CO wine sales.
19
Q. 17 In the future, how interested are you in purchasing wine from each of the following geographic areas?
4%
2%
3%
5%
5%
6%
6%
7%
9%
9%
4%
9%
15%
16%
15%
14%
17%
24%
33%
20%
33%
44%
45%
50%
34%
36%
45%
30%
37%
34%
25%
24%
22%
30%
25%
16%
24%
37%
21%
11%
10%
8%
16%
16%
6%
European Wine
Californian Wine
Colorado Wine
Washington Wine
Oregon Wine
Other American Wine
Australian or New Zealand Wine
South American (e.g., Argentina, Chile, Uruguay) wine
South African wine
Future purchase interest of wine by region(n=1315)
Definitely will not buy Probably will not buy Might or might not buy Probably will buy Definitely will buy Top 2 Box % PI
22%
41%
46%
30%
34%
36%
55%
74%
54%
DC4

Slide 19
DC4 If they have an interest in CO wine, what is keeping them from buying it?Doug Caskey, 9/10/2014

Wine characteristics by region:• CO wine is expected to deliver slightly sweet or fruity characteristics by 23% of respondents as is California wine
(green boxes). Notably, expectations of CO wine are low among respondents – most respondents did not assign characteristics to CO wine.
• California wine has a variety of expectations of taste characteristics – showing consumers are familiar with its diversity of flavors.
• European wine is expected by respondents to be complex and structured & sweet.
20
Q. 18 Certain varieties and characteristics of wine may appeal to you more than others. If you were looking for the wine characteristics listed below, what one region would you most expect to deliver these characteristics? Check one per row. If you are unfamiliar with these regions or characteristics, have no opinion or just don't know, please select N/A
Among total wine drinkers (n=1315) European wine Californian wine Colorado wine N/A
Dry, crisp and clean 22% 34% 9% 36%
Slightly sweet or fruity 14% 32% 23% 31%
Very sweet dessert wine 30% 16% 11% 43%
Rich, oaky or full-bodied 22% 35% 7% 36%
Smooth, berry or velvety 17% 31% 14% 37%
Dry and tannic, but well-balanced 28% 22% 8% 42%
Complex and structured 38% 15% 4% 44%
Earthy 18% 21% 18% 43%
Food-friendly 17% 37% 13% 33%

Impressions of quality by region:• 71% of wine drinkers believe California wine has high or above average quality; 69% for European wine.• Only 37% believe Colorado wine has above average/ very high quality – indicating quality perceptions of
Colorado wine vs. California and Europe is an issue.
21
Q. 19 Select the statement that best describes your opinion and impression regarding the quality of wines from each of the following geographic areas. Check one in each row. If you have never tried wine from a particular region or have no opinion, please select N/A.Q. 20 Select the statement that best describes your opinion and impression of the change in quality of wines over time from each of the following geographic areas. Check one in each row. If you have never tried wine from a particular region or have no opinion, please select N/A.
Quality impressionsAmong total wine drinkers (n=1315)
Very poor quality Below average quality
Average quality
Above average quality
Very high quality N/A
European wine 0% 0% 11% 34% 35% 19%
California wine 0% 1% 15% 41% 30% 12%
Colorado wine 1% 7% 28% 27% 10% 26%
• 41% of wine drinkers believe Colorado wine is somewhat or significantly improving in quality.• 53% believe European wine is staying the same in terms of quality. • California wine is believed to be the same and improving among respondents – a positive outlook. • Very few believe any wines are declining in quality.
Changes in qualityAmong total wine drinkers (n=1315)
Quality significantly
declining
Quality somewhat declining
Quality staying about
the same
Quality somewhat improving
Quality significantly improving
N/A
European wine 0% 4% 53% 7% 4% 32%
Californian wine 0% 2% 39% 22% 10% 26%
Colorado wine 0% 1% 19% 27% 14% 39%
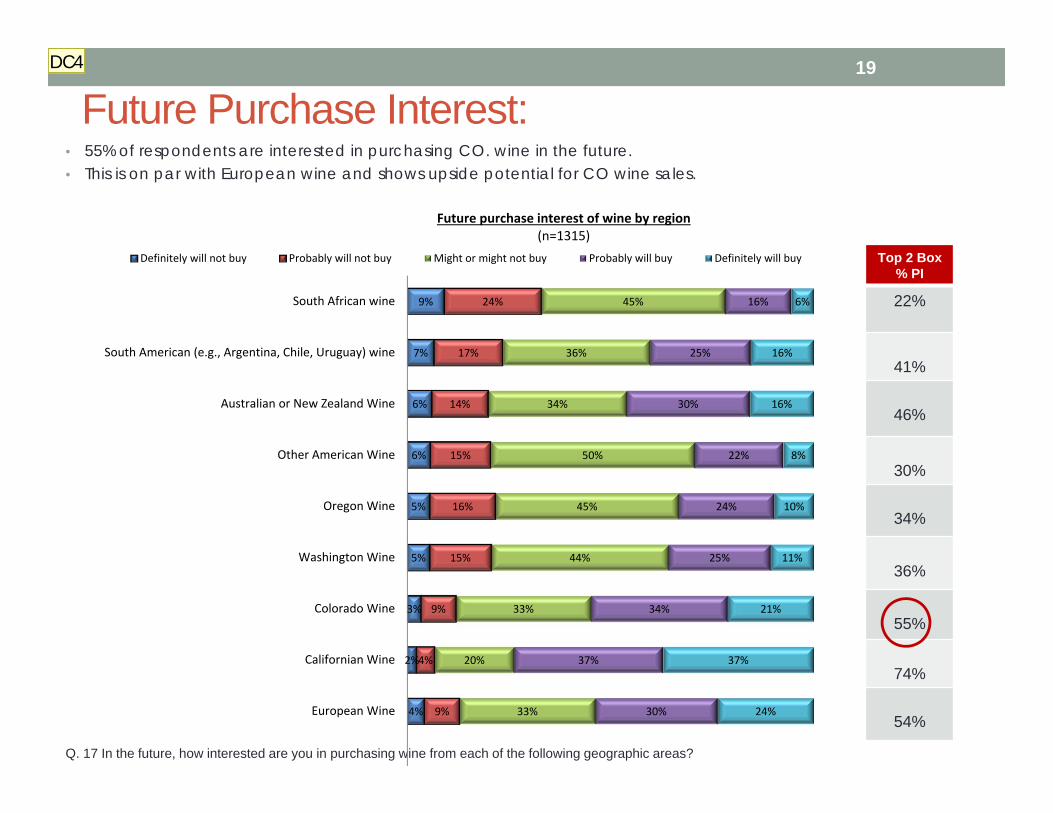
DC5
Slide 21
DC5 N/A for CO wine is higher than CA or Euro. So either people were fuging when they answered about awareness of CO wine, or they have no experience/impression of CO wine.
Is this another possible hook, calling for people to experience CO?Doug Caskey, 9/10/2014
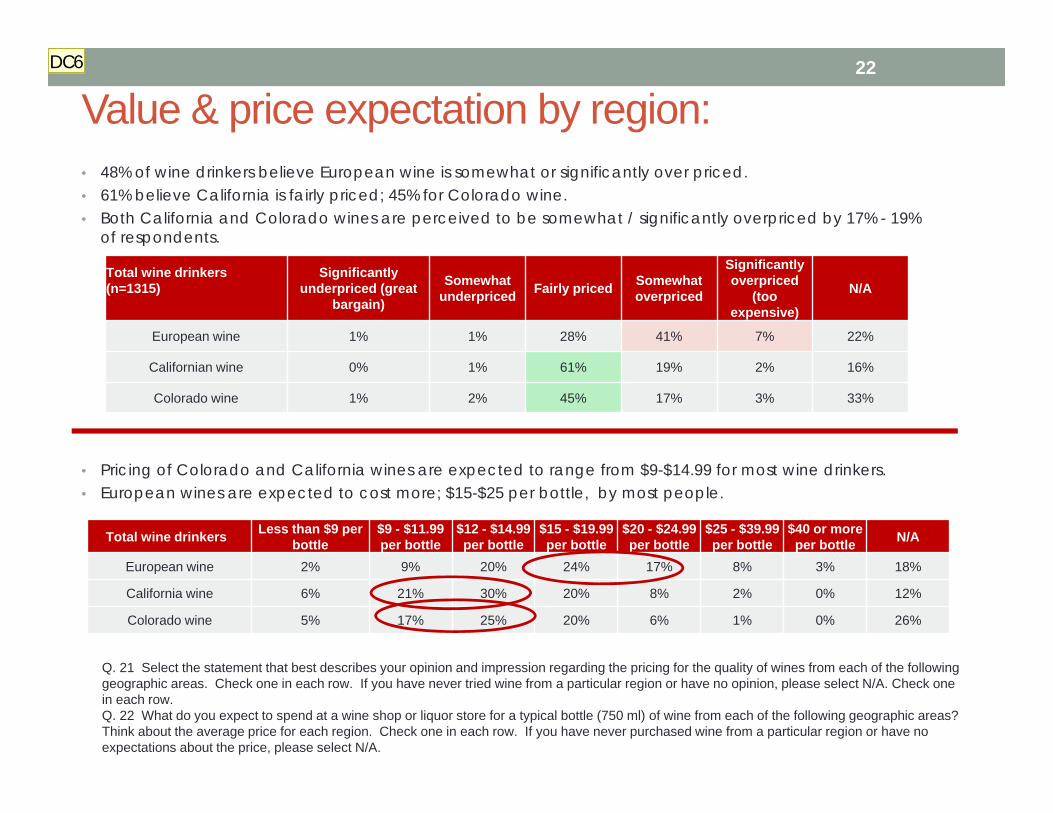
Value & price expectation by region:• 48% of wine drinkers believe European wine is somewhat or significantly over priced.• 61% believe California is fairly priced; 45% for Colorado wine. • Both California and Colorado wines are perceived to be somewhat / significantly overpriced by 17% - 19%
of respondents.
22
Q. 21 Select the statement that best describes your opinion and impression regarding the pricing for the quality of wines from each of the following geographic areas. Check one in each row. If you have never tried wine from a particular region or have no opinion, please select N/A. Check one in each row. Q. 22 What do you expect to spend at a wine shop or liquor store for a typical bottle (750 ml) of wine from each of the following geographic areas? Think about the average price for each region. Check one in each row. If you have never purchased wine from a particular region or have no expectations about the price, please select N/A.
Total wine drinkers (n=1315)
Significantly underpriced (great
bargain)
Somewhat underpriced Fairly priced Somewhat
overpriced
Significantly overpriced
(too expensive)
N/A
European wine 1% 1% 28% 41% 7% 22%
Californian wine 0% 1% 61% 19% 2% 16%
Colorado wine 1% 2% 45% 17% 3% 33%
• Pricing of Colorado and California wines are expected to range from $9-$14.99 for most wine drinkers. • European wines are expected to cost more; $15-$25 per bottle, by most people.
Total wine drinkers Less than $9 per bottle
$9 - $11.99 per bottle
$12 - $14.99 per bottle
$15 - $19.99 per bottle
$20 - $24.99 per bottle
$25 - $39.99 per bottle
$40 or more per bottle N/A
European wine 2% 9% 20% 24% 17% 8% 3% 18%
California wine 6% 21% 30% 20% 8% 2% 0% 12%
Colorado wine 5% 17% 25% 20% 6% 1% 0% 26%
DC6
Slide 22
DC6 Image problem here: do people expect us to be cheaper due to proximity and lower shipping costs or because of lower quality?
We may not want to compare ourselves, but this is a place where we might benefit from comparison.Doug Caskey, 9/10/2014

Awareness of Colorado wine regions:• 50% of wine drinkers in Colorado are not aware of wine growing regions in the state. • East Orchard Mesa, Grand Valley & the Arkansas Valley are known the by the most number of wine
drinkers.
23
Q. 23 Which of the following Colorado wine regions have you heard of or seen on a wine label? Check all that you have heard of.
8%
50%
1%
4%
6%
14%
15%
18%
18%
19%
Other (please specify)
None of the above
Bowie Corridor
West Elks American Viticultural Area
Surface Creek
Redlands
Montezuma County
Arkansas Valley
Grand Valley American Viticultural Area
East Orchard Mesa
CO. wine region awareness(n=1315)
DC7

Slide 23
DC7 And only 1% fell for the fake "Bowie Corridor"Doug Caskey, 9/10/2014

Purchased or consumed by Colorado wine regions:• 34% of wine drinkers that have consumed CO wines indicate they have purchased or consumed CO wine
from a winery or tasting room in the Grand Valley Region, followed by 28% from the Front Range region.
24
Q. 25 If you have purchased or consumed Colorado wine from a Winery or wine tasting room, check all the geographic areas from which you have purchased or consumed Colorado wine at a winery or wine tasting room. If you have never purchased or consumed Colorado wine, PLEASE SELECT ONLY "I HAVE NEVER PURCHASED OR CONSUMED...."
7%
9%
11%
15%
28%
34%
West Elks Region, including Paonia, Hotchkiss, Cedaredge
Montrose, Delta
Mountains, including Glenwood Springs, Minturn, Hartsel
Pikes Peak/Arkansas Valley Region, including Salida,Woodland Park, Cañon City, Colorado Springs
Front Range Region, including Denver, Boulder, FortCollins, Loveland, Estes Park, Castle Rock, Fort Morgan
Grand Valley Region, including Grand Junction, Palisade
% purchased or consumed from CO. Winery(n=1315 wine drinkers)
37% indicated they have not purchased or consumed CO wine in a winery or tasting room.

Opinions of Colorado wines:• The majority of respondents agree they like to “support local growers,” “have interest in visiting CO
wineries,” and are “interested in CO wine events.”• There is some perception that Colorado wines are NOT higher priced vs. California wines and are NOT
higher quality vs. California wines. • Many have no opinions regarding several statements (very high % numbers) – pesticides, antioxidants,
cooler nights/hotter days – likely due to a lack of education.
25
Q. 24 What are your opinions and impressions of Colorado wines even if you have never tasted any?
Among total wine drinkers (n=1315) Strongly disagree–
Somewhat disagree Neutral Somewhat
agreeStrongly
agreeNo
opinionColorado wines are fresher than other wines 2% 5% 39% 14% 4% 36%
I cannot find Colorado wines in stores 20% 23% 12% 16% 3% 26%
I like to buy Colorado and support local growers 2% 3% 14% 28% 33% 19%
I don’t think about Colorado wines as locally grown 30% 23% 13% 9% 4% 21%
Colorado wines are more expensive vs. California wines 9% 20% 23% 16% 4% 29%
Colorado wines are higher quality vs. California wines 7% 22% 34% 7% 2% 28%
Colorado wines have fewer pesticides vs. other wines 2% 6% 38% 7% 3% 46%
I am interested in visiting Colorado wineries 4% 5% 13% 32% 28% 17%
I am interested in Colorado wine tasting events 5% 6% 15% 29% 27% 18%
High-elevation wines have a greater concentration of antioxidants that may prevent some diseases 1% 2% 33% 8% 3% 52%
Wines in Colorado are exposed to cooler nights and hotter days resulting in higher quality grapes 1% 3% 30% 18% 6% 42%
DC9

Slide 25
DC9 Opportunity to elevate the impression of CO wine with more education about the advantages of lower pesticides, higher-elevation and cooler nights.Doug Caskey, 9/10/2014

Factors in buying Colorado wine: 26
• Pricing is a key driver when respondents are considering Colorado wine. They also want to taste it or see descriptions of taste.
• Style of wine & a friend’s recommendation are also selection drivers for many wine drinkers.• Region wine comes from - is important only to 23% - much lower than other factors.
Q. 29 If you buy Colorado wine in the future, which factors will be most important when deciding what Colorado wine to buy? Please rate each factor. Use N/A if you don't care about a factor or have no opinion.
Among total wine drinkers (n=1315) Important Neither important nor unimportant Unimportant N/A
Fair price for quality of wine 79% 9% 2% 9%Style of wine (red, white, rose, blend, fruit, plant) 77% 10% 3% 10%Friend’s recommendation 70% 17% 4% 9%Chance to taste the wine before buying it 65% 19% 5% 10%Description of wine flavor on label 60% 23% 6% 11%Store, restaurant, staff recommendation 55% 26% 8% 11%
Must be priced under a certain amount 54% 29% 7% 10%
Experiment –want to try a new wine I have not tasted before 53% 28% 7% 12%
Information displayed about the wine 53% 28% 7% 12%
Discounted price / on sale 45% 36% 8% 11%A wine I am familiar with in the past 41% 34% 12% 13%Won wine awards or medals 34% 38% 15% 13%Food / menu pairing 36% 36% 16% 13%Points rated 34% 33% 15% 18%Attractive label design 29% 44% 16% 12%Magazine / newspaper review or article 26% 39% 21% 14%Region that the wine is from 23% 45% 18% 14%History / heritage of winery 21% 48% 17% 14%Well-known winery name / brand name 20% 44% 22% 14%Eye catching wine display 20% 43% 22% 15%Internet – bloggers, social media recommendations, reviews 16% 36% 32% 17%

Advice from wine consumers: 27
• Survey Monkey does not have an advanced tool for open ends. Refer to excel spreadsheet, separate from this report for actual verbatims.
Q. 30 What other advice do you have for Colorado wine producers to get people like you to buy and drink more Colorado wine?
Q 30 – example of verbatims – refer to excel spreadsheet – separate from reportRestaurant availability, with informed sommeliers for tasting/pairingAvailability in local liquor stores, promote supporting local business and the impact of supporting local businessesOpportunities to taste and experience these wines e.g. served as a house wine in favorite restaurants, offered at events, reviews in local publications.I look for cool labels. Especially because I give bottles as gifts a good bit.Get it in stores other than high end specialty stores!Advertising to increase familiaritySince Colorado isn't well known for our vineyards- make sure to advertise appropriately!Should be fairly priced.Wine tours/tastingsbetter placement in restaurantsGet it into the stores.I don't recall ever seeing advertising for Colorado wines on the internet. Perhaps that would help.Advertise more locallyTourist bureau in winery locationoffer special tour pricesMore advertising away from winery, more wine parties.store tasting eventsIt would be great if it would be featured in restaurants I frequent with food pairings.Produce fine red wineskeep marketingjust keep making more wineAdvertise the health benefits and quality if that is true

Data breaks by sub groups
28
Frequency of wine consumption

Income by wine consumption frequency:• Seemingly, the more wealthy the individual, the more frequently he/she buys wine; 33% of wine drinkers
buy on a weekly basis and are $100k+ in household income.
29
Q. 7 What range does your annual household income fall into?Note: Data splits for this section of the report are based on Q. 5 On average, how often do you drink wine?
Income by wine consumption frequency
Total wine drinkers(n=1315)
Special Occasion/ Holiday(n=346)
1-3 times per month(n=400)
Weekly +(n=569)
<$30k 9% 12% 10% 6%
$30k-$49k 15% 17% 17% 13%
$50k-$74k 20% 18% 20% 21%
$75k-99k 18% 19% 18% 17%
$100k-$150k 17% 13% 17% 20%
>$150k 10% 7% 9% 13%

Awareness & consumption of CO wine production is highest among frequent wine drinkers:
• 90% of weekly to daily wine drinkers are aware of CO wine.
• Less frequent wine drinkers are less aware of CO wine.
30
.Q. 9 From which of the following geographic areas have you ever heard of wine being produced?
AWARENESS Total
Special Occasion /
Holiday1-3 times
per monthWeekly
+
California 98% 97% 98% 98%
Oregon 53% 37% 51% 65%
Colorado 84% 75% 81% 90%
New York 31% 24% 27% 37%
Idaho 9% 9% 6% 10%
New Mexico 17% 14% 15% 21%
Washington 54% 36% 49% 68%
Argentina 61% 35% 60% 77%
Spain 78% 65% 77% 87%
France 94% 91% 94% 96%
Italy 94% 90% 95% 96%
Slovenia 6% 6% 5% 6%
South Africa 37% 19% 34% 50%
• 82% of weekly to daily wine drinkers have consumed CO wine.
CONSUMPTION Total
Special Occasion /
Holiday1-3 times
per monthWeekly
+California 93% 97% 95% 96%
Oregon 37% 37% 33% 50%
Colorado 74% 75% 73% 82%
New York 17% 24% 17% 21%
Idaho 3% 9% 2% 4%
New Mexico 11% 14% 9% 16%
Washington 40% 36% 35% 56%
Argentina 42% 35% 39% 60%
Spain 53% 65% 51% 70%
France 72% 91% 70% 83%
Italy 73% 90% 75% 85%
Slovenia 2% 6% 2% 3%
South Africa 25% 19% 24% 37%
Q. 10 From which of the following geographic areas have you consumed wine? Check all that apply.

Frequency of CO wine purchase:• Colorado wine purchases are “a few times a year” for most wine drinkers, regardless of how frequently
they purchase wine. • More special occasion/holiday wine purchasers have never purchased CO wine.
31
Q. 16 How often do you typically purchase wine from each of the following geographic areas? Check one.Q. 17 In the future, how interested are you in purchasing wine from each of the following geographic areas?
Colorado Wine by wine consumption frequency
Never Purchased
Less than once a year
Around once a year
A few times a year Monthly Weekly
TOTAL Wine drinkers 22% 28% 18% 27% 5% 0%
Special occasions / Holiday 31% 36% 17% 16% 0% 0%
1-3 times/ month 23% 27% 19% 29% 3% 0%
Daily - Weekly 16% 25% 18% 33% 8% 0%
Future Purchase IntentMEANS ( 5 pt. scale) Total
Special Occasion / Holiday
1-3 times per month Weekly +
European Wine 3.60 2.99 3.64 3.95Californian Wine 4.02 3.41 4.00 4.40Colorado Wine 3.61 3.29 3.69 3.75Washington Wine 3.20 2.72 3.19 3.51Oregon Wine 3.16 2.70 3.18 3.42Other American Wine 3.11 2.74 3.11 3.33Australian or New Zealand Wine 3.36 2.71 3.38 3.74South American (e.g., Argentina, Chile, Uruguay) wine 3.26 2.60 3.20 3.71
South African wine 2.85 2.44 2.86 3.10
• Future Purchase Interest in CO wines is highest among more frequent drinkers.• Versus California wines, CO wines do not rate as high on future Purchase Intent.

Quality & price impressions by drinker frequency:• Colorado wine is perceived to be lesser quality by all types of wine drinkers, regardless of how frequently
they consume wine. • Note: 3.00 is an average rating on a 5 pt. scale. 4.00 is above average and 2.00 is below average.
32
• Colorado wine quality is perceived as more fairly priced (close to 3.00 MEAN ratings) among special occasion and monthly drinkers. However, more weekly/daily wine drinkers perceive CO wine to be slightly over priced vs. European & California wines.
Quality impressions by drinker frequency MEAN ( 5pt. Scale) Total
Special Occasion /
Holiday1-3 times per
month Weekly +European Wine 4.28 4.21 4.26 4.31California Wine 4.15 4.07 4.06 4.24Colorado Wine 3.52 3.73 3.47 3.46
Q. 19 Select the statement that best describes your opinion and impression regarding the quality of wines from each of the following geographic areas. Check one in each row. If you have never tried wine from a particular region or have no opinion, please select N/A.Q. 21 Select the statement that best describes your opinion and impression regarding the pricing for the quality of wines from each of the following geographic areas. Check one in each row. 1=significantly underpriced (great bargain) to 5 = significantly overpriced (too expensive); 3= fairly priced.
Value by user type MEAN (5 pt. scale) 1=underpriced5= overpriced Total
Special Occasion /
Holiday1-3 times per
month Weekly +European Wine 3.70 3.68 3.73 3.68California Wine 3.25 3.21 3.29 3.24Colorado Wine 3.28 3.13 3.19 3.40

Opinions & impressions of CO wines by drinker frequency:
• There’s no difference in the opinions and impressions of Colorado wine by frequency of wine drinker. • Local / Colorado wines are of interest.
33
Opinions and Impressions of Colorado Wines MEAN (5 pt. scale) 1= strongly disagree to 5 = strongly agree Total
Special Occasion/
holiday 1-3/monthly Weekly+Colorado wines are fresher than other wines 3.18 3.33 3.16 3.13
I cannot find Colorado wines in stores 2.47 2.33 2.40 2.57
I like to buy Colorado and support local growers 4.08 4.21 4.06 4.04
I don’t think about Colorado wines as locally grown 2.15 2.06 2.10 2.22
Colorado wines are more expensive vs. California wines 2.82 2.61 2.67 2.99
Colorado wines are higher quality vs. California wines 2.66 2.90 2.69 2.55
Colorado wines have fewer pesticides vs. other wines 3.05 3.10 3.05 3.03
I am interested in visiting Colorado wineries 3.92 3.65 3.95 4.03
I am interested in Colorado wine tasting events 3.81 3.45 3.81 3.98
High-elevation wines have a greater concentration of antioxidants that may prevent some diseases
3.18 3.20 3.29 3.10
Wines in Colorado are exposed to cooler nights and hotter days resulting in higher quality grapes
3.45 3.51 3.49 3.40
Q. 24 What are your opinions and impressions of Colorado wines even if you have never tasted any?

% people buying CO wine at each location
Total CO Wine drinkers (n=833)
Special Occasion/
Holiday CO Wine drinkers
(n=170)
1-3 / mo. CO wine drinkers
(n=256)
Weekly CO wine drinkers
(n=407)
Neighborhood liquor store 72% 74% 73% 71%Wine specialty shop 42% 34% 43% 44%Large, volume discount liquor store 46% 42% 47% 47%Grocery store that sells wine 33% 28% 36% 34%Restaurants 46% 37% 50% 47%Bars 34% 29% 37% 35%Farmer's markets 36% 33% 39% 35%Winery or wine tasting room 51% 39% 47% 58%Internet 30% 27% 32% 31%
Wine Club (on-line, from a winery or mail-order) 32% 27% 33% 33%
Other (e.g. sports/concert venue or wine festival) Specify below 30% 31% 32% 28%
Where purchase CO wine by frequency drinker group:• Most CO wine is purchased in a neighborhood liquor store, regardless of the wine drinker frequency sub
group.• Special Occasion / Holiday wine drinkers tend to purchase CO wine less vs. more frequent drinkers in wine
specialty shops, grocery stores, restaurants and bars.
34
Q 26 Where buy Colorado Wine?
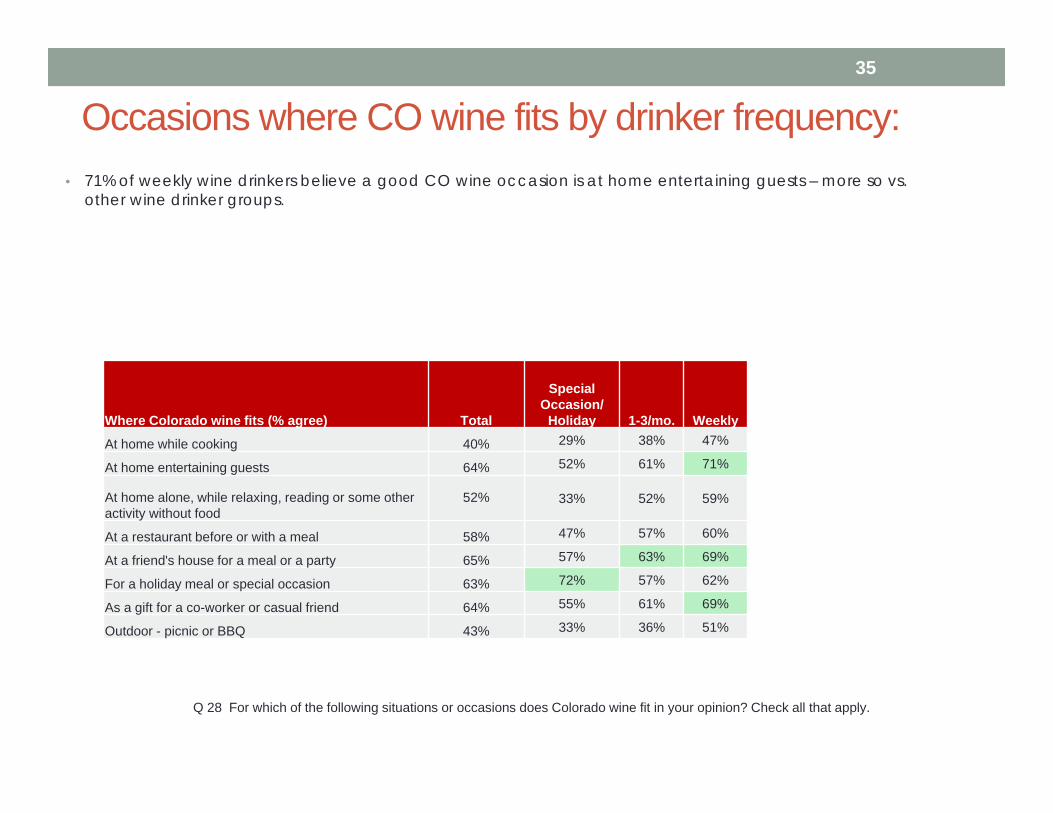
Where Colorado wine fits (% agree) Total
Special Occasion/
Holiday 1-3/mo. Weekly
At home while cooking 40% 29% 38% 47%
At home entertaining guests 64% 52% 61% 71%
At home alone, while relaxing, reading or some other activity without food
52% 33% 52% 59%
At a restaurant before or with a meal 58% 47% 57% 60%
At a friend's house for a meal or a party 65% 57% 63% 69%
For a holiday meal or special occasion 63% 72% 57% 62%
As a gift for a co-worker or casual friend 64% 55% 61% 69%
Outdoor - picnic or BBQ 43% 33% 36% 51%
Occasions where CO wine fits by drinker frequency:• 71% of weekly wine drinkers believe a good CO wine occasion is at home entertaining guests – more so vs.
other wine drinker groups.
35
Q 28 For which of the following situations or occasions does Colorado wine fit in your opinion? Check all that apply.
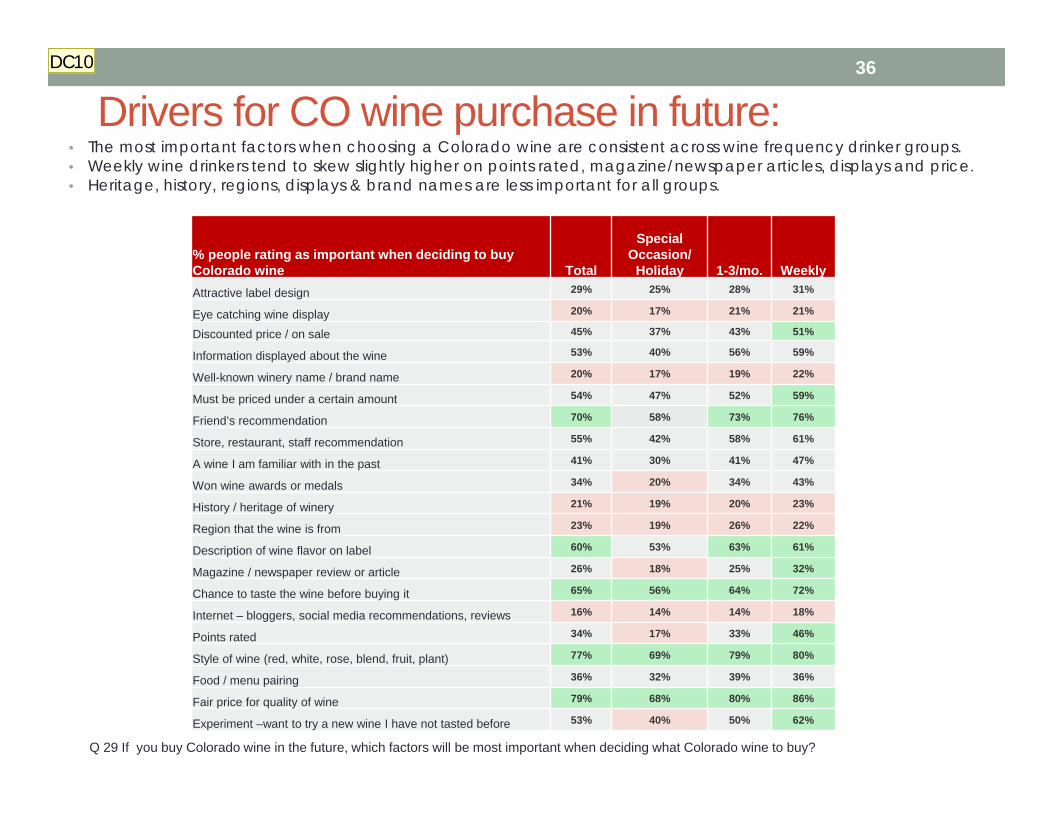
% people rating as important when deciding to buy Colorado wine Total
Special Occasion/
Holiday 1-3/mo. WeeklyAttractive label design 29% 25% 28% 31%
Eye catching wine display 20% 17% 21% 21%
Discounted price / on sale 45% 37% 43% 51%
Information displayed about the wine 53% 40% 56% 59%
Well-known winery name / brand name 20% 17% 19% 22%
Must be priced under a certain amount 54% 47% 52% 59%
Friend’s recommendation 70% 58% 73% 76%
Store, restaurant, staff recommendation 55% 42% 58% 61%
A wine I am familiar with in the past 41% 30% 41% 47%
Won wine awards or medals 34% 20% 34% 43%
History / heritage of winery 21% 19% 20% 23%
Region that the wine is from 23% 19% 26% 22%
Description of wine flavor on label 60% 53% 63% 61%
Magazine / newspaper review or article 26% 18% 25% 32%
Chance to taste the wine before buying it 65% 56% 64% 72%
Internet – bloggers, social media recommendations, reviews 16% 14% 14% 18%
Points rated 34% 17% 33% 46%
Style of wine (red, white, rose, blend, fruit, plant) 77% 69% 79% 80%
Food / menu pairing 36% 32% 39% 36%
Fair price for quality of wine 79% 68% 80% 86%
Experiment –want to try a new wine I have not tasted before 53% 40% 50% 62%
Drivers for CO wine purchase in future:• The most important factors when choosing a Colorado wine are consistent across wine frequency drinker groups. • Weekly wine drinkers tend to skew slightly higher on points rated, magazine/newspaper articles, displays and price. • Heritage, history, regions, displays & brand names are less important for all groups.
36
Q 29 If you buy Colorado wine in the future, which factors will be most important when deciding what Colorado wine to buy?
DC10

Slide 36
DC10 "Take your friends on the CO Wine experience."Doug Caskey, 9/10/2014
Data breaks by sub groups
37
Gender & Age

Wine consumption:Males vs. Females• A slightly higher percentage of females vs. males drink
wine. • A higher percent of men drink beer vs. females.• In terms of frequency, males and females are on par.
38
Incidence of drinking by alcoholic beverage type
Total before wine screen
(n=1870) Males (n=290)Females (n=1024)
21-35(n=275)
36-50(n=374)
51-65(n=492)
66+(n=174)
Wine 64% 73% 80% 57% 75% 79% 87%Beer 48% 76% 51% 70% 57% 52% 47%Spirits/Mixed drinks (whiskey, vodka, rum, gin, tequila, etc.) 51% 60% 58% 68% 63% 56% 42%
Q.4 Which of the following alcoholic beverages have you consumed in the past month? Please check all that apply.Q. 5 On average, how often do you drink wine?
Frequency of wine consumptionTotal wine drinkersN=1315
Males(n=290)
Females(n=1024)
21-35(n=275)
36-50(n=374)
51-65(n=492)
66+(n=174)
Daily 8% 8% 8% 3% 6% 9% 17%
More than once a week, but not every day 22% 19% 23% 23% 20% 22% 26%
Once a week 14% 11% 14% 17% 15% 12% 10%
2-3 times per month 19% 21% 19% 21% 18% 19% 18%
Once a month 11% 13% 11% 10% 12% 12% 11%
Special Occasions or holidays only 26% 29% 26% 26% 29% 27% 17%
Age• A higher percent of younger consumers tend to drink
beer & spirits vs. wine.• Older consumers have a high penetration of wine
consumption. • A higher percent of younger wine consumers tend to
consume wine monthly and at special occasions.

Where heard of wine produced? • A higher percent of older wine drinkers have heard of Colorado as a wine producing area. • Males and females, for the most part, are on par for not only Colorado wine awareness, but other
geographic areas, as well.
39
Where heard of wine production
Total wine drinkers (n=1315)
Males(n=290)
Females(n=1024)
21-35(n=275)
36-50(n=374)
51-65(n=492)
66+(n=174)
California 98% 97% 98% 97% 98% 98% 99%Oregon 53% 57% 52% 44% 54% 58% 55%Colorado 84% 82% 84% 75% 82% 88% 87%New York 31% 44% 27% 17% 21% 37% 57%Idaho 9% 10% 8% 5% 8% 11% 8%New Mexico 17% 20% 16% 14% 16% 19% 21%Washington 54% 56% 53% 47% 53% 56% 59%Argentina 61% 67% 59% 63% 60% 59% 67%Spain 78% 82% 77% 79% 77% 77% 82%France 94% 96% 93% 91% 95% 94% 96%Italy 94% 93% 94% 93% 95% 92% 95%Slovenia 6% 8% 5% 7% 4% 6% 8%South Africa 37% 44% 35% 30% 36% 39% 44%
Q. 9 From which of the following geographic areas have you ever heard of wine being produced?

From where consumed? • A higher percent of older wine drinkers have consumed Colorado before. • A higher percent of females have consumed Colorado wine.
40
Consumed wine from:
Total wine drinkers (n=1315)
Males(n=290)
Females(n=1024)
21-35(n=275)
36-50(n=374)
51-65(n=492)
66+(n=174)
California 93% 94% 92% 90% 91% 94% 97%Oregon 37% 39% 36% 28% 36% 40% 43%Colorado 74% 69% 76% 68% 74% 76% 80%New York 17% 26% 14% 6% 11% 21% 34%Idaho 3% 3% 3% 2% 2% 5% 2%New Mexico 11% 10% 12% 8% 10% 13% 13%Washington 40% 43% 38% 34% 37% 42% 48%Argentina 42% 48% 40% 41% 43% 41% 45%Spain 53% 59% 51% 52% 52% 51% 59%France 72% 79% 69% 67% 71% 72% 80%Italy 73% 73% 72% 69% 74% 74% 71%Slovenia 2% 3% 2% 1% 2% 2% 4%South Africa 25% 31% 24% 19% 26% 26% 31%
Q. 10 From which of the following geographic areas have you consumed wine? Check all that apply.*Note –Q. 16 indicates 22% have never purchased CO wine. And data from Q. 25 indicate that 37% have never consumed or purchased CO wine.

From where purchased? • A higher percent of younger wine drinkers tend to buy wine in multiple locations. • More older consumers buy wine at a neighborhood liquor store vs. other locations. • Restaurants are wine consumption locations as well. • Males and Females have similar purchase locations for wine.
41
Where purchased?
Total wine drinkers (n=1315)
Males(n=290)
Females(n=1024)
21-35(n=275)
36-50(n=374)
51-65(n=492)
66+(n=174)
Neighborhood liquor store 91% 84% 93% 96% 93% 89% 84%Wine specialty shop 53% 52% 53% 64% 59% 47% 40%Large, volume discount liquor store 68% 68% 68% 72% 68% 65% 66%Grocery store that sells wine 51% 48% 52% 63% 52% 46% 43%Restaurants 73% 69% 74% 80% 75% 70% 66%Bars 54% 51% 55% 68% 57% 48% 40%Farmer's markets 44% 40% 45% 57% 46% 39% 33%Winery or wine tasting room 51% 47% 52% 61% 52% 48% 39%Internet 43% 40% 44% 56% 46% 37% 33%Wine Club (on-line, from a winery or mail-order) 46% 44% 46% 58% 46% 41% 39%Other (e.g. sports/concert venue or wine festival) 39% 35% 40% 51% 38% 36% 29%
Q. 11 Approximately what percent of all the wine you bought during the past year, or so, came from the following retail locations? It's OK to enter 0 if you have not purchased wine from a particular location. YOUR ANSWERS MUST TOTAL TO 100%.
Note: Data adjusted to % population. Survey Monkey did not tally to 100%; thus actual share numbers are incorrect in Survey Monkey data output for these two questions.

Price paid per bottle:• $9 - $15 is the price point paid per wine bottle for most wine drinkers, regardless of age and gender.
42
Q.
Price per bottle
Total wine drinkers (n=1315)
Males(n=290)
Females(n=1024)
21-35(n=275)
36-50(n=374)
51-65(n=492)
66+(n=174)
Less than $9 per bottle 14% 11% 10% 9% 12% 18%
$9-$11.99 per bottle 30% 34% 39% 32% 29% 37%
$12-$14.99 per bottle 36% 33% 33% 32% 36% 33%
$15-$19.99 per bottle 13% 15% 12% 18% 16% 6%
$20-$24.99 per bottle 5% 5% 3% 7% 5% 3%
$25-$39.99 per bottle 1% 2% 2% 1% 2% 1%
More than $40 per bottle 0% 0% 0% 1% 0% 1%

Frequency of purchase – CO wine:• Most sub groups tend to buy CO wine rather infrequently – less than once a year to a few times a year.
43
Co wine purchase
Total wine drinkers (n=1315)
Males(n=290)
Females(n=1024)
21-35(n=275)
36-50(n=374)
51-65(n=492)
66+(n=174)
Have never purchased 22% 25% 21% 26% 22% 20% 20%
Less than once a year 28% 27% 29% 23% 30% 29% 30%
Around once a year 18% 21% 17% 16% 17% 18% 24%
A few times a year 27% 23% 28% 28% 26% 28% 23%
Monthly 5% 4% 5% 6% 5% 4% 4%
Weekly 0% 0% 0% 0% 0% 0% 0%
Q. 16 How often do you typically purchase wine from each of the following geographic areas?

Future PI by demographic group:• California wine has strong future purchase intent among all sub groups.• Of all sub groups, ages 21-35 have a higher percent interested in future purchase of CO wine.
44
Future Purchase IntentMEANS ( 5 pt. scale)
Total wine drinkers (n=1315)
Males(n=290)
Females(n=1024)
21-35(n=275)
36-50(n=374)
51-65(n=492)
66+(n=174)
European Wine 3.60 3.55 3.62 3.69 3.68 3.54 3.49Californian Wine 4.02 3.94 4.04 3.92 4.06 4.05 3.99Colorado Wine 3.61 3.49 3.64 3.78 3.67 3.53 3.41
Washington Wine 3.20 3.03 3.25 3.21 3.29 3.18 3.06
Oregon Wine 3.16 3.00 3.20 3.20 3.28 3.10 3.00Other American Wine 3.11 2.93 3.16 3.18 3.22 3.02 3.01Australian or New Zealand Wine 3.36 3.21 3.40 3.37 3.49 3.29 3.27
South American (e.g., Argentina, Chile, Uruguay) wine
3.26 3.18 3.28 3.33 3.41 3.16 3.11
South African wine 2.85 2.69 2.90 2.99 2.99 2.73 2.70
Q. 17 In the future, how interested are you in purchasing wine from each of the following geographic areas?

Quality & price impressions by subgroups:• Colorado wine is perceived to be lesser quality by all subgroups of wine drinkers, though slightly above average,
which is 3.00. • Note: 3.00 is an average quality rating on a 5 pt. scale. 4.00 is above average and 2.00 is below average.
45
• Colorado wine is viewed as close to fairly priced (3.00 MEAN score) by both males and females.• All subgroups view both Colorado and California wine as more fairly priced vs. European wines.
Q. 19 Select the statement that best describes your opinion and impression regarding the quality of wines from each of the following geographic areas. Check one in each row. If you have never tried wine from a particular region or have no opinion, please select N/A.Q. 21 Select the statement that best describes your opinion and impression regarding the pricing for the quality of wines from each of the following geographic areas. Check one in each row. 1=significantly underpriced (great bargain) to 5 = significantly overpriced (too expensive); 3= fairly priced.
Quality Mean scores (5 pt. scale)1=poor quality5=high quality
Total (n=1315)
Males (n=290)
Females (n=1024)
21-35(n=275)
36-50(n=374)
51-65(n=492)
66+(n=174)
European wine 4.28 4.19 4.30 4.22 4.37 4.28 4.16California wine 4.15 4.19 4.14 3.99 4.16 4.22 4.13Colorado Wine 3.52 3.57 3.50 3.45 3.48 3.57 3.52
Value by user type MEAN (5 pt. scale) 1=underpriced3= fairly priced 5= overpriced;
Total (n=1315) Males (n=290)
Females (n=1024)
21-35(n=275)
36-50(n=374)
51-65(n=492)
66+(n=174)
European wine 3.70 3.70 3.69 3.68 3.66 3.72 3.73
California wine 3.25 3.70 3.69 3.26 3.28 3.25 3.18Colorado Wine 3.28 3.29 3.27 3.28 3.24 3.30 3.29
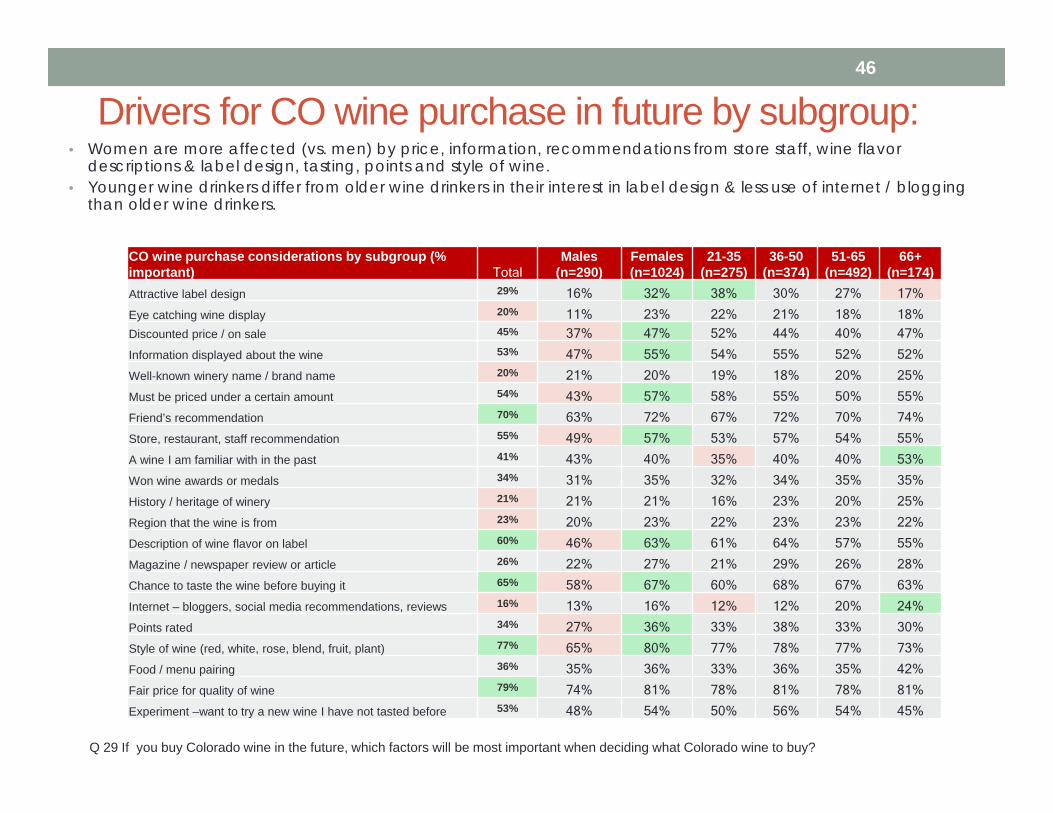
CO wine purchase considerations by subgroup (% important) Total
Males (n=290)
Females (n=1024)
21-35(n=275)
36-50(n=374)
51-65(n=492)
66+(n=174)
Attractive label design 29% 16% 32% 38% 30% 27% 17%
Eye catching wine display 20% 11% 23% 22% 21% 18% 18%Discounted price / on sale 45% 37% 47% 52% 44% 40% 47%
Information displayed about the wine 53% 47% 55% 54% 55% 52% 52%
Well-known winery name / brand name 20% 21% 20% 19% 18% 20% 25%
Must be priced under a certain amount 54% 43% 57% 58% 55% 50% 55%
Friend’s recommendation 70% 63% 72% 67% 72% 70% 74%
Store, restaurant, staff recommendation 55% 49% 57% 53% 57% 54% 55%
A wine I am familiar with in the past 41% 43% 40% 35% 40% 40% 53%
Won wine awards or medals 34% 31% 35% 32% 34% 35% 35%
History / heritage of winery 21% 21% 21% 16% 23% 20% 25%
Region that the wine is from 23% 20% 23% 22% 23% 23% 22%
Description of wine flavor on label 60% 46% 63% 61% 64% 57% 55%
Magazine / newspaper review or article 26% 22% 27% 21% 29% 26% 28%
Chance to taste the wine before buying it 65% 58% 67% 60% 68% 67% 63%
Internet – bloggers, social media recommendations, reviews 16% 13% 16% 12% 12% 20% 24%
Points rated 34% 27% 36% 33% 38% 33% 30%
Style of wine (red, white, rose, blend, fruit, plant) 77% 65% 80% 77% 78% 77% 73%
Food / menu pairing 36% 35% 36% 33% 36% 35% 42%
Fair price for quality of wine 79% 74% 81% 78% 81% 78% 81%
Experiment –want to try a new wine I have not tasted before 53% 48% 54% 50% 56% 54% 45%
Drivers for CO wine purchase in future by subgroup:• Women are more affected (vs. men) by price, information, recommendations from store staff, wine flavor
descriptions & label design, tasting, points and style of wine.• Younger wine drinkers differ from older wine drinkers in their interest in label design & less use of internet / blogging
than older wine drinkers.
46
Q 29 If you buy Colorado wine in the future, which factors will be most important when deciding what Colorado wine to buy?

Data breaks by sub groups
47
Core Colorado wine drinkers (n=362):• Among monthly/ weekly / daily wine drinkers (Q 5)• Also purchasing Colorado wine a few times/year to weekly (Q 16)

Core Colorado wine drinkers:• Among Core Colorado wine purchasers, 88% purchased wine more than once a month.• 83% purchased Colorado wine monthly or more frequently.
48
Q. 5 On average, how often do you drink wine?
10%
33%
21%
24%
12%
Frequency of wine consumptionAmong Core –(monthly+ wine drinkers & purchase CO wine
few times/yr. to weekly)(n=362)
Daily
More than once a week, but not every day
Once a week
2‐3 times per month
Once a month
83%
17%
0.6%
Frequency of CO wine purchaseAmong core (n=362)
A few times a year Monthly Weekly
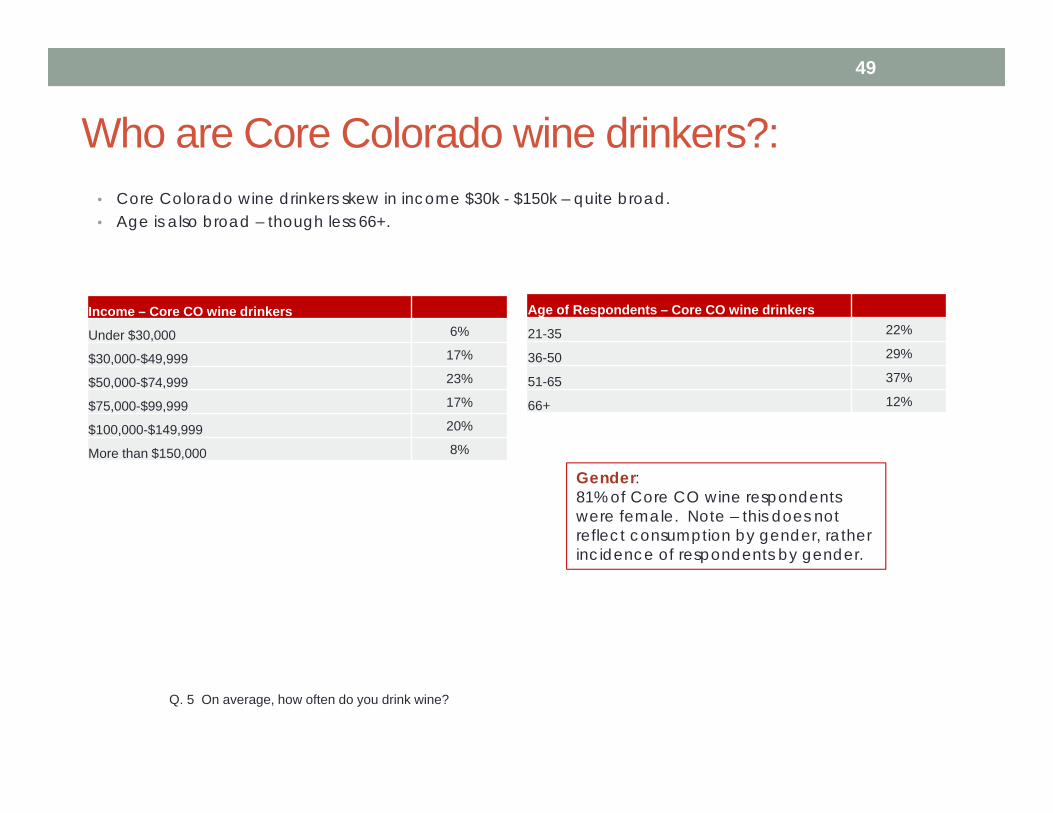
Who are Core Colorado wine drinkers?:• Core Colorado wine drinkers skew in income $30k - $150k – quite broad.• Age is also broad – though less 66+.
49
Q. 5 On average, how often do you drink wine?
Income – Core CO wine drinkers
Under $30,000 6%
$30,000-$49,999 17%
$50,000-$74,999 23%
$75,000-$99,999 17%
$100,000-$149,999 20%
More than $150,000 8%
Age of Respondents – Core CO wine drinkers
21-35 22%
36-50 29%
51-65 37%
66+ 12%
Gender:81% of Core CO wine respondents were female. Note – this does not reflect consumption by gender, rather incidence of respondents by gender.
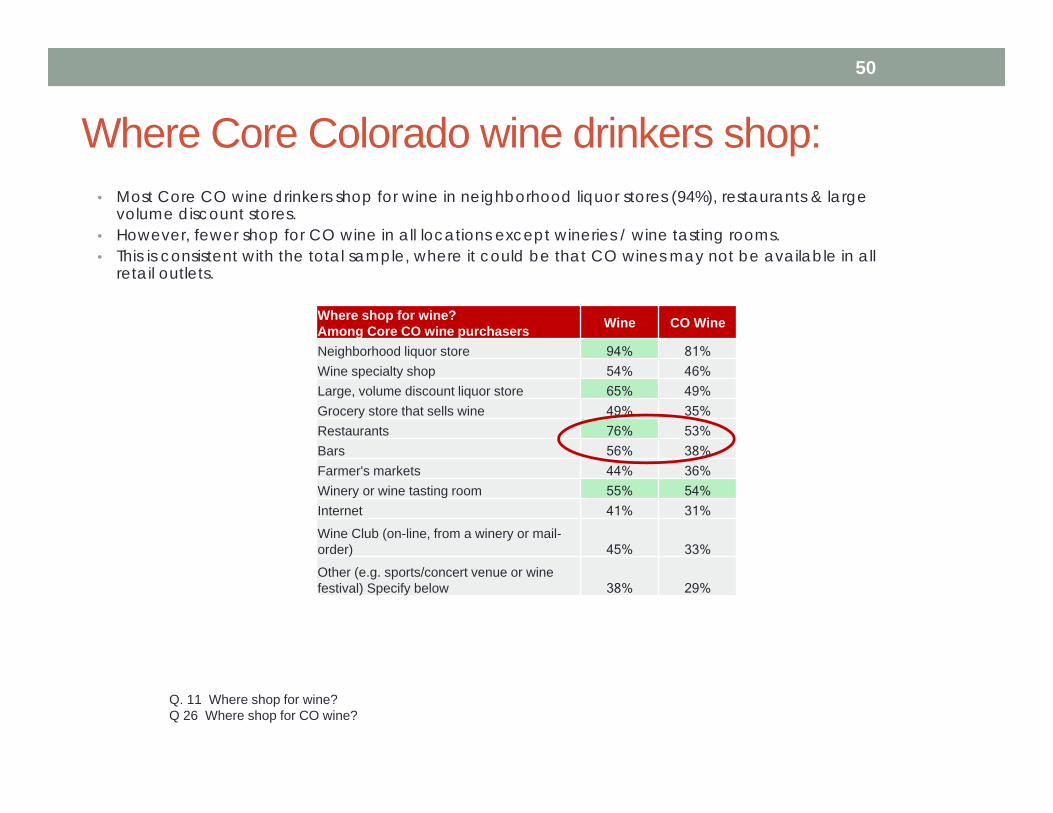
Where Core Colorado wine drinkers shop:• Most Core CO wine drinkers shop for wine in neighborhood liquor stores (94%), restaurants & large
volume discount stores. • However, fewer shop for CO wine in all locations except wineries / wine tasting rooms. • This is consistent with the total sample, where it could be that CO wines may not be available in all
retail outlets.
50
Q. 11 Where shop for wine?Q 26 Where shop for CO wine?
Where shop for wine? Among Core CO wine purchasers Wine CO Wine
Neighborhood liquor store 94% 81%Wine specialty shop 54% 46%Large, volume discount liquor store 65% 49%Grocery store that sells wine 49% 35%Restaurants 76% 53%Bars 56% 38%Farmer's markets 44% 36%Winery or wine tasting room 55% 54%Internet 41% 31%
Wine Club (on-line, from a winery or mail-order) 45% 33%
Other (e.g. sports/concert venue or wine festival) Specify below 38% 29%

Future PI for CO wine among CO wine purchasers:• Core Colorado wine purchasers are more interested in purchasing CO wine in the future and California wine.• This shows California wine is a key competitor to Colorado wines in terms of future purchase.
51
Future Purchase IntentMEANS ( 5 pt. scale)
Total wine drinkers (n=1315)
Core CO Wine Purchasers
(n=362)European Wine 3.60 3.80Californian Wine 4.02 4.29Colorado Wine 3.61 4.39
Washington Wine 3.20 3.52
Oregon Wine 3.16 3.42Other American Wine 3.11 3.43Australian or New Zealand Wine 3.36 3.56South American (e.g., Argentina, Chile, Uruguay) wine 3.26 3.52
South African wine 2.85 3.05
Q. 17 In the future, how interested are you in purchasing wine from each of the following geographic areas?
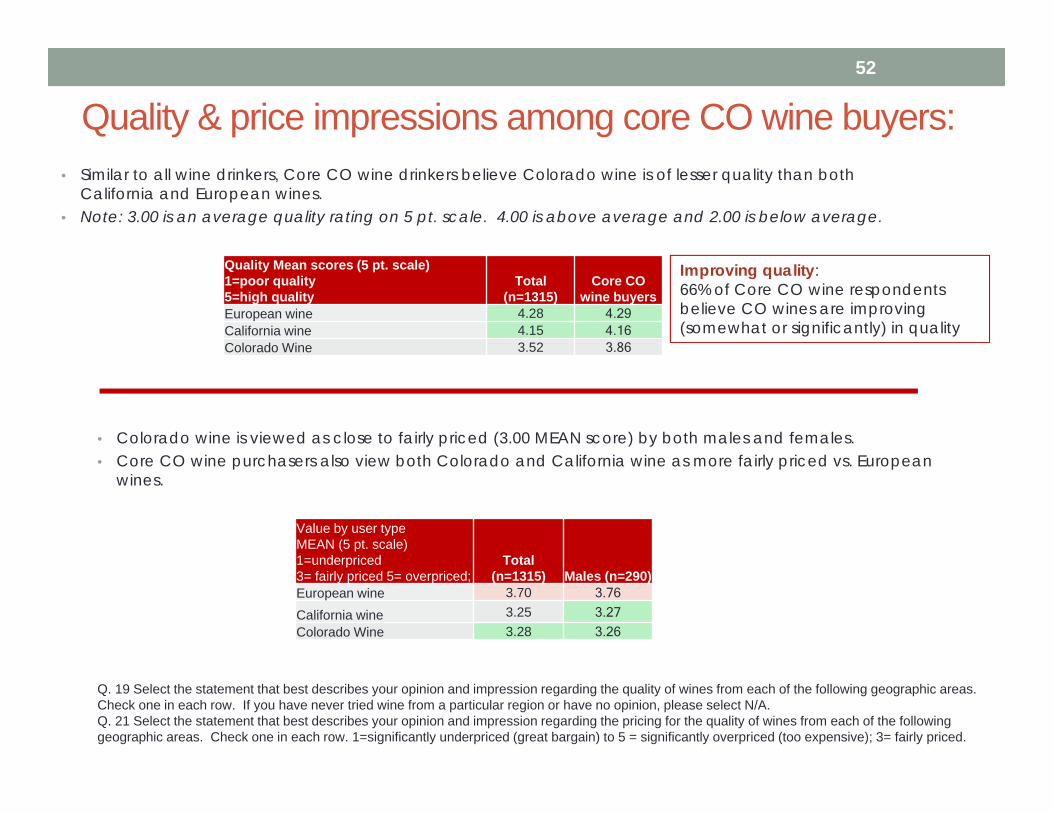
Quality & price impressions among core CO wine buyers:• Similar to all wine drinkers, Core CO wine drinkers believe Colorado wine is of lesser quality than both
California and European wines. • Note: 3.00 is an average quality rating on 5 pt. scale. 4.00 is above average and 2.00 is below average.
52
• Colorado wine is viewed as close to fairly priced (3.00 MEAN score) by both males and females.• Core CO wine purchasers also view both Colorado and California wine as more fairly priced vs. European
wines.
Q. 19 Select the statement that best describes your opinion and impression regarding the quality of wines from each of the following geographic areas. Check one in each row. If you have never tried wine from a particular region or have no opinion, please select N/A.Q. 21 Select the statement that best describes your opinion and impression regarding the pricing for the quality of wines from each of the following geographic areas. Check one in each row. 1=significantly underpriced (great bargain) to 5 = significantly overpriced (too expensive); 3= fairly priced.
Quality Mean scores (5 pt. scale)1=poor quality5=high quality
Total (n=1315)
Core CO wine buyers
European wine 4.28 4.29California wine 4.15 4.16Colorado Wine 3.52 3.86
Value by user type MEAN (5 pt. scale) 1=underpriced3= fairly priced 5= overpriced;
Total (n=1315) Males (n=290)
European wine 3.70 3.76
California wine 3.25 3.27Colorado Wine 3.28 3.26
Improving quality:66% of Core CO wine respondents believe CO wines are improving (somewhat or significantly) in quality

Wine price expectation among core CO wine purchasers:
53
Q. 22 What do you expect to spend at a wine shop or liquor store for a typical bottle (750 ml) of wine from each of the following geographic areas? Think about the average price for each region. Check one in each row. If you have never purchased wine from a particular region or have no expectations about the price, please select N/A.
• Pricing of California wines are expected to range from $9-$19.99 for most core CO wine drinkers. • A larger percent expect to pay slightly more for CO wines vs. California wines.
Less than $9 per bottle
$9 - $11.99 per bottle
$12 - $14.99 per bottle
$15 - $19.99 per bottle
$20 - $24.99 per bottle
$25 - $39.99 per bottle
$40 or more per bottle N/A
European wine 2% 9% 20% 24% 17% 8% 3% 18%
California wine 6% 21% 30% 20% 8% 2% 0% 12%
Colorado wine 5% 17% 25% 20% 6% 1% 0% 26%
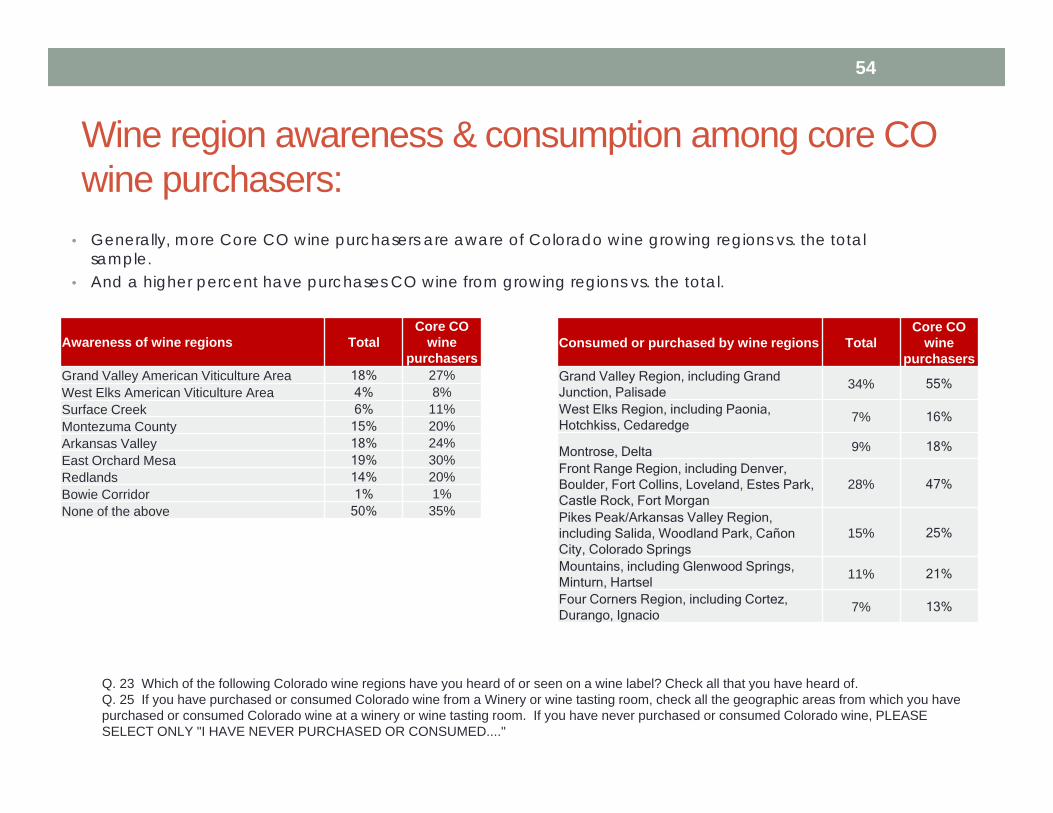
Wine region awareness & consumption among core CO wine purchasers:
54
Q. 23 Which of the following Colorado wine regions have you heard of or seen on a wine label? Check all that you have heard of.Q. 25 If you have purchased or consumed Colorado wine from a Winery or wine tasting room, check all the geographic areas from which you have purchased or consumed Colorado wine at a winery or wine tasting room. If you have never purchased or consumed Colorado wine, PLEASE SELECT ONLY "I HAVE NEVER PURCHASED OR CONSUMED...."
• Generally, more Core CO wine purchasers are aware of Colorado wine growing regions vs. the total sample.
• And a higher percent have purchases CO wine from growing regions vs. the total.
Awareness of wine regions Total Core CO
wine purchasers
Grand Valley American Viticulture Area 18% 27%West Elks American Viticulture Area 4% 8%Surface Creek 6% 11%Montezuma County 15% 20%Arkansas Valley 18% 24%East Orchard Mesa 19% 30%Redlands 14% 20%Bowie Corridor 1% 1%None of the above 50% 35%
Consumed or purchased by wine regions Total Core CO
wine purchasers
Grand Valley Region, including Grand Junction, Palisade
34% 55%
West Elks Region, including Paonia, Hotchkiss, Cedaredge
7% 16%
Montrose, Delta 9% 18%
Front Range Region, including Denver, Boulder, Fort Collins, Loveland, Estes Park, Castle Rock, Fort Morgan
28% 47%
Pikes Peak/Arkansas Valley Region, including Salida, Woodland Park, Cañon City, Colorado Springs
15% 25%
Mountains, including Glenwood Springs, Minturn, Hartsel
11% 21%
Four Corners Region, including Cortez, Durango, Ignacio
7% 13%

Opinions & impressions of CO wine among CO wine purchasers:
• Similar to other sub groups, CO wine purchasers are interested in CO wineries, tasting events and local growers.
55
Opinions and Impressions of Colorado Wines MEAN (5 pt. scale) 1= strongly disagree to 5 = strongly agree Total
Core CO Wine Purchasers
Colorado wines are fresher than other wines 3.18 3.36
I cannot find Colorado wines in stores 2.47 2.34
I like to buy Colorado and support local growers 4.08 4.36
I don’t think about Colorado wines as locally grown 2.15 1.94
Colorado wines are more expensive vs. California wines 2.82 2.78
Colorado wines are higher quality vs. California wines 2.66 2.90
Colorado wines have fewer pesticides vs. other wines 3.05 3.17
I am interested in visiting Colorado wineries 3.92 4.32
I am interested in Colorado wine tasting events 3.81 4.18
High-elevation wines have a greater concentration of antioxidants that may prevent some diseases
3.18 3.29
Wines in Colorado are exposed to cooler nights and hotter days resulting in higher quality grapes
3.45 3.59
Q. 24 What are your opinions and impressions of Colorado wines even if you have never tasted any?
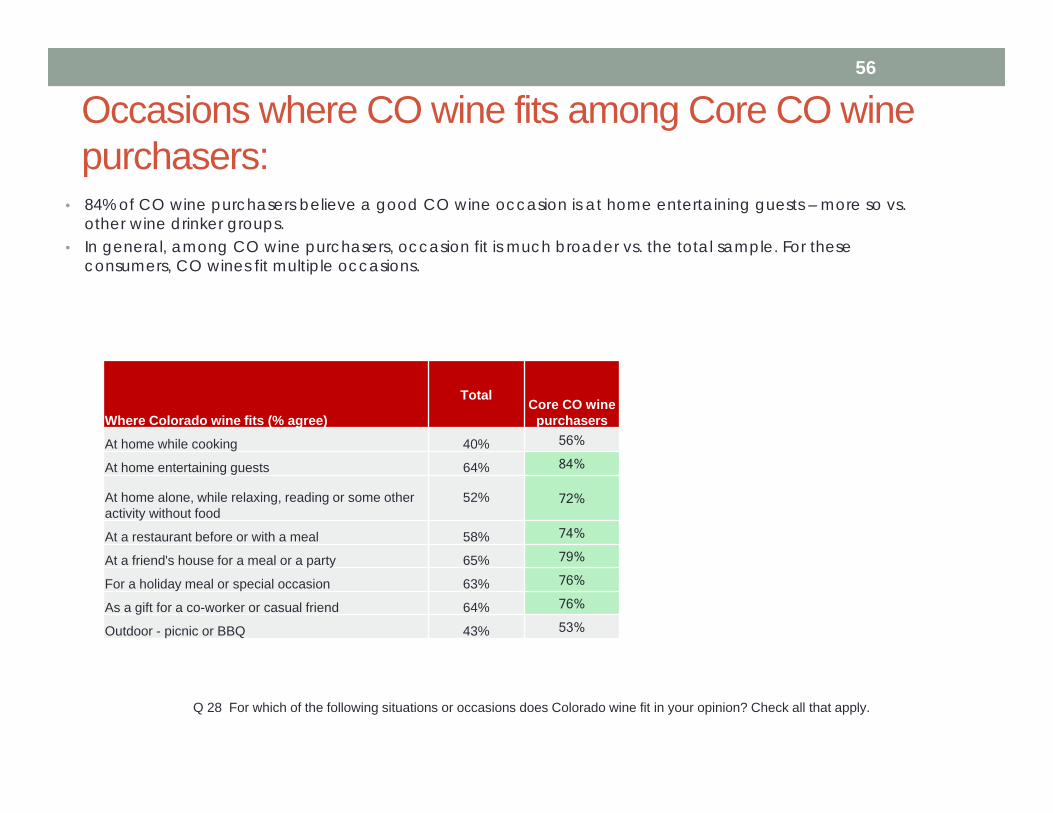
Where Colorado wine fits (% agree)
Total Core CO wine
purchasers
At home while cooking 40% 56%
At home entertaining guests 64% 84%
At home alone, while relaxing, reading or some other activity without food
52% 72%
At a restaurant before or with a meal 58% 74%
At a friend's house for a meal or a party 65% 79%
For a holiday meal or special occasion 63% 76%
As a gift for a co-worker or casual friend 64% 76%
Outdoor - picnic or BBQ 43% 53%
Occasions where CO wine fits among Core CO wine purchasers:
• 84% of CO wine purchasers believe a good CO wine occasion is at home entertaining guests – more so vs. other wine drinker groups.
• In general, among CO wine purchasers, occasion fit is much broader vs. the total sample. For these consumers, CO wines fit multiple occasions.
56
Q 28 For which of the following situations or occasions does Colorado wine fit in your opinion? Check all that apply.

CO wine purchase considerations by subgroup (% important) Total Core CO wine
purchasersAttractive label design 29% 35%Eye catching wine display 20% 26%Discounted price / on sale 45% 52%Information displayed about the wine 53% 59%Well-known winery name / brand name 20% 27%Must be priced under a certain amount 54% 56%Friend’s recommendation 70% 79%Store, restaurant, staff recommendation 55% 60%A wine I am familiar with in the past 41% 59%Won wine awards or medals 34% 35%History / heritage of winery 21% 28%Region that the wine is from 23% 31%Description of wine flavor on label 60% 67%Magazine / newspaper review or article 26% 26%Chance to taste the wine before buying it 65% 69%Internet – bloggers, social media recommendations, reviews 16% 15%Points rated 34% 37%Style of wine (red, white, rose, blend, fruit, plant) 77% 82%Food / menu pairing 36% 42%Fair price for quality of wine 79% 88%Experiment –want to try a new wine I have not tasted before 53% 69%
Drivers for CO wine purchase among core CO wine purchasers:• Core CO wine drinkers differ from the total sample in that a higher percent of them are experimental, wanting to
try new wines. • They are also more apt to rely on friends’ recommendations.
57
Q 29 If you buy Colorado wine in the future, which factors will be most important when deciding what Colorado wine to buy?
Contact Info:
Barb Gasper · Focus Research & Strategy Inc. · 1531 Genesee Ridge Rd. Golden, CO 80401· ph: 303-249-8948 · fax: 303-382-4630 · [email protected] ~ www.focusrsi.com
Thank you.
58