abstract - Wine Australia
106
“That’s for Me…That is Me” Understanding and leveraging marketing opportunities by engaging wine buyers through virtual communities and other e-based sales channels Final project report submitted by: Dr Roberta Veale
-
Upload
khangminh22 -
Category
Documents
-
view
1 -
download
0
Transcript of abstract - Wine Australia

“That’s for Me…That is Me”
Understanding and leveraging marketing opportunities by engaging wine buyers through virtual communities
and other e-based sales channels
Final project report submitted by: Dr Roberta Veale

ii
ABSTRACT
The report presents the findings of a three-year project investigating the use of on-line of live-streaming video technology as a consumer-engagement strategy.
Demonstrated in the three on-line wine communities developed for this project, it was found that use of this technology and similar engagement strategies may exert an important positive influence on consumers’ engagement, brand attachment, word of mouth, and willingness to pay more for wines.
However, and despite this opportunity, the research also indicates that the Australian wine industry currently lacks the critical foundations (including effective websites and expertise) to enable interaction, with consumers, through the on-line engagement strategies used in this project.
LONG ABSTRACT
The report presents the findings of a three-year project focused on understanding the opportunities offered to create and build consumer engagement with a wine brand through online communities and other e-based sales channels. The research focused on one specific on-line engagement strategy: live-streaming video technology in a newly created virtual wine community.
It commenced with an investigation of 200 Australian wine brand websites and blog sites in order to gauge industry readiness and current competencies. This was followed by a short qualitative study (interviews with wine brand owners or marketing personnel) in relation to the findings of the initial investigation.
Findings found, generally, wine brand websites to be quite primitive and generally poorly maintained – albeit with notable exceptions. There was a lack of current contact information, current product information, ‘dead links’ and blog pages with little, old, or no content. Many sites did not offer on-line purchases of wine and, in some cases, did not provide the information a customer would need to find the wine from a distributor.
While the industry may lack the critical foundations to effectively manage on-line business, there was strong interest shown in social media such as Facebook and Twitter, with the belief that this is ‘free and simple’ and ‘everyone is doing it’. While this belief is understandable, there is an unacknowledged danger in that social media (Facebook, Twitter etc.) are brands in their own right that advertise; potentially taking consumers away from wine brand-owned sites and exposing them to competitive offers.
From these initial investigations it appears that the Australian wine industry, whilst keen to use on-line e-based strategies, often lack the critical foundation knowledge to use them strategically. This poses an additional threat, that is, without industry education and a willingness to allocate resources and expertise the findings of this research may be underestimated and misunderstood.
The second stage of this project saw the establishment of three e-communities: The Adelaide Hills ‘Wine Room’ (AHWR), the Mt Surmon ‘Wine Lounge’ (MS) and Barossa ‘HQ’ (HQ). These e-communities were comprised of groups of participants (225 in total across all events) recruited for the project and a person encouraging discussion and providing information about wines and or a wine brand. In the case of HQ, both a representative of the Barossa Wine and Grape Association and individual winemakers led discussions. In the case of MS, discussion was led by the brand owners.
It was expected that the satisfaction of consumer cognitive needs (for example information in relation to wine), and social/emotional needs (for example social interaction, fun and support), would lead to feelings of engagement with both the brand ambassador(s) and fellow participants. It was believed that these higher levels of satisfaction and subsequent engagement would lead to increased brand attachment with

iii
the subsequent benefits of positive word of mouth (WOM) and willingness to pay more for the wine. These expectations were realised.
During the events, it was observed that wine consumers responded very positively to the opportunity to freely interact with the creators of the wine they were drinking. For example, the events were described by one participant as a ‘super cellar door’ experience, where you get to actually meet the wine maker; an opportunity that rarely presents itself, especially in the case of larger wine brands.
Among the HQ respondents, willingness to pay for a bottle of Barossa Valley wine was increased by almost $3.00 after participants experienced only one interactive event. Whilst only a slight increase in willingness to pay was seen for the MS brand, this may be because the awareness of that brand was extremely low prior to the event resulting in a wider range of pre-event price perceptions and a lack of significant difference in comparison. However, it is likely that increases in achievable prices could occur over time if the community were to form strong bonds. Importantly, substantial and significant increases in positive WOM (over 100% in the case of MS) were achieved. This strong indication of advocacy and brand attachment is potentially even more important as an indicator of loyalty.
Surprisingly, outcomes were not moderated significantly by individual consumer personality traits, such as need for cognition (or the need to know), or the need for social and emotional support; showing the robustness of the main effects overall. It was particularly surprising to note that levels of consumer wine knowledge and wine involvement were found to have no influence on cognitive (knowledge seeking) satisfaction. However, the attractiveness and usefulness of the site did exert significant influences on overall satisfaction with the experience. While this was generally positive, when respondents were too ‘taken’ with the website itself it was found to diminish the influence of the brand ambassador. Therefore, it is likely to be best to have an attractive website but not one that is too ‘busy’ or complex as it may be a negative distraction.
These studies show that each wine brand can easily and cheaply form strong and meaningful relationships with their customers online. These impacts have been shown to enhance consumer willingness to pay a more premium price and to stimulate positive word of mouth in addition to attachment to the brand. However, the strategy does require planning and commitment for long-term benefits to be realised.
iv
TABLE OF CONTENTS
Abstract .............................................................................................................................. ii Long abstract ..................................................................................................................... ii Table of contents .............................................................................................................. iv Research objectives .................................................................................................................. 1
report structure .................................................................................................................. 2
Today’s empowered consumer – their orientation to brands ........................................ 4 Initial proposed conceptual framework for testing ................................................................. 5
Needs Satisfaction ................................................................................................................... 5 potentially moderating consumer characteristics ...................................................................... 7 Brand Ambassador .................................................................................................................. 8 Event Engagement / uniqueness ............................................................................................. 8 Brand Attachment .................................................................................................................... 9 Positive word of mouth (WOM) ................................................................................................ 9 Willingness to pay a premium price (WTPPP) .......................................................................... 9 Brand Ambassador -> Brand Community event -> Brand Attachment .................................... 10
Methodology .................................................................................................................... 13 Development of data collection instruments and application .............................................. 13
community web site development .......................................................................................... 14 recruitment process and questionnaires ................................................................................. 16 measures for constructs ......................................................................................................... 19
Industry preparedness – current use of the internet .................................................... 23 Sample selection ..................................................................................................................... 23 Definitions used as website sophistication categorisation .................................................. 23 Results of the wine 1.0 analysis ............................................................................................. 23 Results of the wine 2.0 analysis ............................................................................................. 24 Analysis of Australian wine blogs .......................................................................................... 25 Sample and blog content analysis ......................................................................................... 25
Wine brands mentioned ......................................................................................................... 27 advertising on blogs ............................................................................................................... 27 Blog ownership ...................................................................................................................... 28 Author (Professional from the INDUSTRY or not) .................................................................. 29
Short qualitative report stakeholder attitudes to on-line consumer engagement ..... 30 Sample selection and methodology ....................................................................................... 30 Broad overview of wine brand responses ............................................................................. 31
On-line marketing knowledge ................................................................................................. 31 Preferred marketing communication strategies ...................................................................... 32 Website strategy .................................................................................................................... 33 Blog use ................................................................................................................................. 33 Social media use ................................................................................................................... 33 Reverse channels of communication ..................................................................................... 35 Future outlook in terms of web based consumer engagement ............................................... 36
Summary .................................................................................................................................. 36
Summary of analysis of qualitative findings ................................................................. 37

v
Adelaide Hills Wine Region (pilot study) ....................................................................... 38 Adelaide Hills Wine Room (AHWR) ........................................................................................ 38
Technical requirements .......................................................................................................... 39 The role of a brand ambassador in a community event .......................................................... 40 Exploration of possible community event related needs ......................................................... 41
Mt Surmon Wine Lounge (MS) ........................................................................................ 45 Brand ambassador .................................................................................................................. 45 Needs satisfaction ................................................................................................................... 46
Cognitive satisfaction ............................................................................................................. 46 Social /emotional satisfaction ................................................................................................. 47
Event engagement/uniqueness .............................................................................................. 48 Brand attachment .................................................................................................................... 49
barossa HQ (HQ) .............................................................................................................. 51 Brand ambassador .................................................................................................................. 51 Needs satisfaction ................................................................................................................... 52
Cognitive satisfaction ............................................................................................................. 52 social / emotional satisfaction ................................................................................................ 53
Event engagement/uniqueness .............................................................................................. 54 Brand attachment .................................................................................................................... 54
Quantitative analysis of the Mount Surmon Wine lounge (MS) ................................... 57 Descriptive analysis ................................................................................................................ 57 Model analysis ......................................................................................................................... 58
Model analysis: moderation ................................................................................................... 65 Discussion ............................................................................................................................... 67
Quantitative analysis of the Barossa HQ Community ............................................................. 69 Model analysis ......................................................................................................................... 70
Model analysis: moderation ................................................................................................... 77 Discussion ............................................................................................................................... 84
Comparison of quantitative results of HQ and the MS communities ....................................... 85 Descriptive analysis ................................................................................................................ 85 Analysis of the model ............................................................................................................. 87
Analysis of moderating effects ............................................................................................... 88
Conclusions, limitations and future research ............................................................... 90
References ....................................................................................................................... 94

1
RESEARCH OBJECTIVES
The research objectives of this project are:
1. To profile consumers and determine the participation levels of these consumers involved in brand/region oriented e-subcultures.
• Cross category participation • Cross brand consumption • Participation in brand owned vs. independent forums
2. To understand and document the prime benefits sought by consumers favouring participation in e-based wine communities and subcultures to enable wine marketers to develop attractive and strongly supported e-based strategies and communications vehicles.
• Measure the type and levels of social interactions within virtual communities • Common attributes of supported sites and groups • Levels, intensity and duration of ‘membership’ and engagement • Influences on consumer wine purchasing behaviour
3. To identify and quantify relationships between aspects of these e-based strategies, brand loyalty and wine purchases.
• Provide the basis for recommendations to industry for application in e-based marketing strategy development
• Develop measures that can be employed by managers in future research and for specific brand based market research
4. To determine the types and preferred uses of technology (web designs, site activities etc.), conducive or reflective of expectations of these consumers.
• Identify technological barriers to entry by non-participants • Identify website attributes that are expected and preferred in order to increase participation

2
REPORT STRUCTURE
The report is divided into the following sections:
1. An introduction to the studies, including a summary of existing theoretical knowledge of consumer trends related to brand communities. This also includes engagement, attachment, willingness-to-pay-a-premium-price (WPPP) and positive word-of-mouth (WOM) and a summary of the methodology employed.
2. A synopsis of current wine industry preparedness for on-line marketing of wine and for consumer engagement, consisting of: 2.1. A content analysis of 200 Australian wine websites (wine blogs, Facebook and orientation towards
social media), and a follow-up qualitative study. Together, both provide a background to the main studies in the project and illustrate current on-line and consumer engagement capabilities in the industry.
2.2. Results of a qualitative study about the wine industry’s web-based marketing and social media use carried out to provide insight into the content analysis conducted in stage 2.1 above.
3. Qualitative findings of all studies: 3.1. Adelaide Hills Wine Region ‘Wine Room’ (AHWR):
This was the pilot study for the project overall and the report includes information about the development and testing of interactive live-streaming technology and topic events. It also reports on industry participation and a wine brand’s readiness for consumer engagement. General levels of marketing expertise and perceptions of consumer purchasing behaviour are also documented.
3.2. Barossa HQ (HQ): HQ community consisted of a bi-weekly, unscripted, interactive live-streaming event with recruited participants. The report findings are derived from coding and analysis of video clips and documented ‘live chat’ responses. The HQ community represented a regional wine brand context that generally enjoys wide recognition in Australia. In this instance, the events were unique each time, with brand ambassadors (wine makers/brand representatives). Additionally, the location and the focus of the events were also varied. Analysis was also conducted quantitatively for this regional brand.
3.3. Mt Surmon ‘Wine Lounge’ (MS): This study represented the influence that a strategy of community-building can have, where the subject was a single wine brand with low recognition and where the same brand ambassadors (actors) were used each week. The theme of each event - food and wine matching - was also consistent. This event tested the ability to engage wine consumers when there is essentially no previous brand awareness.
4. The quantitative findings of both the studies (MS & HQ) are based on bi-weekly, unscripted, interactive live streaming events with participants recruited to participate in one of our University of Adelaide computer labs. Participants first completed a pre-event survey to capture pre-event perceptions of Mt Surmon and Barossa Valley wines and their orientation towards brand community type events. This survey also provided data quantifying individual variables such as consumer need for cognition, need for stimulation, need for social interaction, orientation towards risk-taking, etc. At the completion of

3
each event, participants completed a post-event survey providing impressions and opinions about the event, the wines tasted and the brand ambassadors (wine makers/brand representatives). 4.1. Analysis of the MS results – showing empirical results and event model.
4.2. Analysis of the HQ results – showing empirical results and event model. 4.3. Comparison of results for both quantitative studies providing insights and suggestions
for future research directions.
5. Documentation of the technical and operational information about hosting and conducting on-line community events including: 5.1. Information about equipment and relevant software (internet streaming accounts)
with approximate costs.
5.2. Recommendations for developing a functional and attractive website that will encourage on-line wine sales and a community building site where events are hosted and viewed.
5.3. A summary of statistical outcomes from the Vimeo website, including the number of ‘loads’ and ‘views’ from each event specific to the AHWR, the MS and HQ.
6. Summary of outcomes and recommendations for e-based strategies for Australian wine brands and regions, including the threats to Australian wine brand integrity and price objectives that are posed by consumer support of third party on-line wine retailers.

4
TODAY’S EMPOWERED CONSUMER – THEIR ORIENTATION TO BRANDS
Emerging and strongly supported forms of internet-based consumer networking strategies can reach consumers who are averse to traditional forms of mass media advertising (Trusov, Bucklin & Pauwels 2009). While these channels may offer opportunities for marketers, brand managers must fully understand the benefits and know how to exploit them to achieve maximum returns (Kucuk 2010).
Consumers have been found for many years to congregate in brand-oriented groups or communities (e.g. a Holden Car Club or Mac Lovers). Consumers participate in brand communities both on and off-line, because these communities satisfy both their need for knowledge and understanding (cognitive needs), as well as their social and emotional needs. These forms of satisfaction are similar to the ones provided through traditional face-to-face communities (Jae Wook et al. 2008). The impact of brand community-driven attachment on buying behaviour is well documented in the literature (Jae Wook et al. 2008; Muniz Jr & O'Guinn 2001). Consumers attached to a brand show enhanced attitudinal and behavioural loyalty, WPPP and positive WOM (Fedorikhin, Park & Thomson 2006). “Attitudinal loyalty” is some manner of psychological link to a brand that drives behavioural loyalty (consumers’ repeated purchases). These attached consumers are not only expected to be resilient brand advocates displaying robust behaviour in negative circumstances, but also act as sources of product-related feedback and advice for others (Fedorikhin, Park & Thomson 2006). This means that when these ‘attached consumers’ are present in an on-line community environment; their impact on other consumers can be considerable.
However, the ability to stimulate and build brand attachment via the satisfaction of these needs through on-line communities is yet unknown because traditionally brand community interactions have purposefully excluded brand owners from becoming involved in activities in the communities or exerting influence of any kind. When brands have been directly involved, community access took place through a sponsorship with a very limited, scripted or non-existent direct interaction between consumers and brand representatives due to consumer scepticism that brand participation is driven by an opportunity to make direct sales. Consumers generally wish to keep their groups ‘private’ as it allows them to speak freely, praise and sometimes criticise products. Hence, on-line interactions between brands and consumers are largely non-existent or highly scripted. They do not represent truly co-created experiences where value is given and derived by both parties.
Today’s consumers are more confident and outspoken about their views regarding the products they buy, including wine. They want their voices to be ‘heard’ and they wish to get information, not only from each other, but also directly from credible brand ‘sources’. This phenomenon has been exploited and made more visible reality TV shows and the popularity of social media. The questions fundamental to this project are focused firstly on the wine brands’ ability to use these trends to employ their brand ‘ambassadors’ and use live-streaming technologies to bring wine consumers and brand representatives together in the unscripted, non-sales, wine -brand-oriented events. Secondly, this project gauges the effects of these interactions have on consumer engagement, brand attachment, and ultimately, on WOM and WPPP. As stated previously, active and popular brand communities are almost exclusively consumer-led and have strong exclusions have in place related to direct brand involvement. Therefore, the ability of brand managers to actively lead an on-line consumer community that enjoys strong consumer support is entirely unknown because such effects have not been simultaneously tested yet in any context. Here it is worthwhile to differentiate the types of brand-led interactions we tested in this research and brand usage of social media such as Facebook or Twitter.
Whilst both of these social media ‘tools’ may be useful in supporting a community, and are good places to post pictures or keep consumers up to date on events and so forth, they do not provide the same level of communication and two-way synchronous interaction as the events tested in this research. Moreover, these sites actually take consumers ‘away’ from the brands themselves. Both Facebook and Twitter are well-known brands in themselves, and as such, are actively engaged in their own self-promotion. What brands need to do is to bring consumers to ‘their’ territory on-line (that means their own brand websites) and give them a reason to keep coming back.
Adding to the complexity of the research is the testing of live-streaming technology as a vehicle for active brand and consumer interaction. Hence, this research not only extends the existing research in these areas

5
of wine marketing and e-marketing, but also provides Australian wine brands with easy to use strategies to interact with the existing and future wine consumers both at the end user and distributor levels, anywhere in the world in real time. Given the intensity of competition faced by Australian wine brands locally and internationally, the results of this project show that these tools can provide even small brands with limited resources, with a means of reaching out and building customer loyalty.
INITIAL PROPOSED CONCEPTUAL FRAMEWORK FOR TESTING
Given that much of what is explored in this research is being investigated for the first time, it was thought necessary to capture the most comprehensive data set possible. Therefore, in both the qualitative and the quantitative stages, and a wide range of variables were investigated in order to ensure that no significant consumer attributes of the ‘events’ were overlooked.
The figures that follow provide an illustration of the main constructs measured and their initial proposed relationships, with the ultimate dependent variables in a form of WOM and WPPP. What follows is a brief explanation of each.
NEEDS SATISFACTION
Research suggests that consumers who join a brand community of any kind are looking for a range of benefits from their membership. These include what they believe to be trustworthy information from their fellow community members and the enjoyment of social and emotional interactions (Bart et al. 2005; Dickinger 2011; Fassnacht & Köse 2007; Greenfield & Campbell 2006; Greiner & Hui 2010; Gupta, R & Kabadayi 2010; Hung, Yiyan Li & Tse 2011; Pavlou 2003; Sanchez-Franco & Rondan-Cataluña 2010). Essentially these ‘needs’ are categorised accordingly: Cognitive Satisfaction – the perceived quality of the information provided by others in the community, the ability to ‘learn’ more about the target product or category. They want to pick up information that enhances their enjoyment of the project or allows them to get greater functional value (for example how to fix a computer issue, or insider knowledge about wines). The second and third categories are social and emotional satisfaction. We are social beings and we enjoy each other’s company, particularly when with others that share a similar passion or interest. These needs are explained more fully in the following sections.
COGNITIVE SATISFACTION
Consumer decision-making both in traditional and on-line environments requires gathering of some information prior to making a purchase decision. One of the benefits of a brand community is a propensity to provide each other with product or brand related information (Foster, Francescucci & West 2010; Gupta, R & Kabadayi 2010; Gupta, S, Kim & Shin 2010; Heehyoung et al. 2008; Hsiu-Fen 2008; Jae Wook et al. 2008; McWilliam 2000; Mudambi & Schuff 2010; Yung-Cheng et al. 2010). Today’s consumers tend to be somewhat cynical about traditional forms of mass media advertising as well as endorsements. In contrast, recommendations by fellow consumers (even if they don’t actually have any real expertise) are often trusted more or perceived to be more credible (Heehyoung et al. 2008; Hsiu-Fen 2008). Moreover, the very act of sharing ‘inside’ information between participants contributes to a sense of community (Schau, Muñiz & Arnould 2009). Indeed, consumers' thirst for information about a product, brand or category often represents a primary motivation for joining an on-line group.
In the events described in this research, the best possible sources of product information were the brands themselves, which represented a critical component of consumer experience. Hence, it is expected that respondents will perceive the informative aspects to be particularly satisfying. Moreover, the researchers own studies have revealed the importance of ‘insider’ knowledge to those wine buyers who consider themselves wine ‘buffs’ or ‘premium wine’ consumers. Therefore, the consumer’s ultimate reaction to this experience is likely to be influenced by their perceptions of the brand ambassador. Whilst this is something that has never been previously tested, especially in an on-line context, consumer’s positive reactions to meeting wine makers via cellar doors or during special events and tastings have been anecdotally recorded.

6
SOCIAL AND EMOTIONAL SATISFACTION
Brand association with emotion is shown to enhance consumer relationships (Barnham 2008). Consumers crave a more emotional and reassuring connection with brands in spite of being somewhat sceptical of motives for exchanges Jawahar & Maheswari (2009) . Possonby-Mcabe and Boyle (2006) discuss the important attributes that lead to brand loyalty, suggesting that brands can exercise more control if they create ‘emotional laden’ experiences between the brand and the consumer, supporting the notion that consumers seek emotional satisfaction from brand experiences. Extant research also suggests that emotional bonding with others represents an important driver of both brand engagement and brand attachment (Jae Wook et al. 2008; Kim, Song & Jones 2011; Stokburger-Sauer 2010). Hence, brands can obviously use this influence to their advantage when communicating and interacting with consumers.
Social interaction and communication between community members and the brand itself is also said to exert a significant influence on activity within the community (Gupta, S, Kim & Shin 2010; McWilliam 2000). Interaction with others in the virtual community increases social value, previously identified as driving a sense of virtual community (Yung-Cheng et al. 2010). Moreover, belonging to a group where individuals share social goals strengthens group cohesiveness (Walton et al. 2012) contributing to a stronger sense of community (Foster, Francescucci & West 2010) and also enhanced self-image (Walton et al. 2012).
In summary, the literature agrees that seeking social experiences represents a driver for many individuals to join others to form a community around a brand (Drengner, Jahn & Gaus 2012; Rosenbaum, Ostrom & Kuntze 2005; Sindhav 2011; Thomson, MacInnis & Park 2005). It is expected that, consumers who share a common interest in a product category or brands would be interested in spending time with the like-minded individuals sharing experiences and information as well as some camaraderie and social intercourse. As a product type, wine, is ‘emotionally’ charged and is strongly associated with social situations. Therefore, the context of an on-line wine based community event should provide highly satisfactory outcomes for participants in an emotional or social sense.
SITE FUNCTIONALITY, ATTRACTIVENESS AND EASE OF USE
To host a brand event (as part of a community) in the on-line environment, the site needs to be attractive, easy to use and should provide high functionality for the users (Yung-Cheng et al. 2010). These attributes allow community members to interact freely without the distraction of a ‘techno-savvy’ website, encouraging more frequent participation and less frustration. This in turn, increases the number of interactions and strengthens community bonds. In fact, Szmigin and Reppel (2004) nominate the ease of use of the technology as the primary enabler for any interactions to take place.
To interact with consumers in the on-line world, marketers have become interested in the features that make a website attractive as the latter not only elicits trust and reputation, in and out of the on-line community, but also encourages repeat visits (Wakefield, Stocks & Wilder 2004). Furthermore, website attractiveness has previously improved virtual community acceptance and user satisfaction, increasing the likelihood of return visits and creation of community-based loyalty Hsie-Fen (2008).
The community events hosted in our research relied on the applications of live streaming (the technology which was in its infancy lacked wide commercial applications when the project began). Therefore, measuring consumers’ perceptions about the community sites was critical. The importance of attractive and relevant wine brand websites and the current state of Australian wine brands is discussed in relevant sections of the report.
FREEDOM OF EXPRESSION
Brand communities are built on members’ sharing of views and experiences (Algesheimer, Dholakia & Herrmann 2005; Bagozzi, R. P. & Dholakia 2006; McAlexander, Schouten & Koenig 2002; Schau, Muñiz & Arnould 2009; Yongjun, Jooyoung & Jong-Hyuok 2010). Strong feelings of trust among community members (Dickinger 2011; Greenfield & Campbell 2006; Greiner & Hui 2010; Gupta, R & Kabadayi 2010; Wu, Chen & Chung 2010) increase the ability to share opinions freely, which leads to a stronger sense of community and belonging amongst group members (Jae Wook et al. 2008). These aspects are especially important nowadays, as consumers feel ever-more empowered and sceptical of brand-led messages. As discussed, direct brand involvement is typically prohibited in consumer-led groups largely because consumers may report feeling that their opinions (unless highly favourable) would not be accepted. Indeed, many consumers may not feel comfortable openly criticising a product or brand, if they know the brand managers will

7
even learn about their opinions. Hence, an important aspect of this research is to examine if, under the right circumstances with an open and sincere facilitation, consumer trust can be established in a brand owned forum. While consumers might be willing to be open, creating an environment that allows them to feel comfortable enough to do so represents a substantial challenge. Therefore, in all events undertaken in this research brand ambassadors were advised not to ‘hard sell’ their products, but to seek honest and candid consumer opinions and were open to both positive and negative feedback.
POTENTIALLY MODERATING CONSUMER CHARACTERISTICS
Research has documented the interaction resulting from matching brand and consumer personalities with subsequent brand community membership (Fournier 1998; Kuenzel & Halliday 2010; Malär et al. 2011; Romaniuk & Sharp 2003; Zentes, Morschett & Schramm-Klein 2008). There is also evidence suggesting that an individual’s level of attachment, from the perspective of interpersonal relationships, is influenced by within-person variations (La Guardia et al. 2000). Furthermore, research from the retail sector supports that consumer traits are strongly linked to attitudes towards shopping experiences and product choices (Guido, Capestro & Peluso 2007). To date however, these theories have not been tested in relation to consumer-to-consumer, consumer-to-brand actor interactions or in brand community contexts.
NEED FOR COGNITION
Need for cognition refers to an individual’s propensity to engage in cognitive endeavours for their own sake – in other words the degree to which a person ‘needs to know’ or ‘likes to know’ (Cacioppo, Petty & Chuan Feng 1984). Srivastava and Shukla (2010) found that an individual’s need for cognition influenced their on-line experiences, specifically relating to focus and attention, supporting the findings of Sicilia and Ruiz (2006) who outlined the importance of consumers’ need for cognition in terms of its influence on the formation of attitude towards a brand and its website. It was suggested that consumers with a higher need for cognition are more motivated to interact fully with the on-line environment and gain more from such an experience. Given that many consumers belong to brand communities in order to gain knowledge, or even to gain specialised ‘insider’ information, it is expected that this consumer characteristic may moderate the levels of cognitive satisfaction derived from our wine events.
SUBJECTIVE WINE KNOWLEDGE AND INVOLVEMENT
Consumer level of self-assessed knowledge and its influence on product purchase within the retail sector is well documented (Barber, Ismail & Dodd 2008; Bauer, Sauer & Becker 2006; Dardis & Fuyuan ; Knox, Walker & Marshall 1994; Pleshko & Al-Houti 2011; Yilmaz et al. 2011). This goes beyond the understanding of high/low involvement purchases and relates to an individuals’ attitude towards the product category, purchase situation (the intended us for the product) and the purchase environment (Lockshin, Spawton & Macintosh 1997). Product involvement is the degree to which a product is ‘important’ to a consumer in their lives and how ‘invested’ they become in discriminating between brands with Orth (2005) finding that consumer involvement levels significantly effect their decision making process for wine. Hence, involvement can also determine the extent to which the consumer will be likely to engage more deeply with the brand and a potential brand community, with more involved consumers far better candidates (Odekerken-Schröder, De Wulf & Schumacher 2003). Hence, product involvement is highly likely to influence cognitive and emotional satisfaction and overall perceptions of the brand ambassador.
NEED FOR AROUSAL/STIMULATION
The ability for arousal to influence brand commitment has been documented by Raju and Unnava (2009) finding that consumer’s arousal seeking tendency influences preferences in product design and brand imagery. The link between arousal and attitude-formation has also been shown to influence aspects such as the ‘Halo’ effect enjoyed by some brands across a number of categories and, therefore, can exert a positive influence on consumer buying decisions (Bagozzi, Richard P. 1996).

8
DEMOGRAPHICS
Consumer characteristics such as gender, age, education and income levels have an impact on brand selections and WPPP. In the case of wine, it can be expected that, for example, individuals with higher levels of income and who are perhaps older will be more willing to pay a higher price for wine. These influences have been noted in previous studies.
BRAND AMBASSADOR
In the last 25 years, the use of spokespeople in advertising has been of interest to both academics and practitioners. Previous research which has concentrated on the influence of celebrities as brand endorsers (Kahle and Homer, 1985; Kamins, Brand, Hoeke and Moe; 1989; Simmers; 2009) shows that celebrity endorsement drives advertising effectiveness, brand recognition and recall as well as purchase intentions. Although previous research proved that celebrity attractiveness, expertise and trustworthiness influences brand perception (Spry, Pappu and Cornwell; 2011) and attitudes towards an advertisement (Kahle and Homer, 1985; Lafferty and Goldsmith; 1999), the credibility of an endorser and of the company has been found to be more important in driving consumers’ positive evaluation of a brand and their purchase intentions (Lafferty and Goldsmith; 1999). Thomson and Hecker (2001) conclude that “Staff attitudes and behaviours have a significant impact on customer loyalty — more so than many traditional marketing tools” because 41% of the customers are most likely to buy a company’s products based on the staff as brand ambassadors. Furthermore, Braun, Kavaratzis and Zenker (2013) have confirmed the influence of the credibility of spokespeople (residents) in the case of place branding, stating that they “give credibility to any message communicated by city authorities, ‘making or breaking’ the image and brand of their city”.
Although brand ambassadors have been increasingly employed in industry (e.g., Sony, Jet Blue and Microsoft) (Andersson and Ekman; 2009), little research is available about the role of brand ambassadors in communities as a result of their previous exclusion and overall lack of opportunities to engage with large groups of people instantly. Nonetheless, their positive power has been documented by Andersen and Ekman (2009) who state “An ambassador is seen by coordinators as constituting a credible testimony of the distinctive character of ‘a brand’ and its attractiveness”.
EVENT ENGAGEMENT / UNIQUENESS
Engagement related to brand communities has been investigated in relation to websites (Abdul-Ghani, Hyde and Marshall; 2011), media and advertising (Calder and Malthouse; 2008; Phillips and McQuarrie; 2010), on-line gaming (Hsu, Chiang and Huang; 2012) as well as brand communities (Algesheimer et al., 2005). Nonetheless, the concept of engagement that is centred on the consumer co-creating value in a brand-related experience represents a new field of research (Vargo; 2009), particularly when the interaction within a virtual community is concerned (Muniz and O’Guinn; 2001; McAlexander et al., 2002). Community engagement has been defined similarly by scholars across different contexts (Brodie, Ilic, Juric and Hollebeek; 2013). From the social/motivational perspective, engagement represents “the level of a customer's motivational, brand-related and context-dependent state of mind characterized by specific levels of cognitive, emotional and behavioural activity in brand interactions” (Hollebeek; 2011). Several studies have considered the consequences of engagement with consumers, which included its influence on trust (Hollebeek, 2011); commitment (Chan and Li, 2010) and loyalty (Bowden, 2009). In an on-line context, Mollen and Wilson (2010) define engagement as “the cognitive and affective commitment to an active relationship with the brand as personified by the website or other computer-mediated entities designed to communicate brand value.”
Consumer engagement has come to be closely associated with dynamic customer interactions with a brand, contributing to a ‘co-created’ relationship and feelings of ‘specialness’ and ‘uniqueness’ of their experience with a brand (Brodie et al., 2011; Hollebeek, 2011). Given that feelings of engagement have also been linked to forms of brand satisfaction, it is believed to contribute to attachment due to the desire to stay

9
‘close’ to the community and the brand simultaneously. Consequently it is expected that engagement with the event will be the transition between needs satisfaction and brand attachment.
BRAND ATTACHMENT
Attachment is a concept that is grounded in social psychology due to the work of John Bowlby (1969) who showed a strong bond between a child and its caregiver and subsequent behaviour based on this relationship (Bowlby, 1969; Hazan and Shaver, 1994). This strand of research has been extended demonstrating that people also form attachments to objects, such as products (Belk, 1988), places (Hidalgo and Hernandez, 2001) and brands (Ashworth, Dacin and Thomson; 2009; Park, MacInnis, Priester, Eisingerich and Iacobucci; 2010; Thomson, 2006; Thomson, MacInis and Park; 2005). Attachment is, therefore, defined as a cognitive and emotional bond between a person and an attachment object (Aron, Aron and Smollan; 1992; Bowlby; 1969; Thomson et al.; 2005). As part of this, people attribute strong emotions like love, pleasure or passion to the attachment object (Bergami and Bagozzi; 2000; Thomson et al.; 2005). The cognitive aspect is related to a strong connection between a person’s identity and the object (Aron et al., 1992; Park et al., 2010). In comparison to other relationship constructs, such as trust or satisfaction, attachment is closely related to the strength of a relationship and is thus linked to attitudinal and behavioural loyalty of consumers’ behaviours (Thomson, 2006).
Several studies show strong behavioural consequences related to this higher appreciation of a brand, where people are willing to sacrifice time, money and psychological resources for a brand they are strongly attached to (Park, MacInnis, Priester and Hall; 2006). The investment of money is related to the WPPP for a brand for which there is strong attachment (Thomson et al., 2005). Furthermore, people demonstrate that they are willing to defend a brand and show involvement in brand communities or networks, which is strongly related to positive WOM (Ashworth et al., 2009; Sommerfeld and Paulssen; 2008). Due to brand attachment, people are also willing to invest more personal resources, independent of the satisfaction of functional needs, to stay close to a product. Therefore, we expect attachment to strongly influence both WOM and WPPP.
POSITIVE WORD OF MOUTH (WOM)
Individuals who are strongly attached to an object are generally committed to preserving that relationship (Thomson, MacInnis & Park 2005).This means that they are strong advocates of ‘their’ brand and will defend its consumption. Consumers today have endless opportunities to share their views and give their opinions, and this is complemented by the fact that other consumers are actively seeking product endorsements from non-brand related sources.
Consequently, a benefit of engaging consumers via on-line brand hosted events is the positive WOM that community members and ‘advocates’ provide for the brand universally. Therefore, this is considered to be of primary importance and a dependent variable in the model.
WILLINGNESS TO PAY A PREMIUM PRICE (WTPPP)
Price, from a consumer perspective, is the sacrifice people make for the value they intend to get from a product or a brand. While pricing at a product level is determined by its functional attributes, leading to quality perceptions between the sacrifice and received value, pricing on a brand level is far more complex. It depends not only on the perceived satisfaction of functional value, but also satisfaction of symbolic and emotional needs (Aaker; 2010). Symbolic brand associations based on a brand are associated with the expression of the ‘self’ to others (Aaker; 1997). Emotional brand associations, on the other hand, are related to the brand’s potential to elicit a positive emotional response in a consumer (Chaudhuri and Holbrook; 2001). Hence, WPPP is based on the enhanced value that consumers gain from a brand as compared to other alternative offerings. Previous research shows that emotional and symbolic values (and those driven by attachment) lead to a significantly higher brand value and, in turn, lead to a willingness to pay a higher price and lower price sensitivity (Chaudhuri and Holbrook; 2002, 2001; Río, Vazquez, Iglesias;

10
2001). These findings indicate that brand attachment represents an important driver of perceived value and price sensitivity.
Given the intense competition experienced by Australian wine brands both domestically and internationally, being able to ‘ask more and get it’ can be critical for survival. One of the important advantages to an on-line communication strategy is that time and distance are irrelevant. Hence, the technologies and approaches tested in this research can, literally, be used to engage world-wide audiences at both consumer and B2B levels.
BRAND AMBASSADOR -> BRAND COMMUNITY EVENT -> BRAND ATTACHMENT
The model developed for this study is explained below, together with all proposed relationships (Figures 1, 2 and 3). Given the focus of the research is to satisfy both cognitive and emotional/social needs and to provide these values in a brand owned community, it is expected that the brand ambassador will be the key independent variable driving the satisfaction of these different types of needs.
BRAND AMBASSADOR -> BRAND COMMUNITY EVENT
“Brand community” is a social theory concept which refers to “a specialized, non-geographically bound community, based on a structured set of social relations among admirers of a brand” (Muniz and O’Guinn, 2001). It is specialised because its focus is on a branded good or service based on the idea of communal consumption of that good or service. In other words, members are ‘in it together’ in terms of use and enjoyment of the good or service. Muniz and O’Guinn (2001) contemplate a brand community based on a triad between at least two different customers and a brand – that is while traditional consumer-brand relationships describe a dyad, brand communities describe a consumer-brand-consumer triad. Due to the social nature of a brand (Aaker; 1997), consumers are actively involved in the social co-creation of brands. Their study of brand community indicates that inter-customer relationships have important influence on the brand. McAlexander, Schouten and Koenig (2002) suggest an extension of this model, contemplating a focal customer, influenced by a brand, other community customers and the product as well as marketing agents or institutions that manage the brand.
The consumer needs fulfilled by a brand’s community are multiple and include functional (informational), social (relatedness or self-expression) as well as emotional based on the “share(d) consumption experiences in a predetermined location (usually under the very identifiable auspices of the brand owner)” (Devasagayam, Buff, Aurand and Judson; 2010). The fulfilment of needs leads to the belief that the community is valuable and unique, generating higher engagement. Previous research showed that the fulfilment of symbolic needs ( Algesheimer et al.; 2005; Goldsmith and Goldsmith; 2002), cognitive/information-related needs (Brodie et al.; 2013) and emotion-related needs (Hollebeek; 2013) are the drivers behind community engagement.
Hence, the influence of a brand’s ambassador on a brand community is based on her/his ability to facilitate or address the needs of the participants and also depends on the his/her perceived credibility to do so (McAlexander, Kim and Roberts; 2003, McAlexander et al.; 2002). Therefore, respondent’s perceptions about the brand ambassador are expected to significantly influence community engagement/uniqueness as mediated by needs satisfaction as shown in Figure 1.

11
FIGURE 1 INITIAL MODEL PROPOSED BETWEEN THE BRAND AMBASSADOR AND THE COMMUNITY EVENT ENGAGEMENT/UNIQUENESS
BRAND COMMUNITY EVENT -> BRAND ATTACHMENT
Brand attachment, which determines the strength of customer-brand relationships (Thomson, 2006), is typically expressed in a form of customer loyalty. Previous research in brand community engagement has shown that the fulfilment consumer needs via a form of brand community leads to brand attachment and brand loyalty as a consequence of brand attachment (McAlexander et al., 2003).
The driver behind this relationship is the stimulation offered by the brand-related community experience to the respondent. The experience is based on sensory, affective, intellectual, and behavioural elements leading to needs satisfaction (Brakus et al. 2009). This leads to a perception that an event is unique, meaningful, and engaging. Since attachment is defined as an emotional and cognitive bond between a consumer and a brand (Aron, Aron and Smollan; 1992; Bowlby; 1969; Thomson et al.; 2005), consumer engagement/uniqueness must support both dimensions to create brand attachment. The cognitive dimension will be supported by the fulfilment of informational needs related to the improvement of self-identity (cognitive satisfaction) and, therefore, to a connection to the brand (Aron, Aron and Smollan; 1992). Furthermore, the social interaction between participants leads to immersion, (engagement) in the event (c.f., Escalas and Bettman 2003, 2005). Additionally, the sensory stimulation based on the wine tasting (Brakus et al. 2009) as well as the elicitation of positive emotions (fun) related to the event itself (emotional satisfaction) have influence on the emotional dimension of brand attachment. Overall, it is expected that respondent engagement (perception of uniqueness/specialness) within the event will influence brand attachment as shown in Figure 2.

12
FIGURE 2 INITIAL MODEL BETWEEN THE COMMUNITY EVENT AND BRAND ATTACHMENT AND WOM AND WPPP
Figure 3 shows the full model illustrating the transition effects from brand ambassador through needs satisfaction, community engagement/uniqueness and brand attachment with downstream effects on WOM and WPPP.
FIGURE 3 THE FULL MODEL THAT WAS INVESTIGATED QUANTITATIVELY

13
METHODOLOGY
This section provides an overview of the methodology employed in the main studies. At the completion of the pilot study focused on the Adelaide Hills Wine Room (AHWR), it was observed that two fundamental assumptions regarding the potential for industry support of the studies had been made.
Firstly, it was expected that wine brands would want to actively engage with wine consumers and exploit this opportunity – this was not the case. Indeed, it was very difficult to get brands involved in the pilot project. Also, it became clear that almost all marketing activities undertaken by the largest brands focussed entirely on selling to distributors with little or no interest in wine buyers themselves. Whilst many brands held emailing ‘lists’ these, in reality, contained little or no customer intelligence, such as customer preferences or buying habits, and were not used in any strategic way. These lists were used primarily for broadcast emails and on-line promotion of ‘specials’ or some form of newsletter, but there was no evidence of any previous or planned ‘two-way’ interactions with their buyers. Similarly, many brands had Facebook pages and/or Twitter accounts, but the spot check reviews of their sites and activities failed to reveal any evidence of engagement that could be built upon in the communities we had hoped to establish. Secondly, we found that many brands involved in this region were not ready or prepared to trial these strategies in the long term, because they lacked the resources or expertise to do so, or they had a firm commitment to alternative (e.g. B2B) sales oriented strategies.
As a result of this realisation it became obvious that we would not be able to build upon the attachment of existing customers in the form of a longitudinal study as originally planned. In the case of the Mt Surmon Wine Lounge (MS), due to their small size and the lack of marketing resources, there was virtually ‘zero’ awareness of their brand amongst respondents beyond a handful of loyal buyers. Most of their sales were conducted via their cellar door with little repeat purchase-history or bulk wine sales. In the case of Barossa HQ (HQ), many of the participating brands had extensive mailing lists, ‘clubs’ and of course websites, but they were only operating at the most fundamental level.
Although longitudinal data would not be possible, this provided an opportunity to employ a quasi-experimental design, which despite the limitations of a typical laboratory setting, enabled the application of control and the exploration of a wider range of variables. Overall, the results reported below in the empirical sections have a robust nature and demonstrate clearly the potential for increased sales, reduced price sensitivity and positive WOM for wine brands that use on-line engagement strategies to engage their consumers via direct and unscripted interactions with them in an on-line community context. The next section of the report discusses the development of our on-line sites and the process of data collection via live streaming events.
DEVELOPMENT OF DATA COLLECTION INSTRUMENTS AND APPLICATION
Each of these events is a unique experience due to their dynamic and co-created format. Wine buyers and representatives of wine brands are brought together to experience specific wines and discuss and learn about them together. These events sometimes had specific themes, such as food matching or descriptions of how wines were made. One of the things that was fascinating and exciting about these events, from the very first event conducted with the Adelaide Hills, was the diversity of imagination and content that the brands often brought to them. This was surprising given the reluctance of brands to participate and their apparent lack of orientation towards consumer engagement.

14
Examples of event themes included:
• Wine and chocolate matching • Biodynamic wine making • Winery dogs • Cheese and wine matching • Yabbie harvesting and home-made pasta making (with wines to match) • Soil analysis and effects of soil composition on wine flavours • Making sparkling wine • Wine quizzes
COMMUNITY WEB SITE DEVELOPMENT
All three of our wine community sites were developed by ‘Voice Design’ in Adelaide, in conjunction with ‘Triple Zero’ web developers who looked after site functionality. Our first site, the Adelaide Hills Wine Region ‘Wine Room’ taught us all many things about how to best develop these sites for maximum functionality and ease of use for members and administration functions for managers.
As expected, each site had a distinctive ‘personality’ that was unique to their own brands with varying degrees of complexity and differing types of information displayed. As the HQ site was developed last in this project, it shows the highest level of sophistication with little ‘extra’s such as a ‘cheers’ button as a substitute for a ‘like’ button as seen on Facebook. This was a suggestion from one of our participants and was warmly embraced when implemented as it added to the sense of fun and prompted spontaneous responses to comments and questions. The MS community events were strongly focused around food and wine events; hence their site layout included recipes and other short videos regarding the recipes or events at their vineyard.
As can be seen in the illustrations that follow, as the live streaming events were conducted, each member who was participating, either as part of our recruited panel of respondents or spontaneously from elsewhere, would be watching and listening to the live streaming video and typing questions and comments into the ‘chat window’ on the site. The brand ambassadors would have a computer screen or iPad in front of them and read the comments/questions and respond to them. At the same time, members of our panel would also taste the wine(s) that were the topics of discussion. The spontaneous interaction between the brand ambassadors and participants comprised the extensive qualitative data analysed and presented later in this report. In spite of the short time the communities were running, the beginnings of genuine communities were established. This is illustrated in Figure 4, a picture sent to us by members of the HQ community who enjoyed participating in the panel and subsequently joined in on a number of other events. All events were unscripted and spontaneous with brand ambassadors briefed to ensure no ‘hard selling’ took place and also to be prepared to accept (indeed welcome) feedback both positive and negative.

15
FIGURE 4 HQ COMMUNITY MEMBERS LOGGED IN FROM HOME FOR AN EVENT
FIGURE 5 ST HALLETT WINE EVENT WITH JAMES MARCH AND STUART BLACKWELL

16
FIGURE 6 JENI AND BURT SURMON COOKING RABBIT STEW IN THEIR WINE LOUNGE
RECRUITMENT PROCESS AND QUESTIONNAIRES
Each community had a ‘calendar’ of events published on the site stating the time and date of each event. After testing of the MS it was observed that approximately one hour per event was required to give enough time to enjoy the experience and avoid participant fatigue. This event calendar was broadcast to the members and to the email listings (in the case of HQ) of the specific brand hosting the event. For the MS community, Burt and Jeni Surmon presented each time with their events oriented around a recipe that people could cook at home with them during the event. Conversely, events in HQ, each had a unique theme. Sometimes these would be held at the University of Adelaide in an office set up for streaming, or at the premises of the brand and/or at the offices of the Barossa Grape and Wine Assoc. in the Barossa Valley.
For the purposes of data collection, the researchers sent invitations to lists of people provided by the brands hosting the event to ask for participation in our ‘tasting panel’. Invitations were sent to these people inviting them to join from home if they did not want to participate in the study formally. The participants were remunerated for their time and participation with a wine tasting opportunity and a free bottle of one of the wines highlighted in the event. The participants would then complete a pre-event on-line questionnaire that would quantify consumer characteristics such as demographics, wine knowledge, and involvement, need for cognition, need for social and emotional satisfaction and desire for

17
stimulation/risk taking. Their existing levels of attachment with the Barossa Valley as a regional wine brand, or Mt Surmon as an individual wine brand, would also be captured. Other critical information such as their WPPP and likelihood of spreading positive WOM were also measured.
FIGURE 7 TASTING PANEL AT U OF A COMPUTER LAB
FIGURE 8 WINE MAKERS FROM SCHILD ESTATE GETTING READY FOR AN EVENT AT UNIVESITY OF ADELAIDE

18
FIGURE 9 EXAMPLE OF MT SURMON WINE LOUNGE CALENDAR
Respondents received a confirmation email for the event registration and attended the events as scheduled. At the conclusion of each event they completed a post-event questionnaire that measured, again, attachment to the brand, WOM and WPPP. The levels of need satisfaction (all types) and engagement were gathered in addition to their perceptions about the brand ambassador. As respondents were exposed to one single event, it was expected that differences might be small. Hence, the instruments were designed to be sensitive enough to reveal the potential for building community engagement and brand attachment in a community situation after only one event. As discussed, many members certainly returned several times (just because they enjoyed the experience) after recruitment, illustrating the potential power of this medium to attract and hold consumers even after only one experience.

19
MEASURES FOR CONSTRUCTS
Measures for variables illustrated in the models were either scales comprised of numerous items, computed via factor analysis to a single scale measure, or single item questions. Scale items were either 9-point Likert or Bi-Polar scales identified from the literature, or developed and validated as part of this project. All scale measures passed the required tests for reliability and validity (α> 0.7) and, hence, were deemed suitable for further analysis.
TABLE 1 PERCEPTIONS OF THE BRAND AMBASSADOR (9 POINT BI-POLAR)
Boring vs. Engaging
False and Phoney vs. Sincere and Genuine
Not really interested in my comments or opinions vs. Interested in my comments and opinions
Dull and uninteresting to listen to vs. Interesting to listen to
Not really knowledgeable vs. Very Knowledgeable
Not very likeable vs. Very Likeable
Unprepared vs Prepared
Hard to relate to vs. Someone I can relate to
Elitist vs. Down to earth
TABLE 2 COGNITIVE SATISFACTION (1 = STRONGLY DISAGREE TO 9 = STRONGLY AGREE)
The event provided me with useful information.
I learned quite a lot I didn't know before about these wines.
The winemakers presenting were very knowledgeable.
I learned from hearing the opinions of others.
I think the experience was valuable for learning about wine.
TABLE 3 EASE OF USE AND SITE ATTRACTIVENESS
Registering for the Wine Room community is easy.
The live streaming site is easy to find and navigate.
The layout is attractive and useful.
The 'posts' put up in the chat window are easy to read.

20
TABLE 4 SOCIAL SATISFACTION (1 = STRONGLY DISAGREE TO 9 = STRONGLY AGREE)
I liked meeting other wine lovers.
I enjoyed the 'chat' and being part of it.
This event was a good opportunity for meeting others - even in cyberspace!
I like being a part of this group.
I'd like to chat with them all again!
TABLE 5 EMOTIONAL SATISFACTION (9 POINT BI-POLAR)
Relaxing vs. Stimulating
Boring vs. Interesting
Dull vs. Exciting
Sleepy vs. Alert
Not Lively, Not Animated vs. Lively, Animated
Sluggish vs. Fast Moving
Not Fun vs. Fun
Annoyed vs. Happy
Unsatisfied vs. Satisfied
TABLE 6 SITE ATTRACTIVENESS AND EASE OF USE (1 = STRONGLY DISAGREE TO 9 = STRONGLY AGREE)
The live streaming site is easy to navigate.
The site layout is attractive and useful.
The 'posts' put up in the chat window are easy to read. TABLE 7 NEED FOR COGNITION
I actually prefer complex to simple questions.
I like to have jobs that require thinking.
I find long deliberations satisfying.
It's enough to get a job done; I don't care how it was worked out. (reverse coded)
I like that life is full of puzzles to be solved.
I often think long and hard about things that don't concern me.
Learning new things doesn't interest me all that much (truth be told). (reverse coded)
I really enjoy a task that challenges me to find new solutions.

21
TABLE 8 NEED FOR SOCIAL BELONGING/EMOTIONAL SUPPORT
I like belonging to groups – especially with a shared interest.
It’s important to me to be accepted by others.
I work hard to ensure I don’t do things that cause rejection.
I prefer the company of others rather than being alone.
I have the most fun when I'm with other people to share the experience.
I'm quite comfortable when alone, other people are sometimes intrusive. (reverse coded)
I like to be unemotional in emotional situations.
I can find it really satisfying to experience strong emotions.
I prefer to keep my emotions in check.
I think making an emotional decision is often the right thing.
TABLE 9 NEED FOR STIMULATION / RISK TAKING
I like to have new and exciting experiences - even if they're a bit risky or unconventional.
I like to explore new places and cities, even if I sometimes get lost!
I like to try new foods that I've never tried before.
I like to meet new people, even if they're a bit 'out there'.
I sometimes like to do things that are a bit frightening.
I sometimes do things just for the excitement of the experience.
I like to 'test the boundaries'!
I would rather be safe than sorry. (reverse coded)
I like to be very sure before I buy something. (reverse coded)
I pretty much avoid risky things. (reverse coded)
TABLE 10 ENGAGEMENT / UNIQUENESS (EVENT) (1 = STRONGLY DISAGREE TO 9 = STRONGLY AGREE)
It had many unique moments.
It was quite special.
It was as good, or better than expected.
It was a standout experience

22
TABLE 11 BRAND ATTACHMENT (1 = STRONGLY DISAGREE TO 9 = STRONGLY AGREE
*Asked pre and post event
TABLE 12 WOM (HOW LIKELY WHERE 1 = NOT AT ALL LIKELY TO 9 = VERY LIKELY)
Recommend any of the wines you tried tonight. *Asked pre and post event
TABLE 13 WTPPP (OPEN FIELD ANSWER)
What would you be willing to pay for a bottle of Barossa Valley wine? *Asked pre and post event
I feel affection for the Barossa Valley wines.
Barossa Valley wines are important to me.
I feel a bit passionate about them.
I feel Barossa Valley wines are friendly and approachable.
I am quite delighted by these wines.
Barossa Valley wines are quite captivating
I feel connected to Barossa Valley wines.
I feel some bond with Barossa Valley wines.
I feel attachment to Barossa Valley wines.
I feel a bit disloyal to the Barossa if I buy wines from somewhere else (reverse coded)

23
INDUSTRY PREPAREDNESS – CURRENT USE OF THE INTERNET
In order to get an empirical understanding of the Australian wine industry’s preparedness for on-line consumer engagement it was necessary to quantify the degree to which wine brands were already using the internet, their own brand websites and forms of social media to connect and stimulate two-way interactions with wine buyers. With growing use of the internet, consumers engage with companies to search for product related information (Bo-chiuan 2008; Voorveld et al. 2012) or to make product purchases. Therefore, it is important to support the industry, in order to take advantage of the internet as a communication tool. The secondary research was undertaken to assess the Australian wine industries’ position in relation to the use of web-based marketing tools, including web pages, consumer engagement, social media, and interaction with wine blog sites.
The secondary research consisted of two parts. The first was a content analysis (results reported here) that assessed 200 wine brand websites across Australia in 2010. Each website was categorized against established criteria within the literature (Thach, 2009) in relation to general web evolution which was developed for use in the wine industry in the United States. The purpose was to determine the level of sophistication seen on Australian websites. This stage of the research followed by a number of in depth interviews with brand stakeholders conducted to gauge (in a limited way at least) attitudes towards on-line marketing to wine consumers and to gain insights into their internet-based strategies (this follows on from the quantitative report).
SAMPLE SELECTION
Sample selection was based on a list generated from http://www.wine-searcher.com/ that contained 749 wineries. The number of winery websites that will be investigated was based on the actual number of wineries at each Australian state provided in the list. Therefore, a representative sample could be selected. Table 14 shows how the final sample size of 200 websites was chosen using the actual number of wineries listed in each state relative to the total sample of 749 wineries.
TABLE 14 SAMPLE SIZE AND SELECTION OF AUSTRALIAN WINE WEBSITES
ACT NSW SA WA TAS QLD VIC Total
5 137 180 148 37 42 200 749
1% 18% 24% 20% 5% 6% 27% 100%
N = 200 1 37 48 40 10 11 53 200
DEFINITIONS USED AS WEBSITE SOPHISTICATION CATEGORISATION
The initial stage of web presence (and the lowest level), named Wine 1.0, consists of a website that was primarily an on-line brochure with information about the company, its wine and no/little consumer interaction tools (Thach, LIZ 2009). Ordering systems were based on consumers printing order forms and faxing, phoning, or emailing payment details. Wine 2.0 websites had the same content with Wine 1.0 websites. However, they additionally had greater use of social networking tools such as blogs and v-logs that allow them to engage with their consumers. Consumers could also generate content in regards to their interest in the brand (Thach, LIZ 2009). Wine 3.0 is an advancement of Wine 2.0 with more innovative use of technology and greater interaction with the consumer through multiple channels such as barcode scanning or virtual reality tours of winery facilities. These components are perceived as more experiential for the consumer allowing them to engage with the brand on a deeper level (Thach, LIZ 2009).
RESULTS OF THE WINE 1.0 ANALYSIS

24
Among 200 wine sites analysed, 87% of them met the criteria established by wine 1.0. The results show that many of the investigated wine brands promoted on-line ordering, but did not offer full on-line order fulfilment. Queensland and Victoria held the lowest number of wineries that offered any form of on-line ordering system, while South Australia held the lowest number of wineries with email addresses listed (only offering telephone/fax or postal address). Table 15 shows the results of the percentage of wineries meeting the criteria of Wine 1.0 in each state. It can be seen that the majority of Australian wine brand websites were very ‘basic’ in nature at that time. A recent quick ‘spot-check’ of many of these websites determined that little or nothing had changed since then on most sites.
TABLE 15 RESULTS OF ANALYSIS OF WINE 1.0
% of those analysed
Brochure Style
Website Fax Phone On-line
Orders Email Total Wine 1.0
Total 99 % 99% 99% 47% 91% 87%
ACT 100% 100% 100% 100% 100% 100%
NSW 100% 100% 100 % 52% 94% 89%
SA 97% 97% 97 % 43% 83% 84%
WA 100% 100% 100% 47% 92% 88%
TAS 100% 100% 100% 77 % 88% 93%
QLD 100% 100% 100% 46% 92% 87%
VIC 100% 100% 100% 39% 94% 87%
RESULTS OF THE WINE 2.0 ANALYSIS
The next level of web evolution, Wine 2.0, represents sites with more interactive tools that facilitate a closer relationship with consumers. Wineries that were assessed against these characteristics have met all the criteria for Wine 1.0 in addition to one or more of the following features:
• Wine blogs allowing consumers to post their views about the wine, the brand or any other topic the consumer feels is appropriate to the brand hosting the information. In addition to the ability to give feedback about the brand, the use of a web blog allows the consumer to learn more about the brand itself. Research suggests that greater consumer brand knowledge contributes to increased perceived value in the brand (Sinha, Ahuja & Medury 2011).
• The integration of social networking tools such as Twitter and Facebook, allowing a new channel for the dissemination of information by the brands to interested consumers (Johnson 2011). In addition to the increased number of information channels, these tools also offer the option to enter into a dialog with the consumer in a more cost effective manner (Luigi et al. 2011).
Table 16 illustrates what percentage of wineries met the criteria of Wine 2.0 in each state. The results show that South Australia and Victoria had strong representation for Wine 2.0 at 14%. Tasmania, however, held the largest percentage of wineries found to meet the conditions, although due to smaller sample size, it can be argued that, this may not be the case for the whole state. This may also be a function of their distance from mainland Australia. Despite the mooted trend of the wide use of tools such as Twitter and Facebook, there was little evidence that this was widely used within the wine industry at this time (it is worth noting that this study was conducted in 2010). Importantly, whilst some brands had a blog site they were typically ‘empty’ or contained old content. Similarly Facebook sites were bulletin boards without extensive evidence to the two-way engagement. No wine brand was found to be employing Wine 3.0 strategies.

25
TABLE 16 RESULTS OF ANALYSIS OF CRITERIA WINE 2.0
% of those analysed Wine Blogs Social networking Twitter Total Wine 2.0
NSW 5% - - 5%
SA 14% - - 14%
WA 7% - - 7%
TAS 11% 11% - 22%
QLD 7% - - 7%
VIC 10% 2% 2% 14%
ANALYSIS OF AUSTRALIAN WINE BLOGS
An investigation of wine blogs was considered important in this study because the user generated content related to products is usually believed to represent a credible source of information amongst the consumers in comparison to company driven advertisements, and also because WOM strongly influences consumer behaviour (Dickinger 2011). The community sources of information such as chat, blogs and on-line groups have risen to 80% in recent years (Foster, Francescucci & West 2010; Yung-Cheng et al. 2010). Additionally, consumers searching for user-generated content while making a purchase decision has also risen substantially (Chatterjee 2001; Dou et al. 2010) indicating that traditional forms of marketing communications are suffering from consumer scepticism (Hammer, Riebe & Kennedy 2009; Pergelova, Prior & Rialp 2010; Rubinson 2009).
The analysis of Australian blog sites regarding wine, wine brands and wine regions was undertaken to measure the complexity and level of activity within this field. The front page of each blog was reviewed to assess the following aspects: the blogs intent/purpose; wine brands mentioned; advertising content; blog ownership (Brand, Community, Industry); author (professional or non); number of wine brands mentioned on first page and the most frequent wine brand named (K 2007; Steyn et al. 2007; Thach, LIZ 2009).
SAMPLE AND BLOG CONTENT ANALYSIS
A total of 18 Australian blogs were analysed to assess their possible value to consumers who seek advice or information about wine. Topics identified as useful were product (wine) reviews, announcements, corporate information and personal responses to blogger posts (Steyn et al. 2007). In addition to the identified areas of interest, a thematic review of content of the blog site was undertaken to assess the main content.
As expected, the majority of blogs had wine reviews as a major component of their content (83%). Nonetheless, the discussions of wine styles and flavours were also common, with personal views regarding the readiness for drinking or recommended cellaring. The majority of wine reviews used a scoring system to rate reviewed wine. This allowed readers to gain a greater understanding of how the wine was rated.
Announcements, corporate information and responses to blogger posts weren’t seen to any great degree on the analysed blogs. However a range of previously unidentified elements was discovered through the thematic review. These included wine education information, information about wine production and other forms of background information used to educate the readers and demonstrate the expertise of the blogger. It is suggested by previous research that many consumers use such websites to satisfy cognitive desires (Cacioppo, Petty & Chuan Feng 1984). It is also suggested that a consumer’s drive for cognitive satisfaction influences their satisfaction with on-line experiences (Sicilia, Ruiz & Reynolds 2006). Hence, it is likely that the educational/cognitive content is highly valuable to many visitors to these sites. Wine business content was also commonly seen, perhaps targeted at visitors from within the wine industry, this information was less about grape and/or wine product and more about industry trends and future predictions.

26
Winery blogs were also found in the sample, those produced by the brands themselves and hosted externally to their home website. While these blogs provided a large amount of product information they did not show any link back to the home site nor did they provide any purchase information. This attempt to engage with the community through blog sites is believed to have benefits including an increase in direct contact with customers, market research and sharing product updates (Turner 2009).
FIGURE 10 BLOG CONTENT
TABLE 17 EXAMPLE WINE RATING SYSTEM
96+ Top Gold/Trophy Exceptional. Wine of the highest standard. 94-95 Gold Medal Extremely good wine. Outstanding expression of variety or style. 92-93 Top Silver Medal Very good wine. Just missed out on Gold Medal. 90-91 Silver Medal Good wine. 87-89 Bronze Medal Wine has achieved a certain standard. Very acceptable. 85-86 - Fairly average wine with more good features than bad. 82-84 - Wine with more bad features than good. 79-81 - Poor wine. 76-78 - Very poor wine. 75 - Effectively zero. 74- - Tainted or faulty wine. + Highly Recommended Recommended O Commendable X Not recommended
http://australianwinejournal.blogspot.com/2009/07/scoring-system.html
83%
5% 6%
6%
Wine Reviews
Wine Education
Winery Blog
Wine Business
Other

27
WINE BRANDS MENTIONED
The number of individual brands mentioned on the opening page has been found to influence perceived credibility (Cox & Blake 2011) where a blog that mentions a larger number of brands is considered to be more credible. As a large number of blogs were structured around wine variety, there was less opportunity to have large number of wine brands listed on the initial page. However, some of the less structured blogs were often confusing or cluttered with numerous brands, requiring the reader to scroll to see all postings. As shown in Figure 11 (Wine brands featured on first page) the majority of blogs (61%) have between zero to 10 wines brands listed on their first page, potentially being too many for most amateur readers to comprehend and gain maximum value from the blog site (Holton & Chyi 2012). Hence it appears there is a need to list numerous brands to seem knowledgeable, but the trade-off may be the ease of navigation.
FIGURE 11 WINE BRANDS FEATURED ON FIRST PAGE
ADVERTISING ON BLOGS
For the purposes of this analysis, advertising was defined as any graphic offering a link to an organisation other than the blogger or the brand they represent (if a brand owned blog page). Links to wineries listed within reviews were not considered advertising as these were used to provide reference to the product reviewed.
More than half of the reviewed blogs did not carry advertising, other than promoting the blog itself. Of the blogs that did carry advertising, the majority of content was delivered and controlled by the web host. There were promotions from neither wineries or retail outlets, nor other compatible products to wine consumption such as tourism destinations or gourmet foods. This lack of promotion on blog sites is contrary to the literature specific to consumer acceptance of advertising in these domains (Fan & Chang 2011; Jen-Ruei & Chen 2012; Stremtan et al. 2010). However, research also shows that many site owners wish to keep their sites ‘ad-free’ in order to maintain independence (Gupta, Kim & Shin 2010; McWilliam 2000). This may partly suggest why many bloggers avoided promotional information on their blog sites.

28
FIGURE 12 ADVERTISING ON BLOGS
However, subtle advertising placement within the blogs was perceived positively and as a benefit to the community and less of an intrusion by community members. This shows that although a community site may be owned and run by a community of followers, there are many commercial opportunities for brands to engage with members for the benefit of both the brand and the community. This is also supported by research about attitudes of community members where they seek to find benefit for themselves and others as a part of their group (Heehyoung et al. 2008).
BLOG OWNERSHIP
Initially, blogs were classified into two groups, brand owned and individual blogs (Thach, 2010). The preliminary analysis of the wine blogs indicated an additional type of ownership, which was an intermediate level of ‘industry’ (28%). In other words, blogs were not owned by an individual wine brand or individuals, but rather by an industry group such as a wine region or area management group. These blogs provided general wine based content covering wineries in the area they represented, and a range of vineyards or varieties. These blogs were pitched towards the tourist target as they often gave views on aspects other than wine, such as travel to and from the region represented. Naturally, it has been found that brand owned blogs allow for greater interaction between the community and the brand (Turner 2009). Additionally, the information communicated through these channels is perceived as more credible (Ahuja & Medury 2010; Sinha, Ahuja & Medury 2011). Given that wine regions are ‘branded’, this strategy should be an affective if accepted by consumers.
FIGURE 13 BLOG SITE OWNERSHIP
44%
56%
Yes
No
28%
17%
55%
Industry
Brand
Individual

29
AUTHOR (PROFESSIONAL FROM THE INDUSTRY OR NOT)
Many traditional media agencies and journalists are involved in the creation of blogs (Cox & Blake 2011; K 2007) but, there are also a number of individuals, as demonstrated in Figure 5 that take a keen interest in writing about wine. Not surprisingly, it has been established that the strongest determinant to the credibility of a blog is the experience of the blogger (Meyer, Marchionni & Thorson 2010). A blogger’s credibility, in the mind of the reader, is measured by their affiliation with the industry in addition to the believability of their writing (Meyer, Marchionni & Thorson 2010). Again, not surprisingly, those from the professional sector and journalism reported a higher percentage (61%) of blogs analysed.
FIGURE 14 BLOG AUTHORSHIP
All bloggers were consistent in that they were found to rarely follow a sound website structure, layout or template for blog sites. This lack of organisation often resulted in a cluttered appearance for the site, representing a barrier to flow and ease of navigation for visitors. Many bloggers began writing about their passion for wine and then presented the rest of the content ad-hoc. Those blogs that followed a set structure did so based on wine varieties allowing visitors to read reviews on their wines of choice; however, there was no capacity to enable the reader to re-sort reviews and comments on other aspects such as price, brand or vintage. The untapped opportunity to commercialize wine blogs was evident with the lack of visible advertising, particularly since there is evidence to suggest consumers do not react adversely to it. Indeed, they may welcome the opportunity to be advised of products and services associated with wine.
The primary limitation to this stage of the research was the lack of Australian based wine blogs. With no clear list defining the source of each blog with the web address such as the .au suffix, the search was limited to a ‘breadcrumb approach’ of finding blogs through reading recommendations from other bloggers. This may have skewed the results as their peers may have recommended only ‘top bloggers’; however, there was still a strong representation from non-professional bloggers. The use of blog listings from previous research provided a base for discovery of blogs for this stage of the research however these were not categorized by location or topic of the blog. This added increasing complexity to the blog search as previous research was based on English language blogs and was not limited to any one country.
In summary, the results of the website content analysis and blog searches indicate that the Australian wine industry, generally, could be doing much better in terms of leveraging the benefits of overall on-line marketing strategies and engaging with consumers. It was particularly concerning to note that many websites did not contain current information or contact details and appeared to be somewhat ‘abandoned’ after the launch. Given that on-line product searches across category sites is the ‘norm’ for most consumers today, a wine brand’s website is of critical importance to brand positioning and sales. It may well be that many brand owners, particularly in the case of small to medium wine brands, lack the necessary expertise in their organisations to approach the means strategically or that many do not realize its current or potential importance. The main studies in the project provided the opportunity to directly assess this concern due to the involvement of the research team with industry in the establishment and testing of the planned virtual wine communities.
61%
39% Profesional
NonProfessional

30
SHORT QUALITATIVE REPORT STAKEHOLDER ATTITUDES TO ON-LINE CONSUMER ENGAGEMENT
To gain some understanding about wine brand stakeholder attitudes behind the use of on-line tools to engage consumers, 12 in depth interviews were completed. Specifically, the objectives were to investigate the views of brand owners, wine makers and those responsible for the marketing and promotions of wine on-line and the degree to which they felt competent or motivated to do so. This form of qualitative analysis allows a focus on language and words used to describe thoughts, thus shedding more light onto the situation being researched (Malhotra 2011).
SAMPLE SELECTION AND METHODOLOGY
A sample of 12 wineries was chosen from the national sample. As with the website analysis the final number served to determine the representation of each state as shown in Table 18.
TABLE 18 STATE REPRESENTATIONS IN THE SAMPLE
ACT NSW SA WA TAS QLD VIC Total 1% 18% 24% 20% 5% 6% 27% 100%
Sample Size 12 0 2 3 2 1 1 3 12
An industry survey had been completed as part of another project, and those respondents were given the opportunity to indicate their interest in being interviewed as part of this research. Those individuals who showed interest were contacted for in-depth interviews conducted over the telephone. Prior to each interview, the researcher visited their brand website to gauge their website level (Wine 1.0, 2.0 or 3.0) and got familiar with the brand and its wine. All interviews were conducted using a semi-structured discussion guide contains a discussion gathers information on the general use of social media and any other topic related to on-line wine marketing that the respondent wish to share.
AREAS STIPULATED ON THE DISCUSSION GUIDE
• On-line marketing knowledge • Preferred marketing communication tools • Website use • Blog use • Social media use • Future outlook in terms of the need to be ‘web-savvy’

31
BROAD OVERVIEW OF WINE BRAND RESPONSES
Qualitative results indicated three types of wine brand owners categorized according to their involvement in on-line and social media marketing strategies aimed directly at consumers:
• The ‘reluctant’ (N=4) o These respondents are aware of the opportunities that exist for employing sophisticated
on-line marketing strategies and social media tools. They know that others have aggressively employed these approaches, but have no intention to do so right now. Most likely to be Wine 1.0.
• The ‘waders’ (N=5) o They are entering the space of social media, but are not quite sure why. There was a
general feeling that Facebook and Twitter is something they need to have, but they are not convinced of their benefits or how to operationalize their use. Similarly, their websites were more likely to be on the verge of Wine 2.0 – but without operationalization.
• The ‘brave’ (N=3) o The brave believes in on-line engagement. To quote one respondent “all over it man”. They
are very active in both the spaces of Facebook and Twitter. Within this group however there appear to be two subgroups, one that has clear measured objectives and one that is into the space successfully, but needs to determine what/how they will use the social media to engage with their community.
ON-LINE MARKETING KNOWLEDGE
THE RELUCTANT
The person responsible for marketing communication was either the winemaker or other administrative staff members, usually without any marketing training or experience. The answers related to the question of responsibility for on-line marketing and marketing, in general, were “None, well nothing official, our winemaker is our promotions man” or “None officially, it is just admin and us wine folks”. Although the results slightly differed based on the size of the winery, the overall attitude was closely related to the answer of this winemaker: “I am a wine maker, I got into this game because I love my wine, that’s what I do, the marketing and promotion stuff is just stuff you have to do so you can make more wine.”
Although there was no position devoted solely to marketing or more specifically to on-line marketing, the winemakers showed high interest in, and enthusiasm about the use of social media tools. However, the barrier for most winemakers were the perceived complexity of on-line marketing: “You could safely call me a Luddite, not because I want to be, but it’s just so big, what you have to know, I just need somewhere to start off and get one thing under control, I have myself an iPhone and managed to work that out so there is hope for me yet.” This implies that although the companies within this group show the desire to get involved, they still need guidance, expertise, and direction to start on-line marketing activities.
THE WADERS
This group is similar to ‘Reluctants’, in having no special person responsible for marketing or on-line communications. Nonetheless, respondents indicated they have high knowledge of how to use on-line technology and appreciate how it can be applied. One respondent said, “Our son is the IT guy around here, we know what we want to do and he helps us do it, teaching us as much as he can along the way”. Hence, there are no strategic applications of on-line tools or their website. The following statement summarized this approach, “We make it up as we go along”. However, as mentioned above, in comparison to the ‘Reluctants’ the ‘Waders’ have an understanding of the importance of the use of the internet and marketing and tend to get professional assistance sometimes. However, this person is usually a consultant that rarely specializes in on-line marketing.

32
THE BRAVE
The ‘Brave’ not only showed a stronger attitude related to on-line marketing and social media strategies, but they also devoted more time to manage these strategies and had a clearer direction in terms of where they wanted to go with them. In most cases, the companies had a position devoted to sales and marketing and these individuals were more likely to have some marketing qualifications, especially in larger companies, “We have a marketing and PR trained team (2), PR is her focus and marketing is mine, let’s face it, Twitter etc. is really a PR tool”.
Respective to the query about the time devoted by marketing staff to on-line activities and social media, one answered (representative for this group): “10% each day, it should be more than enough for what we want to achieve but there are only two staff in the marketing area and we do everything.” When asked about the importance of social media specifically, “We have competitions on Facebook so are happy to throw time and some money at it to build.” Although, some companies showed a structured resource allocation to time or money for communication channels, most companies had no clear structure: “No real measurement of actual time or money, just whatever it takes to be in this sphere.” None were actively engaging with the consumers on-line via their websites. Some had blog sites, but they were empty when investigated by the research team.
PREFERRED MARKETING COMMUNICATION STRATEGIES
THE RELUCTANT / THE WADERS
This is one area in which all three groups differed both in how they communicate with the market and in how the market communicates with them. “We have a good core market that buys what we produce, we don’t have to do any real advertising and promotion. We get lots of action from wine writers due to the information in our members’ only section (password Merlot). There we have tasting notes for all our wines so that when a writer needs a quick and easy article written all they need is already there for them, do their work and they love you for it.” This respondent, as with all within this group was happy to share and communicate with their customers, the difference was the mode of communication.
The overall feeling within this group was that they were very traditional in their communication methods, using print media, newsletters and possibly a wine club – and that there was nothing wrong with that approach. Although many of them still uploaded and circulated newsletters via their websites they were reluctant to send them more broadly, “We have a good distribution chain, but also lots of folks read our newsletters and I am afraid to say they come to our website too.” (Perhaps an acknowledgement of their own perceptions of the quality of their brand web presence).
There was strong reliance on distributor communications instead of taking responsibility themselves for communicating with consumers. Indeed, it was revealed that many relied on simply on lower prices at retail level to generate sales, “We used to do a lot more promotions, but now things are driven on low price so we cut as much as we can to deliver that to them (consumer) our retailers are good, they know our product is value for money so we still get their support”.
THE BRAVE
This group engaged in more social media tools to communicate with their target markets. Facebook and Twitter were used to support their retail activities but the costs were cutting into traditional consumer promotional spending with thee resources being channelled into supporting their social media strategy, “We have a finite bucket, the time we put into social stuff means that we cut back some of our more traditional promotions, we are still getting results, this may be because of our social media strategy or perhaps it's still a result of the money we spent in the past in traditional media.” This example demonstrates that even the most adventurous of the three categories still grapples with the measurement of the success of their media strategies.

33
WEBSITE STRATEGY
Each group stated that the approximate age of their website was 10 years or above, agreeing that the website was long overdue for an update. Each respondent mentioned that some ‘tinkering’ had been done over the years but because of current business uncertainties, few would be making any major investment in their websites in the near future, “We are all just saving our dollars because of the situation the industry is in at the moment, when it’s all clear again things may change”. There was also some belief that there would be less money spent on websites as sales through this channel were currently low, with one respondent stating, “Definitely due for a revamp, but we don’t get any sales through there so don’t see the need to put lots of money behind it, most of our sales come through bottle shops and our existing distributors.” It was interesting that none made the link between an out of date website with little or no functionality and low on-line sales being generated by it.
Those who had made significant recent changes to their web presence showed concern about its cost –when discussing one website, a respondent noted that theirs was “pretty new, and expensive, hard to update too as there is lots of flash animation”. Overall, what they did was going to remain static for some time. The primary difference between the three groups was in the understanding that the ‘Brave’ had regarding the use of social media tools such as Facebook and using them to make announcements, additions, at little or no cost. Again, the perception that marketing expertise is ‘expensive’ was a recurring theme.
These responses are remarkable as they clearly indicate that an up-to-date web presence is not considered to be a business priority – in spite of the ongoing and exponential growth of on-line wine sales (even 3 years ago). Research conducted for the Wine Makers’ Federation (2012) about the success of third party wine operators selling wine on-line showed that at least half of wine brands in Australia use these channels to sell wine. This suggests that rather than investing in their own domains, they are reaching wine consumers on-line via these retailers. However, whilst this solution requires no expertise or investment, it carries great risks to brand positioning, profit margins and sacrifices the opportunity for the brand to engage directly with the consumers.
BLOG USE
THE RELUCTANT / THE WADERS / THE BRAVE
All three groups universally followed Halliday, both on and off-line. Although there was no other noteworthy specific authors or reviewers mentioned, some generic reviews were read by many respondents across all three groups. These included the Big red wine book (Mattington and Walsh) Hewan Hooker, Winefront, Snooth and Quaff.
Reasons given by respondents for seeking out and reading blog reviews were to investigate possible discussion of their own brand. Reviews of blogs and wine reviews also allows the brand to keep track of competitors, although this was primarily in relation to what others thought of their wine, individual strategies and plans by competitors appeared to be well known by each respondent.
SOCIAL MEDIA USE
THE RELUCTANT
This group, while fully aware of social media tools and their use, they were holding back in adopting them. This was due to three main reasons. First, their inability to see the value it could bring to the business, with one respondent saying that “Twitter….. Well it’s just that isn’t it, just a bunch of people talking about what they had for lunch, how will that help me sell more wine?” the second reason for holding back was the perception of the wine industry’s current situation. As a result, brands were not investing in new channels to distribute their wine. The final reason, was consumers’ unsubscribing from the newsletters (their current communication strategy) - the respondent explained that “until we work out why the hell that happens the

34
last thing we want to do is talk to more of them or even more often, they will all unsubscribe in a week.” This statement, again, suggests that many wine brands are seeking to implement marketing strategies ad hoc without the necessary expertise.
When asked why they have not moved into the social media or on-line wine sales spaces, one respondent replied that they were “…not comfortable with them, just don’t think they actually bring any benefit”. This is, although they do not think they are a ‘bad thing’ at this stage and that they aren’t prepared to discount them completely, they are watching the space with interest. Other respondents supported this with comments such as “we are thinking about doing more, but if we get to more customers with other things, that won’t just scare them off faster, just like the newsletter, that would be better. We are just being cautious”. This comment was identified as a symptom of a larger problem in a lack of direction in communications strategy rather than a problem with the channel of communication itself. Ultimately, the belief that new and potentially ‘untested’ ideas were too risky was the primary reason for reluctance. However it is more plausible that scepticism is underwritten by a general lack of understanding about how to go about it.
Still, they are comfortable with their decisions, “I just don’t trust it, it’s all too new and we (winemakers) like our tradition and take things slow as a process”. As a rule, again, they were also cautious about any potential expense, especially within the current climate, “No cost, no loss” was a response from one respondent.
THE WADERS
The best way to think of this group is the way in which you often get into cold water - go up to your knees, get used to the temperature, go a little further, and get used to the temperature and so on. This group have started to experiment with social media tools - Facebook primarily, as Twitter still creates negative feelings for them, “…..got a Facebook page but it’s a person not a group (fixing now) looking at Twitter but frankly not sure what to do with it once it’s there, I mean what’s it all for? Who gives a damn what the weather is like?” This group was open to the idea that they had a lot to learn. Importantly they were prepared to learn and take on new ideas “….I have an iPhone and I am working my way through that, so I am not a complete luddite, it’s just knowing where to start and getting some runs on the board first.” The primary reason for this group taking up social media tools, like Facebook, was to conform, “Because everybody else is doing it so it must be a good thing”. Another justification was to prepare, just in case it is important “Well, it has you guys researching it so it must be something, now what that is exactly I don’t know, but it’s better to be safe than sorry and at least prepare to jump on the bandwagon.”
Therefore, with Facebook as their first entry into the social media, perhaps it could be possible to convince them to use their own websites for more targeted engagement. They were particularly attracted to social media because it was perceived to be easy to use and ‘free’ as opposed to developing their own web site. However, they were not sure what to do with the consumers reached, “We have a Facebook page but it’s only just kicking off, our next step is growing the group, and then working out what to do with them”. This statement, again, indicates some interest and ‘will’ but there is still a lack of expertise or of a strategic approach to using such communication strategies.
This general lack of a strategic approach naturally extended to the absence of measurement criteria for success. With few resources to put into on-line approaches and no clear goals, it’s not surprising that Waders could not list any benefits realized thus far. But they were not overly concerned about it because they had no real expectations, “We will go in slowly and think things through before spending too much money there, I guess that’s the thing with some of this stuff, we can go in with little money spent, give it a prod and see what happens.” This response was a repeated theme from many respondents – they are entering the social media space, and then going to think about what to do when they get there. Again, Waders were content with this approach and did not intend to invest in their own websites instead. They saw few actual benefits for their ‘dabbling’, but this was balanced out by little investment. However, despite the high interest in the success of the strategy, they were not sure how such success could be quantified.

35
THE BRAVE
This group was especially confident in their use of social media. For example, one respondent said, “You name it and we do it, Twitter and Facebook are our thing at the moment”. This group, however, had more clearly defined goals; “I have given my marketing person some pretty clear KPI’s over them”. These KPI’s were based on ‘followers’, ‘likes’ and ‘friends’ rather than sales or brand saliency based outcomes. Still, such measures were not perceived as concerns because Braves were interested in determining what feedback they could harvest in relation to their brands. As was said by one interviewee, “We don’t just talk to them we listen as well, when thinking about particular events we go to our followers and ask their opinions”. Others within this group had a more engagement oriented focus, “We have put on some events specifically based on what they (customers) want, we gave them a list of who we were thinking of bringing over for a concert, and they chose their favourite, don’t tell our ticket people but we sold more tickets to the event without their help than with it. We are measuring engagement primarily and not financial return.” The owner of this wine brand was heavily involved in event and tourism oriented events. These statements were encouraging in terms of their readiness to employ more sophisticated means of on-line engagement.
Facebook was clearly their focus for consumer engagement, “Facebook, Facebook and more Facebook, we have a Twitter account but are not sure what to do with it yet, we see so many others going on about mundane rubbish and just can’t see the value in that yet. We use Flicker, YouTube have a community with Qwoff, and reviews on Snooth” - “Well that’s just the focus at the moment, we have had a website review and it looks great, so we can tick that box, now Facebook is the next challenge”. Many within this group also saw social media as low risk, “Well, with a following you can make decisions and have less risk, ask them what they want, give it to them and you can’t go wrong, its marketing 101”. Again, for this group, the primary benefits were consumer engagement at a very low cost, “It’s faster and cheaper than updating our webpage with info”. A common thread across the respondents was “…we are all over it man” social media and platforms to engage with their market appear to be something that they have adopted as a part of their traditional communications mix. Such statements provide further insight into the reasons for out of date brand websites.
The measurements for success differed (when present), “So far so good, over 4000 Facebook fans, and nearly 1200 Twitter followers.” While this may in itself be a good measure of the success of getting followers, it remains to be seen as to how well this translates into buying behaviour.
REVERSE CHANNELS OF COMMUNICATION
THE RELUCTANT
Significant differences were observed across the three groups in this area. The ‘Reluctant’ group stated that they rarely heard back from their consumers and were not concerned. They seemed to gain feedback from consumers during the wine tastings in bottle shops. However, their primary sources of feedback were suppliers who often looked for cheaper wine, “Only from bottle shops and all they give us is that they want the product cheaper. When we do tastings though we get lots from the customer.” The general feeling in this group was that the consumers were not very open to sharing their views about wines, and when they did, it happened through the traditional modes, “Email and phone response, Aussies are not real big on telling you that they like the wine, we do get a few but mostly from overseas when the wine was given to them.” This group had put the lack of feedback down to an attitude of the market and did not feel it was because of their approach to the consumer.

36
THE WADERS
The Waders asked for and received more feedback from consumers through various channels, not just from distributors, “None officially but don’t worry, we get feedback, not if they think its corked or anything, Aussies are not big on that stuff as it makes them look like a wine wanker but they will tell you if its good, just not exactly what was good about it.” They felt that consumers were more open to share their views.
THE BRAVE
This group felt that by using more of the social engagement tools, consumers could be more open to provide feedback and opinions about the wines. This was reflected in the comments of one respondent who stated, “Email when they feel inclined. It’s usually the zealots though and not your average wine drinker.” This group also felt that Australian consumers were hesitant to share their true feeling about wine, “People are just not that confident, I think, to put their thoughts out in the open air about wine in Australia”. The main response mode for this group was through emails, Facebook and Twitter, the latter two options were sent as private messages.
FUTURE OUTLOOK IN TERMS OF WEB BASED CONSUMER ENGAGEMENT
THE RELUCTANT
This group has few, if any, plans for developing interactive consumer engagement, “Waiting to see where the cards fall primarily” That being said, however, one of them did plan to review their website and branding, “Website needs love and I think it will get it soon, bottles have a new label that have the web address on them too so we are pulling a few things together”.
THE WADERS
The Waders seek to consolidate what they already have built and also, “Want to try to build some momentum in the market.” They believe that for social media to work they need to have a strong following and “…to build our database more, usually through events.” (These do not generate databases as such). This group also voiced their reliance on retailers and distributors to reach their customers, “They do our real sell (push promotions) we are pretty small, only 8000 cases this year but plan to go up by 30% next year so we need to secure our retail support.”
THE BRAVE
Strong growth in what they are already using is the goal for this group, with plans to build their Facebook ‘friends’ and ‘likes’ and also growth in a Twitter ‘following’. Some are investigating the location-based tools such as 4Square, although this was a limited number and had limited uses in their view.
SUMMARY
Data indicates a general awareness of the importance of on-line based engagement with consumers. However, their brand web presence was not perceived to be as important as a good Facebook page and there was little to be gained by investing in it instead. Generally, respondents agreed that social media is a powerful tool, although most did not have criteria for success stipulated in their marketing planning. The other theme that was consistent and alarming was the perception that marketing expertise was ‘expensive’ and it was better (because it’s low risk) to use free tools and just see what happens. Overall, the analysis suggests an interest, but perhaps not broad-based preparedness for the implementation of interactive on-line consumer engagement in the Australian wine industry. The attitudes exhibited by the ‘Brave’ show that there is a segment in the industry that may embrace it if they are given good direction and support. With one segment of the wine industry involved in these types of strategies and reaping benefits, other segments should follow. Hence, reluctance to invest in brand websites and communities within their own controlled domains may be overcome with evidence of its benefits and advice as to how to go about developing on-line marketing plans, the resources and expertise needed for success.

37
SUMMARY OF ANALYSIS OF QUALITATIVE FINDINGS
The qualitative findings of three studies (AHWR, MS and HQ) were obtained through thematic analysis conducted using the information gathered from interactive conversations between respondents and brand ambassadors during the live streaming events. This same approach was taken in pilot study, but to a lesser degree due to the lack of reliable participants in each event. The main focus of that initial work was to develop and test the live streaming technology, to explore the role of the brand ambassador in a community event and to investigate various types of content to get first insights in the community event related need satisfaction.
As discussed in more detail previously in the report, samples in the main studies (MS and HQ) were selected from the general public, those who joined the communities organically, and those who were encouraged to join in by the respective owners of the brands involved. Results for these two studies are drawn from 24 weekly events in the pilot study and a total of 24 bi-weekly events in the main studies with a total for the main studies of 1702 respondent statements (N=247). A total of 240 hours of video was reviewed alongside event transcripts to ensure community questions or comments were acknowledged by brand ambassadors to be able to include them as a part of this analysis. The two studies averaged nine respondents, each yielding seven comments per event. Comments analysed include all those respondents recruited for each event plus any participants that joined the event organically.
Live streaming on-line events are best described as a virtual wine tasting, conducted in conjunction with designated brand ambassadors (often the winemaker or brand owner), taking participants through tasting a range of wines and, in the case of the MS, a recipe for food matching. Recruited participants were provided wine samples in the University of Adelaide computer lab. Participants logged into the prebuilt chat room environment where they viewed the live streaming hosted by the brand ambassador and engaged in unscripted live chat via their computer terminal. Community members from Singapore, the United States and Europe often participated from their remote locations. The ‘hosts’ responded to questions from participants and community members, and asked questions about their opinions of the tasted wines and other points that ‘evolved’ during the course of the interaction. Each session ran for one hour, however, on occasions the events were extended due to high levels of interaction and engagement.
Brand ambassadors were briefed to the nature of the event prior to the session, with simple instructions to encourage group participation and ask questions of the “audience” to draw the participants into conversations. They were instructed to avoid a one-way communication style such as on television but instead take an advantage of the two-way nature of the chat room. Brand ambassadors could see comments made by participants in real time. No form of moderation was exercised. Brand ambassadors were briefed that not all comments may be positive. They were also instructed that if a participant did not like either the wine or a comment they were free to voice their opinion. In turn, participants were encouraged to ask any questions or make any comment about the wine, including criticism (within the bounds of civility). In the HQ site a ‘cheers’ function (in the form of a wine glass), similar to the “like” button on Facebook, was provided for participants to add support to posted comments and also to encourage future posting.
However, the first test of the concept was with our pilot group, the Adelaide Hills Wine Room. This was a critical part of the study as it allowed for the testing of the technology and the concepts involved. The next section of the report provides an overview of findings from the AHWR pilot project that covers ‘Wine Wednesdays’. This is followed by the findings from the first main study, the MS and lastly, the qualitative findings from HQ are provided.

38
ADELAIDE HILLS WINE REGION (PILOT STUDY)
The Adelaide Hills Wine Region was the first group in the wine industry to join the project. Although it was hoped that it would be possible to develop a fully-fledged community with this group, due to several organisational problems during the first 8 months of the project, it became clear that this would not be the case. Nonetheless, the time spent working with the Adelaide Hills was very helpful for the progress of this project because some of their 24-hosted ‘Wine Wednesday’ events have been very imaginative and informative for this study. Statistics from the Vimeo social media website (where the videos were stored post-event) discussed later in the report supports this conclusion with the ‘Top’ downloads, views and embeds recorded by those staged in the AHWR. This pilot study launched its first event in June 2011 and the last one in November 2011.
The work done in the AHWR provided the research team with information regarding the general level of preparedness for active on-line engagement (generally low). As this strategy was developed with the view that ‘anyone’ with a low investment and basic computer skills could apply it, the work represented a ‘hands on’ experience for the research team from a technical perspective. Although the members of the research team and the participating brands were not computer or audio-visual experts, we were able to cope with the process after only a little practice. The data collected from the transcripts and event feedback were used to finalize the model in Figure 3 tested within the main studies.
Due to organisational problems experienced with the Adelaide Hills Wine Region, an alternative regional wine partner was required to complete the main studies. James March of Barossa Grape and Wine Association expressed a strong desire to be part of the project. Based on a clear understanding of what the researchers were required to achieve in the project and receipt of their firm commitment to work closely with us, we were very pleased to bring them on board. As with the MS it was recognised that we would need to ensure participants were present in each event and the methodology was changed in favour of a quasi-experiment.
What follows is a brief summary description of the qualitative findings.
ADELAIDE HILLS WINE ROOM (AHWR)
Working with ‘Voice Designs’ and ‘Triple Zero’ (the groups that had done previous work with the Adelaide Hills Wine Region), the naming and brand assets were developed for this community. The development of live streaming interactive events required a range of areas to be addressed, such as technological requirements, the general role of a brand ambassador as the host in a community event in addition to the exploration of needs people seek in these community events. All of this information could be used to adjust technical configuration and in briefings for the brand ambassadors in the main studies.
This section provides specific information regarding:
• Technological requirements • The role of the brand ambassador in a community event • Exploration of possible community event related needs

39
TECHNICAL REQUIREMENTS
REQUIRED BRANDWIDTH FOR STREAMING
During streaming sessions, members advised that stability and consistency of bandwidth was essential to enjoyment when it came to the quality of video streaming. Table 19 outlines in more detail the specific statements regarding broadcast issues throughout the pilot project. Dahan and Hauser (2002) recognised the importance of reliable connection speeds on attitudes of consumers in a virtual environment who felt that consistent and reliable connections increased likelihood of ongoing interaction with a brand.
Multiple tests were run from a range of locations to ensure that live streaming could occur with a minimum of screen buffering (where video freezes and must catch-up with live stream). Whilst a minimum recommendation was 248 kbps from the suppliers of the streaming connection (Netromedia Canada), and many test locations matched this speed, a faster and more consistent connection was secured by hosting most of the events from an office set up at the University of Adelaide with Adelaide Hills Wine Region branding.
Participants were less concerned with overall image quality and with lack of streaming or ‘buffering’ which caused interaction to stop. Therefore the quality of broadcast streaming speed was lowered to 300 kbps allowing our broadcast to operate at a lower level maintaining a consistent stream. This lower broadcast rate resulted in smaller quantities of information having to be received by community members and allowed the stream to operate at lower buffer rates. As content of the sessions did not require much physical movement from the brand ambassadors, the lower broadcast level did not result in noticeably lower image quality.
During the pilot project, the broadcast ‘studio’ was re-located several times in the University of Adelaide. Such a review of the ‘studio’ setup provided more room for presenters and improved lighting increased the quality of captured images as shown in comments in Table 19. Whilst the majority of community members did not notice any difference, this allowed greater flexibility in the type of events and enabled a larger number of brand ambassadors at any time. The pilot test indicated that a simple set up was necessary, such as good lighting and attractive, branded backgrounds. As can been seen in the ‘screen shots’ at the end of this section, presenters could still provide an attractive backdrop even when they were in a confined space. It was important that presenters remained focused on, and close to, the camera to ensure that participants feel part of the experience. Having received the feedback that, at times, presenters were instead focused on a ‘private’ discussion made respondents feel isolated and left out. Therefore, a specific briefing was carried out with the presenters prior to each event.
Research demonstrates that virtual community members seek assistance from each other via on-line interaction (Heehyoung et al. 2008), which can serve as an indication of emotional and social support. As shown in Table 19, community members were amongst the first to suggest options to solve technical problems with broadcast than the technical team running the event. This reflects the recognised attributes of a virtual community and provides confidence that interaction with consumers through this medium can foster the feelings of connection normally attributed to physical groups. Fortunately, most of the problems with bandwidth speed and connection issues were resolved by the completion of the AHWR study. This particular stage of the research provided the research team with a steep learning curve.

40
TABLE 19 PARTICIPANTS COMMENTS RELATED TO TECHNICAL AND ENVIRONMENTAL REQUIREMENTS
Kind of issue Participants Comments
Audio
PR 6: We need a little more volume tech team! PR 3: can you get the speakers closer to the action please? PR 5: sound problems.... PR 7: It's a slow feed here too :-/ PR 3: (sound a bit soft...) PR 5: Hello! yes, also can see but not hear.
Connections
PR 8: Roberta the picture is quite blurry - not sure if you are getting the same feed PR 12: Is anyone else getting video dropouts? PR 6: slow feed from McLaren Vale tonight!! PR 13: grrrr, dodgy wireless dongle didn't wanna load the video. Made commenting on what was being said somewhat difficult! PR 24: Bummer, my connection is failing large scale, bollocks PR 5: yes thanks for sorting the techno glitch - nicely done! PR 3: Sorry. Too many buffering issues. Will watch video later. Goodnight everyone. PR 3:..and buffering problems...
Studio setup
PR 8: New studio is good. The quality is quite low compared to normal though? PR 3: It is looking terrific now so well done! PR 5: you are back and looking good PR 1: Hi Charlotte, try 'refreshing' your screen
THE ROLE OF A BRAND AMBASSADOR IN A COMMUNITY EVENT
THE MEANING OF A BRAND AMBASSADOR IN A COMMUNITY EVENT
Participants’ desire to learn the opinion and seek advice of the brand ambassador was evident throughout all conducted events. As seen in Table 20, questions and comments challenging the wine expertise of our brand ambassadors ranged from new trends in wine varieties/the introduction of new wine styles to brand recommendations.
TABLE 20 PARTICIPANTS COMMENTS RELATED TO THE INTERACTION WITH THE BRAND AMBASSADOR
Wine expertise
Participants Comments PR 11: Why has it taken so long for Gruner to enter the Australian market? Jancis Robinson said Gruner is the most commonly planted variety in Austria and it is also grown elsewhere in Eastern Europe. PR 12: If I am looking for a typical South Australian Pinot Noir, one that shows the true character of the fruit - is your Pinot Noir a good example? PR 11: Dan - how does Margaret River Chardonnay compare to Adelaide Hills Chard? PR 3: What makes a Sauvignon Blanc from the Hills better than one from New Zealand? PR 23: Thanks Janet and Erin, great wines, great info!
Identification
PR 3: What are you drinking tonight Marc? PR 24: I know this question is like asking which your favourite child is, but which is your favourite wine in your range? PR 9: Oh... that's really bad Larry... what are you drinking? PR 1: What are you drinking Tash? PR 39: How is the weather in Denmark

41
Likability
PR 23: We love you both..... two very creative personalities in the Hills... PR 4: Sue is so demure tonight - I am waiting for her wild child side to slip out PR 15: Yep Marc, I'm waiting for her infectious cackle PR 6: I really enjoyed the experience and the wine, this evening being my first time with Gruner. Thank you all very much :-)
In support of brand ambassador’s role in a community event, the participants made comments regarding their likability – over time the comments towards the brand ambassador became quite personal and familiar, suggesting that consumers identified themselves with the ambassador. Furthermore, the identification with a brand ambassador showed that he/she was considered as an integral part of the whole community event experience, providing support for the inclusion of a brand ambassador as the independent variable in our models.
EXPLORATION OF POSSIBLE COMMUNITY EVENT RELATED NEEDS
The different needs, which can be supported in a community event by a brand ambassador, were explored through the information gathered from 23 different events. Events covered various topics and involved different brand ambassadors each time
Firstly, the analysis showed that the most important need that participants wanted to satisfy was cognitive in nature. This included the need for knowledge about how the wine should be treated, advice on other wines, or the need for general recommendations. These findings not only demonstrated respect for the brand ambassador’s knowledge, but also supported the assumption that community members are open to receiving advice and recommendations from others (Foster, Francescucci & West 2010;Yung-Cheng et al. 2010).
Over the course of the events it also became evident that participants were interested in product information such as stories about grape growing, production or biodynamic wine production, which was indicative of participants’ information seeking and cognitive satisfaction. Hence, it was decided to include events that were less focused on individual wine, but rather on the production of particular types or styles of wine.
Throughout the events, brand owners chose the event themes according to their desire to highlight a specific wine, brand, or regional orientation. Regional events such as the ‘Crush Festival’ and annual vintage, lead to non-brand specific events; however, these were held in conjunction with regional brands. As the pilot progressed, it was clear that participants were especially interested in situational use of wine and special varietals related to food matching. This useful feedback was used to develop events in community calendars. As demonstrated in Table 21, participants were interested in brand ambassadors’ advice about how they can best enjoy their wine or match food and wine, providing support for the brand ambassador as a driver of cognitive satisfaction.

42
TABLE 21 PARTICIPANTS COMMENTS RELATED TO COGNITIVE SATISFACTION
Product information
Participants Comments PR 2: So how did this preparation stand up against such a wet 2011/12? PR 12: Can you tell us a bit about the Australian movement toward a star rating system of BD practitioners, please? PR 1: Question for Keeda, when out in the vineyard and choosing the right time to pick, is a gut feeling or when you taste the grape do you picture the end taste? PR 3: If I am looking for a typical South Australian Pinot Noir, one that shows the true character of the fruit - is your Pinot Noir a good example? PR 12: If I prefer white wines - is Pinot Noir a good start for getting into reds? PR 13: is this chardonnay sourced from a single vineyard? PR 14: Do only wooded Chardonnays age well? Would I have to drink an unwooded one while it is young like Sauvignon Blanc? PR 15: Why do you put Chardonnay on oak? Is it the only white wine that you use oak with? PR 16: What can I find in a Chardonnay from the ADL Hills that I won't find in Chardonnay from other regions? PR 17: can you age sauvignon blancs like chardonnays or Rieslings? PR 18: why is cool climate fruit so sought after? PR 12: What oak do you use for the cab?
Situational usage
PR 5: Hi guys. Do you think it is a good idea to give the Gruner time to breathe before you drink it? PR 14: Do you guys think there's a certain type (i.e. breed of cow) that works best as a vessel for the preps? PR 12: Fine dining and your wine-which restaurants in Adelaide and elsewhere? PR 10: I am having the GRU with fish and salad - and I was amazed how a simple tomato becomes not so ordinary! PR 11: I can now confirm that it goes very well with Dairy Milk Chocolate. PR 7: Soft ripe cheeses.... must be the French beret talking... PR 14: Stop making me want cheese ... PR 6: I didn't know that. I don't eat cheese. Who knew I would learn about blue cheese in the wine room? PR 4: The Duck and the Mendoza worked well. However the Montepulciano -Zinfandel and the duck balanced perfectly. Good acid and sweet fruit to work with the fatty duck. YUM PR 8: Geeze I'm really enjoying the Hurtle. Wish I had a tapas platter to accompany it. It is perfect to drink today after the amazing weather we had today. Sparkling + warm weather = fabulous PR 2: This may have already been covered ... but what food matches are recommended with Gru? PR 3: Dioni. If you were running a degustation what dishes would you create to match each wine? PR 5: tasting now but need something to eat - what food do you recommend? PR 7: what do you enjoy it with best as far as food is concerned - do you have a favourite? PR 9: I don't eat cheese. What other foods does this wine go well with?
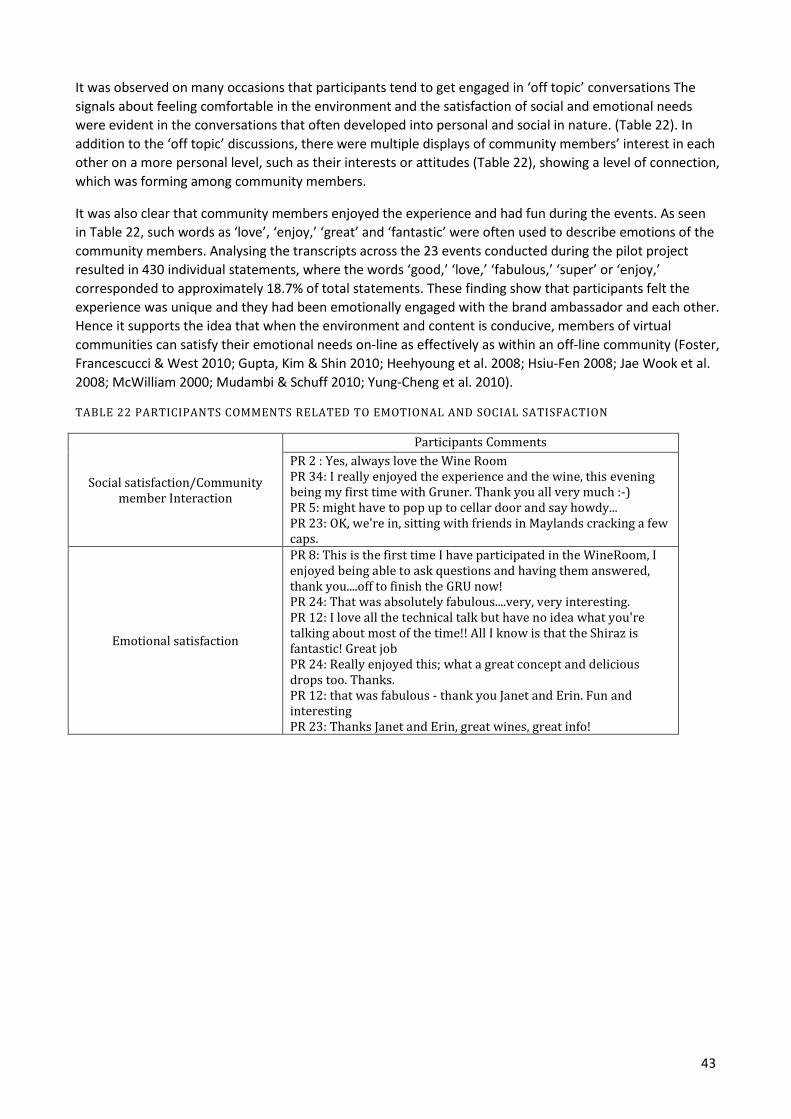
43
It was observed on many occasions that participants tend to get engaged in ‘off topic’ conversations The signals about feeling comfortable in the environment and the satisfaction of social and emotional needs were evident in the conversations that often developed into personal and social in nature. (Table 22). In addition to the ‘off topic’ discussions, there were multiple displays of community members’ interest in each other on a more personal level, such as their interests or attitudes (Table 22), showing a level of connection, which was forming among community members.
It was also clear that community members enjoyed the experience and had fun during the events. As seen in Table 22, such words as ‘love’, ‘enjoy,’ ‘great’ and ‘fantastic’ were often used to describe emotions of the community members. Analysing the transcripts across the 23 events conducted during the pilot project resulted in 430 individual statements, where the words ‘good,’ ‘love,’ ‘fabulous,’ ‘super’ or ‘enjoy,’ corresponded to approximately 18.7% of total statements. These finding show that participants felt the experience was unique and they had been emotionally engaged with the brand ambassador and each other. Hence it supports the idea that when the environment and content is conducive, members of virtual communities can satisfy their emotional needs on-line as effectively as within an off-line community (Foster, Francescucci & West 2010; Gupta, Kim & Shin 2010; Heehyoung et al. 2008; Hsiu-Fen 2008; Jae Wook et al. 2008; McWilliam 2000; Mudambi & Schuff 2010; Yung-Cheng et al. 2010).
TABLE 22 PARTICIPANTS COMMENTS RELATED TO EMOTIONAL AND SOCIAL SATISFACTION
Social satisfaction/Community member Interaction
Participants Comments PR 2 : Yes, always love the Wine Room PR 34: I really enjoyed the experience and the wine, this evening being my first time with Gruner. Thank you all very much :-) PR 5: might have to pop up to cellar door and say howdy... PR 23: OK, we're in, sitting with friends in Maylands cracking a few caps.
Emotional satisfaction
PR 8: This is the first time I have participated in the WineRoom, I enjoyed being able to ask questions and having them answered, thank you....off to finish the GRU now! PR 24: That was absolutely fabulous....very, very interesting. PR 12: I love all the technical talk but have no idea what you're talking about most of the time!! All I know is that the Shiraz is fantastic! Great job PR 24: Really enjoyed this; what a great concept and delicious drops too. Thanks. PR 12: that was fabulous - thank you Janet and Erin. Fun and interesting PR 23: Thanks Janet and Erin, great wines, great info!

44
Figure 15. Screen shots from the AHWR wine room and events.
FIGURE 15 SCREEN SHOTS FROM THE AHWR WINE ROOM AND EVENTS

45
MT SURMON WINE LOUNGE (MS)
This section of the report discusses the findings from qualitative data gathered during the events conducted in the MS. Jeni and Burt Surmon of the Clare Valley in South Australia own Mt Surmon Wines. They are small producers who have limited range of ‘alternative’ wine varieties produced for them on contractual basis. Prior to partnering with the researchers in this project they sold wine to consumers exclusively via their cellar door and bulk wine sales, also served food, had a large art gallery and a small intimate ‘retreat’ that accommodated overnight visitors. Their core brand values are ‘sustainability’, ‘offering something different in terms of wine varietals – no Riesling!’, ‘the pleasures and importance of good food’. Working with this brand also revealed an important point of differentiation was the personalities of the principals. Both Burt and Jeni are in their ‘70’s but are full of life and engaging in personality. With the assistance of the research team and the principals of ‘Voice’ design, they decided to undergo a rebranding exercise as part of the launch of brand community – the Mt Surmon ‘Wine Lounge’. As neither of the principals were wine makers per se, and good food was a core value, the decision was taken to orient their events around food matching in the Mt Surmon kitchen, highlighting one of their own wines each time. Jeni did most of the cooking and Burt fielded questions that they both addressed. This study commenced in March 2012 and finished in August of the same year.
BRAND AMBASSADOR
It was foreshadowed in the AHWR events that the brand ambassadors would be critical to the satisfaction respondents derived from the events. This also became very clear early in the MS events. Therefore, the brand ambassadors represented a focal element in the community events. The literature also suggests that they will provide credible and valuable information, can lead to consumer identification and provide a basis for an emotional evaluation (Algesheimer, Dholakia & Herrmann 2005; Yung-Cheng et al. 2010). These attributes were evident from the community interactions and are summarized below in table 23. As the brand ambassadors represented their brands, it was expected that the perceptions of the brand ambassadors would be carried over to the brands they represent. Hence, their ‘likeability’, ‘identification’ and ‘credibility’ related to ‘wine expertise’ are of critical importance with the potential to lead to stronger personal connections between the community members and the brands represented by the brand ambassadors.
TABLE 23 PARTICIPANTS COMMENTS RELATED TO THE BRAND AMBASSADOR
Wine expertise
Participants Comments MS 8: You guys really know your wine ) MS 24: I haven't ever heard of Viognier. Is there allot of these grapes grown in south Australia? MS 161: Burt could you tell me if using screw caps means we can cellar our wine standing up? MS 173: how long have you been a winemaker? Sounds like you have tons of experience MS 11: You are truly a fountain of knowledge Burt. MS 11: nicely answered Burt MS 8: I bet you're really good at Trivial Pursuit Burt MS 157: would you be able to recommend a particular brand of cocoa?

46
Identification
MS 17: Jenny, I like your passion HQ 8: you have a beautiful voice Burt. Mine ear is much enamoured of thy note MS 191: where did you guys grow up? MS 201: My husband - Leonardo, who is sitting next to me - just agreed that we want to be like you, when we "grow up" ;-) MS 166: Good to be sitting in a nice warm room. It must be cold in Clare Valley also? MS 153: You've inspired me to visit Clare again- and soon... So glad I've 'discovered' you…. Thanks for an informative and entertaining evening MS 173: hope to see you up there in Clare soon! Thanks , enjoyed this video and chat MS 1: Burt, do you realise that you look so longingly into your glass prior to drinking
Likability
MS 17: Jenny, I like your passion MS 8: Great work guys - I wish I was there enjoying with you at your cellar door MS 7: You are a delight together MS 25: I’m a virgin to this cooking show and I'm just in love with it and you and your life MS 192: Aberto loves wine and a lot of food, a great critic all round MS 8: Italian suits you Burt. Or should I say "Burto" MS 19: What a HANDSOME couple..! MS 194: That was a fine production. Jamie Oliver would be PROUD. MS 23: you got told! bravobertie! MS 157: Oh go on, tell us the joke! MS 164: Stick to wine making Burt!! Singing??? MS 8: Sing it again Sam...uh...I mean Burt MS 11: Get yourself together Burt! MS 11: You're swirling like a champ again Burt\ MS 1: phew, I have a Riesling, will that do me or should I spit it out? MS162: so much fun to be with you both, thank you for having us its always so much fun
NEED SATISFACTION
The thematic analysis of statements, questions and comments indicated that participants sought to satisfy several needs in an on-line community that supported the constructs included in Model 3.
COGNITIVE SATISFACTION
Consumers’ need for cognition refers to an individual’s propensity to engage in cognitive endeavours (Cacioppo, Petty & Chuan Feng 1984). Srivastava, Shukla and Sharma (2010) found that individuals’ need for cognition influenced their on-line experiences, specifically relating to focus and attention. Community members within the MS showed interest in learning throughout the event - this learning was related to the aspects other than the wine under discussion. Table 24 illustrates examples of two cognitive needs, namely knowledge seeking, product information and situational use (how best to use the product).

47
TABLE 24 PARTICIPANTS COMMENTS RELATED TO COGNITIVE SATISFACTION
Product Information
Participants Comments MS 13: What effects the strength of flavours in a cab? MS 7: can you tell me what forms sediment? MS 7: What are your thoughts on the more obscure grapes e.g. mouverdre? MS 10: What do you think is the perfect age for a cab sav? MS 17: Do you have particular wines that have inspired the choice of flavours you put into your wines? MS 18; what do you think is the secret to keeping calamari tender and not rubbery? MS 22: so what of your reds WOULDN'T do that dry mouth tannin thing to me? MS 24: I haven't ever heard of Viognier. Is there allot of these grapes grown in south Australia? MS 165: And how long could the wine go down…. this 2006? MS 159: Do you irrigate your Shiraz? MS 202: How difficult is to grow nebbiolo grapes in comparison .... say to pinot noir? MS 148: What is the best temperature to store wine? Is that the same temperature as best temperature for drinking?
Situational use (How and in combination with what food to
drink)
MS 3: Would it possibly go with dessert do you think? MS 159: what other food besides fish would you suggest with this food? Thanks. MS 164: thanks for answering that, stewing in the wine is a good idea! MS 8: I've never made homemade pasta before I'm really excited about learning MS 155: hello looking forward to tasting the wine and learning a new recipe MS 156: I am keen to know why the chocolate, does it go with the olives? MS 24: what's the difference in taste between fresh made pasta, and pre-prepared from the shops?
SOCIAL /EMOTIONAL SATISFACTION
Next, a forum for information exchange creates stronger feelings toward the group itself (Gupta, Kim & Shin 2010; McWilliam 2000). As can be seen in Table 25, community members’ needs to seek and enjoy social and emotional satisfaction were evident through their interaction with each other. Demonstrating and receiving social and emotional support took two forms throughout the discussions during these events – first, as a shared discussion, in which the community members discussed topics that were brought up by brand ambassadors and second, as the interaction between the community members. Emotional satisfaction was expressed through the comments related to their feelings during the event. The overall perception was extraordinarily positive, as shown in Table 25.

48
TABLE 25 PARTICIPANTS COMMENTS RELATED TO SOCIAL AND EMOTIONAL SATISFACTION
Social satisfaction/Community member Interaction
Participants Comments MS 2: Hi Karen! Great to see you in here. MS 153: Apols for my half sentence about your very good wine... what I wanted to 'fess up about was when I taste, I just found it almost impossible to be able to identify 'like' flavours - e.g. liquorice?? Chocolate? MS 11: Greetings one and all MS 8: Evette! I have heard that Cab Sauv is good for Alzheimer's! Mt Surmon Cab Sauv perhaps? ;) MS 156: Hi there you wonderful people, it's here
Emotional satisfaction
MS 8: I was having too much fun MS 11: you've dropped out! You’re tearing me apart! MS 14: Fan-bloody-tastic!! MS162: so much fun to be with you both, thank you for having us its always so much fun MS 169: Thank you for a delightful session MS 173: hope to see you up there in Clare soon! thanks , enjoyed this video and chat MS 159: I agree I’m having a great time MS 180: Thank you - very interesting and lots of fun MS 17: Dark berry, with a pleasant lingering after taste MS 25: I’m a virgin to this cooking show and I'm just in love with it and you and your life
EVENT ENGAGEMENT/UNIQUENESS
As seen in Table 26, community engagement is supported and can be inferred from the comments about the uniqueness of the event and their commitment to join future events of the wine community.
TABLE 26 PARTICIPANTS COMMENTS RELATED TO COMMUNITY ENGAGEMENT/UNIQUENESS
Engagement/Uniqueness
Participants Comments MS 173: hope to see you up there in Clare soon! Thanks , enjoyed this video and chat MS 8: haha will the next live stream be Burt and Jeni hunting down jatz haters? MS 167: thank you for having us - really enjoyed it. I'll be back! MS 4: just got back. This is so cool! MS 148: Hi there! Looking forward to trying your wine and watching you cook! MS 170: Thank you very much, I will be logging in again. This is a great concept. MS 11: OH THANK GOODNESS WE THOUGHT WE'D LOST YOU MS 1: This is a more real life cooking show, just like at home, knife in one hand glass in the other. MS 173: hope to see you up there in Clare soon! Thanks, I enjoyed this video and chat.

49
BRAND ATTACHMENT
The table below provides examples of the comments confirming strong brand attachment, such as love, liking, and passion related to a special wine brand. The importance of a brand ambassador for the evaluation of a wine brand was observed in the overlapping emotional comments related to the brand ambassador and the wine brand. In addition, people showed a connection to the wine brand and the brand ambassador. Based on low brand awareness before the event, the comments of connection were more related to the brand ambassador than the brand. In consideration of behavioural consequences of brand attachment, the participant comments were strongly related to purchase intention and buying behaviour. They mostly asked ‘where to buy the wine?’ and ‘how to visit the vineyard?’ or expressed intentions of positive WOM.
TABLE 27 PARTICIPANTS COMMENTS RELATED TO BRAND ATTACHMENT
Brand related emotions
Participants Comments MS 17: I don't usually drink a lot of red wine, but this has changed my tastes. I love this Cab Sav MS 25: the wine is beautiful MS 8: I really like the wine) MS148: I think your wine has much better acid than a lot of viogniers- it has really luscious fruit but is still beautiful and fresh MS 148: Lost you at the end. Thank you! Your wine is fantastic! MS 152: great Shiraz! MS 149: Hi folk, your shiraz is great!! Just what is needed after a hard day. MS 162: Really enjoying the Cabernet, beautifully integrated, like the old French oak. Long Dutch liquorice finish. The initial impact was of quite high acid. Did you add acid at the crush/ferment MS 8: It tastes like it was made with love
Brand connection 148: I think your wine has much better acid than a lot of viogniers- it has really luscious fruit but is still beautiful and fresh MS 173: hope to see you up there in Clare soon! thanks , enjoyed this video and chat MS 147: do you host weddings etc.
Consequences of brand attachment MS 24: we have a visitor coming from overseas next week....if we were to bring her to visit your winery, what could we do/see? MS 22: do you serve this at your cellar door? MS 147: so do you have B&B accommodation MS 148: where do you sell your wines other than cellar door, interstate /overseas /hotels MS 153: Do you sell your vinegar anywhere in Adelaide pls? MS 159: is your cellar door open every day. I will be visiting in mid Oct
In summary, the comments made during the events were very positive, providing sound evidence for the used constructs and their hypothesized relationships. In particular, strong support for emotional/social and cognitive satisfaction was evident in the data in addition to community engagement/uniqueness and brand attachment. The exemplars that were categorized in tables related to a particular variable, but in many cases that same statement can be also considered for other constructs under investigation – that is, a statement can be attributed to more than one category. The summaries shown in the tables represent only a small portion of from the rich data sets collected and the full transcripts of the events conducted in the MS are available from the research team upon request. What follows in Figure 16 are some screen captures of the events. These can also be viewed via the Mt Surmon Wines website (www.mtsurmon.com.au). The next part of the report provides an overview of the qualitative findings specific to the HQ Community events.

50
FIGURE 16 SCREEN SHOTS OF MT SURMON EVENTS
Home-made pasta, yabbies and Viognier
Introducing the winemakers of their Nebbiolo
Laksa with 100 Blossoms

51
BAROSSA HQ (HQ)
This part of the report provides the findings of the analysis of qualitative data gathered during the events conducted by various brands involved with the HQ Community. Following the same approach as used during the analysis of the MS data, the examples of the statements supporting the constructs in the models are discussed. The HQ events were conducted from October 2011 until September 2012. In contrast to the MS events, each ’HQ’ experience was unique in terms of content and brand/wines.
BRAND AMBASSADOR
Most events were hosted by wine makers, who were predominantly well known and respected. It was noticed that respondents were often in ‘awe’ of having the opportunity to speak to them personally and ask them questions. There was also an element of ‘fan’ behaviour towards some of the presenters. This became particularly evident when respondents asked if they could have their incentive wine bottle ‘signed’ by the winemaker. Also, while debriefing the respondents post the event, many shared how ‘special’ they felt their bottle of wine was or that it would be ‘kept for a special occasion’. There were also many comments and questions from respondents seeking more personal information from the ambassadors, indicating their feeling identification and likability.
TABLE 28 PARTICIPANTS COMMENTS RELATED TO THE BRAND AMBASSADOR
Wine expertise
Participants Comments HQ 36: liking that... framed in oak. I'm going to be using that when I want to sound like I know what I'm talking about HQ 41: Forgetting the terroir exercise would you use the same Oak regime with each sub region if you had a choice? i.e. can the sub region be better suited to some oak? HQ 41: Stuart do you think we focus too much on irrigation or not irrigating? HQ 56: Can you talk about the differences in the wood treatment between the Orphan Bank and the Valley Floor? HQ 56: What do you think about the trend away from very ripe fruit and high alcohol. Will Langmeil alter its philosophy at all in the light of the trend? HQ 63: Me too - thoughts gentlemen?? HQ 64: I once heard a theory can't remember where) that a white wine should be taken out of the fridge half hour before serving and a red put in the fridge for half hour before serving.....never done it, normally in too much of a hurry ;), but interested to hear your thoughts? HQ 65: Speaking of screwcap, what drove the move away from cork? And did you have a chance to directly compare the same vintages under cork and screwcap? If so, how significant were the differences? HQ 74: What is the ideal timeframe for a wine which has been cellared to be drunk, years? HQ 106: What are the benefits of using wild yeast vs manufactured yeast? HQ 27: Barossa Cabernet often sits in the shadow of Shiraz....what does Shavaughn think are the qualities of Barossa cab vs other regions that are better known for the variety? HQ 46: I love Southern Barossa wines could you recommend any other producers that could produce a similar style of wine to the Ben SchildShiraz HQ 83: What are the best combinations of cheese for a cheeseboard? HQ 90: any good Rieslings recommendations from the Eden???????? HQ 136: Have you tried the Cab Franc from Paracombe Winery in the Adelaide Hills?

52
Identification
HQ 34: Stuey Is there a song/musician you prefer to make wine to? HQ 39: Go Matthew! Nice save on the lights! HQ 69: But surely for someone like Shavaughn it helps to hear from the people who drink her wine that she is doing well HQ 73: I agree. Shavaughn and James have helped connect much more than previous one. HQ 52: How did two POMES come to be wine makers at Schild Estate? HQ 53: Scott could you try to move your lips in time with the talking – it’s all a bit monkey magic. HQ 126: Don't get me wrong. There is too much oak, but I rather drink a wine with a lot of oak over the horrible commercial "Barossa fruit bombs" that other wineries do ;-) HQ 128: Jealous of the kiwi sauviblanc skills? HQ 131: Mates rates???? HQ 27: Could you tell us the story about how an Italian came to be in the Barossa? HQ 67: Can I add you as a friend on Facebook?
Likability
HQ 51: Very sexy pair of chaps HQ125: Have you got a driver Adrian? You'd be tanked by now. HQ 27: best semi-on joke ever perhaps the only semi-on joke!) HQ 26: wine joke of the year! HQ 27: how does Shiraz go with possum? there is one in the roof above my head that needs 'fixing'. HQ 70: A bit nutty - like Jodie! :-) HQ 27: you blokes have done a magnificent job to get through this carrying nasty man colds HQ 27: get excited in an Italian way Giuseppe!!!!! HQ 27: Well done James...Barossa's 'Parky' HQ 27: we love you Charlie!.....and Barossa Malbec!
NEEDS SATISFACTION
COGNITIVE SATISFACTION
The area of cognition in regards to the HQ Community focused primarily on wine information. A strong link can be seen between the number of questions asked, and the recognition of brand ambassadors’ knowledge. Hence, it can be suggested that if community members feel the brand ambassador is knowledgeable, they would ask many questions in regards to how their wine can be enjoyed, including suggestions about other wine varieties. It is also likely that high levels of cognitive satisfaction would occur. Table 29 provides the key comments of the respondents who sought advice related to product information and situational use as already suggested in the pilot study.

53
TABLE 29 PARTICIPANTS COMMENTS RELATED TO COGNITIVE SATISFACTION
Product Information
Participants Comments HQ 33: Do you guys steer clear of marcato and stuff like that? Hope so HQ 35: until tonight I haven't really realised the difference you can get in a Shiraz HQ 37: I love rose and sticky whites. Which Chateau Tanunda rose and dessert wines would you recommend? HQ 41: Of the three regions, where would you choose if you could only plant in one and why? HQ 42: so do you mechanical harvest or hand pick?? and why do you think one is better than the other?? HQ 57: Should we be tasting a bit of black current & pepper flavour? HQ 74: What percentages of grapes in this one? HQ 44: what do you think are the secrets to varietal cabernet in the Barossa? HQ 105: As I come from a brewing background, wild yeasts sound a little scary. Is it difficult to control your flavours using wild yeast?
Situational use (How and in combination with what food to
drink)
HQ 28: What's your ideal food match for this one? HQ 67: Could the Valley Floor be served chilled? HQ 67: What are the best nibbles to serve with this wine? HQ 73: Does decanting benefit all red wines, just older or just younger? Would this one benefit from decanting and if so, for how long? HQ 85: You say reds are difficult to match with cheese, but then to my knowledge the Swiss drink mostly reds with their cheese preparation they call fondue - why? Are the Swiss cheese made differently from the locals? HQ 41: Looking for some left field Shiraz matches? HQ 27: what's Shavaugn's favourite thing about the Barossa?
SOCIAL / EMOTIONAL SATISFACTION
Events within the HQ had particular focus on the wine(s) being showcased. Although the group discussed areas considered to be ‘off topic’ to the wine, this was less evident than in the single brand community. The main discussions strongly focused on the wine related comments and discussion regarding individual’s opinions of the wines. With regard to interaction with other community members, similar to the single brand community, comments reflected social norms, greetings, appreciations of positive feedback and light-hearted comments. These indicate familiarity and identification between respondents and the brand ambassador(s), and do not allude to any barrier against brand owners as has been earlier documented in consumer owned communities. Moreover, the participants frequently expressed positive emotions related to the community events.

54
TABLE 30 PARTICIPANTS COMMENTS RELATED TO SOCIAL AND EMOTIONAL SATISFACTION
Social satisfaction/Community member Interaction
Participants Comments HQ 28: Hi - Becky from Thierry's in the UK here HQ 41: Hey troops, what's up tonight? HQ 68: Totally agree Lady Kimmy! HQ 71: It is great to get opinions and other thoughts... wine is so individual, everyone tastes are different, it is important to get feedback from anyone... HQ 70: yes it was! One of her USUAL cheesy puns! HQ 119: Great to see the banter is up & running! HQ111: Hi Paula. All good here. How are you? HQ 46: Good comment Kenneth about the Sauv Blanc but I struggle to find a decent straight Semillon and then there don't to be that many on the shelf. Didn't you guys used to make a straight Sem? HQ 73: I agree. Shavaughn and James have helped connect much more than previous one.
Emotional satisfaction
HQ 40: So good to hear from you! has been a very enjoyable session Cheers HQ 64: Agreed - one of the best vineyard tours I have done. Interesting and interactive. Love the history. HQ 37: Thanks for the experience, very enjoyable
COMMUNITY EVENT ENGAGEMENT/UNIQUENESS
The aspects confirming respondents’ engagement with the event and their perceptions about the uniqueness of their experience were evident. Statements relating to the event being a stand out experience were focused on the appreciation of the community event, with indications for repeated or longer lasting encounters.
TABLE 31 PARTICIPANTS COMMENTS RELATED TO COMMUNITY ENGAGEMENT/UNIQUENESS
Engagement/Uniqueness
Participants Comments HQ 64: Agreed - one of the best vineyard tours I have done. Interesting and interactive. Love the history. HQ 32: Thanks for the fab tastings and info too... an awesome experience! Lyndock is my fav, then Grenock, then Ebenezer... all fantastically fabulous though...great work fellas! HQ 69: Having been part of the last experience this one has been so much more rewarding as Shavaughn has actually answered questions and acknowledged participants. Thank you Shavaughn HQ 127: Well done ladies Great experience!
BRAND ATTACHMENT
Respondents in the HQ showed strong indications of delight and connection with the wines. They also reported some level of previous experience with some of the brands. This was not surprising given that many well-known brands participated in this study. Due to higher brand awareness, in comparison to the MS, the number of comments related to the brand connection was higher in HQ. The consequences emanating from brand attachment were also observed in relation to product usage, value expressions, and purchase intentions.

55
TABLE 32 PARTICIPANTS COMMENTS RELATED TO BRAND ATTACHMENT
Brand related emotions
Participants Comments HQ 28: This is a tease....I'm just imagining how lovely the wine is!! HQ 64: Love the wine, love Langmeil.......been half dozen times and always a fun experience HQ 27: we love you Charlie!.....and Barossa Malbec! HQ 68: Your sparkling red... rocks!! simply the best I've tried –D HQ 81: Thank you Victoria, Emily and Geoff, beautiful wines and cheese. HQ 114: Love the label - wouldn't mind the tattoo! HQ 29: Wow! Greenock has so much fruit! Love it! HQ 32: Love it, the flavour lingers, be great with a dark chocolate! HQ 34: Love the Ebenezer HQ 40: I am loving the Greenock - so rich and full bodied HQ 56: love it! prominent fruit, with the right structure to back it. delicious Barossa beauty HQ 45: I love the label, reminds me of stain glass panel HQ 97: I don't drink a lot of reds - but I'd try this again. Great taste. A lovely drop of vino. Well done. HQ125: I love Yalumba HQ135: Interesting background – thank you for sharing love Taylors Wines too! HQ 36: ooooooh old semillon! lurvely! HQ 38: Thanks a million, any future tastes I would like to be included. HQ 64: This is lovely wine. *sigh* Happy place.
Brand connection
HQ 76: Agree FirstOnScene classic label looks very smart HQ73: I agree. Shavaughn and James have helped connect much more than previous one HQ 64: Best part is non-pretentious cellar door staff....and I am a lady thank you very much HQ 46: As a person who loves there wines but I am in a minority in my social group how do you sell a wine like Ben Schild Shiraz to a novice drinker HQ 125: Personally, I'm not familiar with Grenache, but this tastes really great.. HQ 100: I'm not usually into shiraz much but this is nice. HQ 121: I guess I liked the Bishop shiraz, I'm not normally a red wine drinker. I'm slowly trying different reds, usually a white moscato is my after work favourite lol HQ 32: the tannins aren't huge like some Barossa reds are... they're just going to age with perfection! YUM! HQ 44: makes the cabernet seem a touch astringent for me HQ 48: Earthy, leafy, and slightly dusty… packed with dark fruit on the nose. Good tight acid structure, will go well for a few more years. HQ 50: Even though this wine has dark deep fruit, it also shows many vibrant redcurrants and cherries, coupled with the acid, the fine tannin, and the oak, its good now but def gain a lot with some age.

56
Consequences of brand attachment
HQ 59: The wine is pretty good value for money and I would be happy to put it on the table when we have dinner with friends. HQ 64: Put simply, as I just said to 'Shazam', I really like this wine ) HQ 106: Will definitely be grabbing a bottle sometime soon. Cheers! HQ 69: Apart from Cellar door do you offer behind the scenes tours at Saltram or join the winemaker days? HQ 69: Regarding your labels how do you go about thinking and marketing them, are they important to you or is it the wine that sells the bottle? HQ 49: What does the future hold for Schild Estate? New blends? New varieties? Considering the climate and market etc.? HQ 108: What is the price and is it only available cellar door or mail order? HQ 116: do you make a sparkling shiraz?
In summary, the qualitative data analysed for the HQ also provides strong support for the variables shown in the models and their expected relationships. Whilst the two communities show expected similarities in terms of needs satisfaction, they also demonstrate consistent reactions to the events and the opportunities to engage directly with a wine brand via a brand ambassador. Indeed, results from this research show that the brand ambassadors were embraced and respected and that respondents exhibited a strong desire to engage with them. Of all 177 statements across the two communities, around 20% of comments were directed to, or were about the brand ambassador. Respondents’ reactions were overwhelmingly positive with an expressed desire to learn from, and interact with, the brand ambassador and each other. It was particularly encouraging to note that in both communities’ brand ambassadors were treated without scepticism or aloofness, demonstrating the trust and credibility that is usually only reserved for consumer to consumer interactions. Hence, one of the major concerns providing a possible barrier to a brand-lead community appears to be surmountable. Moreover, whilst some technical issues were experienced, in the most part, in early test runs in the AHWR streaming quality was good to excellent. What follows are some screen shots from events in the HQ. The next section of the report provides quantitative results of empirical testing of the model
. Figure 17 Screen shots of HQ events
Langmeil Barossa
Saltram Wines
Schild Estate Wines
St Hallet Wines

57
QUANTITATIVE ANALYSIS OF THE MOUNT SURMON WINE LOUNGE (MS)
What follows is the analysis of all quantitative data collected from the live streaming events hosted in the MS. Firstly some descriptive data is presented followed by the testing done in relation to the hypothesized relationships of the constructs shown in the models specified in section one of this report.
DESCRIPTIVE ANALYSIS
To check the success of the influence of the community event on the dependent variables (attachment, WPPP, WOM) a paired sample T-test was employed. The results in tables below show significant differences in the dependent variables except WPPP. The evaluation of brand attachment increased from 3.36 to 6.96 on a scale of 1 to 10 (p = 0.000), which is an increase of 106.8%. Also the willingness to support a brand by WOM increased significantly from 3.47 to 7.61 (p = 0.000), which is an increase of 122.5%.
TABLE 33 SAMPLES T-TEST PRE AND POST EVENTS
Mean N Std. Deviation Std. Error Mean
Attachment before Event 3.36 114 1.89 .17
Attachment after Event 6.96 114 1.51 .14
WTPPP before Event 22.00 114 6.37 .59
WTPPP after Event 22.75 114 5.55 .52
Costs of a descent bottle of wine 24.43 114 8.32 .78
WOM before Event 3.47 114 2.21 .21
WOM after Event 7.61 114 1.41 .13
TABLE 34 SAMPLES T-TEST IN THE MS COMMUNITY
Paired Differences t df Sig. (2-tailed)
(p value) Mean Std.
Deviation
Std. Error
Mean
95% Confidence
Interval of the
Difference
Lower Upper
Attachment Difference -3.59 2.27 .21 -4.01 -3.16 -16.83 113 .000
WTPPP Difference -.73 6.22 .58 -1.89 .418 -1.26 113 .209
WOM Difference -4.13 2.46 .23 -4.58 -3.67 -17.89 113 .000

58
The comparison of the WPPP (pre/post) with the perception of ‘how much a descent bottle of wine costs?’ shows that based on the lack of brand awareness the WPPP is below the average price people say they would pay for a ‘descent bottle of wine’. This result implies that brand awareness is an important driver of consumer price perceptions and only one event could not change the WPPP. This highlights a problem faced by many wine brands with low awareness in highly competitive often price driven environment. It also demonstrates the importance that strategies such as those tested in this research can play in engaging consumers. It is also important to note that the actual retail prices for most wines in the ‘MS’ brand range are priced in excess of both the benchmark price and the WPPP seen in this study. This means that for many consumers, without any exposure to ‘MS’ communications strategies would deem these wines to be overpriced.
TABLE 35 SAMPLES T-TEST FOR WPPP AND DECENT BOTTLE OF WINE IN THE MS COMMUNITY
Paired Differences t df Sig. (2-tailed)
(p value) Mean Std.
Deviation
Std. Error
Mean
95% Confidence
Interval of the
Difference
Lower Upper
Difference WPPP(pre)/Descent costs 2.42 6.51 .61 1.21 3.62 3.96 113 .000
Difference WPPP(post)/Descent costs 1.68 7.52 .71 .28 3.08 2.38 113 .019
MODEL ANALYSIS
In order to analyse the proposed model, we conducted a series of regression analysis. Figure 18 includes an overview of all results - including standardized Beta (Beta) values as an indicator of the strength of a predictor on a dependent variable, as well as the adjusted explained variance (R2) as measure of how much variance of a dependent variable can be explained by the proposed predictor. The model shows all transitions between the brand ambassador, the community event as well as difference in (pre vs. post event) brand attachment with downstream effects on WOM and WPPP. All contemplated effects are significant except for the influence of brand attachment on WPPP.
FIGURE 18 OVERVIEW OF THE PATH EFFECTS OF THE MODEL FOR THE MS COMMUNITY

59
To illustrate how the results were determined as shown in Figure 1 what follows is a description of the analysis of each relationship respectively. The results of this regression analysis show that the influence of the brand ambassador on cognitive satisfaction has positive significance with a Beta value of 0.549 (p = 0.001) and can explain 29.5% of the variance (see Tables below).
TABLE 36 EXPLAINED VARIANCE OF COGNITIVE SATISFACTION IN THE MS COMMUNITY
Model R R Square Adjusted R Square Std. Error of the Estimate
1 .549a .302 .295 1.21153
a. Predictors: (Constant), Brand ambassador
TABLE 37 STRENGTH AND DIRECTION OF THE INFLUENCE OF THE BRAND AMBASSADOR ON COGNITIVE SATISFACTION IN THE MS COMMUNITY
Model Unstandardized Coefficients Standardized
Coefficients
t Sig.
(p value)
B Std. Error Beta
1 (Constant) 1.341 .831 1.614 .109
Brand ambassador .723 .104 .549 6.956 .000
a. Dependent Variable: Cognitive Satisfaction
The influence of the brand ambassador on social need satisfaction is also positive and significant (Beta = 0.530; p = 0.001), explaining 27.4% of the variance of social satisfaction. Tables 38 and 39 below show the results of this regression analysis.
TABLE 38 EXPLAINED VARIANCE OF SOCIAL SATISFACTION IN THE MS COMMUNITY
Model R R Square Adjusted R Square Std. Error of the Estimate
1 .530a .281 .274 1.27701
a. Predictors: (Constant), Brand ambassador
TABLE 39 STRENGTH AND DIRECTION OF THE INFLUENCE OF THE BRAND AMBASSADOR ON SOCIAL SATISFACTION IN THE MS COMMUNITY
Model Unstandardized Coefficients Standardized
Coefficients
t Sig.
(p value)
B Std. Error Beta
1 (Constant) 1.226 .876 1.400 .164
Brand ambassador .724 .110 .530 6.610 .000
a. Dependent Variable: Social Satisfaction
The analysis of the emotional satisfaction shows that the brand ambassador influences emotional needs negatively (Beta = -0.303; p = 0.001). The influence of the brand ambassador can explain 8.4% of the Emotional Satisfaction in the community event. Tables 40 and 41 show the results of this test.

60
TABLE 40 EXPLAINED VARIANCE OF EMOTIONAL SATISFACTION IN THE MS COMMUNITY
Model R R Square Adjusted R Square Std. Error of the Estimate
1 .303a .092 .084 1.88125
a. Predictors: (Constant), Brand ambassador
TABLE 41 STRENGTH AND DIRECTION OF THE INFLUENCE OF THE BRAND AMBASSADOR ON EMOTIONAL SATISFACTION IN THE MS COMMUNITY
Model Unstandardized Coefficients Standardized
Coefficients
t Sig.
(p value)
B Std. Error Beta
1 (Constant) 8.507 1.290 6.594 .000
Brand ambassador -.543 .161 -.303 -3.366 .001
a. Dependent Variable: Emotional Satisfaction
TABLE 42 EXPLAINED VARIANCE OF EVENT ENGAGEMENT/UNIQUENESS IN THE MS COMMUNITY
Model R R Square Adjusted R Square Std. Error of the Estimate
1 .861a .742 .735 .85184
a. Predictors: (Constant), Emotional Satisfaction, Cognitive Satisfaction, Social Satisfaction
TABLE 43 STRENGTH AND DIRECTION OF THE INFLUENCE OF EMOTIONAL, SOCIAL AND COGNITIVE SATISFACTION ON EVENT ENGAGEMENT/UNIQUENESS IN THE MS COMMUNITY
Model Unstandardized Coefficients Standardized
Coefficients
t Sig.
(p value)
B Std. Error Beta
1
(Constant) -.790 .505 -1.563 .121
Social Satisfaction .713 .102 .646 7.003 .000
Cognitive Satisfaction .318 .104 .278 3.069 .003
Emotional Satisfaction .114 .043 .135 2.646 .009
a. Dependent Variable: Community Engagement/Uniqueness
In order to analyse the influence of the different needs (emotional, social, cognitive) on community engagement/uniqueness, a multiple regression analysis was examined. A multiple regression analysis provides a comparison of different independent variables on a dependent variable. The results show that the total satisfaction of all needs explain 73.5% of community engagement/uniqueness, which is a very high value. All three needs are significant predictors (p < 0.05), whereby social satisfaction has the highest positive influence on community engagement/uniqueness (Beta = 0.646). Cognitive satisfaction exerts the second highest influence (Beta = 0.278) and finally emotional satisfaction (Beta = 0.135). Tables 42 and 43 illustrate these results.

61
A mediational analysis is used to explain a relationship between two variables based on other, so called, mediating variables. Therefore, in order to explain the process of how the brand ambassador influences community engagement/uniqueness, a mediational analysis was conducted (see Figure 19). The considered mediating variables were cognitive, social and emotional satisfaction. This kind of mediation is called a multiple mediational analysis based on investigating more than one mediating variable. This procedure allows a comparison between the different mediators and reveals which of the mediating variables best explains the underlying relationship between brand ambassador and community engagement/uniqueness.
FIGURE 19 MEDIATION OF THE SATISFIED NEEDS BETWEEN THE BRAND AMBASSADOR AND THE COMMUNITY EVENT ENGAGEMENT/UNIQUENESS
To test the expected mediating roles, we followed Preacher and Hayes (2008, 2004) using a bootstrapping procedure. In detail, we used an SPSS macro provided by Preacher and Hayes (2008) to test for multiple mediations. Table 44 shows the results.
TABLE 44 MEDIATIONAL ANALYSIS OF THE COMMUNITY RELATED NEEDS BETWEEN BRAND AMBASSADOR AND COMMUNITY EVENT ENGAGEMENT/UNIQUENESS IN THE MS COMMUNITY
************************************************************************** Written by Andrew F. Hayes, Ph.D. http://www.afhayes.com ************************************************************************** Model = 4 Y = Community Engagement/Uniqueness X = Brand ambassador M1 = Cognitive Satisfaction M2 = Social Satisfaction M3 = Emotional Satisfaction Sample size 114 ************************************************************************** Outcome: Cognitive Satisfaction Model Summary R R-sq F df1 df2 p . 5493 .3017 48.3839 1.0000 112.0000 .0000 Model coeff se t p constant 1.3409 .8309 1.6137 .1094 Ambassador .7228 .1039 6.9559 .0000 **************************************************************************

62
Outcome: Social Satisfaction Model Summary R R-sq F df1 df2 p .5297 .2806 43.6894 1.0000 112.0000 .0000 Model coeff se t p constant 1.2262 .8758 1.4000 .1643 Ambassador .7239 .1095 6.6098 .0000 ************************************************************************** Outcome: Emotional Satisfaction Model Summary R R-sq F df1 df2 p . 3031 .0919 11.3307 1.0000 112.0000 .0010 Model coeff se t p constant 8.5075 1.2903 6.5935 .0000 Ambassador -.5431 .1613-3.3661 .0010 ************************************************************************** Outcome: Community Engagement/Uniqueness
Model Summary R R-sq F df1 df2 p . 8650 .7482 80.9596 4.0000 109.0000 .0000
Model coeff se t p constant -1.5881.6991 -2.2716 .0251 Cog Sat .2777 .1058 2.6250 .0099 Social Sat .6945 .1017 6.8313 .0000 Emot Sat .1266 .0434 2.9207 .0042 Ambassador .1462 .0892 1.6387 .1042 ******************** DIRECT AND INDIRECT EFFECTS ************************* Direct effect of X on Y Effect SE t p .1462 .0892 1.6387 .1042 Indirect effect of X on Y Effect Boot SE BootLLCI BootULCI TOTAL .6347 .1245 .3884 .8781 Cog Sat .2007 .0982 .0487 .4343 Social Sat .5027 .1258 .2846 .7874 Emot Sat -.0688 .0353 -.1704 -.0186 ******************** ANALYSIS NOTES AND WARNINGS ************************* Number of bootstrap samples for bias corrected bootstrap confidence intervals: 1000 Level of confidence for all confidence intervals in output: 95.00 NOTE: Some cases were deleted due to missing data. The number of such cases was: 6

63
Based on the requirement of Zhao et al. (2010) that mediation exists when the confidence interval of the bootstrap test does not contain zero, the results of the multiple mediation show that the confidence intervals for neither cognitive satisfaction (CI = 0.0487; 0.4343), nor social satisfaction (CI = 0.2846; 0.7874) or emotional satisfaction (CI = -0.1704;-0.0186) include zero. That result means that satisfaction of all the needs combined explains the relationship between the brand ambassador and community engagement/uniqueness; in other words, full mediation is indicated. Emotional satisfaction in comparison to both other community related needs, however, shows a special case of mediation. Even though emotional satisfaction drives community engagement/uniqueness positively, the brand ambassador influences it negatively. To also identify the type of mediation Zhao et al. (2010) recommend employing Baron and Kenny’s (1986) stepwise regression analyses.
TABLE 45 EXPLAINED VARIANCE OF BRAND ATTACHMENT (DIFFERENT PRE AND POST EVENT) IN THE MS COMMUNITY
Model R R Square Adjusted R Square Std. Error of the Estimate
1 .459a .211 .204 2.03232
a. Predictors: (Constant), Community Engagement/Uniqueness
TABLE 46 STRENGTH AND DIRECTION OF THE INFLUENCE OF COMMUNITY EVENT ENGAGEMENT/UNIQUENESS ON BRAND ATTACHMENT (DIFFERENCE PRE VS POST) IN THE MS COMMUNITY
Model Unstandardized Coefficients Standardized
Coefficients
t Sig.
(p value)
B Std. Error Beta
1
(Constant) -2.699 .753 -3.585 .001
Community Engagement/
Uniqueness .632 .116 .459 5.473 .000
a. Dependent Variable: Attachment_diff
The transitional effect of the community event on perceptions of the brand is expressed by the influence of community engagement/uniqueness on brand attachment. Community engagement/uniqueness can explain 20.4% of the difference of brand attachment before and after the event (Table 45). The results of Table 46 show that this effect is significant and positive (Beta = 0.459; p = 0.000).
The following four tables show the effect of brand attachment on behavioural outcomes such as WOM and WPPP. The effect of brand attachment on WPPP is not significant on a level of p < 0.05. However, the results related to WOM indicate that brand attachment can explain 59% of the difference of WOM before and after the event and the relationship is significant and positive (Beta = 0.765; p = 0.000).
TABLE 47 EXPLAINED VARIANCE ON WPPP (DIFFERENCE PRE VS POST) IN THE MS COMMUNITY
Model R R Square Adjusted R Square Std. Error of the Estimate
1 .169a .028 .020 6.16555
a. Predictors: (Constant), Attachment_diff

64
TABLE 48 STRENGTH AND DIRECTION OF THE INFLUENCE OF BRAND ATTACHMENT (_DIFFERENCE) ON WPPP (_DIFFERENCE) IN THE MS COMMUNITY
Model Unstandardized Coefficients Standardized
Coefficients
t Sig.
(p value)
B Std. Error Beta
1 (Constant) -.918 1.082 -.849 .398
Attachment_diff .461 .255 .169 1.810 .073
a. Dependent Variable: Wtpp_diff
TABLE 49 EXPLAINED VARIANCE OF WOM (_DIFFERENCE) IN THE MS COMMUNITY
Model R R Square Adjusted R Square Std. Error of the Estimate
1 .765a .585 .582 1.59490
a. Predictors: (Constant), Attachment_diff
TABLE 50 STRENGTH AND DIRECTION OF THE INFLUENCE OF BRAND ATTACHMENT (_DIFFERENCE) ON WOM (_DIFFERENCE) IN THE MS COMMUNITY
Model Unstandardized Coefficients Standardized
Coefficients
t Sig.
(p value)
B Std. Error Beta
1 (Constant) 1.157 .280 4.136 .000
Attachment_diff .828 .066 .765 12.573 .000
a. Dependent Variable: Wom_diff

65
MODEL ANALYSIS: MODERATION
In order to analyse the potential influences of external effects based on individual consumer differences (need for cognition, need for social/emotional satisfaction, need for stimulation, subjective wine knowledge and wine involvement) as well as influences based on the method of the community streaming event, the effects of the community website (site attractiveness and ease of use), on the relationships in the basic model, moderation analyses were conducted (see Figure 20. for influences on the model).
FIGURE 20. OVERVIEW OF THE MODERATOR EFFECTS ON THE RELATIONSHIPS OF THE MODEL IN THE MS COMMUNITY
A moderator significantly influences the relationship between two variables (Baron and Kenny, 1986). The effect of a moderating variable can be assessed by the increase of the explained variance of the dependent variable in the previous relationship. In Figure 20 can been seen the changed variance of the dependent variables based on the effects of the moderators (old value without moderator is printed in grey, and the new value is in black underneath). Two important variables, differentiating groups based on demographic characteristics are age and gender. Therefore, the influence of age was investigated respective to possible influences on the relationships of the community needs on community engagement/uniqueness to see individual differences related to the importance of the community related needs. The explained variance of engagement/uniqueness increased slightly from 75.5% to 78.9%. The results show no significant direct effect (p > 0.05) age has on community engagement/uniqueness. However, age affects the influence of cognitive and social satisfaction on community engagement/uniqueness. The interaction effect of age and cognitive satisfaction is positive (Beta = 0.018; p = 0.006), which means that cognitive satisfaction is more important for people as age increases. In contrast social satisfaction is less important (Beta = -0.014; p = 0.031).
The second moderator found to be significant was gender. The results in Table 52 show that gender influences community engagement/uniqueness directly (p = 0.013) in addition to the relationship between emotional satisfaction and community engagement/uniqueness (p = 0.035). The explained variance increases slightly from 75.5% to 77.1%. Based on the coding of the variable (male = 1; female = 2), the community engagement/uniqueness was higher for females than for males (B = 2.901). However, the importance of emotional satisfaction decreases for females (B = -0.181) in comparison to males. None of the other potentially moderating variables tested proved to have a significant influence on any of the main effects.

66
TABLE 51 THE MODERATION EFFECT OF AGE ON THE RELATIONSHIP BETWEEN COMMUNITY NEEDS AND COMMUNITY ENGAGEMENT/UNIQUENESS IN THE MSCOMMUNITY
Parameter B Std. Error t Sig.
(p value)
95% Confidence Interval
Lower Bound Upper Bound
Intercept -.212 2.197 -.097 .923 -4.574 4.149
Emotional Satisfaction .139 .188 .743 .459 -.233 .512
Cognitive Satisfaction -.782 .372 -2.099 .038 -1.521 -.043
Social Satisfaction 1.671 .372 4.488 .000 .932 2.409
Age -.024 .039 -.624 .534 -.102 .053
Social Satisfaction * Age -.014 .007 -2.194 .031 -.027 -.001
Cognitive Satisfaction * Age .018 .007 2.804 .006 .005 .032
Emotional Satisfaction * Age .000 .003 -.058 .954 -.006 .006
a. R Squared = .803 (Adjusted R Squared = .779)
TABLE 52 THE MODERATION EFFECT OF GENDER ON THE RELATIONSHIP BETWEEN COMMUNITY NEEDS AND COMMUNITY ENGAGEMENT/UNIQUENESS IN THE MS COMMUNITY
Parameter B Std. Error t Sig.
(p value)
95% Confidence Interval
Lower Bound Upper Bound
Intercept -6.138 2.059 -2.981 .004 -10.223 -2.053
Emotional Satisfaction .410 .147 2.792 .006 .119 .702
Cognitive Satisfaction .401 .395 1.014 .313 -.383 1.184
Social Satisfaction 1.203 .353 3.408 .001 .503 1.904
Gender 2.901 1.142 2.540 .013 .635 5.167
Emotional Satisfaction*
Gender -.181 .085 -2.133 .035 -.350 -.013
Cognitive Satisfaction*
Gender -.045 .221 -.204 .838 -.484 .393
Social Satisfaction* Gender -.255 .205 -1.246 .215 -.661 .151
a. R Squared = .786 (Adjusted R Squared = .771)

67
DISCUSSION
The aim of this study was to test the hypothesised relationships in the models described in Section 1, including brand ambassador, community event related needs (cognitive and emotional) and engagement/uniqueness with influence on brand attachment, WOM and WPPP. This study was undertaken with one single brand and consistent brand ambassadors and event theme.
The results show that the brand ambassador has a substantial and significant influence on the satisfaction of cognitive, social and emotional needs for those taking part in a community event. These brand ambassadors were found to exert a strongly positive influence to the satisfaction of social and cognitive needs; however, they were negatively related to emotional satisfaction. Whilst unexpected given the generally positive reactions to Burt and Jeni Surmon, the qualitative analysis and their overall mean score for this variable (7.82 out of a possible score of 9), this may be due to the fact that the ‘MS’ brand ambassadors were not the focus of the event itself. The levels of emotional satisfaction were not substantially low suggesting that this need was satisfied by other elements of the event not measured – and perhaps the ambassadors even proved a distraction to the main theme of the event for some participants. The low explained variance of 8.4% by the brand ambassador on emotional needs, in comparison to the satisfaction of other needs, provides support for this possibility. Moreover, brand ambassadors strongly provided support for social satisfaction, which was the most important driver of community engagement/uniqueness. The community event itself provided satisfaction of cognitive, social and emotional needs leading to community engagement/uniqueness and explains a robust 75.5% of its variance.
The investigation of the transitional effect from brand ambassador to the community event (represented by community engagement/uniqueness) shows that all community related needs mediate this relationship. Nonetheless, the most important mediator explaining this transition is social and cognitive need satisfaction. Implications are that it is not likely to be as important that a brand ambassador is seen to be unbelievably ‘charming’ and ‘likable’. The highest value of a brand ambassador is related to the support of social interactions between the users, assisting them to realise a feeling of identification with other community members and to provide credible information about the brand.
The transition of effects from community event to brand-customer relationship was investigated by the influence of community engagement/uniqueness on differences in levels of brand attachment (pre vs. post event). The results of this study indicate that the community event increases brand attachment by explaining 20.4% of its variance. Strong downstream effects are related to difference in WOM by explaining 58.2% of its variance with a Beta of 0.765. The influence of brand attachment on difference to WPPP, however, is not significant. The lack of significance in this relationship may be due to the absence of brand awareness before the event. Hence, people had no idea about the price level of the Mount Surmon wine or an expectation of quality. Therefore, the price is close to the participant’s price perception of a descent bottle of wine (taken as a benchmark measure). Still, it is remarkable that just one single event can influence brand attachment so strongly in terms of the downstream influence on difference in WOM. Showing that even for unknown brands these events can be an extremely powerful tool, binding consumers to a brand.
Additionally, the analysis included the examination of the moderating influences of individual characteristics as well as procedure related influences, which could influence the main effects in the model. The results show that age influences the effect of cognitive and social satisfaction on community engagement/uniqueness. Specifically, cognitive satisfaction increases and social satisfaction decreases with increasing age. The moderation analysis related to gender reveals that community engagement/uniqueness is generally higher for women than for men and, surprisingly, emotional satisfaction is more important for men than for women. Therefore, the consideration of moderation effects related to consumer characteristics is particularly important respective to understanding the characteristics of desired target groups related to a respective brand. In this case, the community engagement/uniqueness is higher for women who seem to have different expectations related to the fulfilment of their needs where it is more important for men than women. In consideration of the brand ambassador, here they are more important

68
for women than for men, because the brand ambassador is strongly influential in satisfying cognitive and social needs. In consideration of age, older people seem to be more susceptible to community events supporting cognitive needs and less concerned with satisfying social needs – perhaps they gain that type of satisfaction elsewhere. But, it must be remembered that this is an ‘infant’ community where participants are meeting and engaging with each other for the first time. It was expected that if a true brand community were to develop, that all members may seek and find both emotional, and especially, social satisfaction through membership. The opportunity revealed here is to target events and themes to specific gender and/or age groups. Additionally, the analysis of website attractiveness as an assumed moderator shows that it has a direct influence on cognitive satisfaction increasing the explained variance from 29.5% to 54%. This result implicates that community perception is not only dependent on the brand ambassador, but also by factors related to the website. However, the attractiveness/usability of the website supports community needs differently. In this study, this aspect is particularly important to the fulfilment of cognitive/informational needs. Therefore brand owners must consider all aspects experienced by consumers, the brand ambassador, the website and the context of the event itself.
In order to generalise the findings of the MS, the study in the HQ investigates different brands, themes and brand ambassadors as stimuli.

69
QUANTITATIVE ANALYSIS OF THE BAROSSA HQ COMMUNITY
DESCRIPTIVE ANALYSIS
In order to gauge the success of influence of the community event on the dependent variables (attachment, WPPP, WOM) we employed a paired sample T-test. The results in Tables 53 and 54 show significant differences of all dependent variables. The significance value ‘p’ lower than 0.05 means the result is transferable from a representative sample to the whole population with a failure probability of less than 5%. The evaluation of brand attachment increased from 6.58 to 7.13 (p = 0.004), which is an increase of 8.2%. The WPPP for a presented wine in HQ increased from $28.68 to $31.54 (p = 0.37), which is an increase of 10% related to the price prior to the event. Also the willingness to support a brand by WOM increases significantly from 7.18 to 7.68 (p = 0.008), which is an increase of 7%.
TABLE 53 PAIRED SAMPLES STATISTICS IN THE HQ COMMUNITY
Mean N Std. Deviation Std. Error Mean
Attachment before Event 6.58 111 1.49 .14
Attachment after Event 7.13 111 1.54 .14
WTPPP before Event 28.68 111 11.33 1.07
WTPPP after Event 31.54 111 11.93 1.13
Costs of a descent bottle of wine 27.61 111 8.44 1.13
WOM before Event 7.18 111 1.71 .16
WOM after Event 7.68 111 1.59 .15
TABLE 54 PAIRED SAMPLES T-TEST IN THE HQ COMMUNITY
Paired Differences t df Sig. (2-tailed)
Mean Std.
Deviation
Std. Error
Mean
95% Confidence
Interval of the
Difference
Lower Upper
Attachment Difference -.54 1.94 .18 -.91 -.18 -2.971 110 .004
WTPPP Difference -2.86 14.26 1.35 -5.55 -.18 -2.115 110 .037
WOM Difference -.50 1.93 .18 -.86 -.13 -2.698 110 .008

70
These results show, that only one event could significantly influence all brand related variables by raising the evaluations of attachment, WPPP and WOM.
The comparison of the WPPP (pre/post) with the perception of ‘how much a descent bottle of wine costs?’ in MS shows, that it is likely to be based on a previous awareness, the WPPP (pre) is not significantly different than the statistic for a ‘descent bottle of wine’ (p>0.05). However, WPPP is significantly higher after the event when compared to the statistic for a ‘descent bottle of wine’. Showing that brand awareness is an important starting point to develop and leverage a brand image (related to the fulfilment of different needs). Hence, based on the starting point of existing associations the community event strengthened the associations and improved the value proposition (performance – price) related to competitive brands.
TABLE 55 PAIRED SAMPLES T-TEST FOR WPPP AND DESCENT COSTS OF A WINE IN THE MS COMMUNITY
Paired Differences t df Sig. (2-tailed)
Mean Std.
Deviation
Std. Error
Mean
95% Confidence
Interval of the
Difference
Lower Upper
Difference WPPP(pre)/Descent costs 1.07 10.89 1.03 -.97 3.12 1.03 110 .30
Difference WPPP(post)/Descent costs 3.94 10.88 1.03 1.88 5.98 3.81 110 .00
MODEL ANALYSIS
In order to analyse the proposed model, we conducted a series of regression analysis as used for the MS to compare the results. Figure 21. includes an overview of all results - including standardised Beta (Beta) values as an indicator of the strength of a predictor variable on a dependent variable as well as the adjusted explained variance (R2) as a measure of how much variance of a dependent variable can be explained by the proposed predictor variables. The model shows all transitions between the brand ambassador, the variables of the community event as well as brand attachment with downstream effects on WOM and WPPP. All contemplated effects are significant.
FIGURE 21. OVERVIEW OF THE PATH EFFECTS OF THE MODEL IN THE ‘HQ’COMMUNITY

71
In order to analyse the effect of the brand ambassador on the needs fulfilment of respondents, a regression analysis was conducted. The results are consistent with those from MS study and show that the influence of the brand ambassador on cognitive need satisfaction is positive significant with a Beta value of 0.351 (p = 0.001) and can explain 11.5% of the variance of cognitive satisfaction (see Tables 56 and 57).
TABLE 56 EXPLAINED VARIANCE OF COGNITIVE SATISFACTION IN THE HQ COMMUNITY
Model R R Square Adjusted R Square Std. Error of the Estimate
1 .351a .123 .115 1.10967
a. Predictors: (Constant), Brand ambassador
TABLE 57 STRENGTH AND DIRECTION OF THE INFLUENCE OF THE BRAND AMBASSADOR ON COGNITIVE SATISFACTION IN THE HQ COMMUNITY
Model Unstandardized Coefficients Standardized
Coefficients
t Sig.
B Std. Error Beta
1 (Constant) 4.519 .777 5.818 .000
Brand ambassador .366 .096 .351 3.807 .000
a. Dependent Variable: Cognitive Satisfaction
The influence of the brand ambassador on social needs satisfaction is also positive and significant (Beta = 0.328; p = 0.001), explaining 10% of the variance of social satisfaction. Tables 58 and 59 show the results of this regression analysis.
TABLE 58 EXPLAINED VARIANCE OF SOCIAL SATISFACTION IN THE HQ COMMUNITY
Model R R Square Adjusted R Square Std. Error of the Estimate
1 .328a .107 .099 1.26922
a. Predictors: (Constant), Brand ambassador
TABLE 59 STRENGTH AND DIRECTION OF THE INFLUENCE OF THE BRAND AMBASSADOR ON SOCIAL SATISFACTION IN THE HQ COMMUNITY
Model Unstandardized Coefficients Standardized
Coefficients
t Sig.
B Std. Error Beta
1 (Constant) 4.151 .888 4.672 .000
Brand ambassador .386 .110 .328 3.518 .001
a. Dependent Variable: Social Satisfaction
The analysis of the emotional satisfaction shows that the brand ambassador influences emotional needs positively (Beta = 0.466; p = 0.001). The influence of the brand ambassador can explain almost 21% of the

72
emotional satisfaction in the community event. Tables 60 and 61 show the results of this regression analysis.
TABLE 60 EXPLAINED VARIANCE OF EMOTIONAL SATISFACTION IN THE HQ COMMUNITY
Model R R Square Adjusted R Square Std. Error of the Estimate
1 .466a .217 .209 1.06336
a. Predictors: (Constant), Brand ambassador
TABLE 61 STRENGTH AND DIRECTION OF THE INFLUENCE OF THE BRAND AMBASSADOR ON EMOTIONAL SATISFACTION IN THE HQ COMMUNITY
Model Unstandardized Coefficients Standardized
Coefficients
t Sig.
B Std. Error Beta
1 (Constant) 3.882 .744 5.215 .000
Brand ambassador .492 .092 .466 5.344 .000
a. Dependent Variable: Emotional Satisfaction
TABLE 62 EXPLAINED VARIANCE OF COMMUNITY ENGAGEMENT/UNIQUENESS IN THE HQ COMMUNITY
Model R R Square Adjusted R Square Std. Error of the Estimate
1 .846a .716 .708 .85396
a. Predictors: (Constant), Emotional Satisfaction, Cognitive Satisfaction, Social Satisfaction
TABLE 63 STRENGTH AND DIRECTION OF THE INFLUENCE OF EMOTIONAL, SOCIAL AND COGNITIVE SATISFACTION ON COMMUNITY ENGAGEMENT/UNIQUENESS IN THE HQ COMMUNITY
Model Unstandardized Coefficients Standardized
Coefficients
t Sig.
B Std. Error Beta
1
(Constant) -1.474 .553 -2.665 .009
Social Satisfaction .560 .096 .491 5.840 .000
Cognitive Satisfaction .397 .109 .304 3.657 .000
Emotional Satisfaction .168 .082 .139 2.058 .042
a. Dependent Variable: Community Engagement/Uniqueness
In order to analyse the influence of the different needs (emotional, social, cognitive) on community engagement/uniqueness, a multiple regression analysis was examined. The results show that all needs in total explain 71% of community engagement/uniqueness, which is a very high value. All three needs are significant predictors (p < 0.05), where social satisfaction has the highest positive influence on community

73
engagement/uniqueness (Beta = 0.491). The second highest influence is provided by cognitive satisfaction (Beta = 0.304) and finally emotional satisfaction (Beta = 0.139). The previous tables show the results.
In order to investigate the process underlying the influence of the brand ambassador on community engagement/uniqueness a mediational analysis was conducted. The considered mediating variables were cognitive satisfaction, social satisfaction and emotional satisfaction. To test the expected mediating roles, we followed Preacher and Hayes (2008, 2004) using a bootstrapping procedure. Table 64 illustrates the results.
TABLE 64 MEDIATIONAL ANALYSIS OF COMMUNITY RELATED NEEDS BETWEEN BRAND AMBASSADOR AND COMMUNITY ENGAGEMENT/UNIQUENESS IN THE HQ COMMUNITY
************************************************************************** Written by Andrew F. Hayes, Ph.D. http://www.afhayes.com ************************************************************************** Model = 4 Y = Community Engagement/Uniqueness X = Brand ambassador M1 = Cognitive Satisfaction M2 = Social Satisfaction M3 = Emotional Satisfaction Sample size 105 ************************************************************************** Outcome: Cognitive Satisfaction Model Summary R R-sq F df1 df2 p .3513 .1234 14.4967 1.0000 103.0000 .0002 Model coeff se t p constant 4.5192 .7767 5.8182 .0000 Ambassador .3656 .0960 3.8074 .0002 ************************************************************************** Outcome: Social Satisfaction Model Summary R R-sq F df1 df2 p .3275 .1073 12.3757 1.0000 103.0000 .0006 Model coeff se t p constant 4.1509 .8884 4.6723 .0000 Ambassador .3863 .1098 3.5179 .0006 **************************************************************************

74
Outcome: Emotional Satisfaction Model Summary R R-sq F df1 df2 p .4659 .2171 28.5616 1.0000 103.0000 .0000 Model coeff se t p constant 3.8817 .7443 5.2151 .0000 Ambassador .4917 .0920 5.3443 .0000 ************************************************************************** Outcome: Community Engagement/Uniqueness Model Summary R R-sq F df1 df2 p .8391 .7040 59.4627 4.0000 100.0000 .0000 Model coeff se t p constant -1.6711.7224 -2.3134 .0227 Cog Sat .3899 .1166 3.3441 .0012 Social Sat .5709 .1019 5.6042 .0000 Emot Sat .2306 .0961 2.4002 .0182 Ambassador -.0409 .0859 -.4761 .6351 ******************** DIRECT AND INDIRECT EFFECTS ************************* Direct effect of X on Y Effect SE t p -.0409 .0859 -.4761 .6351 Indirect effect of X on Y Effect Boot SE BootLLCI BootULCI TOTAL .4764 .2362 .1533 1.0519 Cog Sat .1425 .1021 .0182 .4192 Social Sat .2205 .1287 .0484 .5347 Emot Sat .1134 .0751 .0183 .3417 ******************** ANALYSIS NOTES AND WARNINGS ************************* Number of bootstrap samples for bias corrected bootstrap confidence intervals: 1000 Level of confidence for all confidence intervals in output: 95.00 NOTE: Some cases were deleted due to missing data. The number of such cases was: 6
According to Zhao et al. (2010), mediation exists when the confidence interval (BootLLCI/ BootULCI) of the bootstrap test does not contain the number zero. Given the results of the multiple mediation where the confidence intervals for neither cognitive satisfaction (CI = 0.0182; 0.4192), nor social satisfaction (CI = 0.0484; 0.5347) or emotional satisfaction (CI = 0.0183; 0.3417) include zero, the mediational roles of all community related needs were supported. This result shows all needs combined can explain the relationship between the brand ambassador and community engagement/uniqueness. To additionally identify the type of mediation Zhao et al. (2010) recommend employing Baron and Kenny’s (1986) stepwise regression analyses. The results shown in Table 64 relate to the repealed effect of the brand ambassador

75
on community engagement/uniqueness. This influence of the brand ambassador on community engagement/uniqueness can be fully explained by all three needs. The most important variable explaining the relationship can be seen on the indirect effect. The highest influence is social satisfaction, followed by cognitive and emotional satisfaction.
The transitional effect of the community event on the brand is expressed by the influence of community engagement/uniqueness on brand attachment. Community engagement/uniqueness can explain 14.5% of the difference of brand attachment before and after the event (Table 65). The results of Table 66 show that this effect is significant and positive (Beta = 0.39; p = 0.001).
TABLE 65 EXPLAINED VARIANCE OF BRAND ATTACHMENT (_DIFFERENCE) IN THE HQ COMMUNITY
Model R R Square Adjusted R Square Std. Error of the Estimate
1 .390a .152 .145 1.79441
a. Predictors: (Constant), Community Engagement/Uniqueness
TABLE 66 STRENGTH AND DIRECTION OF THE INFLUENCE OF COMMUNITY ENGAGEMENT/UNIQUENESS ON BRAND ATTACHMENT (_DIFFERENCE) IN THE HQ COMMUNITY
Model Unstandardized Coefficients Standardized
Coefficients
t Sig.
B Std. Error Beta
1
(Constant) -2.699 .753 -3.585 .001
Community Engagement/
Uniqueness .479 .108 .390 4.426 .000
a. Dependent Variable: Attachment_diff
The following four tables (Tables 67 through 70) show the effect of brand attachment on behavioural outcomes such as WOM and WPPP. The results show, that the increased brand attachment can explain 6% of the variance of the difference of WPPP and 66% of the difference of WOM. Both effects are significant and positive (Beta = 0.256/0.813; p < 0.05). The direct comparison of both dependent behavioural variables shows that WOM is strongly driven by brand attachment.

76
TABLE 67 EXPLAINED VARIANCE OF WPPP (_DIFFERENCE) IN THE HQ COMMUNITY
Model R R Square Adjusted R Square Std. Error of the Estimate
1 .256a .066 .057 13.85622
a. Predictors: (Constant), Attachment_diff
TABLE 68 STRENGTH AND DIRECTION OF THE INFLUENCE OF BRAND ATTACHMENT (_DIFFERENCE) ON WPPP (_DIFFERENCE) IN THE HQ COMMUNITY
Model Unstandardized Coefficients Standardized
Coefficients
t Sig.
B Std. Error Beta
1 (Constant) 1.833 1.367 1.341 .183
Attachment_diff 1.885 .681 .256 2.768 .007
a. Dependent Variable: Wtpp_diff
TABLE 69 EXPLAINED VARIANCE OF WOM (_DIFFERENCE) IN THE HQ COMMUNITY
Model R R Square Adjusted R Square Std. Error of the Estimate
1 .813a .661 .658 1.13203
a. Predictors: (Constant), Attachment_diff
TABLE 70 STRENGTH AND DIRECTION OF THE INFLUENCE OF BRAND ATTACHMENT (_DIFFERENCE) ON WOM (_DIFFERENCE) IN THE HQ COMMUNITY
Model Unstandardized Coefficients Standardized
Coefficients
t Sig.
B Std. Error Beta
1 (Constant) .052 .112 .465 .643
Attachment_diff .811 .056 .813 14.571 .000
a. Dependent Variable: Wom_diff

77
MODEL ANALYSIS: MODERATION
In order to analyse the important influences of external effects based on individual differences (such as age and gender as well as a subjective knowledge) as well as the website environment (site attractiveness) moderator analyses were conducted (see 22. for influences on the model).
FIGURE 22. OVERVIEW OF THE MODERATOR EFFECTS ON THE RELATIONSHIPS IN THE MODEL (‘HQ’COMMUNITY)
In Figure 22. you can see the changed variance of the dependent variables based on the effects of the moderators (the old value without the moderator is printed in grey, and the new value is in black underneath). As found with the previous community, two important variables differentiating groups are age and gender. Therefore, we investigated the influence of age on the relationships of the community needs and community engagement/uniqueness to see individual differences related to the importance of the community related needs. The explained variance of community engagement/uniqueness increased slightly from 70.8% to 73.9%.
Furthermore, the results show a positive direct effect (Beta = 0.139; p = 0.003) of age on community engagement/uniqueness, which means that people with increasing age show an increase in community engagement/uniqueness. Additionally, the negative influence of the interaction effect of cognitive satisfaction and age (Beta = -0.020; p = 0.014) shows that with increasing age, cognitive satisfaction becomes less important.
Furthermore, the results respective to the influence of gender demonstrate that gender significantly (p = 0.031) influences the relationship between brand attachment and WPPP. The explained variance increases from 5.7% to 8.3%. This is a very strong effect, which we investigated with further analysis. To investigate the effect of gender on the relationship of brand attachment on WPPP more thoroughly, we split the model by gender to investigate the relationship for women/men differently. The results show that the effect of brand attachment on WPPP is significant for men (p = 0.003), explaining 14.7% of the explained variance of WPPP. The relationship between brand attachment on WPPP for women, however, is not significant (p = 0.752).

78
TABLE 71 THE MODERATION EFFECT OF AGE ON THE RELATIONSHIP BETWEEN COMMUNITY NEEDS AND COMMUNITY ENGAGEMENT/UNIQUENESS IN THE HQ COMMUNITY
Parameter B Std. Error T Sig. 95% Confidence Interval
Lower Bound Upper Bound
Intercept -9.286 2.666 -3.483 .001 -14.573 -3.998
Emotional Satisfaction -.061 .336 -.182 .856 -.728 .605
Cognitive Satisfaction 1.527 .447 3.416 .001 .641 2.414
Social Satisfaction .624 .321 1.943 .055 -.013 1.260
Age .139 .046 3.001 .003 .047 .231
Social Satisfaction * Age -.001 .006 -.207 .837 -.013 .011
Cognitive Satisfaction * Age -.020 .008 -2.499 .014 -.037 -.004
Emotional Satisfaction * Age .005 .006 .768 .444 -.007 .017
a. R Squared = .755 (Adjusted R Squared = .739)
TABLE 72 THE MODERATION EFFECT OF GENDER ON THE RELATIONSHIP BETWEEN BRAND ATTACHMENT (_DIFFERENCE) AND WPPP (_DIFFERENCE) IN THE HQ COMMUNITY
Source Type III Sum of Squares Df Mean Square F Sig.
Corrected Model 2409.732a 3 803.244 4.300 .007
Intercept 541.862 1 541.862 2.901 .091
Gender 218.825 1 218.825 1.171 .282
Attachment Difference 1257.315 1 1257.315 6.730 .011
Gender * Attachment Difference 888.630 1 888.630 4.757 .031
Error 19989.241 107 186.815
Total 23310.000 111
Corrected Total 22398.973 110
a. R Squared = .108 (Adjusted R Squared = .083)

79
TABLE 73 EXPLAINED VARIANCE OF WPPP (_DIFFERENCE) BASED ON BRAND ATTACHMENT (_DIFFERENCE) DIVIDED BY GENDER IN THE HQ COMMUNITY
Gender Model R R Square Adjusted R Square Std. Error of the Estimate
Male 1 .405a .164 .147 15.03845
Female 1 .042a .002 -.016 12.34127
a. Predictors: (Constant), Attachment Difference
TABLE 74 STRENGTH AND DIRECTION OF THE EFFECT OF THE RELATIONSHIP BETWEEN BRAND ATTACHMENT (_DIFFERENCE) AND WPPP (_DIFFERENCE) DIVIDED BY GENDER IN THE HQ COMMUNITY
Gender Model Unstandardized Coefficients Standardized
Coefficients
t Sig.
B Std. Error Beta
Male 1
(Constant) .850 2.096 .405 .687
Attachment
Difference 3.255 1.040 .405 3.131 .003
Female 1
(Constant) 3.812 1.774 2.148 .036
Attachment
Difference .282 .887 .042 .317 .752
a. Dependent Variable: WTPP Difference
A third moderating variable was found, subjective knowledge (or self-assessed wine knowledge). The results (Table 75) show that subjective knowledge significantly (p = 0.013) influences the relationship between brand attachment and WPPP and drives WPPP negatively (B = -1.658; p = 0.032). The explained variance increases from 5.7% to 10.6%. In other words, the more consumers think they know about wine, the less likely they were to WPPP. This is a very strong effect, which we investigated with further analysis.
TABLE 75 THE MODERATION EFFECT OF SUBJECTIVE KNOWLEDGE ON THE RELATIONSHIP BETWEEN BRAND ATTACHMENT (_DIFFERENCE) AND WPPP (_DIFFERENCE) IN THE HQ COMMUNITY
Parameter B Std. Error t Sig. 95% Confidence Interval
Lower Bound Upper Bound
Intercept 12.849 5.164 2.488 .014 2.612 23.085
Attachment Difference -3.767 2.264 -1.664 .099 -8.255 .721
Subjective Knowledge -1.658 .765 -2.167 .032 -3.175 -.141
Attachment Difference *
Subjective Knowledge .943 .371 2.540 .013 .207 1.679
a. R Squared = .130 (Adjusted R Squared = .106)

80
To investigate the effect of subjective knowledge on the relationship of brand attachment on WPPP more thoroughly, we split the model by the median score (from 1 = very low to 9 = very high, median = 6.25) to investigate the relationships for low vs. high subjective knowledge. The results show that the effect of brand attachment on WPPP is significant for people with high subjective knowledge (p = 0.011), explaining 9.0% of the explained variance of WPPP. The relationship between brand attachment on WPPP people with low subjective knowledge, however, is not significant (p = 0.332). This is as expected because price is used as a proxy for quality indications consistently by consumers across extensive (almost all!) product categories. But, if an individual thinks they ‘know’ what makes a wine high quality then they may be less likely to rely on it as a proxy – using their own opinion instead to determine the level of value.
TABLE 76 EXPLAINED VARIANCE OF WPPP (_DIFFERENCE) BASED ON BRAND ATTACHMENT (_DIFFERENCE) DIVIDED BY SUBJECTIVE KNOWLEDGE IN THE ‘HQ’COMMUNITY
Subjective
Knowledge
Model R R Square Adjusted R Square Std. Error of the Estimate
low 1 .139a .019 -.001 14.14724
high 1 .325a .106 .090 13.54264
a. Predictors: (Constant), Attachment Difference
TABLE 77 STRENGTH AND DIRECTION OF THE EFFECT OF THE RELATIONSHIP BETWEEN BRAND ATTACHMENT (_DIFFERENCE) AND WPPP (_DIFFERENCE) DIVIDED BY SUBJECTIVE KNOWLEDGE IN THE HQ COMMUNITY
Subjective
Knowledge
Model Unstandardized Coefficients Standardized
Coefficients
T Sig.
B Std. Error Beta
low 1
(Constant) 4.141 2.245 1.845 .071
Attachment
Difference .929 .948 .139 .980 .332
high 1
(Constant) .718 1.750 .410 .683
Attachment
Difference 2.797 1.068 .325 2.619 .011
a. Dependent Variable: WTPP Difference
Site attractiveness as an influencer of the relationship between brand ambassador and community related needs was also found to be significant. The moderating influence of site attractiveness on the relationship between brand ambassador and cognitive satisfaction (Table 78) shows an increased explained variance of cognitive satisfaction from formerly 11.5% based on the brand ambassador to 48.8% in conjunction with site attractiveness. The results in Table 78 indicate that this effect is significantly positive (B = 1.698; p=0.000). That means that people evaluating the community site as more attractive perceive a higher cognitive satisfaction in the community event. However, the interaction effect of brand ambassador and site attractiveness is negative (B = -.145; p=0.013) implicating a negative influence of site attractiveness on the relationship between brand ambassador and cognitive satisfaction. Further analysis revealed the divided effect of a split of site for those that found the site more vs. less attractive (based on median).

81
TABLE 78 THE MODERATION EFFECT OF SITE ATTRACTIVENESS ON THE RELATIONSHIP BETWEEN BRAND AMBASSADOR AND COGNITIVE SATISFACTION IN THE HQ COMMUNITY
Parameter B Std. Error t Sig. 95% Confidence Interval
Lower Bound Upper Bound
Intercept -6.895 3.488 -1.977 .051 -13.814 .024
Brand ambassador 1.313 .443 2.961 .004 .433 2.192
Site Attractiveness 1.698 .458 3.708 .000 .789 2.606
Brand ambassador * Site
Attractiveness -.145 .058 -2.518 .013 -.259 -.031
a. R Squared = .503 (Adjusted R Squared = .488)
TABLE 79 EXPLAINED VARIANCE OF COGNITIVE SATISFACTION BASED ON BRAND AMBASSADOR DIVIDED BY SITE ATTRACTIVENESS GROUPS IN THE HQ COMMUNITY
Attractivenes
s Groups
Model R R Square Adjusted R Square Std. Error of the Estimate
low 1 .410a .168 .137 1.22153
high 1 .275a .076 .063 .79436
a. Predictors: (Constant), Brand ambassador
The moderating influence of site attractiveness on the relationship between brand ambassador and emotional satisfaction (Table 79) shows an increased explained variance of emotional satisfaction from formerly 20.9% based on the brand ambassador to 43.0% in conjunction with site attractiveness. The results in Table 79 indicate that this effect is significantly positive (B = 2.389; p=0.000). That means that people evaluating the community site as more attractive perceive a higher emotional satisfaction in the community event. However, the interaction effect of the brand ambassador and site attractiveness is negative (B = -.259; p=0.000) implicating a negative influence of site attractiveness on the relationship between brand ambassador and emotional satisfaction. Further analysis illustrates the divided effect by a split of site attractiveness between low and high (based on median).
The results indicate that the effect of the brand ambassador on cognitive satisfaction is strongly diminished by higher site attractiveness. Hence, the explained variance (R2
adj./low attractive = 13.7%; R2adj./high attractive = 6.3%)
as well as the strength of the influence of brand ambassador on cognitive satisfaction is diminished (Beta low attractive = 0.410; Beta high attractive = 0.275).

82
TABLE 80 STRENGTH AND DIRECTION OF THE EFFECT OF THE RELATIONSHIP BETWEEN BRAND AMBASSADOR AND COGNITIVE SATISFACTION DIVIDED BY SITE ATTRACTIVENESS GROUPS IN THE HQ COMMUNITY
Attractiven
ess Groups
Model Unstandardized Coefficients Standardized
Coefficients
t Sig.
B Std. Error Beta
Low 1
(Constant) 2.182 1.811 1.205 .239
Brand
ambassador .547 .234 .410 2.336 .027
High 1
(Constant) 6.277 .647 9.707 .000
Brand
ambassador .194 .079 .275 2.465 .016
a. Dependent Variable: Cognitive Satisfaction
TABLE 81 THE MODERATION EFFECT OF SITE ATTRACTIVENESS ON THE RELATIONSHIP BETWEEN BRAND AMBASSADOR AND EMOTIONAL SATISFACTION IN THE HQ COMMUNITY
Parameter B Std. Error t Sig. 95% Confidence Interval
Lower Bound Upper Bound
Intercept -13.278 3.730 -3.560 .001 -20.677 -5.879
Brand ambassador 2.364 .474 4.985 .000 1.423 3.304
Site Attractiveness 2.389 .490 4.879 .000 1.418 3.360
Brand ambassador * Site
Attractiveness -.259 .062 -4.212 .000 -.381 -.137
The results in Tables 80 and 81 show that the effect of the brand ambassador on emotional satisfaction is strongly diminished by perceived higher site attractiveness. Hence, the explained variance (Table 82) (R2adj./low attractive = 41.0%; R2
adj./high attractive = 11.8%) as well as the strength of the influence of brand ambassador on emotional satisfaction is diminished (Beta low attractive = 0.657; Beta high attractive = 0.360).
TABLE 82 EXPLAINED VARIANCE OF EMOTIONAL SATISFACTION BASED ON BRAND AMBASSADOR DIVIDED BY SITE ATTRACTIVENESS GROUPS IN THE HQ COMMUNITY
Attractivenes
s Groups
Model R R Square Adjusted R Square Std. Error of the Estimate
low 1 .657a .431 .410 1.03232
high 1 .360a .129 .118 .98193
a. Predictors: (Constant).Brand ambassador

83
TABLE 83 STRENGTH AND DIRECTION OF THE EFFECT OF THE RELATIONSHIP BETWEEN BRAND AMBASSADOR AND EMOTIONAL SATISFACTION DIVIDED BY SITE ATTRACTIVENESS GROUPS IN THE HQ COMMUNITY
Attractiven
ess Groups
Model Unstandardized Coefficients Standardized
Coefficients
t Sig.
B Std. Error Beta
low 1
(Constant) .315 1.531 .206 .839
Brand
ambassador .894 .198 .657 4.523 .000
high 1
(Constant) 5.440 .799 6.806 .000
Brand
ambassador .322 .097 .360 3.315 .001
a. Dependent Variable: Emotional Satisfaction
The influence of site attractiveness on the relationship between brand ambassador and social satisfaction shows an increase in the explained variance of social satisfaction from formerly 10.0% based on the brand ambassador to 46.8% in conjunction with site attractiveness. These results indicate that this effect is significantly positive (B = 1.384; p=0.010). That means that people evaluating the community site as more attractive perceive a higher social satisfaction in the community event. However, in comparison to the effect of site attractiveness on the other two community needs, site attractiveness has no influence on the relationship between brand ambassador and social satisfaction. The influence of site attractiveness on social satisfaction, however, is stronger than the influence of the brand ambassador itself.
TABLE 84 THE MODERATION EFFECT OF SITE ATTRACTIVENESS ON THE RELATIONSHIP BETWEEN BRAND AMBASSADOR AND SOCIAL SATISFACTION IN THE ‘HQ’COMMUNITY
Parameter B Std. Error t Sig. 95% Confidence Interval
Lower Bound Upper Bound
Intercept -4.662 4.029 -1.157 .250 -12.654 3.330
Brand ambassador .918 .512 1.793 .076 -.097 1.934
Site Attractiveness 1.384 .529 2.616 .010 .334 2.433
Brand ambassador * Site
Attractiveness -.094 .067 -1.407 .162 -.225 .038

84
DISCUSSION
The aim of this study was to investigate the assumed relationships of the model including brand ambassador, community event related needs and engagement/uniqueness with influence on brand attachment, WOM and WPPP. This study was undertaken to support previous results investigated in the MS and to determine the degree to which results can be generalized.
The results show that the brand ambassador supports cognitive, social and emotional needs fulfilled by the community event. In particular, emotional needs were influenced by perceptions of the brand ambassador. The community events satisfied cognitive, social and emotional needs leading to community engagement/uniqueness and can explain 70.8% of its variance. In detail, the satisfactions of social needs were the most important drivers of community engagement/uniqueness. The investigation of the transitional effect from brand ambassador to the community event (represented by community engagement/uniqueness) show that all community related needs mediate this relationship. The most important mediator explaining this transition is social needs satisfaction, followed by cognitive satisfaction. These results imply that although the brand ambassadors in HQ were powerful in satisfying emotional needs, social and cognitive needs were more important to the driving community engagement/uniqueness. The focus of a brand ambassador related to an event should, therefore, be related to the support of community member interactions, identification with the brand community, in addition to providing credible brand and product information. The transition from the community event to brand-customer relationships was investigated by the influence of community engagement/uniqueness on brand attachment. The results show that one single event can lead to a substantial increase in the levels of difference (before and after the events) of brand attachment and can explain 14.5% of its variance. Strong downstream effects are found in WOM by explaining 65.8% of its variance with a Beta of 0.813. The influence of brand attachment on WPPP is also significant (Beta = 0.256; R2
adj. = 5.7%). Based on the results of these analyses, community events can substantially and significantly influence the relationship between a consumer and a brand, as well as their subsequent wine buying related behaviour. This has now been demonstrated using robust samples in two different wine contexts.
The investigation of moderating influences shows that individual consumer characteristics, as well as procedure related influences, will affect the relationships in the model. In detail, the results show that age influences the relationship between cognitive satisfaction and community engagement/uniqueness and indicate that with increasing age, cognitive satisfaction becomes less important for people. Additionally, the positive direct influence of age on community engagement/uniqueness indicates that people with increasing age show a higher community engagement/uniqueness. The outcomes related to the influence of gender on the relationship of brand attachment on WPPP show that brand attachment only influences WPPP for men (raising the explained variance to 8.3%); conversely, the relationship of brand attachment on WPPP is not significant for women. In addition to gender, subjective knowledge is also an important moderator between brand attachment and WPPP. The results imply that brand attachment only drives WPPP for people with higher vs. lower subjective knowledge; moreover, subjective knowledge also negatively drives WPPP. Hence, how much consumers think they know about wine (irrespective of whether or not they actually do possess sound objective knowledge) will lead them to use price less as a proxy for quality. These individuals may need higher levels of engagement and attachment for this affect to be more positive. Again – we have only measured the influence of a single event, if these individuals were to become members of a brand community (and their levels of satisfaction indicate they are open to it), then over time WPPP is likely to be more positive. This would be reflective to affects in established communities documented in the literature. Importantly, subjective knowledge levels did not influence WOM, which in this context is a more important measure of the success of the events.
When establishing a virtual brand community, consumer characteristics such as gender, subjective knowledge and age will be important differentiating factors amongst target groups. For instance the generalised results of the HQ show that cognitive satisfaction is less important to elicit consumer engagement/uniqueness for older people. For them the event hosted by a brand ambassador should provide less product oriented cognitive information and, instead, focus on supporting social and emotional

85
needs. The influence of subjective knowledge shows that people with higher levels of self-assessed wine knowledge feel they can evaluate prices better than people who feel they know less about what a wine should cost. The increase of WPPP for people with a higher subjective knowledge is, therefore, lower although the effect can be better explained by brand attachment. The development of brand attachment is more important for people with higher subjective knowledge.
The results related to the moderating influence of site attractiveness on the influence of the brand ambassador on the community related needs show a consistently negative influence of site attractiveness on this relationship although site attractiveness positively influences the needs directly. This implies that an on-line community event hosted by a brand ambassador is influenced by contextual factors and distracting external variables may significantly diminish the effect of the brand ambassador. This has two important implications related to this kind of community event. First, the environment of the community can substantially support relationship related needs (represented by the direct effect of site attractiveness on the community needs). Therefore, the community website should be created related to their support by higher overall attractiveness and usability. Second, the distraction of a community website can influence the effect of the brand ambassador so the site needs to be attractive and useable without constituting a distraction. Clearly then, the community event consisting of many different elements is perceived holistically by consumers who may naturally allocate different areas of priorities according to their own personal make up. If, for instance, the brand ambassador is an integral part of the event, distracting external effects should be reduced.
COMPARISON OF QUANTITATIVE RESULTS OF HQ AND THE MS COMMUNITIES
The two main studies both reflected opposite, but common contexts within the wine industry. The MS represented an example of a single, small wine brand with very low levels of brand awareness amongst wine consumers. Indeed, Burt and Jeni Surmon are not even wine makers themselves, but rather have their wines made on their behalf off site. They do own an extensive vineyard in a beautiful Clare Valley location providing extensive facilities such as a cellar door, meals, art gallery and retreat. Their events were always hosted by them and reflected their commitment to the enjoyment of good food and wine as an unbeatable combination. Hence, their brand offers a more wine tourism example in industry. Alternatively, HQ was launched by arguably the most famous wine region in Australia and home to many ‘iconic’ brands. In contrast to the MS, different ambassadors hosted the HQ events each time. Usually wine makers, these individuals provided numerous themes and approaches and, obviously, a different brand each time. In spite of these differences the analysis of both communities reveals generally consistent results overall. A comparison of findings is provided now.
DESCRIPTIVE ANALYSIS
The comparison of the differences in the dependent variables (brand attachment, WPPP, WOM) before and after the events shows that brand attachment and WOM were significantly (p < 0.05) influenced in both studies. Interestingly, both variables show almost the same values after the event. Since in the case of the MS there was little brand awareness before the event, it is surprising that both show almost equal evaluations after the event. This leads to implications that community events can be especially important for new or little known brands. It is, indeed, surprising that a single event can drive the strength of consumer-brand relationship so strongly, illustrating the potential for all wineries to engage with their consumer directly on-line. Also the influence of WOM is substantial in the case of the single, little known brand illustrating the influence of the experience to instigate recommendations to others – the best and lowest cost of promotion. Only WPPP is less significantly different for the MS before and after the event. The reason can be due to that lack of awareness, in that respondents did not have a ‘benchmark’ in their minds with which to compare. This result also shows an acknowledged limitation of the research design and a direction for future research.

86
The results of the descriptive analyses show the substantial influence of the brand ambassador as an active marketing tool providing practical implications related to marketing management and planning. In comparison to other marketing instruments (e.g., advertising, commercials, promotions), community events provide support for important needs in a consumer’s relationship with a brand. In fact, the satisfaction of emotional as well as social needs is hardly possible through advertising and other mainstream forms of marketing. If retailers and other third party operators satisfy these needs, then the attachment is likely to be allocated or ‘split’ between the brand and that operator. In comparison to marketing instruments like commercials, community events are also considerably less expensive to conduct and are able to target consumers world-wide; this means that people can be sought that match the target specific attributes of a brand position (e.g., age, gender, subjective knowledge/involvement). This allows higher control and lowers costs. Furthermore, in comparison to marketing strategies supporting different needs (social, emotional) such as sponsoring (event related, cultural, sport, community), the brand ambassador in their brand related community event is co-creating the consumer experience because the brand is an integral part of the event.
This has the following advantages in comparison to sponsoring:
- the brand ambassador can provide brand and product related information, - the brand is in the focus of the event, - the transition of community fulfilled needs is transferred only to one single brand (in case of
sponsoring there are mostly more sponsors), - the attributes of the participants can be controlled, - there are possibilities to provide special offers for participants after the event to support the
consumer-brand relationship.
Finally, brand ambassador hosted brand community events seem to be extremely effective in driving the strength of brand attachment and consumer-brand relationships as well as wine buying consumer behaviour.
TABLE 85 COMPARISONS OF THE DESCRIPTIVE RESULTS
‘MS’Community ‘HQ’Community
Mean Sig. (2-tailed) Mean Sig. (2-tailed)
Attachment before Event 3.36
.000 6.58
.004 Attachment after Event 6.96 7.13
WTPPP before Event 22.00
.209 28.68
.037 WTPPP after Event 22.74 31.54
WOM before Event 3.47
.000 7.18
.008 WOM after Event 7.61 7.68

87
ANALYSIS OF THE MODEL
The analysis of both studies supports the assumptions of the basic model that a brand ambassador influences a brand related community event by driving community engagement/uniqueness through cognitive, social and emotional need satisfaction. Social satisfaction is especially important in driving community engagement/uniqueness. Figure 22 shows the results of the path of both communities. The relative strength and directions of the effects in the model are mostly consistent. The explained variances of the transitions, however, are mostly higher for MS. In comparison to HQ the brand ambassadors in the MS have a slightly negative influence on emotional satisfaction. As discussed, this lack of positive influence between brand attachment and WPPP can be a consequence of low knowledge of the brand and price perceptions prior to the event. This assumption is supported by the moderation of subjective knowledge in the HQ.
FIGURE 22. COMPARISON OF THE BASIC MODEL FOR BOTH COMMUNITIES
The consistency related to the transition between brand ambassador, community and consumer-brand relationship is established. All major assumed relationships have been supported with the findings providing useful information regarding the likely outcomes of using such community events as part of strategic brand management. Whilst significant relationships were not found for the difference in WPPP in the case of the MS the relationship between brand attachment and this behaviour is well established in the literature and our results are likely due to operationalization limitations inherent in our brand choice. Moreover, the models were run looking at the main effects of attachment to WPPP prior and post the events as a manipulation check, and in those instances significant relationships were found in every case.
An additional contrast is related to the substantial influence of brand ambassadors on the community experience. Although the brand ambassadors in both communities changed, the importance of social and cognitive needs to elicit community engagement/uniqueness was the same. Based on brand ambassador specific characteristics and behaviour it is possible to support the needs to drive community engagement/uniqueness differently. Hence, the brand ambassador within the community event should be able to support social and cognitive needs to drive community engagement/uniqueness. Providing cognitive information is possible through giving product and brand related information about a wine, provide suggestions related to the combination of wine with food, give explanations about the quality perception of a wine and information about wine characteristics related to taste and as results of the production. The support of social needs is more complicated and not dependent on the product knowledge of a brand ambassador. The brand ambassador should support the identification of a consumer with the wine brand and the community event. This is possible by fostering interactions among the community members, supporting a brand’s personality by associating a wine brand with human attributes and personality characteristics in brand descriptions and by helping consumers to understand the history and philosophy beyond the brand. In comparison to events without a brand ambassador, a brand ambassador supports important needs of an event and provides the possibility to give a wine brand a face and a personality to fulfil social needs. In the case of Mount Surmon the brand ambassador was incredibly

88
successful in showing this effect. Additionally, the brand ambassador provides a two-directional interaction with a consumer therefore creating a consumer-brand relationship (Fournier 1998).
ANALYSIS OF MODERATING EFFECTS
The analysis of moderating effects included important influences of external effects based on individual differences (demographics such as age, gender and subjective knowledge) as well as effects on the model relationships based on the method of the community streaming event (site attractiveness) (see Figure 23. for comparison of moderating effects between both communities).
FIGURE 23. COMPARISON OF THE MODERATING EFFECTS OF BOTH MODELS
Regarding individual differences, age shows an influence on cognitive satisfaction across both communities. However, the direction of the influence is not consistent. Whilst age influences the relationship between cognitive satisfaction and community engagement/uniqueness in the HQ negatively, in the MS age has a positive effect on the relationship. Furthermore, age drives community engagement/uniqueness directly in HQ. Gender has direct and indirect effect on community engagement/uniqueness in the MS. The community engagement/uniqueness is higher for women than for men and the emotional satisfaction is more important for men than for women. The results from HQ show that gender affects the relationship between brand attachment and WPPP. The relationship between brand attachment and WPPP is only positive and significant for men, but not for women. This effect can be explained by the influence of subjective knowledge. Whereas participants with high subjective knowledge show a significant effect of brand attachment on WPPP, this relationship was not significant for participants with low subjective knowledge. Additionally, subjective knowledge influenced WPPP negatively. The explanation of this effect is related to price knowledge (represented by subjective knowledge), which is important in evaluating WPPP. People without any knowledge about pricing of a wine can rarely evaluate a wines value related to WPPP.
The implications of these moderating effects can be related to the community event itself can be considered in general as well as brand specific based on the comparison between both communities. The general influence of age on community engagement/uniqueness (based on the results of the HQ) seems to be positive. That means, people with a higher age are generally more attracted by wine community events. Showing that the marketing instrument of brand ambassador hosted events seems to be more effective for people higher in age. Contemplating the focus of needs within a community event, the importance of cognitive satisfaction on community engagement/uniqueness is decreasing with a higher age. Therefore other needs are more important to drive community engagement/uniqueness. This implies that a community event should be aligned to support the different needs based on target group characteristics. People with higher age need less information about product and brand. For them it is more important to support social and emotional needs by interactions within the community, talking about wine or stimulation by the tasting itself. Analysis of the MS events extend these results by showing that gender can be important and age can also have a positive influence on cognitive satisfaction driving community

89
engagement/uniqueness. That means that although social and cognitive needs are most important in general, the influence of target group characteristics can change based on a specific brand. Further research could evaluate brand specific differences related to the importance of community needs on community engagement/uniqueness.
Based on the moderating effects of brand attachment on behavioural consequences (WOM and WPPP) it could be useful to assess participant characteristics within a community event or to invite people with special characteristics. Whereas all participants are important as brand endorsers based on the influence of brand attachment on WOM, subjective knowledge can be used to assess the importance of participants related to WPPP. Whereas the results imply that it is possible to sell a wine for a higher price to people with a lower subjective knowledge after an event than before an event, the frequency of purchases of a person with a higher subjective knowledge is supposed to be higher. Hence, the development of a high brand attachment and therefore drive the willingness to pay a higher price is more fruitful for people with a higher subjective knowledge. Given the fact that the success of a company is based on a long-term consumer-brand relationship, the formation of brand attachment is more important for people with a higher subjective knowledge about wine.
Investigating the influence of site attractiveness shows that the relationships between brand ambassador and community needs diminished by distracting external variables but can also have a strong positive influence on need fulfilment. Hence, in both communities the site attractiveness had a strong positive influence on the fulfilment of community related needs. That shows that the holistically perceived community experience can be supported by different elements (e.g., website, environment, brand ambassador, other community members). However, in HQ the site attractiveness showed a diminishing effect on the brand ambassador as driver of community related needs. This result implicates that the different elements within a community experience interact with each other and that the setup of such an event should be considered based on the priority of the different elements. If the brand ambassador is considered as an important driver of community engagement/uniqueness the focus should be on the brand ambassador and other external variables should be reduced. This is, of course, dependent on the focus of the community event and the needs this event is supposed to support. For instance, if a community event is held for an audience that is seeking satisfaction of cognitive needs and the brand ambassador can support this need, other distractors diminishing these relationships should be excluded.
In summary, the results of both communities show relatively consistent results. However, the results from HQ are more reliable related to the criteria of generalizability based on the procedure using different brands and brand ambassadors.

90
CONCLUSIONS, LIMITATIONS AND FUTURE RESEARCH
This comprehensive research project that has taken over three years to complete, involved over 70 Australian wine brands and two of Australia’s most influential wine regions. During this time over 75 live streaming, wine brand hosted interactive events were conducted. The technology available to allow industry to embrace live streaming events was tested and proofed extensively. The information within this report allows even the smallest wine brand, to engage wine consumers on-line and build their own on-line brand community. Whilst not a focus of results, it was also very encouraging to note that with little or no promotion of the communities, at the completion of the various studies the AHWR membership had grown organically to over 300 members, over 100 for the MS and over 400 for HQ.
The results of both the qualitative and the quantitative studies demonstrate that, even after only one community event experience, this approach to consumer engagement has the power to significantly satisfy a range of consumer needs and engage them in a mutually satisfying, co-created wine experience, which in turn, leads to brand attachment with the subsequent benefits of enhanced WOM recommendations and WPPP. Whilst the results of the individual brand community study (MS) and the regional brand community (HQ) showed some differences, they also demonstrated strong generalizability in the main effects tested in the model. Moreover, they both reveal that most individual consumer characteristics have limited moderating influences on these main effects. But, significant differences were found in relation to some consumer characteristics, highlighting the need to target consumers purposefully to get the best overall results. Hence, it can be expected that a carefully considered and targeted effort by any wine brand that employs this on-line engagement strategy can reap highly positive commercial results leading to increased sales, stronger consumer to consumer endorsements and, ultimately reduced price sensitivity in relation to competitive wine offers.
Another important finding common to both studies was consumer acceptance of a brand lead ‘host’ for the community events. Extensive briefing of brand ambassadors prior to events ensured that, with the exception of some initial test events, brand representatives resisted the temptation to use the occasions for any form of ‘hard sell’ of their wines. This approach reaped numerous benefits. It was hoped that consumers would trust the ambassadors and the context and engage openly and freely with brand ambassadors and each other. This outcome was certainly realised. Analysis of the qualitative data reveals the ‘delight’ shown by the majority of respondents as a result of the chance to meet, question and provide feedback to wine makers, in particular. Hence, the barrier to direct brand ownership and involvement in on-line communities, documented in other studies, was not a limitation here. This outcome suggests an expected advancement in the sophistication of consumers in terms of their own confidence in confronting brands intimately and in the ability of brand stakeholders to interact with consumers without the need to ‘sell’ wine directly. To the researcher’s knowledge this model of consumer-to-consumer, consumer-to-brand and brand-to-consumer model, has never been tested elsewhere in any other product category. Therefore, the understanding gained represents an important advancement in our knowledge of consumer engagement and brand attachment generally, providing a sound foundation for those in the Australian wine industry to build upon. Whilst the benefits of engaging with wine consumers on-line using this method are obvious, it is indicated that there will be considerable resistance from many Australian wine brands to plan and develop an on-line wine brand community.
Indeed, wine industry preparedness for brand led on-line consumer engagement is likely to be a considerable barrier to buy-in from industry. Surprisingly, even some of the very large and very prominent brands seem to consider that Facebook and Twitter are the best ways to engage with wine customers on-line because they are perceived to be cheap, easy and low risk. Interestingly, however, when asked by the researchers how they defined the success of their social media strategy, brand owners either didn’t seek to quantify usefulness (benefits were simply assumed to be there), or they used non-financial criteria. For many other brands, survival is grounded solely on maintaining a focus on selling to distributors, relying solely on ‘sales reps’ and a ‘push strategy’ to drive sales. Others are reliant on cellar door visits and bulk wine sales. Many are not surviving in a true business sense and could only be considered hobbyists.

91
Therefore, it’s not surprising that many wine brands are voicing concerns regarding pressure on profit levels and difficulty in achieving desired margins for their wines. In this climate it’s hoped that the findings of this research will be welcomed due to the empirical evidence provided specific to WOM endorsements and, for HQ the impact on WPPP as a result of only one event. Also, it is not suggested by the researchers that existing distribution channels or marketing activities, including the use of social media, should be abandoned - far from it. Rather the research provides understanding of what can be done ‘in-house’, using a resource focused on the uniqueness of each brand, to get close to wine consumers on-line in a way that is an extension of any existing marketing activities.
But, it is true that developing and implementing an on-line, hosted community will take considerable work in terms of planning and will require the investment of resources to upgrade current websites and the employment of people with the appropriate skills to make it happen. However, once in place each brand can take full advantage of what has been established in these studies to be one of their most potentially powerful consumer engagement assets - their own winemakers and brand principals. Moreover, the maintenance of websites and community member lists does not take an extraordinary investment in marketing expertise; but appropriately skilled people should be called upon (using externally recruited people when necessary) to review outcomes and participate in the marketing planning process. The actual cost for the equipment and software to set up an on-line community is minimal; consequently, using this opportunity to meet and engage consumers (and/or distributors and B2B clients for that matter) presents a comparatively low cost communications approach that enjoys world-wide reach.
The research has revealed that consumers do, in many cases, have some brands they admire and this was particularly evident in the qualitative research. But there was also evidence of extensive cross brand or ‘repertoire’ buying behaviour. This is due to a perceived lack of differentiation between brands within a region or a price bracket. Again, if customers gain ‘insider’ knowledge and enjoy special treatment, they will embrace that brand more fully and perceive significant differences between ‘their brands’ and all others. This is the fundamental building block of brand attachment and the downstream consequences of WOM and WPPP (because they believe their brands are superior). But without any basis for differentiation, many consumers do not feel especially attached to any brands in particular, and as a result, favour many brands or simply buy on price. A strategy to combat this would be to develop a brand community where special things happen; establishing a bond between members and the brand via the ambassador provides a sound basis for differentiation.
The use of third party operators to reach wine consumers on-line, as an alternative strategy to engaging with wine consumers themselves, may seem to be a low risk solution for industry requiring no investment or marketing expertise. However, in reality this channel is likely to make desired profit margins more difficult to achieve. It’s established that on-line wine sales are growing exponentially via third party operators, driven by offers of heavily discounted wines. Debriefing with community participants post these studies revealed the influences these third party operators can have on consumer willingness to pay even a moderate, let alone premium price for wine. For example, as a final concluding exercise in this project, the researchers invited a dozen members of the Mt Surmon and Barossa Valley wine communities to attend small focus groups to determine their likelihood to maintain membership if the communities were promoted and fostered by the owners. While most participants overwhelmingly indicated they would maintain their membership because the experiences were fun and interesting and they enjoyed the camaraderie, about a third of participants said they would not be buying the wine directly from the brand sites because they could buy the same wines much cheaper on-line from discount wine retailers. These individuals, usually male, indicated that they always bought wine at ‘full price’ once from the cellar door, brand website or a wine store/restaurant etc., and if they liked it they would scour the internet to find a cheaper retailer. In fact one respondent stated emphatically “I will never pay full price for a bottle of wine again” (this feedback supports a study completed by the researcher in 2012 for the Winemakers’ Federation of Australia Outlook Conference held in Melbourne; the full results are published elsewhere). This worrying consumer search and buying behaviour is supported by anecdotal evidence encountered by the researcher in numerous informal encounters with wine consumers across a range of projects.

92
Therefore, the major contribution of this research is to provide strong evidence of the potential for differentiation, competitive advantage and desensitisation of consumers to price differences. The results clearly indicate that industry’s openness to the work and investment are required to undertake a more consumer oriented approach to on-line wine marketing in a strategically informed way. Members of the research team were often told that these events were ‘a lot of work’ and that they couldn’t be justified in a longer term. We would strongly dispute this and suggest that it is the lack of experience and trained staff that leads to this belief. As stated, these events are extremely cost effective and can achieve worldwide reach. All of this is achieved by taking advantage of the unique talents of wine brand stakeholders – the very people that premium wine buyers in particular want to be close to. It is a matter of investing in skilled staff, maintaining an up to date website/community site, supporting the community via other channels of communications and also ensuring that wine can be purchased on-line via the website. Although this data was not collected from long standing members of an existing brand community, as this takes time beyond the scope of this project, the studies illustrate the influence of a single encounter, whose potential implications cannot be underestimated. The literature clearly shows that brand community members are advocates of brands and stout devotees – this is something worth working towards in these competitive times.
There were several limitations in the research that must be acknowledged. First, the events were conducted in a laboratory environment and some participants indicated post events that the artificial context adversely affected their enjoyment. On a positive note, this indicates that if a brand were to establish a community, their members would not be subjected to such feelings. Second, the model was tested using the data collected pre and post a single event. In order to understand more comprehensively the long term outcomes, a longitudinal study of members within an active wine brand community would be more appropriate. This methodology was found to be beyond the possible scope of this research. Also, whilst all quantitative measures proved to be reliable and valid, there is always an acknowledged risk of a degree of error in their employment. Additionally, whilst the sample of over 100 for each study was considered sufficient for an experimental laboratory research, a larger sample would be more advantageous to ensure the representation of a wider range of wine consumers. Nonetheless, the sample size was appropriate for achieving the documented assumption benchmarks for all testing used, and data analysis illustrates statistically significant results. Finally, the composition of the samples represents another limitation because the participants were drawn using different sources in the wine buying population as a result of the little practical value of most wine brand customer lists. However, all respondents were screened prior to the participation to ensure they were regular wine buyers. Importantly, the analysis of the sample profile (available upon request) showed a reasonable resemblance in terms of gender and age with the general Australian population aged 18 years and above.
In closing, the studies support a number of important directions for future research. Firstly, we recommend follow-up research to assist brands in determining the best community orientations for them. These may include cross-sectional studies dedicated to consumers’ perceptions of a brand’s personality, core values and tailoring events to specifically suit that brand. Whilst the Mt Surmon wine brand and community was conceived to achieve that goal, the wine consumers had little or no brand awareness of their wines and the scope of this project did not allow extending the study to cover these factors. This, however, would be possible for the established brands. Secondly, future research needs to investigate if a match exists between brand personality and differing consumer needs enhances engagement and downstream effects to attachment (WOM and WPPP). For example, are ‘fun’ brands better served by focusing on emotionally based or socially oriented events? Are ‘serious’ brands better served by hosting predominantly cognitively based events? Also, more research is desirable about the effects of a perceived ‘match’ of brand ambassador personality with the desired personality of brand and/or their brand values. In the case of Mt Surmon – the principals are the brand; hence, they are highly congruent with its personality and also with the theme and feeling of the events. In contrast, with larger brands that produce a wide range of products targeting different segments, the questions would be centred on determining if different communities with differing personality styles would be better (say, for different price ranges or consumer characteristics) – or would it be more advantageous to focus one community around the corporate brand and host different events for different segments.

93
Another area of importance is to quantify the effects of a brand community to leverage more traditional forms of marketing communications and promotional strategies and vice versa. It would be expected that an on-line brand community would be a strong inducer to attendance at face-to-face events, leading to greater advertising effectiveness but this has not been tested. In terms of awareness and perceptions of quality, willingness to purchase and WPPP, further research could be to quantify which types of media exert the strongest effects.
Taking an industry B2B perspective, the potential for supplier and/or distributor communities was not formally tested in these studies. Although some brands did invite distributors and other members of their supply chains to log in to events, their perceptions of the experience and its perceived usefulness was not investigated. Given the vast geographical distances between many Australian wine brand stakeholders and overseas commercial customers, using this medium to conduct product training and maintain sound business relationships could prove invaluable and, at the same time, reduce costs of travelling and time away from home. Anecdotally, the researcher received positive responses to the community concept whilst gathering data from the wine distributors in Beijing for a different research project. Hence, it may be useful to evaluate this feedback empirically to determine if live streaming with brand ambassadors can lead to needs satisfaction specific to commercial partners. The same downstream effects of engagement and attachment would still be expected to be evident. This would permit the testing of different needs more commercially oriented in addition to those specified in the consumer studies.
Lastly, given the indications regarding industry preparedness to engage in on-line consumer attachment, anecdotal evidence obtained by the researchers and qualitative feedback regarding the perceived value of marketing qualifications/expertise in the wine industry, it may be worthwhile to undertake an industry investigation around these issues. Interestingly, the use of non-professionals in senior sales and marketing roles in other alcohol related beverage industries is not the ‘norm’ but it appears to be quite common in the wine industry. These brand stakeholders seem much more consumer oriented compared to many in the wine industry, which still appears to have a predominantly production oriented mindset. Statements made during the three years of this project include comments such as, “We make the wine we like – if people don’t like it they can buy somebody else’s”, “We don’t have to interact with customers, our distributors do that”, “Consumers don’t really understand wine, they rely on us to tell them what is good”, “People just buy on price these days it doesn’t matter what else we do”. Hence, it may be worthwhile to investigate these issues empirically to determine industry orientation to marketing and perceptions of how to best implement consumer-focused strategies – beyond Facebook. Given the current increasing levels of national and international competition, and the desire to achieve higher margins for their wines, establishing benchmarks for marketing orientation and industry marketing expertise could be very useful in assisting the industry to increase their expertise.

94
REFERENCES
Aaker, D., 2010. “Building Strong Brands”. Simon & Schuster UK.
Aaker, J., 1997. “Dimensions of Brand Personality”. Journal of Marketing Research 34, 347–356.
Abdul-Ghani, E., Hyde, K.F., Marshall, R., 2011. “Emic and etic interpretations of engagement with a consumer-to-consumer on-line auction site”. Journal of Business Research. Elsevier, ISSN 0148-2963, Vol. 64 (2011) 10, 1060-1066.
Ahuja, V & Medury, Y 2010, “Corporate blogs as e-CRM tools – Building consumer engagement through content management”. Journal of Database Marketing & Customer Strategy Management, vol. 17, no. 2, 91-105.
Algesheimer, R., Dholakia, U.M., Herrmann, A., 2005. “The Social Influence of Brand Community: Evidence from European Car Clubs”. Journal of Marketing 69, 19–34.
Andersson, M., Ekman, P., 2009. “Ambassador networks and place branding”. Journal of Place Management and Development 2, 41–51.
Aron, A., Aron, E., Smollan, D., 1992. “Inclusion of other in the self scale and the structure of interpersonal closeness”. Journal of Personality and Social Psychology 63, 596–612.
Ashworth, L., Dacin, P., Thomson, M., 2009. “Why on earth do consumers have relationships with marketers?”. in: MacInnis, D.J., Park, C.W., Priester, J.R. (Eds.), Handbook of Brand Relationships. Society of Consumer Psychology, New York 83–106.
Bagozzi, R.P., 1996. “The Role of Arousal in the Creation and Control of the Halo Effect in Attitude Models”. Psychology & Marketing 13, 3, 235-264.
Bagozzi, R.P., Dholakia, U.M., 2006. “Antecedents and purchase consequences of customer participation in small group brand communities”. 23, 45-61.
Barber, N., Ismail, J., Dodd, T., 2008. “Purchase Attributes of Wine Consumers with Low Involvement”. Journal of Food Products Marketing 14, 1, 69-86.
Barnham, C., 2008. “Instantiation”. International Journal of Market Research 50, 2, 203-220.
Baron, R.M., Kenny, D.A., 1986. “The moderator-mediator variable distinction in social psychological research: Conceptual, strategic, and statistical considerations”. Journal of Personality and Social Psychology 51, 1173–1182.
Bart, Y., Shankar, V., Sultan, F., Urban, G.L., 2005. “Are the Drivers and Role of On-line Trust the Same for All Web Sites and Consumers? A Large-Scale Exploratory Empirical Study”. Journal of Marketing 69, 4, 133-152.
Bauer, H.H., Sauer, N.E., Becker, C., 2006. “Investigating the relationship between product involvement and consumer decision-making styles”. Journal of Consumer Behaviour 5, 4, 342-354.
Belk, R., 1988. “Possessions and the Extended Self”. Journal of Consumer Research 15, 139–168.
Bergami, M., Bagozzi, R.P., 2000. “Self-categorization, affective commitment and group self-esteem as distinct aspects of social identity in the organisation”. British Journal of Social Psychology 39, 555–577.
Bo-chiuan, S 2008, “Characteristics of Consumer Search On-Line: How Much Do We Search?”. International Journal of Electronic Commerce, vol. 13, no. 1, Fall2008, 109-129.

95
Bowden, J.L.-H., 2009. “The Process of Customer Engagement: A Conceptual Framework”. The Journal of Marketing Theory and Practice 17, 63–74.
Bowlby, J., 1969. “Attachment and Loss”. 1 : Attachment, 2nd. ed. The Hogarth Press and the Institute of Psycho-Analysis, London.
Brakus, J.J., Schmitt, B.H., Zarantonello, L., 2009. “Brand Experience: What Is It? How Is It Measured? Does It Affect Loyalty?”. Journal of Marketing 73, 52–68.
Braun, E., Kavaratzis, M., Zenker, S., 2013. “My city – my brand: the different roles of residents in place branding”. Journal of Place Management and Development 6, 18–28.
Brodie, R.J., Ilic, A., Juric, B., Hollebeek, L., 2013. “Consumer engagement in a virtual brand community: An exploratory analysis.” Journal of Business Research 66, 105–114.
Cacioppo, JT, Petty, RE & Chuan Feng, K 1984, “The Efficient Assessment of Need for Cognition”. Journal of Personality Assessment, vol. 48, no. 3, 306-312.
Calder, B.J., Malthouse, E.C., 2008. “Media engagement and advertising effectiveness”. Kellogg on Advertising and Media 1–36.
Chan, K.W., Li, S.Y., 2010. “Understanding consumer-to-consumer interactions in virtual communities: The salience of reciprocity”. Journal of Business Research 63, 1033–1040.
Chatterjee, P 2001, “Online Reviews: Do Consumers Use Them?”. Advances in Consumer Research, vol. 28, no. 1, 129-133.
Chaudhuri, A., Holbrook, M.B., 2001. “The chain of effects from brand trust and brand affect to brand performance: the role of brand loyalty”. Journal of Marketing 65, 81–93.
Chaudhuri, A., Holbrook, M.B., 2002. “Product-class effects on brand commitment and brand outcomes: The role of brand trust and brand affect”. The Journal of Brand Management 10, 33–58.
Cox, AM & Blake, MK., 2011. “Information and food blogging as serious leisure”. Aslib Proceedings, vol. 63, no. 2/3, 204-220.
Cox, D., Cox, A., 1994. “The Effect of Arousal Seeking Tendency on Consumer Preferences for Complex Product Designs”. Advances in Consumer Research 21, 1, 554-559.
Dahan, E & Hauser, JR 2002, “The virtual customer”. Journal of Product Innovation Management, vol. 19, no. 5, 332-353.
Dardis, F.E., Fuyuan, S., “The influence of evidence type and product involvement on message framing effects in advertising”. Journal of Consumer Behaviour 7, 3, 222-238.
Dickinger, A 2011, “The Trustworthiness of Online Channels for Experience- and Goal-Directed Search Tasks”. Journal of Travel Research, vol. 50, no. 4, 378-391.
Dou, W, Lim, KH, Su, C, Zhou, N & Cui, N 2010, “BRAND POSITIONING STRATEGY USING SEARCH ENGINE MARKETING”. MIS Quarterly, vol. 34, no. 2, pp. 261-A264.
Drengner, J , Jahn, S., Gaus, H., 2012. “Creating Loyalty in Collective Hedonic Services: The Role of Satisfaction and Psychological Sense of Community”. Schmalenbach Business Review (SBR) 64, 1, 59-76.
Escalas, J.E., Bettman, J.R., 2003. “You are what they eat: The influence of reference groups on consumers” connections to brands”. Journal of Consumer Psychology 13, 339–348.
Escalas, J.E., Bettman, J.R., 2005. “Self-construal, reference groups, and brand meaning”. Journal of Consumer Research 32, 378–389.

96
Fan, T-K & Chang, C-H 2011, “Blogger-Centric Contextual Advertising”. Expert Systems with Applications, vol. 38, no. 3, pp. 1777-1788.
Fassnacht, M., Köse, I., 2007. “Consequences of Web-based service quality: Uncovering a multi-faceted chain of effects”. Journal of Interactive Marketing (John Wiley & Sons) 21, 3, Summer 2007, 35-54.
Fedorikhin, A., Park, C.W., Thomson, M., 2006. “How Far Do Feelings Go? How Attachments Influence Brand Extensions”. Advances in Consumer Research 33, 1, 631-631.
Foster, MK, Francescucci, A & West, BC 2010, “Why Users Participate in Online Social Networks”. International Journal of e -- Business Management, vol. 4, no. 1, pp. 3-19.
Fournier, S., 1998. “Consumer and Their Brands: Developing Relationship Theory in Consumer Research”. Journal of Consumer Research, 24, 334-373.
Goldsmith, R.E., Goldsmith, E.B., 2002. “Buying apparel over the Internet”. Journal of Product & Brand Management 11, 89–102.
Greenfield, G., Campbell, J., 2006. “Communicative Practices in On-line Communication: A Case of Agreeing to Disagree”. Journal of Organisational Computing & Electronic Commerce 16, 3/4, 267-277.
Greiner, M.E., Hui, W., 2010. “Building Consumer-to-Consumer Trust in E-Finance Marketplaces: An Empirical Analysis”. International Journal of Electronic Commerce 15, 2, Winter 2010-2011, 105-136.
Guido, G., Capestro, M., Peluso, A.M., 2007. “Experimental analysis of consumer stimulation and motivational states in shopping experiences”. International Journal of Market Research 49, 3, 365-386.
Gupta, R.,Kabadayi, S., 2010. “The relationship between trusting beliefs and Web site loyalty: The moderating role of consumer motives and flow”. Psychology & Marketing 27, 2, 166-185.
Gupta, S, Kim, H-W & Shin, S-J 2010, “Converting Virtual Community Members Into On-line Buyers”. CyberPsychology, Behaviour & Social Networking, vol. 13, no. 5, pp. 513-520.
Hammer, P, Riebe, E & Kennedy, R 2009, “How Clutter Affects Advertising Effectiveness”. Journal of Advertising Research, vol. 49, no. 2, pp. 159-163.
Hazan, C., Shaver, P.R., 1994. “Attachment as an organisational framework for research on close relationships”. Psychological Inquiry 5, 1–22.
Heehyoung, J, Olfman, L, Islang, K, Joon, K & Kyungtae, K 2008, “The Influence of On-Line Brand Community Characteristics on Community Commitment and Brand Loyalty”. International Journal of Electronic Commerce, vol. 12, no. 3, Spring2008, pp. 57-80.
Hidalgo, M.C., Hernandez, B., 2001. “Place attachment: Conceptual and empirical questions”. Journal of Environmental Psychology 21, 273–281.
Hollebeek, L.D., 2013. “The customer engagement/value interface: An exploratory investigation”. Australasian Marketing Journal (AMJ) 21, 17–24.
Holton, AE & Chyi, HI 2012, “News and the Overloaded Consumer: Factors Influencing Information Overload Among News Consumers”. CyberPsychology, Behavior & Social Networking, vol. 15, no. 11, pp. 619-624.
Hsiu-Fen, L 2008, “Antecedents of Virtual Community Satisfaction and Loyalty: An Empirical Test of Competing Theories”. CyberPsychology & Behavior, vol. 11, no. 2, pp. 138-144.
Hsu, C.-P., Chiang, Y.-F., Huang, H.-C., 2012. “How experience-driven community identification generates trust and engagement”. On-line Information Review 36, 72–88.

97
Hung, K., Yiyan Li, S., Tse, D.K., 2011. “Interpersonal Trust and Platform Credibility in a Chinese Multibrand On-line Community”. Journal of Advertising 40, 3, Fall 2011, 99-112.
Jae Wook, K, Jiho, C, Qualls, W & Kyesook, H 2008, “It takes a marketplace community to raise brand commitment: the role of on-line communities”. Journal of Marketing Management, vol. 24, no. 3/4, pp. 409-431.
Jawahar, P.D., Maheswari, R., 2009. “Service Perception: Emotional Attachment as a Mediator of the Relationship Between Service Performance and Emotional Brand”. ICFAI Journal of Marketing Management 8, 2, 7-22.
Jen-Ruei, F & Chen, JHF 2012, “AN INVESTIGATION OF FACTORS THAT INFLUENCE BLOG ADVERTISING EFFECTIVENESS”. International Journal of Electronic Business Management, vol. 10, no. 3, pp. 194-203.
Johnson, RL 2011, “Corporate Strategy And The Social Networking Phenomena”. Journal of Service Science (19414722), vol. 4, no. 2, 1-10.
Kahle, L.R., Homer, P.M., 1985. “Physical Attractiveness of the Celebrity Endorser: A Social Adaptation Perspective. Journal of Consumer Research 11, 954–961.
Kamins, M.A., Brand, M.J., Hoeke, S.A., Moe, J.C., 1989. Two-Sided versus One-Sided Celebrity Endorsements: The Impact on Advertising Effectiveness and Credibility”. Journal of Advertising 18, 4–10.
Kim, J., Song, J., Jones, D.R., 2011. The cognitive selection framework for knowledge acquisition strategies in virtual communities”. International Journal of Information Management 31, 2, 111-120.
Knox, S., Walker, D., Marshall, C., 1994. “Measuring Consumer Involvement with Grocery Brands: Model Validation and Scale-Reliability Test Procedures. Journal of Marketing Management 10, 1-3, 137-152.
Kucuk, S.U., 2010. “Negative Double Jeopardy revisited: A longitudinal analysis”. Journal of Brand Management 18, 2, 150-158.
Kuenzel, S., Halliday, S.V., 2010. “The chain of effects from reputation and brand personality congruence to brand loyalty: The role of brand identification”. Journal of Targeting, Measurement & Analysis for Marketing 18, 3/4, 167-176.
La Guardia, J.G., Ryan, R.M., Couchman, C.E., Deci, E.L., 2000. “Within-person variation in security of attachment: A self-determination theory perspective on attachment, need fulfilment, and well-being”. Journal of Personality and Social Psychology 79, 3, 367-384.
Lafferty, B.A., Goldsmith, R.E., 1999. “Corporate Credibility’s Role in Consumers” Attitudes and Purchase Intentions When a High versus a Low Credibility Endorser Is Used in the Ad”. Journal of Business Research 44, 109–116.
Lockshin, L.S., Spawton, A.L., Macintosh, G., 1997. “Using product, brand and purchasing involvement for retail segmentation”. Journal of Retailing and Consumer Services 4, 3, 171-183.
Luigi, D, Oana, S, Mihai, T & Simona, V 2011, “DISCLOSING THE PROMISING POWER OF SOCIAL MEDIA - AN IMPORTANT DIGITAL MARKETING TOOL”. Studies in Business & Economics, vol. 6, no. 1, 37-45.
Malär, L., Krohmer, H., Hoyer, W.D., Nyffenegger, B., 2011. “Emotional Brand Attachment and Brand Personality: The Relative Importance of the Actual and the Ideal Self”. Journal of Marketing 75, 4, 35-52.
McAlexander, J.H., Kim, S.K., Roberts, S.D., 2003. “Loyalty: The Influences of Satisfaction and Brand Community Integration”. Journal of Marketing Theory and Practice 11, 1–11.
McAlexander, J.H., Schouten, J.W., Koenig, H.F., 2002. “Building Brand Community”. Journal of Marketing 66, 38–54.

98
McWilliam, G 2000, “Building Stronger Brands through On-line Communities”. Sloan Management Review, vol. 41, no. 3, Spring2000, 43-54.
Meyer, HK, Marchionni, D & Thorson, E 2010, “The Journalist Behind the News: Credibility of Straight, Collaborative, Opinionated, and Blogged "News."“. American Behavioral Scientist, vol. 54, no. 2, 100-119.
Mollen, A., Wilson, H., 2010. “Engagement, tele-presence and interactivity in on-line consumer experience: Reconciling scholastic and managerial perspectives”. Journal of Business Research 63, 919–925.
Mudambi, S.M., Schuff, D., 2010. “What Makes a Helpful On-line Review? A Study of Customer Reviews On Amazon.com”. MIS Quarterly 34, 1, 185-200.
Mudambi, SM & Schuff, D 2010, “WHAT MAKES A HELPFUL ON-LINE REVIEW? A STUDY OF CUSTOMER REVIEWS ON AMAZON.COM”. MIS Quarterly, vol. 34, no. 1, 185-200.
Muniz Jr, A.M., O’Guinn, T.C., 2001. “Brand Community”. Journal of Consumer Research 27, 4, 412-432.
Odekerken-Schröder, G., De Wulf, K., Schumacher, P., 2003. “Strengthening outcomes of retailer–consumer relationships: The dual impact of relationship marketing tactics and consumer personality”. Journal of Business Research 56, 3, 177.
Orth, U.R., 2005. Consumer personality and other factors in situational brand choice variation. Journal of Brand Management, 13, 2, 115-133.
Park, C.W., MacInnis, D.J., Priester, J., Eisingerich, A.B., Iacobucci, D., 2010. Brand Attachment and Brand Attitude Strength: Conceptual and Empirical Differentiation of Two Critical Brand Equity Drivers. Journal of Marketing 74, 1–17.
Park, C.W., MacInnis, D.J., Priester, J.R., Hall, H., 2006. Beyond attitudes: attachment and consumer behavior. Seoul Journal of Business 12, 3–35.
Pavlou, P.A., 2003. Consumer Acceptance of Electronic Commerce: Integrating Trust and Risk with the Technology Acceptance Model. International Journal of Electronic Commerce 7, 3, Spring 2003, 101-134.
Pergelova, A, Prior, D & Rialp, J 2010, “ASSESSING ADVERTISING EFFICIENCY”. Journal of Advertising, vol. 39, no. 3, Fall2010, pp. 39-54.
Phillips, B.J., McQuarrie, E.F., 2010. Narrative and Persuasion in Fashion Advertising. Journal of Consumer Research 37, 368–392.
Pleshko, L.P., & Al-Houti, S., 2011. Heavy Versus Light Users: A Preliminary Study Of Consumer Behaviour Patterns In Two Low-Involvement Retail Services. Allied Academies International Conference: Proceedings of the Academy of Marketing Studies (AMS) 16, 2, 17-22.
Ponsonby-McCabe, S., Boyle, E., 2006. Understanding brands as experiential spaces: axiological implications for marketing strategists. Journal of Strategic Marketing 14, 2, 175-189.
Preacher, K.J., Hayes, A.F., 2004. SPSS and SAS procedures for estimating indirect effects in simple mediation models. Behavior Research Methods 36, 717–731.
Preacher, K.J., Hayes, A.F., 2008. Asymptotic and resampling strategies for assessing and comparing indirect effects in multiple mediator models. Behavior Research Methods 40, 879–891.
Rajagopal, K., 2009. Arousal and Merriment as Decision Drivers Among Young Consumers. Journal of International Consumer Marketing 21, 4, 271-283.
Raju, S., Unnava, H.R., Montgomery, N.V., 2009. The Moderating Effect of Brand Commitment on the Evaluation Of Competitive Brands. Journal of Advertising 38, 2, Summer 2009, 21-35.

99
Río, A.B. del, Vázquez, R., Iglesias, V., 2001. The effects of brand associations on consumer response .Journal of Consumer Marketing 18, 410–425.
Romaniuk, J., Sharp, B., 2003. Measuring brand perceptions: Testing quantity and quality. Journal of Targeting, Measurement & Analysis for Marketing 11, 3, 218.
Rosenbaum, M.S., Ostrom, A.L., Kuntze, R., 2005. Loyalty programs and a sense of community. Journal of Services Marketing, 19, 4, 222-233.
Rubinson, J 2009, “Empirical Evidence of TV Advertising Effectiveness”. Journal of Advertising Research, vol. 49, no. 2, pp. 20-226.
Sanchez-Franco, M., Rondan-Cataluña, F.J., 2010. Connection between customer emotions and relationship quality in on-line music services. Behaviour & Information Technology 29, 6, 633-651.
Schau, H.J., Muñiz, A.M., Arnould, E.J., 2009. How Brand Community Practices Create Value. Journal of Marketing 73, 5, 30-51.
Sicilia, M, Ruiz, S & Reynolds, N 2006, “Attitude formation online: How the consumer’s need for cognition affects the relationship between attitude towards the website and attitude towards the brand”. International Journal of Market Research, vol. 48, no. 2, pp. 139-154.
Simmers, C.S.; D.-M., 2009. Examining the Effectiveness of Athlete Celebrity Endorser Characteristics and Product Brand Type: The Endorser Sexpertise Continuum. Journal of Sport Administration and Supervision 1.
Sindhav, B., 2011. The Strategic Implications of Consumer-Centric Virtual Communities. Journal of Marketing Development & Competitiveness 5, 3, 11-23.
Sinha, N, Ahuja, V & Medury, Y 2011, “Corporate blogs and internet marketing - Using consumer knowledge and emotion as strategic variables to develop consumer engagement”. Journal of Database Marketing & Customer Strategy Management, vol. 18, no. 3, pp. 185-199.
Sommerfeld, A., Paulssen, M., 2008. Antecedents and Consequences of Customer-Company Identification. Presented at the EMAC, Brighton.
Spry, A., Pappu, R., Cornwell, T.B., 2011. Celebrity endorsement, brand credibility and brand equity. European Journal of Marketing 45, 882–909.
Srivastava, K, Shukla, A & Sharma, NK 2010, “On-line Flow Experiences: The Role of Need for Cognition, Self-Efficacy, and Sensation Seeking Tendency”. International Journal of Business Insights & Transformation, vol. 3, no. 2, pp. 93-100.
Srivastava, K., Shukla, A., Sharma, N.K., 2010. On-line Flow Experiences: The Role of Need for Cognition, Self-Efficacy, and Sensation Seeking Tendency. International Journal of Business Insights & Transformation 3, 2, 93-100.
Steyn, P, van Heerden, G, Pitt, L & Boshoff, C 2007, “Meet the Bloggers: Some Characteristics of Serious Bloggers in the Asia-Pacific Region, and Why PR Professionals Might Care About Them”. Public Relations Quarterly, vol. 52, no. 3, pp. 39-44.
Stokburger-Sauer, N., 2010. Brand community: Drivers and outcomes. Psychology & Marketing 27, 4, 347-368.
Stremtan, F, Achim, MI, Radu, LA & Radoviciu, R 2010, “Blog Marketing--A Relevant Instrument of the Marketing Policy”. Annales Universitatis Apulensis Series Oeconomica, vol. 12, no. 2, pp. 760-765.
Szmigin, I., Reppel, A.E., 2004. Internet community bonding: the case of macnews.de. European Journal of Marketing 38, 5/6, 626-640.

100
Thach, L 2010, “Wine blogs: expressing diverse wine opinions in a new realm of online wine relationship marketing”. 5th International Academy of Wine Business Research Conference, pp. 8-10.
Thach, LIZ 2009, “Wine 2.0—The Next Phase of Wine Marketing? Exploring US Winery Adoption of Wine 2.0 Components”. Journal of Wine Research, vol. 20, no. 2, pp. 143-157.
Thomson, K., Hecker, L., 2001. Value-adding communication: Innovation in employee communication and internal marketing. Journal of Communication Management 5, 48–58.
Thomson, M., 2006. Human brands: Investigating antecedents to consumers” strong attachments to celebrities. Journal of Marketing 70, 104–119.
Thomson, M., MacInnis, D.J., Park, C.W., 2005. The ties that bind: measuring the strength of consumers” emotional attachments to brands. Journal of Consumer Psychology 15, 77–91.
Thomson, M., MacInnis, D.J., Park, C.W., 2005. The Ties That Bind: Measuring the Strength of Consumers” Emotional Attachments to Brands. Journal of Consumer Psychology (Lawrence Erlbaum Associates) 15, 1, 77-91.
Trusov, M., Bucklin, R.E., Pauwels, K., 2009. Effects of Word-of-Mouth Versus Traditional Marketing: Findings from an Internet Social Networking Site. Journal of Marketing 73, 5, 90-102.
Turner, B 2009, “Wineries, time to get blogging”. Australian & New Zealand Grapegrower & Winemaker, no. 544, pp. 73-73.
Vargo, S.L., 2009. Toward a transcending conceptualization of relationship: a service-dominant logic perspective. Journal of Business & Industrial Marketing 24, 373–379.
Voorveld, HAM, Smit, EG, Neijens, PC, Bronner, FE & Morrison, M 2012, “MEDIA GUIDING CONSUMERS ACROSS DIFFERENT STAGES OF THE PURCHASE PROCESS”. American Academy of Advertising Conference Proceedings, pp. 35-36.
Wakefield, R.J., Stocks, M.H., Wilder, W.M., 2004. The Role of Web Site Characteristics in Initial Trust Formation. Journal of Computer Information Systems 45, 1, Fall 2004, 94-103.
Walton, G.M., Cohen, G.L., Cwir, D., Spencer, S.J., 2012. Mere Belonging: The Power of Social Connections. Journal of Personality & Social Psychology 102, 3, 513-532.
Wang, L.C., Chang, L-H., Wysong, S., 2012. An empirical investigation of the influence of optimum stimulation levels in retailing. International Journal of Retail & Distribution Management 40, 1, 6-20.
Wu, J-J., Chen, Y-H., Chung, Y-S., 2010. Trust factors influencing virtual community members: A study of transaction communities. Journal of Business Research 63, 9/10, 1025-1032.
Yilmaz, C., Telci, E.E., Bodur, M., Iscioglu, T.E., 2011. Source characteristics and advertising effectiveness. International Journal of Advertising 30, 5, 889-914.
Yongjun, S., Jooyoung, K., Jong-Hyuok, J., 2010. The Predictive Roles of Brand Personality on Brand Trust and Brand Affect: A Study of Korean Consumers. Journal of International Consumer Marketing 22, 1, 5-17.
Yung-Cheng, S, Chun-Yao, H, Chia-Hsien, C & Hui-Chun, L 2010, “Virtual Community Loyalty: An Interpersonal-Interaction Perspective”. International Journal of Electronic Commerce, vol. 15, no. 1, Fall2010, pp. 49-74.
Zentes, J., Morschett, D., Schramm-Klein, H., 2008. “Brand personality of retailers - an analysis of its applicability and its effect on store loyalty”. International Review of Retail, Distribution & Consumer Research 18, 2, 167-184.

101
Zhao, X., Lynch Jr., J.G., Chen, Q., 2010. “Reconsidering Baron and Kenny: Myths and Truths about Mediation Analysis”. Journal of Consumer Research 37, 197–206.