The chemistry and biogenesis of the C13-norisoprenoids in wine

Alexander Purvis U64
Chemistry WineCoursework
Alexander Purvis
1
Alexander Purvis U64
Theory
What is wine?
Wine is made up of primarily fermented grapes (red or white depending on the wine), sugars, acids, tannins and enzymes. During fermentation of the grapes, yeast is added; this is a key element asit is this which consumes the sugar, changing it into alcohol. Fermentation is the process in which electrons are transferred from the grapes (nutrient) due to an interaction with yeast. The type ofyeast used in production and the type of grapes react differently together therefore giving different alcohol and sugar contents, offering a wide range of available flavours from just two variables.
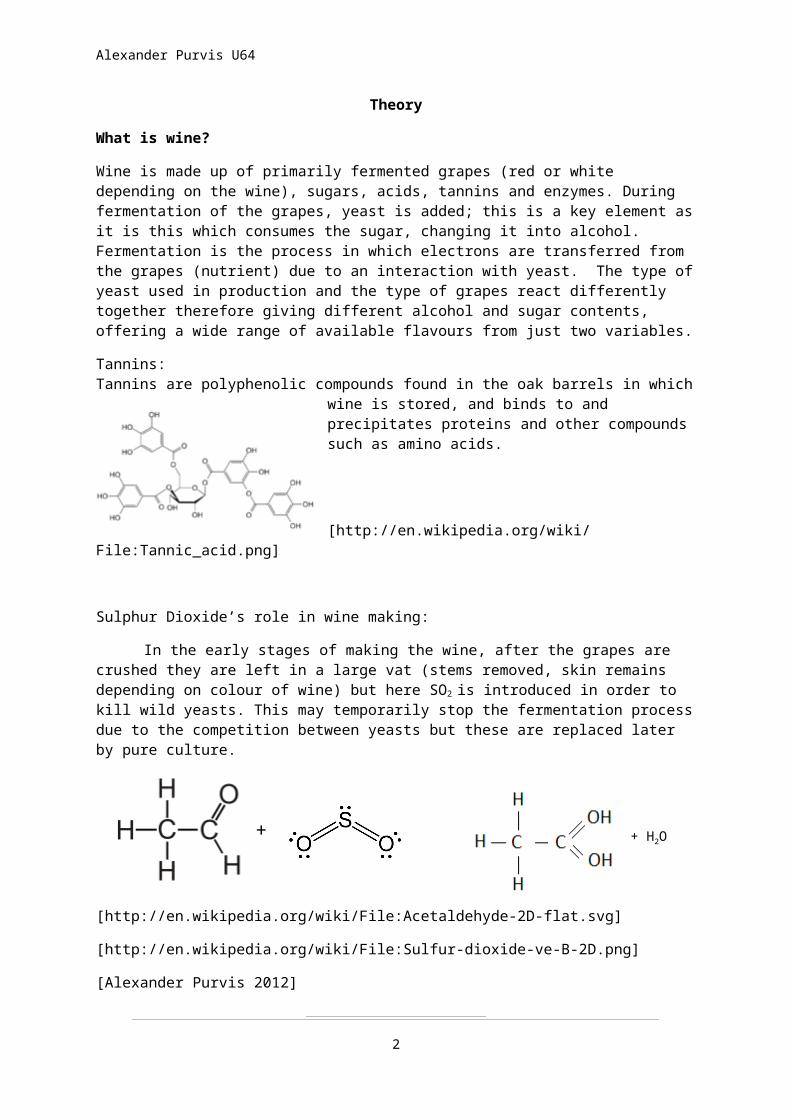
Tannins:Tannins are polyphenolic compounds found in the oak barrels in which
wine is stored, and binds to and precipitates proteins and other compounds such as amino acids.
[http://en.wikipedia.org/wiki/File:Tannic_acid.png]
Sulphur Dioxide’s role in wine making:
In the early stages of making the wine, after the grapes are crushed they are left in a large vat (stems removed, skin remains depending on colour of wine) but here SO2 is introduced in order to kill wild yeasts. This may temporarily stop the fermentation processdue to the competition between yeasts but these are replaced later by pure culture.
[http://en.wikipedia.org/wiki/File:Acetaldehyde-2D-flat.svg]
[http://en.wikipedia.org/wiki/File:Sulfur-dioxide-ve-B-2D.png]
[Alexander Purvis 2012]
2
+ + H2O
+ H2O2[O]- →
Alexander Purvis U64
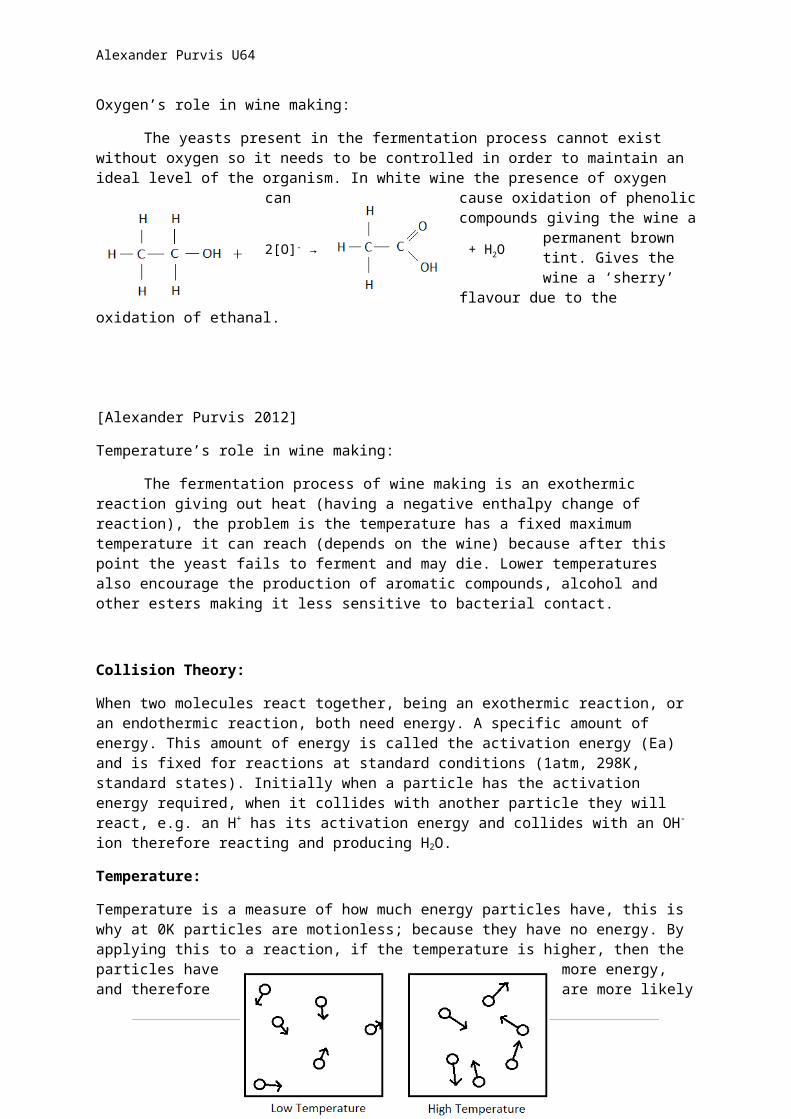
Oxygen’s role in wine making:
The yeasts present in the fermentation process cannot exist without oxygen so it needs to be controlled in order to maintain an ideal level of the organism. In white wine the presence of oxygen
can cause oxidation of phenoliccompounds giving the wine a
permanent brown tint. Gives the wine a ‘sherry’
flavour due to the oxidation of ethanal.
[Alexander Purvis 2012]
Temperature’s role in wine making:
The fermentation process of wine making is an exothermic reaction giving out heat (having a negative enthalpy change of reaction), the problem is the temperature has a fixed maximum temperature it can reach (depends on the wine) because after this point the yeast fails to ferment and may die. Lower temperatures also encourage the production of aromatic compounds, alcohol and other esters making it less sensitive to bacterial contact.
Collision Theory:
When two molecules react together, being an exothermic reaction, or an endothermic reaction, both need energy. A specific amount of energy. This amount of energy is called the activation energy (Ea) and is fixed for reactions at standard conditions (1atm, 298K, standard states). Initially when a particle has the activation energy required, when it collides with another particle they will react, e.g. an H+ has its activation energy and collides with an OH-
ion therefore reacting and producing H2O.
Temperature:
Temperature is a measure of how much energy particles have, this is why at 0K particles are motionless; because they have no energy. By applying this to a reaction, if the temperature is higher, then the particles have more energy, and therefore are more likely
3

Alexander Purvis U64
to have the activation energy required to react, thus increasing thetemperature of a reaction will increase the rate of reaction.
[Alexander Purvis 2012]
Concentration:
When the concentration of a solution is increased, this means that more molecules of that substance have been added, e.g. a 5 molar solution of H2SO4 has more sulphuric acid molecules within the same volume as a 0.1 molar solution of the same substance. So in this case if you increase the concentration of a solution, then when you try and react it with something else, due to the increased numbers of available particles, there is more chance of a successful collision with the activation energy requiredto occur, therefore increasing the rate of reaction.
[Alexander Purvis 2012]
Pressure:
The effect of pressure is similar to that of concentration in the way that energy in the system is the same, but the chance of successful
4

Alexander Purvis U64
collisions is increased. This is because the particles are forced into a smaller area, therefore they are in a closer proximity to each other, therefore more likely to collide and have enough activation energy to react.
[Alexander Purvis 2012]
All three of these methods can be displayed on a Maxwell Boltzmann Distribution curve. This is a graph of energy against the number of particles with this specific energy. As each of these graphs is decreasing the activation energy required for the reaction to occur,I have represented them as one identical line (E2)
Graph showing the energy of particles in a reaction, the original activation energy (Ea1) and the activation energy with any of these benefiting factors (Ea2)
[Alexander Purvis 2012]
5

Alexander Purvis U64
Catalysts:
These act in almost the opposite way to temperature and concentration in the way that instead of giving the particles energy, catalysts lower the activation, therefore it's more likely they will react, the reaction might be able to occur at lower temperatures, or with lower concentrations.
[Alexander Purvis 2012]
Ultra Violet radiation’s role in storage of Wine
[http://www.wrap.org.uk/sites/files/wrap/UV%20&%20wine%20quality%20May'08.pdf]
6

Alexander Purvis U64
This graph shows the UV protection of three different coloured wine bottles.
Photochemical activators riboflavin, pantothenic acid. These can start some ‘light struck reactions’ which can release a bad tasting aroma within minutes of exposure to air. Light strike reactions are caused when particles of light (photons) give energy into the reaction, so as the particles have more energy, they are more likelyto have the activation energy required to react, therefore the rate of reaction is increased. In this case, the reaction with the increased rate is the oxidation of ethanol to ethanoic acid. This increases the concentration of H+ ions, making the wine more acidic which as a consequence altars the taste of the wine, something whichwhen storing wine, we do not want to happen.
Ingredient List
Water
[Alexander Purvis 2012]
Water is used in wines in order to dilute the solution of acids and enzymes. It has also been popular culture for thousands of years to add water to wine in order to enrich the flavour, this has been donesince before the Romans.
Glucose
[http://en.wikipedia.org/wiki/File:Glucose_chain_structure.svg]
Fructose
[http://en.wikipedia.org/wiki/File:Skeletal_Structure_of_D-Fructose.svg]
Both Glucose and Fructose are sugars found naturally in grapes, and are therefore in wines. These are present because they are produced
7
Gluco
Fructos

Alexander Purvis U64
to act as an energy source for the seed (within the grape) when it is fertilized.
Tartaric Acid
[http://en.wikipedia.org/wiki/File:Tartaric_acid.svg]
Tartaric acid is a naturally occurring acid found in the grapes which are used for wines. When wine is tested for acidity, the concentration of tartaric acid is often measured. In our case, the concentration remains constant so storage conditions cannot be determined using this concentration.
Malic Acid
[http://en.wikipedia.org/wiki/File:Malic_acid2.png]
This is another naturally occurring acid found in grapes. Grapes found in cooler regions of the globe often have higher concentrations of Malic Acid, areas such as Rheingau in Germany are known for the higher concentration.
Ethyl Acetate
Ethyl Acetate[http://en.wikipedia.org/wiki/File:Ethyl_acetate2.svg]
8

Ethano
Alexander Purvis U64
Ethyl Acetate is formed in wine when due to the esterificationof ethanol and ethanoic acid and is the cause of the unpleasant smell of nail polish remover often found in wines.
Ethanol
[http://en.wikipedia.org/wiki/File:Ethanol2.svg]
This is a typical alcohol found in most wines, and is producedby the fermentation of wine during production.
Ethanoic Acid
[http://en.wikipedia.org/wiki/File:Acetic-acid-2D-flat.png]
This substance is not found in high concentrations when wine is first produced, and is found due to the oxidation of ethanol in the wine. When ethanoic acid is produced, it increases the concentration of H+ ions in the wine, therefore decreasing the pH giving it an acidic, often unpleasant taste.
Redox
This term refers to two different types of reaction
Oxidation
Reduction
Both of these reactions are determined by the movement of electrons in a reaction. For instance the oxidation of copper to copper (II) oxide can be shown as this:
Cu(s) + ½O2(g) --> Cu2+O2-(s)
As stated above, redox reactions are the movement of electrons, so if you look closer, this is made up of two half reactions:
9
Ethanoic

Alexander Purvis U64
Cu --> Cu2+ + 2e-
½O2 + 2e- --> O2-
In this case the copper has been oxidised and the oxygen has been reduced. This is worked out by the simple memo
OILRIG
OxygenIsLoss [of electrons]ReductionIsGain [of electrons]
In our experiment the reaction is the oxidation of ethanol to form ethanoic acid and water, here the ethanol is oxidised andthe oxygen is being reduced.
[Alexander Purvis 2012]
By using the memo from earlier you can see that the oxygen haslost an electron forming the ions, (loss of electrons is reduction) and the ethanol is gaining these electrons so as a result is being oxidised.
Acid Base
An acid base reaction is similar to redox reactions except instead of only electrons moving, in this case it is Hydrogen atoms/ions being transferred. In this case the substance donating the H+ is called an acid, and the substance receiving
10
+ H2O2[O]-

Alexander Purvis U64
the H+ ion is the base. This was first proposed by Brönsted Lowry and the proton donator is now called the Brönsted Acid and the proton receiver is the Brönsted Base.
Here is an example:
HCl(g) + NH3 (g) --> NH4+Cl-
(s)
In this case we can determine which is the acid and the base.
HCl(g) Cl- + H+
NH3 (g) + H+ NH4+
As shown here, the Chlorine atom is the proton (H+) donor, therefore the acid, and the Ammonia molecule is the proton (H+)receiver, therefore the base.
In my experiment this was the reaction occurring during the titration.
2NaOH(aq) 2Na+ +2OH-
C2H5OH + 2OH- C2H5COOH + H2O
Neutralisation
Neutralisation is adding or removing electrons from a substance in order to create no charge or ions. In the titration which is going to be conducted, I will be using the acid based theory to neutralise the acid in the wine, then usethe volume of alkali to determine the pH. In my case, Sodium Hydroxide (0.1M) will be used in the burette in order to titrate the wine sample. The final titre will be used to determine the overall pH of the wine sample.
Colorimetry
Colorimetry is an experimental method used to record the absorbance of specific frequencies of light (red, green, blue) in order to determine the concentration of coloured compounds within a solution.We see colours because when the electrons react, they are promoted and release specific frequencies of light, these will represent certain colours on the electromagnetic spectrum. If however the frequency is above or below visible light, it will appear colourless. In order to obtain the best results possible we set the colorimeter to detect the opposite colour that the sample will be,
11

Alexander Purvis U64
the complimentary colour, for instance our sample is green, so we measure the absorbance of red light.
The Beer Lambert Law states that the Absorbance is proportional to concentration. Therefore if we know absorbance of fixed concentrations of a substance in a solution, by drawing a calibration curve, we can use the absorbance of the unknown solutionto calculate the concentration of a known substance present. In thiscase, we draw a calibration curve of fixed ethanol contents, and extrapolate the concentration of ethanol in the wine samples by inputting their absorbance. (refer to calibration curve from experiment).
Absorption colorimeters, send a beam of light through the solution and record the percentage of light received at the other end. This allows the percentage of light absorbed to be calculated.
Strong and Weak Acids:
Brönsted Lowry Acids are described as H+ donors, this means that when in an aqueous solution, they will donate a proton to the water molecule to produce oxonium ions, H3O+. Acids strength is determined by the tendency for the acid to donate this proton.
Strong acids have a strong tendency to donate these ions, therefore the donation of H+ ions is a complete reaction.
HA(aq) H+(aq) + A-
(aq)
In weak acids though, the tendency to donate is smaller, so much so that the reaction is not completed, and remains in a state of equilibrium.
HA(aq) H+(aq) + A-
(aq)
The strength of the weak acids is determined by the stability of themolecule, the more stable it is, the weaker the acid, the stability is caused by delocalisation of electrons within the molecule. So when alcohols react this is the equation:
R-OH + H2O R-O- + H3O+
In this case the charge is concentrated solely on the O therefore itis very unstable, lacking delocalisation.
12

Alexander Purvis U64
[Alexander Purvis 2012]
Aims
The aim of this investigation is to research the effects of O2 concentration, UV radiation and temperature on the alcohol content and acidity of the wine.
In order to test for alcohol in the wines, I will use two methods:
Distillation of a sample and finding the density of distilled alcohol
Using colourimetry to measure the concentration of a dichromate ion therefore indicating the amount of alcohol present.
Tests I will use to test the acidity (Concentration of H+ Ions) of the wines are:
Titrating against 0.1moles of Sodium Hydroxide (NaOH) pH meter (therefore to calculate H+ concentration ph=-log10[H+])
Effect of O2 on the wines
In order to determine the effects of O2 on the wine’s alcohol concentration and acidity I am going to be bubbling air through the wine for a specific amount of time, i.e. 24 hours.
13
VeryUnstable,charge onlylocated on Oso ethanol is
More stable,some chargespread to
benzene ring sovery weak pH =
Even morestable,
charge spreadover COO socarboxylic

Alexander Purvis U64
Followed by a comparison between the O2 exposed samples and the originals using the methods above to compare the acidity and alcoholcontent. I will need to control the following whilst exposing my wine to O2
Temperature UV Exposure Wine Used
Wine Sample Sample
Original A
Exposed to O2 for 18 hours B
Exposed to O2 for 21 hours C
Exposed to O2 for 24 hours D
Effect of temperature change on the wines
To investigate the effect of temperature on the wine’s concentrationof alcohol and acidity I will use three different independent variables of temperature:
5oC (kept in fridge) 28oC (Room temperature) 60oC (water bath)
These samples will be left in these conditions for approximately 16 hours (overnight) before being tested for alcohol concentration and acidity.
Wine Sample Sample
Normal A
14

Alexander Purvis U64
5oC E28oC F60oC G
Effects of UV exposure to the wines
Exposing the wines to UV radiation will involve using once again three independent variables of UV intensity and exploring the effects this has on the wines. These are the independent variables:
Blacked out fume cupboard with UV lamp Windowsill Blacked out fume cupboard/in a cupboard
These will allow us to expose the wines to different amounts of the radiation. Even though these are still very rough amounts of light it should still show a difference in the alcohol concentration and acidity. They will each be left for approximately 8 hours from morning to evening.
Wine Sample Sample
Normal ADark HWindowsill IUV J
All these factors will be used in order to determine the ideal UV exposure (often provided by the colour and tint of the bottle), temperature in which the wine will be stored and the oxygen levels in the air on the bottle.
Methods
Overall Chemical List
15

Alexander Purvis U64
Chemical Molarity
Quantity/cm3
Sodium Hydroxide (NaOH)
0.5M 250
Phenolphthalein
20
Buffer pH 4 5Buffer pH 7 5Wine Sample 1500Ethanol (C2H5OH)
99% 10
Potassium Dichromate (K2Cr2O7)
0.1M 50
Distilled water
100
Silver Nitrate
0.1M 50
16

Alexander Purvis U64
(AgNO3)
Simple Methods
For Acid
Acid Base Titration:
Chemicals:
Acid (e.g. HCl) Alkali (e.g. NaOH) Phenolphthalein
Method:
1. Use a funnel and rinse a burette using the HCl which is going to be used before filling it just below the top. Open the valve for a moment to allow the HCl to run into the tip of the burette. Take an initial burette reading and record it to the nearest 0.05cm3
2. Rinse a clean 250cm3 beaker with the NaOH which is going to be used then fill it to 125cm3. Now use a pipette filler to rinse a 25cm3 pipette with the NaOH before filling the pipette to the mark making sure that the bottom of the meniscus is on the line.
3. Now run the NaOH from the pipette into a 250cm3 conical flask. When it is empty touch the tip of the pipette on the inside wall of the flask in order to get the last drop into the flask.
4. Add two or three drops of phenolphthalein into the NaOH but not too much as this can interfere with the results.
5. Place the NaOH under the burette and slowly run the hydrochloric acid from the burette into the conical flask, when the colour changes shut the valve and record the value
17

Alexander Purvis U64
from the burette. This is a trial so the result is not official and doesn’t have to be 100% accurate.
6. Repeat this experiment 3 times but this time by using the value from the trial run, slow down the flow of acid when itgets around 2cm3 away from the trial result and let it drip through until the colour changes, swirling it after every drop.
Equations:
This is an example of the neutralisation which will be occurring such that a hydrogen ions are being neutralised by the alkali (NaOH).
3OH-+H+H2O
Sample X Initial Volume/cm3 Final Volume/cm3 Titre/cm3
Test 1 50.0 35.8 14.2
Test 2 35.8 21.5 14.3
Test 3 21.5 7.3 14.2
Average Titre/cm3 14.2
Moles = (concentration x volume)/1000
Mol = (14.2 x 0.1) / 1000
Conc. H+ ions/moldm3 = (mol x 1000)/25
Conc. H+ ions/moldm3 = 0.0592 ions/moldm3
Basic set-up for a titration:
18
Acid
Alkaline solution and indicator
Burette
Stopcock

Alexander Purvis U64
[http://alliancechemistry.weebly.com/lab-4---master-of-titrations.html]
pH Meter:
Chemicals:
100cm3 distilled water Sample of the wine being tested. 5cm3 of a pH 4 buffering solution 5cm3 of a pH 7 buffering solution
Method:
1. To standardise the pH meter, place the electrodes in a pH7 solution (distilled water)
19

Alexander Purvis U64
2. Leave for around 30 seconds in order to allow the pH meter to stabilise, now adjust the meter to pH 7.
3. Place the electrodes in the pH 4 solution and leave for another 30 seconds. Now set the meter to pH 4.
4. Rinse the electrodes with distilled water and dry by shaking off the excess.
5. The pH meter is now calibrated so place the electrodes inyour wine sample.
6. Leave the electrodes in the chemical and stir with a stirring rod making sure to avoid contact between the electrodes and the stirring rod.
7. Once the meter has settled a result record this and leavethe electrodes in a pH 4 solution between results.
Sample pH1 2 3 Av
For Alcohol
Distillation:
Chemicals:
20

Alexander Purvis U64
Wine to be distilled
Method:
1. Set up the necessary apparatus (figure 1) and put the chemical into the pear shaped flask with a spatula of anti-bumping granules. Make sure that the bulb of the thermometer is in line with the entrance to the water jacket and that the pipe to the tap on the water jacket is closest to the ground.
2. Heat the mixture using the Bunsen burner until the chemical begins to boil, continue to heat until the temperature of the vapour is around 2oC below the collecting chemical’s boiling point (78oC).
3. Now place a beaker at the other end of the water jacket to collect the distilled liquid. At this point heat it less to ensure a rolling boil and that the chemical doesn’t boil over into the water jacket. If this happens you must restart the experiment.
4. Continue heating as above until no more liquid is being collected, this indicated the completion of the distillation.
21
Anti-Bumping Granules
Heat
Water out

Alexander Purvis U64
[OCR Chemical Ideas AS/A2 page368 figure 3]
Colourimetry
Chemicals:
50cm3 0.1mol Acidified Potassium Dichromate (K2Cr2O7) 100cm3 Chemical samples 250cm3 100% Ethanol CH3CH2OH (for calibration curve) 250cm3 distilled water
Equipment
Red Colour Filter Colourimeter
Method
1. Firstly you need to calibrate your colourimeter, to do this get a cuvette and fill it with distilled water.
2. Now place the cuvette in the colourimeter making sure that side of the cuvette which is clouded is facing away to the light allowing the light to flow through the clearsides.
3. Press calibrate, this means that the colourimeter now recognises what 0% absorbance is.
4. Get another cuvette and this time fill it with your sample, and once again place it in the colourimeter in the same way.
5. This time use the colourimeter to measure the absorbance and record it for each of your samples.
6. With your table of results compare these to that of a calibration curve, you can now calculate the amount of a chosen substance in your samples.
22

Alexander Purvis U64
Sample Absorbance/%
1 2 3 Av
Specific Methods
Acidity
Acid Base Titration:
(Assuming a Strong Acid)
2CH3CH2OH +2NaOH 2CH3CH2ONa + H2O
Chemicals:
250cm3 0.5M Sodium Hydroxide (NaOH) – Standard Solution [Alkali]
250cm3 Wine sample [Acid] Phenolphthalein
Equipment
Burette 250cm3 Conical Flask 100cm3 Beaker x2 Funnel 25ml Pipette Filler Distilled Water
Method:
1. Use the funnel to rinse the burette with the wine sample flushing out any impurities before closing the valve and adding a small amount.
23
Alexander Purvis U64
2. Open the valve briefly in order to fill the tip with the wine.When the tip is full, close the valve and fill the burette ideally about 1cm above the scale recording the number (nearest 0.05cm3).
3. Rinse a 100cm3 beaker with distilled water then with the SodiumHydroxide before filling it half way with Sodium Hydroxide.
4. Use the 25cm3 pipette filler to rinse the pipette, and then fill it with Sodium Hydroxide. Make sure the bottom of the meniscus is on the mark of the pipette stem.
5. When you have the Sodium Hydroxide in the pipette, carefully release it into a 250ml Conical Flask, once it is all out touch the end to release the last drops.
6. Add two or three drops of phenolphthalein into the Sodium Hydroxide, the more phenolphthalein is present the more inaccurate the results will be.
7. Slowly open the valve of the burette and allow the wine to flow into the conical flask below shaking the conical flask asit runs. When the colour of the alkali changes close the valveand write down the value on the burette taking account of the extra wine you had in at the start (called the titre).
8. This first test will be a trial as you may overshoot the wine,but this will still give you an approximate reading and allow you to know when to slow down when you approach the colour change.
9. Do this test 3 times, each time rinsing the equipment (not burette) with distilled water, rinse the burette with the wineas shown in step (1).
10. When doing the actual tests let the wine flow until you are around 2cm3 from the titre point, then slow down the flow and add the wine drop by drop shaking the mixture to check forcolour change.
11. Repeat the experiment around 3 times (more if outliers occur) and calculate an average to maintain concordance.
24

Alexander Purvis U64
Sample Initial Volume/cm3
Final Volume/cm3
Titre/cm3 Average Titre/cm3
Equations:
This is the equation which will be used to calculate the concentration of the alkali added which will be used to calculate H+
ions followed by the
Concentration (mol dm-3) = ( Mass (ml dm-3) ÷ Molar Mass (ml mol-
1) )
[http://alliancechemistry.weebly.com/lab-4---master-of-titrations.html]
pH Meter:
Chemicals:
100cm3 distilled water 100cm3 wine 50cm3 pH 4 buffering solution 50cm3 ph 7 buffering solution
Equipment:
pH meter 250ml beaker Stirring rod
25
Acid
Alkaline solution and indicator
Burette
Stopcock

Alexander Purvis U64
Method:
1. Standardise the pH meter by placing the electrodes in a pH 7solution (distilled water).
2. Leave the electrode in the water for about 30 seconds to allowthe pH meter to stabilise before adjusting the meter to pH 7.
3. Now place it in a pH 4 solution for another 30 seconds and setit to pH 4, the pH meter is now calibrated.
4. Rinse the electrode with distilled water and dry by shakingoff excess water.
5. Place the electrodes in 25cm3 of wine.
6. Leave the electrodes in the wine and stir with a stirring rodmaking sure to avoid contact with the electrode.
7. Once the pH meter has settled a result, record it.
8. Between measurements leave the electrodes in a pH4 solution.
Sample pH1 2 3 Av
Equations:
Ph=-log10[H+]
Ka= [(H+)(A-)] ÷ [HA]
Alcohol
Colourimetry
Chemicals:
50cm3 0.1molAcidified Potassium Dichromate (K2Cr2O7) 20cm3 0.1mol Silver Nitrate (Ag3NO3)
26

Alexander Purvis U64
100cm3 Wine samples 250cm3 100% Ethanol/CH3CH2OH (for calibration curve) 250cm3 distilled water
Method
1. Firstly you need to create a calibration curve; this is what you are going to be comparing your results to in order to identify the specific acidity of the sample.
2. To create the curve use the ethanol and distilled water to create different percentage ethanol solutions (2%, 4%,6%, 8%....12%).
3. Now get a clean cuvette and fill it with distilled water,this is going to be used to calibrate the colourimeter. Turn on the colourimeter and place the cuvette of water in the slot making sure the clear sides are where the light is going to pass through, and press calibrate. The colourimeter will shine light through the water and set this absorbance value as 100% absorbance. You can now useit for tests.
4. Make sure that the colorimeter is set to the red filter,
and get each ethanol solution and place them into cuvettes, now you need to use the colourimeter to find a value of absorbance and record each in a table of Absorbance and percentage ethanol. After each test use the distilled water to set it back to 100%.
5. Once you have all the results pot a calibration curve of the results, this is what you will be comparing the results to.
6. Once again use a cuvette of distilled water to set the colourimeter but this time you are going to be using the samples of wine taken from the tests, this might be the three test of temperature, and onenormal sample of the wine from thebottle, and you find the absorptionof each from the colourimeter.
7. Record these results on a table ofthe independent variable againstabsorbance and like before, use the
27

Alexander Purvis U64
absorbance level from the table on the graph and find thepercentage of ethanol in the wine.
Extra information: Like in infra-red spectroscopy, in colourimetrywe look at the absorbance so the scale starts at 100%. We record thedrop from 100% so how much (in this case) light is being absorbed bythe substance. This is why we use distilled water as a standardbecause it is virtually 100% transparent therefore absorbing ~0% oflight.
Calibration Curve samplesEthanolContent/%
Volume ofwater/cm3
Volume ofethanol/cm3
TotalVolume/cm3
2.00 19.60 0.40 20.004.00 19.20 0.80 20.006.00 18.80 1.20 20.008.00 18.40 1.60 20.0010.00 18.00 2.00 20.0012.00 17.60 2.40 20.00
28

Alexander Purvis U64
Distillation
Chemicals:
50cm3 Sample of wine
Equipment:
Anti-Bumping Granules Pear shaped flask Water jacket 250ml Beaker Thermometer Heat source (Bunsen Burner) White tile
Method:
1. Set up the apparatus on the next page, making sure thethermometer is directly next to the water jacket entrance, andensuring the water jacket is fixed the correct way.
2. Put the wine sample in the pear shaped flask with the bumpinggranules.
29

Alexander Purvis U64
3. Gradually heat the pear shaped flask using the Bunsen burneruntil the temperature reaches 79oC (Boiling point of Ethanol)
4. When it reaches this temperature keep it at this level so thealcohol is distilled off into the 250ml beaker at the bottomof the water jacket.
5. Keep heating until no more alcohol is being distilled.
6. At this point you will be able to use the molecular masses ofboth to identify the concentration of alcohol which wasoriginally present in the wine.
Equations:
By volume: (Volume of alcohol distilled ÷ Volume of original winesample) x 100
By Mole Mole= Mass ÷ RFM
So: Mole= Volume of alcohol from distillation/46(RFM of ethanol)
Distillation Diagram
[OCR Chemical Ideas AS/A2 page368 figure 3]
30
Water in
Anti-Bumping Granules
Heat
Condenser

Alexander Purvis U64
For each of these experiments use the data from each sample from thedifferent variables of the tests to create a graph.
Risk Assessment
Chemicals:
Chemical Conc Hazard Risk Action PreventionSilver Nitrate (Ag3NO3)
0.1M Corrosive
Danger for the Environment
Get in eyes
Wash out with lots of water
Wear safety goggles
Spill on skin
Wash with water
Wear latexgloves
Swallow Drink lotsof waterGet to Hospital
Do not putin mouth
31

Alexander Purvis U64
Sodium Hydroxide (aq) (NaOH)
0.5M Corrosive Get in eyes
Wash out with water
Wear safety goggles
Spill on skin
Wash with water
Wear latexglovesKeep in fume cupboardUse pipette totransfer
Swallow Drink large amounts ofwater.Get to Hospital.
Do not putin mouth
Phenolphthalein (aq)
None Get in eyes
Wash with water
Wear safety goggles
Spill on skin
Wash with water
Wear latexgloves
Swallow Drink large amounts ofwater
Do not putin mouth
Distilled Water
None Get in eyes
Wash out with water
Wear goggles
Spill on skin
- -
Swallow - -Ethanol(aq)(C2H5OH)
99% Highly Flammable
Get in eyes
Wash out with water
Wear goggles
Spill on skin
Wash with water
Swallow Drink copious amounts ofwater
32

Alexander Purvis U64
Get to hospital
Potassium Dichromate (aq) (K2Cr2O7)
0.1M OxidantHighly Toxic
Harmful
Corrosive
Dangerous forthe Environment
Get in eyes
Wash out with lots of water for at least 15 minutesGet to Hospital
Wear safety gogglesKeep in Fume cupboard
Spill on skin
Wash with lots of waterGet to Hospital
Wear latexglovesKeep in Fume cupboardTransfer using pipette
Swallow Drink copious amounts ofwaterDo not induce vomitingGet to Hospital
Do not putin mouth
Inhale Go outsidefor fresh air
Keep in fume cupboard
Overall you should stick to typical lab rules in order to stay safe.For example
Keep safety Glasses on
No Running
Do not eat or drink in the lab
Do not ingest ANY chemicals
Be careful when handling glassware
33

Alexander Purvis U64
Equipment
Equipment Name
Risk Action Prevention
Burette Could drop and smash resulting incuts
If glass is lodgedin the patient getto hospitalIf small cuts are sustained clean and add plaster/bandage
Take care when handling
Conical Flask
Could drop and smash resulting incuts
If glass is lodgedin the patient getto hospitalIf small cuts are sustained clean and add plaster/bandage
Take care when handling
Could spill chemical from Flask
Refer to specific chemical risk assessment actions
Carry slowly
Beaker Could drop and smash resulting incuts
If glass is lodgedin the patient getto hospitalIf small cuts are sustained clean and add plaster/bandage
Take care when handling
Could spill chemical from beaker
Refer to specific chemical risk assessment actions
Carry slowly
Pipette Filler
Could jam pipette in too hard smashing it
If glass is lodgedin the patient getto hospitalIf small cuts are sustained clean and add plaster/bandage
Take care when using
Pipette Could drop and If glass is lodged Take care when
34

Alexander Purvis U64
smash in the patient getto hospitalIf small cuts are sustained clean and add plaster/bandage
handling
Pear shaped flask
Could tighten clamps too much smashing neck
Could drop and smash
If glass is lodgedin the patient getto hospitalIf small cuts are sustained clean and add plaster/bandageIf burned, put damaged area undertap for 15 minutes
Take care when clampingUse wet flannelor tongs to move hot apparatus
Could burn when removing after experiment
Water Jacket
Could tighten clamps too much smashing neck
If glass is lodgedin the patient getto hospitalIf small cuts are sustained clean and add plaster/bandage
Take care when clamping
Could drop and smash
Thermometer
Could drop and smash
If glass is lodgedin the patient getto hospitalIf small cuts are sustained clean and add plaster/bandage
Take care when handling
Bunsen Burner
Could Spill hot liquids
Apply cold water for at least 15 minutesRefer to specific chemical risk assessment actions
Wear safety goggles and latex gloves
Could burn skin Apply cold water for at least 15 minutes
Take care when using
Stirring Rod
Could drop and smash
If glass is lodgedin the patient getto hospitalIf small cuts are sustained clean and add
Take care when handling
35

Alexander Purvis U64
plaster/bandage
Preliminary Setup
O2 Exposed tests:
Exposed samples for 16 hours
Normal (0 hours)
12 hours 18 hours 24 hours
Sample ID A B C D
During these tests the controls which are to be maintained are:
36

Alexander Purvis U64
Volume of wine Rate of Oxygen being pumped Same sized beakers Same temperature Same exposure to UV light
Temperature change tests:
Temperature change samples for 24 hours
Normal 5oC (Fridge) 28oC (Windowsill)*
60oC (Water bath)
Sample ID A E F G
*Assuming the temperature remains constant throughout.
During these tests the controls which are to be maintained are:
Volume of wine Same sized beakers
UV exposure tests
UV exposure samples for 8 hours
Normal Blacked out fume cupboard
Windowsill UV light in fume cupboard
Sample ID A H I J
During these tests the controls which are to be maintained are:
Volume of wine Same sized beaker Same temperature O2 Exposure
Analysis
Titration
37

Alexander Purvis U64
Titration to investigate Acidity of wine samples:
Equations:
Moles=(concentration x volume) / 1000
e.g. mol = (14.8 x 0.1)/1000
conc. H+ ions/moldm3= (mol x 1000)/25
conc. H+ ions/moldm3 = 0.0592
For Sample A
Normal
Initial Volume/cm3
Final Volume/cm3
Titre cm3 Conc. of H+ ions/moldm3
Rough
Test 0.00 14.90 14.90 0.0596
Neat 1 14.90 29.70 14.80 0.0592
2 29.70 44.60 14.90 0.0596
3 00.60 14.80 14.80 0.0592
Average 14.80 0.0592
38

Alexander Purvis U64
For Sample B
18 Hour O2 Exposure
Initial Volume/cm3
Final Volume/cm3
Titre cm3 Conc. of H+ Ions/moldm3
Test 01.30 16.10 14.80 0.0592
1 0.00 15.00 15.00 0.0600
2 15.00 30.10 15.10 0.0604
3 30.10 45.10 15.00 0.0600
Average 15.00 0.0600
For Sample C
21 Hours O2 Exposure
Initial Volume/cm3
Final Volume/cm3
Titre cm3 Conc. of H+ ions/moldm3
Test 0.00 15.00 15.00 0.0600
1 15.0 29.90 14.90 0.0596
2 29.90 44.80 14.90 0.0596
3 0.00 14.80 14.80 0.0592
Average 14.90 0.0596
For Sample D
24 Hours O2 Exposure
Initial Volume/cm3
Final Volume/cm3
Titre cm3 Conc. of H+ ions/moldm3
Test 0.00 15.00 15.00 0.0600
1 15.00 30.00 15.00 0.0600
2 15.00 29.90 14.90 0.0596
3 0.00 14.90 14.90 0.0596
Average 14.90 0.0596
*Tests are not used to calculate averages
39

Alexander Purvis U64
These results show that overall oxygen exposure is accountable for very little change in pH, the 18 hour exposure and 24 hour exposure only change from 0.0600 to 0.0596 (0.8% ) leading me to believe thisis an anomalous experiment as this does not show a link predicted bythe theory.
According to the theory, it is theoretically impossible for the concentration of H+ ions to have decreased. This is because when theethanol in the sample is exposed to oxygen in the air, it produces ethanoic acid, increasing the concentration of H+ ions, therefore decreasing the pH. These results indicate therefore that ethanoic acid must be reacting to produce ethanol, decreasing this concentration. The results should have shown a gradual increase in concentration of H+ ions.
Oxidation of Ethanol through reflux in the beaker producing EthanoicAcid
[Alexander Purvis 2012]
For Sample E
5OC for 24 Hours
Initial Volume/cm3
Final Volume/cm3
Titre cm3 Conc. of H+ ions/moldm3
Test 0.00 14.50 14.50 0.0580
1 14.50 29.00 14.50 0.0580
2 29.10 43.40 14.40 0.0576
3 0.00 14.40 14.40 0.0576
Average 14.50 0.0580
For Sample F
25OC for 24 Hours
40
2[O]- →Reflux
+ H2O

Alexander Purvis U64
Initial Volume/cm3
Final Volume/cm3
Titre cm3 Conc. of H3
ions/moldm3
Test 14.70 29.00 14.30 0.0572
1 29.00 43.40 14.40 0.0576
2 0.00 14.50 14.50 0.0580
3 14.50 28.90 14.40 0.0576
Average 14.40 0.0576
For Sample G
60OC for 24 Hours
Initial Volume/cm3
Final Volume/cm3
Titre cm3 Conc. of H+ ions/moldm3
Test 0.00 14.30 14.30 0.0572
1 14.30 Anomaly: 32.40
Repeat: 28.10
13.80 0.0552
2 28.10 42.00 13.90 0.0556
3 42.00 55.90 13.90 0.0556
Average 13.90 0.0556
*Tests are not used to calculate averages
This set of results is showing us that over increasing temperature, the concentration of H+ ions is decreasing, (from 0.0580M at 5oC to 0.0556M at 60oC) therefore the pH is rising. This proves that this test is most likely inaccurate. This is because according to the collision theory, when the ethanol in the wine is exposed to the oxygen in the air, it oxidises to produce ethanoic acid. As a result, this should increase the concentration of H+ ions, thereforedecreasing the pH. These tables show a decrease in concentration of H+ ions which would indicate a loss of ethanoic acid making the solution more alkali.
41
2[O]- →Reflux
+ H2O

Alexander Purvis U64
[Alexander Purvis 2012]
For Sample H
Blacked out Fume Cupboard for 24 Hours
Initial Volume/cm3
Final Volume/cm3
Titre cm3 Conc. of H+ ions/moldm3
Test 0.00 14.50 14.50 0.0580
1 14.50 28.90 14.40 0.0576
2 28.90 43.30 14.40 0.0576
3 0.00 14.30 14.30 0.0572
Average 14.40 0.0576
For Sample I
Windowsill for 24 Hours
Initial Volume/cm3
Final Volume/cm3
Titre cm3 Conc. of H+ ions/moldm3
Test 0.00 17.90 17.90 0.0716
1 17.90 35.40 17.50 0.0700
2 0.00 17.40 17.40 0.0696
42

Alexander Purvis U64
3 17.40 34.90 17.50 0.0700
Average 17.50 0.0700
For Sample J
Under UV lamp for 24 Hours
Initial Volume/cm3
Final Volume/cm3
Titre cm3 Conc. of H+ ions/moldm3
Test 0.00 22.10 22.10 0.0884
1 22.10 44.70 22.40 0.0896
2 0.00 22.50 22.50 0.0900
3 25.50 48.00 22.50 0.0900
Average 22.50 0.0900
*Tests are not used to calculate averages
The tables show us that as the UV intensity emitted upon the sampleshas increased, the concentration of H+ ions increases strongly from 0.0576M to 0.0900M. This increase is due to the ethanol being oxidised to ethanoic acid from the surrounding air. Certain frequencies of UV light cause light strike reactions, where the light gives the reaction energy. So according to the collision theory, the more energy the particles in the sample have, the more chance of a successful collision with the activation needed, therefore increasing the rate of ethanoic acid produced. By referring to this graph, we can explain the larger gap between the 25oC sample and the 60oC sample than the 5oC sample and the 25oC sample. This is because the activation energy for the reaction to occur may lie between 25 and 60oC therefore once the temperature exceeds this, then the rate will rapidly increase.
43

Alexander Purvis U64
[http://revisionworld.co.uk/a2-level-level-revision/chemistry/energy-changes/maxwell-boltzmann-distribution]
This is an example of the neutralisation which will be occurring such that a hydrogen ions are being neutralised by the alkali (NaOH):
OH-+H+ H2O
Oxidation Reaction taking place:
pH Meter
A pH meter was used to calculate the pH of each sample using electrodes in the liquid in order to determine the ideal storage temperature, O2 exposure and exposed UV intensity for maintaining the quality of wine.
The equation used to calculate the concentration of Ethanoic Acid was
To calculate H+ ions:
44
2[O]- →Reflux
+ H2O

Alexander Purvis U64
pH=-log10[H+]
10-pH
e.g. 3.11=-log10[H+]
10-3.11 = 7.76x10⁻⁴
To calculate concentration of Ethanoic Acid/moldm3 (ethanoic acid isweak acid):
[HA] = ([H][A]) / Ka) Ka=1.8x10⁻⁵
e.g. 1.8x10-5 = ([7.76x10⁻⁴][7.76x10⁻⁴])/[HA]
[HA]=(7.76x10⁻⁴)2/1.8x10-5
pH Meter reading for Wine samples.
Normal
SampleID
pH H+ Ions
pH=-log10[H+]
Concentration of Ethanoic Acid/moldm31 2 3 Averag
e
A 3.14 3.10 3.10 3.11 7.76x10⁻⁴ 3.34x10⁻²
O2 Exposure:
18 Hours 21 Hours 24 Hours
45
Alexander Purvis U64
SampleID
pH H+ Ions
pH=-log10[H+]
Concentration of Ethanoic Acid/moldm31 2 3 Averag
e
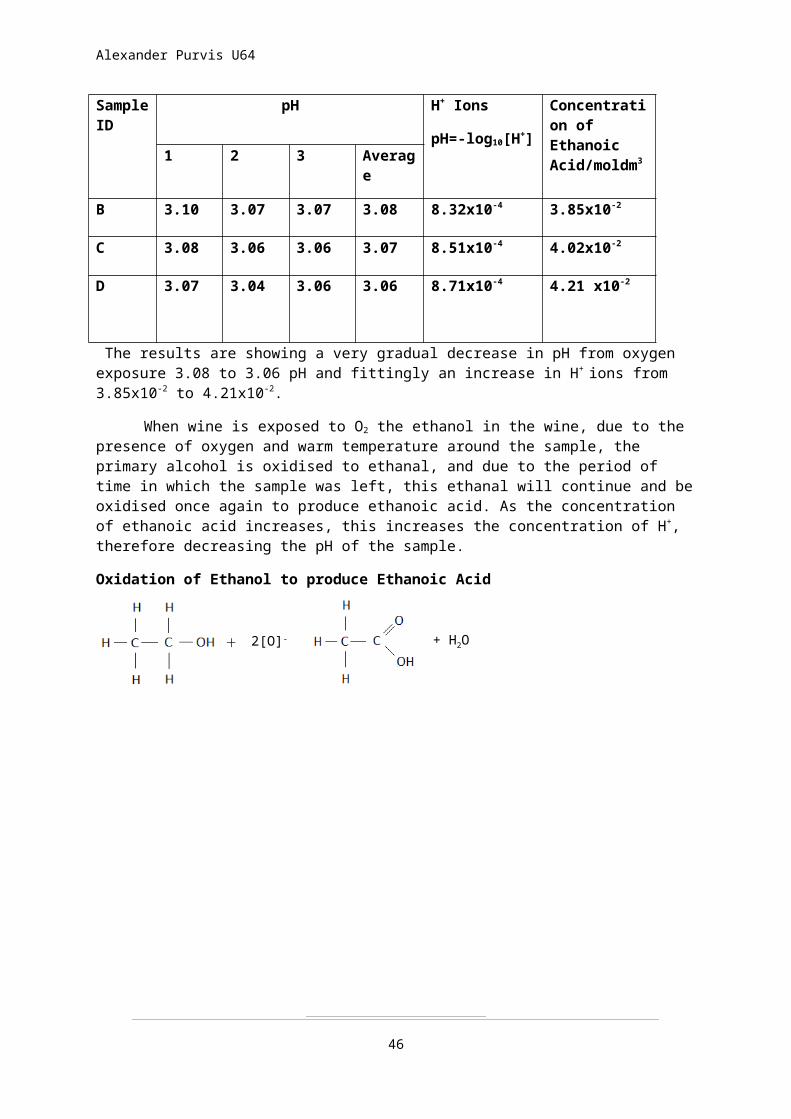
B 3.10 3.07 3.07 3.08 8.32x10⁻⁴ 3.85x10⁻²
C 3.08 3.06 3.06 3.07 8.51x10⁻⁴ 4.02x10⁻²
D 3.07 3.04 3.06 3.06 8.71x10⁻⁴ 4.21 x10⁻²
The results are showing a very gradual decrease in pH from oxygen exposure 3.08 to 3.06 pH and fittingly an increase in H+ ions from 3.85x10⁻² to 4.21x10⁻².
When wine is exposed to O2 the ethanol in the wine, due to the presence of oxygen and warm temperature around the sample, the primary alcohol is oxidised to ethanal, and due to the period of time in which the sample was left, this ethanal will continue and beoxidised once again to produce ethanoic acid. As the concentration of ethanoic acid increases, this increases the concentration of H+, therefore decreasing the pH of the sample.
Oxidation of Ethanol to produce Ethanoic Acid
46
+ H2O2[O]-
Alexander Purvis U64
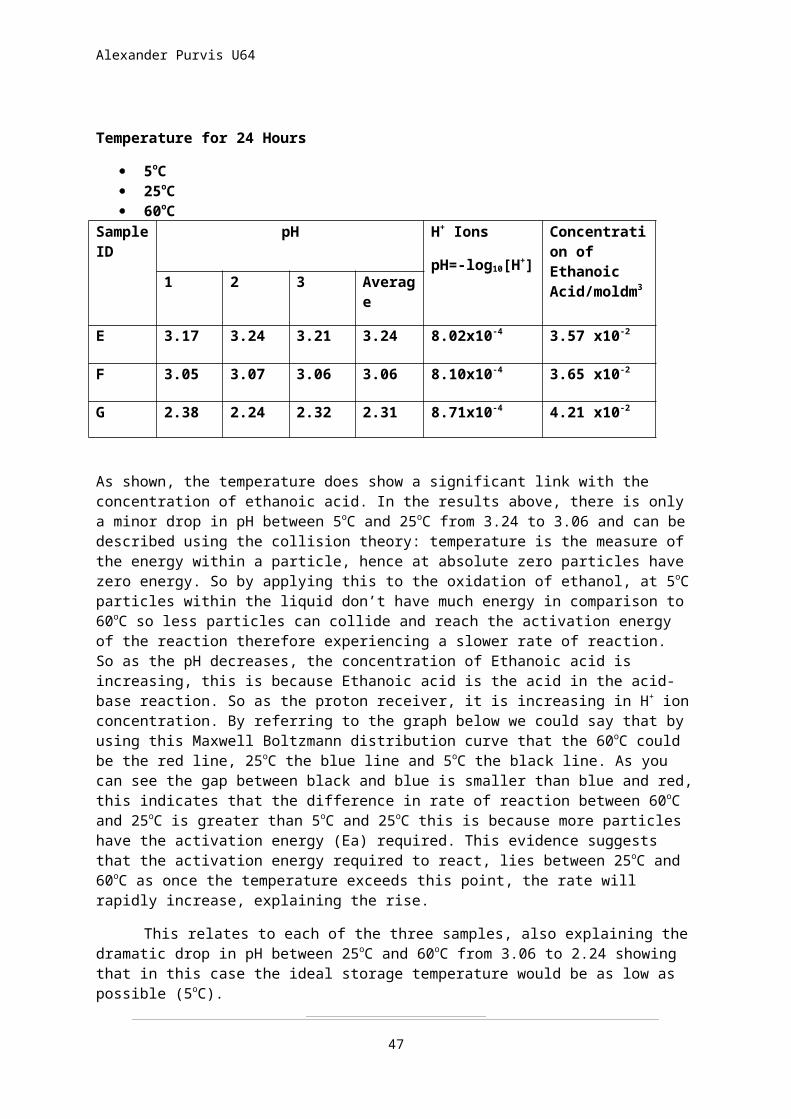
Temperature for 24 Hours
5oC 25oC 60oC
SampleID
pH H+ Ions
pH=-log10[H+]
Concentration of Ethanoic Acid/moldm31 2 3 Averag
e
E 3.17 3.24 3.21 3.24 8.02x10⁻⁴ 3.57 x10⁻²
F 3.05 3.07 3.06 3.06 8.10x10⁻⁴ 3.65 x10⁻²
G 2.38 2.24 2.32 2.31 8.71x10⁻⁴ 4.21 x10⁻²
As shown, the temperature does show a significant link with the concentration of ethanoic acid. In the results above, there is only a minor drop in pH between 5oC and 25oC from 3.24 to 3.06 and can be described using the collision theory: temperature is the measure of the energy within a particle, hence at absolute zero particles have zero energy. So by applying this to the oxidation of ethanol, at 5oCparticles within the liquid don’t have much energy in comparison to 60oC so less particles can collide and reach the activation energy of the reaction therefore experiencing a slower rate of reaction. So as the pH decreases, the concentration of Ethanoic acid is increasing, this is because Ethanoic acid is the acid in the acid-base reaction. So as the proton receiver, it is increasing in H+ ionconcentration. By referring to the graph below we could say that by using this Maxwell Boltzmann distribution curve that the 60oC could be the red line, 25oC the blue line and 5oC the black line. As you can see the gap between black and blue is smaller than blue and red,this indicates that the difference in rate of reaction between 60oC and 25oC is greater than 5oC and 25oC this is because more particles have the activation energy (Ea) required. This evidence suggests that the activation energy required to react, lies between 25oC and 60oC as once the temperature exceeds this point, the rate will rapidly increase, explaining the rise.
This relates to each of the three samples, also explaining thedramatic drop in pH between 25oC and 60oC from 3.06 to 2.24 showing that in this case the ideal storage temperature would be as low as possible (5oC).
47

Alexander Purvis U64
[http://revisionworld.co.uk/a2-level-level-revision/chemistry/energy-changes/maxwell-boltzmann-distribution]
UV Exposure for 24 Hours
Blacked out Fume Cupboard Windowsill Under UV Lamp
48

Alexander Purvis U64
SampleID
pH H+ Ions
pH=-log10[H+]
Concentration of Ethanoic Acid/moldm31 2 3 Averag
e
H 3.04 3.28 3.19 3.17 7.81 x10⁻⁴ 3.39x10⁻²
I 3.09 3.10 3.08 3.09 8.13x10⁻⁴ 3.37x10⁻²
J 3.06 3.07 3.08 3.07 8.51x10⁻⁴ 4.02x10⁻²
The results here indicate that UV doesn't have a huge effect on the concentration of Ethanoic acid (only 0.68x10⁻² difference from H to J) produced by oxidation of Ethanol, decreasing the pH from 3.17 to 3.07. Nevertheless a reaction does occur and is accelerated by high intensity of UV radiation. UV induced reactions are called light strike reactions and occur when photons of a certain frequency give reactions energy. This means that more particles in the sample will have the activation required to react, therefore there will be a higher rate of reaction producing more ethanoic acid and therefore higher concentration of H+ ions so a lower pH.
This all tells us that it is best to use wine boxes or tinted glass when storing wine to keep it in its original condition (in terms of [H]+ concentration) as it reduces the oxidation reaction maintaining its taste. For instance the amber colour of wine bottleswill absorb UV light, therefore more readily preserving the wine.
49

Alexander Purvis U64
Distillation
Each wine sample was tested for its mass of ethanol by distilling the ethanol out of the wine through heating the sample for 10 minutes. These results are used in order to calculate the ideal storage conditions of white wine.
Equations:
Moles=Mass/RFM
e.g. Moles of Ethanol=16.86/48
=0.366M
NormalSample ID Original
mass/gMass of Ethanol
(C2H5OH)/gMoles ofEthanol/M
A 48.41 16.84 0.366
O2 Exposure:
18 Hours 21 Hours 24 Hours
Sample ID Original mass/g Mass of Ethanol(C2H5OH)/g
Moles ofEthanol/M
B 48.41 16.70 0.363
C 48.41 16.65 0.362
D 48.41 16.20 0.352
50

Alexander Purvis U64
These results show us that the overall mass of ethanol in the wine gradually decreases over time when exposed to oxygen from 0.366M of ethanol to 0.352M. This is only a small decrease of ethanol but onceagain it could be due to the oxidising to produce ethanoic acid. Ifthe samples are in fact not oxidising with the oxygen, it may be theother gases in the air which it is exposed to, which are reacting, and using up the ethanol. Additionally due to the temperature of thesamples being around room temperature, this may not give the particles sufficient activation energy to react therefore the reaction is slow enough that a 6 hour difference does not show significant change. This loss of ethanol may even be just due to evaporation of the ethanol and the particles mightn't have been ableto acquire enough energy to oxidise in the first place.
*standard conditions= 1atm, 298K, standard state.
Temperature for 24 Hours
5oC 25oC 60oC
Sample ID Original mass/g Mass of Ethanol(C2H5OH)/g
Moles ofEthanol/M
E 48.41 16.31 0.355
F 48.41 15.90 0.346
G 48.41 14.32 0.311
As shown, as the temperature increases, the moles of ethanol decreases from 0.355M to 0.311M, more of a significant difference than when exposed to oxygen. When the temperature increases, the particles in the liquid gain energy, making it more likely to reach the activation energy of the reaction. Once again this can be linkedwith the Max Boltzmann distribution graph and we can say that the difference between the number of particles beyond the activation energy at 60oC and 25oC is smaller than between 5oC and 25oC explaining the large drop from 0.346M to 0.311M. This may be because
51
[O]- →
+ H2O

Alexander Purvis U64
the activation energy required for the particles to react, is between 25oC and 60oC, therefore once the particles go beyond this temperature, many more can react, therefore accelerating the rate ofreaction.
[http://revisionworld.co.uk/a2-level-level-revision/chemistry/energy-changes/maxwell-boltzmann-distribution]
UV Exposure for 24 Hours
Blacked out Fume Cupboard Windowsill Under UV Lamp
Sample ID Original mass/g Mass of Ethanol(C2H5OH)/g
Moles ofEthanol/M
H 48.41 10.96 0.238
I 48.41 11.72 0.255
J 48.41 12.93 0.281
Mass of Conical Flask = 53.68g
Mass of Round-bottomed Flask = 69.45g
These results indicate that the ethanol content of the sample has increased from 0.238M to 0.281M. Indicating that ethanol has been produced as a result of UV exposure.
When reactions are exposed to UV light, certain frequencies can cause light strike reactions, this is when specific frequencies giveenergy into the reaction therefore more particles are likely to reach the activation energy require. In this reaction it is
52

Alexander Purvis U64
impossible for more ethanol to be produced which makes me suspect that this set of results is an anomaly as the UV light aids the oxidation of ethanol to ethanoic acid, which would as a result decrease the amount of ethanol in the sample. Even though these are showing a difference, as stated in the theory, a greater difference was predicted.
Oxidation of Ethanol with UV light struck reactions.
Colorimetry
In order to determine the ethanol content of the wine I used colourimetry to compare the absorbance of the samples against a calibration curve of standard ethanol solutions, extrapolating the result. When Potassium Dichromate is added to Ethanol (Silver Nitrate Catalysed reaction) the colour changes from orange to green,so we measured the absorption using the colorimeter, the more ethanol, the higher the absorbance.
Calibration Curve
Water (H2O) Content/cm3
Ethanol (C2H5OH) Content/cm3
Total Volume/cm3
Percentage Ethanol/%
Absorption/%
100 0 100 0 0.000
98 2 100 2 0.200
96 4 100 4 0.372
53
+ H2O2[O]- UV

Alexander Purvis U64
94 6 100 6 0.646
92 8 100 8 0.697
90 10 100 10 0.910
88 12 100 12 1.060
86 14 100 14 1.166
Results
Normal
Sample ID Absorption Ethanol content/%
1 2 3 Average
A 0.890 0.862 0.876 0.876 9.50
O2 Exposure
18 Hours
54

+ H2O2[O]- 2[O]-
Alexander Purvis U64
21 Hours 24 Hours
Sample ID Absorption Ethanol content/%
1 2 3 Average
B 0.839 0.840 0.862 0.845 9.35
C 0.822 0.851 0.862 0.847 9.37
D 0.841 0.812 0.879 0.844 9.34
These results show us a drop in ethanol content from 9.50% to 9.34% indicating that oxygen is used to react with ethanol, in this case to produce ethanoic acid. Over time the primary alcohol ethanol oxidises with the oxygen in the air around the sample to produce Ethanal, but due to the time in which it was left, the Ethanal then oxidises to produce ethanoic acid therefore decreasing the content of ethanol in the sample.
As stated by the Beer Lambert law, Absorbance of the sample is also proportional to the concentration (in this case of ethanol) in the solution. Therefore the absorbance of the solution should decrease at the same rate as the ethanol concentration.
Absorbance = -log10(Io/I) = ε x (molar absorptivity) xl(length of solution/cm) x c (conc/moldm-3)
Absorbance ∝ Concentration of solution (Ethanol/Wine sample)
[Alexander Purvis 2012]
Temperature for 24 Hours
5oC 25oC 60oC
55

Alexander Purvis U64
Sample ID Absorption Ethanol content/%
1 2 3 Average
E 0.846 0.862 0.836 0.848 9.35
F 0.817 Anomaly
0.715
Repeat
0.851
0.864 0.844 9.34
G 0.856 0.842 0.822 0.840 9.20
Here the ethanol content has dropped from 9.50 (sample A) to 9.20 (sample G). This decrease is due to the ethanol present in the sample, oxidising with the air producing ethanoic acid. The rapid drop between A and E (0.15) is most likely an anomaly as the temperature in this case was reduced to 5oC therefore due to the collision theory, the rate of reaction should have decreased. The large drop between F and G (0.14) on the other hand may have been caused by the activation energy of the reaction being present between 28oC and 60oC. By referring to the graph, if the red line represents 60oC, blue, 25oC and black 5oC we can see that the 60oC sample has the most particles with enough activation energy to react, and the gap between the red and blue line is greater than between the blue and black line. This larger gap tells us that the energy of the particles at 60oC are more likely to have the activation energy required, therefore if the sample is at 60oC the rate of reaction will rapidly increase.
56

Alexander Purvis U64
[http://revisionworld.co.uk/a2-level-level-revision/chemistry/energy-changes/maxwell-boltzmann-distribution]
UV Exposure for 24 Hours:
Blacked out Fume Cupboard Windowsill Under UV lamp
Sample ID Absorption Ethanol content/%
1 2 3 Average
H 0.883 0.916 0.901 0.900 10.00
I 0.894 0.914 0.892 0.900 10.00
J 0.957 0.969 0.981 0.969 10.70
These results show a large increase in ethanol content from 9.50% to10.70%, according to the theory, this is impossible as ethanol is used up in this reaction being oxidised to ethanoic acid, and is notproduced, therefore the ethanol content can only go down.
57

Alexander Purvis U64
Conclusion
By referring to the aims produced at the start of the project, and the results produced through experimental means, I can now deduce the ideal storage conditions for white wine.
From the Analysis you can see that Ultra Violet light from thesun and other sources, can aid the oxidation of ethanol in the wine using light strike reactions, this causes the H+ ion concentration to increase, decreasing the pH and as a result giving an unpleasant taste and smell indicating that the oppositeshould be used in order to counteract this event. Therefore by referring to the graph on page 5, you can see that in order to reduce the UV exposure to the wine, an amber tinted bottle shouldbe used, or the wine should be stored in boxes or dark rooms, such as a cellar.
Temperature has a great impact on the concentration of alcohol(ethanol) and the pH of the wine. Once again this is due to the oxidation of the ethanol with the surrounding oxygen. As explained above, this causes an increase in H+ ions from the ethanoic acid, and therefore decreases the pH making it more acidic and giving an unpleasant taste and odour. With the collision theory telling us that the rate of reaction is reduced with lower temperatures, it is then recommended that the wine should be stored in lower temperatures, i.e. 5oC (fridge temperature) in order to slow the oxidation of Ethanol.
Once again the conclusion is related to the production of ethanoic acid through oxidation of ethanol. If the wine is exposed to more oxygen, this allows more molecules of ethanol to oxidise, therefore increasing the potential concentration of ethanoic acid, which as a result increases the concentration of H+
ions, so decreasing the pH, which as explained, produces an unpleasant odour and taste. For this reaction, the wine should bekept sealed as much as possible to reduce the oxidation.
58

Alexander Purvis U64
Evaluation
Titration
In obtaining the results, I managed to complete each experiment within the designated time, obtaining all the results. Of these results they all fitted the theory predicted which explained that when the ethanol was exposed to oxygen in each sample, this reacted and produced Ethanoic acid. As a result H+ ions are produced, decreasing the pH. Additionally no equipment was broken and no spillages were recorded.
On the other hand one whole set of results came out to be anomalous as the result was theoretically impossible in the circumstances. Furthermore the method was altered for the experimentas the specific method indicates that the sodium hydroxide is being titrated against the wine but in fact it is the other way round so in the actual experiment the wine was pipetted into a beaker and thesodium hydroxide was slowly added by the burette. Additionally more inaccuracies occurred because one or two more drops of sodium hydroxide may have been added to the sample once the colour had changed due to the difficulty in judging the change.
Error:
59

Alexander Purvis U64
The burette has an accuracy of ±0.05cm3 therefore as the titre is being read from the burette at the start and at the end, this means the absolute uncertainty should be doubled to ±0.1.
Equipment Absolute Uncertainty
Burette ±0.1Pipette ±0.1
e.g. 14.01cm3 titre
Burette (0.2/14.01) x 100 = 1.43%
Pipette 0.1/25 = 0.4%
Burette
Sample Average Titre/cm3 Absolute Uncertainty/cm3
Percentage Uncertainty/%
A 14.80 0.2 1.35
B 15.00 0.2 1.33
C 14.90 0.2 1.34
D 14.90 0.2 1.34
E 14.50 0.2 1.38
F 14.40 0.2 1.39
G 13.90 0.2 1.44
H 14.40 0.2 1.39
I 17.50 0.2 1.14
J 22.50 0.2 0.89
Volume Pipetted/cm3 Absolute Uncertainty Percentage Error/%
25 0.1 0.4
60
Volume of Sodium Hydroxide being

Alexander Purvis U64
Sample Total Percentage error forsample/%
A 1.39
B 1.37
C 1.38
D 1.38
E 1.42
F 1.43
G 1.48
H 1.43
I 1.18
J 0.93
Overall the experiment is very accurate, because even the largest sample is only accurate to ±0.2cm3.
In order to make the results reliable, each titration was repeated at least 3 times to a concurrency of 0.1cm3.
To maintain validity various values were kept constant, for instance:
Burette
Pipette
Pipette Filler
were all kept constant. Keeping an experiment valid makes sure that you are testing what you intended on testing (i.e. keeping to the aims).
In addition, the same amount of the same concentration Sodium Hydroxide solution was used making sure that we were always testing how much of the solution would be needed in order to neutralise the wine sample.
If I were to repeat these titrations, I think it would be beneficialto make sure more than three repeats are completed. This is because the final set of results from the UV sample had a dramatic increase,
61
Alexander Purvis U64
more than any of the other samples. Even though this fits the theorybehind the test, it may have still been an anomaly. In addition I could have used larger volumes of the sample than just 25cm3 and equipment with lower percentage errors in order to reduce the overall percentage error.
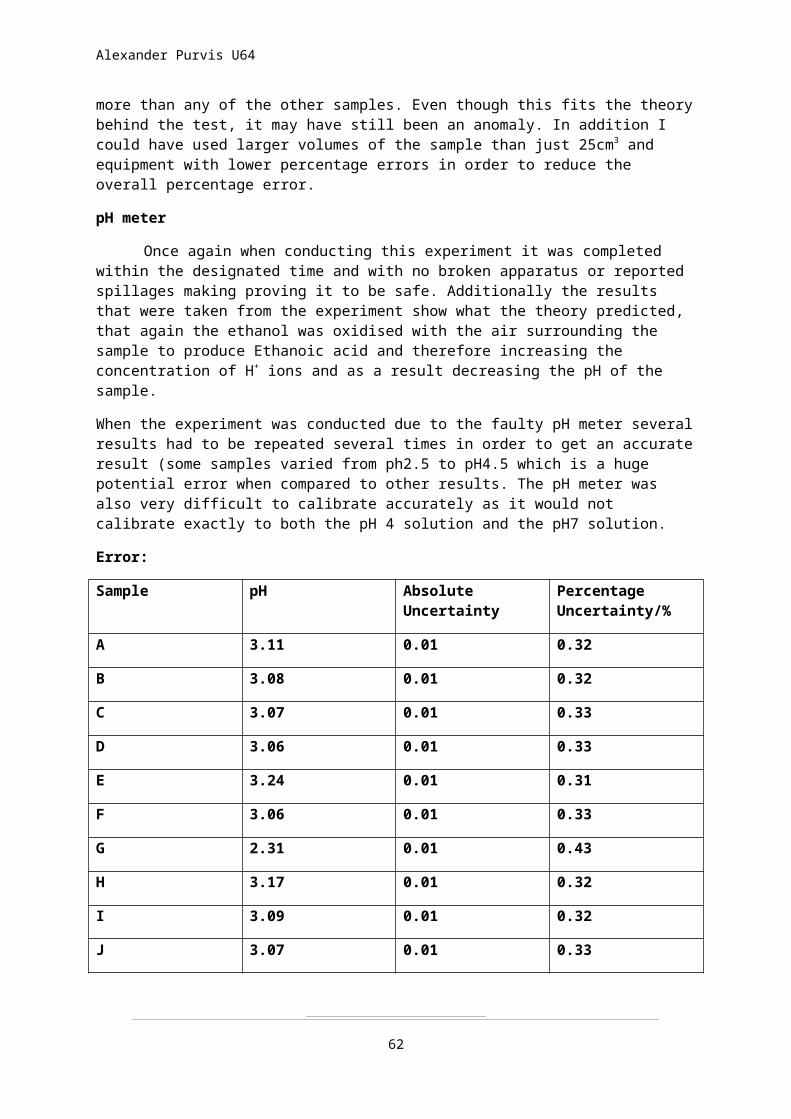
pH meter
Once again when conducting this experiment it was completed within the designated time and with no broken apparatus or reported spillages making proving it to be safe. Additionally the results that were taken from the experiment show what the theory predicted, that again the ethanol was oxidised with the air surrounding the sample to produce Ethanoic acid and therefore increasing the concentration of H+ ions and as a result decreasing the pH of the sample.
When the experiment was conducted due to the faulty pH meter severalresults had to be repeated several times in order to get an accurateresult (some samples varied from ph2.5 to pH4.5 which is a huge potential error when compared to other results. The pH meter was also very difficult to calibrate accurately as it would not calibrate exactly to both the pH 4 solution and the pH7 solution.
Error:
Sample pH Absolute Uncertainty
Percentage Uncertainty/%
A 3.11 0.01 0.32
B 3.08 0.01 0.32
C 3.07 0.01 0.33
D 3.06 0.01 0.33
E 3.24 0.01 0.31
F 3.06 0.01 0.33
G 2.31 0.01 0.43
H 3.17 0.01 0.32
I 3.09 0.01 0.32
J 3.07 0.01 0.33
62

Alexander Purvis U64
Equipment Accuracy of Equipment
pH Example Percentage Error/%
pH Meter 0.01 3.11 0.32Total PercentageError/%
0.32
If we were to repeat the experiment, to improve the accuracy of the experiment, we could have used a more accurate pH meter, to 3 decimal places instead of 2, increasing the accuracy by a factor of 10.
In order to make the results reliable, each pH reading was repeated 3 times in order to work out and correct anomalies.
To maintain validity various values were kept constant, for instance:
pH Meter
pH 4 Solution
pH 7 Solution
were all kept constant as we used the same uncontaminated sample foreach test between readings.
63

Alexander Purvis U64
Distillation
As hoped, the experiment was completed within the given time, and no apparatus was broken or spillages reported. Furthermore, the results which I gained from the experiment fitted the theory where we expected that the ethanol would have been oxidised through refluxto ethanal then to ethanoic acid. As a result, the ethanol concentration decreases and the H+ concentration increases thereforedecreasing the pH.
Because of boiling over, two of the results had to be repeated, when the sample boils over, this contaminates the entire result as the non-oxidised sample mixes with the result therefore disturbing the conclusion. In the distillation, the bumping granulesare used to encourage ‘smooth boiling’ this is when the large bubbles of vapour are broken up by the rough ceramic granules.Error:Sample Mass/g Absolute
UncertaintyPercentage Error/%
A 16.84 0.001 0.006
B 16.70 0.001 0.006
C 16.65 0.001 0.006
D 16.20 0.001 0.006
E 16.31 0.001 0.006
F 15.90 0.001 0.006
G 14.32 0.001 0.007
H 10.96 0.001 0.009
I 11.72 0.001 0.009
J 12.93 0.001 0.008
64

Alexander Purvis U64
Equipment Accuracy of Equipment
Solution example/cm3
Percentage Error/%
Scales 0.001 16.84 (g not cm3) 0.006Total Percentage Error
0.006
In order to make the results reliable, each distillation was repeated 3 times in order to work out and correct anomalies.
To maintain validity various values were kept constant, for instance:
Scales
Quick Fit set
Heat Source (Methane Bunsen Burners)
were all kept constant.
Colorimetry
As with the other experiments, the experiments were all completed within the given time, and with no apparatus damaged or spillages reported. Once again the results also fitted the theory predicted, which said that the ethanol would be oxidised through reflux to ethanal then ethanoic acid. As a result the H+ ion concentration would consequently increase, decreasing the pH.
As with the pH meter, the colorimeter was a relatively unreliable piece of equipment and needed recalibrating after each test in order to obtain accurate results. Furthermore the accuracy of the results is debatable as there was two different designs of cuvette. One had two entire faces of the cuvette opaque and two transparent. The other design only had a small slit of transparency on two sides, both surrounded by opaque areas.
65
Cuvette 1Cuvette 2

Alexander Purvis U64
[Alexander Purvis 2012]
When I actually conducted the experiment I also used a variant of the method I had in my plan. Instead, this was the method:
1. Make up the standard ethanol solutions of 0% to 14% ethanol.2. Get a clean cuvette and rinse it with distilled water.3. Use a 100cm3 beaker and add 1cm3 Silver nitrate with 2cm3 of the
Ethanol solution. Now add 2cm3 of Potassium Dichromate. As you add it, start a stopwatch and swirl the beaker for around 10 seconds.
4. Transfer the solution to a cuvette.5. Get a clean cuvette and fill it with distilled water and use
this to calibrate the colorimeter.6. Replace the cuvette with distilled water with the cuvette with
the solution and read off an absorbance value when the stopwatch reaches one minute.
7. Use steps 2-6 for the actual tests except use the wine sample instead of the ethanol solution.
8. Plot the Ethanol absorbance against its known percentage of alcohol and read off the sample absorbances to find their ethanol concentrations.
Error:
Example: (0.001/0.876)x100=
Colorimeter
Sample Absorbance/% Absolute Uncertainty Percentage Error/%
A 0.876 0.001 0.11
B 0.845 0.001 0.12
C 0.847 0.001 0.12
66

Alexander Purvis U64
D 0.844 0.001 0.12
E 0.848 0.001 0.12
F 0.844 0.001 0.12
G 0.840 0.001 0.12
H 0.900 0.001 0.11
I 0.900 0.001 0.11
J 0.969 0.001 0.10
10cm3 Measuring Cylinder
Solution Accuracy of Equipment
Volume Measured/cm3
Percentage Error/%
Silver Nitrate 0.1 1 10
Potassium Dichromate
0.1 2 5
Ethanol 0.1 2 5
Total Percentage Error/%
20
Sample Total Percentage Error/%
A 20.11
B 20.12
C 20.12
D 20.12
E 20.12
F 20.12
G 20.12
H 20.11
67

Alexander Purvis U64
I 20.11
J 20.10
In order to make the results reliable, each titration was repeated 3times in order to work out and correct anomalies.
To maintain validity various values and equipment were kept constant, for instance:
Colorimeter
Volume of Potassium Dichromate
Volume of Silver Nitrate
were all kept constant.
In addition, the same Potassium Dichromate was taken from the same bottle as each bottle had a slightly different colour, therefore it would alter the results as they would each have a different absorbency.
68

Alexander Purvis U64
References:
[http://revisionworld.co.uk/a2-level-level-revision/chemistry/energy-changes/maxwell-boltzmann-distribution]
[chm.davidson.edu]
Wikipedia.org
[http://www.wrap.org.uk/sites/files/wrap/UV%20&%20wine%20quality%20May'08.pdf]
OCR Chemical Ideas AS/A2
[http://www.chemguide.co.uk/]
[http://www.virtualwine.com.au/wine-making/fermentation.asp]
Alexander Purvis 2012
[Chemistry.about.com]
[http://www.makerstable.com/2012/08/ingredients-on-wine-labels.html]
[http://en.wikipedia.org/wiki/File:Tannic_acid.png]
[http://en.wikipedia.org/wiki/File:Acetaldehyde-2D-flat.svg]
[http://en.wikipedia.org/wiki/File:Sulfur-dioxide-ve-B-2D.png]
[http://en.wikipedia.org/wiki/File:Glucose_chain_structure.svg]
[http://en.wikipedia.org/wiki/File:Skeletal_Structure_of_D-Fructose.svg]
[http://en.wikipedia.org/wiki/File:Tartaric_acid.svg]
[http://en.wikipedia.org/wiki/File:Malic_acid2.png]
[http://en.wikipedia.org/wiki/File:Ethyl_acetate2.svg]
[http://en.wikipedia.org/wiki/File:Ethanol2.svg]
[http://en.wikipedia.org/wiki/File:Acetic-acid-2D-flat.png]
[http://revisionworld.co.uk/a2-level-level-revision/chemistry/energy-changes/maxwell-boltzmann-distribution]
69
Alexander Purvis U64
A2 Level Revision Guide Book - Richard Parson
AS and A Level Chemistry – Marin Berry and Eric Lewis
Salters Advanced Chemistry: A2 Chemical Storylines, 3rd Edition.
70
Copyright © 2022 FDOKUMEN