GRAPES RAISINS WINE 1965 - NALDC
97
rg&V TtIcviÁetíKty ßttlifauUa, S GRAPES "5? RAISINS WINE 1965 SEASON FEDERAL-STATE MARKET NEWS SERVICE United States California Department of Agriculture Department of Agriculture Fruit and Vegetable Division Agricultural Economics Division Market News Branch Bureau of Market News
-
Upload
khangminh22 -
Category
Documents
-
view
4 -
download
0
Transcript of GRAPES RAISINS WINE 1965 - NALDC

rg&V
TtIcviÁetíKty ßttlifauUa,
S GRAPES "5?
RAISINS
WINE
1965 SEASON
FEDERAL-STATE MARKET NEWS SERVICE
United States California
Department of Agriculture Department of Agriculture
Fruit and Vegetable Division Agricultural Economics Division
Market News Branch Bureau of Market News

F 0 B E W 0 B- p
Summarized herein is information pertaining to the marketing of California grapes, raisins, and wine for the 1965 season together with comparable data for other years. This review was edited at the San Francisco office of the Federal-State Market News Service0 Marketing information relative to their particular areas was furnished "by the Market News Offices at Bakersfield, Fresno, Los Angeles« and Sacramento o The office at Phoenix, Arizona submitted most of the data for the special section covering the iresh marketing of grapes in that state«
Statistical data originated "by agencies other than Market News is so identified in the footnotes.
We wish to express our thanks to all those who have cooperated so whole-heartedly in making available the information contained in this surmnary.
Any comments or suggestions for the improvement of these summaries are welcome at any time.
Additional copies may "be requested from any of the following offices of the Federal-State Market News service in California.
727 U# S. Appraisers Buildinc San Francisco 94111
Room 3075, 2550 Mariposa Street Fresno 93721
300 Wholesale Terminal Building Los Angeles 90021
1220 N Street Sacramento 95814
San Francisco, California January, 1967

MARKETING OF CALIFCmiA GRAPES, EA-ISINS, AND WINE
1965 SEASON
COTOTOS
Foreword o o .••••• o •••••••••••• • • 3
Introduction ..«••••o«.* •«••••••••••• ••••••••• 5
(Green Section)
Eeview of the 1965 Season ••• 6
Grape Shipments, Passings, and Distribution , ...•• 11
Shipping-Point Prices and Auction Sales 30
Cold Storage Holdings 40
(Buff Section)
Eeview of the 1965 Season 44
Eaisin Shipments and Distribution 0 • 46
Baisin Production and Utilization 0. 50
(Pink Section)
Eeview of the 1965 Season 0 •.... 56
Winery Grape Crush oe».oo0o .••••••••••• o 63
Wine Shipments •«•»•••oeo» • 68
Production and Utilization ..„..o..... 69
Storage and Inventories .«.e...* 0 • 72
New York State 0 9 0 o 74
GENERAL INFORMATION (White Section)
Acreage, Production, and Utilization « ••••••••••••••• 75
Temperatures 0 ..... c •••.•••••••• 90
Graphs o .•<>»•• •• 92

>.

^
FRESH MEKETING
CONTENTS
Review of the 1965 Season 6
G-rape SMpments, Passings and Distribution
Table Page
1 Domestic shipments and imports, 1956~65 seasons . 11
2 Domestic shipments and imports, monthly, 1965 . . . . . . . 12
3 California rail shipments "by classes and districts 1953~65 seasons . . . . 13
4 Peak shipping days, 1949-65 ................................. 13
5 California rail shipments "by districts, weekly, 1965 and 1964 seasons 14
6 California rail shipments "by classes and districts, weekly, 1965 season ....... é .. . 15
7 California rail shipments "by counties and "billing stations, monthly, 1965 16
8 Distribution of interstate truck passings "by destination, 1965 season ............ 18
9 Interstate rail passings of California grapes "by classes and varieties, 1953"65 seasons ... 19
10 Interstate rail passings of California grapes "by classes and varieties, weekly, 1965 season.. 20
11 Interstate rail passings of California grapes "by class, variety, and loading stations, 1965 . 22
12 Truck unloads of all grapes at 41 United States and 5 Canadian cities, 1959-65 28
13 Eail and truck unloads of California grapes at 41 United States and 5 Canadian cities, 1965 . 29
Shipping"?oint Prices and Auction Sales
14 Shipping-point prices of tafcle grapes "by classes and varieties, weekly, 1961-65 30
15 Total packages sold and weighted average prices "by classes, weekly, 1965 season # 32
16 Total packages sold and weighted average prices "by classes, 1931-65 33
17 Total packages sold and weighted average prices "by classes and varieties, 1963-65 seasons . . 34
18 Total packages sold and weighted average prices "by varieties, weekly, 1965 season 35
19 Total packages sold and weighted average prices of Arizona grapes "by varieties, weekly, 1965. 38
20 Total packages sold, weighted average prices, and value "by cities and varieties, 1965 season. 39
Cold Storage Holdings
21 Semi-monthly cold storage holdings in California "by varieties, 1961-65 seasons 40

MBKETING CALIFORNIA G-BAFES, MISTOS, AMD WIM
1965 gEASQN
lUTRORTTION
Marketing the record large 1965 grape crop vas a difficult pro"blem for California growers and shippers. The total of 3.960,000 tons was 26 percent larger than in 1964, 13 percent more than the previous record in 1963, and 34 percent alsove the five year (1959-63) average. Eaisin varieties totaled 2.560,000, 26 tons percent more than in 1964, 14 percent more than the previous record in 1963. and 39 percent al»ove average. Production of 650,000 tons of Wble grapes was up 26 percent from 1964 and 19 percent above average. It was the third largest ta"ble grape crop on record. Wine varieties reached a new high of 750,000 tons, 23 percent more than in 1964, 10 percent ahove the previous record in 1946, and 32 percent above average.
The crop got off to a good start under nearly ideal conditions. Except for a little damage to early- Thompsons in Kern County and a few of the last Emperors practically the entire crop was harvested without rain or other weather damage. Cool weather during August and early September delayed maturity and sugar development, resulting in a later harvest than usual. The fall "brought warm dry weather and allowed grapes to gain appreciably in sugar content and size.
Highlights of the 1965 marketing season included the following: The long marketing period for fresh grapes, extending into the first of the 1966 crop season; the generally good to excellent quality of the crop, especially of Emperors: the record quantities placed in cold storage for deferred marketing; the increased rate of movement of storage grapes through marketing channels} the decreased use of special packs, particularly wrapped packs; the sharp increase in the use of trailer vans on flat cars (piggy-back); the record truck movement; the continued decline in the volume of auction sales of table grapes: the discontinuance of the .iuice grape auction at Jersey City with the result that there were no auction sales ^.p ¿—•^_ jy .Li-r j?» r J.3 .•_ - a.-u~ -.r. i xi ~J* JL-U^ rr v~— "u >Tä i- T^ — ä,„ m x..
shipments.
raESH MABPTIffG - r^g GBAZES
NoTewent
Bail shipments of 1965 crop California grapes packed for table use totaled 17,348 cars, including trailers loaded on flat cars. This was an increase of 2,769 over the previous season and was the largest rail volume since 1956. Thompson Seedless was the principal variety, with about 43 percent of the total, closely followed by Enrperors with about 38 percent. These two varieties conrprised 81 percent of the total although this is to some extent an overstatement since many cars, especially of Thompson Seedless are not straight cars but contain varying quantities of other varieties. Totays accounted for a little more than 10 percent of the total and Perlettes, Eibiers, Cardinals, Almerías, Calmerias most of the remainder.
The use of vans loaded on flat cars (piggy-back) showed a sharp increase. About 5,600 vans were used, compared with a little less than 2,000 m the previous season.
Interstate truck movement of all grapes, including some juice stock, was a record of 10,530 cars, on the basis of 1.000 packages per car. No data are available regarding the breakdown by varieties, but on the basis of time of shipment, trade reports, and other unofficial information, there are believed to have been about 3.800 cars of Thompsons, 3,300 of Emperors, 1,500 of Tokays, 1,500 of other table varieties, and 430 of wme varieties. The total was an increase of 792 over the previous record in the 1964 season. In recent years rail cars and trailer vans have been loaded heavier than the 1,000 lug figure used for converting truck movement to carlot equivalents. For this reason, comparisons of truck movement in carlot equivalents with actual rail shipments exaggerate the percentage by truck in the past several seasons.
Boat movement from California ports during the 1964 shipping season totaled about 502,500 chests and 169,250 lugs, or the equivalent of 797 cars on the basis of 800 chests and 1,000 lugs per car. Of the total, approximately 242,000 chests went to the Orient, about 212,500 chests to Europe, about 33,500 chests and almost all the lugs to South America, and about 14,500 chests to the British West Indies and the Canal Zone. Venezuela continued to be the principal export market, taking nearly all of the lugs and over 23,000 chests. Philippine Islands took about 100,000 chest and 2,500 lugs. Hong Kong about 100.000 chests, the United Kingdom about 90,000 chests, Sweden 48,000 chests, Finland 35,000 chests, Norway 21,000 chests, and Singapore 21,000 chests. These figures do not include any quantities that may have been transhipped from East Coast or Gulf ports. In addition the equivalent of about 70 cars was shipped by boat to Hawaii.
Air shipments were the equivalent of 10 cars, on the basis of 31,000 pounds billing weight. Almost all were from the early Desert areas and were mostly Perlettes. Most of the volume went to the New Tork market with a few to Chicago, Philadelphia, Boston, and other eastern and midwestem markets. A small quantity of Emperors was snipped late m the season to Tokyo.
Early Pesert Area
days The first Perlettes were picked in the Coachella Valley on May 26, about the normal time but about 10 di earlier than in 1964. Movement was very light for the first week or so. They then came on rapidly and peaked during the period June 7-17. By June 25 the season was about over. Quality was rather variable. Prices averaged a little lower than in 1964. The Agricultural Commissioner of Riverside County reported that 771,820 24-pound lugs were packed during the season, about 34,000 more than in 1964.

Picking of Thompson Seedless "began on June 14 and continued into the latter part of Julyo The heaviest movement occured during the last few days of June and the first half of July, Quality and "berry size were "better than in the previous two or three seasons. Yields were a little heavier than the very light 1964 season. There were 1,741.732 lugs packed, ah out 120,000 more than in the previous year. Prices averaged well "below those of 1964.
Cardinals and Beauty Seedless "began early in June9 ahout a week or so ahead of Thompsons. Thev peaked ahout the middle of the month and were through "before the end of the month. The Cardinal pack of 268ç992 24-pound lugs was more than double that of 1964 while the Beauty Seedless pack of 43,036 lugs was ahout 10 percent lighter. Both /brought lower prices.
The total packout of 2,905,893 packages of all varieties reported "by the Riverside County Agricultural Commissioner was ahout 250,000 more than in 1964.
Carlot movement from the Coachella Valley was 1.260 cars, compared with 1,123 in 1964. Truck shipments, including "both interstate and intrastate, were the equivalent of ahout 1,550 cars0 In 1964 truck movement totaled 1,182 cars. Air shipments of 9 cars were a little less than the 10 cars in 19640
The Borrego Valley season "began a few days after the Coachella Valley and ended a few days earlier«, Most of the crop moved "by truck. Eail shipments are loaded in the Imperial Valley as there are no rail facilities in the Borrego Valley. Almost all of the 37 cars shipped from the Imperial Valley were produced in the Borrego Valley.
Central attd Smtfrera Sw Joaquín Valley
The season was again late in starting, although slightly earlier than in 1964. The first rail shipments of Cardinals and rerlettes moved from the Arvm-Edison section on July 5, three days earlier than the previous season. Quality was exceptionally good. The volume of Perlettess although rather light in comparison with the early desert areas, was heavier than in 1964 as new acreage came into production.
The Fresno-Sanger-Reedley area started on Perlettes ahout a week or so "behind the southern part of the Valley^ and on Cardinals ahout 10 days to 2 weeks later. The Perlette season was ahout over "by the first of August while Cardinals continued to ah out the middle of the month.
Thompson Seedless rail movement "began in the Arvin-Edison section on July 19« a day or two earlier than in 1964o Volume picked up rapidly and the area was ahout at its peak "by the end of the month. Changes in the method of testing Tor sugar content and in the application of maturity standards minimized early season maturity prohlems, especially for Thompsons. Total rail shipments of 585 cars of all varieties from the Arvin-Edison section in July were well ah ove those of July 1964.
An unseasonahle rain on July 30, as the crop was at its peak in this section, interrupted harvesting and damaged the shipping quality of the remaining Thompsons. In some vineyards where rainfall was the heaviest much of the remaining fruit still on the vines hecame unsuitable for fresh shipment and was disposed of to wineries. Little to no rain fell in the area from Delano to Fresnop where picking was just getting under way.
Movement from Delano picked up rather slowly until after August 10 as growers and shippers waited for the Arvin-Edison section to approach its close. There was a trace of rain on August 11 and a moderate to heavy thunder shower on August 17, centering in the Delano section. The weather factor again created added prohlems in lowering shipping and storage quality and curtailed the packout in the more seriously affected vineyards o The area reached its peak ahout August 25 and "by September 10 the season was ahout overo Large quantities were placed in cold storage for late season shipment.
In the southern Fresno and northern Tulare County area« Thompson Seedless volume also picked up rather slowly as growers and shippers waited for the heavy volume from the earlier sections to clear. The peak was reached in the early part of September. The northern Fresno and Madera County section followed closely and peaked ahout the middle of Septemher. By the end of the month the harvest had heen practically completed in all areas.
The large Thompson Seedless crop and generally good to excellent quality« except where rains caused damage9 resulted in a very heavy pack. Large quantities were put in cold storage to avoid overloading the market and to extend the marketing season« The total of 2.493,910 packages in California cold storages on September 15 surpassed "by almost 850j000 packages the previous record of a year earlier. Because the heavy volume in storage had to move m competition with fresh shipments of other varietieSo prices for storage Thompsons failed to advance. The fruit did, however, move into consumption reasonably well and only relatively small quantities hecame unmarketahle and had to he disposed of to wineries.
Bed Malagas started in the southern part of the Valley near the end of June, and in the Fresno area ahout 10 days later0 Interest in and hearing acreage of this variety have heen declining for the past 15 years or so and production has hecome relatively light. Interstate rail shipments of only 80 cars were the same as in 19640 Most of the production, however« moves in mixed cars which are predominantly Thompson Seedless. The shipping season was ahout over "by the first of September.
Italia Muscats started in the Kern County early in August and in the northern part of the area later in the month. They were in fair to moderate volume into early Octoher. Some were put in cold storage and light offerings were still availahle into January.

The first Ribiers were picked in the southern part of the Valley late in July. Volume increased gradually through August as the later sections came into production. Moderate to liberal supplies were available through September and most of October. Quality and color were good to excellent and the fruit moved well. Many were put in cold storage for later shipment. The total of 888,790 packages in California storages on October 31 was the largest on record, although only 1,160 more than the previous high in 1964. Most of these were shipped out during November and December. Interstate rail shipments of 274 cars of Ribiers were consideraoly less than the 416 cars in 1964. Most Ribiers. however, move in mixed cars which are predominantly Thompson Seedless during the early and middle part of the marketing period and with Emperors late in the season. This results in an understatement of the Ribier movement. Acreage and production of Ribiers continues to increase gradually.
Quality and color of Emperors was the best in several years. Weather conditions were favorable until late in the season and the crop generally was suitable for long term storage. Picking started a little before mid-September and became active in October. Because of active competition from Lodi district Tokays until the middle of October, most of the early picking went into cold storage. The combination of favorable weather in late October and early November, ratner unattractive prices, and already heavy storage holdings caused some growers to hold off completing the harvest in the hope of shipping as late as possible without the use of storage.
General rains which began just before mid-November! brought harvesting for fresh shipments to a close except for small quantities which continued into inid-December, mostly for local markets. By the time the rains came, however, most growers had completed or nearly completed picking for fresh shipment. A record quantity of 8,094,100 packages of Emperors were in California storages on November 15, exceeding by about 1,950,000 packages the previous record on the same date in 1962.
Despite the record holdings, the fruit moved into consumption at gradually advancing prices. The excellent quality and attractive color helped to sustain a good retail movement. By the end of March storage holdings were down to just under 700,000 packages. The last of the crop cleaned up about May 20, just a day or two ahead of the start of the new crop of Perlettes in the Coachella Valley. Only a small tonnage of storage Emperors had to be disposed of to wineries.
Almerias and Calmerias did not fare as well as Emperors. Picking began in late September and was active during October and early November. The crop was heavy and storage holdings of 1,207,840 packages on November 15 were almost 60 percent greater than the previous record in 1964. Almerias weakened in November and December as growers and shippers lowered prices in an effort to move stocks. Calmerias held fairly well until about the end of December. At that time storage holdings of the two varieties were down to 143,140 packages. Both moved very slowly after the first of the year. Some lots were taken out of storage and disposed of to wineries.
Acreage and production of Almerias and Calmerias have been increasing steadily for a number of years. In the last few years most of the new plantings have been Calmerias.
Limited quantities of White Malagas were marketed fresh, mostly top late season marketing. There were also small quantities of several
quality fruit that was wrapped for minor varieties.
Northern San Joaquín Valley
Ideal weather conditions at harvest time: packages) since 1956; the smallest volume
. . . _ _ „ , lowest weighted average price at auction since 1952; the heaviest cold storage holdings since" i960; and the changeover from a 27-pound lug to a 26-pound "clipped comer" lug.
Harvesting began in a light way on August 20. the same day as thejjrevious season. The first shipping point prices were reported on August 30 at $2.50-$2.75 a lug, 25-50 cents below the reported opening price m 1964. As the shipping volume increased, prices gradually declined to $1.50 (the season low; on "*• September 28 and continued on through October 29. During this period deliveries to wineries began to increase.
The fresh market absorbed 57,264 tons, slightly less than 29 percent of the total Tokay production. ^ Returns to growers were somewhat less than in 1964.
A more detailed review of the marketing season for fresh shipping Tokays is available upon request to Federal-State Market News Service, 1220 N Street, Sacramento, California.
Auction Sales
The steady decline in the volume of grapes sold at auction in eastern and midwestem markets continued. The total of 1,665,560 packages of all varieties combined was about 10 percent less than in the previous season. With only two minor exceptions, sales at auction have dropped m volume every season since 1947, when 10,104,536 packages were marketed m this manner. Only a little over 5 percent of the combined rail-truck interstate movement was sold at auction compared with 30 percent in 1947. The Jersey City auction did not operate and for the first time in many years there were no auction sales of juice grapes. Three varieties, Thompson Seedless, Emperors, and Eibiers, comprised nearly 68 percent of the total auction sales. Prices for these varieties averaged from about 50-75 cents per package lower than in the previous season. Almerias and Calmerias averaged $1.05^$1.10 lower while Tokays showed a smaller decline of 37^. The average of all table varieties combined was $3.60 compared with $4.31 in the 1964 season.

Cold Storage Holdings
The quant i ty placed in California cold storage for later shipment far exceeded the previous record high volume in 1964. Construction of new storages and additions to or expansions of existing ones over a period of more than 20 years has resulted in a constantly increasing capacity. The total of 10,445,760 packages of all varieties in California storages on November 15 was more than 35 percent greater than the previous season. Emperors, Thompson Seedless, Eihiers. and Almerías and Calmerías all were the heaviest on record. More Tokays were stored in any year since i960. Even with the increased facilities it was necessary to ship some fruit to out-of-state storages "because of insufficient space for the large pack.
Despite the record storage holdings, the fruit moved into consumption with less difficulty than had 'been expected. Emperors were of unusually good quality and color and sold well. Only a negligible volume failed to hold up and had to "be disposed of to wineries. Several hundred tons or Almerías and Calmerías and over 1,000 tons of Thompson Seedless, however, were taken out of storage, unpacked, and delivered to wineries.
¿BIZQHA SBftEES
A record number of lugs of grapes were shipped during the 1965 season from the largest "bearing acreage in Arizona history. The season was a financial disappointment for most growers due to the rains at harvest time which lowered quality and productivity and "because of the low prices received for their grapes.
During the early part of the season temperatures were "below normal and growers experienced difficulty getting grapes to attain a desirahle sugar content. Eainy periods around June 23, mid-July and again toward the end of July, "brought variable amounts of damage to grapes, ranging from none in some locations getting grapes coward the end ^x uuu.^. UXWU.KXJ.U »CU to complete abandonment in others.
Movement out-of-state for fresh use from the Central Arizona district near Phoenix in 1965 totaled 1,000,051 lugs, as compared with 788,576 in 1964, 892,094 in 1963, and 613,317 in 1962. Thompson Seedless continues to De by far the leading variety shipped, followed by Cardinal, rerlette, Exotic and Bob in. This year the 24-pound lug was the principal container, except for the Perlette variety which used many 22-pound lugs, and the use of 26-pound lugs for a few Thompson Seedless late in the season. During the 1964 and 1963 seasons the 27-pound lug was the principal container.
In the Tuma district, all the interstate shipments were by truck, the equivalent of 6 cars. Thompson Seedless remained the leading variety.
Auction sales of all varieties during the 1965 season were 126,457 lugs, about 13 percent of the crop movement out-of-state. The average price of $2.96 per lug was just a snade under 1964 and the lowest in at least the last ten years.
A total of 2,400 tons of packing house culls and vineyard s trippings was crushed during the 1965 season for the production of high proof alcohol. This compared with 1,729 tons crushed in 1954, 3,882 tons in 1963, 3,422 tons in 1962, and 2,073 tons in 1961.
KHESE mEHJUHS - JUICE GBAHS
Movemeat
during the 1965 Interstate rail shipments of grapes packed for use in home winemaking totaled 5,666 cars v, season. Of these, 3,063 were^lack varieties and 2,603 were white varieties. Both were less than in 1964 and were less than the average of most recent years. Of the black varieties, there were 1,375 cars of Alicantes, 762 of Zinfandels, 256 of Carignanes and 672 cars of other varieties or were not specified. All of the White juice shipments consisted of Muscats except 18 cars of White Malagas and 3 of Thompson Seedless.
No accurate information is available as to the breakdown of interstate truck movement by varieties or types. On the basis of unload figures from certain cities and from unofficial trade reports, it is believed that this movement may have been in the neighborhood of 430 cars, mostly into western Canada. These figures do not include some grapes trucked in bulk type containers to commercial wineries in British Columbia and Baja California for crushing.
Movement into eastern Sanada continued to increase. Toronto became the principal market for juice grapes as it exceeded the New lork-Newark metropolitan area for the first time. A record 1,267 cars of juice stock were unloaded at Toronto, an even Î00 cars more than in the New York and northern New Jersey area. Montreal also had a record 671 cars of juice stock, a little more than three times the 222 cars at Philadelphia, the second ranking city in the United. States.
Because of declining sales, the Jersey City juice grape auction did not operate during the 1965 season. It was the first time in many years tnat tnere have been no auction sales of juice stock. Prior to 1965, the volume of sales of juice stock at auction had declined for 17 consecutive years.

10
Marketing Agreements
The Tokay Marketing Agreement continued in effect for the twenty-sixth consecutive year. This Agreement, under Federal law, is designed to create orderly marketing through control of the quality and quantity marketed. As in most years, there was no restriction on the quantity that could T>G marketed. All shipments were required to meet U«, S* Ho« 1 grade standards, with the further proTision that each "bunch should have not less than 75 percent, "by count, of "berries which show at least 60 percent of the surface with characteristic color. This was a higher color requirement than in several previous seasons.
There were no Marketing Agreement« on other varieties.
11
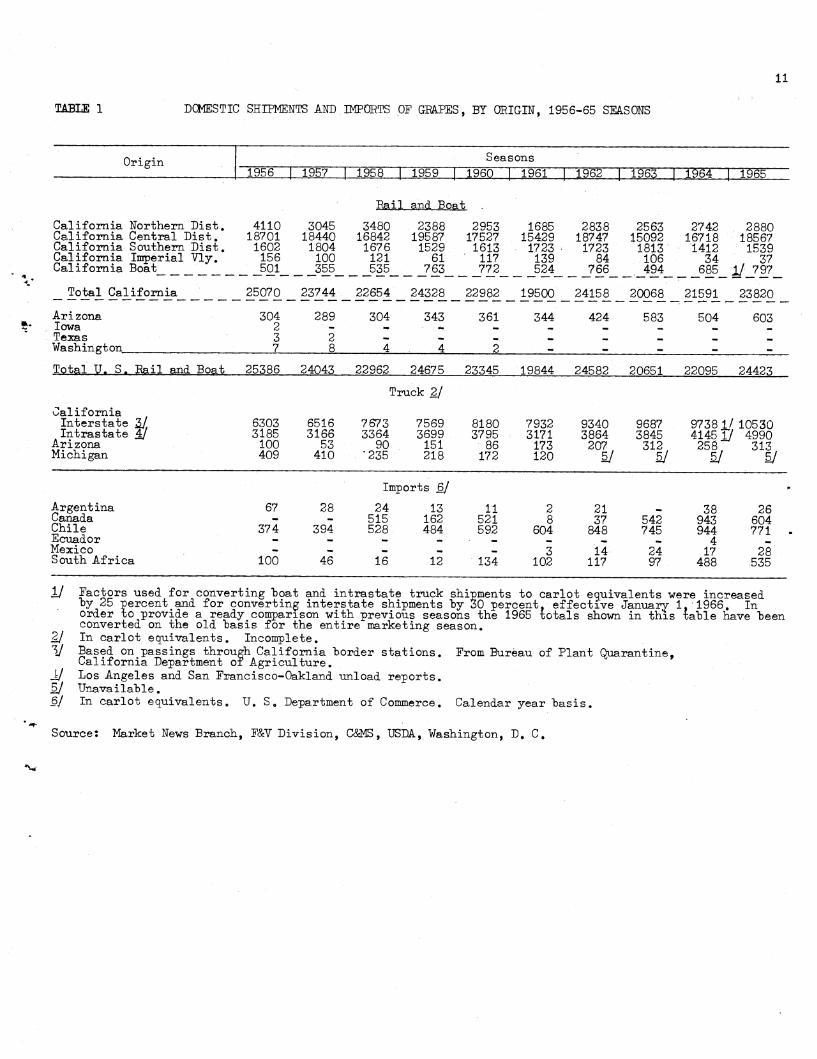
TABLE 1 DCMESTIC SHIPMENTS AND IMPORTS OF GEATES, BY ORIGIN, 1956-65 SEASONS
Origin Seasons 1956 1957 1959 1959 | 1960 | 1961 | 1962 1963 JML 1965
California Northern Dist. 4110 3045 California Central Bist. 18701 18440 California Southern Bist. 1602 1804 California Imperial Vly. 156 100 California Boat 501 355
Bail and Boat .
3480 2388 2953 1685 2838 2563 16842 19587 17527 15429 18747 15092 1676 1529 1613 1723 1723 1813 121 61 117 139 84 106 535 763 772 524 766 494
2742 . 2880 16718 18567 1412 1539 34 , 37 685 1/ 797
Total California 25070 23744
289
2 8
22654 __ 24328 _ 22982_ __ 1_9500 _ 2_4158_ __ 20068;
304 343 361 344 424 583
£159^ _ 23820
504 603 Arizona Iowa Texas Washington.
304 2 3
7
TotalU. S. Bail and Boat 25386 24043 22962 24675 23345 19844 24582 20651 22095 24423
California Interstate 3/ Intrastate 4/
Arizona Michigan
Truck 2/
6303 6516 7673 7569 8180 7932 3185 3166 3364 3699 3795 3171 100 53 90 151 86 173 409 410 *235 218 172 120
9340 9687 3864 3845 207 312
5/ 5/
97381/ 10530 41451/ 4990 256 313
5/ 5/
Imports 6/
Argentina Canada Chile Ecuador Mexico South Africa
67
374
100
28
394
46
24 515 528
16
13 162 484
12
11 521 592
134
2 8
604
3 102
21 37 848
14 117
542 745
24 97
38 943 944
4 17
488
26 604 771
28 535
1/
V II 5J 6/
Factors used for converting "boat and intrastate truck shipments to carlot equivalents were increased oy 25 percent and for converting interstate shipments "by 30 percent, effective January 1,1966. In order to provide a ready comparison with previous seasons the 1965 totals shown in this tahle have "been converted on the old "basis for the entire marketing season. In carlot equivalents. Incomplete. Based on passings through California "border stations. From Bureau of Plant Quarantine, California Bepartment of Agriculture. Los Angeles and San Francisco-Oakland unload reports. Unavaila"ble. In carlot equivalents. U. S8 Department of Commerce. Calendar year "basis.
Source: Market News Branch, F&V Division, CAMS, USDA, Washington, D. C.

12
TABLE 2 DOMESTIC SHIPMENTS AMD IMPORTS OF GRAPES, MONTHLY, BY ORIGIN, 1965 SEASON
Origin 1965
June I July Aug. Sept. Oct.| Nov»| Bee
1966
Jan.] Pet).! Mar.| Apr.) Mav Season Total
Bail md Boat 1/ California Nor. Bist. - 1 22 1531 1238 61 8 California Cent. Bist. 2 722 2660 3849 5103 2287 1882 California Sou. Bist. 2/657 601 2 78 201 California Imp. Vly. 32 5 California Boat_ 10_ _ Ü4_ _ia3_ _ 2L8_ _ S4_ _215_ _jL.ê7_ ,
Total California 2/701 1363 2787 5536 6636 2563 2057
13 6 822 630 453 142
_73. _ jLfi. _ _ Z. - - - ,
908 652 460 142
15
15
2880 18567 1539
37 791.
23820
Arizona 82 517 4 wm .. _ _ _ _ «. _ 603
Total Pail & Boat 2/783 1880 2791 5536 6636 2563 2057 908 652 460 142 15 24423
California Interstate Intrastate
Arizona
Truck 2j
598 1004 1643 2055 1704 1038 821 170 518 1018 1091 883 588 250 57 244 12
502 419 404 259 83 10530 151 105 106 67 37 4984
313
Argentina C&nada Chile Ecuador Mexico South Africa
36
25
Imports 6/
7 402 162 33 10
— «. 6 6 - - 604
205 245 221 717 ■3 1 ~ 4
- - 28 ?4 m 2Ü0 308
1/ Pail figures include rail-truck (piggy-lDack) movement. Each van counted as one car. 2/ Includes 5 cars in May 1965. 2/ In carlot equivalents. Incomplete. 4/ Based on passings through "border stations. From Bureau of Plant Quarantine,
California Department of Agriculture, Sacramento, California. 5/ Los Angeles and San Francisco-Oakland unload reports. 6/ In carlot equivalents. U. S. Department of Commerce, Washington, D. C.
Source: Market News Branch, F&V Bivision, C&MS, USBA, Washington, B. C.

13
TABLE 3 CALIFOMIA CAELOT RAIL SHIPMENTS OF GRAPES, BY CLASSES ANL DISTRICTS, AND UNITED STATES TOTALS, 1953-65 SEASONS
( Ualiforn: i a 1/. Season totals Season Table Stock 2/ | Black Juice White Juice Cali-
fornia Other States
United
Nor. 1 Centl Sou. 1 I .V.I Boatl Total Nor.|Cent|Sou.| Total Nor.|Cent.|Sou.| Total States
1953 : 5381 13660 1198 225 397 18861 1458 2781 507 4746 2 2209 - 2211 25818 332 26150
1954 ; 3855 15328 1160 155 414 19912 1448 2796 351 4595 2 2025 5 2032 26539 247 26786
1955 ; 5070 17240 1603 177 653 22743 1190 2828 ; 346 4364 - 2251 - 2251 29358 357 29715
1956 ; 3795 14099 1156 156 501 18707 1315 2566 446 4327 - 2036 - 2036 25070 316 25386
1957 : 3030 13651 1308 100 355 17444 1015 2411 496 3922 - 2378 - 2378 23744 299 24043
1958 ; 3107 12281 1119 121 535 16163 1373 2205 557 4135 - 2356 - 2356 22654 308 22962
1959 : L392 14472 872 61 763 17563 996 2099 654 3749 - 3016 - 3016 24328 347 24675
1960 : L814 12550 1224 117 772 16477 1139 2307 389 3835 - 2670 - 2670 22982 363 23345
1961 : L125 10789 1419 139 524 13996 560 2059 304 2923 - 2581 - 2581 19500 344 19844
1962 : L955 13575 1311 84 766 17691 883 2176 412 3471 - 2996 - 2996 24158 424 24582
1963 : L702 11059 1591 106 494 14952 861 1665 222 2748 - 2368 - 2368 20068 583 20651
1964 .': L888 11534 1123 34 685 15264 854 2163 289 3306 - 3021 - 3021 21591 504 22095 *
1965 : 3110 13941 1260 37 797 18145 770 2020 279 3069 - 2606 - 2606 23820 603 24423
_l/ Segregation "by classes subject to minor revision.
_2/ Boat shipments (incomplete) reduced to carlot equivalents.
Sources Market News Branch, Fruit & Vegetable Division, U.S. Department of Agriculture, Washington, D. C,
TABLE 4 PEAK SHIPPING DAYS OF CARLOT RAIL SHIPMENTS OF CALIFORNIA GRAPES, BY CLASSES, 1949-65 SEASONS
Season TaT)le Stock
Date Cars
Black Juice
Date Cars
White Juice
Date Cars
All Classes
Date Cars
1949 1950 1951 1952 1953 1954 1955 1956 1957 1958 1959 1960 1961 1962 1963 1964 1965
Sept. 28 Oct. "19 Oct. 18 Sept. 12 Sept. r9 Oct. 13 Nov. 8 Sept. 12 Sept. 10 Sept. 3 Sept. 1 Sept. 8 Sept. 13 Sept. 12 Sept. 17 Sept. 16 Sept. 15
289 263 270 270 240 211 226 222 189 167 192 152 159 178 172 212 201
Sept. Oct. " Oct. Sept Oct. Oct. Oct. Oct. Oct. Sept. Sept. Sept. Oct. Oct. Oct. Sept. Oct.
38 178 Oct. 1 Oct. 20
84 Sept. Oct.
28 546 12 137 58 20 432 12 199 Oct. 12 105 Oct. 18 531 30 183 Oct. 1 76 Sept.
Oct. 30 429
8 176 Oct. 6 85 9 417 13 156 Oct. 7 80 Oct. 13 438 13 155 Oct. 17 96 Oct. 14 441 12 144 Oct. 18 78 Oct. 16 400 9 166 Oct. 10 108 Oct. 9 432
26 164 Oct. 8 112 Oct. 7 400 29 198 Oct. 2 130 Sept. 29 . 382 28 148 Oct. 12 125 Sept.
Oct. 28 357
5 105 Oct. 12 100 11 290 2 177 Oct. 3 175 Oct. 3 476 8 147 Oct. 10 122 Oct. 2 395
24-25 169 Oct. 3 143 Sept. 29 407 8 145 Sept.30 129 Oct. 6 379
Source: Compiled fcom daily carlot shipment reports of Market News Branch, Fruit & Vegetable Division, U. S. Department ^of Agriculture, Washington, D. C.

14
TABLE 5 CALIFORNIA CAELOT EAIL SHIBŒNTS OF G-BAPES BY LIS 'ERIC TS ATO UNÏTED STATES TOTALS, WEEKLY, 1965 AM) 1964 SEASONS
Gal i f 0 r n i a 1/ To tal Week ending Northern | Central 1 Southern 1 . Imp. Vly. Boat California Arizona 1 United States
19651 1964 1965| 1964 1965| 1964 1965| 1964 1965| 1964 19651 1964 19651 1964 1965| 1964
196$ May 29 «. «. «. «. 2 «. _ «. M — 2 „ . - 2 - June 5 - • • • 45 _ - «. • • 45 -
'■-'■' . « 45 -
12 . _ w • 161 32 2 « «. _ 163 32 - - 163 32 19 - • - • 190 163 17 4 -. - 207 167 15 - 222 167 26 . « 1 1 126 224 10 11 «. — 137 236 35 11 172 247
July 3 -. - 1 1 226 205 4 8 10 5 241 219 66 54 307 273 10 « • 17 16 251 293 2 6 9 270, 324 90 97 360 421 17 mm — 53 51 199 162 2 5 15 7 269 225 212 124 481 349 24 • - 186 126 58 42 • - 9 • 253 168 151 184 404 352 31 1 — 466 298 2 ■ «, «. 10 ii 477 311 30 34 507 345
Aug. 7 — — 642 460 - ■. _ 17 17 659 477 4 - 663 477 14 3 - 626 563 - - .., « 20 13 649 576 - - 649 576 21 5 1 614 661 . 2 . . . 15 14 636 676 m. — 636 676 28 6 586 531 — ' - . « 27 15 619 546 - '. - 619 546
Sept.4 50 75 556 507 - - « . 27 14 633 596 - - 633 596 * il 226 399 592 569 .. 1 ' «. « 10. ... 3 828 972 - • 828 972
18 444 509 711 1013 5 26 • . 36 10 1196 1558 - - 1196 1558 25 450 496 1222 1558 27 80 . -. 16 23 1715 2157 • - 1715 2157
Oct. 2 519 517 1424 1862 74 78 . • 19 13 2036 2470 - • 2036 2470 9 521 402 1490 1393 85 67 - - 10 21 2106 1883 . - - 2106 1S83 16 369 238 1376 1241 74 30 w «. 33 52 1852 1561 • -. 1852 1561 23 154 78 1011 762 13 7 .. « 32 53 1210 900 - - 1210 900 30 38 10 727 424 1 _ . -. — 13 46 779 480 • • 779 480
Nov. 6 25 6 605 441 .. M « 43 11 673 458 • • 673 458 • 13 17 2 701 563 — • « . 39 66 757 631 . • 757 631
20 11 1 394 378 - • ' - _ 41 50 446 429 • • 446 429 27 11 2 448 332 « • -, -. 43 39 502 373 -. • 502 373
Dec. 4 3 — 527 403 . «. • «. 71 28 601 431 -. - 601 431 . 11 5 2 586 495 • _ — • 27 12 618 509 - - 618 509
18 1 4 358 220 • • • - 24 18 383 242 - • 383 242 25 1 262 154 - - - - 62 37 335 191 - - 325 191
1966 Jan. J I : §§1 m : ; ; : 11 5i |gf îiS - - £§ m
15 1 . 192 145 _ _ w «, 22 16 215 161 - • 215 161 22 3 .. 163 120 _ • — M 9 4 175 124 - • 175 124 29 3 - 202 118 - . - - 14 . 12 219 130 - « 219 130
Feb. 5 3 «. 185 128 — — ^ .. 5 6 193 134 - - 193 134 12 1 - 183 106 « « • « 4 188 106 - - 188 106 19 1 «. 138 105 . _ ., « 6 3 145 108 - - - 145 108 26 1 - 128 78 - -. • • 4 - 133 78 • - 133 78
Mar. 5 -, 112 92 — . • . 1 4 113 96 - - 113 96 12 • - 101 65 « - - - 6 - 107 65 -. - 107 65 19 - — 95 72 - - - - 1 • 96 72 - - 96 72 26 «. . 104 61 .. . ^ . - 104 , 61. - - 104 61
Apr. 2 - - 77 "43 - - ■- - - 77 43 - - 77 43 * 9 « « 60 32 » « - « - - 60 32 • - 60 32
16 «. — 27 39 — • - - - - 27 39 • • 27 39 23 . _ 23 26 - « - « _ - 23 26 - - 23 26 30 . _ 17 28 « «. .. _ _ .. 17 28 . - - 17 28
May 7 - - 12 28 * - • - - • 12 28 - - 12 28 14 - - 2 24 - - - - - - 2 24 « - 2 24 21 . — 1 12 «. - - «. _ - 1 12 * - 1 12 28 • - _ 12 -r « • » _ - - 12 • - - 12
June 4 — _ - 3 - 4. - - - . - - 3 • - - 3 11 - - - 5 - - - - - - - 5 - • - 5
Season t ptels-
1965 2830 18567 1539 37 797 23820 603 24423 1964 2742 16718 1412 34 685 21591 504 22095
1/ Boat shipments (incomplete) reduced to carlot equivalents, "basis 800 chests or 1,000 lugs per car.
Source; Market News Branch, E&V Div., C&MS, USDA, Washington, D. C.

15
TABLE 6 CALIFORNIA. CAELOT MIL SHIPMENTS OF GRAPES BY CIASSES AND -DISTRICTS, AND UNITED STATES TOTALS, WEEKLY, 1965 SEASON, WITH CCMPAEATIVE TOTALS 1964
Week ending
1SS5. May 1
8 15 22 29
June 5 12 19 26
July 3 10 17 24
T$tei 1965
Cal i f o r n 1 a
Ta'ble 1/ Nor, | Cent | Sou, 11 .V.| Boat [Total
31 1 466 Aug. 7 - 642
14 3 626 21 5 614 2-8. 6 586
Sept.4 50 556 11 226 573 18 437 502 25 353 457
Oct. 2 324 440 9 258 441
16 207 465 23 114 580 30 32 562
Nov. 6 25 543 13 17 671 20 11 393 27 11 448
Dec. 4 3 527 11 5 586 18 1 358 25 1 262
1966 Jan. 1 1 331
8 6 232 15 1 192 22 3 163 29 3 202
Pel). 5 3 185 12 1 183 19 1 138 26 1 128
Mar. 5 - 112 12 - 101 19 - 95 26 _ 104
Apr, 2 - 77 9 - 60 16 » 27 23 - 23 30 • 17
May 7 - 12 14 - 2 21 - 1
2 45
161 190 126 226
17 251 53 199
186 58
2 17 10 4 2 2
10
15 9
10 17 20 15 27 27 10 36 16 19 10 33 32 13 43 39 41 43 71 27 24 62
33 23 22 9
14 5 4 6 4 1 6 1
2 45 163 207 137 241 270 269 253 477 659 649 636 619 633 809 975 826 783 709 705 726 607 611 727 445 502 601 618 383 325
365 261 215 175 219 193 188 145 133 113 107 96
104 77 60 27 23 17 12 2 1
13941 2110 1260
37 797
18145
Black Juice Nor.|Cent|Sou,1 Total
- 14 7 75
97 303 195 367 263 411 162 446 40 251 6 123 - 20
9 1
5 27 74 85 74 13 1
14 87
427 636 759 682 304 130 20 9 1
770 2020
279 3069
White Juice Nor.|Cent|Sou.[Total
5 134 462 617 638 465 180 42 42 21
5 134 462 617 638 465 180 42 42 21
2606 2606
Total
California Arizona United States
to*—
2 45 163 207 137 241 270 269 253 477 659 649 636 619 633 828
1196 1715 2036 2106 1852 1210 779 673 757 446 502 601 618 383 325
365 261 215 175 219 193 188 145 133 113 107 96 104 77 60 27 23 17 12 2 1
23820
15 35 66 90
212 151 30 4
603
2 45 163 222 172 307 360 481 404 507 663 649 636 619 633 828
1196 1715 2056 2106 185? 1210 779 673 757* 446 502 601 618 383 325
365 261 215 175 219 193 188 145 133 113 107 96
104 77 60 27 23 17 12 2 1
24423
Total 1964
11534 1888 1123
34 685
15264 854
2163 289
3306 3021 3021 21591
504 22095
1/ Boat shipments (incomplete) reduced to carlot equivalents, "basis 800 chests or 1,000 lugs per car.
Source: Market News Branch, F&V Div., C&MS, U. S. Department of Agriculture, Washington, D. C.

16
TIABLE 7 CALIFOMIA MIL SHIPMENTS OF G-MFES BY COUNTIES AND BILLING STATIONS, ALSO BOAT AND TRUCK SHIPMENTS, MONTHLY, 1965
Couáty and Station Jan, FeTD, Mar, Apr. May June July Aug. Sept. Oct. Nov. Dec, Total
ALàKBDft Uakland
CONTRA COSTA Ualcl ey
Carlo t^..
6:
13 67 80
FRESNO Clotho Clovis Copper Del Rey Fresno Ivesta Kings"burg <, MelVin Mendota Orange Cove Parlier Pinëdale Reèdley Sanger Selma
;- —. -- >. - ■. • - •- - " '- - - "- 8' ' 1
lo-
8 1
20 ■ _ • .. .. M . ^ ... ^ «, ■ •'«. ^ 10 ^. 7 i - - - • - - 9; 3 26 114 178 10 is 356
27 20 • 19 34 24 4 19 15Ç 586 692 204 143 1928 - . - - - - - ■'-■•• - • -: ■- 4 2 6 12.
- - - - ■.. - -■ ' - - 11 128 282 . 35 6 462 — " " - - - ■• - ' - ï
2
- 17 - 17 1
266 20 30 * - 8 :!■; 2 —- • i» 27 68 36 72; - ■ ■ « ■ - -; - - - 15 51 69
J 41 4 180 — - — — •. : — ' » ^ — _ 4 4 _ 8
18 1 - - - - .. ' - - 20 . 87 431 393 85 53 1088 - - - - - -
-*■ ~ ; .158 364 393 81 ; 27 1023 - - • - - - - • - 21 58 - 79
County Total 72 52 27 35 26 42 456 1722 2176 498 337:, 5449
IMPERIAL *ürawley Càlexico El Centro
29 2 1
34 2 1
County Total 32 37
KERN _~Balcerrv'?:iell. Delano Edison Wasco
RIVERSIDE Indio Mira Loma Thermal
145 94 * 48 3 40 19 ' 4 3 43 17 9 3 2 - -
454 '1066 309 509 308 278 3218 260& 54 338 571 648 531 397
113 266 148 65 73 91 825 1 5 27 11 4 53
Co-unty Te )tal 231 .132 61 6 4 ■-
621 1671 1033 1249 923 770 6701
KINGS Hanî'ord - - - - - .-'■ - - 67 208 2 - 277
MONTEREY Cooper - - - - • - - - 1 ;■ - 1
PLACER .ttoseville . - - - -, L -, - 7 10 - . - 17
5 ?0¿ 1,92
448' 409 27 65
403 92
857
County Total - - _- -.. 5 6S? 601 2 , 2.7 65 - - 1352
SAN BERNARDINO
Cucamonga > San Bernardino
'} ;^;': : -
■■■■'.-'■.•
- :- . ,■-'•■■
^ - 6
45 41 95
'...-'. .-- 47 140
County Total - T';- - ' "V^ -■, -^;r .... ,>:'" - 51 136 '-" 187
Continued

17
TABLE 7 CALIFOem MIL SHIPMENTS OF GÏ&FES BY COUNTIES AND BILLING STATIONS, ALSO BOAT AND TRUCK SHIPMENTS, MONTHLY, 1965 - (Continued)
County and Station Jan. Feb. Mar. Apr. May June July Aug. Sept. Oct. Nov. Dec. Total
Carlots
SAU JQAQUPT Escalón Lodi Stockton,
6 6 1187
IS 428
42 960 JtSL
13 -5£L
48 3 2169. g 9S7
County total - - - - - - 1 22 1621 1439 63 8 3154
STANKMUS Modesto Oakdale Turlock
- - - - • «. .
49 74 9 49
7
- -
123 58 7
County total - - - - - - - 58 130 - - 188
TULARE Cutler Dimiba Due or Earlimart Elmco Exeter Ivanhoe Jovista Lindsay Porterville Strathmore
1 27 4
23
114 2
55 2
36
23 10 12
102
45 3
38
6 74 5
71
27 6
22
34
15
5
42
13
35
7
12
2
15
18
1 72 45 190
19
193
5
4 160 63
252
23
319
19
2 125 70 216
13Ï 32
409
29
6 100 93
160
176 24
249 2 7
3 66 28 118
2 265 10
248 11 10 1
1/ Incomplete. 2/ Incomplete. Truck receipts are for Los Angeles, San Francisco and Oakland only. 3/ Oufbound truck passings reported cooperatively "by the Bureau of Plant Quarantine of the
California Department of Agriculture and Federal-State Market News Service. Since many of the interstate truck shipments originate in Los Angeles where supplies for the most part are secured from the wholesale market, some duplication exists "between these data and the intrastate truck movement. The amounx; of duplication cannot he determined.
17 586 421 988
2 931 68
1565 24
265 1
Sultana Visalia
2 6
1 3
6 2 - - 5 8 12 1
40 8
29 14
4 9
109 41
County total 272 237 217 98 48 4 59 533 853 1062 860 775 5018 '
Pail shipment totals Boat shipment totals 1/
575 53
421 9
305 2
139 83 694 10
1329 34
2684 103
5458 78
6542 94
2348 215
1890 167
22468 765
Total Bail and Boat 028 430 307 139 83 704 1363 2787 5536 6636 2563 2057 23233
Truck shipments Intrastäte 2/ Interstate 2/
109 446
85 339
67 290
43 190
26 80
170 598
518 1004
1018 1643
1091 2005
883 1704
588 1038
250 821
4848 10208
Source: Report of California Carlot Shipments, Service; and Federal-State Market News
prepared "by California Crop and Livestock Reporting Service, Sacramento, California.

18
TABLE 8 DISTRIBUTION OF INTEESTATE THUUK PASSINGS OF CALIFGENIA GEAPES. BY HESTIMTION, 1965 SEASON WITH SEASON TOTALS 1963-64
Destination June July Aug. Sept. Oct. Nov. Dec. Jan. Feb. Mar. Apr. May Total 1965
season
Season totals 1964 1963
Carlot ( aquivalents 1/ Western area. Alaska mm mm „, ^ — mm 1 «. «. — _ „» 1 «, «. Arizona ii 9 37 55 47 30 16 12 13 8 5 4 247 220 196 Colorado 22 28 54 51 53 17 9 5 4 4 4 1 252 269 322 Idaho 2 4 12 7 4 1 1 _ 1 1 - - 33 41 32 Montana 6 9 12 16 13 5 2 2 1 1 i -. 68 51 61 Nevada 3 7 14 11 10 6 3 3 1 1 .2 1 62 73 63 New Mexico 4 7 12 14 18 12 7 5 5 4 •5 2 95 73 73 Oregon UtaH
16 41 76 73 58 25 20 12 12 5 4 1 343 320 304 12 41 65 51 27 18 7. 3 3 3 230 224 198
Washington 26 61 117 115 111 47 33 14 13 11 5 3 556 467 482 Wyoming « - - - 2 - • -. « - - -
1809 ml 2 Area total 102 207 39S 393 34a 161 99 56 53 38 26 12 1733
MifYig;irare{ i 23 39 29 50 36 16 16 16 12 16 4 3 260 339 380
Indiana 6 9 14 23 22 16 11 8 12 5 2 - - 128 81 90 Iowa 9 18 37 57 39 29 18 14 8 6 4 1 240 226 211 Kansas 12 18 35 49 29 22 14 12 9 3 3 1 207 186 220 Kentucky 4 8 11 11 9 6 9 5 5 6 1 1 76 82 105 Michigan 12 21 21 32 18 8 7 5 8 9 4 1 146 200 206 Minnesota 14 24 49 63 49 37 22 8 7 8 6 2 289 308 320 Missouri 23 41 70 100 85 75 61 35 31 32 17 5 575 599 582 Nebraska 12 24 31 36 27 15 9 9 5 4 3 _ 175 157 183 North Dakota 4 7 21 17 9 7 3 2 1 1 - 72 48 63 Ohio 24 40 43 59 44 33 30 13 5 8 4 3 306 260 211 South Dakota 2 4 6 4 5 1 2 1 1 - - 26 25 28 Wisconsin 1§ 21 I3 26 15 11 8 3 4 3 3 „5 125 150
26§r 27B2 Area total 155 274 380 K§? 387 27 § 210 130 108 102 51 20 Southeru area^ AlaDama 16 18 48 61 39 32 28 16 12 12 12 3 296 288 267 Arkansas 5 8 18 24 17 15 11 9 5 6 8 1 127 117 107 Florida 37 39 84 82 68 59 62 44 34 39 21 4 573 520 457 Georgia 15 18 58 65 60 55 48 31 23 23 20 5 421 370 283 Louisiana 18 42 57 70 61 48 41 16 16 18 8 2 397 329 291 Mississippi 6 3 16 18 21 14 13 8 8 4 4 1 116 106 103 North Carolin? i 8 8 21 29 31 40 41 25 14 23 13 7 260 217 199 Oklahoma 14 22 49 74 52 24 22 12 12 6 5 3 295 260 221 South Carolin? i 7 6 20 19 23 16 20 10 13 13 10 2 160 133 113 Tennessee 12 14 38 36 33 40 42 23 14 14 14 4 284 248 239 Texas 7§ 146 276 15S 108 68 52 _45 51 4 üí 1430
40ÎB* 1399 367? Area total 216 324 685 807 634 502 Ï36 262 203 203 lie zè
Eastern, çirea. Connecticut 2 _ 1 _ . _ . _' . '. _ mm 3 1 3 Maine 1 - 1 - - - 1 - - 1 - - 4 6 1 Maryland 2 - - 1 2 - 1 - - - - - 6 5 2 Massachusetts 11 16 10 4 2 2 1 - 1 1 - 1 49 67 71 New Hampshire - - - - - - - - 1 - - - 1 1 - New Jersey 5 ii 3 - - - - - - - - . - 19 50 97 New York 31 58 12 25 3 7 3 1 2 3 - 2 147 108 112 Pennsylvania 21 34 29 35 7 4 7 4 4 4 1 1 151 226 206 Ehode Island 1 « - 2 - - - - — •- - - 3 1 3 Vermont - - 1 - - - - - - - - - 1 - - Virginia 3 5 5 12 9 8 9 5 10 5 5 1 77 47 40 West Virginia 1 - - 3 4 3 2 1 - 3 • - — 17 9 11 Washington,D.( Area total
, - - 1 - - - - - • - ' - _ >À ■■«?■ - 78 124 62 83 27 24 24 ii 10 17 6 5 479 524 546
Canada Alterta 13 18 29 32 31 22 9 13 8 10 9 3 197
f ¡f
-J British Columb H 18 35 51 168 237 34 25 20 16 19 10 5 638 Manitoba 6 14 17 16 20 •8 7 4 5 8 3 1 109 Ontario - 1 2 8 8 - 1 - - - - - 20 Quebec Saskatchewan 5 7 14 19
1 12 11 10 6 8 7 8 Î
1 108 ly
Unknown - 2 1 1 - - - - - - - TüfT ■J Area total 42 75 115 244 310 75 52 43 37 44 30 10
Mexico — — — — «• — — — » — •- — — i 2 Unknown _ _ — 2 1 2 • - « _ _ _ - 1 —| 6 Other total - - 2 Î 3 - - - - - - - 8
Total 1965 598 1004 1643 3055 1704 1038 821 502 419 404 259 83 10530 , Total 1964 432 843 1753 3158 1611 939 653 446 339 290 190 80 3/ 9738 , Total 1963 680 853 1811 3387 1756 862 596 304 249 165 20 4/ 9687 1/ Basis 1.000 lußö per car. 27 Breakdown 1 by Provinces not available.
Includes 4 in May 1964. 4/ Includes 4 in May 1963.
Source: Federal-State Market News Service in cooperation with the Bureau of Plant Quarantine, California Department of Agriculture, Sacramento, California.

TABLE 9 INTERSTATE OAELOT m IL PASSINGS: CALIFORNIA GPAPES BY CLASSES AND VARIETIES 1953-65 SEASONS
(includes express shipments)
19
Variety 1/ 1953 1954 1955 1956 1957 1958 1959 1960 1961 1962 1963 1964 1965
TABLE STOCK Almeria à Calmer ial98 196 382 510 241 456 380 313 381 469 267 270 296 Cardinal 255 447 445 442 381 348 384 395 364 434 436 295 320 Cornichon 15 28 12 9 7 Emperor Málaga
6192 7497 8065 5878 6018 5627 6655 6139 4644 6484 5111 5256 6391 50 132 41 75 19 48 14 16 9 9 10 5 ' 5
Muscat 8c Italia 66 70 36 75 57 40 20 20 25 54 47 51 44 Perlette 24 34 56 47 126 219 239 436 443 406 401 452 454 Red Malaga 593 737 811 495 321 274 328 136 145 144 156 78 80 Ribier 552 736 552 562 656 439 539 442 417 463 359 418 274 Thompson Seedles s 6744 6246 8033 ä 7077 6811 5898 6739 6000 6024 6501 6120 6056 7244 ï?^ ', 3304 2841 3081 2794 2021 2092 1390 1796 1126 1933 1707 1776 1744 Other Table . 11 1 3 1 2 1 5 2 9 5 3 2
Total Table 18004 18965 21517 17965 16660 15442 16693 15695 13578 16906 14619 14660 16854
Alicante 1712 1674 1622 1450 1621 1564 1410 1432 1338 1463 1007 1540 1375 Carignane 672 527 659 494 293 631 573 574 260 479 429 449 256 Comichon G-renache Malvoisie Mataro Mission Petite Sirah Zinfandel
53 43 26 32 85
1798
29 34 43 18 62
1722
56 11 28 29 69
1531
55 7 6
23 53
1627
49 7 3
34 38
1463
f 1387
Í 1134 1 105^
1 I 98Ü
2/
59F 737 J Other Black 259 414 287 564 395 520 604 745 682 537 700 578 672
Total Black 4680 4523 4292 4279 3903 4102 3721 3803 2918 3459 2735 -'•3299'- 3063
rajpi JUICE, 20 27 25 57 56 42 23 19 138 20 65 9 18
Muscat 2189 1991 2211 1956 2300 2294 2981 2645 2436 2970 2286 3000 2582 t Thonrpson 1 10 6 17 18 16 7 4 9 2 15 10 3 *
Total White 2210 2028 2242 2030 2374 2352 3011 2668 2583 2992 2366 3019 2603 G-RAND TOTAL 24894 25516 28051 24274 22937 21896 23425 22166 19079 23357 19720 20978 22520
1/ Cars which contain more than one variety are classified according to the predominating variety in each car.
2/ Included with Other Black.
ource: Copies of train manifests and consists furnished "by the Pacific Eruit Express Company, the Santa Ee Refrigerator Department and the REA Express.

20
TABLE 10 INTERSTATE CAELOT RAIL PASSINGS: CALIFORNIA GRAPES BY CLASSES AND VARIETIES, WEEKLY, 1965 SEASON, WITH COMPARATIVE TOTALS,1964
riëty
Week ending
Class and Vä: May June July Augu st September
39 5 12 19 26 3 10 17 24 31 7 14 21 28 4 11 18 25
TABLE STOCK Almeria& Calmer i a ~ - - - - _ - - - — - - - - 1 7 Cardinal - 3 41 48 15 17 28 62 38 39 23 5 1 - - Emperor Malaga
— — — - - - - - 2 4 4 - - - - - - - - — - - 1 - 1 - 2 1
Muscat & Italia — — - - - - - - - - - 1 2 1 3 3 , 8 7 Perlette 2 35 148 169 35 i 16 40 7 1 Red Malaga — — - 4 14 30 13 11 1 4 2 Ribier "" mm
■• — — — — — - — 7 17 10 4 7 3 8 17 Thompson Seedless "" — — — 52 206 233 226 126 410 524 556 583 600 495 531 494 370 SSC8*" m ,_
— "" — — — — - - - - - - - - 35 19Ô. 356 284 Other Table ~ — — — 1 — 1 - -' — * - -
Total Table 1965 2 35 151 210 136 222 251 270 228 455 575 612 630 620 551 741 876 691 Total Table 1964 •- — 31 146 228 213 302 231 152 267 490 583 636 582 558 823 981 725
BLACK JUICE Alicante - - - - - - - - - - - - - 6 40 220 Car'ignane — — - - - — - - - - - - - - - 1 24 Zinf andel - - - - - - - - - - - - - - - - 9 80 Other Black_ "" ~* — - — — - - - - - - - - - 1 21 34
Total Black 1965 - - - - - - - - - - '- - - 7 71 358 Total Black 1964 — ". — - — - - - - - - - - - - 7 193 656
WHITE JUICE Malaga - - -■ - - - - - - - - - - - - - Muscat — — - — - — - - - - - - — -. - ï 95 424 Thompson . _"_. . _ z — "• "*_ — — — — — — — — ' — .— __A. Total White 1965 - - - - - - - - - - - - - 1 96 424 Total White 1964 — — — — — - .. - - - - - - - - - 15 266 680
Class and Variety October
2| 9 | 16 1 23 1 30
Week ending
November
6 | 13 | 20 | 27
December
4 1 11| 18 1 25
January
1 1 8 1 15 | 22 [ 29
TABLE STOCK Almeria & Galmeria Cardinal Emperor Malaga Muscat & Italia Perlette Red Malaga Ribier Thompson Seedless Tokay Other Table
11 4 10 19 12 22 29 34 27 29 31" 16 5 6 3 5 7 3
41 93 164 230 381 582 362 392 482 577 383 310 333 202 202 148 203
4-52--3----------
1 27 17 29 20 9 12 19
379 381 376 312 275 95 17 315 243 154 94 38 6 11
13 6 3 3
Total Table 1965 Total Table 1964
741 613
690 663 614 658 626 558
566 516 658 416 431 522 617 406 318 341 208 212 160 207 441 431 578 422 331 395 519 260 161 195 163 153 110 128
BLACK JUICE Alicante Carignane Z in fand el Other Black
253 302 266 170 99 11 8 48 70 77 28 4 3
202 228 179 56 6 113 168 169 98 54 13 1
Total Black 1965 616 768 Total Black 1964 972 741
691 492
352 217
163 10
27 8
WHITE JUICE
Malaga Muscat Thompson^ _
594 633 510 6
219 2
49 2
37 2
8 18
Total White 1965 594 633 510 225 51 Total White 1964 935 576 412 125 8
41 26
weekly Total ibibb 1951 2091"1864 1191 Weekly Total 1964 2520 1975 1530 900
780 574 693 419 431 522 617 406 318 341 208 212 160 207 459 439 581 422 33,1 395 519 260 161 195 163 153 110 128
Continued

21
TABLE 10 IMEBSTATE CARLOT EAIL PASSINGS? CALIFORNIA GRAPES BY CLASSES AND VARIETIES WEEKLY, 1965 SEASON, WITH COMPARATIVE TOTALS 1964 - (Continued)
Week endinpc Class and Variety- Fetiruary March April Mav Season totals
51 12| 19| 26 5| i2| 19| 26 2| 9| 16| 231 30 71 141 2i| 28 4 1965 I 19<?4
mBKE STCCK Almería Cardinal Emperor Malaga Muscat Perlette Bed Malaga Ribier Thompson Tokay Other Table
10 41
193 195 149 144 109 103 84 90 98 54 25 26 18 4 -
22 1
296 270 320 295
6391 5256 5 5
44 51 454 452 80 78
274 418 7244 6056 1744 1776
2 3
Total Table 1965 205 201 151 144 109 103 84 90 98 54. 25 26 18 Total Table 1964 129 113 92 83 89 74 66 65 45 34 39 37 29 31 23 12 11 T
16854 14660
Alicante Carignane Zinf andel Other Black
1375 1540 256 449 760 732 672 578
Total Black 1965 Total Black 1964
3063 3299
WHITE JUICE Malaga Muscat Thompson
18 9 2582 3000
3 10
Total White 1965 ----------- Total White 1964 -----------
- - - - - - 2603 3019
Weekly total 1965 205 201 151 144 109 103 84 90 98 54 25 Weekly total 1964129113 92 83 89 74 66 65 45 34 39
26 37
18 29
4 - 31 23 12 11 I 22520
20978
sources Copies of train manifests and consists furnished "by the Pacific Fruit Express Company, the Santa Fe Befrigerator Department, and the EEA Express.
22
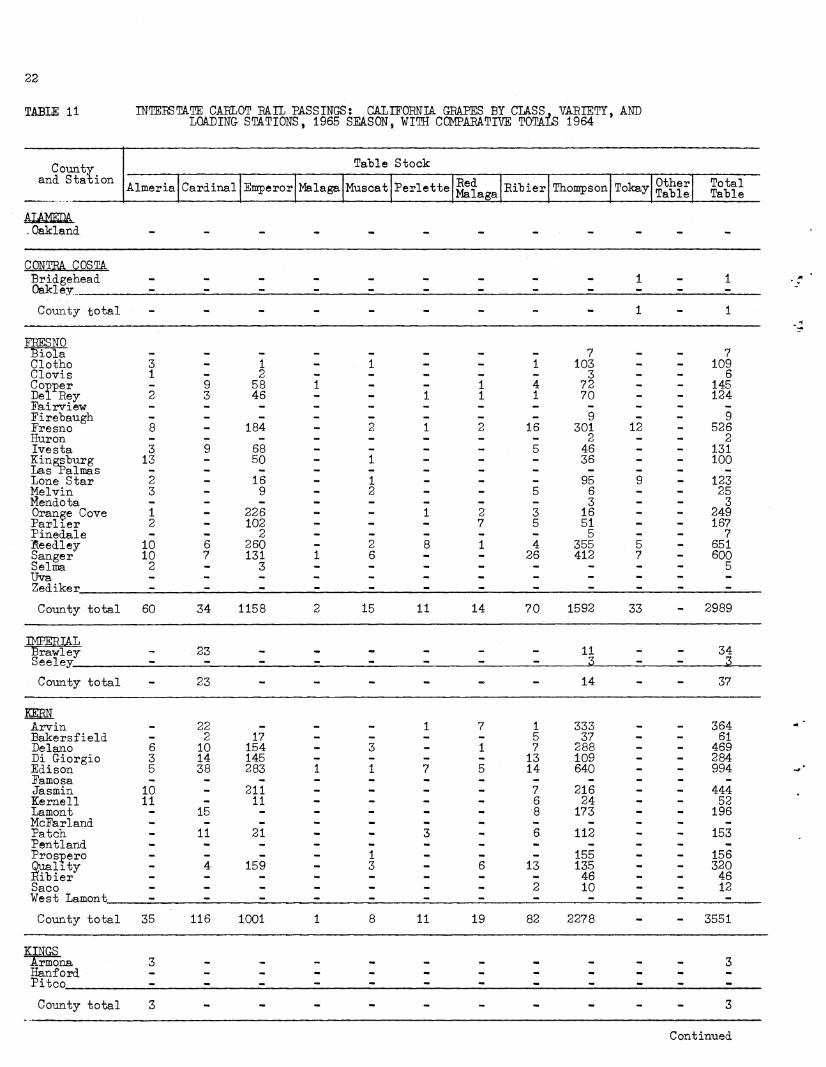
TABLE 11 INTERSTATE CAELOT EAIL PASSINGS: CALIFOENIA GEAPES BY CIASS, VAPIETY, AND LOADING STATIONS, 1965 SEASON, WITH CCMPAMTIVE TOTALS 1964
County and Station
Table Stock
Almeria Cardinal Enrperor Malaga Muscat Perlette Sf^^ [Malaga Pi"bier Thompson Tokay Other Table Total Table
.Oakland
CONTRA. COSTA Bridgehead Oakley
County total
FRESNO Biola Clotho Clovis Copper Del Rey Fairview Firehaugh Fresno Huron Ivesta Kingsburg Las raimas Lone Star Melvin Mendota Orange Cove Parlier Pinedale -Reedley Sänger Selma Uva Zediker
3 13
2 3
1 2
10 10 2
KERN Arvin Bakersfield Delano Di Giorgio Edison Famosa Jasmin Kemell Lamont McFarland Patch Pentland Prospero Quality Ribier Saco West Lamont
mm l 2
9 58 3 46
- 184
9 68 - 50 «. 16 - 9
— 226 - 102 - 2 6 260 7 131 - 3
— _ — - 7 _ — 7 1 • - 1 103 - • 109 - • - - 3 - - 6 - - 1 4 72 - - 145 - 1 1 1 70 - - 124
«. _ — _ 9 ^ _ 9 2 1 2 16 301 12 « 526 .. _ -. 2 _ _ 2 - .. — 5 46 _ _ 131 1 - - - 36 - - 100
1 — „ _ 95 9 «. 123 2 - - 5 6
3 16
- - 25 3
249 _ 1 2 3 ._ «. - - 7 5 51
5 355
- - 167 7
651 2 8 1 4 5 —
6 • - 26 412 7 - 600 — - - - — - — 5
County total 60 34 1158 2 15 11 14 70 1592 33 - 2989
Brawley Seelev
- 23 - - - - - - 11 3
- - 34 3
County total - 23 - - - - - - 14 - - 37
_ 22 _ . 2 17 6 10 154 3 14 145 5 38 283
10 _ 211 11 - 11 - 15 -
.. 11 21
159
7 1 333 - 5 37 1 7 288
13 109 5 14 640
— 7 216 -, 6 24 - 8 173
- 6 112
mm „,, 155 6 13 135
46 - 2 10
364 61
469 284 994
444 52 196
153
156 320 46 12
County total 35 116 1001 1 8 11 19 82 2278 - - 3551
KINGS Armona Hanford Piteo
3 - •
- - •
- - - -
- 3
County total 3 - - - - - - - - - - 3
Continued

23
TABLE 11 IMEESTATE CARLOT MIL PASSINGS: CALIFORNIA GRAPES BY CIASS. VAELETY, ANB LOADING STATIONS, 1965 SEASON, WITH COMPARATIVE TOTAIS 1964 (Contd.)
Coimty Blaök Juice, - White Juice Total Table & Juice
and Station Alicante Carignane Zinfandel
Other Black
Total Black Malaga Muscat Thompson
Total White 1965 1964
ALAMEDA Oakland
FRESNO Biola Clotho ' Clovis Copper Del Reyv Eairview Firebaugh Fresno Huron Ivesta Kinggburg Las Palmas Lone Star Melvin Mendota Orange Cove Parlier Pineda!e Peedley Sänger Selma Uva
9 12
115 20
23
20
5. 48^
29 1
75^ 152
KERN Arvin Bakersfield Delano Di Giorgio Edison Famosa Jasmin Kemell Lament McFarland Patch Pentland Prospero Quality Ei"bier Saco West Lamont
140
16
1
214
Bridgehead Oaklev
6 5
- .2 16
24 29
32 •50
- - - "_"■ 33 50
34 15
Gounty total 11 - 18 53 82 ' ■ - .- - ■■.
■ - - •83 49
2 1 1
18
14 3 1
4 5 1
_ 9 28 42 1 6
11 132 11 •• 33
27 74
26
64 22
5 13 254
69
41 9
48 69
5 39 1
32 21
123 182
1
362
83 110
12 51
427 323 66
• 16 24 66 217 177 22 34 31 18 295 188
254 411 267 _ - 7 . 9 . -
76 676 575 ''■''■'mm 2 1 « 131 103
362 488 364 • - 60 86 257 211
110 204 282 3 1
14 302 300 51 . 219 198
7" 1 428 1202 1007 323 1105 1035 66 72 * 75
85 47 56 46 Zediker _,. m. 9 — 9 . 47 . 47 56 46
County total 509 56 40 189 794 17 1903 3 1923 5706 5038
immAL Brawl ey Seelev
- - - - - - - - - ■ 34 3
34
County total - - - - - - - - - 37 34
7 8 . - -
74 217 - 107
3 7
3 25 "
- 21 2
21
6." 15 : 34
56; 270^ -■■
24
_ 372 303 • 61 116
07 793 795 284 263
mm 994 646 21 24 - 2 471 514
21 73 36 • 196 152 - _ 23
34 202 . 156 ' 20
. 156 200 24 614 542 _ 46 68 « - 12 9
'; '->■ ' ■": ,39
County total 371 12 2 153 538 - .. 209 - 209 4298 3882
KINGS. Armona Hanford Piteo
4 6
■■■■—.. 4 -■- -6
68 128 72
. ■*. 68-
128 72
71 132 78
30 98
158
County total 10 - - - 10 - 268 - 268 281 286
Continued

24
TABLE 11 INTERSTATE CAELOT BAIL PASSINGS: CALIFORNIA GRAPES BY CLASS. VARIETY,.AND LOADING STATIONS, 1965 SEASON, WITH CCMRAEATIVE TOTALS 1964 (CotíMÍ^rv-
County and Station
Table Stock
Almeria Cardinal Emperor Malaga Muscat Perlette lia Malaga Ribier Thompson Tokay
Other Ta*ble
"WEST TaMe
MADERA Borden- Madera^.
County total
MERCED Livingston
PLACEE. Roseville
PIYHglBg Coachella Indio Mecca Mira Loma
SAN JOAQUÍN Acampo Ampere Carrolton Dougherty East Side East Stockton Escalón Haight Kettleman Lockeford Lodi Manteca Simms Stockton Van Allen Victor Woodhridge Woodlake Youngs t own
25 31 5
45 18
107
146 111 165
15
32
T Ï
216 162 277
Thermal «, 35 M . _ 220 «. • 362 . mm 617
County total - 96 - - - 390 - - 784 - 2 1272
SM ETOEPPÏO Cucamonga Etiwanda Grapeland
«. _ -
— - - - -
— -
«. M
'County total - - - - - - - - - - - -
15 « 3 • 3 - 46 - 46 2 17 : 19
9 224 - 233
32 1109 ■ (— 1177 - 1 - 1
6 48 - 55
5 123 mm 129 «. 2 « 2 mm 45 .. 45 « _ 54 ... «. 55
County total 35 54 1687 1780
STAlflglAUS East Modesto McHenry Modesto Oakdale Turlock Waterford
County total
SUTTER Yuba City. 35- 75
Cotinty total 75 75
Continued

25
TABLE 11 INTEES TA. TE CAELOT MIL PASSINGS: CALIFOMIA. GEAPES BY CIASS . VAEIETY, AND LOADING STATIONS, 1965 SEASON", WITH CCMPAEATIVE TOTAI5 1964 (Contd.)
County Black Juice White Juice Total Table & Juice
and Station Alicante C^rignane Zinfandel
Other Black
Total Blçick
Total Malaga Muscat Thompson White 1965 1964
MALERA Borden Madera^
"RIVEES IDE Coachella Indio Mecca Mira Loma Thermal
68 75
36 4
County total - - . -;' - - - - - - 40
Livingston 6 - 6 - 12 - - . - 12 38
PLACEE Eoseville - - - 4 4 - - - - - 4 15
216 190 162 121 277 254 75 65 617 547
County total 68 75 1347 1177
SAN EEENAEDINO Cucamonga Etiwanda Grape land .
51 87 32
51 87 J59_
51 87 .32-
72 86 29
County total 170 177 177 187
SAN JOAQUÍN Acampo Ampere Carrolton Dougherty East Side East Stockton Escalón Haight Kettleman Lockeford Lodi Manteca Simms Stockton Van Allen Victor Woodhridge Woodlake Youngs t own
32
46 6
30 31 119
29 28
- 16 - 57 _ 50
39 241 3 _
81 3 7
49
11 100
7 69 17 80 3 53
82 392 11 45 6 209 1 8
35 43 4 55
15 45 20
100 92 3 4
46 53 19
2 69 73
313 345 53 40
1569 1588 46 43
209 177 63 8
8 172 218 57 98 45 47 55 47
County total 271 155 451 177 1054 2834 2906
STANISLAUS East Modesto McHenry Modesto Oakdale Turlock Waterford
1 1
53
48
County total 103
SUTTEE Yuba City
6 25
32
10 43
1 22
121
52
56 196
1 22
121
2 52
198
75
23 32
147 1 3
_2£L 236
Continued

26
TABLE 11 INTEESTATE CARLOT MIL PASSINGS: GALLFOBNU GRAPES BY CLASS. VARIETY, AND LOADING STATIONS, 1965 SEASON, WITH CCMPAMTHE TOTALS 1964 (Contd.)
County Tatle Stock
and Station Sed Other Total Almeria Cardinal Emperor Málaga Muscat Perlette Malaga Eitier Thompson Tokay | .-Table. Table
TULAPE 6 Angola
Cutler 6
«. 2 17 „ _ . M « ' 8 w _ 27 Dinu"ba 7 9 311 . «. 2 1 2 11 130 _ . 473 Bucor 32 138 1 4 15 8 140 6 -. 344 Earlimart 1 1 581 1 6 18 662 6 - >>>;... 1276 Elmco 4 - 233 • 1 22 • - - 13 97 2 • 372 Exeter 30 -. 986 • 1 9 23 37 1 • 1087 Eayette 1 • 8 • . -. 9 Hig-by Hiïlînaid
2 • 24 - • - • 2 2 - - 30 1 2 32 • _ • 4 -. 1 , ,. » - 40
Ivanhoe - • 60 • - • « - 1 - • 61 Jovista 8 • 88 • _ * 1 4 163 1 . 265 Lindsay 1 - 22 « - • - - - - 23 Lois 1 - 29 • • - • - .. —- - - ■-- 30 Merryman Orosi
- - 24 2
- - - - - - - - 24 2
Porterville • • 20 • — «. _ Î . - - 21 Padnor 2 16 368 • 5 1 • 8 440 1 - 841 Payo Ped"banks
1 « 40 . «. 4 • 45 — — 37 . „ «. . • 19 im -. 56
Pichgrove Strathmore
34 6 403 • 7 9 7 15 259 '-. « . 740 3 1 8 - ' - - ' - • - - - 12
Sultana 2 53 • .. 3 — • 26 - - 84 Trocha 62 14 557 1 mm 9 19 526 4 - 1192 Venida - • 43 • - .. - - - - - 43 fisalia 2 - 12 - - - _ - 1 - • 15 Winco _ 26 . «. .. «. _ • « - - 26
County total 194 51 4122 2 21 42 47 ' 122 2522 21 - 7144
GRAND TOTAL 196 35 296 320 6391 5 44 454 80 274 7244 1744 2 16854 GPAND TOTAL 19« 34 270 295 5257 5 51 452 78 418 6056 1776 3 14661
Alameda Contra Costa «. — — - «, • • .. • 1 • 1 Fresno 60 34 1158 2 15 11 14 70 1592 33 - 2989 Imperial 23 • 14 - 37 Kern 35 116 1001 1 i 11 19 82 2278 - - 3551 Kings 3 - - - - - - - 3 Madera • - - - - • • « - • - - Merced - - - • - - • - - - - « Placer « • • - • • - - - • • • Piverside - 96 • • - 390 - - 784 • 2 1272 San Bernardino - • • «. • « • - - - - San Joaquin 4 • 35 • • • • - 54 1687 « 1780 Stanislaus • « - - - - • • • 2 - 2 Sutter • «. 75 . • • « • • - « 75 Tulare 194 51 4122 2 21 42 47 122 2522 21 • 7144
TOTAL 1965 296 320 6391 5 44 454 80 274 7244 1744 2 16854 TOTAL 1964 270 295 5257 5 51 452 78 418 6056 1776 3 14661
Continued

27
TABLE 11 INTERSTATE CARLOT RAIL PASSINGS: CALLFCRNIA GRAPES BY CLASS. VARIETY, AMD LOADING STATIONS, 1965 SEASON, WITH CCMPARATIVE TOTALS 1964 (Contd. )
Cotuity Black Juice White Juice Total ÏEable & Juice and Station
Àlicaîrte Çarignanç zjnfandel Other Pl&çk
Total Bl^çk Malaga M^§çat ThQprpson
Total Wl^Hç 1965 1964
TTOffiE Angola • Cutler - Dinulia 14 Ducor Earlimart 37 Elmco Exeter 8 Eayette - Higby Hillmaid
— -
Ivanhoe • Jovista - Lindsay - Lois — Merryman Orosi
-
Porterville - Radnor 15 Rayo Reabanks
• -
Richgrove Strathmore
4 -
Sri fana • Trocha 16 Venida • Visalia - Winco «.
5
Ï
15
16
39
9
91
58 1
20
5
31
12
39
— 6 ^ — 27 19
92 581 728 344 337
58 1373 1038 1 373 446 - . 1096 971 - • 9 5 - 30 24 - 40 66 « 61 51 — 266 238 1 24 37 - 30 _ - 24 10 _. • 2 - 21 1
12 873 896 - 45 42 _ 56 59
39 784 735 - 12 8 — 84 99 mm 1223 1234 _ . 43 15 - 15 9 . . 26 21
County total 94 1 .- 26 121 1 202 - 203 7468 7089
GRAND TOTAL 1965 GRAND TOTAL 1964
1375 1540
256 449
760 732
672 578
3063 3299
18 9
2582 3000
3 10
2603 3019
22520 20979
RECAPITULATION BY COUNTIES
*lameda . _ 1 ontra Costa 11 • 18 53 82 — _ « «. 83 49 resno 509 56 40 189 794 17 1903 3 1923 5706 5038
Inrperial - - — - • • - - 37 34 Kern 371 12 2 153 538 . 209 _ 209 4298 3882 Kings 10 • - 10 - 268 « 268 281 286 Madera - - - - - - - - - ■ « 40 Merced 6 • 6 -. 12 .. -. — «. 12 38 Placer — - - 4 4 - - mm _ 4 15 Riverside - - 68 7 75 — — -. mm 1347 1177 San Bernardino - — 170 7 177 - • - mm 177 187 San Joaquin 271 155 451 177 1054 .. «. «. mm 2834 2906 Stanislaus 103 32 5 56 196 • -. - mm 198 236 Sutter — « «. - — — mm . 75 Tulare 94 1 • 26 121 i 202 m. 203 7468 7089
TOTAL 1965 1375 256 760 672 3063 18 2582 3 2603 22520 TOTAL 1964 1540 449 732 578 3299 9 3000 10 3019 20979
Source: Copies of train manifests and consists furnished "by the Pacific Fruit Express Company, the Santa Fe Refrigerator Department, and the REA Express•

28
TABUE 12 TRUCK UNLOADS OF ALL GRAPES AT 41 UNITED STATES AND 5 CANADIAN CITIES, 1959-65
City 1959 1960 1961 1962 1963 1964 1965
ALbany, N.Y. Atlanta, G-a. Baltimore, fid. Birmingham, Ala. Boston. Mass. Buffalo, N.Y. Chicago, 111. Cincinnati, Ohio Cleveland, Ohio Columbia, S. C. Dallas, Texas Denver. Colo. Detroit, Mich. Fort Worth, Texas Houston, Texas Indianapolis, Ind. Kansas,0ity, Mo. Los Angeles, Calif. Louisville, Ky. Memphis, Term. Miami, Fla. Milwaukee, Wis. MinneapolisTiSt. Paul, Minn. Nashville, îenn. New Orleans, La. New YorkrNewark Philadelphia, Pa. Portland, Ore. Pittsburgh, Pa. Providence, R.I. Si. Louis, Mo. Salt Lake City, Utah San Antonio, Texas San Francisco~Oakland, Calif. Seattle^Tacoma, Wash. Washington, D. C. Wichita, Kans^
Carlot equivalents
18 25 25 28 25 32 40 209 253 288 252 272 283 369 31 38 24 30 39 45 49 178 193 182 183 184 183 212 13 17 24 56 67 86 69 10 11 13 11 20 12 16
176 211 254 273 334 295 213 51 59 40 40 43 85 110 34 27 67 44 47 67 104 74 85 121 115 112 104 148 319 282 261 309 341 347 377 329 368 323 374 409 339 356 23 49 79 85 135 133 137 66 49 66 89 67 90 63
247 255 204 241 234 178 223 15 17 19 19 46 50 87
196 201 171 221 196 204 231 2874 2887 2602 2719 3000 3037 3684
16 32 31 37 64 58 80 114 112 121 128 110 104 ' ; 88 133 156 175 198 207 188 m 77 69 60 82 75 73 58 216 243 260 244 238 209 175 40 29 14 35 60 44 33
199 201 185 188 232 219 238 8 8 113 80 124 144 141
61 88 81 111 216 202 142 200 231 192 257 286 311 319 17 23 24 32 54 88 110 - 2 5 5 - - 4
187 248 279 312 286 251 330 207 232 198 192 215 187 226 264 252 218 291 234 240 264 755 787 803 915 1036 1137 Îï'83
1/ 332 341 348 372 357 44R 27 27 17 14 19 27 41 83 83 63 85 62 49 56
-Total California grapes 7076 7752 7507 8099 9016 8870 9950 Total Other areas 2/ 391 430 436 544 445 588 583
Total 41 Cities 7467 8182 7943 8643 9461 9458 10533
Montreal. Que. Ottawa, Ont. Toronto, Ont. Vancouver, B. C. W inn ip e g ^Maiu
61 56 66 189 283 152 97 14 20 22 24 27 34 25 68 129 97 109 97 107 128
261 312 363 326 297 429 415 27 50 115 137 118 134 204
Total California grapes Total Other areas 2/
305 126
380 187
495 168
481 304
622 200
549 307
632 237
Total 5 Cities 431 567 663 785 822 856 869
GRAND TOTALS 7898 8749 8606 9428 10283 10314 11402
_l/ Unavaila"ble
_2/ Includes imports.
Source: Fresh Fruit & Vegetable Unloads, Market News Branch, F & V Division, C&MS, USDA, Washington, D.C,

29
TABLE 13 MIL AND TRUCK UNLOADS OF CALIFOMIA GRAPES AT 41 UNITED STATES AND 5 CANADIAN CITIES, 1965
City M) le Stock Juice Stock Total s Rail 1/ Truck 2/ Rail 1/1 Truck2/ Rail 1/1 Truck 3/1 Rail 4 Truck
Albany, N0 Y0 116 29 27 143 29 172 Atlantaj, Ga* 80 353 - 80 353 433 Baltimore, Md0 387 30 11 — 398 30 428 Birmingham, Alaa 31 203 — — 31 203 234 Boston, Mass. 906 41 176 — 1082 41 1123 Buffalo, N0 Y. 257 5 57 — 314 '5 319 Chicago, Illo 1317 141 142 - 1459 141 1600 Cincinnati, Ohio 301 89 6 — 307 89 396 Cleveland, Ohio 527 54 50 - 577 54 631 Columbia. S0 C9 53 136 — — 53 136 189 Dallas, Texo 9 351 - 8 9 359 368 Denver. Colo0 1 323 ♦" 11 1 334 335 Detroit;, Mich. 734 111 149 "" 883 111 994 Fort Worth, Tex, - 63 — ~ •" 63 63 Houston, Tex. 58 220 — —
58 220 278 Indianapolis, Ind. Kansas City, Mo0
34 86 — ~ 34 86 120 17 212 — •3 17 215 232
Los Angeles, Cal. Louisville, Ky.
2 3660 — 5 2 3665 3667 79 70 — — 79 70 149
Memphis, Term. Miami, Fla.
44 82 — 5 44 87 131 67 204 — — 67 204 271
Milwaukee.. Wis« 150 35 10 *~ 160 35 195 Minnea-Dolis-St »Paul .Minn. 238 167 — *■ 238 167 405 Nashville, Tenn. 45 33 — — 45 33 78 New Orleans, La0 51 231 — — 51 231 282 New York~Newark, 3074 125 1167 — 4241 125 4366 Philadelphia« Pa. 873 99 222 — 1095 99 1194 Pittsburgh. Pao 543 59 144 — 687 59 746 Portland, Oregon 49 301 — 14 49 315 364 Providence, Ro I. 68 2 28 *" 96 2 98 * Sto Louis, Mo o 191 208 - 11 191 219 410 Salt LakeóCity, Utah San Antonio« Tex.
8 5
219 261 -
4 8 5
223 261
231 266
San Francisco™Oakland,Cal. 2 1172 4 11 6 1183 1189 <
Seattle~Tacoma, Wash0 64 431 15 7 79 438 517 Washington^ D0 Co 286 20 -=* ■• 286 20 306 Wichita, KanSo
10667
44 "* i - 45 45
Total 41 cities 9870 2208 80 12875 9950 22825
Montreal o Quebec 964 4 671 1635 4 1639 Ottawa, Ontario 76 - 53 *~ 129 " 129 Toronto, Ontario 1033 25 1267 — 2300 25 2325 Vancouver9 BOoC0 41 208 11 203 52 411 463 Winnipeg, Manitoba 19
2133
176 3 16 22 192 214
Total 5 cities 413 2005 219 4138 632 4770
G-RAND TOTAL 12800 10283 4213 299 17013 10582 27595
1/ All rail figures include shipments, if any, "by rail^truck (piggyback) (
_2/ Carlot equivalents o
Sources Fresh Fruit and Vegetable Unloads, Market News Branch, F & V Division^ C&MS, USDA, Wash,, D0 Cc

30
TABLE 14 SHIPPIM^-POINT PRICES OF CAlIPOeNIA. TABLE GRAPES. BY CLASSES AM) VARIETIES, WEEKLY, 1961-65 SEASONS
IHCMPSQN SEEDLESS 1/ 6/
Season June 7
1961 1962 l 1963 5/ 1964 1965
June 12 June 19 June 26 July 3 July 10 July 17
2/5.00 2/4.00-5.00 a/7.00
2/3.25-4.00 2/5". 50
2/5700-7.00
2/3.50-3.75 , a/4,50
2/5750-6.50 2/6.5Ö ¡TOC " " 275700-7 .00
2/3.50-4.25 ; ¿¿4.50
2/4T50-5.00 §74.50-6.50 2/3.50-5.50
4.00-5.00 / 2Z4^0
2/3V50-4.00 2/3.50-4.50
3.50-4.75 i 6.00-6.50 4.00-5.00
2/2.75-5.50 274.00-4.50 1/3.00-4.50
1961 1962 1963 1964 1965
Julv 24 4t£>0-5;00 3.00-3.25
2/2.75-5.50 273.50-3.75 1/4.00-5.50
JL 2.50-2.75 4.00-5.50 4.00-5.50 3.00-5.00
^.50-3.50 2.50-2.75 3.50-4.00 3.50-3.75
5/2.75-4.25
fefl-J6b 2.25-2.50 3.25-3.75 3.00-3.50
¿/2.50-4.25
2.25-2.50 3.00-3.75 ,2.75-3.00
5/2.25-3.25
Hftfed iS_
2.25-2.50 2.50-3.00 2.50-3.00 2.00-3.25
2.25-2.50 2.50-3.00 2.50-3.25 2.00-3.25
Sept. 11 Sept. 18 Sept. 25 Oct. 2 Opt, 9 Oct. 16 Oct. 23
1961 1962 1963 1964 19g5
2.50-3.25 2.50-3,00 2.50-3.50 2.75-3.50 2.00-3.25
2.50-3.50 2,75-3.00 3.00-3.75 2.75-3.75 g.QQ-3.5Q
2.50-3.25 2.75-3.00 3.00-4.25 3.00-3.75 1.75-3.25
2.50-3.50 2.75-3.25 3.00-4.25 2.75-3.75 j.75-3.25
2.75-3.50 3.00-3.50 3.50-4.50 3.00-4.00 1.5Q-5.35
2.75-3.75
3.50-4.50 3.00-4.00 1.50-3.25
2.25-2.75
4.00-4.50
l.g(£3.3S
HEP miAGA
July 17 July 24 July 31 A-ag. 7 Aug. 14 Aug. 21 Aug. 28
1961 1962 1963 1964 1965
4,00 3.25-4.00 2.75-3.00
2.75-3.50 2.25-2.75 3.25-3.50
2.50-3.75 2.25-2.50 3.00-3.25 3.25-3.50
2.75-3.25 2.00-2.50 3.00-3.25 3.00-3.25 2.50-3.50
2.75-3.25 2.25-2.50 3.00-3.50 2.75-3.25 2.75-3.50
2.50-3.25 2.00
3.00-3.50 2.75-3.50 2.50-3.25
1961 1962 1963 1964 1965
Sept. 4 Sept. IX Sept. 18
2.25-3.25 2.75-3.25 2.25-2.75
2.00-2.50 3.00-3.50
2.25 3.25-3.75
EIBIER 4j
July 3 July 10 July 17 July 24 July 31 Aug 7 Aug. 14
1961 1962 1963 1964 1965
(5.00 '6.00 2/6.00
2/6.00-7.00
6.50
2/5.50-6.00 5.25-6.00
5.00-6.00 4.25-4.50
2/5.00-5.50 5.00-5.25 5.50-6.00
4.50-5.50 3.50-4.00 5.00-5.50 5.00-6.50
5/4.00-5.50
3.75-4.50 3.25-3.75 4.50-5.00 4.50-5.00
5/3.75-5.00 M.
3.25-4.00 3.00-3.50 4.00-4.50 3.75-4.50 3.00-4.25
Aug. 21 Aug. 28 Sept. 4 Sept. 11 Sept. 18 Sept. 25 Ogt. 2
1961 1962 1963 1964 1965
3.00-3.75 2.75-3.25 4.00-4.50 3.00-4.00
5/2.50-4.00
2.50-3.25 2.50-3.00 3.25-4,00 3.25-3.75
5/2.50-3.75
2.50-3.00 2.50-2.75 3.00-3.75 3.25-3.50
5/2.00-3.75
2.50-3.25 2.50-3.00 3.00-3.50 3.25-3.50
5/2.00-3.75 M
2.50-3.25 2.50-3.00 2.75-3.75 3.00-3.50 2.00-3.50
2.50-3.25 2.50-3.00 2.75-3.75 3.00-3.50
5/2.00-3.50 M
2.50-3.25 2.50-3.00 3.00-3.75 2.75-3.50 1.75-3.50
Oct. 9 Oct. 16 Oct. S3 Oçt. 30 NQY. 6 Nov. 13 Nov. 20
1961 1962 1963 1964 1965
2.50-3.25 2.50-3.00 3.00-3.50 2.75-3.25
5/2.00-3.50
2.75-3.25 2.50-3.00 3.00-3.50 2.75-3.00
5/1.75-3.50
2.75-3.25 2.50-3.00 3.00-3.75 2.75-3.00 1.75-3.25
2.75-3.25 2.50-3.00 3.25-4.00 2.50-3.00 1.75-3.25
3.00-4.00 2.75-3.25 3.25-4.50 3.00-3.25 1.75-3.25
3.75-4.50 3.00-3.25 3.50-4.50 3.00-3.50 1.75-3.25
4.00-5.00 3.00-3.25 3.50-5.00 3.00-3.75 1.75-3.25
Nov. 27 Dec. 4 Peg. U Peg. 18 Peg. 25 Jan« il fen. 9
1961 1962 1963 1964 1965
4.00-5.00 3.25-3.75 3.50-5.00 2.75-4.00 1,75-3,35
4.50-5.00 3.25-3.75
3.00-4.00 3.00-3.25
3.25-3.50
3.00-4.00 3.00-3.50
3.25-3.50
3.00-4.00 3.25-3.50
3.50 3.50
3.00-4.00 2.50-3.50
3.50
2.25-4.00 2.75-3.25
2.50-4.00 3.75-3.35
Continued

TABLE 14 SHIPPING-POINT PRICES OF CALIFORNIA TABLE GRAPE. BY CLASSES AND VARIETIES, WEEKLY, 1961-65 SEASONS - Contd.
TOKAY
31
Season Aug. 21 Aug. 28 Sept. 4 Sept. 11 Sept. 18 Sept. 25 Oct. 2
1961 1962 1963 1964 1965
3.50 2.25
2.00-3.00 2.00
2.00 1.85
2.25-3.00 2,25-2.75
2.25 1.65 2.25 2.00
2.00-2.25
2.00-2.25 1.75
1.85-2.25 2.00
2.00-2.50
1.75 1.65-1.75
1.7ê 2.00-2.25 1.65-2.25
1.85-2.00 1.7á 1 75
1.75-2.00 1.50-1.85■
1961 1962 1963 1964
Oct. 9 Oct. 16 Oct. 23 Oct. 30 Nov. 6
1.85-2.00 2.00-2.25 1.75-2.25
1.75 1.50-1.75
2.25 1.85-2.10
1.75 1.50-1.75
2.25 1.85-2.25 2.00-2.25
1,5Q-1.75 1.5P-Í.6Q
EMPEPQR
Sept. 18 Sept. 25 Oct. 2 Oct. 9 Oct. 16 Qçt. 22 Oct. SO
1961 1962 1963 1964 1965
2.00-2.50 2.00-2.25
2.25 2.00-2.25
2.00-2.50 2.00-2.25 2.00-2.50 2.00-2.75 1.60-2.25
1.85-2.50 2.00-2.50 2.00-2.75 2.25-2.75 1.5Q-2.5Q
1.85-2.50 1.75-2.25 1.75-2.85 2.25.-2.75 1,50-2.75
1.85-2.50 1.75-2.25 1.75-2.50 2.25-2.75 1,50-2.75 _
Nov. 6 Nov. 13 FQV. 20 ffpv, 27 Pec, 4 Pec, 11 Pec, 18
1961 1962 1963 1964 1965
1.85-2.50 1.75-2.25 1.75-2.50 2.25.-2.75 1,50-2,75
2.00-2.75 1.75-2.25 1.75-2.50 2.25-2.75 1.25-2.25
2.00-3.00 1.75-2.00 1.85-3.00 2.25-2.75 1.25-2.25
2.00-3.00 1.75-2.00 2.25-3.25 2.25-2.75 1.25-2.25
2.25-3.00 1.75-2.00 2.25-3.25 2.25-3.00 1.25-2.25
2.25-3.00 1.75-2.00 2.50-3.50 2.25-3.00 1.35-2.25
2.25-3.00 1.75-2.00 2.50-3.50 2.25-3.00 1.35-2.25
Dec. 25 Jan. 1 Jan. 8 Jan. 15 Jafí, 22 Jafl» 29 Feb. 5
1961 1962 1963 1.964 1955
2.25-3.00 1.75-2.00 2.50-4.00 2.25-3.25 1-35-2.25
1.75-2.00 2.50-4.00 2.25-3.25 1.75-3.00
1.75-2.00 2.75-3.50 2.50-3.75 1,75-3.00
2.25-2.50 2.75-3.50 2.50-3.75 1,75-3.00
2.25-2.75 2.75-3.50 2.50-3,50 1.75-3.00
2.75 2.75-3.75 2.50-3.50 1.75-3.00
2.75-3.00 2.50-4.00 2.50-3.50 1,85-3.00
Feb. 12 Feb. 19 Feb. 26 Eto, 5 Mar. 12 Mar. 19 ter. 26
1961 1962 1963 1964 1965
2.75-3.10 3.25-4.00 2.50-4.00 1.85-3.50
2.75-3.00 3.50-4.75 2.50-4.25 1.85-3.5Q
2.75-3.25 3.50-4.75 2.75-4.25 1,85-3.00
3.60-3.75
3.00-4.50 1,75-3.00
3.00-3.25
3.00-3.50 1,90-3,00
3.75-4.00
3^50 1,90-2.75
3.50 1,95-3,50
Apr. 2 Apr. 9 Apr, 16 Apr. 23
1961 1962 1963 1964 1965
3.50 3.50 3.25-3.75
1/ Prices represent extreme price range of daily quotations reported "by Market News offices in the San Joaquín Valley, except as noted in 2/
2/ Coachella Valley, 24-rb. lug. 2/ Starting with 1965, 26-113. lugs: 1963-64, 27-113. lugs; for prior years, 28-l"b lugs. Applies to all
varieties, except as noted in 2¿ 4/ In 1964 season, week ending Jan. 15, 3.50-4.00; Jan 22. 3.75-4.00: Jan. 29. 4.00: Feh. 5, 3.75-4.50;
in 1965 season, week ending Jan. 15, 2.50-3.00; Jan. 22, 2.50-3.00; Jan. 29, 2.75. 5/ Wide price range attrihutahle to heavy rains July 31, 1965 representing differential hetween pre rain
and post rain picking. 6/ In 1965 season, week ending Oct. 30, 1.50-3.25, Nov. 6, 1.50-2.75, Nov. 13, 1.50-2.75.
Source: Compiled from daily reports issued hy Federal-State Market News Service, Fresno, California.

32
TABLE 15 AUCTION SALES: TOTAL PACKAGES SOLD AND WEIGHTED AVERAGE PRICES OP CALIFORNIA GRAPES BY CLASSES, WEEKLY, 1965 SEASON
Ta"ble ¿jTAice Ta"ble Stock Juice Stock Black Juice White Juice Mixed Juice
Week Ending No.PkgslWta.Av, No .Pkgs | Wtd -Av. 1 No .Pkgs | Wtd .Av, | No ,Pkgs | WtdTÂv NQ.PkgslWtd.^] No.PkgslWtO^T
June 5 1664 12 13437 19 25405 26 32623
July 3 41291 10 26376 17 31288 24 51600 31 64894
Aug. 7 60746 14 69702 21 77362 28 64685
Sept. 4 55055 11 45465 18 54769 25 57390
Oct. 2 58022 9 47402
16 55967 23 65461 30 65728
Nov. 6 64795 13 60134
- 20 74007 27 39910
Dec. 4 38850 11 42285
- 18 35959 25 36878
1966 Jan. 1 24697
8 18159 15 19676 22 17209 29 14754
PeK 5 13747 12 15047 19 12122 26 14436
March 5 13210 , 12 12188
19 13142 26 3211
April 2 3640 9 4728
16 2489 23 1341 30 1259
May 7 1355
$ 8.20 9.31 6.92 5.16 4.46
m Hi 4.39 4.03 3.46 3.81 3.84 3.95 3.82 3.33 3.31 3.39 3.11 2.94 3.07 2.99 2.90 2.74 3.13 3.22 2.95 2.76 2.88
3.06 3.04 3.27 3.20 3.07 3.49 3.47 3.14 3.36 3.17 3.14 3.20 3.63 4.12 4.03 3.78 2.73 3.11 1.70
1664 13437 25405 32623 41291 26376 31288 51600 64894 60746 69702 77362 64685 55055 45465 54769 57390 58022 47402 55967 65461 65728 64795 60134 74007 39910 38850 42285 35959 36878
24697 18159 19676 17209 14754 13747 15047 12122 14436 13210 12188 13142 3211 3640 4728 2489 1341 1259 1355
$ 8.20 9.31 6.92 5.16 4.46 4.73 4.65 3.59 4.22 4.39 4.03 3.46 3.81 3.84 3.95 3.82 3.33 3.31 3.39 3.11 2.94 3.07 2.99 2.90 2.74 3.13 3.22 2.95 2.76 2.88
3.06 3.04 3.27 3.20 3.07 3.49 3.47 3.14 3.36 3.17 3.14 3.20 3.63 4.12 4.03 3.78 2.73 3.11 1.70
NO JUICE AUCTION SALES FOR 1965 SEASON
Ttl. Pkgs,
Wtd. Avg.
1665560 1665560
3.60 3.60
Note: Auction sales at Boston, Chicago, Detroit, New York, Philadelphia and Pittsburgh.
Source: Compiled from daily reports of auction sales reported "by cities in note a"bove.

33
TABLE 16 AUCTION SALES: TOTAL PACKAGES SOLD AND WEIGHTED AVERAGE PRICES OE CALIFORNIA GEAPES, BY CLASSES, 1932-65
Season "Table & Juice Tatle Stock 2/ Juice Stock 5/ Black Juice White Juice Mixed Juice
Pkgs. Wtd .av-$ Pkgs. Wtd „av-$ Pkgs. Wtd ,av-$ Pkgs. Wtd .av-$ Pkgs. Wtd .av-$ Pkgs. Wtd.av4
1932 1933 1934 1935
17,363,628 11¡014'025 12;060 216 11,713,432
0.95 1.17 1.28 1.15
-
- - -
-■ - -
-
- -
1936 1937 1938 1939 1940
9,972,278 11 798 982 9,718 086
10Î005;032 101245¡245
1.40 1.24 1.25 1.24 1.29
6,301,493 6,'185 254 6,508,535
1.32 1.30 1.33
3,416,593 31819 778 3;?36;710
—
1.14 1.13 1.22
- -
- - - - '
1941 1942 1943 1944 1945
9,204,924 7,684 905 3,535 638 5 083;218 31758^995
1.60 2.19 3.33 3.83 2.75
5,792,511 4:721,506 3,201,208 3 096 453 2;590Î163
1.70 2.41 3.34 3.72 2.68
3,412,413 2 963 399 334 430
1,986)765 i;i68;832
1.46 1.85 3.22 3.99 2.91
2,453,231 324)725
1,643 951 934)754
1.87 3.24 4.09 2.91
454,175 6)820
316)249 208)403
1.77 2.62 3.52 2.92
55,99Í 2 885
26 565 25)675
1.73 3.48 3.73 2.68
1946 1947 1948 1949 1950
8,481,483 10 104'536 9,021,075 7 i651,323 7;?68,241
3.63 2.58 2.76 2.61 3.28
6,226,258 7 634;404 6 580 117 5 806,800 6)066',599
3.64 2.61 2.90 2.64 3.28
2,255,225 2 470)132 2;440)958 i)844 523 i;701,642
3.57 2.49 2.38 2.53 3.27
1,842,023 1 956)577 1 943)534 1 414 815 1)289)878
3.61 2.56 2.38 2.51 3.27
337,394 471 325 416 481 365)205 289)908
3.44 2.25 2.38 2.56 3.29
75,808 42 230 80 943 64 503 121)856
3.38 2.25 2.44 2.77 3.23
1951 1952 1953 1954 1955
7,688,246 7 2811890 6 263,573 5,940,994 51943,192
2.46 3A5 3.42 3.65 3.27
6,041,424 5,875,329 5,098,188 4 837,469 5,047,942
3.03 3.26 3.54 3.81 3.32
1,646,822 1 406,' 561 1 165,385 1,103,525 ,,895)250
-2.61 2.71 2.88 2.95 3.00
1,307,798 l)091 723 904)408 854,015 688)854
2.61 2.72 2.90 2.91 3.00
228,298 270 258 200 146 144 625 140)720
2.54 2.64 2.81 3.14 2.96
110,726 44 580 60)831
104 885 65,676
2.73 2.75 2.93 3.02 - 3.02
1956 1957 1958 1959 1960
5,102,440 4 535 540 4 137,029 4 070 508 3,5901500
3.67 3.81 4.14 3.97 3.67
4,226,903 3,805 911 3 429,587 3,366!029 3,107,570
3.77 3.87 4.31 4.11 3.75
875,537 729,629 707)442 704)479 482)930
3.24 3.54 3.30 3.33 3.17
684,486 550 291 537,300 546,866 353)190
3.21 3.53 3.24 3.38 3122
128,446 145)623 125 942 127,048 101)565
3.36 3.54 3.50 3.13 2.97
62,605 33 715 44 200 30,565 28)175
3.29 3.60 - 3.46 3.37 3.25
1961 1962 1963 1964 1965
2,870,725 2,987!ll5 2,448,320 2^043 853 1,665,560
4.33 3.93 4.30 4.22 3.60
2,529,250 2 674 014 2,165)770 1,845,198 l'665°560
4.39 3.99 4.34 4.31 3.60
341,475 313 101 282)550 198,655
3.88 3.40 3.98 3.38
236,725 236)445 181)205 144)360
3.91 3.38 4.02 3.32
76,235 50)050 49)380 34)795
3.84 3.41 4.03 3.55
28,515 26)606 51)965 19)500
3.77 3.59 3.84 3.49
1/ For 1932-44, prices reported to end of calendar year; thereafter prices cover entire marketing season. Complete "breatdovn "by classes not available prior to 1942 e
2/ Ta"ble stock mostly in packages containing a"bo"u.t 28 pounds through. 19625 mostly 27 poimds in 1963 However9 since a"boiit 1959 there has "been an increasing use of special packs rantrincr down to as 1 as 17 pounds.
special packs ranging Low
£/ Juice stock in packages containing mostly 25-42 pounds, with occasional spec in recent years mostly 36-42 pounds. There were no juice auction sales for
ial packs heavier; the 1965 season«,
Notes Auction sales at Boston. Chicago, Detroit, New York. Philadelphia and Pittsburgh«, Prior to 1957 Baltimore and prior to 1945 Minneapolis and St0 Paul also included. Cincinnati discontinued May 31,1960. Cleveland, Jersey City, St. Louis discontinued in 1965.
Sources Compiled from daily reports of auction sales reported in cities noted ahoye.

34
TABLE 17 AUCTION SALES: TOTAL PACKAGES SOLD AND WEISTíTO A'VJüAGE PRICE < DF CALIFORNIA. GRAPES, BY CIASSES AMD VAEIETIES, 1963-65 SEASONS
Variety 1963 1964 1965
Packages Wtd.av.$ ... Packaares Wtd.av.Í Packages Wtd.av.*
mm. STOCK Aimeria 63,345 4.01 56,253 3.55 58,991 2.50 Alexanders - - - - 415 2.99 Beauty Seedless 558 5.42 2,036 4.41 3,783 4.02 Black Eose 145 3.02 2 209 3.18 1 230 3.34 Calmeria 90,471 5.34 871881 5.08 97*329 3.72 Cardinals 144 851 4.62 114Î996 4.45 10i;331 4.35 Comichon 1,026 2.86 255 3.30 - - Crystal Delight
25 2.65 - « -. • 890 4.53 - -
Enrperor 515,006 3.53 385,184 3.56 332,230 2.93 Exotic 3 901 5.27 17 097 5.49 25 513 3-§2 Italia-Muscat 63 Î 617 4.43 56:215 4.42 60 330 3.72 IChandahar 2 160 4.07 2 577 3.75 i\079 3.56 Lady Finger. Malaga (Ëed) N Malaga (White) Muscat (Table)
25 5.00 1 089 3.46 773 3.56 39,748 3.72 16 231 4.18 38,634 §'S 4 082 3.37 6 596 3.08 1 015 2.65 8 117 3.46 11,869 3.00 4,573 3.67
Olivette 6 307 4.14 10 498 3.47 7,774 §'4§ Perlette 51,308 8.20 80 196 6.81 66', 843 6.32 Queen Eed Queen
4; 095 4.17 5 213 3.88 51974 4.53 - 1 240 3.58 - -
Rihier 281,742 4.33 2671072 4.41 221,620 3.91 Rish Baba 50 2.75 - - - - Thompson Seedless 792,561 4.70 653,076 4.53 575,597 3.71 Tokay 92|655 2.78 66,175 2.66 60,526 2.29
Total & wtd.av. 2,165,770 4.34 1,844,873 4.31 1,665,560 3.60
'
JUICE STOCK
Alicante 66,980 4.50 43,090 3.62 • - Garignane 17 015 3.21 11 975 2.19 - - Grenache Malaga (White) Malvoisie
17 580 3.44 lo*, 425 2.97 - - 31920 4.40 - - - -
- — 2,730 2.54 - - Mission 3,125 3.18 3,510 3.56 - — Mixed Black 49 140 3.85 48,345 3.28 - — Mixed Juice 51,965 3.84 19Î500 3.49. - - Mixed White 3 900 3.94 780 - - Muscat 40,000 3.97. 33,685 3.53^ - - Petite Sirah 780 3.82! - - - - Thompson Seedless 1,560 4.643 330 3.75 — — Valdepena 780 3.72 - - — - Zinfandel 25,805 4.10 18,285 3.87 - -
Total & wtd.av. 282,550 3.98 198,655 3.38 - -
Total & wtd.av. all varieties 2,448,320 4.30 2,043,528 4.22 1,665,560 3.60
Notes Auction sales at Boston, Chicago, Cleveland, Detroit, Jersey City, Philadelphia, Pittshurgh, and St. Louis. Cleveland, Jersey City, and St. Louis discontinued in 1965.
Sources Compiled from daily reports of auction sales in cities noted a"bove.

35
TABLE 18 AUCTION SALES: ™Í!A5^SE^S S^D AND WEIGHTED AVERAGE PRICES OF CALIFORNIA GRAPES, BY VARIETIES, WEEKLY, 1965 SEASON, WITH PRICE CCMPARISONS 1962-1965
Week .Ending
1965 June 26 July 3
10 17 24 31
Aug. 7 14 21 28
Sept. 4 11 18 25
>ct0 2 9
16 23 30
Nov. 6 13 20 27
Dec. 4 11 18 25
1966 Jan. 1
Pel),
15 22 29
5 12 19 26
5 12 19 26
Total and wtd-av-
1SS5. June 5
12 19 26
July 3 10 17 24 31
Aug. 7 14 21 28
Sept, 4 11-
Total and •wtd-av-
.Packages 1965
Wtd.average-¿
1965 1964 1963 1962
THCMPSON SEEDLESS
830 19582 18920 26893 37432 37069 38049 39844 48964 40776 33913 25565 34367 30960 23371 17868 24662 26312 20133 14148 10005 5718
126
6.49 5.08 5.27 4.59 2.96 4.26 4.30 4.10 3:353.'■; 3.74 3.^62 3.87 3.69 3.34 3.54 3.77 3.13 2.90 3.07 2.88 2.14 1.55 1.85
9.53 7.74 6.08 5.11 4.52 5.02 5.49 4.67 4-Î33 3.64 4.17 4.66 4.82 m 4.30 4.10 4.01 4.98 5.59, 6.14 5.50
90 6.64 5.13
8.11 6.85 4.90 4.11 4.75 5.28 6.01 5.72 4.80 3.90 3.67 3.92 4.25 4.36 4.18 4.40 4.99 5.29 5.39 5.42 6.23 5.04 6.89
3.40 1.26
6.49 5.34 5.01 5.16 4.15 4.98 4.52 3.57 3.25 3.60 3.49 3.89 3.91 3.73 4.02 4.38 4.66 4.81 4.44 4.33 7.63 2.27 2.84
2.03 1.91
575597 3.71 4.53 4.70 4.22
PERLETTES
1419 13237 16780 13894
6987
8.57 9.33 7.02 5.91 4.33
418 4.67 6953 5.21 5349 2.93 1020 1.74
786 1.67
15.25 9.65 8.65 6.86 3.83 4.43 7.57 4.92 3.33
8.43 7.55 7.79 3.12
4.71
7.72 7.66 5.23
5.12 3.37 2.88
66843 6.32 6.81 8.20 fi.fls
.Packages 1965
1800 4267 3612 9395 4954 3369 4588 3599 1850 1200
"B ;GL. averagers'
1965 1964 1963 I2S2. EEL MIAGA
3.89 ■7 HO
4.05 3.25 3.58 3.65 3.40 2.73 2.22 2.28
3.25 4.60 4.82 4.28 3.40 3.49
2.70 1.94
3.71 4.08 4.49 4.04 4.08 3.81 3.08 3.13 2.28
3.03 3.39 3.16 2.82 2.92 2.95 2.70 2.28
Packages 1965
38634 3.53 4.18 3.72 2.98 221620
1319 3386 7068 10383 8403 9822 8923 8051
10369 10594 8311 9359
14069 13123 12579 14482 15936 8054 9282 9521 7947 5408
3226 2611 2485 2846 945
1459 884
350 130 180
Wtd.average-&
1965 1964 1963 1962
mm
6.74 5.54 4.38 3.53 4.44 4.43 4.29 4.14 3.84 4.35 4.58 4.16 3.48 3.53 3.50 3.67 3.44 3.63 3.73 3.57 3.28 3.65
4.22 4.67 4.41 4.29 4.87 3.74 3.27
5.00 3.27 3.40
4.0° 6.39 5.60 4.95 4.24 4.38 4.69 4.60 4.39 3.67 3.66 3.91 4.07 4.40 4.24 4.25 4.81 4.82 4.56 4.60 4.77 4.96 4.59
5.50 5.21 5.13 4.86 4.76 4.66 5.14 4.61
6.20 5.93 5.16 4.07 3.73 4.46 4.70 5.10 4.21 3.42 3.79 5.01 5.18 4,61 4.55 4.94 5.30 4.80 4.02 3.85 3.45
3.83 3.00 3.56 3.16 3.47 2.10 1.89 2.13 2.65
Hñ Z.fíl
EXOTIC
500 4.23
3850 9790 9629 1569
175
5.83 4.07 2.98 3.50 3.56
6.75 6.77 6.09 4.58 4.09
6.18 5.51 5.30 3.63 5.23
- 4.22
35515 3.89 5.49 5.27 S.36
CARLINAS
5fc63- 6.18 4.95 3.99 3.89 3.64 3.38 4.08 4.30 3.65 3.59 4.15 4.40 4.04 3.85 4.01 4.75 4.54 3.7/ 3.59 4.11 3.88 4.17"
4.35 4.19 5.28 7.20 4.68 4.17 4.64 4.75 7.04
3.91 4.41 4.33 4.06
7676 16629 13603 7456 3477 7215
20599 12188
8523 3070
565 200
12£L
6.90 4.58 3.84 3.39 5.17 5.32 4.26 4.12 3.60 2.53 1.51 3.20 2.43
10.57
6.34 5.25 4.58 4.14 4.20 3.89 4.21 4.14 5.14 4.50 4.43 2.77
8.03 5.77 4.91 4.54 4.72 4.48 4.82 4.09 4.30 4.55 4.57 2.61 3.74
6.36 4.95 5.03 3.58
4.61 3.24 3.13 3.51 3.20 2.56 1.53
101331 4.35 4.45 4.fi2 4.1 fi. Continued

36
TABLE 18 AUCTIOT SALES: TOTAL PACKAGES SOLD AND WEIGHTED AVERAGE PRICES OE CALIFORNIA GRAPES, BY VARIETIES, WEEKLY, 1965 SEASON, WITH PRICE COMPAPISONS 1962-65
Week Packages 1965
V^ ;rl .averacre-í Packages. 1965
Wtd.averaee-i Packages. W ;d.averaee-S Ending
1965 .1964. 19fi3__ 1962 1965 1964 1963_ 1962 1965 1964 1963 1962
1965 June 5
EMCP EEAWï ymwss wswmtL ffiAIMRAES 245 6.10 « «» _ _ ' M _ M .. ' .. mm — M -
12 200 8.58 4.06 - — - - - - -- - — mm mm - 19 949 5.15 - 6.28 3.42 - - - - - - - mm mm - 26 1270 3.71 6.97 - 3.04 - - — - « - — mm mm —
July 3 1119 2.16 4.01 - - - - - - . - - mm .mm - 10 - - 2.82 - - - - - mm - — - mm mm -
Aug. 21 - - - » « - « - - _. 140 4.62 mm mm - 28 - - - - - - - - ^. -. 549 3.20 - - -
Sept, 4 - - - - - - - - - - 340 3.73 -. - - 11 - ~ - - - - . - - « - 50 3.45 - — -
Dec, 11 -. - ~ — _ 50 2.30 - « - - . - - - - 18 - - - - - . 155 3.02 - - - ~ mm - - mm
25
Jan., 1
- - - - .- 90 3.24 - - - - - mm -
«. .» «. _ «. 120 3.04 „ «. ^ .. mm mm -. ..
Total and wtd.av. _ 3783 4.02 4.41 5.42 3.36 415 4.02 - -. - 1079 3.56 - — -
IIALIA-UÜSCATS QJrfHETTES. m ITEI'MAGiAS 1965 July 31 558 6.23 - — - - - - - - - - - — - Attg. 7 453 6.36 - - - - - - - - — — — ■ - —
14 210 7.20 5.01 6.00 4.08 « ~ - - - — M - - - 21 778 6.26 5,96 5.34 4.77 - - - - « ._v- — - — - 28 2210 5.55 5.24 4.33 3.57 - - » - - -. - — -
Sept. 4 4787 4.42 4.63 4.26 3% 42 - ~ » - - - - - - - - 11 5289 4.00 3.83 4.52 3.96 M. - - - - - - - - - 18 5064 4.43 4.25 4.45 3.92 200 4.50 5.39 - 3.84 - - 3.50 3.17 25 4164 3.60 4.04 5.13 3,36 - — 3.48 4.95 3.38 - - « - 2.64
Oct. 2 4648 3.55 3.97 4.62 2,86 1247 1.38 3.14 4.52 3.44 - mm - - 2.28 9 1760 4.23 4.70 3.60 3.64 1040 2.96 2.82 3.85 3.49 M ~ - 3.08 2.74
16 3793 3.58 4.50 4.06 4.59 675 2.76 3.96 4.13 3.55 - - 3.05 3.16 3.06 23 3968 3.57 4.70 4.97 4,00 1281 2.83 4.26 4.45 3.24 144 2.82 2.79 3.71 2.93 30 3571 3.79 4.79 4.57 3.90 882 3.09 3.75 3.48 3.03 217 2.23 2.72 3.10 2.85
Nov. 6 3861 3.34 4.97 4.31 4.08 1094 2.79 3.17 - 1.50 287 2.91 3.16 3.14 3.75 13 2707 3.22 6.08 5.13 5.53 545 2.11 4.01 - 2.20 287 2.66 3.83 3.56 4.37 20 2894 3.30 5.00 4.83 290 1.76 — - - - 3.26 3.42 3.89 27 2485 2.83 4.29 _ 100 1.25 - - - 80 2.50 4.00 3.51 3.28
Dec. 4 1394 2.32 - 4.48 - 420 1.25 « - - — - mm - - 11 779 2.67 - - « — — -. - - ' - — - - - 18 452 2.60 - — - - - - -. - - - - - - 25
1955 Jan. 1
490 2.50 - - - - - - - - - - -
1515 2.48 „ _ ^ _ — ^ mm — _ « — — — 8 630 1.99 - - - - - « « - — - - -. -
15 740 2.11 - - - - - - - - — - - -. — 22 970 2.26 - _ - - - - - - - — « - - 29 160 2.57 - _ - -,-,. « - - -. - - _ - -
Total and _ 60330 3.72 4.42 4.43 3.77 7774 2.48 3.47 4.14 3.37 1015 2.65 3.08 3.37 3.10
Continued

TABLE 18 AUCTICH SALES: TOTAL PACKAGES SOLD AND WEIGHTED AVEBAGE PRICES OF CALIFORNIA G-RAPES, BY VARIETIES, WEEKLY, 1965 SEASON, WITH PRICE COMPARISONS 1962-65
37
Week Packages : 196g
Wtd .averaere-á> Packages. 1965
WM.averaere-S Packages 196g
Wi ?d.ayçï^RÇ"$ Ending
1965 1964 1963 1962 1965_ 1964 1963 1962 . 1965 1964 1962 1962
m 9 a^WHQPP. AIMEBIAS, ÇAI^EI^S.
390 3.02 4.02 2.65 3.55 «. .- «. 3.00 «. _ • - 4.00 4.70 16 7101 2.62 3.27 2.88 3.39 « - 3.17 3.16 3.74 9.5 5.00 — 6.43 4.61 23 6885 2.95 3.03 2.95 3.23 _ . 4.08 3.96 1071 3.60 5.45 6.20 5.04 30 20841 2.78 3.06 2.80 3.05 957 2.75 3.33 4.23 4.13 3104 3.92 4.31 5.01 4.94
* Nov0 6 24796 2.53 3.43 2.15 2.68 3781 2.97 4.24 3.87 3.72 4249 4.23 4^ 4.63 4.74 13 17892 2.33 3.44 2.70 2.87 5673 2.81 4.38 4.60 3.81 8543 3.73 5.46 4.83 5.03 20 27414 2.23 3.21 3.70 3.33 10790 2.55 4.68 4.53 3.95 10965 3-^ 5.42 4.85 5.15 27 12792 2.80 3.32 3.53 3.20 9562 2.67 4.27 4.59 3.85 .6711 3^§ 5.48 4.87 5.02
Dec « 4 13036 2.77 3.39 3.25 3.00 6795 2.91 3.25 4.04 4.21 7923 3.92 4.74 4.93 5.23 11 18682 2.50 3.55 3.32 2.88 5972 2.66 2.69 3.60 4.09 7281 3.61 ¿•¿5 4.97 5.07 18 16696 2.45 3.54 3.43 2.84 5448 2.25 2.85 2.29 3.36 5261 3^i 4.60 6.04 5.23 25
.1966 Tan. 1
18537 2.49 3.44 4.06 3.44 4006 2.25 2.78 4.79 3.44 8257 3.56 4.51 6.74 5.02
12307 3.91 3.73 4.39 3.26 2735 1.51 3.06 1.25 3.24 4794 3.71 6.51 6.64 5.11 8 10625 2.83 3.80 3.75 3.07 . 3.05 2.26 3.04 4293 2 -SQ 6.03 6.30 6.25
15 10654 2.80 3.74 3.69 3.26 150 2.37 2.84 2.00 1.36 5647 3-^6 5.53 6.11 6.42 22 9310 2.97 3.97 4.31 3.84 - 2.28 2.11 2.34 4083 3.21 5.09 5.11 6.26 29 10782 2.70 4.65 4.64 3.72 100 2.00 2.32 -. 2767 3.99 4.47 6.82 6.79
FeK 5 8822 3.20 4.75 4.76 3.40 40 1.53 - - - 3426 4.16 4.63 7.49 6.82 12 10634 3.45 4.31 4.79 3.50 500 1.25 - - ■ — 3029 3.98 5.39 8.22 8.12 19 7797 3.46 4.51 4.04 4.28 1750 .50 - • — 2575 3.95 4.79 12.25 8.48 26 11510 3.25 4.12 4.04 4.28 410 1.38 -o - - 2166 4.06 5.22 9.69 —
Mar« 5 12114 3.18 4.30 4.26 4.85 252 2.21 3.25 -> — 714 3.21 4.89 7.33 2.95 12 11648 3.13 4.28 6.06 4.48 70 2.25 3.78 — - 290 3.30 5.87 — "t
19 13057 3.21 4.75 6.22 4.22 - ~ — — — 85 2.76 5.13 — a
26 3096 3.67 4.46 7.74 4.18 - • - - — — - — — "" Apr« 2 3640 4.12 3.69 6.87 6.00 — — — — — — — — - ""
9 4728 4.03 3,17 - 5.73 - — 1.19 — — — — — ■" * 16 2489 3.78 3.29 » - 5.85 - — — — — — — — — 23 1341 2.73 3.01 - - - — — — — — — — - — 30 1259 3.11 3.18 - — - - — — - — - — — -0
May 7 1355 1.70 1.81 «. _ . . — — — — «• — — "•
Total and wtd «av « 332230 2.93 3.56 3.53 3.39 58991 2.50 3.55 4.01 3.81 97329 3n72 5.08 5 «24 5n21
■,965 on Lug. 28 >epto 4
IAN FINGERS QUKEfJS BIACK KOSE
75 4.03 _ ■OP «» 1143 5.02 6.80 4.43 3.75 - - - - - 80 2.55 . -, -> 684 4.89 5.45 4.74 4.70 100 4.62 5.30 — —
* 11 _ M — 699 5.41 4.07 4.81 3.96 - - 3.72 - — 18 75 2.75 4.34 «. — 1064 5.39 3.99 3.72 2.99 200 3.60 3.35 — 3.33 25 42 4.90 4.22 - - 1243 3.91 3.72 4.82 3.56 260 3.27 §•55 3.02 3.02
0c-to 2 197 3081 3.11 - -, 564 4.52 3.49 3.98 4.05 280 3.32 2.64 — 2.56 * 9 160 3041 3.24 .. -, -, - 3.48 2.69 3.10 150 3.21 3.00 — 2.82
16 72 3.75 3.24 „ -, - - 3.05 - - 100 3.00 - — — 23 72 3.75 . -. 577 1.89 4.00 - - 140 2.61 - - -
Total and 773 3.56 3.46 5974 4.53 3.88 4J7 . 3.71 1230 3.34 3.18 3.02 3.38
19Ç5 Sept.11
TdtAIS T/U3IÍ: MUSCATS,
1290 3.05 3.19 3.39 2.96 150 4.51 3.94 3.63 -, P 18 960 3.00 3.45 3.47 2.76 200 3.58 3.41 4.25 3.95
25 6753 2.56 2.92 2.97 2.60 » _ 2.98 4.60 3.02 Oct. 2 14722 2.34 2.38 2.50 2.96 549 4.15 2.93 4.19 2.50
9 13459 2.27 2.28 2.78 3.03 3064 3.68 2.81 2.79 3.29 16 9500 2.25 2.61 2.83 2.07 610 3.00 2.76 3.53 3.60 23 10942 2.09 2.55 2.77 -. -• - 3.18 3.57 3.52 30 2900 lo98 2.71 2.51 - - - 2.81 3.65 3.48
Nov. 6 « _. - - « - - 2.97 2.97 - 13 =- _ « - - _ - — 3.98 - 20 «a M - - _ -, » - - 4.30 27 ^ . «. «. _ - «
3.00
.í,.75„
3,46
3.91 Total and wtd.&v« 60526 .2.29 2.66 2.78 2f88 4573 3.67 3.1Z_
Continued

38
TABLE 19 AUCTION SALES: TOTAL PACEAGES SOLD AND WEIGHTED AVERAGE PRICES OF ARIZONA GRAPES BY VARIETIES, WEEKLY, 1965 SEASON, WITH PRICE CCMPARISONS 1963-64
Packages 1965
Wtd. avera£re-í Packages 1965
Wtd. averacre-¿ Packages 1965
Wtd. averaee-í Week enâincr 1965 1 1964 í 1963 1965 | 1964 1963 1965 | 1964 | 1953
omnmL EXOTICS f ffEKUByffi
June 26 1,605 4.61 8.85 4.87 «. M - _ 620 6.45 6.39
July 3 10 17 24 31
4,208 5 980 5 715 2',548 i;032
3.03 5.64 3.47 4.42 2.85 3.43 2.27 1.99 3.43 1.37
4.84 4.10 3.87 4.26
312 1,090 5 327 6,309
5.50 - 5.54 3.44 5.72 2.92 2.06
4.71 3.47 3.39
12,429 4.25 8.11 - 4.59 - 2.99
5.44
Aug. 7 «. - 0.50 _ 5,618 2.18 1.26 3.02 - - -
Total and wtdo av„ 21,088 3.02 2.99 4.59 18,656 3.03 2.14 3.98 13,049 4.35 4.28 6.09
THCMPSON SEEDIESS TQÏ£L A£L VARIETIES
1965 June 26 - - - 2,225 5.23 8.85 5.70
July 3 10 17 24 31
1,153 8 136
22 186 23^856
4.20 - 3.47 4.94 3.08 4.45 2.66 2.80
5.21 3.75 4.17 5.02 5.85
16,637 7)445
14)941 30,061 31)197
3.94 6.01 3.67 4.55 3.38 3.41 3.08 3.17 2.64 2.55
5.23 3.92 4.19 4.60 5.38
Ang. 7 18,333 2.24 2.37 4.27 23,951 2.22 1.91 4.01
Total and Wtd„ av0 73,664 2.80 2.99 5.05 , 126,457 2.96 2.99 4.84
NOTE: Auction sales at Boston, Chicago, Detroit, New York, Philadelphia, and Pittsburgh.
Sources Compiled from daily reports of auction sales reported "by cities in note alcove.

39
TABLE 20 AUCTION SAKS: TOTAL PACKAGES SOLD, WEIGHTED AVERAGE ERICES AND VALUE OF CALIFORNIA GRAPES, BY CITIES AND VARIETIES, 1965 SEASON
City
Boston Chicago Detroit New York Philadelphia Pittsburgh ïotal and wtd. av.
Packages Wtd^v,-^ Value
415
AKE^mg
2.99 1,240
415 2.99 1,240
Packages Wtd.av.-$ Value
4,669 15,339 4 515
20,823 7,162
2.59 2.37 2.27 2.67 2.39 2.45
12,113 36,339 10,238 55,513 17 146 15,858
58,991 2.50 147f207
Packages Wtd .av .-$ Value
BLACK BEAUTY SEEDLESS
1,495 97
935 1,256
5.46 3.50 3.12 3.01
8,171 340
2,915 3 783
3,792 4.02 15,309
Boston Chicago Detroit New York Philadelphia Pittsburgh i'otal and ^td» av.
BIACK ROSE
100 1,130
3.66 3.31
366 3,744
5,955 26 180 3,269
41,864 7,750 12 311
3.16 4.03 3.24 3.82 3.55 3.24
18,827 105,572
10 602 159,733 27,508 39,902
4,055 17 661 11,657 51 485 13,118
3 355
CAPDIMIS
3.84 4.73 4.30 4.32 4.14 4.53
15,563 83,-521 50,166
222 636 54 324 15 187
Boston Chicago Detroit New York Philadelphia Pittsburgh Total and wtd. avQ
1,230 3.34 MIO- 97,329 3.72 362f144 101,231 JL25 441.297
15,119 43,434 12,017
183,320 52,862 25,478
EMPERORS
2.50 2.82 2.42 2.88 2.66 2.91
37,830 122 348 29,024
528,517 140,445 74,241
3,824 218
18,290 3 181
EXOTICS
4.73 6.13 3.69 3.88
ITALIA-MUSCATS
18,108 1 336
67,418 12 336
268 12,674 3,800
40,775 2 613
200
2.94 4.01 3.38 3.69 3.46 3.78
790 50,830 12,-862
150:393 9 008
756
Boston Chicago Detroit New York Philadelphia Pittshurgh Total HisL
and av.
Boston Chicago Detroit New York Philadelphia Pittsburgh Votai and vtd. ay.
Boston Chicago Detroit New York Philadelphia Pittsburgh Total and wtd. av.
332,230 2.81 932f405 25,513 3.89 99,198 60,320 3.72 224f639
150 80
740 109
KH^PAIÎ^g
5.26 3.25 3.45 2.27
IAPY FiTOHff
789 260
2,551 247
1,079 3.56 2,847
Boston Chicago Detroit New York Philadelphia Pittsburgh Total and wtd. av.
PEELETTES
12,277 31488
34,894 14 919 1,265
7.59 5.37 6.68 4.58 7.32
93,202 18,724
233,183 68,313 9,265
66,843 6.22 422,687
17,485 48,964 9,326
110,346 22,123 13,376
RIBIEPS
3048 3.88 3.36 4.18 3.54 3.34
60,807 190,213 31,298
461,252 78,473 44,659
221,620 3.91 866f702
520 1,740
12,693 31,640 9,594 4,339
TOKAYS
2.25 1.86 2.40 2.36 2.13 2o06
1,170 3,243
30,537 74,563 20,487
8,927
357 144 135 137
3.94 3.75 3.22 2.71
1,407 540 435 372
42 1,471
722 4,542
997
OLIVETTES
1.85 3.31 3.11 2.49
.78
77 4,870 2 244
11,304 777
JffiL 3.56 2,754 7,774 2.48 19,272
3,812
1,440 722
QUEENS
4056 17,400 2,535 9:401
4.53 4.40
6,527 3|l74
17 5
,401 764
5,974 4.53 27,101
TABLE MUSCATS
100 3.05 305 1,016 3.94 4,001
200 3.50 700 2,550 3.75 9,556
617 3.22 1,986 90 2.42 218
4,572 3.67 16,766
WHITE MALACxAS
288 2.66 766 144 1.82 262 583 2.79 1,664
§:i
,855 ,559 ,520
HEP MALAGAS
3.18 3.41 3.15 3.31 3.52 3.32
8,066 32,063 2'411
59,-090 19,548 8,380
38,634 3.53 129,558
THCMPSON SEEDLESS
25,236 145,484 49'! 084 249,855 80,459 25,479
3.10 4.07 3.16 3.86 3.31 3.29
78,252 592,354 152 233 965,170 266:472 83,869
575,597 2.71 2,138,350
60,526 2.29 138,927 1,015 2.65 2,692
Source: Compiled from daily reports of auction sales in the a"bove cities.

40
TABLE 21 SEMI-MONTHLY COLD STORAGE HOLDINGS OF GEAPES IN CALIFORNIA, BY VAELETIES, 1961-65 SEASONS
(Number of packages)
Season J./ August September October November
15 I 31 15 30 15 31 15 30
1961 1962 1963 1964 1965
- -
5,260 3,630 2 840
20,640 82,370
ERFEKGR
172,240 376¡860 626,710 950¡560
1,460,840
1,410,810 2¡805,840 3 356 360 3,640¡800 4¡688¡I60
3 5 4 5 7
,390,690 851 030 682 750
,825¡410 .579,920
3,724,270 6 147 560 4 397 630 5,779,720 8.094,100
3,363,200 5 551 -540 3 618 570 5,191,420 6¡839¡350
1961 1962 1963 1964 1965
- - sea.
2,730 290
AIMERIA
12,000 42,860 20,870 31¡620 68,190
150,120 190,120 200,820 373¡420 398¡280 1
446,950 478,060 526,670 762,900
,143,090
388,990 475 130 370,970 592 840
1.207¡840
242,710 302 810 247,750 415,840 858¡520
m 1963 1964 1965
1
1
,570
290 ,000
75,150 53,600 43 870 21,900 961560
187,190 183Î790 202,400 420 670 478 440
RIB1EH 315,690 467,680 542,130 887 630 738;410
458,580 612¡420 500,820 859¡060 818 140
426,100 559¡820 500,860 876¡100 888¡790
255,780 569¡840 343¡730 646,200 715¡510
176,360 428,630 247¡130 408,980 504¡130
1961 1962 1963 1964 1965
20 20 21 29 33
,870 890 060
,360 ,680
637,870 972!300 140 350 640 060
1,899!330
THCMPSON SEEDLESS 984,660 920,420 390,280
1,125¡840 790¡370 251¡680 1,134,200 828¡220 307,160 1,735,050 1,293,100 504,590 2,536,220 2,166,580 1,089,520
118,090 48,090 81¡700 71¡170
409¡180
60,800 15¡380 28,140 11¡320
217,030
15,330 9 960
20,790 3,640
115,130
1961 1962 1963 1964 1965
- 22,940 1,000
22¡910 21,520 39 910 51,210
MALAGA 10,060 44¡920 39¡890 58 170 56.930
12,670 50,630 50¡370 70 400 63,750
16,510 56,340 53,600 68¡150 73¡190
14,160 53,950 46,310 67¡970 67¡650
9,040 48,630 44,270 50 990 62¡230
1961 1962 1963 1964 1965
-
-.
7,300 61¡640
800 1,700
TOKAY
40,320 278 310 100¡190 147 600 143,056
12,210 106 800 173¡480 188 170 338,920
2,500 12,070 38¡340 60,400
155¡530
1,960 14¡390
8 590 55¡310
2,700
8,230
1961 1962 1963 1964 1965
590 80
7,460 28 740
5 860 9,950
74,780
75,550 45,610 46,120 79¡170
112.070
OTHERS
77,090 96¡400
102,290 109¡400 152,150
74,350 86 130 46,620 55¡270
147¡730
49,690 114 540 30,540 35,080 82,330
23,000 83¡280 20,190 14¡990 98¡320
9,700 52,810 14 ^90 12,670 53¡750
1961 1962 1963 1964 1965
22 20 21 30 33
,440 890 940 440 680
720,480 1,077 580
190,080 671,910
2,070,670
ALL VARIETIES 1,260,960 1,547,820 2,509,020 1 443,620 2 097,400 4,103,620 1 407¡880 2,260,300 4,635,630 2 299¡870 3 478 080 5,691 710 3 260 600 4 786,150 7 544 500
4 7 5 7
10
,450,530 119 950 914 460
¡699 210 332 030
4,467,000 7 347 100 5¡221,360 7¡121¡630
10 445¡760
3,816,340 6,394 380 4,196,000 6,083,540 8¡441,340
Continued

41
TABIE 21 SMI-MOITTHLY COLD STORAGE HOLDINGS OF G-EAPES IN CALIFORNIA, BY VARIETIES, 1961-65 SEASONS—-Continued
(Number of packages)
Season 1/
December January February March April 15 -21. J5. J Si- 15 28 JLS. JUL J£. J 2ÛL
EMPEROR 1961 2,568,980 2,128,110 1,793,520 1,403,910 1,109,170 855,160 619,970 1962 4Î180Î230 3!329!o60 2Î630Î650 1 793)810 i;310;280 765^940 424;480 1963 2!-618Î830 1Î884Î500 1)488)460 1)084,870 656)700 403)760 160)730 1964 3)944)230 3)277,170 2)739,410 2)222)930 1,797,730 1,461 130 1,097)560 1965 5)368 090 4,251,980 3)538,620 2)926)460 2)l58)650 l)710)850 i)181¿340
371,890 128)040 36)570
721)060 697,800
204,060 3 520 4 760
458)830 342)920
1/ In some years, small quantities of some varieties in storage "before August and after April. 2/ Includes Calmería0
74,040
295,-020 140)690
AIMERIA 2/ 1961 85,710 26,440 6,550 2,990 1,870- 1,020 750 - _ • 1962 1081700 471790 9 830 2 710 920 360 240 • - « 1963 105,400 54^350 25 670 22)820 10,220 4,770 4,770 2,810 - • 1964 210 080 143,140 103 190 57 440 41 430 26)720 16 400 11,400 2,960 1,240 1965 552;080 338;350 195;530 136)270 81)140 30)240 17,490 9,860 6,100 4)140
Rrnrn 961 87,510 46,320 19,310 1,190 10 • « • • •
1962 277 ,'610 215,820 152 840 73)540 27,230 5,150 800 • « - 1963 162,520 118;470 86 330 62)760 41)710 24)460 13,180 • « • 1964 276,020 175;050 140,830 90)980 55)870 22 840 4)880 1,000 • • 1965 314Î210 2371380 188)020 127 550 79 170 47,550 23)950 7,390 - -
TEJCMFCQN SEEDWSS 1961 4,780 1,160 260 _ M • «, « • - 1962 1 810 - « - • • « « - - 1963 9,290 880 870 870 870 - -. • - - 1964 430 320 • • • • - • - - 1965 53,540 50,710 5,860 - - -■ - - - -
MOAGA 1961 4,370 860 -. « • . • • • • 1962 40^210 27,220 10,830 1,190 - - • • • • 1963 29,460 19,430 13)270 7)410 3,010 1,270 • • - • 1964 44*030 40^880 35)340 26)260 15)420 7)970 3,520 2,390 1,750 1,750 1965 60,180 54,680 51)770 49)910 48)170 46)320 44)970 43)430 — -
961 .962
TOEAY
«. «. — — «, «. — _ _ «, 1963 .. • _ • - mo • « mm • 1964 — - — — _ _ — — - - 1965 3,000 - - - - - - - - -
OTHETRS 1961 2,560 M _ M «, _ « _ _ _ 1962 41,930 23,970 19,570 10,940 5,610 1,590 — . mm mm
1963 11Î870 71300 4^800 1,150 -> - • . mm
1964 6^790 41750 3 900 3)200 - - • - • - 1965 34,960 18,850 14,340 12)210 11,600 1,450 - - - -
ALL VARIETIES 1961 2,753,910 2 .202,890 1 ,819,640 1 ,408,090 1,111,050 856,180 620,720 371,890 204,060 74,040 1962 4,650,490 3 643,860 2 823,720 1 882)190 1)344 040 773)040 425 520 128)040 3,520 1963 2,937,370 2 084,930 1 619;400 1 179)880 712 510 434)260 178)680 39)380 4 760 • 1964 41481 580 3 641 310 3 022,670 2 ,400)810 1,910)450 1 ,518)660 1 ,122)360 735)850 463 540 298,010 1965 6,386,060 4,951,950 3 994)140 3 252)400 2 378)730 1 836)410 1 )267 750 758)480 349,020 144)830
Source: Semi-monthly Cold Storage Reports, Federal-State Market News Servicep San Francisco, California.


43
Al
**
miSIN MAMETING
COT2MTS
'. í '■'■'.:. ,.. " . v..'"'- ■ Page
Review of the 1965 Season 44
Shippents and Pistgj'buti.çfi
Ta*ble-
1 California raisins: Industry shipments of free tonnage - "by months and varietal types, 1965-66 season . . t . . . ......... f • . •••••••••••••••• 46
2 California raisinsî Industry; shipments through all outlets., 1956-65 crop years ...... 46
3 United States exports of raisins ïîy countries of destination, crop year averages 1938-42 to 1958-62, crop years 1052-64, and September-March 1960-b5 *.......... 47
4 California raisins: Grower deliveries to handlers, weekly, 1965 crop ••••••••••• 48
5 California raisins: G-rower deliveries to handlers, 1956-65 crop years • • . . . 49
Production and fffrUizatim
6 Indicated raisin lay "based on aerial photo surveys, 1962-65 crop years . . . .'. . . . . . . 50
7 Natural raisins: Acreage and production "by varieties, California, 1956-66 crop years • . • 50
8 Production of raisins and currants in specified countries, Í953-*65- and 5-year averages, 1938-42 to 1959-63 . . . ;.'. . . . . . ¿ ........... ... 51
9 California raisins: Quotations to growers in the San Joaquin Valley, 1965 and 1964 crops . 52
10 California raisins: Quotations to growers and average farm value for all varieties, 1939-65 .;....... • ..... 53
11 Quotations on the United Kingdom market for specified countries, weekly, August 28, 1965- July 30, 1966 ... # ............ •••..•... 54

44
General
Cash return to California raisin producers averaged $230.00 per sweat "box ton for all ya^ieties of natural and dehydrated raisins of the 1965 crop, $5.00 less than the revised 1964 average and $5.10 a"bove the 5-year average 1960-64. Tonnage failing to pass incoming inspection and held for reconditioning reached a geak of 115318 tons, substantially aTsove the low record of the 1964 crop, "but well "below the 48,405 tons eld in the 1963 crop.
Quality of the crop was generally ordinary. Temperatures during much of the summer were "below average and the crop was slower in maturing than usual. The record heavy yields may also have contributed to the slow sugar development. Many growers "began to harvest "before the desired* sugar content had "been reached, in order to reduce the risk of possible damage from early fall rains. As a result, there was an unusually high dry-away ratio of 4.77 tons of grapes to produce 1 ton of raisins. Harvesting at low sugar content also resulted in a high proportion ox rather light meated raisins of low moisture content. Color was good.
Free tonnage movement of 139.065 tons of all varieties of raisins to domestic market channels during the 1965-1966 season (September-August) fell 3.7 percent "below that of the previous season. Free tonnage export of all varietal type raisins amounted to 8,289 packed tons, 17.9 percent more than in the 1964-65 season.
G-ovemment purchases of 15,601 packed tons of natural raisins from the surplus pool, for distribution to the School Lunch and Needy Persons Program was especially encouraging to the industry. This program was further augmented late in July "by announcement of the governments intention to purchase an additional 10,610 packed tons for the same program for delivery "between September 1966 and January 1967* No similar program was in effect during the 1964-65 season.
The leading export market for California raisins was again Japan, followed "by the United Kingdom, Denmark, Sweden. Finland, Germany, Norway and Ireland. Japan aï sorbed in excess of 36 percent of the 1965-66 season's exports.
Field yiarketj-ng Activity
Field trading followed the customary pattern of active delivery to processors on open contract "basis during «September-OctolDer. Initial firm price offers to growers were established just "before mid~0cto"ber at $250,00 per sweat "box: ton on natural Thompson Seedless, $250.00 for Golden Seedless^ $225.00 for Sultanas, and $230.00 for loose Muscats. These prices remained stable during the active trading season. Zante Currants were quickly absorbed at $250.00 per ton, $10.00 higher than the preceding season.
Packers evinced very little interest in 100 percent equity purchase of natural Thompson Seedless raisins. Trading of a limited tonnage on this "basis was transacted at $175.00-$!80.00 per sweat "box: ton.
Supplies
Grower deliveries to processors of all varietal types of raisins for the 1965-66 crop year amounted to 270,460 sweat "box tons.
This was the second highest production since 1947 "being exceeded only "by the 1952 crop of 288,000 tons. Natural sun dried raisin production of 252,200 tons was remarkably close to the estimate of 254,000 made "by the California Crop and Livestock Reporting Service early in Octooer 1965.
Dry-away ratio of the 1965 crop was 4.77 to 1 on 1,297.000 fresh tons. This was 50.3 percent of the total raisin variety tonnage, compared with 51.4 percent in 1964 and 47.3 percent in 1963.
Free tonnage carry-in inventory September 1, 1965 totaled 26,849 tons, consisting of 24,214 tons of Thompson Seedless, 1,674 of Muscats, 54 of Sultanas, 669 of Golden Seedless and 240 of Zante Currants. Comparable carry-m was 22,060 tons in 1964 and 23,123 in 1963.
Export shipments of all raisin varieties during the marketing year 1965-66 totaled 59.670 tons, including 51,380 tons from the Thompson Seedless surplus pool. They were 16.3 percent heavier than the 1964-65 exports of 51,320 tons including 44,287 tons from surplus.
The Foreign Agricultural Service of the U. S. Department of Agriculture reported that exports to the world market from the principal foreign producing countries of Australia, Greece, Iran, Turkey, Cyprus. South Africa and Spain were 290,000 snort tons. This was second only to the record 305,300 tons m 1962. Including the 70,600 tons exported from the United States, the total of 360,600 tons was the largest on record«

45
Marketing Order Program
The raisin industry again operated under regulations estatlished under Federal and State Marketing Orders o
The Federal Marketing Order "under direction of the Eaisin Advisory Board and Administrative Committee
Department of Agriculture.
The fee for this service amounted to $1.65 per ton and vas "borne "by producer and packer alike.
Under the auspices of the State Marketing Order, a vigorous sales promotion program vas pursued in addition to research effort seeking nev areas for expansion of raisin usage and consunrption. These activities vere supported "by assessment ox $2.50 per ton levied upon producer and processor alike.
Marketing of the surplus natural Thompson Seedless pool vas accomplished through eight offers at $202o50 per ton. and four additional offers at $192.50, vhich resulted in sales of 51f488 tons to packers for disposition in eligible foreign countries.
In order to make California raisins conrpetitive vith foreign offerings, an incentive payment plan of $5.00 per ton vas adopted "by the Eaisin Advisory Committee. This incentive payment vould apply on all tonnage purchased in excess of quotas "based upon historical records of individual country import associations or responsible "buyers. The quotas vould "be "based on the period January 17, 1966 through November 1966.
As of Octoher 31, 1966. there vere 29,721 sveatbox tons remaining uncommitted in the 1965-66 surplus pool, he U. S. Department of Agriculture purchased 10.930 tons on January 6, 1967, at $187 „50 per ton for istrihution through the Needy Persons and School Lunch Program. Later in the month 9,907 tons vere sold
no vintners for distilling purposes at $56.61-$60.00 per ton, leaving 8,884 tons still uncommitted at the end of January 1967.
Tvo offers of reserve pool natural Thompson Seedless raisins disposed of 24,853 tons at $275065 per ton. The "balance of 11,301 tons remaining in the reserve pool on August 1, 1966 reverted to the surplus pool o

46
TABLE 1 CALIFORNIA MIS INS: INDUSTRY SHIPMENTS OF FREE TONNAGE BT MONTHS AND VAEIETAL TYPES, 1965-66 SEASON
(September 1, 1965 - July 31,1966)
Month Natural Thompson
Natural Muscat
Loose Seeded Layer Sultanas G-olden Seedless
Soda Dipped
Zante Currants
Other varieties Total 1/
Surplus Exports
September Octo"ber November December January February March April May June July August
13558 17487 13617 10219 8608 9263
10313 8584 8087 8585 7675 10988
i?
r
Tons * Packed Weight Basis
465 — 470 290 393 217 141 9 107 2/ 96 2/ 42 - 80 - 46 2 62 -
103 4 247 -
36 120 52 30 44 62 71 67 22 41 59 47
3096 3441 1942 908 510 649 496 423 487 492 772 1770
4 6 5 4 9
670 603 444 173 235 144 169 89
116 91 56
252
17 17842 41 22451 43 16723 19 11498 10 9514 61 10275 38 11148 22 9271 43 8808 26 9302 49 8728 14 13326
11093 4407 3198 3456 7914 5678 4540 3743 4522 4292
-*, 7529 17 6609 Í
Total 126984 24 2252 522 651 14986 42 3042 383 14886 66981
1/ Individual items may not add to total due to rounding. 2/ Includes 333 tons Domestic School Lunch Program. 3/ Less than 1 ton,, 4/ Includes USLA Aid to Needy People; January 5392 tons, February 2306, March 1261, April 1331, May 1296,
June 1332, July 1332, August 1018; total 152680
Sources California Crop and Livestock Reporting Service, Sacramento, California,,
TABLE 2 CALIFORNIA RAISINSs INDUSTRY SHIPMENTS THROUGH ALL OUTLETS, 1952-65 CROP YEARS
Crop year Sept0 1-Augo 31
Natural Thompson
Muscat Loose &. . Seeded 1/ Layer
Sultanas Golden Seedless
Sulphur Bleached
Soda Dipped
Zante Currants
Other Varieties Total 2/
Tpne - Packed weight bas 5ÍÍ5
1952 156,709 6,489 1,401 1,164 21,673 255 - 3,584 194 191,469
1953 152,977 5,815 1,434 1,418 12,072 169 - 3,042 175 177,102
Í954 153,436 5,627 1,288 1,935 13,840 46 15 2,718 - 178,905
1955 188,590 4,950 969 1,086 20,195 30 - 2,801 - 218,619
1956 167,475 4,401 1,218 764 14,291 11 - 2,505 - 190,664
1957 139,835 4,359 913 736 13,571 6 134 3,665 - 163,219
1958 123,673 3,859 542 532 12,770 - 2,634 2,769 - 146,778
1959 126,658 3,949 690 917 11,452 - 582 2,776 - 147,025
1960 132,593 4,020 635 761 14,441 - 106 2,887 72 155,515
1961 138,074 2,994 578 613 12,682 - 43 2,961 197 158,143
1962 160,507 3,059 550 826 12,486 - 2/ 3,717 262 181,407
1963 149,349 2,711 533 602 11,904 - 1 3,774 291 169,165
1964 132,490 2,352 512 785 13,025 - - 3,273 239 152,676
1965 126,984 2,276 522 651 14,986 - 42 3,042 383 148,886
1/ Also includes Valencias in 1955, 1956, 1958, 1959, 1963 and 1964,, See Table 5 for tonnages, 2j Includes domestic, export, and surplus export shipments and government purchases«
Individual items may not add to total due to rounding. 2/ Less than one ton*
Sources Raisin Administrative Committee, Fresno, California.

TABLE 3 UNITED STATES EXPORTS OF RAISINS BY COUNTRIES OF EESTIMTION, CROP YEAR AVERAGES 1938-42 TO 1958-62, CROP YEARS 1952 ^4, AND SEPTEMBER I'. lEH 1960-65
47
Crop year -"beginning September 1
Belgium Denmark Finland Franóe West Germany-
Ireland Nether« lands
Norway Sweden Switzer- land!/
United Kingdom
Avers i ere 1218 746 476 1003 124: 2018 3777 - 967 3335 1938-42 36404
1943- •47 2029 11 6 146 19915 977 870 267 584 364 43813 1948- •52 3421 106 1346
473 71 9433 2299 4406 1063 1881 2003 28456
1953- '57 1666 2870 1 3395 3051 3383 2666 3817 1164 >■ 10984 1958- •62 991 2978 1347 . 258 . 2285 2195 1473 1738 3476 967 7920
Crop T95T
year 3139 33 66 4239 3417 5729 5240 5645 2450 , 49950
1953 2229 9 — 7 4506 2407 3780 3197 3935 1590 - 25367 1954 2003 131 - - 909 5157 2579 2973 2830 1025 99 1955 1485 7412 2256 - -7885 4938 7040 3716 4472 972 18642 1956 1556 3923 109, , « 2582 1378 2255 2675 '4229 1413 10759 1957 1057 2874 - . - - 1094 1375 1263 769 3621 r 819 55 1958 643 1782 - 22 685 1638 1005 682 3006 739 ,. 2984 1959 1091 3210 1717- -, 224 • 2799 1949 1590 2240 3977 895 7938 1960 1308 3517 964 336 3855 2998 2635 2356 3489 1138 11455 1961 965 3872 2704 . 321 2434 2908 1348 2320 ,3962 1170 11779 1962 949 2509 1349 386 1653 1483 789- 1091 2944 893 5444 1963 855 3230 2796 323 2093 2006 1631 1707 3341 942 6846 .964 771 3437 2126 450 2262 1561 769 1886 3124 1021 8042
rífek -Marc k.(From preliminaiy monthly reports) 1950 1171 2881 817 280 3224 2818 2437 " 2029 2524 1038 8552 1961 843 3208 1522 ' 252 2079 2886 1311 1897 3495 1143 10685 1962 678 1645 797 280 1060 775 568 821 1926 685 3391 1963 772 2767 1740 266 1550 1998 1539 1339 2520. 905 - 5824 1964 592 2631 1441 , 435 1306 1295 676 1454 2474 847 5054 1965 748 2983 2439 377 1604 1675 954 1792 3110 850 6071
Crop year "beginning Ott16^ September 1 Europe
Total Europe Canada Mexico Hong Kong
2/ Japan
New Zealand
Other Countries
Total except
Europe ¿/ Grand Total
1943-47 1948-52 1953-57 1958-62
year
953 -954 1955 1956 1957 1958 1959 1960 1961 1962 1963 1.964
1961 1962 1963 1964 1965
996 51064 5269 533 1051 2 331 3455 10641 61705 1070 70052 13237 764 538 13 345 4507 19404 89456 1482 55967 8752 752 1059 1889 233 4606 17291 73258
. 41 33511 9822 1184 831 892 307 5449 18485 51996 221 25849 7104 1845 395 7965 791 3924 22025 47874
.357 80265 10144 1129 994 4413- 5282 21962 102227 36 47063 10329 1198 1526 848 . 5348 19249 66312 7 17713 9838 936 678 1140 279 5346 18217 35930
99 58917 8875 1088 665 1492 360 7997 20477 79394 57 30936 11059 1478 1066 509 528 4981 19621 50557 - 12927 9008 1220 218 473 369 3573 14861 27788 - 13186 4722 1334 148 54 283 3509 10050 23236
342 27972 8424 1601 402 996 1006 4099 16528 44500 264 34315 7756 2133 498 11600 1084 3824 26895 61210 306 34089 8142 1968 530 15405 1022 4220 31287 65376 : 191 19681 6476 2191 395 11772 562 3969 25365 45046 210 25980 7151 1843 564 14797 878 4856 30089 56069 280 25730 6080 1926 468 15234 810 5316 29834 55564
nary 199
monthly reports) 27970 5558 - 1530 344 9739 772 5195 23138 51108
.81 29402 5605 1460 391 11295 70S. -3205 22661 52Ö63 108 12734 4560 1752 -235 8765 311 2515 ; 18138 30872 132 21352 4901 1543 245 10916 421 3217 21243 42595 295 18500 4063 939 325 9670 367 3703 19067 37567 215 22818 4524 1654 239 11449 776 3992 22634 45452
1/
2/
Included with Other Europe for years not shown. ......
Includes China through April 1948 and Kwantung through: Sept embuer 1939.; ■? .■■■■''■ ';"'■
May indluife small guantities exported to listed countries "because of changed procedure in compiling statistics after 1952. ..- ..„.^ :- , .,■■■„ :- . t.-. ,..-•; i- , :; v: .
Source: 1938-1942 compiled from Foreign Commerce and Navigation of the United States, 1943-1964 from FT 410, monthly reports of the Department of Commerce. Bureau of the Census. Includes exports under the lend-lease, UNRRA and similar programs and exports under Department of Army Civilian Supply Program "beginning January 1948. Shipments to U0 S. armed forces ahroad not included.

48
TABUE 4 CALIFORNIA. MIS INS: GRCWER EELIVERIES TO HANDLERS, WEEKLY, SEPTEMBER-AUGUST, 1965 CHOP YEAR
Week Ending
Natural Thompson
Natural Muscat
Layer Muscat
Natural Sultana
Golden Seedless
Zante Currant
Others Total
Cumulative Total
m Sept. 11 15
18 452 25 3374
Oct. 2 10079 9 17593 16 21944 23 29636 30 31650
Nov. 6 30682 13 22549 20 13524 27 9243
Dec. 4 15900 11 10649 18 6777 25 2760
1966 Jan. 1 1460
8 1542 15 1639 22 1205 29 1296
FeK 5 1447 12 782 19 755 26 546
March 5 446 12 680 19 755 26 1214
April 2 321 9 246
16 365 23 385 30 54
May- 7 261 14 8 21 126 28 159
June 4 50 11 42 18 6 25 20
July 2 81 9 2
16 90 23 283 30 208
15 29 102 98
299
557 586 356 233
357 181 46 238
18 5
42 31 55
3 8
43
24 63
7 3
36
40
3 109 212 282 230
137 3
17
Toas - Sveafrboz "basis
3 28
81 83 59 40 95
81 96 38 32
21 21 22 2
40 1 4
1
25
3
2266 2373 2263
2205 1982 1872 2404 1354
683 72 40
11
5 11 2
15
27 7 85 25
22 10
774 1025 510
291 203 140 21 52
95 25 30 10
11 23 4
5 14 2
1 2
30 1
36 10
36 2 14
121 50
26 30 74 1
9 10 2
15
14
6
1
22
12
6
12
38
3055 3862 6175
3055 6917 13092
12710 20001 24343 32602 33730
25802 45803 70146 102748 136478
32261 23361 14062 9536
168739 192100 206162 214698
16298 10884 6851 3015
231996 242880 249731 252746
1498 1554 1686 1253 1370
254244 255798 257484 258737 260107
1453 790 820 549
261560 262350 263170 263719
449 - 722 810
1282
264168 264890 265700 266982
326 293 384 388 117
267308 267601 267985 268373 268490
288 62
211 209
268778 268840 269051 269260
53 73 16 20
269313 269386 269402 269422
93 2
90 321 208
269515 269517 269607 269928 270136
Total to date 2/ 243303 2/ 3528 993 794 2/ 18057 3317 468 2/ 5/ 270460 2/ 2/ 270460
1/ Includes: Soda Dipped raisins and Valencia raisins. 2/ Includes very light deliveries in August 1966. 2/ Includes 320 tons in late August 1965.
Source: Raisin Adminstrative Committee, Fresno, California.

49
TABLE 5 CALIFORNIA RAISINS: GROWER HELIVERIES TO HANDLERS, 1956-65 CROP YEARS
Crop Year Natural Thompson
Natural Muscat
Layer Muscat Valencia Sultana
Golden Seedless
Sulphur Bleached
Soda Dipped
Zante Currants Other Total i/
Tons ■ - Sv^fbox "basis.
1956 174,827 4,148 1,841 371 876 15,028 - - 3,139 200,230
1957 138,888 4,368 1,901 - 759 13,739 - 361 3,611 -: 163,627
1958 134,549 4,045 1,073 1,029 705 13,978 - 3,052 3,109 ■- 161,540
1959 198,745 5,292 1,241 141 997 11,888 - 108 3,492 - 221,905
1960 170,264 2,717 1,137 - 743 15,713 - 147 3,325 3 194,049
1961 205,554 2,276 1,173 - 815 12,783 - 11 3,527 252 226,391
1962 168,286 3,820 1,232 - 837 12,391 - 1 3,748 311 190,626
1963 197,427 2,242 1,129 37 749 12,212 - 1 3,400 273 215,410
-964 207,844 2,787 1,229 40 824 13,717 - - 3,785 366 230,591
965 243,303 3,528 992 18 794 18,057 - 41 3,317 409 . 270,460
1/ Individual items may not add to total due to rounding.
Source: Raisin Administrative Committee, Fresno, California.

50
TABLE 6 INDICATED EAJSnr IAT MSED ON AERUL PHOTO SUHVEYS, 1962-65 CHOP YEÂPS
Survey 1962
Acres l»i*
Trays l&m. wt. per acre I per tray
1963 Acres laid
Trays |Gm0 wt. per acre|per tray
1964 Trays
per acre Grn. wt, per tray
1965 Acres laid
Trays per acre
&m# wt. per tray
Acres laid
First 36,000 500 22.6 20,200 780 22.0 56,400 750 21.4 35,800 880 21.8
Second 49,000 570 22.0 47,000 840 21.5 80,500 770 21.8 68,000 955 21.8
Third 70,200 640 22.1 73,000 880 21.2 99,800 790 21.9 87,500 970 22.1
Fourth 80,900 645 22.1 90,600 895 21.2 104,700 790 21.9 99,100 960 22.2
Fifth 84,500 650 22.0 103,700 900 21.2 108,700 790 21.9 106,900 970 22.1
Sixth 86,400 650 22.0 108,000 900 21.2 109,500 790 21.9 107,800 965 22.1
Seventh 86,700 650 22.0 - - - - - - - - -
Area 1/ total 86,700 650 22.0 108,000 900 21.2 109t500 790 21.9 107,800 965 22.1
1/ The area covered (Madera-Kingslmrg) produces a"bout 95 percent of the State's raisin tonnage.
Source: California Crop and Livestock Eeporting Service, Sacramento* California.
TABLE 7 MTUEAL RAISINS: ACREAGE AND PRODUCTION BY VARIETIES, CALIFORNIA 1956-66 CROP YEARS
* THCMPSON TEAT Vä ar
SKKDI.NSS OTHER NATURAL TOTAL NATURAL WEIGHT ie Acres Acres Acres
Harvested Production Harvested Production Harvested Production Green Dry
Acres Tons Acres Tons Acres Tons Tfts. n>s. 1956 87,000 184,600 5,600 10,000 92,600 194,600 NA NA 1957 76,900 1391100 4^900 10^700 81,800 149,800 NA NA 1958 79*000 158.700 5,200 9,100 84,200 167,800 NA NA 1959 101,000 200,520 5!500 11,080 106,500 211,600 21.8 5.13 1960 95,000 170,500 4,100 7*900 99,100 178*400 22.0 5.30 1961 104,400 208,100 5,600 7,900 110,000 216,000 22.4 4.86 1962 99;ioo 168;200 5,100 9,650 104;200 177,850 22.0 5.40 1963 108,900 244,250 5,100 9,900 ii4;ooo 254,150 21.2 4.86 1964 112,000 207,900 4,500 9,100 116,500 217,000 21.9 4089 1965
Ü 109,000 243,400 4,600 8.600 113,600 252,000 22.1 4.60
1966 108;500 237,000 4,100 9,000 112,600 246,000 20.7 4.88
1/ Revised. 2/ Prel iminary 0 NA Not Available„
Source: Raisin Administrative Committee, Fresno, California«

51
TABLE 8 PRODUCTION OF MISINS AND CURRANTS IN SPECIFIED COUNTRIES, ANNUAL 1953-65, AND 5-YEAR AVERAGES, 1938-42 TO 1959-63
Raisins Year
California I?1 Argentina Chile Greece Iran Spain Turkey Cyprus Australia
Sultana! Lcxia South Africa
Total 2/ Raisins
Averaflf« 233.8 5 .2 2 .0 28 .7 34 .1 9.5 58 .3 2.0 62.8 9.9 11.1 i9S8=?2 457.4
1943-47 290.1 5 .7 1 .3 18 .4 32 .5 9.4 58 .3 2.0 58.3 9.4 11.6 497.0 1948-52 235.3 6 .5 1 .0 32 .5 45 .0 10.0 74 .0 5.4 49.3 5.5 §•5 473.0 1953-57 197.9 7 .4 0 .8 55 .0 62 .9 14.0 72 .0 7.6 66.1 9.9 8.-2 501 .-8 1958-62 204.4 4 .9 0 .8 61 .6 60 .6 13.0 88 .8 8.7 73.2 9.-0 7.-1 532,1 1959-63 220.5 5 .1 0 .8 63 .9 59 .8 12.0 87 .6 8.7 70.1 8.6 7.2 544.3
Anntifll 233.0 7 .7 0 .8 55 .0 54 .0 15.0 76 .0 7.3 78.3 12.4 9.9 549.4
1954 168.0 5 .5 0 .8 47 .0 55 .0 11.0 72 .0 7.5 69.9 15.6 10.7 463.0 1955 225.0 8 .3 0 .9 52 .0 66 .0 13.0 44 .0 7.8 66.7 10.0 8.9 502.6 1956 200.0 11 .5 0 .7 51 .0 68 .0 16.5 110 0 7 7 45.5 5.5 5.7 522.1 1957 163.0 4 .1 0 .8 70 .0 72 .0 14.5 58 .0 7.3 70.2 6.2 5.8 471.9
L958 186.0 3 .0 0 .8 47 ,0 69 .0 16.5 72 .0 2.1 77.2 9.4 7.7 490.7 1959 223.0 6 .0 0 .8 69 .0 67 .0 14.2 105 .0 7.3 74.9 8.7 6.3 582.2 1960 194.0 6 .0 0. .8 29 .8 44 .0 14.9 74 .0 10.6 56.1 10.5 7.0 447.7 1961 228.0 5 .9 0. .8 65 .5 68, .0 10.0 94 .0 11.8 68.3 7.7 6.7 566.7 1962 191.0 3 .5 0, .8 96 .5 55. .0 9.4 99 ,0 11.8 89.5 8.5 7.7 572.7
1963 4/ 266.0 4 .0 0. .8 59 .1 65. .0 11.6 66 .0 1.8 61.8 7.8 8.5 552.4 1964 232.4 4 .4 1. .0 77, .5 39. .0 12.7 78 .3 8.4 94.7 8.9 9.5 566,8 1965 272.0 3 .9 0. .8 107. .0 47. 0 11.0 132 .0 9.0 92.7 11.9 9.7 697.0
Currants Year
Australia Greece South Africa Argentina 2/ Total Currants Total Raisins and Currants 2/
tee 24.1 107.3 0.9 132.3 589.7 '943-47 20.1 57.7 1.1 _ 78.9 575.9 948-52 16.6 88.0 1.0 _ 105.6 578.6 ^953-57 14.5 86.8 1.1 _ 102.4 604.2 1958-62 11.5 102.4 1.0 0.6 115.5 647.6 1959-63 10.4 100.6 0.9 1.0 112.9 657.2
Airaual 1953 18.8 81.0 1.1 100.9 650.3 1954 14.9 86.0 1.1 • 102.0 565.0 1955 12.7 72.0 1.0 _ 85.7 588.3 1956 14.9 100.0 1.1 - 116.0 638.1 1957 11.8 95.0 1.0 - 107.8 579.7
1958 13.2 94.0 1.2 0.8 109.2 599.9 1959 12.5 89.0 0.9 ■ill 103.5 685.7 1960 8.7 107.0 1.2 1.0 117.9 565.6 1961 14.5 102.0 0.9 117.4 684.1 1962 8.7 120.0 0.8 129.5 702.2
1963 7.5 85.0 0.8 I 93.3 645.7 1964 12.4 86.0 0.9 99.3 666.1 1965 13.5 87.0 0.9 101.4. 798.4
1/ Includes Zante Currants. 2/ Does not include product! on in Afghanistan or other countries for which statistics are not availa"ble. 2/ Not separately classified prior to 1958. 4/ Includes 49,000 tons subs tandard rain-damaf jjed stock.
Source: Reports of the Foreign Agricultural Service, U.S.D.A.íWashington, D. C. and reports of the California Crop and Livestock Reporting Service, Sacramento, California.

52
mBLE 9 CALIFORNIA MIS INS s QUOTATIONS TO OROA/EBS IN THE SAN JOAQUÍN VALLEY FOB STANDARD GRADE NATURAL CONDITION RAISINS, 1965 AND 1964 CROPS
1965 crop
Date Thompson Seedless Sultana Golden Seedless
Muscat Free Tonnage|100$ Tonnage Natural | Layer Zante Currants
Dollars Per Ton 1/ 1965 Oct. 14
20 28
250 250 250
210 175
225 225 225
230 230 200
Nov. 4 12 18
250 250 250 ! 180
225N 225N 225N
230N
Dec. 9 1966 Jan."13
28
250
250 250
175-185
180 175
•" *•
225
250 250 250N
250N 250N 250N
250 250
1964 crop Date Thompson Seedless
Sultana Golden Seedless Muscat
Free Tonnage IIOO36 Tonnage Natural | Layer Zante Currants
Dc pllars Per Ton 1/ 1
1964 Oct. 1 - • _. 270-280 .. 275 "' 235-240
8 _ - - 270-275N - ■ -■ 235-240 15 - • - — 270-275N . - 240 23 250 - 225 - 240 27 5N 235-240 29 250 215 225 - 240 - 240N
Nov. 5 250 215 225-23( 3 ' ^ 240 Ä 240 12 250 215 225 - 240 - « 19 250 215 225 - 240 - - 25 250 215 225N - 240N - -
Dec 0 3 250 215 225N _ 240N — «. 10 250N 215N 225N - 240N - - 16 250N 215N 225N • 240N - -
1955 Jan. 7 250N 215N - <~ - - •
28 25 ON
1/ Delivered packing plant or packer's receiving station. Quotations represent level of most trading and do not necessarily show extreme price range.
N - Nominal
Sources Raisin Market Bulletins, Federal-State Market News Service, Sacramento, California.

53
TABLE 10 GAXrraeNIA MIS INS: MINIMUM AND MAXIMUM qüOTATIONS TO GRCWERS FOR STAJEAED GRADE EAISINS AND AVERACT EAEM VALUE TOR ALL VARIETIES, 1939-1965
Crop year 1/ Natural Thompson Natural Muscat Natural Sultana Zante Currants Av. farm value all varieties 2/
1939 1940
1941 1942 2/ 4/ 1943 , 1944 4/ 1945
1946 1947 1948 1949 1950
L951 L952 1953 1954 1955
1956 1957 1958 1959 1960
1961 1962 1963 1964 1965
Dollars per ton - ffweafrbox "basis
37.50-50.00 50.00-60.00
70.00-100.00 100.00 155.00 180.00
200.00-215.00
250.00-350.00 100.00-140.00 120.00-140.00 130.00-142.50 200.00-275.00
160.00-175.00 150.00-170.00 150o00-165.00 170.00-180.00 160.00-172.50
185.00-199.10 235.00-305.00 330.00-425.00 200.00-210.00 210.00-215.00
215.00 225.00-285.00
250.00 250.00 250.00
40.00-50.00 50.00-61.00
70.00-92.50 100.00 165.00 195.00
215.00-225.00
270.00-340.00 100.00-135.00 130.00-175.00 130.00-165.00 240.00-300.00
160.00-180.00 150.00-165.00 160.00-170.00 180.00-200.00 200.00-215.00
215.00-225.00 230.00-275.00 200.00-350.00 150.00-185.00
165.00
225.00-275.00 240.00-275.00 240.00-250.00
240.00 230.00
37.50-45.00 45.00-52.50
65.00-75.00 105.00 150.00 180.00
200.00-210.00
240.00-325.00 80.00-120.00
115.00-125.00 115.00-125.00 230.00-275.00
150.00 140.00-155.00 140.00-150.00 130.00-170.00 140.00-160.00
170.00-180.00 220.00-250.00 310.00-350.00 150.00-185.00 175.00-190.00
180.00-190.00 225.00-250.00 220.00-230.00 225.00-230.00
225.00
265.00-280.00
300.00-375.00 135.00-150.00 140.00-160.00 140.00-160.00 235.00-285.00
150.00-160.00 150.00-165.00 175.00-185.00 200.00-210.00 185.00-215.00
275.00-300.00 240.00 325.00
210.00-225.00 190.00-200.00
200.00 210.00
210.00-220.00 235.00-240.00
250.00
48.50 57.60
85.50 113.00 164.00 200.00 203.00
312.00 132.00 134.00 135.00 261.00
167.00 156.00 159.00 175.00 172.00
190.00 264.00 315.00 196.00 212.00
204.00 266.00 204.00 , 235.00 5/ 230.00
1/
2/
3/
4/ 5/
In years of quantity control, price ranges are for "free tonnage" only, free percentages were as follows:
Years of control and
Year Thompson Muscat Sultana Zante
1940 1949 1951 1952 1953 1954 1955
* **
3Q$ _ 49% 100%
IOO79 100%
3 75%
lOOyo 100%
Year Thoroson Muscat Sial tftm Zante 1956* 1956** 1959 1960 1961 1963-64 1965
Average of all varieties, grades, and qualities including "bleached raisins and Zante currants. Includes amounts realized from various pools in years of quantity control. 1944 includes incentive payment and payments from profits on fresh grapes handled by the Eaisin Producers Association. Includes damaged raisins sold to distillers.
Premium for hauling allowed for short period in October hut this feature abrogated on undelivered crops "by maximum price order effective October 14.
Prices established by WFA support program and CPA maximum price regulation.
Revised.
Sources Eaisin Market Bulletins, Federal-State Market News Service, Sacramento, California. Average farm value from reports of the California Crop and Livestock Reporting Service, Sacramento, California.

54
TâBIE 11 ERICE QUOTATIONS FOR RAISINS ON THE UNITED KINGDOM MARKET FOR SPECIFIED COUNTRIES, WEEKLY, AUGUST 28, 1965-JULY 30, 1966
Week Turkey Greece Australia Iran United States •
Ending No* 9 No* 10 No* '¿ No* 4 Nat* 4-Cro"wn b-Crown Maragha/Urmia Nat * Tñomp * See&fess
Cents (U.S.) per pound _l/
1965
Aug. 28 16. 8 17, ,2 _ _ 17 ,4 17, 8 _ _ Sept* 4 16, 8 17. ,2 - - 17, A 17 ,8 12 8 >■ - .
11 16, 8 17, ,2 -' - 17 A 17, ,8 _■ 18 .6 18 16, 8 17, ,2 _ _ 17 ,2 17, ,6 - , 25 - - - - 17, A 17, ,6 - 1.8. .6 .
Oct* 2 _ 17, 0 _ _ 17, A 17, ,6 _ _ 9 16, 8 17, ,2 - - 17, A 17, ,6 - 18 ,8
16 16. 6 17, 2 _ _ 17, A 17, 6 _ 18' ,0 23 16. 6 17, ,2 _ _ 17 A 17, ,6 ^ 30 16, 6 17 2 - - 17 A 17, ,6 - 18 .5
Nov. 6 16, 6 17, ,2 _ _ 17 A 17, ,6 _ 18 ,0 13 16, 6 17, .0 _ _ 17 A 17 ,6 _ 18 .0 20 16. 6 17, ,2 _ _ 17 A 17 ,6 _ 18 .0 27 16. 6 17. ,2 - - 17 A 17 ,6 - 18 .0
Dec* 4 16, 6 17 ,2 _ _ 17 A 17 ,6 _ 18 .0 11 16. 4 17 ,0 - - 17 A 17 ,6 - . 18 .0 18
"25 1/ 1/ 1/ 16.6.
2/ 17 •i/ 17
■i/ 2/ 18
■1/ 1966
Jan* 1 8 le/B7 17.Ü ^ 1/ 17 s/ 17, .¥ |/ 18 .if
15 16. 6 17, ,0 _ - 17 .2 17, ,6 _ 18 .0 22 16. 6 17, ,0 _ - 17 .2 17, ,6 14, ,8 18 .0 29 16. 6 17 ,0 - - 17 ,2 17 ,6 14 ,8 18 ,0
Feb. 5 _ _ _ _ 17 .2 17 ,6 14 ,8 18 .0 12, _ - _ _ 17 .2 17 ,6 14 ,8 18 .0 19 - - - - 17 ,2 17 ,6 14 ,8 18 .0 26 16„ 6 17 ,2 - - 17 ,2 17. ,6 14 ,8 18 .0
Mar. 5 16. 6 17 ,2 _ _ 17 ,2 17 ,6 14 .8 18 ,0 12 16. 6 17 ,2 - - 17 .2 17 ,6 14 ,8 •18 .0 19 16, 4 17 ,2 _ _ 17 ,2 17 ,6 14 ,8 18 .0 26 16. 4 17 ,2 - - 17 ,2 17 ,6 15 ,0 18 .0
Apr* 2 _ _ _ _ 17 .2 17- ,6 15 ,0 18 .0 9 16. 6 17 ,0 - - 17 .2 17 ,6 15 ,0 18 .0
16 - - - 17 .2 17 ,6 15 .0 18 .0 23 16. 6 17 2 _ _ 17 ,2 17 ,6 14 ,8 18 .0 30 16. 6 17 ,2 - - - - 14 ,8 18 ,0
May 7 16. 6 17 .2 _ _ 17 ,2 17, ,6 _ ■ _
14 16, ,6 17 ,2 - - 17 .2 17 ,6 14 .8 18 .0 21 16, ,6 17 ,0 - _ 17 ,2 17 ,6 15 ,0 18 ,0 28 16. 4 17 ,0 - - 17 ,2 17. ,6 15 .0 18 ,0
June 4 16, 4 .17 .0 _ _ 17 .2 17 .6 15 .0 18 ,0 11 16, 4 17 .2 _ - 17 .2 17 .6 15 ,0 18 .2 18 16, 4 17 .2 _ _ 17 .2 17 .6 15 .0 18 .2 25 16. 4 17 ,2 - - 17 .2 17 ,6 14 .6 18 .2
July 3 _ _ _ _ 17 .2 17 .6 14 .8 17 .8 9 _ .„ _ - 17 .2 17 .6 - -
16 16, A 17 ,2 - - 17 .2 17 .6 14 .8 18 .2 23 16 4 17 .2 _ - 17 .2 17 ,6 14 .8 - 30 16. A 17 .2 - - 17 .2 17 .6 14 .8 1.8 .2
!_/ Landed, duty paid*
2/ Not available.
Source: Foreign Fruit and Nut Report, United States Department of Agriculture, Washington, D.C.

55
s
Page
Review of the 1965 Season 56
Winery Grape Crush
Table
1 Tonnage crushed "by districts and varietal classes, weekly, 1965 and 1964 seasons • • • 0 « • « • 63
2 Grape crush "by varietal classes and counties, 1965 . . . . . . .■_".' . . ... «, . .. . . . . « «> 63
3 Grape crush "by varietal classes, 1956-65 . . . * ..••.. . . . • • . • • » • o 64
4 Grapes for crushing: -Average Sugar Content of grapes delivered to Califoirriia wineries during 1965 "by area where grown ....... . . .... • • • • •■■ • • . o o 66
5 Grapes for crushing: Percentage of total quantities crushed in California j < during the 1965 season by areas where grown . . . . . . . . . . . . . . . . r. . . • ■"• 67
Wine gMpments
6 Shipments of California wine into all markets, monthly, 1964-66 . . . , é . ... • .^ . . . . . 68
7 Interstate carlot rail shipments of California wines, monthly, 1964-66 . . , . . . . . . . . . . 68
Production and UtUization
8 Gross wine and brandy production in California, 1951-65 . ..... . . . . . . . ... • •/ o o 69
9 Grape crush and average returns to growers by varietal classes, 1942-65 crop years ...... o 69
10 Average grower return per ton, delivered "basis, for quantities purchased in California during the 1965 season "by areas where grown .................... o 70
11 Prices of assorted bulk wines, weekly, July 1965-June 1, 1966 .....f........oo<> 71
Storage and Inventories
12 Winery storage cooperage in California on December 31, 1946-65 . 72
13 Number of California "bonded wine and "brandy production and storage premises, 1960-65 . 0 . . . 0 72
14 Inventories of California wine in California, monthly, 1964-65 and January^April, 1966 0 . . 0 . 73
15 Inventories of California wine and ^brandy in California on December 31, 19S1-65 ........ 73
New York State
Eeview of the 1965 season 74
16 Grapes, quantity purchased in the United States and Canada "by New York State Wine ries- and processing plants, by ÎTariety,, 1964 and 1965 . . . . . ... >. o . . . • •»•'•<• 75
17 Grapes, quantity purchased by New York State wineries and processing plants from New York growers, by area of production and variety, 1964 and 1965 ...<,.. » • 75
18 Grapes, utilization "breakdown based on primary use in New York State wineries and processing plants, "by variety, 1964 and 1965 . . . ■ 76
19 Grapes, average price paid to New York State growers "by wineries and processing plants, by variety, 1962-1965 . • 76

56
WINERY GBAPE CRUSH AMD ERICES TO GRCMEBS 1/ 2/
General 1965 pro"ba"bly will "be remembered as "the year of the "big crush" (largest in history), resulting from growers producing a record crop of grapes.
Buyers were more selective than usual in their purchases due primarily to the ahundant crop and the vide variance in quality and condition of the grapes. Early contracting was largely the same as in 1964, on an open contract "basis for settlement late in September or early Octooer. Prices changed several times throughout the season, always downward. Growers average returns for grapes was one of the lowest in several years.
Near ideal fall weather extended the harvest season and Contributed significantly to the record crop. There were generally no serious weather problems during the season as rains were only light in most areas and losses were insignificant with the possible exception of some patches in the southern part of Kern County.
Early season grapes were generally low in sugar content, while late varieties averaged near seasonably normal levels. Mildew seemed more prevalent this season, especially in Stanislaus County.
Slow maturing of grapes delayed harvesting, and crushing operations got underway approximately ten days later than normal. Labor seemed adequate except for some temporary shortages.
The season's combined crush of all varieties by wineries reporting to the Market News Service was 2,052,335 tons, almost 243,000 tons more than the previous record in 1963. The season began with packing-house culls from the Desert Valley areas during the latter half of June and extended on into mid-January, when only Emperors and other late table varieties were available from the Central and Southern San Joaquin Valley. Ox the over two million tons of grapes crushed, nearly 8€ percent were crushed in the peak ß«-week period: from September 18 through November 5. Deliverieö during this period ranged from 116,682 tons to 264,451 tons, the latter during the week ending October 9.
Central and Southern Saa Joaquín Valley Crushing of packing house culls began in-a very light wajr about the middle of July. Volume increased fradually until about the middle of August.K Bain on August 17 resulted in some damage, especially in the elano area, and crops from some of the moré severely damagedrvineyards began coving to wineries within a
few days. By late August vineyard run Thompson Seedless and of several of the early wine varieties, mostly Salvadors. Palominos, Muscat Canelli, and Semillon, were being: delivered to wineries. Following the peak of harvesting of Thompson Seedless for raisins early in September, deliveries of this variety to wineries became heavy, reaching the peak about the end of the month and the first few days of October.
Following the decline in Thompson deliveries in early October, deliveries of other varieties began increasing and most wineries were active until early November when most crops except for the late table varieties had been harvested. Because of the large table variety crop,, crushing; continued at a higher rate than usual during November and December and harvesting was not finally completed until the middle of January. ^
Several wineries began contracting Thompson Seedless "on an open price basis, without a minimum guarantee.0 late in August. About September 7, a very few wineries offered a firm price of $31*50 on the basis of 21 Balling plus or minus $1.50 for each degree above or below, and some tonnage was purchased on this basis. A very few wineries also bought a limited tonnage at $1.50 per ton per degree Balling. The $31.50 offer was withdrawn on September 10 and a few days later several wineries re-entered the market at $30.00 on the same sugar basis as before. Although there was some resistance, growers begçn to sell rather freely. In early October occasional wineries raised the minimum sugar requirement to 22 Balling. About the middle of October the price was reduced to $1.00 per ton per degree Balling, but by this time there were very few Thompsons remaining.
The limited tonnage of Sultanas was generally contracted on the same bases as Thompsons.
Most Palominos and Feher Szagos were purchased early in the season at $35.00 without a minimum sugar requirement. The remaining tonnage was purchased at varying prices below this figure.
A few wineries entered the market for Grenache and a few Missions about the middle of September at $40.00 without a minimum sugar requirement but.withdrew this offer a week or so later after securing the tonnage desired. A fairly substantial tonnage of Carignanes and a few Mataros were bought during the latter part of September at $45.00 on the basis of 22 Balling plus or minus $2.00 for each degree above or below. This price was also withdrawn after the desired tonnage had been contracted. There was then a period of over two weeks when wineries were almost completely out of the market for wine varieties. About October 18 an occasional winery purchased some Carignanes and G-renache at $1.10 per ton per degree Balling, partly for delivery outside the general area of production. This was withdrawn after a day or two. By October 20 the market became established at $1.00 per ton per degree Balling for all varieties and the remaining tonnage was purchased at this price.
The early-maturing deep-color varieties - Salvador, Royalty, and Eubired - were contracted on various bases. Demand for Salvadors was much less than in most recent years because of increasing production of the relatively new Royalty and Rubired." Some were placed at $45.00-50.00 and at $15.00 above the average price for the season for Thompson Seedless as computed by the Caliiómia Crop and Livestock Service after the end of the season. Some tonnage not placed early brought lower prices.
1/ Unless otherwise stated, the prices paid by wineries to growers are on the basis of per ton delivered to the winery .within the district quoted. .:. . V
2/ Prices reported by Market News and summarized herein are those that prevailed in the field during the active buying-crushing season; In some instances they may be higher or lower than prices reported by- other agencies that collect data subsequent to crushing operations when adjustments maybe nade due to special considerations. '

57
Wineries "began purchasing a few Muscats about the middle of - September at $30.00 on the "basis of 21° Balling plus or minus $loB0 for each degree aljOYe or "below, This vas the prevailing price for Thompsons/ For the remainder of the season Muscat^ prices followed on the same "basis as Thompsons «
White Malagas also followed the Thompson Seedless price,, Contracting started al)Out the last of Septemberö Miscellaneous ta"ble varietiesj mostly vineyard s trippings 5 were purchased "by a few wineries late in September at $1025 per ton per degree Balling while others paid the prevailing price for Thompsons« Ahout the middle of Octoher the price "became $1 o00 per ton per degree Balling0 Some of the late season tonnage was $18o00«°20o00 per ton in order to avoid the necessity of retaining official sugar testers for small tonnages0
Packing house culls were generally $1025 per ton per degree Balling until mid-Octo'ber- when they dropped to $lo00o Some rain-damaged Thomjson. Seedless, which had "been treated with gib*berellic acid to stinmlate size development for the fresh shipping market, "brought the-same price as packing house culls.
Sugar content of Thompsons0was "below normal early in the season "but improved gradually and some of the late deliveries tested a"bove 22 Balling0 Other varieties ran mostly from a little 1)elow normal to ahout normale Grenache had a relatively high sugar content.
Modesto District
Wineries in this district crushed 210,990 tons, 10*090 tons more than in 1964? and less than 200 tons of matching the record 1963 crush0 This total consisted of 68, 970 raisin varieties, 2,930 ta"ble varieties, and 139,090 wine varietieSo
n the peak 8 week period from September 18 through November 6. an average of 24,400 tons per week was crushed0 This accounted for a"bout 93 percent of the season total. During the compara"ble period in 1964^ the weekly average was 22^450 tons o
On Monday3 August 16, 1965, crushing operations got underway with the seasonalsly normal deliveries of Palominos to wineries. Sugar levels ranged from 14 to 18 degrees» Cool nights had slowed sugar development^ and a few vineyards were also plagued with excessive mildew and "bunch rot. In light of these conditions a few vintners were making inspection tours of vineyards "before accepting grapes.
Prices were on an open price contract "basisf with no sugar requirement or minimum price guarantee. However, the following week one winery was offering $30o00 for Thompson ¿Seedless on the oasis of 21 degrees Balling, plus or minus $lo50 per ton per degree a"bove or telowj also $35.00 for Palominos and Jeher Szagos$ and $4öo00 for G-renache, There were no sugar requirements or minimum price guarantees on any of the latter y three. Other varieties remained on an open price contract Tbasis*
All the larger wineries were operating "but at a rather slow pace as most grapes were testing "below desired sugar levels, and the condition of many of the grapes ranged from fair to poor averaging nearer the poor end« Mildew was prevalent and excessive. This condition^ coupled with thé prospect of a large crop, led cash "buyers and vintners to "be more selective in their purchases.
The last week of September some tonnage was purchased^ mostly on a selective "basis: Thompson Seedless i530o00 on the "basis of 21 degrees Balling plus or minus $1.50 for each degree al>ove or telowj Carignanes $45«00 on the "basis of 22 degrees Balling plus or minus $2.00 for each degree a"bove or "below« also some of "lesser quality at $40o00 with no sugar requirements G-renache $40.00, also with no sugar requirement. Other Ineries continued to receive grapes on an open price contract "basis.
.by the end of the first week of Octoher crushing was atout at its peak* A few wineries were purchasing small tonnagess "best quality Carignanes were $45o00 on the "basis of 22 degrees Balling plus or minus *2o00 for each degree a"bove or "belowf lesser quality $40.00 on the "basis of 22 degrees Balling plus or minus $1^75 for each degree ahove or helowl G-renache and Mission $40*00 on the "basis of 22 degrees Balling plus or minus $1.75 for each degree ahove or "belowj and Thompson Seedless $30<,00 on the "basis of 21 degrees Balling plus or minus $1.50 for each degree aDove or "below0
By the second week of Octoher^ crushing of Thompson Seedless had passed its peak, while late wine varieties were increasing0 A consideraole acreage of Carignanes remained on the vines uncommitted. Due to the largeness of the crop and the wide selection availaMe« contracting for grapes was sparódic and mostly on a selective "basis. Some small tonnage was purchased on the following "basis« "besí quality Carignanes continued at $45.00 on the "basis of 22 degrees Balling plus or minus $2.00 for each degree aoove or "below* lesser quality at $40.00 on the "basis of 22 degrees Balling plus or minus $1.75 for each degree a"bove or helow^ also $35.00 with no sugar requirement! "best quality G-renache and Mission $40.00 on the "basis of SS^ÉP668 Balling „plus or minus $1.75 for each degree ahove or "belowl lesser quality Grenache $32.50 to $35 000 with no sugar requirementj and Thompson Seedless $30o00 on the "basis of 21 degrees Balling plus or minus $1.50 for each degree ahove or "below.
The following week several lots of Carignanes were purchased9. varying from 200 to 500 tons each« mostly on t roadside oasis to "be delivered to wineries outside the area; some had low sugar and "brought $21o50 to 23.50s and some with good sugar $25.00} another lot of good-quality and çi'bove average sugar was purchased oy a winery within the area at $1.25 per degree Ballings Wineries were "buying as their needs dictated as supplies were plentiful and the market continued in a weakened state.
Ïear the end of October the market was depressed to the point oft some Carignane and Grenache "brought 20.00^ and some at $1.00 per degree Balling; and one winery purchased small lots of "black and white wine
type grapes at $.90 per degree Bal ling o There were also offerings of "crushing contracts" and ""brandy pools".

58
In view of the record production, erratic market "behavior and the lateness of occasional wineries settling their open price contracts, the following "brief summation of prices to growers is offered: The "bulk of 'the Çari-gnanes were $45.00 on the "basis of 22 degrees Balling plus or minus $2.00 per degree a'bove or "belowj $40eö0 on the "basis of 22 degrees Balling plus or minus $1.75 per degree a'bove or "below; and $40.00 with no sugar requirement. However« most purchases were $40.00 and most $40.00 purchases were without a sugar requirement. The "balance of purchases ranged from $35.00 down to $20.00 including those at $1.00 per degree Balling9 most of which settled at the latter price.
Grenache were $40.00 on the "basis of 22 degrees Balling plus or minus $1.75 per degree a'bove or "below and $32.50 with no sugar requirement. Most of the purchases were at the $40.00 price. There was. however, a sizeahle tonnage bought at $1.00 per degree Balling near the close of the season "but most of this was destined for distilling material use.
Missions were $32.50 - $40.00, mostly $40.00, and some $1.00 per degree Balling. A few were purchased for $40.00 on the "basis of 22 degrees Balling plus or minus $1.75 per degree a'bove or "below.
Zinfandels were mostly $50.00, few $55.00, few late in the season $40.00, and some early in the season $65.00.
Valdepeñas were mostly $55.00, few $50.00, occasional $45.00. and some near the close of the season $21.50 and $22.50 on a roadside "basis for delivery to wineries outside the area.
Thompson Seedless were generally $30.00 on the "basis of 21 degrees Balling plus or minus $1.50 for each degree a"bove or "below. There were occasional lots "below $30.00, most of which occurred near the close of the season and most of these "brought $1.00 per degree Balling.
Practically all the Palominos and Feher Szagos were $35.00 with no sugar requirement.
There were limited tonnages of Royalty and Euhired at $45.00 - $50.00, mostly $45.00.
A few Salvadors were purchased at $45.00.
Small tonnages of Burger and Alicante Bouschet were $35.00.
ÍQ&í pj-striçt
Wineries in the Lodi district crushed a total of 274,730 tons of grapes of which 17.440 were raisin âVarieties, 161,260 tahle varieties, and 96f030 were wine varieties. This compares to last years crush of 20,800 raisin varieties, 101,200 tahle varieties, and 72,100 wine varieties.
Tokay grapes accounted for approximately 71 percent of the total crush compared to 65 percent in 1964, 72 percent in 1963, and 70 percent in 1962.
Slow maturing of grapes delayed harvesting and only a few wineries had "begun crushing operations "by the first week in September, 196b. As in the neighboring Modesto area, weather continued with mostly "below normal daily temperatures and cool nights. Sugar levels were sub-standard and Zinfandéis showed varying degrees of bunch or center rot and averaged near fairly heavy amounts.
One winery, previously on an open price contract "basis, closed their contracts and settled on the following "basis? Zmfandel, Petite Sirah and Ruby Cabernet $65.00: Carignane and Malvoisie $60.00; Petite Bouschet, G-renache, Mission and Alicante Bouschet $45.00; Burger $42.00; JPalomino $35.00; Tokay, Emperor, Colombard and Black Prince $32.00. There were no sugar requirements.
Sugar levels, although increasing slightly, continued "below desired levels and occasional wineries were rejecting Tokays with readings "below 18 degrees.
During the week of September 22 to 28. a few wineries were purchasing small selective tonnages of "black wine varieties, namely? Zinfandels at $65o00 and Carignanes at $60.00, neither having a sugar requirement.
The following week saw purchases of some small selective tonnages fort Zinfandel and Petite Sirah $65.00; Carignane $60,00; and Burger $42.00. Crushing activity was nearing its peak "by mid-Octoher«, The volume of Tokays delivered to wineries was "becoming heavier while "black wine types were aeclining.
The night of Thursday, the 14thf and Friday morning, the 15th, precipitation of up to one quarter of an inch was reported, but very little damage occurred due mainly to the warm temperatures and winds of around 20 miles per hour that followed. Some small tonnage was purchased in this period, mostly field run, with no sugar stipulation. Tokays were $28.00 to $30.00, and Carignanes and Zinfandels $30.00 to $40.00.
The following week was less active and only occasional small lots of Tokays were purchased at $22.50 and $25.00, although two wineries were still receiving on an open price contract "basis.
Near the close of October only a couple of wineries were "buying for current needs, and these occasional lots were mostly under 150 tons. Practically all the purchases were Tokays at $2Ö.00#
The first week of November saw one winery "buying overage tonnages of contracted Tokays and two other wineries also purchasing Tokays, all at $1.00 per degree Balling.
The week of November 13 "brought fairly heavy rains and winds, and extended picking operations. However, most wineries were practically through crushing for the season and nearly all available storage was filled to capacity.
59
An aTttin&ant crop coupled with an elongated season, were the primary factors contributing to the depressed
Sr
short summation of prices to growers was felt necessary.
Most of the Zinfandéis, on a selected "basis, were purchased at $65.00; occasional lots "brought $50.00, $40.00, $30.00, $25.00, and a few near the close of the seasor $20.00 and $1.00 per decree Balling. Carignanes were mostly $60.00- on a selective "basis; occasional lots "brought $45.00f $40.00, $30.00, $28.00, $25.00, also a few $20.00 and $1.00 per degree Balling near the close of the season. Tokays were mostly $32.00, few $30.00. and occasional lots $28.00 and $25.00, A large quantity was purchased late in the season at $20.00 and $1.00 per degree Balling* most of which were $1.00 per degree Balling. Prices paid for miscellaneous other varieties were established early in the season and remained generally unchanged? Petite Sirah and Ruby Cabernet $65.00: Ma taro and Malvoisie $60.00} Petite Bouschetf Grenache, Mission and Alicante Bouschet $45.00; Burger $42.00; Palomino $35.00; Black Prince, Colomibard and Emperor $32.00.
florth Coast Pistriçt
Weather conditions were favorable during the "bloom and a good crop was set throughout the district. Little or no spring frost damage occurred. Cool, foggy weather during the growing season and rains in August resulted in good growth out slowed maturity and sugar development. However, near ideal weather during October greatly improved sugar levels and the quality of the crop. As a results some early maturing lots, sually nigh in sugar, harvested in late September or early October were among the lowest testing eliveries in 1965. in contrast, some lots from usually late maturing areas often damaged "by fall rains
were among the highest testing deliveries this season. Frost in late September did spotty damage in Napa, Sonoma and Mendocino counties. Deliveries from some of these frost damaged lots were very low in sugar. However, the total acreage damaged by the frost was very light. In a few vineyards, principally of white varieties with heavy foliage, mildew control was difficult and some fruit damage was evident. In all sections, selective picking was necessary to maintain desired sugar levels. An abundance of second bloom fruit also added to the harvest difficulties.
Nflpa-Soflpm-MendocinQ CpuAtiess
Cash trading volume in the area continued to be limited by long term contracts, cooperative marketing and an increase in estate type operations.
Harvesting in the Napa Valley started on a few early maturing varieties around mid-September. However, most growers and wineries waited for better sugar development "before starting and volume crushing was not reached until early October. Harvest was heavy during October and was generally completed during the month.
The first price offerings were announced by several wineries in the Napa-Sonomar-Mendocino County area during the period and were mostly on a minimum sugar basis, with jrices and the sugar basis varying among wineries. Zinfandels and Petite Sirahs ranged from $100.00 at 21 Balling plus or minus $4*00 for each degree above or below to $105.00 at 22 Balling plus pr mjnus $4.50 to $120.00 at 24 Balling minus $5.Q0; Carignanes and other "black varieties ranging $95.00 at 21 Balling plus or minus $4«00 to $100.00 at 22 lus or minus $4.50 to $120.00 at 24 less $5.Q0e An occasional winery offered $90.00 for Alicante, rand noir, and other coloring varieties at 22 plug or minus $4.50. The maximum for which premiums w^uld
oe paid was generally 24 and the minimum was 18-19 , with a price o£ $70,00 for lots running "below 19 in one case. An occasional winery offered $130.00 for Napa Camay at 22 less 5 percent of the price for each degree below.
Offers for standard whites were mostly $90.00-95.00 at 18-20°, without a premium for lots above 2^° and with penalties for lots below the specified minimums. A^ occasional winery offered $100.00 at 22 less $5.00 for each degree "(jelow and $60.00 for lots below 18 , and an occasional winery offered $115.00 for French Columbard at 20 less 5 percent of the price for each degree below.
Earlier in the season an association of growers had offered to sell their crops of black juice varieties at $110o00 for Alicante and Grand Noir, $120,00 for Carignane, $125.00 for Grenache, $135.00.for Petite Sirah, Zinfande},, and Early Burgundy, and $140.00 for Ruby Cabamet at 20-21 Balding, plus $4.00 for each degree above 21 not to exceed a premium of $8o00 and penalties for lots "below 20 ♦ white varieties were offered at $110.00 for Go"* * ™ - x*"" ~~ " ~ ' " " ' ~ at the area average sugar offered at $110.00 for Golden Chasselas, $115.00 for Burger. $120.00 for Sauvignon vert and Green Hungarian
content and French Columbard at $145.00 at 21 Balling.
Trading generally followed the pattern of recent seasons though bargaining by some growers was more active. Demand by wineries for standard whites, Carignanes, and various coloring varieties was not active but demand for better varietal grapes was very active. Firm prices paid growers on Petite Sirah, Zinfandel. Móndense, aijd most other standard blacks were $105.00, on Carignçnes occasionally $90,00, generally on the "basis of 22 Bailing with a premium of $4.50 per degree alcove 22 up to 24 and a discount of $4.50 per degree "below 22 o. Prices for Burgers. Golden Chasselas, Green Hungarian, and mixed whites were $90,00 for lots testing 20 Balling with discounts of $4.50 per degree below 22 . Premiums and discounts occasionally were made to the 1/10 degree on each delivery.
Demand for most varietal grapes was very competitive.
Sonoma County harvest got under way in volume around the first of October. However, occasional growers delayed further harvest after the first few deliveries due to low sugar. Some growers continued to experience difficulty in meeting desired sugar levels until late October. With continued favorable weather, crushing of local grapes was completed by the end of October,

60
Bargaining was active on standard "black varieties "but light on the standard white varieties. Interest in most varietals was active though some of the low premium varieties, especially lots of "borderline quality, were in less demand than in recent seasons. Wineries and growers actively "bargained on price "but competition "between wineries was somewhat less than a year ago. Due to the large crop most wineries had all #f the crapes from their regular growers that their facilities could handle, thus showed little interest in contracting from additional growers. Also, many wineries reduced their takings from other producing areas, especially from San Joaquin Valley points.
firm-prices were paid on the following "basis: Zinfandel, Petite Sirah. and occasionally Carignane« ranged 104.00-$!10.00« occasional higher, and $95.00-$100.00 for Carignane, Alicante, Grand^noir, and other
coloring varieties for lots testing 22 Balling. Premiums for lots over 22 up to 24 and discounts for lots under 22 ranged $4.00-$5.00 per degree, generally calculated to the nearest 1/10 degree. Sauvignon
prices.
Buying activity in Solano County and parts of southern Napa County was less aggressive than a year' earlier when supplies in the north coast district were less ahundant. Firm price trading was at $116.50 roadside or delivered local winery or receiving station for Zinfandel^ Petite Sirah and other standard "black varieties testing 24 Balling less $5.00 per degree "below 24 z Prices for Burger, Sauyignon vert. Green Hungarian and other standard whites testing 22 or over were $96.50 with discounts0of $5<ï00 per degree "below 22 . Lots of standard "blacks testing "below 19 and standard whites "below 18 Balling were further discounted or not accepted "by wineries. Some lots were delivered to Napa or Sonoma County wineries and payment was at the same rate as for deliveries of locally grown grapes.
Harvest in the area was delayed and once started was occasionally disrupted "by low sugar tests. An occasional winery delayed grower deliveries until late October when desired sugar levels had generally 1>een reached.
Mendocino County harvest was delayed "by the cool summer and early fall weather * The warm, sunny Octoher weather was ideal though and in most instances sugar levels at harvest were normal or "better for the area. Grower-winery "bargaining was very active. Asking prices "by some growers were well al>ove initial winery offers« Por this reason/sonsiderahle effort was made "by these growers to obtain their asking price on standard "black and white varieties from local wineries or from wineries located outside the immediate area«. Several moderate sized lots traded at the level asked "by these growers "but "by f#r the "bulk of the trading was in line with that in the other areas. K..r* *
Firm prices paid growers for Zinfandel, Petite Sirah* and occasionally Carignane. ranged $104.00-$!10.00Ä and $y5.00-$100.00 for Carignane, Alicante, Gjand noir, and other coloring varieties for lots testing 22 Balling. Premiums for lots over 22 up to 24 and discounts for lots under 22 ranged $4.00-$5000 per -degree, generally calculated to the nearest 1/10 degree. Sauvignon vert- Green Hungarian* Burger- and other standard whites brought $95.00« and Golden ^Chasselas $90.00 for lots testing 20 Balling witlj discounts of $4.00 on some lots testing helow 20 f and on çther lots premiums of $3.00 for over 20, and discounts of $3.00 for low sugar. Some Wbts testing 18-20 ye re traded at these prices.
Pirm price settlement for premium grapes was nearing completion. Prices to growers in Napa, Sonoma, and Mendocino Counties, "based on the "bulk of the purchases made during the season and not reflecting the prices paid -for small tonnages or special considerations were as follows: Pinot Chardonnay $300.00- occasional $325.-005 Pinot noir $200.0Q-$215<)0Q. occasional higher and lower; Johannisburg or White Riesling $210.00- $220.-00; Camay Beaujolais $210.00-$2l71501 mostly $215.00; Sauvignon Blanc $i75.00-$180.00j Gewurtztraminer $195e0Ö-$200.0Q: Cabernet Sauvignon $190.00-$200.00, occasional $205.Q0-$225.00; Grey Riesling and Chenin Diane ¿uèS.OO-llQO.OO; Pinot "blanc $i80.00-$i95.0Q} Sylvaner $i75.00-$i90.00; Red Pinot $165.00; Semillon |i50o00-$160.00; Gamay $130.00; French Columbard $100.00-$115.00, occasional high as $140.00; Mondeuse $130o00; Ruby Cahemet $120.00; Grenache $130.00: and Muscat de Prontignan $165o00-$170.00o Prices for ¿orne premium grapes were subject to a discount oi 5-10 percent of the price for sugar levels "below those designated "by the wineries. Other wineries directed that premium grapes meet their requirements or "be suhject to price negotiations.
Ajameda-San BenJ-tQ-Saata Clara Counties:
The 1965 season followed the pattern established in the past several years of growers delivering fractically all their crops on open price contracts and not finalizing prices until the market in the orth.j3ay Counties was firmly established.
Dae to the large acreage owned or controlled "by the wineries and the established practices of growers placing their small tonnage each season with the same vintner an extremely limited tonnage of winery grapes is available fo# open market trading. This lack of volume open market trading made it impractical to quote prices o However, standard black and white varieties were generally slightly lower than those of the North Bay Counties and premium varieties ranged from a shade "under to somewhat lower.
Sowtfrera Califomi-a
Crushing operations started in the Cucamonga-Etiwanda area in light volume near the end of August, close to a week earlier than in 1964. As in other years. Palominos were the first variety to be crushed followed closely by a few black varieties. Sugaf content, as in other districts, was below normal. Very little activity occurred until the week ending September 18. but advanced rapidly thereafter. Some difficulty was encountered finding sufficiently experienced grape pickers. In most instances this condition was only temporary.
Pric^g were established rather early and remained about unchanged throughout the season atî $37.50 for black varieties on the basis of 22 degrees Balling less $2.00 for each degree below; and $32.50 for white varieties partly at 20 degrees and partly at 22 degrees Balling less $1.50 for each degree below. Most early varieties were running below these requirements.
61
The peak of the crush ocpurred during the week ending Octo'her 23. amounting to^ 8,073 tons. This volume did not drop appreciahly fer another three weeks. The total crush of wine grapes for'.,the 1965 season amo'unted to 63/494 tons, apprpxiîfiateîy 5,800 tons more than in 1964. ,
Wim MARKETING .-■ :
.-Bulk WJA^S '.l , ■,,-■; "•'•■';.:.■ ;%, ^ '
The market for "bulk dessert wines was 65^ per gallon through July Í0, a carryover of the market price for the past seven months. By July 17 there were strong indications,of a large crop (thatvwould later fill . most storage facilities to capacity and steadily weaken the hulk wine market structurel. From this daté through November 13, the market declined in fairly even stages to 500 per gallon, and held steady at this figure through March 5, 1966. Had not the prospects of a proposed marketing order appeared there\is little; doubt prices would have declined sometime earlier in the season. Most wineries were now plagued with heavy inventories. The market had heen under the constant strain of a weak undertone and finally on March 12, "began another descent of five percent to 47^0, and in occasional sales slipped to 450. By April 2- the market was mostly 47Í-0 per gallon, with strong indications of going to 450. By now it was apparento there wouldn't he enough time for the conscious adaption of the machinery necessary to carry out a marketing order program, and the market weakened to 45*47^0, mostly 47^0, and continued at this level through the remainder of the season.
Interstate movement of San Joaquin Valley hulk tahle wines is normally considerahly lighter than dessert ypes (rarely exceeds ten percent of the total hulk wine sales). Of the tah le wines, dry red type Sales ve rage ah out one half the total.
Starting with May 22, 1965, through July 3, red tahle prices held fairly steady at 47Í-5O0 per gallon. From this date through November 13, prices declined slightly to 45-500, mostly 45-47^0. Prices continued their downward trend, and from November 20 through March 19, 1966, were mostly 40-45?. By March 26, prices were 37^-450, prohahly mostly 400, and continued at this level through June at the close of the season.
Bulk white wines were generally 47Í0 from July 3 though Octoher 23. From Octoher 30 to the close of the season prices declined slightly, varying from 400 to a high of 500 per gallon, hut were mostly 450.
Bulk sweet tahle wines were mostly 57Í0 per gallon from July 3 through Octoher 23. During the next five weeks prices declined to 550. The week of Decemher 4, prices further declined to mostly 500 and continued through April 9, 1966, then dropped to as low as 47^-0 from here on to the end of the season.
Novemeiat
tne previous nign m lybl by ö.b million gallons. Dessert wine snipments oi ö^ftou.biö canons were aown ahout 4.5 million gallons from 1964 and the lowest for several years except for 1962 (85.9 million). Tahle
Lne shipments, for the 14th consecutive year, exceeded those of the preceeding year. The total of 2,656,647 gallons was up nearly 4 million gallons from the 1964 record and was almost double the gallonage
^xiipped 10 years earlier in 1955. Sparkling wines also reached a new record of 3,216,423 gallons, ahout 477,000 more gallons than in 1964 and 4 times as much as in 1955.
Of the total shipments, dessert wines accounted for 61 percent of the volume, tahle wines 37 percent, and sparkling wines 2 percent. By comparison, in 1955, dessert wines accounted for 77 percent of the total, tahle wines 22 percent, and sparkling wines just snort of 1 percent.
Interstate shipments of hulk wines, including rail, hoat and truck, during the calendar year were equivalent to 6,267 cars of 72,000 gallons each. This was 113 more than m 1964 and outside of 1964 was the smallest numher since records were first compiled in 1952. Truck movement of 124 carlot equivalents was 84 less than in 1964. Truck figures are not complete hut it is "believed that the reporting wineries originate most of the truck volume.
Packaged wine shipments to out-of-state points, on the hasis of 3,750 gallons per car, were the equivalent of 13,561 cars, an increase of 253 over 1964 and the heaviest on record. Truck shipments of 530 carlot equivalents were 24 more than in 1964.
During the period 1955 through 1965, hulk wine shipments declined ahout 20 percent, while packaged wine shipments increased nearly 60 percent.
ProductÍ0A
Gross production during the period July through Decemher 1965 of California dessert and tahle wines was 196,098,000 gallons. This was 34 million gallons more than in 1964 and the largest on record. Dessert wine production of 111,133,000 gallons was almost 18 million gallons more than m 1964, and outside of 1951 (116.9 million) the largest recorded. Tahle wine production was hy far the largest to date, almost 85 million gallons, over lb million gallons more than the next highest year 1964 (69.6 million).

62
Ta"ble wine accounted for 39 percent of the total gross production* compared with 43 percent in 1964, 39 percent in 1963f and 40 percent in 1962. Gross figures include production froto lírh^myggecial natural wines, Vermouth, and sparkling wines are prepared. Sparkling wine production of 3.6^01 i on gallons was the highest on record, while production of Vermouth and other special natural wiAW^fë&f^l?-.6 million gallons, the third highest recorded to date.
Beverage "brandy production during the period July through December 1965 was estimated at 11,376,000 g&llons, an all time year-end record high. This compares with 7,488,000 gallons produced in the like period m 1964.
The total inventories of all California wines in California on December 31, 1965, were a record 241-044,000 gallons, 31.7 million more than, the next highest year, 1963 (208.2 million). The 1964 figures, although appearing higher (209.3 million), included 8.6 million gallons in set aside under the Grape Crush Order so that the net increase in marketaole inventories was 7,804,000 gallons•
The total of 131,175,000 gallons of dessert wines, 105,789,000 gallons of tafcle wines. 1.342.000 gallons of sparkling wines, and 24.099,000 gallons of "brandy were all time year-end highs. The' 2.738.000 gallons of Vermouth and other special natural wines were 868,000 less than the 1964 figure of 3,606,000 gallons, "but still 61,000 gallons more than the next highest recorded year.
Marketing Agreements
The State Marketing Order for Wines continued in effect. This Order provides for assessments to carry on advertising and sales promotion programs for California wines, and for research and other activities which will tend to enlarge the market Tor California wines. Assessments amount to one cent per gallon on tálale wines and two cents on dessert wines.

63
TASLE 1 WIKERY CRUSH OF CALIFOENIA GRAPES, BY VARIETAL GIASSES AW CCOTTIES, 1965
Co"unty Raisin varieties Table varieties Wine
varieties
Total all
Thompson Muscat Other Total Tokay EmDeror Otherl/ Total varieties
Tons
Alameda 24 _ « 24 _ «. «. «» 5,370 5,394 Contra Costa - _ - - m. — - 156 156 Los Angeles Mendocmo
-. « .» «„ «. _ . 389 389 - _ - -. — . - 4,499 4,499
Napa 144 234 - 378 - - - - 39!247 39*625 Riverside 1,919 - - 1,919 - - 1,081 1,081 9 671 3 671 San Bernardino 6,076 533 97 6,706 32 « 973 1,005 62,184 69 895 San Diego . . 135 135 San Luis Obispo 2 . 2 — . — — 453 455 Santa Clara 5,988 352 - 6,340 — _ -, - 13,868 20,208 Santa Cruz 1 • ' 1 - - - - 115 116 Sonoma , 941 o. 941 .. « 356 356 58,-730 60,027 Others 2/ 7,358 1,608 23 8,989 1,856 675 23 2,554 10*652 22)195
San Joaquin Val lev
Fresno 471,777 59,569 6,213 537,559 403 23,295 64,755 88,453 144,518 770,530 Kern 111*633 17*266 564 129!463 31,441 38!843 70,284 36*787 236*534 Madera 135^111 459 546 136:116 636 32 4*669 5*337 30 166 171*619 San Joaquin 60,794 1,398 62!192 137,510 40 3,521 141,071 159*799 363*062 Stanislaus 24,477 472 - 24,949 2/22,541 1 023 23 564 70 393 118,-906 Tulare 51J418 16,662 211 681291 1,923 18,238 24^7.89 44^950 54,311 167,552
Gbt.S.Joaq.Vly 855,210 95,826 7,534 958,570 163,013 73,046 137,600 373,659 495,974 1,828,203
State total 877,660 98,556 7,654 983,870 164,901 73,721 140,033 378,655 692,443 2,054,968
1/ For wine, "brandy, grape juice, grape concentrate, etc. 2j Includes Amador, San Benito, Solano, San Mateo, Kings, Butte, El Dorado, and Sacramento, 2j Mostly from San Joaquin County.
Source: Annual Statistical Survey, Part I, April 15, 1966, Wine Institute, San Francisco, California.
TABLE 2 WINERY CRUSH OF CALIFORNIA GRARES, BY VARIETAL CLASSES, 1956-65
Raisin varieties Ta"ble varieties Wine
varieties
Total all ±e'áLj-
Thompson Muscat Other Total Tokay Emperor Other 1/| Total varieties
1956 486,738 62,859 8,234 557,831
Tons
90,158 47,006 67,743 204,907 491,032 1,253,770 1957 395*146 84 098 9*311 488^555 114*956 45*706 87!703 248!365 460!438 1 197,358 1958 578*948 73 361 8,199 660!508 107,604 77,291 106!157 291,052 502!799 1 454,359 1959 506*150 83 757 9 777 599*684 137,621 44 080 104 538 286,239 510 394 1 396 317 1960 510 261 85 480 8.136 603,877 122 985 72,826 109*948 305,759 439,871 1 349,507 1961 657*727 54*546 7,689 719 962 96 287 62 708 79 931 238*926 418,855 1,377 743 1962 566*107 74 422 7 215 647,744 131,661 69,796 97 310 298,767 579,728 1 526 239 1963 774 406 88,449 6,660 869,515 133,169 121 709 119 502 374,380 573 419 1 817 314 1964 617 362 77,335 6 859 701,556 112 823 75 086 88 386 276!295 547,906 1 525*757 1965 877,660 98 556 2/7 654 983,870 164,901 73 721 140 033 378*655 692)443 2,054)968
1/ Crushed at "bonded premises for wine, "brandy, grape juice, grape concentrate, etc. 2j All Sultanas except 145 tons of Zantes.
Source: Annual Statistical Surveys, Wine Institute, San Francisco, California.
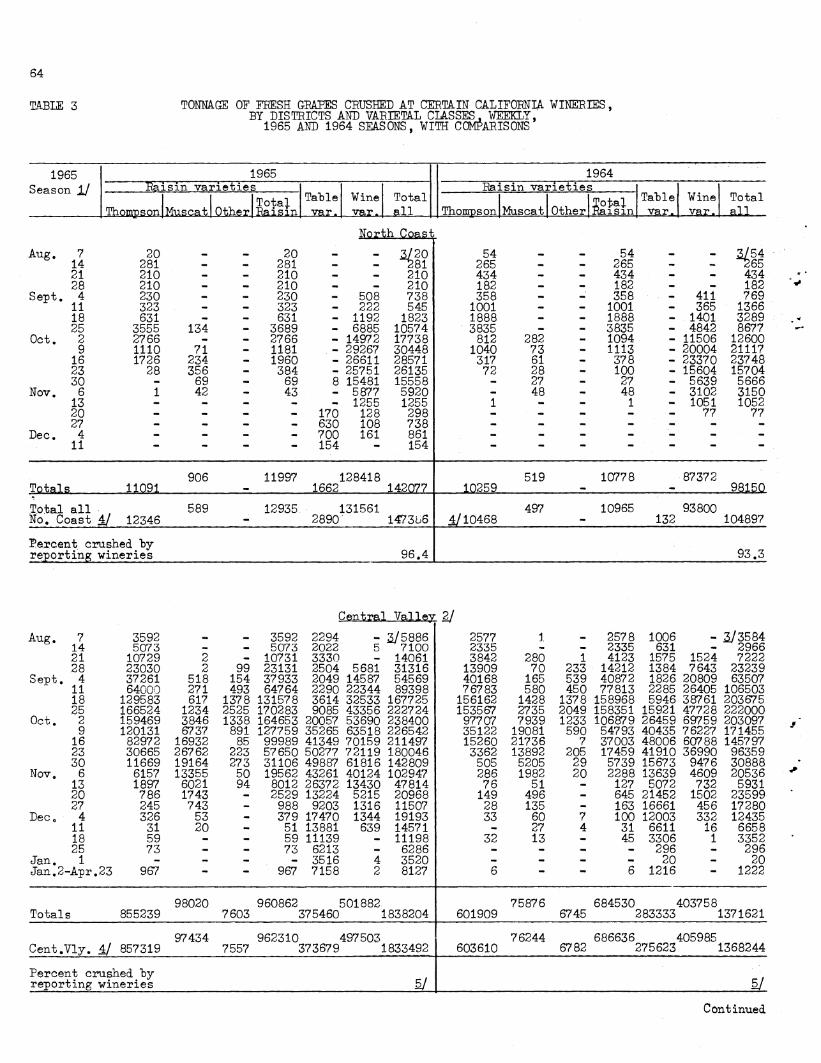
64
TABLE 3 TOMA-GE OF FRESH GEAFES CEUSHED AT CERTAIN CALIFORNIA WINERIES, BY DISTRICTS AND VARIETAL CIASSES, WEEKLY,'
1965 AND 1964 SEASONS, WITH COMPARISONS
1965 1965 1964
Season 1/ Raisin varieties TaUe var.
Wine var.
Total all
1 Raisin varieties TalDle var.
Wine var. Thompson Muscat
TotaJ Other Raisin Thompson Muscat Other
Total Raisin
Total all
7 20 20
North Coast
54 54 Aug. _ 5/20 2/54 ^265 14 281 - - 281 - - 265 - • 265 - -
21 210 . — 210 .. • 210 434 - - 434 - - 434 28 210 • • 210 . .. 210 182 • - 182 - - 182
Sept. 4 230 - - 230 - 508 738 358 • • 358 . - 411 769 11 323 — . 323 _ 222 545 1001 - .. 1001 - 365 1366 18 631 «. — 631 - 1192 1823 1888 - - 1888 _ 1401 3289 25 3555 134 - 3689 - 6885 10574 3835 - • 3835 • 4842 8677
Oct. 2 2766 - 2766 - 14972 17738 812 282 - 1094 - 11506 12600 9 1110 71 _ 1181 - 29267 30448 1040 73 - 1113 • 20004 21117
16 1726 234 .. 1960 - 26611 28571 317 61 - 378 - 23370 23748 23 28 356 - 384 - 25751 26135 72 28 _ 100 - 15604 15704 30 - 69 - 69 8 15481 15558 - 27 - 27 • 5639 5666
Nov. 6 i 42 — 43 5877 5920 _ 48 _ 48 _ 3102 3150 13 • . m. 1255 1255 1 • - 1 « 1051 1052 20 - * - • 170 128 298 - - - « - 77 77 27 - • • - 630 108 738 - • - - - - -
Dec. 4 - - - - 700 161 861 - - - • • - - 11 - - - - 154 - 154 - - — — — — —
906 11997 128418 519 10778 87372 Totals 11091 • 1662 142077 10259 - - 98150
Total all . 589 12935 131561 497 10965 93800 No. Coast 4/ 12346 - 2890 l-CSbö 4/10468 - 132 104897
Percent crushed "by reporting wineries 96.4 93.3
c 'entrai Valley -2/ Aug. 7 3592 .- — 3592 2294 „. 5/5886 2577 1 mm 2578 1006 — 5/3584
14 5073 - - 5073 2022 5 7100 2335 - - 2335 631 - 2966 21 10729 2 - 10731 3330 _. 14061 3842 280 1 4123 1575 1524 7222 28 23030 2 99 23131 2504 5681 31316 13909 70 233 14212 1384 7643 23239
Sept. 4 37261 518 154 37933 2049 14587 54569 40168 165 539 40872 1826 20809 63507 11 64000 271 493 64764 2290 22344 89398 76783 580 450 77813 2285 26405 106503 18 129583 617 1378 131578 3614 32533 167725 156162 1428 1378 158968 5946 38761 203675 25 166524 1234 2525 170283 9085 43356 222724 153567 2735 2049 158351 15921 47728 222000
Oct. 2 159469 3846 1338 164653 20057 53690 238400 97707 7939 1233 106879 26459 69759 203097 9 120131 6737 891 127759 35265 63518 226542 35122 19081 590 54793 40435 76227 171455
16 82972 16932 85 99989 41349 70159 211497 15260 21736 7 37003 48006 60788 145797 23 30665 26762 223 57650 50277 72119 180046 3362 13892 205 17459 41910 36990 96359 30 11669 19164 273 31106 49887 61816 142809 505 5205 29 5739 15673 9476 30888
Nov. 6 6157 13355 50 19562 43261 40124 102947 286 1982 20 2288 13639 4609 20536 13 1897 6021 94 8012 26372 13430 47814 76 51 - 127 5072 732 5931 20 786 1743 « 2529 13224 5215 20968 149 496 - 645 21452 1502 23599 27 245 743 - 988 9203 1316 11507 28 135 - 163 16661 456 17280
Dec 4 326 53 - 379 17470 1344 19193 33 60 7 100 12003 332 12435 11 31 20 - 51 13881 639 14571 - 27 4 31 6611 16 6658 18 59 - - 59 11139 - 11198 32 13 - 45 3306 1 3352 25 73 _ — 73 6213 «. 6286 mm — 296 — 296
Jan. 1 — - - 3516 4 3520 — - _ - 20 _ 20 Jan. 2 -Apr .23 967 - - 967 7158 2 8127 6 — — 6 1216 - 1222
98020 960862 501882 75876 684530 403758 Total s 855239 7603 375460 1838204 601909 6745 283333 1371621
97434 962310 497503 76244 686636 405985 Cent. Vly. 4/ 857319 7557 373679 1833492 603610 6782 275623 1368244
Percent crushed "by reporting wineries 5/ b/
Continued

65
TABLE 3 TONMGE OF FRESH GRAPES CRUSHED AT CERTAIN CALIFORNIA WINERIES BY DISTRICTS AND VARIETAL CLASSES. WEEKLY, N
1965 AND 1964 SEASONS, WITH CCMPAEISONS (Contd.)
1965 1965 1964
Season iy Raisin varieties
Tafcle
yar.
Wine Total
all
| Raisin -varieties Ta-ble
var.
Wine
var.
Total
all 1 Total
Tfrorosre Muscat Other Baisin ThompççA Total
Muscat Other Raisin
So^hem California
21 28
Sept. 4 11 18 25
2 9
16 23 30
6 13 20 27
4
4964 149 125 50 14
150
4964 2897 149 113
Oct.
Nov.
50
125 50 14
150
50
94 38 10 61
110 175 250 200 150 158 24
Dec.
110 603
1957 5682 5669 7441 7264 8073 7763 7757 6103 2040 1724 1308
2/7861 262 219 88
134 814
1957 5682 5779 7666 7514 8273 7913 7915 6127 2040 1724 1308
Totals 5452 50 . 5502
4280 63494
73276 3680 54
180 3914 47536
3174 54624
Total all , So.Calif.4/ 7995
533 97
8625 2086
63379 74090 4/ 3284
594 77
3955 48121 540 52616
Percent crushed "by- reporting wineries 98.9 5/
3680 3680 3013 -. 2/6693
54 50 83 4
43
104 83 4
43
7 83
25
46
52 282
2091 6085 7557 6944 8962 9518 4024 2021
52 282
2091 6085 7668 7110 8966 9543 4067 2067
7 8576 8576 5191
All Districts
1 6312 4019 Aug. -3/13767 6311 if 10331 14 5502? - - 5503 2135 5 7643 2600 - - 2600 631 3231 21 11064 2 - 11066 3424 .. 14490 4276 280 1 4557 1575 1524 7656 28 23290 2 99 23391 2542 5681 31614 14091 70 233 14394 1384 7643 23421
Sept. 4 37505 518 154 38177 2059 15205 55441 40526 165 539 41230 1826 21272 64328 11 64473 271 493 65237 2351 23169 90757 77784 580 450 78814 2285 27052 108151 18 130214 617 1378 132209 3614 35682 171505 158050 1428 1378 160856 5946 42253 209055 25 170079 1368 2525 173972 9085 55923 238980 157402 2735 2049 162186 15921 58655 236762
Oct. 2 162235 3846 1338 167419 20167 74331 261917 98519 8275 1283 108077 26466 88822 223365 9 121241 6858 891 128990 35440 100226 264656 36162 19154 673 55989 40518 103175 199682
16 84698 17166 85 101949 41599 104034 247582 15577 21797 11 37385 48006 93120 178511 23 30693 27118 223 58034 50477 105943 214454 3434 13920 205 17559 41935 62112 121606 30 11669 19233 273 31175 50045 85060 166280 505 5232 72 5B09 15673 19139 40621
Nov. 6 6158 13397 50 19605 43419 53758 116782 286 2030 20 2336 13685 9732 25753 13 1897 6021 94 8012 26396 20788 55196 77 51 128 5072 1783 6983 20 786 1743 - 2529 13394 7383 23306 149 496 - 645 21452 1579 23676 27 245 743 - 988 9833 3148 13969 28 135 - 163 16661 456 17280
Dec. 4 326 53 - 379 18170 2813 21362 33 60 7 100 12003 332 12435 11 31 20 - 51 14035 639 14725 27 4 31 6611 16 6658 18 59 - • 59 11139 _ 11198 32 13 - 45 3306 1 3352 25 73 - - 73 6213 .. 6286 _ - 296 296
Jan. 1 • - — 3516 4 3520 — .. - 20 - 20 Jan.2 -Apr .23 967 - - 967 7158 2 8127 6 - - 6 1216 - 1222
98976 978361 693794 76449 699222 538666 Total s 871782 7603 381402 2053557 615848 6925 286507 1524395
Total nil 98556 983870 692443 77335 701556 547906 Ilstricts4/B77660 7654 378655 2054968 4/617362 6859 276295 1525757
Percent crushed "by- reporting wineries 99.9 99.9
1/ Corresponding weeks in 1964. 2/ Includes some tonnage crashed at other than "bonded premises. 2/ Includes tonnage crushed in previous weeks. 4/ Compiled "by Wine Institute from annual survey of "bonded premises.# Institute survey includes
revisions m figures reported to Market News Service during crushing season. 5/ Over 100 percent. Refer to 2/ and 4/.
Source: Weekly Grape Crush Reports, Federal-State Market News Service, and Wine Institute, San Prancisco, California.

66
mBLE 4 GRAPES FOR CRUSHING: Average Sugar Content of grapes delivered to California wineries during 1965 "by area where grown.
Type & Variety North Coast
Lodi Region _1/
Modesto Region _2/
Other San Joaquin Valley J5/
Southern California
1965 State
Average
Percent
Raisin Grapes5 Thompson Seedless Sultana Muscat Al
19.6 20.6 20.5 19.9 22.2
4/ 23.-4
20.5 19.9 22.2
All Raisin i/ 19,6 20.6 20.7 23.3 20.7
TalDle Grapes:
'Emperor Tokay White Malaga Other Tatle j
4/
3/
4/ 21.1,
i/
18.9 19.9 19.8 18.9 i/
18.9 19.1 19.8 18.9
All TaUe - 19.1 20.8 19.1 i/ 19.1
Wine Grapes:
Alicante Carignane Crenache Mataro Mission Petite Sirah Salvador Zinfandel Other Black
20.2 21.3,
1 so.-g, 4/
20.-g 20.4
4/
■4/ 22.7,
20.5 21.9
20.6 22.3 23.0 23i 22."5 22.5
20.4 22.1 23.4,
4/ 23 .Tí 23.4 19.0 22.1 21.1
20.2 22.0 23.4 23.6 23.5
4/ 23 ."B 22.8
20.3 22.0 23.2 23.4 23.3 21.3 19.0 21.0 21.5
"All Black 20.9 21.0 22.7 22.0 23.1 22.1
White:
- Burger Palomino Other White
17.7 19.8 19.7
16.7 4/ 3/
16.8 18.7 21.7
17.4 18.1 18.6
21.0 20.9 20.2
17.4 18.6 19.6
All White All Wine
19.6 20.5
18.1 20.9
19.6 22.2
18.2 21.2
20.8 22.7
18.9 21.4
All Varieties 20.5 19.7 21.7 20.6 22.7 20.7
_l/ Lodi region includes Sacramento County and San Joaquin County north of Eight Mile Road.
_2/ Modesto region includes the San Joaquin Valley south of Eight Mile Road and north of Merced River, including Escalón area.
_3/ Other San Joaquin region includes San Joaquin Valley south of the Merced River and north of the Tehachapi Mountains.
_4/ Included in State average, "but not shown where sugar content data was insufficient or would disclose ~" individual operations.
Source: California Crop and Livestock Reporting Service, Sacramento, California.

67
TABLE 5 GRAPES FOR CRUSHING: PERCENTAGE OF TOTAL QUANTITIES CRUSHED IN CALIFORNIA DURING THE 1965 SEASON BY AREAS WHERE GRCWN
Type and Variety North Coast
Lodi Region
Modesto Region
Other San Joaquin Valley
Southern California
State
Percent
Raisin Grapes: 100.0. 100.0 100.0 100.0 100.0 ioo.o
Thompson Seedless 88.3 y 97.9 88.1 1/ 89.1
Sultana - - — "0.9 1/ 0.8
Muscat i/ i/ . 2.1 11.0 36.0 10.1
Table Grapes: •» 100.0 100.0 100.0 100.0 100.0
Emperor - 0.1 1/ 39.1 - 20.7
Tokay : - 99.2 1/ 1.7 - 46.9
White Malaga - - 51.4 23.2 1/ 12.7
Other 'Table 0.7 33.0 36.0 1/ 19.7
Wine Grapes: 100.0 100.0 100.0 100.0 100.0 100.0
Alicante 1.0 1.8 2.2 4.8 5.4 3.3
Carignane 15.2 37.4 28.4 25.8 3.8 24.2
Grenache 1.1 1.1 28.0 19.4 20.7 16.9
Mataro 0.2 1/ - 0.2 7.3 0.7
Mission 0.1 3.6 9.6 . 5.6 26.5 7.3
Petite Sirah 9.8 1.3 1/ 0.7 - 2.0
Salvador - 0.1 1.1 4.5 1.6 2.2
Zinfandel 17.2 38.7 3.9 0.4 7.9 8.6
Other Black 20.6 7.7 11.8 15.6 9.2 14.1
Burger 2.1 5.7 1.2 3.3 4.3 2.9
Palomino (Gold. Chas.) 4.2 1.0 8.9 10.5 11.5 8.2
Other White 28.5 1.5 4.7 9.2 1.8 9.6
Area Crush as Percentage State Total 5.5 11.7 13.6 66.2 3.0 2/100.0
1/ Not shown to avoid disclosure of individual operations.
2/ Includes tonnage from Sierras and upper Sacramento Valley.
Source: California Crop and Livestock Reporting Service, Sacramentó, California,

68
TABLE 6 SHIPMEMB OF CALIKUKNIA. WINE INTO ALL MARKETS. MONTHLY. 1964-66 WITH 5-YEAE AVERAGE 1962-66
Month 1964 1965 1966 1962-66 5-yT. avg. 1964 1965 1966 1962-66
5-yT. avg.
r j CaT?l« wine 1/ Gallons Dessert wine Gallons
Jan. 4,351,599 3,782,717 3,822,201 3,758,611 8,752,809 7,318,234 5,984,937 7,366,140 Fe*b. 3,779,192 3,573,296 3:963,948 3)409)641 6)853)881 6)094 918 6 986)989 6)857 442 Mar. 5,030,277 5,439,375 5,973,604 5)059)003 9)567)850 8)l33)019 7 873)274 7 979,019
May* 3 819;646 4'555J625 4;040;258 3 761)250 6)829)756 7 970)398 7 456 590 7 239 934 3 420;961 3^484 754 4 028)999 3)474)258 6)254)587 6)258)349 7 228)815 7 074,028
June 3 740,330 4;238 204 4 354 714 3)728)789 8)559)055 7)670)187 7)653)665 7)531)424 July 2,,990Î598 2,937,137 3)182 065 2)777)540 6)357)122 5 778 231 6 011)779 5)924,431 Aug. 3,986,798 4;249,949 4)108 681 3 876)216 7)070)464 6)503,506 5 923 010 6)644)962 Sept. Oct.
3 962 001 4,577,882 4)859)161 4)075;i93 6,835)650 7 952 066 7 322 342 7 271 113 4 549 141 4 928,530 6 381)993 5)013)322 9)857)725 7 218 020 9 072 891 8,728,332
Nov. 4 873,822 5,697,252 5 496)802 4)784)227 8)506)394 8 391 511 6 753 093 7,585-200 Dec. 4;214,278 5;191,926 5)017)588 4)32l)071 6)579)611 8)l72)079 7)351)955 7)666)243
TOTAL 48,718,643 52,656,647 55,230,014 48,039,121 92,024,904 87,460,518 85,619,340 87,868,268
Sjarklifrg wine Total all wine Jan. 176,446 196,135 215,965 174,679 13,280,854 11,297,086 10,023,103 11,299,430 leb. 134 133 139 545 176 317 128)764 10)767)206 9)807 759 11 127)254 10)-395)-847 Mar. 203 043 236 739 252)628 194)269 14)801,170 13)809)133 14 099)506 13,232)291
^ 165 133 200,650 266)812 178,004 10 814)535 12 726 673 11 763,660 11,179,188 179,091 209)177 262)905 193)886 9)854)639 9 952)280 11 520 719 10)742 172
June 233,036 258,064 305 362 220 067 12 532)421 12 166)455 12 313)741 ll)480)-280 July 151 778 161)992 185 522 144)284 9)499)498 8,877 360 9 379)366 8 846,255 Aug. 181 571 226,542 285 308 200)466 11,238)833 10 979)997 10 316 999 10 721)644
SR- 259,562 333,873 428 181 280)824 11 057)213 12)863)821 12)609,684 11,627,130 390 576 422 756 534 575 385)132 14 797)442 12)569)306 15)989)459 14)126)786
Nov. 318 935 456 653 483 406 350)295 13)699)151 14)545)416 12)733 301 12)719)722 Dec. 346,535 374,297 459)695 336)522 11,140,424 13)738)302 12)829)238 12)323)836
.rom 2,739,839 3,216,423 3,856,676 2,787,192 143,483,386 143,333,588 144,706,030 138,694,581
1/ Shipments of ta"ble, dessert, and sparkling wines "based on state tax-paid sales within California and tax-exempt sales to points outside of California.
Source? Compiled from "bulletins of Wine Institute, San Francisco, California.
TABLE 7 Ï1TTERSTA.TE CAELOT MIL SHIPMENTS OF CALIFORNIA. WINE, MONTHLY, 1961-66
Year Jan. Fe"b. Mar. Apr. May June July Aug. Sept. Oct. Nov. Dec. Total
r - Pw-nTf Qfl,; CS.U
1961 350 682 413 676 392 754 311 706 428 798 777 445 6732 1962 1 f 693 418 662 334 688 297 618 259 609 749 428 717 6472 1963 1 401 756 385 678 457 683 316 664 355 624 602 784 6705 1964 686 341 686 326 438 640 320 529 311 717 744 416 6154 1965 642 413 595 628 367 495 557 325 579 424 616 626 6267 1966 497 552 442 513 556 360 546 307 496 570 345 565 5749
: Package _2SE5-
1961 775 888 983 868 849 976 684 850 1047 1087 1066 940 11022 1962 1 f 761 829 987 858 902 748 705 842 992 1116 1107 836 10683 1963 f 849 950 1030 938 1054 992 627 1032 949 1205 1061 1026 11713 1964 1213 1145 1144 1056 907 1062 772 990 1241 1307 1324 1137 13298 1965 1049 1126 1244 1108 1079 1158 681 1053 1235 1298 1401 1129 13561 1966 1103 1153 1504 1270 1162 1289 921 1175 1350 1576 1447 1302 15252
1/ Includes "bulk "boat shipments converted to carlot equivalents on the "basis of 7,200 gallons per car. 2/ Beginning with July includes out-of-sta%e truck shipments reduced to carlot equivalents. Beginning:
with September also includes truck-to-pier movement for export and/or intercoastal shipments. Truck and waterbome figures are incomplete.
2/ Beginning April 1963, when jumibo tank cars "began to "be used in increasing numbers, all tank car shipments were converted to carlot equivalents of 7,200 gallons and package carlot shipments on the TDESIS of 3,750 gallons per car.
Sources Compiled from reports furnished "by the carriers and from truck data (incomplete) furnished "by certain California wineries.
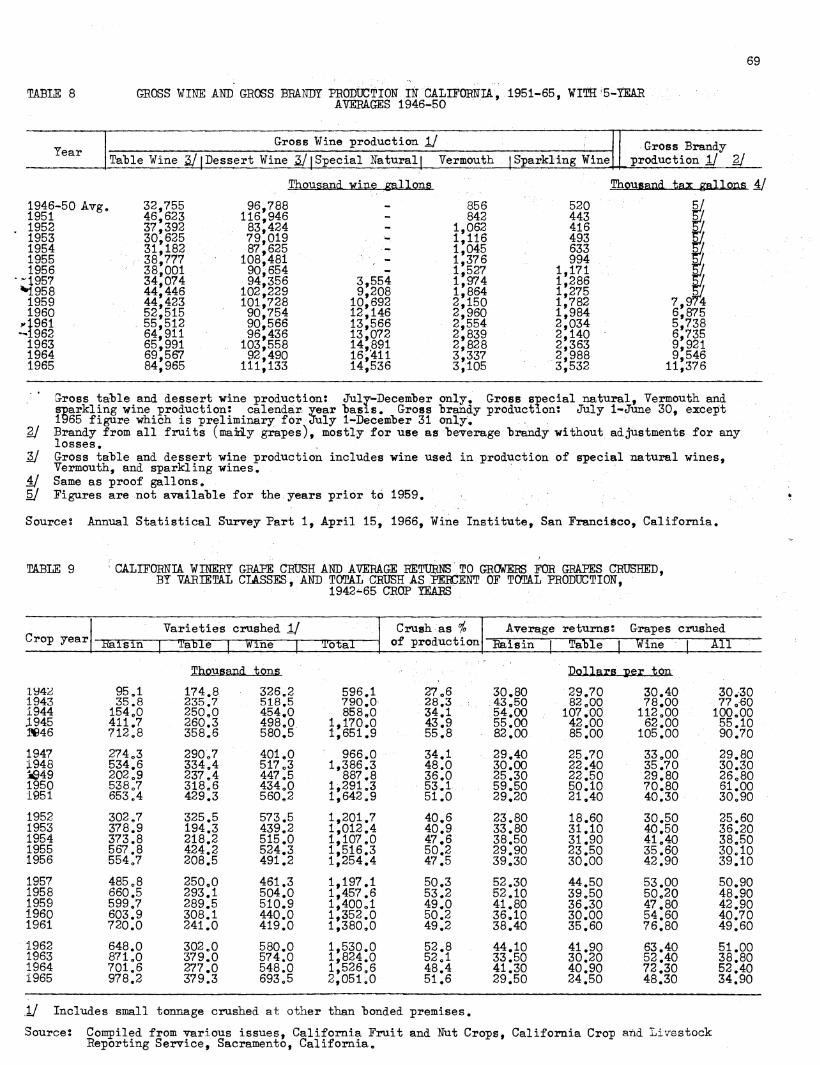
69
TABLE 8 GROSS WINE AMD GROSS BEMTDY PRODUCTION IN CALIFORNm, 1951-65, WITH <5-YEAR AVERAGES 1946-50
Year Gross Wine production 1/
Tafrle Wine 2/ [Dessert Wine ¿/[Special Natural 1 Vermouth I Sparkling Wine Gross Brandy
production 1/ 2/
ThQ^sand viug gallons
1946-50 Avg« 1951
. 1952 1953 1954 1955 1956
•-1957 M958 1959 1960
y 1961 -1962 1963 1964 1965
32,755 96,788 856 46^623 116,946 - 842 37,392 83,424 - 1,062 30,625 79^019 •- 1,116 31,182 871625 .■— 1,045 38,777 108,481 - 1,376 38,001 90,654 - 1,527 34^074 94^356 3,554 1,974 44*446 102*229 9)208 l|864 44,423 101,728 10,692 2,150 52^515 90,754 12*146 2)960 55,512 90,566 13,566 2,554 64^911 96,436 13*072 2)839 65*991 .. 103,558 14;891 2)828 69,567 92,490 16*'411 3*337 84^965 111,133 14,536 3)105
520 443
7,974
416 493 633 994
1,171 1,286 i;275 1,782 1,984 6,875 2;034 5,738 2,140 6,735 2,,363 9^921 2,988 9,546 3,532 11,376
Gross taMe and dessert wine production: July-December only. Gross special natural. Vermouth, and sparkling wine production: calendar year "basis. Gross "brandy production: July 1-June 30, except 1965 figure which, is preliminary for July 1-December 31 only«
2/ Brandy from all fruits (maüy grapes), mostly for use as /beverage "brandy without adjustments for any losses.
3/ G-ross talkie and dessert wine production includes wine used in production of special natural wines. Vermouth, and sparkling wines.
4/ Same as proof gallons. 5/ Figures are not availaMe for the years prior to 1959.
Source: Annual Statistical Survey Part lf April 15, 1966, Wine Institute, San Francisco, California.
TABLE 9 i CALIFORNIA WMERT G-EAíE CBÜSH AND AVERAGE BETURNS TO GRCWERS FOR GRAPES CRUSHED, BT VAMETAL CLASSES, AND TOTAL CRUSH AS RERCENT OF TOTAL PRODUCTION,
1942-65 CROP TEARS
Crop year Varieties crushed 1/ Crush as i« Average returnsi Grapes crushed
tíaísin 1 'i'able Wine ]_ It'otal of production Eaisin | Table Wine | All
Thcmsand tTOS Dollars per ton iy4iJ 95.1 174.8 326.2 596.1 27.6 30.80 29.70 30.40 30.30 1943 35.8 235.7 518.5 790.0 28.3 43.50 82.00 78.00 77.60 Í944 154,0 250.0 454.0 858.0 34.1 54.00 107.00 112.00 100.00 J.945 411.7 260.3 498.0 1,170.0 43.9 55.00 42.00 62.00 55.10 W46 712.8 358.6 580.5 1,651.9 55.8 82.00 85.00 105.00 90.70
1947 274<,3 290.7 401.0 966.0 34.1 29.40 25.70 33.00 29.80 1948 534.6 334.4 517.3 1,386.3 48.0 30.00 22.40 35.70 30.30 Í949 202.9 237.4 447.5 887.8 36.0 25.30 22.50 29.80 26.80 1950 538.7 318.6 434.0 1,291.3 53.1 59.50 50.10 70.80 61.00 1951 653.4 429.3 560.2 1^642.9 51.0 29.20 21.40 40.30 30.90
1952 302.7 325.5 573.5 1,201.7 40.6 23.80 18.60 30.50 25.60 1953 378.9 194.3 439.2 1,012.4 40.9 33.80 31.10 40.50 36.20 1954 373.8 218.2 515.0 1,107.0 47.6 38.50 31.90 41.40 38.50 1955 567.8 424.2 524.3 1,516.3 50.2 29.90 23.50 35.60 30.10 1956 554.7 208.5 491.2 i;254.4 47.5 39.30 30.00 42.90 39.10
195? 485.8 250.0 461.3 1,197.1 50.3 52.30 44.50 53.00 50.90 1958 660.5 293.1 504.0 1,457.6 53.2 52.10 39.50 50.20 48.90 1959 599.7 289.5 510.9 1,400.1 49.0 41.80 36.30 47.80 42.90 1960 603.9 308.1 440.0 1,352.0 50.2 36.10 30.00 54.60 40.70 1961 720.0 241.0 419.0 1,380.0 49.2 38.40 35.60 76.80 49.60
1962 648.0 302.0 580.0 1,530.0 52.8 44.10 41.90 63.40 51.00 1963 871.0 379.0 574.0 l!824.0 52.1 33.50 30.20 52.40 38.80 1964 701.6 277.0 548.0 1,526.6 48.4 41.30 40.90 72.30 52.40 1965 978.2 379.3 693.5 2,051.0 51.6 29.50 24.50 48.30 34.90
1/ Includes small tonnage crushed at other than "bonded premises.
Sources Compiled from various issues, California Fruit and Nut Crops, California Crop and Livestock Reporting Service, Sacramento, California.

70
TABLE 10 AVERAGE GROWER RETURNS FER TON. EELIVERED BASIS. EOR QUANTITIES PURCHASED IN CALIFORNIA DURING THE 1965 SEASON BY AREAS WHERE GRCWN. _l/
Type and Variety- North Lodi Modesto Other Southern 1965 1964 Coast Eegion_2/ Region j3/ San Joaquin
ValleyJ/ California State
Average State
Average
Dollars Dollars Dollars Dollars Dollars
Raisin Grapes: Thompson Seedless _5/ » 30.60 29.30 5/ 29.40 40.50 Sultana - ' ' 29.00 "5/ 29.10 40.90 Muscat 1/ - 5/ 29.90 35.7D 30.00 47.60
All Raisin 5/ ~ 30.60 29.30 29.70 29.50 41.30
Table Grapes Emperor Tolcay
— - H 19.40, - 19.40 39.70 - 28.40 "5/ 5/ - 28.40 40.20
White Malaga - - 30.20, 26.50 - 26.70 46.20 Other Table - -■ 5/ 23.40 - 23.50 39.20
All Table " 28.40 30.20 22.00 ■™ 24.50 40.90
Wine Grapes: Black: Alicante 94.40 5/ 32.20 26.90 37.50 35.00 66.80 Carignane 92.80 59.70, 41.60 34.90 37 .70 43.50 72.60 Grenache 81.80 H 39.00 34.90' 37 .50 37.10 55.60 Mataro 91.10 "5/
3&.20^ 37.70 42.30 70.60
Mission 70.00 45.00 34.30 37.30 36.30 55.50 Petite Sirah 98.60, 5/ - 38.90 88.50 120.20 Salvador 5/ 45.00 42.40 5/ 43.80 96.20 Zinfandel 99.50 64.30 57.70 39.50 39.20 71.00 99.30 Other Black 109.90 61.60 53.30 34.70 37.80 54.30 83.00
All Black 100.30 61.60 42.90, 35.00 37.70 46.60 72.60
White: Burger 92.00 40.70 5/ 5/ 30.50 41.40 55.30 Palomino 82.60
71.20 34.90 33.80 30.50 37.30 48.80
Other White 113.80 66.50 38.70 29.90 79.00 104.10 All White 108.70 43.60 49.00 35.60 30.40 57.30 70.80
All Wine 103.20 60.00 43.70 35.10 36.40 48.30 72.30
All Varieties 103.10 42.10 39.00 29.60 36.10 35.40 52.30
11
2/
i/ 5/
Prices are for purchases only and do not reflect grower returns for tonnage pooled "by cooperatives nor returns for grapes grown "by wineries. The averages reflect prices paid at delivery points in areas where grown and include usual hauling allowances. Packing house culls are excluded from this report. Lodi region includes Sacramento County and San Joaquin County north of Eight Mile Road. Modesto rejzion includes the San Joaquin Valley south of Eight Mile Road and north of Merced River, including Escalón area. Other San Joaquin region include s San Joaquin Valley south of the Merced River and north of the Tehachapi Mountains. Included in State Average, "but not shown to avoid disclosure of individual operations.
Source: California Crop and Livestock Reporting Service, Sacramento, California.

71
TABLE 11 PRICES OF ASSQRTEB BULK CALIFCMIÂ. ¥IKES9 ¥EEKLY, JULY 1965-JUKE 1966
Tal5le Wine 1/ /"< 1 mil T T » Week ending Assorted Dessert Wine
- Eed MiiS'ttr. - Sweet. Talile Wine
Cents per galle . ; II 1965 Juiyi§ ;; . 65'
65 :47|—50 -
■.■■•■■■• 345 50, 3/M '' '' 53? '
17- 60*-6S:v '45—50 45' ..-■■■ ■■■"57|;1 24' ' • ■ 60 ■■■■•■•■ 3/ ■
4 ■ ' 31 ... - -■■■•• 60 •45—47Í
a4?* S . 55—574
■ ,■- 55" Z ■■ ■ r. Aug. ? 60 *• 14 60 ,- 474—50, 57| , ■
21 57—60 45—474 . ' 45—47|
: 50; 55—574 57*
57|- 57| 57| 57,
28 57 3¿ ». Sept, 4 57 45 2
. ■4 . -11 57 . ■.45—474 18 • 57 3/ 2
25 57 45 47' Octo 4 55—57 45—50
47+ 471
3^ 9 55—57 57i 1 16 55 45; 45, pD"E",0 (~íñ i ' ' 23 55 , - ■ ■- ■ . 3/ , .3/. 55—571
55 S 30 ■' 52—55 45 . 45 ..-v, 6 50—55 40—45 40—45 55
13 50 45—48 47 55 20 50 45 48 . 45—55 27 50 • 40—45 40 55
Dec, 4 50 45 ■-• \ 40—45 45—55 11 50 40—45: 40—45 45—55 18 50 45 45, 50,
. . 25 50 40—45 , 1/. ■■•:'■'■■■ ■ :, 1/ : 1966 Jan0 1 50 40 424—50
40—45 '' 50—55"
8 50 40-^45 50 15 50 45 45 50 22 50 45 45 50—55 29 50 40 45„50 - 50—55
Teh, 5 50 45 . 45. ;. . .50 \. :
12 ■= 50- ■:-• ■■■ 40—45 45 50' 19 50 40—45 50 45 : 26 ; 50 ; . ' 45 , ■ 45 50 .'■...
Mar, 5 n50 45, 50 50—55 12 47^—50
47|—50
47l
3/ ■ .,. ■■ - ■ 45 50 19 n45 50 55 26 374—40
421—45 , 371—40 371—45 371—45
45 50 A-r0 2 , 45. : 50
9 43 50, 16 45 A 23 45, 30 47|
4V|
47|
40—45 3/ 474—55 521—55
,474 May 7 374—45.
37|~ 47¿
1 45 ,
14 tr * 21 28
4%o5
Jane 4 37^-45 42|—45 4 11 43—45 443 v 18 40—45
421-45 45-^50 47|
25 552
1/ Blends of San Joaquín Valley wines % occasionally, includes " ~2¡ ^Mostly*' prices qnotedo Prices toD the "bottling trade "based
11
"before taxes and California marketing assessments^ ta"ble wine sales mostly in less than tank carlots( average quality, special types9 vintage wines9 etc« No sales reported»
varietal such as Zinfandel0 on standard quality, naked wine5
in tank car lots9 foOoh, winery0 However9 Not included are wines of "better than
Sources Weekly Bulk Wine Information Bulletins, Federal-State Market News Service 9 San Francisco 9 Calif o
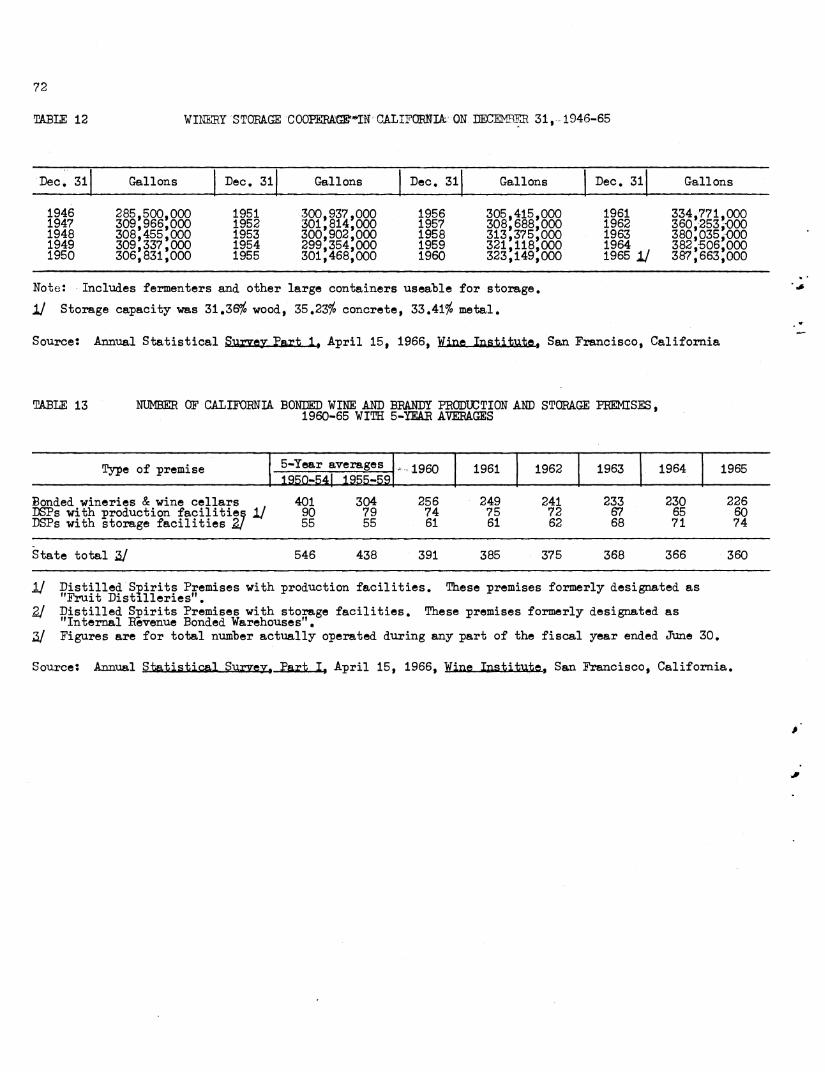
72
TABLE 12 WIMCEY STORAGE -eoaEEŒfclSB^'^ 31,^1946-65
Dec. 31 Gallons Dec. 31 Gallons Dec. 31 Gallons Dec. 31 Gallons
1946 1947 1948 1949 1950
285,500,000 309!9661000 308,455;000 309!337,000 306;831,000
1951 1952 1953 1954 1955
300,937,000
300,902,000 299!354!000 301,468,000
1956 1957 1958 1959 1960
1961 1962 1963 1964 1965 1/
334,771,000 360 253-O00 380Î035-O00 382,506,000 387,663 000
Note: Includes fermenters and other large containers useable for storage.
1/ Storage capacity vas 31.36$ wood, 35.23$ concrete, 33.41$ metal.
Source: Annual Statistical Survey Part ly April 15, 1966, Wine Institute, San Francisco, California
TABLE 13 NUMBER OF CALIFORNIA BONDED WINE AND BRANDY PRODUCTION AND STORAGE PREMISES, 1960-65 WITH 5-YEAR AVERAGES
Type of premise 5-Year averages -1960 1961 1962 1963 1964 1965 -ISBQrBtí_1955r5a
Bonded wineries & vine cellars DSPs with production facilities 1/ DSPs with storage facilities ZJ
401 90 55
304 79 55
256 74 61
249 75 61
241 72 62
233 67 68
230 65 71
226 60 74
State total 2/ 546 438 391 385 375 368 366 360
1/ Distilled Spirits Premises with production facilities. These premises formerly designated as ^ "Fruit Distilleries". 2/ Distilled Spirits Premises with storage facilities. These premises formerly designated as
"Internal Revenue Bonded Warehouses". 2/ Figures are for total number actually operated during any part of the fiscal year ended June 30.
Source: Annual Statistical Survey, Part I, April 15, 1966, Wine Institute, San Francisco, California.

73
TABLE 14 INVENTORIES OF CALIEOEm WINE IN CALIEORNIA, MONTHLY, 1964-66 WITH 5-YEAE AVERAGE 1961-65
Month 1964 1965 1966 1961-65 5-yr.avg. 1964 1965 1966 1961-65
5-yreavg. 2/
Jan. Feb¿- Mar«
Say* June July Aug. Sept. Oct. Nov. Dec.
Jan. Eel). Mar.-
Êy rune
July
Sept. Oct. Nov. Dec.
Ta'ble vine
85,356,840 80,8741376 73:43ll466 66,361,769 60,984,640 54,157,999 50,567,360 46Î539,247 64,772,169
111,122,676 115,825,730 105,789,417
Sparfclíng vJTie
98,622,869 92,186,294 84;464*791 79,052,961 74,369,352 68,815,924 65,430,977 63,037,643 89,269,506 123,751,628 117,199,694 109,306,266
1,273,994 1,380,845 1,411,879 i;427j049 1,524,467 1^539^443 1Î589!424 1,588,703 1,615^149 1,444;663 1,298,962
1,297,220 1^447t534 1,564,219 1,596,714 1,724,313 1,694,401 1,726,431 l'755!222 1,687;933 1Î534|189 1,372^593 1,342,232
GallORS
73,707,104 69,031,597 63,019,072 58,048,321 53,393,964 48,040,375 45,111,726 41,410,020 6l!754;542
100,728,651 97,103,187 88,020,751
1,221,671 1,294,953 1,369,402 1,425,574 1,457,091 1,479,830 1,492*914 l,518;i82 l!l76;i97 1,416,996 1,305,123 1,229,346
Deggert v^e 1/
109,162,333 101*181^555 92!414;i96 87*209,954 81:746,283 73,319,831 67,187,228 61,743:282 86,084,696 123,336,584 120,1071768 115,853,147
109,735,364 102,355,612 95^333*602 89,135,093 83:620,922 76,963,753 70*913,298 66,328,609 83!626,983 132:756,065 140,226,239 133,912,100
129,109,850 12i;454Î344 114,991*010 108;411,008 101,908,558 94,566*503 88,710,915 84Î008*426
111*276*807 138,591,986 136,855,409 128,101,388
Total all wine
191,642,042 178,012,633 162,608,898 15lj934*174 142,069,437 128;396;580 118;698,557 108,801,606 156:538,754 230;812,351 222,245:762 209,319*698
196,389,424 184,677:522 170*329,287 157Î093Î576 146:329,875 132,8161153 123*2071089 114*623;078 150;087,085 245,412*930 257'424,562 241,043,749
229,185,453 215,278,117 201^247*929 189;281,330 178,103,836 165,300;866 156,077,996 149,0271677 202*399*831 264,116,695 255:746,107 239,078,669
Gallons
111,613,625 104^491,197 97^438'209 90,227*416 83,065,964 75,046;299 68,944*870 63Î092-355 84*212*,991
124 446,486 126,831*778 121,163,870
186,542,400 174,817*747 161,826,683 149,696,636 137*917,020 124;566,503 115*549*510 106;O20Î557 147!461,483 226,592,133 225*240*087 210,414,081
1/ Includes Vermoutli and Special natural wines. 2/ From Marabu 1962 into May, 1964, includes any dessert wines held as setaside for account of Grape Crush
Administrative Committee under requirements of the Grape Crush Marketing Order.
Sources Compiled from "bulletins of Wine Institute, San Francisco, California.
TABLE 15 INVENTORIES OF CALIFORNIA WINE AND BRANDY IN CALIFORNIA ON DECEMBER 31, 1951-65 WITH 5-TEAR AVEMGE, 1946-50
vear ending lee. 31 1/ Tahle Wine Dessert Wine Special Natural Vermouth Sparkling Wine 2j
Total All Wine Brandy
1946-50 Avg. \ 1951
1952 1953 1954
^ 1955 ^ 1956
. 1957 1958 1959 1960 1961
* 1962 1963 1964 1965
53,419 58,765 63,170 58,326 54:614 57,925 59*478 54,989 59,839 60,728 65*861 72!245 82,417 87,485 92,168 105*789
i
Thougapd wine gallons
128,141 151,169 141,246 123,975 116,065 129,254 118*132 111*694 116*968 125*087 119*504 112,966 118*970 116*768 112*247 131*175
554 1,004 1,270 1*477 1,782 1,416 1,909 2*726 1*963
811 554 622 607 585 582 693 626 658 656 719 388 774 768 880 774
431 474 430 411 460 657 739 851 825 983
1,148 1,120 1,158 1*228 1,299 1,342
Thuiu-.l .tax gal^>-:. ¿/
304,018 8,819 300,937 9,687 30ll814 10 659 300,902 10ll85 299,354 9*447 301,468 10;347 305,415 12,033 308,688 12-243 313,735 12*350 321,118 13,968 323,149 16,309 334;771 16*702 360*253 17*700 380,035 18*966 382,506 19,798 387*663 24,099
1/ Wine inventories refer to stocks in California "bonded wineries and "bonded wine cellars only0 Brandy inventories refer to stocks in Distilled Spirits Premises only.
2/ Converted from taxable units to gallons at 20 units per gallon. Beginning July, 1955, data reported in gallons.
2/ Same as proof gallons. 4/ Includes dessert wine held in setaside for account of Grape Crush Administrative Committee. For 1961«
17,745s 1962 (as of Fel). 28, 1963), 30,907; 1963, 6,642.
Source: Annual Statistical Survey, Part I, April 15, 1966, Wine Institute, San Francisco, California.

74
3gy YORK S1&T&
forrsY of Wineries and &rape Pr<?ceggi,Qg Plants
This report "briefly stumnarizes the grape survey made in New York State following the completion of the 1965 crop harvest.
Of the firms contacted. 29 reported processing grapes while the other firms indicated they had handled no grapes in 1965. The 29 firms which processed grapes reported that they had handled a net tonnage (after accoimting for plant-to-plant movement) of i36f719 tons of grapes of all varieties. In 1964 a total of 123,515 tons were processed in New Yorfc State plants0
New York State wineries and grape processing plants received 124,903 tons of grapes from within the State in 1965t compared with 110,227 tons in 1964. Receipts from other states in 1965 were 6,216 tons (from Ohio, Michigan and Pennsylvania) while 5,600 tons were imported from Canada« In 1964 receipts from other states were 1,741 tons (from Ohio, Michigan and Pennsylvania) while 11,547 tons were imported from Canada.
In 1965 the 124,903 tons of New York grapes came from the following producing area: Chautaugua-Erie 82^533 tons;- Finger Lakes 34,425 tons; Niagara 4,438 tons; Hudson Valley 2,528 tons; and other New York areas 979 tons.
In 1964 the 110,227 tons of New York grapes came from the following producing areas: Chautauqua-Erie 70,502 tons; Finger Lakes 32,340 tons; Niagara 4,149 tons; Hudson Valley 2,473 tons; and other New York areas 763 tons.
Of the 136,719 tons of grapes processed in 1965 a total of 99,124 tons or 72.5 percent were used to make sweet juice as the product of first utilization or primary use in the plant where the fresh grapes were received, 31,493 tons or 23.0 percent were used to make wine and 6,102 tons or 4^5 percent were used for other purposes such as stemmed and crushed, pulped and de-seeded o In 1964« 93.791 tons or 75 09 percent were used to make sweet juice, 24,441 tons or 19.8 percent were used to make wine and 5,283 tons or 4.3 percent were used for other purposes«
The Concord variety accounted for aliout 84 percent of the total quantity of grapes taken into New York plants in 1965 and was the most important variety in each of the three utilization categories. Most of the pther varieties were used primarily in making wine.
Average prices paid for New York grapes as reported "by wineries and processors are summarized in ta"ble 4 for the Important varieties. Since a large part of the Concord tonnage is handled on a cooperative or .profit sharing "basis no attempt was made at this time to arrive at an average price for 1965.

75
TABIE 16 GUAPES, OmNTITY PURCHASED IN THE UNITED STATES AND CANADA BY NEW YORK STATE WINERIES AND PROCESSING PLANTS, BY VAEIETY, 1964 AND 1965
Purchased in
Variety- New York Other States Canada Total
1964 1965 1964 1965 1964 1965 1964 1965
Tons
Concord 94,749 106,449 1,479 5,942 8,611 2,922 104,839 115,313 Predonia 987 1,443 80 90 17 68 1 084 1 601 Clinton 54 37 • « - - 54 37 Niagara 3,295 4,484 182 78 2,514 1,982 5,991 6,544 Catawba 3,790 4 114 • 50 123 197 3,913 4,361 Delaware 2 351 3,307 • 56 28 - 2 379 3,363 Elvira 1 505 1 307 - 219 431 1 724 1 738 I ves 1 099 1 160 . - - - • 1 099 1,160 Missouri-Riesl ing 202 198 - . - - 202 198 Dutchess 240 221 - - - - 240 221 Isabella 152 138 - - _ - 152 138 French hybrids 1,518 1,842 - - 35 - 1,553 1,842 Miscellaneous 285 203 x — *" ' "" — 285 203
Total 110,227 124,903 1,741 6,216 11,547 5,600 123,515 136,719
Source: New York Crop Reporting Service, Department of Agriculture and Markets, State Campos, Albany, New York.
TABLE 17 GRAPES, QUANTITY BY NEW YORK STATE WINERIES AND PROCESSING PLANTS PROM NEW YORK: GRCWERS, BY AREA OF PRODUCTION AND VARIETY, 1964 AND 1965
Areas Variety Ufiajj^uqua- Niagara Finger Lakes Huds on Other State total
1964 | 1965 1964 | 1965 1964 | 1965 1964 1 1965 1964 | 1965 1964, | 1965
Tons
Concord 1/ 68,689 79,382 3,264 3,229 20,467 21,324 2,305 2,333 24 181 94,749 106.449 Fredonia '909 1 320 16 ' 52 ' 62 ' 71 987 1«443 Clinton 38 6 2 14 14 17 - - .. _ 54 37 Niagara 392 1,044 818 1,017 1,344 1,674 2 2 739 747 3,295 4,484 Catawba 4 39 26 52 3; 660 3 868 100 115 40 3 790 4 114 Delaware 433 700 14 38 1,852 2 515 52 43 • 11 2,351 3,307 Elvira - -. • • 1^505 1 307 .. 1 505 1,307 Ives 19 - - i;080 1^160 • • • • 1 099 1 160 Mis souri-Riesl ing • - - « 202 198 - - - • 202 198 Datchess « - - - 240 221 - • _ • 240 221 Isabella - - • - 152 138 — . _ _ 152 138 French Hybrids 18 42 - 35 1,500 1,745 - 20 • • 1,518 1,842 Miscellaneous 2] "• "•■ 9 1 262 187 14 15 "" — 285 203
Total 70,502 82,533 4,149 4,438 32,340 34,425 2,473 2,528 763 979 110,227 124,903
_l/ Some plants included small quantities of minor varieties such as Clinton. Fredonia, etc., with the Concords - some firms do not normally attempt to keep separate records of these minor varieties. This is particularly true in the Chautauqua-Erie area.
_2/ Includes such varieties as Worden, lona, Brighton, Salem, Van Baren, Diamond, and Ontario.
Source: New York Crop Eeporting Service, Department of Agriculture and Markets, State Campos, Albany, New York0

76
TABLE 18 GEAEES. UTILIZATION BEEAKDOra BASED ON PRIMARY USE IN NEW YORK STATE WINERIES AND PROCESSING PLANTS, BY VARIETY, 1964 AND 1965
Primary Utilization Variety Sweet Juice _!/ Wine 2/ Other j3/ Total
1964 [ 1965 1964 | 1965 1964 | 1965 1964 t 1965
Concord 88,979 Fredonia 1,006 Clinton 30 Niagara 3,015 Cataw"ba 353 Delaware 228 Elvira 179 Ives Missouri Riesling Dutche ss Isabella 1 French Hybrids Miscellaneous
96,040 1Î478
1,121 134 349
10,584 78 24
2,974 3,560 2,146 1 545 1 099
202 240 151
1,553 285
Tons
13,348 123 37
0,361 4,147 5,361 4,147 3,014 O.U-Lt 1,723 1,160
198 221 136
1,822 203
5,276
2
5
5,925
62 80
15
20
104,839 1,084
54 5,991 3,913 2,379 1,724 1,099
202 240 152
1,553 285
115,313 1,601
37 6,544 4,361 3,363 1,738 1,160
198 221 138
1,842 203
Total 93,791 99,124 24,441 31,493 5,283 6,102 123,515 136,719
_l/ Includes a relatively small quantity of grapes listed under the sweet juice category which will ultimately "be used in making wine in the same plant where the grapes were pressed.
_2/ Does not include grapes from which sweet juice was pressed for resale to wineries in New York State or other states.
_3/ Includes quantity stemmed and crushed, pulped, and de-seeded.
Sources New York Crop Reporting Service, Department of Agriculture and Markets, State Campos, Albany, New York.
TABLE 19 GRAPES, AVERAGE PRICE- PAID TO NEW YORK STATE GROWERS BY WINERIES AND PROCESSING PLANTS, BY VARIETY, 1962-1965
Variety 1962
Purchased in
1963 1964 1965
Dollars per ton
Concord 115 Predonia 86 Clinton 88 Niagara 110 Cataw"ba 166 Delaware 197 Elvira 120 Ives 185 Missouri Riesling 174 Dutchess 200 Isabella 165 French Hybrids 167
143 133 1/ 125 115- 128 131 125 122 163 165 198 198 120 128 200 200 177 172 200 200 168 165 166 167
lITl/ 143" 124 165 198 129 200 173 200 165 172
Jl/ Preliminary price.
2/ Average price for 1965 not available at this time.
Sources New York Crop Reporting Service, Department of Agriculture and Markets, State Campos, Albany, New York.

Table
77
CQNIENTS
Acreage, Production, mñ Utilization
Page
1 United States production of grapes, 1961-65 and 5-year average, 1960-64 ........... 78
2 California grapes? production of value and grower's returns "by varietal classes, 1926-65 # . 79
3 California grapes: utilization, production and average returns to growers "by varietal classes, 1962-55 seasons ••'•••••' ••• 80
4 California grapes: production and utilization of all varieties, 1926-65 • . • 81
5 United ¡States production, exports, and imports, 1935-64 ...•..•....♦..♦.... 82
6 Exports from the United States "by country of destination, 1954-64 83
7 California grape acreage as of 1965 "by varieties and age groups ..••... 84
8 California grape acreage "by varietal classes and counties, 1965 . . . 86
9 California grapes: "bearing acreage "by varietal classes, production, and yield per acre, 1928—65 •••••••••••«••....................., 87
10 California grapes: estimated acreage "by counties and 5-year periods, 1940-60; annually, 1961-65 ..•••... • . • . 88
11 Estimates of non-Vearing grape acreage in California "by districts and varietal classes. 1957-65 . . . . . . . . . ; . . . . ... . . . . . # . . . . . ... ... I . . . 89
Temperatures
12 Daily maximum and minimum temperatures at Fresno, California, May-November, 1963-65 90
Graphs
13 Total production and utilization of California grapes, 1955-65 seasons • • • . 92
14 California grapes, all varieties: season average grower price "by utilization, 1950-65 ... 93
15 Shipments of California wine into all markets, 1955-65 94
16 Interstate carlot shipments of California wines, 1955-65 ••• 95
17 Usual harvesting periods of California and Arizona grapes, "by district and varietal class . . 96

78
TABLE 1 OTHED STATES FRODUCTIOF OF GRAPES, 1961-65 AND 5-YEAR AVERAGE, 1960-64
State 1961 1962 1963 1964 1965 Average 1960-64
TPPS
Arkansas 4,000 8,300 5,300: 6,600 9,100 6,400 Arizona 9 230 12:100 16:500 12,600 15,700 11 700 California 2,804 000 2.928 000 1/ 3.500 000 3,155 000 3,975 000 3,014 200 Georgia 1 200 1 000 1,200 1 000 1 300 1 120 Iowa 700 '550 350 450 410 530 Michigan 33,000 68,000 33,500 70,000 75,000 53,900 Missouri 4 300 4,100 2,400 4,100 4 200 3 800 New Jersey 850 900 860 900 1 350 902 New York 124,000 107,000 107,000 .. 120,000 153,000 116,000 North Carolina '950 950 i;ooo 1,500 1 800 1 070 Ohio 16,500 17,500 9,500 16 000 21,500 14 940 Pennsylvania 40,000 34,500 34,000 38,200 49,000 36 040 South Carolina 3 100 , 4 000 5 200 6^100 7 300 4 160 Washington 50.200 52;000 76,600 56;400 37,000 54;720
Total U. S. ' '2/ 3,092,030 3,238,900 3,793,410 3,488,850 4,351,660 2/ 3,319,976
California Wine varieties 474,000 643,000 624,000 608,000 750,000 572,000 Eaisin varieties Eaisins 3/ Not dried
1,885^000 1,707,000 2,254:000 4/266:000
2,030,000 2,575 000 1,897 800 228,000 191 000 232:375 .272 000 221*, 800 973 000 918,000 1,124,000 986 000 1,278 000 969 800
'Table varieties 445 000 578 000 622,000 5i7;ooo 650 000 544,400
1/ Includes 61,000 tons wasted. A2J Includes production for states no longer estimated. Also includes quantities uriharvested on account
of economic conditions, and excess cullage of harvested fruit, 2LI Dried raisins converted to fresh, weight "by ratio of: 4.37 to 1. 1960; 4,70 to 1, 1961;
4.13 to 1, 1962; 4.25 to lf 1963; 4.49 to 1, 1964; 4.77 to 1, 1965; and 4.18 to 1 for the 1960-1964 average.
4/ Includes 41,000 tons dried (174,000 fresh tons), "but not marketed.
Sources California Crop and Livestock Reporting Service, Sacramento, California.

79
TABLE 2 CALIFOMIA G-RAFES: PRODUCTION OF VALUE AMD GRCWERS, RETURNS, BY VARIETAL CIASSES, 1926-65
Growers* returns, all uses-$ per ton _1/ Raisin I Ta"ble I Wine I A rarieties | varieties | varieties 1 vari
Year Production of value - tons
Raisin varieties
Ta"ble varieties
Wine varieties
All varieties
All varieties
^'
1926 1,302,000 340,000 412,000 2,054,000 16.90 25.00 45.00 23.90 1927 1,439,000 338 000 487 000 2,264 000 16.70 26.00 45.00 24.20 1928 1,346,000 403 000 464 000 2;2i3;ooo 10.00 26.00 25.00 16.10 1929 1 093,000 306,000 428,000 1,827,000 16.30 35.00 35.00 23.80 1930 1,304;000 314;000 446,000 2,064;000 13.90 20,80 20.00 16.30
1931 775,000 229,000 306,000 1,310,000 16.30 35.30 19.00 20.20 1932 1,200 000 209,000 363 000 1 772 000 10.90 16.00 12.00 11.70 1933 988 000 267 000 402,000 1 657 000 15.00 14.80 19.75 16.10 1934 930 000 296;000 474 000 1,700,000 17.10 23.50 14.70 17.50 1935 1,253,000 J372; 000 569,000 2,194,000 13.10 14.00 11.80 12.90
1936 918,000 324,000 472,000 1,714,000 17.80 25.30 17.30 19.10 1937 1,429^000 416,000 609,000 2 454;000 17.30 21.80 21.00 19.00 1938 1 445 000 447*000 639,000 2,531,000 11.40 17.80 12.60 12.80 1939 1,306,000 4oo;ooo 522 000 2,228 000 13.10 14.90 14.20 13.70 1940 1,2731000 460,000 517.000 2,250,000 14.80 16.30 16.50 15.50
1941 1,516,000 482,000 549,000 2,547,000 21.20 26.60 22.10 22.40 1942 1 277 000 409,000 474,000 2;i6o;ooo 30.60 44.70 31.20 33.40 1943 1,661 000 553 000 575,000 2,789,000 41.80 99.60 77.90 60.70 1944 1 438 000 513,000 563 000 2 514 000 52.30 110.00 111.00 77.20 1945 1,520,000 5i2;ooo 619,000 2,651,000 53.70 58.00 62.30 56.50
1946 1,644,000 630,000 684,000 2,958,000 81.90 98.50 104.00 90.50 1947 1,699,000 620 000 517,000 2,836,000 33.30 45.60 33.40 36.00 1948 1,679 000 592,000 620 000 2 891;000 35.60 35.50 35.70 35.60 1949 1,421 000 506 000 53e;000 2,465,000 33.90 31.20 29.80 32.50 1950 i;332Í000 588,000 512,000 2;432;000 64.90 57.90 73.60 65.00
1951 1,809,000 759,000 651,000 3,219,000 39.40 30.80 40.40 37.60 1952 1,654,000 648 000 656 000 2,958,000 39.40 33.30 30.50 36.10 1953 1,515 000 435 000 523 000 2,473,000 41.70 50.40 41.20 43.10 1954 1,248,000
l,710Í0O0 482,000 597 000 2 327,000 47.00 49.10 42.00 46.10 t
1955 709;000 601-; 000 3,020,000 40.50 38.50 35.60 39.10
1956 1,618,000 453,000 570,000 2,641,000 47.80 53.70 43.00 47.80 1957 1 373 000 474,000 535,000 2 382 000 62.10 60.00 53.00 59.60 1958 1 631 000 530,000 580,000 2,741,000 67.80 62.90 50.80 63.30 1959 1,749 000 532,000 580,000 2,861,000 49.00 54.10 48.10 49.80 1960 1,623;000 560,000 511,000 2,694,000 48.50 48.90 54.60 49.70
1961 1,885,000 445,000 474,000 2,804,000 47.80 50.00 77,50 53.20 1962 1 707,000 578 000 643,000 2,928,000 57.10 50.30 64^90 57.50 1963 2,193 000 622 000 624 000 3,439 000 44.70 41.30 54.90 46.00 1964 2,020,000 517,000 608)000 3 145;000 50.90 53.90 72.20 55.50 1965 2,575,000 650,000 750,000 3 975;000 40.80 32.60 48.30 40.90
_1/ Returns are on the "basis of naked fruit at the grower, first delivery point.
Source: California Crop and Livestock Reporting Service, Sacramento, California,

80
TABLE 3 CALIFORNIA GRAPES: UTILIZATION. PRODUCTION. AND AVERAGE EETURN TO GEOWJ^'. BY VAPIETAL CLASSES, 1962-65
Production - fresh Tsasis Average returns J./
Utilization 1962 [ 1963 | 1964 1 1965 1962 I 1963 I 1964 [ 1965
RAISIN VARIETIES
Tons Dollars per ton
Out-of-state 190,600 177,300 182,000 195,100 63.40 72.70 74.40 47.30 Within* state 35:700 32,000 42,700 49,100 60.90 65.90 65.10 34.30 Tot. fresh 226,300 209,300 224,700 244,200 63.00 71.70 72.70 44.60 Canned 43 000 43 000 60 000 54 800 61.80 55.40 59.00 50,80 Dried 2/ , 789,000 1,069,000 1,033,000 1,297,000 66.20 48.10 52.30 48.20 CrushedT 3/ 648,000 871 000 701,600 978,200 44.10 33.50 41.30 29.50 Tot.sold -~ 1,706 300 2,192,300 2,019 300 2,574 200 57.10 44.TO 50.90 40.80 Farm use 700 700 700 800 Tot.of value 1,707,000 2,193,000 2,020,000 2,575,000 Wasted - 61 000 - - Tot.produced 1,707,000 2,254,000 2,020,000 2,575,000
TABLE VARIETIES
Out-of-state 233,300 200,600 199,600 226,500 58.40 59.40 70.00 45.80 Within state 41;000. 40,900 38,100 41,800 65.80 55.30 63.10 34.50 Tot.fresh 274,300' -241,500 237,700 268,300 59.50 58.70 68.90 44.00 Crushed 3/ 302,000 379 000 277,000 379,300 41.90 30.20 40.90 24.50 Dried "" 1 200 1 000 1 800 1,900 68.50 61.40 55.60 41.90 Tot. sold 577,500 621,500 516,500 649,500 50.30 41.30 53.90 32.60 Farm use 500 500 500 500 Tot.produced 578,000 622,000 517,000 650,000
* WINE VARLETLES
Out-of-state 58,400 46,300 56,500 51,700 78,80 84.00 71.00 47.50 JWithin state 3,400 2,500 2,300 3,600 75.00 78.00 75.00 54.20 Tot.fresh 61,800 48,800 58,800 55,300 78.60 83.70 71.20 47.80 Crushed 3/ 580 000 574 000 548 000 693 500 63.40 52.40 72.30 48.30 Tot. sold"" 641 800 622,800 606,800 748 800 64.90 54.90 72.20 48.30 Farm use 1,200 1,200 1,200 1 200 Tot.produced 643,000 624,000 608,000 750)000
ALL GRAPES
Out-of-state 482,300 424,200 438,100 473,300 62.80 67.60 72.00 46.60 Within state 80,100 75.400 83 100 94 500 64.00 60.60 64.40 35.10 Tot.fresh 562,400 499,600 521 200 567,800 63.00 66.60 70.80 44.60 Canned 43!000 43,000 60 000 54.800 61.80 55.40 59.00 50.80 Dried 790 200 1,070,000 1,034 800 1,298,900 66.20 48.10 52.30 48.20 Crushed 3/ 1,530,000 1,824,000 1,526,600 2,05i;000 51.00 38.80 52.40 34.90 Tot. sold"" 2,925,600 3,436,600 3,142,600 3,972,500 57.50 46.00 55.50 40.90 Farm use 2 400 2 400 2,400 2 500 Tot.of value 2,928,000 3,439,000 3,145,000 3,975,000 Wasted - 61,000 mm - Tot.produced 2,928,000 3,500,000 3,145,000 3,975,000
J./ Average returns on "basis of naked fruit at .growers first delivery point.
2/ Actual dry-away ratios for 1962, 4.13 to 1; 1963, 4.25 to 1; 1964, 4.49 to 1; 1965, 4.77 to 1.
_3/ Crushing prices in 1962 reflect a 16 percent surplus setaside evaluated at a negative $12 per ton handling charge for those grapes subject to the grape crush order.
Sources California Crop and Livestock Reporting Service, Sacramento, California

81
TABLE 4 CALIFORNIA. GEAPES: PRODUCTION AND UTILIZATION OF ALL VARIETIES, 1926-65
Season : Used fresh
/"i n ■• Dried 1/ Production
Out of State
Within State Total
Canned Crushed Total Earm use Total 5/
5-year average
;ons
1926 821.0 83.6 904.6 2.0 1088.0 53.0 2047.6 6.4 •2069.0 1893 .-0 1927 965.0 87.6 1052.6 2.3 1166.0 37.0 2257.9 6.1 2406.0 2013 ;0 1928 954.0 87.5 1041.5 i'f 1072.0 92.0 2207.1 5.9 2366.0 2085¿-0 1929 788.0 85.1 873.1 2.5 898.0 48.0 1821.3 57 1827.0 2144v0 1930 781.3 101.8 883.1 1.3 782.0 76.0 4/ 2058.4 ■:■ sie 2181.0 2170.0 1931 473.5 S3'8- 567.3 0.3 702.4 34.6 1304.6 5.4 1320.0 2020.0 1932 506 ¿0 99.2 605.2 0.5 1062.0 99.0 1766.7 5.3 •1326.0 1924¿-0 1933 348.1 67.2 4§»3' 1.0 793.0 444.0 1653.3 3.7 1660.0 1783 ¿0 1934 403.1 65.9 469.0 ?•? 695.2 530.0 1696.4 ' 3.6 1700.0 1757.0 1935 427.5 57.6 485.1 2.4 816.0 887.0 2190.5 3.5 2194.0 1760.0 1936 420.4 59.3 479.7 3.2 733.6 494.0 1710.5 3.5 1714.0 1839.0 1937 484.1 53.9 538.0 7.5 994.0 911.0 2450.5 3.5 •2454.0 1944.0 1938 430.2 §i-5- 491.7 5.0 1168.8 862.0 2527.5 : 3.5 2531.0 2119.0 1939 450.8 62.2 513.0 11.0 988.6 7Í2.0 2224.6 3 4 2228.0 2224.0 . 1940 487.2 63.6 550.8 11.3 688.6 996.« 2246.7 3:3 2250.0 2235.0 1941 509.5 56.2 565.7 18,0 840.0 1120.0 2543.7 3.3 2547.0 2402.0 1942 ¿§§-0 51.2 519.2 16.4 1025.0 596.1 2156.7 3.3 2160.0 2343.0 1943 336.3 41.2 377.5 13.0 1605.8 79Ö-.0 2786.3 "27 2789.0 2395.0 1944 365.2 36.1 401.3 14.0 1238.0 858.0 2511.3 2 7 2514.0 2452.0 1945 442.2 55.9 498.1 11.0 969.2 1170.0 2648.3 2.7 2663.0 2535.0 1946 461.9 li-8 516.7 14.3 772.4 1651.9 2955.3 '2.7 2958.0 2617.0 1947 551.4 67.8 619.2 23.0 1225.1 966.0 2833.3 2 7 2836.0 2752.0 « 1948 470.6 73.2 543.8 3d.O 928.2 1386.3 2888.3 2.7 2891.0 2772.0 1949 450.2 62.0 512.2 25.0 1037.3 887.8 2462.3 2.7 2465.0 2763.0 1950 433.0 56.4 489.4 24.0 624.6 1291.3 2429.3 2:? 2432.0 2716.0 1951 507.1 71.1 578.2 26.0 969.2 1642.9 3216.3 2.7 3219.0 2769.0 1952 512.0 §§•£ 577.4 23.0 1153.2 1201.7 2955.3 2 7 2958.0 2793;-0 1953 433.7 64.2 ÏT't 27.0 933.0 1012.4 2470.3 2 7 2473.0 2709.0 1954 455.0 60.6 515.6 28.4 673.3 1107.0 2324.3 2.7 2327.0 2682.0 1955 495.9 72.0 567.9 33.1 900.0 1516.3 3017.3 2:7 3020.0 2799.0 1956 445.9 67.2 513.1 34.8 836.0 1254.4 2638.3 2.7 ' 2641.0 2684.0 1957 427.2 67.0 494.2 36.0 652.0 1197.1 2379.3 2 7 2382.0 2569.0 1958 431.2 69.6 500.8 36.0 744.0 1457.6 2738.4 2 6 2741.0 2622.0 1959 457.1 71.9 : 529.0 37.5 892.0- 1400.1 2858.6 ■■■ 2 4 2861.0 2735.0 1960 448.6 74.3 522.9 40.7 776.0 1352.0 2691.6 \2'4 2694.0 2668.0 1961 396.1 68.6 464.7 44.0 912.9 1380.0 2801.6 '"2.4:' 2804.0 2696.0 1962 482.3 S94 562.4 43.0 790.2 1530.0 2925.6 2.4 2928.0 2806.0 1963 424.2 75.4 499.6 43.0 1070.0 1824.0 3436.6 2*4 3500.0 2957.0 1964 438.1 83.1 521.2 60.0 1034.8 1526.6 3142.6 2.4 3145.0 3016.0 1965 473.3 94.5 567.8 54.8 1298.9 2051.0 3972.5 2.5 3975.0 3270.0
11 Drie d raisins converted to fresh weight by ratio of 4 tons to one ton dried, exce-ot for 1959- 1964. Actti al dry^aw
+ 4.25 to ay ratios
1; 1964. age crusne
k»ii .35 to 1; 1965. 4.7
1960,44.37 7 to 1.
to 1; 1961, 4.70 to 1; 1962, 4.13 to 1;
■odes tonn d at other than "bonded premises. 5/ Inclodes following tuiharvested. or wasted tonnages of
l|g.-142.000; 1222.-153,000; 12250-117,000; 1221-10,000 no value: 1225.-138,000; 1226-15,000: ; 1222.-154,000; 122Í-3,600; 1245¿i2,000; ■■■■■■■ V'V
4/ Incliides 316,000 tons purchased "but left on vines in accordance with marketing agreements which are not included with utilization figures.
Sources California Crop and Livestock Reporting Service, Sacramento, California.

82
TABLE 5 GRAPES: UNITED STATES PRODUCTION, EXPORTS, AND IMPORTS, 1934-64
Year "beginning Production Exports Imports j3/ Exports as
percentage of production
Imports as percentage
July 1 Fresh (Dried 1/ Total S/ Fresh _ 4/ Dried 1/ Total of production
1000 short tons Percent
1934 1,958 18 203 222 12 17 29 11.3 1.5 1935 2,477 19 235 256 8 15 23 10.3 0.9 1936 1,897 23 243 269 8 14 22 14.2 1.2 1937 2,726 35 305 342, 8 12 20 12.5 0.7 1938 2,671 40 331 374 8 9 17 14.0 0.6
1939 2,449 30 274 307 7 9 16 12.5 0.7 1940 2,466 31 186 223 6 3 9 9 0 0.4 1941 2 725 22 219 259 6 1 7 9.5 0.3 1942 2,396 32 318 346 2 2 14.4 0â 1943 2,965 24 513 540 -1 1 18.2 '
1944 2,696 22 405 430 5 1, 6 15.9 0.2 1945 2,767 29 239 242 6 5/ 6 8 7 0.2 1946 3.137 36 131 174 10 "H 15 515 0.5 1947 3,020 27 613 664 7 6, 13 22.0 0.4 1948 3; 061 37 288 329 8 1/ 8 10.7 0.3
1949 2,614 46 375 423 7 5/ 7 16.1 0.3 1950 2 678 45 166 212 19 V, 21 7.9 0.8 1951 3,378 53 345 400 8 5/ 16 11.8 0.5 1952 3; 157 58 459 519 A 20 16.5 0.6 1953 2,690 49 257 308 20 W 20 llU 0.7
1954 2,563 57 180 239 24 H 24 9.3 0.9 ,1955 3 241 72 329 403 23 H 23 12.4 0.7 1956 2 912 73 242 317 14 Û 14 10.9 0.5 1957 2 599 77 133 213 11 "5/ 11 8t2 0.4 1958 3;026 83 97 183 17 "S' 19 elo 0.6
'1959 3,137 95 178 277 14 1 15 8.8 0.5 1960 2 997 97 267 368 19 1 20 12.3 0.7 1961 3 092 82 276 364 16 - 16 11.8 0.5 1962 3:239 100 195 302 14 - 14 9 3 0.4 1963 3,793 95 238 341 32 - 32 9.0 0.8
1964 3,489 101 227 338 38 - 38 9.7 1.1
J./ Includes raisins and currants converted to sweat-box "basis at ratio of 1 to 1.08. Converted to terms of fresh on basis 1 ton dried eouivalent to 4 tons fresh.
21 Beginning January 1941A includes small quantities of canned converted to fresh at ratio 1 pound canned equals 0.741 fresh. Canned grapes in fruit salad are 12% of fruit canned in salad.
3/ Imports for consumption. "4/ Fresh imports converted from cubic feet to pounds at rate of 40 pounds per cubic foot. "5/ Less than 500 tons. 15/ Less than 0.05 percent.
Source: Foreign Agricultural Trade of the U.S., Trade by Countries, Foreign Agricultural U. S. Department of Agriculture, Washington, D.U.
Service,

83
TABLE 6 GRAPES, FRESH: EXPORTS FROM TEE UNITED STATES, BY SRECIFIED COUNTRY OF DESTINATION, 1954-64
* A
Tear "beginning July 1 Coventry
1954 1955 1956 1957 1958 1959 i960 1961 1962 1963 1964
United Kingdom Sweden Norway Finland
Canada Cuba- Mexico Panama, Republic of_!/ Brazil Venezuela Dominican Republic Trinidad & To"bago
Hong Kong Philippines, Republic of the British Malaya Viet-Nam Other Countries
629
2170 313 274 172
4356
Short tons
2278 839
3243 1185 584
2787 1816
2072 2040 512
3223 1028 870
3035 1958 1355 450
1310 1484 742 878
2715 1420 818 623
821 615 569 473
1541 391 690 237
1915 2004 2275 355
53763 2234 2412 391
57711 1884 3243 369
61681 1459 4247 329
73599 1798 2525 290
74769 225
2690 276
68223
1035 280
81569
1166 357
81195
863 353
84060
778 498
5055 4230 5340 6061 6538 5727 3587 4203 3620 4228 4/ 310 3/ 281
1784 1879 1633 1453 591 671
2465 2991
612 789 1119 956 693 ; 465
- 2/ 117 2175"- 1878
656 987 1356 1118 724 709 1227 1269 453 348 559 - 606 498 341 -
1677 2253 3214 2433
2820 2151 3026 1629 1632 2270
-_3/ 397 284
2786 2356 2511
Total 57040 717Í5 72641 77355 82517 94666 97182 82359 100108 95045 101105 ♦
1/ Includes Canal Zone» ,-.«., . • . A -.ntro "2/ January-June only. Not separately classified prior to January 1, 19b8. # "3/ Effective Jan. 1, 1964. Includes the former Federation of Malaya and State of Singapore. [4/ Prior to 1964, included in other countries.
Source: Foreign Agricultural Trade of the U.S., Trade "by Countries, Foreign Agricultural Service, U.S. Department of Agriculture, Washington, D. C.

84
TABLE 7 CALIFORNIA GRAPE ACEEAGE AS) OF 1965, BY VARIETIES AND AGE GROUPS
(Acreage planted during years shown and standing in 1965)
Year -Dlan- ;e<l Class and variety- 1944
or Earlier
1945 to
1949
195D to
1954 1955 1956 1957 1958 1959
Muscat Sultana Thompson Seedless 2ante Currant Others
11,320 11434
51,139 131
Acres
2,237 1,668 518 682 26 16 4 2
22,474 14,197 5,928 5,250 263 38 18 30
145,180
812 1
6,467 38 11
828 1
10,650 47
964
16,202 78
3 Total Eaisin 25,000 15,919 6,468 5,964 7,329 11,526 17,247
TABLE Almeria Calmeria Cardinal Concord 1/ Emperor Italia Malaga Perlette Eed Malaga BiMer Pose de Peru 21 Tokay Others
844 38
235 89
12,151 ' 45
4,275 4
1.328 3,095
264 17,723
613
394 156 66 78 127 56
1,201 1,467 162 10 9 2
7,259 2,312 1,446 '50 625 . 400 254 99 26 23 776 515
1,084 107 2 1,382 487 384
9 1 1,825 1,160 246 '211 341 101
67 43 75
1 587 180 20
787 4
265
■180 167
83 107
52 4
1,191 57 34
695 25
555
270 81
113 94
123 5
985 34 39
280 11
314
225 66
120 186 11?
5 1,906
■• 21 54
207 70
• 505
584 „196
Total Table 40,704 13,780 7,667 3,406 2,376 3,154 2,289 3,971
Juics Alicante Bouschet Burgundy 3/ Cabernet Sauvignon Carignane Camay Grand Noir Grenache Malvoisie (Cinsaut) Mataro Mission Petite Sirah Pinot Noir Royalty Pubired Salvador Valdepeñas einfandel Other Black Total Black Juice
6,855 405 239
12,907 105 365
3,268 500
2,488 3,967 3,116
145
414 508
16,951 l]753
53,986
702 294 223
5,492 187 15
3,176 421 75
1,879 344 80
695 113
2,245 843
10,704
331 . 178 70
1,799 170 13
650 53 51
462 274 139
812 60
1,077 495
6,634
27 35
308 38
110 21
13 83 10
8
101 17
TTT"
17 24
225 40
531
3 67 75 26
82
73 187
1,350
36 22
101 317 107
843
5 86
110 109
18 59
295 331
2,439
221 40 1
482 45
1,200 12 2
256 41 18
91 68 57 115
2,649
177 27 57
1,048 • 44
1,990 86 1
667 113 15
160 52
105 117 236
4,595
White Juice Burger Colombar (Se vert) Feher Szagos French Columbard Palomino 4/ Pedro Ximenes Pinot blanc Sauvignon blanc Semilion Sylvaner 5/ Other White
1,664 558 475 234
3,985 382 225 796 826 398 495
507 267 98
484 3,504
292 173 200 291 502 168
21 78
106 200
9 82 58 17
130 97
14 2
43 83
32 22 7 29
54 20
228 31
1Ö 22 22 30 74
6 6
189 104
273 11 23
127 123
61 13
89 120 34 23
54 12 85
14 27
193 112 70 70 28 20 37 142
Total White Juice 10,038 6,486 798 232 491 862 491 713
Total Wine 64,024 23,270 7,432 1,003 1,841 3,-301 3,140 5,608
TOTAL ALL 249,908 62,050 31,018 10,877 10,181 13,784 16,955 26,826
1/ Concord and other American type grapes. 2/ Includes Black Prince. 5/ Includes Early Burgundy, CrabVs Black Burgundy, Mondeuse, Portugese Blue and Refosco. 4/ Includes Chasselas de Fontainbleau, Gutedel, Napa Golden Chasselas, Sweetwater and Golden Chasselas. 5/ Includes all Rieslings.
Sources California Crop and Livestock Reporting Service, Sacramento, California*

85
TABLE 7 CALIFOem GRAPE ACEEAGE AS OF 1965, BY VARIETIES AM) AGE GRCfUPS
(Acreage planted during years shown and standing! in 1965) - Contd.
Year Planted Acreage standing in 1965 Class and variety
1960 1961 1962 1963 1964 1965 Bearing Non-
Jtearing Total standing
•mis m Muscat Sultana Thompson Seedless 2ante Currant- Others_ -
435 5
9,026 2
115
3,551 ' 12
45 12
5,315 28
- 121
4,152
35
1,886
26
2,922 8
'2,956
19,624 1,501
230,199 1,841
253,179
182i
8,-960 ■8
1ÍL 9,160
19^806 1,501
239 159 1,849
24 262,339 TötalPaisin 9,468 3,678 5,400 4,273 1,931
TAPIE Almeria Calmería Cardinal Concord 1/ Emperor Italia Malaga Perlette Red Malaga BiMer Böse de Peru 2/ Tokay Others Total Table
125 57 59 46 38 «. 224 198 .223 149 449 .. 157. 212 245 93 28 19 20 6 6 9 •
1,074 349 975 .278 680 61 • - 30 - 20 18 4 43 35 : 27 > . 149
142 132 258 187 109 336 « - * 1 4 9
356 79 313 232 216 70 1
35 582 235 36 152 36 66 54 85 37 54
2,084 1 374 3 982
170 30,235
1 442 4,866 3,819 2 631 7 735
274 23,066
1 981
84 755
28 15
1,019 ■ 20 211 632
14 518
1 223 -9^
2,168 2^ 129 4,010
185 31,254
1 462 5 077 4,451 2 645 8 253
> 275 23,289
2 072 2,818 1,373 2,121 1,151 1,622 838 83,659 3,611 87,270-
WINE Black Juiég. Alicante Bouschet Burgundy 3/ Cabernet Sauvignon Carignane Camay Grand Noir Grenache Malvoisie (Cinsaut) Mataro . Mission Petite Sirah Pinot Noir Royalty Pubired Salvador Valdepeñas Zinf andel Other Black
138 10
135 620 5J9
1,150 26 4
295 38 17
133 248 23 82
252 121
65 7 28
460 93
412
129 23
137 105 118 70 115 517 213
196 47 64
1,367 82
334 13
265 .25 46
718 598 116 186 558
■279
124 94
183 1,231
214
154 46
80 132 211 180 57 .8 76
486 280-
143 16
379 490 161
128
23 55
239 259 141
■41. 223 499
er 28
309 1,192
82
130
27 39
252 133 40
17 233
8 1
25
13 1 2 8 4
1 2 1
22 4
% Total Black Juice 3,351 2,492 4,894 3,556 2,797 3,851 100
765 089 918 025 970 393 664 132 629 086 242 742 956 124 381 296 240 590
328 138 871
2,913 457.
412 - 46
130 226 702 572 238
8 134 945
2.Q87' 242 10,207
9,093 1 227 > 1 789
27 .938 1 427 393
14,076 1 178 2 629 8 216 , 4 468 1 444 1 528 1,362 2 389 1 430
23 185 6-.677
110,449
WhjL±£_JmÇÊ. Burger Colombar (S. vert) Eeher Szagos French Coïumbard Palomino 4/ Pedro Xi mené s Pinot "blanc Sauvignon "blanc Semillon Sylvaner 5/ Other White
13 32 90
515 9
79 5
100
21 42
426 22
12
64 7
46 18
309 57
79 56 28
124 J^£L
12 13
427 11
229 83 84
364 ■-332
4 1
154 13
212 62 5
343 120
10
338 25
145 20 15
252 360
421 063 663 816 227 787 058 198 288 553 2£L
26 14
919 49
586 165 104 959
2,447 1 077
663 3,735 8Î276
787 1,644 1 363 1 392 2 512 3 045-
Total White Juice 865 594 837 1,455 914 1,165 22,407 3,534 25,941
Total Wine 4,216 3,086 5,731 5,011 3,711 5,016 122,649 13,741 136,390
TOTAL ALL. 16,502 8,137 13,252 10,435 7,264 8,810 459,487 26,512 485,999
1/ Concord and other American type grapes« 2/ Includes Black Prince. . -...■.■■:./'.■ 2/ Includes Early Burgundy, CrahVs Black Burgundy, Monduse, Portugese Blue and Refosco. 4/ Includes Chasselas de Eontaint1eau, Gutedel, Napa Golden Chasselas, Sweetwater and Golden Chasselas, 5/ Includes all Eieslings. -;
Source: California Crop and Livestock Reporting Service, Sacramento, California,

86
TABLE 8 ESTIMATED CALIFORNIA G-EAPE ACEEAGE, BY VARIETAL CLASSES AND COUNTIES, 1965
Baisin varieties Tatle varieties Wine varieties All varieties
County Non- Bearing "bearing Total
Non- Bearing "bearing Total
Non- Bearing "bearing Total Bearing
Non- "b earing Total
Acres
Humboldt 1-I------1 - l Mendocino JLO__ 3 _13 j3 ;: _3 __,.14712__ __ __8_62__ _ _5574_ _4725 _865 5590
Sub-total 11 3 14 3 3 4712 862 5574 4726 865 5591
Shasta - - -'^.^_r -_ _ _ _- .16 . - 16 .16 -_ _ _ lß_ ,. ■ .'^ ■ 'Í
Alameda 10 - 10 12 - 12 1926 194 2120 1948 194 2142 Contra Costa 7 - 7 40 - 40 1443 - 1443 1490 - 1490 Lake 2 - 2 2 -r- 2 103 17 120 107 17 124 Marin - — - - - - 1 - 1 1 - 1 Monterey - - - - - - 81 1013 1094 81 1013 1094 Napa 83 9 92 22 - 22 9687 1733 11420 9792 1742 11534 San Benito - - - 2 - 2 2166 1168 3334 2168 1168 3336 San Luis Obispo 1 - 1 2 - 2 494 . - • 494 497 - 497 San Mateo - - - - - - 13 - 13 13 - 13 Santa Clara 117 - 117 108 - 108 3097 47 3144 3322 47 3369 Santa Cruz - 14 - 14 88 88 102 102 Sonoma 7 - 7 9 - 9 11172 863 12035 11188 863 12051
S-iib- total 227 9 236 211 «. 211 30287 5035 35322 30725 5044 35769
Butte 9 9 43 8 51 6 1 7 58 9 67 Colusa 1 - 1 - - - - - « - 1 - 1 Glenn » — » - - - 19 - 19 19 - 19 SÄcramento 15 - 15 354 — 354 167 -. 167 536 « 536 Solano 4 - 4 4 -. 4 524 182 706 532 182 714 Sutter 45 - 45 « - - 49 - 49 94 - 94 Tehama 17 - 17 10 - 10 6 66 72 33 66 99 ït>lo - - - 6 - 6 119 119 125 125 Yuta - - - - - - 21 -. 21 21 - 21
Sub-total 91 .— 91 417 8 425 911 249 1160 1419 257 1676
Fresno 144451 3671 148122 12082 309 12391 10949 668 11617 167482 4648 172130 Kern 21167 622 21789 10923 838 11761 4837 385 5222 36927 1845 38772 Kings 3352 33 3385 6 5 U 652 72 724 4010 110 4120 Madera 24213 2676 26889 424 50 474 4872 1796 6668 29509 4522 34031 Merced 8609 467 9076 770 - 770 5854 1533 7387 15233 2000 17233 San Joaquin 914 914 22824 219 23043 22332 1254 23586 46070 1473 47543 Stanislaus 8266 57 8323 433 - 433 9874 1204 11078 18573 1261 19834 Tulare 34504 989 35493 30101 1502 31603 5985 515 6500 70590 3006 73596
Sub-total 245476 8515 253991 77563 2923 80486 65355 7427 72782 388394 18865 407259
Amador 29 29 528 40 568 557 40 597 Calaveras - — ■- 1 — 1 110 - 110 111 - 111 El Dorado — -. - 1 - 1 10 - 10 11 - 11 Nevada - - - - - - 1 - 1 1 - 1 Placer 5 - 5 40 - 40 635 « 635 680 - 680 Tuolumne - - - - - - 3 - 3 3 - 3
Sub-total 34 «. 34 42 .» 42 1287 40 1327 1363 40 1403
Los Angeles 6 6 47 47 71 71 124 124 Orange «- - - 7 - 7 - - « 7 - 7 Riverside 6383 623 7006 4267 671 4938 1298 - 1298 11948 1294 13242 San Bernardino 493 10 503 599 7 606 18580 36 18616 19672 53 19725 San Diego 453 - 453 500 2 502 509 1 510 1462 3 1465 Santa Barbara - - - - - - 3 95 98 3 95 98 Ventura ■5 - 5 3 - 3 - - - 8 8
Sut»-total 7340 633 7973 5423 : 680 6103 20461 132 20593 33224 1445 34669
State total 253179 9160 262339 83659 3611 87270 123013 13745 136758 459851 26516 486367
Source: California Crop and Livestock Reporting Service, Sacramento, California.

87
TABLE 9 CALIFOMIA GBAPES: HEARING ACEEAGE BY VAEIETAL CLASSES, PRODUCTION, ANT). YIELD PEE ACHE, 1928-65 AND ESTIMATED ACEEAGE. 1966
Year Bearing acreage Production (tons)
Yield per acre (tons) Baisin I Table I Wine | Total Baisin I Table [Wine | Total
1928 280,990 116,400 179,860 577,250 2,366,000 5.0 4.1 2.7 4.1 1929 266,780 111 290 287,584 665,654 1,827,000 4.1 2.7 2.3 3.2 1930 254,904 103,790 188,044 546,738 2 181 000 5.1 3.7 3.6 4.0 1931 247,207 96,600 184;734 528 541 l)320)000 3.1 2.4 1.7 2.5 1932 241,680 92;577 183,583 517,840 l) 926,000 5.0 3.4 2.1 3.7
1933 236,065 88,558 178,42a 503,045 1,660,000 " ' 4:.2 3.0 2.3 3.3 1934 233 904 85 824 175,772 495 500 ,1 700 000 4.0 3.4 2.7 3.4 1935 233,302 84 015 172,102 489)419 2,194,000 : 5.4 4.4 3.3 4.5 1936 232,464 82,940 171,114 486)518 1,714,000 3.9 • 3.9 2.8 3.5 1937 238,520 83,718 174,067 496,305 2,454,000 6.0 5.0 3.5 4.9
1938 241,997 83,825 175,571 501,393 2,531,000 6.0 5.3 3.6 5.0 1939 244 353 §§'415 176)095 505 863 2)228,000 5.3 4.7 3.0 4.4 1940 242,974 85,268 176,288 504,530 2 250 000 5.2 5.4 2.9 4.5 1941 247,530 86 365 177,669 511,564 2)547,000 6.1 5.6 3.1 5.0 1942 249,108 86,115 176;635 511)858 2,160,000 5.1 4.7 2.7 4.2
1943 249,316 87,067 175,503 511,886 2,789,000 6.7 6.4 3.3 5.4 1944 247 059 87 525 172,645 507)229 2)514)000 5.8 5.9 3.3 5.0 1945 243 741 86 761 169 307 499)809 2 663 000 6.3 5.9 3.7 5.3 1946 240,070 86,757 163;963 490 790 2)958)000 6.8 7.3 4.2 6.0 1947 236,487 89,535 163,030 489,052 2,836,000 7.2 6.9 3.2 5.8
1948 235,526 93,302 165,670 494,498 2,691,000 7.1 6.3 3.7 5.8 1949 235,180 94,'575 166,881 496,636 2)465,000 6.0 5.4 3.2 5.0 1950 237)673 93,685 165 006 496 364 2 432,000 5.6 6.3 3.1 4.9 1951 231 467 91,329 158,038 480)834 3 219 000 7.8 8.3 4.1 6.7 1952 223,350 86,002 154,158 463,510 2)958)000 7.4 7.5 4.3 6.4 #
1953 223,940 83,953 146,203 454,096 2,473,000 6.8 5.2 3.6 5.4 1954 223,907 82Î524 139)091 445 522 2)327 000 5.6 5.8 4.3 5.2 1955 207,136 80,519 136,119 423,774 3)020 000 8.3 8.8 4.4 7.1 , 1956 202 806 76,191 128 510 407,507 2)641)000 8.0 5.9 4.4 6.5 1957 203,204 75;327 120,469 399)000 2)382)000 6.8 6.3 4.4 6.0
1958 209,807 78,042 118,998 406,847 2,741,000 7.8 6.8 4.9 6.7 1959 212 954 781962 117,185 409)101 2,861)000 8)2 6.7 4.9 7.0 1960 217 171 80 937 118,072 416)180 2)694)000 7.5 6.9 4.3 6.5 1961 226 711 81 772 116 393 424 876 2,804,000 8.3 5.4 4.1 6.6 1962 240,008 84;130 120)008 444)146 2,928)000 7.1 6.9 5.4 6.6
1963 247,504 82,651 121,341 451,496 3,500,000 9.1 7.5 5.1 7.8 1964 251 489 83,373 120,060 454,922 3 155 000 8.1 6.2 5.1 6 9 1965 253,179 83,659 123,013 459,851 3,975,000 10.2 7.8 6.1 8 6 1966 1/ 255,000 82,700 125', 000 462,700
_!/ 1966 "bearing acreage preliminary.
Sources Compiled from Acreage Estimates, California Fruit and Nut Crops, California Crop and Livestock Eeporting Service, Sacramento, California.

TABIiï 10 CALIFORNIA G-EAEES: ESTIMATED ACEEAGE BY COUNTIES AED 5-YEAR PERIODS, 1945-60; ANMIALLY, 1961-65
District Total Acreage _!/ and County
1945 1950 1955 1960 1961 1962 1963 1964 2/ 1965
North Coast
Alameda 3,496 3,313 2,830 2,910 2,910 2,910 2,129 2,065 2,142 Contra Costa 4 794 3,704 2,476 1,730 1,728 1 728 1 490 1,490 1,490 Mendocino 8,061 7,291 5 864 5,337 5 459 5 517 5,610 5 201 S,590 Napa 12,170 14 850 10 601 10 586 10422 10,766 10,766 11,446 11,534 Santa Clara 8 130 '6 492 5,020 3,859 3 532 „3 450 3 455 3,387 3,369 Sonoma 22,868 16 092 11 243 11 033 11 064
31218 11,219 11,309 11,416 12,051
Other 3/ ■'6Î151 4,741 2,958 3,256 3,208 3,274 5,227 51898 •¿ Total North Coaj 3t 65,670 53,483 40,992 38,711 38,333 38,798 38,033 40,232 42,074
Central Valley *
Eresno 180,293 176,147 147,391 165,394 165,469 166,582 166,698 170,279 172,130 Kern 25 457 27 811 28 111 3l|241 34,472 36 224 37,673 37,686 38,772 Kings 11 171 8 501 4 748 4,392 4 392 4,392 4 120 4 120 4,120 Madera 19 242 19 127 19,619 27 520 28 345 29,692 31 550 32.352 34,031 Merced 19 634 18,249 15 740 13 845 15 513 15 628 15 825 15 444 17,233 Sacramento 8 931 5 017 1 584 715 735 735 735 735 536 San Joaqiiin 61 221 58,613 51 242 46,524 47,159 47,448 48,101 48,168 47,543 Stanislaus 21,409 19 509 16 154 16 984 19,144 19 411 19 634 19 671 19,834 Talare 78,200 79 259 66,233 73,395 73,955 73,926 73 236 73 025 73 596 Other 4/ 7,023 4!533 2Í800 2,267 1,918 1,931 . 1,870 1,877 1,829
Total Cent. Yly . 432,581 416,766 353,622 382,277 391,102 395,969 399,442 403,357 409,624
Southern California
*Los Angeles 4,177 1,373 1,199 253 124 124 124 124 124 Riverside 10,217 11 516 13 274 14,553 14,916 14,341 15,232 15,283 13,242 San Bernardino 33,328 31,794 27,630 23,339 23,095 22,317 21,819 19,730 19,725 San Diego
.Other 5/ 4,406 4,260 3,728 2,692 2,695 2 695 2 695 2,695 1,465 l!240 1,504 513 165 138 109 56 149 '113
Total So, Calif, 53,368 50,447 46,344 40,902 40,968 39,586 39,926 37,981 34,669
Total State 551,619 520,696 440,958 461,890 470,403 474,353 477,401 481,570 486,367
Percent of State Total North Coast 11,91 10.27 9.30 8.38 8.15 8.18 7.97 8.35 8.65 Central Valley 78.42 80.04 80.19 82.76 83.14 83.48 83.67 83.76 84.22 So-athem Calif. 9.67 9.69 10.51 8.86 8.71 8.34 8.36 7.89 7.13
1/ i i/ 1/
Total of tearing and nohbearing acreage, Subject to some revision. Incl-udes counties of Humboldt, Lake, Marin, Monterey, San Benito, Santa Cruz, San Luis Obispo, San Mateo, Shasta, Siskiyou, and Solano. Includes counties of Amador, Butte, Calaveras, Colusa, El Dorado, Glenn, Inyo, Nevada, Placer, Sutter, Tehama, Tuolumne, Yolo, and Yuba. Includes counties of Imperial, Orange, Santa Barbara, and Ventura.
Sources Compiled from Acreage Estimates, California Emit and Nut Crops, California Crop and Livestock Reporting Service, Sacramento, California.

89
TABLE 11 ESTIMATES OF NQN-HH AKlflU- UK/U^I AomiU^ BY DISTRICTS AND VARIETAL CLASSES
lui OAJjlJUiUliB., , 1957-65
Year Raisin Table .. .
. Vine All
North Coast 1/
1957 12 2 1,652 1,666 1958 17 2 Mii 2,263 1959 14 "" 2,849 2,563 1960 8 — 1,724 1,732 1961 26 4 £»W1 - 2,143 1962 - 2 3,106 2,108 1963 - 2 1,857 1,859 1964 ii ~ 4,386 4,307 1965 12 — 6,079 6,091
Central Valley
1957 17,082 5,885 8,819 26,586 1958 21 338 4,215 4,395 29 848 1959 28 878 6 641 5,731 41 250 1960 30 038 5 983 6,315 42 336 1961 26,090 7 260 8,765 42,115 1962 15,473 i<l%8 7,455 27,066 1963 11 286 3,827 7,910 23,023 1964 10,248 3,391 7; 544 2i;i83 1965 8,515 2,931 7,534 18,980
Southern Califprnia
1957 387 2,169 ' 9 2,565 „. 1958 424 1,922 134 2,480 1959 451 962 464 1 877 1960 630 622 390 1,642 1961 639 467 163 1,269 i 1962 607 310 116 1,033 1963 674 269 80 1,023 1964 659 202 297 1,158 1965 633 680 132 1,445
State total
1957 17,481 8,056 5,280 30,817 1958 21,779 6,139 6 673 34,591 1959 29 343 7,603 8,744 45 690 1960 30,676 6,605 8 429 45 710 1961 26 755 7,731 11,041 45,527 1962 16,080 4 450 9,677 30,207 1963 11 960 4,098 9 847 25:905 1964 10,918 3,593 12,137 26,648: 1965 9,160 3,611 13,745 26,516 '■'
^ j./. District and State totals .siib-ject to revision.
Source: Conrpiled from Acreage Estimates, California Emit and Nut Crops, California Crop and Livestock Reporting Service, Sacramento, California,

90
TABLE 12 miLY MAXIMUM AM) MINIMUM TEMPERATURES AT FRESNO, CALIFORNIA MAY THROUGH NOVEMBER 1963-65
Date Maximum Minimum Date Maximum M Lnimum 1963 1964 1965 1963 1964 1965 1963 1964 1965 1963 1964 1965
Ma^ 75 62 79 49 45 50
July 93 94 91 58 61 55
2 79 63 70 48 40 41 2 86 92 98 54 56 61 3 80 61 75 51 38 40 3 88 92 102 54 55 62 4 78 64 78 53 41 43 4 87 86 99 57 53 59 5 82 60 71 52 45 44 5 89 90 102 60 53 65' 6 78 61 67 54 42 41 6 90 97 102 61 59 66 f 7 81 70 76 60 41 36* 7 88 100 99 61 61 60 8 76 73 81 52 44 45 8 89 95 99 58 63 61 9 74 84 84 48 49 47 9 95 95 98 60 58 61
10 72 89 87 51 53 50 10 99 101 93 62 59 56 *
11 68 92 91 46 53 53 11 100 106 91 62 68 53* 12 73 95 92 44 56 53 12 103 107 93 67 68 54 13 76 86 86 47 53 52 13 103 107 100 67 67 58 14 75 88 83 53 48 50 14 103 99 100 68 65 63 15 83 90 90 52 48 52 15 102 94 104* 67 64 70 16 ■ 91 81 96 56 51 57 16 95 97 102 60 62 73 17 97 79 91 58 53 58 17 92 103 96 59 65 72' 18 95 87 90 59 50 56 18 95 100 99 58 63 63 19 95 88 90 60 55 54 19 99 99 99 62 58 56 20 89 82 83 59 52 55 20 97 98 93 62 60 59
21 83 81 72 54 49 51 21 97 98 93 62 60 59 22 80 88 73 53 51 47 22 96 101 96 61 58 59 23 80 88 83 58 53 50 23 99 102 100 61 61 60 24 77 85 80 58 58 48 24 93 106 99 62 68 57 T~ 25 83 84 88 59 54 49 25 94 106 93 58 73 60 26 84 78 91 58 53 54 26 98 102 84 60 73 58 27 82 74 96 56 54 56 27 102 98 90 64 74 57 28 76 80 99 59 48 60 28 101 103 94 62 68 59
I 29 83 86 100* 56 50 61 29 101 105 94 63 71 58 30 87 89 94 58 55 58 30 100 98 82 61 67 72 31 83 96 84 57 57 51 31 101 94 99 63 61 67
«Jwif 87 90 75 56 58 50
4ugj. 100 90 100 64 60 67
2 92 85 79 61 55 52 2 95 95 102 62 58 66 3 80 88 86 56 49 55 3 91 96 98 56 60 63 4 87 87 91 51 60 58 4 94 99 97 55 61 59 5 83 91 91 59 60 57 5 98 103 98 60 67 61 6 76 86 88 56 62 54 6 100 98 100 63 69 63 7 85 77 83 57 56 51 7 89 104 103* 67 67 60 8 90 70 69 57 48 53 8 93 105 100 70 69 60 9 93 72 80 61 50 50 9 97 102 100 64 64 64 10 73 77 91 56 49 57 10 99 102 100 66 67 68
11 78 84 98 57 54 63 11 100 95 88 68 63 69 12 83 91 88 58 55 58 12 100 94 88 65 57 65 f 13 85 96 87 61 59 52 13 100 97 94 64 62 65 14 90 100 83 59 64 56 14 101 94 100 62 58 70 v 15 96 84 80 64 58 49 15 104 89 97 65 57 71 16 101 84 84 69 55 54 16 103 , 95 97 68 59 67 jr 17 104 83 87 70 51 54 17 100 102 97 63 60 66 18 102 . 85 89 68 54 56 18 95 99 94 60 64 64 » 19 99 87 95 65 52 59 19 95 98 91 61 63 60 20 93 91 97 61 55 61 20 94 101 91 60 62 58
21 83 91 96 54 53 61 21 94 100 89 62 64 55* 22 81 102 94 54 62 59 22 90 99 87 59 63 57 23 78 106 90 54 64 58 23 83 102 89 54 63 58 24 87 109 88 53 67 56 24 86 102 90 54 64 58 25 95 110 78 59 66 53 25 88 100 89 54 61 57 26 97 100 77 62 65 48* 26 93 98 94 56 60 60 27 86 92 89 56 55 55 27 96 92 98 57 56 60 28 80 94 95 54 55 58 28 96 90 98 60 56 61 29 85 91 99* 49 56 61 29 98 90 98 60 55 61 30 90 94 91 54 55 57 30
31 89 88
94 69
96 89
64 56
55 54
61 59
* Extreme for the month.
Continued

91
TABLE 12 DAILY MAXIMUM AMD MINIMUM TEMmATUKES AT J-'HESNO. CALIFOBNIA •i*-' MAT IHRCrai NOVEMHER 1963-65 - Contd.
Date Maximum Minimum Date Maximum M inimum 1963 1964 1965 1963 1964 1965 1963 1964 1965 1963 1964 1965
Seut, 91 73 86 59 51 58 *& 61 83 67 54 51 37*
2 96 82 88 61 48 55 17 70 79 73 52 48 41 3 101 92 92 65 52 58 18 75 87 77 51 51 43 4 87 94 86 69 55 55 19 78 87 77 54 51 50 5 92 94 86 66 55 52 20 70 92 80 54 52 47 6 96 85 75 64 52 58 7 99 86 78 66 50 57 21 73 91 85 50 50 49 8 99 86 83 65 50 52 22 77 88 90 53 47 47 9 96 87 89 67 50 52 23 71 81 90 53 47 49
10 91 94 91 59 51 54 24 73 72 88 46 46 47 25 75 71 88 52 46 46
11 97 94 90 61 56 53 26 75 70 88 51 44 45 12 89 95 89 64 58 51 27 75 69 85 48 48 47 13 86 86 91 62 53 52 28 78 74 81 56 57 46 14 90 86 92 60 51 51 29 76 70 86 51 55 46 15 91 90 91 60 55 55 30 70 68 84 50 49 44 16 81 96 84 58 58 55 31 71 72 83 41 48 46 17 76 84 76 58 57 48 18 67 87 78 58 51 54 NOT- 19 79 91 78 57 56 47 76 66 82* 44 50 45 20 84 94 83 59 55 46 2 72 67 70 42 45 44
3 67 65 73 50 48 41 21 88 82 87 56 49 49 4 65 72 73 48 46 41 22 86 91 89 59 53 50 5 65 69 70 54 46 43 - 23 84 95 92 58 57 51 6 60 66 73 46 52 42 24 92 98 92* 57 59 52 7 57 74 76 42 52 41 • 25 100 96 85 61 62 55 8 65 72 75 42 55 43 26 107 89 78 64 56 54 9 68 60 68 52 52 43 « 27 104 82 71 68 51 55 10 68 59 68 51 45 38 28 97 81 76 63 50 49 29 95 82 78 63 50 45* 11 72 57 67 44 46 38 30 97 86 90 66 50 46 12 71 65 63 48 45 45
13 74 53 59 51 37 54 Ocrt. 14 73 53 61 52 33 54
Î 94 89 92 62 52 47 15 62 53 66 44 30 56 2 95 94 96* 65 56 49 16 56 54 60 36 33 58 3 93 96 88 59 57 48 17 58 56 71 36 35 57 4 82 96 90 60 58 49 18 57 53 63 37 31 54 5 79 95 73 56 58 50 19 59 59 63 38 29 47 6 82 95 85 54 58 52 20 55 59 58 47 29 45 7 86 93 92 54 60 52 8 78 86 95 56 57 53 21 51 62 61 37 31 45 9 84 86 83 56 54 54 22 56 62 61 34 40 39
10 82 89 79 54 54 53 23 54 60 62 36 36 54 24 54 60 62 41 37 47
11 70 95 81 55 56 49 25 59 62 57 39 42 44 12 72 95 83 48 55 52 26 62 64 57 36 45 37 13 77 81 85 50 51 53 27 49 59 56 44 38 33 14 85 81 75 52 49 54 28 47 62 60 43 36 34 15 75 87 67 54 53 46 29 48 64 59 43 38 33*
30 45 64 54 41 36 39
* Extreme for the month.
Source: U0 S. Department of Commerce, Weather Bureau, Fresno, California

0 9
TABLE 13,
THOUSANDS OF TONS
TOTAL PRODUCTION AND UTILIZATION OF CALIFORNIA GRAPES
4,000
3,600
3,200
2,800
2,400
2,000
1,600
1,200
800
400
/\
V CRUSHED
'<^
,f*w,i RAISIN
-w ~+00 FRESH
'^ y ^.^
""""mu, i..„„„„„.i •••/■••""'»■■"»u,II||rt0»»»%i*M",'"#»,1,.uHi'»||ll*i,,t
I I I L I I 1 I 1955 '56 '57 58 '59 '60 '61 '62 '63 '64 1965
Raisins converted to fresh weight basis. Source: California Crop and Livestock Reporting Service.

. <* I« t*w*
TABLE 14.
DOLLARS PER TON
80
70
60
50
40
30
20
10
0
CALIFORNIA GRAPES, ALL VARIETIES: SEASON AVERAGE GROWER PRICE BY UTILIZATION
1950 '51 '52 »53
Raisins, fresh basis.
•56 '57 '58 '59 'ÓO '61 '62 '63 '64 1965
Source: California Crop and Livestock Reporting Service.

TABLE 15.
MILLION GALLONS
140
120
100
80
60
40
20
0
1
E S
SHIIMENTS OF CALIFORNIA WINES INTO ALL MARKETS
ALL WINE ^^^ ^^
r^mmmmmm^^ *mm%, DESSERT WINE
TABLE WINE .,0'0
«,'"""""'
II l 1 l 1 1 1 1 955 '56 r57 '58 '59 f60 '61 f62 f63 '64 1965
essert wine includes vermouth, and from 1957 special natural wine. Table wine includes sparkling wine, ource: Wine Institute, San Francisco, California.
1 Ar < J^K

ta» «. ^r»
TABLE 16. INTERSTATE CARLOT SHIPMENTS OF CALIFORNIA WINES
CARS
14,000
12,000
10,000
8,000 JW0*-*—
6,000
4,000
2,000
PACKAGE CARS
1955 •56 '57 •58 '59 ■60 '61 •62 'frS '64 1965
As of September^ 1957, tank cars include bulk boat shipments reduced to carlot equivalents. Source: Federal-State Market News Service, San Francisco> California.

96
TABLE 17.
J
USUAL HARVESTING PERIODS OF CALIFORNIA AND ARIZONA GRAPES,
BY DISTRICT AND VARIETAL CLASSES
PRODUCING DISTRICT CALIFORNIA |
JAN FEB MAR APR MAY JUN JUL AUG SEP OCT NOV DEC
RAISIN VARIETIES
Desert Valleys
WA m San Joaquín Valley
{5 ^ Í
T?-»- <-» iil-> —8% m m m w. P mmwwM t
TABLE VARIETIES
Desert Valleys
g m m R San Joaquín Valley
W/A w. m. m m % wfc —K w/mm///M. Bs
WINE VARIETIES
-Jffi m/mm. z//
mmm Central ana «ortn Loast —
H '///A mu ti V/sA
I
PRODUCING DISTRICT ARIZONA
JAN FEB MAR APR MAY JUN JUL AUG SEP OCT NOV DEC
TABLE VARIETIES .
Phoenix
WA ̂
Yuma
Jflfi VA
4
Based on movement data for recent years.
FEDERAL-STATE MARKET NEWS SERVICE.

i I
i é
üo So DEPAEmENT ÖF AGRICraiTÜEE-C&MS Fed¿ral*Stäte Market News Service
727 U0 S0 Appraisers Building San Francisco, California 94111
Official Business
Postage and Fees Paid U. S, Department of Agriculture
t
4
Chief, Fruit Branch Fruit & Vegetable Division Ü. S. Dept. of Agriculture Consumer & Marketing Service Washington, D. C. 20250
MARKET BEPORT - URGENT SAN FRANCISCO - GRAHE, RAISIN AND WINE SUMMARY