Annual Report 1965 - [email protected]
168
-
Upload
khangminh22 -
Category
Documents
-
view
1 -
download
0
Transcript of Annual Report 1965 - [email protected]


MAURITIUS SUGAR INDUSTRY
RESEARCH INSTITUTE.
ANNUAL REPORT 1965
Printed by :CLAUDE MARRIER d'UNIENVILLE
THE MAURITIUS PRINTING CV. LTD.37, Sir William Newton Street
Port Lou is - Mauritius1966

P. O. Wiehe
CONTENTS
MEMBERS EXECUTIVE BOARD AND RESEARCH ADVISORY COMMfITEE
STAFF LIST
REPORT OF CHAIRMAN EXECUTIVE BOARD
REVENUE AND EXPENDITURE ACCOUNT
RESEARCHACT~S
INTRODUCTION
Page
5
6
7
9
I I
CANE BREEDING
I. Arrowing2. Crossing3. Selection4. Variety Trials
NUTRITION AND SOlLS
P. R . Hermelin, J. A. Lalouette,L. P . Noel, M. Perornbelon 37
37383939
M. Hardy
P . HalaisP. Halais
D.H. ParishD.H. Parish& M. Hardy
I. Nitrogen studies D. H. Parish, L. Ross,C. L. Figon & C. Cavalot
I. Efficacy of ammonium sulphate on sugar cane ...11. Studies on the nitrification of ammonium sulphate and on
the movement of nitrate in soil profilesIll. Studies on denitrification lossesIV. Comparison between urea and ammonium sulphate as nt
trogen sources for sugar canev. Etfect of ammoniacal and nitrate nitrogen and time of application
2. The phosphorus status of Mauritius soils as D. H. Parish,determined by chemical extractants and Y. Wong You Cheongfoliar diagnosis .. . & L. Ross
3. Interstalk movement of phosphate in sugar Y. Wong You Cheongcane by means of radio-active phosphorus & C. L. Figon
4. Trace-element status of sugar cane D.H. Parish, E.c. Vignes,in Mauritius C. Cavalot & M. Abel
5. Yield responses of sugar cane to potassium, calcium,magnesium, phosphorus and silicon
6. Preliminary notes on leaching of nitrogenin Iysimeter studies ...
7. Notes on the chemical composition of rain andirrigation water
8. The interpretation of three years' foliar diagnosis on thepermanent sampling units
9. Variety corrections for Si, Ca, Mn leaf-sheath diagnosis
4141
4346
4850
56
59
60
62
64
65
6769

CANE DISEASES R. Antoine & C. Ricaud
I. General considerations2. Gumming disease3. Leaf scald4. Ratoon stunting5. Chlorotic streak6. Fusarium stem rot or wilt7. Microflora of the sugar cane rhizosphere8. Fiji disease in Madagascar
7171767879808183
CANE PESTS J. R. Williams
I. The stalk moth-borer 852. The scale insect 863. General 89
WEED CONTROL E. Rochecoustc
1. Further investigations on the use of substituted uracils 912. Evaluation of new herbicides 923. Control of perennial weeds 93
CLIMATE AND CULTIVATION
1. Climatic conditions during 1965 campaign P. Halais2. Some climatic factors promoting sucrose accumulation
in sugar cane P. Halais3. Forecasting final sugar production from August onwards P. Halais4. Irrigation survey, 1965... G . Mazery & M. Hardy5. Economics of irrigation in Mauritius .. . G . Mazery6. Notes on methods of planting .. . G. Rouillard7. Preliminary results of experiment with petroleum mulch .. . . M. Hardy8. Notes on spacing experiments G. RouilJard
95
101105107108I11112114
SUGAR MANUFACTURE
127
117
123
132
E. Piat & M. Randabel
M. Randabel & F . Leguen
. J. D. de R. de St. AntoineE. C. Vignes
& J. D. de R. de St. Antoine
I . The Performance of sugar factories in 19652. Investigations on the removal of
starch from cane juice .. .3. Curing low grade massecuite in an
Allis-Chalmers 2750 continuous centrifugal4. Chemical Control Notes :
Notes on the use of the Bausch andLomb precision sugar refractometer forchemical control of sugar factories
BY PRODUCTS
IV. Protein recovery from cane juice and syrup R. de Froberville 135
P. O. Wiehe
CONTENTS
MEMBERS EXECUTIVE BOARD AND RESEARCH ADVISORY COMMI1TEE
STAFF LIST
REPORT OF CHAIRMAN EXECUTIVE BOARD
REVENUE AND EXPENDITURE ACCOUNT
RESEARCHACT~S
INTRODUCTION
Page
5
6
7
9
11
CANE BREEDING
1. Arrowing2. Crossing3. Selection4. Variety Trials
NUTRITION AND SOILS
P. R . Hermelin, J. A . Lalouette,L. P. N oel, M. Perornbelon 37
37383939
M. Hardy
P . HalaisP. Halais
D.H. ParishD.H. Parish& M. Hardy
I. Nitrogen studies D. H. Parish , L. Ross,C. L. Figon & C. Cavalot
I. Efficacy of ammonium sulpha te on sugar cane ...11. Studies on the nitrification of ammonium sulphate and on
the movement of nitrate in soil profiles111. Studies on denitrification lossesIV. Comparison between urea and ammonium sulpha te as nt
trogen sources for sugar canev. Etfect of ammoniacal and nitrate nitrogen and time of application
2. The phosphorus status of Mauritius soils as D. H. Parish,determined by chemical extractants and Y. Wong You Cheongfoliar diagnosis ... & L. Ross
3. Interstalk movement of phosphate in sugar Y. Wong You Cheongcane by means of radio-active phosphorus & C. L. Figon
4. Trace-element status of sugar cane D.H. Parish, E.C. Vignes,in Mauritius C. Cavalot & M . Abel
5. Yield responses of sugar cane to potassium, calcium,magnesium, phosphorus and silicon
6. Preliminary notes on leaching of nitrogenin Iysimeter studies .. .
7. Notes on the chemical composition of rain andirrigation water
8. The interpretation of three years' foliar diagnosis on thepermanent sampling units
9. Variety corrections for Si, Ca, Mn leaf-sheath diagnosis
4141
4346
4850
56
59
60
62
64
65
6769

MEMBERS EXECUTIVE BOARD
Sir Andre L. Nairac, C.n.E., Q.c., Chairman, representing the Chamber of Agriculture
Mr. M. D. ffrench-MuJlen, representing Government
Mr. L. H. Garthwaite
Mr. R. de Chazal
Mr. Rene Noel
II>- representing factory ownersIj
Mr. Georges Rouillard, representing large planters
Mr. S. Gaya
Mr. H. Lallmahomed
I>- representing small plantersj
MEMBERS RESEARCH ADVISORY COMMITTEE
Dr. P. O. Wiehe, C.B.E., Chairman
Mr. M. D. ffrench-Mullen, representing the Department of Agriculture
Mr. K. Lutchmeenaraidoo, representing the Extension Service of the Department of Agriculture
Mr. Auguste Harel, representing the Chamber of Agriculture
Mr. P. de L. d'Arifat
Mr. Rene Noel
I>- representing the Societe de Technologie Agricole et Sucriere
j
and the senior staff of the Research Institute.

P. O. Wiehe
CONTENTS
MEMBERS EXECUTIVE BOARD AND RESEARCH ADVISORY COMMfITEE
STAFF LIST
REPORT OF CHAIRMAN EXECUTIVE BOARD
REVENUE AND EXPENDITURE ACCOUNT
RESEARCHACT~S
INTRODUCTION
Page
5
6
7
9
I I
CANE BREEDING
I. Arrowing2. Crossing3. Selection4. Variety Trials
NUTRITION AND SOlLS
P. R . Hermelin, J. A. Lalouette,L. P . Noel, M. Perornbelon 37
37383939
M. Hardy
P . HalaisP. Halais
D.H. ParishD.H. Parish& M. Hardy
I. Nitrogen studies D. H. Parish, L. Ross,C. L. Figon & C. Cavalot
I. Efficacy of ammonium sulphate on sugar cane ...11. Studies on the nitrification of ammonium sulphate and on
the movement of nitrate in soil profilesIll. Studies on denitrification lossesIV. Comparison between urea and ammonium sulphate as nt
trogen sources for sugar canev. Etfect of ammoniacal and nitrate nitrogen and time of application
2. The phosphorus status of Mauritius soils as D. H. Parish,determined by chemical extractants and Y. Wong You Cheongfoliar diagnosis .. . & L. Ross
3. Interstalk movement of phosphate in sugar Y. Wong You Cheongcane by means of radio-active phosphorus & C. L. Figon
4. Trace-element status of sugar cane D.H. Parish, E.c. Vignes,in Mauritius C. Cavalot & M. Abel
5. Yield responses of sugar cane to potassium, calcium,magnesium, phosphorus and silicon
6. Preliminary notes on leaching of nitrogenin Iysimeter studies ...
7. Notes on the chemical composition of rain andirrigation water
8. The interpretation of three years' foliar diagnosis on thepermanent sampling units
9. Variety corrections for Si, Ca, Mn leaf-sheath diagnosis
4141
4346
4850
56
59
60
62
64
65
6769

REPORT OF THE CHAIRMAN
EXECUTIVE BOARD 1965
TH E Board held 12 meet ings duri ng the yea r, one of which join tly with the ResearchAdvisory Co mmi ttee. T he only cha nges on the Board were the rep lace ment of Mr. B. D .Purmanun by Mr. Ham id Lallrnahorncd as rep resenta tive of small plant ers, and the
replacemen t by Mr. S. Staub of Mr. ffrench-Mullen fro m July to October , whi le the latter wason overseas leave.
ESTABLISHMENT
I am glad to record that severa l memb ers of the sta ff ob ta ined higher degrees in the courseof the year : Mr. D . H . Parish, Ph. D. of Queen's University, Belfast; Mr. C. Ricaud , Ph. D. inP lant Pathology, Lond on Universi ty; Mr. C. Mo ngelard, M. Se. in Botan y and o.r.c. : M r. Y.Wong You Chong, the Associateship of the R oyal Institu te of Ch emistry. In addi tion , M r. E. F.George, our for mer Geneticist, obtained the Ph . D. of London University for work done at theInstitute. T here were few changes in the staff, alt houg h we were aga in faced by two resignati ons,the officers concern ed having obtai ned posts ou tside Mau ritius: Mr. W. de Groot resigned in Mayas Plant Breeder, ha ving been o ffered and having accepted a post in Barbad os, while M r. Mametalso left the colony for Reunion and resigned as Field Officer. Mr. L. P. N oel, however , whohad resigned in 1964 came back to the Inst itut e and was appointed Associat e Piant Breeder,an d Mr. L. Tha tcher was appointed F ield Officer. Mrs G . Caine, who had attained retiring age ,left the In sti tut e in December after twelve years fa ithful service .
FINANCE
The increase in cess applied for by the Inst itute, and partially granted after a lon g delay,helped the In stitute to finance its expend iture . It is to be noted however tha t the increase of50 cents per ton of exported sugar - 25 cents short of the increase applied for - was fur therwhittled down in the course of the year by the re-impositi on of the Institute 's contribu tio n tothe former «Phytalus Fun d ». The net increase of 40 cents per ton barely a llowed the Instituteto meet expenditure and precluded it from launching into some desirabl e activities - and this inspite of a cro p larger than was anticipated, in fact the second best crop of the Col ony. TheInst itut e is therefore sti ll financing its necessary expendi ture by borr owing from the banks, andremai ns a t the mercy of one of those drastic red uctions in the crop which are a lways to befeare d in our clima tic condi tions . Planters and millers have always shown themselves ready tosupport the Institute, and Government woul d be well advised to med itate the opinion expressedby a well-known agricultural jou rnal in these words: «E very support needs to be given to theSugar Indust ry Research Insti tut e by the estates and Government if it is to do its j ob as effec tivelyas those serving compe ting sugar producing areas.»

AIME de SORNAY SCHOLARSHIP
Two candidates, Messrs. GiJles Gullet and Mohamed Goolam Hossen, came out thirdex-aequo at the College Entrance Examinations, both fulfilling the conditions stipulated for theaward of the Aime de Sornay Scholarship. In view of the fact that no award had been madein 1964, the Board decided to grant a scholarship to each of the two candidates.
RESEARCH ADVISORY COMMITTEE
Messrs. G. P. Langlois and Adrien Wiehe who had represented the Chamber of Agricultureand the Societe de Technologie Agricole et Sucriere respectively on the Research Advisory Committee since its inception in 1954, ret ired and were replaced by Messrs. Auguste Harel and ReneNoel. I would like to place on record my sincere thanks to Messrs. Langlois and Wiehe forthe services they have rendered to the Institute during these twelve years.
Lastly, I would like to record my deep appreciation of the competence and whole-hearteddevotion with which the Director and his staff carried out, once again, their important, andoften delicate, functions during the year under review.
Chairman
25th January, 1966.

REVENUE AND EXPENDITURE ACCOUNT
YEAR ENDED 31st DECEMBER, 1965
Running & Administrative ExpensesHerbarium ExpensesInterest PaidLeave and Missions FundDepreciationExcess of Revenue over Expenditure
Rs.
1,732,280.664,991.05
48,397.31125,000.144,103.31
8,650.01
2,063,422.34
Cess on Sugar exportedMiscellaneous receipts
Rs .
2,028,582.6234,839.72
2,063,422.34
BALANCE SHEET
AS AT 31st DECEMBER, 1965
ACCUMULATED FUNDS
REVENUE FUNDS
AI ME DE SORNAY FOUNDATION
LOAN FROM ANGLO MAURITIUSASSURANCE SOCIETY LTD .
GOVERNMENT OF MAURITIUS(Purchase of Buildings)
BANK OVERDRAFT
1,349,118.98 FIXED ASSETS (at cost less Depreciationand amounts written off)
88,437.10 Land & Buildings 1,479,169.79Equipment 62,214.93
25,000.- Agricultural Machinery andVehicles 41,390.-
1,582,774.72128,243.- CURRENT ASSETS
114,947.55 Sundry Debtors 141,544.49Airne de Sornay Foundation
Account 25,000.-66,574.93 Cash at Banks & in hand 23,002.35
189,546.84
Rs. 1,772,321.56 Rs. 1,772,321.56==== = == ~ = = = = =
AUDITORS' REPORT
(sd) JEAN ESPITALIER-NOEL
(sd) GEORGES ROUILLARD
(sd) P. O. WIEHE
} Board M embers
Director
We have examined the Books and Accounts of theInstitute for the year ended 31st December 1965, andhave obtained all the information and explanations wehave required. In our opinion, proper books of accountshave been kept by the Institute so far as appears fromour examination of those books, and the foregoingBalance Sheet is properly drawn up so as to exhibit atrue and correct view of the state of the Institute'saffairs as at 31st December 1965, according to the bestof our information and the explanations given to us, andas shown by the Books and Accounts of the Institute.
P.R .C. DU MEE, CA (SA), F.S .A.A.
DE CHAZAL DU MEE & Co.
Chartered Accountants
Port Louis,Mauritius,
19th March, 1966.

664,500 TONS
RAW SUGAR
98.6 POL.
f5.984.000 TONS
CANE
194,000 ARP.
HARVESTED
207,000 ARP.
SUGAR CANE
r:/
//
//
I
--<\\\\
\\
'-
I/
//
//
//
-<\\\\\\\'---
.1.60 0 .0 0 0 TONSBAGASSE
49 % MOISTURE
150.000 TONS
MOLASSE S5 ~o MOl S TURE
170.000 TONS
FILTER CAKE78 % MOISTURE
680.000 TON SROOTS
390.000 TO N S
DRY MAT TER
950.000 TONSTRASH
703.000 TONS
DRY MAT TER
1,675.000 TONS
TOPS450 000 TONS
DRY MATTER
Production of cane, sugar, and associated products of the suga r industry in 1965

INTRODUCTION
THE 1965 SUGAR CROP
Sugar manufactured %cane
served from data available since 1875. Toaggravate matters, rrumrnurn air temperatureswere above normal, while the daily range oftemperature was low throughout the harvestsea50n. Ripening of the cane was thereforeseriously affected as may be seen from thefollowing data :
It is probable, however, that the warm andwet harvest season which was experienced in1965 favoured cane growth, thus compensatingto some extent some of the negative factorswhich had prevailed earlier in the season.
The more important data concerning the1965 sugar crop are compared to those of 1964in the table below, while several features ofinterest relating to cane and sugar productionare illustrated graphically in figs. I to 7.
Normal /965
11.111.510.811.211.011.6
206,900
99,80995,602
195,4114,375,014
207,000
1965 1964
100,60093,498
194,0985,984,489
11.912.412.111.711.612.2
IslandWest ...NorthEast ...SouthCentre
Area cultivated, arpentsArea harvested, "
Estates ...PlantersTotal
Weight of canes, metric tons
T H E area under sugar cane cultivation inMauritius has now reached 207,000arpents, of which 93.7 % was reaped in
1965 to produce 5,984,489 tons of cane, thehighest weight so far recorded in the island.
On the other hand, sucrose content (12.69 %cane) was one of the lowest experienced inrecent years *; nine tons of cane were required toproduce a ton of sugar in 1965 as opposed toa normal ratio of 8.4. As a consequence, thetotal sugar output of 664,000 metric tons wasbelow normal expectations.
An analysis of the major climatic factorsaffecting growth and maturity during the yearreveals several points of interest which aresummarized below.
During the vegetative period from November1964 to June 1965, the monthly distribution ofrainfall over the island as a whole did notdepart much from normal, the rainfall deficitsamounting to 14.08 inches as opposed to anaverage of 15.00 inches during the last 90 years.These deficits, however, were locally morepronounced, particularly along the coastal areasof the island in February and March.
Cane growth was adversely affected by thelower temperatures which prevailed almostcontinuously from November to June 1965, andwhich averaged 0.6°C below normal.
The tropical depression Rose which occurredin early May did not produce wind speedshigher than the critical limit of 30 miles perhour during one hour at any of the stationswhere anemometers are situated.
From July to November, climatic conditionswere most abnormal, the sum of monthly rainfallexcesses reaching 14.12 inches, the highest 0b-
* Except in 1960

-12-
18GROWTH SEASON HARVEST SEASON
260
D C
..0 E
.: irf .
" .P, /
" J/i!'/,rf
,','rt
t »
I~I
"J,'.'
"';pi
.A Nr
/(II~
II
/
fI ....d
I ..-d 0"
...0-- ..'r / .:,/ ...-
-;, I ...:' .' f
,: ~ /.' / .Cl
.' /.' d cl
, <) / -'.' I ....p! FP
u j";/ r:/1"/
d E ,1]-...0
60
220
240
2
40
30
28 200
26 ;>
24 ~180
::>....22 <t
Cl:w ::: 160Q. u20 :l;w 7....
18
"" 140
16 --'-c....
14 <J)
120I...."Zw 100--'
80
oAM A Mo
Rainfall, maximum and minimum temperatures,during the growing and harvest season of 1965.
N
19 64
O'----'-----'----'----'-----'----'-----'------'---'---'--,--'"----,,-...J
4
16
14
12
...J
...J
iJ: 8z<tCl:
Fig . I.
if)
WIU
-~ 10
~
40 Fig. 2.
DEC .1964 1965
Elongation of cane stalk s during the growingseason of 1965 in each of the five sectors ofthe island .
3515.0
~
Zw"er:-c 30er:wCL
wz3 2 5V>z2
0- ,-'-
. '0-'" - - -0- -". _'-0- '- __ , -'0-- _._ --014.0
wZ<tU
~o 13.0w<J)
occu:>t/) 12.0
20
o...L.....,....---r--....-.oy--.,---,-----,11.0
DEC.NOV.OCT .SEPT.AUGUSTJULY
Variation in sucrose content. Plain line: 1965 ;broken line: average 1959-1964.
Fig. 4.
5RlRv 2R 3R
CROP CYCLE
Fig. 3. Cane yields in 1965 (plain line) compared to theaverage 1959·1964 for all est ates of the island(broken line) .

-13-
Fig. 2 Elongation of cane stalks in the fivesectors of Mauritius during the cane Fig. 7growing season of 1965. Growth wasalmost normal in all sectors, except in theNorth where deficient rainfall in Februaryand March caused a marked retardationin elongation.
The following are some observations deducedfrom an analysis of figs. I to 7.
Fig. I Rainfall and temperature in 1965 ascompared to normal. It will be observedthat temperatures were generally belowaverage during the growing season,while the daily range of air temperaturewas smaller than normal during theharvest season, coupled with higherminimum temperatures. Rainfall wasconsiderably in excess from July toOctober.
Sugar manufactured % cane in thedifferent sectors of the island in 1965compared to the island's normal (I 1.9%),and to the sectors' normals. Sucrosecontent was below average in all sectors,and particularly so in the North.
Yields of cane in virgins and 5 ratoonscompared to the average for 1959-1964(1960 excluded). These data are anaverage for the 23 estates of the islandrepresenting the following acreages:virgins 12,479 arpents, 1st R. 12,823;2nd R. 13,693; 3rd R. 15,480; 4th R.13,682 ; 5th R. 11 ,180. It is probable that the sudden decrease in yieldafter the 2nd ratoons is due to thesmaller acreage of high yielding varietiessuch as M. 202/46 and M.93/48 in theolder ratoons. Reference to Table XIIof the Appendix will indicate the varietalcomposition of the ratoon crop, thus 3rdratoons in 1965 were planted in 1961, etc.
Fluctuations in sucrose content throughout the harvest season of 1965 arecompared to the previous 5 - year average(excluding 1960). Ripening of the canedid not occur because of heavy rainsfrom July to October. For the sameweight of cane crushed, the area betweenthe two curves is equivalent to a shortfall of approximately 50,000 tons sugar.
The area occupied by different canevarieties in 1965 is shown in comparisonwith areas planted during the year.The ratio between these two figures givesa correct appreciation of the extensionor regression of a particular variety.
The relative yields of sugar per arpent(metric tom of 98.6 pol.) of plantersand estates in 1965 are shown separatelyfor each sector, and for the island as awhole. The largest difference occurredin the East (-1.71 tons sugar), and thesmallest in the West (---0.68 tons sugar).On the average , estates produced 1.06 tonsmore sugar/arpent than planters in 1965.
Fig. 3
Fig. 5
Fig. 4
Fig. 6
1965 1964
35.7 26.225.6 18.730.8 22.4lUO 1l.85
3.96 3.102.91 2.193.42 2.65
156 121100.6 95.4268,700 252,900
12.49 13.4512.95 13.842.53 2.602.90 3.40
88.0 86.496.0 96.2
1.93 2.03
88.8 90.085.3 86.6
1.55 1.73664,460 518,994
Tons cane per arpent :
Estates . ..PlantersAverage, Island
Sugar recovered % cane
Tons sugar per arpent :
Estates . ..PlantersAverage, Island
Duration of harvest , daysTons cane per hourTons cane crushed weeklySucrose % caneFibre % cane ...Molasses % caneFilter cake % canePurity mixed juiceReduced mill extractionSucrose % bagasseReduced boiling house
recovery .. .Reduced overall recoveryTotal sucrose losses % caneTons sugar 98.6 pol. .. .

-14-
Effect of rainfall excesses on cane quality. Theabnormally high rainfall which occurred fromJuly to November provided extreme datawhich had hitherto been lacking to determinethe true relation existing between rainfallexcesses and cane quality. Thus the relationshipbetween these two factors is not linear butlogarithmic. By using data available since 1950a high positive correlation was found (r = 0.936)between cane quality and the logarithm of rainexcesses for the island as a whole . Individualequations for each of the five sectors were alsoworked out , and are presented in this report.
Sugar production forecast. The data issuedregularly by the Institute since 1955 in Weekly
Bulletin of Crop Evolution have been used todevelop equations relating sugar yields obtaining on estates at a given date to final yieldfor the island as a whole.
From the appropriate regressions, It IS nowpossible to predict within reasonable limits thesugar production of the island, and of four outof the five sectors, as soon as harvest begins.Forecast for the North is more hazardousbecause of the relatively larger fluctuations insugar yield brought about by climatic variations.Additional data essential to forecast the sugarcrop are (i) total ar ea to be harvested, and(ii) the ratio of island yield to estate yieldwhich has increased from 0.80 in 1955 to 0.86in 1966.
THE CANE VARIETY POSITION
One of the most pressing questions whichthe Institute has to face at the moment is thereplacement of M.l47/44 because of its susceptibility to gumming disease. The incidenceof gummosis and its effects on M.147/44 in1965 are discussed briefly elsewhere in thisIntroduction, and more fully in the Pathologysection . As stated in the 1964 Annual Report,this problem is more acute in the drier partsof Mauritius where M.147/44 has been anoutstanding variety, producing in those areasmore sugar per acre than any variety hithertocultivated. The hopes placed on M.442/5 I as asubstitute for M.147/44 have so far been fulfilled, inasmuch as the performance of thisvariety in 1965 has confirmed that it has anequal sugar potential under dry conditions. ButM.442/51 is a medium to late-maturer, and itis desirable therefore that it should be complemented by other early maturing varieties. Inthis connection, observation plots have beenestablished in 1965 at six sites in the coastalarea where rainfall does not normally exceed50" per annum. The drought resistance of 112varieties is being studied in order to establishtrials and propagation plots of the more promising varieties.
Concerning varieties under commercial cultivation, it is interesting to note (vide Table XIof Appendix) that 65 % of the cane area was
occupied in 1965 by varieties released since 1956.The present status of commercial varieties is asfollows :
(a) Varieties which are declining in importance:
M.l47/44, because of its susceptibility to gummosis; occupied 29% of the cultivated area and produced 32% of the1965 crop;
M. 134/32, yields of which were in 1965 inferiorto the island average, from 15% inthe North to 8% in the East; nowoccupies 5% of the cultivated area,and constituted 4% of the 1965 canecrop;
B.3337, highly susceptible to gummosis andyellow spot; cultivated only in thesuper-humid zone and occupying 5%of the cane area ;
B.34104, susceptible to gummosis; presentdistribution 2 % of cultivated area,chiefly in the West.
(b) Varieties which are at present in equilibrium
Ebene I/J", now occupies 11 % of the cultivated areafrom the previous high level of 25 %;cane yields in 1965 were 2.3 tons peracre less than the island average, but

-15 -
12.5-
12 .3
UJ 12 Iz<l:V
~11.9
0UJ
a:: 11.7 W~
l-V«LJ-. 11.5~
z E<l:L
11.3 NS
a::<l:o~ 11 .1v")
10.9
4.75
4.50
5.00
3.00
3.50
n:w
3.75 a.n:«Cl~III
IIIZo~
3.25
2.7 5
2.50
4.25 ~Zwa.
4 .00 ~
1E r-
III1 V;I
ErII I V>
u..o
Wp l IC,. 0-
<t:0-
I 1 I V>
Iu..o
I 1 II ~E II
I I sI
I I I III I SIE
! ~I I ~I I I E : s ~
N
s,Ce on
~0-Z<t:
Ne Ep --'CL
+40
+50
-20
III-0
~ +30wCl«n:w::t + 20
'Clz«...JIII + 10
zozo 0~«s~ - 10
- 30
Fig. 5. Relative yields of sugar per arpent in differentsectors. Island yield = 3.42 tons of 98.6 pol sugar.Plain line : plant ers ; broken line : esta tes ;co lumns : sector average; shaded column: averageisland yield of plan ters and estates .
10 .7
Fig. 6. Suga r manufactured %cane in eac h sector in 1965(pla in co lumns) com pare d to island 's and secto rs 'norrn als (black columns).
5
25
10
30
20
I B IEBE NE I M I34104 1/37 147/44
B3337
25
20
«wn:« 15
*-10
5
0
Fig. 7.
30
....L.-__-.J...O
Presen t varieta l trend in Mauritius illustr at ed by area cultivated (plain columns) and area plant ed in 1965(black co lumns). Dat a refer to esta tes (a rea cult ivated: 109,000 arpe nts ; a rea planted : 13,400 arpents). Lettersdenote secto rs which are ar ranged in descend ing o rde r, according to the relat ive magnitude of plan tat ions .

- 16 -
Some interesting data concerning the presentstatu s of these varieties are tabulated below,while the present trend in varieties is showngraphically in fig. 7.
M.442/51, a variety which tolerates dry conditions and is a medium to late-maturer;such characteristics were confirmed byexperimental results in 1965; its paleyellow foliage together with susceptibility to rust and to attacks by thripsare not conducive to an attractiveappearance, but in the end, it is thesugar that counts and M.442 j51 hasa high potential.
Group (a)
M.147 j44 29 4 34 36.5M .134j32 5 I 4 32.7B.3337 5 4 27.5B.34104 2 2 34.4
Group (b)
Ebene 1/37 I1 2 I1 33.4Ebene 50/47 6 4 6 36.2M .253/48 2 3 2 37.8B.37172 9 10 36.1
Group (c)
M .31j45 4 9 4 36.6M.202/46 11 29 11 39.2M.93/48 12 26 11 36.5M.99/48 < I 3M.442 j51 2 19 39.0
The ·following promising new varietie s, whichare resistant to both forms of gummosis,have been " short listed " , on the basis of theiroverall agronomic performance , for con siderationby the Cane Release Committee. Th ey will be
sucrose content is high ; this varietywill probably be maintained for severalyears at its present level ;
Ebene50 /47, occupies 6 % of the cultivated area,but requires restricted environmentalconditions when sugar yields may bevery high; in 1965 contributed 6 %of total cane crop ;
M.253/48, of very restricted distribution (2 %),generally in irrigated areas ; caneyields were 5% above the generalaverage in 1965; low sugar, earlyand late in the season;
B.37172, which is at present cultivated over anarea representing 9 % of the total;will probably be maintained for sometime in the humid zone; a usefulvariety for late harvest; althoughgumming stripes are often abundant,no cases of systemic infection havebeen observed; susceptible to rootdisease complex; yields in 1965 wereslighty above average (0.4 TCA).
(c) Varieties which are gaining in importance :
M.3lj45 , occupi ed 4 % of the cultivated areain 1965 and yields were 3 % abo veaverage; although the popularity ofthis variety declined in recent years,several of its attributes. are now beingrediscovered. Very susceptible to stalkborer;
M.202 j46, occupies 1I % of the cultivated are a,and produced the highest averagecane yields in 1965 (39.2 tons perarpent); its susceptibility to leafscald requires special attention ;
M.93/48, is the most popular variety at presentin the super-humid zone and occupies12% of the toal cane area; averageyields in 1965 were 2 % above theisland mean; suscepti ble to stalk borer;
M.99j48, which is recommended for thesuper-humid zone, chiefly as a substitute for B.3337 ; susceptible to yellowspot;
* Average all varieties, island 35.7
%AreaCultivated
%Areaplant ed
% CaneCrushed
CaneYieldTCA*

-17-
included in a series of Final Variety Trials to beestablished early in 1966:
M.409/51M.658/51M.l3/53M.13/56Ebene 74/56N.Co:376
(M.112/34 x D/109)(B.34104 x M.213/40)(M.60/44 x M.72/31)(M.241/40 x M.147/44)(Ebene 1/37 x M.147/44)(Co. 421 x Co. 312)
The vaneties Ebene 88/56 and Ebene 118/56which have been mentioned in previous reportsappear to have outstanding qualities, but theirsusceptibility to leaf scald represents a serioushazard as to their commercial future. The results of promising varieties in variety trialsare summarized in the Cane Breeding sectionof this report.
CANE BREEDING AND SELECTION
Flowering was below normal in 1965 withthe result that although a total of approximately 1,250 crosses were made, the number ofcombination- decreased to 293. These crossesinvolved the use of 74 varieties as female, 33 asmale, and 13 as both male and female parents.However, a large number of crosses per combination were made in order to obtain a greaternumber of seedlings for assessing more preciselythe value of these combinations, some of whichare being known to yield few seedlings. Inaddition, more nobilisation lines were tried,involving newly imported robustums and spontaneums as well as existing stock.
In order to streamline the selection procedure and keep the number of seedlings atvarious stages of selection at a manageablelevel, it was decided to curtail considerablythe 1965 sowing programme. To that effect,the only fuzz sown was derived from crosses involving interesting nobilisation lines and fromspecial crosses made in an attempt to obtaininformation on the inheritance of resistance togummosis. The bulk of the fuzz was dried andstored in the deep freeze unit. Sowing andpotting of seedlings were carried out at Reduitonly. The seedlings are to be planted in thefield in March 1966.
An appraisal of breeding records, as mentioned in the 1964 report, has been progressingsatisfactorily and is continuing. So far, resultsobtained in first selection trials from 1953 to1964 have been recorded on punch cards, and aworking list produced, involving 141 combinations
derived from 27 male and 32 female parents,and 11 used as both male and female. Otherstages in selection are being recorded in thesame way with a view to future analysis inorder to assess the breeding behaviour ofparents. Emphasis has been placed on researchin the physiology of flowering. To that effect,several experiments were laid down, involvingvarious techniques, as a first step in an attempttowards a better understanding of the mechanismof flowering in sugar cane, knowledge whichmay lead to a more precise control of floweringfor breeding purposes.
The number of seedlings and varieties nowIII course of selection is as follows :
(i) Seedlings from 1963-1964 series, planted in March 1965(mostly in bunches of 3) 102,578
(ii) 1962-1963 series. Varieties inbunch selection plots. 23,574
(iii) 1960-1963 series. Varieties inpropagation plots for select-ion in first ratoons 6,938*
(iv) 1957-1961 series. Varieties infirst selection trials to be selec-ted in second ratoons 682**
(v) Varieties in multiplicationplots for establishing fieldtrials in 1966:
1957-1959 series 35Foreign varieties 5
40
• 3,443 varieties are planted in two environments, and the remaining 52 in only one
•• From this number, 86 varieties are tested in two environments, making a total of 596 different varieties
-18-
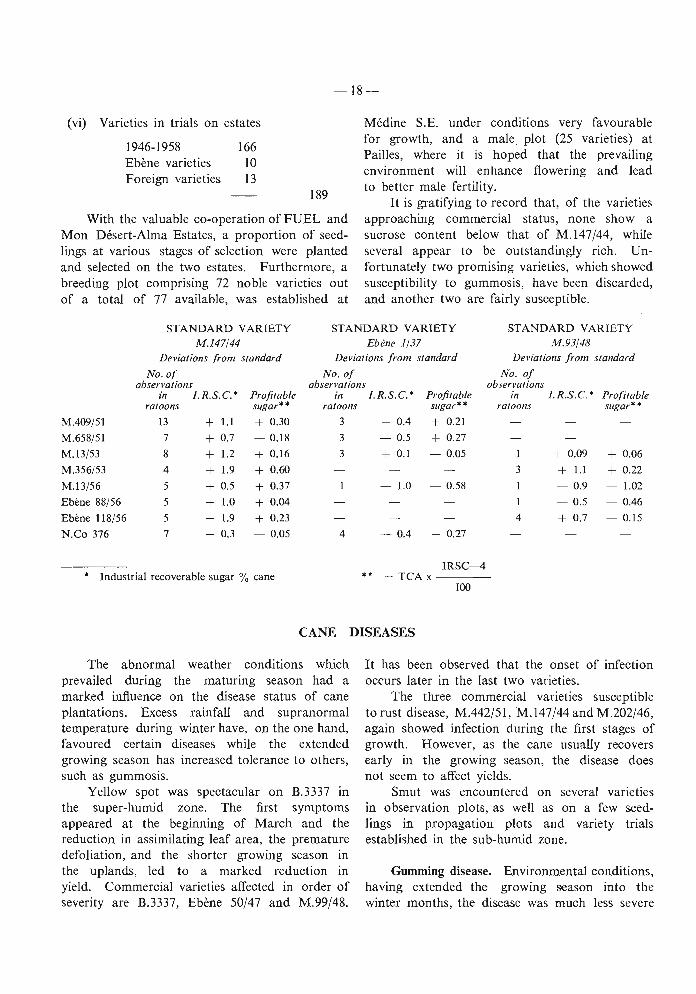
(vi) Varieties in trials on estates
1946-1958 166Ebene varieties 10Foreign varieties 13
189
With the valuable co-operation of FUEL andMon Desert-Alma Estates, a proportion of seedlings at various stages of selection were plantedand selected on the two estates. Furthermore, abreeding plot comprising 72 noble varieties outof a total of 77 available, was established at
Medine S.E. under conditions very favourablefor growth, and a male plot (25 varieties) atPailles , where it is hoped that the prevailingenvironment will enhance flowering and leadto better male fertility.
It is gratifying to record that, of the varietiesapproaching commercial status, none show asucrose content below that of M.147/44, whileseveral appear to be outstandingly rich. Unfortunately two promising varieties, which showedsusceptibility to gummosis, have been discarded,and another two are fairly susceptible.
STANDARD VARIETYM. 147/44
Deviations from standard
No . ofobservations
in I. R.S.C." Profitableratoons sugars?
STANDARD VARIETYEb ene 1/37
Deviations from standard
No . ofobservations
ill I. R.S.C. " Profitableratoons sugars"
STANDARD VARIETYM.93/48
Deviations from standard
No. ofobservations
in I.R.S.C." Profitableratoons sugar" "
M.409 /51
M.658/51
M.I3/53
M.356/53
M.I3/56
Ebene 88/56
Ebene 118/56
N.Co 376
13
7
8
4
5
5
5
7
+ 1.1+ 0.7
+ 1.2
+ 1.9
+ 0.5
+ 1.0
+ 1.9
+ 0.3
+ 0.30
- 0.18
+ 0.16
+ 0.60
+ 0.37
+ 0.04
+ 0.23
- 0.05
• Industrial recoverable sugar % cane
CANE DISEASES
The abnormal weather conditions whichprevailed during the maturing season had amarked influence on the disease status of caneplantations. Excess rainfall and supranormaltemperature during winter have, on the one hand,favoured certain diseases while the extendedgrowing season has increased tolerance to others,such as gummosis.
Yellow spot was spectacular on B.3337 inthe super-humid zone. The first symptomsappeared at the beginning of March and thereduction in assimilating leaf area, the prematuredefoliation, and the shorter growing season inthe uplands, led to a marked reduction inyield. Commercial varieties affected in order ofseverity are B.3337, Ebene 50/47 and M.99/48.
It has been observed that the onset of infectionoccurs later in the last two varieties.
The three commercial varieties susceptibleto rust disease, M.442/51, M.J47/44 and M.202/46,again showed infection during the first stages ofgrowth. However, as the cane usually recoversearly in the growing season, the disease doesnot seem to affect yields.
Smut was encountered on several varietiesin observation plots , as well as on a few seedlings in propagation plots and variety trialsestablished in the sub-humid zone .
Gumming disease. Environmental conditions,having extended the growing season into thewinter months, the disease was much less severe

-19-
than in 1964, particularly in such a vigorousvariety as M.14 7/44 which showed a reducedincidence of systemic infection as indicated byleaf chlorosis. However, the characteristic leafstriping was observed all over the island indicating a widespread epidemic. Furthermore,several cases of severe systemic infection withabundant oozing of gum were observed onB.3337 in the super-humid zone, as well as onM.147/44 in the sub-humid area, and on a fewseedlings in variety trials, thus indicating thatthe disease can be damaging under differentenvironmental conditions.
Out of the 267 varieties tested to the newstrain, 25 % reacted as susceptible, but it shouldbe pointed out that infection in the M.147 /44control plots was lower than expected, probablybecause of environmental conditions. Experimental evidence confirmed that the differencebetween the two strains of the bacterium is one ofvirulence rather than of varietal susceptibility.Thus 21 % of the varieties tested reacted asmuch more susceptible to the new strain, 32 %as more susceptible, 17%as slightly more susceptible and 31% showed an identical reaction.
The routine testing of varieties coming outof First Selection Trials was continued, and 42varieties were included in trials in two localitiesto assess their reaction to the old and newstrains; a few promising varieties already testedwere re-included in these trials. The projectof testing seedlings at the Propagation Plotstage had to be abandoned on account of thepractical difficulties encountered in running atthe same time a selection plot for agronomicperformance and disease reaction. The trialwas therefore established as an independentexperiment at the First Selection Trial stage, and377 varieties coming out of the PropagationPlots were included. Their reaction is beingtested to the new strain of the organism.
Observations on the development of systemicinfection showed that: (i) chlorosis does notnecessarily follow systemic infection; (ii) earlychlorosis in ratoons is largely due to knifeinfection, particularly when young shoots havebeen cut above the growing point; and (iii) stoolswith systemic infection play an important partin the carry-over of the disease from one seasonto the next, especially in the early stages of growth.
Attempts to isolate bacteriophages frominfected leaves and soil in the immediate vicinityof diseased plants have so far been unsuccessful.
A two-week course was conducted inorder to train field assistants employed byGovernment for the control of gumming diseasein small planters' fields.
Leaf scald. The outbreak of leaf scald, alsobelieved to be due to a new strain of the bacterium, has been spreading gradually over the island.The commercial varieties M.202/46 and M.147/44are susceptible. A few seedlings in varietytrials contracted infection during the year.
Surveys and rogueing in M.202/46 on oneestate revealed a maximum incidence of 24diseased stool s per arpent with an averageincidence of two to three stools per arpent.Subsequent rogueings in general brought down thenumber to an insignificant level. On anotherestate, the maximum number of stools rogued was68 per arpent, with an average of five per arpent.
Surveys conducted at the Central Nurseryas well as on several B nurseries on estates inthe variety M .202/46 have failed to reveal thepresence of the disease.
The disease is spread mainly by knives atharvest and in the preparation of cuttings, andby infected cuttings at planting time. It has therefor been recommended that nurseries be regularlysurveyed, and infected stools eliminated at anearly date. The importance of knife sterilization,already recommended in the control of ratoonstunting, has again been emphasized.
Chlorotic streak. Examination of the rootsystem of plants which had contracted infectionin water culture revealed the frequent occurrence ofa Chytrid which has not been identified yet.Several cases of transmission were also obtainedin the soil with plants grown in pots, the rate ofspread was however slower than in culturesolution.
The disease was severe in areas liable towater-logging in the super-humid zone , withdeath of young tillers, or of entire stools, particularly in the variety Ebene 1/37. This isattributed to the exceptionally wet winter.
The routine testing of hot-water treatmenttanks was continued.

-20-
Fusarium stem rot or Wilt. Several reportsof dying cane in fields approaching harvest wereinvestigated in the humid and super-humid zones.The overall symptoms were suggestive of rootdisease or white grub (Clemora smithi) damage.The outbreaks, although spectacular, were restricted to poorly drained areas. The fungus Fusariummoniliforme was isolated from the base ofinfected stalks. Although M.202/46 seemed tobe more prone to infection, similar symptomswere also observed on the following varieties:M. I34/32, Ebene 1/37, B.37172, M.93/48 .
Soil microflora. Studies, initiated in 1960, onthe fungal flora of the sugar cane rhizospherehave continued. Attemps to detect quantitativedifferences between the total fungal flora in rhizosphere of plants receiving organic fertilization, asopposed to inorganic fertilization, have been inconclusive. A list of saprophytic fungi isolatedfrom cane rhizosphere, and of those frequentlyisolated from diseased roots, is given in the CaneDisease section of this report.
Ratoon stunting disease. No experimentswere laid down in 1965 as it was necessary toobtain results from the gumming disease trialsbefore drawing up a list of resistant promisingvarieties for inclusion in the R.S.D. trials.
In spite of the setback caused by theoutbreak of gumming disease, with the resultthat the relatively iarge area of nursery established under the susceptible M.147/44 waslost to planters, due credit must be given toauthorities of the Central Nursery for therapid replacement of susceptible by resistantvarieties. As a result of this prompt action,nearly 3,000 tom. of planting material weresupplied to estates and planters in 1965 ascompared to 3,400 tons in 1964 and 1,900 tonsin 1963. A total of approximately 150 arpentswere under A and B nur series in 1965 forsupply of planting material in 1966. Over200 tons of cuttings were treated at the CentralHot-Water Treatment Station in 1965 to plant42 arpents of land at the Central Nursery.
The beneficial effect of using R .S.D.-freecuttings to establish plantations is illustratedby cane yields obtained on one estate in theSouth where a comparison could be established
between fields of M.147/44 planted with cuttingsderived from nurseries and from untreated canes.The comparison was based on a total of 85fields representing an area of 650 arpents in3rd, 4th and 5th iatoons. The average difference in cane yield was 9.5 tons per arpent infavour of treated canes . No comparison couldbe established for canes at an earlier stage inthe crop cycle, as all fields had been plantedwith treated cuttings.
In connection with hot-water treatment ofcuttings both against R.S.D. and chloroticstreak it should be recal\ed, as stated on previousoccasions, that there is no danger of spreadingthe gummosis or leaf scald pathogen, thesebacteria being destroyed in the bath, at thetime/temperature combination used.
No evidence could be obtained that theL.H.W.T. favoured cane arrowing, either III
nurseries or at subsequent generations, asobserved in other sugar cane countr ies.
Quarantine. The fol\owing varieties introducedin 1964 are undergoing 18 months' quarantineperiod for eventual release in April 1966.
Country of Origin Varieties
Australia Q.61, 54N.7103 (Q.79),53B.45,Triton.
West Indies B.47-135, B.47-258, B.50-112,B.54-142, B.57-36, B.57-150,D.l4l-46, D.37-45.
Hawaii H.38-2915 , H.47-4991, H.49104, Mol. 5801, Mol. 6053,Mo1.5843, 5IN.G.56, 5IN.G.63
Fiji 51R.l24, 51R.182, 53R.4040(Spartan) , 53R.4132 (Homer).
United States CL.41-223, CL.41-142, CP.29-116, C.P.44-101, R.469,P.R.999.
India Co.475 , Co.527, Co.740, Co.997,ce. 1007.
Taiwan F.135, F.l48, F.149, F.150,F.152 .
Madagascar R.447.
Two varieties failed to germinate, and onewas destroyed after showing leaf symptomssuggestive of mosaic.

-21-
CANE
Attacks of army worms and locusts occurredon a limited scale. The former were, as usual,in fields of young ratoons which had been burntat harvest 4 to 5 weeks earlier. Severe armywormattack has been frequent in recent years and mayreduce cane yields appreciably. It is avoidableby inspection of burnt fields for the first fewweeks after harvest and application of insecticideas soon as defoliation becomes apparent. Thesmall scattered attacks b) newly hatched nymphsof the red locust which occurred at the end ofthe year were suppressed by means of insecticide.This again is an insect which has been unusuallyactive recently and demands immediate suppression when detected in numbers.
A field survey to assess the incidence ofdamage by the stalk moth-borer was carriedout during the crop season, nearly 200 fieldsbeing sampled to determine the inten sity ofinjury on millable stalks . The data acquired,with those for 1964, require further analysisbefore conclusions of a gen eral nature may bedrawn on the extent of damage and loss causedby the insect. However, the intensity of injuryto millable stalks in 1965 was markedly lessthan that for 1964, the average percentage ofstalks and internodes bored being 26 %, and2.3 % respectively, as opposed to 38 % and 4.7 %in 1964.
Diatraeophaga striatalis , the Tachinid parasiteof the stalk borer introduced from Java in 1961and 1964, was not recovered in the field anddoes not seem to have established itself. About90 flies received from IRAT, Reunion, werereleased in September, and another attempt toestablish th e parasite will be made in 1966 .The appl ication of biological control methodsagainst the stalk borer, in particular, wasdiscussed with Or. F.J. Simmonds of theCommonwealth Institute of Biological Controlearly in the year. A plan to study the in sectand acquire basic information on its naturalenemies in Indonesia, where it is indigenous ,was formulated, but unsettled conditions in thatarea prevent implementation of this scheme forthe time being.
PESTS
The scale insect continues to be troublesome in the Central Cane Nursery whereconditions favour its multiplication. Preventinginfestation by use of insecticides does not seemvery practicable, although it is under consideration . The main difficulties lie with the resistantnature of the insect to insecticides and itssheltered position under the leaf sheaths whichaggravates the problem of insecticide application.A simple device for injecting insecticide intothe piped irrigation water prior to its overheaddispersion was elaborated and is being used totest the efficacy of malathion applied in this way.
Further experiments to determine the effectof scale-infested setts on germination served toconfirm the results of those done last year.Reduced germination occurs if setts are appreciably infested, but is negligible if the scalesare removed by manipulation, washing, or arekilled by H .W.T. An insecticidal dip may alsobe used to good effect. Live scales on plantedsetts often persist for months and eventuallyspread to the above-ground parts of the developing plants. Infestation in plant cane is thusencouraged by the presence of live scales onthe setts, although this can be of consequenceonly in regions where the scale normally occurs,i.e. in dry lowland areas .
The low sugar content of scale-infestedcanes when harvested is well established. Bri xreadings from comparable clean and infestedstalks showed that the insects prevent normalaccumulation of sugars in the stalks during thematuration period.
A new form of rat bait, developed inJamaica and consisting of "biscuits" made ofparaffin wax, split maize, sugar, and an anticoagulant poison, promises to be most useful incane fields. The "biscuits" have the advantagesof being convenient to use, and of not deteriorating quickly in the field.
Research on the comparatively large plantparasitic nematodes of the genera Xiphinemaand Longidorus revealed five species of theformer and two of the latter occurring amongcane roots. The commonest species wasX. elongatum,

-22-
CANE NUTRITION AND SOILS
Soil groups and NPK nutrition of canecrops. It has been possible, for the first time,to confront the data accumulated during the pastthree years on the NPK nutritional status ofthe sugar cane crops, a s revealed by foliardiagnosis practised on the 600 permanentsampling units on sugar estates, with the corresponding soil groups to which they belong,according to the soil map published by theInstitute.
As far as nitrogen status. of the cane isconcerned, the best nutrition occur s on HumicLatosols and Latosolic Brown Forest soils, and theworst on Low Humic Lato sols and LatosolicReddish Prairie soils, the intermediate position.being held by Humic Ferruginou s Latosols.
Concerning the present pho sphorus sta tusof the cane crops, the best occur on HumicLatosols, and the worst on Lato solic ReddishPrairie and Low Humic Lat osols, with Latosol icBrown Forest as intermediate ; while for potassium,the highest value goes to Humic FerruginousLatosols and the Lowest to Latosolic Reddi shPrairie, with Low Humic Latosols, Humic Latosolsand Latosolic Brown Forest as intermediates.
These findings show how the naturaloriginal fertility of soils can be alt ered as aresult of fertili zer practices. There exists,therefore, a danger for generalisation, underconditions prevailing in Mauritius, to followthe soil group classification as the sole basisfor advice on fertilization.
Nitrogen. High levels of nitrogen are nowbeing used by the planters of Mauritius, andwith the present trend of low sugar prices andhigher cost of fertiliz ers, studies on the efficacyof the various form s of nitrogenous fertilizerassume great importance. Moreover , with thead vent of compound fert ilizers conta ining varyinglevels of nitrate, and became the fertil izer application season in Mauritius may be followed bytorrential rain s, studies on nitrate movementthrough the soil profil e have received atten tion.
The final results of field and laboratory
* N Serve, Trade Mark , Dow Chemical Co.
trials comparing urea and sulphate of ammoniaare presented in this report. The generalconclusions which can be drawn are thatalthough burying or watering on urea improvesits efficacy, sulphate of ammonia, at presentpr ices, and because it can be applied on thesoil surface, is the best material for the sugarplantations of Mauritius.
T he recovery of fertlizer-nitrogen by thecane plant is only about 50 /~, and thereforedat a are presented on the value of splitapplications of fertilizers and of the effectof nitrification inhibitors like 2-chloro-6 (trichloro ethyl) pyridine ("N. Serve")* on fertili zernitrogen efficacy. Studies on nitrification andmovement of nitr ate have also been made,and the result s obtained are discussed in termsof practical fertilizer technique. At the sametime, preliminary studies on the movement ofvarious ions through the soil profile werestarted, and some result s obtained in 1965 aregiven.
Nitrogen is taken up steadily by the cane cropin the first five months, indicating that split applications of nitrogenous fertilizer could avoid thedanger of leaching losses, which are greate rwhen nitrogen is applied early in a single dose.Early application of nitrogen, however, stimulates leaf development, which is all importantin terms of final yield results, whilst late nitrogentends to accumulate uselessly in the stalk s.
As the potash and phosphate status ofcane lands are now generally good in Mauritius,nitrogen is becoming, as it should in anyintensive agricu Iture, the king-pin of the fertilizer programme. The amount of nitrogenneeded for maximum economic returns perunit ar ea must therefore be assessed as accuratelyas po ssible. Field trials with new varietieswere laid down in 1965 to give informat ionon this point.
Phosphorus. One of the important changeswhich have occurred in the Mauritius sugar industry in the last ten years, as a result of the work

- 23 -
of the M.S.I.R.1., is the greatly increased consumption of phosphatic fertilizers, imports ofthese materials on a P20S basis having increasedfive fold.
Although the current fertilizer recommendations have changed radically the phosphatestatus of cane lands, much research work stillneeds to be carried out on the various aspectsof the efficiency of utilization of phosphorus bythe cane plant.
Some evidence exists in the literature thatfoliar sprays of phosphate increase the sucrosecontent of sugar cane. Experiments carr ied outlate in the 1965 crushing season showed conclusively that phosphate applied as a foliar sprayalters the sucrose content of canes, but that inorder to have a po sitive effect, timing is critical.This problem will be studied further in 1966.
With the establishemnt of a radio-isotopelaborator y in 1965, stud ies were started on thephosphate nutrition of sugar cane grown onthe different so il groups of the island. Inpreliminary studies, the determination of exchangeable (E) and labile (L) soil phosphorusand the uptake and translocation of phosphorusby the cane plants using radio-P were carriedout. The chemical fractionation of phosphorusin local soils was also studied, as were thecorrelations between the amounts of soil phosphorus removed by the various widely usedsoil extractants,
The value of soil P analyses for the guidanceof fertilizer practices is discussed in the lightof the results obtained.
Potassium. This is the cheapest nutrient,and with the kaolinitic soils of Mauritius, potassium is easily taken up by the plant, even whenpresent in low levels in the soil. No deficiency ofpotassium should therefore occur on cane lands.
The use of molasses as a potassic fertilizerhas declined in Mauritius due to the increasedcosts of handling and storing the molasses, and toa wider appreciation amongst cane growers thatmolasses are, in effect, primarily a source ofpotash and can be costed as such.
The appl ication of molasses, as a sourceof potash, in overhead irrigation was successfully experimented with on one estate in theSouth.
Soil acidity. With the high levels of fertilizerN, P and K now being used , it is natural thatfactors other than these three major nutrientswhich control the nutrition of the cane itself,should receive greater attention.
Apart from a few minor areas, the traceelement status of cane grown in Mauritius isadequate; the results of several field trials andthe third visible dewlap leaf analyses for Zn,Cu, and Mo are presented in this report.Moreover the large amount of sulphur addedto the cane area each year as sulphate ofammonia leaves only the bases calcium andmagnesium as nutrients potentially in shortsupply.
The addition of more than 200 Kg ofsulphate of ammonia annually to sugar canelands over many years in the past has acidifiedthe soils and thus presented the problem of canenutrition not as a simple base status problem,but as one in which all the facets of soil acidityare involved. To this must be added thecomplication that the highly laterized soils arevery low in silica. Studies on the effect of soilacidity on cane composition and yields, and theinteraction of the various factors involved, areunderway and some of the preliminary resultsobtained are presented in this report.
Because of the large area under sugar caneon the highly leached humic ferruginouslatosols and the latosolic brown forest, andthe fact that the climate of these areas ismarginal for cane production, it is felt thatnutrient solution studies of the effect of AI,Fe, Mn and Si on the uptake and distributionof J adio-P by sugar cane will give much neededinformation on the possible toxic effects ofacidity, and studies on thi s line were initiatedin 1965.
The only local sources of silica in Mauritius,should silica prove essential for good yieldperformances on the highly leached soils, arebasalt, trachyte and, of course, factory ash; theavailability to plants of the silica in thesematerials is being studied.
Variety corrections for Si , Ca and Mn leaf insheaths. It has been repeatedly proved that leafblade analysis cannot be reliably interpreted forpurposes of cane nutrition without a variety

-24-
correction for N, P, and K contents derivedfrom comparative leaf sampling in varietytrials. The same applies to other elements andthe variety corrections are now available forsheath diagnosis dealing with silica, calcium,and manganese, concerning the recommendationof new soil amendments, whether calcareousor silicic.
Soil Survey. With the possible agriculturaldevelopment of Case Noyale in relation to an irrigation reservoir at Chamarel, the soils of that areawere SUI veyed, and a chart prepared. In thisconnection, close liaison was continued betweenthe team of the V.N. Special Fund Project andthe Institute concerning basic data relating tosoils, climate, ground water and irrigation.
PLANT-WATER RELATIONS. IRRIGATION
Plant-soil-water relationships. Investigationswere started in 1965 to determine the effect of varying soil moisture stresses on cane growth. Thesoil moisture conditions are more conveniently expressed as soil water potentials in units of atmospheres, a one-atmosphere potential representing asuction which equilibrates with a 76 cm columnof mercury or a 1033 cm column of water.
The experiments were conducted in thegreenhouse with a drought-susceptible variety,Ebene 1/37, and a presumed drought-resistantvariety, M.442/5J. The maximum soil waterpotentials allowed in the various treatmentswere -0.25, -0.5, -0.75, -3 and -9 atmospheres,the soil in each drum being watered to capacitywhen the required potentials, indicated bytensiometers and gypsum blocks, were reached.
Preliminary data showed that cane growthas measured by shoot height, leaf area and dryweight, was adversely affected by increase insoil water potential measured at 6 inches belowsoil level. Appreciable differences in growthwere observed even between the -0.25 and the-0.5 atmosphere potentials. There is an indication that measurements of soil moisturestresses at such low values will be necessary infuture work.
These results indicate that the water in thesoil from field capacity to permanent wiltingpercentage cannot be regarded as being equallyavailable to the plant.
It was further observed that the varietyEbene 1/37 was more affected by the differentwater regimes than the variety M.442/51, moreparticularly in the early stages of growth.This differential response might prove usefulfor assessing drought resistance in new canevarieties, and studies along this line are beingcontinued.
Measurements of plant-water potential. Whenthe supply of water from the soil is restricted, the water potential in the plant falls,and as the plant integrates all the environmental factors affecting the water balance,measurements of plant-water potentials areconsidered preferable to those of soil-waterpotentials. A suitable technique for estimatingthe plant-water status in the field is beinginvestigated. This technique is based on thedensity column method established by Schardakow, and preliminary results indicate that itcould be useful in estimating plant-waterpotentials in the field. Comparison of thistechnique with the more refined micro-osmometer method of Weatherley suitable for laboratoryconditions, are being carried out in an attemptto obtaint rue estimates of plant-water potentials.
Consumptive use of water by the cane plant.Experiments on the consumptive use of waterby the cane plant - using six lysimeters andthree soil types - initiated in 1963 at Medine S.E.(Palmyre) are progressing satisfactorily. Datahave now been recorded regularly for overtwo years, and will be analysed at the endof the 1966 season. A brief account of thechemical composition of leachate from theIysimeters, and seasonal fluctuations m nitrogencontent of rain water is reported In anothersection of this report.
Present area under irrigation in Mauritius.At the end of 1965, approximately 30,000arpents of cane land were irrigated, of which18,700 arpents were under surface irrigation.the remainder being under overhead irrigation.A table accompanied by short notes is reproduced elsewhere in this report, showing the

--25-
Effect of irrigation on cane yields. A comparison was established between irrigated andun irrigated fields on an estate** in the northof the island, where a new irrigation scheme(overhead, Boom-O'-Rain) was initiated in 1965over an area of about 750 acres of latosolicreddish prairie soils.
The fields chosen were harvested in 5thratoons in 1965 and previous cane yields hadbeen as follows :
distribution of irrigated land by sectors andaccording to type of holding. These figures arecompared with those obtaining in 1963, asummary of which is given below :
1965 1963
arpents arpents
Area irrigated by surface 18,680 20,136overhead 11,350 8,734
Total area irrigated 30,035 28,870Overhead irrigation % of
total irrigated 38 % 30 %
Overhead irrigationSurface irrigation
8.7 Tons3.8 Tons
Economics of irrigation. A study of theeconomics of overhead and surface irrigation underMauritius conditions was made during the yearand appears in this report.
A BArea arpents
21.00 17.8
Tons Cane Arpent
The main results obtained are given below:
Since the efficiency of water utilisation isthree times greater with overhead irrigation onLow Humic Latosols ("free" soils)'!', it is necessaryto express the above figures in terms of costper round of irrigation:
Overhead irrigationSemi-permanent unit
Capital costper arpent
Running costper acre/inch
Rs . 1000
Rs. 9.30
Surfaceirrigation
Rs.250
Rs.I .25
Virgins 1960 20.5 21.1lst R . 1961 22.5 24.12ndR. 1962 36.7 36.43rd R . 1963 30.1 32.64th R . 1964 22.3 24.4Average 26.4 27.7
showing a slight superiority of 1.3 T.C.A.systematically in favour of field B.
Field A was irrigated in 1965, receiving 11"of water at 13 days' interval throughout thegrowing season.
Cane yields m 5th ratoons m 1965 were :
Overheadirrigation
Surfaceirrigation
Airrigated in 1965
48.1 T.C.A.
Bnot irrigated37.8 T.C.A.
Assuming the value of 1 ton of cane to beRs. 32 to the planter, and that 15 rounds ofirrigation are needed during the growing season,the additional tons cane required to cover costand interest on capital are :
Cost per round ofirrigation Rs. 18.60 Rs. 7.50 a difference of 10.3 tons per arpent, to
which can be reasonably added 1.3 tons ofcane representing the greater productivity offield B, making a total of 11.7 tons cane perarpent in favour of irrigation, and in spite ofhighly favourable growth conditions in that areaas indicated by the higher yields obtained in 1965.
* Latosolic Reddish Prairie ("gravelly" soils) cannot be surface irrigated economically, the ratio of water usedbeing 11 : 1 between surface and overhead irrigation
** Data published by kind permission of the Manager
- 26-
WEED CONTROL
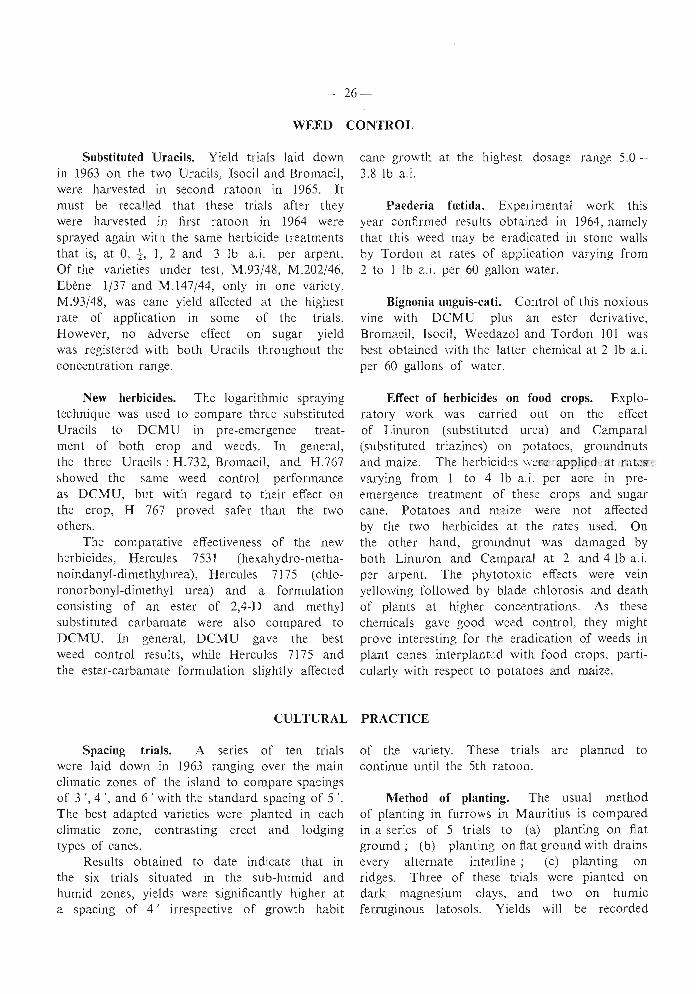
Substituted Uracils. Yield tri als laid downIII 1963 on the tw o Uracils, Isocil and Bromacil,were harvested in seco nd ratoon in 1965. Itmust be recalled th at th ese tri als a fter th eywere harvested in first rat oon in 1964 weresp rayed again wit h the same herb icide treatmentsth at is, a t 0, -}, 1, 2 and 3 Ib a .i. per arpen t.Of the varie t ies under test , M.93/4 8, M.202/46,Eb ene 1/37 and M .147/44 , only in one varie ty ,M.93/48 , was can e yield a ffected a t the highestrat e of application in so me of the tr ials.However, no adverse effect on sugar yieldwas registered with bo th Urac ils through out theconce nt ra t ion range.
New herbicides. The logarithmic sprayingtec hn ique was used to co mpare three substitutedUrac ils to DCM U in pre-ernergence tr eatmen t of both cr op and weeds. In general,the three Uracils : H. 732, Brornacil , and H.7 67showed th e sa me weed control pe rformanceas DCMU, but wit h regard to their effect onthe cro p, H 767 proved safer th an the twoo thers .
The comparative effectiveness of the newherb icide s, Hercules 7531 (hexa hydro-met ha noindanyl-dimethylurea), Hercul es 7175 (chloronorbonyJ-dimethyl urea) and a formulationcon sisting of an ester of 2,4-D and methylsu bstituted ca rba ma te were also co mpared toDCM U. In general, DCMU gave the bestweed control results, whil e Hercules 7175 andthe ester -ca rbama te formula tio n slight ly affected
can e growth at the highest dosage range 5.0-3.8 Ib a.i.
Paederia fretida. Expe ri mental work th isyear confirmed results obtaine d in 1964, namelyth at th is weed may be era dicated in stone wallsby Tordon at rates of application varyin g from2 to I Iba.i. per 60 ga llon water.
Bignonia unguis-cati. Cont rol of thi s noxiousvine with D CMU plus an ester derivative,Brornacil, Isocil, Weedazol and T ordon 101 wa sbes t obtained with the latter chemical at 2 Ib a.i .per 60 gall on s of water.
Effect of herbicides on food crops. Explo-ratory work was carried out on the effectof Linuron (subst itu ted ure a) and Camparal(su bstituted triazines ) on pot at oes, groundnutsand maize. The her bicides were applied a t ra tesvarying from 1 to 4 Ib a.i. per acre in preemergence tr eat ment of these cr op s and suga rcane. Potatoes and maize were not affectedby the two herbicides a t th e ra tes used . Onthe other hand, groundnut was dam aged byboth Linuron and Camparal a t 2 and 4 Ib a .i.per ar pen t. The phytot oxic effects were veinyellowing followed by blade chlorosis and deathof plan ts at higher concentra tio ns . As thesechemicals gave goo d weed control, th ey mightprove interesting for the eradicat ion of weeds inplant canes in terplan tcd with food crops, particul arl y with respec t to potat oes and ma ize.
CULTURAL PRACTICE
Spacing trials. A series of ten trialswere laid down in 1963 ranging over the ma inclimati c zones of the island to co mpare spacingsof 3' , 4', and 6 ' with the standard spacing of 5 ' .The best ad apted varieties were planted in eachcl imatic zone , contrastin g erect and lodgin gtyp es of canes .
Results obtained to date indicate that inthe six tri als situated in the sub-humid andhumid zon es, yields were signi ficant ly higher ata spacing of 4 ' irrespe ctive of growth habit
of the variety. These tr ials ar e planned tocon tinue until the 5th ra toon .
Method of planting . The usual methodof plan ting in furrows in Mauritius is comparedin a series of 5 tr ials to (a) planting on fiatground ; (b) planting on fiat ground with drainsevery altern ate inte rl ine ; (c) planting onridges. Three of these trials were planted ondark magnesiu m cla ys, and two on humicferruginous latosols. Yields will be recorde d

-27-
until the 5th ratoons. Results obtained to date.which include virgins and 1st ratoons indicatea slight advantage only for ridge planting onthe Humic Ferruginous Latosols.
Germination experiments. The variation inthe percentage and rate of germination ofdifferent cane varieties is well known, but thereasons for these differences have still to beexplained. A preliminary experiment with aview to elucidating this problem was started lastyear with three varieties : Ebene l /S", M .93/48and M.147/44. Results of this experiment, carriedout with single-eyed cuttings, have shown thatcuttings of the top half portion of the stalkof the varieties Ebene l /S? and M .93/48 germinate better than cuttings of the bottom half.This was not apparent in the variety M .147/44.The rate of germination and growth of theyoung shoot was comparable in all cuttingsof the variety M.147/44, but there was a steep
gradient in shoot height measurements of thevarieties Ebene 1/37 and M.93 /48, starting fromthe top cuttings towards the basal cuttings.
Further experiments are being pursued,including other drought-resistant and droughtsusceptible varieties, in order to determine ifgermination capacity is an inherent varietalcharacteris tic.
Experiments with petroleum mulch. A specially formulated water emulsion of petroleumresins, known as EAP2000 or petroleum mulch,was tested in an experiment at Belle Riveto study the effects of this mulch on soiltemperature, cane germination, growth and finalyield. This trial will be harvested in 1966.There was a small, but not significant, increasein soil temperature of treated plots. Germination was significantly improved by the mulch,but there was no difference in cane growththree months after germination.
FIELD EXPERIMENTAnON
Th e usual series of experiments were continuedduring the year on variety testing, fertilizationand amendments, cultural operations, herbicides,resistance to pests and diseases, and irrigation.
Excluding experiments on the four stationsof the Institute, 168 field trials were harvested,and 46 laid down on estate land. In addition,about 50 arpents of land are made availableto the Institute by three estates for irrigationexperiments, breeding plots, early stages ofselection, and multiplication plots of promisingvarieties. The assistance received from estatemanagers in this connection is gratefully acknowledged.
Field experimentation is also gaining favour,and four agronomists ale now employed outside the Institute by sugar estates .
A list of Field Trials carried out in 1965,but excluding early stages of selection, isgiven below in summarized form.
Estates Stations
Variety
Variety trialsPre-release trials
8615
2
Ratooning capacityObservation plots on
drought resistance
Fertilization & Amendments
NitrogenPhosphateCalcium & PhosphateVariety - NitrogenPotassium, Calcium &
MagnesiumGypsumSand, Mg limestone,
Muriate of potashBasaltCalcium & BasaltTrace elements ...Method of fertilizer
application ...Organic & mineral
fertilizationPermanent fertilizer
demonstration plots ...
Estates
6
1820
43
5
4448
3
5
Stations
2
2
4
4

-28 -
Estates Stations Estates Stations
Cultural Practice
SpacingBurningInterline cultivationMethod of planting
10244
4
Selective harvestingPetroleum mulchGermination
Diseases
Herbicides
911
14
17
SUGAR MANUFACTURE
In reviewing the programme of research for1965, the Research Advisory Committee recommended that priority should be given to twotopics, namely refining quality of raw sugarand protein recovery from factory products.In consequence, the staff of the Sugar TechnologyDivision devoted most of its time to these twoproblems. It was possible, however, to includeseveral other studies in the programme ofinvestigations, the results of which are given inthe Sugar Manufacture section of this report.
Raw sugar filterability. It is most important for the economy of Mauritius thatits sugars should have a good reputation III
overseas market, the more so in these days ofover-production when purchasers are in aposition to be more selective.
Fully aware of this situation, and so as tomaintain its place in a highly competitive worldmarket, the industry, working in close collaboration with this Institute, has taken a numberof steps to improve the quality of its raws.At the request of the Mauritius Sugar Syndicate,the Sugar Technologist paid a number of visitsto various refiners in the U.K., Canada, andMalaya, in order to discuss with them problemsof mutual interest. Mr. C. H. Alien, Ch 'efChemist of Tate & Lyle Refineries, London,was also invited to spend a few days in Mauritius during the 1965 crop so that the industrymight benefit from his wide experience in problems related to raw sugar quality and refining.It is gratifying to note that, in Mr. AlIen'sown terms, he "was very impressed by theattention and earnestness being paid by everyone(I) met on this question of improving jilterability,and by the technical standard and cleanlinessof the factories visited".
Unfortunately, it is not an easy propositionfor a factory to improve substantially thefilterability of its raws from one crop to thenext as it is not always possible, within .suchta short period, to make the necessary equipmenadditions and processing changes. A furthercomplication lies in the fact that the exactinfluence of various non-sugars on filterabilityhas not been well defined yet. Several authorsbelieve that starch is one of the major causesof poor fiIterability, and since many refinersclaim that they encounter filtration difficultieswhen starch content of raws exceeds 200 ppm,it was decided to pay particular attention tothis non-sugar during the crop.
The opinion is often expressed in Mauritiusthat one of the problems in raw sugarfilterability is varietal. So far as starch isconcerned, this contention does not appear tobe valid . Thus analyses of juices from caneharvested in Final Variety trials show that thevarieties M.147 /44 and M.93/48 contained lessthan half as much starch in 1965 as they didin 1964, and that their starch content last cropwas of the same magnitude as that of the varieties M.134/32 and Ebene 1/37, which are knownto contain little starch. Further, it is a factthat those factories in Mauritius, where filterability is below average, lie mostly on the uplandswhere low starch varieties , such as Ebene 1/37are still predominant.
But a juice relatively low in starch maystill yield a raw with a high starch content jfelimination of the non-sugar during processinghas not been satisfactory. It is with the objectof determining the influence of various processing techniques on starch elimination that starchbalances were carried out on samples collectedfrom a number of factories in 1965. With the

-29-
limited number of results available to date, It ISonly possible to draw tentative conclusionsfrom these balances which indicate that (i) verylittle starch, less than 2 per cent on the average,is eliminated in filter cake; (ii) about 65 percent of the starch present in the juice findsits way into the final molasses; (iii) thosefactories where little or no molasses recycling ispractised eliminate about 10 per cent more ofthe non-sugar in final molasses than thosewhere a certain amount of recycling is practised.
From the point of view of the refiner,however, it is not so much the starch contentof the raw, but that of the affined sugar whichmatters. Hence for any raw of given starchcontent, the higher the proportion of the nonsugar in the film of molasses, the larger will bethe elimination upon affination, and the betterits refining quality. Unfortunately, affinationremoves only part of the starch, as most of it isoccluded in the crystal. Thus the analysis of anumber of average 1964 crop raw sugar samplesindicates that affination does not remove thelarger proportion of this starch .
It is therefore most important that the sugarcrystal should contain as little occluded starchas possible . One of the methods of achievingthis result is to double-cure the C-sugar, whichmay be used then as footing for the A and Bstrikes, or better, remelted. A number of experiments carried out in the laboratory haveshown that the starch content of the C-sugardecreases markedly with increasing purity of thesugar. Average results obtained have shown thatthe starch content is reduced by 45 per centwhen the C-sugar purity is increased from 83to 92; and these findings have been confirmedby the industrial results obtained at two factoriesduring the 1964 and 1965 crops .
However, in factories where starch contentof the juice is high, it may prove advantageousto remove as much of it as possible before thejuice goes into process . One of the methodsof achieving this result is by enzymatic action.Experiments carried out in the laboratory and atMon Desert factory during the crop indicate thata large proportion of the starch may thus bedestroyed without the juice undergoing muchsucrose inversion. Unfortunately, only a few testscould be carried out, but the results obtained
have been such that those factories with highstarch content juices would be well advised totry the process, the more so that it calls forvery little capital expenditure.
A number of other experiments were carriedout during the crop with the object of improvingraw sugar filterability . Encouraging resultswere obtained at Mon Desert factory where,following the experiment on enzymatic removalof starch, the Estate Chemist investigated theeffect of blowing compressed air, prior to liming,into juice heated to 70-80°C. The floatingscurns were scraped off and sent to the vacuumfilter. Filterability of the raw sugar wasmarkedly improved, apparently as a result ofbetter elimination of scurns from the juice.These experiments were initiated at the end ofthe crop so that it is difficult to assess exactlythe merits of the process, but the resultsobtained have been so encouraging. that theyshould be repeated in several factories next crop.
Protein recovery. In October 1964 theSugar Technologist had further discussionsin Germany with Westfalia, manufacturers ofcontinuous separators and de-sludgers, when itwas decided: (i) to investigate the possibilityof partly dewaxing the juice with the help ofSKIG nozzle-type machines in order to increasethe nutritive value of the coagulate ; (ii) torenew investigations in the laboratory, and thenon a pilot plant scale, with the object of separating the protein from high Brix syrup insteadof from low density juice. This decision wastaken in the light of recent experience gainedin Germany in the production of glucose fromcane starch. In this process it is necessary toseparate a mixture of fats and protein from aglucose solution of about 18° Brix. At this Brix,the difference in density between the solid andliquid phases is so small that it was not possibleto obtain their separation in a continuousmachine. However, when the Brix of the glucosesolution was raised to 45°, efficient separationcould be achieved.
Partial dewaxing with the SKIG machineswas unsuccessful, as already reported in 1964.
For the purpose of carrying out the experiments mentioned in (ii) above, two smallmachines were received from Westfalia : one

-30-
the SAOH 205 which is of the bowl type andis fitted with an automatic de-sludging device,and another, the SKOG 205, which is a nozzleseparator.
After preliminary trials in the laboratory,these machines were installed at Medine factorywhere a complete pilot plant was erected.Trials were conducted both with syrup and withjuice. The results obtained, which are reportedfully in this report , were unfortunately verydisappointing as it was not possible to obtaina thick sludge rich in protein. Under thecircumstances, it has been decided to stop furtherwork on this project.
Tall chutes and mill extraction. Fol-lowing the erection of tall Donelly-typechutes to the last three mills of a small factorycrushing a large proportion of planters' cane, itwas decided to study the influence of thesechutes on mill extraction, and to work out theeconomics of the installation . Net profit derivedfrom the installation amounted to slightly morethan the cost of building and erecting thechutes, the gain in mill extraction amountingto 0.46. Under the circumstances, there is nodoubt that other factories in Mauritius wouldbenefit from the installation of similar chutes.
They are simple to make and erect, and costlittle.
Continuous centrifugals for sugar curing. Acontinuous Allis-Chalmers Model 2750 centrifugal was used for the curing of C massecuites at Belle Vue factory in comparisonwith a batch fully automatic 48" x 30" machinerunning at 1800 R.P.M. Unfortunately themassecuite reheater used with the AlIis-Chalmerswas inadequate so that it was not possible tocompare capacities. Further, only one type ofscreen was provided with the continuousmachine. Before definite conclusions can bedrawn, further tests will have to be made andcareful attention paid to the design of thereheater and to the choice of the screen.
Miscellaneous. Other studies made by theSugar Technology Division included the effectof syrup flotation on raw sugar filterability,the sampling of cane for fibre determination,the use of a modified disintegrator and trialswith "pan aid" in vacuum pans.
The advice of the Sugar Technology Divisionwas again sought on a number of problemsby individual factories and corporate bodies,and reports issued accordingly.
LIBRARY AND PUBLICATIONS
The collection in the library has continuedto expand, and the accessions this year havenumbered 1398 new items, bringing the totalto 9238 bound volumes . The catalogue ofperiodicals completed last year has proved ofgreat practical value; it comprised 467 entries,including some of the rarest and oldest agricultural periodicals in the island. The currentjournals and reports received in the library nownumber 350 titles, 195 of which are received onan exchange basis or as gift.
A good opportunity to strengthen thecontacts established with various libraries abroadwas offered when the Librarian went on overseas leave and visited some of the leading agricultural documentation centres.
The following publications were issuedduring the year:
Annual Report 1964. 117, XXXII p., 24 figs, 8 pI.(includes Combined Table of Contents andIndexes for Annual Reports 1954 - 1963).French summary in Re v. agric. suer. IleM aurice 44 (2) 1965 : 72 - 97.
Occasional Papers
No . 19. GEORGE, E.F. Physiological growthattributes of Saccharum clones andtheir progenies. (Originally appeared in Ann. Bot., N. S. 29,no. 113, 1965: 153-165.

-31-
Nos. 20 WILLlAMS, J. R . Studies on theand 21. nematode soil fauna of sugar cane
fields in Mauritius.6. Eudorylaimus sundarus N. Sp.
(Dorylaimidae).7. Species of Thornenema (Dory
laimidae). (Or igina lly appearedin Nematologica 10, 1964:319-322; 345-352.)
No. 22. PARISH, D . H. and the lat e S. M .FEILLAFE. Notes on the I : 100,000soil map of M auritius . 43 p., 5col. pI. , I map.
Leaflet
No. 10. ROCHECOUSTE, E. and VAUGHAN ,R. E. Weeds of Mauritiu s. 14Eleusine indica (L) Gaertn . (Chiendent Patte de Poule, Gros Chiendent). 6p. I pI.
Technical Circulars (mimeographed)
No. 24. WILLl AMS, J. R . The scale insect(Aulacaspis tegalensis) on canesto be used for propagat ion. 20 p.,7 figs.
25. ROCHECOUSTE, E. Notes pr atiquessur le desherbage chimique. 9 p.,4 figs.
Papers prepared for XIIth Congress, l.S.S.C.T.,Puerto Rico, 1965.
ANTOIN E, R . Testing the reaction of sugarcane seedlings during selection to maj ordiseases.
ANTOINE, R. Sugar cane diseases and theirworld distribution.
GEORGE, E. F . An experimen t to assessthe effect of compet it ion between sugarcan e clones at the micro plot stage ofselection.
PARISH, D. H . The efficacy of n itrogenousfertilizers.
PARISH, D . H. The amino acids of sugarcane .
PARISH, D. H. Use of protein in suga r caneas an animal feed .
ROCHECOUSTE, E. Preliminary observationson the use of su bstituted uracils forthe control of weeds in sugar canefields.
SAI NT ANTOINE, J. D. de R. and VIGNES, E.c.Juice preservation during shut-down.
Article in «La Revue Agricole et Sucri ere dePIle Maurice»
ROUILLARD, G . Histoire des domaines sucr iers de I'Il e Maurice. 2. Parnplemousses et Ri viere du Rempart 44 (3)
1965 : 143-176.
Articles in Foreign Journals
ANTOINE, R . Mission phytopathologique al'Ile M aurice et a la Reunion. Agr on.trap. 20, 1965 : 888-892.
PARISH, D . H. The amino-acids of sugar cane.I. The amino-acids of cane juice andthe effect of nitrogenous fertili zat ion onthe levels of these sub stances. J. S ci.Fd Agric. 16, 1965: 240-242.
PEROMBELON, M. and HADLEY, G. Production of pect ic enzy mes by pathogen icand symbiotic Rhizoctonia strains . NewPhytol. 64, 1965 : 144-151.
ROCHECOUSTE, E. Compte-rendu d'une mission d 'etudes sur le desherbage de lacanne a sucre a Madagascar. Agron.trap . 20, 1965: 262-269.
These s
G EORGE, E. F. The ear ly stages of selecti onin a sugar cane breed ing programme.Ph. D . London, 1965.
M ONGELARD, C. Studies in the water relations of Z ea mays. M . Sc. London ,1965.
PARISH, D. H. Studies on the nutrition,composition, me tabolism and utilizationof sugar cane, with particular referenceto ni tro gen and its compounds. Ph.D.Qu een 's University, Belfast, 1965.
RICAUD, C. Strain s of Rhizoctonia solaniresistant to chlorinated nit robenzenes.Ph. D ., London , 1965.

-32--
THE MAURITIUS HERBARIUM
(by Dr. R.E. VAUGHAN)
Accessions. During the year , nearly sevenhundred specimens have been mounted, registered,and incorporated in the Herbarium. The majorityof these comprise miscellaneous material collected during routine field work carried out bythe Herbarium staff. Special mention may bemade of the following acqui sitions :
(i) A collection of about one hundredflowering plants, mostly grasses and sedges, wasreceived from Mr. T. Cadet, Ecole Normale,St. Denis. The grasses were of special interestand included some montane species. Grassesfrom mountainous regions in Reunion usuallyfall into two groups: European adventive specieswhich have become naturalised; and endemicspecies typical of montane scrub and grasslandcommunities. These latter species are of greatsignificance , and knowledge of them and theirecology is still very imperfect.
(ii) A further coUection of marine algae,numbering 38 species, was received from theDirector, Botanic Gardens, Singapore, and areport was submitted to the Director on theirdetermination and comparison with Mascarenespecies.
(iii) When visiting Mauritius as a memberof the XIth Congress of the I.S.S.c.T., Mr.Gillis Een made extensive collections of mossesand hepatics in Reunion and Mauritius. Aduplicate set of some of this material, comprising 43 species, named by Dr. Sigfrid ArneU,Paleobotanical Department, Swedish Museum ofNatural History, was received in October.
Distribution to Institutions & Herbaria. Anincreasing number of specimens have been sentoverseas. This material comprises either littleknown or unnamed species sent out by theHerbarium for examination and determinationby specialists, or duplicates donated on requestto various institutions. Some of these may berecorded here : Conservatoire et Jardin Botaniques , Geneve , (Weinmannia); Rijksherbarium,Leiden, (Ipomoea); Purdue University, Indiana,U.s.A. (Securinega); Museum National d'Histoire Naturelle, Paris, (ferns & ferns allies).
With regard to the ferns, it is fortunate thatMme. M.L. Tardieu-Blot, the leading authorityon the ferns of Madagascar and the Mascarenes,is examin ing material from the fern section ofthe Herbarium, which was badly in need ofrevision and bringing in line with moderntaxonomy and research.
A report on a general collection recentlysent to the Herbarium, Royal Botanic Gardens,Kew, revealed some species hitherto unrecordedin the Mascarene Islands. Particular mentionmay be made of a cane-field weed Coronopusserratus found last year at Phrenix . This plantwas said to have been collected by Commersonat Montevideo in 1767.
Botanic Gardens, Pamplemousses. Someprogress has been made during the yearwith the determination of plants in theGardens, whose names have been lost or misapplied for many years. Among these may bementioned some fine specimens of the littleknown shade tree, Cassipourea gummifiua,native of tropical Africa. It is surprising tolearn that this genus belongs to the Mangrovefamily Rhizophoraceae. Another recently namedspecies worthy of note is Albizia caribbaea fromthe West Indies, This is one of the mostimposing trees in the Gardens, with a straightunbranched bole reaching 100 ft, and topped bythe feathery leaves typical of the Mimosafamily. Thanks to the vigilance of the Gardens'staff, flower ing and fruiting material of practically all the unknown species has now beenobtained, and the process of identification shouldnot be long delayed. This work is an essentialpreliminary to the construction of a new planand census of the Gardens' plants.
Weed Flora. The next few leaflets in theWeed Flora series will be devoted to the grasses,and the first leaflet on Eleusine indica has beencompleted and is in the press. Concerning weedsas a whole , it is often difficult to establish theidentity of some of the commonest weeds inthe Mascarenes. This is partly due to the fact

-33-
L 'Imerina en 1822 - 1823,journaux de Bojer etBull. Madagas car, 15:
that the orig inal determination of the specieswas at fault, and also because local strains andvarieties have been evolved. Th e correcttaxonomic sta tus of a weed and a knowledge ofits life-history is of much pract ical valu e inweed control.
At a meeting of the Royal Soc iety of Artsand Sciences of Mauritiu s held in October , theCurator joined with the Botanist of M.S.I.R.I.in giving a talk on some problems posed byweeds in the Mascarene Islands.
Nature Reserves. The Curator has maintainedclose contact and consultation with th e Forest D epartment and the Ancient Monuments and NationalReserves Board concerning the maintenance andconserv ation of National R eserves, all of whichhave been visited and inspected in the courseof the year.
In November, Ile aux A igrettes nearMahebourg, was proclaimed a National R eserve.This low-lying islet of about 70 acres is composed mainly of compacted dune coral sandor eolianite, and still supports on its southeastern side an ind igenous vegetat ion of a typ ewhich has completely disappeared from theneighbouring mainland. Indeed, it is necessaryto go ten or twelve miles up the coast to therocky foreshores in the vicinity of Bar achoisMontagu and Trou d'Eau Douce before somesmall pockets of the original littoral flora can befound.
The toughness and res ilience of the vegetation on Ile aux Aigrettes is evidenced by themanner it has resisted for such a long time theimpact of aggressive weeds, goats, and humanhabitation. Though invasion by exotics hastaken place to a certain extent, it is po ssibleto build up a fairly reliable picture of itsoriginal structure. Some of the indigenousplants still to be found on th e island havebecome extremely rare , or ha ve disappeared fromthe mainland. Regular visits to th e island aremade to ensure that adequate material is securedfor preservation in the Herbarium.
Another nature res erve, Round Island , hasbeen the subject of an important and criticalreview (VINSON, 1964) in which the author,whos e devoted and untir ing advocacy in thecause of nature protection is well known,
describes steps wh ich should be taken for itspreservation ; these a re now being put intoeffect. Round Island is not merely of parochialinterest , but has an international status andreputation, and it is good to know that practicalmeasures are at last under way for the conservation of its wild life.
Library. Some importan t papers and publications, of interest to the student of Mascarenebotan y, received by th e Herbarium Library aregiven below.
ARNELL, S. (J965) . Hepaticae collected byMr. Gillis Een in Mauritius and R eunionin 1962. Svensk bot . Tidskr., 59: 65-84 ,figs 1-6.
BERNARDI, L. (1964 ). Revisio gen eris Weinmanniae. Bot . lb., 83: 128-221 , tab. 1-38.
CAvACO, A. (1965). Que1ques considerations apropos de la repartition geographiquedes Monirniacees (sensu Iatoi. Proc.Vth Plenary Meeting of the A.E.T.F.A.T.Webbia, 19: 587-592, fig. 1.
CORNER, E. J. H . (1965). Check list of Ficusin Asia and Au stral ia with keys toidentification. Gdns Bull., Singapore 21 :1-186.(Many of the species cultivated inMaui itius are included).
KEAY, R . W. J. et al (1959). Vegetation Mapof Africa South of the Tropic of Cancer,with explanatory notes. Oxford University Press.
MOHLENBROCK, R . H . (1963) . A new speciesof «Zorn ia» from th e Island of Mauritius. Webbia, 17: 265-267, fig. 1.
RAYNAL, A. (1965). Les especes africainesdu genre Laurembergia Berg. Halorrhagaceae. Proc. Vth Plenary meeting ofth e A.E.T.F.A.T. Webbia, 19 : 683-695,figs 1-2.
VALETTE, J. (1965) .d'apres lesHilsen berg.297-34 1.
VINSON, J. (1964). Sur la disparition pro-gres sive de la flore et de la faune del'Ile Ronde. Proc. R. Soc. Arts Sci .Maurit . 2: 247-261, pIs 6-7.

-34-
GENERAL
Meetings. The Research Advisory Committeemet on the 19th January, 1965, to discuss andapprove the research programme for the currentyear. Another meeting was held on 7th Augustat Pamplemousses for a visit of the ExperimentalStation.
Full advantage was taken of facilitiesavailable at the Institute for lectures. Thustwenty-two meetings were held at the BonameHall, as follows
15th January
15th February
18th February
22nd March
26th April
24th May
21st June
24th June
28th June
Dr. F. J. SIMMONDS. (Commonwealth Institute of Biological Control). Biologicalcontrol of insect pests &weeds.'J. D. de R. de SAINT ANTOINEand J. P. LAMUSSE. Rawsugar filterability. 2
- P. O. WIEHE. A review ofthe work of the M .S.LR.Lin 1964.R. ANTOINE. Gommose dela canne a sucre.:'W. de GROOT and J . A.LALOuETTE. Selection of canevarieties.'WONG You CHEONG, Y. Soilsand fertilizers.'P. O. WIEHE and R. NOEL.Le Xlleme Congres duLS.S.C.T.4
E. ROCHECOUSTE. Weed Control."En marge du Xl Ierne Congres LS.S.C.T.4
(a) P. O. WIEHE. Les liesCaraibes.(b) R. NOEL. Extreme Orientet Hawaii.
9th July Dr. D. C. PEREIRA. (Agricultural Research Council ofCentral Africa). Effect ofland use on stream flow."
22nd July En marge du Xl lerne Congres LS.S.C.T.1
(a) L. LINCOLN and R. deFROBERVILLE. Fabrication dusucre et sous-produits.(b) P. HALAIS and D. H .PARISH. Highlights of agronomic research.
24th August - C. MONGELARD and G.MAZERY. Plant-water relationship and in igation."
l Zth September - C. H. ALLEN. (Tate & LyleRefineries, London). Therefining qualities of rawsugars."
27th September - J. R. WILUJ\MS. Entomological problems."
30th September - P. O. WJE}-IE and R. ANTOINE.La gommose et le problemevarietal."
l l th October E. PIAT. The weighing andsampling of factory products?
26th October R. E. VAUGHAN. Some problems of weed distribution ."E. ROCHECOUSTE. Les problernes que posent les mauvaises herbes.?
Meeting under the auspices of the Societe de Technologie Agricole et Sucriere de l'Lle Mauric e.
2 Joint meeting Mauritius Sugar Syndicate and M.S.I.R.I.
3 Talks specially prepared for the Extension Officers of the Department of Agriculture and for the FieldStaff of Sugar Estates.
4 Meeting under the auspices of the Mauritius Sugar Producers' Association .
S Meeting under the auspices of Royal Society of Arts & Sciences, Mauritius, Societe de Technologie Agricoleet Sucriere de I'Ile Maurice, and Association des Anciens Etudiants du College d 'Agriculture.
6 Meeting under the auspices of the Royal Society of Arts & Sciences, Mauritius .
7 Meeting under the auspices of the Engineers' Association of Mauritius.
-35 -
29th October - M. A. GRADENER. (Siemens,South Africa). Electricaldrives for sugar mills andcen trifuga ls. '
l l th N ovember - Film : Pul se beat o f ou rTime.?
22nd November G. ROUILLARD. Observationsagricoles it Forrnose.?
13th Decem ber P. H ALAIS and D. H . PARISH.Cane nutrition."
21st December - M. LY-TIO-FANE. Strategiccommerciale en Indo-Pacifique au 18eme siecle."
XIIth Congress I.S.S.C.T. The Mauritiusdelegation to the XIIth Congress I.S.S.c.T. ,held in Pu ert o Rico from 29th M arch to 6thAp ril, comprised 10 member s led by the D irecto r who represented the Mauritius Sugar Producers ' Associat ion. Dr. Parish, M essrs. Halaisand de Froberville attended on behalf of th eInstitute.
Seven papers were presented by members ofthe staff to th e Congress.
While in the Caribbean area, the Directorvisit ed resear ch stations and cane plantationsin Florida, Jamaica , Guad eloupe, Barbados andTrinidad. Similarly, Mr. de Fro ber ville spen ttwo week s visiting sugar factories in Mexicoand Jamaica , while Dr. Parish, on his returnto U.K., stopped in the U .S.A . for visits a tColumbia Univ ersi ty.
An acc ount of the XII th Congress and th esugar industries of Puerto Rico and the Caribbean was given in the course of lectures at theBoname Hall in Jun e and Jul y.
Comite de Collaboration Agricole The XIIthConference of the Com it e de CollaborationAgricole Maurice-Reunion- Madagascar was heldin M auritius from the 9th to the 16th November. There were 6 delegat es from Reunion and5 from Madagascar. The Committee spen t a dayvisiting the Research Institute and discussingproblems of special in teres t with members ofthe staff.
Mr. Antoine spent a week in M adagascarin March, visiting the East Coast in connectionwith Fiji D isease. H e returned to M adagascarwith the D irector in December to a tte nd a
week's VISi t and conference of the Pathologysub-com mittee . They sto pped for a few days atReunion on th e return j ourney.
Messrs. J.D. de Saint Antoine and E. Piatspen t a wee k in Reun ion in N ovember forvisits to sugar factories under the a uspices ofth e Comit e. Mr. J.R. Williams a lso paid ashor t visit to IRAT in Reunion to studymethods used in the rearing of the parasitefly Diatraeophaga.
Staff Movements Overseas leave was granted to th e following officers during the year :D r. Pari sh , M essr s R ou illard, de F ro berville,Bechet, de R eland, Rajab alee and M iss Ly-T ioFane. In conformity with the principle established sin ce the inception of the In stitute, th eseofficers devot ed part of their leave to the visito f research cen tres or agricultural indus tr ies.T hus, M r. Rouillard spent four weeks in Taiwan ;Mr. Bech et attended a Pest Control Course atChester ford Park Research Station; Mr. deReland took a special cours e in ph otographyin London and G erman y ; and M iss Ly-Tio-Faneesta blished useful contacts for the Library a tResearch Centres in the U.K., Holland andFrance .
Mr. F . Le Guen returned from NottinghamUniversity after having co mpleted an M.Sc.course in instrumentation.
Mr. M. Hardy attended a three - monthIrrigation Cou rse in Isr ael on a scholarshipgra n ted by the Israel Government.
I sh ould like to take this opportunity ofexpressing my warmest thanks and app recia tionto all th e a ut horit ies concerned for the facilitiesgra n ted to members of the staff and myselfwhile on visit or mission a broad.
Miscellaneous. The Institu te maintained closeliaison with cane planters and sugar producers,1,455 visi ts being made by the staff in 1965.Simila rly, collaborat ion with the Department andCollege of Agricultur e was con tinued at ahigh level.
The four field statio ns were used to theirfull potential for field experi men ts. Owing tothe restricted area a vaila ble, however, man yinvestigations have no w to be ca rr ied out atsu b-sta tio ns on Estate lands. In thi s connect ion,

-36-
I am greatly indebted to the Managers of SugarEstates for facilities granted, in particular atFUEL and Man Desert-Alma for selection work,and at Medine for irrigation experiments andbreeding plots. Cane production at Stations in1965 was at Reduit, 397 tons; Parnplemousses,535 tons; Belle Rive, 498; and Union Park, 312,
making a total of 1,742 tons.In concluding this report, 1 should like
to express my gratitude to the staff fortheir help and for the interest shown intheir duties during the year, in particular toDr. E. Rochecouste who acted for me from1st March to 1st June.
I~Director
18th February, 1966.

Rep . M aurit. S u«. lnd. Res. 111.11. 1965 Plale I
•
Left Ma lformed inflorescence produced in Januar y 1966 from a 6-month o ld p lant ca ne infect ed with smut.
R ig hr : F ully initiated sm ut wh ip on M. 64/5 8 (x 75)

CANE BREEDING
P. R. HERMELIN, J. A. LALOUETTE, L. P. NOEL & M. PEROMBELON
1. ARROWING
General
FLOWER IN G has been rather below normalduring the year. It was possible, however,
through retarded flower emergence, to utili zesome of the clones of spontaneum in breedingwork. Such retardation is attributed to lateharvest the previous season, coupled with lightinterruption during the night to which theplants were exposed. lt is interesting to notethat Kassoer has never flowered in Mauritiussince its introduction from Australia in 1960.
Two new breeding plots have been established during the year , one at Medine S.E. invirgin land cleared for the purpose, and the otherat Pailles. The breeding plot at Medine accommodates 72 out of the 85 available noble canes,together with five other varieties including Kassoer.The plot has been heavily manured at plantingtime and adequate irrigation faciliti es are available.The breeding plot at Pailles accommodates 24varieties which can be regarded mainly as potential males. With these two breeding plotssituated where conditions are believed to beoptimalfor flowering, it is hoped that a number ofinteresting combinations will be possible in thecoming years .
Experimentation in the flowering process
A more precise control of flowering isessential in order to make a fuller utilization ofthe various clones of Saccharum species existing
* 2-chloro ethyl trimethylammonium chloride.** Tributyl 2,4-dichloro benzylphosphonium chloride.
at present. With that object in view, severalexperiments were laid down exploring varioustechniques as a first step towards a betterunderstanding of the mechanism of floweringin sugar cane.
The main aspects of the problem which areunder study are the determination of theinductive time for flowering, the relation betweennumber of inductive photo-periodic cycles andflowering intensity, and the duration of theinductive period in Mauritius. To that effect,experiments were conducted with rooted singlestalks of the following freely flowering varieties:U.S. 48 - 34, c.P. 36 - 13, and S. spontaneum(Kletak.)
Studies on the detection of the presenceof endogenous flowering inhibitors in sugar canewere started, using the variety U.S. 48-34 .The experiment consists in a study of theantagonistic effects of inductive and noninductive leaves on flowering intensity.
The influence of growth retardants onflowering in sugar cane is also being investigated.Cycocel* is to be used at different concentrations and at different times during normalinductive period (January-March) on varietiesCP 36-13 and the type of S. spontaneum occurring wild in Mauritius. It is contemplated toexperiment with Phosfon** at a later stage.
Furthermore, a study of the morphogenesisof the flowering apex, including a detailedanatomical comparison between the very earlystages of smut whip and flower initiation is

-38-
being conducted. The observed fact (PI. I) thatsmutted cane plants occasionally give rise to theformat ion of structures bear ing grea t similarity
to a typical inflorescence, even in young can eand outside the normal flowerin g period, hasinitiat ed the studies .
2. CROSSING
Programme 1965 results.
Table 2. Sowing in 1965'
No. of Combination s No . of Seedlin gs
During the year, a number of new combination s invol ving the use of spontaneums androbustutns were tried . Second nobilization of57 N .G . 208 and 51 N.G. 140 was effected.All combinations involving robustum blood,some of the spontaneum crosses, and a fewother comb inations thought to be of intereston parental lines were the only crosses sownthis year, apar t from fuzz deri ved from parent sshowing different reactions to gurruning disease,crossed in various combina tions. The sowingprogramm e was thus curta iled cons iderably inorder to streamline the selection procedure andkeep the number of seedlings at various stagesof selection at a manageable level. The bulkof the fuzz obtained aft er ripening was storedunder deep-fr eeze for sowing in 1966. All theseedlings obtained have been singly-potted in thegreenhouse, and will be transplanted in the fieldby the end of March, A summary of sowingwork is given in Table 2.
The crossing technique was standardizedm the greenhouse during the season underreview. All female pa rents en tering a cro sswere marcotted on the day of collection, andkept in solution unt il they had rooted sufficientlyto be self-supporting.
A total of 1250 crosses were made, involving 293 combinations in which entered 120different parents, of which 74 were female, 33male, and 13 male and female.
Although fewer combinations were attempted, mor e crosses per combination were madein an effort to produce, where possible , a su ffi cient number of seedlings from the new combinat ions being tested. Thus, it is hoped tominimize or elimin at e errors which probablyoccur in the recording of seedling parentage a tselection time, when some of the combinationsplanted out in the field ha ve yielded fewseedlings.
A preliminary investigation into the causesof low fertility in some crosses was started.The method using blue light fluor escence(MARTIN, 1959) for the observation of pollengermination in stigma and style has been triedon a number of clones with satisfactory results .
A summary of crossing work is given inTable 1.
Crosses N ot germinated Germinated obtained
Involving S .Table l. Crossing work in 1965 robustum , or
its earlyN o. of crosses made nobilizations
St at ion Greenhouse Fields Total Involving S.Bi-Parental Polycross es Bi-P arental spontan eum
OthersReduit 934 188 19 1141 Exp er imen tal
(gumrnosisPa mplemousses 96 96 resist an ce)
Total 934 188 115 1237 Total
• Only part of the crosses made in 1965 were sown.
13
22
17
IJ
126
55
84
76
31796
1327
4588

-39 -
3. SELECTION
A summary of selection work is given inTable 3.
Station
Table 3. Se lection work in 1965
Stalks Varietiespl ant ed ill
8.S.P. Prop. P 1st Set.Trials
S electionsmade in1st Set.Trials
M .124/59 (Ebene 1/37 polycro ss) selecteda t Belle Rive and Pamplemousses, yielded muchbett er than Ebene 1/37 and M .93/48 at BelleRive, and showed a higher suga r content thanboth standa rds. At Pamplemousses, althoughyield was ju st unde r that of M. 147/44, sugarconten t was slightly bett er.
Redu it 7,519 21 5Pam plemousses 7,557 117 9Belle R ive 2,438 78 12Uni on Park 127 54 I1FUE L-Union 4,5 61Mi nissy .. . 3,937 2,565 102
Tot al 23,574 5,130 · 372-- 37 " " "
Selections from Fir st Selection Tr ials wereplanted according to established practice forrapid mult iplication . Am ong the 35 varietiesselected fro m F irst Select ion Tri als and planted atMedin e, th e following are pa rticularly promising:
M. 579/59 (N : Co. 310 X M.147 /44) selecteda t Union Park and Reduit. At Union Park ,sugar content was compar able to Ebene 1/37,and bett er th an M.9 3/48, but the variety outyielded both stancL:1.rds by a wide margin . AtRedu it, both yield and sugar content werebetter than M . 147/44.
M .1007/59 (Eb ene 1/37 X M .147/44) selectedat Belle Riv~Nhere it outyielded both EbeneJ/37 and M .93/48 and showed a higher sugarcontent.
4. VARIETY TRIALS ON EST ATES
The new strain of the gumming diseasepath ogen, being more viru lent, attacks a largerrange of seedlings than the old one. Consequentl y, it is desirable to know the reactionsof varieties as earl y as po ssible during selection,and in any case before they are list ed forinclusion in varie ty trials on esta tes. With thatend in view, it had been contemplated to testseedlings for their reaction to gummosis at thePropagation Plot stage . T he proj ect , however,had to be abandoned on account of the practical difficult ies enco untered in ru nn ing at th esame time a selection plot for agronomicperformance and disease reaction. Th e resistance trial has therefor e been esta blished withall selections from the Propaga tion Plot s, and
includes 377 var ieties. In that way, the reactionto gum mosis of all var ieties com ing out ofF irst Selection Tri als will be known , and onlytho se resistant to th e disea se will be propagateda t M ed ine fo r inclusion in Varie ty T rials onestates.
Ta ble 4. Distribution of trials
Year of Sub- Humid Super- i rrigated Totalplanting humid humid
1962 5 6 2 3 16
1963 6 7 7 7 27
1964 7 6 6 8 27
1965 5 5 5 5 20
Tot al 23 24 20 23 90
• T he num ber of d ifferent var iet ies, as they a re plant ed in two regions, is half of the tot al given .
"" From these, 36 varieties are planted in two regions makin g a to tal of 336 d ifferen t va rie ties.
••• From these, 2 vari e ties (1959 series) were selecte d in two env iro nme nts making a to tal of 35 different varieti es.

-40-
During the year under review, an add it ional20 trials were planted, while 12 were discarded,bringing the total to 90 trial s in which 189varieties are test ed .
Table 5. Varieties tested in trials on estates
Series No . of varieties
1946 I1948 31949 I1951 81952 21953 71954 171955 311956 371957 481958 11
Sub-total 166Ebene varieties... 10Imported varieties 13
Total . .. 189
The performance of the mo st prorrusing varietie s is given below. The var ieties M423/51 andM.359/53 , mentioned in pre vious reports, arenot included because of gen erally inferiorperformance.
M.39 /49 (Ebene 1/37 x M .63/39) is a richvariety well adapted to super-humid regions, buthad to be abandoned on account of its highsusceptibility to the new strain of the gummingdisease organism.
M.409/51 (M .112/34 x D .109) is a veryinteresting variety. It is rich, a good yielder,germinates well, and has large, healthy, darkgreen leaves. The variety seems best adaptedto humid regions. Stalks ar e semi- erect andmedium to large in diameter.
M .658/51 (B34104 x M .213/40 ). A vigorousvariety which ha s performed well under humidconditions. However, results were erratic for the1965 season, but sugar content is low.
M .llO/52 (Ebene 1/37 x M .63/39 ). Resultson ratoon crops confirm its high sugar contentbut, on the other hand, yield s are rather low.
M .13/53 (M ,60/44 x M . 72/31) has againindicated that it has a high sugar content.Yield in cane is reasona bly good. The varietyseems more adapted to irrigated conditions ;it has a tendency to split along the internodesduring the period of active growth .
M.356/53 (Ebene 1/37 x Co. 290), a prornising variety with a reasonable yield incane and a high sugar content. It is beingtested for its reaction to gurnrnosis, havingshown signs of susceptibility to the disease.
M.361 /53 (Ebene 1/37 X Co. 290) , a richvariety with medium yield which has performedwell under super- humid condition s.
M .260/55 (B.34104 X M .63/39) has showna marked preference for sub-hu mid conditionswhere it has yielded better than th e standa rdboth in cane and sugar content for two consecutive years .
M.l3/56 (M.241 /40 )< M.147/44). A rathervigorous vari ety with numerous , thin stalks andgood sugar content. Seems better adapted toirrigated condit ions,
M.46/56 (B.34104 X M .63/39 ), another promising var iety which has been disc arded onaccount of its high susceptibility to gummingdisease.
M.351 /57 (N :Co. 310 X M.99/34) has performed exceedlingy well in first ratoon. Sug arcontent is high. The variety appears to bedrought resistant.
N:Co.376 (Co.42.1 X Co .312) perfo rms fairl ywell under super-humid conditions. The vari ety is rather unpopular with its numerous, thinstalks, cl inging trash, and profuse flowering .
Of the Ebene 1956 ser ies, three varietiesar e very promising: Ebene 74/56, Ebene 88/56,and Ebene 118/56. The last two, Eb ene 88/56,a very good yielder with high suga r content,and Ebene 11 8/56 , a rich va riety with reasonableyield, would have been con sidered for release,had they not shown high susceptibility to leafsca ld .
REFERENCE
MARTIN, W. F. (1959). Staining and observing pollen tubes in the style by means of fluorescence. Sta in Technol . 34: 125.

Rep. Maurit . Sug . Ind, R es. ! nSI . 1965 Plat e 11
Autoradiographs showing d istr ibuti on of radi oacti ve phosphorus
Left : Accumula tion of p 32 in the no des of injec ted cane and in the tips a nd roo ts of yo ung suckers .Top right : M ovement of p32 between two mat ure sta lks . Bott om right: T rans verse sect ion of stalk sho wing
concentra tion of p 32 in th e buds ; the section in the midd le is internodal.

NUTRITION AND SOILS
1. NITROGEN STUDIES
D . H. PARISH, L. ROSS, C. L. FIGON & C. CAVALOT
I. EFFICACY OF AMMONIUM SULPHATE ON S UGAR CAl\'E
TH E amount of fertilizer nitrogen recoveredin a crop, expressed as a percentageof the fertilizer nit rogen app lied , can
be taken as an indication of the efficiency ofthe applied n itrogen in meetin g crop needs.
In tile temperate zones, recoveries of fertilizer N are very low , with arable crop figure s,cited by COOKE (1964), ranging from 33 % withpotatoes to 50 % with winter wheat (grain andstraw), whilst with grassland the figures citedrange from about 60 ~;'; with perennial ryegrassto up to almost 90 %with cocksfoot.
Under tropical and sub-tropical conditions,published results range from less th an 10 % upto 88 % (HENZELL, 1962). Wide fluctuations ha vebeen observed in almost all th e nitrogen-recoveryexperiments which have been made, thus thedata of VINCENTE-CHANDLER, SILVA and FIGARELLA (1959) from experiments ca rri ed out inPuerto Rico, show fertilizer-nitrogen recoveriesfrom pastures ranging from 32 to 76 %, with anaverage of around 50 %.
In temperate climates, the reason for thepoor performance of arable crops comparedwith grassland must be that the grass, occupying the whole land surface, as it do es, maintainslow levels of nitrate in th e mass, thus reducingleaching losses, but COOK E (loc. cit.) suggeststhat the beneficial effects of grass roots on soilstructure may also be important in preventingslaking and packing of the soil aggregates,which could lead to conditions suitable fordenitrification during wet weather. The suppres-
sion of nitrification by perennial grasses foundto occur by THERON (I 951) would also contributeto higher efficiencies under pasture whenammonium salts are used as the fertilizernitrogen source.
The apparently low er efficiency of nitrogenousfertilizers with tropical pasture , than with temperate pastu re, could be simply explained byassuming that with the high temperatures andrainfall conditions of the humid tropics, los sesof fertilizer nitrogen are accen tuated .
So far as sugar cane ' Is concerned, an efficiency of utilization . of fertilizer nitrogen ofabout 50 % could be assumed from the fertilizer statistics of the advanced sugar , producing countries.
Studies on th e recoveries by, sugar caneof fertilizer nitrogen applied at varying rateshave been made by BORDEN (1948), who foundaround 45 % recovery with 100 Ib of nitrogen,and up to 70 % with 220 lb of nitrogen/acre,thus implying better efficienci es at the higherrate of fertilization, whil st AYRES and HAGIHARA(1963) working in Hawaii found that less than60 % of fert ilizer-nitrogen was recovered by thecane crop.
As there were field trial plots in 'M aur itiuswhich had received 0, 30 and 60 kg of nitrogenper - acre for four years, it was felt that anestimation of the nitrogen-fertilizer efficiencyof these field trials would give more accuratedata than Borderr 's, which were obtained fromlarge pot experiments.

- 42 -
Experimental and results
The complete aerial portion of canes ina ten-foot strip from the four blocks of a 0,30 and 60 kg Nracre trial which had b eenrunning for four years , and was therefore giving avery good response to the nitrogen treatments wascollected, split into its component parts, weighed
and analysed for total N by the Kjeldahl method.The nitrogen had been applied in the form ofammonium sulphate buried in pockets along thecane row, and as usual, ad equate K and Pfertilization had been made. The treatmentresults which are given in Table 6 are significantly different (P = 0.01).
Table 6. The nitrogen content (Kg N/acre) of a cane crop at the time of harvest
FertilizerTreatm ent Millable Green Discarded Total EfficiencyKg N jacre cane Tops Leaves %
0 7.4 10.3 2.1 19.8
30 14.8 12.8 3.7 31.3 38
60 21.1 18.3 7.4 46.8 45
These results show the recoveries of appliedfertilizer nitrogen ani more than one-third atthe 30 kg N treatment, and almost one half atthe 60 kg treatment level. As the treatmenteffects are highly significant, it would seem sofar as sugar cane is concerned, that the efficiency of fertilizer nitrogen may be higher atthe higher levels of application, althoughTAKAHASHI (1964) as a result of N 15 studiesconcluded that the reverse was true.
According to COOKE (loc. cit.s, the proportions of applied fertilizer recovered by cropsare greatest at low rates of dressing, but eventhe results presented by this author show casesof higher percentage recoveries at higher nitrogen
dressings.The reason for the higher recoveries of
nitrog en at the higher levels of fertilizationcould be simply explained by the greater vigourand growth of the cane plant, and consequentlya more rapid uptake of nitrogen, thus reducingthe effects of those factors leading to nitrogenloss.
Summary
The efficiency of fertilizer nitrogen for thecane crop of Mauritius has been found to varyfrom 38 % with a 30 kg N jacre dressing upto 45 % with 60 kg N zacre.
REFERENCES
AYRES, A.S, and HAGIHARA, H .H, (1963) . A lysimeter study of losses of nitrogen and potassium,Hawaii. Plrs' Rec. 56 (4) : 255-263
BORDEN, R.J . (1948). Nitrogen effects upon yields andcomposition of sugar cane. Hawaii. Plrs' Rec.52 : 1-51.
COOKE, G.W. (1964). Nitrogen fertilisers: their placein food production, the forms which are made, andtheir efficiencies. Proc. Fertil. So c. NO.80 .
HENZELL, E.F. (1962). The use of nitrogenous fertilisers on pastures in the sub-tropics and tropics.B/lII. Commonw. Bur. Past. Fld Crops. 46 : 161-172.
TAKAHASHl, D .T. (1964) . NI5 nitrogen field studieswith sugar cane. Hawaii. Plrs' Rec. 57 : 198-221.
THERON, J .J . (1951) . The influence of plants on themineralisation of nitrogen and the maintenance oforganic matter in the soil. J. Agric. Sci., Camb. 41:289-296.
VINCENTE-CHANDLER, J ., SILVA, S. and FIGARELLA, J. (1959). The effect of nitrogen fertilisation and frequency of cutting on the yield andcomposition of three tropical grasses. Agron . J .51 : 202-206.

-43-
11. STUDIES ON THE NITRIFICATION OF AMMONIUM SULPHATE AND ON
THE MOVEMENT OF NITRATE IN SOIL PROFILES
Results
NH+-N and NO--N (ppm dry soil)4 3
6.12.63
22.1.64
10.1.64
18.11.63
12.11.63
'"oo,
4.81 ins.0.206.700.430.60
28.83
s,
to 4.11.6312.11.6318.11.636.12.63
10. 1.6421. 1.64
Soil: Low Humic Latosol
JII---
Site: Reduit
Rainfall from 29.10.634.11.63
12.11.6318.11.636.12.63
10. 1.64
This sampling technique was considerablysuperior to the auger system, especially whenthe soil was dry, as contamination by surfacesoil running into the deeper layers was eliminated, and the detailed picture of the changes innitrate and ammonium content throughout theprofile obtained by the slice method, made theextra effort worth while. Analyses of the controlplots showed that Jittle or no ammonium ornitrate nitrogen was present in the profiles.
DEPTH (IN.) 0 g: j1111119--------'----Sa-m--'p1inq Date
12 4.11.6315
18
Fig. 8. Changes in ammonium and nitrate nitrogenlevels in profile of soil treated with a surfacedressing of sodium nitrate.Plain columns: ammonium nitrogenBlack columns: nitrate nitrogen
Experimental
The zonal soils of the humid tropics arelatosols or latosolic soils, and by definition thesesoils are being actively depleted in bases andsilica by leaching; it is natural, therefore, toassume that losses of nitrogen due to leachingwill be of greater consequence with these soilsthan with temperate zonal or azonal soils.
Ammonium sulphate has been the standardnitrogenous fertilizer used in the tropics, butfertilizers containing cheap synthetic nitrate areappearing on the market in increasing quantities,and therefore studies of the movement ofnitrate in the soil profile were made to supplement the information obtained in 1962 (PARISH,FIGON & Ross, 1963).
The average annual dressing of sulphateof ammonia used in Mauritius for sugar caneis about 250 kg/acre and as the dressing isbanded along the cane row, the actual intensityof application, taking surface area covered intoaccount, is at least 500 kg/acre; the fertilisedplots, therefore, received this level of fertilization.
The experimental sites were chosen, onesite at Reduit on a Low Humic Latosol with anannual rainfall of 61", the other at Belle Riveon a Humic Ferruginous Latosol with a meanannual rainfall of 157". The sites were inflat fields which had just been cleared afterhaving been under cane for several years.
Six plots (9 I x 9 ') were marked out, tworeceiving 500 kg of ammonium sulphate/acre,two receiving sodium nitrate at an equivalentlevel of nitrogen, and two were control plots.The plots were surrounded by small ditchesto prevent contamination of the surfaces by soilwash, the whole area being kept free fromweeds by hand weeding.
Soil sampling was carried out by digging adeep ditch at the edge of the plots and removing 3" horizontal slices of the profile downto IS".
Analyses were carried out for N02- +N03--N
(expressed as N03--N) and NH/-N

-44-
Changes in ammonium and nitrate distributionat Belle Rive. The results for the Belle Rivesite (figs. 10 and 11) are entirely differentfrom those of the Reduit site, as both thesodium nitrate and the ammonium sulphatetreated plots show almost identical changes intotal nitrogen distribution.
The""ammonium sulphate-treated plot results..(fig. 9) show that little or no downwardmovement of ammonium occurs, or if it does itis rapidly nitrified, and the nitrate formedremoved from the profile by the heavy rains.About 75 p.p.m. of the fertilizer nitrogen wasstill present in the surface 0-3" layer on 2Ijl/64,showing that, although ammonium sulphateis fairly rapidly nitrified and the nitrate leachedout of the profile, on the deep free-drainingLow Humic Latosols it is a more persistent formof nitrogen than sodium nitrate.
6.12.63
22.I.b4
1;',11.63
10.\.64
Sampling Date 4 l' 63
Low Humic LatosolSoil:
•
NH+-N and NO- -N (ppm dC1 soil)4 3
0 :0 00 0 0 'i 0 0, , ,
I,
ReduitSite:
J)~=============-,a.I1.63
tJ~
DEPTH (IN)
~r1Sre
Fig. 10. Changes in ammonium and nitrate levels inprofile of soil treated with surface dressing ofsodium nitrate.Plain columns: ammonium nitrogenBlack columns: nitrate nitrogen
Soil: Humic Ferruginous Latosol
7.66 ins.0.263.313.054.06
40.40
ooI
4,11 63
6.IVH
18.11 03
22,1.64
12.11.63
10.1.64
(ppm dry lOil)
oo
Sampling Dale
to 4.11.6312.11.6318.11.636.12.63
10. 1.6423. 1.64
+ -N H4-~ end NOJ-N
o
!
Site: Belle Rive
Rainfall from 30.10.634.11.63
12.11.6319.11.637.12.63
10. 1.64
Rainfall from 29.10.63 to 4.11.63 4.81 ins.4.11.63 12.11.63 0.20
12.11.63 18.11.63 6.7018.11.63 6.12.63 0.436.12.63 10. 1.64 0.60
10. 1.64 21. 1.64 28.83
Changes in ammonium and nitrate distributionat theReduit site. The results and rainfall dataof the sodium nitrate-treated plots are givenin fig. 8, and the results for the ammoniumsulphate-treated plots in fig. 9.
These plots show a simple picture ofelution down and from the profile. The nitratelevels in the lowest layer of the sampling dated6/12/63 is probably a peak of deeper nitrateaccumulation, as the dry conditions between i:the 18jll/63 and the 10/1 /64 would lead to ,--,strong evaporation from the soil and consequent upward movement of nitrate, which isclearly demonstrated by the 10jl/64 samplingresults.
Complete removal of the nitrate from theprofile occurred with the heavy rains of theweek 10jl/64 to 2Ijl/64, giving a complete lossof a dressing equivalent to about lOO kg N peracre in just under two months.
Fig. 9. Changes in ammonium and nitrate nitrogenlevels in profile of soil treated with a surfacedressing of ammonium sulphate.Plain columns: ammonium nitrogenBlack columns: nitrate nitrogen

-45-
Summary
fertilizer were merely poured on to the soil, theresults cannot be taken as proof of movenemtunder field conditions.
The B horizon of the Humic FerruginousLatosol great soil group is compact, whilst theA horizon is loose and gravelJy due to thelarge amount of concretions. Thi s leads to a Bhorizon which is almo st waterl ogged in periodsof heavy rain, and to strong lateral drainageof the surface layer, thu s accounting for thepersistence of nitrate in the lower part of theprofile , even afte r 40" of rain fell in the fortnight10/1/64 to 23/l/64. Under these conditionssodium nitrate is seen to be as persistent asource of nitrogen as sulphate of ammonia.
The persistence of nitrate in the profilein conditions approaching water logging supportsthe results presented later which show thatdenitrification is not a serious source of nitrogenloss in bare latosols.
4.11.63
6.12.63
18.11.63
12 .11.63
10.1.64
22.1 .64
lJl
o,
(ppm dry soil)
6oI
..Sampling Dote
Ch a nges in ammonium and nitrate levels inp ro .ilc o f soil t reat ed with a surface dressing ofammonium sulphate.Plain columm : ammonium nitrogenBlack columns: nitrate nitrogen
',:~3 ;15
18
R ainfall from 30.10.63 to 4.11.63 7.66 ins .4.11.63 12.11.63 0.26
12.1!.63 18.11.63 3.3119.11.63 6.12.63 3.057.]2.63 10. 1.64 4.06
10. 1.64 23 . 1.64 40.40
+ -NH
4-NondN03-N
DEPTH (IN.) lJlo
Fig . I I.
The nitrification of surface-applied sulphateof ammonia and the movement of nitratethrough the profile of a Low Humic and aHumic Ferruginous Latosol have been studied.
The nitrification rate of ammonia is suffi-Site: Belle Rive Soil : Humic Ferrugionus Latosol ciently rapid to make th is form of nitrogen
only slightly more persistent in a free-drainingsoil than nitrate, whilst the movement ofammonium down the profile which occurs withthe Humic Ferruginous Latosol, and the poordrainage of the B horizon of this great soilgroup eliminate any advantage of persistencewhich the ammonium form of nitrogen mayhave under more normal conditions.
Most of a dressing of fertilizer nitrogen isThe 4/11/63 sampling of the ammonium removed from a bare soil profile in about two
plots shows that the 8" of rain which fell in months. The losses found in these experimentsthe preceding week had spread the ammonium would, of course, have been reduced in thethrough the profile almost as much as it had presence of a growing cane crop ; however , heavynitrate, showing that the Humic Ferruginous rains are common in November and December,Latosol absorbs ammonium only weakly . SHER- and as many soils in Mauritius are very shallowMAN (1955) found movement of ammonium and rocky, the use of heavy dressings of nitratefrom suIphatc of ammonia through a Low Humic and even of ammonium nitrogen at this period,Lato sol profile, but as in this work solutions of on these soils , is not without some risk .
REFERENCES
PARISH, D .H ., FIGON, i.c. and ROSS, L.P. (J 963). SHERMAN, G.D. (1955). Fe rtility problems of tropicalA field study of the nitrificat ion rate of ammo nium soil management in the H awaiian Islands. Hawaii.sulpha te and the subsequent loss of nit rat e. R ep. Plrs' Rec. 55 : 65-75.Maurit . Sug . lnd. Res. Insl.9 : 48-55 .

-46-
HI. STUDIES ON DENITRIFICATION LOSSES
The term denitrification is reserved todescribe microbial reduction of -NO~ togaseous nitrogen compounds or to elementalnitrogen itself.
Attempts to determine the extent of lo ssesof nitrogen in the field due to thi s processhave not been particularly succ essful , as anaccurate figure for the total soil nitrogen and oflosses of nitrogen from the soil by leaching,volatilization of ammonia, and crop removalare needed.
It is not surprising therefore that ALUSON(1955) in his review should have referred tothe 'enigma of soil nitrogen balance'. It hasbeen suggested that loss of nitrogen and itsgaseous oxides from the soil could be caused bynon-biological mechanism, the mo st commonlysuggested being the Van Slyke reaction of theamino group with nitrous acid, although usingN15, ALUSON and DOETSCH (1951) showed thatunder field conditions this reaction was of nosigni ficance .
The reduction of nitrates by bacterialactivity was first described by GAYON andDUPETIT (1886), and since that time the denitrifying bacteria have been found to be facultativeanaerobes wh ich denitrify in conditions of lowoxygen partial pressures, although MEIKLEJOHN(1940), using culture tubes, and CARTER andALLISON (1960) , and CLARK, BEARD and SMITH(1950), using soils, have recorded losses of nitrogen even under aerated conditions. Denitrification is most active in the pH range of7-8.6, and below pH 5 is suppressed (SKYRINGand CALLOW, 1962).
BREMNER and SHAW (1958) found that withlow partial pressures of oxygen, maximumdenitr ification occurred at high temperatures(50°C) in the presence of a readily decomposable energy source, such as glucose, and in thepresence of sufficient nitrate, a set of conditions which, agriculturally speaking, appears tobe very artificial.
GREENLAND (1962) has studied denitrificationin Ghanian soils using Bremner's and Shaw'stechniques, and concluded that, although denitrification is stronger with these soils than withtemperate soils under optimal conditions for
this reaction, it is unlikely that in cultivatedsoils any serious loss of nitrogen occurs bydenitrification; under grassland conditionslosses were also considered to be negligible,since the nitrate levels are invariably very low.
WOLDENDORP (1963) using N '5 has shownthat the roots of living plants can stimulatedenitrification by reducing oxygen tensions inthe rhizosphere, through their respiration, andby excreting organic substances which serveas hydrogen donors during denitrification, andit is obvious now that the only worthwhilestudies in denitrification will include N 15 techniques.
Nevertheless , with the high soil temperatures and high levels of nitrate which occur ina recently fertilized cane field, denitrificationcould be significant, provided the partial pressures of oxygen were low enough.
As during cyclonic disturbances and consequent periods of heavy rainfall temporarywaterlogging of recently fertilized cane soilsmay occur in Mauritius, an examination ofthe denitrifying potential of two zonal soils,using the Bremner and Shaw (loc. cit.) techniques,was considered to be of interest.
Experimental and results
For th e first experiment, a Humic Ferruginous Latosol of the Belle Rive family was used.These soils occur in a rainfall zone with amean annual rainfall of about 150", and some ofthe profiles, particularly on flat land or indepressions, show incipient gleying; of the zonalsoils, they are th e ones most likely to give thelow oxygen tensions associated with waterlogging. They are , however, acid, the pH ofthe plough layer ranging from 5.2-5.6, which isthe lower end of the pH range at which denitrification can take place.
Four samples of soil were taken, the A andB horizons of a virgin site under scrub and grass,and the top and subsoil from a cane row in afield which had been under cane for fifteenyears. The prepared samples were incubatedat 60 ~~ and 120 % M.W.H.C. (maximum waterholding capacity) with added nitrate, and

-47-
analysed at intervals for tot al N ; the wholesequence of treatments and ana lyses being asdescribed by BREMNER and SHA W (loc. cit.).
The results, which are the means of duplicate determinations, are given in Tabl e 7 andshow that, altho ugh the reproducibility of themethod . leaves somet hing to be desired , nosignificant changes in tot al N occurre d .
The experi ment was repeated on a LowHumic Latosol of the Reduit family, a soilwhich has excellent infiltrati on and drainagecharacteristics, so that low oxygen tensions willprobably be more dep endent on the biolo gicaloxygen demand of the rhizosphere than on theactual physical effects of waterlogging.
Because denitrification is pH-depend ent , thesoil taken for this study had a pH of 7.2, atwhich pH the denitrifying micro-organi sms a requite active.
The soil was ta ken from a ro w of grow ingcane and prepared for analysis immediately,thu s eliminating the possibility that somelabil e source of energy, that could act as ahydrogen donor, was being destroyed duringair-drying and thu s reducing the possibility ofdetecting denitrification. The field had beencontinually cropped with sugar cane for morethat twenty-five years , and the soil samples weretaken from the centre of the cane line whereroot growth is most active.
The res ults are given in Table 8.These results, which are the means of
triplicate determi nations, show once more thatdenitrificati on of nit rat e is not a source ofnitrogen loss in tr op ical soils free of gro wingplants, so that if denitrification doe s occur ingrowing cane crops, it must occur as a result of themechan ism suggested by Woldendorp (loc. ci!.).
Table 7. Changes in total soil N (p.p.m, oven-dried soil) on incubat ion with added nitrate and at two moistur e levels
Humic Ferruginous La tosol
60 % M .W.H .C. 120 % M .W. H.e.Virgin Land Cane Land Virgin Land Cane Land
Top Sub Top Sub Top Sub Top SubSo il Soil Soi l So il Soil So il Soil Soil
Soil 3461 1436 3143 1438 3461 1436 3143 1438Soil + nitr at e a t star t 5032 2695 4427 2770 5032 2695 4427 2770
af ter 3 days 5070 2790 4519 2688 4990 2774 4403 2803after 12 days 5089 2859 4574 2888 4960 2745 4374 2773
Table 8. Changes in total soil N (p.p.m.) on incubation with added nitrate and at two moisture levels
Low Humic Latosol
Soil N a t star tSo il + NO; at start
after 3 days" 6 days" 12 days" 18 days
60 %TopSo il
268536313659365936883716
M . W.H. e.SubSo il
181828302859288729072847
120 % M .W.H.C.Top SubSoil Soil
2685 18183631 28303716 28593675 28693675 28873659 2830
Table 9. The effect of varying C :N ratios on the denitr ification of added nitrate (1,000 p.p.m.) at 120 % M.W.H.C.
BeHe RiveHumic Ferruginous Latosol
N at N aft er % of addedstart 20 days N lost
ReduitLow Humic Latosol
N at N af ter % of addedstart 20 days N lostC:N
I248
163264
128
3871 29542966293230413058312630293032
92
84
4310 3258298931593448
· 3192328632503290
105
102

-48-
As a check on experimental technique andon the potential of the two soil groups fordenitrification, two soils were incubated fortwenty days with glucose and nitrate at varyingC:N ratios and a nitrate N addition of1,000 p.p.m. The results, which are the meansof triplicate determinations, are given in Table 9and show that almost complete denitrificationof the added nitrate occurred, and that unlikethe soils used by Bremner and Shaw (loc. cit.)no indication of significant N fixation under
waterlogged conditions and in the presence oflarge accounts of glucose occurred.
Summary
Denitrification in growing cane, if it doesoccur, must be due to the effects of the rootsof the cane crop in reducing oxygen tensionby respiration and by secreting hydrogen donors.
Only N 15 techniques can show whether in fact,denitrification under these conditions does occur.
REFERENCES
ALLISON, F.E. (1955). The enigma of soil nitrogenbalance sheets. Adv, Agron.7 : 213-250.
ALLISON, F.E. and DOETSCH, J. (1951). Nitrogengas production by the reaction of nitrites withamino-acids in slightly acid media. Proc. Soil Sci.Soc. Am. 15 : 163.
BREMNER, J.M. and SHAW, K. (1958). Denitrification in soil. J. Agric. Sci., Camb. 51 : 22-52.
CARTER, J.N. and ALLISON, F.E. (1960). Investigations on denitrification in well-aerated soils. SoilSci. 90 : 173-177.
CLARK, F.E., BEARD, W.E. and SM1TH, D.H. (1960).Dissimilar nitrifying capacities of soils in relationto losses of applied nitrogen. Proc. Soil Sci. Soc.Am. 24 : 50-54.
GAYON, U. and DUPETIT, G. (1886). Reduction desnitrates par les infiniment petits. M. Soc. Bordeaux,Ser. 3,2: 201-214. Cited by WOLDENDORP, J.W.(1963). Meded. Landb Hoog esch, Wageningen 63 (13):1-100.
GREENLAND, D.J. (1962). Denitrification in sometropical soils. J. Agric. Sci., Camb. 58 : 227-233.
MEIKLEJOHN, Jane (1940). Aerobic denitrification. Ann.appl. BioI. 27 : 558-573.
SKYRING, G.W. and CALLOW, Barbara, J. (1962).The physiology and biochemistry of nitrification anddenitrification. Bull. Commonw. Bur. Past, Fld Crops46 : 56-71.
WOLDENDORP, J. W. (1963). The influence of livingplants on denitrification. Meded. LandbHoogesch.Wageningen, 63 (13) : I-lOO.
IV. COMPARISON BETWEEN UREA AND AMMONIUM SULPHATE
AS NITROGEN SOURCES FOR SUGAR CANE
PARISH and FEILLAFE (1960) showed thatsurface-applied urea was inferior to surfaceapplied sulphate of ammonia as a nitrogensource for sugar cane and they concluded that«in view of the intense biological activity occurring in tropical soils, it would seem reasonableto think of urea merely as a convenient way ofstoring and applying the unstable salt ammoniumcarbonate.» This concept immediately suggeststhat the only way to use urea on a practicalscale would be to bury it sufficiently deeplyto prevent volatilization losses.
Experimental
A series of randomized block trials withurea and ammonium sulphate applied a1 ratesequal to 0, 30 and 60 kg Njacre were laiddown with two methods of placement, surface
and buried. As many soils in Mauritius areextremely rocky, and burying of fertilizer isimpossible for these soils, the urea and ammoniumsulphate were dissolved in water and wateredon, this treatment being considered as equivalentto burying.
As usual, adequate phosphatic and potassicfertilization was given.
Results
The vanation in the yields from thesetrials was large, due no doubt to the effectsof the cyclones of 1960, 1962 and 1964, andin order to obtain significant treatment effects,yields for years and sites had to be pooled.
The 30 kg Njacre level gave no significantdifferences between forms and placement, butthe 60 kg Njacre level did (Table 10).

-49-
Table 10. Analysis of form and placement experiments. Nitrogen applied at 60 Kg/acret
Treatment differences4 3
Treatm ent (T.e.A. )
1. Sulphate of ammonia (buried) (31.6) 1002. Urea (buried) (30.6) 96.83. Sulphate of ammonia (surface) (30.2) 95.64. Urea (sufa ce) (29.0) 91.85. Control (25.2) 79.7
5
20.3**17.1**15.9**12.1**
8.2*5.0*3.8*
4.4*1.2
2
3.2*
t Figures are %of treatment I ; significant differenceby Q-test on means of 11 trials during 3 years .
* Sig. at 5% level** Sig. at I % level
Discussion
Variety Zone No . of Soil pHsites
M.147/44 Sub-humid 4 6.6 ; 6.7 ; 6.6; 6.9B.37172 Humid 4 5.6 ; 5.4; 6.1; 5.4B.3337 Super-hum id 3 5.6; 5.4 ; 5.8
The significant improvement in the efficacyof urea when it is buried, or watered on, compared with when it is applied on the surface, canbe explained simply in terms of reduction ofvolatilization losses.
The apparent superiority of buried sulphate ofammonia to surface-applied sulphate of ammonia,and the superiority of buried sulphate ofammonia to buried urea need discussing.
It is accepted that losses of ammonia fromammonium sulphate applied on the surface ofalkaline soils can be high, but the soils of theexperimental sites were slightly acid to acid asthe pH values in Table 11 show.
Table 11. Soil. pH at trial sites
However, even on acid soils ,wetting and drying of heavy surfaceof sulphate of ammonia may cause
alternatedressingsnitrogen
loss; moreover, there is the practical pointthat surface dressings are exposed to surfaceerosion, and it is felt now that every effort tobury or cover fertilizers is well worth while.
As regards the yield differences betweenburied ammonium sulphate and buried urea,possible explanations are that when urea ishydrolysed in the soil, the pH rises considerablyabove 7 and therefore free ammonia may occurand plant roots damaged (COOKE, 1962); orthat toxic accumulations of nitrite occur(COURT, STEPHEN and WAID, 1962) due to thesuppression of nitrification by the high pH ofthe soil surrounding the zone of urea hydrolysis.
It would seem from the yield results of th islast series of experiments, comparing buriedand surface-applied urea and ammoniumsulphate, that buried urea approaches sulphateof ammonia in efficacy.
No European field experiments haveapparently been done comparing buried andsurface-applied urea (COOKE, 1964), but recentAmerican results (MEYER, OLSON and RHOADES,
1961, and JACKSON and BURTON, 1962) showthat burying urea doe s improve considerablyits efficacy as a source of nitrogen.
REFERENCES
COOKE, I.J. (1962). D amage to plant roots caused byurea and anh ydrous ammonia. Nature, Lond. 194:1262-1263.
COOKE, G .W. (1964). Nitrogen fert ilisers : theirplace in food production, the forms which are madeand their efficiencies. Proc . Fertil. Soc. No . 80.
COURT, M.N. , STEPHEN, R.e. and WAID, r.s. (1962).Nitrite toxicity arising from the use of urea as afertiliser. Nature, Lond. 194: 1263-1265.
lACKSON, l .E. and BURTON, G.W. (1962). Influenceof soil treatment and nitrogen placement on theutilisation of urea nitrogen on coastal Bermuda grass.Agron. J. 54 : 47-49.
MEYER, R.D ., OLSON, R.A. and RHOADES, H .F .(1961). Ammonia losses from fertilised Nebra skasoils. Agron, J . 53 : 241-244.
PARISH, D.H. and FEILLAFE, S.M. (1960). A comparison of urea with ammonium sulpha te as anitrogen source for sugar cane . Trop, Agric. Trin.37 : 223-225.
-50-
v. EFFECT OF AMMONIACAL AND NITRATE NITROGEN AND TIME OF APPLICATION.
Thousands of trial s must have been carriedout to compare sodium nitrate with sulphate ofammonia as nitrogen sources for various crops ;CAREY and ROBlNSON (I953) reviewed theresults of 254 experiments carried out in theBritish Commonwealth up to about 1943, andHODNETT (1956) extended this work up to about1955.
One of the earliest references to comparisons between sulphate of ammonia and nitrateof soda as nitrogen sources for sugar cane mustbe that of BONAME (I 902). Although thisworker detected no difference between the twoforms, he expressed a fear, which still exists inthe tropics, that severe losses of nitrate mightoccur following heavy rain, «de sorte qu'il n'estpas cl recommander de faire de fortes fumuresavec nitrate au debut de la saison pluvieuse»,
The reviews of Carey and Robinson andHodnett (loc. cit.) lead only to the conclusionthat sodium nitrate and ammonium sulphategive similar standard responses (3.0 T.C.A. and3.3 T.C.A. respectively, for 50 lb Njacre).
AYRES (I955) concluded for Hawaiianconditions that all forms of nitrogen areapparently equally efficacious as nitrogensources for sugar cane, and this general statementwas supported by DAvlDSON (I963) in hisreview of work carried out in Florida.
The failure to demonstrate a difference inyield response between two fertilizers, assumingthey are compared only at levels and underconditions where a yield response could beexpected, could be due to the fact that someunknown factor was limiting the yields .
When the results of leaching trials areconsidered, the reason that little difference hasbeen obtained when sodium nitrate and ammonium sulphate have been compared is thatammonium sulphate itself is fairly rapidlynitrified, so that comparisons are really beingmade between a true nitrate source (sodiumnitrate) and a mixed nitrate and ammoniumsource (a mmonium sulphate). However, smalldifferences between the two forms in the persistence of nitrogen did exist, and although sodium
nitrate is now too expensive ever to be acommercial fertilizer for sugar cane, the increasing production and consumption of complexfert ilizers, all of which contain about one-thirdof their n itrogen as nitrate nitrogen, make itessential that reliabl e data on the degree ofnitrate-nitrogen losses under field conditions beobtained.
Moreover, as the complex fertilizers containnitrate, they acidify the soil less than anequi valent amount of ammonium sulphate, afact which is developing into a strong salespoint.
Considering these points, it was felt that anew series of experiments comparing the efficacyof sodium nitrate and sulphate of ammonia asnitrogen sources for sugar cane was worthwhile, and the effects of the acidification oflatosols by sulphate of ammonia were alsoexamined.
The introduction by GORING (1962) of2-chloro-6 (trichloromethyl) pyridinc as a material for controlling nitrification in soils andthe results of laboratory studies on the effectof this material on nitrification rate s (PARISH,1964) made field trials with this material alsoworth while.
Experimental and results
(a) Sulphat e of ammonia , sodium nitrate trials
Four 5 X 5 latin squa re trial s were laiddown in 1961 , two in the super-humid zoneon Humic Ferruginous Latosols, and two in thehumid zone in Low Humic Latosols . No resultswere obtained in 1962 because of cyclonicdamage, but in 1963 th e four trials wereharvested .
Only two of the experiments gave significant yield increases with nitrogen, one atBeau Plan showing that nitrate and ammoniacalforms are equival ent , whilst the other at Bar leDue, although showing little difference in finalyields, gave vegetative indices which stronglysuggest a marked loss of efficiency of applied N atthe 60 kg level as sodium nitrate (Table 12).

-51-
Table 12. Comparison of sulphate or ammonia and sodium nitrate (5 x 5 latin square)
Sile ControlSulph ate of ammonia
30 kg Nlacre 60 kg NlacreNitrate of soda
30 kg Njacre 60kg Nlacre
Beau Plan
Bar le Due
T.C.A.V.\.Mn p.p .m. D .M. (TVD)T.C.A.V.I.
19.410021.624.1
100
35.4139
26.828.5
106
44.2155
42.632.4
112
33.513424.626.7
106
42.414722.629.0
104
One interesting point, in view of thecurrent work on the possibility of manganesetoxicity and induced molybdenum deficiency, wasthe effect of ammonium sulphate, through itsacidification of the soil, on manganese uptakewhich in the case of the 60 kg N level wasalmost doubled.
(b) The effect of 2-chloro-6 (irichloromethytipyridine (N-Serve) on cane responses to sulphateof amm onia
In view of the fact that N-Serve decreasedsignificantly the nitrification rate of sulphateof ammonia buried in the soil, six field trialscovering the full range of soils met with inMauritius, were laid down in 1963 to test thismaterial on a field scale.
The design used was a split plot (N-Serve ,no N-Serve) 4 x 4 latin square with 0, 15,30 and 45 kg N/ac re treatments.
The N-Serve was dissolved in methylenechloride and added to crystalline sulphate ofammonia to give a concentration of 2% ofN-Serve on a nitrogen-content basis, the wholemass being tumbled in a drum until dry. Inthe field, both the treated and untreated fertilizers were placed in small holes about 6 inchesdeep around the cane stools and then coveredimmediately with soil. Detailed studies of caneyields, N % D.M. of the T.V.D. leaf laminaeand the V.I., showed that no significant effectsof the N-Serve treatment could be detected.The growing season 1963-64was not a good one,but 1964-65 was, and yet again no effects ofN-Serve were detected.
Many chemicals are known which retardnitrification when added to the soiJ, and moreover some both retard nitrification and increasethe mineralization of soil nitrogen (GASSER and
PEACH EY, 1964). There is, therefore, a greatpossibil ity that a material which could be usedon a commercial scale to prevent nitrificationof the ammonium ion and increase the mineralization of soil nitrogen, will become available foruse on an agricultural scale eventually.
(c) The uptake of nitrogen by sugar caneand the effect of split doses of nitrogenousfertilizer
Cane is harvested in Mauritius from Julyto December, and the heavy rains and hot weatheroccur in January, February, March and April.Fertilizer practice, based on past experimentalevidence, is to apply all the nitrogen in a singledressing as soon as possible after harvesting.This means that late-harvested cane is fertilizedin, or just before, the period of heavy rains,when, as was seen from the nitrification andleaching studies, rapid removal of fertilizernitrogen from the soil profile takes place,implying that much loss of nitrogen must occurbefore strong assimilation by the cane starts.
Taking into consideration the foregoingfacts, it is felt that further studies on theeffect of split applications on nitrogenousfertilizer efficiency, on the degree of nitrogentolerance of a 'nitrogen tolerant' variety, andon the uptake and distribution of nitrogen bythe cane crop are needed if any improvement inthe efficacy of fertilizer-nitrogen use by thesugar cane is to be 0 btained.
Two field experiments were laid down on auniform area of the variety M.93/48 which hadbeen harvested at the end of November 1963.
The first trial was to assess the effect ofsingle and split doses of nitrogen applied atrates of 0, 15, 30 and 45 kg of nitrogen/acreon final cane yields.
-52-
The design was on 4 x 4 split plot. Thesingle dose of nitrogen was applied at thebeginning of December, and five equal splitdoses were applied at the beginning of December,the beginning of January, the end of January,the middle of March and the middle of April.The second trial was designed to check thedegree of nitrogen tolerance of the variety usedby applying a fairly heavy dressing of nitrogenlate in the season.
The experiment was laid down at the endof April 1964 in the same field, on an areawhich had been fertilized by the estatewith 50 kg of Nfacre in early January1964.
The design used was six blocks split intotwo plots , to one of which 30 kg NJacre (assulphate of ammonia) was added. Cane yieldsand sucrose percentage were determined at thetime of harvest.
A trial was designed to study the uptakeof nitrogen from plots which had received no nitrogen, and 45 kg of nitrogen, in a single earlydressing and in split dressings fractionized asabove; treatments were carried out in triplicate.
From these plots, the total aerial portionof cane growth from 5 ft of cane row washarvested at approximately monthly intervals.Care was taken when harvesting to avoid anygaps from previously harvested strips so thatthe border effects of light and competition wereavoided. Initially the growth consisted onlyof green tops, and was weighed and analysedas such, but later sub-division into green tops,cane and trash was made. To avoid losses dueto falling leaves the total number of nodes ineach harvest sample was counted and the trashfigure corrected for fallen leaves.
Growing conditions during 1964 were notgood, and the canes in this series of experimentswere affected to some extent by an earlydrought and an exceptionally cold winter period(July, August and September).
(d) Dry matter production and uptake ofnitrogen
Studies of the uptake and distribution ofnitrogen with a heavy crop like sugar cane are
extremely difficult, as is the interpretation ofthe results . BORDEN (1948) following his detailedstudies of growth and nitrogen uptake underHawaiian conditions stated, «As. is usuallyfound in studies where small samples of cane aretaken from field plots , the experimental errorsare often quite large and many real differen cesmay not be reliably established as treatmenteffects; however, if their existence can be rationalized, they may be tentatively accepted».
This difficulty of carrying out a discussionon fertilizer effects on sugar cane yields, usingarguments based on the classical concept ofstatistics, is again illustrated in a recent paper bySTANFORD and AYRES (1964) who present aninteresting discussion on the 'internal nitrogenrequirement' of sugar cane without any statisticalassessment of fiducial limits.
There is little difficulty in establishingstatistically the significance of the effect ofnitrogen fertilization on the nitrogenous composition of sugar cane, but it is often difficult todetect differences in yield of less than 5 % bythe usual field trial techniques, and yet commercially, differences of this order are of vitalinterest.
The results of the 'uptake of nitrogen'trial illustrate the difficulty of detecting treatmenteffects on the yield of dry matter, but oncenitrogen composition effects are examined,several significant treatment effects are found .
(e) Dry matter production
Examination of the yields of dry matterobtained in the uptake of nitrogen studies, viz.:no nitrogen, 45 kg of nitrogen in a single earlydose, and 45 kg in split doses, showed thatthere were no statistically significant differencesbetween treatments, although at the late harvestdates an increase in yield following nitrogenousfertiJ ization was apparent.
Fig. 12 which presents the dry matteryields of the bulked split and single dose nitrogen treatments, shows the typical logarithmicgrowth pattern associated with a young cropwith a rapidly increasing canopy, or in effectleaf-area index . The most rapid rate of productionof dry matter for this late harvested crop

-53-
o, .... , ... ".'" .
~... -: .. '".
,'- 0,-,,
that in effect thea factor limiting
DATE
--r---o0 .. ~ ~ ... ... ...
:;; ~ 1; -o -o -o .0 -o .0 -o-o -o
0' Q-r "' -'! .-: m
-
11
12
10
this time is falling off, andL.A.I. of the cane crop isdry matter production.
Fig. 13. Dry matter production/unit area with 45 kgN jacr e.
The wor k of EVANS (1935) implies thatafter the first four months, the weight of greentops /acre is constant, but an increa se in L.A.I. ,and then a decline with the onset of maturity,appear to give a more rational picture.
In th is connection the work of THORNEand WATSON (1955), and THORNE (1962) is ofintere st. These authors found that the leafarea of field crops of winter wheat reaches ama ximum in July, shortly before ear emergence,and subsequently falls rapidly. As the drymatter that fills the grain is all produced byphotosynthesis after ear emergence, there wasthe possibility that yields of grain could beincreased if the decline of leaf area from itsmaximum could be delayed. As senescenceand death of leaves are associated with lossof nitrogen to other parts of the plant, theseauthors studied the effect of applying additionalnitrogen at the time of maximum leaf area, andfound, in fact , that increases in grain yield couldbe obtained.
o
o
o
o
~ ~ ~
~... ~ $ .. 1,-o '<! -o .o .0 -o .o oD
S j '" .. ~ :i .,~ Q
-DATE
2500
30 0 0
500
'"z~Cl:;; 2000
'"e,
g
§ 1500
'"Cl
(;....:I:
~ 10 0 0
~
>-'"a
Fig. 12. Dr y weight of green tops/unit area.Points are mean of 45 kg N split an d singleapplic ations.
o...l----,---r---,---r-r---r-r---r-r----r--,
occurred in the period March-April-May ; thereafter the rate of development fell, and theyield cur ve must become a sigmoid, as indicatedby the broken line, and statiscal analysis ofthe data confirmed this. This inflection ofthe curve which starts at the beginning of Jun e,shows that the rate of accumulation ofdry matter is falling off, but that even so,about one third of the total d ry matter production of this crop was synthesized after this date.
The decline in dry matter production fromJune onwards could be due directly to thereduction in leaf area, or indirectly as a resultof a reduction in assimilation due to a loweringof temperatures and of incident sunlight, or acombination of both.
When the quantity of total dry mattercontained in the green cane top s is plottedagainst time (fig. 13) it is seen that the weight increases rapidly up to the beginning of M ay, andthat thereafter no significant changes can bedetected.
If the weight of green cane top s is takenas an indication of leaf area and therefore ofphotosynthetic potential, much of the declinein the net assimilation rate must be due tothe fact that the L.A .I. of the cane crop at
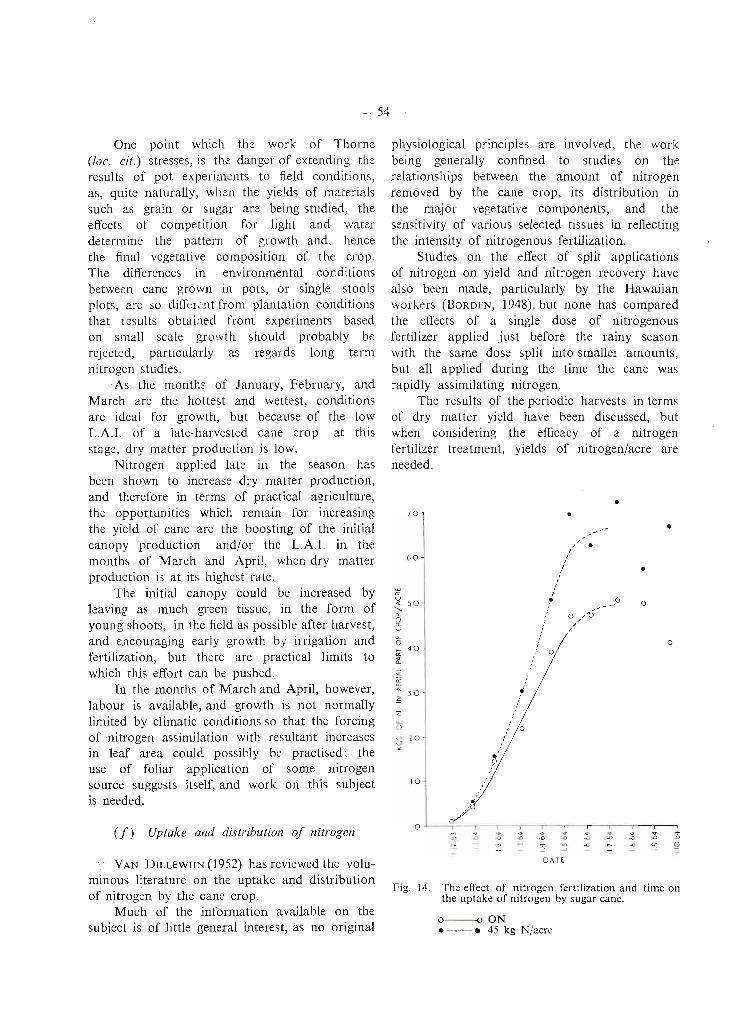
- 54 -
•
physiological pr inciples are invol ved , th e workbeing generally confined to stud ies on therela t ions hips between the amount of nitrogenremoved by the cane crop, its distribution inthe major vegeta t ive components, and thesensitivity of various selected tissues in reflectingthe intensity of nitrogen ous fertilization.
Studies on the effect of split applicationsof nitrogen on yield and nitrogen recovery havealso been made, particularly by the Hawaiianworkers (BORDEN, 1948), but none has comparedthe effects of a single dose of nitrogenousfertilizer applied just before the rainy seasonwith the sa me dose split into smaller amounts,but all a pplied during th e time the cane wasrapidly assimilating nitrogen.
The results of the periodic harvests in termsof dry matter yield ha ve been discussed, butwhen con sidering th e efficacy of a nitrogenfertilizer treatment, yields of nitrogen/acre areneeded.
•
o
•
o
•
o
0/15/
/
o
/ .I
II
",I. /~
7 0
bO
c;V-c SO<,
~neV
0s-, 4 0 -cc<1:~
"~-c
3 0~
z
o20
';
10
One point wh ich th e work of Thorne(loc. cit.) stresses, is th e danger of extending theresults of pot experiments to field conditions,as, quite naturally, when the yields of materialssuch as grain or sugar arc being studied, theeffects of competition for light and waterdetermine the pattern of growth and, hencethe final vegetative composition of the crop.The differences in environ men tal conditionsbetween cane grown in pots, or sin gle stoolsplots, are so different from plantation conditionsthat results obtai ned from exper iments basedon small scale gr owth should probably berejected, particularly as regards long termnitrogen stud ies.
.As the months of January, February, andMarch ar e the hottest and wettest, conditionsare ideal for gr owth, but because of the lowL.A.I. of a late-harvested cane crop at thi sstage, dry matter product ion is low.
Nitrogen applied late in the season hasbeen shown to increase dry matter production,and therefore in terms of practical agriculture,the opportunities whi ch remain for increasingthe yield of cane are the boosting of the initialcanopy production and/or the L.A.I. in themonths of M ar ch and April, when dry matterproduction is at its highest rate.
The initial canopy could be increased byleaving as much gr een tissue, in th e form ofyoungshoots, in th e field as po ssibl e after harvest,and encouraging early growth by irrigation andfertilization,but th ere are practical limits towhich thi s effort can be pu shed.
In the months of March and April, however,labour is available, and growth is not normallylimited by climatic conditions so that the forcingof nitrogen assimilation wit h resultant increasesin leaf area could possibly be practised ; theuse of foliar application of some nitrogensource suggests itself, and work on this subjectis needed.
(f) Uptake and distribution of nitrogen
VAN DILLEWIJN (1952) ha s reviewed the voluminous literature on the uptake and distributionof nitrogen by the cane crop.
Much of th e information available on thesubject is of little general interest, as no original
0 --, I i i I I , I., .,. ., ., .,~ 1
.,-cv , ( I .v -o -D -o .o -D
' "., a:
DA TE
Fig. 14. The effect of nitrogen fertilization and time onthe upt ake of nitrogen by sugar cane.
0-0 ON• -------. 45 kg N/acre

-55-
0 .6 •.
This information, which is given in fig. 14confirms that nitrogen uptake is most rapid inthe first few months of growth; it also demonstrates clearly , however, that the recovery of thefertilizer nitrogen applied increases with time,although even at five months, the last reallyreliable sampling, no more than 20 kg of nitrogenhad been recovered from the 45 kg applied.If nitrification and leaching are active in theearly months of the year, it would seem thatthe fertilizer nitrogen recovered later in theyear must have been stored.
The effect of the split applications was notsignificant in terms of yield of nitrogen, possiblybecause of the very large errors associatedwith this type of harvesting experiment; however,when the various tissues collected were analysedsignificant effects were obtained.
Fig. 15 shows the changes with time ofthe average nit rogen content (% D.M.) of theaerial growth of cane under the three treatments .
... x........... ...... ~ ...... ......• " x <,
o ·0-, , . ...... ......""l"0 " . • <,~ <,
····0. -' .0 '~
• • · . . . .. 0
x
0 I I • i I.. ~ ~ ,1 .. or .. ..,.~ -0 -o -o -o -o -o -o
~ or .., -, -: 0:-
1 5
O . I ~
06l0 51
I04lOllO. 2 ~
Fig. 16. Nitrogen (% D.M.) content of entire aerialgrowth.
The general picture is that the nitrogen contentof the dry matter falls rapidly with time untilthe May harvest, after which date the curvebecomes asymptotic.
The effects of the different treatments arenot noticeable until the May harvest , when thesplit nitrogen treatment leads to a significantlyhigher nitrogen content of the dry matter.
The increase in nit rogen content of thedry matter at the later harvest dates is dueprimarily to the increase in the nitrogen contentof the cane stalk, particularly with the splitdoses, as can be seen from fig. 16.
x
:~ I \.1.0 j09
~ 081
'i O.7lI
.......... ~.................0 .2
Vl~
-';:: 0 .4Vl
wZ<{
UZ
~ 0.3
~05o .
0 .1 --'-- ---,---r--,-----,-----,----,r---,----.
o 0 ON• --. 45 kg. N single dosex x 45 kg. N spl it doses
1/ 3 1/4 lis 1/6 117 I/a l/q 1/10I
1964DATE
Fig. 15. The effect of age and nitrogen treatment onthenitrogen content of cane stalks (N % D .M .)
0 - -0 ON• -------. 45 kg. N single dosex - -x 45 kg. N. split doses
The conclusions to be drawn from thiswork are that small quantities of late appliednitrogen tend to be stored in the cane stalkand are without significant effect on the L.A.I.It would thus seem once more that the mostlikely way of getting nitrogen into the greentissues in the critical first five months is byfoliar application.

-56-
Summary
Field trials have shown that surface-appliedurea is inferior to surface-applied sulphate ofammonia as a nitrogen source for sugar cane.
Burying of urea improves its performanceconsiderably by reduction of volatilization losses.
Burying of sulphate of ammonia alsoimproves its efficacy, even though the soils ofthe experimental sites were slightly acid to acid.
No difference in efficacy could be detected
between sulphate of ammonia and nitrate ofsoda as nitrogen sources.
No improvement in the efficacy of sulphateof ammonia in terms of cane yield or nitrogenuptake followed the use of 2-chloro-6 (trichloromethyl) pyridine.
No beneficial effect of split applications ofnitrogenous fertilizers on cane yields has beendetected.
The problem of improving the efficacy ofnitrogen fertilization is discussed.
REFERENCES
AYRES, A.S. (1955) . Forms of fertiliser material inrelation to efficiency of utilisation. Hawaii. Plrs'Rec. SS : 65-75.
BONAME, P. (1902) . Nitrate de soude et sulphated'ammoniaque. Rep . SIn Agron, Maurice 10 : 38-53.
BORDEN, R.J . (1948). Nitrogen effects upon fields andcomposition of sugar cane. Hawaii . Plrs' Rec. 52 :1-51.
CAREY, T.M. and ROBINSON, P. (1953). The manuring of sugar cane. Emp . J. expt. Agric, 23 :99-115.
DAVIDSON, L.G. (1963) . Sources of nitrogen forsugar cane in Loui siana. Proc. into Soc. Sug . CaneTeehnol. 11 : 87-91.
EVANS, H. (1935) . Investigations on the course ofgrowth in a virgin, or plant crop, of sugar cane.Sug. Cane. Res. SIn Maurit . Bull. 7, pp. 36.
GASSER, J . K.R. and PEACHEY, J .E . (1964) . A noteon the effects of some soil sterilants on the mineralisation and nitrification of soil nitrogen. J. Sei . FdAgric, IS : 142-146.
GORING, C.A .I. (1962) . Control of nitrification by2-chloro-6(trichloromethyl) pyridine. Soil Sci. 93 :211-218.
HODNETT, G.E. (1956) . The responses of sugar caneto fertilisers. Emp . J. expo Agrie .24 : 1-19.
PARISH, D.H. (1964) . Chemical fertilisation. Rep .Maurit, SI/g. lnd. Res . Inst. 10 : 53.
STANFORD, G. and AYRES, A.S . (1964). The internalnitrogen requirement of sugar cane. Soil. Sci. 98 :338-344.
THORNE, Gillian N. (1962). Effect of applyingnitrogen to cereals in the spring or at ear emergence.J. agric. Sci., Camb. 58 : 89-96.
THORNE, Gillian N. and WATSON, D. J. (1955).The effect of yield and leaf area of wheat of applying nitrogen as a top dressing in April, or in spraysat ear em ergence. J. agrie. Sei., Camb. 46: 449456.
VAN DILLEWIJN, C. (1952). The botany of sugarcane. Chronica Botanica Co., Waltham, U.S .A.
2. THE PHOSPHORUS STATUS OF MAURITIUS SOILS AS DETERMINEDBY CHEMICAL EXTRACTANTS AND FOLIAR DIAGNOSIS
D. H. PARISH, Y. WONG YOU CHEONG, & L. ROSS
The most important factor limiting plantgrowth in Mauritian soils ten years ago wasphosphorus deficiency; since then , with liberalphosphate fertilisation, the soil reserves havebeen built up and the phosphate status is nowgenerally good.
The use of soil analysis for forecasting
phosphate fertilisation needs has been usedwidely in Hawaii, South Africa, and Australia.The most common extractant used is dilutesulphuric acid of various strengths, but manyalternative extractants are also used. A recentF.A.O. study showed that the most popularextractant is Olsen's sodium bicarbonate solution.

-57-
As the' various extractants remove differentchemical forms of phosph ate, the distributionof phosphate in local soil s was studied, andvarious extractants were compared.
The standard extractant used in Mauritiusis the modified T ruog which has given verygood result s in forecasting so ils in which ph osphate limits the growth of the plant crop . Theproblem of dec iding ph osph ate fertilizer needsfor the rat oon cro p has not been considered ,as fol iar d iagnosis is completely adequa te; itstill rema ins, howe ver , of interest to studythe problems of ph osphate nutrition of rat ooncrops.
The phosphorus sta tus of the M au rit iansugar cane crop is followed by foliar diagnosisof can es from Perman ent Sa mpling Uni ts.To avoid any fluctu at ions due to other condition sthree-year mean s of twice-yearl y leaf samplingsar e tak en as far as possible. The leaf P levelsha ve been corre la ted with ava ilable phosphorusas determined by soil ana lysis for these samplingun its.
Experimental
About 450 soil sa mples, covering a widerange of neutral and acidic lat osol ic soils andlat osols , with a few alkaline soils, were analysedfor available phosphorus using the following
extractants 0.02 N HzOS4 + 3 g (NH4)z S04(TRUOG, as modified by P EECH, 1944, andAYRES, 1952), 0.5 M NaHCOJ (OLSEN, 1954)0.03 N NH4F in 0.025 N ncl (BRAY'S No . I, 1945)and 0.1 N NaOH (SAUNDER, 1956).
Correlation coefficien ts were calculated fortho se soils considered to be deficient by thelevels of available P (Truog) and between thedifferent extractants and the foliar P levels(Tables 13 and 14).
Leaf P was determined colorimetrically afterdr y ash ing according to the molybdo-vanadatemethod, corrections being made for the age andthe variety of the canes. Leaf samples weretaken at the boom stage of vegetative growthaccor ding to the method now currently in usein Mauritius, and the data used were themean of at least two years' samplings.
For the comparison between the differentextractants, all the soils were grouped together,but for the comparison between the extractantsand foliar diagnosis, each soil group wasconsidered on its own.
Results
Table 13 shows that there is correlationbetwe en all the extractants, but the highestcorrelation is obtained between the mild extractants.
Table 13. Correlation of the phosphorus removed Table 14. Correlation of foliar levels of P with Pby different extractants removed by different extractants
Correlation coefficie nts Correlation coefficients
Olsen Bray 's Saunder Typ e of Truog Olsen Bray 's SaunderNo . I So il No. 1
Deficient LatosolicZonal Soils T ruo g 0.691*** 0.379*** 0.221* Reddi sh
Deficient Zon al Fo liar Pr air ie N.S. N.S. 0.358* 0.519**& Intrazonal D iagnosis P
Soils T ru og 0.448** * 0.4 51* " 0.273** La toso licSaunder 0.339* * 0.462** BrownBray 0.309* * Forest 0.495* * 0.893** 0.435* * 0.469**
Low HumicLat osol N.S . N. S. N.S . 0.524* *
***
**
Significant a t 0.1% level
1%5% "
N.S. Not significant

-58-
Of the Iatosols, only the Low Humic Latosolsgive any significant correlation between foliarlevels of P and soil P (Saunder); no correlationis obtained for the Humic Latosols and theHumic Ferruginous Latosols.
The correlation coefficient for the LatosolicReddish Prairie Soils between foliar P andTruog and Olsen , although not significant,
however approaches significance at 5 % probability level.
Discussion
A typical CHANG and JACKSON (1957)fractionation of representative soils fromthe soil families of Mauritius IS given In
Table 15.
Table 15. Fractionation of Mauritius Soil Families'
p.p.m. P
Loose Al-P Fe-P Ca-P Reductant Occluded Occluded Al-Pbound P soluble P Al-P and Fe-P
Latosolic Reddish Prairie ... 0 36 275 62 380 20 16
Latosolic Brown Forest 0 16 158 21 411 4 12
Low Humic Lato sol 0 12 161 26 220 12 27
Humi c Ferruginous Latosol 0 62 160 25 208 13 20
* Chang and Jackson method.
As the soils get older and the degree oflaterisation increases, there is a shift of phosphorus from calcium phosphate towards aluminium phosphate and iron phosphate. In latosols,added phosphate is held in the form of ironphosphate (CHANG and CHU, 1961) and asTable 15 shows , it may represent over70 % of available phosphorus in Mauritianlatosols.
There would be decreasing correlationbetween Truog and the other extractants as thestrength of these extractants increases; Bray'sNo . I and Saunder, which are selective forAI-P and Fe-P, would extract more of thesefractions and would reflect the quantity orcapacity factor of the phosphorus status of thesoils, whereas Truog and Olsen would be morerelated to the intensity factor (easily availablephosphate).
This is in fact borne out by the results.The correlation between Truog (range 0-20ppm P)and Olsen is highly significant (r = 0.691***,0.1 % probability level); that between Truog andBray is smaller (r = 0.379***, 0.1 % level)although stilJ highly significant, whereas between
Truog and Saunder, the significance is only at5 % level. Essentially the same results areobtained for a greater range of Truog values(0-40 ppm P).
Sugar cane has a long growing season.WILLlAMS and KNIGHT (1963) stated that forcrops with long growing seasons, quantitymeasurements were of more significance thanintensity measurements. The correlation ccefficient between soil analysis and crop figures didnot exceed 0.70 even for the carefully controlledpot experiments.
SUSUKI et al. (1963) found that a testwhich gave a measure of aluminium phosphatewas a better indicator of long-term availabilityof soil phosphorus, whilst Truog only gave ameasure of immediate availability. Thi s wouldhold true for a test for Fe-P, as this is by farthe most important fraction in latosols.
Therefore, the extractants that would beexpected to give any correlation at all betweensoil analysis and leaf phosphorus (an indicationof long-term phosphorus availability) would bethose that reflect the quantity factor, i.e.Saunder.

-59-
In fact, only Saunder gave a correlation(at 1% level) with leaf analysis on latosolicsoils and Low Humic Latosols.
No correlation was obtained on HumicLatosols and Humic Ferruginous Latosols. Thisfact is not surprising. A correlation betweensoil analysis and plant analysis can only beobtained at low leaf levels. However, thelatosols of the humid zones have the bestphosphorus status of the soils of Mauritius;the leaf levels are near the optimum and tend tolie between 0.200 and 0.210 (P % dry matter)whereas the Saunder soil values show muchgreater variation.
On Mauritius latosols, Saunder values above
300 p.p.m. P seem to indicate adequate phosphorus nutrition.
Summary
Various phosphorus extractants have -beencompared : Truog, Olsen, Bray's no. 1 andSaunder's extractants are all correlated.
Distribution of phosphate in Mauritius soilsshows that Fe and Al phosphates are thedominant forms .
Saunder's extractant correlates with foliardiagnosis of sugar cane, showing that aluminiumand iron phosphates are active sources ofphosphorus for ratoon crops.
REFERENCES
AY RES, A.S. and HAGIHARA, H .H. (1952). Availablephosphorus in Haw aiian soil profiles . Hawaii.Plrs' Rec. 54 : 8J-99 .
BRAY, R.B . and KURTZ, L.T . (1945). Determinationof total , organ ic and available forms of phosphorusin soils . Soil Sci . 59 : 39-45.
CJlANG, S.c. and CHU, W.K. (1961). Fate of solublephosp hate appli ed to soils. J. Soil Sci. 12: 286-293.
CHANG, S.c. and IACKSON, M.L. (1957). Fractionation of soil phosphorus. Soil Sei. 84 : 133-144.
OLSEN, S.R., COLE, C.V., WATANABE, F., andDEAN, L.A. (1954). U.S.D.A. Circular 939.
PEECH, M., ALEXANDER, L.T., DEAN, L.A. andREED, I.F . (1947). Methods of soil analysis forso il fertil ity investigations . U.S.D .A. Circular 757.
SAUNDER, D.H. (1956). Determination of availablephosphorus in tropical soils by extraction withsodium hydroxide. Soil Sci . 82: 457-463.
SUSUK1, A., LAWTON, K. and DOLL, E.C. (1963).Phosphorus uptake and soil as related to forms ofphosphorus in some Michigan soils . Proe. Soil Sei.Soc. Am. 27: 401-403.
WILLIAMS, E.G . and KNIGHT, A.H . (1963». Evaluation of so il phosphate status by pot experiments,conventional extrac tion methods, and labile phosphatevalues estimated with the aid of phosphorus-32.J. Sri. Fd Agric. 14 : 555-563.
3. INTERSTALK MOVEMENT OF PHOSPHATE IN SUGAR CANE BYMEANS OF RADIO-ACTIVE PHOSPHORUS
Y. WONG YOU CHEONG & C. L. FJGON
The method of application of phosphate tothe soil is important, but in a steeling crop likethe sugar cane , it is equally important to knowif interstalk movement of phosphate is possible.In principle, if there is interstalk movement,a single root may feed the whole stool inphosphate.
SCHROO (1953) stated that soon after stoolingthe stalks become separated, each of them fedby its own root system and without any inter-
communication, whereas BURR (1953) was ofthe opinion that movement occurred between allparts of a sugar cane stool. Later work carriedout at H.S .P.A Experiment Station in 1956 confirmed Burr's findings .
Whilst it is relatively easy to ascertainwhether there is any physical connectionbetween the stalks, the use of a radiotracer andautoradiographs will afford definite proof ofactual movement between the stalks,

-60-
Experimental
A small hole about 2 mm . deep was boredin an internode about half-way up the stalk.One end of a wetted wick 5 cm . long waspushed into the hole , ensuring close contact,while the other end dipped into a small glassvial containing 251lc p32 in I ml. of water.
After a week, the stool was carefully dugup and those stalks with no obvious connectionswith the injected cane, discarded. Radioactivity was determined by a portable raterneter ;plane sections were made and left in contactwith no-screen X-ray films (Kodirex) in a deepfreeze chamber for a fortnight.
Results
Movement of radio-active phosphorus within
the injected cane was very rapid. Phosphorusaccumulated mainly at the nodes, in the youngrneristernatic tissues, in the veins and in thebuds (PI. II).
Although there was translocation of p 32 toother mature stalks, this movement was morepronounced in the case of suckers, speciallyto the leaf tips and the roots. This fact is ofagronomic importance because «babas» whichhave been feeding off the mother stalk thusreceive an early start in phosphorus nutritioncompared to cuttings whose root systems are notyet sufficiently well developed.
Our work has shown that there is interstalkmovement even between mature stalks eachwith its own root system, but in some cases the"bridges" rot away and the stalks becomeindependent of each other.
REFERENCES
BURR, G. 0. (1953). Basic problems of sugar canenutrition. 1. Absorption and distribution of taggedelements by sugar cane. Proc. int. Soc. Sug, CaneTechnol. 8: 45-51.
H.S .P.A. Expt. Station Committee (1956). Rep. Hawaiian SI/g. Plrs' Ass . Exp. SIn, 1956: 13.
SCHROO, H. (1953). The fertility of sugar cane soilswith special regard to phosphate. Proc. int, Soc.Sug: Cane Technol. 8: 116-124.
4. TRACE-ELEMENT STATUS OF SUGAR CANE IN MAURITIUS
D . H. PARISH, E. C. VIGNES, C. CAVALOT & M. ABEL
Although certain trace element deficiencieswere known to exist on sugar cane in Mauritius,they were associated only with peculiar sites,such as soils with very high pH, or cold,waterlogged conditions; on the zonal or intrazonal soils no deficiencies had been recorded.
Experiments with maize and cauliflowerhave shown that large areas exist with lowreserves of zinc , copper and molybdenum,and it was thought worthwhile to study thezinc , copper and molybdenum status of canefrom typical areas of Mauritius.
Accordingly, ten confounded randomizedblock trials were laid down in 1963 to studythe nutritional status of cane in copper, zinc ,and molybdenum, and the effects, if any, of
soil treatment with these trace elements oncane yields .
Zinc was determined by the method ofWESTOO (1963), and copper as given in TheAnalyst (1963). Molybdenum was determinedfollowing dry ashing of the plant material by amodified thiocyanate stannous chloride method(BARSHAD, 1949).
The results of the trace element analysescarried out are given in Table 16. The Cucontent of the T.V.D. leaf laminae of canegrown in areas typical of Mauritian cane landis about 8 p.p.m. on a dry matter basis, whichis higher than the accepted minimum level of< 5 p.p.m .; the · Zn levels are on the average15 ppm, and the critical level for cane is accepted

-61-
Table 16. Trac e Element levels (p.p.m. D.M.) of Cu. Zn &Mo in cane T.Y.D. leaf laminae at boom stage of vegeta-tive growth.
No. Site Soil Group Cu. Zn. Mo.
23/63 Sans Souci I-I .F.L. 8 15 0.05
24/63 Metheline I-I .F.L. 8 14 0.05
25/63 N ew Grove L.B.F. 8 15 0.06
27/63 Benares L.I-I.L. (pH 6.5) 8 19 0.03
28/63 Bonne Mere L.H .L. (pH 5.2) 7 12 0.03
29/63 Mon Desert H.L. 7 13 0.10
30/63 Beau Songe L.H .L. (pI-I 7+) 6 14 0.11
31/63 So litude L.H.L. (pH 7+) 7 14 0.17
as < 10 p.p.m. These results imply that Cu orZn deficiencies are unlik ely to be limit ing yieldson the normal soil of Mauritius, although theactual levels occurring do imply that soilreserves are not high; a careful watch of thecopper and zinc status of sugar cane, particularlyin areas of high pH must therefore be initiated.
Yield increases in this series of trials werenegati ve, so far as effects of Cu and Zn wereconcerned.
The molybdenum levels of the foliage ofsugar cane are extremely low, and obviouslythe analytical difficulti es in determining accurately such low levels a re great.
The critical level for molybdenum in theT.V.D. leaf lamina of sugar cane is accepted to
be less than 0.05 p.p.m., so the acid LowHumic Latosols of site 27/63 Benares and28/63 Bonne Mere may be genuinely deficient.
Yield results gave no effect of molybdenumtreatment at Benares, but the 1965 harvestresults given in Table 17 gave a significantrespons e (5 % level) at Bonne Mere to themolybdemum treatment.
Table 17. Effect of trace elements treatments on caneyields at Bonne M ere , 1965 harvest (1st Ratoons)
Yield S%Treatm ent T.C.A . Cane
O. Control 33.4 13.7
I. Cu (25 kg Copper Sulphate/arp.) 36.2 13.4
2. Zn (25 kg Zinc Sulphate/arp.) 35.3 13.5
3. Mo (5 kg Sodium Molybd at e/arp.) 40.8 13.8
+ 3 ClI Mo 41.4 13.9
+ 2 ClI Zn 36.4 13.2
2 + 3 Mo Zn 37.0 13.7
+ 2 + 3 Cu Zn Mo ... 39.5 14.0
Sucrose % cane was not significantlyaffected. The acid Low Humic Lato sols, beinghighly manganiferous, give cane with very highmanganese levels, and therefore , the possibilityof a molybdenum deficiency induced by manganese antagonism must be considered, andfurther work on this line becomes essential.
REFERENCES
SOCIETY FOR ANALYTICAL CHE M IST RY (1963).The det ermination of small amo unts of Cu in organ icmatter. Analyst , Land. 88: 253-258.
FEILLA F E, S.M . (1954). Prel iminar y results of limin gsoil s of the super-humid zone . Rep. Maurit . S ug.Ind. Res. Inst. 1: 33-37.
BARSHAD , E. (1949). Mo determinati on in plantmater ial. Analyt . Chem. 21 : 1148 PARISH, D .H . (1963). Ch emical fertil izati on : Phosphat e.
Rep. Maurit . Sug. Ind. Res. Insl. 10: 55-65.D'HOTMAN D E VILLTERS, O. (1947) . Sur des
resultat s detudes relatives a la rejuv en ati on de no ssots epuises des regions hurnid es pa r incorporationde poussiere basalt ique . Rev. agric. lle Maurice26 : 160-175.
WESTO O, G. (1963) . A dith izone meth od for determining Zn in organ ic ma terial. Analyst, Lond. 88 : 287291.

-62-
5. YIELD RESPONSES OF SUGAR CANE TO POTASSIUM, CALCIUM,MAGNESIUM, PHOSPHORUS A D SILICON
D . H. PARISH
1. Potassium, Calcium, Magnesium trials
A ser ies of facto rial expe riments with K ,Ca and M g at two levels each, were laid downin 1963.
K was applied at 0 and 200 kg of mu riate/arpent annually, Ca as cora l sand at 0 and 2tons/arpent once only , and Mg as Ep som sa ltat 0 and 100 kg/arpent ann ua lly. Basic ph osphat ic fertil izer was 200 kg of ammoniumph osphate/arpent , and the nitrogen was supp lement ed as a mmoniu m sulpha te to give 45 kgN/arpent annually.
Virgin and 1st ra toon harvests were takenand the yield results arc given in Table 18.
Shea th sa mples collected In 1965 werean alysed for Ca and Mn, and the mean resultsof the 0 Ca and +Ca treatments ar e given at thefoot of Table 18.
As can be seen, yield data were extremelyvariable; significant yield responses were ob ta inedonly fro m the potassium treatments. T heanalytical data show, however , that even aslittl e as two tons of coarse cora l sand/arpen t,when mixed with the soil, can increase sheathcalcium and lower sheath manganese levelssignificantly, thus dem onstrating the sensi tivityof sheath composition to slight changes in so ilacid ity.
Table 18. The effect of potassium, calcium, magnesium , and their interact ion on yields of cane
Virgins T.C.A. 1st Ratoons T. C.A.Site Si te
3 4 5 6 7 3 4 5 6 7
Co ntrol 28.6 25.5 33.2 12.2 13.8 31.7 25.3 36.5K 35.2 22.4 32.9 16.8 16.8 38.2 30.3 40.0K Ca 33.7 26.0 36.4 15.6 14.0 39.8 27. 9 37.8K Mg 35.1 26.8 29.3 16.6 12.6 40.4 33.7 39.9K Ca Mg 35.5 21.9 32.8 16.2 16.9 38.7 31.1 37.3Ca 32.6 20.2 32.1 14.3 16.8 34.6 24.5 36.7Ca Mg 31.3 25.1 30.5 12.0 16.0 33.7 23.1 35.7Mg 34. 1 20.2 28.2 13.4 16.9 34. 7 23.5 26.3
Ca% D.M . & Mn p.p.m (i ll brake ts; of leaf sheathsS ite
Treatment
o Ca+Ca
3
0.179(120)O. I93(105)
4
0.218(66)0. 220(49)
5
0.210(125)0.232(92)
6
0. 171(145)0.19 3(126)
7
0.153(94)0.165(86)
Table 19. Effect of phosphate and cora l sa nd applied at planting 011 the yields, and calciumand manganese sta tus of 3rd ratoon can e
T.C.A. Ca% M n p.p.m .
S ite Site S ite
Treatment 13/61 15/61 17/6 1 13/61 15/61 17/61 13/6 1 15/61 17/61
1. G ua no ph osp. 38.2 32.2 38.4 0.122 0.156 0.148 133 116 892. Ammoniu m
ph osp . 38.1 32.7 37.9 0.116 0.139 0.144 182 138 933. 1 + Sand 40.5* 36.2 37.4 0. 134 0.164 0.16 2 138 102 714. 2 + Sand 42 .4 ** 35.0 41.3 0.144 0.167 0.175 169 109 765. Contro l 35.6 33.8 39.1 0. 109 0.122 0.164 160 138 107
* Treatment effec ts sig nificant a t 5 % level** at I % level
-63·-
2. Phosphorus and Calcium trials
In 1961 a series of 6 X 6 latin squares werelaid down, in which guano-phosphate (localrock phosphate) and ammonium phosphate,used at 125 kg P20S/acre, were compared withand without coral sand applied at a rate of3 tons/acre .
In the first year, there was a strong responseto the phosphate treatment, particularly theammonium phosphate treatment (PARISH, 1963)but in the first ratoon crop, no treatment effectswere apparent ; in second ratoons, there was aslight, though still non-significant, response tosand + phosphate, whilst in the third ratoonsharvested in 1965, an effect of sand applicationin the pr esence of phosphate became apparent.
Results of the yields (TCA) and of thedried sheath analyses for Ca % and manganesep.p.m., are given in Table 19. Although yieldswere only significantly increased at one site ,in all cases the calcium content of the sheathswas markedly increased, whilst the manganeselevels tended to fall with the sand treatment.
Yields of canes, when the results of thethree trials were bulked, were significantlyhigher (5 %) in the coral sand plus phosphatetreatments, than in the straight phosphatetreatments.
The soil at site 13/61 was a Humic Ferruginous Latosol, whilst the other two sites wereLatosolic Brown Forest soils . The soil pHs atsite 13/61 were in water 4.9 and 5.3, and inKCl 4.4 and 4.9 without sand and with sand,respectively.
FEILLAFE (1955) had already demons-trated that yield responses to applications oflime at 2 tons/acre occur on the LatosolicBrown Forest soils, but the results presentedhere are the first to demonstrate a yield response to low levels of liming in a Humic Ferruginous Latosol ; D'HoTMAN (1947) showed that
massive doses of coral sand (15 tons/acre)increased cane yields on the Humic FerruginousLatosols. It can be concluded, therefore, thatall the highly leached soils of Mauritius arelimiting plant growth, probably by a combination of low calcium status, high availablemanganese, and low silica contents.
Current recommendations are to addcoarse coral sand at 3-5 tons/acre to bring thepH, in water , of the Humic Ferruginous Latosolsabove 5.3, and the Latosolic Brown Forestsabove 5.5.
3. Siliceous amendments
Field trials in which the effect on yields ofbasalt dust, factory ash, and sodium silicate werestudied, have proved disappointing in that nosignificant treatment effects have been recorded.
This point draws attention to the difficultyof carrying out field experiments in the superhumid zone where climatic conditions for canegrowth are often marginal, particularly with thecyclones of 1960, 1962, 1964, and the smallbut late cyclone of 1965 aggravating the wholeproblem.
Many experiments on the use of calcareousand siliceous amendments are now underway,which, it is hoped, will pin-point accurately thereasons for the increase in yields of cane,However, the principal point to remember whenthe results of these trials are considered is thatwork of this nature must be concerned with longterm effects; therefore, experiments must runfor at least three years.
Laboratory and pot experiments on theinter-relationships between P, Si, Mn, Fe and AIhave been initiated in the belief that this workwill give more rapid results than the laboriousone of long-term field experimentation underwhat, in the last few years at any rate, canbe considered as very adverse conditions.
REFERENCES
PARISH, D .H . (1964). Chemical fertilisation. Rep.Maurit . Sug: Ind. Res. Inst. 10: 60.
FEILLAFE, S.M . (1955). Prelimin ary results of limingsoils of the super-humid zone . Rep . Maurit . Sug.lnd . Res. Inst. 1 : 33-37
D'HOTMAN de VILLIERS, O. (1947). Sur des resultatsd 'etudes relatives a la rejuvenation de nos solsepuises des regions humides par incorporation depoussiere basaltique. Rev. agric. lie Mal/rice 26:160-175.

-64-
6. PRELIMINARY NOTES ON LEACIllNG OF NITROGEN IN LYSIMETER STUDIES
D. H. PARISH & M. HARDY
Though the leaching of nitrogen from bareMauritius soils has been studied by PARISH,FIGON and Ross (1962), a study of this nutrientmovement in soils with a cover of sugar canewould yield a more accurate picture for practicalpurposes. Changes in soil flora, soil atmosphere,rate of nitrification, drainage and root effects,among other factors, may alter the rate ofleaching of nitrogen.
Experimental
In Research project 33(5) started in 1963three soil types are studied in 6 lysimeters asfollows:
(a) Lysimeters I, Ill, V : "free" soils fromPalmyre (Low Humic Latosol of the "Richelieu" family). In lysimeter I, however, therocks were replaced in the same position asfound in the soil profile during digging(29 % rocks by volume).(b) Lysimeter 11. : "gravelly" soil from Palmyre (Latosolic Reddish Prairie of the "Medine" family).(c) Lysimeter IV and VI: free soils fromSavannah (Low Humic Latosol of the "Reduit " family).Rain water, irrigation water, and leachates
were analysed for nitrogen and the totals workedout for the crop. The nitrogen was added assulphate of ammonia.
Changes in soil nitrogen or nitrogen removedby the crop were not taken into consideration.
Results
Table 20. gives the amounts of nitrogenadded to the soil and removed from it. Fig.] 7shows the total nitrate leached with time.
Leaching losses of nitrogen from lysimetersI and 11 are high, owing to the rocky andgravelly nature of the soil. On "free" soils, theleaching losses are much smaller and are oflittle importance, thus implying a fairly high
efficacy of nitrogen III these dry areas if lossesby other means are ignored. The soils areslightly acid to neutral; therefore, losses byvolatilization of ammonia occur mainly bywetting and drying and are probably small.
From fig. ]7, it may be seen that the leaching of nitrate has not reached a maximum aftereleven months and seems to be proceeding atmuch the same rate as before. PARISH et at(loc. cit.), however had obtained complete
35
I I
II
8:I:U~ 2C 1
·f · i )-I ~
Q
:0
Fig. 17. Cumulative leaching of N in lysimiters I to VI,1965.

-65-
Table 20. Percentage of N leached in each Iysimeter by 1965 crop
NO-; + NO; N in grams
Lysimeters I IT III IV V VI
Fertilizers 63.0 63.0 63.0 63.0 63.0 63.0Irri gation 12.9 14.9 10.9 11.6 13.9 12.6Rain 2.1 2.1 2.1 2.1 2.1 2.1Tot al N added 78.0 80.0 76.0 76.7 79.0 77.7Total N leached 30.5 16.8 4.6 3.1 3.1 2.0
% N leached 39.0 21.0 6.0 4.0 3.9 2.6
nitrification of ammonium sulphate and leachingof nitrate from a bare soil profile after threemonths ; they concluded that losses of ni trate byleaching on a practical scale could possibly beunimportant.
The high figure s of nitrogen content ofirrigation water are explained by the fact thatthe water has previously been used to irrigatesugar cane in other fields, thereby leaching awaythe fertilizer nitrogen in the furrows.
REFERENCE
PARISH, D.H., FIGON, c.i., and ROSS , L.P . (1962).A field stud y of the nitrification rate of ammonium
sulpha te and the subsequent loss of nitrate. Rep.Maurit . SI/g . Ind. Res. Insl.9 : 48-55.
7. NOTES ON THE CHEMICAL COMPOSITION OF RAIN AND IRRIGATION WATER
MICHEL HARDY
In 1963, Research Project 33(5) was implemented by the M.S.I.R.I . to study evapotransp iration of sugar cane, and a secondary aim of theproject was to determine the nutrition balanceof sugar cane plants growing in each Iysimeter.The amount and quality of water , both rainand irrigation, were therefore carefully controlled.Some of the result s obtained are presented inthis note.
Rain Water
Summer rains are richer in N-content thanwinter rains as shown in Table 21. Of the 25inches rainfall registered in 1964-65, 8.98 inchesfell in winter (May to October) bringing 0.496kg. N to the soil, while 16.33 inches fell insummer (November to April) and brought2.358 kg. N. The total N thus supplied to thesoil per arpent for that particular year amountedto 2.854 kg., or the equivalent of 14 kg. ammo-
nium sulphate, and although important from anexperimental angle, this amount is not expectedto influence cane growth to a marked extent.
The amount of solutes contained in rainwater may be high in a maritime climatewhere winds blowing from over the ocean bringsea spray in contact with rain. This appliesmore particularly to chlorides, as may be seenfrom Table 22 which gives the results ofchemical analysis carried out on samples collectedin 1964 and 1965.
Irrigation water
Irrigation water is of varying composition.This is not only due to its origin, but also towhether or not leachates from tail ditches arereturned to the main or distributing canal.Table 23 shows the results of 12 analysesmade on samples collected at each irr igationin 1964-65.

Period
May 19th to June 6thJune 7th to August 1stAugust 2nd to September 1stSeptember 2nd to October 4thOctober 5th to October 27th
Winter totals & mean
October 28th to November 11thNovember 12th to November 29thNovember 30th to December 15thDecember 16th to January 5thJanuary 6th to March 23rdMarch 24th to April 7thApril 8th to May 18th
Summer totals & mean
Year totals & mean
-66-
Table 21. N content of rain water
Amount of rain N02'+N03-Ninches p.p.m.
0.37 0.62.09 0.82.32 0.43.82 0.50.38 0.6
8.98 0.6
0.10 1.51.13 1.20.39 1.91.22 2.05.31 1.06.27 1.81.91 1.2
16.33 1.4
25.31 1.1
TOlal N receivedKg. per arpent
0.0220.1670.0930.1910.023
0.496
0.0150.1360.0740.2440.5311.1290.229
2.358
2.854
Table 22. Cl, S04'] & K content of rain water
Period Amount of rain pH Cl S04 Kinches p.p.m.
May 19th to June 6th 0.37 7.6 21.3 4.0 13.0June 7th to August 1st 2.09 7.5 20.6 4.0 1.8August 2nd to September 1st 2.32 7.9 17.8 2.0 6.3September 2nd to October 4th 3.82 7.8 17.8 2.0 6.0October 5th to October 27th 0.38 7.6 18.8 3.1 2.9October 28th to November 11th 0.10 7.9 32.0 4.0 1.0November 12th to November 29th 1.13 7.9 17.8 1.8 1.5November 30th to December 15th 0.39 7.6 28.4 3.6 4.5December 16th to January 5th 1.22 8.3 24.9 1.8 7.8January 6th to March 23rd 5.31 7.4 14.2 4.1 7.2March 24th to April 7th 6.27 7.2 35.5 4.0 1.0April 8th to May 18th 1.91 7.2 17.8 8.6 6.3
Totals & means 25.31 7.4 22.2 3.6 4.1
Table 23. Results of 12 irrigation water samples analysis expressed in p.p.m,
Samples pH N02'+N03-N K S04 Cl
1 8.6 1.3 2.0 6.3 28.42 8.3 5.8 4.0 20.0 28.43 8.4 1.6 2.0 3.5 29.14 8.5 2.2 3.0 7.0 29.85 8.4 1.6 4.0 7.0 28.46 8.3 1.5 2.0 14.0 29.8789 9.0 1.5 23.6
10 8.4 2.3 5.0 13.0 28.411 7.1 1.2 3.0 8.0 24.712 7.5 0.8 13.0 4.0 20.6
Mean ... 8.2 1.98 6.0 9.2 28.3

- 67 -
Consumptive use of sugar cane for thatparticular year was 59 inches, of which 34 incheswere supplied by rain, or the equivalent of34 X 1051itresJarp. The mean N-content being1.98 p.p.m., the total amount entering thesoil per arpent per year was 34 X 105 X 1.98roughly 6.8 kg ., or more than twice the amountbrought in by rain .
It is a common belief among cane growersthat rainfall is more profitable to cane growththan irrigation, and one of the hypotheses put
forward is that rain water has a high N-contentduring the growth period. This case wasworth studying experimentally, and although itis true that summer rains are richer in N thanwinter rains (1.4 p .p.m. as compared to 0.5)yet, the N-content of irrigation water is stillhigher (1.98 p .p.m.). Other causes mu st besought, therefore, to explain the beneficial effectof rain water as compared to irrigation, one ofwhich is possibly the higher content of oxygenin rain water.
8. THE INTERPRETATION OF THREE YEARS' FOLIAR DIAGNOSISON THE PERMANENT SAMPLING UNITS
PIERRE HALAIS
Arrangements were made, at the end of1962, for the selection of permanent leafsampling units on miJlers' plantations for thecontrol of the nutritional status of the sugarcane crops by means of foliar diagnosis run ona follow-up basis .
The permanant sampling units are regularcane fields, more than 10 arpents in size,which are as representative as possible oflarger sectors of sugar estates, judged for soiltype and climate by specialists of the Instituteand, for cultural and fertilizer treatments , bythe field managers. The selected permanentsampling units do not get special treatmentoutside those in regular use for the sectors ofthe estate to which they beiong.
The work has been carried out through thefollowing stages :
(i) Representative leaf sampling is made,twice every year, on the permanent samplingunits on ratoon crops between the ages of3 to 8 months, during the peak of the growing season (boom stage, the leaf surface areabeing at its maximum), provided favourablemeteorological conditions have prevailed .Special care is taken to remove the midrib ofthe central portion of the leaf before the bladesare dried, on the spot, according to the instructions given by the Institute.
(ii) The two leaf samples are bulked ontheir arrival at the Institute, and the NPKcontents % dry matter ar e determined by meansof standard analytical techniques, free fromsystematic errors.
(iii) Appropriate corrections are made whenthe average age of the two samples differs fromthe standard age of 5 months. The desiredvariety corrections are also made, from previousresults available at the Institute, in order tobring the NPK contents in line with those ofsugar cane in general.
(iv) In order to rule out the dangers ofhasty conclusions, interpretation of the nutritionalstatus is made only when the results of threeyears' analyses are available. Such a precautionwill be permanently observed so as to enabletechnicians to follow the evolution of the nutritional status as time goes on .
The choice of optimum values for NPK,allowing for sound jugdment on the nutritionalstatus observed on the permanent samplingunits, constitutes the key of interpretation offoliar diagnosis. For the carefully standardisedleaf sampling technique op erative in Mauritius,the bulk of information which has graduallyaccumulated on this subject during the last thirtyyears brings out the folIowing optimum levelswhich are now adopted :

-68-
The results obtained, presented in a condensed form, on the last series of field trialswith fertilizers are given below. They refer tothe series Agro '60, comprising ten widelylocated trials conducted in 2nd and 3rd ratoonsin 1963 and 1964 respectively, with six differentcane varieties. The vegetative response is givenin terms of grams of green weight per leafsampled at the peak of the growing season.
It is therefore clearly seen that theoptimum NPK levels adopted agree very wellwith actual results obtained from regular fertilizer trials when properly interpreted. Theagreement between the vegetative and the sugarresponses is worth stressing. It allows for theformulation of the useful rule that a responseof 1 gram per green leaf, collected at the boomstage, corresponds later to a response of 0.33ton of sugar per arpent (0.82 per ha.) for ratooncanes harvested at 12 months.
The following rules have been adopted forthe interpretation of foliar diagnosis collectedon a three-year basis.
(i) The NPK nutritional status is considered to be high when the data obtained forleaf analysis have been higher than the optimumNPK level during three years.
(ii) Similarly, the nutritional status isdeemed to be low when there have been nocases in the three years studied in which foliardiagnosis has been higher than the optimumNPK level.
HighMedium ...Low
Foliar diagnosis of controlplots
Higher than optimumN P K levels
for the 3 yearsfor only 2 yearsfor only 1 year
... for no year
N P K nutritionalstatus
HighDoubtful HighDoubtful Low
Low
From the purely statistical point of view,the two extreme classes, high and low, aresignificant when judging the nutritional status ofsugar cane in commercial plantations.
An attempt has been made for the firsttime to group the results for the 421 permanentsampling units, for which the data for threeyears foliar diagnosis are now available, accordingto the great soil groups (typical) to whichthey belong.
The percentage distribution of the fournutritional classes in each great soil group isshown in Tables 24 to 26.Some interesting points are revealed in the abovecomparisons :
(i) The present nitrogen nutritional statusis often high with Humic Latosols, HumicFerruginous Latosols and Latosolic BrownForest soils; and rather low with Low HumicLatosols and Latosolic Reddish Prairie soils.
(2) The present phosphorus nutritionalstatus is often high with Humic Latosols,Latosolic Brown Forest soils, and HumicFerruginous Latosols; and rather low with LowHumic Latosols and Latosolic Reddish Prairiesoils.
(3) The present potassium status is often veryhigh with Humic Ferruginous Latosols, and highwith Humic Latosols, Low Humic Latosols soils:and sometimes low with Latosolic Brown Forestand Latosolic Reddish Prairie soils.
It should be stressed that the actual nutritional status observed on each permanentsampling unit represents the basis on which
(iii) The nutritional status of permanentsampling units are considered doubtfully high orlow when higher than optimum figures havebeen obtained for two and one year respectively.
Thus the bulk of the data obtained on thesampling units can be grouped for each of thethree major nutrients NPK into one of thefollowing four classes
K
1.301.301.30
+ 0.11- 0.03-+ 0.21+ 0.32+ 0.42-I- 1.06
SlIgarTons
per arpent
P
0.1900.1900.190
Optimum levels ondry maller basis
N
1.951.901.80
VegetativeGreen WI
per leaf(g)
+ 0.3+ 0.3+ 0.4/. 0.7,. 1.3+ 3.2
Response 10 N,P, orK fertilization
d m 1.320.1980.1781.121.851.49
Sugar response to nitrogenfertilization for the
variety
K%p %p %K%N%N%

- 69 -
advice is. given on the best fer tilizer programmeto be adopted for a given sector of the estateconcerned. Nevertheless, better understanding
of the debatable question of the relationshipbetween soil classification and cane nutritionmay be derived from the present study.
Table 24. Nitrogen nutritional status in relation to soil groups (%)
Great Soil Groups High Doub/ful Doubtful Low No. of permanentHigh Low units
Humic Latosols 70 23 7 0 40Humic Ferruginous Latosols 50 35 13 2 46Latosolic Brown Forest 65 16 11 8 62Low Humic Latosols 32 31 24 13 119Latosolic Reddish Prairie . ',' 32 25 27 17 99Other soils 50 24 7 16 55All soils 45 26 18 11 421
Table 25. Phosphorus nutritional status in relation to soil groups ( %)
Great Soil groups High Doubtful Doubtful Low No. ofpermanentHigh Low units
Humic Latosols 66 22 5 7 40Larosolic Brown Forest 52 30 15 3 62Humic Ferruginous Latosols 61 17 20 2 46Low Humic Latosols 23 29 30 18 119Latosolic Reddish Prairie 26 23 22 29 99Other soils 53 33 8 6 55All soils 40 26 20 14 421
Table 26. Potassium nutritional status in relation to soil groups ( %)
Great Soil Groups High Doubtful Doubtful Low No . ofpermanentHigh Low units
Humic Ferruginous Latosols 89 8 3 0 46Humic Latosols 55 32 8 5 40Low Humic Latosols 60 27 8 5 119Latosolic Brown Forest 52 26 16 6 62Latosolic Reddish Prairie 40 33 20 7 99Other soils 38 35 14 13 55All soils 54 28 13 5 421
9. VARIETY CORRECTIONS FOR Si, Ca, Mn LEAF-SHEATH DIAGNOSIS
PIERRE HALAIS
Table 27. Tentative optimum levels 3rd - 6th leaf sheaths
Nevertheless, tentative optimum levels arealready available (Table 27) for Si, Ca and Mnin leaf sheath of ratoon canes, sampled at thesame time and with similar precautions as the3rd leaf blade normally used for foliar diagnosis.
Tissue testing, as the regular means ofstudying the nutritional status of sugar canecrops, has been extended recently to the 3rd-6thleaf sheaths to obtain further information onthe necessity of soil amendments. Our know ledge on the subject, which is being built upgradually, does not attain, at the present time,the precision and usefulness of that derivedfrom foliar analysis dealing with the majoruntrients N, P, and K.
Si02 % d m
above 1.25
Ca % dm
above 0.15
Mn p.p.m.
below 125

-70 -
U se of lim ing a mend men t is indi cated forimprov ing conditions when the Mn con ten texceeds the limit of 125 p .p .m., and when theSi02. con tent is at the same time normal.Such conditions arise only when the acidi tyfac to r is involved. On the other hand, whenthe Si02. con ten t of the leaf shea th is underth e lim it of 1.25 % d.m. , a low level known tooccur in Mauritius on old so ils having undergone a high stage of lat erisat ion , the use ofsilicic amendment s carrying simul taneous ly silicaand lime in an avail abl e form is most probably necessary. Two amendment s are foundlocally in considerable abundance; they a re:
(1) Coral sand which contains over 95 %of calcium carbonate.
(2) Bagasse furnace ash wh ich conta insabout 75 % Si02.
Field trials will be initiated to test thepractical value of both amendments as soon as
cru shing facilitie s for bagasse furnace ash isavaila ble.
F or the time being, a survey of th e Si,Ca and Mn contents of leaf sheaths is beingcarried out on the permanent sampling unitsalready selected for foliar diagnosis.
Experience has shown that accurate interpret ation of cane tissue cannot be made unlessvariety corrections are available. Such correction s already exist for N.P.K. foliar diagnosis.
Opportunity was taken to evaluate thevariety corrections for six commercial varietiesfrom F inal Vari ety Trials (Series '60) whichwere in 4t h ratoon s in 1965.
Since th ere is no variety/location interaction ,dat a in Tables 28 to 30 hav e been arrangedin order to show at a glance the validity of theco rrec tion .
The va riet y correctio n for Si02 and Mnare given as correct ion factors, and th at forCa as simple d ifferences.
Table 28. SiO , % d.m, of 3rd·6th leaf sheaths
Trial No. and Lo cation M 253/48 Eb .50/47 M93/48 Eb. I/37 M202/46 M147/44 Location means
7/60 Ri viere des Creol es 1.80 1.80 1.72 2.52 1.84 1.86 1.9211/60 Beau Bois 1.78 1.73 1.92 2.34 2.20 1.95 1.9912/60 Valett a 2.00 1.87 2.17 2.18 2.17 2.55 2.1610/60 Unite 2.73 3.10 3.26 3.29 3.36 3.24 3.165/60 Benares 4.00 4.14 4.58 4.41 4.20 4.65 4.336/60 & 13/60 si. Antoine 3.52 4.85 4.39 4.71 5.25 5.44 4.7714/60 Mon Desir 4.93 4.95 4.64 4.88 5.63 5.40 5.07
Variety means 2.97 3.21 3.24 3.48 3.52 3.58 3.33Correction f actors 1.12 1.04 1.03 0.96 0.95 0.90
Ta ble 29. Ca % d.m, of 3rd-6th leaf sheaths
Trial No. and Location M 93/48 MI 47/44 M202/46 Eb. I /37 Eb.50 /47 M253/48 Location means
11 /60 Beau Bois 0.110 0.140 0.123 0.130 0.139 0.133 0.1297/60 Riviere des Creoles 0.106 0.137 0.144 0.146 0.124 0.129 0.13114/60 Mo n Desir 0.122 0.106 0.139 0.138 0.147 0.150 0.13410/60 Un ite 0.128 0.156 0.140 0.144 0.158 0.143 0.1455/60 Benares 0.115 0.141 0.139 0.154 0.155 0.167 0.14512/60 Valett a .. . 0.147 0.158 0.156 0.142 0.158 0.172 0.1566/60 & 13/60 St. Antoine 0.145 0.148 0.162 0. 178 0.155 0.181 0.162
Variety means ... 0.125 0.141 0.143 0.147 0.148 0.154 0.143Variety correction + 0.018 + 0.002 0.000 - 0.004 -0.005 -0.011
Table 30. Mn p.p.m, of 3rd·6 th leaf sheaths
Trial No. and Location M 253/48 M147/44 M202/ 46 M 93/48 Eb . I/3 7 Eb .50/47 Location means
14/60 Mon Desir 32 35 42 43 53 63 456/60 & 13/60 St. Antoine 77 64 75 86 95 125 8712/60 Va1etta ... 85 98 83 101 105 127 1005/60 Benares 84 96 116 81 147 132 10911/60 Beau Bois 107 120 115 122 145 132 12310/60 Unite 107 125 116 132 135 186 1347/60 Riviere des Creoles 146 152 147 182 168 213 168
Variety means ... 91 99 99 107 121 140 110Correction factors 1.21 1.11 1.11 1.03 0.91 0.79

Rep. Maurit . Sug, II/d. Res. IlISt. 1965 Plate III
M.147/44 stool inoculated with new strain of Xanthomonas vasculorunt through cut made with acontaminated knife above growing point. Note chlorotic tillers (left) developing from rhizome.

R ep, Ma urit . S ug. Ind. Res. InS!. 1965 Plat e IV
New strain of Xanthomonas albilineans on M.202/4 6, showing (l qfl) typical wilting and incur ved leaves,arid (right) ac ropeta l development of side shoots.


- 72 -
Thus the area of new plantations of M. 147/44established in 1965 on estates repr esent s only4 % of the total area planted, as compared to22 % in 1964. No new plantations have beenestablished with B. 3337 and B. 34104.
Resistance trial s
Immed iately after the outbreak of theepidemic in 1964, measures were adop ted torep lace the susceptible varieties under cult ivation. This necessitat ed the testing of all commercial varieties, as well as prom ising seedlingsduring selection, for their react ion to the newstrain of the pathogen . A large tr ial wasestabli shed with 267 va rieties in a local itywhere the disease was severe. In ocula ted rowsof M.14 7/44, the infect ion cane, flan ked thevarieties under test on one side. Eac h vari etywas represented by a 10 ' row separated fromthe next variety, along a furrow, by 5 I ofM.147/44, which was also inoculat ed. Thefollowing varieties were used as contro ls :
to 1964, the number of suscept ible varietie srecor ded each year was 4, on an average,representing less than 9 % of the total numberthen tested yearly.
Table 31. Reaction of varieties to the new strainof the gumming disease pathogen in resistance trial
Rating " No . of %of··varieties total tested
Resista nt { I 63 23.62 128 48.0
Suscepti ble 3 51 19.1
Highly r 4 14 5.25 3 l.lSusceptib le l 6 0 0
• Numbers cor respond to the following rat ings :
I = Absence of leaf stripes.2= Few sho rt stri pes on o ld leaves.3= Long stripes old leaves, short stripes young leaves.4 = Heavy striping old a nd young leaves.5= Heavy strip ing and chlorosi s.6 - Death of sta lks.
*. Eight varieties (3 %) were no t given fina l ratingdue to bad germi nation, death of stoo ls or ratdamage.
There were seven replicates of eac h controlin the trial.
The method for inoculating the infectioncane described in the 1964 report proved verypractical and was highly successful. H owever,with the prevailing climatic condit ions du ringthe maturing season, the ratings of var iet ies wereon the low side. Thi s was evident from thebehaviour of M.147/44 which, although showinghigh susceptibility to infection in some of thereplicates as shown by foliar symptoms, gaveonly few cases of systemic infection . Th eprop ortion of susceptible varieties obtained inthe trial is shown in Table 31.
Thu s 25 % of the varieties tested weresusceptible. These included 7 var ieties whichhad shown promise during selection; four ofthem, rat ed as highly susceptible, will have to bediscarded . The other three will be re-testedtogether with other promising varie ties whichhave shown resistance. T he proportio n of susceptible varieties is high co mpared to thatusually obtained in resistance trials before theoccurrence of the new strain. Thus, from 1954
Highly susceptibleModerately resistantHighly resistant
M .147/44M .442/51M . 31/45
Of the 267 varieties III the trial , 145 hadpreviously been tested to the old strai n. Acomparison between the reactions to the oldand new stra ins is presented in Table 32.
Table 32. Comparison of reaction of 145 varietiesto old and new strains of the gumming disease organism
Reaction 10 new strain as No. of %compared 10 old varieties
( Resistant 36 24.8Same reac tion ~
l Susceptible 8 5.5
Slightly more susceptible 24 16.6
More susceptible 47 32.4
Much more susceptible 30 20.7
The results confirm previous evidence thatthe d ifference between the two strains lies invirulence ra ther than in varietal specificity.
T he routi ne testing of varieties coming outof Firs t Select ion Tr ials is being continued, andthis year 42 such varieties were included in twotrials in different local ities in order to test theirreac tion to both old and new stra ins . The tri alwith the old strain is carried out at ReduitExper iment Stat ion where the new stra in is notyet established. T he noble variety 55-1182 isstill used as contaminant for the old strain of

-73-
the bacterium, while B. 34104 has been used toreplace M.147/44 for the new strain, owing tothe tendency of the latter variety to lodge as aresult of its vigour, thus rendering surveysdifficult.
The project of testing seedlings at thePropagation Plot stage had to be abandoned onaccount of the practical difficulties encounteredin running a selection plot for the purpose ofassessing both agronomic performance anddisease reaction at the same time. It has therefore been decided to test for reaction to gummosis in an independent trial run in parallelwith First Selection Trials, the number ofvarieties under test being reduced to a tenth.Such a trial was established during the year with377 varieties coming out of Propagation Plotsto assess their reaction to the new strain of thepathogen.
Studies on systemic infection
Heavy leaf striping in itself does not reflectthe extent of damage caused by the disease,which depends on the number of stalks inwhich systemic infection develops and the degre eof deterioration inside such stalks. Observationshave shown that very few cane s develop systemicinfection in M. 147/44 when the plant is act ivelygrowing, and that such infection tak es placewhen the cool season sets in and growth slowsdown. Similarly, systemic infection is more severein cane s growing under adverse environmentalconditions. Furthermore, flowering stalks havebeen observed to develop systemic infectionmore easily, a result which appears to becorrelated to the reduced infection path in themuch shorter laminae of the uppermost leaves.The severity of the disease in M.147/44 couldbe favoured by a late cyclone, providing idealdissemination of the pathogen , followed by anearly start of the cool season, with low temperatures and dry conditions prevailing, whereby thetolerance of the variety would be lowered, andsufficient time would elapse between the onsetof systemic infection and crop harvest.
One of the characteristic features of thenew strain of the pathogen is th e production ofleaf chlorosis as a result of systemic infect ion.However, it has been observed so far that, in
general , canes which develop leaf chlorosisappear to recover after some time, if subsequentproduction of green leaves is to be tak en as asign of recovery. Attention during the year wastherefore focussed on the sign ificance of thechlorotic symptom, its development and ultimatedisappearance . To that effect, several naturallyinfected fields were kept under observation and,in addition, specific experiments were set upus ing artificial inocula tion.
The preliminary results obtained may besummarized as follow s : all cases of characteristic leaf chlorosis are the result of systemicinfection in the stalk. However, not all cases ofsystemic infection necessarily result in leafchlo rosis . Thus, systemic infection in a field ismore widespread than what would be inferredfrom the number of stools showing leaf chlorosis.
The onset of the reaction leading to theproduction of chlorosis occurs in leaves whichare still enclosed within the spindle, and inwhich chlorophyll has not yet been formed.Thus, for the plant to develop such symptoms,it is essential that, while growth is taking place,there is a certain amount of bacterial activityinside the stalk. Sections through chloroticleaves have revealed that the plastids in the cellsof the bundle sheath are still present, suggesting that chlorosis is due to an interference inthe mechanism of chlorophyll synthesis, probablythrough the agency of to xins produced by thebacterium. The change is irreversible and, onceinduced in the leaf, chlorosis is permanent. Inplants showing partial chlorosis of the leaves, acommon pattern is present : from the olderto the younger leaves, the presence of thechlorotic band gradually passes from th e baseof the lam ina to the upper portion of the blade,to be observed finally at the tip, on the lastleaf showing chlorosis. The factors involved areunder study, and interesting conclusions arebeing derived.
The number of stalks which develop leafchlorosis in mature canes before harvest isrelatively low. Most cases of chlorosis occur inyoung canes after harvest, and are due to inoculation by knives contaminated when cutting stalkswith systemic infection, especially in young shootscut above the growing point. An experimentwas designed to study the extent of such

-74-
infection by knives. Young shoots of M. 147/44were cut above the growing point with a knifedipped in a dilute suspension of the bacterium.For comparison, shoots were also cut in thesame way and inoculated by pouring I c.c. ofthe same bacterial suspension over the cut ends.Each treatment was performed on 2 replicaterows of lOO ft and there were 2 control rowssimilarly cut but not inoculated. The averagenumber of cases of chlorosis wh ich developedin each row is shown in Table 33.
Table 33. Development of chlorosis in young shootsinoculated with knife, compared to inocula
tion with bacterial suspension
Me/hod Average % % No . ofof Inocu- no. ofstools shoots develop- chlorotic
la/ion inocu- dead ing secondarylated jrow chlorosis tillers/row
Knife 186 12.9 48.9 10Bacterial
suspension 212 13.0 27.3 21
Control ... 193 7.0 0 0
Knife inoculation at harvest is an importantway by which stools may develop systemic infection. The bacterium may subsequently developin the rhizome, and secondary tillers producedshow chlorosis (PI. lII).
Two fields of M.147/44 showing leaf chlorosis after harvest were kept under observation inorder to study the rate of disappearance of thechlorotic symptom. In one case - an irrigatedfield in the sub-humid area - several stalks withchlorotic leaves exhibiting different degrees ofchlorosis were tagged and the leaves numbered.The stalks were grouped in three categoriesaccording to the intensity of chlorosis: (i) heavychlorosis, with more than 75 % of the leave saffected; (ii) medium, with 50-75 % of theleaves chlorotic ; and (iii) light, with less than50 %. Even the slightest leaf chlorosis was takenas a positive case . The canes were examined atfortnightly intervals. In 53 % of the cases, theintensity of chlorosis increased and the stalksfinally died, some faster than others, and weresoon replaced in the stools by more rapidlygrowing green tillers. The others gradually losttheir chlorotic appearance through the productionof new green leaves and, on an average,appeared to have recovered completely about
32 weeks after harvest. The percentage of deadand recovered stalks in each category is presented in Table 34.
Table 34. Fate of stalks showing chlorosis asa result of systemic infection by gumming disease
Degree No. Dead Recoveredof observed
chlorosis No. % No. %
Heavy 12 10 83.3 2 16.7
Medium 12 7 58.3 5 41.7Light 8 0 0 8 100
Total 32 17 53.1 15 46.9
It should be noted that usually, stalks whichhave apparently recovered, still harbour thebacterium in gum pockets in the stalk. Thesite of the pockets corresponds more or less tothe internodes where the chlorotic leaves wereoriginally attached. In an experiment to studythe fate of the bacterium in recovered stalks,isolations from the infected tissues of the stem,9 months after the leaves had lost the chloroticsymptoms, showed that the bacterium was st illalive. Thus, such stalks provide an ideal sourceof inoculum for dissemination when the canesare cut, the site of the gum pockets beingusually in the basal portion of the mature stalk.This explains partly why certain fields showabundant chlorosis year after year, while othersnearby, under the same environmental conditions,may not. Furthermore, in young ratoons, caneswith systemic infection can be the starting pointfor a build-up of secondary infection in neighbouring stools. Thus, it has been observed in ayoung ratoon field that stools showing abundantleaf striping were concentrated around chloroticplants.
Growth rate measurements have shown thatstalks with chlorotic leaves, although they mayrecover, grow appreciably more slowly thanhealthy stalks.
The extent of chlorosis in young ratoonfields may at times be considerable, and somestalks may not recover until harvest. In thesecircumstances, it is evident that the diseasemay affect yields. It follows that the systemicinfection of young ratoons by knife inoculationis an important aspect of the disea se towhich due attention should be paid.

-75-
Comparison between old and new strains
There are appreciable differences betweenthe new strain of the pathogen and the old one .In 1964, cultural differences between them werereported; this year, attention has been focussedmainly on differences in their pathogenic activity.Such investigations form part of a general studyon strain variation in X. vasculorum.
Although the new strain of the bacteriumseems to be more infectious than the old one,it would appear, so far, that the extent ofdamage resulting from systemic infection withthe old strain in noble canes and other susceptible varieties cultivated in the past, is moresevere than that caused by the new strain inthe more vigorous hybrids at present undercultivation. Gumming disease on the oldvarieties in the cane collection invariably givesabundant systemic infection which starts wellbefore the beginning of winter. Eventually, asthe cool season sets in, the condition aggravates,
plenty of gum pockets are produced in the stalk,the leaves turn yellow, andwilting occurs, followedby death of the stalk in severe attacks. Wiltinghas never been observed with the new strainin commercial varieties grown at present, butchlorosis develops instead, and this is a symptomessentially produced in a cane which continues togrow despite bacterial activity inside the stalk.The old strain very rarely produces chlorosis innoble canes and, when it does, this is restrictedto new shoots which develop in summer fromthe rhizome of heavily infected stools.
An experiment was designed to comparethe virulence of old and new strains in M.147/44,and to see whether the old strain could causechlorosis in that variety. Young shoots werecut above the growing point and inoculated withbacterial suspensions. Three concentrations wereused for each bacterium, and each treatmentconsisted of two replicate rows of 100'. Inthe control rows, shoots were cut but notinoculated. The results are presented in Table 35.
Table 35. Effect of new and old strain of bacterium inoculated in M. 147/44
Inoculum Dilution" Average no. % % No. ofof shoots shoots developing chloroticinoculated/ dead chlorosis secondary
row tillers/row
I 206 13.1 38.8 28New Strain II 219 13.7 25.7 17
III 212 12.3 26.4 19
I 212 7.8 8.8 0Old Strain II 205 10.3 18.9 0
III 177 11.2 15.5 0
Control 193 7.0 0 0
• Dilutions I, H, HI are in decreasing order of concentration
Comparison between isolates from Reunion,Madagascar and Mauritius
greater physiological activity, and probablyproduces more toxin within the plant.
Attempts were also made to isolate bacteriophages specific to each strain. Isolationsfrom diseased leaves, as well as from soil in theimmediate vicinity of diseased stools, have so farbeen unsuccessful.
Both strains caused chlorosis when inoculated in M.147/44, but the new strain provedto be more virulent, judging from the numberof affected shoots and the intensity of symptoms.With the new strain, systemic infection developedin the rhizome, in several cases, giving rise tochlorotic secondary tillers, a condition which wasnot observed with the old strain. Furthermore,the intensity of leaf chlorosis was much lowerwith the old strain, and all canes with chloroticleaves apparently recovered much more quicklythan those inoculated with the new strain.These results confirm that the new strain has a
Towards thebacterium fromMauritius (both
end of 1964, isolates of theReunion, Madagascar, andstrains) were inoculated in

-76 -
stools of M.147j44 and M .202j46 to comparetheir reaction, in an attempt to ascertain theorigin of the new strain of the organism discovered during that year in Mauritius. Thework was conducted in England, in the glasshouses of the Plant Pathology Department ofthe Imperial College of Science and Technology,with kind permission from the Ministry ofAgriculture of the United Kingdom and theco-operation of the Commonwealth MycologiealInstitute. The assistance and co-operation receivedfrom the authorities concerned are gratefullyacknowledged.
Three stools of each variety, growing in12-inch pots, were inoculated with each strain.The inoculation was performed by pricking" intothe spindle, just below the first visible leaftriangle, with a bunch of needles which hadpreviously been dipped in a concentrated suspension of the bacterium.
The Madagascar, Reunion, and Mauritius(new) strains all gave severe infection with heavy
striping, becoming systemic, and producing smallgum pockets inside the stalks. There weresome qualitative differences between the strains,and M. 147j44 always proved to be moresusceptible than M .202j46. The Mauritius (old)strain was less infective, systemic infectiondeveloping in three cases only, two in M.147j44and one in M.202j46, with few isolated redstreaks running down the stem.
The symptoms produced by the Madagascarstrain were appreciably different from those ofReunion and Mauritius (new). The leaf streakswere deep yellow, with red stripes here and there,and caused a pronounced necrosis at the tip ofleaves. This strain proved slightly more virulentthan the Reunion and Mauritius (new) ones,and the characteristic red stripes it produces werenever encountered with the latter two strains.There was little difference between symptomsproduced by the latter two strains, except thatthe isolate from Mauritius (new strain) appearedslightly more virulent than the Reunion one.
3. LEAF SCALD
The outbreak of leaf scald, probably causedby a new strain of the bacterium, which wasreported last year in M .202j46 and M.147 /44,has been spreading gradually all over the islandwith increasing intensity. On two occasions theacute phase of the disease was observed onM.l47j44 and on a seedling in a multiplicationplot. In both cases, the diseased plants wiltedand died suddenly without showing the characteristic symptoms usually associated with thedisease. Leaf scald proved to be more severein humid and super-humid areas.
Apart from M.202j46 and M.l47j44 whichare susceptible, a few seedlings under selectionwere also found infected. The unreleasedvariety Ebene 88j56, which was showing highpromise and was under observation on a fieldscale on several estates, has shown susceptibility.In several fields, a high level of infection wasobserved, and in one case up to 350 diseasedstools per arpent were detected.
Very little is known about the naturalmethods of transmission of the disease . It ismainly spread by knives at harvest and in the
preparation of cuttings, and also by . infectedcuttings at planting time. Surveys in fields afterharvest have revealed that the characteristic leafsymptoms are found mainly on young shootswhich have been cut above the growing point.It has been recommended that fields of M.202/46should be surveyed after harvest, and diseasedstools rogued to reduce the spread of thedisease at the next harvest. Owing to therelatively low rate of spread of the diseaseby knives, if all necessary steps are taken,infection in M.202j46 can be kept at a lowlevel.
Such recommendations have been followedon several estates, and surveys and rogueingsare carried out regularly in young fields ofM.202j46. Valuable data have thus been obtained on the distribution of the disease, andon the control work generally. On one estate, amaximum incidence of 24 diseased stools perarpent was observed, with an avarage of 2 to 3infected stools per arpent. On another estate,the maximum number of infected stools roguedper arpent was 68, with an average of 5 stools
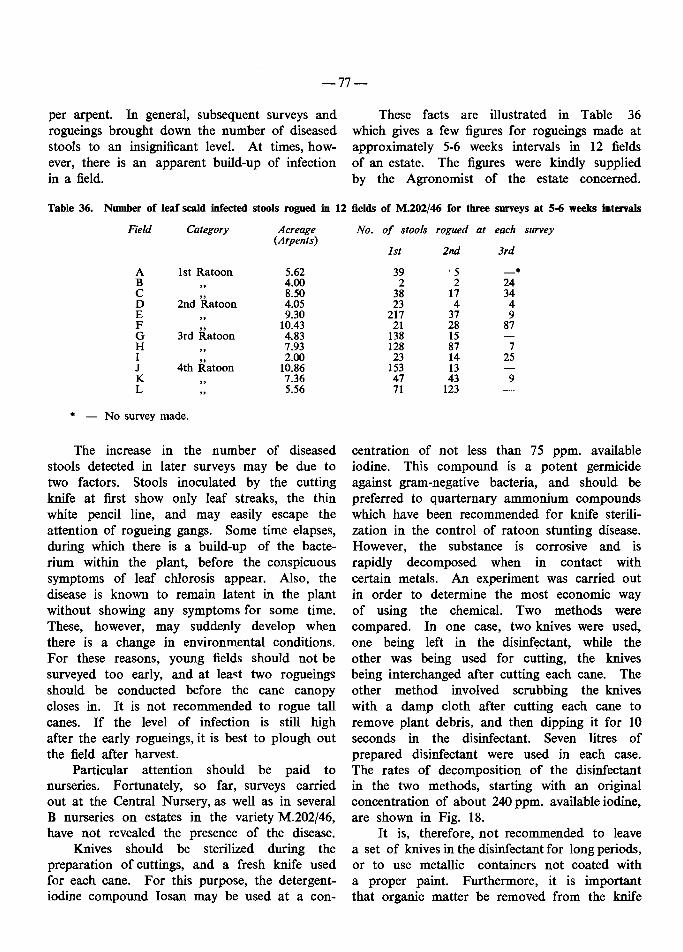
-77-
per arpent. In general, subsequent surveys androgueings brought down the number of diseasedstools to an insignificant level. At times, however, there is an apparent build-up of infectionin a field.
These facts are illustrated in Table 36which gives a few figures for rogueings made atapproximately 5-6 weeks intervals in 12 fieldsof an estate. The figures were kindly suppliedby the Agronomist of the estate concerned.
Table 36. Number of leaf scald infected stools rogued in 12 fields of M.ZOZ/46 for three surveys at S-6 weeks intervals
Field Category Acreage No. of stools rogued at each survey(Arpents)
Ist 2nd 3rd
A 1st Ratoon 5.62 39 '5 •B 4.00 2 2 24C
2nd Ratoon8.50 38 17 34
D 4.05 23 4 4E 9.30 217 37 9F
3rd Ratoon10.43 21 28 87
G 4.83 138 15H 7.93 128 87 7I
4th Ratoon2.00 23 14 25
J 10.86 153 13K 7.36 47 43 9L 5.56 71 123
• No survey made .
The increase in the number of diseasedstools detected in later surveys may be due totwo factors. Stools inoculated by the cuttingknife at first show only leaf streaks, the thinwhite pencil line, and may easily escape theattention of rogueing gangs. Some time elapses,during which there is a build-up of the bacterium within the plant, before the conspicuoussymptoms of leaf chlorosis appear. Also, thedisease is known to remain latent in the plantwithout showing any symptoms for some time.These, however, may suddenly develop whenthere is a change in environmental conditions.For these reasons, young fields should not besurveyed too early, and at least two rogueingsshould be conducted before the cane canopycloses in. It is not recommended to rogue tallcanes. If the level of infection is still highafter the early rogueings, it is best to plough outthe field after harvest.
Particular attention should be paid tonurseries. Fortunately, so far, surveys carriedout at the Central Nursery, as well as in severalB nurseries on estates in the variety M.202/46,have not revealed the presence of the disease.
Knives should be sterilized during thepreparation of cuttings, and a fresh knife usedfor each cane. For this purpose, the detergentiodine compound losan may be used at a con-
centration of not less than 75 ppm. availableiodine. This compound is a potent germicideagainst gram-negative bacteria, and should bepreferred to quarternary ammonium compoundswhich have been recommended for knife sterilization in the control of ratoon stunting disease.However, the substance is corrosive and israpidly decomposed when in contact withcertain metals. An experiment was carried outin order to determine the most economic wayof using the chemical. Two methods werecompared. In one case, two knives were used,one being left in the disinfectant, while theother was being used for cutting, the knivesbeing interchanged after cutting each cane. Theother method involved scrubbing the kniveswith a damp cloth after cutting each cane toremove plant debris, and then dipping it for 10seconds in the disinfectant. Seven litres ofprepared disinfectant were used in each case.The rates of decomposition of the disinfectantin the two methods, starting with an originalconcentration of about 240 ppm. available iodine,are shown in Fig. 18.
It is, therefore, not recommended to leavea set of knives in the disinfectant for long periods,or to use metallic containers not coated witha proper paint. Furthermore, it is importantthat organic matter be removed from the knife

-78 -
surface before sterilization, a recommendationalready made. Starting with an original concentration of approximately 250 ppm. availableiodine, the disinfectant solution should last for anormal day's work , each man being allotted
about 7 litres of solution for preparing 3,500cuttings. Changes in volum e or original concentration can be made if fewer cuttings arc tobe prepared, but any disinfectant left over atthe end of the day's work should be discarded.
240
7
-.b
3320
--- ---- ------ ..-....-
..... .-,-,
-,-,
................ --0_
........
3 4 STIME(HOURS)
1640 2240 2g20N0 OF CUTTINGS PREPA RED
2
-......
1080APPROXIMATE
560
-----e._
220
200
180 -,'E' -,0.. 160 -,6
<.U .z 140 \0
\0120
<.U
\~
CD-c
100 \--l
~.<,
-c 80 <,SOLUTI ON SPE NT
7 5
6 0
40
20
0
Fig. 18. Deteriorat ion of Iosan solution used for disinfecting knives during preparation of cutlings.Brok en line (---): control ; plain line: knife scrubbed, then dipped in disinfectant; brokenline (--) : one knife permanentl y in disinfectant.
4. RATOON STUNTING
The various trials, which had run for severalyears, were concluded in 1964. No experimentswere laid down in 1965, as it was necessary toobt ain results from the gumming disease trialsbefore the selection of promi sing gummosisresistant varieties for inclusion in the R.S.D. trials.
The supply of planting material to estatesfrom the Centra l Nursery amounted to nearly3,000 ton s. Compared to 1964 (3,400 ton s)and 1963 (1,900 tons), and considering the setback caused by the outbreak of gumming diseasewhich led to a reshuffle of the planting pro-

-79-
• Figures in brackets indicate the number offields.
Table 37. Yields of cane obtained with treated anduntreated cuttings in 3rd, 4th, and 5th ratoons on one estate
made between cane yields obtained in fields ofM.147/44 planted with cuttings derived fromnurseries, and with untreated cuttings (Table 37).
The comparison was based on 85 fieldsrepresenting an area of 651 arpents in 3rd,4th, and 5th ratoons. Fields in early ratoonshaving all been planted with material derivedfrom nurseries, no comparisons could be established for that part of the cycle. The averagedifference in cane yield was 9.5 tons per arpentin favour of treated canes.
(Tons/Arpent)
5th
41.9 (4)
31.2 (35)
4th
38.3 (8)
28.6 (12)
Yield in Ratoon
3rd
39.5 (18)·
29.2 (8)
Treated
Untreated
gramme and the loss of planting material fromgummosis-susceptible varieties, a very creditableeffort was made in 1965 by the management ofthe Central Nursery.
Just over 200 tons of cuttings were treatedat the Central Hot-Water Treatment Station toplant 42 arpents of land at the Central Nursery,or 4.8 tons/arpent. Germination of treatedsetts varied from 54% to 96 % with an averageof 62 %. A total of approximately 150 arpentswere under "A" and "B" nurseries for supplyof planting material in 1966.
The increased yields obtained from heattreated planting material had been outlined inthe annual reports of the Institute during thelast years when discussing results of experimentalwork. In 1965, the beneficial effect of usingR.S.D.-free cuttings at planting time was furtherillustrated, this time on a plantation scale onone estate in the south, where comparisons were
5. CHLOROTIC STREAK
As a consequence of the exceptionally wetconditions during the cool season, chlorotic streakwas severe in badly drained areas in the superhumid zone, causing death of young tillers or ofentire stools particularly in the variety Ebene1/37. Thus, the ratoons of highly susceptible canesin such areas may be considerably affected, andit is recommended that in severe cases, fields stillin early ratoon, should be recruited with hot-watertreated cuttings. Although such recruitings mayseem too late for the crop under way, they willserve for the years to come. Heavily infectedfields in higher ratoons should be replanted.
Most of the varieties at present undercultivation in Mauritius are susceptible, orhighly susceptible, to the disease; an exception isM.93/48, a variety adapted to the humid to superhumid zone, which has so far shown moderatesusceptibility. M.442/51 is highly susceptible, butthis variety is recommended for the sub-humidand humid regions where chlorotic streak is lessimportant.
The testing of new or modified hot-watertreatment installations on estates continuedduring the year, and recommendations were
made for improving the efficacy of the curativetreatment.
Studies on disease transmission
Owing to the concentration of efforts onthe problem set up by gumming disease, studieson transmission of chlorotic streak have sloweddown during the year.
In 1964, transmission of the disease wassuccessful when healthy plants were exposed toinfection by growing them in culture solution inwhich diseased plants had previously grown.The search for chytrid fungi in roots of plantswhich had contracted infection continued thisyear. The object of such investigations is toassess the role of such an organism in diseasetransmission, or even as the actual causal agent.
Critical examinations of squashed preparations of roots revealed the frequent occurrence ofa species of the order Chytridiales in the epidermal cells. The fungus (PI. V) is characterized by an unbranched vegetative thallus, witha well-defined. cell wall and numerous globulesin the cytoplasm. There is usually one unit
-80-
per epidermal cell. The sporangia are sausageshaped, and have a conspicuous terminal discharge tube. The occurrence of a resting sporein its life cycle has not yet been observed, andthe organism has not been identified so far.
Preliminary examinations of roots of plantswhich contracted infection in transmission experiments in soil, as well as those of plantsshowing severe infection in the field, have sofar failed to reveal the presence of the chytridfungus.
Concurrently with the experiment on transmission in water culture mentioned above, anddescribed in the 1964 report, another experimentwas performed to study transmission in soilin comparison with that in water culture. Hotwater-treated cuttings and untreated diseasedcuttings of M.442 j51 were grown side by sidein soil in 9-inch pots. One healthy and onediseased plant were established in each pot, andthere were 15 replicates. These were watered
heavily throughout the experiment to provideideal conditions for transmission. The diseasedplants developed abundant symptoms whichpersisted throughout the duration of the experiment which was concluded this year. After 12months, healthy plants contracted the disease in3 plots. The remaining twelve were ratoonedand transplanted to fresh sterilized soil withoutthe diseased plants, after their roots had beenwashed in running water. Three more exhibiteddisease symptoms. This shows that once infection has occurred, there appears to be a build-upof the causal agent inside the plant beforesymptom expression.
The results on transmission in soil and inwater culture brought additional evidence thattransmission in soil is much slower than inwater culture. Thus, in water culture, 82%infection was obtained after only 7 months'exposure, while 40 % infection was obtained insoil after more than 12 months.
6. FUSARIUM STEM ROT OR WILT
Several cases of dying canes , near harvesttime, in fields in the humid and super-humidzones, were investigated during the year. Thedisease manifests itself in patches where thecanes show symptoms which could be attributedto drought effect, nutritional deficiency, attack ofClemora smithi, or root disease. However, grubcounts in such patches were well below thedeleterious level, and the affected canes had anextensive root system. Further investigationsrevealed that the disorder was due to Fusariumstem rot or wilt disease.
Diseased canes show a pronounced yellowing of the leaves which starts in the midrib,and in the later stages, a purple discoloration aswell. Leaves die prematurely in a V-shapedpattern, from the tip pointing down towardsthe midrib. In certain canes, adventitious rootsdevelop profusely on the stem. This symptom,as well as the purple discoloration of the leaves,is most pronounced in the variety M.134 j32.Growth is stopped and the canes die gradually,being invaded finally by Melanconium sacchari.Internally, the diseased stalks arc hollow andpithy at the centre, the condition aggravating in
the later stages; in certain cases, there is a reddiscoloration at the nodes, which sometimesextends in the internodes as well. In the earlystages of infection, however, the interior of thecanes appears healthy, infection being restrictedto the very base of the stalk, near the point ofattachment to a stalk of lower order, wherewind damage has occurred (PI. VI, left & centre).From such diseased tissues at the base of thestalk, the following fungi were isolated:
Fusarium moniliformeFusarium solaniThielaviopsis paradoxaTrichoderma sp.
Cases of Fusarium top rot are numerouson the younger shoots in the diseased patches.The cane stalks are also covered with discolouredspots due to infection by spores of the causalorganism F. moniliforme (PI. VI, right). Suchinfections remain quite superficial, except ifwounds are present or through leaf scars,whereby the internal discoloration already mentioned ensues. By such wind-borne infection byspores, the diseased patches enlarge with timein a field, and in some cases, infection has been

-80-
per epidermal cell. The sporangia are sausageshaped, and have a conspicuous terminal discharge tube. The occurrence of a resting sporein its life cycle has not yet been observed, andthe organism has not been identified so far.
Preliminary examinations of roots of plantswhich contracted infection in transmission experiments in soil, as well as tho se of plantsshowing severe infection in the field, have sofar failed to reveal the presence of the chytridfungus.
Concurrently with the experiment on transmission in water culture mentioned above, anddescribed in the 1964 report, another experimentwas performed to study transmission in soilin comparison with that in water culture. Hotwater-treated cuttings and untreated diseasedcuttings of M.442/51 were grown side by sidein soil in 9-inch pots. One healthy and onediseased plant were established in each pot, andthere were IS replicates. These were watered
heavily throughout the experiment to provideideal conditions for transmission. The diseasedplants developed abundant symptoms whichpersisted throughout the duration of the experiment which was concluded this year. After 12months, healthy plants contracted the disease in3 plots. The remaining twelve were ratoonedand transplanted to fresh sterilized soil withoutthe diseased plants, after their roots had beenwashed in running water. Three more exhibiteddisease symptoms. This shows that once infection has occurred, there appears to be a build-upof the causal agent inside the plant beforesymptom expression.
The results on transmission in soil and inwater culture brought additional evidence thattransmission in soil is much slower than inwater culture. Thus, in water culture, 82%infection was obtained after only 7 months'exposure, while 40 % infection was obtained insoil after more than 12 months.
6. FUSARIUM STEM ROT OR WILT
Several cases of dying canes, near harvesttime, in fields in the humid and super-humidzones , were investigated during the year. Thedisease manife sts itself in patches where thecanes show symptoms which could be attributedto drought effect, nutritional deficiency, attack ofClemora smithi, or root disease. However, grubcounts in such patches were well below thedeleterious level, and the affected canes had anextensive root system. Further investigationsrevealed that the disorder was due to Fusariumstem rot or wilt disease.
Diseas ed canes show a pronounced yellowing of the leaves which starts in the midrib,and in the later stages, a purple discoloration aswell. Leaves die prematurely in a V-shapedpattern, from the tip pointing down towardsthe midrib. In certain canes, adventitious rootsdevelop profusely on the stem. Thi s symptom,as well as the purple discoloration of the leaves,is most pronounced in the variety M.134 /32.Growth is stopped and the canes die gradually,being invaded finally by Melanconium sacchari.Internally, the diseased stalks are hollow andpithy at the centre, the condition aggravating in
the later stages ; in certain cases, there is a reddiscoloration at the nodes, which sometimesextends in the internodes as well. In the earlystages of infection, however, the interior of thecanes appears healthy, infection being restrictedto the very base of the stalk, near the point ofattachment to a stalk of lower order, wherewind damage has occurred (PI. VI, left & centre).From such diseased tissues at the base of thestalk, the following fungi were isolated:
Fusarium moniliformeFusarium solaniThielaviopsis paradoxaTrichoderma sp.
Cases of Fusarium top rot are numerouson the younger shoots in the diseased patches.The cane stalks arc also covered with discolouredspots due to infection by spores of the causalorganism F. moniliforme (PI. VI, right). Suchinfections remain quite superficial, except ifwounds arc present or through leaf scars ,whereby the internal discoloration already mention ed ensues. By such wind-borne infection byspores, the diseased patches enlarge with timein a field, and in some cases, infection has been

-81-
found to spread to an adjacent field across a path.The causal organism produced only micros
pores typical of Cephalosporium in cultures onWilbrink medium. The microspores measured7.7Jl ± 0.4 (range 4.5 - 13.8) by 3.4Jl ± 0.1(range 2.5 - 4.5).
Young canes of M.202/46 were inoculatedwith a suspension of mycelium and spores ofthe organism grown in liquid culture. Some ofthe canes were inoculated at the base of thestalk, using a cork borer, and others in thespindle, using a hypodermic syringe. Althoughthe inoculations were successful, no wiltingsymptoms were reproduced. However, a fewcanes inoculated in the spindle developed typicalsymptoms of Fusarium top rot as well aspokkah boeng.
Conclusions and practical considerations
The disease is of minor importance, as itis restricted to isolated cases in areas where thesoil is heavy and badly drained. Heavy gustsof wind on tall canes due to the late cycloneRose in May, and also the excessively wetwinter, have been responsible for the various
outbreaks during the year. Infection sets inthrough the damaged base of twisted stalks, andfailure of the adventitious roots above theinfected tissues to establish themselves quicklyin the waterlogged soil, causes a water stress inthe plant leading to gradual deterioration of thestalk. A build-up of fungal inoculum in thediseased patch increases aerial infection of theupper part of the stalks by spores, therebyaggravating the deterioration of the canes, andalso spreading the disease beyond the focus ofinfection.
The variety M.202/46 was observed as themost susceptible, but outbreaks also occurred inother varieties, namely in M.134/32, Ebene 1/37,M.93/48 and B.37172.
Infected patches should be harvested earlyowing to the rapid deterioration of the stalks.The removal of diseased stalks also reduces thefungal inoculum, thereby limiting the extensionof the diseased patches and reducing the risksof a carry-over to the ratoon crop. In one case,such carry-over was observed with increasingintensity. In severe cases, the affected areasshould be recruited to avoid gappy stands inthe ratoon crop.
7. MICROFLORA OF THE SUGAR CANE RIDZOSPHERE
Since 1960, whenever time has permitted,attention has been given to studies on themicroflora of the sugar cane rhizosphere. Thepreliminary object of these investigations was todetect any possible quantitative differencesbetween the total fungal populations in therhizosphere of plants receiving organic fertilization in the form of factory residues, such asscums and molasses, as opposed to inorganicfertilization alone. Although benefit to bederived from the practice of adding organicamendments at planting time is still a debatedpoint in Mauritius, such practice is conducted ona large scale. The investigations aimed atstudying this problem from the microbiologicalangle, special considerations being given to theinfluence of changes in the microbial balanceof the rhizosphere on certain soil-borne diseasessuch as root rot. While these quantitative
investigations were being conducted, the fungalspecies most frequently isolated were identified,and a collection of type cultures kept for futurework. The help received from the Commonwealth Mycological Institute for the final identification of the fungi is gratefully acknowledged.
Fungal isolations and counts were madefrom two permanent field trials in which therelative merits of organic and inorganic fertilisations are being studied. Blocks of soil containing cane roots were removed by means of a soilauger within, or around, cane stools and sampledfrom various plots, at a depth of 2 to 6 inches.Several random samples were taken from eachplot. Isolations and plate counts were madefrom the soil layer in contact with the surfaceof roots within the soil blocks sampled (therhizosphere), as well as from soil slightly awayfrom the surface of the roots.

-82-
Table 38. Preliminary list of fungi isolated from sugar cane rhizosphere in Mauritius
PHYCOMYCETES
Mucorales
Absidia corymbifer (Cohn) Sacc. & Trott.Gongronella butleri (Lendner) Peyr. & dal VescoMucor hiemalis Wehmer
ASCOMYCETES
Sphaeriales
Ceratocystis paradoxa (Dade) MoreauChaetomium funicolum Cooke
FUNGI IMPERI-ECTI
Shaeropsidales
Sphaerioidaceae
Phaeocytostroma ambigua (Mont.) Pet.Phoma sp. (not fully determined)
Melanconiales
Melanconiaceae
Pestalotiopsis sp. (not fully determined)
Moniliales
Moniliaceae
Aspergillus chevalieri (Mang.) Thom & ChurchA. flavipes (Bain . & Start.) Thom & ChurchA . nidulans (non-ascosporic)A. terreus ThomA. ustus Bain.Gliocladium roseum Bain.Paecilomyces marquandii (Massee)Paecilomyces sp, (not fully determined)Penicillium funiculosum ThomP. lilacinum ThornP. raistrickii SmithP. vermiculatum Dang.Trichoderma koningii Oud.T. viride Pers. ex Fr.Trichoderma sp. (not fully determined)
Dematiaceae
Cladosporium cladosporioides (Fresen) de VriesC. sphaerospermum Perz.Humicola fuscoatra TraaenHumicola sp. (not fully determined)Trichobotrys sp. (not fully determined)
Tuberculariaceae
Fusarium oxysporum Sehleeht. ex Fr.

-83-
The soil dilution and plate count methodof TIMONIN (1940) was adopted. A peptonedextrose agar medium supplemented with rosebengal and aureomycin was used for isolations(MARTIN, 1950) (JOHNSON, 1957).
No consistent differences were foundbetween the total number of fungal isolates,whether from the rhizosphere, or from the soil,in plots receiving organic and inorganic fertilisation. The nature of the rhizosphere is socomplex that investigations should be conductedunder strictly controlled conditions if any differences are to be detected.
A preliminary list of fungi isolated fromsugar cane rhizosphere is given in Table 38.
In relation to the above investigations, fungiwere also isolated on several occasions fromroots of plants appearing to suffer from rootrot, in different fields of the island. The following fungi were most frequently isolated :
Pythium arrhenomanes DrechslerFusarium oxysporum Schlecht. ex Fr.Trichoderma sp.
The readiness with which Trichoderma isisolated from diseased cane roots, and its verycommon occurrence in the sugar cane rhizosphere,suggest that it may be an important antagonistin relation to root rot.
REFERENCES
JOHNSON, L.F. (1957). Effect of antibiotics on the numbers of bacteria and fungi isolated from soil by thedilution-plate method. Phytopathology, 47 : 630-631.
MARTIN, J.P. (1950). Use of acid, rose bengal andstreptomycin in the plate method for estimating soil
fungi. Soil Sci. 69 : 215-233.
TlMONIN, M.1. (1940). The interaction of higher plantsand soil micro-organisms. I. Microbial populationof rhizosphere of seedlings of certain cultivatedplants. Canad. Jour. Res. 18(c) : 307-317.
8. FIJI DISEASE IN MADAGASCAR
As mentioned in the 1964 report, it hadbeen contemplated to finish the uprootings inthe whole province of Tamatave by the endof February 1965, and to complete the surveysand rogueings, if necessary, in all new plantations by December 1965, date on which theofficial campaign against Fiji disease was tocome to an end. As from January 1966, theprovincial sections of the Plant ProtectionService of the Agricultural Service were expectedto take over from the Fiji Section, a separateunit which was established immediately afterthe discovery of the disease in 1954, and towhich due credit should be paid for the goodwork performed against tremendous odds duringthe last ten years.
However, an unexpected rat invasion on aconsiderable scale in 1965 brought the activitiesin the Fiji campaign to a standstill, all effortsof the Fiji Section being diverted until Septemberto face the new problem. As a result of thissetback, and although no new cases of Fijidisease were discovered during surveys, theMalagasy authorities have decided to extend thelife of the Fiji Section by another year.
The control organization which was set upin Tamatave in order to prevent the entry ofany part of the sugar cane plant into the portarea continued to operate satisfactorily. Furthermore, control measures to ensure that nounauthorized varieties are sold in the marketsof Tamatave were maintained. It is interestingto note that sugar cane cultivation around the townof Tamatave has been declining steadily, beinggradually replaced almost exclusively by bananaswhich are rapidly becoming a major exportcrop of the province.
In the resistance trials, the environmentprovided by the highly susceptible M.134/32had been gradually becoming less infective,a major cause for concern. Indeed, stools withsevere infection had gradually died and disappeared, and a large number of the remainingdiseased plants were considerably dwarfed,bearing witches' brooms or coarse leaves mostprobably unattractive and unpalatable to theleafhopper vector. A plan devised to build upagain the infective environment, including thebreeding of vectors on diseased plants and theirrelease in the trials was put under way. Latest

-84-
reports indicate that the position has improvedconsiderably, with a fair number of M.134/32stools showing large galls on leaves of apparently normal plants. Results obtained in firstratoons in the trial planted in 1963 are asfollows:
Highly susceptible: B.4223I, B.45151, B.4744 &N:Co. 376
Susceptible H.39-3633, H. 44-3098,P.O.J. 3067
The following varieties did not show anydisease symptom :
B.46364, B.49119, c.i, 41/223, Q.58
However, as disease incidence was low in
the infective environment and in the susceptiblecontrol plots, the trial is to stand for anotheryear.
In the trial planted in 1964 , the followingvarieties have contracted infection in virgins :H. 32-8560, M.442/51 , R.445 and R.447. Theother cane s under test are: Ebene 50/47,M.99/48, M.423/51, P.R. 1013, Q.50, R.430 ,R.511, R.512, R. 514, R. 519, R.520.
The following varieties were planted inOctober in the 1965 trial: B.51129. B.55362,Co .449, c.r. 48/103, Ebene 88/56 , N:Co.293,R. 519, Saccharine, Salvo , Samson and Saraband.
Three canes of special interest to Mauritiusare: M.409/51, under multiplication, and M.13/53and Ebene 74/56, in their second year ofquarantine.

Rep. Maurit . Sug. Ind, Res. Inst. 1965 Plat e V
Com monly encou ntere d Chytrid in epidermal cells o f roots of M.44 2/51 wh ich have cont racted chloro tic strea k infection.N ote: left , empty sp ora ngium « - ) ; centre, sausage-shap ed sp orangia wit h well-defined cylindrical discha rge tu be ; right, disch a rged zo osp ores.

Rep. Maurit. Sug . III ~/ . Res. Inst. 1965 Plat e VI
"J
+
Fusarium stem rot in M .202 /4 6
Left Beginning o f infect ion a t base o f secon dary sta lk ; middle : a dva nced stage showing internal discol orat ion a nd hollowce ntra l por tion ; rig lit : spo ts on sta lks d ue to aerial infect ion by sp or es (note lesions due to internal spread throu gh lea f scar ~-) .

· CANE PESTS
J. R. WILLIAMS
1. THE STALK MOTH-BORER
No . fields Average % Average %sampled stalks bored internodes
per field bored per field1964 205 38 4.71965 186 26 2.3
.F ig 19 shows the frequency of fields withdifferent levels of borer injury. It is seen thatin 1965 fields with 0-20% stalks bored preponderate.
Frequency of bored canes in fields examinedin 1964 and 1965. Fields grouped into fivecategories according to % stalks bored.
19651964 ,
Id
40
ClZ 30~<:xw
so
Fig. 19.
~-'w
u: 20
*'
D ATA . on the incidence of damage tomillable stalks by the moth-borer,Proceras sacchariphagus, were collected
by sampling in fields during harvest on sixestates representative of the different climaticzones of the island. From each of the 186fields visited, 50 canes were taken at random,weighed, and the number' of internodes andbored internodes per cane counted. Similarsampling had been done in 205 fields in 1964,and the .considerable amount of data nowacquired needs further analysis before conclusio-rs may be drawn from it.
Proceras injury affects sugar cane at allstages of growth, beginning with the plantedsetts if these are bored, and cane quality as wellas yield is reduced. Assessment of ' loss is 'consequently difficult, and in general terms forthe island as ,a whole involves so many variablesthat , accuracy is impossible. However, theinsect leaves a convenient record of its activityin a crop in the form of holed internodes and,within limits, it should be possible '. to relate thiswith field populations and .loss,
Two items of interest were obtained fromthe data and may be mentioned without prejudice to its fuller treatment a.t a later date.
Ca) Severity oJ damage to millable cane ill 1964and 1965. '
;. - -T he average figures for intensity of stalkand internode damage were ' very different forthe two' years, as shown below, and the lowerfigures for 1965 were borne . out by general fieldobservations :

-86-
Fig. 20. Relationship between % stalks bored and %internodes bored by Proceras sacchariphagusin 205 fields at harvest, 1964.
work in the Far East, particularly in Indonesia,was highly desirable in connection with biological control of cane pests originating fromthat region. A plan to that end was drawn up,to be implemented when possible.
100
. i ..1 r: :.-
-.- -.
40 60 900;0 STALKS BORED (X)
20
-::.
2. 14
cW13
2,~
~ 11o~ 10
~ 9
~9
15
16
1.17
19
"21
23
Fig. 20 is based on 1964 data and showsthe percentage of stalks and of internodes bored,and the relationship between these statistics, in205 fields. Many readings were identical, andare therefore not visible in the figure. Therelationship between the percentage of stalksand of intemodes bored is evidently curvilinear, and a reasonably good fit to the plottedpoints is given by the regression
Y = 0.00204 Xl + 0.43,where Y = % intemodes bored,
and X % stalks bored. The correlationcoefficient is + 0.525 with P <. 0.001. Using thisregression, an estimate of the amount of internodal injury may be obtained from countsof canes bored.
Diatraeophaga striata lis, the Javanese tachinid parasite released in 1961 and 1964, hasnot been recovered in the field and has apparantly failed to establish itself. A further finaleffort to establish this parasite is planned.
During discussions with Dr. F. J. Simmonds,Director of the Commonwealth Institute ofBiological Control, who visited Mauritius inJanuary, it was concluded that exploratory
(b) Relationship between frequency of injury tostalks and to internodes.
2. THE SCALE INSECT
The scale insect (Aulacaspis tegalensis)continued to be troublesome at the CentralCane Nursery where the piecemeal cropping andplanting of the area involved, which is concomitant with the function of the nursery, andsuitable climatic conditions, favour the development of infestations.
A simple apparatus was devised for theinjection of insecticide into the piped irrigationwater shortly before it reaches the spi inklersfor overhead dispersion. The application ofmalathion at fortnightly intervals by this methodis under trial.
Further experiments on the germination andearly growth of scale-infested setts, and onremedial treatments which might be applied tosuch setts, were made.
Experiment 1. The following treatmentswere applied to 32 three-budded infested anduninfested setts, respectively, from lO-month-oldM.93j48 cane before dipping in aretan andplanting in trays of soil in the open at Reduit :
(a) No treatment(b) Washed(c) Dipped in a emulsion of albolineum
(2 %) and malathion (0.1 %).(d) HWT at 52°C for 15 minutes
The results obtaines eight weeks later aregiven in Table 39.
Experiment 2. A similar experiment usinginfested l l-month-old M.202j46 cane, comparableuninfested material being unavailable, gave theresults shown in Table 40.

-87-
Table 39. The effect of scale-infested setts and treatment of setts on early growth
UNTREATED WASHED INSECfICIDE HWT LSD
Uninfested Infested Uninfested Infested Uninfested Infested Uninfested Infested 5 % 1 %
Germination ( %)
Av. shoot length (cm)
Growth index"
79
61
lOO
44
42
40
80
63
104
77
55
86
48
68
66
73
51
78
76
65
101
69
55
79
16 21
9 12
19 25
• Total lengths of all shoots as a percentage of such data for uninfested, untreated setts
Table 40. Early growth from scale-infested setts with and without treatment
Untreated Washed Insecticide HWT LSD5% 1%
Germination ( %)
Average shoot length (cm)
Growth index"
18
40
lOO
39
57
305
29
49
177
63
47
297
12
NS
86
16
NS
112
• Total lengths all shoots as a percentage of such data for untreated setts
Table 41. Early growth from healthy setts after insecticidal treatment
M.31/45 M.442/51
8 11
M .99/48 M .202/46
9 13
Variety
Age (months)
M.253 /48
7
U· Tt
E.1/37
8
U T U T U T U T U T
M.50/47
13
U T
M.93/48
8
U T
Germination ( %)
Av. shoot length (cm)
Growth index:f:
57 47 51 64 74 82 61 60 60 57 68 54 44 42 58 71
28 35 32 31 24 24 30 39 33 30 49 44 17 18 30 30
lOO 104 lOO 116 lOO 118 lOO 123 lOO 91 lOO 71 lOO lOO lOO 125
• Untreatedt Treated:f: Total lengths of all shoots as percentage; untreated setts = 100%
Table 42. Effect of scale-infested setts and treatment of setts on early growth and yield of cane
(a) Pointe aI/XSables UNTREATED INSECfICIDE HWT LSD Age
Uninfested Infested Uninfested Infested Uninfested Infested 5 % 1 % (weeks)
Germination ( %)
Av. shoot length (cm)
Growth index"
Yield (TCA)
(b) Belle Vue
80
52
lOO
54.7
62
41
74
45.7
79
52
99
56.5
67
42
74
45.0
84
58
103
53.6
73
48
96
52.7
8 11 6
7 9 6
19 26 11
8.0 11.0 54
Germination ( %)
Av. shoot length (cm)
Growth index"
Yield (TCA)
41
62
lOO
39.7
33
54
66
39.4
43
70
101
43.2
38
65
71
44.3
52
66
110
44.6
48 8 11
56 NS NS
70 28 38
43.4 NS NS
4
7
7
64
• Total lengths of all shoots per unit length of row as a percentage of such data for untreated. un infestedsetts

-88-
Fig. 21. Brix of scale-infested and clean stalks ofM. 93/48. Each point represents the meanvalue of internodal brix in five canes.
• --. clean canes0--------0 infested canes
than from clean setts, except when HWT hadbeen applied; in (b) yields do not differ much.
The observations made in these field experiments on survival of scales underground on theinfested setts have already been described. * Thepersistence of the scales is remarkable, and theprogeny of those on the setts at planting may befound months later on both setts and undergroundparts of the new shoots. Later, scales appearabove ground when intcrnodes have formedsuitably, and there seems little doubt that theyare derived from those originally on the setts.As previously emphasized, this factor can beimportant in originating infestations only inareas where the insect thrives, namely, the drycoastal districts.
The maturation of infested and cleancanes in a field of M.93/48 was studied bytaking readings of internodal brix at intervalsfrom April to November. In figure 21, eachpoint represents the mean brix value from allthe internodes of five complete canes. It isseen that the brix of infested canes remainedlow: the increase in September-October coincided with the death of most scales on the stalks,as usually happens later in the crop season,largely from the action of natural enemies.
r-----oI
II
II
~. I
1
"/
~-~, "
I -, I
..... '"'(j/ '" //p''0''/
Experiment 3. Un infested three-budded settsfrom eight varieties were dipped in the abovementioned insecticide mixture and their germination compared with simliar untreated setts.Twenty four treated and untreated setts of eachvariety dipped in aretan and planted in traysof soil in the open at Reduit, gave afterseven weeks the results shown in Table 41.
The tabulated results serve to confirmconclusions drawn from earlier experiments, asdescribed in the previous report, and especiallyin Technical Circular No. 24. The scale depresses germination and young growth when it isabundant on the planted setts, but their removalor destruction diminish considerably this adverseeffect of the scale. The destruction of the scaleswith HWT is complete, and this is preferable tothe insecticide dip which is not highly efficacious.The dip in Table 39 would seem to have reducedgermination of uninfested setts but a similareffect is not evident in Table 41, where thereare no significant differences, or in otherexperiments carried out.
Two field experiments were concluded.These were designed to indicate the effect ofscale-infested setts, and of treatment of setts, onyield of cane as well as on early growth. Thesurvival of the insects on the planted setts andtheir ability to originate infestation in the virgingrowth were also studied in these experiments.The two experiments were identical, but laiddown in different localities, and were randomisedblocks with five replications and plots of 1 rowX 4 gaulettes (approx. 40 ft.), each plot beingplanted with 50 three-budded setts of l4-monthold M.202/46. Treatments were (i) nil; (ii) HWTat 50GC for 10 min.; (iii) insecticide dip as above,for both infested and uninfested setts, giving sixrows (plots) per block. It should be noted thatno effort was made to prevent scales beingdislodged from infested material during preliminaries, i.e. cutting, loading, transport, choppinginto setts, etc., and many were in fact removedas would happen in normal field practice. Theexperiments were well watered by overheadirrigation. Results are given in Table 42 (a) and(b); in (a) yields from infested setts are less
20
><
"'"-'-c" ISoZccW>-Z
I MAY JUNE JUL't' I AUG SE PT OCT
* Rep. Maurit . Sug . Ind. Res. Inst. 11 (1964) : 68-71 ; and Technical Circular no 24, 1965.

-89-
3. GENERAL
(i) Over 50 soil samples were taken fromaround cane roots in different localities andexamined for nematodes of the genera Xiphinemaand Longidorus. Five species of the former,the commonest being Xielongatum, and two ofthe latter were found .
(ii) A few localized attacks by aggregatesof red locust hoppers occurred in December andwere suppressed by spraying with dieldrin .The largest was over about 20 arpents in thenorth.
(iii) Armyworms iLeucania loreyi) attackedyoung ratoon cane on several occasions,invariably in fields which had been burnt atharvest a few weeks previously . Insecticidal
treatment was recommended as necessary.(iv) A new form of rat bait, originally
devised for use in coconut groves in Jamaica, isa mixture of anti-coagulant rodenticide (0.5 %),crushed maize, sugar and paraffin wax in theproportions I: 11 : 2: 7 by weight, respectively.The wax is melted, the other ingredients stirredin, and the mixture poured into moulds andthen , when hard, cut into blocks, or biscuits.The biscuits are convenient to use and, becauseof the wax, do not deteriorate rapidly in thefield. Laboratory tests showed them to be bothpalatable to the brown rat and highly efficacious.They have been recommended for use in canefields.

WEED CONTROL
E. ROCHECOUSTE
1. FURTHER INVESTIGATIONS ON THE USE OF SUBSTITUTED URACILS
T HE nine trials initiated in 1963 to determine the effect of Bromacil (5-bromo-3sec. butyl-o-methyl uracil ) and Isocil
(5-bromo-3 isopropyl-6-methyl uracil) on caneyield and sugar content were harvested in 2ndratoon in 1965. It must be recalled that thesetrial s were distributed in humid and superhumid areas, and the herbicides were applied afortnight after harvest. The experimental designconsisted of 5 X 5 latin square with plots 1/80thof an arpent. After the 1964 harvest, the experimental plots received again the same herbicidetreatment as in 1963, that is, the Uracils weresprayed at dosages 0, -}, I, 2 and 3 Ib a. i. per arp ent.
Results. From the results obtained andpresented in Table 43 it will be observed thatno increased phytotoxic effects on cane growthwere registered after a second application of theUracil s. In fact, it is only at the highest rat eof application (3 Ib a.i.) that Bromacil andIsocil affected cane growth in the varietyM.93/48 in 3 out of the 8 trials . No adverseeffect on sugar yield was recorded with bothUracils at aU rates of application experimented.These data indicate that the rate s of applicationbetween -} lb to I Ib a.i . per acre may besafely used in ratoon crop.
Table 43. Effect of BromaciI and IsociI on cane yield (Tons/arpent),
BROMACIL
TREATMENTS M .93/48 M.202/46 Ebene 1/37 M.I47/44
Belle ",lonRive Riche D esert
Beau ell Bonne Gros N ew SI . Bois SI.Ib a.i . per arpent Champ Henrietta Eau Veine Alma Bois Gro ve Pi erre Sec Attbin
CONTROL 32.8 31.6 29.1 42.7 31.0 34.1 28.1 25.7 36.4 38.61/2 Ib 31.2 31.1 28.0 42.4 34.3 32.4 28.8 31.1 35.2 42.21 Ib 30.2 30.0 27.7 40.9 28.7 33.5 30.8 28.3 35.6 41.52lb 29.6 30.4 33.6 41.1 29.3 30.0 30.3 26.2 33.6 41.93 lb 28.0 26.8 28.6 29.2* 25.5 30.1 31.1 22.9 32.0 37.0
ISOCIL
TREATMENTS M.93/48 M.202/46 Ebene 1/37 M.147/44
Belle M onRiv e Riche Desert
Beau en Bonne Gros N ew SI . Bois SI.Ib a.i . per arpent Champ Henrietta Eau Veine Alma Bois Grove Pierre S ec Aubin
CONTROL 27.3 33.3 32.5 36.9 28.7 31.7 29.9 28.2 32.9 44.71/21b 30.2 33.9 32.2 38.1 34.0 34.5 28.6 29.7 34.2 44.71 Ib 29.7 31.9 31.6 34.3 29.2 31.7 29.2 30.2 34.7 43.02lb 28.4 29.6 26.2 29.5 29.8 33.7 31.7 27.6 32.7 45.73 lb 22.6* 26.3* 27.8 30.6 32.6 32.2 29.9 26.8 34.9 49.1
* Significant at 5 % level.

-92-
2. EVALUATION OF NEW HERBICIDES
Two logarithmic trials were laid down atthe Belle Rive Sugar Experiment Station. Thelog-plots were 45 ft long and each treatmentwas duplicated. Weed assessment was madeby the frequency-abundance technique. In onetrial the new herbicides Hercules 7531 (hexahydro-methanoindanyl-dimethyl urea), Herculcs7175 (chloronorbonyl dimethyl urea) and UCP40-1 (2,4-D ester plus methyl substituted carbamate) and compared to DCMU. In the othertrial, the effectiveness of the substituted Uracils,Bromaeil (5-bromo-3 sec. butyl-o-methylui acil),H-732 (5-chloro-3 tert. butyl-6-mcthyluracil) andH-767 in comparison to DCMU was investigated.In both trials the herbicides were applied inpre-emergence treatment of both crop and weeds.
Results. Trial No. I. DCMU was the most
effective herbicide throughout the concentration range tested. Both Hcrcules weed-killersshowed better weed control performance thanUCP-40-1. Hercules 7175 and UCP-40-1 slightlyaffected cane growth at the dosage range5.0-3.8 Ib a.i. per acre. In general, DCMUwas more effective than these herbicides on thefollowing weed species Digitaria timorensis,Setaria pallidefusca and Ageratum conyzoides.
Trial No. 2. The substituted Uracils,Brornacil, H-732 and H-767 gave comparativelysimilar weed control results as DCMU. Ofthe three Uracils, Bromacil proved more toxicto cane growth at the concentration range5.0-2.8Ib a.i. per acre than H-732 and H-767,and there arc indications that H-732 might beslightly more toxic than H-767 at the highestdosage range.
Trial No. I Effects of new herbicides on weed infestation and cane growth, 12 weeks after planting
WEED INFESTATION /~ CONTROL MEAN SHOOT LENGTH % CONTROL
Dosage range per acre (/h active) per 3 yd. Dosage range per acre (/h active) per 3 yd.logarithmic strip logarithmic strip
TREATMENTS 5.0-3.8 3.8-2.8 2.8-2.1 2.1-1.6 1.6-1.2 5.0-3.8 3.8-2.8 2.8-2.1 2.1-1.6 1.6-1.2
DCMU 5 Ib 20.6 16.2 17.6 25.7 22.8 105.3 95.5 89.6 98.6 94.6
Hercule 7175 Sib 36.0 30.9 33.8 49.3 55.9 75.5 82.5 86.7 89.3 98.6
Hercule 7531 51b 29.4 33.1 36.8 40.4 57.0 84.9 108.7 110.7 94.6 101.4
UCP 40-1 51b 47.1 50.0 51.5 63.2 67.6 73.5 94.0 98.8 94.2 91.3
Duration of experimentTotal RainfallNo. of rainy daysRainfall during 1st fortnight
86 days24.03 in.
c 597.71 in.
Trial No. IT Effects of new herbicides on weed infestation and cane growth, 18 weeks after planting
WEED INFESTATION ~Io CONTROL
Dosage range per acre (/b active) per 3 yd.logarithmic strip
MEAN SHOOT LENGTH % CONTROL
Dosage range per acre (/b active) per 3 yd.logarithmic strip
5.0-3.8 3.8-2.1 2.8-2.1 2.1-1.6 1.6-1.2
129.7 112.0 118.7 100.8 111.4
73.7 72.5 84.6 91.5 105.4
84.4 95.5 94.3 95.8 96.7
100.0 97.4 95.7 95.4 91.6
20.5 20.5 22.7 26.7
14.8 24.4 29.5 32.4
21.6 28.4 27.3 33.5
23.3 26.7 30.1 35.8
161 days49.19 in.1292.22 in.
TREATMENTS ... 5.0-3.8 3.8-2.8 2.8-2.1 2.1-1.6 1.6-1.2
DCMU 5 lb 18.2
Duration of experimentTotal rainfallNo. of rainy daysRainfall during 1st fortnight
Bromacil 5 Ib 15.9
H-73251b 19.9
H-767 51b 23.9
-93-
3. CONTROL OF PERENNIAL WEEDS
(a) Paederia fcetida
Further experimental work on the control ofthis vine in stone walls was continued in 1965.From the data obtained, the potency of Tordonon the eradication of this weed was confirmed.At an application rate of I Ib a.i. per 60gallons water, very satisfactory results may beobtained, but a repeat application may be necessary . At the 2 Ib treatment, almost completecontrol was obtained with one application.Best results were registered when the herbicidespray was made in summer after the rains hadset in, that is after the vine had exhausted itsfood reserves .
(b) Bignonia unguis-cati
This plant is a vigorous leafy vine oflimited distribution occuning only in some caneiands of the western part of the island. It ischaracterised by its opposite leaves, each ofwhich consists of two leaflets separated by atendril, with a three-clawed grapnel structure.It bears trumpet-shaped yellow flowers. Theplant is a hard-to-kill weed owing to numeroustubers which give rise to new plants wheneveraerial growth is destroyed.
Experimental work on its eradication wascarried out during the years 1963-I965 withvarious chemicals. Two trials were laid down,one in 1963, and another in 1965. Plot size was400 sq. ft, and there were two replicates pertreatment. Rates applied were in Ib a.i. peracre in 100 gallons water.
Results.
In the 1963 trial, the following treatmentswere used:
I. DCMU (4 Ib) plus an Isoctyl ester of2,4,-D and 2,4,5-T (3 Ib).
2. Isocil (4).
3. Bromacil (4).
4. DCMU (4) + Bromacil (4).
5. DCMU (4) + Isocil (4).
None of the above treatments gave satisfactory results. A top kill was obtained theduration of which was about 3 to 4 months,thereafter the plant began to put out new growhfrom its underground tubers.
In the 1965 trial the following treatmentswere experimented :
I. Weedazol TL. (4 Ib)
2."
(2 Ib)
3."
(lib)
4. Tordon (4 lb)
5. (2 lb)
6. (I Ib)
Observation made six months after application showed that the Weedazol treatments werenot as effective as those of Tordon throughoutthe concentration range. The best treatmentswere Tordon at 4 and 2 Ib a.i./acre where 95 %and 85 % control of the plant were obtainedrespectively. At the I Ib rate this chemicalwas ineffective. These preliminary data indicatethat Tordon may be used to eradicate this vine,but it must be emphasized that its applicationshould be restricted to non-crop lands untilinformation becomes available on the persistenceof Tordon in the soil.

Rep. Ma urit , Sug: Ind, Res. Inst . 1965 Plate V I[
Lysimeter exper imen t a t Pal myre
Top left : pla cement of Iysim iter in the gr ound; top right : three of the six lysimet er in th e experime nta l field.
Bottom left: irr igati on o f ex per imen ta l field ; bottom right : ger mina tion three weeks a fter plant ing.

Rep . Maurit . SI/g . Ind. Res. Inst . 1965 Plat e VIII
Top :Bottom
Petroleum mulch experiment at Belle Ri ve Exp eriment Station
trea ted and untreated plots afte r planting ; white tripods indi cat e position of thermom eters.experi mental plot s three months a fter pla nting, sho wing uni fo rm grow th .

CLIMATE AND CULTIVATION
1. CLIMATIC CONDITIONS DURING 1965 CAMPAIGN
PIERRE HALAIS
WEAT HER conditions prevailing in 1965are illustra ted in figs. 22 to 25, whichare based on data given in Tables
VII , VIII and IX of the Appendix. They areaverage figures worked out for the sugar-producing area of the island as a whole, fromobservations systematically collected on selectedpermanent stations over the five sugar sectors.Though they differ considerably as far as theintensity of climatic characteristics from sectorto sector is concerned, they are in reality quiteinterdependent, during a given campaign, owingto the restricted size and altitude of Mauritius.Nevertheless, the leeward western sector mayexceptionally show some divergenc e, especiallyfor the ra infall factor, but this is largely attenuated in practice because of irrigation.
During the eight months vegetative periodextending from No vember 1964 to June 1965,weath er conditions d id not depart much fromnormal values :
i) The highest wind speed (V) for onehour 's run reached 24 m.p .h., compared to themedian figure of 26 m.p.h. taken as normal.
ii) The sum of monthly rainfall deficits (D )amounted to 14.1 inches, against the long termnormal of 15.0 inches.
iii) The relative insolation was 59 %againstthe normal of 58 %.
iv) On the other hand, mean air temperature during the four critical months, March toJune, differed much from normal, 22.6°C compared with the normal value of 23.3°C, that isa difference of - 0.7"C, which affected ad verselylate vegetative growth. The contrary happenedin 1961 to an even greater extent, when air
temperature reached the record value of 24.6°Cwhich boo sted cane growth.
The average T.C.A. for 1965 was thehighest yet recorded, and amounted to 30.6against the latest normal value estimated to about31 tons .
During the four months maturation periodJuly to October 1965, weather conditions weremost abnormal as regards both rainfall and airtemperature.
i) The sum of monthly rainfall excesses (E)amounted to 14.1 inches, the highest figure everrecorded in Mauritius since systematic observations started in 1875, whereas the normal valueis only 2.5 inches.
ii) Minimum air temperature averaged17.6°C, one of the highest on record sinceobservations started in 1950, against the normalvalue of 16SC. Mean daily range of airtemp erature was the lowest yet observed ,6.7°C again st the normal value of 8.2°C.
iii) Highest wind speed for one hour'srun and relative insolation were both almo stno rmal.
Sugar manufactured % cane was very low,11.1 compared to the latest normal valueestimated at 11.8. As a consequence, the totalsugar output for the island only reached 664.5thousand ton s, compared to the latest normalsugar product ion pot ential estimated at 708thousand tons.
The largest part of this " shortage" of 45thousand tons of sugar is a direct result of thevery high rainfall excesses and of the corresponding abnormal air temperature which prevailed during the four months maturation period,

-96-
from July to October 1965. It is obvious thatwhen harvest started in July, no one was in aposition to forecast the abnormal weatherconditions which set in later, and persistedcontinually during four months. On the otherhand, if weather conditions had turned extremelyfavourable, the shortage of 45 thousand tonscould have been altered into a "surplus" of thesame magnitude, hence the great uncertaintyarising from cane quality.
It must be mentioned in this connectionthat a "normal" year, as far as certain dominantmeteorological elements are concerned, hasbeen defined conventionally by this Instituteas follows: (i) absence of destructive cyclones,that is no wind in excess of the threshold of30 miles per hour for one hour; (ii) a sum ofmonthly rainfall deficits (D) during the vegeta-
tive period from November to June close tothe normal value of 15.0 inches; and (iii) a sumof monthly rainfall excesses (E) during thematuration period from July to October,approaching the normal value of 2.5 inches.
It follows that the latest nonnal sugarproduction estimated at 708 thousand tons forMauritius in 1965, as a reference potential, ismuch higher than the true average sugar production which is limited by the dominantweather hazard, namely, destructive cyclones.
Tables 44 and 45 give in a summarized formthe most important weather data which areknown to affect sugar production in Mauritius.The normal values are long-term arithmeticmeans, with the exception of highest wind speed,for which the median figure has been selectedto represent the normal value.
Table 44. Variations in major climatic elements during the vegetative period 1963-1965.
Months Normals 1964/65 1963/64 1962/63 Extremes since1950
Highest wind speed m.p.h, Nov.-June 26 24 60 26 18 - 74(May) (Jan.) (Jan.) ( 1959) (1960)
Sum of monthly rainfall deficits, inches Nov.-June 15.0 14.1 10.3 13.9 5.7 - 28.7(1962) (1961)
Relative insolation in % Nov.-June 58 59 55 53 53 - 61(1963) (1961)
Mean air temperature QC Mar.-June 23.3 22.6 22.7 23.2 22.6 - 24.6(1965) (1961)
Tons cane/arpent 30.9 30.6 22.5 29.6 12.7 - 30.6(1960) (1965)
Table 45. Variations in major climatic elements during the maturation period 1963-1965.
Months Normals 1965 1964 1963 Extremes since1950
Highest wind speed for one hour's run m.p.h. July-Oct. 20 20 20 17 17 - 25(1957,1963) (1952)
Sum of monthly rainfall excesses, inches July-Oct. 2.5 14.1 2.9 2.2 0.0 - 14.1(1956) (1965)
Relative insolation in % ... July-Oct. 58 56 61 51 51 - 65(1963) (1956)
Average min. air temperature °C July-Oct. 16.5 17.6 15.8 15.7 15.7 - 17.6(1963) (1961,1965)
Mean daily range, air temperature °C July-Oct. 8.2 6.7 7.9 8.7 6.7 - 9.3(1965) (1956)
Sugar manufactured % cane 11.8 11.1 11.9 11.9 9.8 - 12.9(1960) (1956,1957)
Tons sugar/arpent 3.65 3.42 2.66 3.53 1.26 - 3.53(1960) (1963)
Area harvested thousand arpents 194 194.1 194.9 194.1 151.0 - 194.9(1950) (1964)
Total sugar production, thousand tons 708 664.5 519.6 685.5 253.8 - 685.5(1960) (1963)

m. mm.
.. + 10 + 250
+9+ 22 5
+ 8 + 20 0
+7+ 17 5
+6+V>
150 z0
+5+ 125 ~>UJ
+ 4 ~ 100 0...J...J+ 3+ 75 -cu..z
+2+ 50 -c""
+1+ 2 5
0 0
1- 2 5
2- 50
---------..~ - MATURATIO N PERIOD - - .-1
mm . in.
. +500 +20 .. VEGETAT IVE PERIODUJ.J
+450+ 18 .JUJ
+ 40 0 + 16 ~ "011+ 350+14 11
/1VI +300+12 11z 1I0i= + 250+9 I I-c I I>UJ
+200+8I I0 I I
....J I I >-
....J + 150+6 I z-c I I zU- UJz I I
....-c +100+4 I \ :~a::
+ I I ..50 +2 I II0 0
- 50 -2
- 100 - 4
TEN DAYSMEDIAN VALU ES
1875 - 1959
~0~~~~~NOO~~008N~~~~~00~roNN~~~~ro~ro~~ __ ~~~~~~vv~~
~ro~V-~O~~N-~OO~-~N-ro~~~~odO~NNn~~~~N~~~~~NN~~~-L-.Jl---.Jl---..JL...-.....JL---...Jl---.Jl---..JL---..J
NOV. DEC. JAN. FEB. MAP. . APR . MAY JUNE
~ ~ N ~ N 0 ~ ~ 0 0 0 ~ ~ 0 ~ millimetres,....,~I'"""'l~,..,....,..,.... N NNNN .--NN
~ ~ ~ ~ ~ '" 0 o- en eo et? ~ r-:- 60' inches":-"":"-:''-:''-:''-:'-: 00 0 0 0 0L--......J L--......J L---..J L---....J L---...J
JULY AUG. SEP. OCT. NOV.
Fig. 22. Rainfall deviations from 10 days ' median values.Dotted line : 1962-63. Broken line: 1963-64. Plain line: 1964-65.Scale used for maturation period is double that for vegetative period of sugar cane.

8 - 5
+ 40+25
+ 5 6 +3 5
l17 M .P.H.
27 K.P.H.
NOV.
18
29OCT.
... ..::-:-.. -.:..:..
1930SEP.
2032
AUG .
18
29JUL .
1930JUN.
1930
MAY .
1727
APR .
18
29MAR .
1930
FEB .
2032JAN.
1626
DEC.
uJ..J..JuJ
Z<to
1\
I \1 \I \1 \
I \ uJ
I \ juJ
1 \ !Q\l.!)
I "-.. 1 '\
. ' /....... "-/1 "
}
+ 48 +30
V}
Zo +64+40I-«>UJ
ooLULUc,V)
K.P.H. M.P.H.
+80+50
+72+45
16 -10
MEDIAN VALUES 171950-1965 27
NOV.
~ + 3 2 +20
3: +24+15>--I
0::: + 16+ 10:JoI + 8 + 5lV}
LLJILJ:r:
Fig. 23. Deviations of highest hourl y wind speed from corresponding med ian values.Dotted line : 1962-63. Broken line : 1963-64. Plain line: 1964-65.

... VEGETATIVE PERIOD ~ - MATURATION PERIOD-
+O·B +1·6V) V)
Z zQ +0·6· + 1.2 0I- i=« /--, ,. «:> +0·4 +0.8 >\ . . UJUJ .- 00 \ ,
:+0.4UJ +0·2 UJ
\ ~a:::: :::>:::> .....0
I-!< 0 «~~
UJUJ
./ ---;.-:-_- c,~ -0·2 -0-4 ~' .' /----...' ./ UJUJ
f--I-/ -0-8a:::: -0·4 .- ~
'/ ««\
/ " "
- 1·2 ~z -0·6 / :::>« \ / '., ~UJ
1·6 zz -O ·B \ -/ z
\ /- 2.0- 1.0
\ //
1.2 l--- - 2.4
- 1.4 - 2.8MONTHLY NORMALS 23.3 24.g 25.7 25.6 25.3 24.1 22.5 21 .0 16.4 16.0 16.5 17.4 18.71950 - 1965
MEAN TEMPERATURE -AVERAGE MINIMUM TEMPERATURE-
NOV. DEC. JAN. FEB . MAR. APR . MAY JUNE JULY AUG. SEP. OCT. NOV.
Fig. 24. Air temperature deviations from monthly normal values; average mean T for vegetative period; average minimum T for maturation period.Dotted line: 1962-63. Broken line : 1963-64. Plain line : 1964-65.
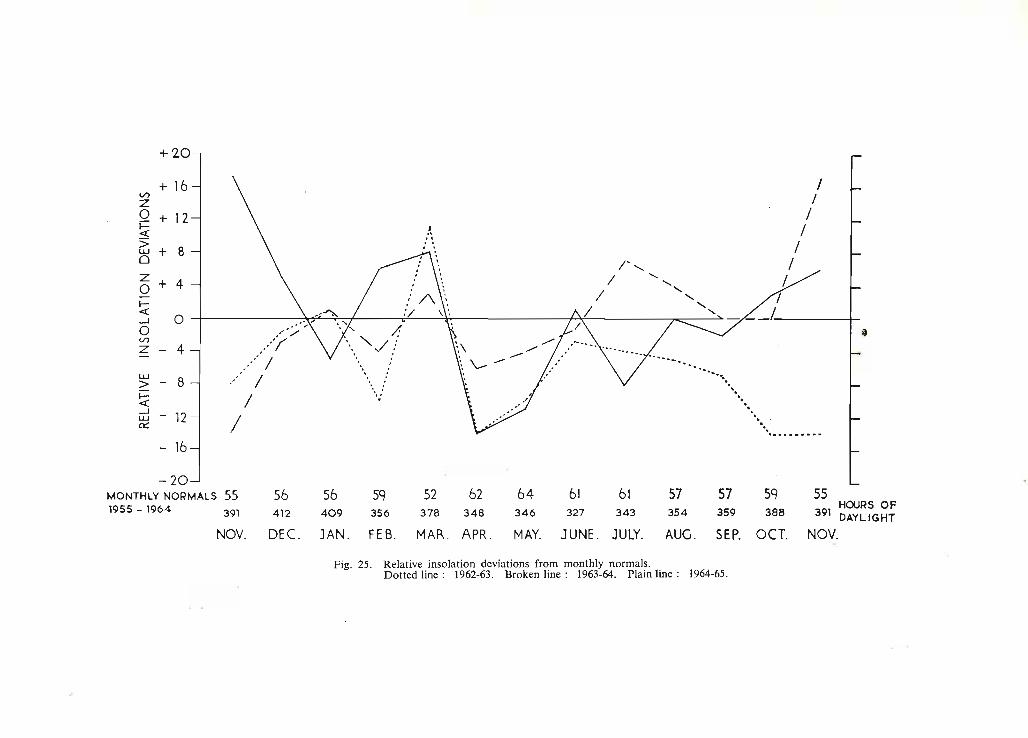
+ '20
+ 16V')
z0 + 12i=-cs
8Ll.J +0
z + 40I--c
0....J
0l/)
z 4
Ll.J8> -
I--c....J - 12Ll.Ja::
... ./,/1
,,/ '/
" //
/
:/.,. , /-... -, / ...
\ " ". ."\. ,.,..'.. ,'
-'. " ........•...
........ ._... .- 16
-20MONTHLY NORMALS SS 56 56 Sq 52 62 64 61 61 57 57 5q SS1955 - 1964 354 359 388 391
HOURS OF391 412 409 356 378 348 346 327 343 DAYLIGHT
NOV. DEC. JAN. FE B. MAR. . APR . MAY, JUNE. JULY, AUG. SEP. OCT, NOV,
Fig. 25, Relative insolation deviations from monthly norrn als.Dotted line : 1962-63. Broken line: 1963-64. Plain line : 1964-65.

-101-
2. SOME CLIMATIC FACTORS PROMOTING SUCROSEACCUMULATION IN SUGAR CANE
PIERRE HALAIS
Cane quality, as measured by sugar manufactured % cane, shows considerable variationfrom year to year in Mauritius, the extremevalues observed recently being 9.8 in 1960after the passage of two destructive cyclones inJanuary and February, followed by exceptionallyheavy rains in September, and 12.9 in 1956 and1957, two consecutive years with restrictedrainfall throughout the maturation period fromJuly to October.
The value of 11.1 obtained for the 1965campaign is one of the lowest on record (11.0in 1953), and a close analysis of the abnormalmeteorological conditions which prevailed duringthe maturation period, July to October 1965, isworth attempting.
The present study covers a period of 16years from 1950 to 1965.
Experience has shown that three meteorological factor s during the four months maturationperiod, from July to October, exercise a predominant influence on cane quality at harvest inMauritius. They are :
(i) The sum of monthly rainfall excesses (E)which varied from zero in 1956 to 14.1 inchesin 1965. The arithmetic mean for the longterm 1875 to 1949, being 2.5 inches, repres entsthe normal value.
(ii) The average minimum air temperature,which varied from 15.7°C in 1963 to 17.4°C in1961 and 1965, the normal value being 16.6°C.
(iii) The mean daily range of air temperature,which varied from 6.7°C in 1965 to 9.3°C in1956, the normal value being 8.2°C.
Low rainfaII, low minimum and high dailyrange of air temperature, favour high sucrose content of the harvested sugar cane, whereas highrainfall, high minimum and low daily rangeinhibit cane maturation.
A search for the better understanding ofthese relationships is the object of this note.
Table 46 gives the monthly values forrainfall and air temperatures observed during thematuration period for the two con trasted years:1956 with 12.95* sugar manufactured % cane,and 1965 with only 11.1%**.
Table 46. Rainfall and temperature during maturation period for two contrasted years
July August September October Sum 0/ monthlyrain/all excesses
(E)
Normal rainfall, inches (1875-1949) 4.59 4.15 2.90 2.81 2.51956 2.94 2.82 1.68 1.40 0.01965 9.01 9.43 6.67 3.46 14.1
JulY-Dei.Av. min . air temp. QC (normaIs, 1950-1965) .. . 16.4 16.0 16.5 17.4 16.6
1956 15.0 15.6 16.6 17.8 16.21965 17.5 16.7 17.3 18.3 17.4
Mean daily range air temp. QC (norrnals, 1950-1965) 7.6 8.0 8.4 8.8 8.21956 9.0 9.2 9.2 9.6 9.31965 6.6 6.3 6.9 7.2 6.7
• Equivalent to 7.7 tons of cane per ton of sugar
.. Equivalent to 9.0 tons of cane per ton of sugar

-102-
The normal value for the sum of monthlyrainfall excesses (E) being 2.5 inches, and therelationship between excess rainfall and sugarmanufactured % cane being logarithmic, it hasbeen found necessary to transform the meteorological data and adopt the term log 4 E inorder to obtain a normal value of 1.00.
On the other hand, air temperature shouldbe expressed as the ratio of the daily range tothe minimum in order to increase the sensitivityof this meteorological index. As the normalvalues for mean daily range and average minimum air temperatures are 8.2°C and 16.6°Crespectively, it has been found convenient tomultiply the ratio by 2 in order to obtain anormal value of 1.00.
Therefore, the two meteorological indices
chosen for explaining fluctuations in cane qualityare: (i) log 4 E, a mathematical transformationof the rainfall excess and (ii) x, twice the ratioof temperature daily range divided by minimumair tempeature. The normal values of bothindices are equal to 1.00.
The indices E and x have been workedout as usual for the sugar area of Mauritiusas a whole, from observations collected on 18selected stations for rainfall, and on 5 rep resentative stations for air temperatures.
A class analysis given in Table 47 for themonthly values of the ratio x, twice dailyrange over minimum temperature, and observedrainfall for the whole period of 204 monthsfrom 1950 to 1965 shows that the two valuesare very closely associated.
Table 47. Relationship between rainfall and temperature ratio
No . of monthly observations
6
12
24
40
42
46
27
5
Ratio x twice daily range Monthly rainfallmin. temp.
Class Average inches log. inches
1.20 - 1.29 1.26 1.9 0.279
1.10 - 1.19 1.13 2.8 0.447
1.00 - 1.09 1.05 3.0 0.477
0.90 - 0.99 0.94 4.9 0.690
0.80 - 0.89 0.85 6.1 0.785
0.70 - 0.79 0.75 9.1 0.959
0.60 - 0.69 0.65 12.5 1.097
0.50 - 0.59 0.55 19.2 1.283
The monthly values (median and extremes) for the per iod 1950-1965 are given in Table 48.
Table 48. Monthly variations in temperature ratio x and rainfall.
TemperatureRatio x
Median ...
Extremes
N
0.97
1.28
0.68
D
0.83
0.96
0.59
J
0.73
0.91
0.62
F
0.70
0.91
0.52
M
0.69
0.87
0.50
A
0.75
0.91
0.60
M
0.87
1.18
0.66
.J
0.89
1.09
0.72
J
0.90
1.20
0.75
A
0.94
1.30
0.76
s
1.04
1.20
0.78
o
1.02
1.18
0.80
MonthlyRa infall
Inches ...
Log inches
4.0 8.7 10.6 11.0 13.7 8.2 5.7 5.7 5.5 4.2 3.4 2.8
0.602 0.740 1.025 1.041 1.137 0.914 0.756 0.756 0.740 0.623 0.531 0.447

-103-
Table 49 gives the monthly values of the years 1956 and 1965.temperature ratio x for the two contrasted
Table 49. Monthly values of temperature ratio x for two contrasted years.
Median19561965
July
0.901.200.75
August
0.941.190.76
September
1.041.110.80
October
1.021.090.80
July-October
0.981.120.78
The following six regression equations havebeen worked out for calculating sugar manufactured % cane (y) when the sum of monthlyrainfall excesses (log. 4 E) is known for thematuration period July to October, observed
over the whole sugar area of Mauritius, for15 years between 1950 and 1965 (cyclone year1960 excluded). The number of degrees offreedom is 13.
correlation caffi cient r
MauritiusWest SectorNorth SectorEast SectorSouth SectorCentral Sector ...
)'m
)'w
y"YeYsye
11.87 - 1.1912.31 - 1.0912.39 - 1.5811.65 - 1.1011.45 - 1.0612.12 - 0.85
(log 4 E - 1.01 )( )( )( )( )( )
- 0.936- 0.897- 0.827- 0.769- 0.914- 0.881
Figure 26 gives a generalized graphicalrepresentation of the six above mentionedregression equations relating sugar manufactured % cane to the sum of monthly rainfallexcesses for July-October averaged over thewhole sugar area of Mauritius.
Six other regression equations have been
worked out for finding sugar manufactured %cane (y), when the temperature ratio x is knownfor the maturation period July to October,observed over the whole sugar area of Mauritius for 15 years between 1950 and 1965(cyclone year 1960) excluded). The number ofdegrees of freedom is 13.
correlation cafficient r
MauritiusWest SectorNorth SectorEast SectorSouth SectorCentral Sector ...
)'m
)'wYnYeYsYe
11.87 -:- 5.0712.31 -:- 5.0412.39 - r- 7.5211.65 4.6511.45 + 4.2212.12 + 3.51
(x - 0.98)( )( )( )( )( )
+ 0.703+ 0.770+ 0.731+ 0.601+ 0.673+ 0.674
Both meteorological factors selected, i.e.sum of monthly rainfall excesses (E) for JulyOctober and ratio twice daily range overminimum air temperature (x) for July-October,show a highly significant correlation with sugarmanufactured % cane for Mauritius, or for eachof the five sugar sectors taken separately.Neverthel ess, it is clear that the rainfall excessfactor is the dominant one under the conditionswhich prevail locally.
The regression ccefficients b are the highest
for the North Sector, 1.58 and 7.52, and thelowest for the Central Sector, 0.85 and 3.51,which means that fluctuations in cane qualityare much wider for the North Sector than forthe Central Sector.
The temperature ratio x may be usedwith advantage as a general climatic index forcane quality (in the absence of late irrigationand high water table), as shown below withreference to the maturation period July toOctober.

-104-
14.0 \\
\\\
13,0\\\\\
u.J \\\\z
~ \q:u r \\~ ~ \
" \ -,0" \
- \ \u.J
\a:: <,~ \
.~"I- 12.0 \
u \q: \u... \~ -,z '.-c:L -,
-,
• <,a:: <, ---c -,
<, --o <,
~.
---- ----c./) --.11.0
- " --- ---....
10.0-+--.--.--------,.---,----.--.----.-----.---,---.----.-----,r-----.---,-----.---,o 2 3 4 5 b 7 8 g
INCHES
10 11 12 13 14 15 16
Fig. 26. Relation between sugar manufactured % cane and sum of monthly rainfall excesses from July to October.
MauritiusNo rthSouth
EastWestCentre

-105-
Table 50. Temperature ratio x as a General climatic index for cane quality
Mauritius West North East South CentreMedina Pamplemousscs FUEL Plaisance Vacaas
(irrigated)Daily range ... 8.2 10.3 9.0 7.3 7.0 7.3°CMin. temp. ... 16.6 17.0 16.9 17.0 17.6 14.3°CTemp. ratio .. . 0.99 1.I9 1.06 0.86 0.79 1.02Sugar manuf. % cane for sector 11.9 12.3 12.4 11.6 11.4 12.1
It can be seen in the above table that atemperature ratio of 1.00 separates the sectorsinto two groups: West, North, Centre with
high cane quality (temperature ratio above 1.00),and East and South with lower cane quality(temperature ratio inferior to 1.00).
3. FORECASTING FINAL SUGAR PRODUCTION FROM AUGUST ONWARDS
PIERRE HALAIS
Ten years have now elapsed since theM.S .LR.I. started to circulate, in 1955, a weeklybulletin giving essential information on theevolution of the sugar cane crop in each of thefive sugar sectors.
The mass of information now availableconstitutes excellent material for attempting,by means of appropriate statistical methods, todevise the right procedure for making, as early aspossible, and within a specified margin of error,objective forecasts of the final sugar production.
Three steps are necessary to earry out thefinal forecast:
(i) An estimate of the final tons of sugarper arpent on millers' plantations by means ofappropriate regression equations giving a marginof error within the probability of 0.90.
(ii) A conversion factor for obtainingaverage (millers and planters) tons of sugar perarpent from millersdata.
(iii) An estimate of the total area expectedto be harvested.
(a) Estimate of millers' final sugar per arpent
final figure, the first object of our study, is madeavailable.
The steps to be followed will be given belowas an example dealing with the final sugarproduction of the island as a whole.
Table 51. Tons of sugar per arpent for millers
Year Aug . Sept . Oct . Nov . Final
(xr ) (X2) (X3) (X4) (y)
1955 3.19 3.60 3.81 3.92 3.911956 3.82 4.13 4.23 4.20 4.141957 3.72 3.98 4.14 4.17 4.171958 3.56 3.70 3.79 3.80 3.701959 3.81 3.94 4.02 4.01 3.981960 1.21 1.32 1.41 1.46 1.511961 2.97 3.19 3.40 3.53 3.601962 3.05 3.21 3.26 3.23 3.231963 3.79 4.01 4.15 4.19 4.191964 2.73 2.91 3.02 3.07 3./1
Average 3.19 3.40 3.52 3.56 3.55
Four regression equations have beenworked out where y is the final tons of sugarper arpent, and x., X 2 , X 3, X 4, are the successive monthly values. The number of degrees offreedom is 8.
Table 52. Regression equations
Correlation cofficientsThe weekly bulletin of the Institute allowsthe intrapolation of tons of sugar per arpenton the lst of eaeh month.rorn August fonwards,up to the end of the crop season when the
Aug . ySept. yOct. yNov. y
Regression equations
3.55 + 0.986 (Xl - 3.19)3.55 + 0.957 (X2 - 3.40)3.55 + 0.952 (X3 - 3.52)3.55 + 0.967 (X4 - 3.56)
+ 0.972+ 0.987+ 0.994+ 0.998

-106-
Table 56. Conversion factors for calculating area harvested
(c) Area /0 be harvested
Table 55. Conversion factors for calculating averagesugar yields
Th e th ird information needed is the total areato be harvested . The latest figure should be used ,in case no real estima te is availabl e.
Year ThaI/sand arpcntharvested
Thousand arpentharvested
Year Factor A/M Year Factor A /M
1955 0.810 1961 0.8201956 0.822 1962 0.8531957 0.795 1963 0.8431958 0.803 1964 0.8591959 0.797 1965 0.8571960 0.830
Year
of suga r per arpent including both millers andplanters.
Ta ble 55 gives the conversion factors (AiM)to be used for converting millers sugar yields(M) to average sugar yields (A). Ob viously, theproper factor to use IS the latest available,that is for 1965, the factor observed in 1964.
Table 53. Expected margin of error on final tonssugar per arpent (P 0.90)
M onthly values of Aug. S ept . OC I. N ov.tons sugarlarpt,
(x)
1.50 + 0.32 + 0.21 - t - 0.15 ,0.08
2.00 + 0.25 + 0.17 + 0.12 0.07
2.50 0.18 + 0.13 0.09 ' ,' 0.05
3.00 0.14 + 0.09 -;- 0.07 T 0.04
3.50 0.15 + 0.08 -I- 0.05 -;' 0.03
-1 .00 0.20 + 0.10 -1- 0.06 0.03
4.50 0.27,
0.14 -1- 0.09 '. ' 0.05-
5.0 0 + 0.35 + 0.19 0.11 -;- 0.06
As could be expected , the precision of theforecast for final tons of sugar per arpentincrea ses from August onwards, as proved bythe correlation coefficients which rise gra duallyfrom 0.972 in August to 0.998 in November.
Allowing for a probability P of 0.90, themargin of error expected on the final ton ssugar per arpent has been calculated for variousvalues of x, the monthly values, according tothe procedure of DIXON & MASSEY (1951).
Table 57. Forecast of final sugar production
For the running forecast concerning the1965 sugar campaign, assuming a conversionfactor of 0.859 and the area harvested to be195.000 arpcnts, the final factor works out to0.859 ;< 195 167.5 for calculating the totalsugar alr ead y estimated. (Table 57).
COliversion fac tors(0.85 9 x 195 -167.5)
The following example has been worked outfrom data presented in the weekly bulletin forthe 1965 campaign (Table 54). Appropriateregression equations were taken from Table 52,and the margin of error from Table 53.
Table 54. Final production foreca st, 1965
Monthly values observed Filial values calculatedl Oll S sugurj arpent tons sugarjarpent ,
Aug. 3.59 3.95 + 0.16
Sept. 3.76 3. 90 + 0.09
Oct. 3.89 3.91 + 0.06
Nov. 3.93 3.93 + 0.03
Final 3.96 (observed)
195519561957195819591960
Filial tons sugar/arp t. expected 0 11
millers plantations.
168.6167.9169.6176.7183.1188.4
19611962196319641965
187.3193.8194.1194.9194.1
Forecast of fi nalsugar production
th, tons.
(b) Relation between Millers' and Planters' sugary ields.
The abo ve-mentioned ton s of sugar perar pent refer exclusively to mill owners plantations and what is finally needed is average tons
Aug. 3.95 -I- 0.16
Sept. 3.90 -+ 0.09
Oct. 3.91 + 0.06
Nov. 3.93 ' 0.03
Actu al production
X 167.5 662 ;' 26
x 167.5 653 T 15
»; 167.5 654 " 10
v 167.5 658 -t- 5
664.5

-107-
It is realized that the conversion factorsare also subject to uncertainty, which means thatthe real margin of error will exceed those givenabove.
Similar statistical analysis has been carriedout for each of the five sugar sectors separatelyand given in Table 58.
Table 58. Regression equation for the sugar sectors
The expected margin of errors for P 0.90has also been calculated for each sector separatelybut needs not be reproduced in this short note.
The conversion factors (A/M) for calculating average tons sugar per arpent from millers'values are given in Table 59.
Table 59. Conversion factors (A/M) for calculating averagetons. sugar per arpent from millers' values
WEST SECTOR
Aug. y = 4.06 + 1.057 (Xl - 3.90) + 0.958Sept. y = 4.06 + 0.968 (X2 - 4.00) + 0.966Oct. y = 4.06 + 0.898 (X3 - 4.09) + 0.978Nov. y = 4.06 + 0.965 (X4 - 4.07) + 0.995
NORTH SECTOR
Aug. y = 3.70 + 0.726 (Xl - 3.34) + 0.705Sept. y = 3.70 + 0.881 (X2 - 3.67) + 0.808Oct. y = 3.70 + 0.940 (X3 - 3.75) + 0.861Nov. y = 3.70 + 0.954 (X4 - 3.76) + 0.888
EAST SECTOR
Aug. y = 3.59 + 0.989 (Xl - 3.41) + 0.946Sept. y= 3.59 + 0.962 (X2 - 3.52) + 0.972Oct. y= 3.59 + 0.945 (X3 - 3.61) + 0.992Nov. y= 3.59 + 0.950 (X4 - 3.61) + 0.997
SOUTH SECTOR
Aug. y = 3.35 + 1.040 (Xl - 3.00) + 0.981Sept. y = 3.35 + 0.987 (X2 - 3.19) + 0.991Oct. y = 3.35 + 0.965 (X3 - 3.29) + 0.997Nov. y = 3.35 + 0.967 (X4 - 3.34) + 0.999
CENTRAL SECTOR
Aug. y= 3.55 + 1.072 (Xl - 3.15) + 0.985Sept. y= 3.55 + 1.000 (X2 - 3.43) + 0.987Oct. y= 3.55 + 0.975 (X3 - 3.55) + 0.994Nov. y= 3.55 + 0.982 (X4 - 3.57) + 0.999
Regression equations Cafficients of correlation West North East South Centre
1955 0.810 0.810 0.708 0.886 0.8361956 0.839 0.792 0.756 0.893 0.8291957 0.858 0.728 0.727 0.893 0.8391958 0.864 0.732 0.711 0.904 0.8461959 0.852 0.717 0.752 0.885 0.8341960 0.761 0.734 0.748 0.884 0.9091961 0.788 0.805 0.746 0.893 0.8391962 0.824 0.794 0.776 0.917 0.8731963 0.849 0.794 0.769 0.919 0.8511964 0.882 0.779 0.771 0.934 0.8801965 0.908 0.792 0.792 0.943 0.877
The general conclusion arising from thisstatistical study is that the Institute has nowa reliable method for forecasting the finalsugar production, with a reasonable margin oferror for Mauritius as a whole, and for fourof the sugar sectors namely West, East, Southand Centre separately. However, a usefulforecast for the North Sector, as shown by themuch lower values of the correlation ccefficients,is difficult to obtain owing to the verynature of the local climatic conditions whichmay exercise a decisive influence on the sugaroutput, even up to an advanced date in the cropseason.
REFERENCES
DIXON, W. J. and MASSEY, F. J. jr. (1951) Introduction to statistical analysis, 2nd. ed. London, Mc Graw Hill. p 192.
4. IRRIGATION SURVEY, 1965
G. MAZERY & M. HARDY
A survey carried out at the end of 1965revealed that there are approximately 30,000arpents, representing 14.6% of cane lands, underirrigation at present, of which 21,500 arpentsbelong to estates and 8,500 to planters.
The distribution of irrigated lands by. sectors inrelation to total area and cane area is given inTable 60, which shows the pre-eminent positionof irrigation in the West where cane cultivationcannot be economically carried out without

-108-
additional water.
The system of irrigation used is given inTable 61, which shows that overhead irrigationis practised over 38% of the total irrigatedarea. A comparison with data available for1963 IS of interest. During this period
area irrigated has increased by approximately2,600 arpents, and overhead irrigation has beenextended by 8 %.
Data presented in Table 62 show the areairrigated by different types of growers, as well asthe system of irrigation used, and changes whichhave taken place during the last two years.
Table 60. Distribution of irrigated lands in relation to total area and cane area, 1965
West ...NorthEast .South .Centre
Total
Approximate area 0/ sectorarpents
56,00091,00072,000
160,00063,000
442,000
Approximate cane area,arpents
13,53055,19045,60066,40025,620
206,340
Area under irrigation,arpents
10,9807,8003,8204,6802,750
30,030
Table 61. Comparison between surface and overhead irrigation
Area irrigated, arpents
Sur/ace Overhead
West 8310 2670North 3900 3900East 1320 2500South 2600 2080Centre 2550 200Island 18680 11350
Table 62. System of irrigation used by different types of growers
Area irrigated, arpents
Sur/ace/963 /965
Overhead/963 /965
Planters ...EstatesTotal
7,30812,82820,136
6,24012,44018,680
2,0026,7328,734
2,2509,100
11,350
5. ECONOMICS OF IRRIGATION IN MAURITIUS
G. MAZERY
The purpose of these notes is to summarizeinformation available at the M.S.I.R.I. on therelative costs of surface and overhead irrigation.
Basic data on this subject were obtainedfrom experiments carried out by the Instituteduring a period of 5 years. In addition, information on the cost of large-scale irrigationschemes was obtained from several sugar estates.
Many factors have to be considered, underlocal conditions, before a final decision is reachedon the type of irrigation - surface or overhead- best suited for a given locality. Of these,climate, availability of water, soil type, andtopography of land, size and type of holding,are the most important, and are analysedseparately.

-109-
Quantity of water used for one irrigation
Size and Type of Holding
(Latosolic Reddish Prairie) which are too permeable. In this latter case, the most rationalsystem is overhead irrigation, which allows anaccurate control of the amount of water applied,irrespective of the type of soil and topographyof the land, thus enabling an important watersaving.
The following data illustrate this point:
For the purpose of Irrigation possibilities,the cane growing area of Mauritius can beclassified into the following units :(i) planters cultivating less than 20 arpents;(ii) planters cultivating between 20 and 100
arpents;(iii) planters cultivating more than 100 arpents;(iv) factory grown canes.
The number and distribution of thesegroups in different sectors of the island areshown in Table 63.
2.0 inches19.0
"Gravelly" soils
2.0 inches6.0
"Free" soils
Overhead ...Surface
In fact, in several regions of the island,cane lands which had been abandoned, as wellas large areas which had never been cultivatedbecause they required too much water by surfaceirrigation, have recently been put under cultivation as a result of conversion to the overheadsystem of irrigation.
The water saving derived from the use ofoverhead irrigation may result in an appreciableincrease in the development of land where thereare still uncultivated areas of reasonable agricultural potential, and where water is the limitingfactor.
Climate
Surface irrigation can only be practisedprofitably on "free" soils (Low Humic Latosols).It cannot be considered for "gravelly" soils
Availability of Water
The main supply of irrigation water inMauritius is from Government and privatelyowned reservoirs, from water rights on riversand springs, from residual water from factories,and from underground resources. Costs willobviously fluctuate within wide limits. Thus,water supplied by Government from "La Ferme"reservoir and Magenta canal in the west ischarged at Rs. 0.25 cs for 4000 cu. ft, and thatsupplied from "Nicoliere" to the northernsector is charged at Rs. 0.50 cs for 4000 cu. ft.The cost of ground water varies, depending onthe depth of the well and the source of energyfor pumping, while the cost of water is negligible for planters who enjoy water rights onrivers and springs.
Soil and Land
The number of irrigations required in acane growth cycle, hence the cost, will fluctuateconsiderably according to the particular climaticzone concerned. For example, in the West about20 irrigations a year are required, while in otherregions, 6 to 15 irrigations per year are sufficientunder normal conditions for satisfactory canegrowth. Essential data to be considered in thisconnection are rainfall deficits and evapotranspiration of the specific region to be irrigated.In this connection, the agro-clirnatic map ofMauritius, which will be published shortly bythe Institute, will prove of great assistance inthe determination of the amount of irrigation
.water required and of frequency of application.
Table 63. Number and area of cane growing units
Less than 20 arp. Between 20-/00 arp, More than /00 arp, Factories Total Cane
Number Area Number Area Number Area Number Area Area
West 666 1655 30 1565 12 3205 I 7108 13533North 9693 20285 III 4375 27 10340 6 20193 55193East 6664 16719 79 3600 13 2981 3 22300 45600South 5226 10812 98 4984 14 4204 10 46400 66400Centre 4660 7633 63 2595 4 1232 3 14158 25618
Island 26909 57/04 38/ 17//9 70 2/962 23 //0/59 206344

-1l0-
Irrespective of climatic conditions, und erwhich additional water is desirable to improveyields, it is considered that cane un its of lessthan 20 arpents cann ot be irr igated economicallybecause water losses become excessive withdiminish ing size of irrigated area. On the otherhand, the minimum size of holdin g for efficientoverhead irr igation using diesel oil as sourceof power is about lOO arp ents. In any majo rplan for develop ing irrigat ion in Mauritius,therefore, it should be borne in mind that agross area of 57000 arp ents should be excluded,unless small growers can be grouped into largerunit s for the purpose of irrigation . Concerningoverhead irrigation, a further area of approximately 17,000 acres should be neglected.
As indicated above, the size of cane unit swhich can be safely considered to be min imal
for irrigat ion are
Surface irriga tio n : not less tha n 20 arpcnt sOverh ead " (diese l pu mping) : not less than 100 a rpc nts
., (electric pumping) : not less than 50 ar pents
Another factor of importance, governed bythe type of holdin g, is that in the case ofplanter-grown cane, the increase in yield mustalone compensate irr igation expenditure. In thecase of facto ry-gro wn cane, however, the marginof return in the field may be smaller because oflower cost in processing a larger supply of rawmaterial.
An indication of additiona l cane productionrequired by planters to compensa te the increasedcost of eane production ansing through irrigation is given in Table 64 for different sugarprices.
Table 64. Additional cane production required to compensate cost of irr igation
I. Price of sugar per ton
2. Value to planter of I ton cane at 12.00% extract ion
3. No. of irrigations per annum
4. Additional tons cane required to cove r costs andinterest on capital investment :
(i) Overhead irrigation (by semi-per manent system)
(li) Surface irrigation
Rs. 400
Rs . 32
10 15 20
5.8 8.7 11.6
2.5 s.s :. I
Rs. 450
Rs. 36
10 IS 20
5.1 7.6 10.0
J 3.4 4.5
Rs. 500
Rs. 40
10 15 20
4.7 7.0 9.3
2.0 3.0 4 1.'
Cost of Irrigation
The approximateoverhead irrigation are
These dat a are
costs of surface andsummarized in Table 65.based on a small-scale
experiment carried out on an area of 50 arpentsby the M.S.I.R.I. over a period of 5 years. Onesta te practice, the running cost per acre inchwould have to be increased so as to ta ke intoaccount overhead administrative charges.
Table 65. Cost s of surfa ce and overhead irri gation
Overhead irrigation S urface irrigation
Capital Cost - Rs/acr e ...
Running Cost - Rs/acre inchInt erest at 7 % on capitalD epreciation of spraying equipmentD epreciation of diesel engineFuel and maintenance .. .Maintenance of channels and reservoirsLabourWater
Total Rs/acre/inch
Se mi-permanent system
1000
2.001.400.703.~0
1.750.25
9.30
Mob ile sys tem
650
1.102.200.803.70
2.750.25
10.80
250
0.10
0.340.660.25
1.35

-111-
As indicated in a preceding section, 2"of water applied by overhead irrigation areequivalent to the minimum of 6" applied bysurface on Low Humic Latosols. In consequence,it is necessary to determine, for comparativepurposes, the cost per irrigation cycle, whichworks out as follows :
Overhead irrigation, semi-permanent system = Rs. 9.30 x 2 = Rs. l8.60/acre
Overhead irrigation, mobilesystem ... = Rs.10.80 >: 2 = Rs.21.60/acre
Surface irrigation ... =Rs. 1.35;<6 = Rs.8.IO/acre
1t will be noted from Table 65 that thecost of pumping with diesel motor represents
approximately 40 % of the running expenses ofoverhead irrigation. Considerable economycould be achieved by using electricity. Thus atthe present tarifT*, it is estimated that the costof pumping, using electr ic motors, could bereduced to Rs. 2.50 per acre inch, instead ofRs . 3.60. In addition, electr ic motors arecheaper than diesel engines , both as regardsmaintenance and capital cost, but the capitalinvestment would be influenced in a largemeasure by the proximity of existing power lines.
Finally, it should be mentioned that whereadvantage can be taken of natural water heads,the cost of overhead irrigation could be decreased by a very wide margin.
6. NOTES ON METHODS OF PLANTING
G. ROUILLARD
The general practice of cane planting inMauritius is to place the cuttings in furrows,earthing up being carried out every year orevery other year, chiefly in the super-humidzone where Humic Ferruginous Lato sols andLatosolic Brown Forest soils arc predominant.Consequently , in older ratoons, the lines of canesare raised above the interlines which formdrains between the cane rows. This practiceis beneficial under conditions of poor drainage.
On the Dark Magnesium Clays and GreyHydromorphic soils, impeded drainage is therule and 79% of the root system is to be foundin the upper 9" of soil (MONGtLARD, 1963).Mo st of these soils occur in the sub-humidzones, in the west and north west of theisland , and require irrigation. One of the difficulti es in the management of these soils is to
• Tariff 511 of the Centr al Electricity Board.
strike a balance between irrigation and drainage.A method of planting that would allow for
a drainage system between the lines shouldtherefore be envisaged, and forms the object ofthe trial s which are described below.
Experiments carried out by the Sugar CaneResearch Station (d'EMMEREz, 1943) to compareplanting in furrows and on ridges in the superhumid zone resulted in an annual increase of5.1 tons per acre from virgins to 2nd ratoons infavour of ridge planting. The marked increasein yield obtained might be due to the fact thatin those days soil preparation was improperlydone because of lack of mechanical means .
In 1962, two experiments were planted onDark Magnesium Clays, and in 1963, three oth erswere laid down, one on the same type of soiland two on Humic Ferruginous Latosols.

-112-
The layout employed throughout was thelatin squar e, and the treatments were the following:
(i) Fu rrow planting ;(ii) Planting on flat ground;(iii) Planting on flat ground with a drain on
every other interline;(iv) Planting on ridges.
Each plot cons isted of 8 rows of cane of50 feet in length , the two centre rows of whichwere weighed at harvest, and a sample analysedfor sucrose content. The fields were cross
ploughed mechani cally, and other cultural operations were carried out by hand .
The results presented in summarised formin Table 66 are avera ge for virgins and lstratoons for trials A to C, and averages forvirgins, l st and 2nd rat oons for trials 0 and E.Although the differences in yield have not beenfound to be sta tistically significant, they areconsidered to be of suffic ient int erest at thisstage to draw attention to the importance ofdrainage, particularly in hydromorphic soils.The se trial s will be pur sued until the 5th ra too nwhen the results will be fully ana lysed.
Table 66. Compara tive yields obtained by different method s of planting on badl y drained soils
Hum ic Ferruginous Lat osol" Dark Magn esium Clay
Trial A Trial B Average Trial C Trial D Trial E Average
F urrow plan ting (standard) 12.8 21.9 17.4 36.5 28.7 33.3 32.8Plant ing on flat gro und 12.8 2 1.1 17.0 36.3 30.4 31.7 32.8P lant ing o n flat ground with dra ins
on eve ry a lte rna te interl ine 12.9 20.9 16.9 42.5 29.0 33.4 35.0Plan ting on ridges 13.7 22. 7 18.2 39.9 29.0 32.5 33.8S.D. a t 5 % 1.3 2.4 4.7 2.3 2.7
• T he low yields ob tai ned in Trials A and B a re du e to the fact th at th e exper ime nts were la id down onseni le so ils.
REFERENCES
D ' EMM EREZ de C HA R MOY , A. (1943) . Methods ofplan t ing experiments. Rep. Sag. Cane Res. Sin Mauritius. 14 : 16
MONG EL ARD , C. (1963) Ma thematical tr ea tm ent ofda ta upo n roo t systems suga r cane . 1'1'0(' . in/ Soc.Sugar Cane Technol, 11 : 253-26 1.
7. PRELIMINARY RESULTS OF EXPERIMENT WITH PETROLEUM MULCH
M. HARDY
A new ar tificial mulch derived from petroleum has been put locally on the mark et in 1964.Known under the trade name of EAP 2000,th is chemical consists of a speciaIly formulatedwater emulsion of petroleum resins, and isrepor ted to have given goo d results on certa incro ps, such as vegetables, cotton, and fodderplants. It was thought, therefo re, that thispro duct was worth experimenting with , as no
reference on the use of th is mul ch on sugarcane could be traced in the literature.
One of the lead ing propert ies claimed forth is artificial mulch , apar t from reducing evaporat ion losses, is to increase the soi l tempera ture . Several cane lands in Mauritius have arecru iting problem when canes are planted inearly winter, and moreover , germ ination is slowand growth seriously retar ded in the ear ly sta ge
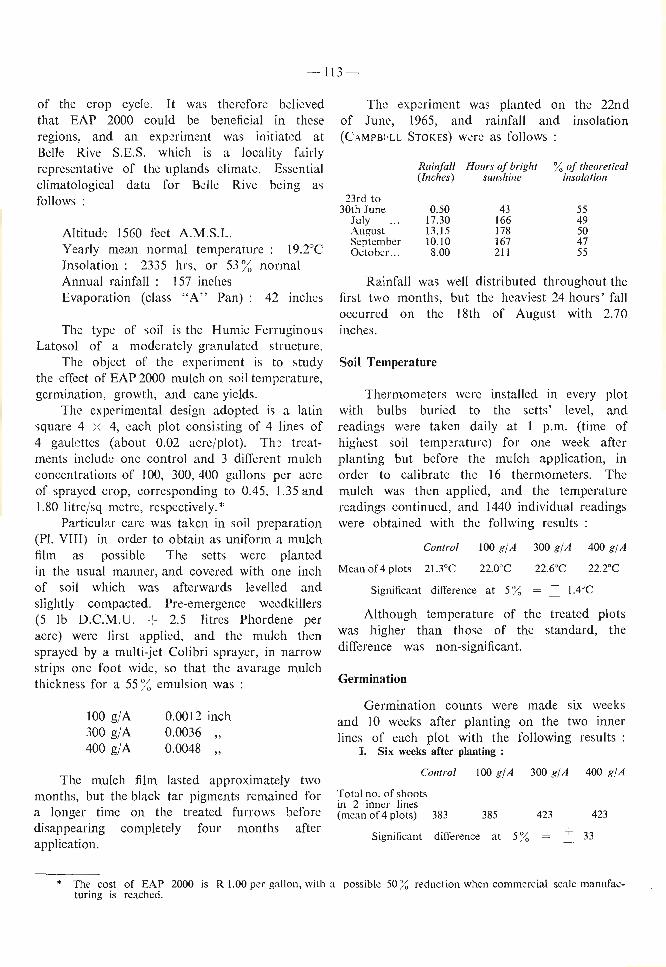
-1I3-
Germination
Soil Temperature
Rainfall Hours of bright %of theoretical(fnch es) sunshine insolation
The exp eriment was planted on the 22ndof June, 1965, and rainfall and insolation(C-\MPBELL STOK ES) were as follows :
300 glA 400 glA
22.6°C 22.2°C
+ 1.4°C
Control lOO glA
Significant difference at 5 %
23rd to30th June 0.50 43 55
July 17.30 166 49August 13.15 178 50September 10.10 167 47October .. , 8.00 211 55
Mean of 4 plots 21.3°C
Rainfall was well distributed throughout thefirst two months, but the heaviest 24 hours' falloccurred on the 18th of August with 2.70inches .
Thermometers were installed in every plotwith bulbs buried to the setts' level, andreadings were taken daily at I p.m. (time ofhighest soil temperature) for one week afterplanting but before the mulch application, inorder to calibrate the 16 thermometers. Themulch was then applied, and the temperaturereadings continued, and 1440 individual readingswere obtained with the foil wing results :
Although temperature of the treated plotswas higher than those of the standard, thedifference was non-significant.
of the crop cycle. It was therefore bel ievedthat EAP 2000 could be beneficial in theseregions, and an experiment was initiated atBelle Rive S.E.S. which is a locality fairlyrepresentative of the uplands climate. Essentialclimatological data for Belle Rive being asfollows:
Altitud e 1560 feet A.M.S.L.Yearly mean normal temperature 19.2°CInsolation: 2335 hrs, or 53 % normalAnnual rainfall: 157 inchesEvaporation (class " A " Pan): 42 inches
The type of soil is the Humic FerruginousLatosol of a moderately granulated structure.
The object of the experiment is to studythe effect of EAP 2000 mulch on soil temperature,germination , growth, and cane yields .
The experimental design adopted is a latinsquare 4 x 4, each plot consisting of 4 lines of4 gaul ctt cs (about 0.02 acre/plot). The treatments include one control and 3 different mulchconcentrations of 100, 300, 400 gallons per acreof sprayed crop, corresponding to 0.45, 1.35 and1.80 Iitrc/sq metre, respectively. *
Particular care was taken in soil preparation(PI. VIII) in order to obtain as uniform a mulchfilm as possible The setts were plantedin the usual manner, and covered with one inchof soil which was afterwards levelled andslightly compacted. Pre-emergcnce weedkillers(5 Ib D.C.M.V. + 2.5 litres Phordene peracre) were first applied, and the mulch thensprayed by a multi-jet Colibri spraycr, in narrowstrips one foot wide, so that the avarage mulchthickness for a 55 % emulsion was :
100 gjA300 g/A400 g/A
0.0012 inch0.00360.0048
Germination counts were made six weeksand 10 weeks after planting on the two innerlines of each plot with the following results :
I. Six weeks after planting :
The mulch film lasted approximately twomonths, but the black tar pigments remained fora longer time on the treated furrows beforedisappearing completely four months afterapplication.
Control lOO glA 300 gl A 400 glA
Total no . of shootsin 2 inner lines(mean of 4 plots) 383 385 423 423
Significant difference at 5 % + 33
* The cost of EAP 2000 is R 1.00 per gallon, with a possible 50 % reduction when commercial scale manufacturing is reached.


- 115 -
Each plot was sampled for analysis ofsugar, but it was found that spacing exerts
of 60 kg of nitrogen was applied annually inaddition to 50 kg of soluble phosphate andpotassium.
Yield comparison s were obtained by weighing the centre rows of each plot in order thatthe area was the same except in the 5 I spacingin which a correction factor had to be used.(x 1.2, correction for difference in area). Caneweight was therefore obtained as follows :
(a) 3 feet spacing(b) 4(c) 5(d) 6
4 rows per plot3
2 " "2
no in fluence on sucrose content of cane.
Discussion of results
Data have been obtained so far for virginsand l st ratoons in eight trials , two other trialsof the super-humid zone having failed becauseof accidental causes.
A spacing distance of 4 feet has given thebest results for the six trials of the sub-humidand humid localities irrespective of the varietyand climate, but no significant difference hasbeen found between the other treatments forall the trials (Table 67).
It is not intended to make any recommendations at this stage since the experimentswill be pursued until the 5th ratoon.
Table 67. Yields obtained for different spacing distances under different climatic conditions
Sub-humid < 50" Sub-humid Humid Average Humid AverageLocality Irrigated Low elevation for High elevation for
50' -75" A to F* 75"-100" GandH
Variety A 8 C D E F G HM.147/44 8 .37172 M. 147/44 8.37172 M .147/44 8 .37172 M .93/48 Ebene50/47
Spacing3 feet4 feet5 feet6 feet
27.631.526.527.9
22.824.622.324.8
42.844.941.037.7
34.938.232.431.0
42.144.342.743.5
44.744.841.041.2
35.8238.0534.3234.52
42.642.544.942.3
35.335.836.334.3
38.939.140.638.4
* Sig. d iff. a t 5 %, 1.95
REFERENCES
B.S.E.S., Queensland (1961) . The effect on crop of varying interspaces. Rep . 8ur . SlIg. Exp. SUI Qd 61: 35
D'EMMEREZ de CHARMOY, A. (1942). Spacing trials.Rep. Sug . Cane Res. Stn Mauritiu s 13 : 22 - 25
S.A .S.E.S. (1964 - 1965). Plant populations. Rep. Exp.Stn S. Afr. Sug. Ass., 1964 - 65 : 50 - 52

SUGAR MANUFACTURE
1. THE PERFORMANCE OF SUGAR FACTORIES IN 1965
J. D . de R. de SAINT ANTOINE
A SYNOPSIS of the chemical control figure sof the twenty-three factories of theisland is given in Appendix XVII[
(i) to (v).
Cane and sugar production
The climatic conditions which prevailedduring the vegetative period of the crop werecharacterized by good rainfall distribution whichwas close to normal , except for th e coastalareas which suffered from drought in Februaryand March. As a result a large cane crop wasstanding when the first mills started crushing inea rly July, in spite of the fact that temperatureswere 0.6°C below normal during the vegetativeperiod. The prospects wer e then excellent, andhopes were high that a record sugar productionwould be achieved. Unfortunately, climaticconditions were d isastrous for ripening duringthe maturity period, rainfall excesses abovenormal being the highest ever recorded inMauritius, whilst minimum air temperatureswere high, and difference between maximum andminimum temperatures was low. Althoughth ese conditions were favourable to the production
of a high cane tonnage, yet they affected canequality very adversely. Thus the tonnage ofcane harvested hit a new record figure of almostsix million tons, but sugar production amounted ,to only 664,000 tons. Table 68 gives the areacultivated, cane crushed and sugar producedduring the period 1961-65.
Table 68. Area cultivated (thousand arpents),cane crushed and sugar produced (thousand metric tons),
1961 - 1965.
1961 1962 1963 1964 1965
Area cultivated 201 205 204 207 207Cane crushed 4,943 4,624 5,547 4,375 5,984Sugar produced 553.3 532.8 685.5 519.0 664.5
Cane quality
As a result of the most abnormal climaticconditions which prevailed during the maturationperiod, sucrose per cent cane was very low,amounting to only 12.50, as against an average,of 13.23 for the past four years . As may beseen from Table 69, the northern sector wasthe most affected, and the central sector theleast, these sectors being in th e drier andwetter regions of the island respectively.
Table 69. Sucrose per cent cane , 1961-65
Year Island West North East South Centre
1961 12.81 13.06 13.46 12.53 12.42 12.911962 13.19 13.61 13.73 12.85 12.85 13.261963 13.47 14.26 13.97 12.91 13.18 13.791964 13.45 13.75 14.35 13.14 13.02 12.97
Av. 1961-64 13.23 13.67 13.88 12.86 12.87 13.23
1965 12.50 13.06 12.28 12.39 12.40 12.96% Reduction 5.8 4.5 11.5 3.7 3.7 2.0

- 118 -
The climatic conditions which prevailedduring the harve sting season were also conduciveto lower fibre in cane in 1965, as shown inTable 70. Concerning the mixed juice purity
Table 70. Fibre % cane and mixed juiceGravity Purity. 1961-65.
Year Fibre % Mixed jui ceCane Gravity Purity
1961 12.61 85.21962 13.85 85.91963 13.11 86.31964 13.85 86.41965 12.92 88.0
reported in the same table, it must be pointedout that, for the first time in 1965, all the sugarfactories of the island adopted precision suga rrefrac tometers for chemical control. As aresult, a ll the purity figures given in th is sectionfor the past crop cannot be compared withtho se for pre viou s crops when Brix was determined by spindle. How ever, since mixed juicepurity calculated with densimetric Brix is about1.5 units higher than that calculated withrefractometric Brix, it may be said that ju icepurity was practicalIy the same in 1965 as in1963 and 1964.
All factories adopted in 1965 the RietzVarigrator for bagasse analyses and for fibre
determinat ion of cane. Unfortunately somemechanical setbacks were encountered, du emainly to the fact that the dr iving shaft protrudesfrom the bottom of the bowl. Frequent failu res ofthe seal between this shaft and the bowl led theInstitute to modify an existing Rietz so that thedrive would be from the top instead . The details ofthe modificati on are shown in fig. 27. Thi sequipment was tested during the latter part ofthe crop, and the results obtained were quitesatisfactory. Th e disintegratin g performance wasvery good, being in fact even better than thatof the standa rd varigrator.
Milling
A synopsis of cru shing dat a and millingfigures is given in Table 71.
'With the record tonnage of cane harvestedthe duration of the crop was a little longer,amounting to 128 crushing days per factory onthe average. Several factories sta rted operatingin early July to stop only in lat e December.
Averagc tonnage of can e crus hed per hourexceeded for the first time the 100 metric tonmark, but tonnage of fibre ground per hourwas slightly lower than in 1964 as a result ofthe lower fibre figure obtaining in 1965.
Table 7]. Milling results, 196]-65
1961 1962 1963 1964 1965
No. offactories ... 23 23 23 23 23No. of crushing days 123 116 123 100 128No. of net crushing hrs/day 18.86 19.08 20.82 19.96 20.28H ours of s to ppa ges/da y" 0.80 1.03 0.88 0.83 0.72Time efficiency . .. 95.8 94.9 95.9 96.0 96.6Tons cane /ho ur 92.8 91.0 97.8 95.4 100.6Tons fibre/hour 11.70 12.60 12.82 13.21 13.00Imbibition % fibre 222 222 221 228 220Pol. % bagas se 2.09 2.18 2.08 2.03 1.93Moisture % bagasse 48.6 47.1 48.4 48.5 48.9Reduced mill extrac tion 95.8 95.8 96.0 96.2 96.0Ex tractio n rati o 33.3 33.9 31.7 3 1.0 31.7
* Exclusive of stop pa ges due to shortage of cane.
Because of the low sucrose content of thecane, reduced mill extrac tion was only 96.0 asagainst 96.2 the previous year. Th e onlyfactories where major altera tions were broughtto the milling plant are Highlands, where theold tandem was replaced by five turb ine-d riven38 X 72 inch mills, and FUEL where three of the
intermediate mil1s were replaced by larger unitsin order to cope with the increased tonnage.The milling plant of this factory, which in 1965crushed over 250 metric tons of cane per houron the average, now consists of two sets ofknives and seven turbine-dr iven 38 x 75 inchmil1s.

-119-
I I
Ii
o
NEW eow\
- -
-NEW SHAFT
c: >,. PLA STIC
' \ \ VEro.: T PiPE
"\~\
".,".,o·00., I:: i'iJlf \'----J...
I
tSTART ER REMQ\lED
AN D FIXE,? TO WALL
------r
I
I
I
-I-I
I
I
I
IIIIir---.----+-----,---
DRIP PROCFCOVER REMOVED
3 •1 t
oINCHES 'L-_-'--_ '----'-_ --'-_ -'-------'
Fig . 27 Modified Rietz Varigrator.
Excellent results were also 'achieved atSt. Felix, following the addition of 7-ft tallDonnclly-type vertical chutes to the last threeunits of the short four-mill tandem. Th e gainin reduced mill extraction attributabl e to thechutes was 0.44 and the benefit deri ved fromthe installation in 1965 exceeded the cost ofmanufacture and erection of the chutes, Rs. 25,000.Other factorie s in Mauritius would no doubtincrease their mill extraction at little cost byinstalling similar equipment.
As in 1964, Table 72 has been preparedin an attempt to take into consideration the
major factors which influence the milling efficiency of different tandems. Once again, thefactories are listed in the order of their specificfeed rates, expressed in lbs of fibre ground perhour per cubic foot of tot al roller volume.
As pointed out in the Annual Report for1964, dilution ratio is a measure of the efficiency with which imbibition water and dilutejuices are mixed with the residual juices left inthe mill bagasses. Hence, it will be influenced bya number of factors, namely efficiency of canepreparation, percentage of juic e extracted byfirst unit of tandem, number of imbibition


-121-
Boiling house work
Following th e adoption of refractometerBrix by all the factories for chemica l control as
from the 1965 crop, it is difficult to compareboiling house work for that year with that ofprevious years as given in Table 74.
Table 74. Syrup, massecuites and molasses, 1961-65
1961 1962 1963 1964 1965
Syrup gra vity purity 85.3 86.5 86.6 87.0 88.0A-mcte app. purit y 82.0 82.2 83.0 82.8 84.9Pur ity d rop : A rnassecu ite 22.3 20.3 20.3 20.7 20.3
B 22.2 21.2 22.2 20.7 21.0C 24.6 22.9 24.3 23.6 25.1
Crystal % Brix in C '~1assccu i te 36.0 34.6 35.9 35.5 38.6Magma purity . .. 82.3 82.4 82.8 83.4 86.7Fin al molasses : gravity purity 35.7 36.2 35.6 36.1 38.3
Red . Sug . % Bx 16.6 13.8 15.0 12.8 15.5Tot. Sug, ~~ Bx 52.4 50.1 50.4 48.9 53.8\Vt % cane (a: 85" Ox 3.14 2.98 3.04 2.85 2.64
Thus, in sp ite of the fact that the ave ragegravity purity for final mol asses was 38 .3, asagainst 36.1 in 1964, yet better ex haustion wa sprobably obtained in 1965 since the averagedifference between gravity puritics when calculated from refractometric and dcnsimctric Brixis normally so mewha t higher than 2.2 points .
In 1965, several other factories hav e doublecured C massecuites with th e object of improving raw sugar filtcrability. As a result, average
magma purity was higher in 1965.Excellent results were obtained at Riche En
Eau with a mechanical circulator fitted to aC-massecuite pan. The circulator is driven fromthe top by a motor of 87 H .P. and rev olv es at80 R.P.M. As a result th e duration of theC-strike was reduced from eight and a half toabout three hours only.
Finally, as may be seen from Table 75,los ses were further reduced in 1965.
Tabl e 75. Losses and recoveries, 1961-65.
1961
Sucrose lost in final molasses ~;, cane 0.96Undetermined losses % cane 0.21Industri al losses % ca ne .. . 1.24Boiling house recovery 89.9Redu ced boiling house recovery 89.7
Raw sugar fiIterability
The major acti vity of the Sugar TechnologyDiv ision during the crop was devoted to stud ieson the filtcrability of raw sugars with emp hasison sta rch, clarification, juice and syrup flotation,double-curing of Cvsugar and remelting process .
(a) Starch
Starch balances carried out on severalfactories have shown , as anticipated, that verylittle sta rch is found in th e filter cake, elimination taking place mostly in final molasses.Since it is not possible, under present ci rcumstances, to control the amount of starch enteringthe factory, it is necessary to keep down the
1962 1963 1964 1965
0.92 0.89 0.91 0.860.21 0.18 0.18 0.121.21 1.14 1.15 1.0490.4 91.2 91.0 91.489.7 90.2 90.0 88.8
starch level of th e sugar, either by reducing thestarch content of the juice, or by eliminatingmore of thi s undesirable non-sugar in th e finalmolasses.
Starch removal from juiee may be partlyobtained with the help of natural enzymespresent in the juice. This enzyrnatic processwa s tried experimentally a t Man Desert factoryduring the crop, and forms the subject of asp ecial article in this report.
In those factories where the C-sugar is stillused as foot ing for the A and B strikes, thestarch content of the bagged sugar can begreatly reduced by dou ble-curing th e C-sugar.A number of experiments were carried out inwhich C-masseeuite samples collected from

-122 -
Fig . 28. Influence of C-sugar puri ty on sta rch content.
vario us factori es were centr ifuged in such a wayas to obtain, for each massecuitc , C-sugars ofdilTerent purities. T he result s of one of thetests are shown gra phically in fig. 28, from whichit will be observed tha t the starch content of thesugar is inversely proportional to its purity.The results of all the tests made show tha t byincreasing the purity of the C-sugar fro m 83 to92, that is by doubl e-curing, the starch contentof the sugar is reduced by 45 per cent on theaverage. 1t is true that the C-was h is returnedto the C-strike and its sta rch is not eliminateddirectly. Yet, by reducing drastically the starchcontent of the A and B footings, these suga rsautomatically con tain less starc h and theirfi lterability is ma rkedly improved.
b) Clarification
(i) Figures were collected in severalfacto ries in order to determine whether thereexist correlat ions between filtcrability of rawsugar and such varia bles as pH, turbidi ty, an dphosphate con tent of clarified juice. Theresults obtained were somewha t contradictory .Thus, at Mo n Desert , when the amou nt ofphosphate added to the raw juice was reduced,filterability was improved, but no correlationwas found between solu ble phosphate, to talphosphate, or turbidity of clarified juice andsuga r filtcrability, On the ot her hand, filterability was improved at Union-Ducray where thepH of the clarified ju ice was raised from 6.9 - 7.0to about 7.3. Thus the condit ions con duciveto good clarification and to improved filterabilityvary from factory to factory an d each case should
d) Syrup flotation
Following the results obtained in Queenslandwhere raw sugar filterabi lity was increa sed by aprocess of flota tion in which solid impu rities,including inso luble phosphates, are removed byblowing air thro ugh the hea ted syrup (temperatur e 80-85°C, Brix 68), similar experimen ts wereconducted at Saint Ant oine facto ry. Thetreated syru ps, however, did not yield bett erfilter ing raws under the preva iling conditions.Yet the results obtai ned showed that A massecui tes boi led on syrup only yielded raws withan average filterabi lity 7 to 9 points higher thanthose produced from A massecuites on whichA-molasses were recycled. Hence the importanceagain, of adopting a st raight boi ling system.
e) Double curing of C-Sugar
Further evidence was obtained in 1965 onthe beneficial effect of double-curing the C-sugaron the filterability of the bagged product.Thu s, at Mon Desert, filterab ility was increasedby about 60 per cent, whilst at Bel Ombre it
c) Juice flotation
An interesting experiment was carried outat Mon Desert Factory by the chemist, J.Leclezio. It cons isted in heati ng the raw juiceto 75°C and in bubbling compressed air throughit with the help of perforated pipes placed atthe bottom of a cylindr ical tank of 6 minutesretention time. The foam produced was scrapedinto a gutter and sent to the vacuum filter.Fo llowing the adoption of this process, amar ked improvement in filterability was observed,but the drop which ensued du ring the threedays when the process was discont inued, pr iorto the end of the cro p, was not as marked.Hence it is difficult to assess the merit s of theprocess, but it is intended to carry out furtherstudies next crop.
be stu died on its own merits.(ii) It hac; already been shown in Queens
land that juice deterioration in clarifiers has adetri mental effect on raw sugar filterab ility.Similar results were obtain ed at Mo n Desertfactory in 1965 where the average filterabilityon Mondays was 4 points lower than that forthe other days of the week.
----,eGO
I I I I - - . . '"1) 0 ;.) . 00 !, (X) sec le:;
S lA RCH eo» r e NT (pp....)
• • 1
" 1

-123-
was improved by 40 per cent.Excellent results were also obtained at
Riche en Eau but, in addition to double-curing,this factory followed a straight boiling systemthroughout the crop and used a mechanicalcirculator on its C-massecuite pan. It is interesting to point out that the circulator hasdoubled the capacity of the pan . It has alsodoubtless contributed towards the improvementin barged sugar filterability both by helping toprovide well-formed sugar nuclei, free of conglomerates, and by facilitating the adoption of astraight boiling system.
f) Remelting process
Several factories not equipped for doublecuring the C-sugar have remelted this sugarinstead of using the low purity seed as footingfor the shipment strikes. In most cases, anincrease in filterability has followed, but sucha practice should only be considered as a temporary measure. C-sugar should no doubt beremelted to improve the filterability of thebagged product, but this should be done afterefficient removal of final molasses in foreworkers, followed by a second purging in afterworkers.
Since the filterability of A sugars is 2 to 3
times higher than that of B sugars, averagefilterability of the bagged product would doubtless be considerably increased if only A sugarswere produced . Unfortunately, most of thefactories of the island are not equipped to adoptsuch a process . However, it is anticipated thatnext crop a few factories will be in a positionto remelt all their double-cured C-sugar, andalso remelt most or part of their B sugars.The adoption of this process, even by only afew factori es, will thus contribute to increasethe average filterability of Mauritius raws.
Conclusion
A number of steps have already been takenin the sugar factories of the island to improvefilterability. Yet, with the low prices prevailingat the moment and the large surplus of thecommodity on the world market, still othermeasures must be adopted by the industry. It isnot possible to elaborate here on these measures,the more so that they may vary somewhat fromfactory to factory. However further recommendations have been made to the industry lately,and there is no doubt that their adoption willlead to the production of better filtering raws asfrom the 1966 crop.
REFERENCES
SAINT ANTOINE, J.D. R. de (1964). The performanceof sugar factories in 1964. Rep. Maurit . Sug. lnd.Res. Inst. 11 : 99-105.
PERK, CJ.M. (1964) Thirty ninth annual summary ofchemical laboratory reports of the South Africansugar factories. Proc. S. Afr. SI/g. Technol. Ass.39 : 15.
2. INVESTIGATIONS ON THE REMOVAL OF STARCH FROM CANE JUICE
E. C. VIGNES & J. D. de R . de SAINT ANTOINE
With the low pr ices of sugar on the worldmarket and the large stocks carried by manyraw sugar producing countries, coupled withthe fact that the commodity is in most casessold on a straight pol, and not on a qualitybasis, it is these days still more important thanin the past to produce raws having good
refining properties. Of these properties, oneof the most important is filterability. The rawsugar producer should therefore manufacturea product that causes no filtration problem inthe refinery. In other words, the raw sugarshould not contain impurities which impederefining filtration.

-124-
Unfortunatel y the in fluence of variousnon-suga rs on Iiltcrability has not been welldefin ed yet. Thus, whereas in Au st ral ia thetotal phosphate content of th e raw suga r iscla imed to be th e dominant fact or (A NON, 1962),in Formosa CHU and CHU ( 1961) found asign ifican t correlation between silica and filterability, but observed no co r relat ion betweensta rch, gum, or wax, and filtcrabil ity. Recently,YA~P..N E, SUZUKI and KAGA (1965) ha ve o bta inedsignificant correlation s betw een filterability ofraw sugar, as determined by the Nicholson andHorslcy filt ration test , and each of the foll ow ingimpuri t ies: gum, wax, ph ospha te, si lica andstarch, but th e correlation ccefficicnt in th e caseof sta rc h was much lower th an for th e o therimpurit ies. However , in a sti ll more recentstudy (1966), the se authors hav e shown thatth ere exists a clear relationship bet ween thefilt crability of affincd sugars and that of th eca rbona tion slurries, and obtai ned a remarkablyclose correlation between filtcrability and starchcon tent, They therefore conclude th at starchis the 1II0St detrimental impurity ill affined sugars,so fa r as the filtcrability of carbonation slurries isconcerned. VIGNES (1960), working on M auritiusra ws, obta ined a correlation be tween filtcrab ility- a lso determined by the Ni ch olson & Horsleytest - and sta rch, but found no correlat ion withgu ms, wax , silica and phosphat e. DOUWES D EKKER(1964) is of the opinion that tile m ost impo rtantfiltration-impeding impurity is oh viously starch, but theeffec t of gums is also appreciable. T his opinionis shared by many refiner s in th e U.K. andCa nada, who even claim th at as soon asth e starch content of th e raw sugar exceeds200 p.p.m., filtration difficulties are encountered.
T he best explanation as to wh y va r iousauthors do not agree on the in fluence of variou snon-suga rs on filterab ility is pr obably that givenby ALEXANDER and GRi\H AM ( 1964), who write :"When one considers the enormous effect ofdegree of hydration, surface area, and particle size of impur itt es impeding fil tra tio n,it is perhaps /101 surprising that some contiicting, data are oft en obtained when att emptsare made to correlate the weight of variousimpurities as determined chemically , and theresult s of filtration tests. A f urther complication to such correlation is the fac t that most
of the imp urities normally test ed f or are notdefinit e compoun ds hut represent classes orgroups of compounds. The relati ve pr oportionsof the const ituents of any one of these gr oupsm ay vary mark edly fro m olle sugar to anoth er."It should a lso be poi nted out that the methodsof analysis foll owed for the determination ofsome of th e non-sugars, starch and gums inparticular, were no t very accura te a few yearsago, but have since been modified and are nowmore reliable.
Unt il more pr ecise information is obtainedon the influen ce o f various non-sugars onfilt crab ility it may be sai d th at starch is mostprobabl y o ne of th e major causes o f poo rfilterability. Accord ing to BUCHA NAN (1959)sta rc h blocks th e filte r and exerts a viscos ityeffect during filt rati on . On th e other hand, aconsid erable portion of sta rch degradati onproducts find th ei r way ins ide the sugar crystals,impeding filt ration in re fine ries. Affination doesnot help very mu ch, as most of the starch is notpresent in th e film o f mola sses, but is occluded.The analyses o f average 1965 crop samples fromthe 23 local fact o ries have sho wn that affinationin th e laborato ry removed on the a verage only24 per cent of th e starc h present in th e raws.YAMAN E, SUZUK I a nd K AG A (lac. cit .) obtain afigur e of the sa me orde r, 29 per cen t from th eana lyses of sugars sa mpled from 28 ca rgoesoriginating from six different raw sugar pr oducing countries .
It would appear, therefore, that one wa y ofimproving raw sugar filterability, at least inthose factories where th e sta rch content of th eraws exceeds 200 p.p .m., would be to eliminateas much of th e starc h as possible from thejuice before sendi ng th e latter to the boilinghouse, and one method of ac hieving thi s resultis by en zymatic ac tio n.
The enzy rnat ic removal of starch was firstadvocated by H ADDON ( 1928). H c patenteda method of starch e limination using a powerfulenzyme ca lled Ubasc. A lthough it was cla ime dthat th e latter co uld liquefy more than 2400times its ow n weight of sta rch in less than 30minutes, th e cos t of tr eating all the juice in afactory proved pr ohibit ive. The question ofenzymatie treatment of cane juices was againbrought forward when BoYES (1958) added

-125-
malt to syrup prior to boiling. Factory scaleexperiments were disappointing, result s showingthat mixed juice was the best place for enzymatic action. Treatment of the latter, followed byboiling, liming to pH 7.5 and settling removedup to 84 per cent of the total starch content.There again, the calculated costs of juice treatment were shown to be uneconomical.
Some years ago NICHOLSON and HORSLEY(I 958) established that cane juice containedsufficient natural enzymes which could removemost of the starch from cane juices undercertain conditions. They found that the optimumpH for enzymatic activity was very close tothe natural pH of the juice, and that whereascane starch gelatinises at 70°C, the enzyme israpidly destroyed above 75°C. Therefore, storing cane juice for a certain period of time at70°C - 75°C would destroy a hirgo portion ofthe starch present in the juice. However, thereis always the danger that a certain amount ofinversion should take place, so that the timeof storage must not be prolonged.
BOYES (1960) reports the case wherefactories situated within the same area hadwidely different amounts of starch in theirsugars, although processing juices of similarstarch contents. Sugar from those factorieswhere raw JUice was left for a definite time insettling tanks after being heated to between70° and 80De had much less starch. Thelatter was undoubtedly being eliminated bythe action of natural enzymes.
Early this year, the Sugar Technologydivision decided to carry out preliminaryinvestigations into the problem of enzymaticstarch removal in cane juice on a laboratoryscale in the first place. Canes were passedthrough a Jeffco cutter-grinder and pressedto extract the juice. Pol % g. of the juicewas determined, as well as starch content andreducing sugars before and after incubationat 73°C in a water bath for various lengthsof time. Data obtained are shown in Tables.76 and 77.
Table 76. Effect of juice storage on starch at 73°C
Date Initial starch Starch content ill p.p.m. after Per cellt decrease in starch aftercontent (p.p.m.)
5 mins. 10 mins. 15 mins. 30 mins . 5 mins. 10 mins. 15 mins. 30 mins.
24.5 47 30 3626.5 24 15 3728.5 142 66 63 56 47 54 56 61 672.6 427 257 223 213 194 40 48 50 55
Average 42 52 56 61
Table 77. Effect of juice storage on reducing sugars at 73°C
Date Increase ill reducing sugars in mg . after5 mins. 10 mins 15 mins. 30 mins.
Per cent loss of sucrose after5 mins . 10 mins. 15 mins. 30 mins.
24.526.528.5
2.6
Average
20362618
2624
2925
5435
0.150.280.200.11
0.18
0.200.15
0.18
0.220.15
0.19
0.410.21
0.31
The amount of inversion is calculated fromthe increase in reducing sugars. It was foundthat the raw juice kept for 5 minutes at 73°Clost 42 per cent of its starch content. Percent elimination increased to 52 after 10 minutes,and to 56 after 15 minutes. At the sametime there was a loss of sucrose of between 0.18and 0.19 per cent. Extending the time of
storage caused starch removal to increase toonly 61 per cent, whilst sucrose loss rose to0.31 per cent.
On a plant scale since inversion of sucrosedepends on pH, temperatures, and time, it isevident that a compromise must be arrivedat between these factors and destruction ofstarch. Therefore, judging from the laboratory

-126-
results, it appeared that storing the juice forup to 15 minutes would eliminate more thanhalf the starch without significantly affectingthe sucro se. Towards the end of the crushingseason, this was put to the test on an industrialscale in a factory. Three storage tanks, placedin series, were available for the test. The mixedjuice was heated to 75°C and sent to the firsttank where it was retained for 6-1- minutes.For the first two days of the experiment, Iimingwas effected in the second tank. Compositesamples were taken before the heaters and fromthe juice emerging from the first tank. Thesesamples were analysed for sucrose and reducingsugars. As in the laboratory experiments,
increase in reducing sugars was tak en as indicating sucrose loss, and calculated as a percentageof the original sucrose in the juice. Othersamples were taken at the same time as theabove, and kept for starch determination. Theprocedure in this case was as follows: apre-determined mixture of acid and alcohol wasprepared, and every 15 minutes mixed juice(20 g.) was weighed and poured into the acid /alcohol mixture. Sampling was continued for1{hours. Similar experiments were carried outfor three more days, when the juice was allow edto settle for 12 minutes in the first two tanksand Iiming was shifted to the third tank .Results are shown in Tables 78 and 79.
Table 78. Enzymatic removal of starch from mixed juice at 75°C
Dale Initial starch Starch content in p.p.rn. after Per cent decrease ill starch aft ercontent
6} minutes 12 minutes 6} minutes 12 minutes
26.11 170 124 27.127.11 150 108 28.0
2.12 50 25 50.03.12 135 62 54.14.12 150 86 42.7
Average 27.5 48.9
Table 79. Change in reducing sugars during enzymatic elimination of starch
Increase ill reducing sugars in Pf!r cenl loss of sucrose after Inilial FinalDale mg aft er
6! minutes 12 minutes 6} minutes 12 minutes Glucos e Rat io Gluco se Ratio
26.11 14 0.09 3.05 3.1427.11 38 0.28 3.50 3.75
2.12 26 0.20 3.90 4.074.12 21 0.15 3.30 3.46
Average 0.16 0.18
A small amount of evaporation did occurduring heating and storage. Thi s was takeninto account, and analytical results were accordingly corrected . Keeping the juice for 6}minute s caused 27 to 28 percent of the starchto be destroyed, loss of sucrose being onaverag e 0.16 per cent. Between 42.7 and 54.1of the starch in the juice is successfully eliminated after 12 minutes, average loss in sucroseamounting to 0.18 per cent, a figure equivalentto a drop of only 0.024 in sucrose per centgrams of juice .
Thu s both laboratory and industrial results,although scanty, indicate a definite possibilityof reducing the starch content of mixed juice
and confirm the results obtained in Natal,where the process has been adopted industrially.Despite the small amount of inversion takingplace, it would be worthwhile pursuing theinvestigation further under local conditions.The greatest difficulty in carrying out theexperiment on an industrial scale is the problemof sampling. During a short period of time,considerable fluctuations in the starch contentof the juice may take place. Th e only wayto obtain accurate information is to carry outinvestigations over a long period. For a complete picture to be obtained, the influence ofthe process on the starch content of the resulting sugars and their filterability must also be

-127-
stud ied . Should it be sho wn, as anticipated,that the enzymati c remo val of starch improvesthe refining qualities of certain Mauritius raws,its adoption by the factories where the starch
content of the juice is above average, could goa long way towards solving their particularproblem, provided that loss of sucrose is keptwithin limits.
REFERENCE
ALEXANDER, J .B. (1957) . Some observations on thefilterability of Nat al raw su gars. Proc, S. Afr. Sug:Technol. Ass. 31 : 68-75 .
ALEXANDER J.B. and GRAHAM, W.S. (1964). Privatecommunication.
ANON, (1962). G eneral chemistry report, October 1962.Sug, Res. Inst., Ma ckay; p. 3.
BOYES , P.N. (1960) . St ar ch in th e manufacture of rawsugar. Proc. S. Afr. Sug: Technol. Ass. 34 : 9 1-97.
BUCHANAN, E.J . (1959) . Recent obser vat ion s on suga rca ne starch and its effect on filterab ility of sugar.S . Air. Sug, J. 42 (I) : 32-47.
DOUWES DEKKER, K. (1964). The filterabil ity of rawsugars. Proc. Sug. Ind, Tecllll.23 : 159-170 .
NICHOLSON, R .1. and HORSLEY, M. (1960) . St archremoval from cane jui ces. 1111. Sug. J . 60 : 260-263.
POW ERS , H. E. (1959). Crystallography of suc rose .Principles of Sugar Technology. Elsevier, Amsterdam , v.2
ST. ANTOINE, J.D . de R. and PARISH, D.H . (1959).T he co mposition of cane jui ce. Rep. Maurit . S ug,lnd, Res. Inst . 6 : 44-46 .
TAKEO YAMANE, KAZUMASA SUZUKI and TOSH IOKAGA (1965-66). Filtrat ion -impeding materials inraw sugars of various o rigins . I.1/. T he filtrability of laboratory carbonatation slurries.lnt . Sug. J. 67 (803): 333-337; 68 (805): 3-6.
HADDON, E. (1928) . Influence of starch on th e manu- VIGNES , E.C. (1961). Filterab ility of raw sugar. Rep.facture of sug ar and its removal from the juice. M aurit , Sug, Ind. Res. Inst . 8 : 80-85.Rev. agric, suer. Ill' Mauri ce 38 : 80-82.
3. CURING LOW GRADE MASSECUITE IN AN ALLIS-CI-IALMERS 2750CONTINUOUS CENTRIFUGAL
ERIC PIAT & MAURICE RANDABEL
The purpose of this experiment was, ini
tially , to compare the merits of a continuouscentr ifugal to tho se of a batch machine. However,it soon became evident that before comparativetests could be ca rr ied out it was necessary toobtain first as much information as possibleon the operation of the continuous machine, andto determine whether the whole installation wassuch that it could lend itself to a fair comparison.
Description of machine
The Allis-Chalmers "'750 continuous centrifugal consists of a conical basket mountedhorizontally on two self-align ing roller bearings.The cone is driven through a belt driv e by a30 RP. electric motor. The dimensions of the
cone are are as follows :
External diameter: 27.5 inchesSlope of cone : 30°Number of revolutions per minute 2200Type of screen: sta inless steel 0.006 inch
thick , diameter of holes0.006 inch (0.15 mm) , openarea : 28.2 %
M assccuite is introduced into a funnelplaced on the front plate of the mach ine, andflows through a slightly slop ing pipe to theapex of the con e. Th ere the massecu ite isdistributed evenly over the screen. The slope ofthe cone and the centrifugal forc e cau se themassccuite to travel outwards, molasses being atthe sa me time separated from the sugar crystal s.

-128-
BUTTERFLY VALVE
- -- ---..,----,--,-------,
_________,.-_-L..:,-L- +- --J-;.....l.-J
V- BELT ORIVE
CONTROL PANEL
SHAFT
BEARiNGS
MOTOR
D
MOLASSESOISCHARGE
----------~~~~~
f-------
SUGAROISCHARGE
<,
Fig . 29. AIlis-Chalmers continuous centrifugal model 2750.
The sugar is thrown out of the open end of thecone into the sugar chamber.
In order to increase the capacity of themachine, the viscosity of the massecuite ismomentarily reduced by:
(i) Rapid reheating to about 50°C. Belowthat temperature, the massecuite does notspread evenly, and serious vibrations occur.
(ii) Washing the layer of massecuite onthe screen with water. The time of contact
of wash water and sugar is so small that practically no dilution of sugar takes place.
There is also a small amount of wateradded above the funnel; this enables particularlysticky massecuites to flow freely through thefunnel without adhering to the metal. Thisamount of water is negligible.
The basket is driven at constant speed by asynchronous motor. When rnassecuite is introduced into the cone, it is accelerated centri-

-129-
fugally, and therefore the 'torque on the motor isproportional to the feeding rate and to theconsistency of the massecuite. The power takenby the motor is used to regulate the supply asfollows: on the control panel of the centrifugeis a wattmeter with an adjustable pointer on itsdial. When the pointer of the wattmeter goesbeyond any selected position of the adjustablepointer, a signal is sent to the butterfly valvecontrolling the feed so as to reduce it. Conversely, when the power taken falls below theselected value, the butterfly valve opens.
The batch machine selected for this seriesof comparisons was a Broadbent 40 X 30spinning at 1800 r.p.m.
Set lip of experiment
For every run, the C strike discharged fromone large vacuum pan was divided between twosimilar erystallisers, and the cooling time keptthe same in both cases. The massecuitc goingto the Broadbent was reheated through a largeheater, feeding a bank of batch machines, andfitted with a thermostatic controller in the hotwater line, whilst the massecuite fed to thecontinuous machine was reheated in a locallymade rotating coil mingler. The water temperature was not controlled in the latter. and theflow of hot water through the element wasmanually adjusted.
The practice at Belle Vue factory where thetests were carried out was -to cool down themassecuite to about 35°C, while maintaining itsviscosity within acceptable limits by the additionof water.
Each test lasted at least one hour. andduring that period samples of massecuite, sugar,and molasses were taken from each machine.Meanwhile the following data were recorded ;
(i) Temperature of massecuite;(ii) Temperature of water in heating clement;(iii) Number of cycles per hour for Broad-
bent;(iv) Thickness of massecuite inside the
Broadbent basket ;(v) Level of massecuite in crystalliser
feeding AlIis-Chalmers at the beginningand at the end of the experiment;
(vi) Amount of wash water used on AlIisChalmers.
The capacity of each machine was determined from (iii), (iv) and (v) above.
The samples of massecuite were dividedinto two portions: one for direct determination of Brix and purity; the other for determination of cyclone molasses Brix and purity, i.e.Brix and purity of mother liquor obtained bycentrifuging the massecuite in a laboratorycentrifugal. The cyclone molasses were essentialfor the comparisons, since two reheaters ofdifferent design were used , one of which could,for instance, cause more re-solution of sucrosethan the other.
Observations and results
The reheater of the AlIis-Chalmers wasfound to be inadequate. Fluctuations occurredin the massecuite temperature, and if thecapacity of the AlIis-Chalmers was raised toohigh, the temperature of the masseeuite keptfalling until the experiment had to be stoppedbecause of vibrations. Therefore, the throughputof the AlIis-Chalmers was governed by theability of the reheater to cope with the amountof massecuite fed to it.
During the first tests, it was found thatwhile the butterfly valve was fully open, thepower output of the motor was still below theset point. This was obviously due to the smalldiameter (6") of the pipe leading from thereheater to the valve . The pipe was thereforereplaced by an 8-inch one which proved adequate .
On one occasion. the gate valve, placedjust on top of the butterfly valve, was closed,and fifteen minutes later opened again: thescreen was immediately torn off. The sameaccident occurred some time later win- a newscreen. It was then suggested that during the fifteenminutes interval, sugar had dried on the screen,and that when massecuite was re-admitted, itadhered to the rough surface of the dry sugarand increased the load on the screen considerably. causing the failure of the latter. To avoidany further mishap of that sort, it was decidedto wash the screen with water each time themachine was stopped. Consequently, no otherscreen was damaged until the end of thecrop.

-130-
The results shown in Table 80 representeight tests carried out with va rious motor
settings and various ratios of wash water tomassecu ite .
Table 80. Results or comparative tests between the Allis-Chalmers and a Broadbent batch machine
Massecuite Cyclone Mols.
Brix Ply Brix Ply
Batch ... 93.78 58.6 90.42 35.7Cant. 93.60 59.0 90.42 35.9
Batch. 94.68 60.4 90.60 34.9Cant. 95.28 61.2 91.38 35.6
Batch ... 95.28 61.9 90.42 35.3Cant. 94.94 61.6 91.62 34.9
Batch ... 95.64 60.7 90.96 36.6Cant. 94.08 62.3 91.50 35.8
Batch .. . 95.34 58.4 91.92 36.2Cant. 95.22 60.3 91.92 36.9
Batch .. , 93.12 57.9 90.42 34.2Cant. 95.16 56.5 91.14 33.7
Batch .. . 95.46 59.5 90.66 34.4Cant. 94.62 60.1 90.54 35.0
Batch ... 95.10 58.5 90.78 33.2Cant. 94.26 59.6 89.82 33.7
Mean f Batch ... 94 .80 59.5 90.77 35.1lConl. 94.64 60.1 91.04 35.2
Discussion of results
It is difficult to comment on the capacityof the Allis-Chalmers since it was purposelykept down because of the lack of capacity ofthe massecuite re-heater. However, it must bepointed out that on one occasion a capacityof 70ft 3/hr. was achieved. It can be safelyassumed that a capacity of 50-60ft3 / hr wouldbe achieved if the machine were equipped withan adequate re-heater. The re-heater bestsuited for that purpose would be either of theresistance type, or of the Green type, becauseboth provide rapid reheating of the massecuite,with practically no remelt.
The molasses purities of the two machinescannot be directly compared because the puritiesof the mother liquors differ slightly. In orderto compensate for this, the difference in motherliquor purity must be added to or subtractedfrom the difference in molasses purity. Aftercorrection, the nett difference in molasses purityaveraged 1.7 in favour of the batch machine.It will be noted that the cyclone purities are
Molasses Cssuear Dilut ion Temp .M. C. Capacity
Brix Ply Ply GlsJJi 3 QC fts lhr
90.66 34.1 79.4 48.1 3485.08 35.4 88.1 0.32 50-46 70
91.98 34.5 79.8 40.3 3479.06 36.7 89.1 0.72 50-51 25
91.62 34.8 82.8 50.3 3486.04 36.3 88.7 0.33 51-45 46
92.64 35.6 80.2 50.0 3485.02 37.3 87.3 0.50 49-45 30
93.30 35.1 75.4 47 3489.34 38.1 86.6 0.50 53-59 30
91.08 33.1 46.5 3490.12 34.0 82.4 0.60 53-59 25
92.34 33.8 79.6 44.0 3491.14 35.9 79.9 0.33 46
91.20 32.8 79.8 47.7 4088.98 34.5 83.6 Nil 44-48 39
91.85 34.2 79.6 3586.84 36.0 86.2 39
higher than they should have been due to theuse of a laboratory centrifugal which doubtless letmore crystals through. But since the same laboratory machine was used for all the determinations, the difference in cyclone purities maystill be used for correction.
At first sight, this result would seem toindicate that the continuous machine cannotcompete with the batch machine. However,such a hasty conclusion cannot be drawn for anumber of reasons, the most important ofwhich are:
(i) Although the 1.7 difference in molassespurity is significant, yet the number of comparisons made is small, amounting only to eight;
(ii) As already pointed out, the heatingsurface of the reheater used with the AllisChalmers was so inadequate that comparisons athigh throughputs of the continuous machinecould not be made;
(iii) The average capacity of the batchmachine was only 35 cu . ft/hour, as against39 for the continuous machine in spite of thelimitation mentioned in (ii) above. It would not

-131-
appear that the batch machine could be used ata higher throughput, under the conditionsprevailing during the tests, since the averagepurity of the C-sugar amounted to only 79.6,as against 86.2 for that from the Allis-Chamers.It should not be forgotten that the lower thesugar purity, the larger the proportion ofmolasses recycled. It is estimated that a dropof purity of the C-sugar from 86.2 to 79.6would account for an increase in molassesrecycling of about 85 per cent, with all itsinherent disadvantages.
(iv) For all the tests, the same type ofscreen was used in the Allis-Chalmers, namelyone with holes 0.15 mm in diameter, givingan open area of about 28 per cent. However,another type of screen with 0.06 mm slits andan open mea of about 8 per cent is apparentlyalso available. Whereas the first screen shouldincrease the capacity of the machine, the secondshould yield lower molasses purity. Comparative tests carried out with the two screens(ANON, 1963) in a B.M.A. centrifugal haveshown that the coarser screen yielded a molassespurity 2.4 points higher than that from thefiner. Other au thors (vide References) men tionthat continuous centrifugals of various makes,using screens with slits 0.06 mm wide, yield
molasses the puritics of which vary but slightlyfrom those of corresponding cyclone molasses,while molasses puritics 1.5-2.5 points higher thancyclone purities are obtained when using screenswith 0.15 mm diameter holes instead.
Conclusion
Due to its simplicity, easy maintenance, lowpower consumption and price, the continuouscentrifugal is a very promising machine. However, if the results to be obtained from it areto match the standards obtained with the batchmachine for the curing of C-strikes, greaterattention should be paid to the selection of theright screen and to the choice of the ma ssecuitereheater.
In those factories where double-curing ofthe C-sugar has to be resorted to and wherethe C-fugal station is already adequate and upto date, the continuous centrifugal should provebetter than the batch.
Also, if it becomes necessary to increase theB-fugal s capacity, or to replace existing machinesin a factory where the double magma system isfollowed, or where the B-sugar is re melted,strong consideration should be given to theinstallation of continuous machines.
REFERENCES
ANON, (1963). Notes on the use of continuouscentrifugals for low grade massecuitcs. Sug : J.(New Orleans) 26(1) : 69-73.
B.S.E.S. (Brisbane), Div . Mill Technology . An Investigation into the performance of B.M .A. continuousfugaI. Operation Report /964 , 110. /.
DAVIES. J.G. (1963). An evaluation of continuouscentrifugals for Cvmassecuites. Sug , J. (NewOrleans) 26(5): 32-35; 44.
KELLER, A.G. (1964). Continuous Centrifugals Operating problems. Sug . J. (New Orleans) 26(11) : 46-49.
LUI, E.L. (1963). Op erating data of Silver continuous
centrifugals at Hutchinson. Proc. Hawaiian Sug :Tecllllol. 22 : 203-204.
SIEPE, W. (1963). The fully continuous flow centrifugal. Sug . J. (New Orleans) 26 (3) : 25-28.
SI LVER, B. (1963). The continuous centrifugal forprocess ing low and high grade massecuite. Sug . J.(New Orleans) 25(11): 49-55.
SOCKHILL, RD. (1964). Continuous fugal on canelow grade massecuite. Proc. Qd Soc. Sug, CaneTechllol . 31: 271-279.
WULFEKUHLER, A.F. (1963). Western States continuous centrifugal. Proc. Hawaiian Sug, Techuol . 22 : 205.

-132-
4. CHEMICAL CONTROL NOTES
NOTES ON THE USE OF THE BAUSCH AND LOMB PRECISION SUGAR REFRACTOMETER
FOR CHEMICAL CONTROL OF SUGAR FACTORIES
M. RANDABEL & F. Le GUEN
Th e refractometer has been used in Hawai ifor Brix measurement in chemical control forthe last twenty-fiv e years, but it is onl y recentlythat other countries have studied the possibilityof using it to replace the densimeter or Brixspindle. Mauritius has been the second countryto adopt refractornetcric Brix. After preliminary investigations carried out during the lastfew year s by LAM USSE (1960), LE GUEN andRANDABEL (1961), the Baush and Lombprecision sugar refractometer was adopted in1965 by all factories of the island for che micalcontrol. The purpose of these notes is tosummarize various poi nts of interest relating tothe use of that instrument.
In 1961 when LE GUEN and RANDABELstudied the results of 550 Brix deterrninat ions injuice by densimeter and by refractometer , theyfound that the latter gave on the average areading smaller than the former by 0.25 unit.For final molasses, the difference was usuallyof 6 to 7 points, spread between 3.00 and 10.00
Brix. In 1965, however, some factories obtainedabnormally high differences of up to 13.00between the Brix values of the same finalmolasses, whilst in other cases, very smalldifferences were obser ved. It is intend ed , priorto next season, to investigate into the possiblecauses of such abnormal differences.
Whilst, with some instruments, no difficultieswere encountered as to the sharpness of thedividing line between the dark and br ightportions of the fields, in other cases, this linewas not as shar p as could be desired . Thead vice of the Experiment Station of the Hawa iianSugar Planters Association was sought in th is connection, and in the light of their comment s whichwere confirmed subsequ ently by local experience,the followin g precautions should be taken:
(i) There should be no moisture or condensation upon the back of the prism, i.e. the
part which is ju st opposite the telescope ;(ii) Bright light fall ing on the back face
of the prism causes a lack of contrast betweenthe dark and bright portions of the field , andshould therefore be avoided. It is helpfulto set up the instrument inside a darkened boxwhere it is sheltered from extraneous light , as isusually done with sacc hari meters ;
(iii) Too much light from the sodium lampcan also give rise to a lack of contrast. Itsometimes helps to diffuse that light by mean sof opalescent glass , or a lOO-mesh wire scree n;
(iv) Ju ice or moistu re on the front faceof the prism should not affect the reading. Itis nevertheless advisabl e to keep thi s part ofthe instrument clean;
(v) The sharpness of the dividing line isaffected by the amount of suspended matter inthe juice, and by its turb idity. In Hawaii, thepract ice is to filter with Kieselghur all the sa mplesor else to centrifuge them at 18,000 or 20,000 g.Such a pro cedure should remov e all suspendedmatter and give a more accura te Brix, as wellas provide a sharper dividing line. At firstsight, however, this pro cedure appears to berather inconven ien t for everyday practice.Ho wever it is a lso intended, prior to the nextcampaign , to study the effect of the removal ofsolids on the Brix of final molasses;
(vi) Lack of sharpness of the dividing linemay also be caused by a too wide spacing ofthe pri sms, the distance between which shouldlie between 0.08 and 0.15 mm , according tothe man ufacturers. However, it appears thatwhen the juice is extr emely turbid , the ma ximumspacing allowed by this tolerance is too wide.In such cases, the pri sm should be readjustedonly by the manufacturers.
(vii) The most common sources of troublewith the instrument are given hereunder :
(a) Failure of sodium vapour lamps.

-133 -
(b) Corrosion of parts in gcneial. Itis therefore highly important to keep theinstrument clean. It should , mo reover, notbe kept in a corrosive atmosphere (vicinityof acids) in the laboratory ;
(c) Corrosion of the scale. Thi s isbest prevented by wiping it once a weekwith benzene ;
(d) Freezing of the telescope barrelin its housing. This is easily prevented byremoving the telescope from its barrel andusing a silicone grease as lubricant.
(e) Alidadc action not free. This doesnot affect the accuracy of the instrument,but results in a backlash whenever themot ion of the telescope bearing arm isreversed. It is usually due to improperadju stment, or to lack of sti ffness of thespring (springs usuall y last from two tofive years.);
(f) Prism cement failur e. In Hawaii,dental cement (resin type) has been successfully used for repair ;
(g) Scratching of measuring pri sm.Th is is best prevent ed by washing withdist illed water after use, so as to re moveany abrasive particles and by using extr emecare whenever the measuring pri sm is beingwiped . Very severe scra tching can evenimpair the contrast between the dark andbright portions of the field;
(h) Corrosion of prism box or case.Thi s is best prevented by washing after use ;
(i) Corrosion of prism box mountingscrews. These should be removed once ayear and lub ricated;
(j) Seeping of juice under the prismbox. This is best prevented by operatingthe instrument so that it slopes towards thesodium lamp.Difficult ies were also encountered in connec
tion with the sodium vapor spectra l lamps usedwith the instruments. The se lamps have anominal life of 500 hours, but in pract ice, theysometimes last 1000 hours or more. In severalcases, however, lamps burned after only a fewday s, and the trouble was traced to voltagefluctuations of the main s supply.
In th is connection the following pointsshould be noted :
(a) The lamp is particularl y vulnerable tovoltage fluctu at ions, and a voltage sta biliser isdesirable whenever such fluctuations are to beencountered;
(b) The effect upon lamp life of a too lowvoltage is far worse that of a too high voltage.For the GEC lamps supplied by Bausch andLornb , the 120 volt s nominal prim a ry voltageshould not fall below 112 volts nor rise ab ove125 volts at most.
At one time du ring the cru shing season, thestock of spare lamps was completely exhausted.As a subst itute, sodium lamps of a type usedfor lighting, and wh ich were known to be satisfactory for use with saccharimeters, were tried .These lamps appear to be quite satisfactoryand have the advantage of being much cheaper.
In conclusion, it may be sa id that the adoption of the preci sion refractometer for thechemical control of sugar factories in Mauritiushas presented no problem in th e laboratories andhas been most successful.
REFERENCES
D EICK E, R. (l95H) Preliminar y investigati ons into theinfluence of suspe nded so lids on the Brix o f firstexp ressed juice. Proc. Qd Soc. Sug. Cane Tech.25 : 159-161.
C LAYTON, J.L. (1959). Brix a nd purity o f raw juices .Proc. Qd Soc. Sug . Cane Tech. 26 : 131-[37.
CLAYTON, J.L. (1962). Refractometer Brix for factorycontrol. Pro e. Qd Soc. Sug . Cane Tech., 29 : 235-241.
J ENSEN, E.D. (1962). A compari son of meth ods for
the determination o f d issolved so lids . Proc. QdSo c. Sug, Cane Tech. 29 : 227-233.
LAMUSS E. J .P. (1960). Preliminary stud ies on the use ofthe refractometer for routine chemical co ntrol. Rep.Maurit, SlIg. Ind . Res. Inst . 7 : 101-103.
L E GUEN, F. and RANDABEL, M. (1961). Furtherstudies on the use o f the refractometer for rout inechemica l co ntro l. Rep. M aurit . SlIg. Ind. Res. Inst.8 : 86-88.

BY-PRODUCTS
IV. PROTEIN RECOVERY FROM CANE JUlCE AND SYRUP
R. de FROBERVILLE
THE possibility of recovering protein fromcane juice has been studied at thisInstitute since 1960 and the results
obtained have form ed the subject of severalpapers (vide Annual Reports 1960 - 1962)
It will be recollected that the major difficulties encountered were the relati vely highproportion of fats and waxes present in thecoagul ate obt ained, the lack of an efficientcontinuous separator to replace the batch typeKG 10006 Westfalia machine used, and the smallamount of protein, about 0.1 per cent , containedin the juice.
In spite of these difficulties and the unfavourable results obtained so far , anotherattempt to recover proteins was made in 1965.Investigations were carried out on a pilot plantscale, sta rting from syrup instead of cane juic e.It was hoped that efficient separation of theproteins could be obtained from a more concentrated solution, in the same way as theseparation of fats and proteins is obtained froma glucose solution of 45° Brix in the industrialproduction of glucose from starch in Germany(HUSTER , 1964)
The machines used were a Westfalia separator: SAOH 205 of the bowl type fitted with anautomatic de-sludging device and a no zzleseparator Westfalia SKOG 205.
Trials were made at Medinc factory. Aflow diagram of the install ation is shown in
Fig. 30. Juice heated in one of the industrialheaters was by-passed and screened over a120-mesh monel stationary filter to removebagacillo . The juice temperature was thenra ised to approximately 90'C by blowing steamby means of perforated pipes placed at thebottom of a tank. The pH of the juice wasthen adju sted to neutrality with the help of a15% solution of sodium hydroxide. Evaporation took place in a small single effect evaporatorworking under 26 " vacuum, and the syrup wasfed to the SAOH separa tor.
Syrups of varying brix values were obtainedwith the object of investigating the influence ofdensity on the capacity of the machine and onthe efficiency of protein recovery. De-sludgingintervals were also varied in order to obtain athicker sludge. Finally the SKOG machinewas installed in series with the bowl-typemachine. Protein content was determined onsamples of syrups ent ering and leaving theseparators, and of sludges, in each of the trial runs.
In none of the cases was it possible toclarify the syrup in a sati sfactory mann er, morethan 90 % of the protein remaining in the syrupafter centrifuging. In addition, these syrupsretained a high proportion of microsc opic solidimpurities.
It appears from the results obtained thatthe separation of proteins from syrups is evenmore difficult than separation from canc juice.
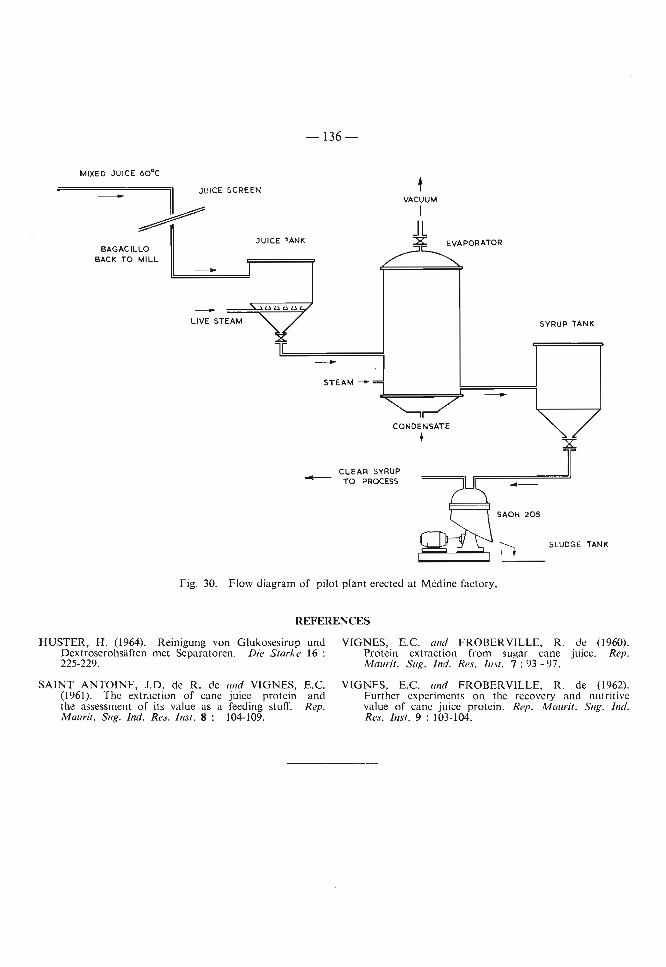
-136-
MIXED JUICE 60·C
~ JUIC E SCRE EN
~JUICE TANK
BAGACILLOBACK TO MILL --
VACUUM
IJLX
SLUDGE TANK
I
....--
SYRUP TANK
SAOH 205
--x
r========J
CONDENSATE
+
CLEAR SYRUPTO PROCESS
LIVE STEAM
-
Fig. 30. Flow diagram of pilot plant erect ed at Medine factory.
REFERENCES
HUSTER. H. (1964). Reinigung von Glukosesirup undDextroserohsaftcn met Scparatoren. Die Starke 16 :225-229.
VIGNES, E.C. ami FROBERVILLE, R. de (1960).Protein extraction from sugar cane juice. Rep.Maurit. Sug . Ind . Res. Inst . 7: 93 - 97.
SAINT ANTOlNE, J .D. de R. de and VIGNES,(1961). The extract ion of cane juice prote inthe assessment of its value as a feeding stuff.Manrit . Sug , Ind. Res. lnst . 8: 104-109.
E .C.a nd
Rep.
VIGNES, E.C . and FROB ERVILLE, R. de (1962).Further experiments on the recovery and nutritivevalue of ca ne jui ce protein . Rep. Maurit , SlIg. Ind.Res. lnst . 9 : 103-104.

APPENDIX*
I. Description of cane sectors
II. Area under sugar cane, 1957 - 1965
Ill. Sugar production, 1957 - 1965
IV. Yield of Cane, 1957 - 1965
V. Sugar manufactured % cane, 1956 - 1965
VI. Sugar manufactured per arpent, 1956 - 1965
VII. Rainfall excesses and deficits, 1949 - 1965
VIII. Monthly temperatures, 1950 - 1965
IX. Wind velocity, 1951-1965
X. Wind velocity, cyclone years
XI. Variety trend, 1951 - 1965
XII. Varietal composition of plantations, 1961 - 1965
XIII. Relative production of virgin and ratoon canes, 1952 - 1965
XIV. Yield of virgin and ratoon canes, 1965
XV. Evolution of 1965 sugar crop
XVI. Evolution of cane quality, 1965
XVII. Duration of harvest and weekly crushing rates, 1948 - 1965
XVIII. Summary of chemical control data, 1965 crop(i) Cane crushed and sugar produced
(H) Cane, bagasse, and juices(iii) Filter cake, syrup, pH, final molasses and sugar(iv) Massecuites(v) Milling work, sucrose losses and balance recoveries
XIX. Molasses production and utilization, 1948 - 1965
XX. Importation of fertilizers, 1950 - 1965
XXI. Sale of herbicides, 1964 - 1965
XXII. Importation of herbicides, 1955 - 1965
XXIII. List of 1965 crosses sown in November
XXIV. Experimental crosses, 1965-Study of inheritance to gumming disease
XXV. List of Approved Cane Varieties
• Grateful acknowledgment is made to the Secretary, Mauritius Chamber of Agriculture, for providingthe necessary data to compile Tables 11 to VI.

=
Table I. General description of sugar cane sectors of Mauritius
SECTORS WEST NORTH EAST SOUTH CENTRE
Pamplemousses Grand Port Plaines WilhemsDISTRICT Black River & Flacq & &
Riviere du Rempart Savanne Moka
ORIENTATION Leeward - Windward Windward -
PHYSIOGRAPHY Lowlands and Lowlands Lowlands and lowlands ana PlateauSlopes Slopes Slopes
GEOLOGY Late lava - Pleistocene
PETROLOGY Compact or vesicular doleritic basalts and subordinate tuffs
ALTITUDE Sea level - 900 ft. Sea level - 600 ft. Sea level -1,200 ft. Sea level - 1,200 ft. 900 - 1,800 ft,
HUMIDITY PROVINCE Sub-humid Sub-humid to humid Humid to super-humid
ANNUAL RAINFALL,(30- 60) 44 (40 - 75) 55 (60 -125) 94 (60 -125) 90 (60 -150) 90inches. Range and mean
MONTHS RECEIVING September toLESS THAN TWO June to October NoneINCHES RAIN October
AVERAGE JAN. 27.0° 26S 25S 25.0° 23STEMPERA-
TURE °C JUL. 21.0° 20S 19S 19.0° 17S
CYCLONIC WINDS,greater than 30m.p.h. December to May
during 1 hour
PEDOLOGY Soil FamiliesGreat Soil Groups
Low Humic Latosol « Richelieu » « Richelieu » « Reduit » « Reduit » « Reduit );« Reduit » « Bonne Mere » « Ebene »
Humic Latosol - « Rosa1ie » - « Riche Bois » « Riche Bois »
Humic Ferruginous - - « Sans Souci» « Belle Rive» « Belle Rive »Latosol « Sans Souci » « Sans Souci »
« Midlands » « Midlands »« Chamarel »
Latosolic Reddish « Medine » « Labourdonnais » « Mont Choisy » « Labourdonnais » « Mediae »Prairie « Mont Choisy » « Mont Choisy »
Latosolic Brown - - « Rose Belle » « Rose Belle» « Rose Belle»forest « Bois Cheri » « Bois Cheri »
Dark Magnesium Clay « Lauzun » « Lauzun » - - -« Magenta»
Grey Hydromorphic « Balac1ava » « Balaclava » « Balaclava » - -« St. Andre »
Low Humic Gley - - « Valetta » - « Valetta »« Petrin »
Lithosol - « Melleville » « PI. des Roches » « Melleville » -« Melleville »
IRRIGATION Common Some Rare
APPROXIMATE Secter S6 91 72 160 63
AREA
1000 arpents Cant 12 54 41 65 27
CANE PRODUCTION468 ~461 1,333 1,935 788
lOUO metric tons (196'\\
SUGAR PRODUCTION54 159 148 213 91
1000 metric tons (1965'
SUGAR FACTORIES Medine 54 Belle Vue 33 Union Flacq 83 Savannah 32 Mon Desert 41Production in Mon Loisir 29 Beau Champ 37 Mon Tresor 29 Reunion 251000 metric tons St. Antoine 26 Constance 28 Riche en Eau 26 Highlands 25
(1965) Solitude 25 Rose Belle 23
Beau Plan 23 Union 21
The Mount 23 Bel Ombre 20Britannia 18
. St. Felix 16Benares 14Ferney 14

III
Table 11. Area under sugar cane in thousand arpents (I), 1957 - 1965
I Area reapedArea under
Year cane
I I I IIsland Island West North East South Centre
-!1957 182.67 169.58 8.95 48.27 35.72 54.25 22.29
1958 189.22 176.69 9.20 49.14 38.78 56.62 22.95
1959 195.31 183.12 9.62 50.37 40.93 58.77 23.43
1960 201.61 188.36 10.22 51.50 42.15 60.34 24.14
1961 201.17 187.29 10.33 50.71 41.98 60.29 23.98
1962 204.97 193.77 11.07 52.60 42.61 62.41 25.08
1963 204.20 194.08 11.63 51.17 43.61 62.67 25.00
1964 206.94 195.41 11.79 52.70 42.23 62.45 25.24
I 1965 (2) 207.00 I 194.10 11.85 51.96I
43.08 I 62.00 I 25.21
NOTE: (1) To convert into acres, multiply by 1.043" " "hectares," "0.421
(2) Provisional figures
TABLE In. Sugar production in thousand metric tons (1), 1957 - 1965
I Crop No. of IYear factories Av. Pol. Island West North East South Centre
operating
1957 26 98.5 562.0 36.05 141.28 103.31 198.86 82.50
1958 25 98.5 525.8 31.80 137.17 106.07 178.80 72.01
1959 24 98.6 580.4 35.22 141.95 123.76 195.86 83.59
1960 23 98.0 235.8 18.06 75.22 50.02 72.24 20.24
1961 23 98.8 553.3 32.62 140.05 111.92 183.77 84.90
1962 23 98.6 532.8 35.09 154.51 109.25 176.74 56.87
1963 23 98.8 685.5 47.3 175.2 145.5 222.0 95.5
1964 23 98.9 519.0 40.5 148.7 108.9 161.4 59.5
1965 (2) 23 98.6 664.5 I 53.8 158.1 148.7 212.5i
91.4
-NOTE: (1) To convert into long tons, multiply by 0.984
" " "short" " " 1.102
(2) Provisional figures

IV
Table IV. Yield of cane metric tons per arpent (1), 1957 - 1965
SECTORS 1957 I 1958 1959 I 1960 I 1961 1962I
1963 1964 1965 (2)IISLAND I
Millers ... 32.2 30.5 32.5 15.3 32.2 28.0 35.1 26.2 35.7
Planters 19.1 19.1 19.7 10.2 20.5 19.5 23.7 18.5 25.6
Average ... 25.6 24.5 25.9 12.7 26.4 23.9 29.6 22.4 30.8
WEST
Millers ... 35.9 32.4 34.4 21.3 35.3 31.8 37.8 32.3 43.5
Planters 27.8 25.2 26.4 13.5 23.4 22.7 27.8 25.0 35.7
Average ... 30.8 28.0 29.3 16.2 27.8 26.2 32.1 28.1 39.5
NORTH
Millers ... 29.0 29.5 30.0 19.2 29.2 31.1 35.0 29.0 35.5
Planters 16.9 17.5 17.1 11.4 20.6 21.4 24.0 19.2 24.2
Average ... 21.1 21.6 21.5 14.1 23.5 24.7 27.8 22.5 28.1
EAST
Millers ... 31.5 31.5 33.0 16.3 32.7 29.0 37.6 28.0 39.0
Planters 17.2 16.8 19.2 9.3 17.9 17.1 21.3 16.0 23.5
Average ... 22.9 22.4 24.8 12.2 24.4 22.5 28.9 21.5 30.9
SOUTH
Millers ... 32.8 30.3 32.3 14.6 31.7 27.8 33.4 24.5 33.1
Planters 22.0 22.5 21.4 9.4 20.8 20.1 24.6 18.7 27.3
Average ... 29.3 27.4 28.6 12.9 28.3 25.5 30.7 22.7 31.2
CENTRE
Millers ... 34.1 30.6 34.9 9.7 36.7 22.1 36.2 23.3 35.7
Planters 20.4 19.9 22.0 7.6 23.7 15.8 24.1 16.9 25.7
Average ." 28.6 25.9 29.1 I 8.8 30.8 19.3 30.8 I 20.5 31.3
NOTE: (1) To convert in metric tons/acre, multiply by 0.959" long tons/acre, 0.945" short tonslacre, 1.058" metric tons/hectare, " 2.370
(2) Provisional figures

v
Table V. Average sugar manufactured % cane U), 1956 - 1965
Crop Year Island West North East South Centre
1956 12.95 13.17 13.59 12.84 12.47 12.89
1957 12.94 13.07 13.86 12.64 12.49 12.88
1958 12.14 12.36 12.95 12.22 11.53 12.12
1959 12.24 12.48 13.08 12.22 11.64 12.27
1960 9.84 10.94 10.34 9.73 9.29 9.56
1961 11.19 11.40 11.76 10.94 10.78 11.47
1962 11.52 12.07 11.90 11.38 11.12 11.76
1963 11.93 12.66 12.32 11.54 11.54 12.40
1964 11.85 12.22 12.52 11.70 11.39 11.50
1965 (2) 11.10 11.50 10.82 11.16 I 10.98 I 11.60
NOTE: (1) To convert into tons cane per ton sugar manufactured: divide 100 by above percentage
(2) Provisional figures
Table VI. Tons sugar manufactured per arpent reaped, 1956 - 1965
I Crop Year Island West North East South I Centre
1956 3.41 3.56 3.47 3.07 3.53 3.49
1957 3.31 4.02 2.92 2.89 3.66 3.68
1958 2.98 3.46 2.79 2.74 3.16 3.14
1959 3.17 3.66 2.81 3.03 3.33 3.57
1960 1.26 1.96 1.49 1.19 1.20 0.84
1961 2.95 3.16 2.76 2.67 3.05 3.54
1962 2.75 3.16 2.94 2.56 2.84 2.27
1963 3.53 4.06 3.42 3.34 3.51 3.82
1964 2.66 3.43 2.82 2.52 2.58 2.35
1965 (1) 3.42 4.54 I 3.04 I 3.45I
3.43 3.63
NOTE: (1) Provisional figures

Table VU. Monthly rainfall in inches, 1949·· 1965. Average over whole sugar cane area of Mauritius
GROWTH PERIOD NOY·JUNE MATURATION PERIOD JULY·OCT.
Crop year(deficient months in italics) (sum of (excess months in italics) (sum of
monthly monthlyNOV. DEC. JAN. FEll. ,I MAR. APR. MAY I JUNE deficits) JULY AUG. SEPT. OCT. excesses)
Normals1875-1949 3.77 7.09 11.04 11.06 12.09 9.50 6.91 4.96 15.00 4.59 4.15 2.90 2.81 2.50
Extremes 0.52 1.74 2.69 2.59 3.35 1.45 1.62 0.97 2.20 1.62 0.60 0.69 0.76 0.00to date 13.18 44.81 32.46 36.04 38.98 27.60 21.41 16.49 29.20 10.23 12.52 8.06 9.83 14.12
1949 4.01 5.48 4.81 16.71 8.86 7.01 3.30 10.09 17.17 4.11 1.91 1.39 1.39 0.00
1950 3.34 3.42 10.20 5.21 23.18 11.39 2.98 7.02 14.72 4.47 5.02 2.80 2.35 0.87
1951 3.15 5.86 11.65 8.20 10.89 7.98 7.00 7.26 7.43 4.91 5.41 4.16 3.84 3.87
1952 4.08 2.22 5.26 11.17 16.88 10.11 5.69 4.86 12.31 8.22 5.20 3.47 3.13 5.61
1953 6.06 18.05 11.65 6.59 10.57 8.35 11.95 12.75 7.14 10.10 4.72 3.07 2.68 6.25
1954 3.76 11.47 5.00 7.96 14.89 6.20 6.49 6.06 12.88 6.44 5.04 4.11 1.53 3.76
1955 4.81 5.19 4.50 23.28 19.60 10.97 8.83 7.73 8.44 4.66 3.85 3.68 1.12 0.85
1956 3.03 7.70 12.02 13.59 10.60 4.14 5.93 4.90 8.63 2.94 2.82 1.68 1.40 0.00
1957 2.08 8.11 7.80 6.98 8.93 10.66 6.14 3.66 14.24 3.55 254 3.32 0.96 0.42
1958 2.09 10.26 13.49 13.28 29.54 13.29 4.95 2.20 6.40 8.22 4.51 1.5u 2.47 3.99
1959 1.18 3.06 13.64 9.48 13.93 4.81 3.04 1.80 19.91 3.07 6.01 267 6.53 5.59
1960 11.43 6.58 23.46 18.29 16.97 1.73 3.23 5.06 11.96 3.57 2.29 8.06 1.49 5.16
1961 2.48 3.13 4.31 2.59 7.96 7.58 4.70 7.13 28.71 7.84 5.65 2.05 2.26 4.75
1962 3.89 44.81 11.17 15.42 14.47 5.12 5.62 5.49 5.67 2.89 3.50 3.79 5.28 3.36
1963 4.68 5.26 8.41 11.46 5.02 9.49 5.41 4.09 13.91 6.13 0.82 1.76 3.50 2.23
1964 7.43 2.24 22.12 9.75 10.58 8.28 6.42 4.05 10.29 3.71 2.07 4.05 4.54 2.88
II
I I I1965 1.08 5.27 11.13 6.85 10.70 16.19 4.66 3.23 14.09 9.01 9.45 6.67 3.46 14.12
NOTE: To convert into millimetres, multiply by 25.4

Table VIII. Monthly maximum and minimum air temperatures, 1950 - !965. Average over whole sugar cane area of Mauritius
-IAPR. I 1
-YEAR NOV. DEC. I JAN. FEB. MAR. MAY JUNE I JULY AUG. SEPT. OCT.
M ID M ID M ID M ID M ID M ID M m M ID M m M ID M ID M mNormals1950-65 27.9 18.7 29.2 20.6 29.7 21.7 29.4 21.8 29.1 21.5 27.9 20.2 26.4 18.6 24.8 17.1 24.0 16.4 23.8 16.0 24.8 16.5 26.1 17.4
1950 28.1 18.0 29.6 20.0 30.0 22.1 29.0 21.9 28.5 21.2 27.4 20.3 26.4 16.6 24.7 17.1 23.2 16.0 23.6 15.7 24.0 15.8 26.4 17.2
1951 28.1 18.1 29.2 21.0 29.9 22.2 28.7 22.0 29.1 21.7 28.4 19.1 26.8 18.3 24.6 17.5 24.5 16.9 24.0 16.3 24.9 16.2 26.1 17.7
1952 27.7 19.3 29.8 21.0 30.8 22.3 29.6 21.9 28.8 22.2 28.0 21.2 26.9 20.0 23.8 17.3 l24.0 16.8 23.8 15.6 25.0 17.2 25.9 16.7
1953 27.7 18.6 28.7 19.7 29.2 21.5 29.6 21.5 30.4 21.2 28.6 20.2 27.1 19.9 26.0 19.1 24.1 17.2 23.7 16.1 24.7 16.6 25.9 17.5
1954 28.1 19.0 28.8 21.1 29.8 21.7 30.4 22.3 29.8 21.4 27.9 21.0 26.6 20.0 24.9 17.3 24.1 17.4 24.2 17.0 24.6 17.4 26.5 17.3
1955 27.4 19.2 29.1 20.2 30.9 21.6 29.4 21.3 29.1 22.1 28.1 20.4 26.6 18.9 24.7 17.6 24.0 16.8 23.4 15.9 24.9 16.4 .25.8 16.5
1956 28.4 18.7 28.4 20.4 29.4 21.7 28.4 21.6 28.6 21.3 27.5 19.4 26.2 19.2 24.5 16.4 24.0 15.0 24.7 15.5 25.8 16.6 27.2 17.6
1957 29.2 17.8 29.8 20.3 30.4 21.6 28.8 21.1 29.4 21.3 27.4 19.2 26.7 18.4 24.6 16.7 24.9 16.2 24.4 16.0 25.6 16.5 27.6 17.4
1958 29.2 17.8 30.5 21.3 29.9 21.9 29.6 21.8 29.6 22.4 28.8 22.1 26 I) 17.7 24.4 16.3 24.2 15.6 24.4 16.7 25.9 16.2 26.1 17.3
1959 28.4 17.9 30.1 19.9 30.1 21.1 29.8 21.7 28.7 22.5 28.1 20.0 26.6 17.6 25.0 15.8 23.5 15.6 23.7 15.9 24.8 16.2 25.8 17.8
1960 27.3 20.5 28.9 20.9 28.8 22.0 29.1 22.4 28.7 21.5 '27.8 19.1:26.8 18.6 24.7 17.7 23.4 16.2 24.0 17.0 24.3 17.5 25.7 17.5
1961 26.6 18.6 29.2 20.6 29.8 21.9 30.8 21.2 29.8 21.8 29.4 21.1 28.3 19.6 26.4 18.3 25.5 18.4 24.3 16.8 25.4 16.5 26.7 18.0
1962 28.3 19.9 28.6 22.1 29.2 21.7 29.5 22.2 29.5 22.1 27.6 19.3 25.8 18.0 24.7 16.°1 24.0 15.1 23.6 15.7 25.1 17.0 25.7 17.8
21.31 29.3 28.7 20.7128.6 20.8 25.8 17.8 25.2 16.3 14.4 25.9 16.71963 27.3 18.4 29.1 20.8 29.1 21.6 17.4 23.8 23.6 24.3 15.4
1964 27.1 18.9 29.0 20.0 29.2 21.1 29.1 23.1 28.9 22.7 26.1 19.8 24.8 18.1 24.1 16.5 22.7 14.9 22.9 15.4 23.7 15.9 25.2 16.9
1965 27.3 18.2 28.8 20.4 28.3 21.4 29.2 21.8 28.0 20.5 27.1 20.81 25.2 18.7 24.4 16.1 24.1 17.5 22.9 16.6 24.2 17.3 25.3 18.1
<............

VIII
Table IX. Highest wind speed during one hour in milestO. Average over Mauritius
Crop I
~11959 196111962Year 1951 1952 1953 1954 1955 1956 1957 1960 1963 1964 1965
-------- -_._-November 17 24 18 18 14 16 12 13 13 19 16 18 15 17 15
December 24 21 15 16 15 17 13 13 14 15 15 43(2) 24 18 17
January 21 22 18 28 13 20 20 . 14 17 53(2) 16 20 26 60(2) 19
February 20 25 15 15 34(2) 16 19 18 17 74(2) 13 59(2) 16 34(2) 15
March 18 25 15 15 29 19 18 33(2) 18 15 13 18 17 24 21
April 17 22 20 16 16 17 16 28 17 15 12 21 16 18 21
May 20 24 22 22 19 18 15 , 14 16 17 13 20 20 22 24
June 23 25 23 20 22 17 13 14 17 17 19 17 18 20 17
July 21 20 24 16 17 15 12 11 16 15 19 19 17 20 20
August 24 25 24 23 20 14 17 20 18 16 20 22 15 20 18
September 21 21 20 19 19 171
17 17 17 20 21 18 17 20 17
October 20 20 14 I 151
18 18 I 221 16 17 1819 20 I 18 ' 17 19I I
NOTE: (1) To convert into knots, multiply by 0.87kilometres/hr., multiply by 1.61metreslsec., multiply by 0.45
(2) Cyclonic wind above 30 miles per hour
X. Highest wind speed during one hour in miles in different sectors. Cyclone years
. -Cyclone Years West North East South Centre
February 1955 - 30 - 37 35
March 1958 34 29 22 35 31
January 1960 Alix 60 48 43 60 -
February 1960 Carol 83 82 78 74 55
December 1961 Beryl 49 45 33 51 40
February 1962 Jenny 64 74 49 58 54
January 1964 Danielle 48 61 55 81 53
I February 1964 Gisele I 37 I 33I
26 42 I 32

IX
Table XI. Variety trend in Mauritius, 1951 - 1965
% Area cultivated (Estate lands)
I tIlCl)
.S r-N '<t \0 00 ..... ::a r- '<tr<) '<t
.,.., -e- 00"'T .,.., r<)
<3 r- '<t ..... N~ --- --- -e- --- '<t --- --- IlJ --- r<) 0 \0 r- tIl
'<t r- --- N --- r<) N IlJ ..... ....<C ..... r<)
.,..,r<) ..... ..... ..... Cl)
r<) -e- 0 .,.., '<t tIl r- r-r<) 0'1 Cl) r<) '<t -"=~..... - N N '<t :;E l=: Cl) r<) r<) r<)
l=: ....;r. :;E :;E :;E
.Cl) p:i 0~ :;E ~ :;E oD ·1lJ p:i p:i p:i.... r..l.l oD
IlJ r..l.l..r::....0
------------ ----~1951 92 - - - - - - 4 2 - - - - - -
1952 90 - - - - - - 3 4 - - - - - 1
1953 86 - - - - - - 3 8 - - - - - 1
1954 83 - - - - - - 3 9 - 1 - 1 - 1
1955 74 - - - - - - 2 15 - 3 - 2 1 1
1956 66 1 1 - - - - 3 17 - 4 - 3 2 1
1957 55 6 3 - - - - 1 21 - 4 1 3 3 1
1958 43 10 4 - - - - 2 24 - 5 1 3 5 1
1959 33 15 5 - - - - 1 25 - 5 2 3 8 1
1960 25 19 5 - - - - 1 26 - 6 2 3 10 1
1961 19 23 5 2 1 1 - - 24 1 7 2 2 11 1
I 1962 13 26 4 4 3 1 - - 21 3 7 3 2 11 1
1963 9 29 4 6 5 2 - - 18 4 6 3 2 11 1
1964 6 31 3 8 9 2 - 1 15 5 6 2 - 11 1
1965 5 29 4 11 12 2 2 1 I 11 6 5 2 - 9 1
- I

TABLE XII. Percentage annual plantations under different cane varieties on sugar estates, 1961 to 1965.
Island Centre
1.2 0.411.0 - 0.4 1.0 0.1 - - - -
I... 30.1 28.931.022.5 3.6 17.844.1 55.1 4'cl.1 113.1 55.4 53.3 68.156.8 13.4 34.4 32.5 30.9 22.0 1.627.923.6-23.1 14.9 - 8.9 3.6 1.0 0.4 -I '. I I
0.8 1.2 1.716.2 9.4 - - -. 1.3 6.2 3.3 1.9 1.0 2.4 7.5 1.0 2.7 6.1 14.922.3 0.2
10.8
1.0 5.5 7.9 - 1.0 - - 0.6
12.6
116.1
14.81'1.3 21.1 18.3 15.6 ".9'28.4 29.2 1l.2 12.1 12.4 22.0 13.7 15.3 26.3 19.3 23.0 23.3 1l.5 f5.7 15+5.1 24.8 10.8 8.1 7.8 4.0 0.6
11.6·20.4 24.425.5 26.3 - 3.3 1.8 - 0.9 2.9 3.1 9.3 12.3 18.8 12.828.6 16.4 20.6 19.1 18.7.24.0,28.723.4 22.9 5.527.4 46.662.767.9
., 1.0 1.7 - 0.6 1.3 - - -I 0.9 1.4 5.0 8.0 0.6 1.8 3.2 - - - 0.5
M.202/46
M.93/48
M.134/32
M.31/45
M.147/44
M.99/48
M.253/48
M.442/51
Ebene 1/37 ...
Ebene 50/47...
- - -- - 3.4 - - - - 1.1
l- - - - 0.6 - - - - 5.7 - - - - 4.41 - - - - 1.8
3.6 3.7 1.7 1.4 2.7 12.8 7.4 2.4 10.9
1,20.6
3.1 3.7 3.3 0.3 1.6 4.0 3.3 1.3 1.3 0.9 2.2 3.1 1.9 1.2 1.5 i 3.4 3.6 - - -
!- - - 4.218.8 - - - 7.023.8 - - - 1.8 26.6 - - - 5.0 18.4 - - - 5.4 20.91- - - 1.0 1.8
12.7 3.0 4.5 1.7 1.7 - - - - - 3.3 - - - - 11.7 - 4.1 - - 12.3 1.2 3.6 3.6 3.4(0.3 16.4 13.5 1.3 1.5
7.3 12.6 9.7 7.6 4.4 3.1 2.9 0.7 - - 0.5 6.3 4.0 2.1 1.4 6.4 4.4 3.5 3.5 2.4 3.9 i12.5 9.2 8.6 7.1 :26.3 35.5 26.0 20.4 5.5
- 12.9 1.7 -
I- - 0.61 0.6 -4.3 2.5 1.9
- 6.9 5.4 7.6 4.75.7 0.1 14.8 4.9
l- - - 9.2\9.4 5.1 3.1
2.8 1.2 0.6 3.6 4.3 5.1 2.51 0.812.1 4.1
~ ~II~ 8 ~ MV)MNO..... \D... ~M'" N~ '0"' v) -.:r'" tr) tr)"'
0.5 0.4 6.1 0.6
- - - 1.5 0.9
0.8/0.7. -
- 0.6 2.2
5.0 3.5 0.7
I
~ ~.II~ ~ ~r-. .,..,.-I N N N"
- 26.7 24.5 9.0 3.2
o~M-
8.7 5.4 2.4 1.5 0.4 18.7 1.3 4.9 3.2 0.2 '14.0 8.6 -
6.0 2.4 5.8 3.1 -
4.0 3.5 1.2 0.2
....... \D 0 tr)tr) 0 0\ tr)
'<1". '<1". N r--tr) M N'" M"'- - -
1.6 1.1 2.8 4.216.9 2.6 0.9 2.2
B.37172
B.3337
B.34104
Total areaarpents
Other varieties

XI
Table XIII. Percentage weight of ratoons in total cane production on estates
I I I-
Year Island West North East South Centre
II
I1952 88.6 85.0 83.4 87.9 90.2 86.7
1953 87.8 85.9 87.7 88.1 88.5 85.4
1954 88.0 83.8 86.8 89.6I
89.4 85.3
1955 87.1 86.7 88.6 87.7 86.4 86.1
1956 84.5 87.5 86.4 84.9 83.8 82.9
1957 85.0 79.0 86.9 83.6 85.7 83.7
1958 82.9 77.9 86.3 77.5 83.1 85.5
1959 86.1 87.8 85.9 82.1 87.2 87.8
1960 81.9 82.2 82.7 78.3 75.2 84.8
1961 85.4 78.5 84.4 85.1 86.3 86.7
1962 82.9 72.8 83.3 82.1 84.6 82.1
1963 86.2 77.8 86.2 84.6 88.3 85.8
1964 88.2 89.9 86.9 88.9 89.3 83.7
1965 86.7 87.2 87.2 85.0 78.5 87.2
NOTE: The weight of cane produced on estates in 1965 was: virgins 483,990 tons ; ratoons 3,165,018
Table XIV. Average yields of virgin and ratoon canes on estatesTons per arpent, A: 1961 - 1964 B: 1965
Island I West I North I East I South I Centre
Crop Cycle
I ~ I IA B A B A B A B A B
-- -- -_. ---- -- ----- - ---Virgin 35.0 38.8 42.3 51.3 35.7 40.0 38.6 41.3 32.7 36.1 32.8 36.4
1st Ratoon 32.4 37.7 36.1 38.5 33.3 38.4 34.0 41.5 31.2 35.6 31.1 38.1
2nd " 30.7 37.6 33.3 43.7 31.4 36.3 32.6 42.1 29.5 34.4 29.4 37.5
3rd"
29.7 35.0 31.3 39.0 . 30.4 35.6 31.7 37.6 28.8 32.3 28.2 35.5
4th"
29.1 33.5 29.6 41.2 29.8 33.8 30.5 37.6 28.2 30.9 28.3 32.8
5th"
28.7 34.1 29.1 37.6 29.2 34.4 29.9 38.3 27.8 31.3 28.8 35.1
6th" I 28.0 34.0 29.1 36.2 28.6 33.5 28.61 37.4 27.4 I 31.7 1 27.7 36.5
-

Table XV. Evolution of 1965 crop - Production data at weekly intervals
XII
[slandl West INorth IEast ISouth Icentre 1,1"""1 W"'~INorth IEast ISouth Ic'n'" k'land! W"', IN."hIEast ISouth icon'''' [Slandl West INorth IEast ISouth Icentre
17th July 24th July 31st July 7th August
Cane crushed (1000 m. tons) 253 36 - 77 135 5 467 56 12 140 230 I 29 717 75 62 202 313 65 1,013 95 1125 267 424 102
Sugar manufactured % cane 10.13 10.51 - 10.24 9.94 10.75 1:).16 10.48 9.44 10.33 9.98 10.54 10.29 10.65 9.94 10.56 10.02 10.64 10.40 10.79 ' 10.04 10.69 10.16 10.73
Sugar manufactured (1000 m. tons) 25.6 3.8 - 7.9 13.4 0.5 47.5 5.9 1.2 14.5 22.91 3.0 73.8 8.0 6.2 21.4 31.3 6.9 105.4 10.3 12.6 28.5 43.0 11.0
14th August 21st August 28th August 4th September
Cane crushed (1000 m. tons) 1,319 116 205 330 526 142 1,531 131 263 375 I 595 167 1,814 152 326 442 694 200 2,106 172 405 503 790 236
Sugar manufactured % cane 10.50 10.90 10.18 10.79 10.27 10.82 10.57 10.96 10.23 10.83 10.35 10.87 10.61 11.02 10.28 10.92 10.40 10.90 10.66 11.05 10.30 10.96 10.47 10.96
Sugar manufactured (1000 m. tons) 138.5 12.6 20.9 35.6 54.0 15.4 161.8 14.3 26.9 40.7 61.7 18.2 192.5 16.7 33.6\ 48.2 72.2 21.8 224.5 19.0 41.8 55.1 . 82.7 25.9i
11th September 18th September 25th September 2nd October
Cane crushed (1000 m. tons) 2,4061192 484 567 886 277 2,712 213 562 632 985 320 3,016 ~ 234 642 694 1,084 362 3,283 247 720 750 1,168 398
Sugar manufactured % cane 10.72 ·11.08 10.34 11.00 10.57 11.04 10.78 11.14 10.40 11.10 10.62 11.16 10.87 11.22 10.45 11.16 10.72 11.27 10.93 11.25 10.50 11.20 10.79 11.36
Sugar manufactured (1000 m. tons) 258.0 21.3 50.0 62.4 93.7 30.6 292.51 237.0 58.5 I 70.1 104.6 35.6 328.0 26.2 67.7 77.5 116.6 40.8 358.7 27.8 75.6 84.0 126.0 45.3
oth October 16th October 23rd October 30th October
Cane crushed (1000 m. tons) 3,571 266 798 808 1,259 440 3,858 287 876 869 1,347 479 4,096 304 939 914 1,426 1 513 4,383 323 1,014 974 1,518 554
Sugar manufactured % cane 10.97 11.29 10.54 11.22 10.85 11.42 11.00 11.33 10.57 11.27 10.88 11.49 11.03 11.35 10.62 11.28 10.91 '11.53 11.05 11.39 10.65 11.28 10.95 11.54
Sugar manufactured (1000 m. tons) 391.7 30.1 84.1 90.7 1136.6 50.2 424.7 32.5 92.6 97.9 146.6 55.1 451.9 I 34.5 99.7 !103.0 155.6 59.1 484.5 36.8 108.0 109.8 166.0 63.9I
6th November 13th November 20th November 27th November
Cane crushed (1000 m. tons) 4,566 336 1,063 1,013 1,574 580 4,822 356 1,132 1,061 1,656 617 5,087 375 1,206 1,117 1,734 655 5,340 394 p,280 1,170 1,803 693
Sugar manufactured % cane 11.08 11.41 10.68 11.30 10.97 11.57 11.09 11.45 10.71 11.28 10.98 11.59 11.10 11.47 10.76 11.25 10.98 11.61 11.10 11.48 10.77 11.25 10.98 11.61
Sugar manufactured (1000 m. tons) 506.0 38.4 113.5 114.4 1172.7 67.0 535.0 408.0 121.2 119.7 181.8 71.5 564.8 43.0 129.8 125.6 190.4 76.0 593.5 45.3 138.0 131.8 198.0 80.4
4th December 11th December 18th December Total crop production (preliminary figs.)
Cane crushed (1000 m. tons) 5,583 413 1,353 1,223 1,863 731 5,791 432 1,412 1,271 1,909 767 ,5,944 452 1,455 1,314 1,935 788 5,984 468 1,461 1,333 1,935 788
Sugar manufactured %cane 11.10 11.49 10.77 11.21 11.00 11.60 11.09 11.49 10.81 11.20 10.98 11.60 11.09 11.49 10.81 11.17 10.98 11.60 11.10 11.50 10.82 11.16 10.98 11.60
Sugar manufactured (1000 m. tons) 620.0 47.5 145.7 137.2 204.9 84.7 643.0 49.7 152.7 142.3 209.5 88.8 659.6 51.9 157.3 146.7 212.3 91.4 664.5 53.8 158.1 148.7 212.5 91.4I
r, -

XIII
Table XVI. Evolution of cane quality during 1965 sugar crop
31st "
24th "
21st "
28th "
Week Ending
14th "
17th July
7th August
1 I~a~I~~~~1 A EistB AsouthB ~I~11.95 10.28 12.12 10.75 - - 12.08 10.40 11.31 10.07 12.40 10.75
11.85 10.20 12.25 10.65 11.48 9.44 12.02 10.42 11.65 10.01 11.96 10.54
11.96 la. f4 12.50 11.l6 11.81 10.08 1~.11 10.79 11.72 10.15 12.20 10.68
12.17110.64 12.58 11.31 11.77 10.09 12.36 11.13 12.05 10.47 12.51 10.88
12.3010.8212.7311.4211.9610.4°112.4611.21 12.2410.6912.6811.08
12.20 10.81 12.79 11.41 11.76 10.34 ~ 12.43 11.22 12.18 10.74 12.51 11.03i
12.31 10.96 12.84 11.43 11.85 10.51 12.54 11.32 12.28 10.89 12.47 11.06
:-----~~-_._----~--.--------~"-.--------'----:
4th September 12.32' 10.96 12.71 11.23 11.81 10.42 12.49 11.24 12.38 11.01 12.78 11.41
11th " 12.53 1l.l9 12.87 11.39 11.90 10.56 12.77 11.54 12.62 11.28 12.97 11.53
18th " 12.79 11.38 13.20 11.70 12.04 10.65 12.91 11.70 13.03 11.45 13.29 11.84
25th " 12.85 11.52 13.53 12.03 12.23 10.87 13.02 11.81 12.85 11.49 13.45 12.16
2nd October 12.69 11.39 13.22 11.74 12.21 10.82 12.73 11.53 12.75 11.41 13.36 12.11
9th " 12.83 11.48 13.30 11.76 12.36 10.97 12.85 11.63 12.85 11.46 13.45 12.14
16th " 12.77 11.45 13.31 11.84 12.44 11.01 12.66 11.58 12.77 11.38 13.32 12.06
6th November 12.68 11.42 13.45 12.01
23rd "
30th "
12.83 11.48 13.22 11.75
12.75 11.41 13.53 11.99
12.57 111.07
12.64 11l.l 8
12.67 11.23
12.63 11.52 12.83 11.50 13.30 12.03
12.37 11.34 12.70 11.29 13.19 11.95
12.29 11.26 12.56' 11.32 13.23 11.99
13th "
20th "
12.75 11.38 13.68 12.11 12.77 11.28 12.15 10.97 12.67 11.23 13.21 11.92
12.58 11.25 13.24 11.73 12.67 1l.l8 12.15 10.91 12.55 1l.l6 13.09 11.80
27th" 112.65
4th December 12.45
IIth " 12.53
11.22 13.46 11.76 12.71 11.20 11.94 10.77 12.62 11.16 '13.08 11.76
10.99 13.52 11.78 12.52 11.01 11.86 10.61 12.30 10.75 12.77 1l.43
10.95 13.40 1l.49 12.84 11.26 11.98 10.54 12.38 10.68 12.46 11.08
18th " 12.65 11.05 13.38 111.48 12.89 1l.l9\12.03 110.45 12.40 10.97 12.80 ~2.04
NOTE A = Sucrose % cane
B = Sugar manufactured ~~ cane

XIV
Table XVII. Duration of harvest in days (A) and weekly crushing rates of factories in1000 metric tons (B) in different sectors of the island, 1948 - 1965
Island West North Eastr
South CentreYEARS
A B A B A B~I_B~I_B A B--
1948 132 167.6 140 7.3 122 42.1 136 33.6 140 60.0 125 24.6
1949 133 176.5 142 7.7 128 44.0 129 37.0 140 62.4 127 25.4
1950 141 184.6 130 10.1 140 47.9 145 35.1 144 65.0 135 26.5
1951 154 197.8 150 10.3 169 52.0 159 40.3 140 65.8 132 29.4
1952 149 192.4 151 9.9 149 50.5 155 40.2 154 63.4 131 28.4
1953 158 205.7 162 11.8 167 57.7 161 42.5 153 66.0 145 27.7
1954 140 214.1 142 11.7 137 60.5 138 42.9 147 68.7 134 30.3
1955 133 222.6 134 12.8 122 64.2 140 41.5 140 71.6 127 32.5
1956 136 227.3 129 12.7 137 62.71 138 43.4 138 76.2 128 32.3
1957 128 237.5 144 13.3 104 68.2 133 42.9 141 78.6 129 34.5
1958 131 232.2 131 I 13.7 109 68.2 142 I 42.9 142 76.4 135 30.9
1959 134 248.4 127 15.5 106 71.8 152 46.7 148 79.4 136 35.1
1960 113 148.3 110 10.5 116 43.9 123 29.5 118 46.2 81 18.2
1961 150 230.2 147 13.6 126 66.2 160 44.6 165 72.2 154 33.6
1962 140 231.4 158 12.9 136 66.9 159 42.2 141 78.8 111 30.6
1963 153 263.3 160 16.3 132 75.4 174 50.6 156 86.0 154 34.9
1964 121 252.9 119 19.5 115 72.1 127 51.3 130 76.2 107 33.7
1965 156 268.7 178 18.31 145 70.5 164 56.7 155 I87.41 154 35.7

xv
Table XVIII. Summary of chemical control data 1965
(i) CANE CRUSHED AND SUGAR PRODUCED
--"-~~~ "-
" .~ a' Q, ;:l '- ~
~ ~ " ~ " o e '" ~ ~ ~<Cl
-Cl '-'"" w ~
o:l"::l
I
h~
(1)
" '" ;:l ;:l '0 '0 U o:l~
>. " '2 '" ~:o oD '" '" "~ "0 p::; 0 > ~ (I:; "-u
~ ." :;] 8 0 <=: '(1)
~01800:a E ~ ...1 2 0 c:: ~ r=: a:I ~
h o ;:l '2 '" Cl '"~ <.J <=: '" '2 <t: ..... 0 '-." ;:l 2 <t: ;g .§h
'" " ,::l ~ ;::l ~ 0 "0 c:: <.J <.J ! t:o~ '" " v 0 ;::l u, ..c: c:: ;> :3 .;:; '<.J o ,-, ...: '<.J c:: .... ;>-Cl) <.J
~0
'" 0 '" a:I v ~ :t 0 -<IJ:I ..c: IJ:I ~ U :5 "o
~Cl) ~ a:I Cl)
Cl)a:I ~.... IJ:I ~
CRUSHING From 2/7 16/7 29/7 23/7 23/7 30/7 6/8 16/7 3/7 2/7 23/7 5/7 5/7 5/7 9/7 7/7 14/7 18/7 8/7 2/7 14/7 17/7 20/7 -
PERIODTo 24/12 14/12 6/12- 17/12 18/12 23/12 16/12 14/12 22/12 23/12 16/12 9/12 17/12 4/12 23/11 20/11 16/12 9/12 14/12 20/12 14/12 18/12 16/12 -
No. of crushing days 145 122 109 121 122 114 107 126 143 143 144 131 137 127 113 113 128 133 132 141 128 110 125 128
No. of crushing hours per day 22.00 21.71 23.02 20.77 20.61 22.26 19.81 20.45 19.59 20.99 17.76 16.76 18.19 20.18 20.57 19.19 17.45 17.42 19.94 J8.37 18.10 21.83 22.32 20.28
Hours stoppage per day 1.17 0.69 0.46 0.57 0.84 0.76 0.98 0.55 0.50 0.23 0.45 0.22 1.00 0.73 0.96 0.35 0.18 0.45 0.94 2.12 0.68 0.63 0.93 0.72
Overall time Efficiency 94.9 96.9 98.1 97.4 96.1 96.7 95.2 95.8 97.0 90.9 97.5 98.6 94.8 96.4 95.6 98.2 99.0 97.5 95.6 89.7 96.4 97.2 96.0 96.6
CANE Factory 250,930 62,140 70,313 143,316 119,627 80,463 158,347 117,796 456,353 231,622 78,287 198,591 209,280 206,286 141,857 136,409 128,795 192,270 60,632 74,115 132,932 130,342 237,482 3,618,185CRUSHED(Metric Tons) Planters 216,829 172,080 139,410 64,868 173,439 172,064 104,858 151,528 262,516 112,797 68,227 33,548 43,300 68,715 60,311 23,860 1,919 174 90,059 118,683 91,926 77,494 117,703 2,366,308
Total 467,759 234,220 209,723 208,184 293,066 252,527 263,205 269,324 718,869 344,419 146,514 232,139 252,580 275,001 202,168 160,269 130,714 192,444 150,691 192,798 224,858 207,836 355,185 5,984,493
Factory % Total 53.6 26.5 33.5 68.8 40.8 31.9 60.2 43.7 63.5 67.3 53.4 85.5 82.9 75.0 70.2 85.1 98.5 99.9 40.2 38.4 59.1 62.7 66.3 60.5
Per day 3,226 1,920 1,924 1,721 2,402 2,215 2,460 2,137 5,027 2,409 1,017 1,772 1,844 2,165 1,789 1,418 1,021 1,446 1,142 1,367 1,757 1,889 2,841 2,040-"
Per hour actual crushing 146.6 88.4 83.6 82.8 116.5 99.5 124.2 103.0 251.7 114.7 57.3 107.5 101.3 106.6 87.0 75.7 58.5 83.0 57.2 74.4 96.8 86.5 127.3 100.6
VARIETIES M.134/32 per cent 6.4 2.2 8.2 1.0 22.6 - 13.7 - 0.4 0.7 - 0.3 3.2 12.4 - - 5.2 12.9 4.0 16.3 2.1 - 0.1 4.4CRUSHED(Factory) M.147/44 per cent 34.1 35.6 56.3 44.2 51.5 66.0 70.2 62.5 23.5 41.1 35.5 47.6 38.0 22.0 2.4 17.9 19.9 21.7 38.5 39.1 21.2 0.4 8.4 31.9
M.31/45 per cent 1.9 0.3 3.8 8.1 1.4 2.6 1.4 4.4 5.7 9.9 3.2 1.5 4.0 3.0 1.4 1.3 6.1 5.5 6.0 3.2 1.2 - - 3.6
M.202/46 per cent 14.2 35.4 12.9 14.0 4.9 5.0 0.5 17.8 14.3 9.2 12.9 7.9 8.0 11.0 17.7 5.7 11.8 11.8 8.2 9.5 12.3 2.1 4.3 10.7
M.93/48 per cent 1.0 3.1 2.8 8.7 2.5 0.8 3.2 0.2 17.0 6.3 7.4 6.0 5.0 9.3 31.6 34.6 6.9 9.8 6.0 2.9 16.4 11.6 28.2 11.0
M.253/48 per cent 9.0 5.4 0.9 2.1 1.7 0.2 - 1.1 2.4 2.6 1.9 1.9 1.9 2.0 0.5 - 1.4 1.5 3.2 0.2 4.4 0.9 0.8 2.2
Ebene 1/37 per cent - - 0.7 4.0 0.4 - 0.2 1.2 14.9 9.4 3.4 5.6 12.5 10.7 24.1 20.7 2.9 9.1 7.0 0.9 20.0 20.1 40.7 11.0
Ebene 50/47 per cent 1.6 1.3 1.1 5.0 1.7 - 1.1 2.6 4.5 2.7 2.9 2.8 5.2 4.5 2.9 1.6 6.4 12.0 4.1 3.5 9.0 54.1 11.9 6.3
B.3337 per cent - - - 0.1 - - - - 8.5 1.2 4.8 12.1 - 2.3 19.3 14.8 0.5 3.8 0.5 0.7 6.5 3.1 2.8 4.1
B.37172 per cent 11.7 16.0 6.9 11.0 9.7 24.5 8.7 9.6 4.6 14.5 9.1 13.0 10.5 17.3 0.1 - 37.4 10.9 16.0 17.8 2.8 - - 9.9
B.34104 per cent 15.4 - 3.4 1.0 1.1 - - - - 1.1 11.0 0.9 4.6 0.5 - - 0.4 - 6.0 0.5 2.3 - - 2.1
Other varieties per cent 4.7 0.7 3.0 0.8 2.5 0.9 1.0 0.6 4.2 1.3 7.9 0.4 7.1 5.0 - 3.4 1.1 1.0 0.5 5.4 1.8 7.7 2.8 2.8
SUGAR Raw Sugar 53,800 24,962 22,736 22,695 32,736 18,086 28,907 28,524 83,360 36,795 4,882 25,687 29,526 31,962 22,983 17,808 5,528 20,978 16,032 19,943 24,860 25,407 41,200 639,397PRODUCED(Metric Tons) White Sugar - I
24,9621 22,7361
- - I 8,052 - - I - I - I 9,196 1 - I29,5261 31,962
1
- - I 8,156 - - - - - - 25,404
Total Sugar 53,800 22,695 32,736 26,138 28,907 28,524 83,360
1
36,795 14,07825'
6871
22,983 17,808 13,684 20,978 16,032 19,943 24,860 25,407 41,200 664,801
Tons Sugar at 960 Pol. 55,210 25,656 1 23,365 1 23,307 1 33,609 26,926 1 29,696 29,280 84,836 37,872 14,548 26,406 30,3661 32,881 23,618 18,313 14,195 21,292 1 16,481 20,496 1 25,559 1 26,132 42,350 I 682,394
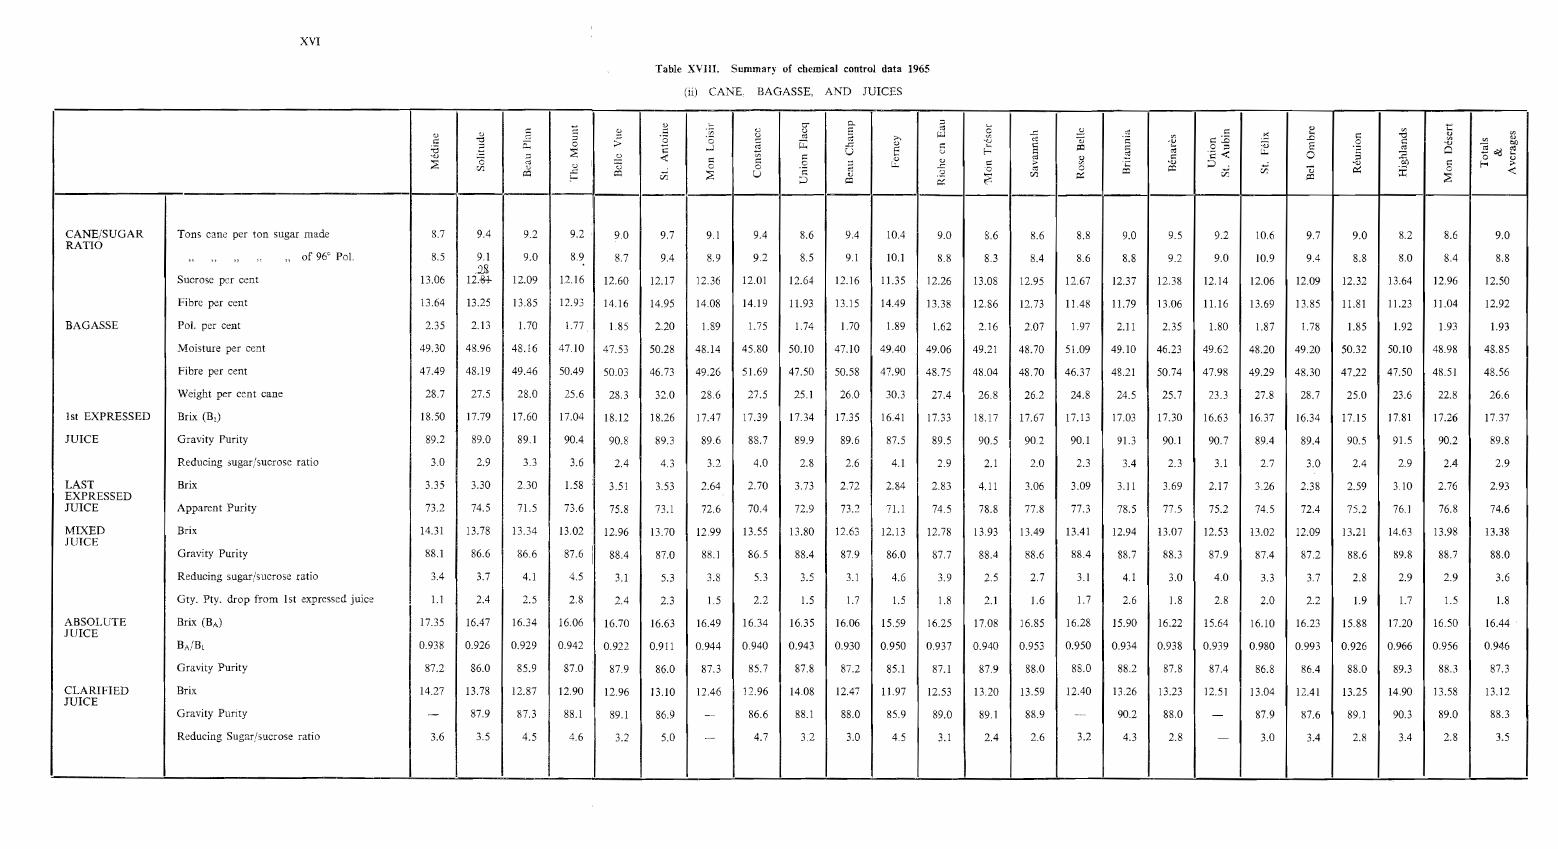
XVI
Table XVIII. Summary of chemical control data 1965
(ii) CANE. BAGASSE, AND JUICES
15c- er 0-
~c- O)
~
~ >:: g 0 0 E £ ~ .s ~ en'""'.~ en u, .r:
'""'0) '"" ~ 5 '0 ;:: oj oj >. ~ <:i en >:::i3 .:::: .s: >:: "Cl <I) 0)
>:: "Cl 0 '0 s ." 0 >:: '";::J c:; > "2 s i:i:: U o c:: c- S i=C c- O ;::J -o E '"'0)
~o<leo
;0 ::E .....I c:: .~ f- a ~ u, '§ Cl '"';2 < 0 :2 '""'." ;::J 52 < '" c:: () oj o 0 <l~ C e " I "0 § § 0 ~ u, ~ c:: ;- v: .c; ,D
~...; -o 00 >:: f-< ;>[JJ
S d '0 oj 0 a:: (/5 <:i ~ i 0 <0:: .r: a:: ill ~ U <lJ .:2 [JJ er; a:: Ul ::sf- a:: ~ ~ i=CI
~
CANE/SUGAR Tons cane per ton sugar made 8.7 9.4 9.2 9.2 9.0 9.7 9.1 9.4 8.6 9.4 10.4 9.0 8.6 8.6 8.8 9.0 9.5 9.2 10.6 9.7 9.0 8.2 8.6 9.0RATIO
" " ",.
"of 96° Pal. 8.5 9.1 9.0 8.9 8.7 9.4 8.9 9.2 8.5 9.1 10.1 8.8 83 8.4 8.6 8.8 9.2 9.0 10.9 9.4 8.8 8.0 8.4 8.8
.2J~Sucrose per cent 13.06 12:8+ 12.09 12.16 12.60 12.17 12.36 12.01 12.64 12.16 11.35 12.26 13.08 12.95 12.67 12.37 12.38 12.14 12.06 12.09 12.32 13.64 12.96 12.50
Fibre per cent 13.64 13.25 13.85 12.93 14.16 14.95 14.08 14.19 11.93 13.15 14.49 13.38 12.86 12.73 11.48 11.79 13.06 11.16 13.69 13.85 11.81 11.23 11.04 12.92
BAGASSE Pal. per cent 2.35 2.13 1.70 1.77 1.85 2.20 1.89 1.75 1.74 1.70 1.89 1.62 2.16 2.07 1.97 2.11 2.35 1.80 1.87 1.78 1.85 1.92 1.93 1.93
Moisture per cent 49.30 48.96 48.16 47.10 47.53 50.28 48.14 45.80 50.10 47.10 49.40 49.06 49.21 48.70 51.09 49.10 46.23 49.62 48.20 49.20 50.32 50.10 48.98 48.85
Fibre per cent 47.49 48.19 49.46 50.49 50.03 46.73 49.26 51.69 47.50 50.58 47.90 48.75 48.04 48.70 46.37 48.21 50.74 47.98 49.29 48.30 47.22 47.50 48.51 48.56
Weight per cent cane 28.7 27.5 28.0 25.6 28.3 32.0 28.6 27.5 25.1 260 30.3 27.4 26.8 26.2 24.8 24.5 25.7 23.3 27.8 28.7 25.0 23.6 22.8 26.6
lst EXPRESSED Brix (B1) 18.50 17.79 17.60 17.04 18.12 18.26 17.47 17.39 17.34 17.35 16.41 17.33 18.17 17.67 17. I 3 17.03 17.30 16.63 16.37 16.34 17.15 17.81 17.26 17.37
JUICE Gravity Purity 89.2 89.0 89.1 90.4 90.8 89.3 89.6 88.7 89.9 89.6 87.5 89.5 90.5 90.2 90. I 91.3 90.1 90.7 89.4 89.4 90.5 91.5 90.2 89.8
Reducing sugar/sucrose ratio 3.0 2.9 3.3 3.6 2.4 4.3 3.2 4.0 2.8 2.6 41 2.9 2.1 2.0 2.3 3.4 2.3 3.1 2.7 3.0 2.4 2.9 2.4 2.9
LAST Brix 3.35 3.30 2.30 1.58 3.5 I 3.53 2.64 2.70 3.73 2.72 2.84 2.83 4.11 3.06 3.09 3.1 I 3.69 2.17 3.26 2.38 2.59 3.10 2.76 2.93EXPRESSEDJUICE Apparent Purity 73.2 74.5 71.5 73.6 75.8 73. I 72.6 70.4 72.9 73.2 71.1 74.5 78.8 77.8 77.3 78.5 77.5 75.2 74.5 72.4 75.2 76.1 76.8 74.6
MIXED Brix 14.31 13.78 13.34 13.02 12.96 13.70 12.99 13.55 13.80 12.63 12.13 12.78 13.93 13.49 13.41 12.94 13.07 12.53 13.02 12.09 13.21 14.63 13.98 13.38JUICE
IGravity Purity 88.1 86.6 86.6 87.6
I88.4 87.0 88.1 86.5 88.4 87.9 86.0 87.7 88.4 88.6 88.4 88.7 88.3 87.9 87.4 87.2 88.6 89.8 88.7 88.0
Reducing sugar/sucrose ratio 3.4 3.7 4.1 4.5 3.1 5.3 3.8 5.3 3.5 3. I 4.6 3.9 2.5 2.7 3.1 4.1 3.0 4.0 3.3 3.7 2.8 2.9 2.9 3.6
Gty. Pty. drop from 1st expressed juice 1.1 2.4 2.5 2.8 2.4 2.3 1.5 2.2 1.5 1.7 1.5 1.8 2. I 1.6 1.7 2.6 1.8 2.8 2.0 2.2 1.9 1.7 1.5 1.8
ABSOLUTE Brix (BA) 17.35 16.47 16.34 16.06 16.70 16.63 16.49 16.34 16.35 16.06 15.59 16.25 17.08 16.85 16.28 15.90 16.22 15.64 16.10 16.23 15.88 17.20 16.50 16.44JUICE
BA/Bl 0.938 0.926 0.929 0.942 0.922 0.91 I 0.944 0.940 0.943 0.930 0.950 0.937 0.940 0.953 0.950 0.934 0.938 0.939 0.980 0.993 0.926 0.966 0.956 0.946
Gravity Purity 87.2 86.0 85.9 87.0 87.9 86.0 87.3 85.7 87.8 87.2 85.1 87.1 87.9 88.0 88.0 88.2 87.8 87.4 86.8 86.4 88.0 89.3 88.3 87.3
CLARIFIED Brix 14.27 13.78 12.87 12.90 12.96 J3.10 12.46 12.96 14.08 12.47 11.97 12.53 13.20 13.59 12.40 13.26 13.23 12.51 13.04 12.41 13.25 14.90 13.58 13.12JUICE
Gravity Purity - 87.9 87.3 88.1 89.1 86.9 -- 86.6 88. I 88.0 85.9 89.0 89. I 88.9 -~ 90.2 88.0 - 87.9 87.6 89.1 90.3 89.0 88.3
Reducing Sugar/sucrose ratio 3.6 3.5 4.5 4.6 3.2 5.0 - 4.7 3.2 3.0 4.5 3. I 2.4 2.6 3.2 4.3 2.8 - 3.0 3.4 2.8 3.4 2.8 3.5

XVII
Table XVIII. Summary of chemical control data 1965
(iii) FILTER CAKE. SYRUP, pH, FINAL MOLASSES, SUGAR
~ '" .~ 0- D. c: ;... ~c: '" ;:0 '" o S d ;;; ..2 0:: '" v:
~§ " ..... ..<:: .S .':0 ;...0:: -e <Il
'" " d ?- o§ '0 0:: 0:: »~ "
<Il c::.o s: '"0:: "d 0: I 0~ ~ e '"
.", § .",:;;) S 0 § .", <Il en
.~ ....J 0:: ... i=C ;... o c: 0 E~ C'l~ ;;S 0:: ;:0 o t- o:: C'l ;J.,.'" c:
I..2 < ~ 0:: 0:: kJ '-' 0:: '" ~ 0:: '2 -c 0 ;:; :2 0 kJ
;;S Cl d <J 0 0~ "- ;:0 > '" .~ .", ;:.J c;j
.", cO 0:: f-; >'" ~ 0 '13 .<: 0 ec 0 i=C - ~ i 0 <(/J
~ c;j ;;S U o i=C iil '"i=C f::: ;:.J '" 02 ;;S (/J ~ i=C ;;Si=C
!
FILTER CAKE Sucrose per cent 0.36 1.29 1.57 2.01 0.65 Ll8 1.13 1.80 0.56 1.50 0.97 0.58 1.82 1.03 2.33 1.78 1.36 LOO 7.83 6.30 7.60 2.16 2.07 2.13
Weight per cent cane 2.5 2.8 3.9 3.0 3.5 4.8 3.4 2.5 3.1 2.9 2.9 4.7 4.2 1.9 2.6 2.8 2.5 2.2 1.8 2.3 1.8 2.0 3.7 2.9I
SYRUP Brix 59.1 51.6 52.0 I 60.1 57.2 57.9 54.6 57.4 62.5 52.9 57.7 61.3 58.3 58.9 66.8 63.1 55.7 58.7 52.9 51.2 56.0 58.7 62.9 57.7
Gravity Purity - 86.4 86.6 88.2 89.0 86.9 - 86.8 87.5 88.2 85.8 88.9 89.0 88.8 - 89.5 87.5 - 87.9 87.0 88.7 89.8 89.1 88.0
Reducing sugar/sucrose ratio 4.0 3.6 4.4 4.4 3.3 4.8 - 4.8 3.5 2.5 4.5 3.1 2.8 1.4 2.9 4.5 - - 2.7 3.2 3.1 3.5 3.1 3.1
pH VALUES Limed juice 7.5 - 8.4 8.1 - 8.1 - 8.3 8.3 8.0 - 8.0 7.9 7.8 7.7 7.8 8.3 7.9 - 7.9 8.3 7.8 7.6 8.0
Clarified juice 7.0 7.0 7.2 7.0 7.2 7.3 7.1 6.9 7.2 7.0 7.1 7.2 7.2 7.1 7.0 7.0 6.8 7.2 6.8 7.1 7.3 7.0 7.0 7.1
Filter Press juice - - 9.1 - 7.2 8.3 7.6 6.7 8.6 7.7 - 8.9 7.0 7.2 7.5 - - 6.6 - - 6.7 - 8.0 7.7
Syrup - - 6.7 6.4 6.7 6.9 - 6.8 6.9 6.8 7.0 7.0 6.7 7.0 - 7.1 6.0 6.7 - 7.2 7.0 7.0 6.9 6.8
FINAL Brix 90.1 89.9 90.7 89.6 89.1 88.2 89.0 87.8 88.4 89.2 86.2 89.2 89.0 90.6 91.5 88.0 87.1 89.4 89.2 88.5 84.2 86.8 89.1 88.8MOLASSES
Sucrose per cent 36.64 34.67 31.31 33.10 34.48 33.40 33.85 31.21 34.80 34.54 32.07 33.83 31.70 33.39 34.93 33.20 37.45 35.62 33.90 35.33 32.97 34.26 35.65 33.99
Reducing sugar per cent 17.00 13.70 17.20 15.00 12.00 12.88 14.79 18.17 10.90 13.79 15.78 11.14 14.32 11.80 13.87 16.60 11.11 12.31 12.60 13.32 12.86 14.71 13.39 13.78
Total sugars 50.64 48.37 48.51 48.10 46.48 46.28 48.64 49.38 45.70 48.33 47.85 44.97 46.02 45.19 48.80 49.80 48.56 47.93 46.50 48.65 45.83 48.97 49.04 47.77
Gravity Purity 37.3 38.6 34.5 36.9 38.7 37.9 38.0 35.4 39.4 38.7 37.3 37.9 35.6 368 38.1 37.7 43.0 39.8 38.0 39.9 39.1 39.5 40.0 38.3
Reducing sugar/sucrose ratio 50.5 39.5 54.9 45.3 34.8 38.6 43.7 58.2 31.3 39.9 49.2 32.9 45.2 35.3 39.7 50.0 29.7 34.4 37.1 37.7 39.0 42.9 37.6 40.5
Weight per cent cane at B5° Brix 2.54 2.95 2.63 2.29 2.49 2.96 2.45 2.80 2.37 2.72 3.01 2.42 2.34 2.37 2.10 2.17 2.80 2.49 2.41 2.82 2.30 2.32 2.59 2.53
SUGAR MADE White sugar recovered per cent cane - - - -- - 3.19 - - - - 6.28 - - - - - 6.24 - - - - - - 0.42
Raw" " " " "
11.50 10.66 10.84 10.90 11.17 7.16 10.98 10.59 11.60 10.68 3.33 11.07 11.69 11.62 11.37 I i.n 4.26 10.90 10.63 10.34 11.05 12.22 11.60 10.68
Total" " " " "
11.50 10.66 10.84 10.90 lLl7 10.35 10.98 10.59 11.60 10.68 9.61 11.07 11.69 11.62 11.37 11.11 10.50 10.90 10.63 10.34 11.05 12.22 11.60 11.11
Average Pol. of sugars 98.52 98.67 98.66 98.60 98.56 98.90 98.62 98.74 97.70 98.81 99.20 98.69 98.73 98.76 98.65 98.72 99.34 98.71 98.69 98.66 98.70 98.74 98.68 98.58
Total sucrose recovered per cent cane 11.33 10.52 10.69 10.75 11.01 10.24 10.83 10.45 11.32 10.35 9.53 10.92 11.54 11.48 11.21 10.97 10.42 10.76 10.49 10.20 10.91 12.07 ll.45 ll.40
Moisture content of raw sugar per cent 0.22 0.30 0.28 0.39 0.42 0.48 0.42 0.31 0.49 0.32 0.37 0.36 0.33 0.22 0.33 0.34 0.47 0.35 0.27 0.39 0.39 0.42 0.34 0.36
Dilution indicator 17.7 29.1 26.4 38.6 41.2 44.8 43.1 32.6 27.1 36.8 31.6 38.1 35.1 26.1 32.3 35.8 - 37.2 25.9 4Ll 42.4 49.1 34.7 34.0

XVIII
Table XVIll. Summary of chemical control data 1965
(iv) MASSECUITES
0) .... 0- P, ;:l'- .....
~.....
0) ~ .v; 0) u E cl S; .2 .~ ~ " '" ....~ UJ .c
.~....
~v>
" " cl 5 ;:l '0 '0 o ~ cl ;>-, ('j v '" ~:E .D § -0 "~ -0 ~ ." <:: ." ~ '".~
p:; ~~ .s p:; .c " ~ '- ~ a:I ~ '- 0 ;:l :;:) E ~
." "Eo(! eo:.0 ::'2 -l U ~
" f-< ~ ~ u, <:: ~ CIl'- .s '2 -<t: 0 '-." "0
;:l .2 -<t: ~ '" ~ "~ " ~ ;:l ~ 0 Cl
::'2 CIl v ~ 0 ;:l u, Cl ~ :> '" ·c ." ~ ...; v:j -o ~ f-< :>CIl " 0)
v:j0 0 '2 ~
.c 0 ~ 0 a:I a:I 0:; ~ i 0 -<t:a:I .c a:I ::'2 u 0) u::'2 CIl ~ CIl ::'2f-< ;:I a:I ~
a:I
MAGMA Apparent Purity 79.9 91.6 85.5 85.9 90.6 84.1 83.6 82.8 89.4 86.1 93.8 92.3 87.3 93.0 81.9 84.0 84.2 85.5 85.6 85.5 84.8 85.2 91.0 86.7
A-MASS ECUITE Brix 91.0 91.6 91.8 90.6 90.9 90.9 92.0 89.0 92.4 91.6 89.2 90.9 91.3 92.1 92.0 91.4 89.4 91.7 91.6 92.3 90.5 92.1 92.1 91.4
Apparent Purity 85.4 86.7 85.4 85.4 86.7 83.5 81.4 82.0 81.2 84.2 86.2 89.9 88.9 83.1 88.8 86.1 88.3 88.1 84.9 83.7 85.3 87.8 85.6 84.9
" " of A-Molasses 70.0 65.0 65.2 67.0 67.1 62.9 58.9 58.4 59.7 60.9 68.4 71.2 66.2 61.7 66.9 64.6 76.2 69.7 63.9 61.8 68.8 66.0 66.8 64.6
Drop in Purity 15.4 21.7 20.2 18.4 19.6 20.6 22.5 23.6 21.5 23.3 17.8 18.7 22.7 21.4 21.9 21.5 12.0 18.4 21.0 21.9 16.5 21.8 16.8 20.3
Crystal per cent Brix in rnassecuite 51.3 62.0 58.0 55.8 59.6 55.5 54.7 56.7 53.3 59.6 56.3 64.9 67.2 55.8 28.0 60.7 50.6 60.7 58.1 74.3 52.9 64.1 49.4 57.3
Cubic feet per ton Brix in Mixed Juice 27.8 26.4 25.9 24.3 23.3 36.7 34.5 29.6 31.8 29.1 31.0 27.9 24.3 32.2 29.9 26.6 33.2 28.0 25.8 28.7 26.6 23.7 33.9 29.0
A-Massecuite per cent total massecuite 54.3 56.0 56.4 54.0 57.1 64.6 62.5 59.9 71.0 58.8 46.8 56.0 53.4 62.3 55.9 55.4 48.3 52.1 50.9 58.0 61.1 55.4 67.5 59.0
B-MASSEC UlTE Brix 91.9 91.8 91.5 92.7 91.9 92.6 92.1 91.0 92.7 92.0 89.3 91.3 92.1 92.8 92.7 92.0 89.4 92.9 91.2 94.1 91.6 91.9 93.1 92.0
Apparent Purity 74.5 74.2 71.8 75.6 74.5 72.6 71.6 72.6 71.3 73.0 76.9 79.3 74.4 74.1 76.5 73.9 80.6 77.6 75.4 74.0 77.3 76.7 75.3 74.8-" "
of B-Molasses 55.4 52.7 47.6 52.6 54.1 50.4 50.7 50.0 54.0 48.4 66.9 56.6 48.6 53.9 50.7 50.7 67.7 57.7 52.1 53.4 56.2 52.1 55.1 53.8
Drop in Purity 19.1 21.5 24.2 23.0 20.4 22.2 20.9 22.6 17.3 24.6 10.0 22.7 25.8 20.2 25.8 23.2 12.8 19.9 23.3 20.6 21.1 24.6 20.2 21.0
Crystal per cent Brix in rnassecuite 42.8 45.4 46.2 48.5 44.4 44.8 42.3 45.2 37.6 47.7 30.2 52.3 50.2 43.8 52.3 47.1 39.7 47.0 48.6 59.0 48.2 51.4 45.0 45.5
Cubic feet per ton Brix in Mixed Juice 14.5 9.7 12.1 13.2 9.0 9.7 12.3 10.4 6.8 10.2 18.9 11.1 13.0 11.3 14.1 13.4 20.5 16.5 15.0 12.0 10.2 11.0 9.2 11.5
B-Massecuite per cent total Massecuite 28.3 20.6 26.3 29.2 22.1 17.1 22.3 25.1 15.2 20.7 28.5 22.5 28.6 21.9 26.4 28.0 29.7 30.8 29.7 24.2 23.4 25.7 18.4 23.3
Kg. Sugar per cubic foot of A & B Massecuite 19.4 21.9 21.3 21.8 25.3 16.9 17.9 19.9 21.7 20.4 15.4 21.0 21.9 19.0 18.9 20.8 14.6 18.3 19.6 19.2 22.5 24.0 19.0 20.1
C-MASSECUlTE Brix 93.6 93.6 93.5 94.1 94.7 96.1 93.4 94.0 94.1 93.9 93.2 94.6 94.2 96.4 95.4 94.0 92.7 95.3 93.3 94.5 93.4 93.4 97.9 94.4
Apparent Purity 59.5 60.4 55.3 59.2 60.6 59.2 57.2 56.0 58.7 59.0 62.8 62.1 60.0 58.7 59.7 59.9 68.0 62.3 61.4 59.1 59.6 63.7 60.7 60.0
",. of final Molasses 33.5 35.2 27.9 34.5 36.4 36.6 35.9 29.8 36.0 34.6 33.7 35.0 32.1 32.6 34.6 37.7 39.4 36.5 34.9 36.6 35.9 34.9 37.8 34.9
Drop in Purity 26.0 25.2 27.4 24.7 24.2 22.6 21.2 26.2 22.7 24.4 29.1 27.1 28.9 26.1 25.1 22.2 28.6 25.8 26.5 22.5 23.7 28.8 22.9 25.1
Crystal per cent Brix in massecuite 39.1 38.9 38.0 37.7 38.1 35.6 33.2 37.3 35.5 37.3 43.9 41.6 41.1 38.7 38.4 35.6 47.2 40.6 40.7 35.5 37.0 44.2 36.8 38.6
Cubic feet per ton Brix in Mixed Juice 8.9 11.1 8.0 7.6 8.5 10.4 8.4 7.4 6.2 10.1 16.3 10.7 8.2 8.1 9.5 8.0 15.2 9.2 9.7 8.8 6.8 8.1 7.1 8.7
C-Massecuite per cent total massecuite 17.4 23.5 17.3 16.8 20.8 18.3 15.2 15.0 13.8 20.5 24.7 21.5 18.0 15.8 17.7 16.6 22.0 17.1 19.4 11.8 15.5 18.9 14.1 17.7
TOTAL Cubic feet per ton Brix in Mixed Juice 51.1 47.1 46.0 45.1 40.8 56.8 55.1 47.4 44.8 49.4 66.2 49.8 45.5 51.7 53.5 48.0 68.9 53.7 50.6 49.4 43.5 42.8 50.2 49.3
MASSECUITE" " " "
sugar made 62.5 59.7 56.9 55.3 49.9 72.3 65.9 59.7 53.4 61.7 86.4 60.7 55.0 62.3 64.9 57.6 87.5 65.7 62.9 63.4 52.7 51.4 61.0 60.4

XIX
Table XVIII. Summary of chemical control data 1965
(v) MILLING WORK, SUCROSE LOSSES AND BALANCE RECOVERIES
1.51 1.49
8.49 10.11
12.62 15.86
89.4 90.3
87.0 89.6
MILLINGWORK
SUCROSELOSSES
SUCROSEBALANCE
RECOVERIES
Imbibition water ~Iu cane
" % fibre
Extraction ratio
Mill extraction
Reduced mill extraction
Sucrose lost in bagasse I~ cane
" in filter cake % cane
" in molasses ~..~ cane
Undetermined losses % cane
Industrial losses % cane
Total losses ~.~ cane
Sucrose in bagasse ~.~ sucrose in cane
" filter cake ~,~ sucrose in cane
" molasses 10 sucrose in cane
Undetermined losses % sucrose in cane
Industrial losses ~.~ sucrose in cane
Total losses % sucrose in cane
Boiling house recovery
Reduced boiling house recovery (Pty. M. J. 85")
Overall recovery
27.0
198
38.1
94.8
95.2
0.68
0.01
0.85
0.19
1.05
1.73
5.21
0.08
6.51
1.45
8.04
13.25
91.5
88.9
86.8
25.4
192
35.9
95.2
95.6
0.58
0.04
1.02
0.12
1.18
1.77
4.75
0.33
8.31
0.98
9.62
14.37
89.9
88.5
85.6
28.6
206
28.5
96.1
96.5
0.48
0.06
0.82
0.04
0.92
1.40
3.95
0.51
6.80
0.27
7.58
11.53
92.1
91.0
88.5
28.3
219
28.7
96.3
96.4
0.45
0.06
0.76
0.14
0.96
1.41
3.72
0.49
6.25
1.11
7.86
11.57
91.9
89.8
88.4
33.6
237
29.3
95.9
96.4
0.52
0.02
0.86
0.19
1.07
1.59
4.13
0.18
6.80
91.2
88.2
87.4
28.2
189
38.7
94.2
95.3
0.70
0.06
0.99
0.18
1.23
1.93
5.75
0.49
8.13
89.3
87.4
84.1
31.9
227
31.0
95.6
96.2
0.54
0.04
0.83
0.13
0.99
1.53
4.36
0.31
6.69
1.04
8.04
12.40
91.6
89.0
87.6
'"o§;3oU
25.8
182
28.2
96.0
96.5
0.48
0.04
0.87
0.17
1.08
1.56
4.00
0.33
7.24
1.41
8.99
12.99
90.7
25.1
210
29.3
96.5
96.3
0.44
0.02
0.82
0.04
0.88
1.32
3.48
0.14
6.53
0.29
6.96
10.44
92.8
31.6
240
27.7
96.4
96.6
0.44
0.04
0.94
0.19
1.17
1.61
3.62
0.33
7.73
1.56
9.62
13.24
90.1
87.1
86.8
33.5
231
34.5
95.0
95.8
0.57
0.03
0.96
0.28
1.27
1.84
5.05
0.25
8.51
2.47
11.19
16.21
88.5
87.5
84.0
32.8
245
27.1
96.4
96.7
0.45
0.03
0.82
0.05
0.90
1.34
3.63
0.22
6.67
0.43
7.33
10.95
92.4
90.4
89.0
28.3
220
34.4
95.6
95.7
0.58
0.08
0.74
0.14
0.96
1.54
4.43
0.61
5.66
1.07
7.34
11.77
92.3
89.7
88.2
30.0
236
33.0
95.8
95.9
0.54
0.02
0.79
0.12
0.93
1.47
4.17
0.15
6.10
0.93
7.18
11.35
92.5
89.0
88.6
27.5
239
33.4
96.2
95.8
0.49
0.06
0.73
0.18
0.97
1.46
3.84
0.47
5.76
1.42
7.66
11.52
92.5
89.3
88.5
27.7
235
35.6
95.8
95.6
0.51
0.05
0.72
0.12
0.89
1.40
4.12
0.40
5.83
0.97
7.20
11.32
92.5
89.6
88.7
27.8
213
37.1
95.2
95.4
0.60
0.03
1.05
0.28
1.36
1.96
4.85
0.28
8.47
2.25
10.99
15.83
88.5
84.6
84.2
29.6
266
30.9
96.6
96.1
0.42
0.03
0.88
0.05
0.96
1.38
3.45
0.22
7.12
0.57
7.91
11.36
91.5
88.9
88.6
29.1
213
31.5
95.7
96.1
0.52
0.14
0.82
0.09
1.05
1.57
4.31
1.16
6.79
0.74
8.70
13.01
90.9
88.8
86.9
'"138o
38.5
278
30.3
95.8
96.3
0.51
0.15
1.00
0.23
1.38
1.89
4.22
1.24
8.27
1.90
11.41
15.63
88.1
86.2
84.4
26.4
224
31.8
96.2
96.0
0.46
0.13
0.76
0.06
0.95
1.41
3.76
1.09
6.16
0.49
7.71
11.44
92.0
88.8
88.5
24.0
214
29.6
96.7
96.3
0.45
0.04
0.79
0.29
1.12
1.57
3.30
0.29
5.79
2.13
8.21
11.51
91.5
86.8
88.5
23.7
214
30.6
96.6
96.1
0.44
0.08
0.92
0.07
1.07
1.51
3.38
0.59
7.13
0.54
8.26
11.65
91.5
88.2
88.4
28.4
220
31.7
95.9
96.0
0.51
0.06
0.86
0.12
1.04
1.55
4.10
0.49
6.87
0.92
8.29
12.39
91.4
88.8
87.6
Reduced overall recovery (Pty. M.l. 85°,F ~~ C 12.5)
Boiling house efficiency
84.6
98.9
84.5
99.0
87.8
99.7
86.6
99.5
85.0
98.8
83.3
97.7
85.6
99.3
86.3 87.0
98.6 100.4
84.1
98.0
83.8
97.5
87.4
99.8
85.8
99.1
85.3
99.2
85.5
99.5
85.7
99.6
80.7
97.6
85.4
99.9
85.3
99.1
83.0
97.0
85.2
99.7
83.6
98.3
84.7
99.3
85.3
99.1

xx
Table XIX. Production and utilisation of molasses, 1948 - 1965
Used for Available I N.P.K. equivalentProduction Exports production as in molasses
Year of alcohol fertilizer available as fertilizer
M . tons M. tons M. tons M. tons M. tons
N P205 K20
1948 85,308 - 42,640 42,768 222 107 2,198
1949 96,670 1,867 41,728 53,075 276 133 2,728
1950 98,496 79 25,754 72,643 378 182 3,734
1951 125,819 3,601 44,896 77,322 402 193 3,974
1952 113,756 40,537 29,878 43,339 225 108 2,228
1953 141,449 67,848 16,037 57,564 299 144 2,958
1954 120,495 89,912 8,300 22,383 116 56 1,145
1955 106,839 53,957 9,005 43,877 228 110 2,255
1956 118,716 52,694 8,661 57,361 298 143 2,948
1957 110,471 72,539 7,796 30,136 157 75 1,549
1958 113,811 59,158 8,435 46,218 240 116 2,376
1959 118,056 59,985 9,632 48,439 252 121 2,490
1960 72,991 45,180 8,871 18,940 98 47 970
1961 139,234 64,633 7,357 67,244 350 168 3,456
1962 122,890 76,800 7,750 38,340 199 96 1,955
1963 149,586 109,770 8,192 31,14 I(2) 162 78 1,588
1964 113,781 96,830 7,172 9,333(2) 46 23 476
I 1965(1) 151,152 105,360 7,824 I 37,514(2) 195 94 1,913
(1) Provisional figures
(2) In 1963, four hundred and eighty three tons, in 1964, four hundred and forty six tons, in 1965, fourhundred and fifty four tons were used in the preparation of animal foodstuff. and have therefore beendeducted from production figures

XXI
Table XX. Importation of inorganic fertilizers, in metric tons, 1950 - 1965
YEAR N PZ0 5 KzO
1950 3,990 870 1,930
1951 5,710 1,020 4,080
1952 5,800 1,140 2,960
1953 5,080 560 2,380
1954 4,170 1,110 3,340
1955 5,620 570 3,110
1956 8,870 2,170 3,940
1957 6,900 2,770 4,390
1958 6,210 3,020 4,690
1959 8,500 2,740 5,310
1960 8,170 4,382 5,765
1961 7,462 4,769 4,569
1962 9,467 5,377 6,373
1963 9,762 5,079 6,952
1964 10,095 5,698 8,838
1965 9,520 7,236 6,222

XXII
Table XXI. Sale of herbicides 1964 - 1965
I 964 196 5
HERBICIDES Quantity QuantitySale in Sale in
Imperial
IRupees Imperial Rupees
gallons Kg. gallons Kg.
MCPA - Metallic salt 9,859 130,558 9,072 137,277
2,4-D Amines 27,361 424,216 23,172 370,786
2,4-D and 2, 4, 5-T Esters 11 ,029 419,869 13,086 524,494
Pentachlorophenol 595 8,330 100 1,600
Sodium Chlorate 398,053 I 539,155 272,823 471,587
Sodium Trichloroacetate(TCA) 389,449 1,201,856 309,746 929,415
Sodium 2,2-dichloro-propionate (Dalapon,Basfapon, Unipon) 6,670 76,740 2,261 21,867
Substituted UreasDCM U 35,312 1,283,353 38,922 1,414,562
Substituted Triazines
Simazine 15,097 243,444 9,338 168,559
Atrazine 22,507 395,941 33,305 678,189
Unclassified 602 425 34,384 661 544 35,533
4,757,846 4,753,869

Table XXII. . Importation of Major Herbicides,' 1955 - 1965
Ino rganic Chemicals Hormone type · Aliphatic acid Substitu ted Su bstitu ted _. Sub sti tutedDerivatives pheno ls U reas Triazines
YEAR 2,4-D ; 2,4,5-TSodium Sodium MCP A T C A Dalapon P. C. P . D .C.M.U. Simazine AtrazineChlora te Arsen ite
Kg. Kg. Imp. Gall. Kg. Kg. Kg. Imp. Gall. Kg. Kg. Kg.
\
1955 81,494 - 49,706 5,600 254,300 - 3,448 - - -
1956 92,780 124 48,333 6,125 181,700 - 3,460 - - -
1957 107,961 80 36, 142 645 163,278 - 1,824 - - -
1958 128,835 4,000 43, 150 565 167,096 - 3,528 - - -
1959 173,383 - 60,26 1 72 264,389 - 1,534 - - -
1960 304,851 7,050 76,629 - 377,063 400 2,64 1 12,500 568 -
1961 214,301 6,000 59,272 - 363,716 9,553 1,403 30,000 1,812 -
1962 272,937 8,000 54,507 - 335,595 21,933 1,010 38,279 21,432 -
1963 276,502 - 45,825 - 339,981 5,070 969 39,915 26,833 2,377
1964 398,053 - . 48,249 - 389,449 6,670 595 35,312 15,097 22,507
1965 272,823 - 45,330 - 309,746 2,261 100 38,922 9,338 33,305
~

XXIV
XXIII. List of crossest/) made in 1965 and sown in November
Parental Combinati ons No. of Tassels I No. of seedlingspotted
8.41227 x 51NG 140 ... ... 4 0
58 B 38 x M. 220j56 . .. ... 2 0
CP 36-105 x D.109 ... .. . .. . 2 0
Mapou Perlee x 28 NG 101 ... ... 2 2
" "x Sdlg. (Ch alain x 57 NG 208) .. . 2 16
" "x Sdlg. (M . I 09j26 x 57 NG 208) ... 2 20
" "x US 48-34 .. . .. . 4 5
M.134j32 x D .I09 ... ... .. . 2 1
M.204j40 x S.S. Passoer oean ... ... 1 13
M. 241j40 x Mol. 5904 .. . . .. 3 2810
"x S.S. Kloet ... .. . 2 54
"x S.S. Mandalay .. . . . . 2 240
"x S.S. Tabongo .. . ... 2 0
M .377j41 x 51 NG 140 ... ... 5 2
"x Sdlg (Ch alain x 57 NG 208) ... 2 I 0
M .112j42 x S.S. Mandalay ... .. . 2 60
"x Sdlg. (Chalain x 57 NG 208) .. . 4 0
57 NG 208 selfed ... ... ... I 2
r.o.r. 2364 x 57 NG 208 ... ... 1 0
Sdlg. (Cha lainx 57 NG 208) x 57 NG 208 ... ... I 36
_.-
Total ... ... .. . 46 3,261
I . This list ex cludes the majority of crosses made in 1965 and stored ill deep fi eeze

xxv
Table XXIV. Ex perimental crosses, 1965 - Study of inheritance to gumming disease
Cross No. of Tassels No. of seedlingspotted
B.3337 x M .147/44 9 760
x M .202/46 6 240
x Ebene 50/47 3 2
Ebene 1/37 x Ebene 50/47 3 0
Ebene 50/47 x B.34104 .. , 2 2
M.134/32 x Ebene 50/47 9 2
x M .147/44 11 98
M .202/46 x Ebene 50/47 3 9
x M.147/44 5 210
M .202/46 selfed 4 4
Total ... 55 1327

XXVI
Table XXV. List of Approved Cane Varieties, 1966
M.134/32
M.134/32 white
M.134/32 striped
*M.112/34
*M.423/41
**M.147/44
M.31/45
M .202/46
M .93/48
***M.99/48
M.253/48
M.442/51
Ebene 1/37
Ebene 50/47
*B.H .1O/12
**B.3337
**B.34104
B.37161
B.37172
* To be uprooted before 31st December, 1969
** To be uprooted before 31st December, 1970
*** Recommended for re/ease, 12th February 1965