ENERGY VALUE OF FOODS - NALDC
109
^Ä*^ ^^/, CORE LIST r ENERGY VALUE OF FOODS • • • basis and derivation UNITED STATES DEPARTMENT OF AGRICULTURE Agriculture Handbook No. 74 mmmgiimgimmi
-
Upload
khangminh22 -
Category
Documents
-
view
1 -
download
0
Transcript of ENERGY VALUE OF FOODS - NALDC
■^Ä*^
^^/, CORE LIST r
ENERGY VALUE OF FOODS
• • • basis and
derivation
UNITED STATES DEPARTMENT OF AGRICULTURE
Agriculture Handbook No. 74 mmmgiimgimmi

ENERGY VALUE OF FOODS
•I. ■ basis and derivation
Do«miem Delivery SeM«sB,anch
'NíAL Sid Ï'' ' "-'• '■- .c.,r^,, . . Bernice K. Waff , '
*""ô, A10 2Ü7Ü5 ■^^'"cJoS f
Human Nutrition Research Branch
AGRICULTURAL RESEARCH SERVICE
UNITED STATES DEPARTMENT OF AGRICULTURE
Agriculture Handbook No. 74 Slishtly revised February 1973
For sole by the Superintendent of Documents, U.S. Government Printing Office, Washington, D.C. 20402 Price $1.25 domestic postpaid or $1.00 GPO Bookstore Stock Number 0100-02770

PREFACE
The kilocalorie, which has been defined as the amount of heat energy needed to raise the temperature >f a kilogram of water 1° C, is the unit that has been used traditionally for expressing the energy value >f foods. Recently the International Bureau of Weights and Measures has recommended that the joule, L unit of energy applicable to electrical, work, and chemical energy, be adopted as the preferred unit for L11 forms of energy. The joule is derived from basic units in the International System of Units (SI) and s defined as a measure of force (newtons) times distance (metres).
In the interest of uniform nomenclature, some nutritionists have proposed that the kilojoule replace he kilocalorie. The conversion factor for expressing kcalories as kjoules, as recommended by the Com- nittee on Nomenclature of the International Union of Nutritional Sciences, is 1 kcalorie equals 4.184 goules, based on the kcalorie determined at 14.5° to 15.5° C.
Use of kjoules in place of kcalories as the unit of measure for energy in no way invalidates the )rinciples underlying the Atwater system for determining energy value of foods and the energy needs md energy expenditures of man.
The Atwater system is based on the demonstrated principle that the oxygen used, the carbon dioxide ormed, and the energy evolved in oxidizing foods are the same whether this oxidation takes place in the )ody of man or in a bomb calorimeter. Furthermore, Atwater has clearly shown that by applying appro- )riate factors, which allow for metabolic losses, to the contents of protein, fat, and carbohydrate in a ood, the physiologically available energy value of that food can be calculated with outstanding accuracy. The results obtained by this procedure are in excellent agreement with data from measurements made >y bomb calorimetry on food and metabolic products. Results of studies by Atw^ater and others could )e expressed either in kcalories or in kjoules.

CONTENTS
Introduction Part I. Sources of food energy.
Fat- Determination of fat content Heat of combustion
Carbohydrate Determination of carbohydrate content Heat of combustion
Protein Determination of protein content Heat of combustion
Determined versus calculated gross energy values of foods
Other sources of energy Organic acids Alcohol
Part II. Digestibility and available energy of foods„ Definition of terms Digestibility of fat, carbohydrate, and protein. __ Availability of energy from digested nutrients
Fat Carbohydrate Protein Alcohol
Page 1 1 2 2 2 2 2 3 4 4 4
5 6 6 7 8 8 8 9 9
10 10 18
Part III. Derivation of current calorie factors Physiological fuel values of foods of animal
origin Physiological fuel values of plant products
Products of wheat Products of grain other than wheat Legumes Nuts Vegetables Fruits Miscellaneous foods
Part IV. Application of calorie factors Comparison of calculated and determined avail-
able calories for diets General factors and more specific factors for
calculating calories in individual foods Application of general factors to national food
supplies Conclusions Literature cited Appendix. Tabular summary of experiments on
digestibility of foods of plant origin by human subjects
Apparent digestibility and available energy Composition and heat of combustion of foods
Text Tables 1. Average determined heats of combustion of
fats and oils and assumed factors for fat of different groups of food materials 2
2. Average determined heats of combustion of different carbohydrates and assumed factors for carbohydrates of different groups of food materials 3
3. Factors for calculating protein from nitrogen content of food 4
4. Average determined heats of combustion of proteids and nonproteids and calculated heat of combustion of protein 5
5. Comparison of calculated heats of combustion with results of direct determinations 6
6. Fresh fruits classified as to organic acid content. 7 7. Factors for heats of combustion and fuel values
of nutrients in different groups of food mate- rials and in mixed diet 10
8. Summary of data showing calorie-nitrogen ratio of urine based on early studies of energy metabolism and digesti billty 12
9. Daily food intake in the experiments from which Atwater originally obtained the calorie- nitrogen ratio of 7.9 for urine 16
10. Daily nutrient intake in the experiments from which Atwater originally obtained the calorie- nitrogen ratio of 7.9 for urine 17
11. Comparison of data for available energy obtained by direct determination only and in part by calculation 19
12. Effects on energy metabolism of replacing portions of dietary carbohydrate and fat by alcohol
Data used for calculating energy values of foods or food groups by the Atwater system
Energy values of wheat ñours calculated by use of specific energy factors for protein, fat, and carbohydrate
Apparent digestibility and physiological fuel value of wheat flours
Coefficients of apparent digestibility for grain products
Comparison of determined and calculated gross energy values of potatoes
18. Summary of steps for checking available energy values calculated by factors from table 13
Comparison of determined and calculated available energy values of various types of diets
Factors for digestibility, heats of combustion, and physiological fuel values of nutrients in food groups as used in present-day mixed diets
Comparison of energy values for different dietary patterns calculated with specific and with general calorie factors
13.
14.
15
16.
17.
19.
20.
21
Appendix Tables 22. Use of digestibility data to determine coeflfi-
cients of apparent digestibility and available energy 59
23. Apparent digestibility and available energy of foods of plant origin for human subjects. _ 60
GrainSj'grain products 60 Legumes and nuts 87
23.
24.
Apparent digestibility, etc.—Continued Vegetables, vegetable products Fruits Miscellaneous
Composition and heat of combustion of food items used in experiments on human digest- ibility (table 23)
Page 24
26 26 27 31 36 36 37 40 40 43
44
48
48 51 51
58 58 100
22
25
28
29
32
38
44
46
49
50
94 98 98
100
IV

Energy value of foods . . . basis and derivation
INTRODUCTION Accurate evaluation of the energy value of foods
is essential for dealing with problems of normal nutrition, undernutrition, or obesity. The classic investigations of Professor W. O. Atwater and his associates at the Storrs (Conn.) Agricultural Ex- periment Station some 50 years ago provided the basis used in this country for measuring the energy values of food. The general calorie factors 4, 9, 4 developed from that work gained widespread acceptance, and until recently they were used for calculating the calories shown in official food com- position tables. Properly applied, these general factors provide a satisfactory measure of available energy in average diets and food supplies in this country. Following Atwater's period little atten- tion was given to methods of calculating food energy and to the details of Atwater^s procedure.
However, in recent years attention has again turned to the important problems of determining and meeting man's energy needs. In attempts to alleviate food shortages experienced during and following World War II consideration was given first to meeting energy needs in stricken areas. Ma3mard, who represented this government in various interallied food-planning groups, pointed out the necessity of understanding the bases of the different methods for estimating energy values in use in Canada, thé United Kingdom, and in this country. On several occasions he called at- tention to the correct application of the general calorie factors 4, 9, 4 and pointed out their limita-
tions and misuse when applied to individual foods and different types of diets (114y ^^p)-^.
The Food and Agricultiu-e Organization, faced with the urgency of assessing energy values of food supplies in various countries and population groups, convened an ad hoc committee of experts in 1947 to study the problems involved and to make recommendations. While endorsing the Atwater method as one that in the light of present knowl- edge is suitable if properly used, the committee pointed out the limitations of the use of general factors and the need for more specific calorie factors (55) when dealing with individual foods.
These developments have pointed to the need for summarizing the kinds of information Atwater used, the steps followed in his procedure for deter- mining fuel values of food, and the need for revising calorie data for foods to take account of additional research accumulating since his time. This pub- lication has been prepared to provide more back- ground information on food energy data than that given in current textbooks and food tables and to show the basic data drawn upon in deriving the revised calorie factors now used in tables of food composition in this country. Except for a few recent revisions, factors derived as shown in this publication have been used in U. S. Department of Agriculture Handbooks No. 8 (185) and No. 34 (100) and in various other sources, including food tables published by the lood and Agriculture Organization (36),
PART I. SOURCES OF FOOD ENERGY The chief food sources of energy to the human
body are fat, carbohydrate, and protein. Fats and carbohydrates contain carbon and hydrogen which can be oxidized to their end products, CO2 and H2O, both in the bomb calorimeter and in the body. In addition, protein contains nitrogen. This nitrogen together with some carbon and hydrogen leaves the body chiefly in the form of
^ The authors express appreciation to Mildred Adams for her review of the manuscript and her invaluable sug- gestions; to William Kunerth for his generous help in translating numerous articles from German; and to Blanche C. Spears for her collaboration in various phases of the study.
urea. Thus protein is incompletely oxidized in the body, whereas it can be completely oxidizedjin the calorimeter. The heat released by oxidation of food in the bomb calorimeter is its heat of combustion and is a measure of its gross energy value.
Rubner (Í4^), as early as 1885, realized that each of these broad groups of energy-yielding components of foods consisted of substances of more or less unlike composition and that the heat values for pure protein, neutral fat, and pure
2 Italic figures in parentheses refer to Literature Cited, p. 51.

carbohydrate might not be applicable to foods. He also recognized that methods of determining how much of each is present in a food were not entirely satisfactory. Innumerable improvements in methods and techniques for separating and determining the fractions making up these three main sources of energy in food have been made in the intervening years, but many of the limitations of determining and dealing with the main sources of energy in food that were pointed out in 1890 by an ad hoc Committee of the Association of OflBicial Agricultural Chemists (5) still remain. In the following sections the terms as they are used today in tables of food composition are discussed so that their meaning and limitations will be better understood.
Fat Determination of fat content
The fat content of foods usually is determined by one of three general methods: (1) simple ex- traction with a solvent, (2) acid hydrolysis with extraction, and (3) saponification with extraction.
The fat content reported for foods in American tables of composition refers as a rule to the weight of crude fat and is obtained by simple extraction with a solvent, usually ether. Included with the fatty acids and the true fats (triglycérides) thus extracted are other materials having similar solubility, such as the sterols, and chlorophyll and some other pigments. Special precautions are necessary to insure complete extraction; carbo- hydrate-containing foods, particularly those high in starch, present additional problems {61, 66,105,
A method based on acid hydrolysis before ex- traction gives, in addition to substances listed above, fats which are in combination or which for other reasons are not removed by the usual fat solvents. Egg and yeast have been shown to contain appreciable amounts of fat not extracted without preliminary hydrolysis (78),
Tha third procedure used in determining the fat content of a food, saponification, is usually followed by extraction and titration of the fatty acids. The data obtained by this method are translated into terms of total fat on the assump- tion that all the fatty acids are present as triglycérides.
The determination of fat in foods is fraught with complications. Particular care is necessary to avoid oxidation of fat diu-ing sample prepara- tion and analysis, loss of volatile fatty acids, and the possible formation of esters of fatty acids with alcohol.
Heat of combustion The heat of combustion of the ether extract
from a food depends on the particular fatty acids making up the triglycérides and on the compo- nents and proportions of the other ether-extract- able materials present. The triglycérides of beef,
mutton, and pork fat have been found to have heats of combustion of 9.50 or 9.51 calories per gram; butterfat, 9.27; and the fats from several cormnon plant sources, about 9.3. Lower figures for heats of combustion have been found for total ether extract, indicating that the extractable matter other than the glycerides has a lower heat value than the glycerides alone.
Atwater (17) applied the heat of combustion factors determined for triglycérides to crude fat on the assumption that the error resulting from the use of the higher heat of combustion factors would in some measure offset the error resulting from the incomplete extraction of fat in the deter- mination of the fat content of the food. The table containing the data which Atwater as- sembled from the literature and from his own work and the heat values he considered best suited to apply to the fat content (ether extract) has been reproduced here as table 1.
TABLE 1.—Average determined heats of combustion of fats and oils as assumed factors for fat of dif- ferent groups of food materials
Heat of combustion per gram
Kind of material
Determined Assumed or calculated
Beef fat Calories
9.50 9.24 9.51 9.32 9.50 9. 13 9.59 9.32 9.27 9.36 9.07 9.32 9.20 9.28 8.93 9.07 9.49 9. 47 9.07
Calories
Beef "ether extract'' Mutton fat ._ Mutton, *'ether extract" Pork fat Pork, "ether extract" Lard Cottolene Butterfat Wheat oil Wheat, "ether extract" Rye oil __ Rye, "ether extract" Maize oil Oats, "ether extract" Barley, "ether extract" _ __ Nut oil (except cocoanut) _._ .__ Olive oil Cocoanut oil Fat of meat, fish, eggs, etc___ _ _ 9. 50 Fat of dairy products 9. 25 Fat of cereals. _ _ _ _ 9 30 Fat of vegetables and fruits 9. 30
NOTE.—This table appears as table 7 in The Avail- ability and Fuel Value of Food Materials (17),
Carbohydrate
Determination of carbohydrate content The difference between 100 and the sum of the
crude protein and fat, moisture, and ash is called '^total carbohydrate'' or '^carbohydrate by dif- ference,'' a practice used by Atwater in his food tables and continued in this country. In addition to the true carbohydrates, this ^'difference" frac- tion may include such compounds as organic acids.

Foods of animal origin, except the milk prod- ucts, contain little carbohydrate. Foods of plant origin, on the other hand, have a variety of car- bohydrates. The principal ones are starch, sug- ars, and cellulose, but appreciable amounts of pentosans, dextrins, gums, and other carbohy- Irates also may be present. It has been general- ly assumed that the starches, at least when 30oked, and the monosaccharides and disaccha- [•ides are well used by the body. Much less is known about the utilization of cellulose, pento- sans, and other of the more complex carbohy- drates.
''Carbohydrate by difference" has been shown bo be generally satisfactory for estimating energy values of foods (17), However, for certain pur- poses, such as dietary planning for the diabetic, carbohydrate values are needed which exclude the fractions that are not potential glucose formers. For these purposes nitrogen-free extract, ''carbo- bydrate by difference" minus fiber, may be calcu- lated. As the digestibility of fiber may be very low, nitrogen-free extract is considered a much closer estimate of the sum of potential glucose formers than the ''carbohydrate by difference." "Nitrogen-free extract," sometimes abbreviated to NFE or Nifext, has been used for classifying fruits and vegetables into different carbohydrate groups (2,87).
Another approach has been the determination of the sum of the sugars, starches, and dextrins measured as total reducing sugars but exclusive of pen toses and hemicelluloses. In such cases it is fairly conxmon to report total reducing sugars ex- pressed as glucose based on analyses in which cop- per was used. For routine determinations, this procedure is not entirely satisfactory since the ex- tent of the reduction of the copper reagent differs for the various sugars, and mixtures of sugars may be present. In addition the determination may be complicated by the presence of noncarbohy- drate reducing substances. Improvements have been made in procedures involving the use of cop- per reagents, and progress is also being made in the development of totally different methods which may some day provide the specific information needed. For example, differential fermentation, Chromatographie separation, and differential spec- trographic analysis give promise of quantitative determinations for specific carbohydrates.
Heat of combustion Atwater assumed that 97 percent of the carbo-
hydrate in flours and meals was composed of starch with a small amount of fiber, about 2 percent dextrin, and 1 percent sugar. As the heats of combustion of dextrin, 4.11, and of sucrose, 3.96, are not greatly different from that for starch, 4.2, he considered 4.2 calories per gram the suitable factor to use for carbohydrate in cereal foods. He also applied this figure to the carbohydrate content of foods consisting largely of starch, such as corn- starch and tapioca, and to dried legumes because
he considered that the carbohydrate portion of the latter consisted mainly of starch.
In many vegetables the carbohydrate is largely starch and cellulose with more or less sugar. Atwater suggested the same calorie factor for vegetables that he had used for cereals and for legumes, 4.2 calories per gram. He thought that vegetables had a higher proportion of pentosans than the cereals and that the higher heat of com- bustion of pentosans as compared with polyhexoses might offset the lower heat value of the sugars.
In fruits a large proportion of the carbohydrate is present as sugar, especially monosaccharides, but some starch, cellulose, and pentosans also are present. Combining the lower heat of combustion of the sugars with the higher value for starch, Atwater considered that 4.0 calories per gram was probably not far from a correct figure for carbo- hydrate in fruits.
The main carbohydrate of animal source is milk sugar. Atwater found that figures on record for its heat of combustion were not in agreement and he used 3.9 calories per gram. Muscle meats and fish contain traces of glycogen, which in ordinary analyses is not taken into account. Oysters, other shelhish, and liver, however, may contain an ap- preciable amount of glycogen, which has a heat of combustion of 4.2 calories per gram. Since the amounts of these foods contained in ordinary diets were small, Atwater used 3.9 calories per gram of carbohydrate in all foods of animal origin for gen- eral dietary calculations.
The table prepared by Atwater summarizing data on heats of combustion to apply to carbohy- drate is reproduced here as table 2.
TABLE 2.—Average determined heats of combustion of dißerent carbohydrates and assumed factors for carbohydrates of different groups of food materials
Kind of material
Pen toses ^ Dextrose Lévulose Cane sugar Milk sugar Cellulose Starch Dextrin Glycogen Carbohydrates of animal
foods, meats, dairy prod- ucts, etc
Carbohydrates of cereals Carbohydrates of legumes Sugars Starches Carbohydrates of vegetables. Carbohydrates of fruits
Heat of combustion per gram
Determined
Calories 3. 72 to 4. 38
3. 75 3.76 3.96 3.86 4.20 4.20 4. 11 4. 19
Assumed or calculated
Calories
3.90 4.20 4.20 3. 95 4.20 4.20 4.00
1 Apparently includes not only the simple pentoses but also the pentosans.
NOTE.—This table appears as table 8 in The Availability and Fuel Value of Food Materials (17).

Protein
Determination of protein content
It is customary in this country to calculate the protein content of a product from the nitrogen present by applying a factor considered suitable for converting nitrogen to the protein in the particular food. The factors used are based on the nitrogen content of the predominating pro- tein present in various foods. As a great many commonly occurring proteins contain approximate- ly 16 percent nitrogen, 6.25 is the factor often used for general purposes. In the course of extensive investigations, however, Jones (76) found rather wide variation in the nitrogen content of different kinds of protein, for example, 13.4 percent for an alcohol-alkali-soluble protein preparation from avocado and 19.3 for amandin in almonds. He therefore prepared special factors for converting nitrogen to protein in those foods for which he considered there was sufficient information to justi- fy their derivation. Table 3 Ksts these factors along with others obtained from him through personal communication.
TABLE 3.—Factors for calculating protein from nitrogen content ojfood ^
Food
Animal origin: Eggs Gelatin Meat Milk
Plant origin: Grains and cereals:
Barley Corn (maize)-. Millets Oats Rice Rye Sorghums Wheat:
Whole kernel. Bran Embryo Endosperm..
Legumes: Beans:
Adzuki Castor Jack Lima Mung Navy
Factor Food Factor
Plant origin—Con. 6.25 Legumes—Con. 5.55 Beans—Con. 6.25 Soybeans 5.71 6.38 Vel vet beans _ 6. 25
Peanuts 5. 46 Nuts:
5.83 Almonds. __ 5. 18 6.25 Brazil 5.46 5.83 Butternuts 5.30 5. 83 Cashew 5.30 5. 95 Chestnuts 5.30 5.83 Coconuts 5.30 b. 25 Hazelnuts 5.30
Hickory 5.30 5.83 Pecans 5. 30 6. 31 Pine nuts 5.30 5.80 Pistachio 5. 30 5. 70 Walnuts
Seeds: 5.30
Cantaloup 5.30 6.25 Cottonseed 5. 30 5.30 Flaxseed 5.30 6.25 Hempseed 5.30 6.25 Pumpkin 5.30 6. 25 Sesame 5. 30 6.25 Sunflower 5. 30
1 Adapted from table 5 of U. S. Department of Agricul- ture Circular 183, revised edition, February 1941 {76) and from unpubhshed data obtained by personal communica- tion with the author. For groups of foods not included here, the conventional factor 6.25 should be used until more is known regarding their proteins.
The figures commonly reported in American tables of composition for protein actually repre- sent crude protein, since as a rule the figures are
derived by applying the appropriate factor to the total nitrogen present. This procedure involves the assumption that all of the nitrogen present is in the form of protein, which is not wholly valid because in this procedure counted with the true protein may be other nitrogenous compounds, such as nitrates, nitrites, purine bases, choline, and free amino acids.
Heat of combustion
The heat of combustion of the nitrogenous portion of food depends on the kinds of protein present and on the proportion of protein and non- protein nitrogenous material—^the latter usually having lower heat of combustion than the former.
Atwater's procedure for obtaining a figure foi the heat of combustion for the total nitrogenous portion of a food may be illustrated by his figures for cereal grains having 17.5 percent nitrogen in their proteins. The protein would therefore be computed by multiplying the nitrogen by the factor 5.7. He assumed, from analyses of Teller W), Snyder {163), and Wüey {183), that not less than 96 percent of the nitrogen of the seeds of cereals was in the form of protein and not over 4 percent as nonprotein material. One gram of cereal nitrogen, then, would be equivalent to 5.47 grams of protein (0.96 gm. N X 5.7) and, using asparagin (21.2 percent N) as a model of the nonprotein nitrogenous fraction, 0.19 grams of asparagin (0.04 gm. N X 4.7).
Applying to the protein portion the heat of combustion of the principal proteins in the cereals, about 5.9 calories per gram according to Atwater's data, and to the nonprotein portion, the heat of combustion of asparagin, 3.45 calories per gram, the total heat of combustion for the nitrogen- containing compounds in cereals was calculated as follows:
5.47 gm. protein X 5.9 cal./gm. = 32.27 calories .19 gm. asparagin X 3.45 caL/gm. = .655 calories 5.66 gm. nitrogenous compounds=32.9 calories 1.0 gm. nitrogenous portion=5.8 calories For the heat of combustion of the nitrogenous
portion of meat, Atwater felt the most satisfactory procedure was to use the value for the fat-free muscle tissue including the nonprotein extractives, as quantitative data on creatin and other non- protein compounds were lacking. The heat of combustion for fat-free muscle meat was about 5.65 calories. He used this same factor for the protein of milk. He estimated the heat of com- bustion for the nitrogenous portion of Q^g to be 5.75 calories per gram, based on data for proteins in the white and yolk, assuming that very little nonprotein nitrogen is present.
Table 4 is a reproduction of one prepared by Atwater showing average determined heat of com- bustion of ^'proteids" and ''nonproteids'' and calculated heat of combustion of '^protein.'' At- water used the term ''proteid'' to-cover the true proteins, and the term '^protein" to cover both the

food can be shown by using potatoes as an ex- ample—a food known to contain a considerable portion of nonprotein nitrogen. If 60 percent of potato nitrogen is attributed to protein and 40 percent to asparagin, the heat of combustion of the nitrogenous matter equivalent to 1 gram of nitro- gen should be 28.2 calories and the heat of com- bustion per gram of nitrogenous compounds, 5.01 calories, as shown by the calculations below:
0.6 gm. NX6.25 = 3.75 gm. protein 0.4 gm. NX4.7^1.88 gm. asparagin 1.0 gm. N = 5.63 gm. nitrogenous compounds
3.75 gm. proteinX5.8 cal./gni.=21.75 calories
1.88 gm. asparaginX3.45 cal./gm.^6.49 calories 5.63 gm. nitrogenous compounds^28.24 calories
1.0 gm. nitrogenous compounds=5.02 calories
Kind of material Determined
nonprotein compounds, the extractives, amides, etc., and the true proteins. If Atwater's heat of combustion values for protein (as defined by him) is applied to protein as currently determined, that is, total N times a factor, some error will result because the heat of combustion of the true proteins is usually higher than that of other nitrogenous compounds. It has become the custom in this €Ountry, however, to apply heat of combustion factors to total nitrogen treated as protein without weighting the composition data according to the proportion of the different nitrogen-containing compounds present. This has been done because of the limited information available on the parti- tion of nitrogen in foods between true protein and other forms. Although this procedure may re- sult in an appreciable error in the calorie value of the protein of a food, the error in the total energy value is generally small, as most foods having a large proportion of their nitrogen as nonprotein jf^ however, all of the nitrogen is assumed to be nitrogen (mostly vegetables and fruits) contain protein (6.25 gm. protein) and to this is applied relatively small amounts of total nitrogen. ^j^^ factor 5.02 calories (corrected as shown above
. for the lower heat of combustion for the nonpro- TABLE 4.—Average determined heats of combustion ^^^^ portion), an energy value of 31.4 calories per
o-f proteids and nonproteids and calculated heat of gram nitrogen results (1 X 6.25 X 5.02). This combustion of protein result is about 11 percent higher than that ob- tained in the first calculation because the content
Heat of combustion per gram ^£ protciu is Overestimated, If no correction is rnade for the presence of nonprotein nitrogenous
^cSafed' compounds and if the higher heat of combustion of potato protein, 5.8 calories per gram, is appUed,
Calories an energy value equivalent to 36.25 calories per gram of nitrogen would result (1 X 6.25 X 5.8).
This result is nearly 30 percent higher than the [I"II"I. first calculation because there has been overesti- mation in both the content of protein and the heat
^' ^^ of combustion of the nonprotein fraction. This llllllllll illustration shows that we should have data on III"mil the actual partition products, but until we do, it
5- 75 seems best to continue the rather arbitrary pro- cedure shown here as the second calculation,
5. 65 namely, to apply a weighted calorie factor to total nitrogen treated as protein.
Determined versus calculated gross energy values oí foods
5. 80 Gross energy may be determined directly by
^* ^^ burning a sample of food, or it may be calculated 5. 00 by applying previously determined heats of com-
bustion to composition data on the energy-yielding ^- 20 components of food and obtaining the sum. In view, however, of the diversity within the
fractions of the so-called protein, fat, and total carbohydrate components of food pointed out in
preceding paragraphs, and in view of the assump- tions made in deriving heat of combustion values
Note.—This table appears as table 6 in The Availability to apply to each fraction, Atwater recognized the and Fuel Value of Food Materials (17). importance of checking the gross energy values
calculated for foods. He compared results for The eft^ect of method of calculation on estimated calculated and determined gross heats of combus-
energy values for the nitrogenous compounds in a tion for 276 samples includmg foods of animal
Beef, fat-free muscle Beef, fat-free muscle, extract-
ives removed Veal, fat-free muscle Mutton, fat-free muscle Protein of meat Egg albumin. Egg, protein of yolk Vitellin Protein of egg Milk casein Milk protein Protein of dairy products Gliadin Olutenin Gluten of wheat Legumin Plant fibrin Protein of cereals (96% pro-
teids) Protein of legumes (96% pro-
teids) Protein of vegetables (60%
proteids) Protein of fruits (70% pro-
teids) Gelatin Creatin, as type of non-pro-
teids of animal foods Asparagin, as type of non-
proteids of vegetable foods.
Calories 5. 65
5. 73 5. 65 5. 60
5.71 5. 84 5. 76
5. 63 to 5. 86 5. 67
5.92 5.88 5. 95 5. 79 5.89
5.27
4. 27
3. 45

origin as well as a variety of plant products. He found that when he applied the heats of com- bustion he had worked out for protein (actually nitrogenous compounds), fat (as ether extract), and carbohydrate (usually determined by differ- ence) to amounts present, the results were in good agreement with those obtained by bomb calo- rimeter. Although in a few cases discrepancies were as much as 5 or 6 percent, agreement was very much closer in most cases and justified the use of the calculated values.
The table in which Atwater summarized these comparisons has been reproduced here as table 5. Possibly the difficulties in getting satisfactory composition data for dried samples of high original water content was responsible for the larger discrepancies observed between the calculated and determined gross heats of combustion for fruits and vegetables. Differences might be expected for milk likewise and may have been observed for individual samples, but the averages for the 37 samples are in excellent agreement. With the improved techniques in moisture deter- minations now available, we would expect even better agreement between the gross heats obtained by calculation and the determined values.
TABLE 6—Comparison oj calculated heats oj combustion with results of direct determinations
Kind of food material
Beef Beef, canned- Muttoh Pork Poultry Fish
Butter Milk "__[ Breakfast foods Bread, crackers, etc Corn (maize) meal and corn
preparations Rye preparations Barley preparations Rice Oatmeal (rolled oats) Oatmeal, cooked Wheat, pastry Legumes, fresh Legumes, cooked Vegetables, fresh Vegetables, cooked .. Vegetables, canned Fruits, fresh Fruits, canned
Average 276 samples
Number of
anal- yses in- cluded
in average
55 7
10 10 5 3
10 20 37
3 36
7 6 2 5 2 6 8 8 5
10 3 2
12 4
Average heat of combustion per gram of water- free substance
Deter- mined
Calorieê 6507 6197 7146 7835 6310 6317 7103 8832 5437 4367 4536
4580 4353 4352 4390 4834 4488 4579 4367 4312 4195 4057 4264 4389 4078
Calcu- lated
Calories 6619 6268 7316 7944 6508 6427 7160 8918 5413 4360 4513
4624 4343 4365 4474 4811 4480 4605 4361 4343 4051 4277 4102 4123 4056
Calcu- lated
results in per- centages of those deter- mined
Percent 101. 7 101.2 102.4 101.4 103. 1 101.8 100.8 101.0 99.6 99.8 99. 5
101.0 99.8
100.3 101.9 99.5 99.8
100. 6 99.9
100.7 96.6
105.4 96.2 93.9 99.5
100.3
Note.—This table appears as table 9 in The Availability and Fuel Value of Food Materials (17). Figures for heat of combustion are in terms of small or gram calories rather than large or kilogram calories customarily used for foods.
We have compiled gross calorie data for a number of samples of wheat and flours produced in this Country. For 15 samples of wheat or whole- wheat flour reported in the literature (Î64, 166, 168,18Sy 194, 195) differences between determined and calculated gross heats varied from 0.1 percent to 1.9 percent and averaged only 0.6 percent. For 16 additional samples of wheat flour of varying degrees of refinement the average difference between gross calories obtained the two ways was slightly higher, 1.3 percent.
Other sources of energy
Two other sources of energy—organic acids and alcohol—are noted below since in some circum- stances one or both may be important.
Organic acids
Occurrence of organic acids.—Organic acids are widely distributed in foods but for the most part in small concentrations. Among the various acids that have been identified are: Malic, citric, isocitric, ascorbic, oxalic, lactic, succinic, acetic, quinic, tartaric, benzoic, glyoxahc, salicylic, aconi- tic, and malonic. As explained earlier, figures for the total carbohydrate content of a food, that is, ''carbohydrate by difference,'' include organic acids. In a very few foods the acids are suffi- ciently abundant that they should be determined separately for estimations of energy values of those foods, inasmuch as they are distinctly differ- ent chemically from carbohydrates and their heats of combustion are lower than for carbohydrates generally. Total free acid is commonly deter- mined by titration against standard alkali and expressed as the predominant acid in the food. To the extent that the organic acids may be present in bound form the total acid value may be underestimated, but this error is ordinarily con- sidered of little importance.
Fruits contain organic acids in more significant amounts than other food groups. In table 6 a number of fruits have been classified according to the total free organic acid content as reported in the literature. Citric and malic acids predomi- nate in all fruits listed except grapes and tamarind. Tartaric acid accounts for most of the total in these two fruits. Other organic acids have been found present in small amounts in fruits. Of the fruits listed in table 6 only 7 have been re- ported to contain more than 2 percent organic acid; 15 contain from 1 to 2 percent; and more than 35 contain less than 1 percent. However, in pro- portion to the total solids, the organic acids may provide an appreciable percentage of the total energy value of some fruits. For lemon juice, it would amount to over half, but for peaches, only about a twentieth.
Less information is available on the acid con- stituents of vegetables, but the amounts in most vegetables tend to be less than 0.5 percent.

TABLE 6.—Fresh Jruits classified as to organic acid content ^
3 percent and over » 2 to 3 percent 1 to 2 percent 0.5 to 1 percent Less than 0.5 percent
Lemons (C). Cranberries (C). Apricots (M). Apples (summer) (M). Apples (fall) (M). Limes (C). Currents, red, black, Carissa or natal plums Blackberries (C).
Blueberries (C). Apples (winter) (M).
Tamarind (T). and white (C). (C). Bananas (M). Gooseberries (C). Grandillas, purple, or
Cherries, sour (M). Grapefruit, all (C).
Cherries, sweet (M). Crab apples (M).
Cherimoya (C). Feijoa (C).
passion fruit (C). Groundcherries (in- Grapes, pulp or juice, Figs (C). cluding poha and American type, all Jujubes (C). cape-gooseberry) (C). (T). Limes, sweet (C).
Kumquats (C). Grapes, European type, Muskmelons (C). Loganberries (C). all (T). Papavas (C). Loquats (C). Guavas (C). Pears, all (C). Nectarines (M). Mamev or Mammee Persimmons, Japanese Oranges (C). apple (C). or Kaki (M). Plums, excluding Mangos (C). Persimmons, native
prunes (M). Mulberries, black, (^)- Pomegranates (C). white, and red (M). Prickly pears (M). Raspberries, red and Peaches, all (M). Roseapples (C).
black (C). Pineapples (C). Sapodilla or sapota (C). Strawberries (C). Plantains (M). Sapote or Marmalade Tangerines, other Prunes (M). plum (C).
Mandarin type Quinces (M). Sugar apples or oranges (C). sweet sop (C).
Watermelons (M).
1 Total free acid expressed in terms of the predominating acid as malic (M), anhydrous citric (C), or tartaric (T) in the edible portion of fruit. 2 Lemons and limes, 6 percent; tamarind, ripe, 13 percent.
Hartman and Hillig (ffS), reporting results from available, the heats of combustion or gross calorie analyses of organic acids in a large number of food values per gram of acid calculated from gram- products, included a table of 29 vegetables which molecular weight data are as follows: showed a total malic and citric acid content (free Calories and combined) ranging from 0.1 to 0.8 percent. Acid: per gram Only for lima beans, cauliflower, white potatoes ^?^V° I'tn (Idaho), and tomatoes were the values'above 0.5 Lactic ll"""llll"l"l""ll 3.620 percent. Malic "1"'-'-"-"-'-'---"'--'--- 2.388
In certain types of processing by fermentation ^ . . i . i . n x- the total acidity of the product is increased several Organic acids contribute a very small portion fold over the original content of the food. Cab- of the total daily calorie intake, but m a few bage, for example, contains only a fraction of a foods they are present in amounts that should not percent of acid as mahc and citric, while sauer- be overlooked as potential sources of ener^. kraut has around 1.5 percent lactic acid. Simi- The gross energy value of organic acids m 100 larly apples contain less than 1 percent acid grams of a few foods has been estimated as foUows : expressed as malic, but vinegar made from apples Food: Calories averages about 4.5 percent acetic acid. Lemons, limes 15
Some of the acid constituents of food are Currants gooseberries__.. 6 available to the body as a source of calories; f^ll^^]^¡^^^^^ ^'^ \l others are known to be unavailable or of doubtful Sauerkraut 5 availability. Oxalic acid is probably excreted in the form of its insoluble calcium salt; tartaric Alcohol acid is thought to be either excreted unchanged or destroyed by micro-organisms. Little is known Alcohol, with a gross energy value of 7.07 about the availability of such acids as glyoxalic, calories per gram, is another source of energy malonic, and aconitic, but since they occur in which may be important in the diet of some insignific8.nt amounts they would make a negligible individuals or some population groups. It is contribution to the total energy value of the foods discussed in connection with the availability of in which they are found. energy from the various sources (p. 18) since the
Heat of combustion.—For the several acids availability of its fuel value is the point of un- found in appreciable amounts and considered certainty.

PART II. DIGESTIBILITY AND AVAILABLE ENERGY OF FOODS
Definition of terms Meanings of some of the terms necessary in a
discussion of energy value of foods have changed over a period of years. In the following para- graphs terms of most importance are explained and attention is called to differences in past and present connotations.
Digestibüity was the term Atwater used for the proportion of food material actually digested. If there had been a way to measure the undigested residue in the feces, digestible food would have been computed as the dSerence between the total food eaten and the undigested residue. However, as he pointed out, methods for distinguishing between metabolic products in the feces and undigested residue from the food were not suffici- ently accurate to permit the determination of the undigested residue separately and he did not compute digestibility.
Availability was the term Atwater used to designate the quantity or proportion of the food or of the nutrients which could be used for build- ing and repair of tissue and the yielding of energj^ Some of the absorbed nutrients are used to form digestive juices and returned to the tract in the form of bile and other digestive secretions. Inas- much as these metabolic products are not used for tissue building or as fuel, they are not avail- able in the sense in which Atwater employed the term. He computed the amounts of available nutrients (protein, fat, carbohydrate) by sub- tracting the amounts in the feces from the amounts in the food. Availability as Atwater used the term is the same as apparent digestibility in more recent years and in current usage. He calculated the coefficient of availability, using nitrogen for illustration, as follows:
N in food—N in feces N in food XI00=coefficient of
availability.
According to present usage this would be called the coefficient of digestibüity, meaning of course apparent digestibihty, and it corrects only for total fecal losses.
Heat oj combustion data are obtained by burning samples of food in a bomb calorimeter. The heat of combustion is a measure of the gross energy value of the food.
Available energy of a food takes into account both fecal and urinary losses. The total available energy of the food is its heat of combustion less that of the urinary and fecal residues. For fat and carbohydrate the available energy is the gross energy of the amounts absorbed (intake—fecal fat and carbohydrate) since each nutrient is assumed to be completely oxidized. The incom- pletely oxidized matter of the urine is assumed to be of protein origin and the available energy of protein is the gross energy of the absorbed protein
8
(intake—fecal protein) less the gross energy of the urine. Available energy of a food may*be obtained entirely from data on heat of combustion or it may be calculated in part from analytical data on nitrogen according to thefollowingjproce- dures:
1. Gross energy of food— (gross energy of urine+ feces).
2. Gross energy of food — (gross energy in feces+ net absorbed grams NX7.9).
3. Gross energy of food — (gross energy in feces+ urinary N in gramsX7.9).
If the subject is in nitrogen balance, no difference would be expected in the deduction for urinary loss between procedures 2 and 3. A discussion of the extent of the differences resulting from these methods of calculation under other conditions follows the section on calorie-nitrogen ratio of the urine, page 18.
Atwater distinguished between physical and physiological fuel values, the latter being the actual benefit gained by the body from the use of fuel for the different purposes served. This distinction was made in recognition of the possibility that the energy value of a gram of fat, for example, might be different for mechanical work from what it would be if used only for maintaining body heat. Atwater used the term fuel value as obtained by method 1, 2, or 3 described above to mean physical fuel value, not physiological fuel value. The latter term, however, has since been applied to his data and to his method of obtaining fuel values {5Ö, Illy 159). Likewise, in the present publica- tion physiological fuel value is the term used to connote energy value of a food obtained by sub- tracting energy lost in the excreta (feces and urine) from the total energy value of the food, no con- sideration being given to the specific functions served in the body.
Digestibility of fat, carbohydrate/ and protein
On any diet some ether extractable matter, nitrogenous matter, and other organic matter are lost in the feces and must be taken into account in calculating the energy value of foods. The nitrog- enous matter present in the feces may be due in part to undigested food residues, bacteria and their products, the residues of digestive juices, and mucus or particles of epithelium mechanically separated from the walls of the digestive tract. Numerous studies have been made to determine to what extent the nitrogenous matter in the feces under different kinds of dietary conditions is metabolic and to what extent it is undigested or unabsorbed food material. Some investigators have concluded that all the nitrogenous matter in the feces results from metabolic processes but that

some foods cause greater loss than others (ÍO4, Î06, 147). Other workers, including Murlin and coworkers (40, Î27,128) and Bricker, Mitchell, and Kinsman {SI), as a preliminary step in obtaining biological values of proteins, have estimated the digestibility of foods with the assumption that part of the fecal nitrogen is metabolic in origin and part is from food eaten.
Since this publication is concerned primarily with estimation of energy value no attempt has been made to distinguish between metabolic and undigested food nitrogen appearing in the feces, because neither is available to the body as a source of energy. Actually, level of N intake may appre- ciably affect the apparent digestibilitv of protein; on low levels of protein intake the fecal N may represent chiefly metabolic N which, when charged against a specific test food, leads to low values for apparent digestibility of this food. Results re- ported in the literature in which digestibilities of test foods were measured under conditions of extremely low protein intake are therefore not satisfactory for application to a more nornial level of protein intake. Even under conditions of higher protein intake, losses attributed to the protein of the test food by this method of calcula- tion may actually be due to the influence of the test food on the digestibility of the entire diet. Similar problems occur in calculating the energy factors for carbohydrate and fat {188, 190, 191). More information or possibly an entirely different approach is needed to relate fecal losses directly to the test food.
Atwater assembled results of many digestion experiments on men in which the apparent digesti- bility of a food was studied. In some experi- ments a single food was fed and in others the test food was fed as part of a simple mixed diet. From these findings he developed tentative co- efficients of digestibility. As they had been based largely on the digestibility of single foods in very simple diets, Atwater tested these tentative coefficients by applying them to the several foods in experiments in which ordinary mixed diets were eaten. In these latter experiments the amount of protein, fat, and carbohydrate in the feces was compared with that in the total food so that the **availability'' measured applied to the whole mixed diet and not to nutrients in individual foods. The results found for these actual ex- periments were then compared with the calculated results in which the various tentative coefficients for each kind of food had been applied to the quantities of the respective foods in the diet.
Atwater reported that some adjustments in the tentative coefficients were necessary and he altered them slightly in the way he considered most probable. The resulting average coefficients of apparent digestibility (availability as Atwater used the term) for the nutrients in different food groups and for nutrients in a mixed diet were as toUows:
. ' • Food group Protein Fat Carbohy
drate
Animal foods Percent
97 85 78
Percent 95 90 90
Percent 98
Cereals - 98 Legumes dried 97 Sugars and starches _ _ _ _ 98 Vegetables _ _ 83
8Ö 84
90 90 90
95 Fruits . -- 90 Vegetable foods _ 97
Total food * 92 95 97
1 Weighted by consumption statistics based on a survey of 185 dietaries.
When these coefficients were applied to data in 93 digestion experiments on ordinary mixed diets very good agreement was found between calculated values and the results of actual determination. The calculated coefficient for protein in the whole diet was 93.6, and that found by actual determina- tion, 93.3; for fat the calculated value was 94.5 and that found by determination, 95.0; for carbo- hydrate the calculated value was 98.1 and the actual value, 97.7. From this Atwater concluded that for average mixed diets the calculated coefficients were close enough to the determined so that the calculated could be used. But he pointed out that the calculated coefficients might not be applicable under all circumstances and might not apply to all foods in one class. Digestibility studies published since his time have indeed shown rather wide differences among foods within these groups.
A review of the literature shows that in most of the experiments very simple diets have been used in which the test foods made up a large proportion of the total diet. In experiments where the test foods were fed alone or contributed essentially all of the nutrients tested, the supplemental action of one food upon another cannot be observed. Woods and Merrill {193) reported that some of their early digestion experiments with men showed milk and bread to be more completely assimilated when fed together than when eaten separately. A similar conclusion was reached by Bryant {32) regarding milk and oatmeal when fed together and separately to infants. Unfortunately there is not adequate basis at this time for estimating how significant the differences in digestibility are under different conditions of diet intake.
Availability of energy from digested nutrients
Fat Atwater illustrated his method of estimating
the fuel value of fat (ether extract) with the fat of meat. The coefficient of digestibility (cuiTent usage) had been determined to be about 95 per- cent. As its heat of combustion was about

9.5 calones per gram, its fuel value was 9.0 calories per gram (9.5X.95=9.02).
Carbohydrate
The fuel value of carbohydrates was determined in like manner. For example, cereal carbohy- hydrate was considered about 98 percent available (absorbed) for use in the body, and using the heat of combustion of 4.2 calories per gram, Ûie fuel value was 4,1 calories (4.2X.98=4.12).
Protein
For protein (nitrogenous products), in addition to the use of the coefficient of digestibility, it was necessary to correct for the loss of incompletely oxidized nitrogen from the body. To do this Atwater determined the ratio of the nitrogen in the urine to the heat of combustion of the urine. The average of 46 determinations showed that for TABLE 7.-
every gram of nitrogen present in the urine there was sufficient unoxidized matter to yield 7.9 calo- ries, the equivalent of approximately 1.25 calories (7.9-f-6.25) per gram of available (absorbed) pro- tein. The heat of combustion of a gram of ab- sorbed protein (nitrogenous compounds) was therefore reduced by 1.25 calories per gram to allow for incomplete metaboHsm. In the case of digestible meat protein, for example, the heat of combustion per gram is 5.65 calories. Of this nmnber, 1.25 would be deducted for the heat of combustion of the unoxidized products in the urine. This figure was derived from the ratio of the calorie value of the urine to the nitrogen con- tent of the urine on the assumption that the sub- jects were in N-equilibrium and tíiat all of the nonmetabolized part of the available N was re- covered in the urine. The fuel value, 4.40 calo- ries, would then be applied to each gram of protein available as a source of fuel.
-Factors for heats of comhustion arid fuel values of nutrients in different groups of food materials and in mixed diet
Kind of food material
Protein
Meats, fish, etc Eggs Dairy products
Animal food Cereals Legumes Vegetables Fruits
Vegetable food Totalfood
Fat
Meat and eggs Dairy products
Animal food Vegetable food Totalfood
Carbohydrates
Animal food Cereals Legumes Vegetables Fruits Sugars
Vegetable food Totalfood
Nutrients furnished by each group
per 100 grams Total
QratM 43.0 6.0
12.0 6L0 3L0 2.0 5.5 .5
Heat of com- bustion per
gram
Coloriée 5.65 5.75 5.65
Proportion of total
nutrient actually available
Total energy per gram in
available nutrients
5.65
39.0 100.0
60.0 32.0 92.0 8.0
100.0
5.0 55.0
1. 0 13.0 5.0
21. 0 95. 0
100. 0
5.80 5.70 5.00 5.20 5.65 5.65
9. 50 9.25 9.40 9.30 9.40
3.90 4. 20 4. 20 4. 20 4.00 3.95 4. 15 4. 15
0.97 .97 .97
97 85 78 83 85 85 92
.95
.95 95 90
.95
.98 ,98 97 95 90 98
D - (B X C)
Calories 5.50 5.60 5.50
Fuel value
Per gram available nutrients
E»
Calories 4.40 4.50 4.40
Per gram total nutrients
F>
5.50 4.95 4.45 4. 15 4.40 4.80 5. 20
9.00 8. 80 8.95 8. 35
97 97
8.90
3.80 4. 10 4. 05 4. 00 3. 60 3. 85 4.00 4. 00
4.40 4.55 4.45 3.75 3.95 4. 40 4.40
9. 50 9.25 9.40 9.30 9. 40
3.90 4. 20 4. 20 4.20 4.00 3.95
Calorie* 4.25 4.35 4.25 4.25 3.70 3.20 2.90 3. 15 3.55 4.00
9.00 8.80 8.95 8.35
4. 15 4. 15
8.90
3.80 4. 10 4 05 4. 00 3.60 3. 85
P revised «
Calories 4.27 4.37 4.27 4.27 3.87 3.47 3. 11 3.36 3.74 4.05
9.03 8.79 8.93 8. 37
00 00
8.93
3.82 4. 11 4.07 3.99 3. 60 3.87 4.03 4. 03
1 Values for fats and carbohydrates, same as corre- sponding values in column B. Values for protein, same as corresponding values in column B minus 1.25.
2 Values for fats and carbohydrates, same as corre- sponding values in column D. Values for protein, same as corresponding values in column D minus 1.25.
3 Proportion of total nutrients available (column C) applied to heat of combustion values (column B). (Heat
10
of combustion values for protein adjusted for energy loss in the urine by deduction of 1.25.)
NOTE.—This table appears as table 10 in The Availa- bility and Fuel Value of Food Materials (17) with the exception of column F, revised. The figures in this column appear in tabular form in Investigations on the Nutrition of Man in the United States (98, p. 18).

The basic data needed for computing fuel value of a diet were brought together by Atwater and Bryant in a table, reproduced here as table 7. They presented two sets of factors for use in esti- mating energy values. In column E of their table they listed Úxe factors to apply to a gram of avail- able protein, fat, and carbohydrate in each of the various food groups and the average calorie factors per gram, 4.40, 9.4, and 4.15, to apply to the total amounts of protein, fat, and carbohydrate avail- able in a mixed diet. The factors in column E were therefore to be applied to absorbed nutrients.
The fuel value factors listed in coluron F in- cluded a correction for digestibility loss and were to be applied to grams of ingested protein, fat, and carbohydrate in each of the food groups; the average factors rounded to 4.0, 8.9, and 4.0 calories per gram were to be applied to the total amounts of the nutrients in mixed diets. These then were the factors that they considered could be applied directly to representative data on the chemical composition of foods.
For some time after the pubUcation of this work of Atwater and Bryant, apparently no consistent policy was followed with respect to the factors used to estimate energy values of foods (6y 8, 10y 18y 19y 20y 08y 89y ^^7, ^i^^, ^7i). For a period of time the Atwater and Bryant general factors ap- peared in the literature as 4, 8.9, 4; then a refer- ence to a further rounding of the factors to 4, 9, 4 was made in the 1910 revision of Farmers' Bul- letin 142 (11). The 4, 9, 4 factors later came into widespread usage in estimating calorie values of food and not only were applied to the total amounts of protein, fat, and carbohydrate (by difference) of a mixed diet as Atwater and Bryant had originally intended but also were used in assessing the fuel value of individual foods.
Following the publication of the 1899 report, it was realized that for protein the number of calories calculated by applying factors in column E to absorbed nutrients was not identical with the number derived by applying factors in column F to total nutrients. Results obtained by the latter were too low. The error resulted from the misuse of the factor 1.25 derived from a gram of protein. It had been applied to protein which, after diges- tion loss was taken into account, was less than 1 gram. To illustrate: If a subject ingests 1.0 gram of protein the gross fuel value of which is 5.65 calories, and if only 0.97 gram is digested, the gross available calories are 0.97X5.65, or 5.48.
Since only 0.97 gram is available from each gram of ingested protein, only 0.97X1.25 or 1.21 cal- ories should be deducted. Thus for 1 gram of ingested protein, the available energy value would be 5.48—1.21, or 4.27 calories. This is the same as 0.97 (5.65-1.25).
Corrected values for colmnn F were written in file copies ^ of the report and have been included as column F revised here in table 7. The cor- rected values were also published by Langworthy and Milner in 1904 in a summary of investigations on the nutrition of man in this country (98). This publication may not have had wide circulation and has seldom been cited. The revised values make for consistency in the use of columns E and F. It should be pointed out that the revised figures for column F were unrounded in contrast to the values in columns D and E in the original table.
The calorie value per gram of urinary nitrogen.— Several questions have been raised on the advis- ability of applying 7.9, the calorie-nitrogen ratio in urine published by Atwater (12y 17), to energy calculations for which dietary conditions may be greatly different. Lusk (101) summarized data showing that the ratio was affected by the propor- tion of dietary protein, fat, and carbohydrate. Other questions have been raised concerning the effect of negative or positive nitrogen balance, and of high-fruit diets having more than the usual amount of organic acid.
Unfortunately, at the present time no record is at hand showing the specific experiments from which Atwater derived the ratio of 7.9 calories per gram of urinary nitrogen and from it concluded that 1.25 calories per gram of available protein should be subtracted for loss of incompletely oxidized material in the urine.
As early as 1897 Atwater and Benedict in the Storrs Agricultural Experiment Station report for that year (12y, p, 167)y stated, '' . . . the heat of combustion of the water-free substance of the m*ine will be 1.25 calories for each gram of digested (available) protein. This factor is the average foimd in a number of experiments in this labora- tory, in which the heat of combustion of the water-free substance of the urine was determined.^'
At the time this statement was published, results probably were available from the first 16 of a series of 55 experiments on the metabolism of matter and energy in the human body conducted under Atwater^s supervision. We found the ratio of the heat of combustion of urine to urinary nitro- gen when calculated for these 16 experiments to average 7.9 calories, or the equivalent of 1.26 cal- ories per gram of absorbed protein (7.9^-6.25= 1.26).
The study that included the 55 metabohsm experiments was made at Middletown, Conn., during the years 1896-1902 under the auspices of the U. S. Department of Agriculture in coopera- tion with the Storrs (Conn.) Agricultural Experi- ment Station and Wesley an University. The subjects were normal healthy men of similar weight, around 65 to 79 kg.
3 A note on one of the marked copies on file in U. S. Department of Agriculture reads, "A copy showing cor- rections as made on slips sent to Magnus Levy in letter'lof July 6, 1904.''
11

TABLE 8.—Summary of data showing calorie-nitrogen ratio of urine hosed on early studies of energy metabolism and digestibility
[Respiration experiments—food, drink, feces, urine, and respiratory products were weighed, measured, and analyzed. Metabolism experiments—same determina« tions as made for respiration and in addition measurements of heat given off and heat equivalent of work. Digestion experiments—food, drink, feces, urine, were weighed, measured, and analyzed.]
Kind of experiment
Respiration.. Do Do Do Do Do Do Do
Digestion Metabolism.. Digestion Metabolism.. Digestion Metabolism.. Digestion Metabolism..
Average ^_. Minimum. Maximum.
Digestion MetaboHsm.. Digestion Metabolism.. Digestion Metabolism.. Digestion Metabolism.. Digestion Metabolism.. Digestion Metabolism.. Digestion Metabolism..
Do Do
Digestion Metabolism..
Do Do Do
Digestion
Experi- ment
number
1 1 i2 i3
i4P 1 4A 14B i4C 1 4S 237
3 5 239
3 6 Ml 37
243 38
245 39
M7 3 10 M9 7 11 *51 ^ 12 2 76 M3 2 78 7 14 ^80 * 15 * 16 * 17 *82 * 18 * 19 <20 7 21 ^83
Date Number of days duration
Feb. 17-19, 1896 Feb. 26-28, 1896 Mar. 16-21, 1896 Mar. 23-25, 1896 Mar. 25-28, 1896 Mar. 28-31, 1896 Mar. 31-Apr. 3, 1896. Apr. 3-4, 1896 Apr. 26-May 4, 1897. May 4-8, 1897 May 14-18, 1897 May 18-22, 1897 June 3-8, 1897 June 8-12, 1897 Nov. 4-8. 1897 Nov. 8-12, 1897
Jan. 6-10, 1898-- Jan. 10-14, 1898.. Feb. 11-15, 1898. Feb. 15-19, 1898- Mar. 18-22, 1898. Mar. 22-26, 1898. Apr. 8-12, 1898-- Apr. 12-16, 1898- Nov. 4-8, 1898... Nov. 8-11, 1898.- Dec. 17-20, 1898. Dec. 20-24, 1898_ Jan. 12-16, 1899-, Jan. 1&-18, 1899., Jan. 18-20, 1899. Jan. 20-22, 1899. Feb. 2-6, 1899... Feb. 6-8, 1899... Feb. 8-10, 1899.. Feb. 10-12, 1899. Feb. 12-15, 1899. Mar. 9-13, 1899..
2>i 2^4 5 1^/8 3 3 3 1% 8 4 4 4 5 4 4 4
Subject
EO... E0-._ OFT.. AWS- AWS. A WS. A WS. AWS. EO... E0-._ EO... EO... E0___ EO... EO... EO...
EO... EO... EO... EO... EO... E0_._ E0_._ EO... EO... EO... EO... E0__. EO.-. EO... EO... EO... AWS- AWS. AWS. AWS. AWS. EO...
Activity
Rest do do do Mental work. Rest ^- Work Rest do do. Work-,
-do. Rest. do. do. do.
Light-. Rest.-. do. ......do. Work.. do.
.do.
.do. Light. Rest... Light.. Rest... Light-- Rest.., do. do. do- do. do. do. do. Light..
Daily nutrient intake
Gross energy
Calories 3,230 2,920 2,640 2,740 2,740 2,740 2, 740 2,740 2,680 2,660 3,680 3,680
5 2, 470 5 2, 460
2,930 2,900 2,870 2,460 3,680 2,710 2,720
« 2, 700 5 2, 710
3,860 3,860
« 3, 950 « 3, 890
2,620 2,600 2,450 2,510
5 2, 640 5 2, 650 5 2, 650 « 2, 650 5 2, 670 5 2, 780 5 2, 780 s 2, 780
2,260 8 2, 650
Protein
Qrams 142 120 96
101 101 101 101 101 118 119 116 119 104 104 122 129 112
96 142 116 120 120 124 121 124 120 121 116 117 92 94
102 109 109 109
94 97 97 97 97
120
Fat
OratM 126 112
73 85 85 85 85 85 96 95
154 153 69 68
102 96 98 68
154 69 69 32 32
128 129 163 158 95 88 81 82 40 40 40 40 72 72 72 72 72 69
Carbo- hydrate
Oramt 296 281 338 328 328 328 328 328 281 276 381 378 192 190 311 308 304 190 381 342 342 299 297 488 485 307 296 267 270 280 290 269 277 277 277 253 250 250 250 250 281
Nitrogen balance
Orams -f-2. 2 -.4 + .7 + .7
-fl. 6 + 2.3 + .7
-1.3 -. 1 -.7
+ 6.1 + 1.3 -2.5 -1.9 + 4. 1
.0 + .8
-2.5 + 6.1 -2.2 -.6
+ 2. 4 -1.0 + 5. 1 -, 2
+ 3.4 + . 1 + .3
-1.9 -2.8 -2.0 + 2. 9 + 1.0 + 1.2 + 1.0 -1.4 -1.9 + .1 + .4 -.9
+ 2.4
Composition of daily urine
Nitro- gen
Orams 19.6 18.0 13.7 14. 1 13. I 12.5 14. 1 16. 1 17.9 18. 1 11. 2 16.3 17.8 17.7 14. 2 19. 5 15. 9 11.2 19. 6 19.4 18.4 16. 1 19.4 12. 9 17. 9 14.4 18.0 18. 0 19. 5 16. 7 16. 2 13.0 15. 6 15.4 15.6 15.9 16.4 14.4 14. 1 15.4 16. 1
Heat of com-
bustion
Calories 150 159 124 87
101 126 116 84 136 128 96
125 118 134 140 152 124 84
159 132 148 142 147 136 133 136 130 111 173 105 142 121 128 126 128 94 122 108 106 126 142
Cal./N ratio
7.65 8.83 9.05 6. 17 7.71
10.08 8. 23 5. 22 7.60 7.07 8.57 7.67 6.63 7.57 9.86 7. 79 7.86 5.22
10 08 6.80 8.04 8.82 7.58
10 54 7.43 9.44 7.22 6. 17 8.87 6.29 8.77 9.31 8.21 8. 18 8.21 5.91 7.44 7.50 7.52 8. 18 8.82

lCc^^(^^ooc^'«T^^çDí^TlHlc^-o(X)Oi'*'^ooo5coc^^'«í^cD(NrHTí^oirí^THOOTí^c<loorí<oo1-H(^lo^ Tt<'«íiTtiOOC^iOt>050C005COC»Tt^^'^(NÍ^»Cl^cDiC(Ni-HOO»-Ht^iOO>cD^OOC^050000'«!Í<iOI>l>^
Í>rH!©t^Tt^i^:05l>OOOTÍ<OOC^'^OOOOS05CDt^iOLOt^COiOrHOCOOOOO»OÍ^OOC^'íí^iOC^t^iOOOC<ICOOO(X)C^»OQ^ C0Tí^c0C^(X)i>(^^Tí^C0(NC^(NC0C0Ti^C0C^'-H(N(NC0C005t^(^:)lOC0(N'^iOOO'<í^Tí^u0
Tt^OCOCO(NOCO^r-H^CDCOOCCi-HTíHCOCOOC005000^0COOiOOOOT-He0000505005rHCVIOOOUOOOOi
oó ci od <rJ 1-H ci o CO CO lo ILC lo id JO t^ >o ló to ^^ CD lo te
CO CO C^ TtH C» r^ o C^ o CO C5 l> T-H CO C5 ^ 00 Tí^ (N lO-^ o lO Ti^ TíH CO o 00 00 o T-^-^ CO t^ í^ CO l> lO C^ C5 r^ CO »o CO rH t^ o l> i<N ITÍ1 1 1 . I . •
_i_|_J_a-<NCO l<Nl i |4_1^1 1 |(N'-H'-^'-^^lOr-TÍ^CO|^TÍHTt^(NC0r-HC0| |r^C^|^COT-H,,l IH-I »1'
+ 1 ++1 + +1 ' i ' + ' 1 ' ' ' 1 1 1 1 7 1 1 1Y ' 1 17 1 1 1 1 ' ' 1 1 ' +17 ' +^ ^ !+ 1+ ;
COC5C)CO<MOOO<M^I>í^»00'-H»-HCOe<l'^iOOOT-(00 t^l:^OOCiOO(Ni-icOTfTí^|>|>.t^TÍHTÍHCOtOiOlr^OOí^ <N(NTt<COr-iT^C0CO(M(NC^COTt<TÍHC0COC0COCO'^(N<M
Cí 1-H CO ^ OC5 TíH CO <N
C5C0Q0 lO O I—I iOOOCO
OCOC^T-iTtii^COT-il^àOTiH (NOOOCit^CO-^OOt^í^CO C0COC5COC0COO0COOÍ>O5C<l
OCOCOOOiO o (N 1-4 coooeoco to o TjH Tt* 05 TÍH Tí< ÍTTJH ÍT^O Í
CiOCitOC^COOOTÍHt^iLOOOOOcOTtHT-KNlMOCSCOcO COCOCOOOCOCOOOCSd'ífTÍ^CíOOCOtOíOCSCSOOOO
00 Ci CO CO CO o
(M
iOCO lO CO CO 00 r-l (N
TÎ^<Nt>05Tji(NO(NÇDàOt^ cocicoooa)Oi>a>oooico (N(N (N(NCO (N 1-1
C5 CO C5 "^ CO cqco COCOÍ
COTí^Tî^»-H<^l(NcOT-^t^OCiOCOOC5l-lCOOOO'*00 (M(N(Mr-HC:Tt^O.-^CiOC5C5C5OC5OC5OOO05O
(N OCO C5 oo
<M(NCO ooo CO'^TÎ<iOC<JCO(NCO'<Î<rHàOCOC5COtOOO> CSOOOOOOOOi-HCO C500T-IO
oooooooooooooooooooooo Tti»OCOt^cOLOOO(MCiC5C50CiCOC>C5Ci05a><NC^ OtOOOOCíCiOdiO'íí^TtiTí<ríH"rtlTÍ<Tt<"rt<'TÍ<rt<'^tOtO
ooo (N !-( T-l Csl^i^
OOO COl-HTi< CO to to
ooooooooooooooooo o o CO l> CO CO CO TÍH r-( CO l> o o rH CO 00 00 rH T-l l> CO (N 00 C5 00 W 00 i>-00 CO to CO O'^rf tOtOír^tOw^tOÍ
COC^C0(M(MC0OÍ(NíM<N<NC^C0COCOC0COC0CO00<N(N -^ "^-^ Tt< "\J< Tí< TíH rti lO to c<i tototototo to to"
o o -ce
ooo www
o o o ^T3
c o
w
o I I o o -t-3 ^ T3 I »aíj TJ 13
bßO ■ ^ o
3&^ IPíí^
lOOOOOOOOOO
Oí o
O I O O O O O O J:ïJT:3^T3T3T3'OT5'T3
II ¡I 1 : : ¡ ■ ■ pí
rí^C0^C0COC0Tt^C0COCOTí^coCOC0Tí^Ttr^COTí^TÍ^l-(T^Tt^Tí^rHTí^'<t^»-HTfTfTt^.-^TÍ^C0l-t(NT^C0^
Oi Oi Oi 0¡ Oi Oi 00 00 00
CO C5<N
00 CO Cl
S^^
oooo o o o o Ci Ci d C5
CO CO '^ t^
I I I I Ci CO o -«í^ ^(M ^ ^
•-5 1-2 .un pL(
oo oo Ci Ci
O'CO*^
OO oo Ci Ci Ci Ci
>oo >oo oooo oooo ' o S^CiCiCiCiOO '~''~'i-li-li-lr-40Ci
'-11—l»-lCN,_,çsqçs;j(-sqLO<3i
îrt Î3 Î3 t» >-<' ^H' tn' u^' Ü ci
Ç^OCi ^Cil-H
"^ -to
^ OOr-1
ooo Ci Ci <3^
Ci o"^
' I À. to Ci c^ T—i 1—I C^
3 «a c3,<li
• oo ^ CiCi
¿Il
§ ^"^ J J co'^ J
<N <NCO
r-1 r-, ^ OCiOi ^* O O í>,0 Ci 1-1 '-'
^ ^Ci Ci s?^ -H - -
tAdi-fV4.^V ' '
OO Ci Cl
r ~i di I j -^ S5
^ ^ tJ iJ tJ >^ >> >» t^
iMññ^^^Mñ
coco
Ci CO
03 03
ISS
^(N (N (N (M CO CO „ (M O O O O ^-^o O ' 2? £2
CiCiC5CiCiCiÇ2<^S ^•^^^^^^^OCi2
P<N<N<NC0í^(NC0^-OO _L I I I I I 1 I ï> «-^ T"
^r-(C9(N(NC0<M<NCOt^I^
^ Ù ^ ^^ ^I, t^ C, íH' b* ^ > j;
^«««^^^"^^ ^
C^ (M (M í> tO Ci CO t^ 00 CO Ci O ^ l> C^ CO Tfi Ci tO CO C^ t^ 00 Ci tO O rH C^ 00 CO "^ to Cí CO t^ 00 C^ Ci O 1-1 tO C«^ CO Tí< tO Tí< CO CO r^ I *rí "^ CS|''t'C^ CSI C^ to C^ CO CO tO CO CO CO 00 CO 00 Ci CO CO CO Ci-^ Til Tti Ci Tt" "^ rtH o TjH rí< ^ o T^ to tO o to to lO tO | '-^r-'^r^*'--^í--rt^i-Hr^^r>r^^_,^^^^r-(oOo-^oooC<>ooo^oooCOoooo«C>^COc,„ T?
o o _ „ ...
I ^§; 5.2 o .2 o 1 ^j j2 -t^ jD
OO.íríOOO.ÍíOOO.SO
5§ SS
bc.y O O bc-g g o o
GO ho^ ce bD a5 bt) o;
o o ' .2 O O
bO"g
PS
S! bc.2'o'
■•-í 5R 03 œ bCQ)1
f25Sï
ÖH
o o 0.::á o
^QQ:
o
.2 'S .2 «^
W)^ bO bO oj bí) Qj bC
493-791 O - 73 -
13

TABLE 8.—Summary oj data showing calorie-nitrogen ratio of urine based on early studies of energy metabolism and digestibility—Continued
Experi- ment
number Date
Number of days duration
Subject Activity
Daily nutrient intake
Nitrogen balance
Composition of daily urine
Kind>f experiment Gross
energy Protein Fat Carbo- hydrate
Nitro- gen
Heat of com-
bustion Cal./N ratio
Metabolism 12 58 «619
12 60 12 61
12 622 12 62 12 63 12 64 12 65 12 66 12 67
Nov. 10-13, 1903 Jan. 21-27, 1904 Jan. 27-30, 1904 Jan. 30-31, 1904 Apr. 12-16, 1904 Apr. 16-19, 1904 Apr. 19-22, 1904 Apr. 22-23, 1904 Apr. 23-24, 1904 Apr. 24-25, 1904 Apr. 25-27, 1904
3 6 3 1 4 3 3 1 1 1 2
HF BFD BFD BFD ALL ALL ALL ALL ALL ALL ALL
Rest Calories 1,500
(13)
2,510 3,610
(13)
4,640 4,750 5,390 2,370 2,060 2,110
Grams 40
(13)
101 100
(13)
101 103 117 96 88 68
Grams 27
(13)
51 163
^13)
115 300 365
30 30 29
Grams 252
(13)
356 376
(13)
731 323 337 389 324 371
Grams -2.2
------- -L6
-2.0 + 2.4 -9.4 -9.0 -7.2
Grarru 8.5
15. 1 15.7 16.5 15.3 15.4 17.8 15.7 24.0 22.3 17.4
Calories 76
133 130 138 126 131 136 128 176 157 130
8. 94 Digestion Metabolism
Do
do do Work do do do do Rest
8.81 8.28 8 36
Digestion Metabolism.
Do*
8.24 8.51 7. 64
Do* 8. 15 Dot 7. 33 Do do
Light 7. 04
Dot 7. 47
1 Atwater, W. O., Woods, C. D., and Benedict, F. G. U. S. Dept. Agr., Off. Expt. Sta. Bui. 44, 1897. (êS)
2 Atwater, W. O. Fourteenth Ann. Rept. of the Storrs Agr. Expt. Sta. 1901, pp. 179-245, 1902. (7)
3 Atwater, W. O., and Benedict, F. G. U. S. Dept. Agr., Off. Expt. Sta. Bui. 69, 1899. (Rev. ed.) {IS)
* Atwater, W. O., and Benedict, F. G. Nati. Acad. Sei. Sixth Mem. Vol. 8, 1902. (15)
5 Included 512 calories from 72.5 grams alcohol. <^ Average of the 16 experiments believed used by Atwater to obtain his
first estimate of the calorie-nitrogen ratio 7.9 in 1897. 7 Atwater, W. O., and Benedict, F. G. U. S. Dept. Agr., Off. Expt. Sta.
Bui. 109, 1902. {14) ^512 calories supplied by 72.5 grams alcohol on last day of experiment. * Average of all metabolism and their preliminary digestion experiments
made in period 1896-1899. These 41 experiments believed to be included in the 46 experiments used by Atwater to confirm 1897 estimate of calorie- nitrogen ratio.
10 Atwater, W. O., and Benedict, F. G. U. S. Dept. Agr., Off. Expt. Sta. Bui. 136, 1903. {16)
11 Experiment discontinued at end of first day, subject became nauseated and able to consume only part of food, worked 5 hours instead of customary 8 hours.
12 Benedict, F. G., and Milner, R. D. U. S. Dept. Agr., Off. Expt. Sta. Bui. 175, 1907. {S7)
13 Amount not reported, but essentially same as in following experiment. 1* Results for last two days of period. ♦High fat diet, fat supplying one-half to two-thirds of the total calories. fHigh carbohydrate diet, carbohydrate supplying two-thirds or more of
the total calories.

A complete outline of the work, and the pro- cedures followed were given in considerable detail by Atwater and Benedict (16), Those aspects of the study thought to have a direct bearing on the calorie-nitrogen ratio of the urine will be referred to here. Some additional details are given in the section on alcohol (p. 18). Selected data from the 55 experiments have been summarized in table 8 along with data from a later series in which Benedict and Milner continued the study.
Atwater designated the first fom* experiments of the series as "respiration experiments/' for these, analyses were made of food intake, drink, feces, urine, and respiratory products. No deter- minations were made of the heat given off from the body nor of the heat equivalents of external work in these experiments. He called the remain- ing experiments. Nos. 5 through 55, "metabolism experiments." They included measurements of energy in addition to the data obtained in the respiration experiments. Each njetabolism experi- ment had two parts, a digestion experiment in which the subject Hved under ordinary conditions and the metabolism experiment proper in which the subject lived in a respiration chamber. Di- gestibihty data were available from the second Eart as well as from the first part of each metabo-
sm experiment. The respiration calorimeter, described in detail
in U. S. Department of Agriculture Bui. 63 (21), was especiaUy designed for this series of experi- ments. It included among other equipment a bed and a stationary bicycle with an ergometer for measuring external muscular work, thus providing for the study of metabolism of matter and energy under conditions of rest and strenuous activity.
In the so-called work experiments, the activity of the subject varied but in most cases he rode the stationary bicycle for 8 hours daily. During the preliminary digestion period, prior to the work periods within the calorimeter, the activity of the subject was sometimes comparable to that during the work period and sometimes was only his normal activity with some additional light exercise. This latter activity was designated as "Ught" in table 8 to differentiate it from the more strenuous activity of pedaling the stationary bicycle for 8 hours daily, referred to as a "work'' experiment. In the "rest" experiments the subject remained quiet, avoiding all muscular activity as far as it was practical.
Certain precautions were taken to minimize errors in the nitrogen and energy déterminations. The urinary nitrogen was determined in 6-hour intervals throughout the day, using the Kjeldahl method. A portion of each collection was reserved as part of a composite sample for the day. Nitro- gen and the heat of combustion were determined on a portion of this composite and the remainder was preserved by adding formalin or thymol. This became a part of the composite sample for the whole period of usually 3 to 4 days. The analysis of the total composite sample checked
closely with results obtained when the urine was analyzed each day. This assured the investigators that no significant error occurred from nitrogen or energy loss in the urine during storage.
The heats of combustion were determined by the Kellner method. A weighed absorption block of cellulose of known heat of combustion was saturated with a known amount of urine, dried at about 60° C, and burned in a bomb calorim- eter. The results were corrected for the heat of combustion of the absorption block. This latter factor was an average of determinations for a number of similar blocks. The method was given in detail by Atwater and Snell, 1903 (22).
The investigators took into account the possi- bihty that a lag in liitrogen excretion by the subjects woidd introduce some error in urinary estimations in the relatively short experimental periods of 3 to 4 days. This possible error was reduced by haviug periods on the same diet rim consecutively. In addition to the incompletely oxidized matter lost iu the urine the perspiration losses should be recognized. However, as nitrogen losses have been shown by 25 work experiments of Atwater and Benedict (16) to be small, averaging only 0.29 gram per day, and as data on compa- rable energy loss in the perspiration were lacking,, the data in table 8 apply to urinary losses only.
The series was planned to study metabolism (1) whUe fasting, (2) when the proportions of fat and carbohydrate of an ordinary diet were varied,, and (3) when a moderate amount of alcohol replaced fat and carbohydrate isocalorically. In the first 16 experiments rather simple mixed diets were used as shown in table 9. For these experi- ments the amounts of protein, fat, and carbo- hydrate, and the gross calories foimd by deter- mination were reported. The amoimts of other nutrients present in the diet have been calculated from tables of nutrient composition; these cal- culated values are shown in table 10.
In the annual report for 1899 (17) Atwater con- tinued to use the same factor, 1.25 calories per gram of digested protein, in his calculations of available energy, although he recognized that this deduction was not accurate for all foods. Some error is introduced when this correction, based on the factor 6.25 to convert nitrogen to protein, is used with proteins or with nonproteins containing more or less than 16 percent nitrogen. In the same publication he mentioned briefly the deriva- tion of the basic figure 7.9 calories per gram of urinary nitrogen. He stated that the figure was based on the average of 46 determinations. They were mainly from his laboratory with a few from Chas. D. Wood of the Maine Experiment Station. In addition to the first 16 experiments conducted prior to the 1897 report, the next 25 of the series may have been completed before the 1899 report was prepared. Possibly these 41 experiments, together with 5 unpublished from the Maine Experiment Station, made up the 46 experiments to which Atwater referred in the 1899 report.
15
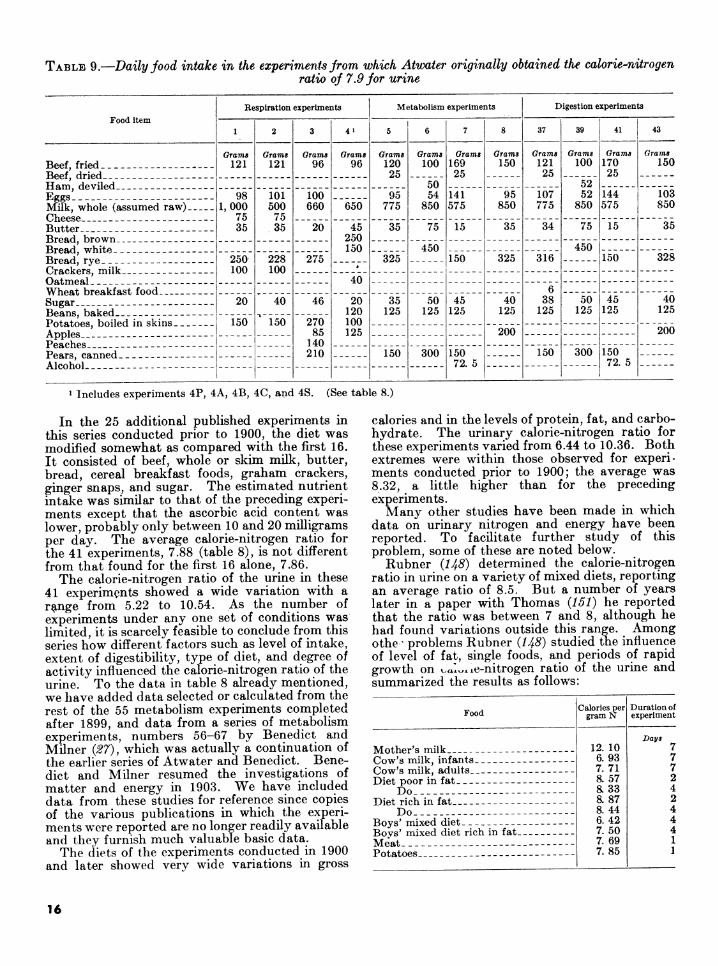
TABLE 9.—Daily food intake in the experiments from which Atwater originally obtained the calorie-nitrogen ratio of 7.9 for urine
Respiration experiments Metabolism experiments Digestion experiments
Food item 1 2 3 41 5 6 7 8 37 39 41 43
Beef, fried Grams
121 Grams
121 Grams
96 Grams
96 Grams 120 25
Grams 100
'"'5Ö" 54
850
Grams 169 25
Grams 150
Grams 121 25
Grams 100
""52' 52
850
Grams 170 25
Grams 150
Beef, dried - -
Eggs 98 1,000
75 35
101 500
75 35
100 660 "65Ö'
95 775
141 575
95 850
107 775
144 575
103 Milk, whole (assumed raw) Cheese
850
Butter - 20 45 250 150
*
35 75 15 35 34 75 15 35
Brpad whitp "325'
450 450 Bread, rve 250
100 228 100
275 150 325 316 150 328 Orarkpra milk
40 WVipftt hrpakfast food 6
38 125
Sugar - -- 20 40 46 20 120 100 125
35 125
50 125
45 125
40 125
50 125
45 125
40 Beans, baked _ - - 125 Potatoes, boiled in skins 150 150 270
85 140 210
200 200
Pears, canned - 150 300 150 72. 5
150 300 150 72. 5
Includes experiments 4P, 4A, 4B, 4C, and 4S. (See table 8.)
In the 25 additional published experiments in this series conducted prior to 1900, the diet was modified somewhat as compared with the first 16. It consisted of beef, whole or skim milk, butter, bread, cereal breakfast foods, graham crackers, ginger snaps, and sugar. The estimated nutrient intake was similar to that of the preceding experi- ments except that the ascorbic acid content was lower, probably only between 10 and 20 milligrams per day. The average calorie-nitrogen ratio for the 41 experiments, 7.88 (table 8), is not different from that found for the first 16 alone, 7.86.
The calorie-nitrogen ratio of the urine in these 41 experiments showed a wide variation with a r^-nge from 5.22 to 10.54. As the number of experiments under any one set of conditions was limited, it is scarcely feasible to conclude from this series how different factors such as level of intake, extent of digestibility, type of diet, and degree of activity influenced the calorie-nitrogen ratio of the urine. To the data in table 8 already mentioned, we have added data selected or calculated from the rest of the 55 metabolism experiments completed after 1899, and data from a series of metabolism experiments, numbers 56-67 by Benedict and Milner (^7), which was actually a continuation of the earlier series of Atwater and Benedict. Bene- dict and Milner resumed the investigations of matter and energy in 1903. We have included data from these studies for reference since copies of the various publications in which the experi- ments were reported are no longer readily available and they furnish much valuable basic data.
The diets of the experiments conducted in 1900 and later showed very wide variations in gross
calories and in the levels of protein, fat, and carbo- hydrate. The urinary calorie-nitrogen ratio for these experiments varied from 6.44 to 10.36. Both extremes were within those observed for experi- ments conducted prior to 1900; the average was 8.32, a little higher than for the preceding experiments.
Many other studies have been made in which data on urinary nitrogen and energy have been reported. To facilitate further study of this problem, some of these are noted below.
Rubner (I48) determined the calorie-nitrogen ratio in urine on a variety of mixed diets, reporting an average ratio of 8.5. But a number of years later in a paper with Thomas (151) he reported that the ratio was between 7 and 8, although he had found variations outside this range. Among othe^ problems Rubner (I48) studied the influence of level of fat, single foods, and periods of rapid growth on oo-lv.x xe-nitrogen ratio of the urine and summarized the results as follows:
Food
Mother's milk Cow's milk, infants Cow's milk, adults Diet poor in fat
Do Diet rich in fat
Do Boys' mixed diet Boys' mixed diet rich in fat Meat Potatoes
Duration of experiment
Days 7 7 7 2 4 2 4 4 4 1 1
16

TABLE 10.—Daily nutrient intake in the experiments from which Atwater o riginally obtained the calorie-nitrogen ratio of 7.9 for urine
Respiration experiments Metabolism experiments Digestion experiments
Nutrient 1 2 3 14 5 6 7 8 37 39 41 43
Gross energy _ _ calories. _ 3.230 2,920 2,640 2,740 2,660 3,680 2 2, 460 2,900 2,680 3,680 2 2,470 2,930 Protein . _grams _ 142 120 96 101 119 119 104 129 118 116 104 122 Fat-_ _- grams._ 126 112 73 85 95 153 68 96 96 154 69 102 Carbohydrate. __ _ grams__ 296 281 338 328 276 378 190 308 281 381 192 311 Calcium._ _ . milligrams.. 1,882 1,290 962 1,394 1,137 1,269 891 1,224 1, 145 1,214 895 1,230 Iron _ _ - milligrams.. 15.3 14.4 15. 1 16.4 17.9 13.0 17.0 17.9 18.2 13.5 17.3 18. 1 Vitamin A value International Units. . 4,700 3,940 3,620 3,040 3,520 4,490 3,050 3,820 3,620 4,460 3,090 3,900 Thiamine milligrams. _ 1.26 1.02 1.35 1.06 1.17 1.04 .90 1.26 1.20 1.05 . 86 1. 27 Riboflavin milligrams 2.87 2.12 2.06 1.89 2.29 2.35 2.02 2.43 2.35 2.33 2. 04 2. 43 Niacin milligrams _ . 14.6 13.7 15.6 16.4 15.4 13.8 14.4 16.2 14.8 14.0 14. 4 15. 3 Ascorbic acid milligrams. . 42 32 67 35 21 25 16 29 21 25 16 29
1 Includes experiments 4P, 4A, 4B, 4C, and 4S. (See table 8.) 2 Includes about 500 calories from 72.5 gm. alcohol in diet.

Rubiier and Thomas {151) found the urinary calorie-nitrogen,ratio for a subject on a diet solely of potatoes to be 9.04, 11.92, and 10.09 for the 1st, 4th, and 6th days respectively—^ratios which were much higher than Rubner had observed in earlier experiments except for the infant on mother's milk. Sherman (l56) reported a series of metab- ohsm experiments on very simple diets of crackers and milk and in some cases butter. In one series periods of restricted and liberal intakes were alter- nated. Experimental periods of 3 to 5 days fol- lowed consecutively, two series for 12 days each and a third series for 20 days, to provide a better basis for following and interpreting changes in the composition of the urine. There was no apparent difference in the calorie-nitrogen ratios found for the periods on restricted and liberal intakes. The range was 7.39-8.00. In general the ratio was somewhat lower than that found by Atwater and CO workers for subjects on mixed diets.
Benedict made an extensive investigation of nitrogen and energy losses in the urine under fasting conditions, reporting his results in two publications {25^ 26). When body material is metabolized the calorie-nitrogen ratio appears to be even more variable than- that found for differ- ent kinds of mixed diets but the average ratio is higher. He reported ratios in the range of 8 to 10 for the first day of fasting, increasing with each successive day until after several days some were in the range of 14 to 18.
Several investigations have been made in which calories and nitrogen in the urine of children have been reported, notably those of Macy {111, 112), Her studies provided data on a group of children ranging from 4 to 12 years of age over an extended period of time. From the composition of the urine reported the calorie-nitrogen ratio has been cal- culated for each child. The ratio does not appear to differ appreciably from that obtained by Atwater for adults. Related problems have been studied by Folin {54) y Rubner {14^), Rubner and Heubner {150), and Tangl {180).
In view of the wide variation observed for the calorie-nitrogen ratio of the urine, the use of an average calorie value per gram of nitrogen may be questioned. Data providing a measure of the magnitude of the discrepancies when the avail- able energy of the whole diet is calculated by the three procedures outlined on page 8 have been brought together in table 11. The experiments selected represent the more extreme conditions on record as follows: (1) Those in which the actual calorie-nitrogen ratio of the urine was considerably above or below the average ; (2) those in which the subject was in different states of N-balance; and (3) those in which the subjects had diets of widely different composition with respect to proportions of calories from fat, protein, and carbohydrate.
The data show that although the amount of energy lost in the urine is highly variable, on the whole it is small compared with the gross energy
of the food eaten. This is not surprising since less than a third of the gross calories from the digestible protein is involved, and digestible proteiu makes up only 10 to 25 percent of the total calories in these diets. Consequently, an error introduced by the use of an average calorie value per gram, of either urinary nitrogen or net absorbed nitrogen does not affect greatly the calculated available energy of the whole diet.
For individual high-protein foods such as lean meat and some defatted nut and legiune products, urinary loss might be a much more significant factor in determining available energy. If suitable data were available not only for foods of high nitrogen content but for all foods having some nonprotein nitrogen, and if data were available on the digestibility and utilization of the various nitrogenous compounds, a more accurate procedure for calculating available energy could be developed. Such data are not available and we are continuing to use Atwater's correction of 1.25 calories per gram of available protein (nitrogen content 16 percent).
For purposes for which the calculation of urinary energy loss from nitrogen in the usual way is not satisfactory, attention is called to the work of Rubner {149) and of Benedict {25, pp. 490-492). Benedict found less variability in the ratios of calories to either carbon or organic matter than in the ratio of calories to nitrogen. He found closer relationship when he related the energy to carbon but in view of the difficulty in determining carbon he suggested as a more feasible procedure, using the somewhat less constant calorie-organic matter ratio of the urine. The latter was largely proportional to the carbon content of the urine and far more readily determined. Benedict's suggestion for making the urinary energy deduc- tion on this basis rather than using the more variable calorie-nitrogen ratio in estimating avail- able calories in foods should be given further consideration.
Alcohol The perplexing subject of the energy value of
alcohol has been investigated from time to time for more than 50 years. Investigations have included such problems as the extent to which alcohol can spare protein for building or mainte- nance of body tissue, and the use of alcohol for muscular activity, deposition of fat, and generation of heat for maintenance of body temperature. Particularly controversial has been the question of the body's use of alcohol for muscular work.
The gross energy value of alcohol is 7.07 calories but its physiological energy value has been assessed variously by different groups of investigators. Daniel, 1951 {45) suggested using about 5.0 calories per gram, since from animal experiments and various biochemical studies it
18

TABLE U.—Comparison qfdatajor available energy obtained by direct determination only and in part by calculation *
Experiment number and kind (See table 8)
(1)
Average^gross]energy per day
65 (Metabolism) 66 (Metabolism) 67 (Metabolism) 41 (Metabolism) 38 (Metabolism) 43 (Metabolism) 45 (Metabolism) 198 (Digestion). 48 (Metabolism) 4S (Respiration) 8 ( Metabolism) 1 25 (Metabolism) 76 (Digestion) _ _ 49 (Metabolism) 80 (Digestion).. 43 (Digestion).. 49 (Digestion).. 39 (Digestion)...
Food
(2)
Calories 2,369 2,062 2, 114 4,539 3,708 4,867 4,860 4,258 4,856 2,741 2,897 2,896 2,622 5,499 2,638 2,935 3,860 3,684
Feces
(3)
Calories 92 92 92
231 153 224 256 246 280 120 117 111
71 172 96
158 198 192
Urine
(4)
Calories 176 157 130 158 155 147 150 105 162 84
152 147 111 135 121 140 136 96
Nitrogen absorbed
(net) per day
(6)
Qrams 14.5 13.3 10. 1 15.4 15.7 15. 1 15.2 13.9 15.0 14.8 19.5 16. 7 18. 3 16. 6 15.9 18. 3 18. 0 17.2
Nitrogen in urine per day
(6)
Grams 24.0 22.3 17.4 20.0 20.3 18.8 18. 9 16. 3 17.2 16. 1 19.5 16.5 18.0 15.5 13.0 14.2 12. 9 11. 1
Heat of combus-
tion of urine per gram
urinary N
(7)
Calories 7.33 7.04 7.47 7.90 7.64 7.82 7.94 6.44 9.42 5.22 7.79 8.91 6. 17 8.71 9.31 9.86
10. 54 8.65
Daily N-balance
(8)
Orams -9.5 -9.0 -7.3 -4.6 -4.6 -3.7 -3.6 -2.4 -2.2 -1.3
0 + .2 + .3
+ 1.1 + 2.9 + 4. 1 + 5.1 + 6.1
Available enei^y obtained from data in preceding columns—
By direct determina-
tion Procedure 1 (2)-r(3)+
In part by calculation
È)]
(9)
Calories 2,101 1,813 1,892 4,150 3,400 4,496 4,454 3,907 4,414 2,537 2,628 2,638 2,440 5,192 2,421 2,637 3,526 3,396
Procedure 2 (2)-l(3)+
7.9 (6)1
(10)
Calories 2,162 1,865 1,942 4, 186 3,431 4,524 4,484 3,902 4,458 2,504 2,626 2,653 2,406 5, 196 2,416 2,632 3,520 3,356
Procedure 3 (2)-[(3)+
7.9 (6)]
(11)
Deviation from values obtained by direct de- termination, of values calculated by—
Calories 2,087 1,794 1,885 4,150 3,395 4,494 4,455 3,883 4,440 2,494 2,626 2,655 2,409 5,205 2,439 2,665 3,560 3,404
\ Data selected from more extensive list of experiments shown in table 8. publication.
Procedure 2
(12)
Percent + 2.9 + 2.9 + 2.6 +.9 + .9 + .6 +.7 -. 1
+ 1.0 -1.3 -. 1 +.6
-1.4 + . 1 -.2 -.2 -.2
-1.2
Procedure 3
(13)
Percent -0.7 -1.0 -.4 0 -. 1 0 0 -.6 + .6
-1.7 -. 1 +.6
-1.3 + .3 +.7
+ 1.1 + 1.0 + .2
The reader is referred to that table for further information and for source of original
appears that only 65 to 70 percent is available for muscular work. The Food and Agriculture Organization Committee on Calorie Conversion Factors and Food Composition Tables did not publish a review of the literature but suggested in their report {55) that alcohol be omitted in computations of energy value of diets for two reasons—it is seldom possible to estimate alcohol consumption accurately, and little is known regarding its physiological energy value.
The gross potential energy value of alcoholic beverages was estimated by Atwater and Benedict to be as much as 500 calories per day for an individuaPs consumption described as "moderate.*' Statistics based on alcohol tax receipts in this country indicate that the average per capita consumption (man, woman, and child) of alcoholic beverages in recent years is approximately equiv- alent to 76 calories (gross value) per day. Were children and all other nonusers eliminated, the average consumption for users would be much higher. For numerous purposes, therefore, some assessment must be made of the energy value of alcohol.
The question is still being debated whether the energy of alcohol can be used for various physio- logical processes to the same extent as the organic constituents of food or whether its use is limited entirely or partially to providing heat. Reviews of the different aspects of alcohol utilization have been published by Carpenter {35), Mitchell and Curzon (Jf^^), Keys {80), and Klatzkin and others {82),
To be accurate, the assessment of food energy should take into account the site of the energy conversion and physiological destination of the nutrients. Up to the present no such additional refinements have been attempted in any common method of estimating energy values of foods. Attempts to do so with a view to obtaining calorie values to apply to foods under real life situations would be very complex. To illustrate. Keys {81) pointed out that when starch is hydrolyzed to glucose in the gastro-intestinal tract, approximately 14 calories per 100 grams are released in the body. This is available only as body heat and for no other purpose. If the hydrolysis occurs during cooking, these calories are lost before ingestion. In estimating calorie values of starch this type of difference is not taken into account. Of more importance, he pointed out, is the demonstration that, calorie for calorie, fat is about 12 percent less efficient for production of external muscular work than carbohydrate, yet there is no difference if calories are needed solely to maintain body temperature.
The potential energy of moderate amounts of alcohol may have a more limited usefulness in body metabolism than energy from proteins, fats, and carbohydrates. In view of the fact that in estimating calorie values, differences in avail- ability and efficiency of use of the energy from these common sources are not considered, it does
not seem necessary at present to discount the energy value of alcohol, particularly since there is considerable evidence that when intake is moderate a large part may be available for mus- cular work and that aU of it may serve as a source of body heat.
The calorie factor for alcohol used in the tables in this publication is the one proposed by Atwater and Benedict (15), 6.9 calories per gram, based on respiration calorimeter studies in which they found that 98 percent of the heat of combustion -(7.07 calories per gram) was utilized by the human body in its combined needs for energy in muscular work, building tissue, and maintaining body temperature.
Altogether Atwater and Benedict conducted 26 experiments, each lasting 2 to 4 days, in which they compared the metabolism of man on diets with and without alcohol. These experiments were part of the long series already referred to and are included in table 8.
In three groups of the first experiments, the periods with and without alcohol were not as directly comparable as in the six groups of later experiments, owing largely to lack of means for providing a food supply of uniform composition. By the time the later experiments were conducted, ways of preserving considerable quantities of food by canning and by cold storage had been devised. Three men in good health and with apparently normal digestion served as subjects in these 26 rest and work experiments. The respiration calorimeter used (see p. 15) was so constructed and equipped as to permit measurement and sampling for analysis of ventilating air, food, and excreta, and also for measurement of heat given off and external work performed by the subject.
The experimental plan for these 26 experiments was in general the same as that for the other ex- periments in the entire series. One difference was that in this group of experiments all periods were more than 1 day.
A preliminary digestion experiment of 3 or 4 days preceded each metabolism experiment. Each subject was on the experimental diet he was to have in the following period in the respiration chamber. During this preliminary period the subject made adjustments considered necessary in the diet and controlled his activity as much as possible to that he would have during the metabo- lism experiment in the calorimeter. The amounts, heats of combustion, and composition of food, feces, and urine were determined.
During the metabolism experiment these deter- minations were continued and in addition deter- minations were made of the water and carbon dioxide content of the ventilating air entering and leaving the respiration cbamber, the heat given off by the body, and the heat equivalent of the muscular work performed during the work experiment. These data made it possible to determine the carbon, nitrogen, and hydrogen
20

balance, the potential energy of food and unoxi- dized excreta, the kinetic energy of heat given off, and the external work performed.
Each subject had a rather simple diet consist- ing of such ordinary foods as meat, milk, bread, cereals, butter, sugar, and in some cases, coffee. During the rest experiments the diet supplied about 2,500 calories and during the work experiments, about 3,900 calories. In the rest experiments the subject performed as little activity as possible in addition to the necessary motions of dressing, un- dressing, handling of samples, recording of data, and the daily setting up and taking down of his cot. Most of the day was spent sitting, reading, or writing. In the work experiments he rode a sta- tionary bicycle for a total of 8 hours a day.
Alcohol was substituted for either carbohydrate or fat or a mixture of both in 13 experiments, in- cluding rest and work experiments. About 72 grams (about 500 calories) were given in 6 small doses, 3 with meals and 3 at regular intervals between meals. Thus it furnished about a fifth of the calories during the rest experiments and between a seventh and an eighth of the calories during the work experiments.
The data showed that alcohol had no practical effect on digestibility except possibly in the case of protein. The coefficient of apparent digesti- bility of protein was a little larger in the experi- ments when the diet included alcohol than in comparable experiments without alcohol, 93.7 percent as compared with 92.6 percent.
The amounts of unoxidized alcohol given off by the kidneys, lungs, and skin were measured and deducted from the amount ingested. The differ- ence was taken as the amount of alcohol oxidized in the body. Previous research by another worker had indicated that alcohol was not ex- creted by way of the intestine even when con- siderable quantities were taken. Therefore, no analysis of feces for alcohol was made. In these experiments only small amounts of unoxidized alcohol (0.7 to 2.7, averaging 1.3 grams) were recovered. The authors concluded that not more than about 2 percent would be given off unoxidized when taken in amounts comparable to those in these experiments. They suggested using 98 percent of the gross heat of combustion as the value of alcohol.
From these results Atwater and Benedict com- pared the energy of the daily net income and the outgo for subjects on diets with and without alcohol. The net income was the energy of the material actually oxidized in the body, and was determined by adjusting the available energy (gross food energy minus total calories in urine and feces) for calorie equivalent of loss or storage of body protein and fat. The total heat outgo was the energy measured by the apparatus as the heat given off plus the heat equivalent of the work performed by the subject. Wliether or not the diet contained alcohol, the average energy outgo was equal to the average amount of energy of the
net income. Atwater and Benedict concluded that the energy of alcohol oxidized was trans- formed completely into kinetic energy and ap- peared either as heat or as muscular work, or both.
Atwater and Benedict made some deductions concerning the protecting effect of alcohol on body material, based on the carbon, nitrogen, and hydrogen balances of the subjects. From these balances they estimated the daily gains and losses of body fat and protein, assuming that the glyco- gen stores for each individual at the beginning and end of the experiment were the same. They found some gains and some losses of body fat on either kind of diet but on the average there was a gain. This gain was slightly larger when the subjects were on the diets including alcohol than when on the ordinary diets; 2.4 grams daily as compared with 1.1 grams of fat in comparable experiments with and without alcohol. Storage and loss of bod}^ protein also was calculated. Com- parisons made between the ordinary and alcohol periods indicated that alcohol was slightly inferior to carbohydrate or fat in protecting body protein; that is, a larger average daily loss, G.9 grams, of body protein occurred in the alcohol periods than the average loss, 3.5 grams per day, for the ordi- nary periods.
Loss of the energy of alcohol by radiation of heat seemed to account for only a small proportion of the calorie value. Atwater and Benedict found that the radiation of heat from the body was only slightly greater with the alcohol diet than with the ordinary diet, and amounted to not more than 6 percent of the energy of alcohol.
Some of the results of the six groups of experi- ments (totaling 15 balances on 2 men) in which the alcohol and nonalcohol periods were more nearly comparable are shown in table 12. As the protein intake within each group of comparable experiments with and without alcohol is nearly constant, these data indicate approximately the effect of alcohol on both the apparent digestibility of protein and on the retention or loss of digested protein. There was a small increase in apparent digestibility and also some increase in urinary nitrogen excretion when the diets included alcohol. The heats of combustion which Atwater and Benedict applied in experiments 9 and 10 to changes in body protein and fat were 5.65 and 9.54 calories per gram, respectively. In their later experiments they changed the figure for body fat as they considered 9.4 calories per gram more nearly correct. The net effect of alcohol on gain or loss of body protein and fat in terms of total energy change is shown in column 13. The last two columns of the table show excellent agreement between energy expenditures obtained in two entirely different ways: by adjusting available energy of food intake for changes in amounts of body protein and fat, and by direct measurements of the heat given off by the body plus the heat equivalent of the muscular work performed (in the work experiments).
21

TABLE 12.—Effects on energy metabolism of replacing portions of dietary carbohydrate and fat by alcohol
Subject, diet, and experiment number
EO on a mixed diet: 9 Without alcohol «
10 With alcohol replacing 520 cal- ories from the diet (37 gm. fat, 45 gm. carbohydrate). '
EO on a mixed diet: 11 Without alcohol* 12 With alcohol replacing 512 cal-
ories mainly from carbo- hydrate.'
EO on a mixed diet: 24 Without alcohoH 22 With alcohol replacing 509 cal-
ories of sugar.' JFS on a mixed diet:
26 Without alcohol, supplement of 63.5 gm. butter, supplying 508 calories.*.
28 Without alcohol, supplement of 128 gm. cane sugar, supplying 507 calories.*
27 With alcohol« JFS on a mixed diet:
31 Without alcohol, supplement of 63.5 gm. butter, supplying 511 calories.*
29 Without alcohol, supplement of 128 gm. sugar, supplying 507 calories.*
30 With alcohol supplement (72 gm.), supplying 509 calories.'
Activity
(2)
Rest_-- do_
Work__ do_
Rest- .do.
do_
do_
do_
Work..
do.
do.
DaUy intake Daily N excretion
Nitrogen balance
Protein Energy Feces Urine»
(3) (4) (5) (6) (7)
Oramê 119.6 123.5
Calories 2,717 2,709
Orams 1.3 1.4
Orams 18.4 19.5
Orams -0.6 -1. 1
124. 1 120.6
3,862 3,891
2.2 1.3
18. 1 18.2
-.5 -.2
123.6 123.2
3,061 3,044
1.3 1. 1
ia2 18.5
+ .3 -f.2
99.6 2,490 1. 1 15.4 -.6
98.6 2,489 1.2 15.3 -.7
98.6 2,491 1. 1 15.7 -1.0
100.9 3,495 .8 15. 6 -.3
100. 1 3,487 .8 16.0 -.8
99.2 3,458 .7 17.3 -2. 1
Gross heat values
Determined for-
Feces
(8)
Calories 142 127
219 136
116 114
106
112
97
91
93
71
Urine
(9)
Calories 149 147
133 130
136 138
128
128
124
129
134
140
Excreted alcohol
(10)
Calories
11
15
Calculated for gain or loss of body tissue *
Protein
(11)
Calories -20 -38
-17 -6
+ 10 + 8
-20
-26
-35
-13
-28
-74
Fat
(12)
Calories + 174 + 200
-374 -302
+ 561 + 589
+ 233
+ 208
+ 174
-151
-227
-163
Net change
(13)
Calories + 154 + 162
-391 -308
+ 571 + 597
+ 213
+ 182
+ 139
-134
-255
-237
Energy value of material oxidized
in body
Energy of net
income 4— (cols.
8+94-10+ 13)
(14)
Calories 2,272 2,265
3.901 3,922
2,238 2,180
2,043
2,067
2,125
3,439
3,515
3,479
Body heat loss plus
heat equivalent
of work
(15)
Calories 2,309 2,283
3,932 3,927
2,272 2,258
2,085
2,079
2,123
3,420
3,589
3,470

JFS on a mixed diet: 32 Without alcohol, supplement of
63.5 gm. butter, supplying 510 calories.*
34 Without alcohol, supplement of 128 gm. sugar, supplying 507 calories.*^
33 With alcohol supplement (72 gm.), supplying 509 calories.*
do_.. 100.5 3,487 1.2 15.7 -.8 142 119 -14 -333 -347 3,573
do-. 99.7 3,493 1.2 16.7 -1.9 126 126 -54 -334 -388 3,629
do.__ 99.7 3,486 1.2 17.3 -2.5 125 129 5 -76 -366 -442 3,669
3,565
3,587
3,632
Ï Includes 0.2 gm. nitrogen per day from loss in perspiration for work experiments 11, 12, 29, 30, 31, and 0.4 gm. nitrogen per day for work experi- ments 32, 33, and 34. No correction for nitrogen loss in perspiration during rest experiments.
2 In these experiments the heats of combustion used by Atwater and Bene- dict were 5.65 calories per gram of body protein, and, except in experiments 9 and 10, 9.40 calories per gram for body fat; in experiments 9 and 10, 9.54 calories per gram of body fat was used.
3 Atwater, W. O., and Benedict, F, G. Bui. 69, 1899. (Rev. ed.) (IS)
* Atwater, W. O., and Benedict, F. G. Bui. 109, 1902. (14)
« Atwater, W. O., and Benedict, F. G. National Academy of Science Sixth Mem., vol. 8, 1902. (la)
U. S. Dept. Agr. Off. Expt. Stas.
U. S. Dept. Agr. Off. Expt. Stas.
€0

A comparison of the experiments with and without alcohol (column 13) indicates that within each group, when 72 grams of alcohol (509 c^ories) replaced an approximate calorie equivalent of fat and/or carbohydrate, the calculated net gain or loss of energy value in the form of body tissue was sometimes a little larger and sometimes a little smaller than the change calculated for the comparable experiments when no alcohol was included. In these six groups of experiments the calculated calorie change of body tissue varied from an additional gain of 83 calories to a larger loss of 95 calories as compared with the
corresponding nonalcohol experiment. Under the conditions of these experiments Atwater and Benedict concluded that alcohol must have been used by the body about as efficiently as the nutri- ents from ordinary food it replaced. In the most extreme case, alcohol calories were only about four-fifths as well used as the food calories which alcohol replaced. These experiments do not prove but suggest that under the conditions comparable to those in these experiments much of the energy of alcohol can be used in the body for internal or muscular work.
PART Hi. DERIVATION OF CURRENT CALORIE FACTORS Since Atwater first proposed his individual food
group factors and his general factors for estimating the fuel value of mixed diets as a whole {17), enough data for a niunber of foods have accumu- lated to make possible some revisions and addi- tions. For other foods more data are urgently needed.
Prior to 1947 the Bureau of Human Nutrition and Home Economics had summarized the available information on digestibility by man of bread made from wheat of three levels of extrac- tion and had compiled preliminary material for potatoes. Since then, study of the scientific literature has been continued, permitting the addition of coefficients of digestibility for many more items. Data from the digestibility studies reviewed are given in appendix tables 23 and 24. The resulting sunmiary of data on human digesti- bility and heat of combustion needed for deriving specific calorie values of individual items of food or of small food groups is given in table 13. Where fm*ther information was lacking, Atwater's data were taken from the revised figures for col- umn F iji table 10 of his report cited above and reproduced as table 7, page 10. The figures in columns 4, 7, and 10 are the specific factors to be applied to the grams of protein (nitrogenous material), fat (usually ether extract), and carbo- hydrate (determined by differences) in the food to obtain the physiological energy value.
Before discussing the derivation of the specific calorie factors shown in table 13, a few general observations should be made regarding the basis of the data.
The basis for the coefficients of digestibility in table 13 could have been broadened greatly, if the large volume of work with experimental animals in the literature had been included. Some work has been done to compare digestibilities of man and experimental animals. Brierem and Nico-
laysen {30) compared utilization of protein and dry matter in wheat and rye brans by man with utilization by sheep and swine. Later Crampton and others {4.3) compared man^s use of several grain products with that of rats, sheep, and swine. However, there is insufficient evidence at present for concluding that digestibility of nutrients by experimental animals can be used to predict that of man. If a relationship could be established, research in this field could proceed more economi- cally and more rapidly.
The energy factors shown in table 13 do not rest on equally reliable information. The number of subjects for different foods varied considerably. In general, no information was available on the possible departure of the test diet from the previ- ous dietary pattern. Lack of uniformity was observed in the experimental procedures used, including lengths of the preliminary and experi- mental periods, choice of marker, and the relative proportion of the diet furnished by the test food. The foods tested, expecially in the early digestion experiments, were not always adequately de- scribed, nor was the chemical composition of the sample always reported. In some cases, reason- able assumptions could be made as to the identity of the samples. For a few foods neither descriptive nor composition data were reported by the investigators, and energy factors derived from digestibility data in those experiments may be shown by future work to need considerable revision. Grain products of various degrees of milling as described some 50 years ago have presented particularly knotty problems. Although the products were identified by extraction and other recognized milling terms, composition data in addition were necessary to classify them in terms of the most nearly comparable products on the market today.
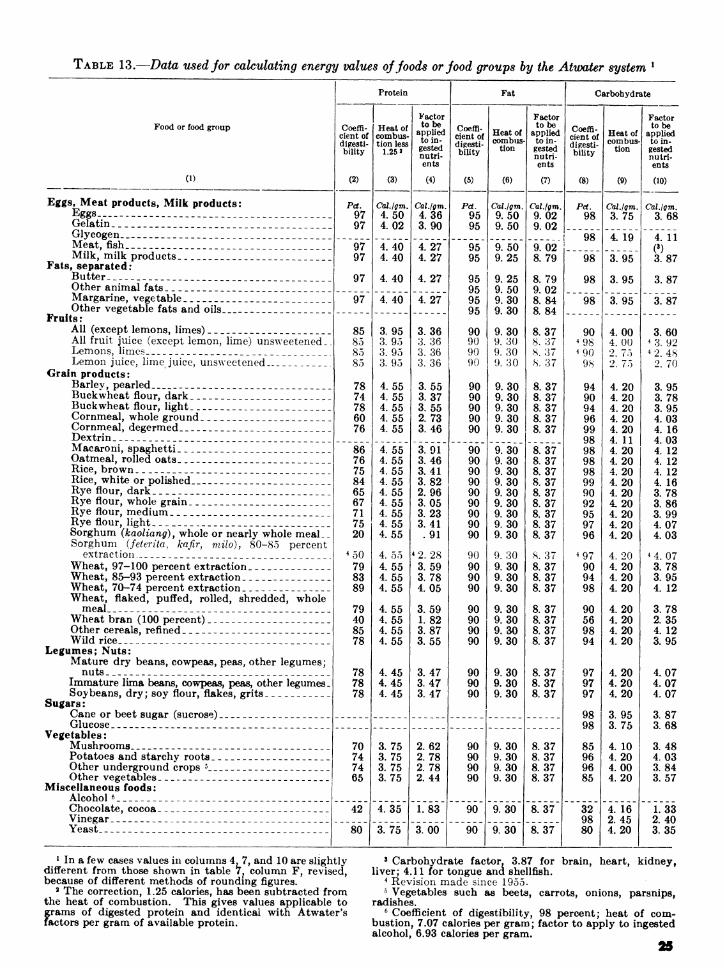
TABLE 13.—DaUi usedjor calculating energy values of foods or food groups by the Atwater system *
Food or food group
(1)
£¿gs, Meat products, Milk products: Eggs Gelatin Glycogen Meat, fish Milk, milk products
Fats, separated: Butter Other animal fats Margarine, vegetable Other vegetable fats and oils
Fruits: All (except lemons, limes) All fruit juice (except lemon, lime) unsweetened. Lemons, limes Lemon juice, lime juice, unsweetened
Grain products: Barley, pearled Buckwheat flour, dark Buckwheat flour, light Cornmeal, whole ground Cornmeal, degermed Dextrin Macaroni, spaghetti Oatmeal, rolled oats Rice, brown Rice, white or polished Rye flour, dark Rye flour, whole grain Rye flour, medium Rye flour, light Sorghum (kaoliang) ^ whole or nearly whole meaL. Sorghum (feterita, kafir, milo), 80-85 percent
extraction Wheat, 97-100 percent extraction Wheat, 85-93 percent extraction Wheat, 70-74 percent extraction Wheat, flaked, puffed, rolled, shredded, whole
meal Wheat bran (100 percent) Other cereals, refined Wild rice
Legumes; Nuts: Mature dry beans, cowpeas, peas, other legumes;
nuts Immature lima beans, cowpeas, peas, other legumes . Soybeans, dry; soy flour, flakes, grits
Sugars : Cane or beet sugar (sucrose) Glucose
Vegetables : Mushrooms Potatoes and starchy roots Other underground crops ^ Other vegetables
Miscellaneous foods: Alcohol 6 Chocolate, cocoa Vinegar Yeast
Protein
Coeffi- cient of digesti- bility
(2)
Pd. 97 97
Heat of combus- tion less
1.25 2
(3)
Factor tobe
applied to in- gested nutri- ents
(4)
Cal.fgm. 4.50 4.02
97 97
97
97
85 85 85
78 74 78 60 76
86 76 75 84 65 67 71 75 20
'50 79 83 89
79 40 85 78
78 78 78
70 74 74 65
4. 40 4.40
4.40
4. 40
3.95 3. 95 3. 95 3. 95
4.55 4. 55 4.55 4.55 4. 55
4.55 4.55 4.55 4.55 4.55 4.55 4.55 4.55 4.55
4. 55 4.55 4.55 4.55
4.55 4.55 4.55 4.55
4.45 4.45 4. 45
3.75 3.75 3.75 3.75
Cal.lgm. 4.36 3.90
4.27 4.27
4.27
4.27
3.36 3. 36 3. 36 3.36
3.55 3.37 3.55 2.73 3. 46
3. 91 3.46 3.41 3.82 2.96 3.05 3.23 3.41 .91
4 2. 28
3.59 3.78 4.05
3.59 1.82 3.87 3.55
3.47 3.47 3.47
Fat
Coeffi- cient of digesti- biUty
(5)
Pet. 95 95
95 95
95 95 95 95
90 90 90 90
90 90 90 90 90
Heat of combus-
tion
(6)
Caljgm. 9.50 9.50
2.62 2.78 2. 78 2. 44
42
80
4.35
3,75
1.83
3.00
90 90 90 90 90 90 90 90 90
90 90 90 90
90 90 90 90
90 90 90
90 90 90 90
90
90
9.50 9.25
9.25 9.50 9.30 9.30
9.30 9. 30 9. 30 9. 30
9.30 9.30 9.30 9.30 9.30
9.30 9.30 9.30 9.30 9.30 9.30 9.30 9.30 9.30
9. 30 9.30 9.30 9.30
9,30 9.30 9. 30 9.30
9.30 9.30 9.30
9.30 9.30 9.30 9.30
Factor to be
applied to in- gested nutri- ents
(7)
Caljgm, 9.02 9.02
9.02 8,79
8.79 9.02 8. 84 8. 84
8.37 8. 37 8. 37 8. 37
8.37 8.37 8.37 8.37 8.37
8.37 8.37 8.37 8.37 8.37 8.37 8. 37 8.37 8.37
8. 37 8.37 8.37 8.37
8.37 8.37 8.37 8.37
8.37 8.37 8.37
9.30
9.30
8.37 8.37 8.37 8.37
Carbohydrate
Coeffi- cient of digesti- bility
Í8)
8.37
8.37
Pet. 98
98
'98'
98
'98'
90 '98 '90 98
94 90 94 96 99 98 98 98 98 99 90 92 95 97 96
'97 90 94 98
90 56 98 94
97 97 97
98 98
85 96 96 85
Heat of combus-
tion
(9)
Caljgm 3.75
4. 19
3."95
3.95
3.'95
32 98 80
4.00 4. 00
4. 20 4. 20 4.20 4.20 4. 20 4. 11 4. 20 4. 20 4. 20 4.20 4. 20 4.20 4. 20 4.20 4. 20
4. 20 4. 20 4.20 4.20
4.20 4. 20 4.20 4. 20
4. 20 4.20 4.20
3.95 3.75
4. 10 4.20 4.00 4.20
4. 16 2. 45 4.20
Factor to be
applied to in- gested nutri- ents
(10)
Cal.lgm. 3.68
4. 11
3.87
3.87
"3.87
3.60 ' 3. 92 4 2.48
2. 70
3.95 3.78 3.95 4.03 4. 16 4.03 4. 12 4. 12 4. 12 4. 16 3.78 3.86 3.99 4.07 4.03
M. 07 3.78 3.95 4. 12
3.78 2.35 4. 12 3.95
4.07 4.07 4.07
3.87 3.68
48 03 84 57
1,33 2.40 3.35
^ In a few cases values in columns 4, 7, and 10 are slightly different from those shown in table 7j column F, revised, because of different methods of rounding figures.
* The correction, 1.25 calories, has been subtracted from the heat of combustion. This gives values applicable to grams of digested protein and identical with Atwater's factors per gram of available protein.
' Carbohydrate factor, 3.87 for brain, heart, kidney, liver; 4.11 for tongue and shellfish.
^ Revision made since 1955. 5 Vegetables such as beets, carrots, onions, parsnips,
radishes. ^ Coefficient of digestibility, 98 F>€rcent; heat of com-
bustion, 7.07 calories per gram ; factor to apply to ingested alcohol, 6.93 calories i>er gram.
Physiological Fuel Values of Foods of Animal Origin
For determining physiological fuel values of foods of animal origin, Atwater's factors for the dif- ferent categories are still being used with only slight changes. His coefficient of digestibility of 97 percent for the protein of meat, fish, eggs, and dairy products has been used without change in this publication (see table 7).
Many items of animal origin contain small amounts of carbohydrate to which Atwater applied the energy factor 3.82 calories per gram. He obtained this using 3.90 calories as heat of combustion and a coefficient of digestibility of 98 percent. Some small revisions in this factor are indicated in view of current information on the form of carbohydrate predominating in the dif- ferent kinds of foods of animal origin. These revisions, which are very minor, are noted in the following paragraph.
For the carbohydrate of milk and milk products, we have used for the physiological energy factor, 3.87 calories per gram. This is based on the heat of combustion for lactose, 3.95 calories per gram, and Atwater's coefficient of digestibility, 98 percent.
Eggs contain a small amount of carbohydrate, chiefly glucose, bound in a large complex. The
energy factor used in this publication, 3.68 calories per gram, was obtained by applying the coefficient of digestibility, 98 percent, to 3.75, the heat of combustion of glucose. Perhaps this figure is too low for simple sugars which require no digestion.
Appreciable amounts of glucose and glycogen have been found in tissue of brains, heart, and glandular organs, the relative amounts varying according to metabolic conditions at the time of slaughter and conditions of storage. For heat of combustion, 3.95 calories per gram, a figure inter- mediate between the heats of combustion of glucose and glycogen, has therefore been selected, resulting in a physiological energy factor of 3.87 calories per gram.
Analyses have shown glycogen to be the main carbohydrate constituent of tongue and some kinds of shellfish. Hence, to derive an appropriate energy factor, we applied the coefficient of digesti- bility, 98 percent, to 4.19, the heat of combustion of glycogen, and the resultant factor was 4.11 calories per gram.
For animal fats we have used Atwater's energy factors, 8.79 calories per gram for fats in dairy products and 9.02 for fats from other animal sources.
Physiological Fuel Values of Plant Products
Separated fats of plant origin are important items today but were practically unknown 50 years ago. For them we have used the digesti- bility coefficient, 95 percent, that Atwater used for butter and other animal fats. For the heat of combustion of fat in plant products, whether or not separated, we have continued the use of Atwater^s factor, 9.3 calories per gram.
Margarine as manufactured in the United States of America may be made of either animal or vegetable fats, and a few States have laws requiring a specified high proportion of animal fats. However, as most margarine in this country is made with vegetable oils, the factor 8.84 calories per gram for fat in margarine shown in table 13 was based on heat of combustion of 9.3 calories per gram and a coefficient of digestibility of 95 percent. Margarine of either type and butter contain small amounts of protem and carbo- hydrate carried over from the milk in which the fats were blended or chm-ned. The calorie factors for protein and carbohydrate of milk were used for those constituents of margarine.
For fat as it occurs in cereals and other plant sources Atwater assumed the apparent digesti- bility to be 90 percent and we have continued this practice. The energy factor for fat in plant foods is therefore assumed to be 8.37 calories per gram.
The revisions we have made in the Atwater factors for the physiological fuel values of protein and carbohydrate of plant products have resulted
mainly from adding data from a comprehensive review of digestibility studies reported since 1875. For a few foods the revisions result from changes in the heat of combustion factors used. More specific energy factors, together with the average coefficients of digestibility and heats of combustion from which they were derived, are presented in table 13. The basis for the differences in these figures as compared with Atwater^s factors for food groups is discussed in the remainder of this section. In some instances the values may prove to need further revision as the result of future research, but we believe them to be better ap- proximations for individual foods than either the general, overall factors or the food group factors that were developed in 1899. The basic data on digestibility from which the factors were obtained have been compiled in table form (appendix table 23).
This compilation is not entirely complete for studies reported in foreign languages, but we beheve it covers the bulk of early and recent research in which apparent digestibility of the test food was measured. Articles in which apparent digestibility was not reported or could not be calculated for the test food alone were not in- cluded. By this criterion, digestion experiments such as those of F. Erismann {52) were excluded. His coefficient of digestibility for protein has been quoted by various authors in early publications as applying to peas, but a translation of the original
26

article shows that the coefficient was apphed to bread made of 50 percent pea meal and 50 percent rye flour without adequate basis for calculating the digestibility of the pea meal alone. Included in the compilation are several experiments which contribute useful information although for various reasons they have been excluded from the data used for obtaining average coefficients.
The derivation of the energy factors in table 13 is discussed in the following paragraphs by food groups since foods within a group have certain characteristics and problems in common. Where no mention is made of the derivation of factors, Atwater's data considered most applicable to the particular item or small food group have been used.
Products of wheat
By far the largest proportion of the digestion experiments reported have been concerned with foods of the cereal group. Of the cereal foods wheat has been studied in most detail.
Flours
Digestibility of wheat flour was studied first by Rubner and other European scientists during the latter part of the 19th century. As milling practices and the terms used have changed over the years, we encountered problems in deciding how to combine and group the large volume of data on the digestibihty of wheat flours. Wheat flours milled commercially and experimentally have been studied extensively since 1900, par- ticularly in the United States and in Great Britain. For a great many of these flour samples, enough information is available so that the flours can be arranged in three groups according to degree of extraction from the kernel. These three groups were described by United States scientists in the early part of the 20th century as graham, entire wheat, and as straight or standard patent. Not all the terms used then still apply but the data are usable.
Graham was essentially whole-wheat meal, but may have had a very small amount of coarse material removed. The straight and standard patent flour group contained the first and second patent flours and the first clear flour and made up about 70 to 72 percent of the wheat kernel, which is in line with modern-day yields of straight grade flour. Data on the composition of the straight patent flours used in the early experiments when reported also indicated that from the stand- point of proximate constituents the straight patent flours were similar to those produced in recent years. In some instances the standard patent was blended with small amounts of the low-grade flours, second clear and red dog.
More variation existed in the flours included in those of the intermediate extraction. The so- called entire-wheat flour as described by Woods and Merrill {194) included patent, first clear,
second clear, red dog, and shorts, indicating that it may have been somewhat more than 85 percent of the kernel. For comparison, the average mill- ing yields from several commercial milhngs of cleaned wheat reported in 1941 by Sherwood and others {160) have been included here as follows:
_ _.„ , ^ Percent Milled fraction: yield
Patent flour 53. Q First clear flour " 7^0 Second clear flour " 45 Red dog flour 4.0 Germ ^ 2 Shorts 12! 3 Bran ~..V.V... 9! 0
If it could be assumed that the sum total of the fractions comprising the entire-wheat flour of the early experiments was comparable to the fractions reported by Sherwood, theoretically the yield of entire-wheat floiu* would have been close to 91 percent. Usually the entire-wheat floiu* was re- ferred to as being of about 85-percent extraction. Probably this was a Uttle low. Woods and Mer- rill {19JÇ) stated that 100 pounds of cleaned No. 1 wheat would make 85 to 88 pounds of entire-wheat flour, that the large mills gave rather larger yields than small mills, and that a starchy wheat yielded 1 to 3 pounds more than a hard wheat. They also stated that the ash content of the entire-wheat flour was about half that of the whole-wheat flour.
Snyder {I64, 166, 168) also conducted experi- ments in that period and used entire-wheat flours, but the indications are that the flours he used were of somewhat longer extraction than those described by Woods and Merrill. The flours of longer extraction were obtained by removal of part of the coarser bran by screening and the inclusion of fine bran, shorts, and germ. The amount of coarse bran removed varied from a small proportion to over half the total amount present. Data he reported showed that the ash content of the entire-wheat samples ranged from 51 to 92 percent of that in the wheats from which they were milled. In view of this kind of infor- mation it is likely that entire-wheat flour repre- sented about 90 percent of the cleaned wheat. The latter figure was also arrived at independently by a milling expert in the United States Depart- ment of Agriculture who estimated the probable extractions of a number of samples of entire-wheat flour from their ash contents in relation to the ash content of the whole-wheat from which each was miUed.
Since such estimates may be more or less in error, and since the information on the milling and composition of the flours suggests that the entire-wheat flour was not always of uniform extraction, we have considered it preferable in this pubhcation to assume that the data applied to flours within the range of 85- to 93-percent extrac- tion. Likewise for floiu^s designated as standard patent we have assumed that the data applied to flours of 70- to 74-percent extraction. ' With re-
27

gard to the whole-wheat or graham flours used in the early studies, it has been assumed that flour so designated may have been of from 97- to 100- percent extraction, since there was some evidence that a small amount of the outer portion of the kernel may have been removed.
The average coefficients of digestibility of pro- tein and of carbohydrate for wheat flours of these three extraction ranges are based on more than 70 digestibihty trials on whole-wheat and near whole wheat flours, more than 50 trials on wheats of intermediate extractions, and over 100 digesti- bility trials on straight and patent flours. The average coefficients of digestibility are shown in table 14. The variation in digestibility found for the protein of wheat was much greater than that for the carbohydrate, and there was greater varia- tion in the digestibility of longer extraction flours than for refined flours of shorter extraction.
The wheat samples used in the digestibility studies were largely hard wheats, both spring and winter varieties; a few soft wheats were included. Data on proximate composition were available for the whole-wheat flours used in 18 digestibility trials, for the flours of intermediate extraction in 22 trials, and for the straight and patent flours in 28 trials. Average values for the flours of known composition are shown in the first colunrn of table 14. Within each of the three groups there was much variation. The protein content of the whole-wheat samples, for example, ranged from 8.5 to more than 15 percent, the majority containing over 12 percent. At present, data are inadequate to determine to what extent variation observed in digestibility within groups and between groups may have been due to differ- ences in protein and carbohydrate content of the flours.
TABLE 14.—Energy values of wheat Hours calculated by use of specific energy factors for protein^ fat^ and carbohydrate
Type of flour
(1)
Essentially whole wheat ^ (97-100 percent extraction) : Protein (N X 5.83) Fat Carbohydrate by difiference
Total-
Intermediate extraction (85-93 percent) : ^ Protein (N X 5.7) Fat Carbohydrate by difference
Total-
Patent 2 (70-74 percent extraction) : Protein (N X 5.7) Fat Carbohydrate by difference
TotaL
CompositiOD '
(2)
Percent 12. 6 1.9
71.8
12. 0 1.8
73.0
11.7 1. 3
74.5
Coefl5cient of digestibility
(3)
Percent 79
< 90 90
83 * 90
94
89 * 90
Energy value of available
nutrient
(4)
Cal.lgm. 3 4. 55
9.30 4,20
3 4. 55 9. 30 4.20
3 4. 55 9.30 4. 20
Energy fac- tors to be applied to ingested nutrients
(col. 3 X col. 4)
(5)
Cal.lgm. 3. 59 8.37 3. 78
3. 78 8.37 3. 95
4.05 8.37 4. 12
Available energy of food using specific factors (col. 2
X col. 5)
(6)
Cal.llOO gm. 45. 2 15.9
271. 4
332.5
45. 4 15. 1
288. 4
348. i>
47. 4 10.^
306.^
365.2
1 Composition data are calculated to a 12-percent moisture basis.
2 The ash content found for the wheat flours are 1.7 percent for essentially whole wheat, 1.2 percent for wheat of intermediate extraction, and 0.5 percent for patent flour.
3 1.25 calories have been deducted from the heat of combustion of 1 gram of protein to correct for loss of incompletely metabolized products in the urine.
* Assumed coefficient of apparent digestibility for fat in plant products, 90 percent, used because actual data for wheat were unsatisfactory.
The average digestibility of the protein and of the carbohydrate for any one type of flour of known chemical composition showed differences of less than 1 percent from average coefficients of di- gestibility obtained by using data from all of the samples of that type. The coefficients based on all the samples within the group, therefore, were used for deriving the energy factors shown in table 14. It is unlikely that the heat of com- bustion value would be the same for the nitroge-
nous portion of flours of different extraction rates. The relative proportions of protein and nonprotein. nitrogen compounds and the composition of ther protein fraction itself are each known to vary. These changes would be expected to affect the heat of combustion and hence the energy factors also. However, in preparing table 14, no attempt was made to adjust the heat of combustion data for differences in the heat values of the protein or fat mixtures in the flours of different extractions.
28

Energy values for flours at each of the three extractions have been worked out from the com- position data of the known samples. The results, shown in the last column of table 14, are con- sidered suitable for flours of the extractions and compositions specified.
From time to time calorie values for flours of other extractions are needed. To estimate co- efficients of digestibility for protein and carbo- hydrate in such flours, the digestibility data estimated at the three extraction rates, 100, 90, and 70 percent, for the wheat flours just discussed were used. This was done inasmuch as the few scattered digestion experiments reported on flours of other specified extractions of wheat were so varied in conditions and methods that the results were not usable for this purpose. The relation- ship between the percent extraction and coefficient of digestibility of wheat can be expressed in the form of the equation y=a-^bx+cx^j where a:=per- cent extraction and 2/=coeflScient of digestibility. By the method of least squares the constants for this equation, fitting the three points based on average digestibility data for wheat of 100-, 90-, and 70-percent extraction, were as follows for protein and carbohydrate:
Equation constant Value of constant
Protein Carbohydrate
a - - - - 0.890 . 00233
-. 0000333
0. 700 h . 00867 c_ _ __ - -- - - -. 0000667
Digestibility coefficients (y) for other extraction percentages (x) were computed by solving the equation.
From this equation, coefficients of digestibility of protein and carbohydrate were calculated for flours of 95-, 85-, 80-, and 75-percent extraction. The values found are shown in table 15. Addi- tional intervening points may be determined from the equation or read from a curve. For conven- ience the energy factors to apply to the protein and carbohydrate in wheat flours of the specified extractions are also included in table 15.
Degree of extraction has been accepted here as the most important influence on digestibility of wheat flour. To test this assumption an estimate was made of the extent to which rate of extraction was associated with coefficients of digestibility. The relationship of these two, based on those subjects for whom data were available at each of three extraction rates, was found to be represented by an equation of the form y=a-{-bx+C7:^j where the extraction rate is the independent variable. IP, the variance, was 44 percent, showing that almost half of the variation in the coefficient of digestibility was associated with variation in extraction. This indicates that the assumption was warranted since 56 percent of the variation
remained to be distributed among such factors as level of protein intake, level and nature of carbo- hydrate, length of experimental period, the varia- tion characteristic of each subject, and fineness of grind of the flour.
TABLE 15.—Apparent digestibility and physiological juel value oj wheat flours
Percent Extraction
Coeflacient of digesti- bility Specific energy factor
Protein Carboliy- drate Protein Carbohy.
drate
100 95 90 85 80_ - _ _ _-
Percera 79
(81) 83
(85) (86) (88) 89
Percent 90
(92) 94
(96) (97)
' (98) 98
Cal./gm. 3.59 3. 69 3.78 3. 87 3.91 4.00 4. 05
Cal./gm. 3.78 3. 86 3.95 4.03 4. 07
75 4. 10 70 4. 12
1 97.5 by calculation from equation, page 29.
Since 1945, when the relationship between coefficient of digestibility and degree of extraction were worked out rather hastily for wheat of 100-, 90-, and 70-percent extractions, some additional data have been located in the literature and others have become available as the result of more recent research. The inclusion of these additional values did not warrant any change in the coef- ficients of digestibility published earlier (55, 118)^ and we have continued to use them.
Methods of determining energy values used in Great Britain.—McCance and his associates have given special attention to assessing the energy values of cereals {102, 104, 108). They differ- entiated between available and physiological calories and as both procedures differ from the one used in this country and as certain of the terms have different meanings we include here a brief discussion of their work—particularly as it relates to wheat.
The consideration given carbohydrate haa been an important difference between the systems for estimating energy used by English and American scientists. Data on carbohydrate in British tables of food composition are based on ^^available carbohydrate/' which includes sugars^ starches, and dextrins—carbohydrates assumed to be fully utilized by the body, but exclude as un- available, fiber and nonfermentable sugars or pentoses. The analytical determination of avail- able carbohydrate has been discussed by McCance and Lawrence {103).
Available calories as calculated by McCance are the sum of the gross calories in the available carbohydrate fraction of the food, plus the calories from fat after deduction for fecal lipids, plus the calories from protein after deduction for fecal and urinary losses of nitrogenous matter. In principle this procedure is similar to that used
493-791 O - 73 - 29

in this country but the method for determining available calories from carbohydrate is different; also there are some differences in the actual calorie factors selected for protein and fat.
To illustrate how the calorie factors for the calculation of available calories are obtained, data are presented here from a study of McCance and Walsham {104). Digestion and utilization of calories of two samples of whole-wheat flour, one made from a low-proteiu English wheat and the other from a high-protein Canadian wheat were determined for adult subjects. The calorie factors for protein were found by applying the coefficients of apparent digestibility of protein found in these digestion experiments to the factor 4.35 calories per gram (5.65 less 1.3 calories per gram for urinary loss) used by Sherman {158) for the heat of com- bustion of protein in a mixed diet. The apparent digestibility of protein was found from the experi- ment to be 84.9 percent for the Canadian flour and 74.2 percent for the English flour.
The calorie factor for fat was obtained by apply- ing 58 percent, the coefficient of apparent digesti- bility found for fat, to 9.45 calories the heat of combustion per gram of fat in a mixed diet {158). From these experimental data the calorie factors to be applied to analytical data on the content of protein and fat to obtain the calories from these nutrients in the two samples of flour were thus found to be 3.65 and 5.5 calories per gram, respectively, for the Canadian and 3.21 and 5.5 calories per gram for the English wheat flours. Calories from carbohydrates were obtained by applying the gross calorie factor for starch, 4.2, to data on content of '^available carbohydrate'* expressed as starch for each wheat.
Physiological calories as calculated by McCance include only the gross calories from those fractions of the nutrients which definitely may be con- sidered usefully available. Provision is made for excluding urinary calories, a loss resulting from incomplete combustion of protein, but no deduc- tion is made for nitrogenous matter in feces; like- wise no deduction is made for fecal fat. The fraction of the carbohydrate measured is con- sidered completely available. It is treated in the same way for determining physiological calories as in the determination of available calories—the fraction of questionable value as a source of energy is excluded and a gross heat value is used with the data on available carbohydrate content. For use in food tables physiological calories are the values McCance considers most suitable {102, 104, 108), because, as he has pointed out {107), it is unusual to make allowance for losses in the feces in pre- senting data on composition of foods.
Physiological calories based on data from the experiment with the two whole-wheat flours were calculated to be the sum of the calories from carbohydrate obtained in the same way as for available calories above, plus the gross calories from fat (9.4 X grams of fat in the wheat sample) present in the food, plus the gross calories from
protein present with a deduction for urinary loss (4.35Xgrams of protein content in the wheat).
Data reported by McCance and Walsham from this study for gross, available, and physiological calories for the two samples of whole-wheat flour (15 percent moisture) were as follows:
Type of data Canadian wheat
English wheat
Gross calories: Food (bomb) ..
Calories 372
-45
-17
Calories 350
Fecal (bomb) — 40 Urinary loss (1.3 X net absorbed
N) — 8
Available calories (from above) Available calories calculated by
McCance procedure _ _ _ _ _ _
310
299
320
302
304 Physiological calories calculated by
McCance procedure 320
Additional calculations of energy values.— Using data from the same study, McCance and Walsham also made two additional energy cal- culations—one attributed to the Atwater pro- cedure and one in which energy factors for wheat used by Food and Agriculture Organization were applied. We have not included results for these two calculations for two reasons. The application of the general calorie factors for pro- tein, fat, and carbohydrate of a mixed diet to a specific food is not a procedure used by Atwater. Moreover, McCance and Walsham do not report values for ash content and thus it is not possible to determine the total carbohydrate (by difference), a value needed to use the Atwater procedure correctly. When assumed figures for ash suggested by the authors were used, gross calories calculated from composition were observed to differ from bomb determinations by 15 calories per 100 grams in the case of Canadian wheat and 24 calories per 100 grams in the case of English wheat. In view of the close agreement previously reported (p. 6) between calculated values for gross calories and bomb calorimeter determinations, the dis- crepancies of 4 percent for the Canadian and 7 percent for the English wheat seem too large to warrant the use of these assumed figures for a comparison between the two methods of calcula- tion.
We have not located any reports in the literature in which adequate data are given for evaluating the two methods of assessing available calories in foods—the McCance procedure outlined above and the Atwater procedure as we use it. For a correct appraisal of the two methods by means of digestion experiments, the following data are essential: (1) Chemical composition of the food samples, which should include moisture content, nitrogen compounds, fat, ash, carbohydrate by difference, and available carbohydrate (starch and sugar); (2) bomb calorimeter determinations of the foods and excreta. Such an evaluation, if
30

made for other types of food as well as wheat, would provide very useful information.
Alimentary pastes; other iiour mixtures Macaroni and other alimentary pastes usually
are made with semolina or durum flour as the principal ingredient. This type of wheat has characteristics difi^erent from wheats used for preparing wheat flours for bakers and homemakers. Digestion experiments were carried out in 1905 by Snyder (168) and at an earlier date by several European scientists to determine the digestibility of macaroni and other kinds of alimentary pastes. Only in the study reported by Snyder was the flour used in making the pastes described in any detail. In this latter study the flour milled from durum wheat represented a somewhat larger portion of the kernel and was more granular in appearance than the patent flour used for bread making purposes. The average coeflicients of digestibility found for macaroni, 86 percent for protein and 98 percent for carbohydrate, seemed reasonable in view of other studies indicating that both degree of extraction and coarseness of grind affected the apparent digestibility, particularly of the protein, of flours.
The specific energy factors for protein and car- bohydrate calculated by use of these coefficients of digestibility and the heats of combustion of wheat flours were 3.91 and 4.12, respectively. The factors are considered applicable to the various alimentary pastes made from flour and water. Digestibility of those containing eggs or milk might be somewhat different, but as only small amounts of these optional ingredients are present separate factors are not proposed.
The digestibility of some other products in which flour is the main ingredient has been studied also. Deuel published results found for a variety of baked products including yeast breads, baking powder biscuits, cakes, cookies, crackers, and others (48). The coefficient of xligestibility of protein ranged from 85 to 94 percent and that for carbohydrate from 97 to 99 percent.
For flour mixtures that vary considerably with respect to ingredients, such as cookies, energy factors were calculated for each product, weight- ing the energy factors of each ingredient in propor- tion to the amounts present in the product. This procedure is explained in more detail on page 42.
Bran Differences in apparent digestibility between
whole-grain flours and those of short extraction suggested that bran might have a low coefficient of digestibility. Some investigations have been undertaken to determine the digestibility of bran alone, and while the results were variable, the co- efficients were in every case very low. The aver- age apparent digestibility found for the protein of bran was 40 percent based on 14 digestion experi- ments, and for carbohydrate, 56 percent based on
16 experiments. These coefficients were applied to the heats of combustion of protein (nitrogenous matter) and carbohydrate of wheat, and the energy factors obtained for the two nutrients after cus- tomary deduction for urinary nitrogen loss were 1.82 and 2.35.
Wheat breakfast foods Foods in this group have been studied in some
detail in digestion experiments, but as the experi- mental diets were low in protein the apparent digestibility as determined may have been too low. Hence, rather than use these data in esti- mating digestibility, we used the coefficients of digestibility of whole-wheat flour (table 13) to obtain tentative estimates for whole-wheat meals and other whole-wheat cereals. Likewise for farina and other breakfast foods made from the endosperm we used the coefficients of digestibility of patent flour. These factors would result in some overestimation of energy values for foods subjected to special processing that reduces utilization of any of the organic nutrients and possibly for meals of a coarser grind than that of wheat flour. For breakfast foods that are mix- tures, we derived weighted energy factors if we knew the kind and approximate proportions of ingredients.
Products of grain other than wheat
The digestibility and physiological fuel values of corn, oat, rice, and rye products have been studied less than wheat but more than most of the remain- ing grains.
Although information on the various cereals is not strictly comparable, on the whole it indicates that differences in digestibility may be expected among grains and that neither the fiber content nor the level of protein intake alone appears to be adequate basis to explain differences observed among cereals when fed to human subjects.
Spriggs and Weir (172) found the digestibility of the protein in a mixed diet containing bread made with white flour to be 91 percent, but when only a third of the flour was replaced successively by oatmeal, barley flour, fine sifted corn flour or rice flour the digestibihty was 87.6, 81.5, 86.7, and 89.7 percent, respectively. Jones and Water- man {77) observed significant differences in the extent to which proteins may be digested in vitro by pepsin and trypsin. They found that arachin, casein, and cooked phaseolin were 48, 61, and 58 percent digested and suggested that the order in which the amino acids were united to form the proteins might be responsible for the incomplete digestion; some linkages are more resistant than others to the hydrolytic action of digestive enzymes.
Other workers studying the physiological avail- ability of purified proteins have observed wide differences in the proportions of a given amino
31

acid in the feces of experimental animals, depend- ing on the protein fed. These and other studies indicate that among the various kinds of cereals considerable difference in digestibility and physi- ological fuel values may be expected. Digestibil- ity data from the literature for the various kinds of cereals have been summarized separately. The average coefficients of digestibility and the number of experiments on which each was based are shown in table 16. As more research becomes available these data will no doubt need revision. Data on wheat have been included in the table for ease in comparison.
TABLE 16.—Coefficients of apparent digestibility for grain products
Grain Product
Cornmeal, whole- ground, bolted
Cornmeal, degermed Oatmeal, rolled oats Rice, brown Rice,»white or milled Rye flour:
Dark. Whole-grain Medium Light
Wheat flour: Essentially whole
wheat, 97 - 100 percent extrac- tion
Intermediate, SO- GS percent ex- tion
Straight or patent, 70 - 74 percent extraction
Protein
Coeffi- cient of di- gestibUity
Percent 60 76 76 75 84
65 67 71 75
79
83
89
Experi- ments
Coeffi- cient of di- gestibUity
Number 3
21 48 22
119
0) 0) 0) (0
72
53
104
Carbohydrate
Percent 96 99 98 98 99
90 92 95 97
90
94
98
Experi- ments
Number 3
21 24 22
119
0) 0) (0 (0
72
53
104
1 Coeflñcients of digestibility for rye flours were derived less directly as explained on pages 33 and 34. Therefore, the number of experiments is not indicated.
Cornmeal The cornmeals studied have been of two general
types, whole meal, sifted through a 16-mesh sieve which may have removed a small amount of the bran, and degermed cornmeal which probably had most of the bran, as well as the germ, re- moved. In addition to the meals, digestibility data for several other corn products have been re- ported. Although most of these other studies were not used directly they have been included in appendix table 23 and were helpful in that the digestibiUty coefficients tended to confirm the averages for the two cornmeals shown in table 16. Data for only three digestion trials were found in which sifted whole-ground cornmeal was used. The average coefficient of digestibility of the meal eaten in the form of cornbread by three subjects
was close to 60 percent for protein and 96 percent for carbohydrate. These values are in line with digestibility coeflScients for field corn (pressure- cooked) and for hulled corn (hominy), which, judging by their fat and fiber content, must have contained the germ and more of the branny por- tion than degermed corn products. Degermed cornmeal prepared as mush or as cornbread has been used in several studies. Average coefläcients based on 21 digestibility trials were found to be 76 percent for protein and 99 percent for carbo- hydrate. Hence, the energy factors suggested and used here for protein and carbohydrate in whole grain corn products are 2.73 and 4.03 calories per gram, and in degermed corn products, 3.46 and 4.16.
Data on apparent digestibility of frozen raw cornmeal and toasted corn breakfast products also were found in the literature or could be calculated from the information reported by the authors. They have been recorded in appendix, table 23, for reference but for various reasons were not used in assessing the energy value of corn products.
Oatmeal Several studies have been made of oat products,
mainly oatmeal or rolled oats, which were either cooked and used as a porridge or baked as oat cakes. Also recorded in this appendix table but not used in obtaining average digestibility figures were a few experiments on ready-to-eat cereals.
Based on 48 digestibility trials, the average coefficient of digestibility for protein was found to be 76 percent and that for carbohydrate, based on 24 trials, 98 percent. As was the case with most of the cereals there was more variation in the coefficients of digestibility for protein than for carbohydrate. Using the average coefficients of digestibility, the energy factors for protein and carbohydrate are 3.46 and 4.12 calories per gram, respectively.
In most cereals the quantity of fat present is so small that the use of Atwater's assumed digesti- bility coefficient of 90 percent for fat in plant foods introduces very little error in the total energy value of the food. Oatmeal, which con- tains 7 to 8 percent fat on an average, has more fat than most cereals and its digestibility is of more significance. In 28 experiments in which the digestibility of fat in oatmeal has been reported or could be calculated from data given, the results have varied from 56 percent to complete digesti- bility. These values were largely from two studies, a recent report by McCance and Glaser, 1948 {102), and a much earlier article by Harcourt and Fulmer, 1907 {62). The range in digestibiUty of fat found by McCance and Glaser was 62.5 to 77.6 percent. In their experiments, six subjects were fed a mixture of two oatmeals, having an average fiber content of 0.9 percent, supplemented with a little bramble jelly or sirup. The daily intake of 34 to 67 grams of fat was supplied entirely by the oatmeal.
32

A very wide range, 57.6-97.9 percent, in the coefficients of digestibility for fat in oatmeal was calculated from data in 16 experiments published by Harcourt and Fulmer (62). These investi- gators tested four oatmeals with fiber contents of 1.94, 1.15, 1.12, and 1.04 percent. Seven subjects participated but not all subjects ate each of the four meals. The daily intake of 58-120 grams of fat was supplied by oatmeal and either milk or cream, with about one-fifth to one-third of the total contributed by oatmeal. For the purpose of calculating the digestibility of the fat in oat- meal from data supplied we assumed the digesti- bility of the fat of milk and cream to be 95 percent. To the extent that this average figure may not be applicable for these specific experiments there may be some error in our calculated results for oatmeal.
The data from Harcourt and Fulmer suggest that there may be some relation between digestibility and fiber content of oatmeal. When the oatmeals of both 1.94 percent fiber and lower fiber contents were fed to the same subjects under similar experi- mental conditions, the fat digestibility of the oat- meal of 1.94 percent fiber was lower than that of samples with the much smaller percentages of fiber. Of interest in this connection are results reported by McCance and Glaser (102) who found that the substance or mixture of substances which they estimated as fiber in oatmeal passed through the gut almost without change. The results raise several questions. Is intestinal motil- ity related to the fiber content of oatmeals and if so does this affect the digestibility of fat? To what extent do metabolic products account for fat (ether-extractable matter) in the feces? The ex- perimental evidence is inadequate either to inter- pret the widely divergent coefficients found or to determine which part of the range would be closer to the true value. The Atwater energy factor, 8.37 calories per gram of fat in cereals and other plant foods in general, therefore has been used without change for fat in oat products.
Rice The niost extensive study on digestibility of rice
was carried out in a series of experiments by Sugi- moto, Higuchi, Momyeda, Tonaka, Yasuda, and others and w^as pubhshed by Saiki in 1926 (178). The subjects, all Japanese men, ate rice as part of a niixed diet. The rice used was of four categories which were described in one of the articles as follows:
(a) Unpolished rice.—Rice from which the < husk had been removed, but which still retained the outer layer, or silver skin, and the embryo or germ.
(b) 50% polished rice.—Rice which had been milled and polished but which retained half of the outer layer and germ.
(c) 70% polished rice.—Rice which still re- tained about 30 percent of the outer layer and germ.
(d) Polished rice (white rice).—Rice which had been polished perfectly, so that the germ was almost entirely rubbed off in the milling.
The actual amounts of the rice kernel removed in the polishing differ somewhat with the variety of rice, but about 4 percent of the unpolished rice kernel was removed in making the half-polished rice, nearly 6 percent in making the 70-percent polished rice, and approximately 7 to 8 percent in making the fully polished white rice. According to one article in the series no polishing powder w^as used. Judging from other information given, the unpol- ished rice may have been the same as brown rice; the ha If-polished rice may be considered as an extraction of about 96 percent of the brown rice; the 70-percent polished, as an extraction of about 94 percent; and the polished rice, about a 92-per- cent extraction. On the basis of paddy or rough rice, which is a more common basis for expressing milling yields, the extraction rates, assuming the loss in removing the hulls to be 21 percent, would be about 79 percent for brown rice, 76 percent for half-polished, 74 percent for 70-percent polished, and 73 percent for polished white rice.
Rubner (144) and also Snyder (167) studied the digestibility of rice when eaten by men subjects as part of very simple diets. Probably the rice used was ordinary white rice but it was not de- scribed in either study. The number of experi- ments in which Europeans and Americans were subjects was too small to permit a good comparison but there appeared to be no marked difference in digestibility of the rice for the Japanese men who very likely were accustomed to eating it as a major item in their diet and for the German and American subjects who probably had it only occasionally.
The average coefficients of digestibility for the unpoUshed (brown) rice, based entirely on the Japanese studies, were 75 percent for protein and 98 percent for carbohydrate; for half-polished rice the coefficients were 82 and 99 percent, respec- tively, for the two nutrients, and for 70-percent pohshed rice, 83 and 99 percent. For white rice the average coefficients of digestibility based on data reported by Saiki, Rubner, and Snyder were 84 percent for protein and 99 percent for carbo- hydrate.
The energy factors we suggest for the protein and carbohydrate of brown rice are 3.41 and 4.12 calories per gram respectively, and for white rice, 3.82 and 4.16.
Rye Many of the digestion experiments on rye flours
were conducted years ago in Germany. In some studies the diet was simple rve bread or rye bread and beer. Some of the subjects who were un- accustomed to eating large quantities of rye bread experienced pain in the digestive tract and in some cases diarrhea, a factor that might vitiate the digestibihty figures. But on the basis of the data reported there was no clear-cut means of
33

eliminating this factor. In other experiments there was more variety in the diet but on the whole the diets were simple. Results indicate no appreciable differences in digestibility when sub- jects had rye bread alone or as part of simple mixed diets.
Rye flours have been described as dark, whole- grain meal, medium, and light, and the following data on their composition have been cited as being representative for these products (100^ 185) :
Constituent Dark Whole- grain meal
Medium Light
Water Percent 11.0 16.3
2. 6 2.0 2.4
68. 1
Percent 11.0 12. 1
1. 7 1.8 2.0
73.4
Percent 11.0 11.4 1.7 1. 1 1.0
74.8
Percent 11. 0
Protein _ _ __ _ 9. 4 Fat 1. 0 Ash _ . 7 Fiber . 4 Carbohydrate, total by dif-
ference 77. 9
As there are no standards of identity for these products, much variation may be expected in appearance and composition of samples of a given designation or grade. For example, li^t rye has been described as ranging from white to medium- light flour with a comparatively vvide range in proximate composition. In these circumstances, it was difficult to determine the t3rpe of flour used in the early digestibility studies. However, there is a marked decrease in fiber and ash content with increasing degree of refinement, and the ash content reported for the rye flours studied in the digestion experiments served as a criterion for deciding íA which of the above four categories— dark, whole-grain, medium, or light—to include the data.
Little information is available on digestibility of medium and dark rye flours. However, the relationship of the digestibilities of either protein or carbohydrate observed between the light and whole-gram rye flours was similar to that observed between the straight patent and whole-wheat flours. On the assumption that this similarity in ratios can be extended to include intermediate extractions of rye and wheat flours, digestibility values for other extractions of rye flour were imputed from ratios for wheat flours where data on rye flour were lacking. Ash content was taken as a general index of the degree of extraction of the flour. Thus for rye flours of the composition shown in Agriculture Handbook No. 8 {185) and described as dark, whole-grain, medium, and light we estimated the digestibility of protein as 65, 67, 71, and 75 percent and the corresponding digestibility of the carbohydrate as 90, 92, 95, and 97 percent, respectively. Using these coeffi- cients of digestibility and Atwater^s heats of combustion for cereals, the energy factors to apply to dark, whole-meal, medium, and light rye flour are, respectively, 2.96, 3.05, 3.23, and 3.41
calories per gram of protein and 3.78, 3.86, 3.99, and 4.07 per gram of carbohydrate.
Other grains
For grains and grain products not included in table 16, very few digestibility data are available. Among the reports on these products is one by Woods and Snyder {196) which summarizes the results of the digestion experiments on cereal foods at the Connecticut (Storrs), Maine, and Minnesota Agricultural Experiment Stations.
For pearled and flaked barleys^ Woods and Snyder applied their estimated coefficients of digestibility of barley products, 78 percent for protein and 94 percent for carbohydrate. These products had undergone some refinement and in chemical composition were much like modern pearled barley {185). The energy factors for Eearled barley, calculated from these coefficients
y use of the customary heat of combustion of grain products, are 3.55 and 3.95 calories per gram of protein and carbohydrate, respectively.
For buckwheat flour, ^Jarina,'^ and groatSy Woods and Snyder estimated digestibility at 78 percent for protein and 94 percent for carbohydrate. Their composition data indicated that the products were refined forms, the fat, fiber, and ash content of 1.2, 0.4, and 0.9 percents for the flour being comparable to composition of modern light buck- wheat flour. The above coefficients of digestibility applied to the heats of combustion for protein and carbohydrate in cereal products result in the following energy factors, 3.55 calories per gram of protein and 3.95 calories per gram of car- bohydrate.
For dark buckwheat flour, we have found no experimental work on digestibility. The figures in table 13 have been calculated arbitrarily from data for light buckwheat flour, assuming that the ratio of digestibility of dark to light flour would be the same as that between whole-wheat flour and wheat flour of intermediate extraction. Judging by the ash content, the light buckwheat flour may have been comparable in degree of refinement to wheat flour of intermediate extraction and the dark buckwheat flour to whole-wheat flour. The coefficients of digestibility thus assumed for dark buckwheat flour were 74 percent for protein and 90 percent for carbohydrate, and the energy factors were 3.37 and 3.78 calories per gram, respectively
For wild rice, data are also to be found in the summary by Woods and Snyder. They report the coefficients of digestibility to be 78 percent for protein and 94 percent for carbohydrate, which would result in energy factors of 3.55 and 3.95 calories per gram, respectively.
Sorghums and millets, while little used in this country for human consumption, are important foods in some parts of the world. In sections of the Far East, both grains are used extensively, frequently prepared as a mush or ground into meal and used in bread.
34
LangwortKj and Holmes (93) conducted experi- ments with the dual purpose of comparing the digestibilities of the different kinds of sorghums— kaoliang, feterita, kafir, and milo—and the digesti- bility of sorghums in general with that of other cereals, namely, wheat and corn. The grains were ground in the same mill and put through a 16-mesh sieve. By this treatment 5 percent of the bran was removed from kaoliang, 15 percent from feterita, 19 percent from milo, and 21 percent from kafir.
The differences in the structure of the grains probably account for the different amounts of the ground meals that passed through the 16-mesh sieve, being largest for the softer kaoliang which grinds more readily than the corneous types. The portions of the wheat and corn kernels removed was not stated. Each of the sorghums was used as bread or as mush; the corn and wheat as bread only.
In one of the kafir bread series the remainder of the diet consisted of milk, orange, and sugar. Otherwise, the diets in the bread series had in addi- tion to the bread, applesauce, butter, sugar, and in most cases, potato. In the series containing mush, the diet was similar except that potato was omitted so that essentially all of the protein would be supplied by the test food.
Whether a sorghum meal was served as bread or as mush appeared to have had little influence on its digestibility. The carbohydrate was well utilized in all the sorghums; the average digestibility for the kaoliang was 96 percent and the carbohydrate of the other sorghum meals was as well or better utilized. Using 96 percent and 4.20 calories per gram as the heat of combustion, the energy factor for carbohydrate is 4.03.
The digestibility of the protein was extremely variable but considerably lower than that found for the protein in either wheat meal or cornmeal. Feterita and kafir, both hard corneous types of sorghum, showed similar average protein digesti- bility, approximately 50 percent. Milo is a some- what softer type with a larger proportion of starchy endosperm; its average protein digestibility was about 40 percent. Kaoliang, which is very soft and has a high proportion of starchy endosperm, had a very low digestibility, slightly less than 20 percent.
In an experiment conducted by Abe and others (7) with Japanese subjects, when kaoliang was the main food in a mixed diet, the average digestibility of the protein in the total diet was 77 percent and the carbohydrate, 99 percent. No estimate was made for the sorghum alone. For the total diet the averages in the Langworthy and Holmes experiments were lower, only 24 percent for protein in the diets containing kaoliang, and 42 to 64 per- cent for protein in the other sorghum diets; for carbohydrate, 96 percent in the diets containing kaoliang and a range of 96 to 97 percent in the diets containing the other sorghums. The digesti- bility was lower in the experiments of Lang- worthy and Holmes, particularly for the protein.
We question whether the higher coeflScients for protein indicated by the experiments on Japanese subjects, possibly accustomed to eating kaoliang, are applicable for measuring digestibihty in persons with an entirely different dietary pattern. Further- more, we need to consider the composition of ttie other foods used with the sorghums. In many of the experimental diets of Langworthy, fruit, either oranges or applesauce, was a major item.
The data available do not provide a good basis for deriving a satisfactory figure for the apparent digestibility of sorghum protein. The variations observed were extremely wide and the particular extractions used for the Langworthy experiments may not be typical of the sorghum meals ordinarily used for food. A kaoliang meal of 95-percent extraction may not be typical but is not far short of whole meal. If a factor for whole-meal sorghum or nearly whole meal is needed, we suggest as a tentative factor 0.91 calorie per gram of protein. This is based on a digestibility of 20 percent, indi- cated by the work of Langworthy and Holmes for kaoliang and the usual heat of combustion for protein in cereals. We recognize the possibility that for persons accustomed to eating kaoliang, this factor may be too low. Better digestibility of protein and carbohydrate was indicated for the more refined meals of the other sorghums.
Millet also was studied by Langworthy and Holmes {94). The experimental plan was similar to that used for sorghums. Two millets were studied, common millet, Setaria itálica^ from which 40 percent of the bran portion was removed, and proso millet, Panicum miliaceum^ from which 29 percent bran was removed by sifting the meals through a 16-mesh sieve. Both were fed as bread in a simple mixed diet of potato, orange, butter, and sugar.
The utilization of carbohydrate in millet was about like that for the sorghums. The average digestibility observed for the carbohydrate of each of the millets was high, 96 percent. The digest- ibility of protein of both millet meals was variable but was low, averaging approximately 40 percent for each kind. For millets as for the sorghums these samples prepared as described may not be at all comparable' to the millet meals actually used. We have not attempted to derive calorie factors for millets but have called attention to this work since anyone needing data on millets may be able to adapt the information to their purpose.
Other grain products include various refined cereal foods such as breakfast foods prepared from a mixture of grains and also starches and flour mixtures. For some a few scattered data are available but the experimental conditions were not always such as to make them suitable for use in obtaining representative coefficients of digest- ibility. In lieu of satisfactory data, Atwater's group factors for cereals were used for these various products. His factors, 3.87 calories per gram for protein, 8.37 for fat, and 4.12 for carbo-
35

hydrate, were predominantlv weighted by refined cereals and therefore should give a fairlv close approximation of the energy value of foods that have undergone considerable refinement.
Legumes
The array of data on digestibilitv of foods in the dry legume group (see appendix table 23) shows that several studies have been made of the more important items. For beans, peas, and soybeans the digestibility of carbohydrate (deter- mined by difference) was high, averaging 96 to 98 percent; for cowpeas it was lower, about 90 percent. These high coefficients suggest possible utilization of some of the fiber and pentosans. Data are inadequate to explain the disappearance from the gut of much of the complex carbohydrate matter. Results of some investigations indicate that some are spUt by means of bacterial action into their simpler components and ultimatelv into end products that may be discarded by the body. To what extent intermediate products are absorbed is an unanswered question.
Both the kinds and amounts of carbohydrates present are of particular interest in comparing digestibilities of various legumes. Some legumes are similar in their content of moisture, protein, fat, ash, and total carbohydrate by difference, but several experiments indicate that the similarity does not hold for individual carbohydrates. Differences in digestibility might be more easily understood had more information been obtained on the makeup of the carbohydrate fraction in the legumes samples used. Data in the Uterature indicate that the proportion of the total carbo- hydrate (by difference) in the form of the so-called available carbohydrates, mainly starch, sugar, and dextrin, is less than one-half for cowpeas, two- thirds to more than three-fourths for beans (kidney, lima, mung) and chickpeas, 85 to 90 percent for lentils and peas. The total amount of crude fiber plus pentosans varied for the several foods, 12 percent for kidney beans, 10 percent for mung beans, 13 percent for chickpeas, 10 percent for cowpeas, and 7 percent for lentils. The undetermined fraction makes up a relatively large portion of the total carbohydrates in beans and cowpeas but only a small percentage in the other legumes.
For soybeans as much as two-thirds of the total carbohydrate is made up of the carbohydrate fraction usually considered to be of questionable availabihty. In this fraction a variety of sub- stances has been found in widely varying amounts. These include rafñnose, stachyose, pentosans, ga- lactans, arabans, cellulose, lignin, organic acids, phytin, and glycosides. In addition to these some waxes, color principles, tannins, and undeter- mined hemicelluloses are believed to be present.
Bowers (29) studied the composition of the complex carbohydrate fraction of defatted soy- bean meal and the digestibility of separate con-
36
stituents with a healthy man engaged in moder- ately active laboratory work as the subject. The digestion experiment was carried out according to customary procedures. The methods of analyses employed were those used by Street and Bailey (174)- Analyses were made of both the soybean meal and the feces resulting from a ration of soy- bean meal porridge, milk, butter, and cane sugar. Bowers reported the coefficients of digestibility for the carbohydrates of cooked soybean meal as follows: Dextrin and starch, 99 percent; sucrose, 100 percent; raffinose, 100 percent; organic acids, 99 percent; pentosans, 93 percent; galactans, 96 percent; cellulose, 79 percent; and the remaining fraction, presumably waxes, color principles, and possibly undetermined hemicelluloses, 94 percent by difference. By calculation from the separate constituents he arrived at a digestibility coefficient of about 94 percent as compared with 96 percent which he found independently for total carbo- hydrate by difference.
Entirely different results for digestibility of the carbohydrate of uncooked soybeans were obtained by Adolph and Kao (3) in a series of in vitro experiments in addition to in vivo digestibility experiments with rats. They estimated the avail- abihty of soybean carbohydrate to be about 40 percent. This figure has been widely used in assessing soybean carbohydrate (36, 37, 185), but its application to soybeans for human use seems questionable.
In the manufacture of soybean curd and milk, much of the carbohydrate fraction is removed and the carbohydrates that are left appear to be almost completely digested. A digestibility coefficient of 98 percent was found for curd in a Japanese experiment (134) -
Although there may be significant differences in digestibility of carbohydrates in different leg- umes as indicated in the very few studies avail- able, it does not appear wise at the present time to depart from the group factor, 4.07 calories per gram, originally used by Atwater for carbohydrate in legumes.
A large number of studies has provided data on the apparent digestibility of protein in leg- umes. Although some variation may be observed (see appendix table 23) the data on the whole support the digestibility and energy factors used by Atwater. They are suggested here for use with soybean curd and milk because the data in the literature are too variable to indicate whether or not the factors for either protein or carbohydrate are applicable to these two products.
Nuts Nuts present problems regarding digestibility
and composition similar to those of the legimrie group. Little has been reported on their digest- ibility and it is difficult to evaluate the few results that have been pubhshed. The most extensive work on this food group was reported by Jaffa

(75), who determined the digestibihty of diets composed of fruit and nuts in 28 experiments. The kinds of nuts studied were almonds, Brazil nuts, coconuts, pecans, walnuts, and peanuts, a legume which is used like nuts. In 20 of these experiments, in which most of the protein was supplied by nuts, the average digestibility for the dietary protein was about 75 percent. This value is lower than usually is found for mixed diets in which plant foods predominate. Possibly the low apparent digestibility was the result of the large quantities of fruit consumed. Unfortunately the effect of the amount and kind of carbohydrate from the fruit on the digestibility of the protein and fat in the nuts could not be determined from these studies.
The apparent digestibility of the protein of nuts alone estimated from these 20 experiments by use of Atwater's figure of 85 percent digesti- bility for fruit protein, ranged from 54 to 87 per- cent, averaging 70 percent for nuts as a group. From the two experiments on peanuts the calcu- lated coefficient of digestibility for protein would be 81.5 percent. These figures may be too low since the calculation is dependent on the digesti- bility of the whole diet. Holmes {70, 72) found a much higher digestibility, 92 percent, for peanut protein. He used a simple mixed diet which included either pressure-cooked peanuts or baking powder biscuits that had been made with peanut flour. The peanuts Jaffa used were not described; presumably they were ordinary roasted peanuts. In diets in which boiled or roasted chestnuts con- tributed most of the total protein intake Heupke and others {67) found that the digestibility of chestnut protein ranged from 68 to 79 percent.
In view of the variable results for peanuts and for nuts, there is no good basis for estimating digestibility of protein in nuts of different kinds or even as a group. It is preferable to continue to use, as an interim value for nuts, Atwater^s group coefficient for protein in legumes, 78 per- cent. The grouping of nuts with legumes is a common practice and has some basis since there are many points of similarity in the proximate composition of these two food groups.
Very little work on the digestibility of carbo- hydrate material in nuts has been reported. Only a small fraction of the total carbohydrate intake was furnished by nuts in Jaffa^s series of experi- ments and the digestibility of carbohydrate in nuts has not been estimated. Merrill {120) found that more than 98 percent of the carbohydrate in chestnut flour was digested. Heupke and others {67) found digestibilities ranging from 96.5 to 99.9 percent in several experiments in which chestnuts were fed as raw flakes or cooked by boiling or roasting.
Data reported in the literature on the composi- tion of various nuts indicate that most nuts con- tain from one-half to two-thirds of their carbo- hydrate in the form of sugars or starch or both, up to one-third as crude fiber, pentosans, and
similar complex carbohydrate constituents, and a like amount as undetermined matter. Almonds appear to have a lower proportion of sugar and starch, averaging around 40 percent, and have about 25 percent in the form of complex carbo- hydrates that are of questionable availability. The nature of the remaining portion is undeter- mined. The limited data for peanuts are too variable to estimate the proportions in which the carbohydrate components are distributed.
As readily can be seen, the information on the composition and the digestibility of the carbo- hydrate fraction of nuts is far from complete. Therefore, it appears best to continue to use the coefficient, 97 percent, assigned by Atwater to carbohydrate in legumes and nuts, and his energy factor, 4.07 calories per gram.
Vegetables Very few digestibility studies of vegetables had
been made when Atwater proposed for all vege- tables as a group the factors 3.11 calories per gram for protein and 3.99 calories per gram for carbo- hydrate. Data accumulated since are still limited but provide some basis for separate factors that may be applied to smaller groups of vegetables.
Potatoes Potatoes have been studied more than other
vegetables; results from 10 investigations have been noted in the literature. In most cases the composition of the samples used in the digestion experiments was not reported.
The average digestibility coefficients found for protein by the 10 investigators were from 64 to 85, averaging 74 percent. These are surprisingly low values and we consider them tentative estimates. In several of the experiments the total protein intake was low. Potatoes contain very little nitrogen, only about 0.3 percent, but several observers have pointed out that subjects have remained in generally good physical condition for long periods of time on diets in which potatoes are practically the sole source of protein.
One such study was reported by Kon and lOein, 1928 {SS), who conducted digestion experiments over a period of 167 days. The two subjects, a man aged 25 and a woman aged 28, remained in nitrogen equilibrium and in apparent good health on a very simple diet with the daily intake of nitrogen chiefly from potatoes, averaging only 5.7 grams for the man and 3.8 grams for the woman. The coefficients of digestibility of the potato pro- tein were 66 and 62 percent respectively for the man and woman.
Three subjects in the study by Hindhede, 1913 {69), also were on simple diets in which potatoes contributed nearly all the protein over an ex- tended period of time. The diets were planned to provide the minimum protein intake at calorie levels just suflicient to maintain nitrogen equi- librium. The digestibility of the potato protein
37

ranged from 71 to 86 percent. For 9 months one subject, M, had a daily nitrogen intake from 5.8 to 8.4 grams and maintained a schedule of varying activity, including 3 months of hard labor, without any apparent ill effects—his excellent physical condition at the end of the period was confirmed by four physicians. The apparent digestibility of the potato protein in this case averaged 84 percent.
In a 10-day experiment Rose and Cooper (14^) also observed good utilization of potato protein. The subject, a woman, was able to maintain nitrogen equilibrium, after the third day, on a diet of potato, sugar, and agar-agar, which pro- vided a relatively low nitrogen intake, 4.8 grams per day. The apparent digestibility was 74 percent.
The detailed analyses reported on the nitro- genous fractions of potatoes by Street, Kenyon and Watson, 1946 (173), Crook and Watson, 1948 {U)y Neuberger and Sänger, 1942 {ISO), and Headden, 1927 (65), indicated that most of the nitrogenous matter in potatoes would be available. The proportions of the different nitro- genous materials vary greatly from sample to sample, the coagulable fraction (proteins, proteoses, peptones) ranging from 30 to almost 75 percent and averaging around 40 percent, and the amino acid fraction from 30 to 60 percent, averaging about 50 percent. Of the small remaining frac- tion, 2 to 6 percent has been determined as ammonia and nitrate nitrogen.
Of more practical significance than nitrogenous compounds in estimating energy values for potatoes are data on digestibility and composition of the carbohydrate fractions. Results from six studies reporting digestibility of total carbohy- drate ranged from 92 to more than 99 percent, with an average of 96 percent. These values appear reasonable in view of the high proportion of starch, sugar, and dextrin in potatoes. Also
present are lignin, cellulose, pentosans, pectins, and other hemicelluloses, but the complex carbo- hydrate constitutents of doubtful availability appear to make up only about 1 to 3 percent of the potato. Sugars have been found in varying amounts, from less than 1 to as much as 6 percent. The quantities of dextrin present are small. Starch makes up nearly all of the remaining carbo- hydrate.
In a recent compilation the following average data were obtained: Carbohydrate by difference, 19.1; starch, 17.1; sugar, 0.3; crude fiber, 0.6; and undetermined, 1.1 percent. This last fraction may contain pentosans, pectins, and other carbo- hydrate constituents not determined as crude fiber by the Weende method. It has been shown by Remy (189), WilUams and Olmsted (187), and Weinstock and Benham (186) that this method fails to measure much of the total fiber.
For potatoes it seems to us best to continue the use of the heats of combustion which Atwater assumed for potatoes and other vegetables (see table 7). As a check on the application of these factors to potatoes, we calculated gross heats from the chemical analyses of three samples and compared the results of our calculation with values determined in the bomb calorimeter for the same samples. Data from protein, fat, and carbohydrate analysis and from the bomb calo- rimeter were taken from a study of Bryant and Milner (33). Close agreement between the deter- mined and calculated heats of combustion was found as shown in table 17. The energy factors we derived for potatoes were 2.78 calories per gram for protein and 4.03 calories per gram for carbohydrate. They were derived by applying average coefficients of digestibility found in the literature, 74 percent for protein and 96 percent for carbohydrate, to the heats of combustion, 5.00—1.25 and 4.2 calories per gram, respec- tively.
TABLE 17.—Comparison oj determined and calculated gross energy values oj potatoes
Composition Heat of combustion per 100 grams
Sample number
Water Protein Fat Carbohydrate by difference Fiber Ash Bomb calo-
rimeter Calculated » from com- position
1 Percent
79.5 78.3 81.2
Percent 2.2 2.3 1.9
Percent 0. 1
. 1
.3
Percent 17. 4 18. 4 15.5
Percent 0.4
Percent 0.8 .9
1. 1
Calories 84.8 90. 0 78.2
Calories 85. 0
2 89 7 3 77. 4
1 For heat of combustion factors used see table 13, page 25.
Other vesetables Because published data are lacking on the
digestibility of many vegetables, we have applied group factors—the energy factors for dried legumes to immature shelled beans, peas, and other legumes, those for fruic to rhubaro and tomatoes.
and those for potatoes to starchy roots and tubers. For other underground vegetables such as beets, carrots, onions, parsnips, and radishes we have applied the energy factor for protein and the coefficient of digestibility for the carbohydrate in potatoes, but have made an adjustment in the heat of combustion factor generally used for
38

vegetable carbohydrate to correct for the rela- tively large proportion of sugar. We assumed that from two-thirds to three-fourths of the carbohydrate in most of these underground vege- tables is present as sugar, and one-third to one- fourth as starch and fiber. On this basis the weighted heat of combustion would be 4.00 calories per gram and the energy factor calculated for carbohydrate, 3.84 calories per gram.
Coefficients of digestibility for protein and carbohydrate in the few vegetables for which data have been reported vary widely. We rounded the median figure for digestibility of protein, based on 14 experiments, to 65 and have used it rather than Atwater's figure of 83 percent. The carbohydrate fractions are an important source of energy in some vegetables. We have used a coefficient of S5 percent, the median value for 13 experiments on a variety of vegetables, in place of Atwater^s figure of 95 percent. For the remaining vegetables except mushrooms we have calculated the energy factors by applying diges- tibilities of 65 percent for protein and 85 percent of carbohydrate to the heats of combustion used by Atwater for vegetables. The energy factors obtained in this way are 2.44 calories per gram for protein and 3.57 calories per gram for carbo- hydrate.
Mushrooms Reports in the literature cover various aspects
of the composition of the nitrogenous matter of mushrooms, but as yet there is no complete picture of the quantitative distribution of the various constitutents. From 63 to 72 percent of the total nitrogen has been termed ^^protein nitrogen" (58, 123, 175). Other known constituents are free amino acids, amides, purines, and ammonia. In some instances appreciable amounts of urea have been determined. Iwanoff {73) reported that amino acids are formed autolytically during the ripening period before spore formation and are in turn changed into urea. He found that urea was several times as high at the ripened stage as in the young immature mushrooms, and that in some samples the urea nitrogen approximated half ojf the total nitrogen. Mendel {116) suggested that some of the nitrogen in mushrooms is bound with cellulose and that all attempts to separate the nitrogenous constituent from the portion that yields sugar on hydrolysis had failed.
Thus it is apparent that use of the conventional factor 6.25 to convert nitrogen,to protein intro- duces an error in the value for the nitrogenous matter, but at present there are insufficient data to provide a better factor. Hence, we have con- tinued to use the factor 6.25 in calculating total nitrogenous material in mushrooms, although we realize that the error involved may be of some significance.
Urea, as well as some of the other nitrogen- containing substances, has a lower heat of com- bustion than protein, but since we could m.ake no
accurate estimate for these substances we have used the heat of combustion of vegetables, 5.00 calories per gram, for nitrogenous matter in mushrooms.
Very little work has been noted on the digesti- bility of the nitrogenous matter of mushrooms. Saltet {152), in a 2-day study of a 31-year-old man, found that his subject digested 69 percent of the nitrogenous matter when mushrooms com- bined with a little butter and seasonings were fed. A similar result, 72 percent digestibility, was obtained by Skinner, Peterson, and Steenbock {161) when mushroom.s were fed to albino rats.
A digestibility coefficient of about 70 percent seems a reasonable estimate and following the usual procedure of applying it to the heat of com- bustion, 5.00 calories less 1.25, we derive an energy factor of 2.62 calories per gram of nitrog- enous matter.
The carbohydrate fraction of mushrooms also includes a variety of components, not all of which have been determined quantitatively.
One of the most complete analyses of carbohy- drates in mushrooms reported to date was made by McConnell and Esselen {109), but 51.8 percent of the total carbohydrate was still unidentified. The data from this study expressed as percent of fresh mushrooms and as percent of total carbohy- drate follow:
Carbohydrates in mushrooms {Agaricui campeatris)
Total carbohydrate (by difference)___ Mannitol Reducing sugars (as dextrose) Pentoses, methyl pentoses, hex-
uronic acids Glycogen Grude hemicellulose
Content on fresh
basis
Percent 5. 75
. 95
. 28
.04
. 59
. 91
Proportion of total carbo-
hydrate
Percent 100.0
16. 5 4.9
.7 10.3 15. 8
Other carbohydrate constituents that have been reported as occurring in mushrooms include cellu- lose, lignin, trehalose, indican, and amino-hexose. The published data indicate that not only is the total carbohydrate fraction complex but also that some of the components vary in amounts, possibly depending on variety and other factors such as drying and storage.
There is no very reliable information from which an estimate of the digestibility of the carbohy- drates in mushrooms can be obtained. Only one digestion experiment, reported by Oshima {lS4)y has been noted in the literature. The subject, a Japanese army surgeon, was on an experimental diet consisting of 74 grams of dried mushrooms (Agaricus sitake) and 40 grams of soy sauce for 1 day. According to the author a satisfactory separation of the feces was obtained by the use of buckwheat flour. The digestibility found for the carbohydrate was 84 percent
-Í9

For calculating the energy value of the carbo- hydrate in mushrooms, Watt and Merrill (185) used a factor of 1.35 on the assumption that only mannitol, reducing sugars, and glycogen, which account for approximately 33 percent of the total carbohydrate, were available for absorption. The data from the one digestibility study which has since been located suggests that such a procedure may underestimate appreciably the energy value. Until additional digestibility data on mushrooms are available, it therefore seems preferable to use a digestibility coefficient of 85 percent as for most vegetables and to apply it to a heat of combustion value which corrects for the presence of appre- ciable amounts of sugars. Using the composition data of McConnell and Esselen and assigning heat of combustion values of 3.75 to mannitol, reducing sugars as dextrose, and pentoses, 4.19 to glycogen, and 4.20 to the remaining fraction, the resulting heat of combustion value for total carbohydrate becomes 4.1 calories per gram. By applying the coefficient of digestibility, 85 percent, to this value the energy factor for carbohydrate in mushrooms is 3.48 calories per gram.
Fruits The energy from fruits comes largely from
carbohydrate. The energy factor, 3.60 calories Eer gram, was applied by Atwater to carbohydrate,
ased on the heat of combustion figure of 4.00 calories per gram and digestibility of 90 percent. In arriving at this heat of combustion value he took into consideration that the carbohydrates of fruits are a mixture of sugars, mainly lévulose and dextrose, but that starch, cellulose, pento- sans, and other complex carbohydrates are also present.
We consider 3.60 a reasonable group factor and have applied it to most individual fruits, but with full recognition of the possible inaccuracies involved. For example, the coefficient of digesti- bility 90 percent is probably too low for fruit juices and for sweetened canned or cooked fruit.
The group factor for heat of combustion of carbohydrate in fruits will not apply equally well to individual fruits. A compilation of the proxi- mate composition of fresh fruits (38) showed considerable variation among fruits in the pro- portions of sugar, starch, acid, and crude fiber present. There is need for revision and extension of this compilation to include data available since its publication, particularly with respect to the carbohydrate constituents, before further esti- mates for heats of combustion of carbohydrate in individual fruits are made.
Attention is called to lemons in particular, since they have considerable citric acid with a heat of combustion of only 2.47 calories per gram. As the value 4.00 would be too high for the heat of combustion for total carbohydrate (by differ- ence) in lemons and lemon juice, we have used 2.75 derived by the following calculations:
Constituent Grams per 100 grams
Calories per gram
Total calories
Invert sugar _ 1. 5 6. 0
. 2
3. 75 2.47
4. 2
5. 6 Citric acid (anhydrous) Fiber and unknown constit-
uents
14.8
. 8
Total carbohydrate (by difference) 7. 7 21.2
1 gram carbohydrate = 2.75 calories (21.2-^-7.7).
Since the fiber fraction of lemon juice is very low and since both invert sugar and citric acid may be completely utilized, we took the figvire recommended by Atwater for sugar, 98 percent, as a reasonable value for apparent digestibility. The resultant energy factor was 2.70 calories per gram of carbohydrate. Since limes are similar to lemons in carbohydrate constituents we have applied the same energy factor for carbohydrate.
For lack of better data for other fruits we have continued to use the carbohydrate factor, 3.60 calories per gram, derived by Atwater. Likewise, his factors for protein and fat in all fruits have been used.
Miscellaneous foods Many specific foods have not been studied in
human digestion experiments, as can be seen from the compilation on digestibility coefficients (ap- pendix table 23). In many cases when digest- ibility data on individual foods were lacking, we have used a general value for a group of foods for each food in that group. In other instances when a food has undergone some treatment to change its form, the energy factor of the food in its original form has been applied to the product or products. These procedures no doubt result in some errors.
Where the above procedures were not applicable and when the methods of estimating the energy factors differed in some respects from the general procedure usually followed, these deviations will be explained in turn for the several miscellaneous foods.
Chocolate and cocoa Chocolate and cocoa present a variety of
problems in regard to both chemical composition and digestibility.. Determinations of various ni- trogen-containing compounds have been made in a few studies. It appears that from 12 to 23 percent of the total nitrogen present is in the form of alkaloids, mainly theobromine and caffeine, and 1 to 9 percent as ammonia, and that the remainder, although not clearly identified, may be in the form of protein or protein derivatives.
Data reported by Stutzer (Î77) are the most complete of the analyses located and seem to be representative values when compared with several
40

less complete analyses made by other investi- gators. Stutzer analyzed several kinds of cocoa. For one product which had not been treated with alkaline chemicals (potash, soda, or ammonia) he found that 16.6 percent of the total nitrogen was from alkaloids (mainly theobromine), 1.4 percent from ammonia, 6.3 percent from amides, and 75.8 percent from other nitrogenous matter.
Using these data, we have calculated the gross energy per gram of total nitrogen in cocoa as follows:
Compound Nitro- gen per gram
Conver- sion
factor
Amount of com- pound
Heat of combus-
tion
Gross energy equiva-
lent
Protein _ __ Om,
0.758
. 166
. 014
.063
6. 25
3. 22 1.22 5. 35
Om. 4. 74
. 53
. 02
. 34
Cal./cm. 5.80
5. 22
Cal. 27 5
Alkaloids as theo- bromine _ _ _ _ 2 8
Ammonia.. __ __ _. Amides as asparagin. 3. 45 1. 2
Total 1. 001 5. 63 31.5
Gross energy equivalent of 1 gm. nitrogenous matter = 5.60 calories.
Digestibility of the nitrogenous portion of cocoa was studied by some of the early German scientists. .In these studies there was no atcempt to distinguish between the protein and| non- protein fractions of the nitrogenous matter. In some of the studies cocoa supplied all of the nitrogen, and in some the diet included other protein foods in addition to the cocoa. Experi- ments conducted by Weigm.ann and by Lebbin, reported through König {84, pp. 244-245), showed the following results: For three kinds of cocoa fed in amounts of 188-304 grams per day along with sugar and water, Lebbin found protein digesti- bility coefficients of 41.1, 45.2, and 41.6 percent; for a diet of cocoa and beer or wine, Weigmann found a digestibility of 41.5 percent after correc- tion for metabolic nitrogen. The apparent di- gestibihty was calculated to be 12.7 percent. For two kinds of cocoa, Neumann (131) reported that Beddies found digestion coefficients of 55.3 and 54.1 percent. In these latter experim.ents, 150 grams of cocoa were consumed daily but no information was given on the remainder of the diet.
Several studies have been reported in which cocoa was eaten in combination with other protein- containing foods. There is some indication that digestibility of the cocoa may be affected by the level of cocoa and its proportion of total dietary nitrogen, the combination of foods used with the cocoa and possibly its preparation—whether raw or cooked. Forster (56) found for a diet of milk alone that the protein digestibihty was 93 percent as compared with 93.2 and 92.4 percent for diets of milk and cocoa, with the latter taken in amounts of 20 grams (2 to 3 cups of beverage) and 60 grams
(8 cups), respectively. Schlesinger (153) found a digestibility of about 86.5 percent for protein in a mixed diet consisting of milk, meat, refined cereal, and fat, whereas when 60 grams of cocoa were eaten in addition the digestibility of the protein of the total diet was slightly lowered and was about 84 percent. Beddies, as reported by Neumann (131), also found the digestibility of protein to be about 84 percent for a mixed diet which included 50 grams of cocoa. Cohn (41) observed a lower digestibility coefficient, 75.5 per- cent. His diet differed from those of Schlesinger and Beddies mainly in that larger amounts of cocoa, 100 to 130 grams, were used and milk was not included.
Neumann has reported two studies on cocoa (131, 132). In one series of investigations he deter- mined digestibility of diets made up of sausage, brie cheese, rye bread, lard, and sugar, in which cocoa replaced equivalent amounts of protein and fat of the diet. The digestibihty of the protein of the diet without cocoa averaged 82 percent. When 35 grams of cocoa were included in the diet, the digestibihty dropped to 75 percent, decreasing still further to 57 percent when the daily intake of cocoa was increased to 100 grams. In the second series, Neumann found very low digestibility of the cocoa protein, namely, 45 and 25 percent in two experiments in which 35 grams of cocoa were eaten with 350 grams of sugar as the only other food in the diet. Inasmuch as he corrected for the nitrogen in the digestive juices in getting his digestibility of cocoa, the apparent digestibility would be still lower. These results indicate that the digestibility of the nitrogen portion of cocoa is considerably lower than that of the other foods in the mixed diets studied. Unfortunately the digestibility of cocoa cannot be calculated in the several studies on mLxed diets and there is no means of determining whether the utilization of cocoa as a flavoring ingredient in the diet as it is normally consumed is better than when it is used alone or with sugar only.
On the basis of studies in which cocoa was the chief source of nitrogen, we have used a digestibil- ity of 42 percent, although this may be too low for ordinary application. When the 42 percent figure is applied to 5.6, the heat of combustion derived as shown above, less 1.25, an energy factor of 1.83 calories per gram of nitrogen- containing material results. Information on the utilization of the nonprotein nitrogen is needed before a more accurate factor can be developed.
The carbohydrates of chocolate and cocoa pre- sent problems similar to those for the nitrogenous matter. Some unpublished data ^ for chocolate liquor show the following complex composition: 28.4 percent total carbohydrate by difference; 8.0 percent starch; 2.8 percent fiber; 3.5 percent pentosaDs; 2 to 3 percent gums and hemicellulose;
* Winkler, W. O. Unpublished data. Food and Drug Administration, U. S. Department of Health, Education, and Welfare [n. d.].
41
9.5 percent products such as tannins and cocoa red; 0.5 percent sugars, mainly glucose; 0.6 percent organic acids; and the remainder, undetermined matter. These data were used in estimating the heat of combustion for the total carbohydrate (by difference). The value obtained was 4.16 calories per gram, using as heats of combustion 3.75 calories per gram for sugar, 2.45 for organic acid, and 4.20 for the remaining constituents and weight- ing them according to the percentage composition above.
Digestibility data for the carbohydrate of cocoa are even less conclusive than those reported for protein. In the few experiments located in which cocoa was fed in mixed diets, the digestibility of carbohydrate could not be calculated for the total diet or for the cocoa. The experiments of Lebbin on diets of cocoa and sugar reported by König {8Jf) indicated that probably less than a third of the tota) carbohydrate of cocoa is available to the body. Here, as in the case of protein, this esti- mate may be lower than actually found when cocoa is used in a mixed diet. As a tentative coefficient, until satisfactory data can be obtained on the digestibility of cocoa carbohydrate, we are using 32 percent. This was indicated both by the work of Lebbin and by the carbohydrate composition data above for chocolate liquor, assuming the starch, sugar, and organic acids to be almost completely digested and the remaining constituents to be undigested. The energy factor calculated from this coefficient and the heat of combustion factor 4.16 is 1.33 calories per gram.
Yeast The utilization of yeast ''protein" has been a
matter of great interest. A number of studies have been reported on the digestibility of the nitrogenous matter in yeast, but in only a few of these were human subjects used. Kuen and Puringer {87) compared its digestibility in dried and fresh compressed yeasts, presumably baker's yeast, fed in a mixed diet that furnished 10 to 11 grams of nitrogen and 2,460 to 2,840 calories daily. The estimated digestibility was 90 percent for the nitrogenous matter of dried yeast but only 63 percent for the fresh compressed yeast.
Dirr {50) reported experiments in which either dried yeast or animal sources of protein were fed in alternate periods of 7 days each. The daily nitrogen intake in each case was 10.4 grams from the test food with additional 3.4 to 5.6 grams from plant foods. The calorie intake for the four subjects ranged from about 2,000 to 2,800. The digestibility of the nitrogen of the total diet averaged 87.5 percent in the period in which nitrogen was supplied largely from animal sources, and 83.4 percent in the period in which yeast predominated in the diet. These results indicate that the nitrogenous matter of the yeast was almost as completely absorbed as animal protein. Dirr and Sod en {51) referred to the yeast as wood sugar dried yeast and estimated from analyses
that 67 percent of the total N was amino N and 7.5 to 16 percent was ammonia N.
Funk, Lyle, and McCaskey {59) reported ex- periments in which a dried anaerobic yeast preparation was eaten in a diet consisting largely of vegetables and fruits. The daily nitrogen intake, mainly from yeast, was 5.9 grams and the digestibility of the nitrogenous matter was esti- mated to range from about 60 to 80 percent, averaging about 70 percent. Results of Murlin and others {125) indicated that the apparent digestibility of nitrogen in brewer's yeast was about 57 percent. The daily nitrogen intakes were very low, averaging 3.7 grams daily.
The data indicate that the average apparent digestibility of the nitrogenous matter of dried yeast is probably in the range of 70 to 90 percent when the level of intake is fairly adequate. In deriving an energy factor, we have estimated the coefficient of digestibility as 80 percent.
According to an analysis of yeast reported by Frey {58) the nitrogenous matter is composed of 60 percent monoamino acids, 20 percent diamino acids, 12 percent purines and pyrimidine bases, and 8 percent ammonia. These data indicate that the heat of combustion is lower than if the nitrogenous matter of yeast were all protein. Therefore, for yeast protein we used the heat of combustion 5.00 calories per gram that we applied to vegetables. The digestibility coefficient, 80 percent, applied to 3.75 (5.00 less 1.25) results in an energy factor of 3.00 calories per gram.
Very little research has been noted on the com- position of the different specific carbohydrate constituents in yeast and none at all on their digestibility. Frey {58) has reported that 81.5 percent of the total carbohydrate is glycogen and 18.5 percent, such substances as cellulose and gums. On the basis of these data we used 80 percent as a tentative coefficient of digestibility on the assumption that the glycogen is digestible and the other carbohydrates may not be. This coefficient applied to the heat of combustion 4.20 calories per gram, assumed for total carbohydrate (by difference), resulted in the energy factor 3.35 calories per gram.
Food mixtures To keep pace with marketing practices as well
as buying habits, successive editions of food com- position tables contain a growing proportion of items that are food mixtures. Included are a wide assortment of baked goods, meat and cereal mixtures, salad dressings, and others that are combinations of ingredients. Because the many food mixtures vary so much in the kinds and pro- portions of ingredients used, information on their digestibility from experiments can scarcely be expected. If the weights of ingredients are known, calorie factors per unit weight of total protein, fat, and carbohydrate in the finished product may be calculated. For products in
42

which the proportions of ingredients are fairly standard, the calorie factors once worked out may be applied directly to data on the amounts of protein, fat, and carbohydrate in the product.
To calculate the calories for any given weight of an item from its recipe, the weight of the finished
product must be known in addition to the weights of the ingredients. Calculations indicating the derivation of energy factors and of calories per 100 grams of baking powder biscuits made with skim milk, item 98 in Agriculture Handbook No. 8 {185), are shown in the sample calculation below.
Sample calculation oj energy jactors for Jood mixtures {baking powder biscuits)
Weight
Protein Fat Carbohydrate (by difference)
Kind of data Weight
Specific energy- factor
Energy value Weight
Specific energy factor
Energy value Weight
Specific energy factor
Energy value
Ingredients: Wheat flour, patent- Fat
Qm. 336
55 244
16 2
Om. 36.3
Cal.jgm. 4.05
Cal. 147. 02
Om.
3.0 55.0
. 2
Cal./gm. 8.37 8. 84 8.79
Cal. 25. 11
486. 20 1.76
Om.
255.0 Cal.fgm.
4. 12 Caí.
1, 050. 60
Miik, skim Baking powder
8. 5 4.27 36.20 12.4 '"'3."87' 47.99
Salt
Total 653 44. 8 183. 32 58.2
8.82
513. 07 267.4
4. 11
1, 098. 59
Weighted factor (per gram) 4.09
Baked yield: Total 549
100 44.8 8.2
58.2 10.6
267.4 52.2 100-gram portion. _ 4.09 33. 54 8. 82 93.49 4. 11 214. 54
The factors 4.09, 8.82, and 4.11 calories per gram were applied to the protein, fat, and carbo- hydrate values of the baked biscuits, with the resultant calorie value 342 calories per 100 grams.
Similar calculations were made for the other units of weight given for this item in tables 2 and 3 of Handbook No. 8.
PART IV. APPLICATION OF CALORIE FACTORS The physiological fuel value of a food resulting
from applying the factors summarized in table 13 to the amounts of protein, fat, and carbohydrate present is considered to be a measure of its avail- able energy. Attention is again called to the interpretation of this term to connote that portion available to the body as a source of energy. The difference between total or gross calories of a food and available calories is the caloric value of the organic matter in the urine and feces. Whether this fecal organic matter is entirely of metabolic origin plus bacterial residues and desquamated tissue, or whether it usually or only under some circumstances includes undigested protein, fat, or carbohydrate residues also, is a question of very great importance in dealing with such problems as determining man's use of various foods as sources of specific nutrients. When this question is resolved the information should be helpful also in devising methods for estimating energy values of specific nutrients in food when fed in various combinations and at different levels; present methods are actually not completely satis- factory for estimating available energy from the different nutrients. As a result of changes in method, however, no big changes in actual total
available calorie values for the foods are antici- pated.
In using data on apparent digestibility for developing the energy factors shown in table 13, the assumption is made that the amount and character of the fecal matter (protein, fat, and carbohydrate) present is dependent on the food; a low apparent digestibility could result from greater excretion of metabolic products caused by that food, from incomplete digestion, or from a combination of several causes. Whatever the contributing factors are, the assumption is that the apparent digestibilities of the energy-yielding components of that food would not vary widely for a subject on a reasonably adequate intake of the nutrient. If the total intake of a nutrient in a diet is very low, the relative proportion in the feces is too high for satisfactory measurement by this procedure. More information is needed on the effect of level of the foods on utilization of nutrients. Most studies in the literature at present are on rather extreme diets, for example, either very high or rather low levels of protein, and moderately high and very high levels of the test food. Data are needed also for intermediate levels, those which are more realistic in terms of common food practices.
43

Comparison oí calculated and determined available calories For diets
The end results obtained by use of the current factors (table 13) for estimating available energy of diets have been compared with results obtained by direct bomb calorimeter determinations. An experiment conducted by Snyder {16Jf) with a subject on a very simple diet of whole-wheat bread and milk serves to illustrate the details of calculation (table 18). Snyder's protein figures based on the factor 6.25 for converting nitrogen to protein were recomputed with the factors 5.83 and 6.38 for the bread and milk, respectively; the necessary adjustments were made in the figures
for carbohydrate by difference. The gross calorie values for food and feces were from bomb calo- rimeter determinations and were found to be 4,143 for the food and 418 for the feces. For comparison we also calculated the gross calories of the food. The heats of combustion, 5.80, 9.30 and 4.20 calories, were applied to the protein, fat, and carbohydrate (by difference), respectively, of whole-wheat bread; and 5.65, 9.25, and 3.95 to these nutrients in the milk. The calculated gross calories for bread (2,407) were a little higher than the determined (2,353), and the calculated gross calories for milk (1,737), a little lower than the determined (1,790), but for the total diet the calculated gross calories were in excellent agree- ment with the determined.
TABLE 18.—Summary oj steps jor c kecking available energy values calculated by factors from table 13
Weight of material Protein Fat Carbo-
hydrate Gross energy
Available energy Deviation of calculated
Type of data Determined
by bomb Calculated by use of factors 1
available energy from determined
value
Food consumed in 2-day period : Bread made from whole- Grams
1, 020. 8 2, 500. 0
Grams 73.9 75.2
Grams 12.9 87.5
Grams 442.4 127.2
Calories 2,353 1,790
Calories Calories 2, 045. 5 1, 582. 5
Percent
Milk
Total - - 149. 1 100.4 569.6 4, 143 2 3, 561 3,628 + 1.9
Excreta: 97.0 17.6 10.2 52. 1 418
3 164
Total 582 __ __
1 Energy factors from table 13 applied to the protein, fat, and carbohydrate: 3.59, 8.37, and 3.78, respectively, for bread and 4.27, 8.79, and 3.87 for milk.
2 Gross energy of food minus total energy of excreta (4,143-582).
The urinary calories were 181 when determined by bomb, but 164 when estimated according to Atwater's procedure by multiplying the grams of digested protein 131.5 by 1.25 calories. The wide range in the calorie to nitrogen ratio of the urine (p. 16) indicates that there is less satisfactory agreement between the usual calculation of urin- ary energy loss and direct determinations. In fact, with the difficulties of drying and burning urine, it may be that much of the discrepancy is in the bomb determination. We have considered it advisable when estimating available energy data to use the calorie-nitrogen factor based on a large number of samples rather than a bomb determination of the particular sample of urine.
The calorie-N ratio for this individual was 6.9, which is lower than the average but within the range found for a large number of studies, table 8, p. 12. This individual was also in negative bal- ance, excreting 26.4 grams of nitrogen in the 2-day period during which he absorbed only 21.8 grams. However, the errors involved are insignificant when considered in terms of total available energy.
8 7.9 X difference between amount nitrogen in food and in feces.
NOTE.—Data used in this procedure taken from experi ment No. 171, Studies of Bread and Breadmaking {164)
The available energy of the diet determined from gross energy values of food, feces, and urine was 3,561 calories. When the average wheat and milk energy factors for protein, fat, and carbo- hydrate shown in table 13 were applied to the nutrient intake in this experiment, the figure obvained for available calories was 3,628, differing from the determined figure by 1.9 percent. As pointed out earlier, the factor for fat in whole wheat may be too high since it is based on digesti- büity of 90 percent. If the average digestibility is nearer two-thirds, as indicated in a number of experiments, the energy factor would be approxi- mately 5.95; the figure for available calories, 3,597, would then be in even better agreement with the determined value, differing by only 1.0 percent.
We have checked the results obtained by apply- ing factors from table 13 to data in 108 digestion experiments which provided information on com- position of the foods in the diet and data on bomb calorimeter determinations of the food and feces. Although the experimental data needed for using every factor in table 13 were not provided by these
44

experiments, most of the factors could be tested in this way. The available energy calculated by applying the appropriate energy factors to the composition data for the various foods was in excel- lent agreement with the comparable values for the diets obtained by direct determinations of foods and feces and calculated urinary calories. The differences between the determined and calcu- lated values, not taking direction into account, ranged from 0 to 5 percent and averaged 2 percent. The calculated values were in some cases higher and in some lower than the determined values. These positive and negative deviations were noted even in experiments in which the same type of diet and the same subject were used and suggest that the differences may be in part the result of experimental error.
The digestion experiments that were used to make this comparison include many types of diets: Ordinary mixed diets with foods of animal and plant origin; mixed diets containing large amounts of legum.es; diets of fruits and nuts; very simple diets such as combinations of meat and bread, eggs, milk, and bread, whole-wheat bread and milk, bread made of lower extractions of wheat flour and milk, oatmeal and milk, or crackers and milk; other simple diets containing large amounts of rice, dry peas, vegetables, or fruit; and a few diets of single foods. The proportions of protein, fat, and carbohydrate in the food intake as well as the level of protein intake varied widely, the latter ranging from 14 to 184 grams daily. We have grouped some of the diets and summarized the differences we found between determined and calculated values as follows:
In 14 diets of fruits and nuts the absolute deviation (that is, not taking signs into account) ranged from 0 to 5 percent, averaging 2 percent.
In 16 diets containing large quantities of dry beans, peas, or cowpeas the absolute deviation ranged from 1 to 5 percent, averaging 2 percent.
In 7 diets containing a large proportion of rice or oatmeal the absolute values deviated by only 1 percent in all cases.
In 6 diets of whole-wheat bread and milk the absolute deviations ranged from 2 to 4 percent, averaging 2.5 percent.
In 11 diets containing a large proportion of cabbage, potatoes, beets, green corn, or apple- sauce, the absolute deviations ranged from 0 to 3 percent, averaging 1 percent.
In 6 ordinary mixed diets the absolute devia- tions ranged from 0 to 3 percent, averaging 1.5 percent.
In 36 simple diets in which lower extractions of wheat flours were fed as bread or crackers the absolute deviations ranged from 0 to 5 per- cent, averaging 2.5 percent. Several general observations appear reasonable
in view of these data: 1. That the energy factors in table 13 give an
accurate estimation of the available energy
when applied in various diets containing foods of both animal and plant sources either as mixed diets or simple diets of two or more foods.
2. That the factors are equally suitable when applied to foods in diets in which various plant foods are predominant, as in fruit and nut diets, diets in which large amounts of beans or peas are eaten, and diets in which large proportions of the calories are supplied by rice, wheat, or vegetables.
3. That the factors applied to the several diets of single foods give results in good agreement with the determined values for available energy. This indicates that the factors are applicable to foods used alone in the diet, but further confir- mation with additional data is needed.
4. That the level of protein fed apparently does not affect the extent of agreement obtained in estimating available energy by use of the factors. This was indicated particularly in the group of experiments in which fruit and nuts made up a large part of the diet and the daily protein intake ranged from as low as 14 grams to a maximum of 85 grams; there was no evi- dence of difference in the percentage deviations between calculated and determined values at the different levels of protein intake.
The energy values of the 108 diets were calcu- lated also by applying the general factors, 4, 9, 4. There were larger differences between the direct determinations and calculated values than were observed when the values were calculated by use of the factors from table 13. The largest differ- ences were noted in those diets in which foods of plant origin predominated.
Data have been summarized in table 19 from a few of the experiments selected to represent differ- ent types of diets. The data illustrate the extent of agreement between available calories directly determined and those calculated by use of the factors from table 13 and by use of the general factors 4, 9, 4. Although there is good agreement between the determined and the calculated avail- able energy values as illustrated by the data in table 19, examination of the data show that for some kinds of diets similar agreement for the available energy value of specific nutrients does not necessarily follow. For example, in the case of experiment 388 which represents a diet low in protein and fat, the apparent digestibility of the total protein from the diet was 45 percent, with an estimated 25 calories available from protein in- stead of the 46 which would be calculated by the factors from table 13. Likewise, an estimated 146 calories would be available from fat if the calculation were based on the apparent digesti- bility for the total fat in the diet, instead of the 201 obtained by use of the factors with the indi- vidual foods. For carbohydrate, however, the data from this experiment would indicate approx- imately 861 available calories instead of the 823 obtained by application of the factors from table 13 to the carbohydrate of the items in the diet.
493-791 O - 73 - 45

4^ O'
TABLE 19.—Comparison of determined and calculated available energy values of various types of diets
Daily diet
Diets of fruits and nuts
2,447 gm. grapes (European type), ]3 gm. olive oil, 28 gm. olives, 14 gm. tomatoes (75), experiment No. 388.
595 gm. oranges, 1,120 gm. bananas, 142 gm. pecans {76), experiment No. 409
1,834 gm. Japanese persimmons, 213 gm. peanuts, 11 gm. tomatoes, 28 gm. granóse (a whole wheat prod- uct), 7 gm. olive oil, 57 gm. milk (75), experiment No. 394
Diets with large amounts of legumes
120 gm. whole wheat bread, 10 gm. butter, 250 gm. bananas, 20 gm. sugar, 15 gm. pork, 438 gm. dry white beans (beans supplied 68 per- cent of total organic matter) (184), experiment No. 335
420 gm. whole wheat bread, 30 gm. butter, 250 gm. bananas, 40 gm. sugar, 12 gm. pork, 350 gm. beans (beans supplied 42 percent of total organic matter) (154), experiment No. 338
420 gm. whole wheat bread, 30 gm. butter, 250 gm. bananas, 40 gm. sugar, 11 gm. pork, 400 gm. dry cowpeas (peas supplied 46 percent of total organic matter) (184) y experiment No. 344
292 gm. whole wheat bread, 650 gm. milk, 32 gm. butter, 20 gm. pork, 228 gm. bananas, 32 gm. sugar, 275 gm. dry cowpeas (peas sup- plied 35 percent of total organic matter) (184), experiment No. 629.
Daily intake »
Protein
Orams 13.8
35. 7
84.8
94.9
118.0
138.6
Fat
Orams 23.2
103.8
120. 8
31.2
45.5
45.2
105. 8 89. 8 453. 4
Carbohydrate
Total
Orams 228.6
206. 5
298.8
420.4
540.5
574.4
Fiber
Orams 6.0
10.8
33.8
Gross energy
Calories 1,227
2,010
2,832
2,555
3,324
3,606
Daily excretion in-
Feces
Weight water-
free
Orams 31.9
40.8
58. 2
51.5
53.0
77.2
Protein
Grams 7.6
11.4
12.4
19.2
20.8
30.5
3,283 61.5 23.5 2.8 28.0
Fat
Orams 7.5
10.4
13.6
4.5
5.2
3.2
Carbohydrate
Total
Orams 12. 7
13.4
25.8
22.0
19.0
36.5
Fiber
Orams 3.4
2.6
3.3
Gross energy
Calories 172
225
330
252
262
380
Urine
Gross energy »
Calories
35
103
97
127
140
Available energy from daily diet
Deter- mined,
by bomb
Calories 1,047
1,750
2,399
2,206
2,936
3,085
Calculation by use of—
Energy factors from
table 13
Calories 1,070
1, 741
2,406
2,268
2,913
3, 121
303 106 2,874 2,938 3,045 +2 +6
General energy factors 4, 9, 4
Calories 1, 179
1,904
2,622
2, 342
3,043
3,259
Deviation from determined value,
column a, of—
Value
column b
Percent + 2
-1
+ 3
4-1
Value in
column G
Percent + 13
+ 9
+ 9
-h6
4-4
+ 6
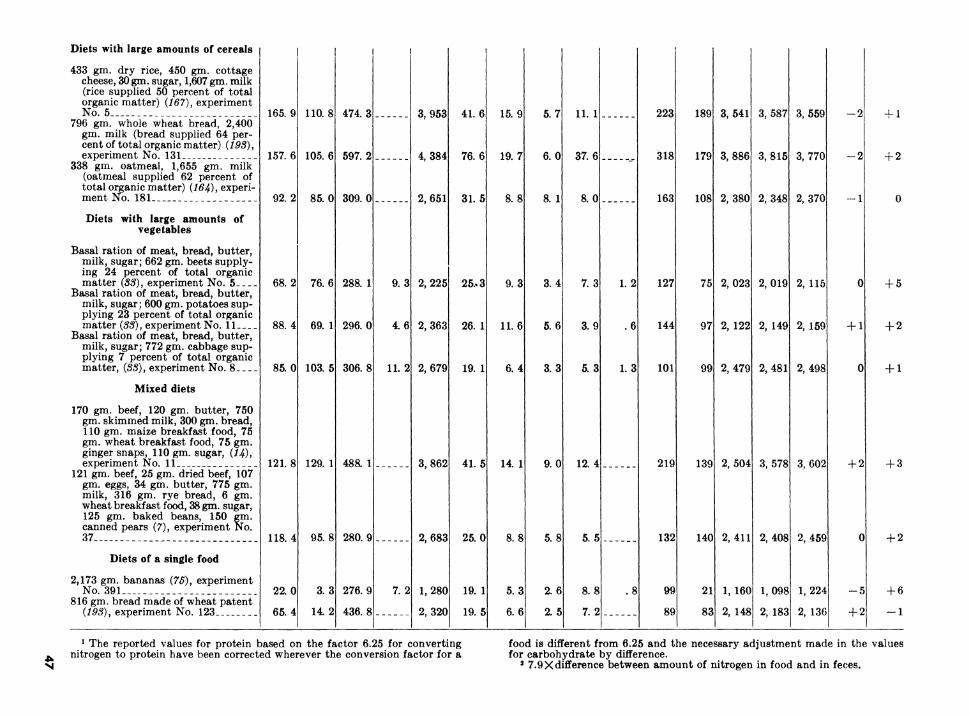
Diets with large amounts of cereals
433 gm. dry rice, 450 gm. cottage cheese, 30 gm. sugar, 1,607 gm. milk (rice supplied 50 percent of total organic matter) (167) y experiment No. 5
796 gm. whole wheat bread, 2,400 gm. milk (bread suppUed 64 per- cent of total organic matter) (193) y experiment No. 131
338 gm. oatmeal, 1,655 gm. milk (oatmeal supplied 62 percent of total organic matter) (164), experi- ment No. 181
Diets with large amounts of vegetables
Basal ration of meat, bread, butter, milk, sugar; 662 gm. beets supply- ing 24 percent of total organic matter (33), experiment No. 5
Basal ration of meat, bread, butter, milk, sugar; 600 gm. potatoes sup- plying 23 percent of total organic matter (33), experiment No. 11
Basal ration of meat, bread, butter, milk, sugar; 772 gm. cabbage sup- plying 7 percent of total organic matter, (33), experiment No. 8
Mixed diets
170 gm. beef, 120 gm. butter, 750 gm. skimmed milk, 300 gm. bread, 110 gm. maize breakfast food, 75 gm. wheat breakfast food, 75 gm. ginger snaps, 110 gm. sugar, (14), experiment No. 11
121 gm. beef, 25 gm. dried beef, 107 gm. eggs, 34 gm. butter, 775 gm. milk, 316 gm. rye bread, 6 gm. wheat breakfast food, 38 gm. sugar, 125 gm. baked beans, 150 cm. canned pears (7), experiment No. 37
Diets of a single food
2,173 gm. bananas (76), experiment No. 391
816 gm. bread made of wheat patent (193), experiment No. 123
165.9
157.6
92.2
68.2
88.4
85.0
121.8
118.4
22.0
65.4
110. 8
105.6
85.0
76.6
69. 1
103.5
129. 1
95.8
3.3
14.2
474.3
597.2
309.0
288. 1
296.0
306.8
48& 1
280.9
276.9
436.8
9.3
4,6
11.2
7.2
3,953
4,384
2,651
2,225
2,363
2,679
3,862
2,683
1,280
2,320
41.6
76.6
31.5
25.» 3
26. 1
19. 1
41.5
25.0
19. 1
19.6
15.9
19.7
8.8
9.3
11.6
6.4
14. 1
8.8
5.3
6.6
5.7
6.0
8. 1
3.4
5.6
3.3
9.0
6.8
2.6
2.5
11. 1
37.6
8.0
7.3
3.9
6.3
12.4
6.5
8.8
7.2
1.2
.6
1.3
.8
223
318
163
127
144
101
219
132
99
89
189
179
108
75
97
99
139
140
21
83
3,541
3,886
2,380
2,023
2, 122
2,479
2,504
2,411
1, 160
2, 148
3, 587
3, 815
2,348
2,019
2, 149
2,481
3,578
2,408
1,098
2,183
3, 559
3,770
2,370
2, 115
2, 159
2,498
3,602
2,459
1,224
2, 136
-2
+ 1
+ 2
+ 2
-fl
+ 2
+ 5
+ 2
+ 1
+ 3
+ 2
+ 6
^ The reported values for protein based on the factor 6.25 for converting ^ nitrogen to protein have been corrected wherever the conversion factor for a
food is different from 6,25 and the necessary adjustment made in the values for carbohydrate by différence.
* 7.9 X difference between amount of nitrogen in food and in feces.

In this experiment these discrepancies in the values for available calories from the different nutrients are large, as is to be expected in view of the items in the diet and the very low level of protein and fat. This example is useful, therefore, to point out that although the calorie factors in table 13 are satisfactory for calculating total available calories in a diet of widely different composition and character from the ordinary mixed diet, under some conditions there may be considerable error in calculating available calories from specific nutrients. Caution should be used also in applying general digestibility coefficients to such diets with a view to obtaining data on avail- able nutrients.
General factors and more specific factors forcalculating calories in individual foods
When the factors shown in table 13 are applied to individual foods and the resulting calories compared with calories obtained by use of the general factors 4, 9, 4, very large differences are observed for some foods. A list of foods reprä- sentative of different groups has been assembled below in tabular form to illustrate this difference:
Food
Animal foods: Beef Salmon, canned Eggs Milk
Fats: Butter Vegetable fats and oils.
Cereals: Cornmeal, whole ground
(unbolted) Cornmeal, degermed Oatmeal Rice, brown Rice, white or milled Wheat flour, whole
wheat Wheat flour, patent
Legumes: Beans, dry seeds Peas, dry seeds
Vegetables: Beans, snap Cabbage Carrots Potatoes Turnips
Fruits: Apples, raw Lemons, raw Peaches, cammed
Sugar: Cane or beet
Energy value per 100 grams edible portion derived by use of—
Specific factors
(a)
Calories 273 143 162 68
716 884
355 363 390 360 362
333 364
338 339
35 24 42 83 32
58 32 68
385
General fac- tors 4, 9, 4
Calories 268 138 158 69
733 900
367 356 396 356 351
355 355
346 349
42 29 45 85 35
64 44 75
398
Ratio col, b col. a
Percent 98 97 98 101
102 102
103 98 102 99 97
107 98
102 103
120 120 107 102 109
110 138 110
103
The significance of some of the differences illustrated above becomes more apparent when related to emergency feeding problems. For example, the general factors overestimate the energy value of whole wheat by 22 calories per 100 grams, and a ton therefore would supply some 200,000 fewer calories than calculated. To supply the higher number of calories, estimated, however, 2,132 pounds instead of 2,000 would be needed.
Application of general factors to national food supplies
Although general factors 4,9,4 may not be suit- able for estimating available energy values for indi- vidual foods, the question arises as to whether they may be suitable for calculating calories of present- day food supplies. Food consumption patterns have changed over the years {182). There have been major shifts in consumption of foods within groups and between groups. As a result there has been some shift in the proportions of protein, fat, and carbohydrate supplied by the different foods within a group, and also a shift in the proportions of these nutrients from the various food groups in the national food supply.
We have grouped the foods into a few large categories and have calculated average coefRcients of digestibility and calorie factors for the protein, fat, and carbohydrate of each of these groups. For this we weighted data selected from table 13 by the amount of the nutrient each food in the group supplied. These food group averages are shown in table 20. The average or general calorie factors for the total food supply also weighted by current distribution data on nutrients were found to be 4.00, 8.92, and 3.97 calories per gram as shown in table 20. These factors if rounded to simple whole numbers are the same as the general factors that have been used nearly 50 years. No large error is introduced in the calculation of national per capita figures per day if general factors rounded to whole numbers are used instead of the unrounded 4.00, 8.92, and 3.97. The net result of applying these rounded factors to the amounts of protein, fat, and carbohydrate of the food supply would be to overestimate the total available calories from about one-half to less than 1 percent. On a 3,000-calorie diet this would be less than 30 calories.
General factors such as these provide a quick means of calculating the physiological fuel value from composition data of the total food supply in this country. They may be used with family or institutional diets also if the pattern is compara- ble in the types and proportions of food to those used in this country. However, for limited or unusual diets such as are found in some areas or for food supplies of totally different composition, these general factors might not be suitable. Data in table 21 illustrate the differences that may result from applying the rounded general factors
48

TABLE 20.—Factors Jor digestibility^ heats of combustion, and physiological fuel values of nutrients in food groups as used in present-day mixed diets ^
Protein Fat Carbohydrate
Classes of food materials Propor- tion of total in mixed diet
Appar- ent
digesti- bility
Heat of combus- tion less
1.25 2
Physio- logical
fuel value
Propor- tion of total in mixed diet
Appar- ent
digesti- büity
Heat of combus-
tion
Physio- logical
fuel value
Propor- tion of total in mixed diet
Appar- ent
digesti- büity
Heat of combus-
tion
Physio- logical
fuel value
Mpata fish DOultrv Percent
31 7
25
Percent 97 97 97
Cal.Igm. 4.40 4.50 4.40
Cal.fgm. 4. 27 4.36 4.27
PercerU 36
4 18 19
Percent 95 95 95 95
Cal.Igm. 9.50 9.50 9. 25 9.40
Cal.Igm. 9. 02 9.02 8.79 8.93
Percent Percent Cal.Igm. Cal.Igm.
EercTs - Dairy products _ 8 98 3.95 3.87 SeDarated fats
Total food of animal origin 63 97 4. 41 4.28 77 95 9.42 8.95 8 98 3.95 3.87
Cereals ___ 23 6 6 2
86 78 70 85
4. 55 4.45 3. 75 3.95
3.91 3.47 2.62 3.36
2 3 1 1
90 90 90 90
9.30 9. 30 9.30 9.30
8.37 8.37 8.37 8. 37
40 3 9 8
32
98 97 93 90 98
4.20 4.20 4. 19 4.00 3.95
4. 12 Legumes and nuts _ _ _ 4.07 Vegetables 3.90 Fruits. --_ 3.60 Sugars and sirups__ 3.87 Separated fats and oils 16 95 9.30 8.84
Total food of plant origin 37 82 4.37 3.58 23 94 9.30 8.74 92 97 4. 10 3.98
Total food 100 91 4. 40 4.00 100 95 9. 39 8. 92 100 97 4. 09 3.97 1
1 Based on United States of America food consump- tion data, 1949 (182),
4, 9, 4 and the specific factors for individual foods or food groups to different kinds of diets. Diet A may be considered comparable to that used currently in this country. It has fairly large quantities of meat, milk, fats, and sugar, and relatively small quantities of cereals; the greater proportion of the cereals are refined products. Diet B, on the other hand, follows the dietary pattern of some of the Eastern European countries and has very high proportions of unrefined cereals and potatoes and relatively small amounts of meat, fat, eggs, and sugar.
Results of applying the general and specific factors in this example show that for Diet A either set of factors would be satisfactory. No significant error is to be expected from applying general factors in this case because the proportions of the different types of food are the same as
2 Heat of combustion corrected for incompletely oxidized products in the urine.
those used in developing the general factors. In the case of Diet B, which is also a mixed diet but one in which the proportions of different types of food are very different, calories calculated by the use of the general and specific factors are not in as good agreement.
General factors may therefore be used for esti- mating the energy value of average family diets or of the national food supply of this country from the total quantity of protein, fat, and carbo- hydrate. The more specific factors should be used for most other calculations, such as those for experimental and therapeutic diets, individual foods, food supplies of a totally different character from that of this country, and particularly for areas of the world where the food supplies consist largely of imrefined cereals and vegetables.
49

o
TABLE 21.—Comparison of energy values Jor different dietary patterns, calculated with specific and with general calorie factors
Nutrients per kilogram as purchased ^ Diet A DietB
Food
Protein Fat Carbo- hydrate
Quan- tity of food
Total nutrient intake Energy value by use of—
Quantity of food
Total nutrient intake Energy value by use of—
Protein Fat
Gm./day 0.2 2.4 .4 . 1 . 2 .2 . 1
1.0 30.3 26. 8 5.3
74.5 0.0
Carbo- hydrate
Specific factors Í
General fac- tors 4, 9, 4 Protein Fat Carbo-
hydrate
Gm./day 385, 2
0 18.6 76. 5 2.7 2.2 3.0 2.5 0.0
12. 2 . 1
0.0 30.0
Specific factors »
General fac- tors 4, 9, 4
Whole wheat Gm.
133 105 214
16.8 10. 2 10. 6 9.6 2.6
147 35
113.9 0. 0 0.0
Gm. 20 10 16
.8 1.5 2.6 1.7 3. 5
184.8 39
102.4 1,000
0.0
Gm. 710 761 616 160.4 38. 7 81.8 61.8
131. 1 0.0
49 6.2 0.0
995
Kgjyr. 3.5
88.6 9.2
54. 1 45.0 26.4 20.0
101.8 59.8
251. 1 19.0 27. 2 41. 3
Gm./day 1.3
25.5 5.4 2.5 1.3 .8 .5 . 7
24. 1 24. 1
5. 9 0.0 0.0
Gm./day 6. 8
184. 7 15.5 23.8 4.8 5.9 3.4
36. 6 0,0
33.7 .3
0.0 112. 6
Cal./day 32 884 85
104 22 27 15
142 376 469
75 672 436
Cal./day Kg./yr. 198.0
0 11.0
174. 0 25.0 10.0 18.0 7.0
21.0 91.0 7.0 5.0
11.0
Gm./day 72. 1
0 6.4 8.0
. 7
.3
.5
. 1 8.5 8.7 2. 2 0.0 0.0
Gm/day 10.8 0 .5 .4 . 1 . 1 . 1 . 1
10.6 9. 7 2.0
13.7 0.0
Cal./day 1, 805
0 102 334
12 10 14 10
132 170 28
124 116
Cal./day
Wheat patent flour _ Dry beans Potatoes; refuse, 16 pet Cabbage; refuse, 27 pet Carrots; refuse, 12 pet Turnips; refuse, 13 pet Apples; refuse, 12 pet Beef; refuse, 16 pet Milk Eggs; refuse, 11 pet Lard _. _ _ _ . _ Sugar _ _ ..__
TotaL-_ -- 92. 1 141.5 428. 1 3,339 3,354 107. 5 48. 1 533.0 2,857 2 995
Percentage relationship. 100 100.4 100 104 8
1 Data on food composition adapted from U. S. Department of Agriculture Handbook No. 8 {18S). ^ Calorie factors given in table 13.

CONCLUSIONS It is recognized that some of the physiological
fuel factors for food groups and individual foods developed as shown in this publication and summarized in table 13 are based on a limited amount of data and that factors for food groups may not always be equally suitable for individual foods within the group. Also revisions are antici- pated as more complete information becomes available on the various constituents in the nitrogenous matter, fat and carbohydrate of food, and on their heats of combustion and digestibilities. Moreover it is realized that there are problems with direct bearing on the digesti- bility of protein, fat, and carbohydrate that have not been resolved satisfactorily at this time. Although all of the calorie factors may not be entirely suitable as a result of the various limita-
tions existent in the basic data, nevertheless when they were applied to the nutrients in foods fed alone or in various combinations, the estimated total available energy of the food was always in excellent agreement with the value determined by use of the bomb calorimeter.
In view of the agreement noted and until more basic information becomes available, the modifica- tion of the method of Atwater and Bryant as pro- posed in the present publication for estimating the available (or physiological) energy value of foods seems the most satisfactory procedure to use; the calorie factors presented in table 13 are recommended for calculating the total available energy value of foods until there is basis for further revision or refinement of the factors.
LITERATURE CITED (1)
(2)
(3)
(4)
(5)
(6)
(7)
ABE, A,, TAKEI, U., UENO, O., and others. Í934. COEFFICIENT OF DIGESTIBILITY OF KAO-
LIANG. Jour. Oriental Med. 21(1): 1001-1012. [In Japanese. Esperanto summary, p. 115.]
ADAMS, G., and CHATFIELD, C.
1935. CLASSIFICATION OF FRUITS AND VEGE- TABLES ACCORDING TO THEIR CARBO- HYDRATE CONTENT. Amer. Dietet. As- soc. Jour. 10: 383-390.
ADOLPH, W. H., and KAO, H. C.
1934. THE BIOLOGICAL AVAILABILITY OF SOY- BEAN CARBOHYDRATE. Jour. Nutr. 7: 395-406.
ARKANSAS AGRICULTURAL EXPERIMENT STATION.
1896. CONCERNING WHEAT AND ITS MILL PROD- UCTS. PARTS I AND II. (Appendix by G. L. Teller.) Ark. Agr. Expt. Sta. Bui. 42, pp. [611-104.
AssociAiioN OF OFFICIAL AGRICULTURAL CHEM-
ISTS, COMMITTEE.
1890. EDITORIAL NOTES. U. S. Off. Expt. Stas., Expt. Sta. Rec. 2: 185-190.
ATWATER, W. O.
1902. PRINCIPLES OF NUTRITION AND NUTRITIVE
VALUE OF FOOD. U. S. Dept. Agr. Farmers' BuL 142, 48 pp., illus.
(8) -
1902. ON THE DIGESTIBILITY AND AVAILABILITY OF FOOD MATERIALS. Conu. (StOFrs) Agr. Expt. sta. 14th Ann. Rpt. 1901, pp. 179-245.
(9)
(10)
1903. THE DEMANDS OF THE BODY FOR NOURISH- MENT AND DIETARY STANDARDS. ' Conn. (Storrs) Agr. Expt. Sta. 15th Ann. Rpt. (1902-1903), pp. 123-146.
1904. EXPERIMENTS ON THE DIGESTIBILITY OF CEREAL BREAKFAST FOODS. Conn. (Storrs) Agr. Expt. Sta. 16th Ann. Rpt. for the year ending June 30, 1904, pp. 180-209.
1906. PRINCIPLES OF NUTRITION AND NUTRITIVE VALUE OP FOOD. U. S. Dept. Agr. Farmers' Bui. 142 (First rev.), 48 pp., illus.
(11)
(12)
(13)
(14)
(15)
(16)
(17)
(18)
(19)
(20)
ATWATER, W. O.
1910. PRINCIPLES OF NUTRITION AND NUTRITJVF
VALUE OF FOOD. U. S. Dept. AgV. Farmers' Bui. 142 (Second rev.), 48 pp., illus.
and BENEDICT, F. G.
1897. EXPERIMENTS ON THE DIGESTION OF FOOD BY MAN. Conn. (Storrs) Agr. Expt. Sta. Bui. 18, pp. 154r-167.
and BENEDICT, F. G.
1899. EXPERIMENTS ON THE METABOLISM OF MATTER AND ENERGY IN THE HUMAN BODY. U. S. Dept. Agr. Off. Expt. Stas. Bui. 69 (rev. ed.), 112 pp.
and BENEDICT, F. G.
1902. EXPERIMENTS ON THE METABOLISM OF MATTER AND ENERGY IN THE HUMAN BODY, 1808-1900. U. S. Dept. Agr. Off. Expt. stas. Bui. 109, 147 pp.
arnd BENEDICT, F. G.
1902. AN EXPERIMENTAL INQUIRY REGARDING THE NUTRITIVE VALUE OF ALCOHOL. Nati. Acad. Sei. Sixth Mem., vol. 8, pp. 231-397.
and BENEDICT, F. G.
1903. EXPERIMENTS ON THE METABOLSIM OF MATTER AND ENERGY IN THE HUMAN BODY, 1900-1902. U. S. Dept. Agr. Off. Expt. stas. Bui. 136, 357 pp., illus.
and BRYANT, A. P. 1900. THE AVAILABILITY AND FUEL VALUE OF
FOOD MATERIALS. Coun. (Storrs) .Agr. Expt. sta. 12th Ann. Rpt. (1899). pp. 73-110.
and BRYANT, A. P. 1900. COMPOSITION OF COMMON FOOD MATE-
RIALS AVAILABLE NUTRIENTS AND FUEL VALUE. Conn. (Storrs) Agr. Expt. Sta. 12th Ann. Rpt. (1899), pp. 111-123.
and BRYANT, A. P. 1902. DIETARY STUDIES IN NEW YORK CITY IN
1896 AND 1897. U. S. Dept. Agr. Off. Expt. Stas. Bui. 116, 83 pp.
and BRYANT, A. P. 1906. THE CHEMICAL COMPOSITION OP AMERICAN
FOOD MATERIALS. U. S. Dept. Agr. Off. Expt. stas. Bui. 28 (rev. ed.), 87 pp., illus.
51

(21)
(22)
(23)
(24)
(25)
(26)
(27)
(28)
(29)
(30)
(31)
(32)
(33)
(34)
(35)
(36)
ATWATER, W. O., and ROSA, E. B.
1899. DESCRIPTION OF A NEW RESPIRATION CALORIMETER AND EXPERIMENTS ON THE CONSERVATION OF ENERGY IN THE HUMAN BODY. U. S. Dept. Agr. Off. Expt. Stas. Bui. 63, 94 pp., illus.
and SNELL, J. F.
1903. DESCRIPTION OF A BOMB-CALORIMETER AND METHOD OF ITS USE. Amer. Chem. Soc. Jour. 25: 659-699, Ulus.
WOODS, C. D., and BENEDICT, F, G.
1897. REPORT OF PRELIMINARY INVESTIGATIONS ON THE METABOLISM OF NITROGEN AND CARBON IN THE HUMAN ORGANISM, WITH A RESPIRATION CALORIMETER OF SPECIAL CONSTRUCTION. U. S. Dept. Agr. Off. Expt. stas. Bui. 44, 64 pp., illus.
BEAZELL, J. M., SCHMIDT, C. R., and IVY, A. C. 1939. ON THE DIGESTIBILITY OF RAW POTATO
STARCH IN MAN. Jour. Nutr. 17: 77-83. BENEDICT, F. G.
1907. INFLUENCE OP INANITION ON METABOLISM.
Carnegie Inst. Wash., Pub. 77, 542 pp. Washington.
1915. A STUDY OF PROLONGED FASTING. Car- negie Inst. Wash., Pub. 203, 416 pp., illus. Washington.
and MiLNER, R. D. 1907. EXPERIMENTS ON THE METABOLISM OF
MATTER AND ENERGY IN THE HUMAN BODY, 1903-1904. U. S. Dept. Agr. Off. Expt. stas. Bui. 175, 335 pp., illus.
BLYTH, A. W.
1889. EXPERIMENTS ON THE NUTRITIVE VALUE
OF WHEAT MEAL. PfOC. Royal SoC. London 45: 549-553.
BOWERS, W. G.
1919. SOME STUDIES ON THE NUTRITIVE VALUE
OF THE SOY BEAN IN THE HUMAN DIET.
N. Dak. Agr. Expt. Sta. Spec. Bui., vol. 5, pp. [2781-327, illus.
BREIREM, K., and NICOLAYSEN, R.
1942. INVESTIGATIONS ON THE DIGESTIBILITY OF RYE AND WHEAT BRAN IN DOMESTIC ANI- MALS AND HUMANS. In Avhandliuger utgitt av Det Norske Videnskaps- Akademi I Oslo 1, M at.-Natur v. Klasse. No. 2, pp. 3-16. Oslo.
BRICKER, M., MITCHELL, H. H., and KINSMAN, G. M.
1945. THE PROTEIN REQUIREMENTS OF ADULT HUMAN SUBJECTS IN TERMS OF THE PRO- TEIN CONTAINED IN INDIVIDUAL FOODS AND FOOD COMBINATIONS. JOUF. Nutr. 30:269-283, illus.
BRYANT, A. P. 1897. TWO DIGESTION EXPERIMENTS WITH AN
INFANT. Conn. (Storrs) Agr. Expt. Sta. 9th Ann. Rpt., 1896, Second pt., pp. 181-185.
and MiLNBR, R. D. 1903. EXPERIMENTS ON THE DIGESTIBILITY OF
VEGETABLES. AmcF. JouF. Physiol. 10: 81-99.
CAHILL, W. M., SCHROEDER, L. J., and SMITH, A. H. 1944. DIGESTIBILITY AND BIOLOGICAL VALUE OF
SOYBEAN PROTEIN IN WHOLE SOYBEANS, SOYBEAN FLOUR, AND SOYBEAN MILK. Jour. Nutr. 28: 209-218.
CARPENTER, T. M.
1940. THE METABOLISM OF ALCOHOL: A REVIEW. Quart. Jour, of Studies on Alcohol 1 : [201]-226.
CHATFIELD, C.
1949. FOOD COMPOSITION TABLES FOR INTER- NATIONAL USE. Food and Agr. Organ. Nutr. Studies 3, 56 pp.
(37)
(38)
(39)
(40)
(41)
(42)
(43)
(44)
(45):
(46)
(47)
(48)
(49)
(50)
(51)
(52)
CHATFIELD, C, and ADAMS, G.
1940. PROXIMATE COMPOSITION OF AMERICAN FOOD MATERIALS. U. S. Dept. Agi. Cir. 549, 91 pp.
and MCLAUGHLIN, L. I. 1928. PROXIMATE COMPOSITION OF FRESH FRUITS.
U. S. Dept. Agr. Cir. 50, 20 pp. CHENG, L. T., Li, H. C, and LAN, T. H.
1941. BIOLOGICAL VALUES OF SOYBEAN PROTEIN AND MIXED SOYBEAN-PORK AND SOY- BEAN-EGG PROTEINS IN HUMAN SUB- JECTS. Chinese Jour. Physiol. 16: 83- 89.
CLARK, L. C, RYER, H., and MURLIN, J. R. 1949. RELATIVE TO EGG BIOLOGICAL VALUES AND
REPLACEMENT VALUES OF SOME CEREAL PROTEINS IN HUMAN SUBJECTS. JoUF. NutF. 38: 405-420.
CoiiN, H. 1895. UEBER CACAO ALS NAHRUNGSMITTEL.
ZtschF. f. Physiol. Chem. 20: 1-27.
CONSTANTINIDI, A. 1887. UEBER DIE AUSNÜTZUNG DES WEIZENKLE-
BERS IM DARMKANALE UND ÜBER DIE VERWENDUNG DESSELBEN ZUR ERNÄH- RUNG DES MENSCHEN. ZtSchF. f. Biol. 23:[433]-455.
CRAMPTON, E. W., IRWIN, M. I., LLOYD, L. E., and NEILSON, H. R.
1951. THE APPARENT DIGESTIBILITY OF ESSEN-
TIALLY SIMILAR DIETS BY RATS, GUINEA PIGS, SHEEP, SWINE AND BY HUMAN
SUBJECTS. JouF. NutF. 43: 541-550. CROOK, E. M., and WATSON, D. J.
1948. STUDIES ON THE STORAGE OF POTATOES. I. CHANGES IN COMPOSITION DURING STORAGE IN CLAMPS. JoUF. AgF. Sci. [London] 38: 440-457, illus.
DANIEL, L. J. 1951. THE NUTRITIVE VALUE OF ALCOHOL. N. Y.
State JouF. Med. 51: 1283-1284.
DESIKACHAR, H. S. R., DE, S. S., and SUBRAHMAN- YAN, V.
1948. PROTEIN VALUE OF SOYA-BEAN MILK: HU-
MAN FEEDING EXPERIMENTS. ^ Indian JouF. Med. Res. 36: 145-148.
and SUBRAHMANYAN, V. 1949. INFANT FEEDING EXPERIMENTS WITH SOYA-
BEAN MILK. Indian JOUF. Med. Res. 37: 77-83.
DEUEL, H. J.
1923. DIGESTIBILITY OF BAKED GOODS MADE
FROM PATENT FLOUR. JoUF. HomC Econ. 15: [699]-701.
1924. THE DIGESTIBILITY OF TEPARY BEANS. JouF. AgF. Res. 29: 205-208.
DiRR, K. 1942. ÜBER DEN WERT DER WUCHSHEFEN FÜR
DIE MENSCHLICHE ERNÄHRUNG. II. MITTEILUNG: ÜBER DIE BIOLOGISCHE BRAUCHBARKEIT DER BERGIN-HOLZZUC- KERTROCKENHEFE. Biochem. ZtschF. 312: [233]-251.
and SODEN, O. 1941. üBER DEN WERT DER WUCHSHEFEN FüR
DIE MENSCHLICHE ERNÄHRUNG. I. MIT- TEILUNG : AMINOSÄUREGEHALT VON BER- GIN-HOLZZUCKERTROCKENHEFE. BÍO- chem. ZtschF. 309: [329]-336.
ERISMANN, F.
1901. DIE BROTSURROGATE IN HUNGERSZEITEN UND IHRE AUSNUTZUNG IM MENSCH- LICHEN VERDAUUNGSKANAL. ZtSChF. f. Biol. 42: [6721-709.
52

(53) FITZPATRICK, W. H., ESSELEN, W. B., JR., and (71) WBIR, E.
1946. COMPOSITION AND NUTRITIVE VALUE OF
MUSHROOM PROTEIN. Amer. Bietet. Assoc. Jour. 22: 318-323.
(54) FoLiN, O. (72) 1905. A THEORY OF PROTEIN METABOLISM. Amer.
Jour. Physiol. 13: 117-138. (55) FOOD AND AGRICULTURE ORGANIZATION OF THE
UNITED NATIONS. /-7Q\ 1947. ENERGY-YIELDING COMPONENTS OF FOOD ^ ^
AND COMPUTATION OF CALORIE VALUES.
23 pp. Washington. (56) FöRSTER, J.
1900. UEBER ''HOLLäNDISCHEN" KAKAO. Hyg. ^* ^) Rundschau 10: [305h317.
(57) FRAPS, G. S.
1946. COMPOSITION, DIGESTIBILITY AND ENERGY
VALUES OF SOME HUMAN FOODS. Texas Agr. Expt. Sta. Bui. 680, 41 pp. (75)
(58) FREY, C. N.
1930. HISTORY AND DEVELOPMENT OF THE MOD-
ERN YEAST INDUSTRY. Indus. and Engir:. Chem. 22: 1154-1162.
(59) FUNK, C, LYLE, W. G,, MCCASKEY, D., and others. 1916. THE NUTRITIVE VALUE OF YEAST, POL- (76)
ISHED RICE, AND WHITE BREAD, AS DE- TERMINED BY EXPERIMENTS ON MAN. Jour. Biol. Chem. 27: 173-191.
(60) FuNNELL, E. H., VAHLTEICH, E. MCC, MORRIS,
S. ()., and others. 1936. PROTEIN UTILIZATION AS AFFECTED BY (77)
THE PRESENCE OF SMALL AMOUNTS OF BRAN OR rrs FIBER. JouT. Nutr. 11: 37-45.
(61) GROSZFELD, J.
1917. ZUR FETTBESTIMMUNG IN BACKWAREN.
Ztschr. f. Untersuch, der Nähr. u. (78) Genussmtl. 34: 490-491.
(62) HARCOURT, R., and FULMER, H. L.
1907. BREAKFAST FOODS. THEIR CHEMICAL COM- POSITION, DIGESTIBILITY, AND COST. (79) Ontario Agr. Col. Bui. 162, 56 pp.
(63) HARTMANN, B. G., and HILLIG, F.
1934. ACID CONSTITUENTS OF FOOD PRODUCTS. (80) SPECIAL REFERENCE TO CITRIC, MALIC, AND TARTARIC ACIDS. AsSOC. Off. AgT. Chem. Jour. 27: 522-531. (81)
(64) HAWLEY, E. E., MURLIN, J. R., NASSET, E. S.,
and others. 1948. BIOLOGICAL VALUES OF SIX PARTIALLY-
PURIFIED PROTEINS. Jour. Nutr. 36: 153-169, illus. (82)
(65) HEADDEN, W. P.
1927. EFFECTS OF NITRATES ON COMPOSITION OF
ÍHE POTATO. Colo. Expt. Sta. BUI. 325, 96 pp., ülus.
(66) HERTWIG, R.
1923. DETERMINATION OF FAT IN ALIMENTARY (83)
PASTE, FLOUR AND D^IED EGG. ASSOC.
Off. Agr. Chem. Jour. 6: 508-510. (67) HEUPKE, W., MIESEN, G., and PREISER, A.
1939. DIB AUSNUTZUNG DER EDELKASTANIE. (84) Ernähr. [Leipzig] 4: 238-242.
(68) HILLS, J. L., WAIT, C. E., and WHITE, H. C.
1909. DIETARY STUDIES IN RURAL REGIONS IN VERMONT, TENNESSEE, AND GEORGIA. (85) U. S. Dept. Agr. Off. Expt. Stas. Bul. 221, 142 pp., illus.
(69) HINDHEDE, M.
1913. STUDIEN ÜBER EIWEISS MINIMUM. Skand. (86) Arch. f. Physiol. 30: [97]-182.
(70) HOLMES, A. D. 1918. DIGESTIBILITY OF PROTEIN SUPPLIED BY (87)
SOYBEAN AND PEANUT PRESS-CAKE FLOURS. U. S. Dept. Agr. Bui. 717, 28 pp.
HOLMES, A. D. 1919. EXPERIMENTS ON THE DIGESTIBILITY OF
WHEAT BRAN IN A DIET WITHOUT WHEAT FLOUR. U. S. Dept. Agr. Bul. 75], 20 pp.
1920. DIGESTIBILITY OF STEAM-COOKED SOY BEANS AND PEANUTS. Amer. Med. Assoc. Jour. 74: 798-801.
IWANOFF, N. N. 1923. tÎBER DIE ANHÄUFUNG UND BILDUNG DES
HARNSTOFFS IN CHAMPIGNONS. BiO- chem. ztschr. 143: 62-74.
JACOANGELI, T., and BONANNI, A.
1897. L*ALIMENTAZIONE CON LE PASTE ALI- MENTARI ^ DI GRANTURCO E MISTE. Bol. di Not. Agr. 19 (Secondo Semes.;: 434-448.
JAFFA, M. E.
1903. FURTHER INVESTIGATIONS AMONG FRUI- TARIANS AT THE CALIFORNIA AGRI- CULTURAL EXPERIMENT STATION, 1901- 1902. U. S. Dept. Agr. Off. Expt. Stas. Bui. 132, 81 pp.
JONES, D. B.
1941. FACTORS FOR CONVERTING PERCENTAGES OF NITROGEN IN FOODS AND FEEDS INTO PERCENTAGES OF PROTEIN. U. S.
Dept. Agr. Cir. 183, 22 pp. (Slightly rev. ed.)
and WATERMAN, H. C.
1922. STUDIES ON THE DIGESTIBILITY OF PRO-
TEINS IN VITRO. III. ON THE CHEMI- CAL NATURE OF THE NUTRITIONAL DE- FICIENCIES OF ARACHIN. JOUT. Biol. Chem. 52: 357-366.
JOSLYN, M. A.
1950. METHODS IN FOOD ANALYSIS APPLIED
TO PLANT PRODUCTS. 525 pp., illuS. New York.
KBLSEY, H. P., and DAYTON, W. A., eds. 1942. STANDARDIZED PLANT NAMES. Ed. 2,
675 pp. Harrisburg, Pa. KEYS, A.
1943. PHYSICAL PERFORMANCE IN RELATION TO
DIET. Fed. Proc. 2: 164-187.
1945. THE REFINEMENT OF METABOLIC CALCU- LATIONS FOR NUTRITIONAL PURPOSES AND THE PROBLEM OF "AVAILABILITY." Jour. Nutr. 29: 81-84.
KLATSKIN, G., GEWIN, H. M., and KRBHL, W. A. 1951. EFFECTS OF PROLONGED ALCOHOL INGES-
TION ON THE LIVER OF THE RAT UNDER CONDITIONS OF CONTROLLED ADEQUATE DIETARY INTAKE. Yale JOUT. Biol. anjd Med. 23: [317K331, illus.
KoN, S. K., and KLEIN, A. 1928. XXXV. THE VALUE OF WHOLE POTATO IN
HUMAN NUTRITION. Biochem. Jour. 22: 258-260.
KONIG, J. 1904. CHEMIE DER MENSCHLICHEN NAHRUNGS-
UND GENUSSMITTEL. VOl. 2, 1,557 pp. Berlin.
KRAMER, M. M., and HALSTEAD, M. J.
1925. THE INFLUENCE OF THE METHOD OF PREP- ARATION ON THE DIGESTIBILITY OF CORN MEAL. Jour. Home Econ. 17: 75-78
KREBS, H. A., and MELLANBY, K.
1942. DIGESTIBILITY OF NATIONAL WHEATMEAL. Lancet (London] 242: 319-321.
KuEN, F. M., and Pí^RINGER, K. 1934. tjBER DIE AUSNUTZUNG VON FRISCHER
HEFE UND TROCKENHEFE. Biochem. Ztschr. 271: [152]-167.
53

(88)
(89)
(90)
(91)
(92)
(93)
(94)
(95)
(96)
(97)
(98)
(99)
(100)
(101)
(102)
(103)
(104)
(105)
KuETHER, C. A., and MYERS, V. C. 1948. THE NUTRITIVE VALUE OF CEREAL PRO-
TEINS IN HUMAN SUBJECTS. JOUF. Nutr. 35: 651-667.
LANGWORTHY, C. F. 1904. THE FUNCTIONS AND USES OF FOOD. U. S.
Dept. Agr. Off. Expt. Stas. Cir. 46 (rev.), 10 pp.
and DEUEL, H. J., JR. 1919. THE EFFECT OF MILLING ON THE DIGESTI-
BILITY OF GRAHAM FLOUR. Nati. Acad. Sei. Proc. 5: 514-517.
and DEUEL, H. J., JR. 1920. DIGESTIBILITY OF RAW CORN, POTATO, AND
WHEAT STARCHES. JouF. Biol. Chem. 42; 27-40.
and DEUEL, H.\J., JR. 1922. DIGESTIBILITY OF RAW RICE, ARROWROOT,
CANNA, CASSAVA, TARO, TREE-FERN, AND POTATO STARCHES. JouF. Biol. Chem. 52: 251-261.
and HOLMES, A. D. 1916. STUDIES ON THE DIGESTIBILITY OF THE
GRAIN SORGHUMS. U. S. Dept. AgT. Bul. 470, 30 pp.
and HOLMES, A. D. 1917. EXPERIMENTS IN THE DETERMINATION OF
THE DIGESTIBILITY OF MILLETS. U. S. Dept. Agr. Bui. 525, 11 pp.
and HOLMES, A. D. 1917. THE DIGESTIBILITY OF THE DASHEEN. U. S.
Dept. Agr. Bui. 612, 12 pp. and HOLMES, A. D.
1921. THE EFFECT OF A VARIATION IN MILLING ON THE DIGESTIBILITY OF WHEAT FLOURS. Nati. Acad. Sei. Proe. 7: 119-123.
and MERRILL, A. T. 1924. DIGESTIBILITY OF RAW STARCHES AND
CARBOHYDRATES. U. S.. Dept. Agr. Bul. 1213, 16 pp.
and MiLNER, R. D. 1904. INVESTIGATIONS ON THE NUTRITION OF
MAN IN THE UNITED STATES. U. S. Off. Expt. Stas. Doe. 713, 20 pp., illus.
LEHMANN, K. B. 1902. HYGIENISCHE UNTERSUCHUNGEN üBER
MEHL UND BROT. XI. T)BER DIE BEDEU-
TUNG DER SCHäLUNG UND ZERMAHLUNG
DES GETREIDES FÜR DIE AUSNUTZUNG (AVEDYK- UND STEINMETZVERFAHREN). Areh. f. Hyg. 45: 177-211.
LEUNG, W. W., PBCOT, R. K., and WATT, B. K. 1952. COMPOSITION OF FOODS USED IN FAR
EASTERN COUNTRIES. U. S. Dept. AgT. Handb. 34, 62 pp.
LusK, G. 1928. THE ELEMENTS OF THE SCIENCE OF NUTRI-
TION. Ed. 4, 844 pp., illus. Phila- delphia and London.
MCCANCE, R. A., and GLASER, E. M. 1948. THE ENERGY VALUE OF OATMEAL AND THE
DIGESTIBILITY AND ABSORPTION OF ITS PROTEINS, FATS AND CALCIUM. Brit. Jour. Nutr. 2: 221-228.
arid LAWRENCE, R. D. 1929. THE CARBOHYDRATE CONTENT OF FOODS.
Brit. Med. Res. Couneil Spec. Rpt. Ser., No. 135, 73 pp. London.
and WALSHAM, C. M. 1948. THE DIGESTIBILITY AND ABSORPTION OF
THE CALORIES, PROTEINS, PURINES, FAT AND CALCIUM IN WHOLEMEAL WHEATEN BREAD. Brit. Jour. Nutr. 2: 26-41, illus.
and WiDDOwsoN, E. M, 1940. THE CHEMICAL COMPOSITION OF FOODS.
Brit. Med. Res. Council Spec. Rpt. Ser., No. 235, 150 pp. London.
(106)
(107)
(108)
(109)
(110)
(111)
(112)
(113)
(114)
(115)
(116)
(117)
(118)
(119)
(120)
(121)
(122)
(123)
MCCANCB, R. A., and WIDDOWSON, E. M. 1947. THE DIGESTIBILITY OF ENGLISH AND CANA-
DIAN WHEATS WITH SPECIAL REFERENCE TO THE DIGESTIBILITY OF WHEAT PRO- TEIN BY MAN. Jour. Hyg. 45: 59-64.
and WIDDOWSON, E. M. 1947. THE CHEMICAL COMPOSITION OF FOODS.
Ed. 2, rev. [Reprint of British ed. 2, 1946. No basic text changes.] 156 pp. Brooklyn, N, Y.
WIDDOWSON, E. M., MORAN, T., and others. 1945. THE CHEMICAL COMPOSITION OF WHEAT
AND RYE AND OP FLOURS DERIVED THEREFROM. Biocliem. Jour. 39: 213— 222, illus.
McCoNNELL, J. E. W., and ESSELEN, W. B., JR. 1947. CARBOHYDRATES IN CULTIVATED MUSH-
ROOMS (AGARICUS CAMPESTRIS). Food Res. 12: 118-121.
MACRAE, T. F., HUTCHINSON, J. C. D., IRWIN, J. O., and others.
1942. COMPARATIVE DIGESTIBILITY OF WHOLE-
MEAL AND WHITE BREADS AND THE EFFECT OF THE DEGREE OF FINENESS OF GRINDING ON THE FORMER. JOUF. Hyg. 42: 423-435.
MACY, I. G. 1942. NUTRITION AND CHEMICAL GROWTH IN
CHILDHOOD. VOL. I. EVALUATION. Springfield, 111. and Baltimore, Md.
[1946.] NUTRITION AND CHEMICAL GROWTH IN CHILDHOOD. VOL. II. ORIGINAL DATA. Springfield, 111.
MALFATTI, H. 1884. üBER DIE AUSNUTZUNG EINIGER NAHB-
UNGSMITTEL IM DARMCANAL DES MEN- SCHEN. K. Akad. der Wiss. Sitzber. [Vienna] 90: 323-350.
MAYNARD, L. A. 1944. THE ATWATER SYSTEM OF CALCULATING
THE CALORIC VALUE OF DIETS. JOUP. Nutr. 28: 443-452.
1946. INTERNATIONAL FOOD-EVALUATION ACTIVI- TIES AND PROBLEMS. Fed. Proc. 5: 270- 273
MENDEL, L. B. 1898. THE CHEMICAL COMPOSITION AND NUTRI-
TIVE VALUE OF SOME EDIBLE AMERICAN FUNGI. Amer. Jour. Physiol. 1: [225]- 238.
and FINE, M. S. 1912. STUDIES IN NUTRITION. IV. THE UTILI-
ZATION OF THE PROTEINS OF THE LEGUMES. Jour. Biol. Chem. 10: 433-458.
MERRILL, A. L., and WATT, B. K. 1948. PHYSIOLOGIC ENERGY VALUES OF WHEAT.
Amer.^Dietet. Assoe. Jour. 24: 953-956. MERRILL, L. H. '
1905. CEREAL FOODS. Maine Agr. Expt. Sta. Bui. 118, pp. [117J-135.
1906. INDIAN CORN AS FOOD FOR MAN. Dl- G'ciSTION EXPERIMENTS WITH CHEST- NUTS. Maine Agr. Expt. Sta. Bui. 131: [1331-148.
1908. FOOD OF MAN STUDIES. Maine Agr. Expt. Sta. Bui. 158, pp. [219J-238.
MITCHELL, H. H., and CURZON, E. G. 1940. THE FOOD VALUE OF ETHYL ALCOHOL.
Quart. Jour, of Studies on Alcohol 1: [2271-245.
MöRNBR, C. T. 1886. BEITRÄGE ZUR KENNTNISS DES NIHR-
WERTHES EINIGER ESSBAREN PILZE. Ztschr. f. Physiol. Chem. 10: [503}-516
54

(124)
(125)
(126)
(127)
(128)
(129)
(130)
(131)
(132)
MuRLiN, J. R., EDWARDS, L. E., HAWLEY, E. E., and CLARK, L. C.
1946. BIOLOGICAL VALUE OF EROTEINS IN RE- LATION TO THE ESSENTIAL AMINO ACIDS WHICH THEY CONTAIN. I. THE ENDOGENOUS NITROGEN OF MAN. Jour. Nutr. 31: 533-554, illus.
EDWARDS, L. E., FRIED, S., and others. 1946. BIOLOGICAL VALUE OF PROTEINS IN RELA-
TION TO THE ESSENTIAL AMINO ACIDS WHICH THEY CONTAIN. III. COM- PARISON OF PROTEINS WITH MIXTURES OF THE AMINO ACIDS. JOUF. Nutr. 31: 715-736.
LINE, W. R., PIPER, H. A., and PIERCE, H.B. 1929. THE NUTRITIVE VALUE OF CEREAL BREAK-
FAST FOODS. I. COMPOSITION AND HEAT VALUE. JouF. Nutr. 2: 83-90.
MARSHALL, M. E., and KOCHAKIAN, C. D. 1941. DIGESTIBILITY AND BIOLOGICAL VALUE OF
WHOLE WHEAT BREADS AS COMPARED WITH WHITE BREAD. JouF. Nutr. 22: 573-588, illus.
and MATTILL, H. A. 1938. DIGESTIBILITY AND NUTRITIONAL VALUE
OF CEREAL PROTEINS IN THE HUMAN
SUBJECT. Jour. Nutr. 16: 15-35. NäSSET, E. ö., and MARSH, M. E.
1938. THE EGG-REPLACEMENT VALUE OF THE
PROTEINS OF CEREAL BREAKFAST FOODS, WITH A CONSIDERATION OF HEAT IN- JURY. Jour. Nutr. 16: 249-269.
NEUBERGER, A., and SäNGER, F. 1942. THE NITROGEN OF THE POTATO. Biochcm.
Jour. 36: 662-671. NEUMANN, R. O.
1906. DIE BEWERTUNG DES KAKAOS ALS NAH-
RUNGS- UND GENUFSMITTEL. I. TEIL, VERSUCHE TïBER DEN EINFLUFS DER MENGE, DES FETTGEHALTES, DES SCHA-
LENGEHALTES, DES KAKAOS UND DER
MIT DEMSELBEN EINGEFüHRTEN NAHR- UNG AUF DIE RESORPTION UND ASSIMI- LATION DESSELBEN. Arch. f. Hyg. 58: 1-62. (Data from Beddies, A., pp. 16-17.)
1906. DIE BEWERTUNG DES KAKAOS ALS NAHR- UNGS-UND GENUFSMITTEL. II. TEIL. VER- SUCHE MIT VERSCHIEDENEN KAKAO- HANDELSSORTEN. Arch. f. Hyg. 58: 63-124.
(133) NEWMAN, L. F., ROBINSON, G. W., HALNAN, E. T., and NEVILLE, H. A. D.
1912. SOME EXPERIMENTS ON THE RELATIVE DIGESTIBILITY OF WHITE AND WHOLE MEAL BREADS. Jour. Hyg. 12: [119]- 143.
(134) OSHIMA, K. 1905. A DIGEST OF JAPANESE INVESTIGATIONS
ON THE NUTRITION OF MAN. U.S. Dept. Agr. Off. Expt. Stas. Bui. 159, 224 pp.
(135) PiTTMAN, M. S. 1932. THE UTILIZATION BY HUMAN SUBJECTS OF
THE NITROGEN, CALCIUM, AND PHOS- PHORUS OF THE NAVY BEAN (PHASEOLUS VULGARIS) WITH AND WITHOUT A SUP- PLEMENT OF CY8TINE. Jour. Nutr. 5: 277-294.
(136) PLAGGE and LEBBIN. 1897. UNTERSUCHUNGEN ÜBER DAS SOLDATEN-
BROT. 234 pp., illus. Berlin. (Ver- öffentlichungen aus dem Gebiete des Militär-Sanitätswesens, Heft 12.)
(137) PRAUSNITZ, W. 1890. DIE AUSNUTZUNG DER BOHNEN IM DARM-
KANALE DES MENSCHEN. Ztschr. f. Biol. 26: 227-232.
(138)
(139)
(140)
(141)
(142)
(143)
(144)
(145)
(146)
(147)
(148)
(149)
(150)
(151) •
(152)
(153)
(154)
(155)
PUGLIESE, A. 1915. LA VALEUR ALIMENTAIRE DES DIVERS
TYPES DE PAIN. Rev. Gén. des Sei. Pures et Appl. 26: 612-617, illus.
REMY, E. 1931. EXPERIMENTELLE STUDIEN ZUR BIOCHEMIE
UND BIOLOGIE DER ROHFASER. Bio- chem. Ztschr. 236: 1-18.
RICHTER, A. P. F. 1903. tÎBER DIE AUSNtÏTZUNG VON ERBSEN IM
DARMKANAL DES MENSCHEN BEI WEI- CHEM UND HARTEM KOCHWASSER. Arch. f. Hyg. 46: 264-273.
ROMBERG, E. 1897. DER NäHRWERTH DER VERSCHIEDENEN
MEHLSORTEN EINER MODERNEN ROGGEN-
KUNSTMÜHLE. Arch. f. Hyg. 28: [244]- 290.
ROSE, M. S., and COOPER, L. F. 1917. THE BIOLOGICAL EFFICIENCY OF POTATO
NITRO GE !^. Jour. Biol. Chem. 30: 201- 204.
and MACLEOD, G. 1925 MAINTENANCE VALUES FOR THE PROTEINS
OF MILK, MEAT, BREAD AND MILK, AND SOY BEAN CURD. Jour. Biol. (jhem. 66: 847-867.
RUBNER, M. 1879. UEBER DIE AUSNUTZUNG EINIGER NAHR-
UNGSMITTEL IM DARMCANALB DES MEN- SCHEN. Ztschr. f. Biol. 15: [1151-202.
1880. UEBER DTE AUSNt5TZUNG DER ERBSEN IM DARMKANALE DES MENSCHEN. Ztschr. f. Biol. 16: 119-128.
1883. UEBER DEN WERTH DER WEIZENKLEIE FtÍR DIE ERNÄHUNG DES MENSCHE>i. Ztschr. f. Biol. 19: 45-100.
1885. CALORIMETRISCHB UNTERSUCHUNGEN. I AND IT. Ztschr. f. Bio!. 21: [250]-334; (3371-410.
1901. DER ENERGIBWERT DER KOST DES MEN- SCHEN. Ztschr. f. Biol. 42: [2611-308.
1930. ÜBER DIE ELEMENTARZUSAMMENSETZUNG DES HARNES BEI VERSCHIEDENER ERNÄHRUNG NACH VERSUCHEN VON ELMER BERRY M. P. E. Ztschr. f. die Gesam. Expt. Med. 72: [1441-177.
and HEUBNER, O. 1898. DIE NATtJRLICHE ERNÄHRUNG EINES SÄUG-
LINGS. Ztschr. f. Biol. 36: 1-55. and THOMAS, K.
1918. DTE ERNÄHRUNG MIT KARTOFFELN. Arch. f. Anat. u. Physiol. (Physiol. Abt.) pp. 1-15.
SALTET, R. H. 1885. UEBER DIE BEDEUTUNG DER ESSBAREN
SCHWäMME ALS NAHRUNGSMITTEL FTíR DEN MENSCHEN. Arch. f. Hvg. 3: [4431-463.
SCHLESTNGER, H. 1895. BEITRÄGE ZUR BEURTHEILUNG DES CACAOS
BEI DER ERNÄHRUNG DES MENSCHEN. Deut. Med. Wchnschr. 21: 80-82.
SCHOCH, T. J. 1938. ABSENCE OF COMBINED FATTY ACID IN
CEREAL STARCHES. (Communications to the Editor.) Amer. Chem. Soc. Jour 60: 2824-2825.
SEALOCK, R. R., BASINSKI, D. H., and MURLIN, J. R 1941. APPARENT DIGESTIBILITY OF CARBOHY-
DRATES, FATS, AND *'INDIGESTIBLE RESI- DUE" IN WHOLE WHEAT AND WHITE BREADS. Jour. Nutr. 22: 589-596, illus.
55

(156)
(157)
(158)
(159)
(160)
(161)
(162)
(163)
(164)
(165)
(166)
(167)
(168)
(169)
(170)
(171)
(172)
SHERMAN, H. C. 1902. THE METABOLISM OF NiTROGEfi, SULPHUR,
AND PHOSPHORUS IN THE HUMAN ORGAN- ISM. U. S. Dept. Agr. Off. Expt. Stas. Bui. 121, 47 pp., illus.
1911. CHEMISTRY OF FOOD AND NUTRITION. 355 pp., illus. New York.
1937. CHEMISTRY OF FOOD AND NUTRITION. Ed. 5 640 pp., illus. New York.
1952. CHEMISTRY OF FOOD AND NUTRITION. Ed. 8, 721 pp., illus. New York.
SHERWOOD, R. C, NORDGREN, R., and ANDREWS, J. S.
1941. THIAMIN IN THE PRODUCTS OF WHEAT MILLING AND IN BREAD. Cere&l Chem. 18: 811-819, illus.
SKINNER, J. T., PETERSON, W. H., and STEENBOCK, H.
1933. NÄHRWERT VON SCHIMMELPILZMYCBL. Biochem. Ztschr. 267: [169]-178.
SNYDER, H.
1897. THE DIGESTIBILITY OF POTATOES AND
EGGS. In U. S. Dept. Agr. Ofif. Expt. Stas. Bui. 43, Losses in Boiling Vege- tables and the Composition and Digesti- bility of Potatoes and Eggs, pp. 20-24.
1899. MISCELLANEOUS ANALYSES: COMPOSITION OF TOMATOES. PROTEIDS OF WHEAT FLOUR. Minn. Agr. Expt. Sta. Bui. 63, pp. [495h533.
1901. STUDIES ON BREAD AND BREAD MAKING AT THE UNIVERSITY OF MINNESOTA IN 18W AND 1900. U. S. Dept. Agr. Off. Expt. Stas. Bui. 101, 65 pp., illus.
1902. HUMAN FOOD INVESTIGATIONS. Uriv. Minn. Agr. Expt. Sta. Bui. 74, pp. [109hl74, ülus. -
1903. STUDIES ON THE DIGESTIBILITY AND NUTRI- TIVE VALUE OF BREAD AT THE UNI- VERSITY OF MINNESOTA IN lftOO-1902. U. S. Dept. Agr. Off, Expt. Stas. Bui. 126, 52 pp., illus.
1905. THE DIGESTIBILITY AND NUTRITIVE VALUE OF COTTAGE CHEESE, RICE, PEAS AND BACON. Univ. Minn. Agr. Expt. Sta. Bui. 92, pp. [2591-275.
1905. STUDIES ON THE DIGESTIBILITY AND NUTRITIVE VALUE OF BREAD AND OF MACARONI AT THE UNIVERSITY OF MINNESOTA, 1903-1Ö05. U. S. Dept. Agr. Ofif. Expt. Stas. Bui. 156, 80 pp., illus.
1908. HUMAN FOODS AND THEIR NUTRITIVE VALUE. 362 pp., illus. New York,
and VooRHEEs, L. A. 1899. STUDIES ON BREAD AND BREAD MAKING.
U. S. Dept. Agr. Off. Expt. Stas. Bui. 67, 51 pp., illus. (Reprinted, 1903.)
SOUTHARD, L., RICHARDS, E. H., USHER, S., TER- RiLL, B. M., and SHAPLEIGH, A.
1903. DIETARY STUDIES IN BOSTON AND SPRING- FIELD, MASS., PHILADELPHIA, PA., AND CHICAGO, ILL. U. S. Dept. Agr. Off. Expt. stas. Bui. 129, 103 pp.
SPRIGGS, E. I., and WEIR, A. B. 1917. THE DIGESTIBILITY OF BREAD MADE FROM
TWO PARTS OF WHEAT AND ONE PART OF OATS, BARLEY, MAIZE, OR RICE. Lancet [London] 193: 724-726.
(173)
(174)
(175)
(176)
(177)
(178)
STREET, H. E., KENYON, A. E., and WATSON, G. M.
1946. THE NATURE AND DISTRIBUTION OF VARIOUS FORMS OF NITROGEN IN THE POTATO^ Anil. Appl. Biol. 33: 1-12, illus.
STREET, J. P., and BAILEY, E. M.
1915. THE CARBOHYDRATES AND THE XNIYMES OF THE SOY BEAN, ludus. and Engin. Chem. Jour. 7: 853-858.
STROHMER, F.
1886. EIN BEITRAG ZUR KENNTNIS DER ESS- BAREN SCHWÄMME. Arch. f. Hyg. 5: f322}-332.
STRîJMPELL, A.
1875. UEBER DEN NäHRWERTH DER LEGUMI-
NOSEN UND IHRE BEDEUTUNG ALS KRANKENSPEISE. Deut. Arch. f. Klin. Med. 17: [108H19.
STUTZER, A.
1891. NEUES AUS DER RöST-, DARR- UND TROCK- NUNGS-INDUSTRIE. Ztschr. f. Angew. Chem. Jahrg. 1891, Heft. 12: 368-375.
SUGIMOTO, K. 1926. STUDIES ON THE DIGESTIBILITY AND
UTILISATION OF RICE OF DIFFERENT GRADES OF POLISHING. In Saiki T., [ed.] Progress of the Science of Nutri- tion in Japan. League of Nations Health Organ. III. Health III. 25. C. H. 523 pp. [87H54'
Mo: HiGUCHi, M., MoMOYEDA, S., and others. (179) — 1926. THE DIGESTIBILITY AND UTILISATION OF
RICE COOKED BY DIFFERENT METHODS. In Saiki, T., [ed.] Progress of the Science of Nutrition in Japan. League of Nations Health Organ. III. Health III. 25. C. H. 523, pp. [155]-233.
(180) TANGL, F.
1899. BEITRAG ZUR KENNTNIS8 DES ENERGIEGE- HALTES DES MENSCHLICHEN HARNES. In Arch. f. Anat. u. Physiol. (Physiol. Abt.), pp. 251-266. Leipzig.
(181) Tso, E., and CHU, F. T. 1931. NITROGEN METABOLISM IN INFANTS ON
GRADED INTAKE OF SOYBEAN "MILK" PROTEINS. Chinese Jour. Physiol. 5: 287-294, illus.
(182) UNITED STATES BUREAU OF AGRICULTURAL ECO- NOMICS.
1953. CONSUMPTION OF FOOD IN THE UNITED STATES, 190^62. U. S. Dept. Agr. Handb. 62, 249 pp., illus.
(183) UNITED STATES DEPARTMENT OF AGRICULTURE, DIVISION OF CHEMISTRY.
1898. FOODS AND FOOD ADULTERANTS. (Investi- gation under direction of H. W. Wiley.) U. S. Dept. Agr. Bui. 13, pp. 1169-1374, illus.
(184) WAIT, C. E.
1907. STUDIES ON THE DIGESTIBILITY AND NUTRITIVE VALUE OF LEGUMES AT THE UNIVERSITY OF TENNESSEE, 1901-1ô06. U. S. Dept. Agr. Off. Expt. Stas. Bui. 187, 55 pp.
(185) WATT, B. K., and MERRILL, A. L. 1950. COMPOSITION OF FOODS RAW, PROCESSED,
PREPARED. U. S. Dept. Agr. Handb. 8, 147 pp.
(186) WEINSTOCK, A., and BENHAM, G. H.
1951. THE USE OP ENZYME PREPARATIONS IN THE CRUDE FIBER DETERMINATION. Cereal Chem. 28: 490-497, illus.
(187) WILLIAMS, R. D., and OLMSTED, W. H. 1935. A BIOCHEMICAL METHOD FOR DETERMINING
INDIGESTIBLE RESIDUE (CRUDE FIBER) IN FECES: LIGNIN, CELLULOSE, AND NON-WATERSOLUBLE HEMICELLULOSES. Jour. Biol. Chem, 108: 653-666.
56

(188) WILLIAMS, R. T., éd. 1952. LiPiD METABOLISM. Biochem. Soc. Sym-
posia 9, 101 pp. [London.] (189) WiNTGEN, M.
1905. UEBER DIE AUSNUTZBARKEIT VON LEGUMI- NOSENMEHLEN. Vëroffentl. aus. dem Gebiete des Milit.—Sanitatsw. 29: [37]-55.
(190) WOLLAEGER, E. E,, COMFORT, M. W., and OSTER- BERG, A. E.
1947. TOTAL SOLIDS, FAT AND NITROGEN IN THE FECES: III. A STUDY OF NORMAL PER- SONS TAKING A TEST DIET CONTAINING A MODERATE AMOUNT OF FAT; COM- PARISON WITH RESULTS OBTAINED WITH NORMAL PERSONS TAKING A TEST DIET CONTAINING A LARGE AMOUNT OF FAT. Gastroenterol. 9: 272-283.
(191) LuNDBERG, W. O., CHIPAULT, J. R., and MASON, H. L.
1953. FECAL AND PLASMA LIPIDS. A STUDY OF 2 NORMAL HUMAN SUBJECTS TAKING (1) A DIET FREE OF LIPID AND (2) A DIET CONTAINING TRIOLEIN AS THE ONLY
LIPID. Gastroenterol. 24: 422-436.
(192) WOOD, T. B. 1911. THE COMPOSITION AND FOOD VALUE OF
BREAD. Royal Agr. Soc. England Jour. 72: 1-24.
(193) WOODS, C. D., and MERRILL, L. H. 1900, A REPORT OF INVESTIGATIONS ON THE
DIGESTIBILITY AND NUTRITIVE VALUE OF BREAD. U. S. Dept. Agr. Off. Expt. Stas. Bui. 85, 51 pp.
(194)
(195)
(196)
and MERRILL, L. H. 1904. ENTIRE WHEAT FLOUR. Maine Agr. Expt.
Sta. Bui. 103, pp. [61]-76, illus.
and MERRILL, L. H. 1904. STUDIES ON THE DIGESTIBILITY AND
NUTRITIVE VALUE OF BREAD AT THE MAINE AGRICULTURAL EXPERIMENT STA- TION 1899-1903. U. S. Dept. Agr. Off. Expt. Stas. Bui. 143, 77 pp.
and SNYDER, H. 1906. CEREAL BREAKFAST FOODS. U. S. Dept.
Agr. Farmers' Bui. 249, 36 pp.
57

APPENDIX. TABULAR SUMMARY OF EXPERIMENTS ON DIGESTÍ- BILITY OF FOODS OF PLANT ORIGIN BY HUMAN SUBJECTS
Apparent DisesHbility and Available Energy Scope of compilation.—The compilation of human di-
gestion experiments given in table 23 presents data on the apparent digestibility of protein, fat, carbohydrate, and energy, and in some cases the availability of the total energy of various foods of plant origin. It covers research in this field since 1875. Data published in languages other than English may not have been covered completely but the greater portion is believed to have been reviewed. The reports included in the compilation may be identified by the numbers in the last column of the table, which refer to Literature Cited, page 51.
Coefficients of apparent digestibility of fat are shown in the table, but in many cases are not considered to be reli- able. With the exception of a few kinds of plant foods, such as nuts, the fat content is too low to contribute more than a small part of the total fat intake. Thus, in calcu- lating the digestibility of the fat of the test food even a small error in the assumptions made for digestibility of fat of the remainder of the diet may result in a relatively large error in the estimated digestibility of the test food.
Too much importance should not be given to the re- ported figures for gain or loss of body nitrogen in studies in which the experimental periods were short and in studies in which no preliminary period on the experimental
) diet was indicated. If the period on the experimental diet had been sufficiently long the subjects might have reached nitrogen equilibrium.
This compilation includes studies in which the apparent digestibility of the test food was reported or could be cal- culated from data given by the author. A wide variety of experimental conditions are represented, some of which were too extreme for derivation of coefficients of digesti- bility for general use as represented in table 13. However, they are useful in considering the effects that various con- ditions of dietary intake and experimental procedures may have upon the digestibility of foods and for this reason are included in the compilation.
Order of foods.—The order in which the food groups appear in the table follows that used by Atwater and Bryant in their report of 1899 {17) and by the Food and Agriculture Organization ad hoc Committee in its report of May 1947 (65). This order seemed desirable in that the first two groups, "Grain, Grain Products" and ''Le- gumes and Nuts," are both important sources of calories, and it is on foods in these two groups the greater portion of the research on digestibility of foods of plant origin has been done.
The food items within each group have been arranged alphabetically except where some other arrangement is believed to be more useful to the reader. For example, the wheat items are in the order of their relation to the original grain, starting with the items most similar to the whole grain in composition and form. Thus, the whole-grain flours appear first, followed by intermediate extractions, 80-percent extraction and lower extractions.
The common plant names in table 23 are followed by their scientific names to aid the user in identification of items. Occasionally the scientific names were given by the authors (items 23, 24, 88-91, 316-320). Otherwise we have used the ones preferred in Standardized Plant Names {79) with a few exceptions where other names were recom- mended by the Horticultural Crops Research Branch of the Agricultural Research Service, U. S. Department of Agriculture.
Apparent digestibility.—The coefficients of digestibility reported in the table represent apparent digestibility. In calculating the apparent digestibility no attempt has been made to distinguish between metabolic products euñé un- digested food in the feces. Using protein as an example, these coefficients are calculated as follows:
Protein in- Protein (from
w fnnT~ ^^'St?i^ '"^ Coefficient of apparent test food feces y 100=digestibility of protein
Protem mtake from test food of test food as percent.
Where there were no data on the basal diet and the diets used were relatively simple, the fecal protein for the diet exclusive of the test food was calculated from the coeffi- cient of digestibility of the various items in the diet. For example, in a very simple diet of bread and milk in which bread was the test food, it was commonly assumed that milk protein would have a digestibility of 97 percent. Then the fecal protein from milk would be 3 percent of the milk protein intake (100—97) and that from bread would be the difference between the total fecal protein and the milk fecal protein.
When the authors determined the digestibility of a mixed diet during a preliminary period and then substituted the test food for a specified proportion of the mixed diet, it was assumed that reducing the intake of the basal diet did not change its digestibility. If the test- food replaced 15 per- cent of the basal diet, the fecal protein in the test period due to the basal diet was considered to be 85 percent of the fecal protein found experimentally for the basal period. The resulting value was subtracted from the total fecal protein in the test period to obtain the protein from the test food in the feces.
The coefficients of digestibility of fat, carbohydrate, and of energy have been calculated in the same way.
The proportion of gross energy available to the body was reported in a limited number of studies. To obtain this value the energy lost in the urine, as well as the energy value of the feces, was deducted from the gross energy of the food intake. The absorbed fat and carbohydrate were considered to be completely oxidized, and the unoxidized organic matter of the urine was assumed to be mainly nitrogenous products. The energy loss in the urine was assumed to average 1.25 calories per gram of absorbed protein. On these assumptions the available energy of the test food was calculated as follows:
Gross energy of test food —fecal energy from test food —energy Tost in urine (digestible protein from test foodX 1.25) = available energy from test food.
Available energyX 100„Percent of gross energy available Gross energy to the body.
Table 22 shows in detail the results of calculations for estimating the coefficients of digestibility of protein, fat, carbohydrate, and energy, and the proportion of energy actually available to the body. This experiment was taken from one of the early reports of Snyder {164)-
Adaptations of published data.—^All the studies in which original basic data were reported by the authors have been recalculated prior to inclusion in table 23. Differences, when found, between the results as originally reported and the recalculated figures were of three types:
S8

1. Whereas in most studies investigators assumed di- gestibility coefficients for the basal foods close to or the same as those shown in table 13, in occasional studies they applied other coefficients of digestibility. As a re- sult, the original figures for digestibility and proportion of energy available from the test food were in some cases considerably different from results we obtained by apply- ing the usual coefficients to the basal diets. If our recal- culated figures differed from the reported results by more than 1 percent, they were entered in table 23, and atten- tion called to this change by a footnote.
2. In some studies the authors did not report apparent digestibility or available energy but reported the basic data needed for making such calculations. For these cases we have calculated the values entered in table 23 as noted in a footnote.
3. In still other experiments when we used the basic data and assumptions reported by the authors in calcula- tion, we obtained a different result. Our recalculated values have been entered in brackets in table 23-
TABLE 22.—Use of digestibility data to determine coefficients of apparent digestibility and available energy
Sample No.
Weight of material
Protein (Nx6.25) Fat Carbo-
hydrate Ash Heat of combustion
70 Food consumed:
Bread (made from graham flour) _ _ _ _ Orams 908.3
3, 250. 0
Grams 70.5 95.9
Qrams 11.5
113.8
Orams 389.0 167.4
Grams 8.6
25.7
Calories 2, 093
69 Milk ._ 2,327
Total _ . _ _ 166.4 125.3 556.4 34.3 4,420
Feces (water free) 71 90.0 16.3 2.9
9.4 5.7
49. 6 3.3
14.7 392 Estimated feces from food other than bread 83
Estimated feces from bread 13.4 3.7 46.3 309
Total amount digested 150. 1 57. 1
115.9 7.8
506. 8 342.7
19.6 4,028 Estimated digestible nutrients in bread . 1, 784
Coefficients of digestibility of total food Percent
90.2 81.0
Percent 92. 5 67.8
Percent 91. 1 88. 1
Percent 57. 1
Percent 91. 1
Estimated coefficients of digestibility of bread 85.2 Proportion of energy actually available to body:
In total food 86. 9 In bread alone __ 81. 8
NOTE.—This table appears as table 18 in U. S. Department of Agriculture Bui. 101 {164)-
Terms and symbols used.—References to ''authors" in either the footnotes or descriptive columns in table 23 apply to the authors of the specific digestibility reports and not to the compilers of table 23.
The proportion of protein, fat, carbohydrate, and energy supplied by the test food in the diet has been shown in the table wherever suitable information on composition and amounts of food were reported. In some cases composi- tion data given were not complete and we have used figures from Agriculture Handbook No. 8 (186) to supply missing composition data and have entered the results in parentheses in table 23.
Parentheses were used also in the descriptive columns for added explanatory phrases as interpreted from the
authors' description. To illustrate, for item 9 the term "hominy" was not used in the text of the article but since there was little doubt as to the identity of the product this interpretation of the test food was noted in parenthesis in addition to the author's description of the product.
Quotation marks have been used with certain food items to indicate that they were quoted directly from the article. This was done whenever a term might have different con- notations. For example, entire-wheat flour, as used in studies reported in the early part of the 20th century, was a flour of intermediate extraction having part of the bran removed. Today this term applies to a whole-grain product.
59

s TABLE 23.—Apparent digestihüiiy and available energy of foods of plant origin for human subjects
8
9
10
Pest food, description
GRAINS. GRAIN PRODUCTS
Barley Products {Hord- eum vulgäre):
Barley,* flaked
Barley,* germinated, flaked.
Barley products (pearled; flaked).»
Buckwheat Products ( Fagopyru m esculeu' turn):
(Farina, flour, groats)»
Flour*
Flour (presumably sim- ilar to item 5).
Corn, Corn Products (Zea mays):
Field com, yellow hy- brid, dried several days.
Hominy*-.
(Hominy),* hulled us- ing alkali, steamed.
Meal, coarsely ground, sifted through 16- mesh sieve.
Meal* (presumably de- germed, fiber and ash low).
Diet
Barley porridge, cooked 20 min.; cream, sugar. Average daily in- take: 26 gm. protein, 1,780 calories.
Barley porridge, cooked 20 min.; cream, sugar. Average daily in- take: 28 gm. protein, 2,170 calories.
Buckwheat flour, boiled with water, salt, and small amount meat ex- tract. 600 gm. uncooked weight of flour eaten daily.
Buckwheat flour, prepared like macaroni; beef extract, shoyu.
Com, ground and cooked with water and salt. Also unground, cooked 1 "hr. at 15 lb. pressure. Sucrose added in diets of A F and OS; butter, in diet of CK.
Hominy, cooked. Eaten in simple and mixed diets,'*
Hulled steamed com, rnilk
Combread (recipe: 15 c. commeal, V/i c. molasses, 1 c. lard, V/s qt. water, 3M tsp. salt, 3H tsp. soda, 5 tsp. ginger), potatoes, apple- sauce, butter, sugar. Average daily intake: 38 gm. protein, 115 gm, fat, 451 gm. carbohydrate,
Commeal porridge, cooked 20 min.; cream, sugar. Average daily in- take: 27.6 gm. protein, 1,930 calories.
Subject and
weight
Kg. (CBT ^FAC [Av. ÍFAC JWJH iCBT [Av.
KY 46
KY 47
AF 86 CK 78 GS 75 Av. _-.
IDGG . IRLS . (OES . ]AV. .
KGMc. JEB . CRK . Av. _
Daily intake per kilogram body weight
Pro- tein
1.0
Gross energy
Cal.
Proportion of total intake supplied by test food
Pro- tein
Pet. 63 75 69 81 80 78 80
(89)
100 100 100 100
Fat
Pd.
100
Car- bohy- drate
Pd. 64 72 68 68 68 65 67
100
(55) (60) (50) 55
Gross energy
Pd. 43 53 48 40 40
Coefficient of apparent digesti- bility of test food
Pro- tein
Pd. 57.6 74.0 65.8 67.8 76.9 69.3 71.3
77.8
77.8
74.3
162.9 1,58.4 171.2
64.2
74.5
61.2
153.5 168.1 151.6
57.7
75.0 74.3 71.9 73.7
Fat
Pd.
Car- bohy- drate
Pd. 96.3 97.2 96.8 97.0 98.4 97.3 97.6
93,8
93.8
96.8
95.1 97.2 96.2 96.2
99.2 99.1 98,3
Energy
Pd. 187,3 190.6
89.0 192,7 196.8 193,1
94.2
86.4
86.4
94,4
197,4 196.1 195.6
96.4
Por- tion of gross
energy avail- able
Pd. 2 85.9 '88,5
87,2 Ï [90. 4] 2 94,3 >90,7
91,8
3 95.6 «94.5 2 94.0
94.7
Remarks
Subjects, young men. Ex- perimental period, 4 days. No preliminary experi- mental period. Fecal marker, lampblack.
(Subjects, healthy men. Co- efficients of digestibility estimated by authors from unpublished data available at Conn., Maine, and Minn. Agr, Expt.
, Stas. Subject, 47-yr. old man.
Experimental period, 3 days. Marker, red mun- go bean. Study by Y. Washitsu and K. Uki in (ÎS4, p. 166).
Subject, 49-yr. old man. Experimental period, 3 days. Marker, raw red mungo bean. Study by K, Kawanishi in (1S4, p. 167).
Subjects, 3 men. Collection period, 9 days, began on 3rd day. Marker, char-
( coal or barium sulfate at beginning and end collec- tion period. N'-balance average, — 1.6gm, per day.
Subjects (see remarks, item 14). Experimental pe- riod, 6 days.
4 subjects, C, D, M, S. 8 experiments. Authors' usual method followed.
[Subjects, young men. Ex- perimental period, 3 days. Marker, charcoal. See also remarks for sorghum,
[ items 88-91.
Subjects, young men. Ex- perimental period, 4 days. Marker, lampblack.
62
196
88
120
121

18
19
Meal, reported as maize meal.
Meal.
Meal,* granulated.
Meal,* waxy variety of maize imported from China.
Meal,* white-
Meal, yellow..
Starch.
Starch-
Polenta (629 gm. com meal cooked with water to form a mush). Daily intake: 43 gm. protein, 10 gm. fat, 481 gm. carbohydrate.
Polenta (776 gm, commeal) with butter, 95 gm. Daily intake: 54 gm. protein, 92 gm. fat, 590 gm. carbohydrate.
Polenta (794 gm. commeal) with Swiss cheese, 130 gm. Daily in- take: 90 gm. protein, 37 gm. fat, 612 gm. carbohydrate.
Commeal wafers (240 gm. commeal) in simple diet of 255 gm. apple, 31 gm. dried whole milk, 28 gm. sugar, 93 gm. butter.
Commeal mush, cooked 30 min. at 20 lb. pressure in simple diet de- scribed above.
Commeal muions in simple diet described above.
Raw commeal in frozen pudding eaten in simple diet described above.
Commeal mush, cooked 10 min., eaten In simple diet described above.
Hasty pudding (commeal, salt, water) eaten in simple and mixed diets.*
Johnnycake (equal parts commeal and wheat flour) eaten in simple and mixed diets.*
Brown bread (equal parts commeal and wheat flour) eaten in simple and mixed diets.*
Hoe cake (commeal, sugar, salt, water) eaten in simple and mixed diets.*
Hoe cake with sirup, eaten in simple and mixed diets.
Frozen pudding (raw commeal, milk, oil, sugar, salt, flavoring), oranges, sugar, tea or coffee if de- sired. Average daily intake: 39 gm, protein, 1,970 calories.
Diet same as for item 15. Average daily intake: 34 gm. protein, 1,750 calories.
Polenta, a hasty pudding of corn- meal, water, and salt.
Frozen pudding (raw comstarch, milk, oil, sugar, salt, flavoring), oranges, sugar, tea or coffee if de- sired. Average daily intake: 22 gm. protein, 1,920 calories.
Frozen pudding (raw comstarch, milk, o'l, sugar, salt, flavoring), oranges, sugar, tea or coffee if de- sired. Average daily intake: 31 gm. protein, 2,760 calories.
1 Calculated from authors' data using coeflBcients of digestibility for foods in remainder of diet as shown in table 13, p. 25. , ^ ^ .
î Calculated from authors' data allowing a urinary loss of 1.26 calories per gram of digested protem O* as shown in table 13, p. 25.
. , 100
98
61
72 72 72 72 72 72 72 72 72 72 72 72 72 72 72 72 72 72 72 72 72 72
100
13
27
100
100
100
74 74 74 74 74 74 74 74 74 74 74 74 74 74 74 74 74 74 74 74 74 74
100 81 7
68.5
189.9
78.0 71.4 76.3 75.2 81.9 73.8 82.4 73.7 78.0 70.3 75.0 78.4 70.1 73.5 82.8 82.7 82.8 79.9 80.1 79.7 76.7 79.1
73.2
86.3
83.0
77.1
78.8
179.3 180.1 169.4
173.7 I 76.4 169.3
75.6 74.1 76.9 75.5
57. 9 !
84.9 85.9 83.8 84.9
fRC EG
IMH Av RC EO
^MH HR Av.
ÍMK EG
^MH HR Av. RC
mn Av
fRC *" EG
-^MH HR Av.
ATM . (45) (45) (45)
(40) (40) (40)
100 100 100 100
(4) (4) (4) (4)
(4) (4) (4)
(12) (12) (12)
(8) (8) (8)
100 100 100 100
(.4) (.4) (.4) (.4)
(.4) (.4) (.4)
46 50 46
51 48 49
100 100 100 100
57 44 57 49
64 57 59
100 100 100 100
^CM ER
ATM >RJ CM
r .. 58 1 -.. 68
1 -. 58 Av.
GB
1.2 1.1 1.3 1.2
ATM CM RLP
WVD mLG ELM
96.6 I-
96.3
98.7 98.8 98.8 99.5 99.0 99.3 98.9 99.1 98.9 99.2 99. 0
98.3
97.7 98.0 96.2
98.3 98.6 98.8
96.9 94.7 92.6 94.7
100.0 100.0 100. è 100.0
100.0 100.0 100.0
1
_
93.1
93.5
93.4
93.8
94.0
Subject, young man. Ex- perimental period, 2 days
> for 1st, and 3 days for 2d and 3d experiments. Marker, lampblack.
Subjects, young women. Experimental period, 3 days.
Several experiments made I with 2 subjects, most of
them with 4. Experi- mental period, 6 days.
Subjects, women. Experi- mental period, 3 days, 9
t meals. Marker, carmine, ' with lampblack for fol-
lowing period of 3 or 4 days on regular diet.
Subject, 45-yr.-old farmer. Experimental period, 3 days, 2 meals per day.
Subjects, women. Experi- mental period, 3 days, 9 meals. Marker, carmine, with lampblack for follow- ing per od of 3 to 4 days on regular diet.
Subjects, men students. Experimental period, 3 days. Authors' usual lab- oratory procedure fol-
, lowed.
85
120
97
74
91
8 Coefficients of digestibility estimated for "products" were considered by authors of article to be applicable to these items. , ^ ». , j,,^,
* Simple diet, milk, sugar and/or butter; mixed diet, meat and canned peaches in addition. *Indicates that composition, and in some cases also heat of combustion, was reported by the author.
See table 24.

s TABLE 23.—Apparent digestibility and available energy of foods of plant origin for human subjects—Continued
20
25
Test food, description
GRAINS, GRAIN PRODUCT&-Con.
Corn, Corn Products (Zea mays)—Con.
Ready-to-eat breakfast food:
Corn endosperm/ toasted, added sug- ar, salt.
Com flakes.
Oven-expanded com cereal.
MUlet: Meal (Panieum milia-
ceum), proso, 29 per- cent of the millet (chiefly bran) re- moved by sifting through a 16-mesh
Meal (Setaria itálica), common millet.« 40 percent of the millet (chiefly bran) re- moved by sifting through a 16-mesh sieve.
Oats, Oat Products {Avena satica):
Rolled oats*
Rolled oats...
Rolled oats*-.
Diet
Toasted com endosperm, sugar, cream, and coffee.»
Com flakes. Sucrose added in diets of AF and OS; butter added in diet of CK.
Com cereal. Sucrose added in diet of AF; butter added in diets of CK and GS.
Millet bread (recipe: 15 c. millet meal, 1% c. molasses, 1 c. lard, 2 qt. water, 3K tsp. salt, 3H tsp. soda, 5 tsp. ginger), potato, orange, tea or coffee as desired. Daily in- take: 45 gm. protein, 2,140 to 3,080 gross calories.
Millet bread (see recipe, item 23), potato, orange, tea or coffee as de- sired. Daily average intake: 49 gm. protein, 2,140 to 3,or calories.
Rolled oats, cooked 4 hrs.; milk. "Full ration" , "One-half ration"
Rolled oats, cooked; cream, sugar...
Rolled oats, cooked; sugar, cream, coffee,*
Subject and
weight
Kg.
AF CK OS Av. AF CK OS Av.
DGQ . •HRG . AJH . PK
DGG . AJH . RLS . DGG . AJH . RLS .
lOES .
Daily intake per kilogram body weight
Pro- tein
Gm.
0.7 .7 .7 .7 .7 .7 .7 .7
1.4 1.8 1.0 1.1
Gross energy
Cúl.
37,6
37.6
40.7 60.7 28.6 28.0
Proportion of total intake supplied by test food
Pro- tein
Pet.
100 100 100 100 100 100 100 100
Fat
Pd.
Car- bohy- drate
Pet,
(47)
Gross energy
Pet.
69
52
Coefficient of apparent digesti- büity of test food
Pro- tein
Pet.
165.4 »67.9 »67.0
66.8 »66.2 »70.2 »66.5 67.6
»34.2 »32.0 »39.0 »64.9
»23.8 »31.3 »30.3 »36.2 »28.7 »61.3 »46.2
»72.3 »69.2 »85.1 »79.9
78.4
Fat
Pet.
»56.4 »67.6 »78.7 »77.9
Car- bohy- drate
Pet. 97.1
96.2 93.9 98.2 96.6
94.0 95.6 95.3 94.3 96.7 96.9 97.2
94.4 95.7 97.2 95.6
96.6
Energy
Pet.
»85.1 »85.9 »92.2 »90.1
89.8
Por- tion of gross
energy avail- able
Pet.
«82.2 «83.1 «88.8
Remarks
Details of experiment not given. Authors reported *'coeflîcient of utilization" of protein, 84 percent; not included in this table since not clear if value is tme or apparent digestibility.
'Subjects, 3 men. Cfollec- tion period, 9 days, began on 3a day. Marker, cnar- coal or barium sulfate at beginning and end of col- lection period. N-balance average, —1.7 gm. for com flakes period, — 1.6gm. for oven-expanded com cereal period.
Subjects, young men (medi- cal and dental students). Experimental period, 3 days. Marker, charcoal, taken with 1st meal of ex- perimental period and with 1st meal following.
Two subjects, young men. Experimental period, 2 days with 6 meals. Pre- liminary experimental pe- riod of 1 meal. Marker, charcoal. N-balance per day; subject No. 4, full ra- tion, —O.Sgm.; half ration, -f-3.6 gm. Subject No. 5, full ration, + 1.3 gm.; half
> ration, --0.6 gm. Average of 16 experiments.
Details of experiment not given. Authors reported "coefficient of utilization" of protein, 84 percent; not included in this table since not clear if value is trae or apparent digestibility.
126
164
119
126

29
32
Rolled oats..
Rolled oats..
Rolled oats..
RoUed oats, quick cook- ing.
Rolled oats,* cooking.
quick
Rolled oats, cooked; milk-cream- mixture. sucrose. Proportions of oats and milk-cream mixture dif- fered for the two experimental pe- riods.
Rolled oats, cooked; sucrose, but- ter.
Rolled oats, cooked; cream, butter, lettuce, raw tomatoes with seeds removed, applesauce, orange mar- malade or jam, coffee, tea, carbon- ated beverage. Vitamin and min- eral supplements.
See diet, item 29
Oats, cooked; butter, cream, prunes, bananas. N-intake, 5.6 gm.; gross calories, 2,680.
Oats, cooked; fruits, cream, lettuce, coffee or beer, vitamin B complex. Average daily intake: 37 gm. pro- tein, 2,930 calories.
QQ LG RL OK WP MP Av, QQ LQ RL CK WP OS
UP. AF CK OS .Av. Av.
JM JO RA OS Av.
Av. 71
Av, 71
6
5
"'"37:5"
""37'6"
'"37.'5" 45
45
41.3
57 57 58 58 58 57 58 80 80 80 80 80 80 80 100 100 100 100 80
80
80 80 80 80 80
78
168.8 »78.9 »72.1 »82.4 »64.6 »69.4 72.7
»73.6 »84.8 »73.7 »79.7 »64.5 »77.~l 75.6
»72.6 »80.2 »70.2 74.3
»71.6
» 72.7
»57 150 «76 »67 60
»73.2
» Calculated from authors' data using coeflBclents of digestibility for foods in remainder of diet as shown in table 13, p. 26.
> Calculated from author's data allowing a urinary loss of 1.26 calories per gm. of digested protein as shown In table 13, p. 26.
» Diet as described by Clough, Carmen, and Austin, In Jour. Nutr. 3:1-16,1930. • Author Identified common millet as Setaria itálica, but according to classification In Standardized
Plant Names (79) Setaria itálica applies to foxtail millet.
Subjects, 3 women (GQ, LG, RL) and 6 men (CK, WPy MP, GS. AF). Col- lection period of 9 days began on 3d day of experi- mental period. Marker, charcoal or barium sul-
> fate. Average N-balance for the 6 subjects were -0.3 gm. per day for 1st pe- riod; —0.8 gm. per day for 2d period. For 3d period, subjects, 3 men, average N-balance was —1.2 gm. per day.
'Subjects, 11 men, ages 17-31 yr. Egg replacement method as used previously in authors' laboratory. 80 pet. of protein from egg or cereal, 10 pet. from cream and butter, 10 pet. from remaining diet. These amounts have been used here to calculate ap- parent digestibility of test food.' Subjects in nega- tive N-balance during test periods.
Experimental period, 4 days, 128 Ereceded by 3-day period
1 which milk protein re- placed cereal protein. Markers, charcoal and car- mine, used alternately.
Subjects, 10 young men. Marker, charcoal. Exper- imental period. 6 days.
Ereceded oy 6-day period I which egg protein re-
placed cereal protein. 78 pet. of protein from egg or cereal, 11 pet. from cream and butter, 11 pet. from remaining foods. These amounts have been used here to calculate apparent digestibility of test food.7 N-balance, —0.1 gm. per day.
' Apparently authors made no correction for N of foods other than test food in total N intake or fecal N.
• Authors gave two reasons for low digestibility: (1) low level at which protein was fed; (2) the rather liberal friiit intake.
^Indicates that composition, and In some cases also heat of combustion, was reported by author. See table 24.
t

TABLE 2Z.—Apparent digestibility and available energy of foods of plant origin for human subjects—Continued
Test food, description Diet Subject
and weight
Daily intake per kilogram body weight
Proportion of total intake supplied by test food
Coefficient of apparent digesti- büity of test food Por-
tion of gross
energy avail- able
Remarks
1 1 1 M
Pro- tein
Gross energy
Pro- tein Fat
Oar- bohy. drate
Gross energy
Pro- tein Fat
Car- bohy- drate
Energy
33
GBAINS, GBAIN PRODUCTS-Con.
Omia, Oat Products (Avena tativa)-^Con.
Meal,* granulated or pin- head, flne-cut with low-grade materials removed.
Meal.» midcut or stand- ard; had more of the prm left than pin-
Meal/*roUed (authors reported product as oatmeal).
Meal* (reported as oat- meal but possibly was roUedoats).
Meal (no further de- scription).
Meal,» mixture of 2 kinds, coarsely eround "püihead" and me- dium-ground.
Oat products (oatmeal, rolled oats, flaked and malted oats).»
Ready-to-eat cereal, ex- ploded; mixture in- cluded 70 pet. oat flour, 20 pet. com and rye flours.
Oatmeal, cooked 20 min.; cream, sugar. Average daily intake: 44 gm. protein, 2,200 gross calories.
Oatmeal, cooked 20 min.; cream, sugar. Average daily intake: 39 gm. protein, 1,860 gross calories.
Rolled oatmeal, cooked 20 min.; cream, sugar. Average daily in- take: 60 gm. protein, 2,480 gross calories.
Rolled oatmeal, cooked 8 hrs.; cream, sugar. Average daily in- take; 60 gm. protein, 2,530 gross calories.
Oatmeal, cooked 20 min.; cream, sugar. Average daily intake: 76 gm. protein, 3,420 gross calories.
Oatmeal, cooked 8 hrs.; cream, sugar. Average daily intake: 66 gm. pro- tein, 2,680 gross calories.
Oatmeal, cooked; bread, butter, milk.
Oatmeal »« eaten as porridge or oat cakes made without fat; bramble Jelly or sirup. Oatmeal provided 92.8 to 100 percent of the aiet.
Oat cereal, cream, sugar. In some of experiments the cereal was eaten in simple mixed diet.
Oat, com, and rye cereal; milk- cream mixture, sucrose. Propor- tions of cereal and milk-cream mix- ture differed for the two experi- mental periods.
Oat, com, and rye cereal; sucrose, butter.
Kg FAC WJH CBT Av. WJH FAC CBT Av. CBT KGM FAC Av. FAC CBT KQM Av. JB
fCLK IJB Iwjc [AV. t
Om. Cal. Pd. 86 83 81 83 87 86 79 84 86 86 86 86 81 81 82 81 90
80 83 76 80
Pet. 26 21 19 22 30 29 21 27 27 27 27 27 23 23 25 24 31
20 24 17 20
Pet. 76 71 68 72 70 73 62 68 75 76 75 76 73 74 75 74 81
71 75 66 71
Pd. 60 64 61 65 60 61 49 67 60 60 64 61 65 56 67 66 66
62 67 46 52
Pd. 66.7 71.9 83.0 73.6 88.1 87.9 88.4 88.0 76.0 82.3 75.7 77.7 80.0 83.3 84.4 82.6 80.9
86.8 78.5 79.0 81.4
75 94 84.5
65.7 67.9 64.9 72.8 66.2 81.0 69.6
77.9
»67.8 »73.2 »64.8 »84.0 »59.6 »68.0
67.9 »71.4 »60.0 »66.1 »90.8 »66.0 »77.0
71.7 »77.6 »82.3 »76.9
78.6
Pd.
64 100 82
71.7 64.8 65.2 67.2 62.5 77.6 68.2
Pd. 96.3 97.2 99.1 97.5 98.8 98.9 97.8 98.5 98.1 98.6 98.2 98.3 98.6 98.7 98.7 98.7 97.6
98.7 97.4 98.8 98.3
»99.1 •97.9
98.5
97.0
Pd. »85.6 »88.9 »94.7
89.7 »95.7 »96.1 »96.0
95.9 »91.6 »94.1 »92.0
92.6 »94.4 »94.4 »96.7
94.8 »92.6
»96.6 »92.4 »95.8
94.9
Pd. >83.2 »86.3 »91.6
87.0 »92.3 »92.8 »92.6
92.6 »88.9 »91.2 »89.3
89.8 »91.5 »91.6 »92.7
91.9 »89.4
»93.1 »89.4 »92.7
91.7
Subjects, healthy young men. Experimental pe-
, riod, 4 days. Marker, lampblack.
] Subjects, 2. 3-day prelim- \ inary period and 2-day 1 collection period.
Subjects, 6 men, ages 20-48 yra. Followed general plan of conducting experiment used by McCance and Walsham (1948). See re- marks, item 106. Total period 11-12 days of which 7 days was experimental
, period. Marker, carmine. Subjects, men-— ----
34
36 62
36
37 67
J [Air EO RM MW JH LH SH Av.
38 85 68 76 68 62 64 69
1.0 1.4 1.1 1.4 .8
1.1 1.1
42.4 63.2 43.3 64.6 32.5 42.8 44.8
95 100 99 96 93 97 97
88.0 86.2 86.0 87.1 84.1 89.1 86.6
87.8
102
196 39
(QQ LG RL CK WP MP AV. QQ LG RL CK WP GS Av. AF CK
IQS Av.
67 62 Si 78 68 73 63 67 62 61 78 68 73 63 86 78 76 80
T
"37'6"
"37'ö'
"'37'6"
63 53 63 63 63 53 63 80 80 80 80 80 80 80
100 100 100 100
Subjects, 3 women (GO, LG, RL)and6men(CK, WP, MP, GS, AF). Col- lection period began on 3d day and continued 9 days. Marker, charcoal or barium sulfate. Average N-bal- anoes for the 6 subjects were, -1.1 gm. per day for 1st period, -0.8 gm. for 2d period; for the 3 men in 3d period, -1.2 gm.
40 7 7 7 7 7 7 7 7 7 7 7 7 7 7 7 7 7
88
1 '

42
Readv-to-eat cereal, ex- ploded. Mixture of 75 pet. ground oats, 20 pet. corn and rye flours, 6 pet. salt, sugar, oil, mineral salts, and vitamins.
Rice. Rice Products (Oryza sativa):
Unpolished, 3d grade Shonai. Husk re- moved, but outer layer and germ re- tained.
Unpolished, powdered, Snonai quality No. 3.
Half-polished, 3d grade Shonai. Par- tially milled, half of outer layer and germ retained.
Oat, com, and rye cereal; cream» butter, lettuce, raw tomatoes with seeds removed, applesauce, orange marmalade or jam. coffee, tea, car- bonated beverage. Vitamin and mineral supplements.
Boiled rice eaten in mixed diet." Average daily intake: 63 gm. pro- tein, 1,570 calories.
Boiled rice eaten in mixed diet." Average daily intake: 77 gm. pro- tein, 1,630 calories.
Boiled rice eaten in mixed diet.» Average daily intake: 83 gm. pro- tein, 1,970 calories.
Boiled rice eaten in mixed diet.'3 Average daily intake: 80 gm. pro- tein, 1,850 calories.
Boiled rice eaten in mixed diet." Average daily intake: 85 gm. pro- tein, 1,790 calories.
Dango (rice and water formed into bails, 50-60 gm. weight, and cooked in water) eaten in a mixed diet." Average daily intake: 93 gm. protein, 2,050 calories.
Boiled rice eaten in mixed diet." Average daily intake: 81 gm. pro- tein, 2,270 calories.
Boiled rice eaten in mixed diet." Average daily intake: 87 gm. pro- tein, 2,250 calories.
Boiled rice eaten in mixed diet." Average daily intake: 84 gm. pro- tein, 2,160 calories.
Boiled rice eaten in mixed diet." Average daily intake: 79 gm. pro- tein, 2,070 calories.
Au.
Av.
H M S T Av. S H I K Y Av. N H I K Y Av. Y M T I K Av. Y M T I K Av.
H M S Av.
Ha Hi M S T Av. S In Is Ka Ko Av. N H I K Y Av.
80
33 22 75 57
39 35 70 60
43 36 77 67
41 34 75 64
45 43 73 63
49 47 77 68
47 20 84 71
46 33 81 71
44 25 80 70
43 24 78 68
»66.0
68.3 74.1 65.2 69.2
76.0 76.5 80.6 78.0 77.8 74.5 73.6 67.7 71.9 68.4 71.2 78.4 77.6 73.6 75.6 73.0 75.6 77.7 80,6 80.4 75.8 78.5 78.6 80.2 85.1 84.5 82.0 83.0 83.0
73.3 80.6 80.7 78.2
83.8 80.1 82.4 82.8 81.3 82.1 81.5 77.6 81.8 81.1 83.0 81,0 80.6 82.6 84.0 82.6 82.8 82.5
77.9 70.3 75.3 74.5
64.1 60.1 70.6 58.8 63.4 51.5 64.5 62.6 55.4 47.6 M. 3 61.2 66.6 52.8 65.7 59.4 57.1 60.3 66.3 63.6 60.3 58.7 61.8 89.8 89.7 89.8 87.3 86.1 88.5
81.7 80.1 81.2 81.0
76.7 78.9 77.7 78.6 77.2 77.8 73.8 69.9 77.7 76.0 72.4 74.0 72.9 71.9 77.4 •72.7 74.2 73.8
Subjects, II men, ages 17-31 yrê. See remarks, item 29.
Qeneral: Test food taken ad lib., other foods kept con- stant. Marker, carmine or carbo sanguinis. Data given in 2 reports.
Plan of 1st report "followed. Average N-balance of 3 sub-
, jects, —3.7 gm. per day.
See general remarks. Plan of 2d report '< followed. N-balances for 14 subjects used in these 3 experi- ments were: 7 positive, averaging -fO.9 gm. per day; 7 negative, averag- ing —1.0 gm. per day. Some subjects not con- sistently in negative or positive N-balance dur- ing the series of experi- ments.
lee general remarks and plan of 2d report." The 10 subjects used in these 2 experiments were all in positive N-balance, aver- aging -1-0.7 gm. per day.
See general remarks, item 42, and plan of 1st report." Subjects H and S showed negative N-balance, —1.6 and -1.2: subjectM, N-bal- ance was -1-0.3 gm. per day.
See general remarks, it^m 42, and plan of 2d re- port.»* 13 of the 15 sub- jects used in these 3 ex- periments were in positive N-balance, averaging -1-1.5 gm. per day. 2 subjects were in slightly negative N-balance: S in 1st experi- ment, —0.2 gm., and I in 3d experiment, —0.1 gm. per day.
178
1 Calculated from authors* data, using coeflSicients of digestibility for foods in remainder of diet as shown in table 13, p. 25.
a Calculated from authors' data allowing a urinary loss of 1.25 calories per gram of digested protein as shown in table 13, p. 25.
» Coefficients of digestibility estimated for "products" were considered by authors of article to be applicable to these items.
* Calculated from author's data for N-free-extract and crude fiber. 1« Each subject chose a different mixture of the oatmeals but the total for the 6 men amounted to
equal parts of coarse and medium ground meals. n Included bean paste, taro, dalkon (raw and pickled), potatoes, onions, soybean curd, sardines,
dried fish powder, soysauce, sugar, and vinegar, supplying dally 656 calories, 43 gm. protein, 63 gm. carbohydrate (expressed as glucose), and 24 gm. fat.
»a Plan of 1st report: The total period of 13 days included 3 days preliminary period, 2 days post period, and 8-day experimental period. The e.xperimental period was divided into 2-day periods in which polished, half-polished, 70-percent polished, and unpolished rice were fed successively in a mixed diet.
" Included bean paste, wakame, fish powder, mackerel, pork, potatoes, burdock, cabbage, onions, dalkon (raw and pickled), bean curd, fuki (boiled), sugar, soysauce, and vinegar, supplying dally 656 calories. 47 gm. protein, 81 gm. carbohydrate (expressed as glucose), and 14 gm. fat.
" Plan of 2d report: Total period was 6 days. On 1st, 2d, 6th, and 6th days polished rice was fed while on 3d and 4th days rice of a different grade of polishing was fed so that In each experiment half- polished, 70-percent polished, or unpolished rice was compared with polished grade.
♦Indicates that composition, and in some cases also heat of combustion, was reported by author. See table 24.

t TABLE 23.—Apparent digestibility and available energy of foods of plant origin for human subjects—Continued
45
46
Test food, description
GRAINS, GRAIN PRODUCTS-Con.
Rice, Rice Prodncta iOrpza sativa)—Con.
70-percent polished, 3d grade Shonal. 30 pet. of outer layer and germ retained.
Polished, 3d grade Shonai. Qermtdmost entirely rubbed off in milling.
Diet
Boiled rice eaten in mixed diet." Average daily intake: 84 gm. pro- tein, 2,610 calories.
Boiled rice eaten in mixed diet." Average daily intake: 88 gm. pro- tein, 2,510 calories.
Boiled rice eaten in mixed diet." Average daily intake: 79 gm. pro- tein, 2,230 calories.
Boiled rice eaten in mixed diet." Average daily intake: 81 gm. pro- tein, 2,310 calories.
Boiled rice eaten in mixed diet.ii Average daily intake: 76 gm. pro- tein, 2,600 calories.
Boiled rice eaten in mixed diet." Average daily intake: 81 gm. pro- tein, 2,550 calories.
Boiled rice eaten in mixed diet." Average daily intake: 82 gm. pro- tein, 2,660 calories.
Boiled rice eaten in mixed diet." Average daily intake: 78 gm. pro- tein, 2,360 calories.
Subject and
weight
Kg. H M S Av.
fHa Hi M S T
{Av. S In Is Ka Ko
[Av. 8 H I K Y Av. H M S
[Av.
Ha Hi M S T Av. Ha HI M S T Av. H M S T
[Av.
Daily Intake pe" íálogram body weight
Pro- tein
Om.
Gross energy
Cal.
Proportion of total intake supplied by test food
Pro- tein
Pet.
46
40
44
42
42
Fat
Pet.
20
12
14
Car- bohy- drate
Pet.
87
83
81
82
87
84
84
82
Gross energy
Pet.
74
72
Coefficient of apparent digesti- bility of test food
Pro- tein Fat
Pet, Pd. Pet. 76.9 83.5 99.1 81.6 84.4 99.2 83.1 86.5 99.4 80.5 84.8 99.2
83.4 79.7 99.6 84.5 84.7 99.6 76.7 76.2 99.5 83.4 83.4 99.6 83.2 76.2 99.6 82.2 80.0 99.6 84.6 82.5 99.7 82.3 82.8 99.6 84.7 81.9 99.7 84.2 82.1 99.7 84.0 82.2 99.6 84.0 82.3 99.6 a3.i 81.5 99.6 78.3 76.1 99.6 83.4 83.4 99.6 81.9 80.1 99.5 80.2 84.0 99.4 81.4 81.0 99.5 89.7 91.8 99.7 90.2 91.9 99.7 86.1 91.1 99.6 88.7 91.6 99.7
85.5 85.3 99.7 85.8 85.5 99.7 84.7 87.1 99.7 84.6 87.7 99.7 85.6 88.1 99.7 85.2 86.7 99.7 86.7 89.8 99.7 83.1 87.2 99.6 87.9 88.3 99.8 87,2 90.2 99.7 87.3 90.6 99.7 86.4 89.2 99.7 82.9 88.6 99.6 83.9 84.4 99.6 85.6 87.3 99.7 84.2 89.1 99.7 84.2 87.3 99.6
Car- bohy- drate
Energy
Pet.
Por- tion of gross
energy avail- able
Pet.
Remarks
See general remarks, item 42, and plan of 1st re- port." Daily N-balance for H was —1.3 gm.; for M, +1.1 gm.; for S, —0.3 gm.
See general remarks. Item 42, and plan of 2nd re- port.". 13 of the 15 sub- jects were In positive N-balance, averaging +1.4 gm. S and H tn 2nd ex- periment showed negative N-balances of —0.4 and —1.5 gm. per day, respec- tively.
See general remarks. Item 42, and plan of 1st report." Daily N-balance for H was -0.2; for M, -f 1.3; for S,
. -0.7 gm. See general remarks, item 42,
and plan of 2d report." The 5 subjects in tnis ex- periment were In positive N-balanoe, averaging -Í-1.1 gm. per day.
See general remarks, item 42, and plan of 2d report." The 5 subjects In tnis ex- periment were in positive N-balanoe, averaging +1.4 gm. per day.
See general remarks, item 42, and plan of 2d report." The 4 subjects in tnis ex- periment were in positive N-balance, averagmg +0.4 gm. per day.

Boiled rice eaten in mixed diet." Average daily intake: 83 gm. pro- tein, 2,350 calories.
Boiled rice eaten in mixed diet.»» Average daily intake: 79 gm. pro- tein, 2,120 calories.
Boiled rice eaten in mixed diet." Average daily intake: 88 gm, pro- tein, 2, 600 calories.
Rice gruel eaten in mixed diet." Average daily intake: 60 gm. pro- tein, 1,050 calories.
Boiled rice eaten in mixed diet." Average daily intake: 94 gm. pro- tein, 2, 910 calories.
Ojiya (963 gm. rice, 80 gm. bean paste, boiled in 400 cc. water to obtain 3,860 gm. ojiya) eaten in mixed diet," Average daily in- take: 73 gm. protein, 1,460 calories.
Boiled rice eaten in mixed diet." Average daily intake: 91 gm. pro- tein, 2,900 calories.
Sushi (rice cooked in usual way with salt, sugar, and vinegar added) eaten in mixed diet." Average daily intake: 93 gm. protein, 2,990 calories.
Boiled rice eaten in mixed diet." Average daily intake: 87 gm. pro- tein, 2,580 calories.
Akanogohan (1,171 gm. rice cooked with 1,600 cc. water and 400 cc. juice prepared from boiled red beans by squeezing through cloth) eaten in mixed diet," Average daily intake: 87 gm. protein, 2,300 calories.
Boiled rice eaten in mixed diet." Average daily intake: 89 gm. pro- tein, 2,600 calories.
Boiled rice eaten in mixed diet." Average daily intake: 85 gm. pro- tein, 2,380 calories.
S H M T Y
[Av. Y M T I K Av. H M T Av. H M T Av. Kay
S T Kat Av. Kay
S T Kat Av. N T I S TT Av. N T I S TT Av. H T I S TT Av. H T
TT Av. S I N H Av. K Sa I Sh T Av.
43 29 82 72
40 28 79 69
46 30 84 74
22 -"VQ 48 38
60 34 86 77
35 29 66 65
48 35 86 77
49 28 86 78
45 31 84 75
46 29 81 72
47 19 84 76
30 83 74
82.1 87.5 99.6 80.0 86,6 99.5 84.2 84.3 99.6 82.0 87,5 99.6 80.4 85.6 99.4 81.7 86.3 99.6 83.8 87.3 99.4 87.1 88.3 99.6 85.3 87.8 99.6 87.4 89.8 99.7 89.3 90.2 99.6 86.6 88.7 99.6 86.9 91.2 99.8 85.1 90.6 99.7 81.6 88.5 99.7 84.5 90.1 99.7 84.2 91.4 99.4 81.6 92.1 99.2 76.1 89.2 99.1 80.6 90.9 99.2 86,9 91.2 99.8 86.3 90.9 99.7 86.1 91.1 99.7 85.4 89.0 99.7 S5.S 90.1 99.8 86.1 90.6 99.7 86.2 94.9 99.7 84.4 92.8 99.5 83.3 91.8 99.4 82.6 91.7 99.5 81.9 91.0 99.4 83.7 92.4 99.5 83.0 90.4 99.7 79.9 90.1 99.7 83.1 91.6 99.7 83.3 90.8 99.8 80.7 89.0 99.8 82.0 90.4 99.7 84.6 92.9 99.8 83.0 92.6 99.8 85.5 92.7 99.8 85.7 92.1 99.8 82.4 90.0 99.8 84.2 92.1 99.8 81.4 91.1 99.8 79.7 90.9 99.6 82.8 89.8 99.7 84.7 90.0 99,7 81.7 90.8 99.6 82.1 90.5 99.7
90.6 96.0 99.8 81,3 91.0 99.7 83.6 91.0 99.7 85.2 91.3 99.7 82.8 91.6 99.6 84.7 92.2 99.7
86.1 93.6 99.7 83.8 90.2 99.6 82.8 90.0 99.7 85.3 87.7 99.7 84.6 90.4 99.7 86.2 91,6 99.6 84.6 91.8 99.6 83.7 91.3 99.6 83.6 90.6 99.6 81.9 91.1 99.4 84.0 91.3 99.6
See general remarks, item 42, and plan of 2d report.^«
Boiled polished rice was used in 8 experiments of the series reported, and 37 sub- jects were used. 24 were in positive N-balanoe, averaging -f 1.3 gm. per day. 13 subjects were in negative balance, averag- ing —0.7 gm. per day. 3 subjects on rice gruel diet showed negative balance, averaging —3.6 gm. per day. 6 subjects on *'ojiya" diet were in negative N- balance, averaging —1.6 gm. per day. 4subiectson '^susni" diet were m posi- tive N-balance, averaging -f 1.3 gm. per day. Sub- ject N in slightly negative N-balance, —0.03 gm. per day. 4 subjects on "ak- anogohan" diet in nega- tive N-balance, averaging —1.6 gm. per day. Sub- ject H in positive N-bal- ance, -fO.3 gm. per day.
>i Included bean paste, taro, daikon (raw and pickled), potatoes, onions, soybean curd, sardines, dried fish powder, soy sauce, sugar, and vinegar, supplying daily 656 calories, 43 gm. protein, 63 gm. carbohydrate (expressed as glucose), and 24 gm. fat.
" Plan of 1st report: The total period of 13 days included 3 days preliminary period, 2 days post- period, and 8-day experimental period. The experimental period was divided into 2-day periods in which polished, half-polished, 70-percent polished, and unpolished rice were fed successively in a mixed diet.
" Included bean paste, wakame, fish powder, mackerel, pork, potatoes, burdock, cabbage, onions, daikon (raw and pickled), bean curd, fuki (boiled), sugar, soy sauce, and vinegar, supplying daily 666 calories, 47 gm. protein, 81 gm. carbohydrate (expressed as glucose), and 14 gm. fat.
" Plan of 2d report: Total period was 6 days. On 1st, 2d, 6th, and 6th days polished rice was fed while on 3d and 4th days rice of a different grade of polishing was fed so that in each experiment half-polished, 70-percent polished, or unpolished rice was compared with polished grade.

00
TABLE 23.—Apparent digestibility and available energy of foods of plant origin for human subjects—Continued
Test food, description Diet Subject
and weight
Daily intake per kilogram body weight
Proportion of total intake supplied by test food
Coefficient of apparent digesti- bility of test food Por-
tion of gross
energy avaU- able
Remarks
d
12: Pro- tein
Gross energy
Pro- tein Fat
Car- bohy- drate
Gross energy
Pro- tein Fat
Car- bohy. drate
Energy 1
47
GRAINS, GRAIN PRODUCTS-Con.
Rice, Rice Products (Oryza 8aiiva)~Con.
Polished, powdered, Shonai, quality No. 3.
Polished, glutinous, Shonai, quality No. 3.
Polished* or white
Undescribed*
Dango (mixture rice and water formed into balls, 50-60 gm. weight, and cooked in water) eaten in mixed diet." Average daily intake: 83 gm. protein, 2,350 calories.
Okowa (glutinous rice soaked 24 hr., then steamed 45 min.) eaten in mixed diet." Average daily in- take: 74 gm. protein, 1,660 cal- ories.
Mochi (prepared like okowa, then pounded and rolled to 2 cm. in thickness) eaten in mixed diet." Average daily intake: 82 gm. pro- tein, 2,120 calories.
Rice, cottage cheese, sugar, milk
Boiled rice, a little fat and meat extract added. Average daily intake: 62 gm. protein, 74 gm. fat, 493 gm. carbohydrate.
Frozen pudding (raw rice starch, milk, oil, sugar, salt, flavoring), oranges, sugar, tea or coffee if desired. Average daily intake: 25 gm. protein, 1,830 calories.
Same diet as described for item 51. Average daily intake: 22 gm. protein, 1,675 calories.
Kg. iS
Gm. Cal. Pa. Pet. pa. Pa. Pa. 84.0 83.1 90.1 85.9 82.4 86.1
78.4 81.3 82.1 81.7 80.9
83.1 85.7 87.6 84.4 85.2
83
79.6
Pa. 90.8 89.3 92.7 92.4 89.4 90.9
90.8 88.4 88.0 88.4 89.1
94.5 91.8 92.1 90.8 92.3
Pa. 99.7 99.7 99.7 99.8 99.5 99.7
99,6 99.6 99.6 99.5 99.6
99.6 99.7 99.8 99.6 99.7
08
99.1
100.0 100.0 100.0 99.8
100.0
100.0 100.0
Pa. Pa. /See general remarks, item 42
and plan of 2d report." For diet containing "dango," subjects H and T in positive N-balance,-f- 0.4 and -fO.9; subjects S, M, and Y in negative N- balance, -0.2, -0.3, and —0.7 gm. per day, respec-
\ tively. See general remarks, item
42, and plan of 2d re- port.'* All 4 subjects on ''okowa" diet were in negative N-balance, aver- aging -1.2 gm. per day.
/See general remarks, item 42, and plan of 2d re- port.»* For diet contain- ing "mochi" subjects A and T were in iwsitive N-balance^ +0.6 and +0.3; subjects N and K in nega- tive N-balance, -0.1 and —0.3 gm. per day, respexî-
V tively. Subjects. 3 men. Experi-
mental period, 3 days. All subjects in positive N-balance, averaging +0.5 gra. per day.
Subject, medical student, 22 yr. old. Experimental period, 3 days. Marker, meat diet at beginning and milk at end of experi- ment. N-balance, —3.3 gm. per day.
Subjects, young men. Ex- perimental period, 3 dajrs. Marker, carmine for ex- perimental period, lamp- black for subsequent regu- lar diet of 3 to 4 days.
Subjects, women. Experi- mental procedure as de-
, scribed for item 51.
H M T Y Av. 44 29 82 72
48 ÍN A K T Av. 36 22 73 60
íN A K T Av. 43
20
85
25
1
79
66
100
69
38 40 Av. 90 167
50 A 72
ÍPHC ...
0.9 144
51 Starch 92
Starch
WVD ... HLG ... ELM ... JFS ...
50 IATM ... 4 4
59 68
97 fRJ ... ]

Pumpernickel bread.
Rye, Rye Products {Sé- cale cerealé):
Flour, whole-grain, ground.
Flour* No. 18, 13th grinding of middlings. Ash, 2.18 pet. 2d poorest in quality.
Flour III,* a commer- cial flour of poorer quality than Flour II, item 60. Ash, 1.97 pet.
Flour No. 17*, 12th grinding of mid- dlings. Ash, 1.90 pet.
57 Flour No. 4,* 3d grind- ing of whole grain. Ash, 1.87 pet.
T^ Flour No. 16,* 11th grinding of mid- dlings. Ash, 1.74 pet.
Flour No. 15,* 10th grinding of mid- dlings. Ash, 1.69 pet.
Flour II,* a commer- cial flour of poor quality. Ash, 1.68 pet.
Flour* made by Stein- metz process from Swiss rye. 94 pet. yield (3 pet. grinding loss). Most external ligneous layer of bran removed. 46 pet. of flour coarser than 0.2 mm. mesh sieve. Ash, 1.52 pet.
" Included bean paste, wakame, fish powder, mackerel, pork, potatoes, burdock, cabbage, onions, daikon (raw and pickled), bean curd, fuki (boiled), sugar, soysauce, and vinegar, supplying daily 656 calories, 47 gm. protein, 81 gm. carbohydrate (expressed as glucose), and 14 gm. fat.
»* Plan of 2d report: Total period was 6 days. On 1st, 2d, 5th, and 6th days polished rice was fed while on 3d and 4th days rice of a different grade of polishing was fed so that in each experiment half- polished, 70-percent polished, or unpolished rice was compared with polished grade.
Rye bread made from equal amounts of flours No. 18 and No. 6 (good dark bread). Daily intake: 6Ö7 gm. fresh bread (399 gm. dry weight).
Rye bread made from flour No. 18 (very wet after 3 hr. baking, un- palatable). Daily intake: 304 gm. fresh bread (192 gm. dry weight).
Rye bread, made from equal amounts of flours III and 0, Item 83 (very dark bread). Daily in- take: 522 gm. fresh bread (311 gm. dry weight). 2 liters beer.
Rye bread (very moist, although baked long time). Daily intake: 447 gm. fresh bread (272 gm. dry weight). 2 liters beer.
Rye bread (dark). Daily intake: subject R, 667 gm. fresh bread (408 gm. dry weight); subject B, 567 gm. fresh bread (366 gm. dry weight). 2 liters beer.
Rye bread (very dark but edible). Daily intake: 667 gm. fresh bread (401 gm. dry weight). 2 liters beer.
Rye bread (sour, soggy, and un- palatable). Daily intake of 2 subjects similar, averaging 499 gm. fresh bread (322 gm. dry weight).
Rye bread (a very dark but well- baked bread). Daily intake: 618 gm. fresh bread (409 gm. dry weight). 2 liters beer.
Rye bread, meat, butter, beer. Daily intake: 500 gm. bread (crustless), 450 gm. meat, 45 gm. butter, H liter beer, water ad lib.
48.0
i»56.8 '»61.2
49.0
1» 52.8 J» 61.1
68.6
69.7 70.4
79.1 74.0
74.1 77.5
69.5
1» 51.1 1« 39.3 »« 45.5
90.3
«s 88.1 1*88.9
79.2
1» 82.5 i»88.7
89.0
89.4 93.0
92.0 92.4
92.6 93.5
91.9
68 .7 .7
.7
.5
.4
.9
1.1 .7
1.0 1.0
1.1 1.1
.9
7?
68
68 7?
72
68 80
72 7?
7? 80
68
23 23 26
Details of experiment not 136 given. Data from Pann Witz in (135, pp. «/5-«/7).
Subjects, young men. Marker, milk. 2 liters milk and cheese—cottage, Swiss, or Dutch—eaten 1st and 5th days. Bread alone eaten on 2d, 3d, and 4th days. Clear dif- ferentiation of feces in most cases. Subject R while on bread diet (flour No. 18 usually used in blends) had severe stom- ach ache and colic, also diarrhea. Subject F had severe stoniach ache on 1st day of bread diet (flour No. 17). Some diarrhea but good differentiation of feces. Subject H had severe stomach ache and mild diarrhea on 2d day of bread diet (flour No 15). Bread diet (flour II) lasted only 2 days. Subject R had severe stomach ache on 2d day; very thin feces.
Subjects, men, ages 26-33 jrr. Experimental period of 2 days preceded and fol- lowed by 1 day on milk and cottage cheese diet used as marker. Good separation of feces ob- tained. Author verified by experiment that meat and butter in amounts consumed had no marked
, effect on quantity of feces.
" Coeflacient of digestibility of test flour, indirectly estimated by author from the known digesti- bility of the flour with which the test flour was combined.
" In author's opinion the low figure for digestibility may be due to the low N content of the rye flours used in this study. The percent fecal loss becomes proportionately large in relation to lower N intake.
•Indicates that composition, and in some cases also heat of combustion, was reported by author. See table 24.

ä TABLE 23.—Apparent digestibility and available energy of foods of plant origin for human s ubjects- —Cont inued
1 Test food, description Diet
Subject and
weight
Daily Intake per kilogram body weight
Proportion of total Intake supplied by test food
Coefficient of apparent digesti- bUity of test food Por-
tion of gross
energy avail- able
Remarks
i
Pro- tein
Gross energy
Pro- tein Fat
Car- bohy- drate
Gross energy
Pro- tein Fat
Car- bohy- drate 1
62
GRAINS, GRAIN PRODUCTS-Con.
Rje. Rye Frodact« (Sé- cale céréale)—Con.
Flour, from peeled ker- nel, 8.4 pet. bran re- moved (4.9 pet. milltng bran and 3.6 pet. peeling bran). Coarsely ground.
Flour, from peeled Magdeburg rye, 10.84 pet. bran removed (7.76 pet. milling bran and 3.08 pet. peeling bran). Finely ground.
Flour,* flours No. 6 and No. 18 blended in equal amounts. Ash, 1.40 pet.
Flour,* commonly used in Wurzburg; like item 76, except 4.6 pet. of flour coarser than 0.2-nmi. mesh sieve. Ash, 1.24 pet.
Flour,* flours 0 and III blended in equal amounts. Ash, 1.20 pet.
Flour, from unpeeled kernel, 15 pet. bran removed. Coarsely ground.
Flour, from peeled ker- nel, 16 pet. bran removed (11.86 pet. milling bran and 3.15 pet. peeling bran). Coarsely ground.
Flour, from unpeeled kernel, 84 pet. yield, 12.68 pet. • bran re- moved (10.94 pet. milling bran and 1.74 pet. from point end of kernel). Finely ground.
Flour of 4th to 6th mill- ings of item 69 and comparable to last 10 pet. of yield (from 73.5 to 84 pet. of item No. 69 yield).
Bread made from the rye flour
Bread made from the rye flour, baked with yeast.
Rye bread (a good dark bread). Daily intake: 609 gm. fresh bread (399 gm. dry weight). 2 Uters beer.
Same diet as described in item 61
Rye bread (very dark). Daily in- take: 622 gm. fresh bread (311 gm. dry weight).
Ordinary soldier bread made from the rye flour.
Bread made from the rye flour
Bread made from the rye flour
Bread made from the rye flour
u^'- Om, Cal. Pet. Pd. Pd. Pd. Pd. 38.6 48.2
66.8 66.0 70.2 68.6 72.6
68.9 71.1
"66.6
66.4 69.5
60.1 60.8 53.0 66.0 61.2 69.3 66.3 57.6 65.0 62.2 62.0
61.7 60.1
49.2 68.3
Pd. Pd. 89.3 92.6
92.1 89.3 93.2 92.2 94.1
93.2 93.6
Pd. Pd. 1 Details of experiment not y given. Data from Pann- 1 Witz in use, pp. iie-tíT).
See remarks, item 62.
\See remarks, item 64 for / detaUs of experiment.
See remarks, item 61
\See remarks, item 64 for de- / tails of experiment.
Experimental method not given. Data from Pann- witz in ose, pp. tl6-gl7).
136
L
63 p P >•
{Sch. R geh
04 (R 68 |H 72
L
0.7 .7
141
6f» 24 99
66 (R 68 ]H 72
/p
.6
.4 90.4 93.6
88.6 92.4 90.6 90.8 94.1 91.7 92.6 92.8 90.2 94.6 93.7
92.2 91.2
80.0 82.0
141 .
L 67 P
p WB
F Seh. vB
68 [p vB Q
69 fP
136
(G ■"
70 fP {L

Flour* made by Stein- metz process n-om rye Daily intake: 500 gm. onistless JL of Silesia. 82 pet. bread, 450 gm. meat, 46 gm. IN yield, i. e., 12 pet. " bran removed in mill- ing, 3 pet. husk bran, 3 pet. loss in grinding. Rather coarsely ground; 23 pet. of
our coarser than 0.2- mm. mesh sieve. Ash, 1.18 pet.
72 Flour,» made by "old process" of milling from Swiss rye. 72 pet. yield, i. e., 25 pet, removal of bran and 3 pet. loss in grinding. Finely jeround; 2.8 pet. of nour coarser than 0.2-mm. mesh sieve. Ash, 1.10 pet.
Flour No. 13,* 8th grinding of middlings. Ash, 1.04 pet.
Flour No. 12, • 7th grinding of middlings. Ash, 0.96 pet.
Flour,♦ commonly used in Wurzburg, about 75 pet. yield. 2.6 pet. of flour coarser than 0.2-mm. mesh sieve. Ash, 0.86 pet.
Flour, 25 pet. bran re- moved. Finely ground.
Flour I*, commercial flour. Ash, 0.81 pet.
Flour No. 10,* 6th grinding of middlings. Ash, 0.77 pet.
79 Flour No. 2,* 1st flour of the bran grinding.
Ash, 0.73 pet. Flour No. 7,* 2d grind-
ing of middlings. Ash, 0.62 pet.
Flour No. 6,* 1st grind- ing of middlings. Ash, 0.62 pet.
Flour,* made by "old process" of milling from rye of Silesia. 62 pet. yield, i. e., 35 pet. removal of bran and 3 pet. loss in I grinding. Finely ground; 0.32 pet. of flour coarser than 0.2- | mm. mesh sieve. I Ash, 0.65 pet. !
" In author's opinion the low figure for digestibility may be due to the low N content of the rye flours used in this study. The percent fecal loss becomes proportionately larger in relation to lower N intake.
Rye bread, meat, butter, beer. Daily intake: 500 gm. crustless bread. 450 gm. meat, 46 gm. butter, and ^ liter beer.
Rye bread, meat, butter, beer. Daily intake: 500 gm. crustless bread, 450 gm. meat, 45 gm. butter, and H liter beer.
Rye bread (dark). Daily intake: 667 gm. fresh bread (423 gm. dry weight). 2.1iters beer.
Rye bread (quite dark). Daily In- take: 667 gm. fresh bread (364 gm. dry weight). 2 liters beer.
Rye bread, meat, butter, beer. Daily intake: 500 gm. crustless bread, 450 gm. meat, 45 gm. butter, ^ liter beer.
Bread made from the rye flour-
Rye bread. Daily intake: 667 gm. fresh bread (406 gm. dry weight). 2 liters beer.
Rye bread. Daily intake: 667 gm. fresh bread (404 gm. dry weight). 2 liters beer.
Rye bread (good white color). Daily intake: 667 gm. fresh bread (436 gm. dry weight). 2 liters beer.
Rye bread (good white color). Daily intake: 667 gm. fresh bread (414 gm. dry weight). 2 liters beer.
Rye bread (very white and palat- able). Intake: 667 gm. fresh Dread (416 gm. dry weight). 2 liters beer.
Rye bread (quite -sour but well leavened). Daily intake: 500 gm. bread, 450 gm. meat, 45 gm. butter, H liter beer, water ad lib.
{5
{I H F
M
27 32
21 21
90 .7
.5 85
25 25
68 .6
:l .7 .7
.7 ,7
.6
.6
.6
.6
72 87 68 72
68 67
80 67
72 72
24 24
»• 62.6 I« 66.6
«•45.1 >• 43.4
60.0
71.6
»•49.2 »•66.3
68.1 63.3 67.3
68.0 72.8 73.3 68.3
174.7J
73.4 81.5
70.5 78.2
82.7 79.0
»•46.8 »•56.5
94.7
96.9
93.8 96.2 94.2
96.3 96.4 96.9 96.1 97.0
96.4 98.0
97.1 97.8
98.2 98.3
1
Subjects, men, ages 26-33 yr. Experimental period, 2 days, preceded and foK lowed by 1 day on a milk «ttd oottage cheese diet
: used as a marker. Good separation of feces ob- tained. Author verified by experiment that meat and butter in amounts consumed had no marked effect on quantity of feces.
See remarks, item 64. Sub- ject B had diarrhea on 2d day of bread diet (fiour No. 13).
jsee remarks, item 71.
Experimental method not given. Data from Pann- witz in ase, pp. tie-til).
See remarks, item 64. Sub- ject S had diarrhea but differentiation of feces was good. Subject R in ex- periment on fiour No. 10 bad severe stomach ache and diarrhea on 2d day.
jSee »marks, item 71.
99
141
99
136
141
99
»»Bread used in this eroeriment was baked with leaven (sour dough). •Indicates that composition, and in some cases also heat of combustion, was reported by the author,
oee taoie 24.

;:J TABLE 2S.—Apparent diffestihility and available energy of foods of plant oHgin for human «ul>/eci«—Continued
83
84
86
87
Test food, description
GBAINS, GRAIN PRODUCTS-Con.
Rye, Rye ProdnctB {Se- cale céréale)—Con.
Flour O,* a commercial flour. Ash, 0.43 pet.
Flour No. 1,* 1st flour from whole-grain groats. Ash, 0.39 pet.
Branny portion,* frac- tion of 67-85 pct.>8
Branny portion,* frac- tion of 67-95 pet. »»
Branny portion,* frac- tion of 85-95 pet.»«
Sorchnm meals {Sorghum vulgäre):
Hard, corneous type: Feterita, 15 pet. bran
removed with a 16- mesh sieve, size commonly used in the home.
Diet
Kafir, 21 pet. bran re- moved with a 16- mesh sieve, size commonly used in the home.
Ryi bread (a very white bread). Daily intake: 667 gm. fresh bread (425 gm. dry weight). 2 liters
Rye bread (white color). Daily mtake: 667 gm. fresh bread (427 gm. dry weight). 2 liters beer.
Rye bran fed with diet of fruit, can- ned meat and fish, potatoes, bread, butter, cheese, turnips.
Diet same as for item 85..
Diet same as for item 85..
Feterita bread (recipe: 15 c. sor- ghum meal, iti o. molasses, 1 c. lard, V/i qt. water, SH tsp. salt, 3H tsp. soda, 5 tsp. ginger), pota- toes, applesauce, butter, sugar. Average daily intake: 40 gm. pro- tein, 81 gm. fat, 320 gm. carbo- hydrate.
Feterita mush cooked 3-4 hr. in double boiler, applesauce, butter, sirup, sugar. Average daily in- take: 44 gm. protein, 59 gm. fat, 661 gm. carbohydrate.
Kafir bread (recipe: 3 c. sorghum meal, 3 c. water, 3 tbsp. lard, salt; cooked H hr.; bakinc powder added, baked in thin layer until hard and crusty), milk, oranges, sugar. Average daily intake: 91 gm. protein, 117 gm. fat, 363 gm. carbohydrate.
Kafir bread (see recipe, item 88, a softer bread than that used in the preceding experiment on Kafir), potatoes, applesauce, butter, sugar. Average daily intake: 46 gm. pro- tein, 104 gm. fat, 385 gm. carbo- hydrate.
Kafir mush cooked 3-4 hr. in double boiler, applesauce, botter, sirup, sugar. Average daily intake: 44 gm. protein, 66 gm. fat, 558 gm. carbohydrate.
Subject and
weight
Kg.
R T
1 2 3 4 Av. I 2 3 4 Av. 1 2 3 4 Av.
75
fDOG . RLS . OES . RFT .
(DGQ . RLS . OES . RFT .
UP. - HFB . DGG . RLS . OÊS . Av. . RLS IDB . WD EEM . IDB WD EEM .
UP. - DGG . RLS OES . RFT DGG RLS . OES
UP. DGG RLS , OES . Av. .
Daily intake per kilogram body weight
Pro- tein
Gm. 0.5 .5
Gross energy
Cal.
Proportion of total intake supplied by test food
Pro- tein
Pd.
Fat
Pd.
Car- bohy- drate
Pd.
(50) (50) (40) (40) (45) (50) (40) (45) 45 38 44 42 34 40 74 55 68 53 52 50 48 56 (45) (45) (45) (45) (50) (45) (45) 46 39 45 38 41
Gross energy
Pd.
Coefficient of apparent digesti- bility of test food
Pro- tein
Pd. 75.2 80.7
69.2 69.7
67 60 83 96 77 91 70 75 82 80 95 60 73 77 76
> 52.1 ' 54.4 I 41.0 »62.2 130.5 165.8 145.3 139.4
48.8 77.5 43.6 42.1 30.4 48.4 76.0 43.5 65.4 55.7 43.0 67.5 59.7 58.7
188.8 135.5 136.1 132.6 158.8 148.4 142.9
49.0 59.4 61.5 23.5 48.1
Fat
Pd.
Car- bohy- drate
Pd. 96.0 96.6
97.4 97.8
97. 98. 95. 98. 97. 95. 97. 99. 97. 98. 99. 96. < 97.)
Energy
Pd.
Por- tion of gross
energy avail- able
Pd.
Remarks
See remarks, item 54 for de- tails of experiment.
Subjects, 4 students, pre- liminary period, 1 wk. Experimental period 3 or 4
• wk. Quantities of foods eaten kept constant. Marker, cnarcoal given weekly.
Subjects, young men. Ex- perimental period, 3 days. Preliminary and final per- iods omitted since ration was made up to resemble closely an ordinary mixed diet. Marker, charcoal in gelatin capsules. Samples of bread analyzed, out composition of potato, applesauce and butter es- timated by comparison with average values of large number of earlier analyses.
141
30
93
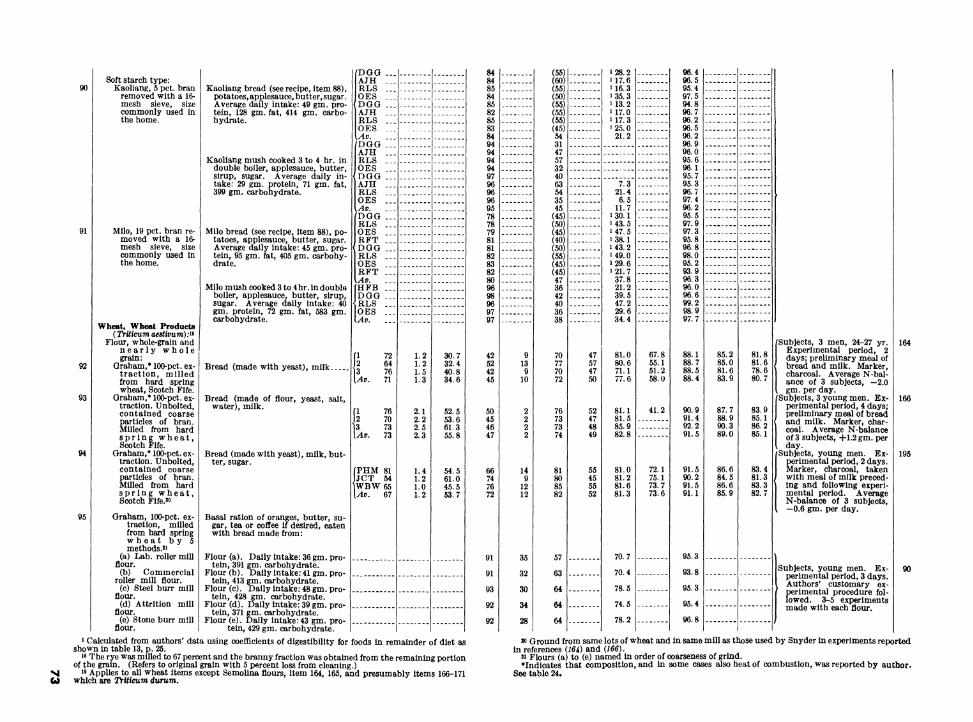
90
92
94
Soft starch type: Kaoliang, 5 pet. bran
removed with a 16- mesh sieve, size commonly used in the home.
Milo, 19 pet. bran re- moved with a 16- mesh sieve, size commonly used in the home.
Wheat, Wheat Products (Triticum aestiüum):^^
Flour, whole-grain and nearly whole grain:
Graham,* 100-pct. ex- traction, milled from hard spring wheat, Scotch Fife.
Graham,* 100-pct. ex- traction. Unbolted, contained coarse particles of bran. Milled from hard spring wheat, Scotch Fife.
Graham,* 100-pet. ex- traction. Unbolted, contained coarse particles of bran. Milled from hard spring wheat, Scotch Fife.M
Graham, 100-pct. ex- traction, milled from hard spring wheat by 5 methods.21
(a) Lab. roller mill flour.
(b) Commercial roller mill flour.
(c) Steel burr mill flour.
(d) Attrition mill flour.
(e) Stone burr mill flour.
Kaoliang bread (see recipe, item 88), potatoes, applesauce, butter, sugar. Average daily intake: 49 gm. pro- tein, 128 gm. fat, 414 gm. carbo- hydrate.
Kaoliang mush cooked 3 to 4 hr. in double boiler, applesauce, butter, sirup, sugar. Average daily in- take: 29 gm. protein, 71 gm. fat, 399 gm. carbohydrate.
Milo bread (see recipe, item 88), po- tatoes, applesauce, butter, sugar. Average daily intake: 45 gm. pro- tein, 95 gm. fat, 405 gm. carbohy- drate.
Milo mush cooked 3 to 4hr. in double boiler, applesauce, butter, sirup, sugar. Average daily intake: 40 gm. protein, 72 gm. fat, 583 gm. carbohydrate.
Bread (made with yeast), milk-
Bread (made of flour, yeast, salt, water), milk.
Bread (made with yeast), milk, but- ter, sugar.
Basal ration of oranges, butter, su- gar, tea or coffee if desired, eaten with bread made from:
Flour (a). Daily intake : 36 gm. pro- tein, 391 gm. carbohydrate.
Flour (b). Daily intake: 41 gm. pro- tein, 413 gm. carbohydrate.
Flour (c). Daily intake: 48 gm. pro- tein, 428 gm. carbohydrate.
Flour (d). Daily intake: 39 gm. pro- tein, 371 gm. carbohydrate.
Flour (e). Daily intake: 43 gm. pro- tein, 429 gm. carbohydrate.
DGG AJH RLS OES DGG AJH RLS OES AD, DGG AJH RLS OES DGG AJH RLS OES
.Av. /DGG RLS OES RFT DGG RLS OES RFT
[Av. HFB DGG RLS OES .
[Av.
il 72 |2 64 13 76 [Av. 71
1 76 2 70 3 73 Av. 73
ÍPHM 81 JJCT 54 1WBW65 [Av. 67
1.2 1.2 1.5 1.3
2.1 2.2 2.5 2.3
1.4 1.2 1.0 1.2
30.7 32.4 40.8 34.6
52.5 53.6 61.3 55.8
54.5 61.0 45.5 53.7
84 84 85 84 85 82 85 83 84 94 94 94 94 97 96 96 96 95 78 78 79 81 81 82 83 82 80 96 98 96 97 97
42 52 42 45
50 45 46 47
66 74 76 72
91
91
93
92
92
9 13 9 10
2 2 2 2
14 9 12 12
35
32
30
34
28
(55) (60) (55) (50) (55) (55) (55) (45) 54 31 47 57 32 40 63 64 35 45 (45) (50) (45) (40) (50) (55) (45) (45) 47 36 42 40 36 38
»28.2 117.6 116.3 135.3 1 13.2 117.0 117.3 '25.0
21.2
7.3 21.4 6.5
11.7 130.1 143.5 147.5 138.1 143.2 149.0 129.6 121.7
37.8 21.2 39.5 47.2 29.6 34.4
81.0 80.6 71.1 77.6
81.1 81.5 85.9 82.8
81.0 81.2 81.6 81.3
70.7
70.4
78.5
74.5
78.2
67.8 55.1 51.2 58.0
41.2
72.1 75.1 73.7 73.6
m 4 96.5 95 4 97.5 94 8 96 7 96.2 96.5 96.2 96 9 96.0 95 6 96.1 96.7 95.3 96.7 97.4 96.2 95.5 97.9 97 3 95.8 96.8 98.0 95 ? 93.9 96.3 96.0 96.6 99.2 98.9 97 7
88.1 88.7 88.5 88.4
90.9 91.4 92.2 91.5
91.5 90.2 91.5 9L1
95 3
85.2 85.0 81.6 83.9
87.7 88.9 90.3 89.0
86.6 84.5 86.6 85.9
8L8 81.6 78.6 80.7
83.9 85.1 86.2 85.1
83.4 81.3 83.3 82.7
93.8
95.3
9«) 4
96 8
Subjects, 3 men, 24-27 yr. Experimental period, 2 days; preliminary meal of bread and milk. Marker, charcoal. Average N-bal- ance of 3 subjects, —2.0 gm. per day.
Subjects, 3 young men. Ex- perimental period, 4 days; preliminary meal of bread and milk. Marker, char- coal. Average N-balance of 3 subjects, -M.2gm. per day.
Subjects, young men. Ex- perimental period, 2 days. Marker, charcoal, taken with meal of milk preced- ing and following experi- mental period. Average N-balance of 3 subjects, —0.6 gm. per day.
Subjects, young men. Ex- perimental period, 3 days. Authors' customary ex- perimental procedure fol- lowed. 3-5 experiments made with each flour.
164
90
S
Í Calculated from authors' data using coefficients of digestibility for foods In remainder of diet as shown In table 13, p. 25.
18 The rye was milled to 67 percent and the branny fraction was obtahied from the remahilng portion of the grain. (Refers to original grain with 5 percent loss from cleaning.)
" Applies to all wheat Items except Semolina flours, Item 164, 165, and presumably items 166-171 which are Triticum durum.
'0 Ground from same lots of wheat and In same mill as those used by Snyder In experiments reported In references (164) and (166).
" Flours (a) to (e) named In order of coarseness of grind. •Indicates that composition, and In some cases also heat of combustion, was reported by author.
See table 24.

2 TABLE 23.—Apparent digeatihility and available energy of foods of plant origin f or human subjects—Continued
Daily intake per kilogram body weight
Proportion of total intake Coefficient of apparent digesti- Por- tion of
d Snhippt
supplied by test food bility of test food iz; o Test food, description Diet anc
weig gross Remarks 8 z it S
1 Pro- tein
Gross energy
Pro- tem Fat
Car- bohy- drate
Gross energy
Pro- tein Fat
Car- bohy- drate
Energy avail- able (S
GRAINS, GRAIN PRODUCTS—Con.
Wheat, Wheat Prod- ncto (Triticum aesti- puro)—Continued
Flours, whole-grain and nearly whole grain- Continued
96 Graham,* practically Bread (made of flour, yeast, salt, Subjects, 3 young men. Ex- perimental period, 4 days. Marker, lampblack. Au-
168 wheat meal. Un- and water), milk. Ko Gm. Cal. Pet. Pd. Pet. Pet. Pet. Pet. Pet. Pet. Pet. bolted, contained il 79 1.1 45.5 59 10 81 61 60.6 90.1 82.5 80.7 coarse, unpulver- 2 70 1.1 44.2 54 8 77 67 65.3 90.9 85.6 83.5 thor's customary experi- Ized particles. 3 70 .7 29.9 46 6 71 48 »40.5 92.6 83.8 82.6 mental procedure fol- Milled from Oregon Av. 73 1.0 39.9 53 8 76 65 63.0 91.2 83.9 82.3 lowed. Average N-bal- white winter wheat. ance of 3 subjects on Ore-
gon wheat, —4.3 gm. per «7 Graham,* practically Bread (made of flour, yeast, salt. Il 80 2.3 55.0 52 6 79 52 74.1 85.6 80.0 76.1 wheat meal. Un- and water), milk. r 70 1.8 41.8 57 7 83 57 82.2 89.1 90.5 86.1 day. Subject 3 lost 3 lb. bolted, contained 1^ 70 1.4 32.4 46 4 75 46 76.6 87.4 83.6 79.6 during experiment. Aver-
age N-balance of 3 sub- coarse, unpulver- [Ac. 73 1.8 43.1 52 5 79 52 77.3 87.4 84.7 80.6 ized particles. jects on Oklahoma wheat, Milled from hard —1.2 gm. per day. winter Weissenburg wheat from Okla- homa.
98 Graham,* milled Bread (made of flour, yeast, salt, (1 77 2.3 61.3 45 6 76 51 79.2 88.9 85.8 82.7 For experimental details see
remarks, Item 93. Aver- 166
from Michigan soft and water), milk. 2 76 2.2 59.8 43 5 75 50 80.1 ""7.0' 89.5 84.9 81.7 age N-balance of 3 sub- winter wheat. 1 69 2.4 64.9 46 6 77 52 79.0 76.8 89.6 86.6 83.5 jects on Michigan wheat,
[Av. 74 2.3 62.0 45 6 76 51 79.4 89.3 85.8 82.6 +7.6 gm. per day. 99 Graham, 100-pct. ex-
traction, milled in 663 gm. bread (made of flour, yeast,
salt, and water), oranges, butter. Av. 84.2 94.4 Subjects, young men, both
active and sedentary. 96
commercial mill sugar, tea or coffee if desired. Series of 139 experiments from mixture of made. Experimental per- wheats. " iods of 15-25 days sub-
divided Into separate suc- cessive 3-day periods in which bread from flours of 64-, 70-, 85-, and 100- percent extractions were fed in simple diets. Au- thors' customary experi-
/Subjects, young men. Ex. perlmental period, 2 days. Marker, lampblack, fed
193
Graham Bread, milk. Average dally Intake: 140 gm, protein, 3,760 gross cal- ories.
iCWS FHM CDH PFF
50 44 33 39 42
10 8 5 7 8
77 73 62 69 70
55 49 38 45 47
77.5 77.0 79.3 70.3 76.0
51.3 36.3 64.7 37.9 45.0
92.4 93.2 92.3 91.2 92.3
88.0 88.0 88.4 85.2 87.4
84.8 84.8 85.2 82.4 84.3
with meal of milk which preceded and followed ex- perimental period. Sub- ject FHM in negative N- balance, averaging —5.1 gm. per day; other 3 sub-
100
jects In positive N-bal- ance, averaging +9.7 gm. per day.
iAJP 62 1.6 63.5 59 16 78 53 80.7 83.9 92.7 87.8 85.1 See remarks. Item 100. 101 Graham Bread, milk, butter, sugar JOWK 62 1.4 60 7 50 21 6£
72 42 48
77.3 79.0
84.6 84.2
92.3 92.5
87.0 87.4
84.3 84.7
Average N-balance of 2 subjects, —1.4 gm. per day. [Av. 62 L5 62^1 54 14
102 Graham* Frozen pudding (containing raw graham flour, milk, oil, sugar, salt, flavoring), oranges, sugar, tea or coffee if desired. Average daily intake: 40 gm. protein, 2,085 calories.
Subjects, young women. Experimental period, 3 days. Marker, carmine taken at beginning of ex- perimental period, lamp- black with following per- iod on regular diet, 3-4
97
ATM CM RLP Av.
(2) (4) (4) 3
44 54 47 48
»74.1 »81.9 »78.7
78.2
96.4 97.3 98.0 97.2
days.
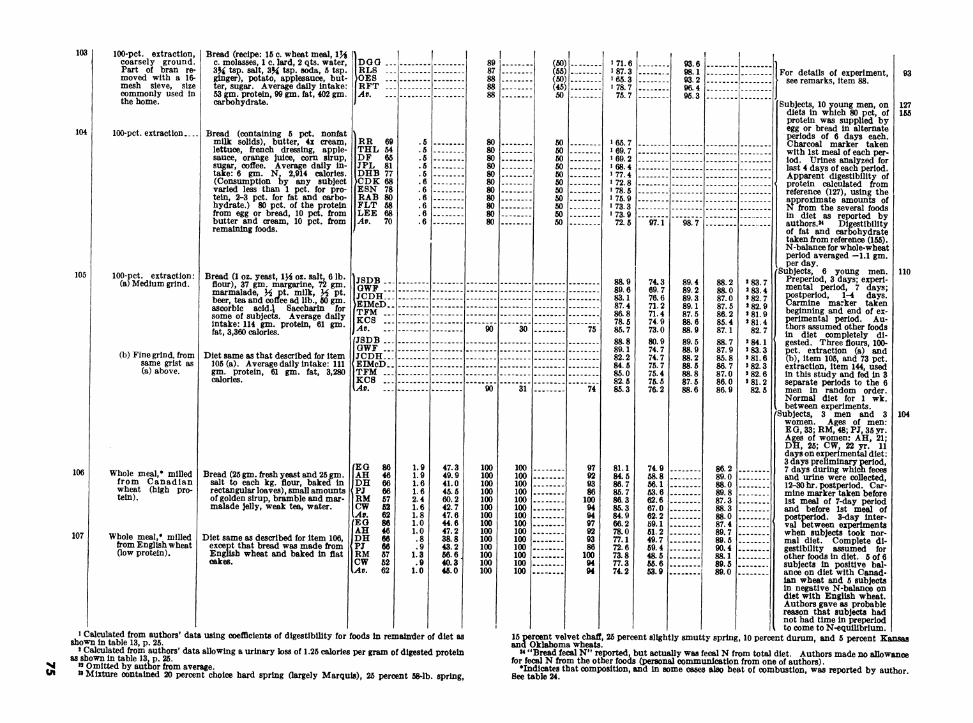
103
104
100-pct. extraction, coarsely ground. Part of bran re- moved with a 16- mesh sieve, size commonly used in the home.
100-pct. extraction..
106
107
100-pct. extraction: (a) Medium grind.
(b) Fine grind, from same grist as (a) above.
Whole meal,* milled from Canadian wheat (high pro- tein).
Whole meal,* milled from English wheat Oow protein).
Bread (recipe: 16 c. wheat meal, IH c. molasses, 1 c. lard, 2 qts. water, Z% tsp. salt, 3|i tsp. soda, 6 tsp. ginger), potato, applesauce, but- ter, sugar. Average daily Intake: 53 gm. protein, 99 gm. fat, 402 gm. carbohydrate.
Bread (containing 6 pet. nonfat milk solids), butter, 4x cream, lettuce, french dressing, apple- sauce, orange juice, com sirup, sugar, coffee. Average dally in- take: 6 gm. N, 2,914 calories. (Consumption by any subject varied less than 1 pet. for pro- tein, 2-3 pet. for fat and carbo- hydrate.) 80 pet. of the protein from egg or bread, 10 pet. from butter and cream, 10 pet. from remaining foods.
Bread (1 oz. yeast, 1^ oz. salt, 6 lb. flour), 37 gm. margarine, 72 gm. marmalade, H pt. milk, M pt. beer, tea and coffee ad lib., 60 gm. ascorbic acid.I Saccharin for some of subjects. Average daily intake: 114 gm. protein, 61 gm. fat, 3,360 calories.
Diet same as that described for Item 105(a). Average daily intake: 111 gm. protein, 61 gm. fat, 3,280 calories.
Bread (26 gm. fresh yeast and 25 gm. salt to each kg. flour, baked in rectangular loaves), small amounts of golden sirup, bramble and mar- malade jelly, weak tea, water.
Diet same as described for item 106, except that bread was made from English wheat and baked In flat cakes.
DOG I
89 87 88 88 88
80 80 80 80 80 80 80 80 80 80 80
(60) (65) (60) (45) 50
50 50 50 50 50 50 50 50 50 50 50
RLS ... )OES RFT ... Av.
|RR 69 THL 64 DF 66 JPL 81 DHB 77 CDK 68 ESN 78 RAB 80 FLT 58 LEE 68 Av. 70
JSDB ...
6 5 6 6 5 6 6 6 6 6 6
GWF ... JCDH .
JEIMCD.. TFM ... KCS ... Av. ... 90 30 75 JSDB ... GWF ... JCDH... EIMcD, TFM ... KCS . Av. 90
100 100 100 100 100 100 100 100 100 100 100 100 100 100
31
100 100 100 100 100 100 100 100 100 100 100 100 100 100
74
97 92 93 86
100 94 94 97 92 93 86
100 94 94
EG 86 AH 46 DH 66 PJ 66 RM 57 CW 62 Av. 62 EG 86 AH 46 DH 66 PJ 66 RM 57 CW 62 Av. 62
1.9 1.9 1.6 1.6 2.4 1.6 1.8 1.0 1.0 .8 .9
1.3 .9
1.0
47.3 49.9 41.0 46.6 60.2 42.7 47.6 44.6 47.2 38.8 43.2 66.6 40.3 46.0
> Calculated from authors' data using coefficients of digestibility for foods In remainder of diet as shown in table 13, p. 25.
Í Calculated from authors' data allowing a urinary loss of 1.25 calories per gram of digested protein as shown in table 13, p. 25.
N « Omitted by author from average. w» » Mixture oontained 20 percent choice hard spring (largely Marquis), 25 percent 58-lb. spring.
»7L6 1
93.6 98.1 93.2 96.4 95.3
»87.3 »65.3 1 78.7
76.7
»66.7 »69.7 »69.2 168.4 » 77.4 1 72.8 »78.5 »75.9 »73.3 »73.9
72.5 97.1 98.7
88.9 74.3 89.4 88.2 «83.7 89.6 69.7 89.2 88.0 »83.4 83.1 76.6 89.3 87.0 «82.7 87.4 71.2 89.1 87.5 »82.9 86.8 71.4 87.5 86.2 »81.9 78.5 74.9 88.6 85.4 »81.4 85.7 73.0 88.9 87.1 82.7 88.8 80.9 89.5 88.7 »84.1 89.1 74.7 88.9 87.9 »83.3 82.2 74.7 88.2 85.8 »81.6 84.6 75.7 88.5 86.7 »82.3 86.0 75.4 88.8 87.0 »82.6 82.5 75.6 87.6 86.0 »81.2 85.3 76.2 88.6 86.9 82.5
81.1 74.9 86.2 84.5 68.8 89.0 86.7 56.1 88.0 85.7 53.6 89.8 86.3 62.6 87.3 85.3 67.0 88.3 84.9 62.2 88.0 66.2 69.1 87.4 78.0 51.2 89.7 77.1 49.7 89.5 72.6 59.4 90.4 73.8 48.6 88.1 77.3 65.6 89.6 74.2 53.9 89.0
, 10 young men, on vhî • -- -
127 155
Subjects, diets in which 80 pet, of protein was supplied by egg or bread in alternate periods of 6 days each. Charcoal marker taken with 1st meal of each per- iod. Urines analyzed for last 4 days of each period. Apparent digestibility of protein calculated from reference (127), using the approximate amounts of N from the several foods in diet as reported by authors.»* Digestibility of fat and carbohydrate taken from reference (156). N-balance for whole-wheat period averaged -1.1 gm. per day.
Subjects, 6 young men. 110 Preperlod, 3 days; experi- mental period, 7 days; postperiod, 1-4 days. Carmine marker taken beginning and end of ex- perimental period. Au- thors assumed other foods In diet completely di- gested. Three flours, 100- pct. extraction (a) and (b), item 106, and 73 pet. extraction. Item 144, used in this study and fed In 3 separate periods to the 6 men in random order. Normal diet for 1 wk. between experiments.
Subjects, 3 men and 3 104 women. Ages of men: EQ,33;RM,48;PJ,36yr. Ages of women: AH, 21; DH, 25; CW, 22 yr. 11 days on experimental diet: 3 days preliminary period, 7 days during which feces and urine were collected, 12-30 hr. postperiod. Car- mine marker taken before 1st meal of 7-day period and before 1st meal of postperiod. 3-day Inter- val between experiments when subjects took nor- mal diet. Complete di- gestibility assumed for other foods in diet. 5 of 6 subjects In positive bal- ance on diet with Canad- ian wheat and 5 subjects In negative N-balance on diet with English wheat. Authors gave as probable reason that subjects had not had time in preperlod to come to N-equllibrium.
15 percent velvet chaff, 25 percent slightly smutty spring, 10 percent durum, and 5 percent Kansas ana Oklahoma wheats.
^ "Bread fecal N" reported, but actually was fecal N from total diet. Authors made no allowance for fecal N from the other foods (personal communication from one of authors).
•Indicates that composition, and in some cases also beat of combustion, was reported by author See table 24.
For details of experiment, see remarks, item 88.
93

TABLE 23.—Apparent digestiUîity and available energy of foods of plant origin for human subjects—Continued
Daily intake per kilogram body weight
Proportion of total intake Coefficient of apparent digesti- Por- ©
Test food, description Diet Subject
and
supplied by test food bility of test food tion of gross
energy Remarks
Z 8
1 1
g weight
Pro- tein
Gross energy
Pro- tein Fat
Car- bohy- drate
Oross energy
Pro- tein Fat
Car- bohy- drate
Energy avail- able 1
GRAINS, GRAIN PRODUCTS-Con.
Wheat, Wheat Prod- ucts (Triticum aesti- Mi 771/-Continued
Flours, whole-grain and nearly whole grain- Continued
108 Whole meal,* ground Cakes or porridge made of whole- /Subject A, a physician. Suc- 28
by subject. wheat meal and water: Kg. A A A 0
66 64 66 66
Gm. 1.0 1.2 1.7 1.2
Cal. Pet 100 100 100 100
Pet. 100 100 100 27
Pet. 100 100 100 100
Pet. 100 100 100
Pet. 81.0 82.2 83.6 89.6
Pet. 69.6 77.8 36.0
Pet. Pet. Pet. cessive experimental pe- riods of (1) 8 days with 16 oz. whole meal eaten daily, (2) 14 days with 20 oz. meal daily, (3) 7 days with 28 oz. meal daily. Subject 0 took 16-22 oz. meal daily
16-22-oz. meal eaten daily as cakes or porridge, olive oil.
for 7-day period. Collec- V tion of feces last 3 days.
109 100-pct. of wheat ker- nel* "wheat meal
Bread, beer. Average daily intake of bread, 990 gm.
D 69.5 48.9 92.6 Subject, 1 man. Experi- mental period, 3 days.
146
110 •'Peeled wheat," only thin epidermis of wheat berry re-
Diet and daily Intake as described for item 104.
Av. 80 60 »73.0 97.1 99.1 Subjects, young men. 10 used for period on peeled wheat, item 110; 5 for pe- riod on item 111. For de-
127 166
111 " Peeled wheat," only thin epidermis of wheat berry re- moved.
Diet and daily intake as described for item 104.
(a) Bread (with ordinary yeast)... (b) Bread (with high vitamin
yeast).
Av. Av.
80 80
60 60
174.6 »76.3
97.1 97.0
98.6 98.6
tails of experiment and note on calculations see remarks, item 104. Aver- age N-balance for subjects,
, —1.0 gm. per day.
Flours, intermediate ex-
112 tractions:
"Entire wheat," * Bread, milk fl 72 1.1 29.7 41 7 70 46 78.1 65.6 93.6 87.6 84.4 íFor experimental details see 164
part of bran re- moved Milled from
2 64 1.1 29.9 60 10 78 66 83.9 48.1 94.6 89.6 86.1 remarks, item 92. 3 sub- l3 77 1.1 28.8 43 8 72 47 79.1 63.6 94.1 89.4 86.1 jects in negative N-bal-
iiard spring wheat, Av. 71 1.1 29.6 45 8 73 49 80.4 66.8 94.1 88.9 86.5 ance, averaging —2.9 gm.
113 Scotch Fife.
"Entire wheat,"* part of bran removed.
Bread (made of flour, yeast, salt, and water), milk.
1 2
76 71
2.2 2.4
62.6 68.0
61 42
2 1
80 74
66 48
83.4 86.6
96.2 96.6
93.0 89.1 90.0
per day. For experimental details, see
remarks, item 93. 3 sub- 166
Milled from hard i3 73 2.9 68.2 42 1 74 48 88.8 96.9 94.3 [89.4] \ jects in positive N-bal- spring wheat, Av. 73 2.6 69.6 46 1 76 61 86.2 96.2 93.7 89.6 ance, averaging -f 4.9 gm.
per day. For experimental details see
remarks, item 94. Aver- 114
Scotch Fife. "Entire wheat," * part
of bran removed Bread (made with yeast), milk,
butter, sugar. PHM JCT
82 64
1.2 1.2
48.1 62.6
76 77
16 9
83 81
60 49
81.9 78.7
78.6 61.6
97.0 94.5
91.9 86.4
88.7 83.4
196
Milled from hard 'WBW 66 .9 40.8 76 11 86 66 81.8 78.4 96.4 91.2 88.0 age N-balance of 3 subjects, spring wheat, Av. 67 1.1 60.6 76 12 83 66 80.8 72.9 96.0 89.8 86.7 [ -1.3 gm. per day.
115 Scotch Fife.20
"Entire wheat,"* larger portion of coarse bran re-
Bread (made of flour, yeast, salt, and water), milk. P 82
72 1.4 1.6
32.1 40.4
24 34
6 9
73 82
46 68
66.9 77.6
93.8 94.6
88.9 91.6
87.0 89.5
/For experimental details see remarks, item 96. Sub-
168
13 7? 1.0 27.4 36 9 83 69 68.9 93.8 88.6 86.7 jects 1 and 2 in positive moved, shorts and germ retained. Milled from Oregon
[Av. 76 1.3 33.3 31 8 79 64 71.1 94.1 89.7 87.7 N-balance, -f 0.3 and +2.7 gm.; subject 3 in negative N-balance, -1.7 gm. per day.
For experimental details see remarks, item 96. Sub- 116
white winter wheat. "Entire wheat." *86-
pct. of wheat. Mlllpd from hard
Bread (made of flour, yeast, salt, and water), milk. 1^ 79
71 2.3 1.7
66.8 42.7
63 64
7 7
76 76
54 66
76.7 84.4
89.6 92.0
86.6 90.6
81.9 86.5
13 70 1.6 37.6 44 6 68 45 78.7 90.0 86.7 82.9 jects 1 and 2 in positive N-balance, -f 0.3 and +0.6; subject 3 in negative N-
l balance, —0.2 gm. per day.
winter Weissenburg wheat from Okla- homa.
[Av. 73 1.8 46.7 60 6 73 61 79.6 90.5 87 6 83.8

117
119
121
122
123
124
125
126
127
128
'Entire wheat," * a small portion of the bran removed. Had characteristics of a finely pulver- ized graham flour. Milled from Indiana soft winter wheat.
'Entire wheat," * milled from Michi- gan soft winter wheat,
'Entire wheat"
"Entire wheat"
92 pet. of the wheat, coarse brown.
92 pet. of the wheat; 8 pet. of branny part removed. Milled from English wheat.
90-pct. extraction,* from English wheat. Reconsti- tuted for this ex- periment by mem- bers of Cereals Re- search Station, St. Albans, England.
90-pct. extraction,* from Manitoba wheat. Reconsti- tuted by members of Cereals Research Station, St. Al- bans.
88 pet. of the wheat..
88 pet. of the wheat, 12 pet. branny part removed. Milled from English wheat.
85-pct. extraction, "National wheat meal."
85-pct. extraction (patent, 1st and 2d clear, red dog, and shorts).»
Bread (made of flour, yeast, salt, and water), milk.
Bread (made of flour, yeast, salt, and water), milk.
Bread, milk. Average daily intake: 159 gm. protein, 4,190 gross calories.
Bread, milk, butter, sugar..
750-800 gm. bread, 600 cc. milk, 30 gm. filtered butterfat, 20 gm. sugar.
Bread, milk, butter, sugar. Aver- age daily intake: 81 gm. protein, 3,100 calories.
Wheat flour made largely into bread; some made into pastries and cakes. Butter, bacon fat, bram-
, ble and marmalade jelly, weak ' tea or water if desired. 50 mg. as-
corbic acid taken daily if remem- bered.
Diet same as described for item 123. .
Bread, milk, filtered butterfat, sug- ar. For amounts, see item 121.
Bread, milk, butter, sugar. Aver- age daily intake: 82 gm. protein and 3,020 calories.
One-half of the mixed diet of the pre- liminary period » with bread (made of the National wheat meal) eaten in unrestricted amounts, jam. Average daily intake: 3,450 calories.
472 gm. bread (made of flour, yeast, salt, and water), oranges, butter, sugar, tea or coffee if desired.
Av. 72
1 76 2 76 3 68 Av. 73
ICWS ... PFF ... ABO ... Av, ...
AJP 60 OWK 62
[AP, 61
[11 82 IV 62 [Av. 72
MC RM RT BW CW EW Av.
/MC RM RT BW CW EW
[Av.
[II 82 IV 62 Av. 72
1 68 1.7 2 64 1.5 3 58 2.0 4 64 1.7 Av. 64 1.7
2.6 2.6 2.4 2.6
2.2 2.2 2.4 2.3
1.6 1.5 1.6
1.0 1.3 1.2
0.8 1.5 0.8 0.9 0.9 0.5 0.9 1.3 2.2 1.2 1.3 1.3 1.0 1.3
1.0 1.3 1.2
71.8 71.3 66.4 69.8
61.8 62.3 67.9 64.0
64.1 64.4 64.2
46.9 69.2 42.7 47.7 46.7 26.0 46.2 46.7 67.8 41.2 47.8 45.9 34.0 46.9
»»100
"100
77
62
78
89.5 84.9 79.3 84.6
86.8 82.8 87.4 85.7
79.2
»77.6
87.
87.6 89.9 89.5 91.6 89.4
87.1
"""76"Ó'
"'7Í."Í'
""48.4" 11.6
84.0 88.2 86.1
90.3 89.8 88.8 89.6
92.2 93.2 93.4 92.9
96.0 97.9 96.9 96.9
97.3 98.0 97.6
90.2 87.9 86.1 88.1
91.3 90.0 92.7 91.3
90.4 95.5 93.6 93.2
[93.0] 93.8 93.4
86.2 84.5 82.9 84.2
87.9 86.8 89.4 88.0
87.1 91.6 90.0 89.6
89.3 90.0 89.6
96.6
Eíroerimental period, 3 days. For other details of experi- ment see remarks, item 93. All 3 subjects in positive N-balanoe averaging +6.8
, gm. per day.
In this experiment all 3 sub- jects in positive N-balance, averaging +2.8 gm. per day.
For experimental details see remarks, item 100. Aver- age N-balance for 3 sub- jects, +7.0 gm. per day. Subject AJP In positive N-balance, +0.1 gm. per day; OWK in negative N-
, balance, — 1.1 gm. per day. Subjects, men. Experi-
mental period. 3 days. 4 meals daily. Marker, car- bon. Average N-balance of 2 subjects, -4.8 gm. per day.
Subjects, 4 male research students. Experimental period, 3 days.
Subjects, 2 men, 4 women. Experiment in 4 parts in which were tested flours of 90- and 80-pct. extrac- tion from both English and Manitoba wheats. For each flour there was a 3-day preperlod, 7-day test period, and a postpe- riod. Carmine marKer taken before 1st meal of test period and of postpe- riod. Feces collected In test period between ap- pearances of carmine. Ex- periment planned to mini- mize effects of season, hab- its, etc.
For experimental details see remarks, Item 121. Aver- age N-balanoe, —1.7 gm. per day.
For experimental details see remarks, item 122.
[Subjects, men of military age. Preliminary period of 1 wk. on mixed diet fol- lowed by 1-wk. period with bread replacing half of mixed diet. Marker, carmine. Feces and food
. analyzed in weekly periods. For experimental details see
remarks. Item 99.
166
193
133
192
106
133
192
86
96
1 Calculated from authors' data using coefficients of digestibility for foods In remainder of diet as shown in table 13, p. 25.
M Ground from same lots of wheat and in same mill as those used by Snyder In experiments reported In references (164) and (166).
M Mixture contained 20 pet. choice hard spring (largely Marquis), 26 pet. 68-lb. spring, 16 pet. velvet chaff, 25 pet. slightly smutty spring, 10 pet. durum, and 6 pet. ETansas and Oklahoma wheats.
" Authors stated that for all practical purposes the wheat flour constituted the sole source of N. M The mixed diet eaten In the prellmmarv period included meat, flsh, butter, margarine, bacon,
cheese, milk, potatoes, vegetables, and small amotmts of rice and porridge, famishing about 71 gm. protein and 1,860 calories per day.
* Indicates that composition, and in some cases also heat of combustión, was reported by author. 8eetoble24.
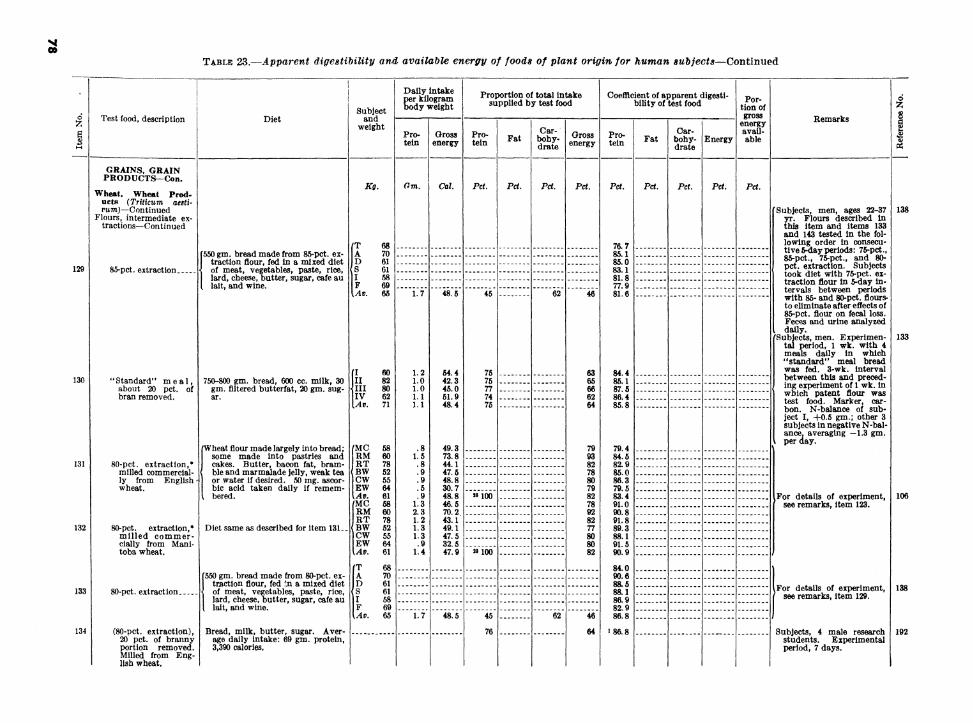
M
TABLE 23.—Apparent digestihility and available energy of foods of plant origin for human subjects—Continued
Test food, description Diet Subject
and weight
Daily intake per kilogram body weight
Pro- tein
Qross energy
Proportion of total intake supplied by test food
Pro- tein Fat
Car- bohy- drate
Oross energy
Coefficient of apparent digesti- bility of test food
Pro- tein Fat
Car- bohy- drate
Energy
Por- tion of gross
energy avail- able
Remarks
GRAINS, GRAIN PRODUCTS—Con.
Wheat. Wheat Prod- ucts (Triticum aesti- mm)—Continued
Flours, intermediate ex- tractions—Continued
131
132
133
85-pct. extraction.
"Standard" meal, about 20 pet. of bran removed.
80-pct. extraction,* milled commercial- ly from English wheat.
80-pct. extraction,* milled commer- cially from Mani- toba wheat.
80-pct. extraction.
SO-pct. extraction), 20 pet. of branny portion removed. Milled from Eng- lish wheat.
650 gm. bread made from 85-pct. ex- traction flour, fed in a mixed diet of meat, vegetables, paste, rice, lard, cheese, butter, sugar, cafe au lait, and wine.
Kg.
¡T 68 A 70 D 61 S 61 I 58 F 69
[Av. 66
750-800 gm. bread, 600 cc. milk, 30 gm. filtered butterfat, 20 gm. sug- ar.
Wheat flour made largely Into bread; some made into pastries and cakes. Butter, bacon fat, bram- ble and marmalade jelly, weak tea or water if desired. 50 mg. ascor- bic acid taken daily if remem-
, bered.
Diet same as described for item 131..
[650 gm. bread made from 80-pct. ex- traction flour, fed in a mixed diet of meat, vegetables, paste, rice, lard, cheese, butter, sugar, cafe au
[ lait, and wine.
Bread, milk, butter, sugar. Aver- age daily Intake: 69 gm. protein, 3,390 calorics.
fMC RM RT BW CW EW Av. MC RM RT BW CW EW Av.
T A D S I F .Av.
Gm.
1.7
1.2 1.0 1.0 1.1 1.1
1.5 .8 .9 .9 .5 .9
1.3 2.3 1.2 1.3 1.3 .9
1.4
Cal. Pet. Pet. Pet. Pet.
48.6 62
64.4 42.3 46.0 51.9 48.4
49.3 73.8 44.1 47.6 48.8 30.7 48.8 46.6 70.2 43.1 49.1 47.6 32.5 47.9
"100
"100
Pet.
76. 85. 85. 83. 81. 77. 81
63 84.4 66 86.1 66 87.6 62 86.4 64 85.8
79.6 83.4 91.0 90.8 91.8 89.3 88.1 91.6 90.9
84.0 90.6 88.6 88.1 86.9 82.9 86.8
«86.8
Pet. Pet. Pet. Pet.
Subjects, men, ages 22-37 3rr. Flours described in this item and items 133 and 143 tested In the fol- lowing order in consecu- tive 6-day periods: 76-pct., 86-pct., 76-pct., and 80- pct. extraction. Subjects took diet with 76-pct. ex- traction flour In 6-day in- tervals between periods with 86- and 80-pct, flours- to eliminate after effects of 85-pct. flour on fecal loss. Feces and urine analyzed
, daüy. Subjects, men. Experimen-
tal period, 1 wk. with 4 meals daily In which "standard" meal bread was fed. 3-wk. interval between this and preced- ing experiment of 1 wk. In which patent flour was test food. Marker, car- bon. N-b^ance of sub- ject I, -t-0.5 gm.; other 3 subjects in negative N-bal- ance, averaging —1.3 gm. per day.
,For details of experiment, see remarks. Item 123.
For details of experiment, ' see remarks. Item 129.
Subjects, 4 male research students. Experimental period, 7 days.
138
133
106
138
192

136
136
137
138
139
140
141
Flours, lower extrac- tions:
Standard patent,* included 1st and 2d patents, about 72.6 pet. of the screened wheat. Milled by roller process from hard spring wheat, Scotch Fife.
Straight patent* (or standard patent) included 1st and 2d patents and 1st clear. About 72
»ct. of the wheat, ^filled from hard
spring wheat, Scotch Fife.
Bread and milk.
pet. Mill
Straight patent,* in- cluded 1st and 2d patents and 1st clear. 72 pet. of the wheat. From same lot of wheat as item 135.»«
Standard patent* or straight grade, about 70 pet. of the wheat. Milled from Oregon white winter wheat.
Standard patent* or straight grade. About 70 pet. of the wheat. Milled from hard winter Weissenburg wheat from Oklahoma.
Standard patent* or straight grade. Largely straight flour with some lower grades and a little germ. MUled from Indi- ana soft winter wheat.
Standard patent* or straight. Con- tained somewhat less than 72 pet. of wheat kernel. Milled from Mich- igan soft winter wheat.
Bread and milk, full ration.
Bread and milk, H ration.
Bread and milk, half ration.
Bread (made of flour, yeast, salt, water), milk.
Bread (made with yeast), milk, butter, and sugar.
Bread (made with yeast), milk, butter, and sugar, one-half ration.
Bread (made of flour, yeast, salt, and water), milk.
Bread (made of flour, yeast, salt, and water), milk.
Bread (made of flour, yeast, salt, and water), milk.
Bread (made of flour, yeast, salt, and water), milk.
Í1 72 2 64 3 75 4 71 Ac. 70 1 69 2 68 3 73 Av, 70 1 69 2 70 3 73 Ac. 71 I 70 2 70 3 72 Ac. 71
Ac.
PHM 83 1.4 JCT 65 1.3 WBW 66 1.2 Ac. 68 1.3 PHM 80 .4 JCT 63 1.0 Ac. 66 .7
1 79 1.3 2 69 1.5 3 70 l.l Ac. 73 1.3
1 79 2.2 2 71 1.7 3 69 1.7 Ac. 73 1.9
1 73 2.6 2 74 2.2 3 69 2.1 Ac. 72 2.3
Ac.
0.9 1.0 1.0 1.3 1.0 2.2 2.3 2 3 2 3 1.6 1.4 1.6 1.6 1.4 1.1 1.2 1.2
1.9 2.3 2.7 2.3
2.1 2.1 2.0 2.1
24.2 29.8 28.3 36.6 29.7 62.9 63.1 66.3 63.8 42.0 38.7 43.0 41.2 37.4 30.0 33.1 33.6
48.0 67.2 64.7 66.6
60.5 67.0 44.6 60.6 19.0 38.8 28.9
44.4 62.8 41.2 46.1
66.0 43.2 43.2 46.7
71.6 62.6 69.2 64.4
60 5 61.8 68.8 60.4
SI
80 77
64 60
72 46 72 46 73 46 72 46
81 66 79 60 83 62 81 63 80 62 81 66 80 64
78 60 83 68 84 69 82 66
77 67 80 61 80 61 79 60
77 61 81 56 81 67 80 66
78 52 76 49 79 54 78 52
82.8 90.3 86.6 85.6 87.7 90.2 87.8 88.6 86.6 87.8 87.3 93.3- 91.1 91.7 92.0
86.6 88.4 91.1 88.3
94.7 91.2 96.6 93.8 77.3 86.2 81.2
86.6 89.4 79.8 84.9
90.2 91.9 90.6 90.9
94.2 89.4 83.0 88.9
93.0 94.4 90.9 92.8
66.2 62.6 61.3
56.4
70.0
93.6 88.5 95.9 92.6 34.4 66.9 50.6
62.1 64.4
63.2
97.4 93.5 90.0 97.9 93.7 90.3
89.1 97.1 92.3 97.4 96.8 92.2 97.4 93.8 90.4 98.6 96.1 92.6 96.7 94.9 91.4 97.0 95.6 92.0 97.4 95.5 92.0 97.7 95.3 91.8 97.2 94.9 91.6 98.0 96.0 92.5 97.6 95.4 91.9 98.0 97.0 93.3 97.9 96.6 92.9 97.6 95.4 91.8 97.8 96.3 92.7
97.9 94.8 90.9 98.1 95.5 91 4 97.0 94.5 90.3 97.7 94.9 90.9
99.7 97.9 94.2 98.2 94.8 91.2 98.8 97.0 93.2 98.9 96.6 92.9 94.1 82.8 79.8 98.7 93.6 90.4 96.4 88.2 86.1
98.0 96.9 94.8 98.9 98.5 96.3 97.8 95.9 94.0 98.2 97.1 95.0
96.7 94.8 90.7 98.2 97.6 93.3 98.1 96.3 92.2 97.7 96.2 92.1
95.6 93.9 90.4 96.6 93.6 90.4 95.8 93.6 90.4 96.0 93.7 90.4
97.6 97.3 93.4 98.3 98.6 95.1 98.2 97.4 94.1 98.0 97.7 94.2
For experimental details, see remarks item 92. Average N-balance for 4 subjects on 1st diet, —2.7 gm. per day; for 3 subjects on full ration, +4.9 gm., and on ^i ration, -1-2.1 gm. On the ^ ration, subjects 1 and 3 averaged —8.0 gm., subject 2, -1-1.9 gm. per day.
For details of experiment see remarks, item 93. 3 subjects in positive N-bal- ance, averaging +3.7 gm. per day.
'For details of experiment see remarks, item 94. Subjects PHM and WBW in negative N-balance, averaging —0.9 gm.; sub-
{ ject JCT in positive N- balance, +0.9 gm. per day. Subjects on half ration in negative N-bal- ance, averaging —4.3 gm. per day.
For details of experiment see remarks, item 96. For diet (item 138), sub- jects 1 and 3 in negative N-balance, averaging -2.1 gm.; subject 2 in pos- itive N-balance, +2.8 gm. per day. For diet (item 139), subjects 1 and 2 averaged —1.6 gm. and subject 3, +1.3 gm. per day.
Experimental period, 3 days. For other details of experiment see remarks, item 93. All subjects in pxwitive N-balance, aver- aging +4.7 gm. per day on diet (item 140), and +3.7 gm. on diet (item 141).
164
166
» Calculated from author's data using coeflBcients of digestibility for foods in remainder of diet as shown in table 13, p. 25.
N| *• Ground from same lots of wheat and in same mill as those used by Snyder in experiments reported <0 in references (/tf4) and (iff«). ^ ^
" Authors stated that for all practical purposes the wheat flour constituted the sole source of N. *Indicates that composition, and in some cases also heat of combustion, was reported by author.
See table 24.

00 o TABLE 23.—Apparent digestiMUty and available energy of foods of plant origin for human subjects—Continued
Test food, description Diet Subject
and weight
Daily intake per kilogram body weight
Pro- tein
Proportion of total intake supplied by test food
Gross energy
Pro- tein Fat
Car- bohy- drate
Gross energy
Coefficient of apparent digesti- bility of test food
Pro- tein Fat
Car- bohy- drate
Energy
Por- tion of gross
energy avail- able
Remarks
143
144
GRAINS, GRAIN PRODUCTS—Con.
Wheat, Wheat Prod- ucts (Triticum aesti- pum)—Continued
Flours, lower extrac- tions—Continued
Standard patent. 70 pet. extraction. Included patent, 1st clear, and small portion of 2d clear. Milled from wheat mixture."
75-pct. extraction
146
147
148
149
160
Straight run, 73-pct. extraction. From same grist as item 105.
70 pet. of wheat ker- nel.* Middle-grade flour. Milled from mixture of Girka and Minnesota wheats.
1st patent,* milled from a hard spring wheat, Scotch Fife.
2d patent*
Patent,* milled from a hard spring wheat, Scotch Fife.
Patent, baker's grade.* Milled from Scotch Fife.
Patent, a high-grade white flour.
564 gm. bread (made of flour, yeast, salt, and water), oranges, butter, sugar, tea or coffee if desired.
550 gm. bread made from 75-pct. extraction flour, fed in a mixed diet of meat, vegetables, paste, rice, lard, cheese, butter, sugar, cafe au lait, and wme.
Diet same as described for item 105. Average daily intake: 110 gm. pro- tein, 56 gm. fat, 3,410 calories.
Bread and beer, gm. bread.
Bread and milk_
Daily intake: 880
Bread and milk.
Bread, eggs, butter.
Bread, eggs, butter.
750-800 gm. bread, 600 cc. milk, 30 gm. filtered butter fat, 20 gm. sugar.
Kg. Av.
T A D S I F
UP.
fJSDB .. GWF ..
IJCDH.. EIMcD. TFM .. KCS .. Av. ..
D
Cal. Pet.
1.6 1.6 1.9 1.9 1.9 1.6 1.7
46.3 45.0 51.6 51.6 54.3 45.7 48.5
1.3
1.3
1.3
1.4
1.3 1.0 1.0 1.2 1.1
35.0
35.2
52.2 39.4 42.1 60.9 46.2
90
Pet. Pet. Pet.
23
72
100
100
Pet. 90.1
87.4 92.2 90.9 92.2 88.6 83.7 89.2
94.1 92.0 88.2 92.3 89.7 90.5 91.1
75.4
188,
89.
Pet. Pet. Pet. Pet.
79.3 79.4 76.7 80.6 75.2 82.3 80.6
37.2
193.0
191.5
98.7 99.0
98.0
98.7
196.8
196.8
96.8 96.5 95.4 96.5 95.5 96.0 96.1
2 92.3 2 92.0 2 91.1 2 92.0 2 91.1 2 91.5
91.7
96.4
97.1
92.8
93.5
For details of experiment see remarks, item 99.
For details of experiment ' see remarks, item 129.
For details of experiment see remarks, item 105.
Subject, 1 man. Experi- mental period, 3 days.
For details of experiment see remarks, item 92. N- balance of subject 4 on 1st patent flour was +1.8 gm. and on 2d patent flour, —3.1 gm. per day.
Subject, 22-yr.-old man. Experimental period, 2 days. Marker, charcoal. Author's usual laboratory procedure followed. Sub- ject in positive N-balance in both experiments, aver- aging +0.6 gm. per day.
'Subjects, 4 men. Experi- mental period, 1 wk., 4 meals per day. Marker, carbon. Subject I in posi- tive N-balance, +0-8 gm. per day; others in nega- tive N-balance, averag- ing -1.9 gm. per day.
138
146
164
170
133

152
167
158
159
Patent*
Patent, enriched. Contained 11.7 pet. protein.
Patent.
Patent, milled from a blend of English and foreign wheats.
Patent, 64-pct. ex- traction. Milled from a wheat mix- ture. »
White flour, (presum- ably a patent).
White flour (presum- ably a patent).
White flour (presum- able a patent).
White flour (presum- able a patent).
Frozen pudding (containing raw patent flour, milk, oil, sugar, salt, flavoring), oranges, sugar, tea or coffee if desired. Average daily intake: 44 gm. protein, 2,060 cal- ories.
Test food with basal diet of sugar- cornstarch-lard cookies, sucrose, lactose, fondant, jelly, butterfat, lemon juice, applesauce, lettuce, french dressing.
Baking powder biscuits ^"^
ATM ... (50) (50) (60) (50)
95
(2) (2) (2) (2)
52 51 44 49
CM RLP Av.
Yeast breads: Oiirrant bims *7 Rolls " Biscuits"
Cakes, cookies: Qinger cakes'^-- .. Ginger snapts *' Molasses cakes *^ Suear cakes '^
Crackers: Boston 27 Boston butter *^ Sea biscuits '^ Soda 27
Doughnuts ^ Pancakes 27 Piecrust " Pretzels" Bread, milk, butter, sugar. Daily
Intake: 70 gm. protein, 3,220 cal- ories.
600 gm. bread (made of flour, yeast, salt, and water), oranges, butter, sugar, tea or coffee If desired.
76
.
65
ÍHBS 66 HBS 66
•LHH
1.1 .6
35.2 21.3 Bread and a small amount of beef
tea. Average daily Intake: 43 gm. protehi, 1,620 gross calories.
LWF ... Av. (100)
63 49 62 49 66 46 67 44 44 48 46
(100) 33 17 10
6 16
8 8 9 9 8 6
(100) 87 79 85 77 82 74 74 69 67 71 71
(100) 70 57 66 54 62 61 48 43 43 46 43
fLHH ... Bread and milk. Average daily intake: 108 gm. protein, 3,020 gross calories.
HBS 66 CWS
1.3 38.4
PFF .- Av.
Bread, milk, butter, sugar.
AJP 62 BRM 75
■ AJP 61 OWK 61 Av. 65 OWK 67
2.1 1.8 1.9 1.9 1.9 .8
78.0 64.5 63.0 62.0 66.9 27.6
Bread, milk, butter, sugar. Par- tially fasting.
Bread (made with water), eaten in simple and mixed diets.«
»69.0 >91.2 »85.6
81.9
81.6
88.2
88.0 88.6 88.2
85.6 85.2 84.6 88.4
87.7 93.0 94.1 92.7 91.8 86.3
29 76.9 88.2
»89.8
87.7
90.9 80.0 81.7 76.4 82.0 79.6 83.2 88.2 80.1 82.8 94.6 87.2 92.2 92.1 91.5 97.7
85.6
100 100 100 100
97.4
98.1 97.7 96.8
97.8 97.7 97.9 98.0
97.9 96.7 98.8 98.4 96.8 96.5 99.6 98.0
82.3 65.6 67.6 67.2 70.6 70.8 63.1 50.9
""èi.'è" 89.9 45.0 89.6 91.2 78.9 99.1
99.7
98.3 98.9 97.7 98.7 98.4 98.0 97.6 97.9 97.8 97.8 99.1 98.4 98.2 98.1 98.4 98.9
98.9
96.2 94.1 93.3 93.5 94.3 97.0 92.9 94.6 89.7 93.6 97.2 91.9 95.2 95.2 94.9 98.7
94.0
92.7 91.2 90.3 90.7 91.2 94.3 89.9 90.7 86.1 90.2 94.2 88.3 91.5 91.6 91.4 94.7
For details of experiment, see remarks. Item 102.
For each test food, used 4 or 6 subjects (young women) and 7-13 experimental pe- riods. Experimental peri- od continued until N output In urine was rea- sonably constant for 3 or more days. Average length experimental period, 7.6 days. Feces collected for period of 3-6 days. Marker, either FejOj or CrjOs, given in 0.3-O.6 gm.
Subjects, young men. Ex- perimental period, 3-4 days. 3 experiments for each food with follow- ing exceptions: Piecrust, 5 experiments; Boston crackers, 9 experiments. Results summarized from experiments at Minn. Agr. Expt. Sta. by Snyder, and experiment on piecrust at Off. Home Econ., USDA. Experimental methods used In the 2 laboratories were essentially the same.
Subjects, 4 male research students. Experimental period, 7 days.
For details of experiment, see remarks. Item 99.
For details of experiment see remarks, Item 100. Average N-balance of 4 subjects; -6.7 gm. per day on bread and beef tea diet, —0.9 gm. on bread and milk diet, +0.8 gm. on diet (Item 167). Sub- ject OWK on diet (Item 168), -3.4 gm. per day.
Subjects, young men. Ex- perimental period, 6 days; also see remarks. Item 14.
97
192
96
193
120
» Calculated from authors' data, using coefficients of digestibilty for foods in remainder of diet as shown in table 13, p. 25.
2 Calculated from authors' data allowing a urinary loss of 1.25 calories per gram of digested protein as shown In table 13, p. 25.
* Simple diet, milk, sugar and/or butter; mixed diet, meat and canned peaches In addition. 23 Mixture contained 20 percent choice hard spring (largely Marquis), 26 percent 68-lb. spring,
15 percent velvet chaff, 26 percent slightly smutty spring, 10 percent durum, and 6 percent r and Oklahoma wheats.
" Type of diet not reported. 28 Bread Included in the diet. No further description given. 2« According to the author this value presumably was unduly low since the protein Intake was so
small that accurate results could not be expected. ♦Indicates that composition, and in some cases also heat of combustion, was reported by author.
See table 24.

TABLE 23.—Apparent digeatihility and available energy of foods of plant origin for human subjects—Continued
Test food, description Diet Subject
and weight
Daily intake per kilogram body weight
Pro- tein
Oross energy
Proportion of total intake supplied by test food
Pro- tein Fat
Car- bohy- drate
Gross energy
Coeflftcient of apparent digesti- bUity of test food
Pro- tein Fat
Car- bohy- drate
Energy
Por- tion of gross
energy avail- able
Remarks
160
161
162
163
164
166
166
167
168
170
171
GRAINS, GRAIN PRODUCTS—Con.
Wheat, Wheat Prod- net« (TrUicum aetti- pum >~Continued
Flours, lower extrac- tions—Continued
White flour (presum- ably a patent).
White flour (presum- ably a patent).
White flour (presum- ably a patent).
30 pet. of the wheat kernel,* milled from mixture of Odessa, California, and English wheats.
Flours, other: Semolina.* Included
all the flour and middlings except dark-colored break flour, i. e., 1st, 2d, and coarse mid- dling flours, and break flour. Milled from dunmi wheat, Kubanka.
Semolina,* milled from Kubanka wheat as described for item 164.
Flour, used in making pastes.
Flour, gluten added; used in making
Flour, used in mak- ing pastes.
Flour, used in mak- ing pastes. Best quality flour.
Flour, used in mak- üig pastes.
Flour used In mak- ing pastes. From durnm wheat.
A lean white bread, No. 1 from a chain store, eaten In diet as de- scribed for item 104.
Bread (made with 6 pet. nonfat milk solids and high-yitamin yeast) eaten in diet as described for item 104.
A lean white bread. No. 2 from a chain store, eaten In diet as de- scribed for Item 104.
Bread and beer. Average daily in- take: 900 gm. bread.
Macaroni and bread (both made trom semolina) 1:1, with milk.
Macaroni and bread (both made from semolina) 2:1, with milk.
Macaroni and milk..
Macaroni noodles cooked in salted water. Fat added. Dally in- take: 62 gm. protein, 72 gm. fat, 462 gm. carbohydrate.
Macaroni noodles cooked In salted water. Fat added. Daily In- take: 129 gm. protein, 73 gm. fat, 418 gm. carbohydrate.
Spaetzels.M Dally Intake: 68 gm. protein, 668 gm. carbohydrates.
Macaroni used in a thick soup "
Macaroni used In a thick soup "_.
Macaroni used in a thick soup »-
Kg.
1 79 2 81 3 64 Av. 76
1 79 2 81 3 64 Av. 76
D 74
D 74
D 74
Om.
Av.
1.3 1.7 1.8 1.6
1.6 1.8 1.7 1.7
1 68 1.0 2 83 1.0 3 83 .9 Av. 78 1.0
.8
.9
Cal. Pet. 80
80
Pd. Pet. 60
60
Pet. 29
29
38.0 48.6 63.3 46.6
44.9 60.1 47.6 47.6
30.2 30.6 28.6 29.7
40 44 49 44
64 64 62 63
100
100
100
100
100
29
Pet. 181.1
»78.6
180.4
79.3
87.6 91.3 83.7 87.6
82.0 88.9 82.0 84.3
82.9
»179.6
91.2
90.8
Pet.
66.3
66.2
94.3
93.0
87.6
86.2
87.9
Pet. 97.4
97.0
97.2
98.9
98.4 97.3 96.6 97.4
97.8 97.4 97.7 97.6
97.3 97.1 97.0 97.1
98.8
97.7
98.4
97.6
96.3
97.4
Pet. 99.7
99.8
99.8
Pet.
97.2 96.0 94.9 96.7
96.7 96.6 96.4 96.2
94.4 96.2 92.8 94.1
91.7 91.7 92.4
93.6 93.1 92.3 93.0
91.6 91.7
[90.0] 91.1
Subjects, 10 young men. For details of experiment and note on calculations see
• remarks, Item 104. Aver- age N-balance for the 3 pe- riods was —1.0 gm. per day.
Subject, man. Experimental period 3 days.
For details of experiment see remarks, item 96. For dibts (Item 164) subject 1 in 1st experiment and subject 3 In 2nd experi- ment in negative N-bal-
^ anee, averaging — 2.0 gm. per day. in the other trials, subjects were in positive N-balance, aver- aging +1.7 gm. For diet (Itiem 166) subjects 1 and 2 averaged -}-2.8 gm. per day, subject 3, —3.9gm.
Subject, 43-yr.-old man. Ex- perimental period, 2 days each on macaroni noodle diets and 3 days on spaetzel diet. N-balances for the 3 periods: —7.0, -1-2.2 and —4.4 gm. per day.
Subject, 48-yr.-old farmer. Experimental period, 3 days with 6 meals. Feces from 2d day used for
. analyses. Subjects, 3 men. Study by
E. CapellettI, in (IBB, pp. 66, 77, 78).
127 156
146
168
168

176
177
179
180
Flour mixtures: Mixture of 80 pet.
standard patent fiour and 20 pet. wheat starch. Similar to many low-protein flours on market.
"Bran flour,"* a mix- ture of 86 pet. straight-grade flour and 14 pet. very finely ground bran (amount removed in milling). MUled from hard winter Weissenburg wheat.
"Germ flour,"* a mixture of 93 pet. straight-grade flour and 7 pet. finely ground germ (amount removed In milling). MiUed from hard winter Weissenburg wheat.
Wheat breakfast foods: Whole-grain and par-
tially refined: Flaked.* Whole-
grain, 89.5 pet.; cane sugar, 7 pet,; salt, 3 pet.; malt sirup, 0.5 pet.; steam-cooked and toasted.
Flaked
Flaked, whole- grain, 89.5 pet.; cane sugar, 7 pet.; salt, 3 pet.; malt sfrup, 0.6 pet.; steam-cooked and toasted.
Meal, from hard red spring wheat.
Meal, * some of bran removed, granu- lated and toasted.
Meal,* coarser parts of bran removed. 5 pet. added wheat germ. Finely granu- lated.
Bread and milk, "two-thirds ration".
Bread (made of flour, yeast, salt, and water), milk.
Bread (made of flour, yeast, salt and water), milk.
Wheat flakes, fruits, cream, lettuce, coffee or beer. 1 vitamin ¿-com- plex tablet. Average intake : 2,930 calories, 6.84 gm. N. 78 pet. of N from wheat flakes, 11 pet. from cream and butter, 11 pet. from remaining foods.
Wheat flakes, sucrose or butter. (Butter not eaten by AF, sucrose not eaten by CK and OS.)
Wheat flakes in diet as described for item 29.
Wheat meal cooked with water and salt, 1 hr. at 16 lb. pressure, sucrose, butter. (Butter not eaten by AF.)
Wheat meal, cooked; fruits, cream, lettuce, coffee or beer. 1 vitamin B-oomplex tablet. Average in- take, see diet, Item 175.
Diet and Intake same as described for item 179; except average N-in- take, 6.04 gm.
1 70 2 70 3 73 Av. 71
1 83 2 70 3 72 Av. 76
1 82 2 70 3 69 Av. 74
AF 86 CK 78 OS 76 Av. 80
Av. 71
[AF 86 ICK 78 lOS 76 [Av. 80
Av. 71
1.3 1.3 1.4 1.3
41.9 39.2 43.2 41.4
2.0 1.6 1.6 1.7
49.0 39.1 39.0 42.4
2.2 2.1 1.8 2.0
64.3 61.8 43.9 60.0
.6 41.3
.7
.7
.7
.7 ""37."6'
.6 46.0
.7
.7
.7
.7 "37.6"
.6 41.3
.6 41.3
61 1 84 62 40 1 77 62 46 1 81 68 46 1 81 67
39 4 74 42 46 6 80 49 43 4 78 46 43 4 77 46
49 7 72 60 54 8 76 66 63 8 76 64 62 8 74 63
j
78
100 100 100 100
80
100 100 100 100
78
78
87. 91. 91. 90.
1 68.2
174.4 «73.9 »73.8
74.0
164.8
172.8 177.4 176.9
76.7
168.2
98.0 97.9 97.8 97.9
93.0 92.8 94.3 93.4
97.0 97.9 97.9 97.6
96.2 95.5 96.6 96.7
90.2 90.8 93.9 91.6
94.8 96.8 96.2 95.9
93.4 92.8 92.9 93.0
86.3 86.8 89.7 87.6
90.5 92.3 91.7 91.6
For details of experiment see remarks. Item 92. Subject 1 in negative N-balanoe, —3.6 gm. per day. Subjects 2 and 3 in positive N-balance. aver- aging +3.2 gm. per aay.
For details of experiment see remarks, item 96. Bran or germ added to straight flour to determine thefr effect on completeness of digestibUity. Subject 2 on bran flour diet in negative N-balanoe, —4.6 gm.; subjects 1 and 3 in positive N-balance, aver- aging +2.1 gm. per day. Subject 1 on germ flour diet in negative N-bal- ance, —0.1 gm.; subjects 2 and 3 in positive N-bal- anoe. averaging +3.6 gm. per day.
Subjects, 10 young men. For details of experiment and note on calculations see remarks, item 32. Average N-balance, —0.0 gm. per day.
Subjects. 3 men. For de- tails of experiment see re- marks, item 28. Avenge N-balance, —1.2 gm. per day.
Subjects, 11 men. For de- tails of experiment and note on calculations see remarks, item 29. Sub- jects in negative N-bal- ance during this period.
Subjects, 3 men. For de- tails of experiment see remarks, item 28. Aver- age N-balance, —0.7 gm.
. per day.
Subjects, 10 young men. For details of experiment and note on calculations see remarks, item 32. Average N-balance per day: tor period of test food, item 179, -0.6 gm.; itemlSO,-l.Ogm.
1 Calculated from authors' data, using coefficients of digestibility for foods in remainder of diet as shown in table 13, p. 25.
w Stiff paste prepared from flour, water, milk, and eggs, forced through a large-holed sieve into boiling water, cooked quickly, and drained.
*i Value applies to spaetzels; no correction made by author for digestibility of egg and milk in the spaetzels.
164
168
129
40
129
» Other ingredients of soup not eiven ¡assumed they were in too small amounts to introduce errors of any slgniflcanoe in the digestibility of macaroni.
'Indicates that composition, and in some cases also heat of combustion, was reported by author. See table 24.
CO
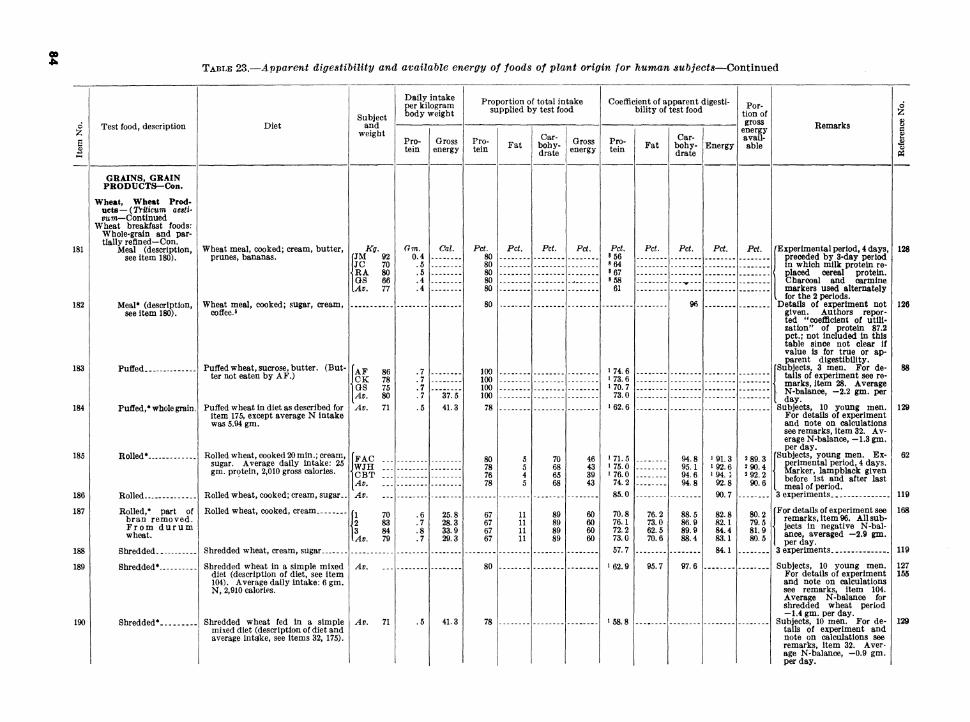
TABLE 23.—Apparent diffesUMUty and available energy of foods of plant origin for human .suhjects—Continued
Test food, description Diet Subject
and weight
Daily intake per kilogram body weight
Pro- tein
Gross energy
Proportion of total intake supplied by test food
Pro- tein Fat
Car- bohy- drate
Gross energy
Coefficient of apparent digesti- bility of test food
Pro- tein Fat
Car- bohy- drate
Energy
Por- tion of gross
energy avail- able
Remarks
182
GRAINS, GRAIN PRODUCTS-Con.
Wheat, Wheat Prod- ucts—(Triticum aesti- t>wm—Continued
Wheat breakfast foods: Whole-grain and par- tially refined—Con.
Meal (description, see item 180).
Meal* (description, see item 180).
184
185
186
187
188
189
190
Puffed.
Puffed,* whole grain
Rolled*
Rolled.
Rolled,* part of bran removed. From durum wheat.
Shredded-
Shredded*
Shredded*
Wheat meal, cooked; cream, butter, prunes, bananas.
Wheat meal, cooked; sugar, cream, coffee.*
Puffed wheat, sucrose, butter. (But- ter not eaten by AF.)
Puffed wheat in diet as described for item 175, except average N Intake was 5.94 gm.
Rolled wheat, cooked 20 min.; cream, sugar. Average daily intake: 25 gm. protein, 2,010 gross calories.
Rolled wheat, cooked; cream, sugar..
Rolled wheat, cooked, cream
Shredded wheat, cream, sugar
Shredded wheat in a simple mixed diet (description of diet, see item 104). Average daily intake: 6 gm. N, 2,910 calories.
Shredded wheat fed in a simple mixed diet (description of diet and average intsfke, see items 32, 175).
Kg Gm. JM 92 0.4 JC 70 .5 RA 80 .5 GS 66 .4
[Av. 77 .4
Cal.
FAC WJH CBT Av.
Av.
2
Av.
Av.
37.5
41.3
100 100 100 100
78
Pd, Pet. Pet.
25.8 28.3 33.9 29.3
41.3
80
78
Pet. 8 56 864 8 67 858
61
174.6 173.6 1 70.7
73.0
162.6
171.5 1 75.0 1 76.0
74.2
85.0
70.8 76.1 72.2 73.0
57.7
158.8
Pet. Pet. Pet. Pet.
96
94.8 95.1 94.6 94.8
76.2 73.0 62.5 70.6
88.5 86.9
1 91.3 1 92.6 1 94. i
92.8
90.7
82.8 82.1 84.4 83.1
84.1
2 89.3 2 90.4 2 92.2
90.6
80.2 79.5 81.9 80.5
95.7 97.6
Experimental period, 4 days, preceded by 3-day period in which milk protein re- ? laced cereal protein.
Charcoal and carmine markers used alternately for the 2 periods.
Details of experiment not given. Authors repor- ted "coefficient of utili- zation" of protein 87.2 pet.; not Included in this table since not clear if value is for true or ap- parent digestibility.
Subjects, 3 men. For de- tails of experiment see re- marks, item 28. Average N-balance, —2.2 gm. per
. day. Subjects, 10 young men.
For details of experiment and note on calculations see remarks, item 32. Av- erage N-balance, —1.3 gm. per day.
'Subjects, young men. Ex- perimental period, 4 days. Marker, lampblack given before 1st and after last
. meal of period. 3 experiments
For details of experiment see remarks, item 96. All sub- jects In negative N-bal- ance, averaged —2.9 gm. per day.
3 experiments
Subjects, 10 young men. For details of experiment and note on calculations see remarks, item 104. Average N-balance for shredded wheat period —1.4gm. per day.
Subjects, 10 men. For de- tails of experiment and note on calculations see remarks, item 32. Aver- age N-balance, —0.9 gm. per day.
128
126
129
62
119
168
127 156
129

191
m
195
196
197
198
199
200
Refined: Endosperm, granu-
lated.
Endosperm,^ ulated.
Endosperm,* gran- ulated.
Endosperm,* farina.
Endosperm,* farina.
Endosperm,* farina-
Wheat breakfast food mixtures:
Wheat and barley malt.
Wheat and barley malt.*
Wheat, whole grain, and barley malt.* *'Force."
Wheat, whole grain, and barley malt* "Force."
Wheat and barley malt. "Malta Vita.'^' Resembles "Force" in appearance and general character.
Wheat endosperm, cooked; cream, butter, prunes, bananas. Average daily intake, 5.6 gm. N, 2,900 cal- orics.
Wheat endosperm, cooked, fed in a simple mixed diet. Diet and av- age intake same as for items 32 and 175, except N intake was 5.87 gm.
Wheat endosperm, cooked; sugar, cream, coffee.*
Farina, cooked 20 mln.; cream, sugar. Average daily intake: 34 gm. pro- tein, 2,200 gross calories.
Farina, cooked 8 hr.; cream, sugar. Average daily intake: 32 gm. pro- tein, 1,900 gross calories.
Farina, cooked 20 min.; cream, sugar. Average daily intake: 30 gm. pro- tein, 1,990 gross calories.
Farina, cooked 8 hr.; cream, sugar. Average daily intake: 31 gm. pro- tein, 1,900 gross calories.
Frozen pudding (raw farina, milk, oil, sugar, salt, flavoring), oranges, sugar, tea or coffee if desired. Av- erage daily intake: 45 gm. protein, 1,950 calories.
Wheat and barley malt breakfast food, cream, sugar.
Wheat and barley malt breakfast food, milk, cream, sugar.
Whole wheat and barley malt break- fast food, milk, cream, sugar.
Whole wheat and barley malt break- fast food, cream, sugar. Average daily intake: 36 gm. protein, 2,110 gross calories.
Wheat and barley malt breakfast food, milk, cream, sugar.
fJM 92 1 .4I ... 80 80 80 80 80
78
80
80 79 80 68 66 74 69 79 75 72 75 72 68 74 71
(50) (50) (50) (50) (50)
»82 JC 70 .5
.5
.4
.4
.5 41.3
«74 »84 «74
78
»83.2
Subjects, men. For details > of experiment see remarks,
item 31 RA 80 OS 66 Av. 77
Av. 71 Subjects, 10 men. For de- tails of experiment and note on calculations see remarks, item 32. Aver- age N-balance, —0,7 gm, per day.
Details of experiment not given. Authors reported "coeflacient of utilization" of protein, 94 pet,; not in- cluded in this table since not clear if value is for true or apparent digestibility.
96.3
99.1 98.2 98.6 97.6 98.8 98.7 98.4 99.0 98.3 97.1 98.1 97.1 97.5 98.0 97.5
99.8 100.0 100.0 100.0 100.0
RJM -. ó 5 5 4 3 5 4 4 3 3 3 4 3 4 4
(2) (2) (2) (2) (2)
72 74 73 66 65 73 68 72 72 67 70 68 68 74 70
52 53 53 47 51
50 50 50 43 41 48 44 48 48 45 47 49 44 48 47
80.1 71.9 76.0 65.8 68.1 77.9 70.6 78.1 75.2 60.7 71.3 75.7 76.9 68.5 73.7
»78.8 188.4 «94.8 »98.1
90.0
76.1
69.6 67.9 72.8 70.1 71.0 68.6 69.8
68.2 50.0 59.1
71.6 73.8 71.1 72.0 72.2
'96.8 »94.5
95.6 »91.2 1 94.8 »95.6
93.9 »96.7 »94.2 »87.6
92.8 »94.5 »97.1 »91.7
94.4
»94.4 «92.2
93.3 2 89.1 2 92.6 «92.7
91.5 Î94.3 292.0 2 85.7
90.7 292.2 294.8 2 89.4
92.1
HCW ... Av. ... CM FM ... HCW .. Subjects, young men. Ex-
perimental period, 4 days. Marker, lampblack given before 1st meal and after last meal of period.
Av. ... WJH - JD MFC -. Av. JD FMC . WJH ... Av.
ATM ... Subjects, women. Experi- RJ ... mental period, 3 days. CM ... Marker, carmine for ex- RLP ... perimental period, lamp-
black for following period Av. ...
Av. ... 89.4
»87.8 »88.2 »90.3
88.8 »85.5 »75.8
80.6
»91.1 »84.4
87.8 »84.1 »88.8 »86.1 186.2
86.3
85.3 85.8 87.7 86.3 83.2 73.5 78.4
388.9 j82.8
85.8
81.3 85.8 83.2 83.4 83.4
of 3-4 days on regular diet.
.^ firneriment.«?
fABA 70 RDM 75 EO 70 Av. 72 HCS 66 EO 70 Av. 68
MFC ...
1.2 1.0 1.0 1.1 1.4 .9
1.2
54.6 44.0 45.7 48.1 42.7 33.1 37.9
35 41 32 36 32 30 31
69 76 72
36 44 46 37 40
3 4
6 8 7 4 3 3 2 3
53 60 56 56 65 56 60
68 75 72
65 58 60 60 61
27 32 25 28 41 33 37
44 53 48
37 31 33 27 32
91.3 91.8 91.5 91.5 89.5 93.3 91.4
96.1 92.5 94.3
89.2 91,7 89.9 89.2 90.0
/Subjects, young men. Ex- perimental period, 3-4 days. Marker, lampblack taken with 1st meal of and 1st meal after experimental period. Diets containing items 198 and 201 accom- panied by fermentation, with intestinal irritation and pain.
[Subjects, young men. Ex- CM .. perimental period, 4 days. Av. No preexperimental pe-
HCS 66 RDM 75 JAR 64 EO 70 Av. 69
1.5 1.1 1.3 1.4 1.3
46.6 50.3 65.2 61.0 53.3
riod. Marker, lampblack.
Subjects, yoimg men. For details of experiment see remarks, item 198.
128
» Calculated from authors' data using coefficients of digestibility for foods in remainder of diet as shown in table 13, p. 25.
» Calculated from authors' data allowing a urhiary loss of 1,25 calories per gram of digested protein as shown in table 13. p. 25. i- ^ » v
» Diet as described by Clough, Carmen, and Austin, in Jour. Nutr. 3:1-16,1930.
126
97
119
62
8 Authors gave two reasons for low digestibility: (1) low level at which protein was fed; (2) the rather liberal fruit intake.
♦Indicates that composition, and in some cases also heat of combustion, was reported by author. See table 24.
Ul

TABLE 23.—Apparent digeatihility and available energy of foods of plant origin for human subjects—Continued
Test food, description Diet Subject
and weight
DaUy intake per kilogram body weight
Proportion of total intake supplied by test food
Coefficient of apparent digesti- blUty of test food Por-
tion of gross
energy avail- able
Remarks
i s
6 Pro- tein
Gross energy
Pro- tein Fat
Oar- bohy. drate
Gross energy
Pro- tein Fat
Car- bohy- drate
Energy
tí
GRAINS. GRAIN PRODUCTS-Con.
Wheat, Whe«t Prod- nets (Triticum aetti- pum)—Continued
Wheat bran: Branny portion,* frac-
tion of 73-96 pet.M
Branny portion,» frac- tion of 82-96 pet."
Commercial bran: (a) Ground quite
fine in experi- mental mill. All but 2 pet. passed through a 109-mesh sieve.
(b)Unground, flakes.
"Prepared bran"
Wheat starch: Starch
Wheat bran fed with basal diet of fruit, canned meat and fish, po- tatoes, bread, butter, cheese, turnips.
Wheat bran with basal diet as de- scribed for item 202.
Bran bread >^ with a simple mixed diet of potatoes in limited quan- tities, fruit, butter, sugar, tea or coffee. Average daily intake: 32 gm. protein, 134 gm. fat, 266 gm. carbohydrate.
Bran bread ^ with simple mixed diet as described for item 204(a). Average daily intake: 24 gm. pro- tein, 103 gm. fat, 237 gm. carbo- hydrate.
Bran fed with basal ration of wafers (made of starch, lactose, and but- ter); milk, sugar, cream, grape juice, apples.
Frozen pudding (made of raw wheat starch, milk, oil, sugar, salt, flavoring) fed with oranges, sugar, tea or coffee if desired. Average daily intake: 22 gm. protein, 2,138 calories.
Diet as described for item 206. Av- erage daily intake: 21 gm. protein, 1,826 calories.
Kg. n
Gm. Coi. Pet. Pet. Pet. Pet. Pet. 87
100 67 67 80 60 69 69 62 63
18.0
? <") 66.8 43.2 60.1 66.7 45.0 13.4 (») (»•) 36.6 16.7 49.7 31.1 21.6 28.0
46 59
Pet. Pet. Pet. Pet.
Subjects, 4 students. For details of experiment, see remarks, item 85.
Subjects, 5 men, ages 20 to over 40 yr. Experlmental period, 3 days. Marker, charcoal, taken with 1st meal of and 1st meal fol- lowing experimental pe- riod . Subjects' reports on bran diets varied from
after eating to extreme laxative effect,.but author of article found no appar- ent relationship between these observations and digestibUity.
Subjects. 2 women. Experl- mentel period, 9 days, with preliminary period of 3 days on the experi- mental diet. Marker, car- mine. Both subjects in
[ negative N-balance.
Subjects, women. For de- ' tails of experiment, see
remarks, item 19.
Subjects, women. For de- - tails of experiment, see
remarks, item 18.
Subjects, men. See re- marks, item 3.
202 2 3 4 30 Av I 2
203 3 4 Av
DGG 81 79 81 81 83 71 80 83 80 76 74 82 77 80 74 80 76 77
22 22
] ■■
'.'.'.V.'.'.l
38.4 69.2 28.8 37.6 71.0 67.5 65.3 74.7 56.6 45.4 45.8 69.4 60.3 41.6 72.1 58.4 60.7 66.4
204 AJH 71 RLS OES DGG AJH PK
RLS Av
fDQO AJH RLS OES DGG AJH RLS
OES Av
205 F 58 M 68
PC
0.6 .5
60
?06 62 62 48 48 62 68 58 57
99.8 98.6 98.4
100.0 99.2
100.0 100.0 100.0
93.8
HLG 91 ELM JFS Av ATM 97
Wild rice (Zizania aqua- tica):
Wild rice products (whole grain; parched wUdrice).»
" CM RB
86.4 208 77.8 196

200
211
213
214
215
LEGUMES AND NUTS
Beans, dry: Common white (Phas-
eolus vtUgaris).
Common white,* navy beans.
Common white,* navy beans. Mixture of 2 samples In equal amounts.
Common white,* navy beans, skins removed.
Common white,* navy beans.
Common white, navy beans.
Kidney beans* (Phase- ciua mdgam).
Cooked or baked beans In a mixed diet.
Beans, boiled several hours with fat salt pork, replacing part of basal ration of bread, butter, bananas, sugar. Daily Intake of beans: Subject B, 376 gm.; subject H, 438 gm.; subject K, 375 gm.
Beans, boiled several hours with fat salt pork, replacing part of basal ration of bread, butter, bananas, sugar. Daily Intake of beans: Subject B, 300 gm.; subject H, 350 gm.; subject K, 300 gm.
Beans boiled 20 mln., skins removed, baked with salt and butter. Fed with bread and milk.
600 gm. beans, cooked until soft, mixed with small amount of flour, browned in fat and a little vine- gar. 1 liter beer. Daily Intake: 112 gm. protein.
Bean purée (beans soaked overnight, salted, cooked until soft, 4-6 hr. in 260** F. oven; sieved) fed with a simple dlet.w Average daily in- take: 30 gm. protein, 2,150 cal- ories.
Diet above with cystlne added in proportion of 2 pet. of weight of calculated protein.
Baked beans (soaked overnight, salted, and baked 10 hr. at 350-376* F.). Fed in simple diet.» Aver- age daily Intake: 30 gm. protein, 2,390 calories.
Baked bean diet described above with cystlne added In proportion of 2 pet. of weight of calculated protein.
Beans, boiled several hours, replac- ing part of basal ration of bread, milk, butter, bananas, sugar. HI consumed 300-375 gm.; Hr and S, 250 gm. each; and B, 375-400 gm. beans daily. Milk omitted from subject B's diet.
» Calculated from author's data using ooeflBcients of digestibility for foods In remainder of diet as shown in table 13, p. 26.
> Coefficients of digestibility estimated for "products" were considered by authors of article to be applicable to these Items.
" The wheat was milled to 73 pet. and the branny fraction obtained from the remaining portion of the grain. (Refers to original grain with 6 pet. loss from cleaning.)
56
B 67 H 62 K 69 Av. 66
B 67 H 62 K 69 Av. 66
Í1
1.4
1.3 1.6 1.2 1.3
1.7 2.0 1.6 1.8
48.2
34.8 41.2 33.7 36.6
46.7 63.6 45.6 48.6
68
81 83 81 82
66 60 56 57
19 23 19 20
11 12 10 11
64 68 64 65
37 41 37 38
63 67 63 64
38 41 37 39
2 .: 3 UP.
ÍA 36.0 38.0 37.7 37.2
36.0 38.0 37.7 37.2 42.4 39.6 40.4 40.8
42.4 39.6 40.4 40.8
92 90 92 91
92 90 91 91 92 95 93 93
91 93 92 92
81 74 74 81 77 69 71 87 77
B IC Av. .
A "' "■
B IC Av. C D E Av. ...
[C
IE [AV. .
/HI 67 Hr 66 S 60 B 74 HI 67 S 60 HI 67 B 74 UP. 66
1.8 1.5 1.4 1.6 1.9 1.5 1.6 1.6 1.6
18 12 12 13 11 8 9
26 14
68 48 48 52 51 41 44 61 50
77.9
73 78 78 76
7b 80 81
86.8 72.3 81.6 80.2
66.
68.
145 »67 '67 51
»64 »46 »51 54
81.4 85.7 72.4 79.8
96 96 96 95
99 96 97 97
96.0 96.9 96.8 96.2
»60 »69 »26 »50 »77 »72 »72 »47 69
92 93 95 96 93 95 92 95 94
Subject, 1 man. Mixed diet, 4 da3rs. Beans replaced 68.2 pet. total N in diet for next 6 days. Collections made last 4 days of bean diet.
Subjects, young men. 4 days on basal ration sup- plying 112 gm. protein and 3,000 calories per day, fol- lowed by 4-day experi- mental period in which part of basal ration was replaced by test food. Each experiment preceded by meal of bread and milk night before to give feces characteristic consistency. Lampbl^k taken before 1st meal of and after last meal of experimental pe- riod. Calculations based on customary assumption of digestibility of other foods In diet.
Subjects, 3 men.
Subject, 1 man. Experi- mental period, 3 days.
Subjects, women students. 2 series in which bean puree and baked beans, respectively, were eaten. Each series subdivided Into 2 experiments, 1 with and 1 without added cys-
^ tine. Each experiment consisted of a preliminary period of 3 days and col- lection period of 10 days (2 periods of 5 days each). Diet Inadequate to main- tain N-equilibrium for any length of time. No signifi- cant Improvement when cystlne was added.
63. 56. 66. 66. 62.
59. 73. 61. 65.
76 71 81 81 75 79 73 77 76
M Recipe consisted of 15 c. bran, 3% tsp. soda, V/i c. molasses, 3^ tsp. salt, 6 tsp. ginger, 1 c. lard, and V/i qt. hot water.
»s Negative results, the fecal protein from bran exceeding that of the bran intake. '« Diet consisted of purified butterfat, sucrose, lactose, grape juice, and lemon juice. *Indlcates that composition, and in some cases also heat of combustion, was reported by
author. See table 24.
For details of experiment see remarks, item 210.
184
137
135
184
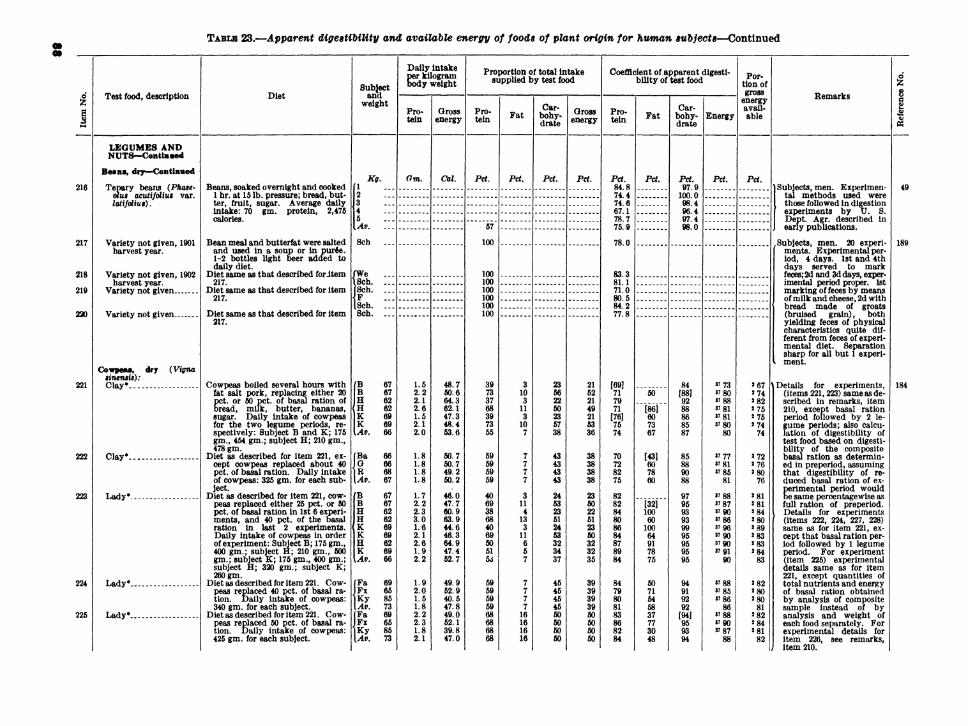
TABLB 23.—Apparent diçeatiMUty and available energy of foods of plant origin for human iuhjecta—Continued
Test food, description Diet Subject
weight
Daily intake per kilogram body weight
Proportion of total intake supplied by test food
Coefficient of apparent digesti- bility of test food Por-
tion of gross
able
Remarks
1
1 Pro- tein
Gross energy
Pro- tein Fat
Car- bohy. drate
Gross energy
Pro- tein Fat
Car- bohy- drate
Energy 1
?16
LEGUMES AND
Tepary beans (Phase- olu8 acutifoliu8 var. lalifolius).
Variety not given, 1901 harvest year.
Variety not given, 1902 harvest year.
Variety not given
Variety not given
CowpeM, dry (Vigna 9inenèi$): Clay*
Beans, soaked overnight and cooked 1 hr. at 15 lb. pressure; bread, but- ter, fruit, sugar. Average dally intake: 70 gm. protein, 2,476 calories.
Bean meal and butterfat were salted and used in a soup or in purée. 1-2 bottles light beer added to daily diet.
Diet same as that described for item 217.
Diet same as that described for item 217.
Diet same as that described for item 217.
Cowpcas boiled several hours with fat salt pork, replacing either 20 pet. or 50 pet. of basal ration of bread, milk, butter, bananas, sugar. Daily intake of cowpeas for the two legume periods, re- spectively: Subject B and K; 176 gm., 454 gm.; subject H; 210 gm., 478 gm.
Diet as described for item 221, ex- cept cowpeas replaced about 40 pet. of basal ration. Daily intake of cowpeas: 325 gm. for each sub- ject.
Diet as described for item 221, cow- peas replaced either 26 pet. or 60 pet. of basal ration in 1st 6 experi- ments, and 40 pet. of the basal ration in last 2 experiments. Daily intake of cowpeas in order of experiment: Subject B; 176 gm., 400 gm.; subject H; 210 gm., 600 gm.; subject K; 176 gm., 400 gm.; subject H; 320 gm.; subject K; 260 gm.
Diet as described for item 221. Cow- peas replaced 40 pet. of basal ra- tion. Daily intake of cowpeas: 340 gm. for each subject.
Diet as described for item 221. Cow- peas replaced 60 pet. of basal ra- tion. Daily intake of cowpeas: 426 gm. for each subject.
2 3 4 6 Av.
Sch
isch. Sch. F Sch. Sch.
B H H K K Av.
Ba G R Av.
B B H H K K H K Av.
iFa Fx Ky
te
Gm. Cal. Pet. Pet. Pet. Pet. Pet. 84.8 74.4 74.6 67.1 78.7 75.9
78.0
83.3 81.1 71.0 80.5 84.2 77.8
[69] 71 79 71
'?!' 74
70 72 82 75
82 82 84 80 86 84 87 89 84
84 79 80 81 83 86 82 84
Pet. Pet. 97.9
100.0 98.4 96.4 97.4 98.0
Pet. Pet. Subjects, men. Experimen-
tal methods used were those followed in digestion experiments by U. S. Dept. Agr. described in early publications.
Subjects, men. 20 experi- ments. Experimental per- iod, 4 days. 1st and 4th days served to mark feces; 2d and 3d days, exper- imental period proper. 1st marking of feces by means of milk and cheese, 2d with bread made of groats (bruised grain), both yielding feces of physical characteristics quite dif- ferent from feces of experi- mental diet. Separation sharp for all but 1 experi-
V ment.
Details for experiments, (items 221,223) same as de- scribed in remarks, item 210, except basal ration period followed by 2 le- gume periods; also calcu- lation of digestibility of test food based on digesti- bility of the composite basal ration as determin- ed in preperiod, assuming that digestibility of re- duced basal ration of ex- perimental period would be same percentagewise as full ration of preperiod. Details for experiments (items 222, 224, 227, 228) same as for item 221, ex- cept that basal ration per- iod followed by 1 legume period. For experiment (item 225) experimental details same as for item 221, except quantities of total nutrients and energy of basal ration obtained by analysis of composite sample instead of by analysis and weight of each food separately. For experimental details for item 226, see remarks, item 210.
49
67
100
100 100 100 100 100 100
39 73 37 68 39 73 65
59 59 59 59
40 69 38 68 40 69 60 51 56
59 59 59 59 68 68 68 68
?17 189
718
?1fl
??0
??1 67 67 62 62 69 69 66
66 66 68 67
67 67 62 62 69 69 62 69 66
69 65 85 73 69 66 86 73
1.6 2.2 2.1 2.6 L6 2.1 2.0
1.8 1.8 1.8 1.8
1.7 2.2 2.3 3.0 1.6 2.1 2.6 1.9 2.2
1.9 2.0 1.6 1.8 2.2 2.3 1.8 2.1
48.7 50.6 64.3 62.1 47.3 48.4 63.6
50.7 50.7 49.2 60.2
46.0 47.7 60.9 63.9 44.6 46.3 64.9 47.4 62.7
49.9 52.9 40.5 47.8 49.0 52.1 39.8 47.0
3 10 3
11 3
10 7
7 7 7 7
3 11 4
13 3
11 6 6 7
7 7 7 7
16 16 16 16
23 56 22 50 23 67 38
43 43 43 43
24 53 23 51 24 63 32 34 37
45 45 45 45 60 60 60 50
21 62 21 49 21 53 36
38 38 38 38
23 50 22 51 23 60 32 32 35
39 39 39 39 50 50 50 50
"50""
""[86]"" 60 73 67
[43] 60 78 60
60 100 64 91 78 75
50 71 54 58 37 77 30 48
84
88 86 85 87
85 88 90 88
97 95 93 93 99 95 95 95 95
94 91 92 92
[W] 95 93 94
»7 73 "80 "88 37 81 87 81 87 80
80
87 77 87 81 37 85
81
87 88 37 87 87 90 87 86 87 96 87 90 37 90 37 91
90
87 88 37 85 37 86
86 37 88 37 90 87 87
88
»67 »74 2 82 »75 «75 2 74
74
2 72 »76 »80
76
»81 »81 »84 »80 »89 »83 »83 »84
83
»82 »80 »80
81 »82 »84 »81
82
184
??? Clay»
7n Lady*
??4 Lady*
T?« Lady*

226 \VTiippoorwiIi*
Whippoorwill*
228 Whippoorwill*
230
231
232
233
235
236
237
239
240 241 242
Lentils, dry {Lens culi- naris):
Lentils
Lentils -
Lentils, 1901 harvest year.
Lentils Lentils, 1902 harvest
year. Peas, dry (Pisum sati-
vum): Peas
Peas*.
Peas*
Peas*
Peas, split*..
Peas, 1901 harvest year.
Peas Peas Peas, 1902 harvest year. Peas...
Basal ration as described for item 210. Cowpeas replaced part of basal ration. Daily intake of cowpeas in order of experiments: Subject B, 375 gm.; H, 475 gm.; K, 375 gm.; B, 300 gm.; H, 400 gm.; and K, 300 gm.
Basal ration as described for item 221. Cowpeas replaced 35 pet. of basal ration. Daily intake of cpwpeas: 275 gm. for each subject.
Diet, see item 221. Cowpeas re- placed 40 pet. of basal ration. Daily intake of cowpeas: 350 gm. for each subject.
250 gm. lentils, soaked overnight, cooked until tender in IJ-ifliters meat broth, with salt and 20 gm. butter added.
Lentil meal and butterfat used in a soup or porridge, salt added. 1-2 bottles light beer.
Diet, see item 231 Diet, see item 231
ISch |Sch /Sch
rwa ISch
Peas, cooked 12 hr., forming a por- ridge or thick soup; rice, sugar, milk.
Peas, cooked 2-3 hr., sieved; 1 liter beer. Daily intake: 960 gm. peas.
Diet, see item 235. Daily intake: 600 gm. peas.
Peas, cooked in distilled water, puréed. Daily intake: 137 gm. protein.
Peas, cooked in hard water, puréed. Daily intake: 137 gm. protein.
548 gm. peas and 75 gm. butter cooked into porridge; 1 liter beer. Daily intake: 129 gm. protein, 68 gm. fat, 338 gm. carbohydrate.
575 gm. peas, cooked into porridge; 1 liter beer. Daily intake: 134 gm. protein, 4 gm. fat, 354 gm. carbohydrate.
Pea meal and butterfat used in a soup or porridge, salt added; 1-2 bottles light beer.
Diet, see item 239 Diet, see item 239 .-. Diet, see item 239....... Diet, see item 239-
B H K B H K Av. B H K Av. Fa Fx Ky Av.
I Sch |F
Sch Wa Sch
/Sch \We
1.5 2.0 1.5 1.8 2.3 1.7 1.8 1.6 1.7 1.6 1.6 1.8 1.9 1.5 1.7
34.8 44.4 33.9 47.4 68.2 46.1 44.1 49.0 53.0 47.6 49.9 49.8 52 9 40.4 47.7
100 100 100 100 100 100
32
100
100
100
100 100 100 100 100 100 100
16
iOO
100
100
100
100
100
100
71 72 73 70 70
[68] 71 74 71 72 71 61
69.8
77.1 69.5
81.1 84.2 76.3 82.1
72.2
82.5
89.8
83.2
84.7
85.3 85.8
85.1
86.2 84.5
»40 »40 »57 »55 »82 »66 55 94 100
[68] 72
25
36.1
87.6
58.9
87 86 85 [89] 90 91 88
[87] 89 88 88 86 88 82 85
92.7
96.4
37 94. 6
" 96.4
95.8
"79 "83 "83
82 "79 "82 "74
78
»75 »79 3 78
77 2 74 «77 »70
74
Subject, 1 man. Feces for experimental period were easily identified by un- digested seed skins.
Study by Potthast in (//7,
Subjects, men. For experi- I mental details see re-
marks, item 217.
Subjects, 3 men. Experi- mental period, 3 days. Usual experimental proce- dure in author's labora- tory followed. All sub- jects in positive N-balance, averaging +0.6 gm. per day.
Subject, 1 man. Experi- mental period, 2 days.
I Subjects, men» Experimen- tal period, 2 days. More digestive disturbance from peas cooked in hard water.
Subject, 1 man. Experi- \ mental period, 2 days.
Fecal marker, lampblack.
Subjects, men. For experi- mental details see remarks, item 217.
184
176
117
167
146
113
» Calculated from author's data using coeflacients of digestibility for foods in remainder of diet as shown in table 13, p. 25.
2 Calculated from author's data allowing a urinary loss of 1.25 calories per gram of digested protein as shown in table 13, p. 25.
" Calculated from author's data. *Indicates that composition, and in some cases also heat of combustion, was reported by the author.
See table 24.
%

s TABLE 23.—Apparent digeatiHlittf and available energy of foods of plant origin for J^uman subjects—Continued
Test food, description Diet Subject
and weight
Daily Intake per kilogram body weight
Pro- tein
Gross energy
Proportion of total intake supplied by test food
Pro- tein Fat
Car- bohy- drate
Oross ener gy
Coefficient of apparent digesti- bility of test food
Pro- tein Fat
Car- bohy- drate
Energy
Por- tion of gross
energy avail- able
Remarks
LEGUMES AND NUTS—Continued
SoybettM, Soybean Prod- uetB, dry (Olyciw max):
Soybeans, run-of-the- miU.
245
246
247
248
249
250
Soybeans.
Soybeans, Mammoth, yellow variety.
Soybean flour, about 8 pet. fat. From press cake, expeller-type process used.
Soybean flour,* 6.6 pet. fat (reported as meal).
Soybean flour,* 3.3 pet. fat (reported as meal).
Soybean flour, 43.8 pet. protein.
Soybeans, autoclaved for 1 hr. at 15 lb. pressure; cream, starch, crack- ers, lettuce, salad dressing, orange juice, margarine, apples, dextri- maltose, sucrose, vitamin supple- ment. Protein level of intake kept at or near 5 pet. of total calorie intake. About 80 pet. of total N intake from soybeans, 10 pet. from cream, 10 pet. from remaining foods.
Soybeans boiled M hr., salt and to- matoes added to resultant mush; potatoes, fruit, milk, sugar, but- ter, cereal, coffee or tea.
Soybeans, cooked 2 hr. at 15 lb. pres- sure until soft and tender. Eaten with simple mixed diet of bread, butter, sugar, oranges, tea or cof- fee. Average daily intake: 103 gm. protein 3,100 calories.
Baking powder biscuits made of soy- been flour and patent wheat flour in equal proportions; fruit, butter, sugar. Average daily intake: 84 gm. protein, 92 gm. fat, 268 gm. carbohydrate.
Soybean meal prepared as porridge, cooked 6 hr.; milk, butter, sugar.
Yeast bread (200 gm. soybean meal, 400 gm. patent wheat flour, 10 gm. sugar); milk, butter, sugar.
Soybean flour fed with basal ration as described for item 152.
Kg. fWC 68 RC 87 JG 64 FG 61 JH 68 SK 76 KP 67 RR 62 GV 90 JY 74 UP. 72
67
/PK JCM . WO'C JFC . TOH . FAK . Av. .
AF PK JCM . AAR . PK JCM . AAR .
Gm. 0.4 .5
1.3
1.2
1.1
Cal. 38.1 43.7 46.7 52.1 47.1 47.3 53.6 41.8 35.2 47.4 45.3
42.1
Pd. 80 80 80
90
pa. Pet. Pet.
23.3
29.7
Pd. »74. 169. »74. »68. »64. »71 »70. »76. »72. »68.
71.
85.3
74.8 76.0 82.7 82.9 80.0 83.4 79.9
»88.9 »80.3 »82.6 »88.3 »91.1 »86.1 »85.9 86.2
»88.4
»88.8
70.3
Pd. Pd. Pd. Pd.
»98.9
»96.0
Subjects, young men. Ex- perimental method of Murlin et al., 1941 (Íg7), followed. Test food or egg supplied about ^i of the food N. Soybeans, soy flour, and soy milk tested in series of experiments planned so that an egg period always preceded and followed a soy prod- ucts period. Experimen- tal periods, 6 days. Marker, charcoal, taken with 1st meal of each period. N-balance of sub- jects positive in egg period, averaging +0,8 gm. per day; negative in soybean period, averaging —0.1 gm. per day. To calcu- late apparent digestibility of test food, N-intake and fecal N from the other foods were estimated from amounts in sample diet reported by authors.'
Subject, 24-yr.-old man. Ex- perimental period, 6 days, preceded by 6 days on a mixed diet. In positive N-balance, 4-1.7 gm. per day.
Subjects, men 1^24 yr. old. Experimental period, 3 days.
Subjects, 4 men, ages 20-40 yr. Experimental period, 3 days. No attempt made to maintain a uniform body weight of subjects or N-equllibrium.
Subject, 1 man, aged 38 yr. Experimental period, 3 days. Fecal marker, lamp- black.
Subjects, 4 or 6 young women. For experimental details see remarks, item 152.
34
117
72
70
29
31

251 Soybean flour.
252
254
256
Soybean prodacts, other: Soybean curd* (Tofu)
Soybean curd
Soybean curd..
Soybean curd-
Soybean milk.
Soybean milk.
Soybean milk.
Soybean flour, mixed with water and salt, autoclaved for 1 br. Eaten with simple mixed diet as described for item 244. Protein level of intake kept at or near 6 pet. of total calorie intake.
Soybean curd with a small amount soy sauce (shoyu).
Soybean curd eaten with basal diet of lotus starch, sugar, lard, turnip, carrot, cabbage, salted turnip. To basal diet was added small amount of fresh orange or pear at each meal, cod-liver oil and wheat bran once every 2 days.
246 gm. soybean curd, 150 gm. starch, 45 gm. dextri-maltose, 75 gm. lactose, 73 gm. butterfat, 230 gm. apple.
1 lb. soybean curd eaten with a basal diet of rice, tur dhal black gram, Bengal gram, vegetables, fat (a typical South Indian diet). Average daily intake: 56 gm. pro- tein in basal ration; 66 gm. pro- tein in soybean curd period; 2,880 calories both periods.
Soybean milk, cream, starch crack- ers, lettuce, salad dressing, orange Juice, margarine, apples, dextri- maltose, sucrose, vitamin supple- ment. Protein level of intake kept at or near 5 pet. of total calorie in- take.
Soybean milk. Average daily in- intake: 57.5 gm. protein.
Soybean milk, cane sugar, com- starch, calcium lactate, salt, cod- liver oil. Cabbage water added to H's diet in 2d experiment; orange juice added to diets of S, Hsu, and C in ¿U experiments.
(RC BC AF FQ JH SZ
UP.
KB MN
►MV SM KS
WC RC FQ JH SK KP RR OV JY
UP.
/LM AC SM PF HS N8 Av. /H H S S S Hsu C C C C
\Av.
86 .6 44.2 46.1 46.5 51.5 46.5 47.4 47.0
80 80 80 80 80 80 80
78 5 6 6 5 6 fi
71 62 69 63 72
57 .5 .6 .6
.5
50 50 50
40.0
55 52
50 98
15 16 16 15 16
80 80 80 80 80 80 80 80 80 80
100 100 100 100 100 100 100
100 100 100 100 100 100 100 100 100 100 100
_
68 ,5 .5 .6 .6
■i .5 .4 .6 .5
38.3 43.7 52.1 47.2 47.5 53.8 42.0 35.2 47.3 45.2
87 61 68 76 67 6? 90 74 73
4 0 6.9 3.7 5.0 3.0 2.4 4.5 4.9 3.7 2.8 2.4
151 137 121 126 127 119 118 123 120 122 126
.
4 4 5 0 5 2 5 3 5 4 5 5 5 6 5 8 5 9 5.2 1 3.8
' Calculated from authors' data using coefficients of digestibility for foods tn remainder of diet as shown in table 13, p. 25.
T Authors apparently made no correction for N of foods other than test food in total N intake «O or fecal N.
Subjects, young men. For 34 experimental details and note on calculations see remarks, item 244. Sub- jects in positive N-balance during Doth egg and soy flour periods, averaging +0.8 gm. and +0.3 gm. per day. respectively.
Subject, 1 man. Experi- 134 mental period, 1 day. Buckwheat containing black husk used as Îecsà marker.
Subjects, Chinese men, 39 26-37 3n". old. No digestive disturbances, but sub- jects in negative N-bal- ance during 6-day pre- perlod and period In which soybean curd was added. N-üitake In pre- perlod averaged +0.89 gm.,
i or 0.64 pet. protein level. Subject, young woman. 4 143
consecutive experimental periods of 3 days each. N-intake kept constant for all 4 periods. Dally N-balance for the 4 pe- riods: -0.3, -0.2, +0.4, and +0.2 gm.
/Subjects, 16-21 yr. old. Ex- perimental period, 7 days. Last 4 days served as col- lection period for feces and urine. 6-day rest period followed by 7-day basal ration period. Method of marking feces not given. Subjects In positive N-bal- ance, +3-4 gm. per day.
Subjects, young men. For 34 experimental details and note on calculations see remarks. Item 244. Sub- jects in positive N-bal-
( anee during egg period, averaging +0.8 gm., and In negative N-balance dur- ing soybean milk period, averaging —0.2 gm. per day.
'6 Chinese subjects, 1-3 3rr. 47 old. Experimento! period, 7 days. Feces and urine collected last 5 days. Method of marking not given. Subjects all in positive N-balance, aver- aging +5.6 gm. per day.
Subjects, Chinese infants. 181 Ages during period of ex- periment: H, 1J4-3 mo.; S, 4-4^i mo.; Hsu, &-10 mo.; C, 6^-8 mo. Fecal marker, carmine (Infor- mation from Tso et al., Chinese Jour. Physlol. 2: 409-414, 1928). All sub- jects in positive N-balance.
" Calculated from authors' data. ** Value higher than 100 percent; omitted here. *Indicate8 that composition, and in some cases also heat of combustion, was reported by the author.
See table 24.
«73.2 ^69.3 »76.2 »74.7 »70.5 »70.4 72.4
89.2 95.3 98.2
98 96 98
75.8
37 89.3 "99.8 (87 Í8)
(37 18)
(37 88)
»69.5 »70.9 »67.8 »65.2 »74.7 »71.5 »76.3 »68.0 »67.0 70,1
»7 92.0 »7 91.0 »7 92.4 »7 90.2 »7 91. 7 »7 90.9
91.4
79.5 76.2 80.6 81.6 76.4 79.0 81.9 83.4 83.4 81.1 80.3
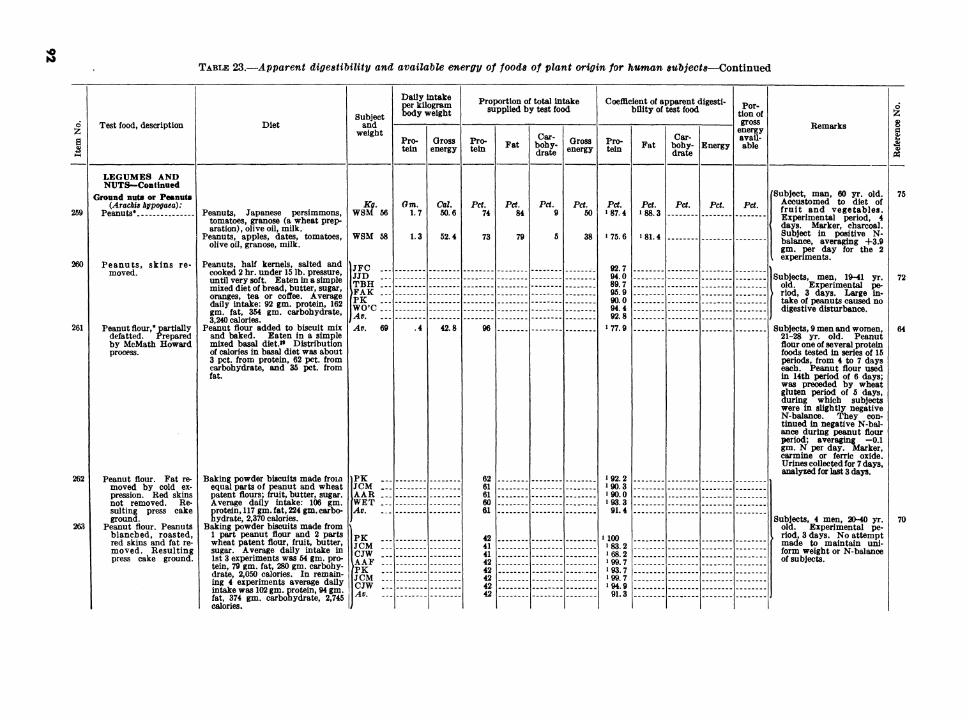
TABLE 23.—Apparent digestibility and available energy of foods of plant origin for human subjects—Continued
Test food, description Diet Subject
and weight
Daily intake per kilogram body weight
Proportion of total intake supplied by test food
Coefficient of apparent digesti- bUity of test food Por-
tion of gross
able
Remarks i i
1 Pro- tein
Gross energy
Pro- tein Fat
Car- bohy- drate
Gross energy
Pro- tehi Fat
Car- bohy- drate
Energy
2/>9
LEGUMES AND NUTS-Contlnued
Ground nuts or Peanuts (Arachis hypogaea):
Peanuts* Peanuts, Japanese persimmons, tomatoes, granóse (a wheat prep- aration), olive oil, milk.
Peanuts, apples, dates, tomatoes, olive oil, granóse, milk.
Peanuts, half kernels, salted and cooked 2 hr. under 15 lb. pressure, until very soft. Eaten in a simple mixed diet of bread, butter, sugar, oranges, tea or coffee. Average daily intake: 92 gm. protein, 162 gm. fat, 354 gm. carbohydrate, 3,240 calories.
Peanut flour added to biscuit mix and baked. Eaten in a simple mixed basal diet.»» Distribution of calories in basal diet was about 3 pet. from protein, 62 pet. from carbohydrate, and 35 pet. from fat.
Baking powder biscuits made from equal parts of peanut and wheat patent flours; fruit, butter, sugar. Average daily intake: 106 gm. protein, 117 gm. fat, 224 gm. carbo- hydrate, 2,370 calories.
Baking powder biscuits made from 1 part peanut flour and 2 parts wheat patent flour, fruit, butter, sugar. Average daily intake in 1st 3 experiments was 54 gm. pro- tein, 79 gm. fat, 280 gm. carbohy- drate, 2,050 calories. In remain- ing 4 experiments average daily intake was 102 gm. protein, 94 gm. fat, 374 gm. carbohydrate, 2,745 calories.
WSM'56
WSM 68
JFC ...
Om. 1.7
1.3
Cal. 50.6
52.4
Pet. 74
73
Pet. 84
79
Pel. 9
6
Pet. 50
38
Pet. 187.4
»75.6
92.7 94.0 89.7 95.9 90.0 94.4 92.8
177.9
192.2 190.3 190.0 193.3
91.4
1100 183.2 168.2 199.7 193.7 199.7 194.9
91.3
Pet. 188.3
181.4
Pet. Pet. Pet. Subject, man, 60 yr. old.
Accustomed to diet of fruit and vegetables. Experimental period, 4 days. Marker, charcoal. Subject in positive N- balance, averaging +3.9 gm. per day for the 2 experiments.
Subjects, men, 1^-41 yr. old. Experimental pe- riod, 3 days. Large in- take of peanuts caused no digestive disturbance.
Subjects, 9 men and women, 21-28 yr. old. Peanut flour one of several protein foods tested in series of 15 periods, from 4 to 7 days each. Peanut flour used in 14th period of 6 days; was preceded by wheat gluten period of 5 days, during which subjects were in slightly negative N-balanoe. They con- tinued in negative N-bal- ance during peanut flour period; averaging -0.1 gm. N per day. Marker, carmine or ferric oxide. Urines collected for 7 days, analyzed for last 3 days.
Subjects, 4 men, 20-40 yr. old. Experimental pe- riod, 3 days. No attempt made to maintain uni- form weight or N-balance of subjects.
76
Peanuts, skins re- moved.
Peanut flour,* partially defatted. Prepared by McMath Howard process.
Peanut flour. Fat re- moved by cold ex- pression. Red skins not removed. Re- sulting press cake ground.
Peanut flour. Peanuts blanched, roasted, red skins and fat re- moved. Resulting press cake groimd.
260 JJD ... 72 TBH FAK ... PK WO'C ... Av.
261 Av. 69
IPK ...
.4 42.8 96
62 61 61 60 61
42 41 41 42 42 42 42 42
64
?6? JCM - AAR ... WET Av
263 PK ..
70
JCM ... CJW .. AAF PK ... JCM CJW ... Av.
1

264
265
269
270
Tree Nota: Almonds* {Prunus
amygdalus).
Brazil nuts* (Perthol- letia excelsa).
Brazil nuts*.
Chestnuts,* fresh (Cas- tanea sativa):
(a) Flakes, raw
(b) Peeled, boiled..
(c) Roasted.
Chestnut flour* (Cas- tanea dentata).
Coconuts,* (Coco« nucí- fera).
Pecans,* (Carya illin<y- ensis).
Walnuts* (presumably Persian or English). (Jugions regia.)
Almonds, bananas Almonds, apples Almonds, apples, bananas. Almonds, bananas, oranges
Brazil nuts, grapes (mainly cor- nichon), small amounts of honey, milk, and olive oil.
Brazil nuts, grapes (mainly cor- nichon), granóse, small amounts of tomatoes, milk, and olive oil.
Brazil nuts, apples, bananas
500 gm. raw chestnut flakes, 68 gm. dried egg, 125 gm. butter, 188 gm. fried beef. Average daily intake: 12.1 gm. N, 124 gm. fat, 193 gm. carbohydrate.
833 gm. peeled boiled chestnuts used in thick soup. In 1st two experiments 33 gm. sugar and 33 gm. butter added. Average daily intake: 7.2 gm. N, 40 gm. fat, 353 gm. carbohydrate. In 3d experi- ment, 100 gm. sugar and 85 gm. butter added; average daily in- take: 7.3 gm. N, 83 gm. fat, 420 gm. carbohydrate.
600 gm. roasted chestnuts, 55 gm. butter, 117 gm. white bread. Average daily intake: 6.6 gm. N, 65 gm. fat, 296 gm. carbohydrate.
Chestnut flour, bread, potatoes, milk (whole and skim), sugar.
Coconut, pears, with small amounts of cottage cheese, tomatoes, and olive oil.
Pecans, apples, dates, with small amounts of granóse (a wheat prep- aration) and cottage cheese.
Pecans, apples, bananas Pecans, apples, bananas, granóse Pecans, oranges, bananas Pecans, oranges, bananas, granóse.... Walnuts, grapes, granóse Walnuts, pears, with small amounts
of granóse and milk. Walnuts, apples, dried figs, with
small amounts of granóse and mUk.
Walnuts and bananas Walnuts and apples Walnuts, apples, bananas Walnuts, dried prunes, oranges Walnuts, bananas, dates, small
amount of sugar. Walnuts, bananas, oranges, small
amount of sugar.
rCPH 63 CPH 64 CPH 64 AV 69 .Av. 65 WSM 56
.6
.7 1.1 1.3 .9 .9
WSM 56 1.2
CPH 64 .6
/ERM 62 \HAM 59
WSM 57
WSM 69
CPH 64 CPH 65 CPH 65 CPH 64 WSM 56 WSM 67
WSM 68
CPH 63 CPH 63 CPH 64 CPH 66 JER 77
JER 75
1.7
.6
.7
.6
.8 1.0 1.3
29.7 33.5 50.4 65.0 42.2 44.2
33.4
47.6 60.0
32.3 30.8 30.9 33.7 40.8 56.0
61.9
26.6 26.6 34.1 32.7 28.3
25.4
» Calculated from authors' data using coefficients of digestibility for foods in remainder of diet as shown in table 13, p. 25.
' Calculated from author's data allowing a urinary loss of 1.25 calories per gram of digested protein as shown in table 13, p. 25.
35
59
79
36
63
62
67
90
83
97
44 69 71 45 57 63
30
46
40 40
46
35
43 33 55 26 55 45
40
46 69 51 47 43
50
»57.1 172.2 178.7 161.4
67.4 183.8
168.7
»67.8 »73.0
»72.6 »70.6 179.2
173.6
151.2 »78.7
»66.0
»54.1
'"»'78."5' »83.6
»62.3
»70.3 »58.9 »70.2 »82.8 »62.6
»64.5
»84.5 »88.1 »91.9 183.4
87.0 191.4
»83.5
»91.6
»57.5 »75.6
»91.5
»91.6
»88.0 »80.9 »90.0 »81.6 »89.6 »91.4
»88.0
»84.6 »82.8 190.2 »88.3 »76.6
»73.8
198.0 »99.0
»98.8 »98.2 »99.9
»96.5
»98.1 »99.6
»89.2 »95.3
»88.2 «93.8
/Subjects (CPH and WSM) men 60 yr. old, accus- tomed to fruitarian and vegetarian diets; subject AV, young man. CPH ate 2 meals per day; the others, 3. Experimental period, 4 days. Marker, charcoal. On 3 almond diets, CPH showed aver- age daily N-balance of —0.9, +0.2, and +4.1 gm.; on brazil nut diet, —0.8 gm. AV on almond diet, -0.4 gm. WSM in posi tive N-balance, +2.4 and +3.6 gm. per day on the 2 brazil nut diets.
6 experiments: 2 on raw chestnut flakes, 2 days each; 3 on peeled boiled chestnuts, 3 days each; 1 on roasted chestnuts, 3 days. Marker, carmine. Because carbohydrate in feces was reported as re- ducing substance, the co- efficient of digestibility of carbohydrate may be somewhat in error.
Subjects, young adults, 23-34 yr. old. Experi- mental period, 3 days. During this period ERM lost 2H lb.; HAM, IH lb.
See remarks, item 264. Sub- ject WSM on coconut diet in negative N-balance, averaging -1.6 gm. per day. Both subjects on pecan diet in negative N- balance. WSM averaged -0.06 gm. per day; CPH averaged -3.3, -3.1, -1.7 and -2.4 gm. per day for the 4 experiments, respec- tively. On walnut diets, WSM in positive N-bal- ance, averaging +2.3 gm. per day; CPH in slightly negative N-balance during 1st 2 experiments, averag- ing —0.3 gm., and in posi- tive N-balance during last 2 experiments, averaging +2.5 gm. per day. JER in negative N-balance, averaging —1.9 gm. per day.
'» Basal diet included butter, sirup, biscuit mix with arrowroot starch, lettuce (iceberg heart leaves), carrot, pickle, french dressing, orangeade (artificial), applesauce, vitamin supplements (all vitamins), coffee, kola-type beverage.
•Indicates that composition, and in some cases also heat of combustion was reported by author. See table 24.
120
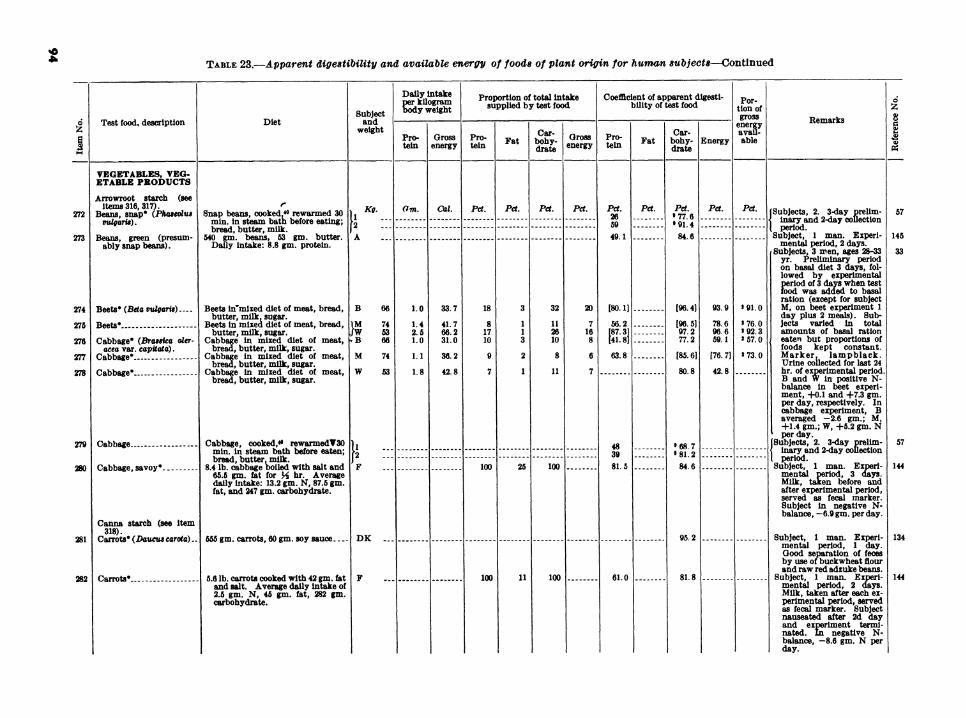
^ ^ TABLE 23.—Apparent digestibility and available energy of foods of plant origin for human subjects—Continued
Test food, description Diet Subject
and weight
Daily intake per Itílogram body weight
Pro- tein
Gross energy
Proportion of total intake supplied by test food
Pro- tein Fat
Car- bohy- drate
Oross energy
Coefficient of apparent digesti- bUity of test food
Pro- tein Fat
Car- bohy- drate
Energy
Por- tion of
energy avail- able
Remarks
272
273
274
276
276
277
278
279
280
281
VEGETABLES, VEG- ETABLE PRODUCTS
Arrowroot starch (see items 316,317).
Beans, snap* {PhoBtolu» vtUgari»).
Beans, green (presum- ably snap beans).
Beets* (Baa vulgaris).
Beets*
Cabbage* (Brtuiiea oler- ácea YU. capüata).
Cabbage*
Cabbage*..
Cabbage
Cabbage, savoy*.
Canna starch (see item 318).
Carrots* (Dauetu carota)..
Carrots*
Snap beans, oooked.<<> rewarmed 30 min. in steam bath before eating; bread, butter, milk.
540 gm. beans, 63 gm. butter. Daily intake: 8.8 gm. protein.
Beets in'mixed diet of meat, bread, butter, milk, sugar.
Beets in mixed diet of meat, bread, butter, milk, sugar.
Cabbage hi mixed diet of meat, bread, butter, milk, sugar.
Cabbage in mixed diet of meat, bread, butter, milk, sugar.
Cabbage in mixed diet of meat, bread, butter, milk, sugar.
Cabbage, cooked,«« rewarmedVSO min. in steam bath before eaten; bread, butter, milk.
8.4 lb. cabbage boiled with salt and 66.6 gm. fat for H hr. Average daily intake: 13.2 gm. N, 87.6 gm. fat, and 247 gm. carbohydrate.
656 gm. carrots, 60 gm. soy sauce...
6.6 lb. carrots cooked with 42 gm. fat and salt. Average daily hitake of 2.6 gm. N, 46 gm. fat, 282 gm. carbohydrate.
Kg. Om. Cut. Pet. Pet. Pet. Pet.
B 66
M 74 W 63 B 66
M 74
W 63
1.0
1.4 2.6 1.0
1.1
1.8
33.7
41.7 66.2 31.0
36.2
42.8
Pet. 26
49.1
[80.1]
66.2
mil 63.8
Pet. Pd. •77.6 »91.4
84.6
(96.41
[96.5] 97.2 77.2
[85.6]
80.8
Pd. Pd.
78.6 96.6 59.1
[76.7]
42.8
»91.0
«76.0 »92.3 »57.0
»73.0
DK
100 26 100
100 100
48 39 81.5
61.0
»68.7 »81.2
84.6
95.2
81.8
[Subjects, 2. 3-day prelim- < inary and 2-day collection
period. Subject, 1 man. Experi-
mental period, 2 days. Subjects, 3 men, ages 28-33
yr. Preliminary period on basal diet 3 days, fol- lowed by experimental period of 3 days when test food was added to basal ration (except for subject M, on beet experiment 1 day plus 2 meals). Sub- jects varied tn total amounts of basal ration eaten but proportions of foods kept constant. Marker, lampblack. Urine collected for last 24 hr. of experimental period B and W in positive N- balance in beet experi- ment, -f-0.1 and -f 7.3 gm. per day, respectively. In cabbage experiment, B averaged —2.6 gm.; M, +1.4 gm.;W,-1-6.2 gm.N per day.
Subjects, 2. 3-day prelim- inary and 2-day coUection period.
Subject, 1 man. Experi- mental period, 3 á^ys. Milk, taken before and after experimental period, served as fecal marker. Subject in negative N- balance, —6.9 gm. per day.
Subject, 1 man. Experi- mental period, 1 day. Qood separation of feces by use of buckwheat flour and raw red adzuke beans.
Subject, 1 man. Experi- mental period, 2 days. Milk, taken after each ex- perimental period, served as fecal marker. Subject nauseated after 2d day and experiment termi- nated. In negative N- balance, —8.6 gm. N per day.
145
33
57
144
134
144

283
284
285
287
290
291
292
Cassava starch (see item 319).
CoUards* (Bratsica oler- ácea var. acephala).
Corn, green* (Zea mays).
Mushrooms
Potatoes, white* (Sola num tuberosum).
Potatoes, white*.
Potatoes, white*..
Potatoes, white.
Potatoes, white-
Potatoes, white*.
Potatoes, white*.
Collards, cooked " rewarmed 30 min. in a steam oath before eaten; bread, butter, milk,
Com in a mixed diet of meat, bread, butter, milk, sugar.
887 gm. mushrooms combined with small amounts of Lieblg extract, curry powder, sdlt and butter.
Potatoes in mixed diet of meat, bread, butter, milk, sugar.
Potatoes in mixed diet of meat, bread, butter, milk, sugar.
Potatoes in mixed diet of meat, bread, butter, milk, sugar.
Potatoes (steamed unpeeled, fried, mashed, or in salad with a little oil), butter or pork fat, a few fruits (apples, pears), tea or black coflfee and sugar taken occasional- ly. Fat intake varied from 120- 150 gm. daily. Average daily N intake: Subject A, 6.7 gm., sub- ject B, 3.8 gm.
1,587 gm. potatoes, 8 eggs (hard- boiled), 710 cc. milk, 237 cc. cream.
Potatoes, eaten boiled with salt or butter or in salad with vinegar and oil, or sliced and fried. Aver- age daily intake of 6% lb. potatoes, peeled, supplying about 72 gm. protein and 718 gm. carbohydrate; oil and butter, about 144 gm. fat.
1,700 gm. potatoes, cooked in water and pureed; 100 gm. butterfat, 12 gm. salt, 600 cc. beer.
> Calculated from authors' data alio whig a urinary loss of 1.25 calories per gram of digested protein as shown in table 13, p. 25. *- o e, »^
»Calculated from author's data for N-free extract and crude fiber. »' Calculated from authors' data. «0 Cooked approximately 30 min., or until tender, seasoned with salt, "sterilized" in fruit jars in a
steam oven for 1 hr., and stored until needed.
1 2 W 53 2.3 66.4 24 9 29 22
A 90 .5 100
B 66 1.2 36.8 19 1 38 24
M 74 1.4 43.4 14 I 27 17
W 63 1.7 44.6 13 3 31 20
i-^ 64 62 63 61 62 63 62 62 61 62
.5
.6
.6
.6
.6
.3
.4
.4
.4
.4
100 100 100 100 100 100 100 100 100 100
A A A Av. B B B B
KAv.
- 62 1.8 46.5 33 1 89 48
E 72 1.0 100 100
74 .6 91 93
66 72 •63.3
96.6 83.9
69.2
(86. 9] »82.3
[Ô8.4]
78.6
47.4
" 69.6
99.9
[98.9]
98.0
98.9
96.2
86.6
«95.7
«93.7
»84.1
»7 63.5 "66.2 »7 66.4 66.2
»7 48.0 »7 67.4 37 59. 2 »7 75.1
62.4
71.9
67.8
93.0
92.3
»99.0
« 83.6 «81.2
80.6
Subjects, 2. 3-day prelim- inary and 2-day collection period.
See remarks, item 274
Subject, healthy man; 31 yr. old. Experimental per- iod. 2 days. Preperiod and postperlod on milk diet, used as fecal marker. Fecal separation described as very complete. See remarks, item 274. Sub- jects in positive N-balance while on potato experi- ments, averaging -fO.6 gm. per day. Subject W on experimental diet 4 days.
Subjects: A, 25-yr.-old man; B, 28-yr.-old woman. Ex- perimental diet continued for 167 days. 4 collection periods during this time, each of 4 days except the 4th for subject A, which was 6 days. Both fecal and urinary N deter- mined. N-balance posi- tive for A in all periods, averaging -f-0.6 gm. per day^ and for B in 4th col- lection period, averaging -fO.l gm. per day; nega- tive for B during 1st 3 periods, averaging —1.0 gm. N per day. Body weight remained nearly constant.
Subject, 22-yr.-old man. 3- day preliminary period on experimental diet followed by experimental period of AH days with 13 meals. Marker, charcoal, taken at beginning and end of ex- perimental period. Sub- ject in positive N-balance.
Subject, active 23-yr.-old man accustomed to a high potato diet. Experimen- tal period, 3 days. Marker, mük, taken at beginning and end of experimental period. In negative N- balance, averaging —1.0 gm. per day.
Subject, 1 man. Experi- mental period, 3 days. Marker, milk taken at beginning and end of ex- perimental period.
57
33
33
83
162
144
42
« Based on gross calories of foods and feces, as calculated from their composition by applying the factors 6.6 calories per gram protein, 9.3 calories per gram fat, and 4.1 calories per gram carbohydrate.
<» Calculated from author's data, using author^s estimated gross calories (see footnote 41) and allow- ing a urinary loss of 1.26 calories per gram of digested prot«ih as shown in table 13. p. 26.
•Indicates that composition, and in some cases also heat of combustion, was reported by the author. See table 24. *— ^
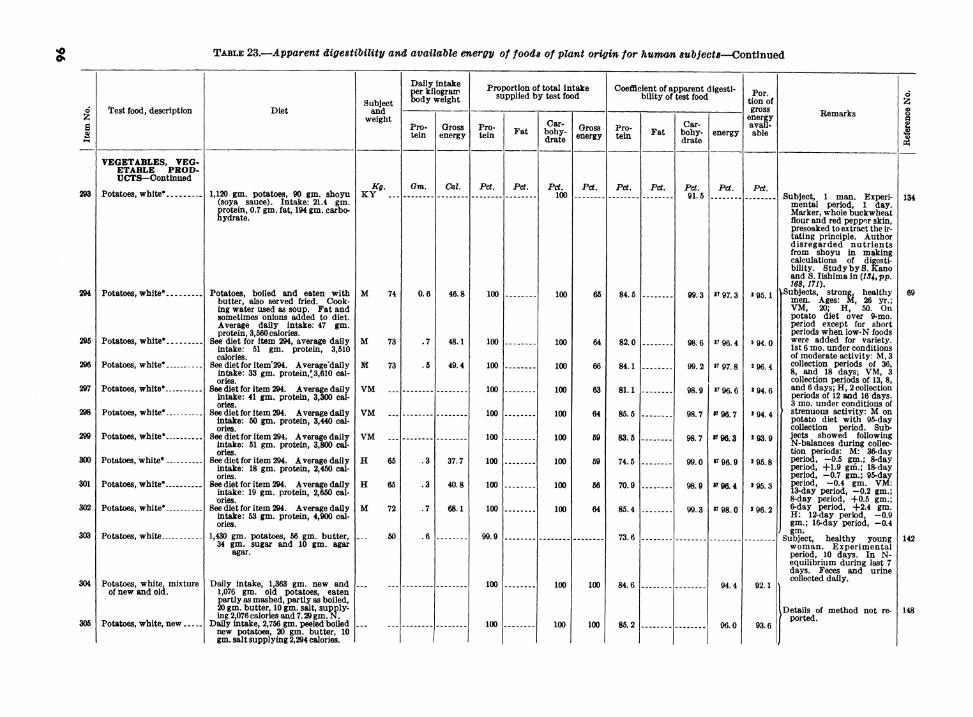
s TABLE 23.—Apparent digestibility and available energy of foods of plant origin for human subjects—Continued
Test food, description Diet Subject
and weight
Daily intake per kilogran" body weight
Proportion of total intake supplied by test food
Coefficient of apparent digesti- bUity of test food Por.
tion of gross
able
Remarks 1
1 1 Pro-
tein Gross
energy Pro- tein Fat
Car- bohy- drate
Gross energy
Pro- tein Fat
Car- bohy- drate
energy 1 293
VEGETABLES, VEG- ETABLE PROD. UCTS-Contlnued
Potatoes, white* 1,120 gm. potatoes, 90 gm. shoyu (soya sauce). Intake: 21.4 gm. protein, 0.7 gm. fat, 194 gm. carbo- hydrate.
Potatoes, boiled and eaten with butter, also served fried. Cook- ing water used as soup. Fat and sometimes onions added to diet. Average daily intake: 47 gm. protein, 3,660 calories.
See diet for item 294, average daily intake: 61 gm. protein, 3,610 calories.
See diet for item'294. Average'daily intake: 33 gm. protein,* 3,610 cal- ories.
See diet for item 294. Average daily intake: 41 gm. protein, 3,300 cal- ories.
See diet for item 294. Average daUy intake: 60 gm. protein, 3,440 cal- ories.
See diet for item 294. A verage daily intake: 61 gm. protein, 3,800 cal- ories.
See diet for item 294. Average daily intake: 18 gm. protein, 2,460 cal- ories.
See diet for item 294. Average daüy intake: 19 gm. protein, 2,660 cal- ories.
See diet for item 294. Average daüy intake: 63 gm. protein, 4,900 cal- ories.
1,430 gm. potatoes, 66 gm. butter, 34 gm. sugar and 10 gm. agar
agar.
Daily intake, 1,363 gm. new and 1,076 gm. old potatoes, eaten partly as mashed, partly as boiled, 20 gm. butter, 10 gm. salt, supply- ing 2,076 calories and 7.29 gm. N.
Daüy intake, 2,766 gm. peeled boüed new potatoes, 20 gm. butter, 10 gm. salt supplying 2,294 calories.
Kg. KY ...
Om. Cal. Pd. Pa. Pet. 100
100
100
100
100
100
100
100
100
100
Pd. Ptí. Pd. Pd. 91.6
99.3
98.6
99.2
98.9
98.7
98.7
99.0
98.9
99.3
Pd. Pd. Subject, 1 man. Experi-
mental period, 1 day. Marker, whole buckwheat flour and red peppor skin, presoaked to extract the ir- tating principle. Author disregarded nutrients from shoyu in making calculations of digesti- bility. Study by S.Kano and S. lishima In (ISi, pp. 168,171).
Subjects, strong, healthy men. Ages: M, 26 yr.; VM, 20; H, 50. On potato diet over 9-mo. period except for short periods when low-N foods were added for variety. 1st 6 mo. under conditions of moderate activity: M, 3 collection periods of 36, 8, and 18 days; VM, 3 coUection periods of 13, 8, and 6 days; H, 2 collection periods of 12 and 16 days. 3 mo. under conditions of strenuous activity: M on potato diet with 95-day coUection period. Sub- jects showed following N-balances during collec- tion periods: M: 36-day period, -0.5 gm.; 8-day period, -1-1.9 gm.; 18-day period, -0.7 gm.; 96-day period, -0.4 gm. VM: 13-day period, -0.2 gm.; 8-day period, +0.6 gm.; 6-day period, 4-2.4 gm. H: 12-day period, -0.9 gm.; 16-day period, -0.4 gm.
Subject, healthy young woman. Experimental period, 10 days. In N- equüibrium during last 7 days. Feces and urine collected daüy.
Details of method not re- ported.
134
69 794 Potatoes, white* M 74
M 73
TA 73
VM
0.6
.7
.6
46.8
48.1
49.4
100
100
100
100
100
100
100
100
100
99.9
100
100
65
64
66
63
64
69
69
66
64
84.5
82.0
84.1
81.1
86.6
83.6
74.6
70.9
85.4
73.6
84.6
86.2
»^97.3
»Í 96.4
»7 97.8
"96.6
»'96.7
«96.3
" 96.9
"96.4
"98.0
»95.1
»94.0
»96.4
»94.6
»94.4
»93.9
»96.8
»95.3
»96.2
296 Potatoes, white*
?96 Potatoes, white* . -
297 Potatoes, white*.
?9ft Potatoes, white* VM
299 Potatoes, white*- VM
300 Potatoes, white* —- H 66
H 66
M 72
60
.3
.3
.7
.6
37.7
40.8
68.1
301 Potatoes, white* ...
302 Potatoes, white*
303 Potatoes, white. 142
304 Potatoes, white, mixture of new and old.
Potatoes, white, new
100
100
100
100
94.4
96.0
92.1
93.6 306 148
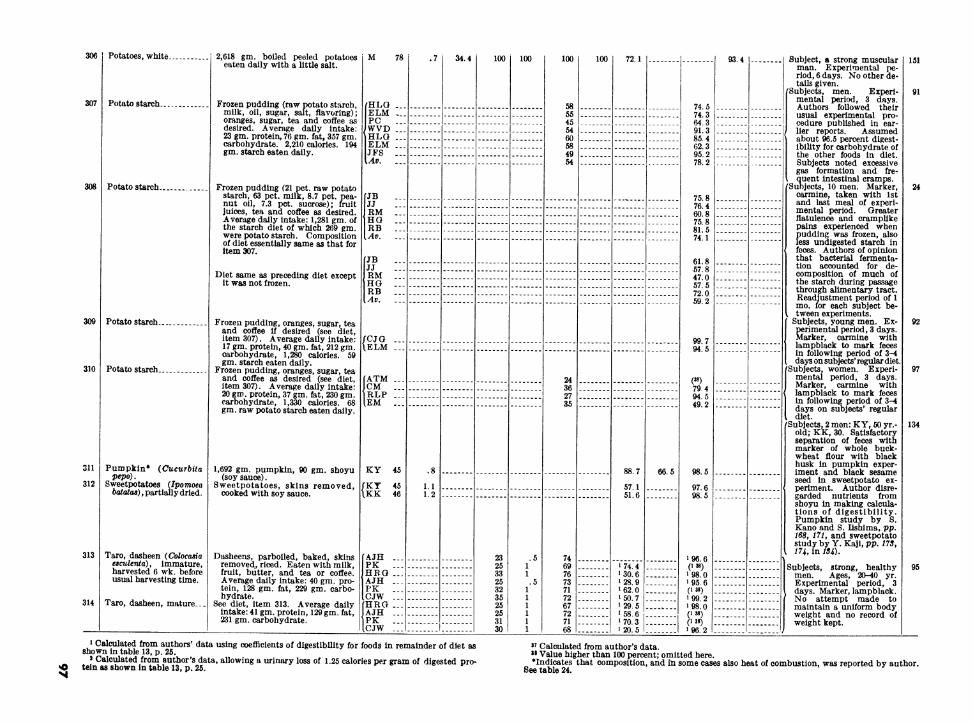
306 Potatoes, white --
Potato starch-.
308 Potato starch-.
309
311
312
313
314
Potato starch-.
Potato starch..
Pumpkin* (Cucúrbita pepo).
Sweetpotatoes (Ipomoea batatas), partially dried.
Taro, dasheen (Colocasia esculenta), immature, harvested 6 wk. before usual harvesting time.
Taro, dasheen, mature.
2,618 gm. boiled peeled potatoes eaten daily with a little salt.
Frozen pudding (raw potato starch, milk, oil, sugar, salt, flavoring); oranges, sugar, tea and coffee as desired. Average daily intake: 23 gm. protein, 76 gm. fat, 357 gm. carbohydrate. 2,210 calories. 194 gm. starch eaten daily.
Frozen pudding (21 pet. raw potato starch, 63 pet. milk, 8.7 pet. pea- nut oil, 7.3 pet. sucrose); fruit juices, tea and coffee as desired. Average daily intake: 1,281 gm. of the starch diet of which 269 gm. were potato starch. Composition of diet essentially same as that for item 307.
Diet same as preceding diet except it was not frozen.
Frozen pudding, oranges, sugar, tea and coffee if desired (see diet, item 307). Average daily intake: 17 gm. protein, 40 gm. fat, 212 gm. carbohydrate, 1,280 calories. 69 gm. starch eaten daily.
Frozen pudding, oranges, sugar, tea and coffee as desired (see diet, item 307). Average daily intake: 20 gm. protein, 37 gm. fat, 230 gm. carbohydrate, 1,330 calories. 68 gm. raw potato starch eaten daily.
1,692 gm. pumpkin, 90 gm. shoyu (soy sauce).
Sweetpotatoes, skins removed, cooked with soy sauce.
Dasheens, parboiled, baked, skins removed, riced. Eaten with milk, fruit, butter, and tea or coffee. Average daily intake: 40 gm. pro- tein, 128 gm. fat, 229 gm. carbo- hydrate.
See diet, item 313. Average daily intake: 41 gm. protein, 129 gm. fat, 231 gm. carbohydrate.
rHLG ELM PC WVD HLQ ELM JFS
UP.
JB JJ RM HQ RB Av.
.7
JB JJ RM HQ RB Av.
rcjo lELM
ÍATM JCM IRLP IEM
KY 45
KY 45 KK 46
AJH PK HRG AJH PK CJW HRG AJH PK CJW
1.1 1.2
34.4 100 100 100
24
57.1 51.6
»74.4 130.6 •28.9 '62.0 150.7 129.5 158.6 170.3 ' 20.5
74.3 64.3 91.3 85.4 62.3 95.2 78.2
75.8 76.4 60.8 75.8 81.5 74.1
61.8 57.8 47.0 57.5 72.0 59.2
99.7 94.5
(38)
79.4 94.5 49.2
93.4
98.5
97.6 98.5
196.6 (188)
198.0 195.6 (138)
199.2 198.0 (188) (138) 196.2
N
» Calculated from authors' data using coefficients of digestibility for foods in remainder of diet as shown in table 13, p. 25.
* Calculated from author's data, allowing a urinary loss of 1.25 calories per gram of digested pro- tein as shown in table 13, p. 26.
Subject, a strong muscular man. Experimental pe- riod, 6 days. No other de- tails given.
'Subjects, men. Experi- mental period, 3 days. Authors followed their usual experimental pro- cedure published in ear- lier reports. Assumed about 96.5 percent digest- ibility for carbohydrate of the other foods in diet. Subjects noted excessive gas formation and fre-
. quent Intestinal cramps. 'Subjects, 10 men. Marker,
carmine, taken with 1st and last meal of experi- mental i)eriod. Greater flatulence and cramplike pains experienced when pudding was frozen, also less undigested starch in feces. Authors of opinion that bacterial fermenta- tion accounted for de- composition of much of the starch during passage through alimentary tract. Readjustment period of 1 mo. for each subject be-
, tween experiments. Subjects, young men. Ex- perimental period, 3 days. Marker, carmine with lampblack to mark feces in following period of 3-4 days on subjects' regular diet.
Subjects, women. Experi- mental period, 3 days. Marker, carmine with lampblack to mark feces in following period of 3-4 days on subjects' regular diet.
Subjects, 2 men: KY, 60 yr.- old; KK, 30. Satisfactory separation of feces with marker of whole buck- wheat flour with black husk in pumpkin exper- iment and black sesame seed in sweetpotato ex- periment. Author disre- garded nutrients from shoyu in making calcula- tions of digestibility. Pumpkin study by S. Kano and S. lishima, pp. 168, 171, and sweetpotato study by Y. Kajl, pp. Í7S, 174, in m).
Subjects, strong, healthy men. Ages, 20-40 yr. Experimental period, 3 days. Marker, lampblack. No attempt made to maintain a uniform body weight and no record of weight kept.
92
*' Calculated from author's data. " Value higher than 100 percent; omitted here. •Indicates that composition, and iü some cases also heat of combustion, was reported by author.
See table 24.

00 TABLE 23.—Apparent digestibility and available energy of foods of plant origin for human subjects—Continued
315
Test food, description Diet Subject
and weight
Daily intake per kilogram body weight
Pro- tein
Gross energy
Proportion of total intake supplied by test food
Pro- tein Fat
Car- bohy- drate
Qross energy
Coefficient of apparent digesti- bility of test food
Pro- tein Fat
Car- bohy- drate
energy
Per. tion of
enerey avail- able
Remarks
318
319
320
321
322
323
324
VEGETABLES, VEG- ETABLE PROD- UCTS—Continued
Taro starch, granules ex- tremely small, 1-7 mi- crons.
Vegetable starch, other: Arrowroot, true {Mar-
anta arundinacea). Granules measured 22-53 microns.
Arrowroot, so-called commercial {Zamia floridana). Granules, 42-70 microns.
Canna, Hawaiian (Canna edulis). Granules 42-95 mi- crons.
Cassava (Manihot escu- lenta) commercial product. Granules much smaller than those of potato and arrowroot and some- what smaller than wheat or maize starch.
Treefern, Hawaiian (Cibotium menziesit). Granules about 9 mi- crons.
FRUITS
Applesauce (Malus sylves- tris).
Bananas,*common (Musa paradisiaca var. sapi- entum).
Grapes* (Vitisspp.), mix- ture of Tokay, Muscat, and Cornichon.
MISCELLANEOUS
Cocoa (Theobroma cacao) : Commercial -
Frozen pudding, oranges, sugar, tea and coffee as desired. (See diet, item 307.) Average intake: 19 gm. protein, 47 gm. fat, 271 gm. carbohydrate, 1,680 calories.
See diet, Item 307. Average daily intake: 17 gm. protein, 66 gm. fat, 265 gm. carbohydrate, 1,640 cal- ories. 124 gm. raw arrowroot starch eaten daily.
See diet, item 307. Average dally intake: 19 gm. protein, 68 gm. fat, 297 gm. carbohydrate, 1,790 cal- ories. 68 gm. raw arrowroot starch eaten daily.
See diet, item 307. Average daily intake: 22 gm. protein, 80 gm. fat, 248 gm. carbohydrate, 1,800 cal- ories. 109 gm. raw canna starch eaten daily.
See diet, item 307. Average daily intake: 18 gm. protein, 48 gm. fat, 246 gm. carbohydrate, 1,490 cal- ories. 140 gm. raw cassava starch eaten daily.
See diet, item 307. Average daily intake: 23 gm. protein, 71 gm. fat, 314 gm. carbohydrate, 1,990 cal- ories. 160 gm. raw treefern starch eaten daily.
Applesauce (sugar added) with a mixed diet of meat, bread, butter, milk, sugar.
Bananas.
Grapes (4,835 gm. Tokay, 649 gm. Muscat, 4,306 gm. Cornichon) eaten with small amounts of olive oil, tomatoes, and olives.
115 gm. cocoa, 60 gm. sugar, 176 gm. white bread, 200 gm. meat, 20 gm. butter. Dally Intake: 14 gm. N, 54 gm. fat, 211 gm. carbohydrate.
Kg. HJD HLG
HJD ELM
HLG ELM JFS
HJD HLG ELM
PHC HLG JFS
HLG ELM
Cal. Pet. Pet. Pet. Pd. Pet. Pet.
63
CPH 62
WSM 66
HC
0.9 1.8
42.6 63.4
20.6
21.9
100
94
25
100
16
70
100
99
100
84
[29.0] 28.4
76.1
44.5
27.9
18.9
Pet. 98.1 99.5
92.1 99.3
82.5 65.7 99.3
43.0 56.5 60.3
97.9 98.4
100.0
90.2 96.5
99.2 99.6
»96.8
»94.4
Pet. Pet.
97.6
92.3
185.0
«89.8
»84.3
95.4
Subjects, young men. For experimental details see remarks, item 309. Auth- ors noted a direct rela- tionship between size of starch granules and di- gestibility, the starches having larger granules be- ing less digestible.
For experimental details see remarks, item 274. B in slightly negative N-bal- ance, —0.01 gm., and W in positive N-balance, +0.7
. gm. per day. Experimental period for
CPH, 3 days; for WSM, 4 days. For other experi- mental details see remarks, item 264. Both subjects In negative N-balance. Average for CPH, -1.3 gm.;forWSM,-3.7gm.N per day.
Subject, the author. Ex- perimental period, 4 days. Average N-balanoe, -1.7 gm. per day.
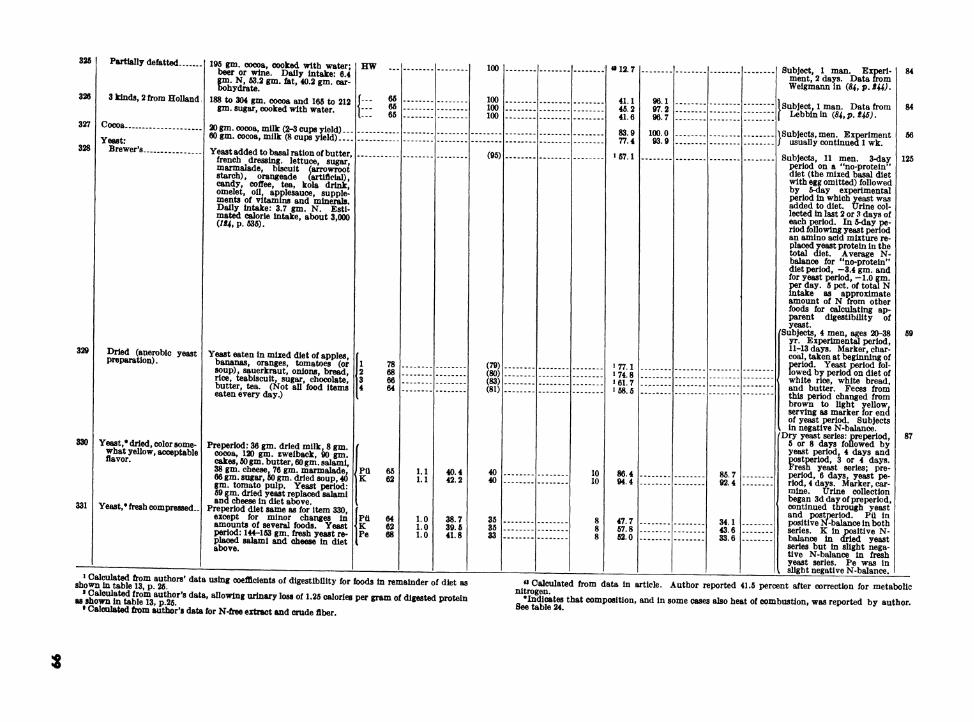
325
326
327
Partially defatted-.
3 kinds, 2 from Holland
Cocoa
Yeast: Brewer's..
329
330
331
Dried (aneroblc yeast preparation).
Yeast,» dried, color some- what yellow, acceptable flavor.
Yeast,* fresh compressed..
196 gm. cocoa, cooked with water; beer or wine. Dally intake: 6.4 gm. N, ¿3.2 gm. íát, 40.2 gm. car- bohydrate.
188 to 304 gm. cocoa and 166 to 212 gm. sugar, cooked with water.
20 gm. cocoa, milk (2-3 cups yield) 60 gm. cocoa, milk (8 cups yield)...
Yeast added to basal ration of butter, irench dressing, lettuce, sugar, marmalade, biscuit (arrowroot starch), orangeade (artificial), candy, coffee, tea, kola drink, omelet, oil. applesauce, supple- ments of vitamins and mlnei^. Dally Intake: 3.7 gm. N. Esti- mated calorie Intake, about 3.000
Yeast eaten in mixed diet of apples, bananas, oranges, tomatoes (or soup), sauerkraut, onions, bread, rice, teabiscuit, sugar, chocolate, butter, tea. (Not all food items eaten every day.)
Preperiod: 36 gm. dried milk, 8 gm. cocoa, 120 gm. zweiback, 90 gm. cakes, 60 gm. butter, 60 gm. salami, 38 gm. cheese, 76 gm. marm^ade, 66 gm. sugar, 60 gm. dried soup, 40 gm. tomato pulp. Yeast period: 69 gm. dried yeast replaced salami and cheese in diet above.
Preperiod diet same as for item 330, except for minor changes in amounts of several foods. Yeast period: 144-163 gm. firesh yeast re- placed salami and cheese In diet above.
HW
1 78 2 68 3 66 4 64
PÜ K
PÜ K Pe
100
100 100 100
(95)
1.1 1.1
1.0 1.0 1.0
40.4 42.2
38.7 39.5 41.8
(79) (80) (83) (81)
sho^^totobîeîn ^af.*"*^"' ^*** ^^^ coefficients of digestibUlty for foods in remainder of diet as
as ÄSi^^l^Älfwfp^o!'^'* ^^^* allowing urinary loss of 1.26 calories per gram of digested protein • Calculated from author's data for N-free extract and crude fiber.
«12.7
41.1 46.2 41.6
83.9 77.4
»67.1
J77.1 »74.8 »61.7 »68.6
86.4 94.4
47.7 67.8 62.0
96.1 97.2 96.7
100.0 93.9
86.7 92.4
34.1 43.6 33.6
Subject, 1 man. Experi- ment, 2 days. Data from Weigmann in (84, p. BW-
[Subject, 1 man. Data from ( Lebbinin (84,p,t46).
1 Subjects, men. Experiment / usually continued 1 wk.
Subjects, 11 men. 3-day period on a "no-protein" diet (the mixed basal diet with egg omitted) followed by 6-day experimental period in which yeast was added to diet. Urine col- lected in last 2 or 3 days of each period. In 6-day pe- riod following yeast period an amino acid mixture re- placed yeast protein in the total diet. Average N- balance for "no-protein" diet period, —3.4 gm. and for yeast period, -1.0 gm. per day. 6 pet. of total N intake as approximate amount of N from other foods for calculating ap- parent digestibility of yeast.
Subjects, 4 men, ages 20-38 3rr. Experimental period, 11-13 days. Marker, char- coal, taken at beginning of period. Yeast period fol- lowed by period on diet of white rice, white bread, and butter. Feces from this period changed from brown to light yellow, serving as marker for end of yeast period. Subjects in negative N-balance.
Dry yeast series: preperiod, 6 or 8 days followed by yeast period, 4 days and ppstperiod, 3 or 4 dajrs. Fresh yeast series; pre- period, 6 days, yeast pe- riod, 4 days. Marker, car- mine. Urine collection began 3d day of preperiod, continued through yeast and postperlod. Pu in positive N-balance In both series. K in positive N- balance in dried yeast series but in slight nega- tive N-balance in fresh yeast series. Pe was In slight negative N-balance.
84
84
66
87
"Calculated from data in article. Author reported 41.6 percent after correction for metabolic nitrogen.
•Indicate that composition, and in some cases also heat of combustion, was reported by author, see table 24.
IS

Composition and Heat of Combustion of Foods
Composition and heat of combustion data are recorded in table 24 for test foods used in digestion experiments described in table 23 whenever such data were reported. Composition data are useful in identification of a food item and in interpretation of experimental results in digestion experiments in which that item is used.
For ease in using the data the test foods with composition reported carry the same item number in both tables 23 and 24. The composition data are recorded as reported by the authors and the factors they used for converting nitrogen to protein are noted in footnotes. More complete description of the food items is given in table 23.
TABLE 24.—Composition and heat oj combustion of food items used in experiments on human digestibility {table 28)
Test food, description
GRAINS, GRAIN PRODUCTS Barley Products (Hordeum vulgäre) :
1 Barley, flaked 2 Barley, germinated, flaked
Buckwheat Products (Fagopyrum escu^ lentum) : 5 Flour
Corn, Corn Products (Zea mays): 8 Hominy 9 (Hominy) hulled using alkali,
steamea
11 Meal 14 Meal, granulated:
a b
15 Meal, waxy variety of maize im- ported from China
16 Meal, white 20 Corn endosperm, toasted, added
sugar and salt Oats, Oat Products (Avena sativa) :
25 Rolled oats 27 Rolled oats 28 Rolled oats 32 Rolled oats, quick-cooking 33 Meal, granulated or pinhead 34 Meal 35 Meal, rolled 36 Meal 38 Meal:
a. Coarsely ground pinhead. __ b. Medium ground
Average Rice, Rice Products (Oryza sativa) :
49 Polished or white 50 Undescribed
Rye, Rye Products (Sécale céréale) : 54 Flour No. 18 55 Flour III, a comercial flour 56 Flour No. 17 57 Flour No. 4 58 Flour No. 16 59 Flour No. 15 60 Flour II 1 N X 5.7. 2 N X 6.25. » N X 5.83.
Water
Percent 9.79
10. 18
11.34
10.96
0 0 0 9.52
11.79 7.77
10.54 9.88
7.49
8.66 11.02 7.90 7.36 7.51 7.35 7.45 8. 12
15. 15. 15.
(12.92) 13.50
9.25 11.40 10.96 9.30
10.06 11.00 11.26
Protein
Percent 18.87
1 10. 62
>8. 13
*9. 44
«9. 96 »8. 92
a 10. 05 Í 6.87
*8. 50 ♦8.69
*8. 88 ♦10. 63
«7.38
2 14. 69 2 15. 69 ' 15. 10 2 16. 13 1 12. 43 1 13. 17 1 12. 21 1 13. 25
> 11. 70 »8.60 10. 10
*8. 55 *8. 27
*15. 48 ♦14. 92 ♦15. 78 ♦15. 67 ♦16. 14 ♦15. 38 ♦15. 33
Fat
Percent 1.24 1.21
1.22
.67
5.30 5.00 5.65 .65
.98 1.92
4.24 6. 17
1.68
6.96 7.23
6. 14 6.31 7.53 7.27 7.28
7.21 7.78 7.50
.31
.3
2.01 1.89 1.89 1.78 1.76 1.71 1.89
Carbohydrate
Total (by difference)
Percent 79.22 76.89
77.69
78.61
76.77 77.96 76.67 82.67
78. 25 81. 12
75.04 71.52
80.38
67.89 64.23
68.53 72.23 70.23 71.37 69.57
64.47 67. 15 65. 86
77.89 77.26
71.08 69.82 69.47 71.38 70.30 70.22 69.84
Fiber
Percent 0.77 1.27
.37
1.51 .69 .78 .46
.46
.40
1.67 1.83
.90 1.94 1.04 1. 15 1. 12
.85
.93
.89
Ash
Percent 0.88 1. 10
1.62
.32
7.97 a 12 7.63 .29
.48
.50
1.3 1.80
3.07
1.80 1.83
1.84 1.52 1.72 1.70 1.78
1.62 1.47 1. 54
.33
.67
2. 18 1.97 1.90 1.87 1.74 1.69 1.68
Heat of combus- tion per
gram
Calories
3.986
4.440 4. 164 4.625
3.823 4.023
3.869
4.560
3.854
Ref. No.
62 62
134
120
121
62
120
07 97
126
164 126 88 129 62 62 62 62
102
167 144
141 141 141 141 141 141 141
* N X 5.95. ♦N-conversion factor not reported.
100

TABLE 24.—Composition and heat of combustion oj jood item^ used in experiments on human digestibility (table ;?S)—Continued
Test food, description Water Protein Fat
Carbohydrate
Total (by diflerenoe) Fiber
Heat of . . combus-
^^'^ tion per gram
Ref. No.
GRAINS, GRAIN PRODUCTS—Con.
Rye, Rye Products (Sécale céréale)—Con. 61 Flour, whole grain, most external
layer removed (Whole-grain Swiss rye before pro-
cessing)« Flour, flours No. 6 and No. 18
blended in equal amounts Flour, ñnely ground flour com-
monly used in Wurzburg Flour, flours 0 and III blended in
equal amounts Flour, made by Steinmetz process from rye of Silesia (Whole-grain rye of Silesia before
processing)^. Flour, made by "old process" of
milling from Swiss rye Flour No. 13 Flour No. 12 Flour, 75 percent yield Flour I Flour No. 10 Flour No. 2 Flour No. 7 Flour No. 6 Flour, 62 percent yield Flour 0 Flour No. 1 Branny portion, fraction of 67-85
percent * Branny portion, fraction of 67-95
percent * Branny portion, fraction of 85-95
percent ^ Wheat, Wheat Products {Triticum aesti-
vum) : Flours, whole grain and nearly whole
grain: 92 Graham, 100-percent extraction,
Scotch Fife, hard spring (Whole grain before processing)» Graham, 100-percent extraction,
Scotch Fife (Whole grain before processing) »^ Graham, 100-percent extraction Graham, milled from Oregon white
winter wheat (Whole grain before processing)" Graham, milled from hard winter
Weissenburg wheat from Okla- homa
(Whole grain before processing) ^^ Graham, milled from Michigan soft
winter wheat (Whole grain before processing)*' Graham
64
65
66
71
72
73 74 75 77 78 79 80 81 82 83 84 85
86
87
93
94 96
97
98
Percent 13.0
(13.0)
9. 16
11.6
11.32
(13.0)
13.0
(13.0) 11. 19 11.56 14.73 11.84 11.76 12. 14 11.87 9.07
(13.0) 11.25 12.49
14.8
14.8
14.2
8.61 8.50
13.21 10.41 10.51
8. 15 8.99
7.73 8.65
11.23 10.25 11.82
Percent » (a 40)
» (a 28)
*12. 42
»9.33
*10. 76
» (9. 62)
« (9.21)
'(7.11) *11. 85 ♦11.42 »9.79 ♦10. 22 ♦10. 81 ♦9. 8Ö ♦9.31 ♦9.35
» (a 69) ♦6.59 ♦5.36
♦20.2
♦ia5
♦16.2
12. 65 12. 65
• 14. 21 I 15. 50 ' 14.00
la 18 ia32
Í 15. 33 » 15. 3a
1 12. 24 » 12. 34 ♦10. 63 102
1 N X 5.7. » N X 6.25. » N X 5.83. • Reported as celhilose. • Items Ño. 61 and 72 were prepared from this sample. 7 Items No. 71 and 82 were prepared from this sample. 8 The rye was milled to 67 percent and the branny frac-
tion ob tamed from the remaining portion. Refers to original grain with 5 percent loss from cleaning.
• Items No. 92, 112, 135, 146, and 147 were prepared
Perunt
1.30
1.38
1. 14 1.69
1.00 .97 .73 .78 .59
.88
.59
3.3
3.4
3.6
2.44 2.36
2.01 2.28 2.52
1.68 1.83
1.79 1.83
1.41 1.35 1.71
Percent
75.72
75.34
74.78 74.37
76.13 75.69 76.60 77.42 80.37
80.85 81.17
5a 9
59.6
61.1
74.58 74.69
6a 56 69.88 70.97
80.27 79. 10
73.83 72.87
73.27 74.23 74. 12
Percera « (2. 03)
» (1.65)
Ml. 57)
» (2.71)
' (. 66)
(.67)
2.9
4.6
7.5
2.25
Percent 1.52
(1.61)
1.40
1.24
1.20
(1. 18)
(1.84)
(1. 10) 1.04 .96 .86 .81 .77 .73 .62 .62
(.55) .43 .39
2.8
a 7 4.9
1.72 1.80
2.01 1.93 2.00
1.72 1.76
1.32 1.32
1.85 1.83 1.72
Calories
4. 148 4. 140
a 971 4.023 4.004
a 990 4.008
4. 178 4. 110
a 906 4.000
from this sample. Also from this wheat were prepared items No. 94, 114, and 137 appearing in another report.
w Items No. 93, 113, and 13Q were prepared from this sample.
** Items No. 96 and 115 were prepared from this sample. w Items No. 97, 116, 139, 173 and 174 were prepared
from this sample. 1» Items No. 98, 118, and 141 were prepared from this
sample. *N-conversion factor not reported.
101

TABLE 24.—Composition and heat of combustion of food items used in experiments on human digestibility (table j?S)—Continued
Test food, description Water Protein Fat
Carbohydrate
Total (by difference) Fiber
Ash Heat of combus- tion per
gram Ref. No.
GRAINS, GRAIN PRODUCTS—Con.
Wheat, Wheat Products (Triticum aesH- vum)—Continued Flours, whole grain and nearly whole
grain—Continued 106 Whole meal, milled from Canadian
wheat 107 Whole meal, milled from English
wheat 108 Whole mVaLlIIlI^IIIIIIIII"" 109 100 percent of wheat kernel
Flours, intermediate extractions: 112 "Entire wheaV' 113 "Entire wheat" 114 "Entire wheat" milled from hard
spring wheat, Scotch Fife 115 "Entire wheat" milled from Oregon
white winter wheat 116 "Entire wheat" milled from hard
winter Weissenburg wheat from Oklahoma
117 * 'Entire wheat" milled from Indiana soft winter wheat (Whole grain before processing).. ^
118 "Entire wheat" milled from Michi- gan soft winter wheat
123 OOnpercent extraction, milled from English wheat
124 90-percent extraction, milled from Manitoba wheat
131 80-percent extraction, milled from English wheat
132 80-percent extraction, milled from Manitoba wheat
Flours, lower extractions: 135 Standard patent, milled from hard
spring wheat, Scotch Fife 136 Straight patent, milled from hard
spring wheat, Scotch Fife 137 Straight patent, milled from hard
spring wheat, Scotch Fife 138 Standard patent, about 70 percent
yield, milled from Oregon white winter wheat
139 Standard patent, about 70 percent yield, milled from hard winter Weissenburg wheat from Okla- homa
140 Standard patent, milled from Indi- ana soft winter wheat
141 Standard patent, contained less than 72 percent wheat kernel milled from Michigan soft winter wheat
145 70 percent of wheat kernel, milled from a mixture of Girka and Minnesota wheats
146
147 148
Ist patent, milled from hard spring wheat, Scotch Fife
2d patent. Patent, milled from hard spring
wheat, Scotch Fife » N X 5.7. » N X 6.25. » N X 5.83. " Available carbohydrate 55.20 percent;
matter (pentosans, etc.) 9.78 percent.
Percent 15.
15. 13.50 14.38
10 81 13.51
10 99
8.66
7.46
9.60 8.09
11.01
15.
15.
15.
15.
10.54
12.38
11.55
8.94
9.93
10.30
10.97
15.02
10 55 10.49
12.36
Percent » 15. 40
»8.52 » 11. 66 » 10 92
1 12. 26 » 13. 72
» 13.00
»7.52
1 15. 16
1 12. 80 1 13. 16
» 12. 01
»8. 32
» 13. 51
»8.15
1 13. 05
Í 11. 99
1 13. 60
« 12. 75
16.90
» 13. 74
1 12. 30
1 10 92
» 11. 57
1 11.08 » 11. 14
♦12. 44
Percent 2.23
1.83 1.82 1.81
2.24 1.69
2.28
1.67
1.64
1.54 1.52
1.53
1.61
1.30
1.43
1.25
.92
.93
.50
.81
1. 15 1.20
1.62
Percent m (15)
71.49 71.. 69
73.67 70 10
72.51
81.08
74.52
74.40 75.38
74.17
75.36
72.04
73.67
82.47
74.89
75.94
77.15
72. 19
76.85 76.75
73.07
Percent 2.36
2.02
1.15
1.15
.17
.24
Percent
1.53 1.20
1.02 .98
1.22
1.07
1.22
1.66 1.85
1.28
0 60
.68
.60
.44
.52
.53
.46
.41
.37
.42
.51
Calories
4.032 3.877
3.944
3.900
4.159
4.020 4.090
3. 860
4.050
3.861
3.889
3.880
4.040
4.010
3.799
4.032 4.006
104
104 28
146
164 166
195
168
168
166
166
106
106
106
106
164
166
195
168
168
166
166
146
164 164
170 " Available carbohydrate 63.60 percent; undetermined
matter (pentosans, etc.) 9.02 percent. " Items No. 117 and 140 were prepared from this sample,
undetermined *N-conversion factor not reported.
102

TABLE 24.—Composition and heat oj combustion of food items used in experiments on human digestibility {table ^5)—Continued
Test food, description Water Protein Fat
Carbohydrate
Total (by difference) Fiber
Ash Heat of combus- tion per
gram Ref. No.
GRAINS, GRAIN PRODUCTS—Con.
Wheat, Wheat Products—Con. Flours, lower extractions—Con.
149 Patent, baker's grade, milled from Scotch Fife
151 Patent 163 30 percent of wheat kernel, milled
from a mixture of Odessa, Cali- fornia and English wheats
Flours, other: 164 Semolina, milled from durum
wheat, Kubanka (Whole grain before processing) i^_
165 Semolina, ^^ milled from durum wheat, Kubanka
(Whole grain before processing) **_ Flour mixtures: ^
173 ''Bran flour," a mixture of 86 per- cent straight grade and 14 percent very finely ground bran from hard Weissenburg wheat
174 "Germ flour," a mixture of 93 per- cent straight grade flour and 7 percent finely ground germ milled from hard winter Weissenburg wheat
Wheat breakfast foods: Whole grain and partially refined:
175 Flaked 179 Meal 180 Meal 182 Meal 184 Puffed, whole grain 185 Rolled 187 Rolled 189 Shredded
190 Shredded Refined :
192 Endosperm, granulated 193 Endosperm, granulated 194 Endosperm, farina 195 Endosperm, farina 196 Endosperm, farina
Wheat breakfast food mixtures: 198 Wheat and barley malt 199 Wheat, whole grain and barley
malt, "Force" 200 Wheat, whole grain and barley
malt mixture, "Force" 201 Wheat and barley malt, "Malta
Vita" 202 Branny portion, fraction of 73-95
percent 21 203 Branny portion, fraction of 82-95
percent 21
LEGUMES AND NUTS
Beans, dry (Phaseolus vulgaris) : 210 Common white, navy beans. 211 Common white, navy beans.
Percent 8.01
11.07
14.63
10.77 8.76
7. 57 10 48
9.69
9.63
2.72 7.06 8.08 8.08 4.90 9. 19
11.35 6.20
5.62
9.35 12. 68 10 55 10 58 11.37
6.47
10.86
7.37
11.32
14.7
14 3
11. 21 11. 19
Percent *15. 50 *12. 75
2 8.91
2 11. 64 2 12. 37
2 11. 57 2 12. 45
13.96
1 14. 87
2 11. 69 2 11.25 2 16. 32 2 15. 16 2 15. 06
1 9. 81 2 11. 14 1 10 60
19.97
1 10 54 2 11.81
1 9. 70 1 9. 18
*13. 03
1 11. 63
19.86
1 9. 81
1 12. 20
*15. 7
*15. 0
2 18. 25 2 20. 69
1 N X 5.7. 2 N X 6.25. 1^ Item No. 164 was prepared from this sample. " Composition for macaroni, dry; used here for flour as
Snyder foimd by previous analyses that flour and uncooked macaroni made from it have practically same composition.
Percent 2.22 .90
,96
1.27 2.07
0. 89 2. 48
1.48
1.66
1.49 1.89 1.47 1. 35 1.94 2.27 2. 12 1.37
1. 35
.85 2.40 1.36 1. 10 .77
. 77
1. 65
2. 13
1. 52
4.2
4.4
1. 63 1. 58
Percent 73.52 74.84
75. 18
75.56 74 92
79.06 72. 92
73.62
72.97
79. 13 78.45 72. 68 74.08 76.70 77.22 73.85 80 06
81.27
78. 76 72.46 77.97 78. 60 74 27
78.96
74 77
78. 29
72.03
61. 1
61.3
64 89 62.54
Percent
. 14
2. 83
1.88 20 2. 10 20 2. 07
2.34 1.07
2.42
.27
.44
.36
.28
1. 85
7.6
10 3
Percent .75 .44
.32
.76 1.88
0 91 1.67
1.25
.87
4.97 1.35 1. 45 1.33 1. 40 1. 51 1. 54 1. 77
1.79
. 50
. 65
.42
. 54
. 56
2. 17
2. 86
2. 40
2.93
4.3
5.0
4.02 I 4. 00 i
Calories
4 16
3.876
3.962
4. 020
3. 877
4 061
3. 822
3.841
3. 885 3.922
170 97
146
168
168
168
168
129 129 129 126 129 62
168 127 and
155 129
129 126 62 62 97
9
9
62
9
30
30
184 184
^^ Items No. 165 and 187 were prepared from this sample. 20 Estimated by authors of article. 21 The wheat was milled to 73 percent and the branny
fraction obtained from the remaining portion. Refers to original grain with a 5 percent loss from cleaning.
*N-conversion factor not reported.
103

TABLE 24.—Composition and heat of combustion of food items used in experiments on human digestibility (table «S)—Continued
Water Protein Fat
Carbohydrate
Ash Heat of combus- tion per
gram Test food, description
Total (by difference) Fiber
Ref. No.
LEGUMES AND NUTS—Continued
Beans, dry—Continued 212 Common white, navy beans, skins
removed Percent 13.32 12.82 n. 25
13.37 10.77 11.32 10.27 10.05 8.08
12.84 8.36
13.0 13.2 11. 53 12, 61
4. 17 6.5
87.80
4.88 4.44
4.42 4.33 5.28
Percent *23. 75 *22. 06
2 25. 38
2 23. 19 2 21. 94 2 25. 50 2 22. 38 2 23. 75 2 23. 00 2 19. 94 2 21. 44
2 21.2 2 2L 2 2 22. 81 2 23.44
2 49. 31 2 44. 1
2 5. 83
2 32. 64 *58. 98
2 17. 28 2 19. 78 2 18.00 25.4 2 6.38 23.85 25.25
2 15. 67
2 24. 58
2 1. 16 ♦1.9 *2. 2
*. 9 *1. 0
*. 9 2 2. 1 2.86
2 1.6
23. 13 *4. 9
*2. 2 *2. 3 *1. 9 *2. 3 *2. 38
2 1.49 2 2.0 2 2.04 2 1. 20
Percent L71
Percent 59.50
Percent Percent Calories 165
213 Common white, navy beans 215 Kidney beans
3.38 3.58
3.50 3.72 3.57 3.45 3.51 3.93 3.57 3.76
2.7 2.6 2.44 L56
5.80 5.7 .71
2. 56 3.84
2.78 3.62 2.65
3.915 3.913 4.023 3.922 3.997 4.071 3.908 4.040
3.716 3.480
3.040
3. 129 3. 125 3.397
137 L41
L45 L78 L73 1.75 L75 1.35 1.48 1.70
L2 L2 1.51 .71
6. 50 3.3 4.41
47.33 9.69
54.30 63.31 66.07
1.4 3.32 2. 10
51.00 71.52
62.92
. 13
.3
.2
.3
.3
. 1
.6
.33
.2
.54 1.4
. 1
. 1
.3
."03'
.07
58. 38
58.49 6L79 57.88 62. 15 60.94 63.64 62. 17 64.74
6L9 6L8 6L71 61.68
34.22 40. 4
1.25
12. 59 23.05
2L22 8.96 8.00
38.3 81.54 47.75 23.44 6.96
a 62
5.44 13.8 10.8
3.3 3.0 3.7 6.6 7.40
11.0
5.53 17.3
17.4 18.4 15. 5 23.3 22. 32 17.35 21. 8 19.47 23. 19
5. 10 5.9
. 11
1.98 2. 54
2.58 2.96 4.22
184 Cowpeas, dry (Vigna sinensis) :
221 Clay 184 222 Clay 184 223 Lady 184 224 Lady .. ._ 184 225 Lady 184 226 Whippoorwill 184 227 Whippoorwill _ _ 184 228 Whippoorwill 184
Peas, dry (Pisum scUivum) : 235 Peas 145 236 Peas- __ _ 145 237 Peas _.. 140 238 Peas, split 113
Soybeans, Soybean Products (Glycine max) : 248 Soybean flour, about 6.5 percent fat_ 249 Soybean flour, about 3.3 percent fat. 252 Soybean curd (Tofu)
29 29
134 Ground nuts or peanuts (Arachis hypogaea) :
259 Peanuts 75 261 Peanut flour, partially defatted
Tree nuts: 264 Almonds (Pruniis amygdalus) 265 Brazil nuts (Bertholletia excelsa) 266 Brazil nuts _ _ __
64
75 75 75
2fi7 f^lipstmif.s frpsh (CJnsttfinpfi ft/itivfiS 67 268 Chestnut flour (Castanea dentata) _ _
(Kernel before processing)" 269 Coconuts (Cocos nucífera)
6.36 44.89 19. 17 4.30
3.97
92.44 82.6 85.4
94. 7 94.8 94. 4 89.4 90.53 86.3
88.44 76.0
79.5 78.3 81. 2 73.4 74.33 80. 16 75. 1 77.66 74.80
"13." 77' 3. 17
1.87
1.04 1.0
1. 1
"'"i.'Î2"
L51 .5
.4
.~28'
.39
2.40 1.41 1. 14 1.55
L91
.83 1.4 1. 4
.8
.9
.9 1.3 .88 .9
2.36 .4
.8
.9 1. 1 LO .94 .93
1.0 .84 .81
3.958 2.372 2.712 3.551
3.318
"".'673' .599
.214
.210
.203
"LÍÍ2'
.848
.900
.782
"i.öii'
120
75 270 Pecans {Carya illinoensis) 75 271 Walnuts (Juglans regia) (presum-
ably Persian or English)
VEGETABLES
272 Beans, snap {Phaseolus vulgaris) 274 Beets (Beta vulgaris)
75
57 33
275 Beets ___ ___ 33 276 Cabbage (Brassica olerácea var.
çapitata) _ ___ 33 277 Cabbage _-_ . .-_ _ _ 33 278 Cabbage 33 280 Cabbage, savoy 144 281 Carrots (Daucus carota) 134 282 Carrots _ ___ 144 283 Collards (Brassica olerácea var.
acephala) 57 284 Corn, green (Zea mays) _ . . 33 286 Potatoes, white (Solanum tubero-
sum) - __ _-_ 33 287 Potatoes, white 33 288 Potatoes, white _ ____ 33 291 Potatoes, white,_ _ _ _ 144 292 Potatoes, white. __ _ _ _ 42 293 Potatoes, white _ _ _ 134 294 Potatoes, white ^a _ _ 69 295 Potatoes, white ___ _ 69 296 Potatoes, white 69
2 N X 6.25. 22 Item No. 268 was prepared from this sample.
23 Average of several samples weighted by their con- sumption during period of digestion experiment.
*N-conversion factor not reported.
104

TABLE 24.—Composition and heat of combustion of food item^ used in experiments on human digestiMlüy {table 23)—Continued
Test food, description
Carbohydrate Heat of combus- tion per
gram Water Protein Fat
Total (by difference) Fiber
Ash
PercerU PereerU PereerU PereerU PereerU PereerU Coloriée 73.66 « 1.95 23.38 1.01 76.23 »2. 11 20.70 .96 77.66 «2.04 19.47 .84 74.80 « 1.20 23. 19 .81 74.3 « 1.8 23.2 .8 79,4 » 1.4 18.4 .9 84.01 « 1.94 .19 13.23 i.3Ö .63
4.96 « 1.71 .76 90.27 7.65 2.30
77.15 »1.60 .24 20.20 .52 .81
86.8 «.7 .2 12.0 .5 .3
6.82 69.92
"47.25 * 15. 20
4.478 1.443
Ref. No.
297 298 299 300 301 302 311 312
322
323
330 331
VEGETABLES—Continued
Potatoes, white Potatoes, white Potatoes, white Potatoes, white Potatoes, white ^ Potatoes, white ^ Pumpkin {Cucúrbita pepo) Sweetpotatoes, partially dried
{Ipomoea batatas)
FRUITS
Bananas (Musa paradisiaca var. sapientum)
Grapes {Vitis «pp.),** mixture of Tokay, Muscat and Cornichon.,
MISCELLANEOUS
Yeast, dried Yeast, fresh compressed
69 69 69 69 69 69
134
134
75
75
87 87
» N X 6.25. *» Average of several samples weighted ty their con-
sumption during period of digestion experiment.
** Weighted average of 3 kinds of European type grapes used in the digestion experiment.
•» N X 6.25. Authors also reported 7.05 percent protein N and 0.51 percent purine N.
105 U5. GOVERNMENT PRINTING OFFICE : 1973 0-493-791