New wave - NISSIN FOODS GROUP
62
NISSIN FOODS HOLDINGS NEW WAVE Annual Report 2014
-
Upload
khangminh22 -
Category
Documents
-
view
0 -
download
0
Transcript of New wave - NISSIN FOODS GROUP

NISSIN FOODS HOLDINGS
New waveAnnual Report 2014

New ValueFrom its founding as a food products company, the NISSIN FOODS Group has sought out new possibilities in food. Today, we continue our quest for completely new product categories and bringing greater value to customers around the world.
Our history begins in 1958 with the development of Chicken Ramen, the world’s first instant noodles.
1st

No.1Since its introduction in 1971 as the world’s first cup-type instant noodles, Cup Noodle has maintained a powerful position as Japan’s top brand of instant noodles.

The Group owns powerful brands in Japan in addition to instant noodles, such as chilled and frozen foods, confectionery, and beverages and continues to evolve as food manufacturer.
6 ProductsCategories

The Group launched overseas operations in 1972 and now does business worldwide. We divide our overseas operations into four regions: the Americas, China, Asia, and EMEA*.
4RegionsOutside Japan
*Europe, the Middle East, and Africa

This is the number of new products* the Group introduces annually. We continue to release innovative products by applying two key strengths: technological innovation and marketing capability.
1,000SKUs
*In Japan and overseas, including renewed products

NISSIN Global Innovation Center and NISSIN Global Food Safety Institute
This year, a new research and development center started operation. As the global base for food development and food safety research, it aims to generate tremendous power in support of growth.
2014

NewCHalleNGe Chief Executive Officer
Koki Ando

FiNaNcial HigHligHts (¥ Billion)
Net Sales
¥417.6Operating Income
¥27.7Net Income
¥19.3ROE (%)
6.0Sales by Segment
Total worldwide demand for instant noodles exceeded 100 billion servings in 2012 and continues to grow, especially in Asia. The Group’s China business achieved sharp increases in sales and income through an aggressive sales strategy for local Cup Noodles products in China.
In fiscal 2014, the opening year of the current medium-term business plan, the domestic instant noodle business and operations in China drove sales and profit growth, and the Group increased both sales and income. Consolidated net sales rose by 9.1% to ¥417.6 billion (US$4,058 million), operating income by 15.7% to ¥27.7 billion (US$269 million), and net income by 2.2% to ¥19.3 billion (US$187 million).
In Japan, amid an increase in demand for bag-type instant noodles driven by the increasingly popular non-fried noodles, which are just like fresh noodles, the sales of our bag-type non-fried Nissin RAOH series continued to perform well. The Group achieved increases in domestic sales and income as a result.
Nissin Food Products
¥210.9 (50.5%)
Myojo Foods
¥39.6 (9.5%)
Chilled and Frozen Foods
¥54.8 (13.1%)
The Americas
¥32.2 (7.7%)
China
¥29.9 (7.2%)Others
¥50.2 (12.0%)

Our New Research and Development Center: “the WAVE”
In the final month of fiscal 2014 (the year ended March 31, 2014), our new research and development center, named “the WAVE”, was opened in Tokyo. We gave it this name to express our desire to spread a new wave of innovation worldwide by pioneering leading-edge food technologies. “the WAVE” has a unique external appearance. The entrance features two cylindrical towers resembling the cutting blades of a noodle-making machine, and the exterior walls have a vast number of louvers that visually represent ramen noodles. The design symbolizes noodles being cut by cutting blades, our starting point. Furthermore, recognizing that the land and natural environment are the source of all food ingredients, we introduced advanced environmental systems such as solar radiation control using louvers and an auxiliary power supply that uses solar panels, with the aim of creating a building that is in dialog with the external environment. About twice the size of the former General Research Institute of Food Science and Technology and Food Safety Research Institute, “the WAVE” is one of the largest food research institutes in Japan.
Supporting the Growth Strategy with Technology
“the WAVE” houses two research facilities. The first is the NISSIN Global Innovation Center, which provides technical support for innovation, one of the key strengths of the Group. This research center has installed a hundred-meter-long test line based on the production lines at our plants. Until now, it was necessary to confirm and establish production conditions through line tests on actual production lines at the plants to prepare to mass produce trial products we had developed. The installation of a full-specification, continuous, multi-product-configurable production line within the research center will enable us to study mass production conditions in advance and shorten the time for product launch. In addition, we have set up within the research center the Technical Development Division to perform tasks including the development of machinery and will engage in production facility design and development. In this way, we will accumulate unique expertise within the Group and work to increase the speed and efficiency of product development.
Winning the Race for New Products and Markets
Competition to create new products is fierce in the instant noodle industry, and shortening development times is important for successfully competing in the market. It is of course critical if we are to be the first entry to the market, or to accelerate the process of developing a completely new product so as to create a new market. Not only that, a company can aim to capture market leadership by being the first to introduce a product with a clear competitive advantage over existing products in an established product category. We have transferred the chilled and frozen foods R&D center to the new research center and have also set up R&D functions for confectioneries and beverages. Although heretofore we have developed groundbreaking products by leveraging Group synergies, such as applying noodle technologies to confectioneries, the new research center will now assume a central role in an effort to develop completely new products that fuse the Group’s various food processing technologies. Innovation is not our sole focus. The other research facility, the NISSIN Global Food Safety Institute, is responsible for ensuring the safety essential to a food
“the WAVE”, the NISSIN FOODS Group’s new research and development center, opened in March 2014. The new research center will provide technical support for the Group’s growth strategy of speeding up development of the overseas business to evolve into a truly global company.
The Group engages in four types of R&D at “the WAVE”: basic research, applied research, safety research, and industrial machine development.
ceO Message

As a food culture creator that pursues new possibilities in food, the NISSIN FOODS Group will mount a united effort to satisfy the physical and spiritual appetites of people all over the world.
In China, local Cup Noodles products are highly popular, particularly among young people. In Turkey, MakarNeks instant pasta has successfully penetrated the market.
cHiNa
turkey
ceO Message
products company. The institute is deploying a world-class management system relating to food safety and will centrally manage safety at our domestic and overseas production plants to ensure the safety of all Group products. In the future, the institute will function as a global center for the transmission of information about instant noodles and a quality control tower with a powerful commitment to take responsibility for managing the safety of not only the Group’s products, but all instant noodles, a product for which worldwide demand now exceeds 100 billion servings and will further increase in the coming years.
Aspiring to Be a Truly Global Company
We consider the current medium-term business plan (announced in April 2013) to be a turning point for the Group’s development into a global company. We have designated the three-year period through fiscal 2016 as a time for up-front investment—with continued growth in the overseas business our highest priority. In fiscal 2014, the first year of the business plan, by stepping up overseas investment for
geographical expansion and in-depth business cultivation, we strengthened our position in the growing markets of China and Asia, and successfully early on in Central and South America, the Middle East, and Africa—all markets with high future potential. In the overseas business, we are implementing an efficient strategy for growth by means of marketing approaches that are adapted to individual countries and regions, localization based on technologies nurtured in Japan, and the provision of products differentiated from the competition. This strategy has produced encouraging results, and we are confident we can achieve the fiscal 2016 target of overseas sales of ¥100.0 billion in the business plan. Furthermore, “the WAVE”, our new research and development center, will play a key role as a global innovation center in implementing the global strategy in cooperation with development sites around the world, such as our principal regional research centers in Hong Kong, the U.S., and Singapore, etc.
Serving for All Shareholders
The Group’s management objective is to constantly strive to enhance earnings
potential, to increase corporate value, and to provide appropriate returns to our shareholders. We will engage in shareholder-oriented and ROE-oriented management to enhance our reputation as a global company. As the Japanese market matures due to population decline and the aging of society, the only path to further growth is to successfully compete in the global market. To accomplish this, we must develop a new business model that is not a mere extension of the business structure we have continuously developed since our founding. Through the years, the Group has applied technological innovation and marketing capabilities to explore various possibilities in food and create dream-inspiring delicious tastes. These key strengths have always provided a favorable tailwind for growth. In the coming years, we will gratify people everywhere with pleasures and delights food can provide and increase shareholder value by opening up new markets around the world and working to achieve sustainable growth.
Chief Executive Officer

ceO’s viewPOiNt
For a food products
company, the pursuit
of safety is a
never-ending struggle.
Future scientific and
technological progress
in medicine, physiology, and other fields is
likely to yield new knowledge about food. In
fact, nowadays research on human health is
constantly revealing new facts. Safety risks
suddenly arise, and we are pressed to
develop countermeasures. We think we will
increasingly face such situations.
The Group will remove harmful
substances contained in food products and
modify them or replace them with safe
substances. We will quickly detect new
causes for concern and take preventive
measures before problems occur. Our stance
is that there can be no compromise in the
pursuit of safety.
Since instant noodles
are tasty, safe, easy
to prepare, storable
for long periods of time
at room temperature,
and inexpensive,
I think that they are an essential food for any
time or circumstance. After natural disasters
or other emergencies, they can be rapidly
delivered where needed. In ordinary times,
instant noodles add convenience and pleasure
to our daily lives and help safeguard health.
According to the United Nations, the
world’s population will exceed nine billion in
2050, and a food supply crunch is said to be
a possibility. Instant noodles, which are easy
to prepare and highly energy efficient, can be
just the things to be a part of the foundation
of a healthy diet for large numbers of people.
Our purpose and passion is to support the
world’s food supply.
FOOd aNd HealtH
FOOd suPPly
“ Peace will come to the world when there is enough food”
Food is the most important thing supporting human life. The operations of NISSIN FOODS Group have grown from roots in human life.

The NISSIN FOODS Group appoints multiple outside directors and outside audit & supervisory board members, actively reflects in management the opinions of outside experts and realizes management vitalization and transparency. The executive officer system promotes rapid decision-making and clearly segregates management oversight from business execution.
NEW DEDICATION
Noritaka Ando
Yukio Yokoyama Yoshinori Miura Kiyotaka Ando
Tsunao Kijima
Susumu Nakagawa Akihide Matsuo
Mitsuru Tanaka
Ken Kobayashi
Masahiro Okafuji
Koki Ando
Yoko Ishikura

The NISSIN FOODS Group engages in business so as to maximize benefits to all stakeholders and regards the enhancement and strengthening of corporate governance as one of its most important management priorities.
cOrPOrate gOverNaNce
Management Committee
Direction/ Suggestion
Direction/ Report,
Suggestion and Confirmation
Direction/Report
Direction/Report
Liaison
Audit
Audit
Audit
Consultation/Recommendation
InternalAuditingOffice
Internal Control S
ystems
Audit
Selection and Appointment
Audit Report
Audit Report
Audit Report
Liaison
Liaison
Advice andGuidance
LiaisonSelection
Risk Management Committee
Board of Directors
General Meeting of Shareholders
Audit & Supervisory Board Independent Auditors
RepresentativeDirectors
Investment and Loan Strategy
Committee
Group Company Strategic
Presentation
PersonnelCommittee
Global Platform System
Presentation
Lawyers, Tax Accountants and Other Professionals
Business Ethics Committee
Environmental Committee
Information Security Committee
Business Divisions
Selection and Appointment
ReportSelection and Appointment
Report

cOrPOrate gOverNaNce
Strengthening of Corporate Governance
The Group has long actively reflected in
management the opinions of outside experts
and is pursuing management vitalization and
transparency. We first appointed
independent officers in 2010 and have
strengthened oversight by utilizing the
knowledge and talents of outside experts.
As a global compliance measure, in 2012 we
revised the approval regulations to promote
rapid decision-making in overseas regions.
Furthermore, as part of the governance
system, the representative directors of
NISSIN FOODS HOLDINGS receive periodic
strategy proposals at Global Platform
System Presentations from each NISSIN
FOODS HOLDINGS platform and at Group
Company Strategic Presentations from each
operating company.
Development and Construction of Internal Control Systems
The Group considers the development,
construction and appropriate operation of
internal control systems to be one of its
most important management priorities and
is working to construct more appropriate
and efficient systems through reviews
conducted when appropriate and
continuous improvement of the basic policy
on construction of internal control systems,
first instituted in 2006. The audit &
supervisory board members audit internal
control systems related to overall business
management to ensure their effectiveness.
The audit & supervisory board members
and Internal Audit Office conduct
operational audits of the business divisions,
audit and examine the effectiveness of
internal controls and provide improvement
suggestions, guidance and instructions,
as necessary.
Strengthening of Compliance
As part of internal control systems
construction, we are working to establish a
groupwide compliance structure. In
accordance with the NISSIN FOODS Group
Ethics Regulations, all of the Group’s
managers and employees are aware of
corporate social responsibility, observe
relevant laws and regulations and strive for
socially ethical behavior. Furthermore, in
accordance with the code of conduct in the
NISSIN FOODS Group Compliance
Regulations, each operating company
develops fair, equitable and transparent
relationships with raw materials suppliers,
subcontractors and other business partners,
all the while striving to conduct business
dealings in conformance with laws,
regulations and fair business practices. If
there has been a report of a compliance
violation from an employee, we respond in
accordance with the NISSIN FOODS Group
Whistleblower Regulations. In March 2014
we set up a dedicated compliance
promotion organization within the Legal
Affairs Department and are working to
strengthen the compliance structure.
To ensure the protection of personal
information, we instituted the Information
Security Policy and set up the Information
Security Committee in June 2004. We
comply with the NISSIN FOODS Group
Personal Information Protection Regulations,
instituted in 2008, and strive to appropriately
manage personal information.
Risk Management
We instituted the NISSIN FOODS Group
Risk Management Regulations in February
2008, set up the Risk Management
Committee chaired by a representative
director and endeavor to avoid damage to
corporate value from various risks facing the
Group. We partially amended the regulations
in April 2012, clearly defining details and
routes for information communication when
a risk event occurs.
Business Continuity Plan
We have launched a groupwide cross-
organizational project and are actively
engaging in business continuity planning.
The Group believes that maintaining
product supply even in times of emergency
is the most important way of fulfilling the
social responsibility of a food products
company. Accordingly, we are developing a
system that enables us to deliver products
to customers even if a key Group business
site ceases to function due to a large-scale
natural disaster or other catastrophe by
means such as continuing operations using
alternative business sites. We will now test
the effectiveness of our business continuity
plan, identify issues and strengthen the
plan by periodically conducting drills and
put in place a system that enables
employees to rapidly and flexibly execute
unaccustomed operations.

Notes: 1. Indicates an outside director as provided for in Article 2-15 of the Companies Act. 2. Indicates an outside audit & supervisory board member as provided for in Article 2-16 of the Companies Act. 3. Designated for independent director/audit & supervisory board member as specified by the Tokyo Stock Exchange and other exchanges in Japan.
cOrPOrate gOverNaNce As of June 27, 2014
Audit & Supervisory Board Members, Executive Officers andChief Officers
Board of Directors
Audit & SupervisoryBoard Member (Outside · Independent)
Hiroshi Takano *2 *3
Audit & Supervisory Board Member (Outside)
Toru Horinouchi *2
Audit & SupervisoryBoard Member (Outside · Full-time)
Kazuo Kanamori *2
Audit & Supervisory Board Member (Full-time)
Hideki Hattori
Senior Executive Officer
Toshihiro YamadaCQO (Chief Quality Officer) Head of NISSIN Global Food Safety Institute
Masahiro HommaCLO (Chief Legal Officer)
Jitsuro MurataDeputy Head of SCM Headquarters
Yasuhiro YamadaHead of SCM HeadquartersCPO (Chief Production Officer)
Toshihiko IjichiCAO (Chief Administrative Officer)
Hitoshi SuzukiGeneral Manager, Advertising Control Division, Corporate Strategy Headquarters
Kazuhiro TadokoroCHO (Chief Human Resources Officer)
Toshimichi FujinawaDeputy Head of NISSIN Global Innovation Center
Executive Officers and Chief Officers
Shigeo KitaraCIO (Chief Information Officer)
Kazuhito KusumotoCRO (Chief Resourcing Officer)
Koji SakaiGeneral Manager, Technology Development Division, NISSIN Global Innovation Center
President & Representative Director
Koki AndoCEO (Chief Executive Officer)
Managing Director
Akihide MatsuoPresident & Representative Director, MYOJO FOODS CO., LTD.
Director
Yukio YokoyamaCFO (Chief Financial Officer)
Outside Director
Masahiro Okafuji *1
President & Chief Executive Officer, ITOCHU Corp.
Managing Director
Tsunao KijimaCBO (Chief Business Officer)
Director
Yoshinori MiuraPresident & Representative Director, NISSIN FOOD PRODUCTS CO., LTD.
Director
Kiyotaka AndoChief Representative, China
Independent Outside Director
Yoko Ishikura *1 *3
Professor Emeritus, Hitotsubashi University
Executive Vice President & Representative Director
Susumu NakagawaCOO (Chief Operating Officer)In charge of Chilled and Frozen Foods Business
Director
Mitsuru TanakaCDO (Chief Development Officer) Head of NISSIN Global Innovation Center
Outside Director
Ken Kobayashi *1
President & Chief Executive Officer, Mitsubishi Corp.
Senior Managing Director & Representative Director
Noritaka AndoCSO (Chief Strategic Officer)In charge of MarketingIn charge of SCM
The latest information about management personnel is available on our web site:

The next objective of the NISSIN FOODS Group is to compete and win globally. We will leverage
technological capabilities developed in Japan to accelerate worldwide implementation of the
global strategy and drive growth in the global market as the instant noodle pioneer.

eMea*
asia
cHiNa aNdHONg kONg
ceNtral aNdsOutH aMerica
ThailandCompletion of Nava Nacorn Plant
Colombia (Non-consolidated)
Establishment of subsidiaryand start of sales
Kenya (Non-consolidated)
Startup of joint venture with JKUAT
TurkeyLaunch of first instant noodle business in Turkey
Maghreb (Non-consolidated)
Launch of instant noodle business
India Completion of Khordha Plant(Production of CHOP noodles)
Hong KongConstruction of new plant for Demae Iccho(Scheduled to go into operation in Jul. 2016)Establishment of a confectionery joint venture between NISSIN FOODS (HK) and Frente
ChinaEstablishment of production subsidiary for Cup Noodles(Scheduled to go into operation in Apr. 2016)Establishment of subsidiary for productionof packaging materials (Scheduled to go into operation in Jan. 2015)
To prepare for growth in the overseas business, a key objective in our current medium-term business plan, we have stepped up investment in China and Asia, markets which continue to grow, and have newly entered and gained footholds in Central and South America, the Middle East and Africa, markets with high future potential.
glObal HigHligHts OF Fiscal 2014
* Europe, the Middle East, and Africa
Mouse overpictures
for details
Brazil (Equity method associate)
Completion of Gloria do Goita Plant for business expansion in the northeast region
n Turkey, where we got off to a solid start and gained a foothold
with instant pasta, we will aim to further establish our products as regularly stocked items and increase sales. On the African continent, where we entered the markets of Kenya and Morocco in fiscal 2014, we will continue market creation efforts with a view to setting up a local production structure and expanding into the East African Community.
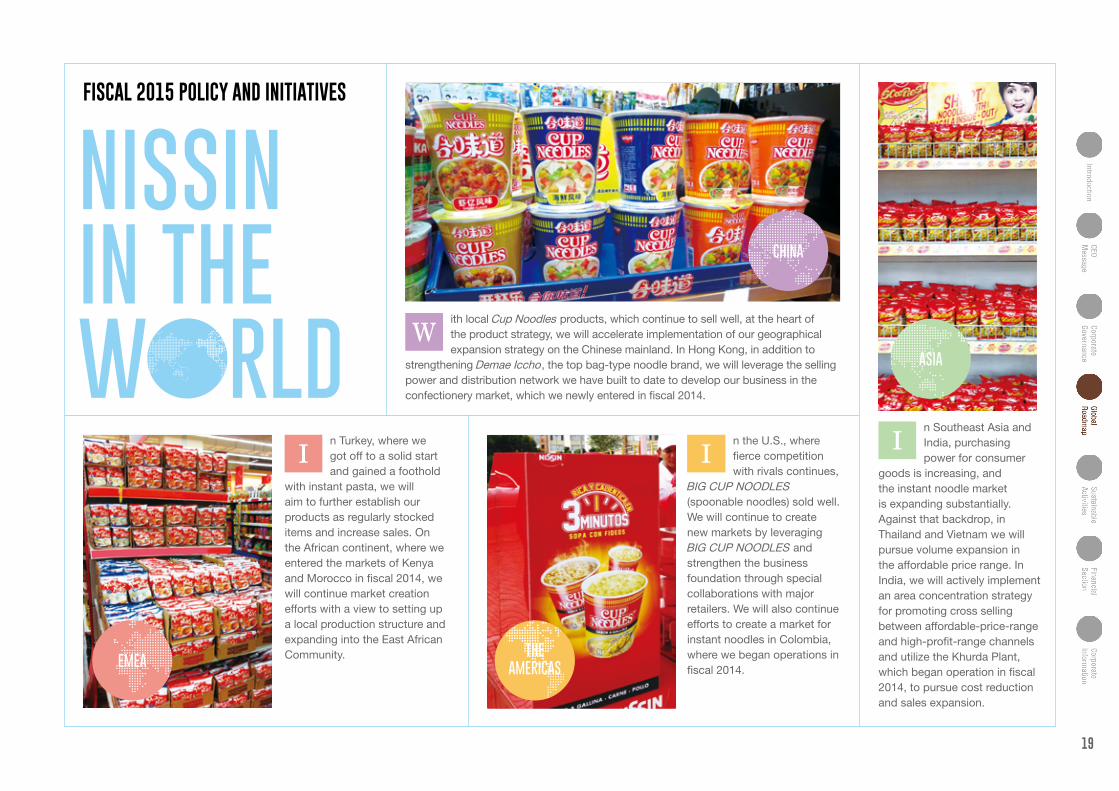
n the U.S., where fierce competition with rivals continues,
BIG CUP NOODLES (spoonable noodles) sold well. We will continue to create new markets by leveraging BIG CUP NOODLES and strengthen the business foundation through special collaborations with major retailers. We will also continue efforts to create a market for instant noodles in Colombia, where we began operations in fiscal 2014.
ith local Cup Noodles products, which continue to sell well, at the heart of the product strategy, we will accelerate implementation of our geographical expansion strategy on the Chinese mainland. In Hong Kong, in addition to
strengthening Demae Iccho, the top bag-type noodle brand, we will leverage the selling power and distribution network we have built to date to develop our business in the confectionery market, which we newly entered in fiscal 2014.
asIa
eMea
NIssIN IN THe w rlD
n Southeast Asia and India, purchasing power for consumer
goods is increasing, and the instant noodle market is expanding substantially. Against that backdrop, in Thailand and Vietnam we will pursue volume expansion in the affordable price range. In India, we will actively implement an area concentration strategy for promoting cross selling between affordable-price-range and high-profit-range channels and utilize the Khurda Plant, which began operation in fiscal 2014, to pursue cost reduction and sales expansion.
II
W
I
Fiscal 2015 POlicy aNd iNitiatives
CHINa
THe aMerICas

New FuTureThe NISSIN FOODS Group’s philosophy, EARTH FOOD CREATOR, signifies the Group’s aspiration to contribute to society and the earth by gratifying people everywhere with pleasures and delights food can provide. Our mission is to support food, support life and support the future.

Quality Assurance System
The cornerstone of the Group’s quality
assurance system is the NISSIN Global
Food Safety Institute. The institute develops
analysis and testing methods to ensure
quality from raw materials to finished
products, confirms the quality of procured
raw materials, conducts supplier inspections
and verifies the quality control systems of
Group and supplier production plants.
The NISSIN Global Food Safety Institute
analyzes harmful substances that may be
contained in food (such as residual agricultural
chemicals, veterinary drugs, carcinogens,
food allergens, food poisoning bacteria,
mold fungus, heavy metals and radioactive
substances) and is independently developing
analysis and inspection systems to prevent
contamination of food. Through these rigorous
inspection systems, the institute has put in
place a mechanism to ensure the use of safe
raw materials.
NASRAD-700, the latest system for instantly
analyzing residual agricultural chemicals and
veterinary drugs, can instantly analyze 545
types of residual agricultural chemicals and
188 types of veterinary drugs.
To instantly analyze residual agricultural
chemicals, it is necessary to extract
agricultural chemicals from food. This is called
“preprocessing.” FASRAC, independently
developed by the NISSIN Global Food
Safety Institute, are the first systems in the
world to automate preprocessing in residual
agricultural chemicals analysis.
NASID determines on the basis of a profile
of residual agricultural chemicals and
the content of specific elements that raw
materials delivered to plants are identical to
retained samples whose quality has been
confirmed in analysis.
NESMAGET rapidly and conveniently
examines genotoxic carcinogens contained
in food. NESMAGET is highly rated for a
revolutionary testing method that uses
human cells to evaluate DNA damage, a
cause of cancer, and has received an award
at an academic conference.
Quality Survey Activities
The NISSIN Global Food Safety Institute
conducts quality surveys to ensure that
quality and safety assurance measures are
appropriately taken at every stage from raw
materials processing to finished product
production.
Quality Survey Activities of the NISSIN Global Food Safety Institute
To provide products customers can enjoy with confidence and peace of mind, the NISSIN FOODS Group has established a quality assurance system that extends from farm to table, covering all operations from raw materials procurement to production, distribution and sales, by means of independent analysis and inspection systems.
Quality aNd saFety
We have put in place a redundant quality management system consisting of quality control at the production plants and inspection of products produced at our plants at the NISSIN Global Food Safety Institute.
dOuble
Nissin’s Analytical System for Residual Agricultural Chemicals and Veterinary Drugs (NASRAD)
Food Automatic Analytical Systems for Residual Agricultural Chemicals (FASRAC)
Nissin’s Analytical Systems for Identification (NASID)
Nissin’s Evaluation Systems for Mammalian Genotoxicity (NESMAGET)
Quality process management at manufacturing plants in China
Quality surveys from raw materials production to processing, including surveys of farms, livestock farms and fisheries
On-site inspections of manufacturing plants based on Nissin’s Inspection Standards for Food Safety (NISFOS)

Environmental Management
The Group engages in activities to preserve
the natural environment. In 2008 the
Group established the NISSIN FOODS
Group Environmental Charter, which sets
forth fundamental principles and action
guidelines that promote the practice of green
management. To preserve a sustainable
global environment, the Group works to
reduce environmental impacts at every stage
of all business activities.
We have set up the Group Environmental
Council, chaired by a representative director
of NISSIN HOLDINGS, for the purpose of
promoting environmental preservation. The
committee is developing an environmental
management system for the Group by
establishing a Group environmental policy
and discussing environmental targets and
important matters concerning environmental
activities.
To promote green management
throughout the Group, in fiscal 2012 we set
up the Environmental Promotion Division
within the Food Safety Research Institute
(current name: NISSIN Global Food Safety
Institute). The division inspects the status
of compliance with environment-related
laws and regulations and environmental
activities at the Group’s plants using our
independent inspection standards for
environmental activities (RISEA). RISEA
inspection results are fed back to the plants,
and the department verifies subsequent
improvement.
Environmental Risk Management System
The Group has established independent
emissions standard values that are
stricter than the standards prescribed
by laws and regulations concerning SOx
(sulfur oxides) and NOx (nitrogen oxides),
causes of air pollution, and the water
pollution indices BOD (biochemical oxygen
demand) and COD (chemical oxygen
demand). The Group periodically monitors
and measures emissions to prevent
environmental accidents. We also take risk
countermeasures to provide against damage
to facilities and spillage of environmentally
harmful substances. We conduct emergency
drills at each plant in accordance with
an emergency response manual and are
working to strengthen and enhance the
environmental risk management system.
The 12th Hyakufukushi Project: “NISSIN Employee Disaster Preparation Training Project”
The Great East Japan Earthquake caused
unprecedented damage and took many
precious lives. One of the lessons of that
fateful day was a keen realization of the
importance of self-reliance and of preparing
to protect oneself by one’s own power.
Other major earthquakes are expected to
occur in Japan, and earthquake preparation
measures by individuals and companies
alike are an urgent necessity.
The NISSIN Employee Disaster
Preparation Training Project, the 12th
Hyakufukushi Project, is an employee
development project whose aim is to instill in
employees knowledge of crisis management
and mastery of the mental attitude required
in an emergency. Group employees from
across Japan will gather for overnight
training at the head offices to simulate
experience of life at an evacuation center.
The goal of the project is to train employees
to protect themselves, survive together with
others, and show equanimity and initiative
in the face of natural disaster, such as when
operating Kitchen Cars*.
To contribute to a brighter, richer future, the NISSIN FOODS Group engages in activities to preserve the natural environment as well as socially beneficial activities as a responsible member of society.
eNvirONMeNtal / sOcial activities
Since 2008, the Group has been implementing the Hyakufukushi Project to engage in a total of 100 social contribution activities in 50 years. Five themes guide project selection: Creation, Food, The Earth, Health, and Children.
100
*Vehicles with on-board water heaters for distributing instant noodles
More information on our environmental and social activities is available at our website:

alwaYs NewNISSIN FOODS Group believes that food should be
fun. To create food that satisfies the appetite and
brings smiles to the faces of people everywhere, we
always look to the future and pursue freshness and originality.
Expect more great things to come from us.

24
Years ended March 31, Millions of yen (except per share information)
2014 2013 2012 2011 2010 2009
For the Year Net sales ¥ 417,621 ¥ 382,793 ¥ 380,675 ¥ 374,932 ¥ 371,178 ¥ 362,057 Cost of sales 231,310 211,347 213,707 203,202 203,037 202,304 Gross profit 186,311 171,446 166,968 171,730 168,141 159,753 Selling, general and administrative expenses 158,606 147,492 140,756 137,192 140,799 136,201 Operating income 27,705 23,954 26,212 34,538 27,342 23,552 Other income (expenses) 4,020 5,439 5,408 145 3,813 (180)Income before income taxes and minority interests 31,725 29,393 31,620 34,683 31,155 23,372 Income taxes 12,436 10,195 12,887 13,597 10,270 7,385 Minority interests in earnings (loss) of consolidated subsidiaries 20 343 194 330 389 96 Net income 19,269 18,855 18,539 20,756 20,496 15,891 Comprehensive income 37,410 34,884 18,541 13,239 — —
Per Share Net income —primary ¥ 174.83 ¥ 171.12 ¥ 167.97 ¥ 187.56 ¥ 177.02 ¥ 129.98 —diluted 174.13 170.57 167.59 187.30 176.91 —Cash dividends 75.00 75.00 75.00 70.00 60.00 50.00 Equity*1 3,018.82 2,782.25 2,545.31 2,454.67 2,406.26 2,287.21
At Year-End Working capital*2 ¥ 74,652 ¥ 48,865 ¥ 60,949 ¥ 56,472 ¥ 67,772 ¥ 69,536 Property, plant and equipment, net 147,620 133,788 126,360 125,882 109,278 101,132 Total assets 479,470 446,132 414,717 409,749 408,410 408,729 Long-term liabilities 37,001 33,296 37,194 44,499 48,371 34,426 Equity*3 342,301 315,027 286,657 277,595 271,951 285,569
R&D expenses ¥ 5,313 ¥ 4,321 ¥ 4,385 ¥ 4,081 ¥ 3,807 ¥ 3,477 Capital expenditures 27,527 21,582 18,937 30,810 18,448 17,572
Value & Performance Indicators
Operating margin (%)*4 6.6 6.3 6.9 9.2 7.4 6.5 Return on assets (%)*5 4.2 4.4 4.5 5.1 5.0 4.0 Return on equity (%)*6 6.0 6.4 6.7 7.7 7.5 5.7 Inventory turnover (times)*7 11.5 11.5 13.4 14.1 13.7 13.5
CONSOLIDateD SIx-year Summary OF SeLeCteD FINaNCIaL Data
* Interest coverage ratio = Operating cash flow / Interest payments
2013
2014
382.8
417.6
200.8 39.3
52.6
25.9
20.8
54.8 29.9
43.3
210.9 39.6 32.2 50.2
NET SAlES BY SEGMENT (Billions of yen)
34.59.2
27.37.4
26.26.9
24.0
27.7
6.3
6.62013
2012
2010
2011
2014
OPERATING INCOME AND OPERATING MARGIN (Billions of yen) / (%)
136.7
205.4
150.0
150.1
120.82013
2012
2010
2011
2014
INTEREST COVERAGE RATIO (Times)
Operating income Operating margin Nissin Food Products Myojo Foods Chilled and Frozen Foods The Americas China Others
Notes: 1. Equity per share = (Equity - Minority interests - Stock acquisition rights) / Number of shares outstanding as of the year-end (excluding treasury stock) 2. Working capital = Total current assets - Total current liabilities 3. Equity: In compliance with the Corporate Law, from fiscal 2007, the amount of equity includes the amount of minority interests. 4. Operating margin = Operating income / Net sales
5. Return on assets = Net income / Average total assets6. Return on equity = Net Income / (Average total equity - Average minority interests - Average stock acquisition rights)7. Inventory turnover = Cost of sales / Average total inventory

25
FINaNCIaL reVIeW
Net SalesConsolidated net sales of the Group for fiscal 2014 amounted to ¥417,621 million (US$4,058 million), a 9.1% increase on the previous fiscal year’s ¥382,793 million. Among consolidated net sales, domestic net sales alone (excluding intersegment sales) increased by 4.5% year on year to ¥343,931 million (US$3,342 million), while the share of overseas net sales also increased by 3.6 percentage point to 17.6%. During the fiscal year under review, the Japanese economy continued to stage a recovery, driven by domestic corporate and household demand, as the policies of the government and the Bank of Japan gradually permeated the real economy. Nevertheless, there was scant room for optimism as the yen’s weakness continued to put upward pressure on raw materials prices and consumers maintained their deep-seated desire to protect their livelihood by saving money. Consumers also continued to demonstrate high sensitivity to food safety and worry-free food, so that food manufacturers were once again required to further strengthen their quality assurance systems. Looking at the global market for instant noodles, the Group’s mainstay business, worldwide demand for instant noodles in calendar year 2013 increased by 4.1% over the previous year to 105.59 billion servings, according to the World Instant Noodles Association (WINA). In the Asian market, which accounted for 86.5% of the worldwide demand in 2013, the demand for instant noodles was 91.32 billion servings and marked a 4.1% year-on-year increase. As for the Group, the domestic instant noodle industry saw an increase in total demand for bag-type instant noodles due to the dramatic expansion of the market for fresh bag-type instant noodles. There was also a spike in demand ahead of the consumption tax hike in April 2014. For Group operations outside of Japan, the aggregate overseas sales grew, with marked contributions by the Americas and China businesses, both of which recorded increases in revenues as well as operating income. The Americas business endeavored to reinforce its business foundation in North America, while the China business improved its marketing efficiency and accelerated its strategic expansion of business areas. The Group also strengthened investments in the China and Asian markets, where the economic growth is pronounced, and proceeded with entry into the promising markets of Latin America, the Middle East and Africa. In this environment, the Group harnessed its strong technological innovation and
marketing capabilities to develop products in line with the group philosophy of being an EARTH FOOD CREATOR and contributing to society and the earth by gratifying people everywhere with the pleasures and delights food can provide. It also sought to further enhance its brand value. The Group’s global strategy focused on emerging countries with high growth potential, and worked to strengthen competitiveness sufficient to succeed on the world stage and to develop systems capable of swiftly executing strategies. The sales breakdown by segment (excluding intersegment sales) shows that the total sales of the Nissin Food Products and Myojo Foods segments, both of which are chiefly focused on the instant noodle business in the domestic market, amounted to ¥250,468 million (US$2,434 million), and accounted for 60.0% of total consolidated net sales. In the Nissin Food Products segment, among its bag-type instant noodles, the growth of non-fried noodles was remarkable, and the Nissin RAOH series continued to sell briskly. Nissin-No-Donbei Nama Udon Shokkan and Nama Soba Shokkan also tapped into year-end demand, and contributed to the overall sales growth. Chicken Ramen, which celebrated its 55th anniversary in August 2013, also sold strongly, reflecting vigorous ongoing marketing activities, including proposing new ways of serving. In cup-type instant noodles, the main product lines, such as the Cup Noodle series and the Nissin-No-Donbei series, continued to sell strongly, contributing to the overall sales increase. As for the Myojo Foods segment, in its bag-type noodles, MYOJO KIWAMEN, which boasts the texture and taste of fresh noodles, was rolled out across the whole of Japan and contributed to sales. In cup-type noodles, main product lines continued to perform solidly, thanks largely to the sales of variations of the MYOJO IPPEICHAN YOMISE NO YAKISOBA series, and consequently, the instant noodle sales increased overall. The chilled and frozen foods segment, which comprises the production and sales of chilled and frozen food products, increased its sales compared to the previous fiscal year. Within this segment, sales of products of NISSIN CHILLED FOODS CO., LTD. exceeded the year-ago level, reflecting a solid performance from the fall, amid continued stagnant demand for chilled noodles in the market. In particular, value-added products with a strong commitment to the flavor of chilled noodles sold strongly, and sales of mainstay brands such as Tsukemen-no-Tatsujin grew. In NISSIN FROZEN FOODS CO., LTD., its performance remained strong, reflecting efforts to expand the line-up and improve the quality of existing
INCOME ANAlYSIS
NISSIN FOODS HOLDINGS CO., LTD. (the “Company”) and its subsidiaries and associated companies (“associates”) operate the production and sales of instant noodles and other instant foods as their core business, to further develop their business domain in various foods, logistics and other related businesses. The scope of consolidation for fiscal 2014, the year ended March 31, 2014, covers the Company, 45 consolidated subsidiaries (26 in Japan and 19 overseas), and five associates accounted for by the equity method (collectively, the “Group”).

26Working capital = Total current assets – Total current liabilitiesCurrent ratio = Total current assets / Total current liabilities
Shareholders’ equity = Total equity – Minority interests – Stock acquisition rights
mainstay brands such as the Reito Nissin Spa-O Premium series. The rice products, which were improved to enhance the softness of the rice, as well as snack products, also contributed to the overall increase of sales. In the Americas segment, the Group aimed to become less susceptible to the effect of price competition and worked to strengthen its high value-added products. BIG CUP NOODLES, which will be a core product in the future, was introduced as a regular product at major retailers, and contributed to sales growth. The long-selling products Top Ramen and Cup Noodles also maintained solid sales. In the China segment, sales increased, thanks to expansion of the sales network and sales personnel, as well as brand strategy in the mainland China market where the middle-income class continues to grow. In particular, the sales of cup-type instant noodles grew due to an aggressive sales strategy for high value-added products under the Hap Mei Do brand. Demae Iccho, manufactured in Hong Kong, also continued to perform strongly. Other business areas, which are not reported as stand-alone segments, include domestic confectionery, beverages and food service businesses, and overseas businesses in Europe and Asia. The aggregate sales of other business areas increased compared with the previous fiscal year.
Cost of Sales and Selling, General and Administrative ExpensesThe cost of sales for fiscal 2014 increased by 9.5% from the previous fiscal year to ¥231,310 million (US$2,247 million), mainly due to the increase in net sales and the rise in raw materials prices. The ratio of cost of sales to net sales rose by 0.2 percentage points to 55.4%. Selling, general and administrative (“SG&A”) expenses amounted to ¥158,606 million (US$1,541 million). Among SG&A expenses, promotional expenses increased by 7.9% from the previous fiscal year to ¥76,154 million (US$740 million), with a 0.2 percentage-point drop in the ratio to net sales. Advertising expenses also increased by 7.8% year on year to ¥11,854 million (US$115 million), while the ratio to net sales slightly decreased by 0.1 percentage point. Distribution expense grew by 9.9% to ¥24,214 million (US$235 million), with the ratio to net sales holding steady at the same level as that of the previous fiscal year.
As a result, total SG&A expenses increased by 7.5% from the previous fiscal year.
Operating Income, Other Income (Expenses) and Net IncomeThe increase in net sales exceeded the increases in the cost of sales and SG&A expenses, and, as a result, consolidated operating income for fiscal 2014 increased to ¥27,705 million (US$269 million) by 15.7% from the previous fiscal year. The ratio of operating income to net sales also rose by 0.3 percentage points to 6.6%. Net other income declined to ¥4,020 million (US$39 million) from ¥5,439 million in the previous fiscal year. A ¥2,969 million increase in gain on sales of investments in securities and other profit-increasing effects were offset by the profit-decreasing factors, such as a ¥724 million increase in loss on impairment of fixed assets, and a ¥2,822 million loss on revaluation of investments in securities, unconsolidated subsidiaries and associates, and other recorded. As a result of the above, income before income taxes and minority interests for fiscal 2014 amounted to ¥31,725 million (US$308 million), up by 7.9% from the previous fiscal year. Net income resulted in a 2.2% year-on-year increase to ¥19,269 million (US$187 million). The ratio of net income to net sales, on the other hand, slightly dropped by 0.3 percentage points to 4.6%. Net income per share increased by ¥3.71 to ¥174.83 (US$1.70) from the previous year’s ¥171.12.
56.4164.4
67.8176.9
60.9167.1
48.9
74.7
150.0
174.52013
2012
2010
2011
2014
WORKING CAPITAl AND CURRENT RATIO (Billions of yen) / (%)
271.77.7
266.37.5
280.46.7
306.6
332.7
6.4
6.02013
2012
2010
2011
2014
SHAREHOlDERS’ EQUITY AND ROE (Billions of yen) / (%)
Shareholders’ equity ROE Working capital Current ratio
COSTS AND ExPENSES, AND NET SAlES RATIO Millions of yen
Years ended March 31, 2014 2013
Net Sales Ratio Net Sales Ratio
Cost of sales ¥231,310 55.4 ¥211,347 55.2
SG&A expenses 158,606 38.0 147,492 38.5
Promotional expenses 76,154 18.2 70,552 18.4
Advertising expenses 11,854 2.8 11,001 2.9
Distribution expenses 24,214 5.8 22,024 5.8
Other expenses 46,383 11.1 43,916 11.5

27
lIQUIDITY AND CAPITAl RESOURCES
66.3
65.2
67.6
68.7
69.42013
2012
2010
2011
2014
EQUITY RATIO (%)
2,454.67
2,406.26
2,545.31
2,782.25
3,018.82
2013
2012
2010
2011
2014
EQUITY PER SHARE (Yen)
Cash FlowsCash and cash equivalents as of March 31, 2014 stood at ¥80,201 million (US$779 million), an increase of ¥16,186 million from the previous fiscal year-end. Net cash provided by operating activities decreased by ¥1,831 million to ¥30,214 million (US$294 million). Major cash-increasing factors included a ¥2,332 million increase in income before income taxes and minority interests; and a ¥2,737 million increase in loss on revaluation of marketable securities, investment securities and other. On the other hand, major cash-decreasing factors were a ¥3,404 increase in gain on sales of marketable securities, investment in securities and other; and a ¥2,918 million increase in the negative adjustment for trade notes and accounts receivable. Net cash used in investing activities recorded a year-on-year decrease of ¥21,744 million to ¥9,507 million (US$92 million). This significant drop was mainly attributable to a ¥8,259 million increase in proceeds from sales and redemption of marketable securities; and a ¥19,252 million increase in proceeds from sales and redemption of investments in securities. Net cash used in financing activities decreased by ¥1,545 million to ¥8,526 million (US$83 million). While repayment of long-term borrowings increased by ¥4,554 million, there were a ¥2,482 million net increase in short-term borrowings and a ¥3,635 million increase in proceeds from long-term borrowings.
Assets, liabilities and Net AssetsTotal assets as of March 31, 2014 amounted to ¥479,470 million (US$4,659 million), up by 7.5% from the previous fiscal year-end. Return on assets (ROA) dropped by 0.2 percentage points to 4.2%, reflecting the total assets’ rate of increase surpassing that of net income. Total current assets grew by 19.2% year on year to ¥174,820 million (US$1,699 million). This increase was attributable mainly to a ¥15,572 million increase in cash and deposits; and a ¥5,661 million increase in marketable securities due to the acquisition and reclassification of debt securities. Net property, plant and equipment rose by 10.3% to ¥147,620 million (US$1,434
million), reflecting the construction of a new research center and the consolidation of new overseas subsidiaries. Investments and other assets decreased by 5.2% to ¥157,030 million (US$1,526 million). The decrease mainly reflects a total ¥10,197 million decrease in investments in securities, investments in unconsolidated subsidiaries and associates, and other investments due to sales, redemption and reclassification of invested assets. Total liabilities resulted in a 4.6% year-on-year increase to ¥137,169 million (US$1,333 million). Long-term debt increased by ¥2,133 million, and deferred tax liabilities also rose by ¥3,076 million. Total current liabilities increased by 2.4% year on year to ¥100,168 million (US$973 million). As the growth ratio of current assets surpassed that of current liabilities, working capital as of March 31, 2014 soared by 52.8% to ¥74,652 million (US$725 million). The current ratio also rose by 24.5 percentage points to 174.5%, from 150.0% of the previous fiscal year-end. Total equity as of March 31, 2014 increased by 8.7% to ¥342,301 million (US$3,326 million). Although ¥8,266 million cash dividends were paid, total equity resulted in a ¥27,274 million increase chiefly due to ¥19,269 million net income posted; a ¥5,234 million increase in unrealized gain on available-for-sale securities, and a ¥13,151 million net increase in foreign currency translation adjustments. Equity per share also rose by 8.5% from ¥2,782.25 for the previous fiscal year-end to ¥3,018.82 (US$29.33).
CASH FlOW HIGHlIGHTS Millions of yen
Years ended March 31, 2014 2013
Net cash provided by operating activities ¥30,214 ¥ 32,045
Net cash used in investing activities (9,507) (31,251)
Net cash used in financing activities (8,526) (10,071)
Cash and cash equivalents at end of the year ¥80,201 ¥ 64,015
409.75.1
408.45.0
414.74.5
446.1
479.5
4.4
4.22013
2012
2010
2011
2014
TOTAl ASSETS AND ROA (Billions of yen) / (%)
Total assets ROA

28
Significant Business AgreementsJoint-venture agreement with Hebei Jinmailang Mianye Co., Ltd.
With regard to the Company’s capital participation in Hebei Hualong F&N Industry Group Co., Ltd., a major manufacturer of instant noodles and flour in the PRC (hereafter “Hebei Hualong”), which was undertaken to expand and thereby reinforce the Company’s instant noodle operations in the PRC, the Company concluded on May 12, 2004, a joint-venture agreement with Hebei Jinmailang Mianye Co., Ltd., the parent company of Hebei Hualong. Hebei Jinmailang Mianye split Hebei Hualong into two new companies: Nissin Hualong Foods Co., Ltd. (now renamed Jinmailang Foods Co., Ltd.) and Hebei Nissin Hualong Paper Products Co., Ltd. (now renamed Hebei Jinmailang Paper Products Co., Ltd.). Through capital increases subscribed by its Hong Kong-based subsidiary, Nissin Foods Co., Ltd., the Company had acquired 14.9% of registered equity in each newly established company during the fiscal year ended March 31, 2005. In order to accelerate a joint-venture with Jinmailang Group, Jinmailang Nissin Foods Co., Ltd. was established in August 2011 and asset restructuring and reorganization process were started. In April 2012, Nissin Foods Co., Ltd., a subsidiary of the Company, invested in 14.3% of the shares of Jinmailang Nissin Foods Co., Ltd. At the time of the completion of asset restructuring, Nissin Foods Co., Ltd. will acquire additional shares of Jinmailang Nissin Foods Co., Ltd. The percentage of the Company’s total shareholding will be 33.4%, and the total investment is expected to reach about ¥20 billion.
Risk InformationConditions that have the potential to significantly influence the decisions of investors are presented below. Any conditions with reference to the future are based on information available at the time of publication of this annual report. The Company acknowledges the possibility that these risks can arise, and will make every effort to prevent such risks from appearing and address resulting situations if such risks do appear.
(1) Food safety issues
The Company’s basic philosophy is to provide safe foods that consumers can enjoy without worry. In the past, a high incidence of disquieting developments, such as avian influenza, residual pesticides in foods, falsely labeled food products, radioactive contamination of foods, and toxic substances mixed in food products, threatened to undermine food quality and safety. The needs of consumers with regard to food safety have become more sophisticated. To enhance its ability to meet these needs, the Company established the Food Safety Research Institute in 1988 (and established “the WAVE” in 2014) and continues its endeavor to enhance its research function and strengthen its quality control system. However, the Company’s financial position and financial performance could be unfavorably influenced were unusual health-related situations to arise in the future that were beyond the Company’s conjecture, or if rumors
were to mar the image of the Company’s products, even though such rumors were based on incidents not directly affecting the Company’s products.
(2) Risk derived from changes in demographic trends
In Japan, the birth rate remains low, and the population is aging rapidly. Accordingly, the number of young consumers, who are the major customers of the Company, has been decreasing, and therefore the market of our products is expected to remain unchanged or otherwise decrease over the long term. In the face of such a business climate, the Company is making ever-greater efforts to develop new products that closely meet the needs of each age bracket in order to maintain and expand our customer base. However, were the decrease in population to accelerate, the overall demand in the instant noodle market would shrink, negatively affecting the Company’s financial position and financial performance.
(3) Risk of decline in brand value
The Company’s mainstay products, particularly Chicken Ramen and the Cup Noodle series, have become familiar household items for most consumers, thanks to years of accumulated technical expertise and product development activities. The Company emphasizes the establishment and enhancement of its brands. However, new products flood the instant noodle market every year, and the relative brand value of the Company’s products could decline if another company were to achieve a revolutionary breakthrough in instant noodle development.
(4) Risk of product liability
As a food manufacturer, the Company believes its mission is to provide safe, worry-free products to consumers, and therefore applies strict quality control standards to its manufacturing activities. In addition, the Food Safety Research Institute studies ways to ensure the safety of raw materials and strives to reinforce quality control systems at each manufacturing facility. The Company also endeavors to lessen the potential of product liability claims that could affect its financial position, and therefore is insured against product liability. However, if an accident occurs through product liability and a situation arises wherein the Company must recall certain products, the insurance carried by the Company may not be sufficient to cover all claims. A tarnished reputation in society and a weakened corporate image could erode consumers’ willingness to buy the Company’s products. This situation could hurt the Company’s financial position and financial performance.
(5) Risk of increases in prices of raw materials
The primary raw materials used for the Company’s products are agricultural commodities such as flour and palm oil, and petroleum-based items for packaging and
ADDITIONAl INFORMATION

29
wrappers. The prices of these raw materials fluctuate with changing market conditions. Therefore, the Company’s financial performance could be adversely impacted if the prices of raw materials skyrocket, as there exist more factors than ever to boost their prices, such as political unrest or international disputes occurring in the countries that produce these raw materials, and crop failures caused by abnormal weather associated with global warming.
(6) Risk of natural disasters
The Company has manufacturing facilities both in Japan and overseas. If a natural disaster, such as a large-scale earthquake or flooding from a typhoon, were to occur and manufacturing facilities incurred damage, the Company’s production infrastructure as well as its financial position and financial performance could suffer because, for example, an interruption in operations would reduce output and repairs to facilities and equipment would raise expenses. Furthermore, serious accidents at electric power plants caused by natural disasters could also negatively affect the Company’s production infrastructure, financial position and financial performance, through lowered electricity supply, large-scale blackouts, and radioactive contamination.
(7) Risk related to overseas operations
The Company produces food products, including instant noodles, based on the basic policy of local production and local marketing in 17 countries. If political unrest or international disputes arise in the regions where the Company’s subsidiaries and associates operate, or if issues threaten to undermine food safety, or if legal controls in certain countries create a situation that hinders production activities, then the financial position and financial performance of the subsidiaries, affiliates and/or the Company could suffer.
(8) Risk related to information systems
The Company uses computers to process and store information on production, sales and administration. The Company had adopted all conceivable measures to safeguard these information systems from computer virus-induced crashes, damage by hackers, and the risk of a breach in information security. However, the Company’s financial position and financial performance could be adversely affected if the Company’s systems were damaged and/or if data were leaked outside the organization, due to illegal access to the systems by unauthorized individuals through technologies that the Company has not envisioned, or an unknown computer virus getting through established safeguards.
(9) Risk related to retirement benefit accounting
Costs and obligations pertaining to retirement benefits are determined based on discount rates and other predetermined criteria used in actuarial calculations and on the expected
rate of return on pension assets. If actual results differ from predetermined criteria, or if predetermined criteria are amended, the actuarial difference is charged to the income of the fiscal year following the one in which the difference occurred. If a decline in discount rates and/or returns on the pension assets persists, the Company will have to carry a higher burden of pension-related costs, and this could hurt the Company’s financial position and financial performance.
(10) Risk of declining market values on marketable securities
The Company invests in marketable securities to ensure efficient application of funds, while it is the policy of the Company to maintain the integrity of principal. However, the Company’s financial position and financial performance could be adversely affected if worsening market conditions cause market values to decline or sluggish performances by equity investments force the Company to apply the accounting for impairment.
(11) Risk related to the accounting for impairment of fixed assets
The Company owns various tangible fixed assets for the purpose of its business. These fixed assets could face in the future a substantial decline in their fair value and/or future cash flows they are to generate, and thus would have the possibility of impairment loss recognition in conformity with the accounting for impairment of fixed assets. Such circumstances could negatively affect the Company’s financial position and financial performance.
(12) Reliance on certain business clients
The Company substantially relies on specific business parties for sales of products and procurement of certain raw materials. Reliance on specific trading companies for sales of products aims at reducing the effort expended on credit control and minimizing credit risk through concentration of transactions among highly creditworthy companies. Reliance on specific vendors for procurement of certain raw materials also aims at efficient and stable procurement. However, if the business activities of these sales agents were to fail and the Company had difficulty collecting accounts receivable, or if the supply of raw materials were suspended and the Company’s production had to be halted, the Company’s own financial position and financial performance could be negatively affected.
(13) Exchange rate fluctuations
The Company expands its businesses in various overseas regions. The local financial statements in each region are translated to Japanese yen for the purpose of preparing consolidated financial statements. Hence, exchange rate fluctuations may have an effect on the Group’s consolidated results and financial position, even if there is no change in the value in local currencies.
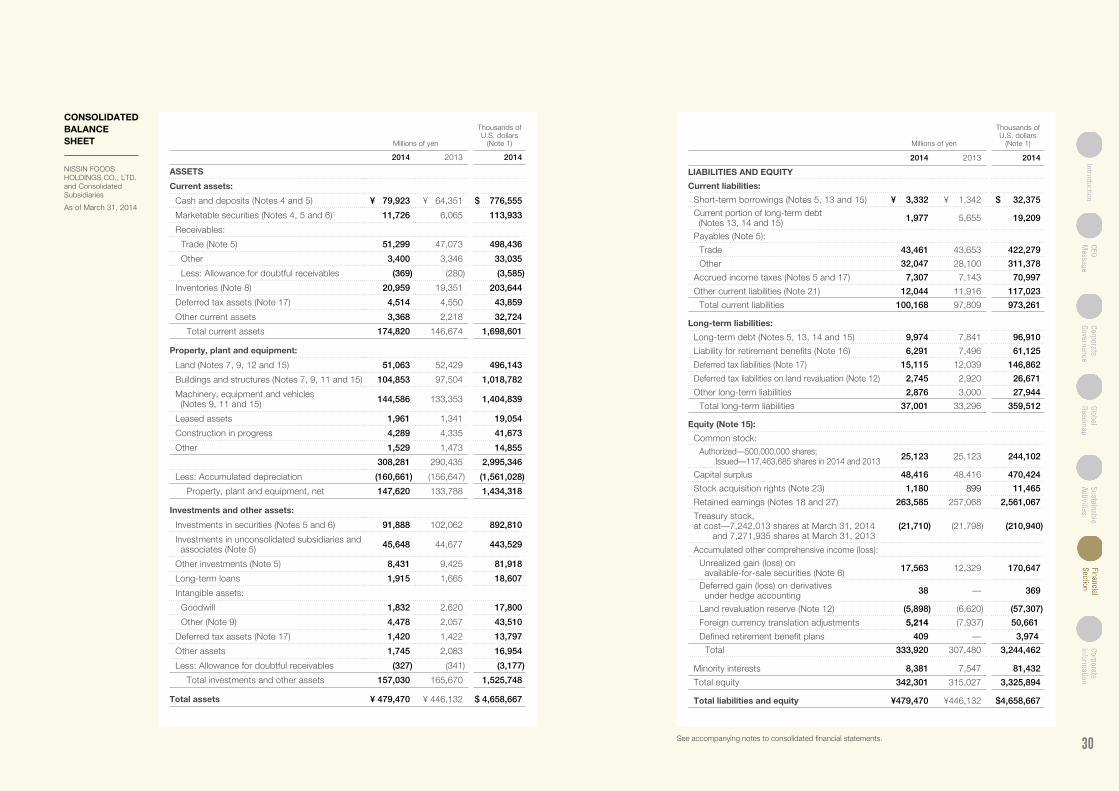
30
Millions of yen
Thousands of U.S. dollars
(Note 1)
2014 2013 2014
ASSETS
Current assets:
Cash and deposits (Notes 4 and 5) ¥ 79,923 ¥ 64,351 $ 776,555
Marketable securities (Notes 4, 5 and 6) 11,726 6,065 113,933
Receivables:
Trade (Note 5) 51,299 47,073 498,436
Other 3,400 3,346 33,035
Less: Allowance for doubtful receivables (369) (280) (3,585)
Inventories (Note 8) 20,959 19,351 203,644
Deferred tax assets (Note 17) 4,514 4,550 43,859
Other current assets 3,368 2,218 32,724
Total current assets 174,820 146,674 1,698,601
Property, plant and equipment:
Land (Notes 7, 9, 12 and 15) 51,063 52,429 496,143
Buildings and structures (Notes 7, 9, 11 and 15) 104,853 97,504 1,018,782
Machinery, equipment and vehicles (Notes 9, 11 and 15) 144,586 133,353 1,404,839
Leased assets 1,961 1,341 19,054
Construction in progress 4,289 4,335 41,673
Other 1,529 1,473 14,855
308,281 290,435 2,995,346
Less: Accumulated depreciation (160,661) (156,647) (1,561,028)
Property, plant and equipment, net 147,620 133,788 1,434,318
Investments and other assets:
Investments in securities (Notes 5 and 6) 91,888 102,062 892,810
Investments in unconsolidated subsidiaries and associates (Note 5) 45,648 44,677 443,529
Other investments (Note 5) 8,431 9,425 81,918
Long-term loans 1,915 1,665 18,607
Intangible assets:
Goodwill 1,832 2,620 17,800
Other (Note 9) 4,478 2,057 43,510
Deferred tax assets (Note 17) 1,420 1,422 13,797
Other assets 1,745 2,083 16,954
Less: Allowance for doubtful receivables (327) (341) (3,177)
Total investments and other assets 157,030 165,670 1,525,748
Total assets ¥ 479,470 ¥ 446,132 $ 4,658,667
Millions of yen
Thousands of U.S. dollars
(Note 1)
2014 2013 2014
lIABIlITIES AND EQUITY
Current liabilities:
Short-term borrowings (Notes 5, 13 and 15) ¥ 3,332 ¥ 1,342 $ 32,375
Current portion of long-term debt (Notes 13, 14 and 15) 1,977 5,655 19,209
Payables (Note 5):
Trade 43,461 43,653 422,279
Other 32,047 28,100 311,378
Accrued income taxes (Notes 5 and 17) 7,307 7,143 70,997
Other current liabilities (Note 21) 12,044 11,916 117,023
Total current liabilities 100,168 97,809 973,261
long-term liabilities:
Long-term debt (Notes 5, 13, 14 and 15) 9,974 7,841 96,910
Liability for retirement benefits (Note 16) 6,291 7,496 61,125
Deferred tax liabilities (Note 17) 15,115 12,039 146,862
Deferred tax liabilities on land revaluation (Note 12) 2,745 2,920 26,671
Other long-term liabilities 2,876 3,000 27,944
Total long-term liabilities 37,001 33,296 359,512
Equity (Note 15):
Common stock:Authorized—500,000,000 shares; Issued—117,463,685 shares in 2014 and 2013 25,123 25,123 244,102
Capital surplus 48,416 48,416 470,424
Stock acquisition rights (Note 23) 1,180 899 11,465
Retained earnings (Notes 18 and 27) 263,585 257,068 2,561,067
Treasury stock, at cost—7,242,013 shares at March 31, 2014 and 7,271,935 shares at March 31, 2013
(21,710) (21,798) (210,940)
Accumulated other comprehensive income (loss):Unrealized gain (loss) on available-for-sale securities (Note 6) 17,563 12,329 170,647
Deferred gain (loss) on derivatives under hedge accounting 38 — 369
Land revaluation reserve (Note 12) (5,898) (6,620) (57,307)
Foreign currency translation adjustments 5,214 (7,937) 50,661
Defined retirement benefit plans 409 — 3,974
Total 333,920 307,480 3,244,462
Minority interests 8,381 7,547 81,432
Total equity 342,301 315,027 3,325,894
Total liabilities and equity ¥479,470 ¥446,132 $4,658,667
See accompanying notes to consolidated financial statements.
NISSIN FOODS HOLDINGS CO., LTD. and Consolidated Subsidiaries
As of March 31, 2014
CONSOlIDATED BAlANCE SHEET

31
Millions of yen
Thousands of U.S. dollars
(Note 1)
2014 2013 2014
Net sales ¥417,621 ¥382,793 $4,057,724
Cost of sales 231,310 211,347 2,247,473
Gross profit 186,311 171,446 1,810,251
Selling, general and administrative expenses (Note 19) 158,606 147,492 1,541,061
Operating income 27,705 23,954 269,190
Other income (expenses):
Interest and dividend income 2,981 2,673 28,964
Gain on sales of marketable securities 494 59 4,800
Equity in earnings of associates 2,154 1,888 20,929
Interest expense (250) (213) (2,429)
Foreign exchange gain (loss) 1,177 1,538 11,436
Gain on sales of fixed assets 139 348 1,351
Gain on sales of investments in securities (Note 6) 3,329 360 32,346
Subsidy income (Note 11) — 17 —
Insurance income 24 152 233
Loss on disposal and sales of fixed assets (948) (395) (9,211)
Loss on impairment of fixed assets (Note 9) (1,999) (1,275) (19,423)
Loss on revaluation of investments in securities, unconsolidated subsidiaries and associates, and other (Note 10)
(2,822) — (27,419)
Loss from natural disaster (45) (236) (437)
Loss on cancellation of manufacturing subcontract agreement (55) (310) (534)
Other, net (159) 833 (1,547)
Income before income taxes and minority interests 31,725 29,393 308,249
Income taxes (Note 17):
Current 11,193 10,221 108,754
Deferred 1,243 (26) 12,078
12,436 10,195 120,832
Net income before minority interests 19,289 19,198 187,417
Minority interests in earnings (loss) of consolidated subsidiaries 20 343 194
Net income ¥ 19,269 ¥ 18,855 $ 187,223
See accompanying notes to consolidated financial statements. See accompanying notes to consolidated financial statements.
NISSIN FOODS HOLDINGS CO., LTD. and Consolidated Subsidiaries
Year ended March 31, 2014
NISSIN FOODS HOLDINGS CO., LTD. and Consolidated Subsidiaries
Year ended March 31, 2014
CONSOlIDATED STATEMENT OF INCOME
CONSOlIDATED STATEMENT OF COMPREHENSIVE INCOME
Millions of yen
Thousands of U.S. dollars
(Note 1)
2014 2013 2014
Net income before minority interests ¥19,289 ¥19,198 $187,417
Other comprehensive income (loss)
Unrealized gain (loss) on available-for-sale securities 5,258 7,925 51,088
Deferred gain (loss) on derivatives under hedge accounting 38 — 369
Foreign currency translation adjustments 8,637 3,903 83,920
Share of other comprehensive income (loss) in associates 4,035 3,858 39,205
Defined retirement benefit plans 153 — 1,487
Total other comprehensive income (loss) 18,121 15,686 176,069
Comprehensive income 37,410 34,884 363,486
Total comprehensive income attributable to:
Owners of the parent 36,788 34,371 357,442
Minority interests 622 513 6,044

32
NISSIN FOODS HOLDINGS CO., LTD. and Consolidated Subsidiaries
Year ended March 31, 2014
CONSOlIDATED STATEMENT OF CHANGES IN EQUITY
Millions of yen
Accumulated other comprehensive income
Common stock
Capital surplus
Stock acquisition
rights (Note 23)
Retained earnings
(Notes 18 and 27)
Treasury stock
Unrealized gain (loss) on available-for-
sale securities(Note 6)
Deferred gain (loss)
on derivatives under hedge
accounting
Land revaluation
reserve (Note 12)
Foreign currency
translation adjustments
Defined retirement
benefit plans Total
Minority interests
Total equity
Balance, April 1, 2012 ¥25,123 ¥48,416 ¥659 ¥247,139 ¥(21,856) ¥4,386 ¥— ¥(7,275) ¥(15,509) ¥ — ¥281,083 ¥5,574 ¥286,657
Cash dividends paid — — — (8,264) — — — — — — (8,264) — (8,264)
Net income — — — 18,855 — — — — — — 18,855 — 18,855
Acquisition of treasury stock — — — — (3) — — — — — (3) — (3)
Sales of treasury stock — (9) — — 61 — — — — — 52 — 52
Transfer to capital surplus — 9 — (9) — — — — — — — — —
Reversal of land revaluation reserve — — — (656) — — — — — — (656) — (656)
Other — — — 3 — — — — — — 3 — 3
Net change in the year — — 240 — — 7,943 — 655 7,572 — 16,410 1,973 18,383
Balance, March 31, 2013 (as previously reported) ¥25,123 ¥48,416 ¥899 ¥257,068 ¥(21,798) ¥12,329 ¥— ¥(6,620) ¥ (7,937) ¥ — ¥307,480 ¥7,547 ¥315,027
Effect of accounting change — — — (2,095) — — — — — 256 (1,839) — (1,839)
Balance, March 31, 2013 (as restated) 25,123 48,416 899 254,973 (21,798) 12,329 — (6,620) (7,937) 256 305,641 7,547 313,188
Cash dividends paid — — — (8,266) — — — — — — (8,266) — (8,266)
Net income — — — 19,269 — — — — — — 19,269 — 19,269
Acquisition of treasury stock — — — — (6) — — — — — (6) — (6)
Sales of treasury stock — (10) — — 94 — — — — — 84 — 84
Transfer to capital surplus — 10 — (10) — — — — — — — — —
Reversal of land revaluation reserve — — — (722) — — — — — — (722) — (722)
Change in scope of consolidation — — — (1,659) — — — — — — (1,659) — (1,659)
Net change in the year — — 281 — — 5,234 38 722 13,151 153 19,579 834 20,413
Balance, March 31, 2014 ¥25,123 ¥48,416 ¥1,180 ¥263,585 ¥(21,710) ¥17,563 ¥38 ¥(5,898) ¥ 5,214 ¥409 ¥333,920 ¥8,381 ¥342,301

33See accompanying notes to consolidated financial statements.
Thousands of U.S. dollars (Note 1)
Accumulated other comprehensive income
Common stock
Capital surplus
Stock acquisition
rights (Note 23)
Retained earnings
(Notes 18 and 27)
Treasury stock
Unrealized gain (loss) on available-for-
sale securities(Note 6)
Deferred gain (loss)
on derivatives under hedge
accounting
Land revaluation
reserve (Note 12)
Foreign currency
translation adjustments
Defined retirement
benefit plans Total
Minority interests
Total equity
Balance, March 31, 2013 (as previously reported) $244,102 $470,424 $ 8,735 $2,497,746 $(211,796) $119,792 $ — $(64,322) $ (77,118) $ — $2,987,563 $73,328 $3,060,891
Effect of accounting change — — — (20,356) — — — — — 2,487 (17,869) — (17,869)
Balance, March 31, 2013 (as restated) 244,102 470,424 8,735 2,477,390 (211,796) 119,792 — (64,322) (77,118) 2,487 2,969,694 73,328 3,043,022
Cash dividends paid — — — (80,315) — — — — — — (80,315) — (80,315)
Net income — — — 187,223 — — — — — — 187,223 — 187,223
Acquisition of treasury stock — — — — (58) — — — — — (58) — (58)
Sales of treasury stock — (97) — — 914 — — — — — 817 — 817
Transfer to capital surplus — 97 — (97) — — — — — — — — —
Reversal of land revaluation reserve — — — (7,015) — — — — — — (7,015) — (7,015)
Change in scope of consolidation — — — (16,119) — — — — — — (16,119) — (16,119)
Net change in the year — — 2,730 — — 50,855 369 7,015 127,779 1,487 190,235 8,104 198,339
Balance, March 31, 2014 $244,102 $470,424 $11,465 $2,561,067 $(210,940) $170,647 $369 $(57,307) $ 50,661 $3,974 $3,244,462 $81,432 $3,325,894

34
Millions of yen
Thousands of U.S. dollars
(Note 1)
2014 2013 2014
Operating activities:
Income before income taxes and minority interests ¥ 31,725 ¥ 29,393 $ 308,249
Depreciation and amortization 14,517 14,345 141,051
Loss on impairment of fixed assets 1,999 1,275 19,423
Increase (decrease) in allowance for doubtful receivables 30 (2) 291
Increase (decrease) in liability for retirement benefits (3,813) (1,950) (37,048)
Interest and dividend income (2,981) (2,673) (28,964)
Interest expense 250 213 2,429
Foreign currency exchange (gain) loss (216) (1,431) (2,099)
Equity in earnings of associates (2,154) (1,888) (20,929)
Loss on disposal and sales of property, plant and equipment 809 46 7,860
Gain on sales of marketable securities, investments in securities and other (3,823) (419) (37,145)
Loss on revaluation of marketable securities, investments in securities and other 2,822 85 27,419
(Increase) decrease in trade notes and accounts receivable (2,318) 600 (22,522)
(Increase) decrease in inventories (257) (777) (2,497)
Increase (decrease) in trade notes and accounts payable (1,342) (1,819) (13,039)
Increase (decrease) in other payables (507) 1,553 (4,926)
Other, net 1,539 1,458 14,954
Subtotal 36,280 38,009 352,507
Interest and dividends received 4,699 3,961 45,657
Interest paid (250) (213) (2,429)
Income taxes paid (12,184) (11,664) (118,383)
Income taxes refunded 1,669 1,952 16,216
Net cash provided by operating activities 30,214 32,045 293,568
Millions of yen
Thousands of U.S. dollars
(Note 1)
2014 2013 2014
Investing activities:
Net (increase) decrease in time deposits 991 1,629 9,629
Payments for purchases of marketable securities (5,704) (500) (55,422)
Proceeds from sales and redemption of marketable securities 10,840 2,581 105,325
Payments for purchases of property, plant and equipment, and other (21,068) (21,078) (204,703)
Proceeds from sales of property, plant and equipment, and other 2,283 2,149 22,182
Payments for purchases of investment in securities (21,034) (18,835) (204,372)
Proceeds from sales and redemption of investments in securities 25,912 6,660 251,768
Payments for purchases of investment in subsidiaries resulting in change in scope of consolidation
— (1,903) —
Proceeds from sales of investment in subsidiaries 475 — 4,615
Net (increase) decrease in loans receivable 350 (185) 3,401
Other, net (2,552) (1,769) (24,796)
Net cash used in investing activities (9,507) (31,251) (92,373)
Financing activities:
Increase (decrease) in short-term borrowings, net 2,029 (453) 19,714
Proceeds from long-term borrowings 4,034 399 39,195
Repayment of long-term borrowings (6,195) (1,641) (60,192)
Net (increase) decrease in treasury stock (7) (3) (68)
Cash dividends paid (8,266) (8,264) (80,315)
Cash dividends paid to minority shareholders (31) (18) (301)
Other, net (90) (91) (874)
Net cash used in financing activities (8,526) (10,071) (82,841)
Effect of exchange rate changes on cash and cash equivalents 2,822 1,551 27,419
Net increase (decrease) in cash and cash equivalents 15,003 (7,726) 145,773
Cash and cash equivalents at beginning of the year 64,015 71,741 621,988
Increase in cash and cash equivalents arising from initial consolidation of subsidiaries 1,183 — 11,495
Cash and cash equivalents at end of the year (Note 4) ¥ 80,201 ¥ 64,015 $ 779,256
NISSIN FOODS HOLDINGS CO., LTD. and Consolidated Subsidiaries
Year ended March 31, 2014
CONSOlIDATED STATEMENT OF CASH FlOWS
See accompanying notes to consolidated financial statements.

35
(a) Principles of consolidation and accounting for investments in unconsolidated subsidiaries and associates
The accompanying consolidated financial statements include the accounts of the Company and the significant companies which it controls directly or indirectly under the control or influence concept. Companies over which the Company exercises significant influence in terms of their operating and financial policies have been included in the accompanying consolidated financial statements by the equity method. The assets and liabilities of consolidated subsidiaries are stated at fair value as of their respective dates of acquisition. Consolidation of the remaining subsidiaries and associates would not have a material effect on the accompanying consolidated financial
statements. All significant intercompany balances and material unrealized gains from intercompany transactions have been eliminated. The number of consolidated subsidiaries has been increased by one during the fiscal year ended March 31, 2014. Nissin Foods Vietnam Co., Ltd. and Nissin Foods (Thailand) Co., Ltd. have been included in the scope of consolidation due to the increase of their significance. Aji-no-Mingei Co., Ltd. has been excluded from the scope of consolidation after the Company sold its shares to a third party. Moreover, the Company acquired the shares of BonChi Co., Ltd. Effective for the year ended March 31, 2014, the equity method of accounting has been applied to this associate. The Company’s consolidated subsidiaries outside Japan prepare their financial statements in accordance with International Financial Reporting Standards or accounting principles generally accepted in the United States of America. However, certain items are adjusted in the process of consolidation based on “Practical Solution on Unification of Accounting Policies Applied to Foreign Subsidiaries for Consolidated Financial Statements” (Accounting Standards Board of Japan (ASBJ), Practical Issues Task Force, No. 18 dated May 17, 2006). The balance sheet date of overseas consolidated subsidiaries is December 31. Any significant differences in intercompany accounts and transactions arising from intervening intercompany transactions during the period from January 1 through March 31 have been adjusted as necessary. The numbers of consolidated subsidiaries and associates accounted for by the equity method for the years ended March 31, 2014 and 2013 were as follows:
2014 2013
Consolidated subsidiaries 45 44
Associates accounted for by the equity method 5 4
(b) Cash and cash equivalentsFor the purposes of the consolidated statements of cash flows, cash and cash equivalents comprise cash on hand, deposits held at call with banks and all highly liquid investments with an insignificant risk of changes in value and with maturities of three months or less from the acquisition date.
(c) SecuritiesThe accounting standard for financial instruments requires that securities be classified into three categories: trading, held-to-maturity or available-for-sale
The accompanying consolidated financial statements of NISSIN FOODS HOLDINGS CO., LTD. (the “Company”) and consolidated subsidiaries (collectively, the “Group”) are prepared on the basis of accounting principles generally accepted in Japan and related accounting regulations prescribed in the Financial Instruments and Exchange Act of Japan, which are different in certain respects from the application and disclosure requirements of International Financial Reporting Standards. In preparing the accompanying consolidated financial statements, certain reclassifications and rearrangements have been made to the consolidated financial statements issued domestically in order to present them in a format that is more familiar to readers outside Japan. Certain reclassifications of previously reported amounts have been made to conform the consolidated financial statements for the year ended March 31, 2013 to the 2014 presentation. Such reclassifications had no effect on consolidated net income or equity. The consolidated financial statements are stated in Japanese yen, the currency of the country in which the Company is incorporated and operates. The translation of yen amounts into U.S. dollars is included solely for the convenience of readers outside Japan and has been made at ¥102.92 = US$1.00, the exchange rate prevailing on March 31, 2014. This translation should not be construed as a representation that yen can be converted into U.S. dollars at the above or any other rate.
01BASIS OF PRESENTING CONSOlIDATED FINANCIAl STATEMENTS
02SUMMARY OF SIGNIFICANT ACCOUNTING POlICIES
NOteS tO CONSOLIDateD FINaNCIaL StatemeNtSNISSIN FOODS HOLDINGS CO., LTD. and Consolidated Subsidiaries

36
securities. Trading securities are carried at fair value and held-to-maturity debt securities are carried at amortized cost. Marketable securities classified as available-for-sale securities are carried at fair value with any changes in unrealized gain or loss, net of the applicable income taxes, reported in a separate component of equity. Cost of securities sold is determined by the moving-average method. Non-marketable securities classified as available-for-sale securities are carried at cost based on the moving-average method. For other than temporary declines in fair value, investment securities are reduced to net realizable value by a charge to income.
(d) InventoriesFinished goods and merchandise are principally stated at the lower of cost or net selling value, with cost being determined by the average method. Raw materials and supplies are principally stated at the lower of cost or net selling value, with cost being determined by the last purchase price method.
(e) Hedging activitiesThe Group manages risk of adverse fluctuations in foreign exchange and interest rates in the underlying liabilities with derivative financial instruments (“derivatives”). The derivative instruments are applied for forecasted and committed foreign currency transactions and long-term debt. For foreign currency forward contracts and interest rate swaps, the gains or losses are deferred until maturity of the hedged transactions if they meet requirements for hedge accounting, i.e., hedging purpose, high effectiveness and high correlation between the hedging instruments and the hedged items. Foreign currency options are recognized as either assets or liabilities and measured at fair value, and gains or losses on derivative transactions are recognized in the consolidated statements of income. An evaluation of hedge effectiveness has been omitted, since the significant conditions of the hedging instruments and hedged items were the same and the risk of changes in cash flows was completely avoided. The Group does not anticipate any losses arising from credit risk, since the Group enters into these derivatives with major international financial institutions with high credit ratings to reduce the risk of counterparties’ non-performance.
(f) Property, plant and equipment (except for leased assets)Property, plant and equipment are stated at cost. Depreciation is computed principally by the declining-balance method. Certain consolidated subsidiaries apply the straight-line method. The straight-line method is also applied to the head office building of the Company (in Osaka). In addition, the straight-line method is applied to buildings (except for the attachments to the buildings)
acquired on or after April 1, 1998. The range of useful lives is principally from 15 to 50 years for buildings and 10 years for machinery and equipment.
(g) Intangible assets (except for leased assets)Intangible assets are amortized by the straight-line method. Purchased software is amortized by the straight-line method over a five-year period, which is the estimated useful life used by the Group.
(h) Leased assetsLeased assets under finance lease contracts that do not transfer ownership to the lessee and which were entered into on or after April 1, 2008 are capitalized and depreciated to a residual value of zero by the straight-line method using the term of the contract as the useful life. Leased assets under finance lease contracts that do not transfer ownership to the lessee and were entered into on or before March 31, 2008 are accounted for as operating lease transactions.
(i) Long-lived assetsThe Group reviews its long-lived assets for impairment whenever events or changes in circumstance indicate the carrying amount of an asset or asset group may not be recoverable. An impairment loss would be recognized if the carrying amount of an asset or asset group exceeds the sum of the undiscounted future cash flows expected to result from the continued use and eventual disposition of the asset or asset group. The impairment loss would be measured as the amount by which the carrying amount of the asset exceeds its recoverable amount, which is the higher of the discounted cash flows from the continued use and eventual disposition of the asset or the net selling price at disposition.
(j) Liability for employees’ retirement benefitsThe Company and certain domestic consolidated subsidiaries have defined benefit pension plans. The Company accounts for the liability for retirement benefits based on the defined benefit obligations and plan assets at the balance sheet date. The defined benefit obligations are attributed to periods on a benefit formula basis. Net unrecognized actuarial gain or loss is credited or charged to income in the year following the year in which the gain or loss was incurred. Actuarial gains and losses that are yet to be recognized in profit or loss are recognized within equity (accumulated other comprehensive income) after adjusting for tax effects, and any resulting deficit or surplus shall be recognized as a liability or asset.

37
(k) Allowance for doubtful receivablesThe allowance for doubtful receivables is calculated based on the historical experience with bad debts and an estimate of certain uncollectible amounts determined after an analysis of specific individual doubtful receivables.
(l) Income taxesThe provision for income taxes is computed based on the pretax income included in the consolidated statements of income. Deferred tax assets and liabilities are provided for temporary differences between the balances of assets and liabilities reported for financial reporting purposes and the corresponding balances for tax reporting purposes.
(m) GoodwillGoodwill is amortized by the straight-line method over a certain period reasonably determined for each investment on a case-by-case basis, but for no longer than 20 years, or are charged to income as incurred if the amount is deemed to be immaterial.
(n) Stock optionsIn accordance with “Accounting Standard for Stock Options” (ASBJ Statement No. 8, December 27, 2005), the Company and its domestic subsidiaries accounted for stock options granted to their directors, executive officers and employees on and after April 3, 2009 as expense on the date of grant based on the fair value at the grant date.
(o) Per share informationBasic net income per share is computed by dividing net income available to common shareholders by the weighted-average number of common shares outstanding for the period, retroactively adjusted for stock splits. Diluted net income per share reflects the potential dilution that could occur if stock options were exercised. Cash dividends per share presented in the accompanying consolidated statements of income are dividends applicable to the respective years, including dividends to be paid after the end of the year.
Changes in accounting proceduresAccounting Standard for Retirement Benefits—On May 27, 2012, ASBJ issued ASBJ Statement No. 26 “Accounting Standard for Retirement Benefits” and ASBJ Guidance No. 25 “Guidance on Accounting Standard for Retirement Benefits.” The Group applied the revised accounting standard from the beginning of the annual period beginning on April 1, 2013.(a) Under the revised accounting standard, actuarial gains and losses and
past service costs that are yet to be recognized in profit or loss are recognized within equity (accumulated other comprehensive income) after adjusting for tax effects, and any resulting deficit or surplus is recognized as a liability or asset.
(b) Net unrecognized actuarial gain or loss is credited or charged to income in the year following the year in which the gain or loss was incurred.
(c) The defined benefit obligations are attributed to periods on a benefit formula basis.
The Company early applied the revised accounting standard and guidance for retirement benefits for (a), (b) and (c) above effective April 1, 2013, and changed the method of attributing expected benefit to periods from a straight-line basis to a benefit formula basis. The Company recorded the effect of (a) and (b) above as of April 1, 2013, in accumulated other comprehensive income, and the effect of (c) above as of April 1, 2013, in retained earnings.
As a result, liability for retirement benefits of ¥9,037 million ($87,806 thousand) was recorded as of April 1, 2013. Also, accumulated other comprehensive income increased by ¥256 million ($2,487 thousand) and retained earnings decreased by ¥2,095 million ($20,356 thousand). The effect of these changes on consolidated operating income, income before income taxes and minority interests, and per share information for the year ended March 31, 2014 was immaterial.
03CHANGES IN METHOD OF ACCOUNTING AND DISClOSURES

38
A reconciliation of cash and deposits in the consolidated balance sheet and cash and cash equivalents in the consolidated statement of cash flows at March 31, 2014 and 2013 is as follows:
Millions of yen
Thousands of U.S. dollars
2014 2013 2014
Cash and deposits ¥79,923 ¥64,351 $776,555
Time deposits with maturities exceeding three months (2,969) (3,575) (28,848)
Marketable securities redeemable within three months 3,247 3,239 31,549
Cash and cash equivalents ¥80,201 ¥64,015 $779,256
04CASH AND CASH EQUIVAlENTS
The Group holds financial instruments according to its policy. Investments comprise low-risk financial assets and borrowings that are financed by banks. The Group is exposed to financial risks such as credit risk on trade receivables, foreign currency risk on trade payables, market risk on securities and interest rate risk on long-term debt. The Group manages these risks and executes derivatives in accordance with policies established and approved at a management meeting of the Company, and no derivatives are used for trading or speculative purposes.
05FINANCIAl INSTRUMENTS AND RElATED DISClOSURES
(a) Fair value of financial instruments as of March 31, 2014 and 2013 is summarized as follows:
Millions of yen
March 31, 2014 Book value Fair valueUnrealized gain (loss)
Cash and deposits ¥ 79,923 ¥ 79,923 ¥ —
Trade receivables 51,299 51,299 —
Marketable securities and investments 104,218 118,066 13,848
Total ¥235,440 ¥249,288 ¥13,848
Trade payables ¥ 43,461 ¥ 43,461 ¥ —
Short-term borrowings 3,332 3,332 —
Other payables 32,047 32,047 —
Accrued income taxes 7,307 7,307 —
Long-term debt 9,974 10,016 42
Total ¥ 96,121 ¥ 96,163 ¥ 42
Derivative transactions which do not qualify for hedge accounting ¥ — ¥ — ¥ —
Derivative transactions which qualify for hedge accounting 58 58 —
Total ¥ 58 ¥ 58 ¥ —
Thousands of U.S. dollars
March 31, 2014 Book value Fair valueUnrealized gain (loss)
Cash and deposits $ 776,555 $ 776,555 $ —
Trade receivables 498,436 498,436 —
Marketable securities and investments 1,012,611 1,147,162 134,551
Total $2,287,602 $2,422,153 $134,551
Trade payables $ 422,279 $ 422,279 $ —
Short-term borrowings 32,375 32,375 —
Other payables 311,378 311,378 —
Accrued income taxes 70,997 70,997 —
Long-term debt 96,910 97,318 408
Total $ 933,939 $ 934,347 $ 408
Derivative transactions which do not qualify for hedge accounting $ — $ — $ —
Derivative transactions which qualify for hedge accounting 564 564 —
Total $ 564 $ 564 $ —

39
Millions of yen
March 31, 2013 Book value Fair valueUnrealized gain (loss)
Cash and deposits ¥ 64,351 ¥ 64,351 ¥ —
Trade receivables 47,073 47,073 —
Marketable securities and investments 101,640 117,468 15,828
Total ¥213,064 ¥228,892 ¥15,828
Trade payables ¥ 43,653 ¥ 43,653 ¥ —
Short-term borrowings 1,342 1,342 —
Other payables 28,100 28,100 —
Accrued income taxes 7,143 7,143 —
Long-term debt 7,841 7,894 53
Total ¥ 88,079 ¥ 88,132 ¥ 53
Derivative transactions which do not qualify for hedge accounting ¥ — ¥ — ¥ —
Derivative transactions which qualify for hedge accounting — — —
Total ¥ — ¥ — ¥ —
Notes: 1. Fair value of deposits, trade receivables and payables, short-term borrowings, accrued income taxes and
other payables approximates the book value because of their short-term clearing.2. Fair value of marketable securities and investments is quoted from market or financial institutions.3. Fair value of long-term debt is calculated with assumed discount rate.4. Fair value of derivatives is quoted from financial institutions and stated as net of assets and liabilities.
(b) Maturity analysis for financial assets and securities with contractual maturities as of March 31, 2014 and 2013 is summarized as follows:
Millions of yen
March 31, 2014Due within
one year
Due after one year through
five years
Due after five years
through ten years
Due after ten years
Cash and deposits ¥ 79,923 ¥ — ¥ — ¥ —
Trade receivables 51,299 — — —
Securities with maturity dates classified as available-for-sale
securities:
I. Bonds
National government — — — —
Corporate 8,326 6,587 1,203 —
Other — — — —
II. Other 3,400 832 — —
Total ¥142,948 ¥7,419 ¥1,203 ¥ —
Thousands of U.S. dollars
March 31, 2014Due within
one year
Due after one year through
five years
Due after five years
through ten years
Due after ten years
Cash and deposits $ 776,555 $ — $ — $ —
Trade receivables 498,436 — — —
Securities with maturity dates classified as available-for-sale securities:
I. Bonds
National government — — — —
Corporate 80,898 64,001 11,689 —
Other — — — —
II. Other 33,035 8,084 — —
Total $1,388,924 $72,085 $11,689 $ —
Millions of yen
March 31, 2013Due within
one year
Due after one year through
five years
Due after five years
through ten years
Due after ten years
Cash and deposits ¥ 64,351 ¥ — ¥ — ¥ —
Trade receivables 47,073 — — —
Securities with maturity dates classified as available-for-sale
securities:
I. Bonds
National government — — — —
Corporate 2,192 6,697 10,058 1,005
Other 482 — — —
II. Other 3,391 660 — —
Total ¥117,489 ¥7,357 ¥10,058 ¥1,005

40
(c) Carrying value of financial assets whose fair value cannot be reliably estimated at March 31, 2014 and 2013 is summarized as follows:
Millions of yenThousands of U.S. dollars
March 31, 2014 2013 2014
Available-for-sale securities
Investments in unconsolidated subsidiaries and associates ¥36,514 ¥ 36,801 $354,780
Unlisted equity securities 697 6,703 6,772
Preferred equity securities 7,000 7,000 68,014
Investment in anonymous partnership — — —
Other ¥ 9,263 ¥10,084 $ 90,002
06SECURITIES
(a) Information regarding marketable securities classified as available-for-sale securities at March 31, 2014 and 2013 is summarized as follows:
Millions of yen
March 31, 2014Acquisition
costCarrying
valueUnrealized gain (loss)
Securities whose carrying value exceeds their acquisition cost:
I. Equity securities ¥34,986 ¥63,109 ¥28,123
II. Bonds
National government — — —
Corporate 14,005 14,060 55
Other — — —
III. Other 2,987 3,305 318
Subtotal ¥51,978 ¥80,474 ¥28,496
Securities whose carrying value does not exceed their acquisition cost:
I. Equity securities ¥ 6,945 ¥ 6,144 ¥ (801)
II. Bonds
National government — — —
Corporate 5,106 5,068 (38)
Other — — —
III. Other 3,405 3,399 (6)
Subtotal ¥15,456 ¥14,611 ¥ (845)
Total ¥67,434 ¥95,085 ¥27,651
Thousands of U.S. dollars
March 31, 2014Acquisition
costCarrying
valueUnrealized gain (loss)
Securities whose carrying value exceeds their acquisition cost:
I. Equity securities $339,934 $613,185 $273,251
II. Bonds
National government — — —
Corporate 136,077 136,611 534
Other — — —
III. Other 29,022 32,112 3,090
Subtotal $505,033 $781,908 $276,875
Securities whose carrying value does not exceed their acquisition cost:
I. Equity securities $ 67,480 $ 59,697 $ (7,783)
II. Bonds
National government — — —
Corporate 49,611 49,242 (369)
Other — — —
III. Other 33,084 33,026 (58)
Subtotal $150,175 $141,965 $ (8,210)
Total $655,208 $923,873 $268,665

41
Millions of yen
March 31, 2013Acquisition
costCarrying
valueUnrealized gain (loss)
Securities whose carrying value exceeds their acquisition cost:
I. Equity securities ¥23,402 ¥46,215 ¥22,813
II. Bonds
National government — — —
Corporate 17,613 17,799 186
Other 433 482 49
III. Other 4,622 5,131 509
Subtotal ¥46,070 ¥69,627 ¥23,557
Securities whose carrying value does not exceed their acquisition cost:
I. Equity securities ¥19,188 ¥16,673 ¥ (2,515)
II. Bonds
National government — — —
Corporate 7,307 7,213 (94)
Other — — —
III. Other 252 252 —
Subtotal ¥26,747 ¥24,138 ¥ (2,609)
Total ¥72,817 ¥93,765 ¥20,948
(b) Sales of investments in securities classified as available-for-sale securities for the years ended March 31, 2014 and 2013 are summarized as follows:
Millions of yenThousands of U.S. dollars
March 31, 2014 2013 2014
Proceeds from sales ¥6,453 ¥1,748 $62,669
Aggregate gain 2,981 419 28,964
Aggregate loss — — —
Inventories as of March 31, 2014 and 2013 are summarized as follows:
Millions of yenThousands of U.S. dollars
2014 2013 2014
Merchandise and finished goods ¥10,033 ¥10,022 $ 97,484
Raw materials and supplies 10,926 9,329 106,160
Total ¥20,959 ¥19,351 $203,644
08INVENTORIES
07INVESTMENT PROPERTIES
The Group owns investment property such as buildings and land for rent in Tokyo and other areas. Net operating income from these properties was ¥444 million (US$4,314 thousand) and ¥494 million for the years ended March 31, 2014 and 2013 respectively. The details of investment properties are as follows:
2014 Millions of yenThousands of U.S. dollars
Net book value at March 31, 2013 ¥ 5,832 $ 56,665
Net change for the year ended March 31, 2014 ¥ 989 $ 9,610
Net book value at March 31, 2014 ¥ 6,821 $ 66,275
Fair value at March 31, 2014 ¥10,562 $102,623
2013 Millions of yen
Net book value at March 31, 2012 ¥5,891
Net change for the year ended March 31, 2013 ¥ (59)
Net book value at March 31, 2013 ¥5,832
Fair value at March 31, 2013 ¥9,657
Notes:1. Net book value represents net of accumulated depreciation.2. Increase during the fiscal years ended March 31, 2014 and 2013 mainly consisted of acquisition of land
and improvement of buildings.3. Fair value is mainly calculated by the Company, based on the internal real estate appraisal standard.

42
The Group recognized losses on impairment of fixed assets for the years ended March 31, 2014 and 2013 as follows:
Location Usage Asset type
(March 31, 2014)
Yokohama City, Kanagawa Prefecture Idle assets Land, buildings, and other assets
Ritto City, Shiga Prefecture and other locations Idle assetsBuildings, structures, machinery and equipment, and other assets
India Business assets
Buildings, machinery and equipment, and other assets
(March 31, 2013)
Shimonoseki City, Yamaguchi Prefecture and other locations Idle assets
Buildings, machinery and equipment, and other assets
Shinjuku Ward, Tokyo Idle assets Software in progress
The Group’s business assets are grouped according to manufacturing unit or usage, and the Group’s idle assets are grouped on an individual asset basis. Consequently, the Group has written down the carrying value of idle land whose fair value has declined to its net selling value based on an appraisal value determined by specialists. Also, the Group has written down the carrying value of other idle fixed assets and business assets whose fair value has declined to their respective memorandum value. As a result, the Group recorded loss on impairment of fixed assets of ¥1,999 million (US$19,423 thousand) in the accompanying consolidated statement of income for the year ended March 31, 2014. The impairment loss for the year ended March 31, 2014 consisted of losses on buildings and structures of ¥526 million (US$5,111 thousand), losses on machinery and equipment of ¥931 million (US$9,046 thousand), losses on land of ¥496 million (US$4,819 thousand) and losses on other fixed assets of ¥46 million (US$447 thousand). Loss on impairment of fixed assets recognized for the year ended March 31, 2013 was ¥1,275 million. This impairment loss consisted of losses on buildings and structures of ¥53 million, losses on machinery and equipment of ¥477 million, losses on software in progress of ¥744 million, and losses on other fixed assets of ¥1 million.
09lOSS ON IMPAIRMENT OF FIxED ASSETS
10lOSS ON REVAlUATION OF INVESTMENTS IN SECURITIES, UNCONSOlIDATED SUBSIDIARIES AND ASSOCIATES, AND OTHER
During the year ended March 31, 2014, the Company has recorded the loss on revaluation of investments in Jinmailang Food Co., Ltd.
11PROPERTY, PlANT AND EQUIPMENT
Under certain conditions such as exchanges of fixed assets of similar kinds and sales and purchases resulting from expropriation, Japanese tax laws permit companies to defer the profit arising from such transactions by reducing the cost of the assets acquired or by providing a special reserve in the equity section. The deferred gain on property, plant and equipment taxable for tax purposes in the future was ¥1,024 million (US$9,949 thousand) and ¥1,186 million as of March 31, 2014 and 2013, respectively.
12lAND REVAlUATION RESERVE
Based on the Land Revaluation Law and the Amended Land Revaluation Law, the Company revalued the land it holds for use in the course of ongoing operations at March 31, 2002. The resulting land revaluation difference represents an unrealized devaluation of land and has been debited directly, net of income taxes, under “Land revaluation reserve” in equity. The market value of the land as of March 31, 2014 and 2013 declined by ¥7,270 million (US$70,637 thousand) and ¥7,812 million, respectively, compared with the carrying value of the land revalued as of March 31, 2002 except for a part that was impaired after the revaluation.

43
The aggregate annual maturities of long-term debt subsequent to March 31, 2013 are summarized as follows:
Years ending March 31, Millions of yen
2014 ¥ 5,655
2015 1,128
2016 915
2017 1,116
2018 448
2019 and thereafter 4,234
¥13,496
13SHORT-TERM BORROWINGS AND lONG-TERM DEBT
Short-term borrowings, which amounted to ¥3,332 million (US$32,375 thousand) and ¥1,342 million as of March 31, 2014 and 2013, respectively, generally represent notes payable to banks. Long-term debt (excluding the current portion thereof) amounted to ¥9,974 million (US$96,910 thousand) and ¥7,841 million as of March 31, 2014 and 2013, respectively. The average interest rates on short-term borrowings were 2.41% and 0.73% at March 31, 2014 and 2013, respectively. The average interest rates on long-term borrowings at March 31, 2014 and 2013 were 1.10% and 1.20%, respectively.
Long-term debt at March 31, 2014 is as follows:
Millions of yenThousands of U.S. dollars
Long-term borrowings at interest rates ranging from 0.18% to 8.55% ¥11,286 $109,658
Lease obligations 665 6,461
¥11,951 $116,119
Current portion of long-term debt (1,977) (19,209)
¥ 9,974 $ 96,910
The aggregate annual maturities of long-term debt subsequent to March 31, 2014 are summarized as follows:
Years ending March 31, Millions of yenThousands of U.S. dollars
2015 ¥ 1,977 $ 19,209
2016 1,862 18,092
2017 2,054 19,957
2018 1,930 18,752
2019 3,272 31,792
2020 and thereafter 856 8,317
¥11,951 $116,119
Long-term debt at March 31, 2013 is as follows:
Millions of yen
Long-term borrowings at interest rates ranging from 1.01% to 1.90% ¥13,171
Lease obligations 325
¥13,496
Current portion of long-term debt (5,655)
¥ 7,841
A subsidiary of the Company entered into a syndicated loan agreement with three financial institutions for which Mizuho Bank, Ltd. is the arranger. The debt amounting to ¥4,100 million ($39,837 thousand) and ¥3,600 million as of March 31, 2014 and 2013, respectively, includes the following non-consolidated financial covenants.
As of March 31, 2014
1. The amount of equity on the balance sheet is required to be equal to or larger than 75% of equity on the balance sheet as of March 31, 2013 or as of the previous fiscal year, whichever is larger.
2. Ordinary loss for two consecutive years is not allowed.
As of March 31, 2013
1. The amount of equity on the balance sheet is required to be equal to or larger than 75% of equity on the balance sheet as of September 30, 2008 or as of the previous fiscal year, whichever is larger.
2. Ordinary loss for two consecutive years is not allowed.
14FINANCIAl COVENANTS
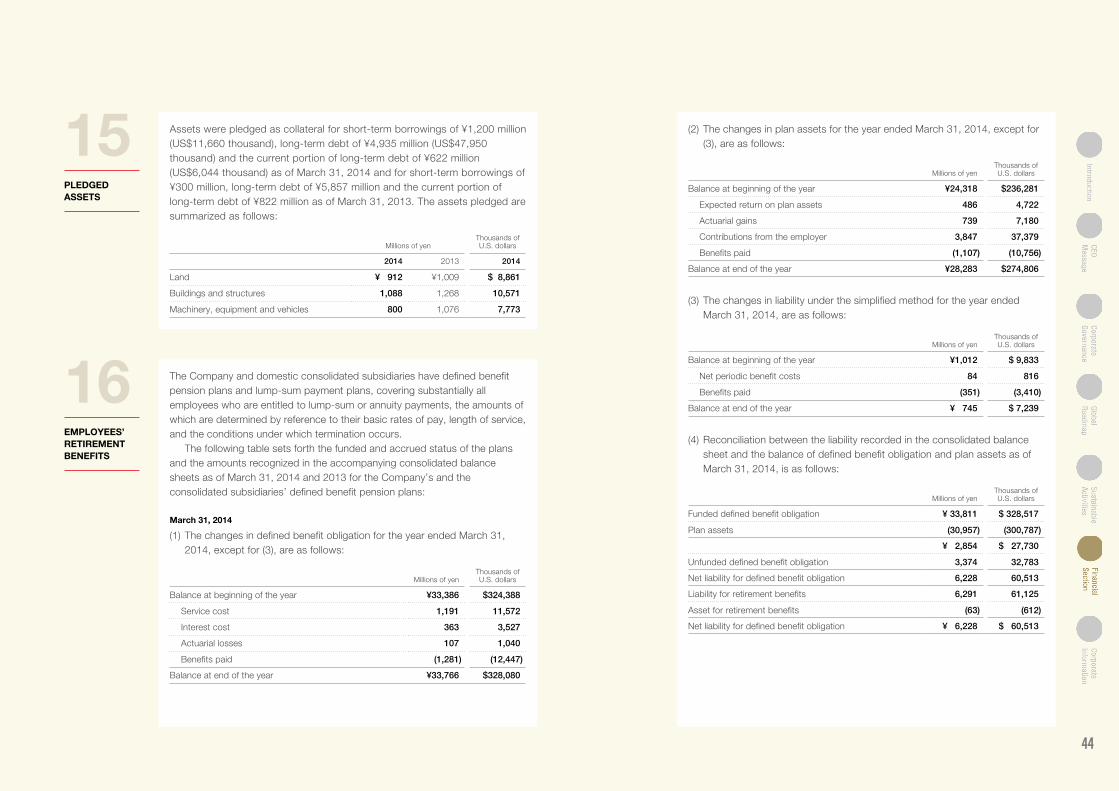
44
15PlEDGED ASSETS
Assets were pledged as collateral for short-term borrowings of ¥1,200 million (US$11,660 thousand), long-term debt of ¥4,935 million (US$47,950 thousand) and the current portion of long-term debt of ¥622 million (US$6,044 thousand) as of March 31, 2014 and for short-term borrowings of ¥300 million, long-term debt of ¥5,857 million and the current portion of long-term debt of ¥822 million as of March 31, 2013. The assets pledged are summarized as follows:
Millions of yenThousands of U.S. dollars
2014 2013 2014
Land ¥ 912 ¥1,009 $ 8,861
Buildings and structures 1,088 1,268 10,571
Machinery, equipment and vehicles 800 1,076 7,773
16EMPlOYEES’ RETIREMENT BENEFITS
The Company and domestic consolidated subsidiaries have defined benefit pension plans and lump-sum payment plans, covering substantially all employees who are entitled to lump-sum or annuity payments, the amounts of which are determined by reference to their basic rates of pay, length of service, and the conditions under which termination occurs. The following table sets forth the funded and accrued status of the plans and the amounts recognized in the accompanying consolidated balance sheets as of March 31, 2014 and 2013 for the Company’s and the consolidated subsidiaries’ defined benefit pension plans:
March 31, 2014
(1) The changes in defined benefit obligation for the year ended March 31, 2014, except for (3), are as follows:
Millions of yenThousands of U.S. dollars
Balance at beginning of the year ¥33,386 $324,388
Service cost 1,191 11,572
Interest cost 363 3,527
Actuarial losses 107 1,040
Benefits paid (1,281) (12,447)
Balance at end of the year ¥33,766 $328,080
(2) The changes in plan assets for the year ended March 31, 2014, except for (3), are as follows:
Millions of yenThousands of U.S. dollars
Balance at beginning of the year ¥24,318 $236,281
Expected return on plan assets 486 4,722
Actuarial gains 739 7,180
Contributions from the employer 3,847 37,379
Benefits paid (1,107) (10,756)
Balance at end of the year ¥28,283 $274,806
(3) The changes in liability under the simplified method for the year ended March 31, 2014, are as follows:
Millions of yenThousands of U.S. dollars
Balance at beginning of the year ¥1,012 $ 9,833
Net periodic benefit costs 84 816
Benefits paid (351) (3,410)
Balance at end of the year ¥ 745 $ 7,239
(4) Reconciliation between the liability recorded in the consolidated balance sheet and the balance of defined benefit obligation and plan assets as of March 31, 2014, is as follows:
Millions of yenThousands of U.S. dollars
Funded defined benefit obligation ¥ 33,811 $ 328,517
Plan assets (30,957) (300,787)
¥ 2,854 $ 27,730
Unfunded defined benefit obligation 3,374 32,783
Net liability for defined benefit obligation 6,228 60,513
Liability for retirement benefits 6,291 61,125
Asset for retirement benefits (63) (612)
Net liability for defined benefit obligation ¥ 6,228 $ 60,513

45
(5) The components of periodic benefit costs for the year ended March 31, 2014, are as follows:
Millions of yenThousands of U.S. dollars
Service cost ¥1,190 $11,563
Interest cost 363 3,527
Expected return on plan assets (486) (4,722)
Recognized actuarial (gains) losses (395) (3,838)
Net periodic pension cost calculated by a simplified method 84 816
Net periodic benefit costs ¥ 756 $ 7,346
(6) The components of other comprehensive income on defined retirement benefit plans, before tax, are as follows:
Millions of yenThousands of U.S. dollars
Actuarial (gains) losses ¥(395) $(3,838)
Total ¥(395) $(3,838)
(7) Accumulated other comprehensive income on defined retirement benefit plans, before tax, is as follows:
Millions of yenThousands of U.S. dollars
Unrecognized actuarial (gains) losses ¥(633) $(6,150)
Total ¥(633) $(6,150)
(8) Plan assets(a) Components of plan assets are as follows:
Debt investments 53%
Equity investments 16%
General accounts with life insurance companies 18%
Other 13%
Total 100%
(b) Method for determining the expected rate of return on plan assets:The expected rate of return on plan assets is determined considering the long-term rates of return which are expected currently and in the future from the various components of the plan assets.
(9) The assumptions used for the year ended March 31, 2014 were as follows:
Discount rate Principally 1.1%
Expected rate of return on plan assets Principally 2.0%
March 31, 2013
Millions of yen
2013
(a) Retirement benefit obligation (Note 2) ¥(33,673)
(b) Plan assets at fair value 26,572
(c) Unfunded retirement benefit obligation (a+b) ¥ (7,101)
(d) Unrecognized actuarial loss (gain) (395)
(e) Liability for retirement benefits (c+d) ¥ (7,496)
Note: Certain domestic consolidated subsidiaries apply a simplified method to calculate retirement benefit obligation.
The components of retirement benefit costs for the year ended March 31, 2013 were as follows:
Millions of yen
2013
(a) Service cost (Notes 1 and 2) ¥ 982
(b) Interest cost 725
(c) Expected return on pension assets (524)
(d) Amortization of actuarial loss (gain) 587
(e) Amortization of past service cost —
(f) Total net periodic pension cost (a+b+c+d+e) ¥1,770
(g) Gain on transfer of substitutional portion of employees’ pension fund —
(h) Total (f+g) ¥1,770
Notes:1. Employee’s contributions to defined benefit pension plans have been excluded.2. The components of retirement benefit costs of certain domestic consolidated subsidiaries, which have
been calculated by a simplified method, are included in service cost in the above table.
The assumptions used in accounting for the above plans for the year ended March 31, 2013 were as follows:
Discount rate Principally 1.9%
Expected rate of return on plan assets Principally 2.5%

46
17INCOME TAxES
Income taxes applicable to the Company and its domestic consolidated subsidiaries comprise corporate taxes, inhabitants’ taxes and enterprise taxes which, in the aggregate, resulted in a statutory tax rate of 37.68% for the years ended March 31, 2014 and 2013. Overseas consolidated subsidiaries are subject to the income taxes of the respective countries in which they operate. The difference between the Company’s statutory tax rate and the effective tax rate for the year ended March 31, 2014 is not disclosed as the difference is less than five percent of the statutory tax rate.
The effective tax rate for the year ended March 31, 2013 differs from the Company’s statutory tax rate for the following reasons:
2013
Statutory tax rate 37.68%
Entertainment expenses not deductible for income tax purposes 0.94
Loss on valuation of investments in securities (1.39)
Equity in earnings of associates (2.42)
Amortization of goodwill 1.33
Tax loss carryforwards recorded by consolidated subsidiaries (1.27)
Difference in consolidated subsidiaries' applicable tax rates (1.03)
Other 0.84
Effective tax rates 34.68%
The tax effects of temporary differences that gave rise to significant portions of the deferred tax assets and liabilities at March 31, 2014 and 2013 are presented below:
Millions of yenThousands of U.S. dollars
2014 2013 2014
Deferred tax assets:
Unrealized losses on securities ¥ 1,934 ¥ 2,111 $ 18,791
Liability for retirement benefits 2,434 2,636 23,649
Accounts payable 2,066 2,061 20,074
Loss on impairment of fixed assets 942 1,211 9,153
Accrued bonuses 1,291 1,310 12,544
Other long-term payables 1,161 1,079 11,281
Depreciation and amortization 721 757 7,005
Tax loss carryforwards of consolidated subsidiaries 9,167 7,547 89,069
Other 729 423 7,083
Gross deferred tax assets 20,445 19,135 198,649
Less: Valuation allowance (14,512) (13,163) (141,002)
Total deferred tax assets 5,933 5,972 57,647
Deferred tax liabilities:
Deferred capital gain on properties (1,731) (1,731) (16,819)
Unrealized gain (loss) on available-for-sale securities (9,381) (6,921) (91,148)
Revaluation gain recognized upon consolidation (3,156) (2,680) (30,665)
Other (847) (708) (8,230)
Total deferred tax liabilities (15,115) (12,040) (146,862)
Net deferred tax (liabilities) assets ¥ (9,182) ¥ (6,068) $ (89,215)
New tax reform laws enacted in 2014 in Japan changed the normal effective statutory tax rate for the fiscal year beginning on or after April 1, 2014, from approximately 37.68% to 35.31%. The effect of this change was to decrease deferred tax assets in the consolidated balance sheet as of March 31, 2014, by ¥298 million (US$2,895 thousand) and to increase deferred income taxes in the consolidated statement of income for the year then ended by the same amount.

47
The Companies Act of Japan (the “Companies Act”) provides that an amount equal to 10% of the amount to be disbursed as distributions of capital surplus (other than the capital reserve) and retained earnings (other than the legal reserve) be transferred to the capital reserve and the legal reserve, respectively, until the sum of the capital reserve and the legal reserve equals 25% of the capital stock account. Such distributions can be made at any time by resolution of the shareholders, or by the Board of Directors if certain conditions are met. The Company’s legal reserve included in retained earnings at March 31, 2014 and 2013 amounted to ¥6,280 million (US$61,018 thousand). Under the Companies Act, upon the issuance and sale of new shares of capital stock, the entire amount of the proceeds is required to be accounted for as capital stock, although a company may, by resolution of the Board of Directors, account for an amount not exceeding one-half of the proceeds of the sale of new shares as additional paid-in capital included in capital surplus.
Movements in issued common stock and treasury stock for the years ended March 31, 2014 and 2013 are summarized as follows:
Number of shares
2014
March 31, 2013 Increase Decrease March 31, 2014
Common stock and treasury stock:
Common stock 117,463,685 — — 117,463,685
Treasury stock 7,271,935 1,539 31,461 7,242,013
Number of shares
2013
March 31, 2012 Increase Decrease March 31, 2013
Common stock and treasury stock:
Common stock 117,463,685 — — 117,463,685
Treasury stock 7,291,193 987 20,245 7,271,935
18SHAREHOlDERS’ EQUITY
Dividend payments on common stock approved during the years ended March 31, 2014 and 2013 are as follows:
Millions of yen(Thousands of
U.S. dollars)Yen
(U.S. dollars)
2014
Total amount of dividend
Dividend per share
Record date
Effective date
Approved by:
General meeting of shareholders held on June 26, 2013
¥3,857($37,476)
¥35($0.34)
March 31, 2013
June 27, 2013
Board of Directors meeting held on October 31, 2013
¥4,409($42,839)
¥40($0.39)
September 30, 2013
November 26, 2013
Millions of yen Yen
2013
Total amount of dividend
Dividend per share
Record date
Effective date
Approved by:
General meeting of shareholders held on June 28, 2012
¥3,856 ¥35 March 31, 2012
June 29, 2012
Board of Directors meeting held on November 7, 2012
¥4,408 ¥40 September 30, 2012
November 27, 2012
19RESEARCH AND DEVElOPMENT COSTS
Costs relating to research and development activities are charged to income as incurred. Research and development costs included in cost of sales and selling, general and administrative expenses totaled ¥5,313 million (US$51,623 thousand) and ¥4,321 million for the years ended March 31, 2014 and 2013, respectively.

48
(a) Finance leasesLeased assets presented in the accompanying consolidated balance sheet as of March 31, 2014 consisted of those under finance lease contracts that do not transfer ownership to the lessee and that were entered into on or after April 1, 2008, principally for vending machines for the instant noodle business. The following pro-forma amounts represent the acquisition cost, accumulated depreciation/amortization and net book value of the property leased to the Group at March 31, 2013, which would have been reflected in the accompanying consolidated balance sheets if finance leases, without transferring the ownership to the lessee starting on or before March 31, 2008 which are currently accounted for as operating leases, had been capitalized:
Millions of yen
2013Acquisition
cost
Accumulated depreciation/amortization
Net book value
Machinery and vehicles ¥167 ¥162 ¥5
Equipment 46 44 2
Intangible fixed assets and other — — 0
Total ¥213 ¥206 ¥7
Note: There were no finance lease properties which are accounted for as operating lease as at March 31, 2014.
Lease payments relating to finance leases accounted for as operating leases in the accompanying consolidated financial statements amounted to ¥7 million (US$68 thousand) and ¥47 million, which were approximately equal to the depreciation of the leased assets computed by the straight-line method over the respective lease terms assuming a nil residual value for the years ended March 31, 2014 and 2013, respectively.
(b) Operating leasesThe Group has lease commitments under non-cancelable operating leases as follows:
Millions of yenThousands of U.S. dollars
2014 2013 2014
As a lessor
Due within one year ¥ 34 ¥ 34 $ 330
Due over one year 1,532 1,565 14,885
Total ¥1,566 ¥1,599 $15,215
20lEASES
As described in Note 2 (e), the Group utilizes derivatives to hedge the risk of fluctuations in foreign exchange rate and interest rate on certain liabilities. Contract amounts of outstanding derivative positions accounted for by hedge accounting as of March 31, 2014 are ¥302 million (US$2,934 thousand) for interest rate swaps and ¥4,049 million (US$39,341 thousand) for forward foreign exchange contracts. There was no outstanding balance of derivative contracts which does not qualify for hedge accounting at March 31, 2014 and 2013. Disclosure of fair value information on derivatives of interest rate swaps has been omitted, because contracts of interest rate swaps are treated as part of the hedged long-term debt, thus their fair values are integrally computed with those of the hedged long-term debt. Fair value of forward foreign exchange contracts is ¥59 million (US$573 thousand), which is measured at the quoted price obtained from the financial institution.
21DERIVATIVE FINANCIAl INSTRUMENTS
Amounts per share at March 31, 2014 and 2013 for the years then ended were as follows:
Yen U.S. dollars
2014 2013 2014
Equity ¥3,018.82 ¥2,782.25 $29.33
Cash dividends applicable to the year 75.00 75.00 0.73
2014 2013
Net income(Millions of yen)
Weighted- average
number of shares
(Thousands of shares)
Per share(Yen)
Per share(U.S. dollars)
Per share(Yen)
Net income—basic ¥19,269 110,216 ¥174.83 $1.70 ¥171.12
Stock options — 441 — — —
Net income—diluted ¥19,269 110,657 ¥174.13 $1.69 ¥170.57
The amounts per share of equity have been computed based on the number of shares of common stock outstanding at the year-end. Basic net income per share has been computed based on the net income available for distribution to shareholders of common stock and the weighted-average number of shares of common stock outstanding during the year. Cash dividends per share represent the cash dividends proposed by the Board of Directors as applicable to the respective fiscal years together with the interim cash dividends paid.
22AMOUNTS PER SHARE

49
Stock options as of March 31, 2014 are as follows:
Number of shares for options
Yen (U.S. dollars)
Millions of yen(Thousands of U.S. dollars)
No.Date of grant
Personsgranted
Granted and vested Exercised Canceled
Fair value at grant date
Average stock price at exercise Book value
2 June 26, 2009 12 Directors 74,300 17,100 — ¥2,325 ($23) ¥3,880 ($38) ¥133 ($1,292)
3 June 26, 2009 9 Executive Officers and Employees 3,155 579 — ¥2,677 ($26) ¥4,100 ($40) ¥ 7 ($ 68)
4 June 26, 2009 32 Directors of subsidiaries 11,284 4,957 — ¥2,677 ($26) ¥4,112 ($40) ¥ 17 ($ 165)
6 June 29, 2010 11 Directors 73,200 14,900 — ¥2.616 ($25) ¥3,880 ($38) ¥153 ($1,487)
7 June 29, 2010 10 Executive Officers and Employees 5,710 763 — ¥3,003 ($29) ¥4,100 ($40) ¥ 15 ($ 146)
8 June 29, 2010 31 Directors of subsidiaries 21,329 6,769 — ¥3,003 ($29) ¥4,113 ($40) ¥ 44 ($ 428)
9 June 29, 2011 8 Directors 73,200 6,300 — ¥2,141 ($21) ¥3,880 ($38) ¥143 ($1,389)
10 June 29, 2011 13 Executive Officers 11,049 1,894 — ¥2,614 ($25) ¥4,100 ($40) ¥ 24 ($ 233)
11 June 29, 2011 35 Directors of subsidiaries 22,677 5,226 — ¥2,614 ($25) ¥4,136 ($40) ¥ 46 ($ 447)
13 June 28, 2012 8 Directors 85,900 7,500 — ¥2,244 ($22) ¥3,880 ($38) ¥176 ($1,710)
14 June 28, 2012 10 Executive Officers 8,666 702 — ¥2,709 ($26) ¥4,100 ($40) ¥ 22 ($ 214)
15 June 28, 2012 36 Directors of subsidiaries 26,477 4,144 — ¥2,709 ($26) ¥4,198 ($41) ¥ 61 ($ 593)
16 April 1, 2013 1 Director of subsidiary 343 343 — ¥4,184 ($41) ¥4,135 ($40) —
17 June 26, 2013 7 Directors 80,000 4,300 — ¥3,003 ($29) ¥3,880 ($38) ¥227 ($2,206)
18 June 26, 2013 12 Executive Officers 7,990 508 — ¥3,461 ($34) ¥4,100 ($40) ¥ 26 ($ 253)
19 June 26, 2013 36 Directors of subsidiaries 26,914 1,378 — ¥3,461 ($34) ¥4,352 ($42) ¥ 88 ($ 855)
20 January 6, 2014 3 Directors of subsidiaries 579 579 — ¥4,439 ($43) ¥4,405 ($43) —
Notes:1. All stock options granted were vested.2. The exercise period is 40 years from the grant date of each option.3. The exercise price is ¥1 for each option.
23STOCK OPTIONS

50
Stock options as of March 31, 2013 are as follows:
Number of shares for options Yen Millions of yen
No.Date of grant
Personsgranted
Granted and vested Exercised Canceled
Fair value at grant date
Average stock price at exercise Book value
2 June 26, 2009 12 Directors 74,300 13,400 — ¥2,325 ¥3,035 ¥142
3 June 26, 2009 9 Executive Officers and Employees 3,155 210 — ¥2,677 — ¥ 8
4 June 26, 2009 32 Directors of subsidiaries 11,284 4,042 — ¥2,677 ¥3,035 ¥ 19
6 June 29, 2010 11 Directors 73,200 11,200 — ¥2,616 ¥3,035 ¥162
7 June 29, 2010 10 Executive Officers and Employees 5,710 121 — ¥3,003 — ¥ 17
8 June 29, 2010 31 Directors of subsidiaries 21,329 5,117 — ¥3,003 ¥3,035 ¥ 49
9 June 29, 2011 8 Directors 73,200 2,700 — ¥2,141 ¥3,035 ¥151
10 June 29, 2011 13 Executive Officers 11,049 1,275 — ¥2,614 ¥3,070 ¥ 26
11 June 29, 2011 35 Directors of subsidiaries 22,677 3,575 — ¥2,614 ¥3,035 ¥ 50
12 April 2, 2012 1 Executive Officer 1,044 1,044 — ¥3,069 ¥3,070 —
13 June 28, 2012 8 Directors 85,900 3,100 — ¥2,244 ¥3,035 ¥186
14 June 28, 2012 10 Executive Officers 8,666 — — ¥2,709 — ¥ 23
15 June 28, 2012 36 Directors of subsidiaries 26,477 1,751 — ¥2,709 ¥3,035 ¥ 67
Notes:1. All stock options granted were vested.2. The exercise period is 40 years from the grant date of each option.3. The exercise price is ¥1 for each option.
The fair value of options granted as of the grant date was estimated using the Black-Scholes option-pricing model based on the following assumptions:
No. 16 No. 17 No. 18 No. 19 No. 20
Volatility of stock price 70.19% 21.36% 16.56% 16.56% 2.52%
Estimated remaining outstanding period 2 days 11.6 years 4.3 years 4.3 years 2 days
Estimated dividend ¥75 per share ¥75 per share ¥75 per share ¥75 per share ¥75 per share
Risk-free interest rate 0.07% 0.99% 0.28% 0.28% 0.10%

51
Other comprehensive income for the years ended March 31, 2014 and 2013 is as follows.
Millions of yenThousands of U.S. dollars
2014 2013 2014
Unrealized gain (loss) on available-for-sale securities
Gain (loss) arising during the year ¥10,902 ¥12,139 $105,927
Reclassification adjustments to profit or loss for the year (2,611) (419) (25,369)
Amount before income tax effect 8,291 11,720 80,558
Income tax effect (3,033) (3,795) (29,470)
Total ¥ 5,258 ¥ 7,925 $ 51,088
Deferred gains or losses on hedges
Gain (loss) arising during the year ¥ 59 ¥ — $ 573
Reclassification adjustments to profit or loss for the year — — —
Amount before income tax effect 59 — 573
Income tax effect (21) — (204)
Total ¥ 38 ¥ — $ 369
Foreign currency translation adjustments
Gain (loss) arising during the year ¥ 8,637 ¥ 3,903 $ 83,920
Reclassification adjustments to profit or loss for the year — — —
Amount before income tax effect 8,637 3,903 83,920
Income tax effect — — —
Total ¥ 8,637 ¥ 3,903 $ 83,920
Share of other comprehensive income (loss) in associates
Gain (loss) arising during the year ¥ 4,035 ¥ 3,858 $ 39,205
Total ¥ 4,035 ¥ 3,858 $ 39,205
Net defined benefit liability
Gain (loss) arising during the year ¥ 633 ¥ — $ 6,150
Reclassification adjustments to profit or loss for the year (395) — (3,838)
Amount before income tax effect 238 — 2,312
Income tax effect (85) — (825)
Total ¥ 153 ¥ — $ 1,487
Total other comprehensive income (loss) ¥18,121 ¥15,686 $176,069
24OTHER COMPREHENSIVE INCOME

52
(b) Net sales, income or loss, assets and other items by reportable segmentMillions of yen
Year ended March 31, 2014Nissin Food
ProductsMyojo Foods
Chilled and frozen foods
The Americas China Subtotal Others Total
Recon-ciliations Consolidated
Net salesSales to third party ¥210,906 ¥39,562 ¥54,790 ¥32,220 ¥29,904 ¥367,382 ¥ 50,239 ¥417,621 ¥ — ¥417,621Intersegment sales 3,187 1,708 1,229 — 127 6,251 18,408 24,659 (24,659) —
Total 214,093 41,270 56,019 32,220 30,031 373,633 68,647 442,280 (24,659) 417,621Segment income (loss) 25,688 1,964 473 543 2,846 31,514 (576) 30,938 (3,233) 27,705Segment assets 140,085 50,654 29,594 15,927 38,770 275,030 114,843 389,873 89,597 479,470
Other itemsDepreciation and amortization 7,225 1,062 1,139 1,316 861 11,603 2,914 14,517 — 14,517Investments in associates — — — — — — 38,191 38,191 — 38,191Capital investment 7,432 5,540 1,752 716 1,634 17,074 10,787 27,861 (387) 27,474
Thousands of U.S. dollars
Year ended March 31, 2014Nissin Food
ProductsMyojo Foods
Chilled and frozen foods
The Americas China Subtotal Others Total
Recon- ciliations Consolidated
Net salesSales to third party $2,049,222 $384,396 $532,356 $313,059 $290,556 $3,569,589 $ 488,135 $4,057,724 $ — $4,057,724Intersegment sales 30,966 16,595 11,941 — 1,234 60,736 178,858 239,594 (239,594) —
Total 2,080,188 400,991 544,297 313,059 291,790 3,630,325 666,993 4,297,318 (239,594) 4,057,724Segment income (loss) 249,591 19,083 4,596 5,276 27,653 306,199 (5,597) 300,602 (31,412) 269,190Segment assets 1,361,106 492,169 287,544 154,751 376,700 2,672,270 1,115,847 3,788,117 870,550 4,658,667
Other itemsDepreciation and amortization 70,199 10,319 11,067 12,787 8,366 112,738 28,313 141,051 — 141,051Investments in associates — — — — — — 371,075 371,075 — 371,075Capital investment 72,212 53,828 17,023 6,957 15,876 165,896 104,809 270,705 (3,760) 266,945
Notes:1. “Others” consists of the operating segments not included in reportable segments. It includes domestic confectionery, beverages and food service business and overseas business in Europe and Asia. Aji-no-Mingei Co., Ltd. has been excluded from the scope of consolidation after the Company sold the shares to the third party.2. Operating loss under “Reconciliations” amounted to ¥3,233 million (US$31,412 thousand), consisting of ¥677 million (US$6,578 thousand) from retirement benefit expenses, minus ¥804 million (US$7,812 thousand) from the amortization of goodwill, minus ¥3,328
million (US$32,336 thousand) from group expenses and ¥222 million (US$2,157 thousand) from elimination of intersegment transactions.3. Segment income is reconciled to operating income of consolidated statements of income.4. Segment assets under “Reconciliations” include the asset which cannot be allocated to any particular segment amounting to ¥89,597 million (US$870,550 thousand). The amount mainly consists of ¥83,983 million (US$816,003 thousand) of surplus investment
(a) Overview of reportable segmentsThe Group’s reportable segments are those for which separate financial information is available and regular evaluation by the Board of Directors is being performed in order to decide how resources are allocated among the
Group. According to the operating unit strategy of the seven operating companies in Japan and four overseas business regions, the reportable segments consist of “Nissin Food Products,” “Myojo Foods,” “Chilled and frozen foods,” “The Americas” and “China.” The segments of “Nissin Food
Products,” “Myojo Foods,” “The Americas” and “China” are operating the business of manufacturing and selling Cup and bag-type noodles. The “Chilled and frozen foods” segment is operating the business of manufacturing and selling chilled and frozen foods.
25SEGMENT INFORMATION

53
funds, ¥1,832 million (US$17,800 thousand) of goodwill, and ¥3,781 million (US$36,737 thousand) of other investments.
Millions of yen
Year ended March 31, 2013Nissin Food
ProductsMyojo Foods
Chilled and frozen foods
The Americas China Subtotal Others Total
Recon-ciliations Consolidated
Net sales
Sales to third party ¥200,841 ¥39,336 ¥52,565 ¥25,917 ¥20,848 ¥339,507 ¥ 43,286 ¥382,793 ¥ — ¥382,793
Intersegment sales 191 1,137 553 — 96 1,977 16,526 18,503 (18,503) —
Total 201,032 40,473 53,118 25,917 20,944 341,484 59,812 401,296 (18,503) 382,793
Segment income (loss) 23,810 1,713 819 236 1,836 28,414 98 28,512 (4,558) 23,954
Segment assets 134,628 47,987 28,226 13,279 31,362 255,482 107,366 362,848 83,284 446,132
Other items
Depreciation and amortization 7,624 1,050 1,249 1,011 554 11,488 2,857 14,345 — 14,345
Investments in associates — — — — — — 33,317 33,317 — 33,317
Capital investment 11,141 1,320 1,284 883 2,820 17,448 4,161 21,609 (27) 21,582
Notes:1. “Others” consists of the operating segments not included in reportable segments. It includes domestic confectionery, beverages and food service business and overseas business in Europe and Asia.2. Operating loss under “Reconciliations” amounted to ¥4,558 million, consisting of minus ¥508 million from retirement benefit expenses, minus ¥1,044 million from the amortization of goodwill, minus ¥40 million from elimination of intersegment transactions and minus
¥3,046 million from group expenses.3. Segment income is reconciled to operating income of consolidated statement of income.4. Segment assets under “Reconciliations” include the asset which cannot be allocated to any particular segment amounting to ¥83,284 million. The amount mainly consists of ¥79,635 million of surplus investment funds, ¥2,620 million of goodwill, and ¥1,030 million
of other investments.
(c) Supplemental informationInformation by product or service group
Millions of yen (Thousands of U.S. dollars)
Year ended March 31, 2014Instant noodle and
associated businessOther
business Consolidated
Sales to third party ¥ 364,824($3,544,733)
¥ 52,797($512,991)
¥ 417,621($4,057,724)
Millions of yen
Year ended March 31, 2013Instant noodle and
associated businessOther
business Consolidated
Sales to third party ¥ 334,653 ¥ 48,140 ¥ 382,793
Notes:1. Classification of the businesses is based on product types and characteristics. 2. Major products of each business: (1) Instant noodle and associated business: bag-type instant noodles, cup-type instant noodles, chilled foods and frozen foods (2) Other business: confectioneries, beverages and the food service business

54
Geographical information
Millions of yen (Thousands of U.S. dollars)
Year ended March 31, 2014 Japan North America Other areas Consolidated
Sales to third party ¥ 343,142 ($3,334,065)
¥ 32,263 ($313,476)
¥ 42,216 ($410,183)
¥ 417,621 ($4,057,724)
Property, plant and equipment ¥ 120,612 ($1,171,901)
¥ 8,208 ($ 79,751)
¥ 18,800 ($182,666)
¥ 147,620 ($1,434,318)
Millions of yen
Year ended March 31, 2013 Japan North America Other areas Consolidated
Sales to third party ¥328,580 ¥25,971 ¥28,242 ¥382,793
Property, plant and equipment ¥116,078 ¥ 7,575 ¥10,135 ¥133,788
Note: Classification of the countries or regions is based on geographical proximity.
Information by major customer
Millions of yen(Thousands of U.S. dollars)
Year ended March 31, 2014 SalesMain reportable
segment
Mitsubishi Corporation ¥ 146,799 ($1,426,341)
Nissin Food Products
ITOCHU Corporation ¥ 105,160 ($1,021,764)
Nissin Food Products
Millions of yen
Year ended March 31, 2013 SalesMain reportable
segment
Mitsubishi Corporation ¥135,325 Nissin Food Products
ITOCHU Corporation ¥ 95,466 Nissin Food Products

55
Information on loss on impairment of fixed assets by reportable segment
Millions of yen(Thousands of U.S. dollars)
Year ended March 31, 2014Nissin Food
ProductsMyojo Foods
Chilled and frozen foods
The Americas China Others
Eliminations or corporate Consolidated
Loss on impairment of fixed assets ¥ 377 ($3,663)
¥ 353 ($3,430)
¥ — ($ —)
¥ — ($ —)
¥ 27 ($262)
¥ 1,242 ($12,068)
¥ — ($ —)
¥ 1,999 $19,423
Millions of yen
Year ended March 31, 2013Nissin Food
ProductsMyojo Foods
Chilled and frozen foods
The Americas China Others
Eliminations or corporate Consolidated
Loss on impairment of fixed assets ¥224 ¥62 ¥211 ¥ — ¥33 ¥745 ¥ — ¥1,275
Note: “Others” consists of the operating segments not included in reportable segments. It includes domestic confectionery, beverages and food service business and overseas business in Europe and Asia.
Information on goodwill by reportable segment
Millions of yen(Thousands of U.S. dollars)
Year ended March 31, 2014Nissin Food
ProductsMyojo Foods
Chilled and frozen foods
The Americas China Others
Eliminations or corporate Consolidated
Amortization of goodwill ¥ — ($ —)
¥ 398 ($3,867)
¥ 73 ($709)
¥ 45 ($ 437)
¥ — ($ —)
¥ 288 ($2,798)
¥ — ($ —)
¥ 804 ($ 7,811)
Balance of goodwill ¥ — ($ —)
¥1,009($9,804)
¥ —($ —)
¥ 136 ($1,321)
¥ — ($ —)
¥ 687($6,675)
¥ — ($ —)
¥ 1,832 ($17,800)
Millions of yen
Year ended March 31, 2013Nissin Food
ProductsMyojo Foods
Chilled and frozen foods
The Americas China Others
Eliminations or corporate Consolidated
Amortization of goodwill ¥ — ¥ 398 ¥147 ¥334 ¥ — ¥165 ¥ — ¥1,044
Balance of goodwill ¥ — ¥1,407 ¥ 73 ¥181 ¥ — ¥959 ¥ — ¥2,620
Note: “Others” consists of the operating segments not included in reportable segments. It includes domestic confectionery, beverages and food service business and overseas business in Europe and Asia.
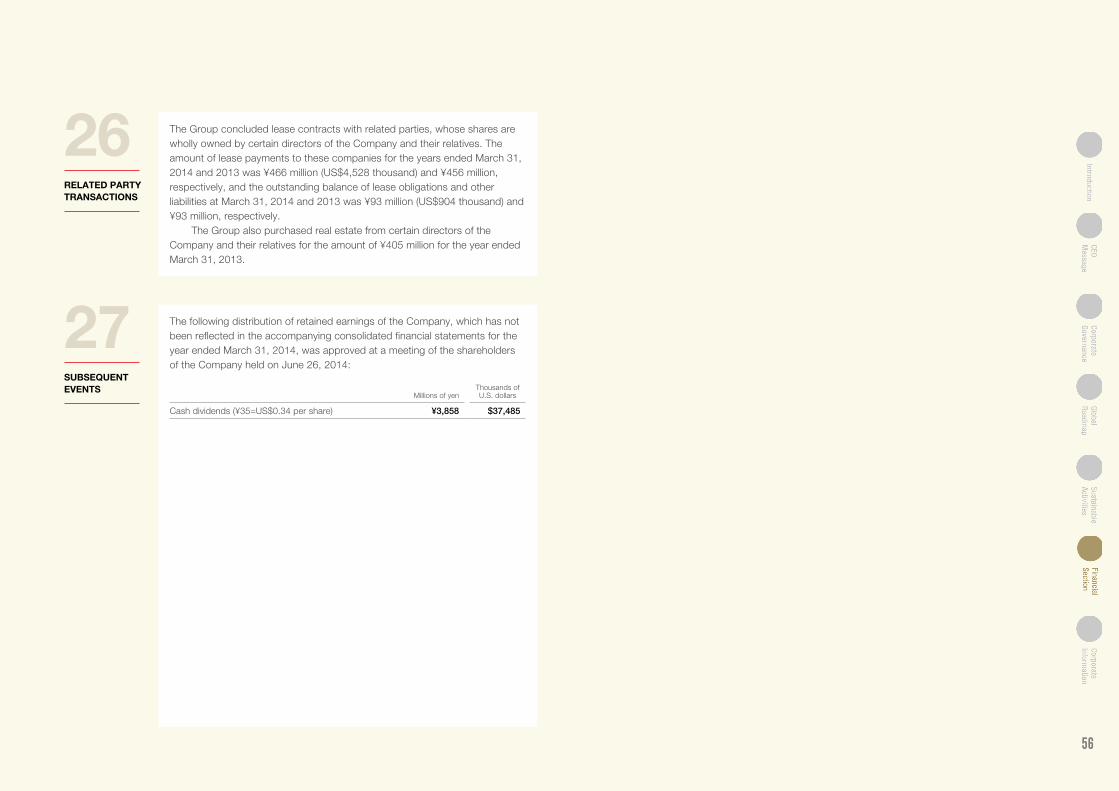
56
The Group concluded lease contracts with related parties, whose shares are wholly owned by certain directors of the Company and their relatives. The amount of lease payments to these companies for the years ended March 31, 2014 and 2013 was ¥466 million (US$4,528 thousand) and ¥456 million, respectively, and the outstanding balance of lease obligations and other liabilities at March 31, 2014 and 2013 was ¥93 million (US$904 thousand) and ¥93 million, respectively. The Group also purchased real estate from certain directors of the Company and their relatives for the amount of ¥405 million for the year ended March 31, 2013.
26RElATED PARTY TRANSACTIONS
The following distribution of retained earnings of the Company, which has not been reflected in the accompanying consolidated financial statements for the year ended March 31, 2014, was approved at a meeting of the shareholders of the Company held on June 26, 2014:
Millions of yenThousands of U.S. dollars
Cash dividends (¥35=US$0.34 per share) ¥3,858 $37,485
27SUBSEQUENT EVENTS

57

58
HISTORY
1948 Chukososha Co., Ltd. established.
1958 Chicken Ramen, the world’s first instant noodle product, introduced.
Company name changed to Nissin Food Products Co., Ltd.
1963 Listed on the Second Section of the Tokyo and Osaka Stock Exchanges.
1970 Nissin Foods (U.S.A.) Co., Inc., the Company’s first overseas operation, established in Gardena, California.
1971 Cup Noodle introduced.
Kanto Plant begins operation.
1972 Listed on the First Section of the Tokyo, Osaka and Nagoya Stock Exchanges.
1973 Shiga Plant and General Research Center begin operation.
1975 Shimonoseki Plant begins operation.
Nissin-Ajinomoto Alimentos Ltda. established in Sao Paulo, Brazil.
1977 Construction of new headquarters completed.
Main office moved to its present location in Yodogawa-ku, Osaka.
1983 Chilled foods division begins operation.
1984 Nissin Foods Co., Ltd. established in Hong Kong.
1986 Expansion into frozen food business.
1988 Construction of Tokyo Head Office building completed.
Central Research Institute begins operation.
1990 Capital participation in Yoke Co., Ltd. (currently, NISSIN YORK CO., LTD.).
1991 Capital participation in Cisco Co., Ltd. (currently, NISSIN CISCO CO., LTD.).
Bangalore Plant of Indo Nissin Foods Ltd. begins operation.
1992 Nissin Rao, long-life fresh noodles, introduced.
1993 Nissin Foods GmbH established in Germany.
PT. NISSINMAS begins operation.
1994 Nissin Foods (Thailand) Co., Ltd. begins operation.
1995 Nissin Spa-O introduced.
1996 Guangdong Shunde Nissin Foods Co., Ltd., Nissin-Universal Robina Corporation, Shizuoka Plant, and Shanghai Nissin Foods Co., Ltd. begin operation.
1997 Nissin’s “hungry?” series wins the International Advertising Festival (CANNES LIONS).
1999 Share unit (minimum trading unit) reduced from 1,000 shares to 100 shares.
The Momofuku Ando Instant Ramen Museum, the world’s first instant noodle museum, opened in Ikeda City, Osaka.
2001 Consolidated net sales exceed ¥300 billion for the first time.
2002 Food Safety Research Institute established.
Nissin GooTa series introduced.
Becomes an official supplier to the 2002 FIFA World Cup™ held in Japan and South Korea.
2003 Aggregate sales of Cup Noodle brand since launch in 1971 top 20 billion servings.
2004 Capital alliance with Hebei Hualong F&N Industry Group Co., Ltd. (currently, Jinmailang Nissin Foods Co., Ltd.)
2005 Nissin Foods marks a world first with Space Ram, noodle space rations, developed for the Space Shuttle Discovery.
2006 Aggregate sales of Cup Noodle brand top 25 billion servings all over the world.
2007 MYOJO FOODS CO., LTD. becomes a wholly owned subsidiary of Nissin Foods.
FOOD SAFETY EVALUATION & RESEARCH INSTITUTE CO., LTD. begins operation in Shanghai, China.
2008 The Group completes transformation to a pure holding company, effective October 1, 2008.
2009 Capital alliance with MAREVEN FOOD HOLDINGS LIMITED (formerly, ANGLESIDE LIMITED), a Russian instant noodle holding company.
2011 CUPNOODLES MUSEUM (officially, Momofuku Ando Instant Ramen Museum) opened in Yokohama.
2014 “the WAVE”, a new global R&D center, established.
Consolidated net sales exceed ¥400 billion for the first time.
Research InstitutesNISSIN Global Innovation Center
NISSIN Global Food Safety Institute
FOOD SAFETY EVALUATION RESEARCH INSTITUTE CO., LTD. (Shanghai)
Osaka Head Office1-1, 4-chome, Nishinakajima, Yodogawa-ku
Osaka 532-8524, Japan
Telephone: 81-6-6305-7711
Fax: 81-6-6304-1288
Head Office28-1, 6-chome, Shinjuku, Shinjuku-ku
Tokyo 160-8524, Japan
Telephone: 81-3-3205-5111
Fax: 81-3-3205-5059
NISSIN FOODS HOlDINGS CO., lTD.
COrPOrate Data(As of March 31, 2014)
Website

59
Company Capital Business Area Equity Ownership (%)
CONSOlIDATED SUBSIDIARIES
NISSIN FOOD PRODUCTS CO., LTD. ¥5,000 million Instant noodle manufacturing and marketing 100.0
MYOJO FOODS CO., LTD. ¥3,143 million Instant noodle manufacturing and marketing 100.0
NISSIN CHILLED FOODS CO., LTD. ¥100 million Chilled food manufacturing and marketing 100.0
NISSIN FROZEN FOODS CO., LTD. ¥100 million Frozen food manufacturing and marketing 100.0
NISSIN CISCO CO., LTD. ¥2,600 million Confectionery manufacturing and marketing 100.0
NISSIN YORK CO., LTD. ¥870 million Beverage and dairy product manufacturing and marketing 100.0
NISSIN BUSINESS SUPPORT CO., LTD. ¥50 million Intergroup business support 100.0
NISSIN ASSET MANAGEMENT CO., LTD. ¥50 million Real estate and leasing management 100.0
Sapporo Nissin Co., Ltd. ¥250 million Instant noodle manufacturing and marketing 100.0 (100.0)
Nissin Plastics Co., Ltd. ¥450 million Container manufacturing and marketing 100.0 (100.0)
NISSIN F.D. FOODS CO., LTD. ¥100 million Ingredient manufacturing and marketing 100.0 (100.0)
Kagawa Nissin Food Products Co., Ltd. ¥100 million Ingredient manufacturing and marketing 100.0 (100.0)
Nissin Enterprise Corporation ¥300 million Shipping and warehousing 100.0 (100.0)
AJINIHON CO., LTD. ¥95 million Soup manufacturing and marketing 46.3 (46.3)
NISHINIHON MYOJO CO., LTD. ¥90 million Instant noodle manufacturing and marketing 100.0 (100.0)
UNI-STAR CO., LTD. ¥150 million Soup manufacturing and marketing 100.0 (100.0)
HIGASHINIHON MYOJO CO., LTD. ¥90 million Instant noodle manufacturing and marketing 100.0 (100.0)
Saitama Nissin Food Products Co., Ltd. ¥30 million Chilled and frozen food manufacturing and marketing 100.0 (100.0)
MYOJO FRESH CO., LTD. ¥400 million Chilled food manufacturing and marketing 100.0 (100.0)
Shikoku Nissin Food Products Co., Ltd. ¥98 million Frozen food manufacturing and marketing 100.0 (100.0)
Takamatsu Nissin Food Products Co., Ltd. ¥80 million Frozen food manufacturing and marketing 100.0 (100.0)
Mie Nissin Food Products Co., Ltd. ¥100 million Frozen food manufacturing and marketing 100.0 (100.0)
Circle Liners Co., Ltd. ¥50 million Shipping and warehousing 100.0 (100.0)
NICKY FOODS CO., LTD. ¥60 million Frozen food manufacturing and marketing 100.0 (100.0)
UJI KAIHATSU DEVELOPMENT CO., LTD. ¥100 million Golf course management 98.3 (0.4)
NISSIN NETCOM CO., LTD. ¥24 million Real estate and restaurant management 100.0
As of March 31, 2014
BUSINESS AREAS OF CONSOlIDATED SUBSIDIARIES AND ASSOCIATES

60
Company Capital Business Area Equity Ownership (%)
CONSOlIDATED SUBSIDIARIES
NISSIN FOODS (U.S.A.) CO., INC. US$149,706 thousand Instant noodle manufacturing and marketing 94.4
MYOJO U.S.A., INC. US$5,000 thousand Chilled food manufacturing and marketing 96.0
NISSIN FOODS DE MExICO S.A. DE C.V. MxN 215,191 thousand Instant noodle manufacturing and marketing 100.0
NISSIN FOODS CO., LTD. HK$1,674,987 thousand Instant noodle manufacturing and marketing 100.0
WINNER FOOD PRODUCTS LTD. HK$29,975 thousand Instant noodle and frozen food manufacturing and marketing 74.0 (74.0)
MIRACLE FOODS CO., LTD. HK$21,000 thousand Container manufacturing and marketing 100.0 (100.0)
NISSIN FOODS (CHINA) HOLDING CO., LTD. US$40,500 thousand Invests in businesses in China 100.0 (100.0)
SHANGHAI NISSIN FOODS CO., LTD. US$44,000 thousand Instant noodle manufacturing and marketing 100.0 (100.0)
GUANGDONG SHUNDE NISSIN FOODS CO., LTD. HK$130,000 thousand Instant noodle manufacturing and marketing 100.0 (100.0)
ZHUHAI GOLDEN COAST WINNER FOOD PRODUCTS LTD. HK$84,000 thousand Instant noodle manufacturing and marketing 70.5 (70.5)
GUANGYOUGNAN FOOD PRODUCTS (SHENZHEN) CO., LTD. HK$11,000 thousand Frozen food manufacturing and marketing 100.0 (100.0)
NISSIN FOODS (ASIA) PTE. LTD. SG$225,303 thousand Instant noodle manufacturing and marketing/Supervising Asian business 100.0
Indo Nissin Foods Ltd. INR 2,650,000 thousand Instant noodle manufacturing and marketing 97.1 (97.1)
Nissin Foods India Ltd. INR 500 thousand Instant noodle marketing 100.0 (100.0)
Nissin Foods Kft. HUF 1,000,000 thousand Instant noodle manufacturing and marketing 100.0
Nissin Foods GmbH EUR 25 thousand Instant noodle marketing 100.0 (99.0)
NISSIN YILDIZ GIDA SANAYI VE TICARET A.S. TL 87,625 thousand Pasta and instant noodle manufacturing and marketing 50.0
Nissin Foods Vietnam Co., Ltd. US$48,630 thousand Instant noodle manufacturing and marketing 100.0 (100.0)
Nissin Foods (Thailand) Co., Ltd. THB 2,140,000 thousand Instant noodle manufacturing and marketing 100.0 (100.0)
ASSOCIATES ACCOUNTED FOR BY THE EQUITY METHOD
NISSIN-AJINOMOTO ALIMENTOS LTDA. BRL 12,688 thousand Instant noodle manufacturing and marketing 50.0
THAI PRESIDENT FOODS PUBLIC COMPANY LIMITED THB 180,000 thousand Instant noodle manufacturing and marketing 21.1
MAREVEN FOOD HOLDINGS LIMITED RUB 398 thousand Holding company of instant noodle businesses 33.5
Frente Co., Ltd. ¥1,090 million Confectionery manufacturing and marketing 20.0
BonChi Co., Ltd. ¥160 million Confectionery manufacturing and marketing 30.0
Note: The figures in ( ) of equity ownership show percentage of indirect ownership.

61
Date of Establishment September 1948
Number of Employees 525 (parent company) 8,357 (consolidated basis)
Common Stock Authorized: 500,000,000 shares Issued: 117,463,685 shares Number of Shareholders: 44,691 (Excluding owners of odd-lot shares)
Paid-in Capital ¥25,123 million ($244 million)
Stock listings Tokyo Stock Exchange (Ticker Code: 2897)
Independent Auditors Deloitte Touche Tohmatsu LLC
Transfer Agent Mizuho Trust & Banking Co., Ltd. 2-1, Yaesu 1-chome, Chuo-ku, Tokyo, Japan
INVeStOr INFOrmatIONNISSIN FOODS HOLDINGS CO., LTD.
As of March 31, 2014 (US$1=¥102.92)
Years ended March 31, 2010 2011 2012 2013 2014
Net income per share (EPS) ¥177.02 ¥187.56 ¥167.97 ¥171.12 ¥174.83
Equity (book-value) per share (BPS) ¥2,406.26 ¥2,454.67 ¥2,545.31 ¥2,782.25 ¥3,018.82
Price earnings ratio (PER) (Times) 17.8 15.6 18.4 25.6 26.6
Price-to-book ratio (PBR) (Times) 1.3 1.2 1.2 1.6 1.5
Dividend ¥60.00 ¥70.00 ¥75.00 ¥75.00 ¥75.00
Payout ratio (%) 33.89 37.32 44.70 43.80 42.90
Share price: High ¥3,590 ¥3,340 ¥3,195 ¥4,385 ¥4,735
Low ¥2,610 ¥2,730 ¥2,812 ¥2,824 ¥3,550
Notes: 1. From the fiscal year ended March 31, 2008, number of issued shares excludes the numbers of treasury stocks at term-end.
2. Equity per share = (Equity - Minority interests - Stock acquisition rights) / Number of shares outstanding as of the year-end (excluding treasury stock)
3. Price earnings ratio and price-to-book ratio are calculated based on the share price at year-end.
CONSOlIDATED PER SHARE DATA
n Other Corporations 39.13%
n Financial Institutions 24.51%
n Foreign Corporations 18.48%
n Individuals and Other 11.70%
n Treasury Stock 6.17%
DISTRIBUTION OF OWNERSHIP AMONG SHAREHOlDERS
0
9,000
3,000
6,000
0
4,000
6,000 (Thousands of share)(Yen)
2,000
42013
5 6 7 8 9 10 11 12 12014
2 3 4 5 6
Share Price (Left)
Trading Volume (Right)
SHARE PRICE RANGE AND TRADING VOlUME ON TSE
For further information, please contact: IR OFFICE, FINANCIAL HEADqUARTERS Tel: 81-3-3205-5027 Fax: 81-3-3205-5179Regularly updated IR information in English is also available on NISSIN FOODS HOLDINGS website at
FURTHER INFORMATION
Name
Number of Shares Held (Thousands)
Percentage of Total Shares Outstanding
Ando Foundation 7,904 6.72%Mitsubishi Corp. 7,800 6.64State Street Bank and Trust Company 7,404 6.30ITOCHU Corp. 5,400 4.59Ando International Y.K. 4,000 3.40Mizuho Bank, Ltd. 3,375 2.87The Bank of Tokyo-Mitsubishi UFJ, Ltd. 2,629 2.23Japan Trustee Services Bank, Ltd. (Account in Trust) 2,511 2.13ONO PHARMACEUTICAL CO., LTD. 2,460 2.09EZAKI GLICO CO., LTD. 2,361 2.00Total 45,844 39.02
Note: In addition to the above, the Company holds 7,242,013 shares (6.16%) of treasury stock.
PRINCIPAl SHAREHOlDERS
Forward-looking Statements This report contains forward-looking statements regarding the Company’s plans, outlook, strategies and results for the future that are based on management’s estimates, assumptions and projections at the time of publication. Certain risks and uncertainties could cause the Company’s actual results to differ materially from any projections presented in this report. These risks and uncertainties include, but are not limited to, the domestic and international economic circumstances surrounding the Company’s businesses, competitive activity, related laws and regulations, product development programs and exchange fluctuations.

NISSIN FOODS HOLDINGS
In ANNUAL REPORT 2014, we report not only its business results,
but also its philosophy and environmental and social activities, to give
shareholders, investors, and all other stakeholders a comprehensive
picture of the Group and our vision for the future. However, rather than
attempt to exhaustively cover everything, we have focused primarily on
three areas: the Group’s philosophy; “the WAVE”, our new research and
development center completed in fiscal 2014; and development of our
overseas business, which is currently a top priority.
We believe that the annual report, as a vehicle for disseminating
information to our stakeholders, should be as innovative as our products.
We have tried to make ANNUAL REPORT 2014 an original and fun
report that embodies the defining characteristics of the NISSIN FOODS
Group’s product development: unique, happy, global and creative.
abOut tHis rePOrt