Sapphire Foods India Limited - BSE
29
+91 022 67522300 [email protected] www.sapphirefoods.in 702, Prism Tower, A-Wing, Mindspace, Link Road, Goregaon (W), Mumbai- 400062 Sapphire Foods India Limited (formerly known as Sapphire Foods India Private Limited) CIN: L55204MH2009PLC197005 Date: May 25, 2022 To, National Stock Exchange of India Limited Exchange Plaza, Block G, C/1, Bandra Kurla Complex, Bandra (E), Mumbai – 400051 Symbol: SAPPHIRE BSE Limited Phiroze Jeejeebhoy Towers, Dalal Street, Mumbai – 40001 Scrip Code: 543397 Dear Sir/Madam, Subject: Corporate Presentation Pursuant to the Regulation 30 of SEBI (Listing Obligations and Disclosure Requirements) Regulations 2015, please find enclosed herewith Corporate Presentation. The Corporate Presentation is also available on Company’s website (www.sapphirefoods.in/investors-relation/financial-information ) under FY22 Q4 section. Request you to kindly take the same on record. Thanking you, For Sapphire Foods India Limited (formerly known as Sapphire Foods India Private Limited) Sachin Dudam Company Secretary and Compliance Officer Encl: a/a
-
Upload
khangminh22 -
Category
Documents
-
view
0 -
download
0
Transcript of Sapphire Foods India Limited - BSE
+91 022 67522300 [email protected] www.sapphirefoods.in 702, Prism Tower, A-Wing, Mindspace, Link
Road, Goregaon (W), Mumbai- 400062
Sapphire Foods India Limited (formerly known as Sapphire Foods India Private Limited) CIN: L55204MH2009PLC197005
Date: May 25, 2022
To,
National Stock Exchange of India Limited
Exchange Plaza, Block G, C/1, Bandra Kurla Complex, Bandra (E), Mumbai – 400051
Symbol: SAPPHIRE
BSE Limited
Phiroze Jeejeebhoy Towers, Dalal Street, Mumbai – 40001
Scrip Code: 543397
Dear Sir/Madam, Subject: Corporate Presentation Pursuant to the Regulation 30 of SEBI (Listing Obligations and Disclosure Requirements) Regulations 2015, please find enclosed herewith Corporate Presentation. The Corporate Presentation is also available on Company’s website (www.sapphirefoods.in/investors-relation/financial-information ) under FY22 Q4 section. Request you to kindly take the same on record. Thanking you, For Sapphire Foods India Limited (formerly known as Sapphire Foods India Private Limited) Sachin Dudam Company Secretary and Compliance Officer Encl: a/a
Sapphire Foods India Limited3Q FY22 Earnings Presentation
February 2022
SAPPHIRE FOODS INDIA LIMITED
1
SAFE HARBOR
This presentation and the accompanying slides (the “Presentation”), which have been prepared by Sapphire Foods India Limited (the “Company”), have been prepared
solely for information purposes and do not constitute any offer, recommendation or invitation to purchase or subscribe for any securities, and shall not form the basis or be
relied on in connection with any contract or binding commitment what so ever. No offering of securities of the Company will be made except by means of a statutory offering
document containing detailed information about the Company.
This Presentation has been prepared by the Company based on information and data which the Company considers reliable, but the Company makes no representation or
warranty, express or implied, whatsoever, and no reliance shall be placed on, the truth, accuracy, completeness, fairness and reasonableness of the contents of this
Presentation. This Presentation may not be all inclusive and may not contain all of the information that you may consider material. Any liability in respect of the contents of, or
any omission from, this Presentation is expressly excluded
Certain matters discussed in this Presentation may contain statements regarding the Company’s market opportunity and business prospects that are individually and
collectively forward-looking statements. Such forward-looking statements are not guarantees of future performance and are subject to known and unknown risks,
uncertainties and assumptions that are difficult to predict. These risks and uncertainties include, but are not limited to, the performance of the Indian economy and of the
economies of various international markets, the performance of the industry in India and world-wide, competition, the company’s ability to successfully implement its strategy,
the Company’s future levels of growth and expansion, technological implementation, changes and advancements, changes in Restaurant Sales, income or cash flows, the
Company’s market preferences and its exposure to market risks, as well as other risks. The Company’s actual results, levels of activity, performance or achievements could
differ materially and adversely from results expressed in or implied by this Presentation. The Company assumes no obligation to update any forward-looking information
contained in this Presentation. Any forward-looking statements and projections made by third parties included in this Presentation are not adopted by the Company and the
Company is not responsible for such third party statements and projections.
2
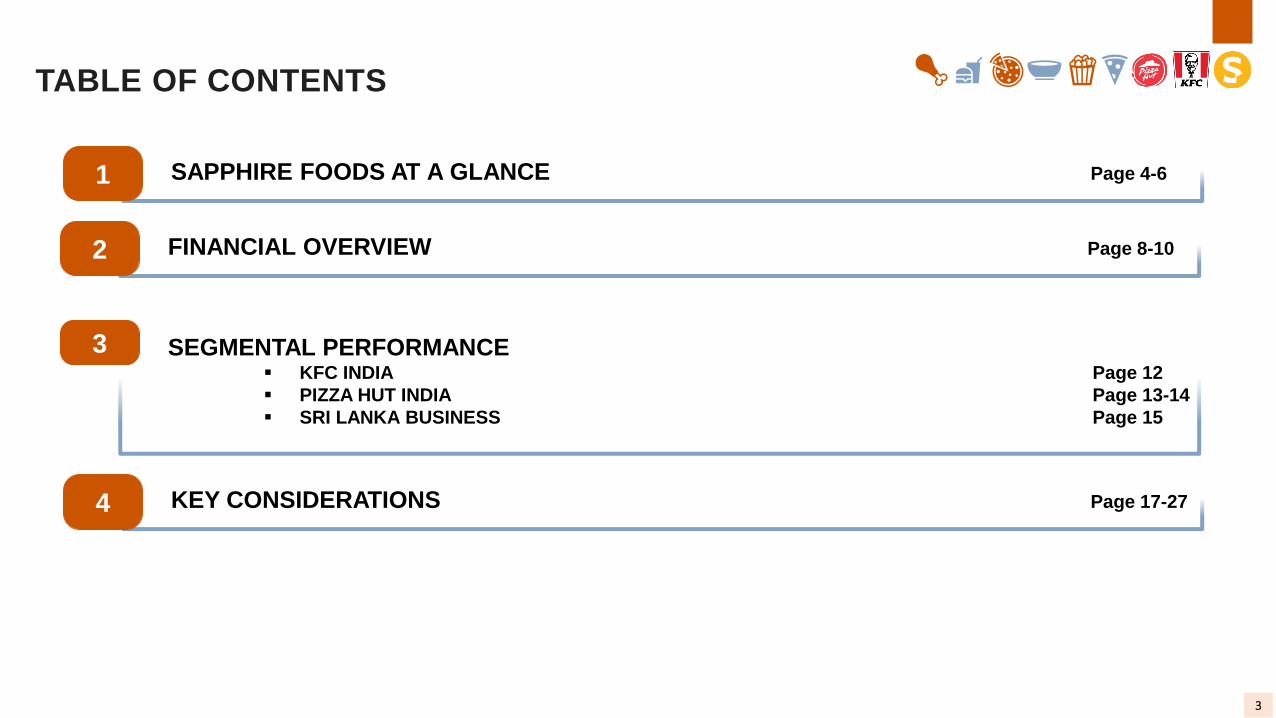
SEGMENTAL PERFORMANCE▪ KFC INDIA Page 12
▪ PIZZA HUT INDIA Page 13-14
▪ SRI LANKA BUSINESS Page 15
3
FINANCIAL OVERVIEW Page 8-102
KEY CONSIDERATIONS Page 17-274
TABLE OF CONTENTS
SAPPHIRE FOODS AT A GLANCE Page 4-61
3
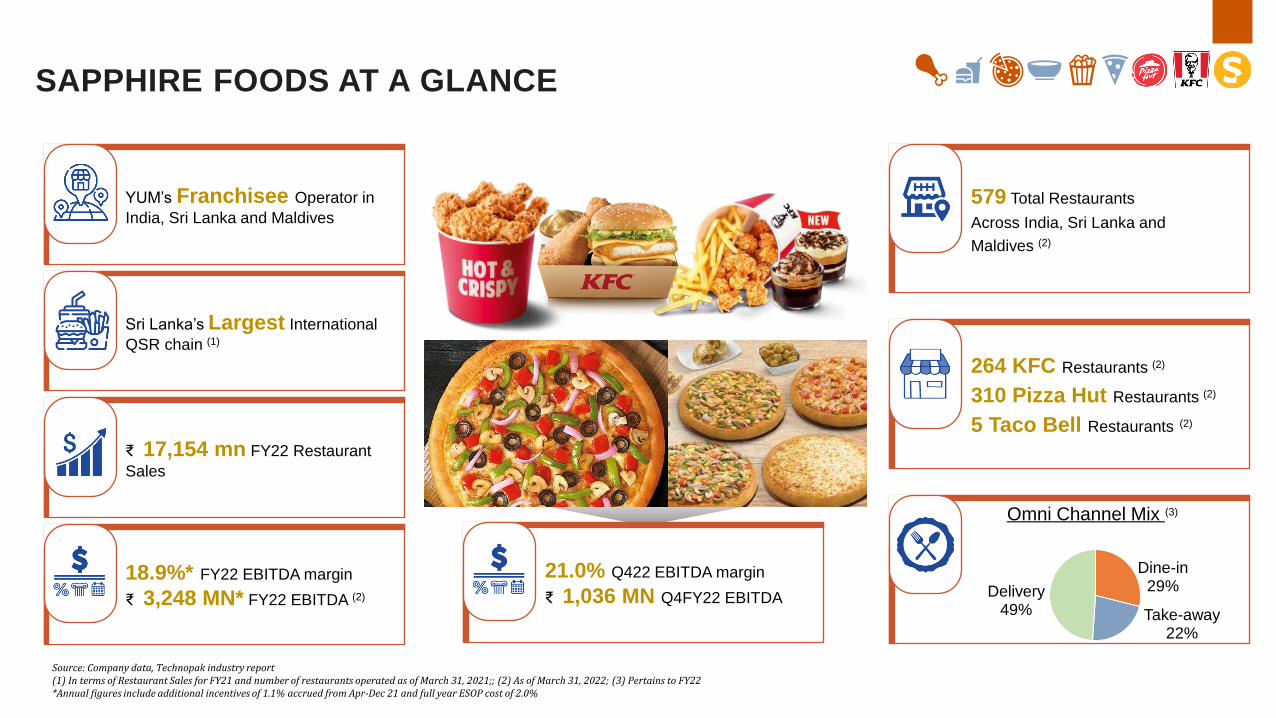
SAPPHIRE FOODS AT A GLANCE
18.9%* FY22 EBITDA margin
₹ 3,248 MN* FY22 EBITDA (2)
YUM’s Franchisee Operator in
India, Sri Lanka and Maldives
Sri Lanka’s Largest International
QSR chain (1)
₹ 17,154 mn FY22 Restaurant
Sales
Source: Company data, Technopak industry report(1) In terms of Restaurant Sales for FY21 and number of restaurants operated as of March 31, 2021;; (2) As of March 31, 2022; (3) Pertains to FY22*Annual figures include additional incentives of 1.1% accrued from Apr-Dec 21 and full year ESOP cost of 2.0%
579 Total Restaurants
Across India, Sri Lanka and
Maldives (2)
264 KFC Restaurants (2)
310 Pizza Hut Restaurants (2)
5 Taco Bell Restaurants (2)
Omni Channel Mix (3)
Dine-in29%
Take-away22%
Delivery49%
21.0% Q422 EBITDA margin
₹ 1,036 MN Q4FY22 EBITDA
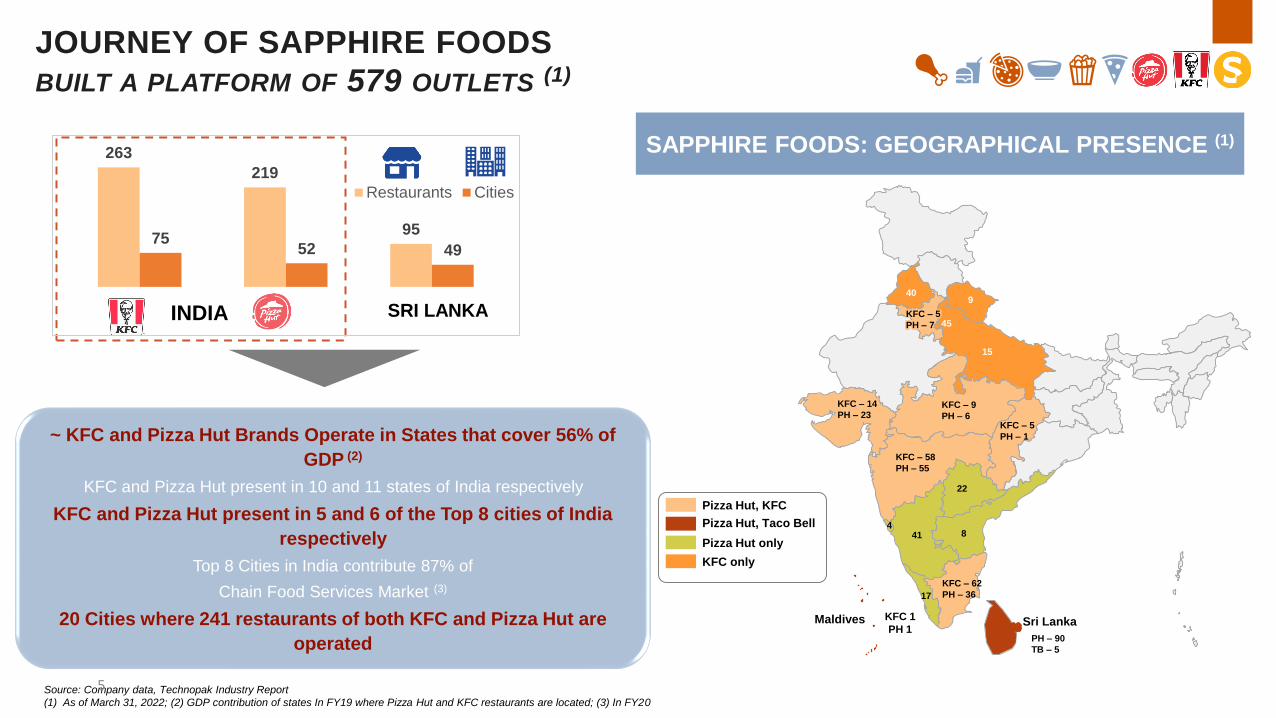
SAPPHIRE FOODS: GEOGRAPHICAL PRESENCE (1)
~ KFC and Pizza Hut Brands Operate in States that cover 56% of
GDP (2)
KFC and Pizza Hut present in 10 and 11 states of India respectively
KFC and Pizza Hut present in 5 and 6 of the Top 8 cities of India
respectively
Top 8 Cities in India contribute 87% of
Chain Food Services Market (3)
20 Cities where 241 restaurants of both KFC and Pizza Hut are
operated
Source: Company data, Technopak Industry Report
(1) As of March 31, 2022; (2) GDP contribution of states In FY19 where Pizza Hut and KFC restaurants are located; (3) In FY20
263
219
9575
52 49
Restaurants Cities
INDIA SRI LANKA
KFC 1
PH 1
JOURNEY OF SAPPHIRE FOODS
BUILT A PLATFORM OF 579 OUTLETS (1)
5
Pizza Hut, KFC
Pizza Hut, Taco Bell
Pizza Hut only
KFC only
Maldives Sri Lanka
KFC – 9
PH – 6
KFC – 14
PH – 23
KFC – 58
PH – 55
KFC – 5
PH – 1
KFC – 62
PH – 36
8
22
414
17
15
45
940
PH – 90
TB – 5
KFC – 5
PH – 7
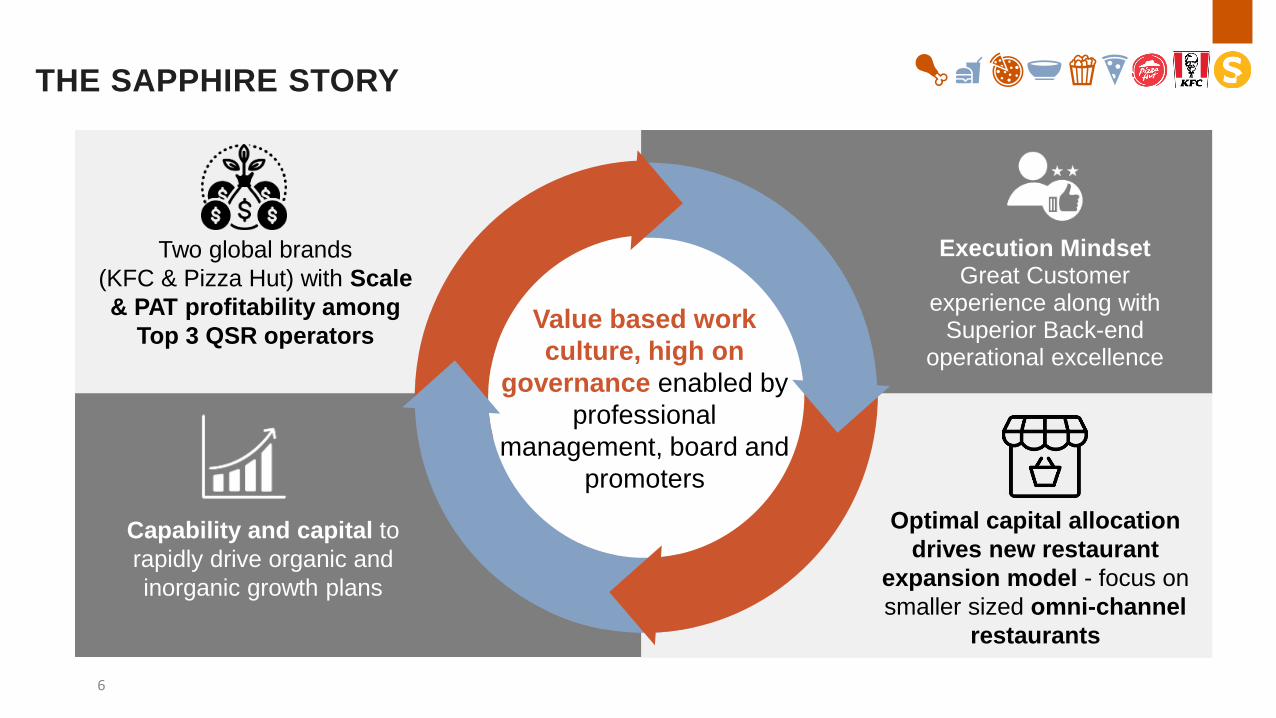
THE SAPPHIRE STORY
Capability and capital to
rapidly drive organic and
inorganic growth plans
Execution Mindset Great Customer
experience along with Superior Back-end
operational excellence
Two global brands
(KFC & Pizza Hut) with Scale
& PAT profitability among
Top 3 QSR operators
Optimal capital allocation
drives new restaurant
expansion model - focus on
smaller sized omni-channel
restaurants
Value based work
culture, high on
governance enabled by
professional
management, board and
promoters
6

FINANCIAL OVERVIEW
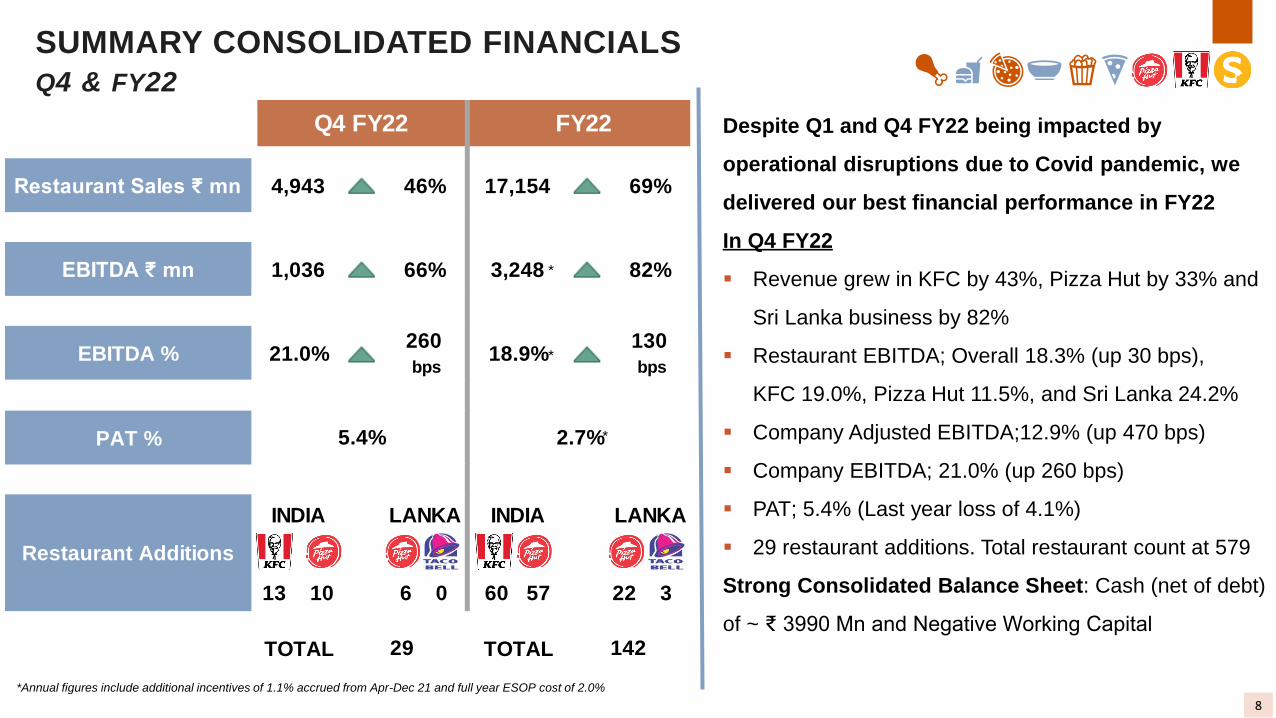
SUMMARY CONSOLIDATED FINANCIALS
Q4 & FY22
Despite Q1 and Q4 FY22 being impacted by
operational disruptions due to Covid pandemic, we
delivered our best financial performance in FY22
In Q4 FY22
▪ Revenue grew in KFC by 43%, Pizza Hut by 33% and
Sri Lanka business by 82%
▪ Restaurant EBITDA; Overall 18.3% (up 30 bps),
KFC 19.0%, Pizza Hut 11.5%, and Sri Lanka 24.2%
▪ Company Adjusted EBITDA;12.9% (up 470 bps)
▪ Company EBITDA; 21.0% (up 260 bps)
▪ PAT; 5.4% (Last year loss of 4.1%)
▪ 29 restaurant additions. Total restaurant count at 579
Strong Consolidated Balance Sheet: Cash (net of debt)
of ~ ₹ 3990 Mn and Negative Working Capital
*Annual figures include additional incentives of 1.1% accrued from Apr-Dec 21 and full year ESOP cost of 2.0%
8
Restaurant Sales ₹ mn 4,943 46% 17,154 69%
EBITDA ₹ mn 1,036 66% 3,248 82%
260 130
bps bps
PAT %
INDIA LANKA INDIA LANKA
13 10 6 0 60 57 22 3
TOTAL TOTAL29 142
EBITDA % 21.0%
Restaurant Additions
18.9%
5.4%
Q4 FY22 FY22
2.7%
*
*
*
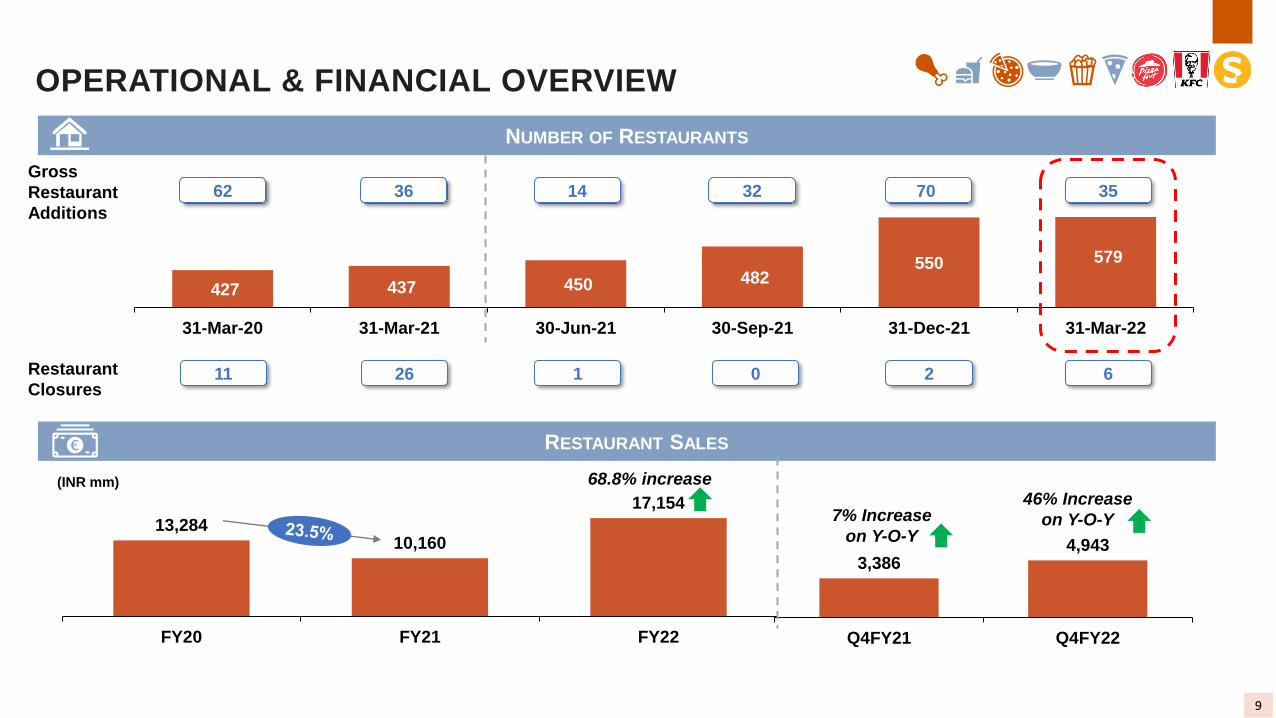
427 437 450 482 550 579
31-Mar-20 31-Mar-21 30-Jun-21 30-Sep-21 31-Dec-21 31-Mar-22
3,3864,943
Q4FY21 Q4FY22
11 1
NUMBER OF RESTAURANTS
Restaurant
Closures26
62 14Gross
Restaurant
Additions
36
RESTAURANT SALES
13,28410,160
17,154
FY20 FY21 FY22
(INR mm) 68.8% increase
32 70
0
46% Increase
on Y-O-Y7% Increase
on Y-O-Y
OPERATIONAL & FINANCIAL OVERVIEW
9
2
35
6
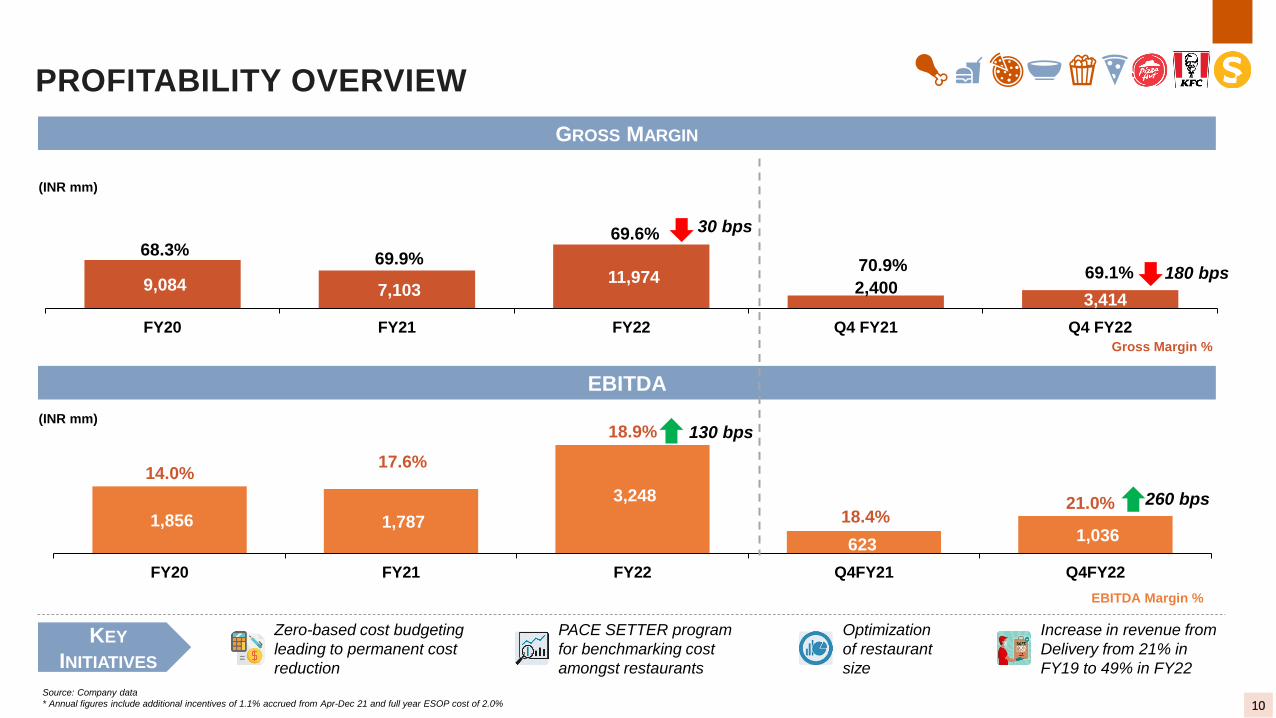
1,856 1,787
3,248
623 1,036
14.0%17.6%
18.9%
18.4%21.0%
FY20 FY21 FY22 Q4FY21 Q4FY22
EBITDA Margin %
130 bps
260 bps
KEY
INITIATIVES
PACE SETTER program
for benchmarking cost
amongst restaurants
Optimization
of restaurant
size
Increase in revenue from
Delivery from 21% in
FY19 to 49% in FY22
Zero-based cost budgeting
leading to permanent cost
reduction
EBITDA
9,084 7,103 11,974
2,400 3,414
68.3%69.9%
69.6%
70.9% 69.1%
FY20 FY21 FY22 Q4 FY21 Q4 FY22Gross Margin %
30 bps
180 bps
(INR mm)
GROSS MARGIN
(INR mm)
Source: Company data
* Annual figures include additional incentives of 1.1% accrued from Apr-Dec 21 and full year ESOP cost of 2.0%
PROFITABILITY OVERVIEW
10
SEGMENTAL PERFORMANCE
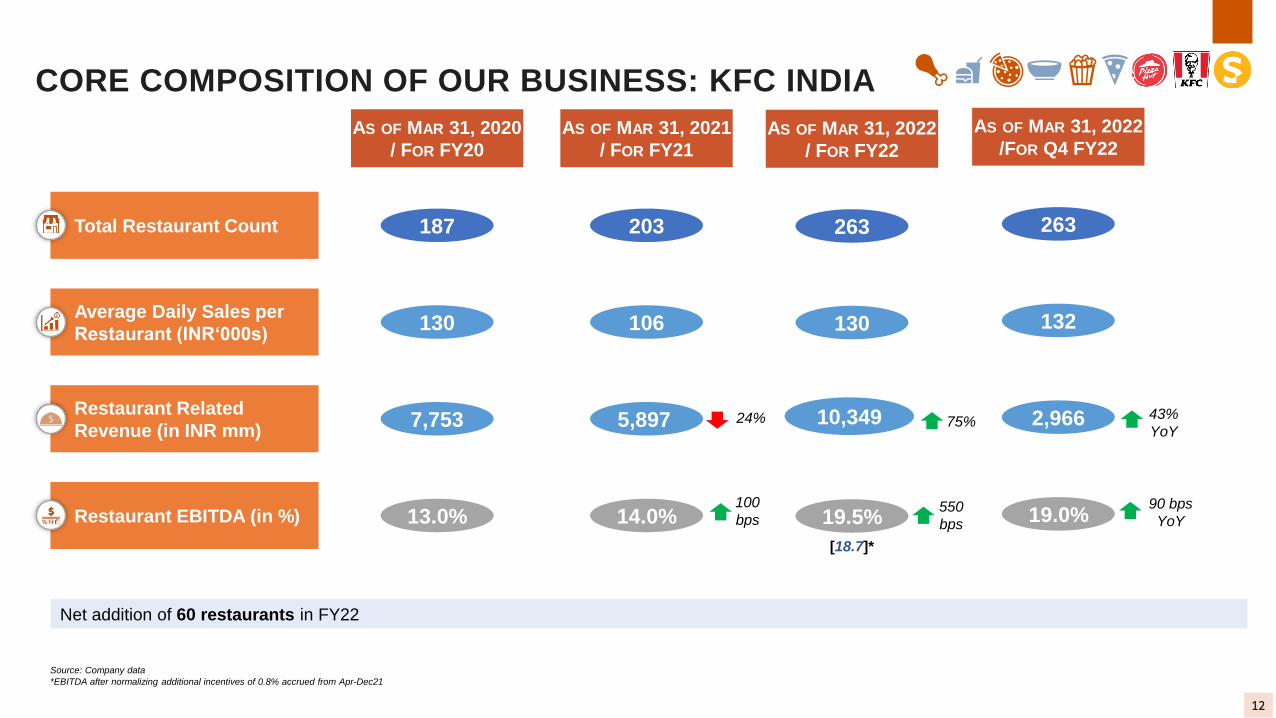
CORE COMPOSITION OF OUR BUSINESS: KFC INDIA
Restaurant Related
Revenue (in INR mm)
Restaurant EBITDA (in %)
Total Restaurant Count
Average Daily Sales per
Restaurant (INR‘000s)
Net addition of 60 restaurants in FY22
Source: Company data
*EBITDA after normalizing additional incentives of 0.8% accrued from Apr-Dec21
130
7,753
13.0%
187
AS OF MAR 31, 2020
/ FOR FY20
132
2,966
19.0%
263
AS OF MAR 31, 2022
/FOR Q4 FY22
106
5,897
14.0%
203
AS OF MAR 31, 2021
/ FOR FY21
43%
YoY
90 bps
YoY
24%
100
bps
130
10,349
19.5%
263
AS OF MAR 31, 2022
/ FOR FY22
[18.7]*
75%
550
bps
12
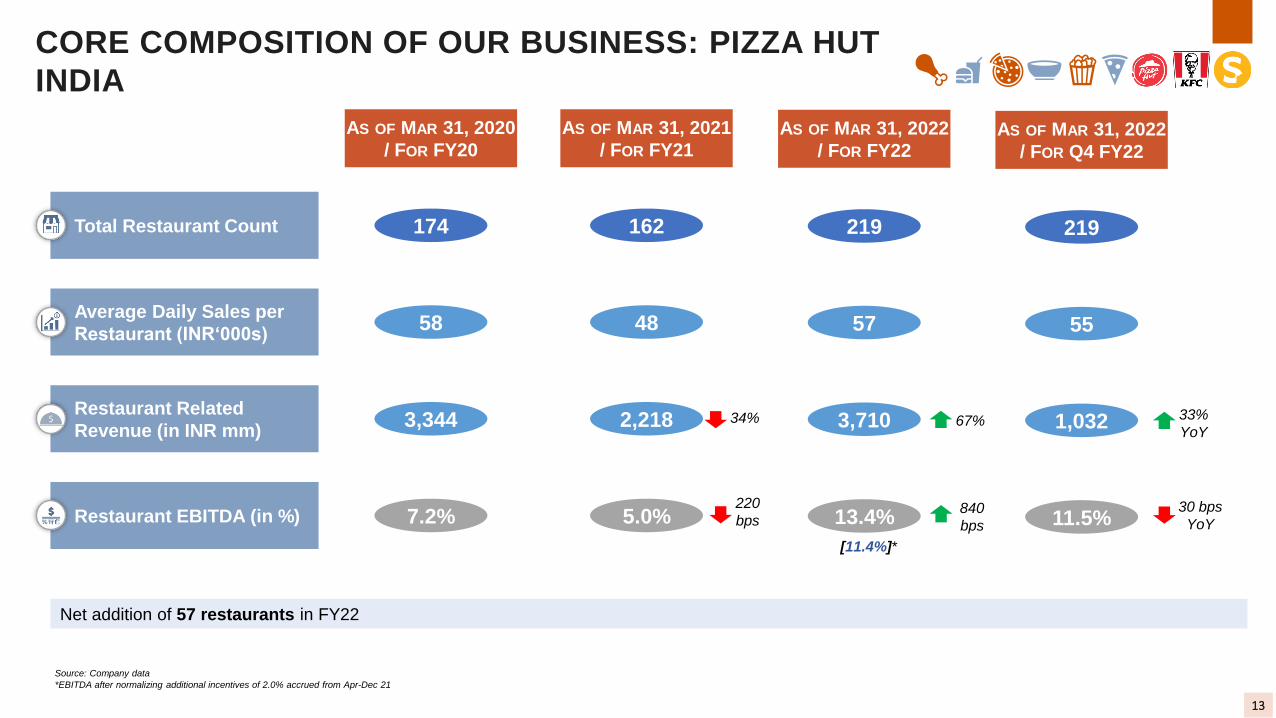
Restaurant Related
Revenue (in INR mm)
Restaurant EBITDA (in %)
Total Restaurant Count
Average Daily Sales per
Restaurant (INR‘000s)
CORE COMPOSITION OF OUR BUSINESS: PIZZA HUT
INDIA
58
3,344
7.2%
174
AS OF MAR 31, 2020
/ FOR FY20
48
2,218
5.0%
162
AS OF MAR 31, 2021
/ FOR FY21
55
1,032
11.5%
219
33%
YoY
30 bps
YoY
Net addition of 57 restaurants in FY22
34%
220
bps
AS OF MAR 31, 2022
/ FOR Q4 FY22
57
3,710
13.4%
219
67%
840
bps
AS OF MAR 31, 2022
/ FOR FY22
Source: Company data
*EBITDA after normalizing additional incentives of 2.0% accrued from Apr-Dec 21
13
[11.4%]*
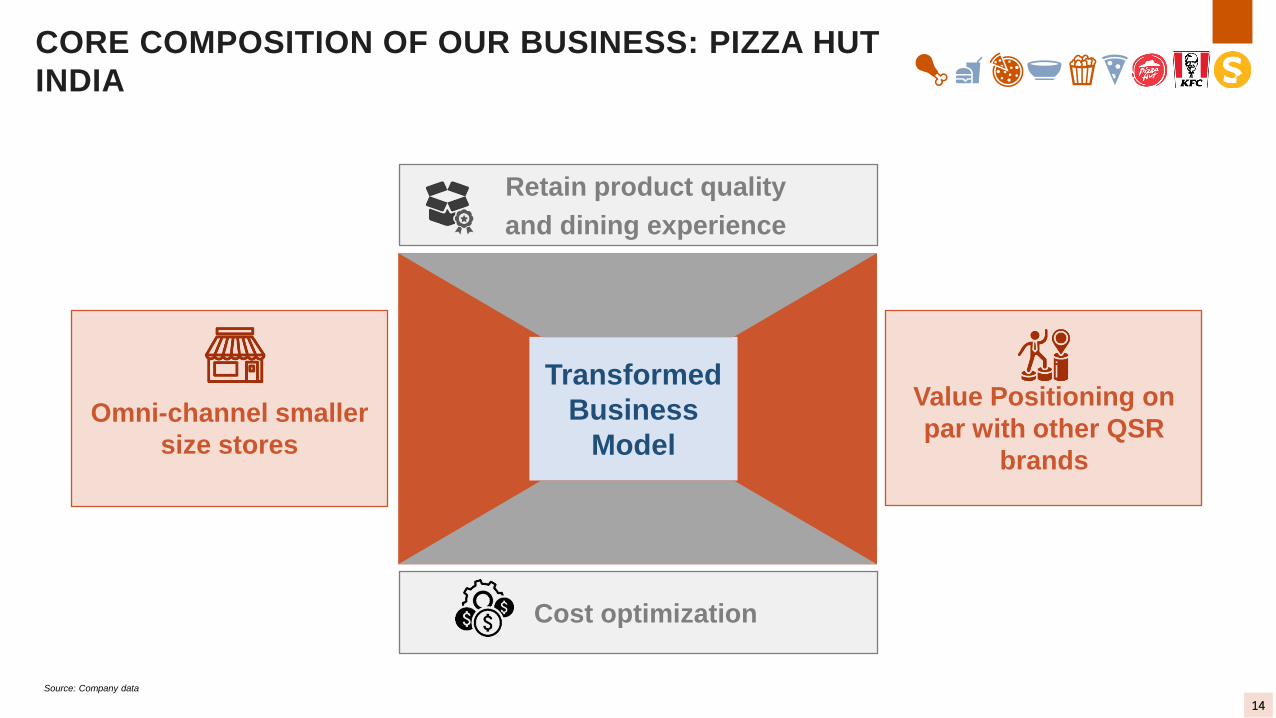
CORE COMPOSITION OF OUR BUSINESS: PIZZA HUT
INDIA
Omni-channel smaller
size stores
Value Positioning on
par with other QSR
brands
Retain product quality
and dining experience
Cost optimization
Transformed
Business
Model
Source: Company data
14
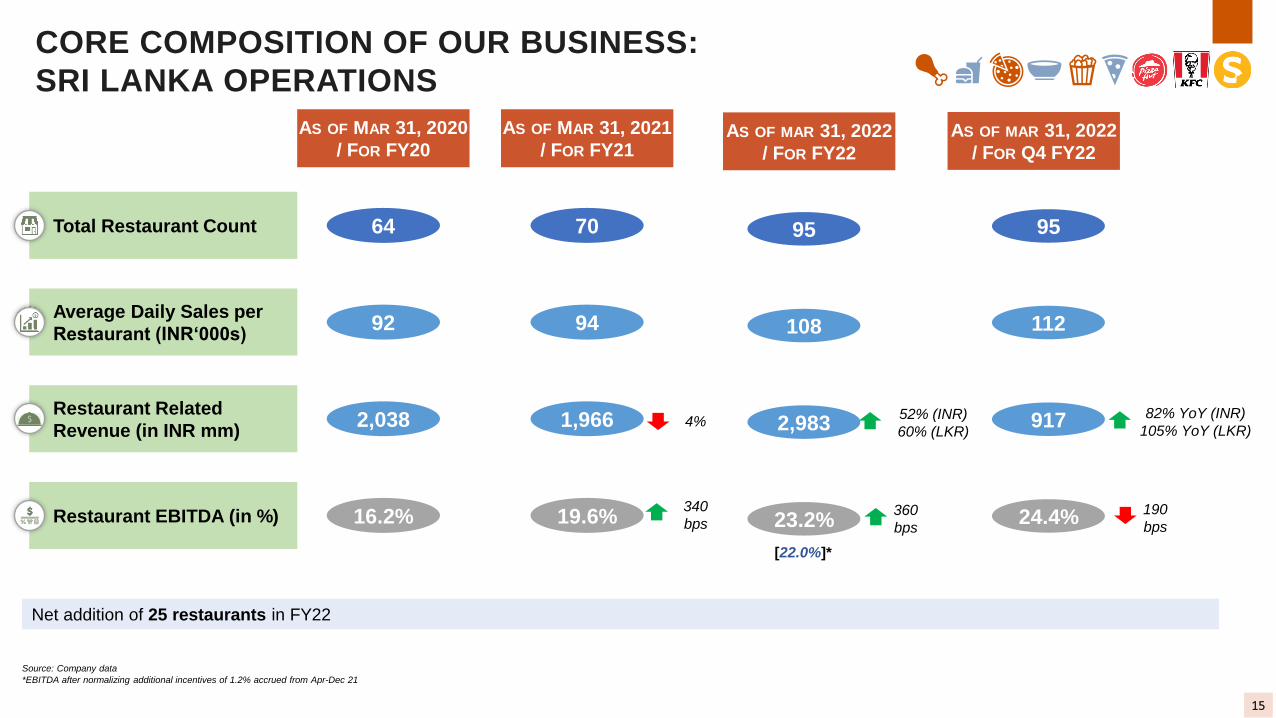
CORE COMPOSITION OF OUR BUSINESS:
SRI LANKA OPERATIONS
Restaurant Related
Revenue (in INR mm)
Restaurant EBITDA (in %)
Total Restaurant Count
Average Daily Sales per
Restaurant (INR‘000s) 92
2,038
16.2%
64
AS OF MAR 31, 2020
/ FOR FY20
94
1,966
19.6%
70
AS OF MAR 31, 2021
/ FOR FY21
108
2,983
23.2%
95
52% (INR)
60% (LKR)
360
bps
Net addition of 25 restaurants in FY22
4%
340
bps
AS OF MAR 31, 2022
/ FOR FY22
112
917
24.4%
95
190
bps
AS OF MAR 31, 2022
/ FOR Q4 FY22
[22.0%]*
Source: Company data
*EBITDA after normalizing additional incentives of 1.2% accrued from Apr-Dec 21
15
82% YoY (INR)
105% YoY (LKR)

KEY CONSIDERATIONS
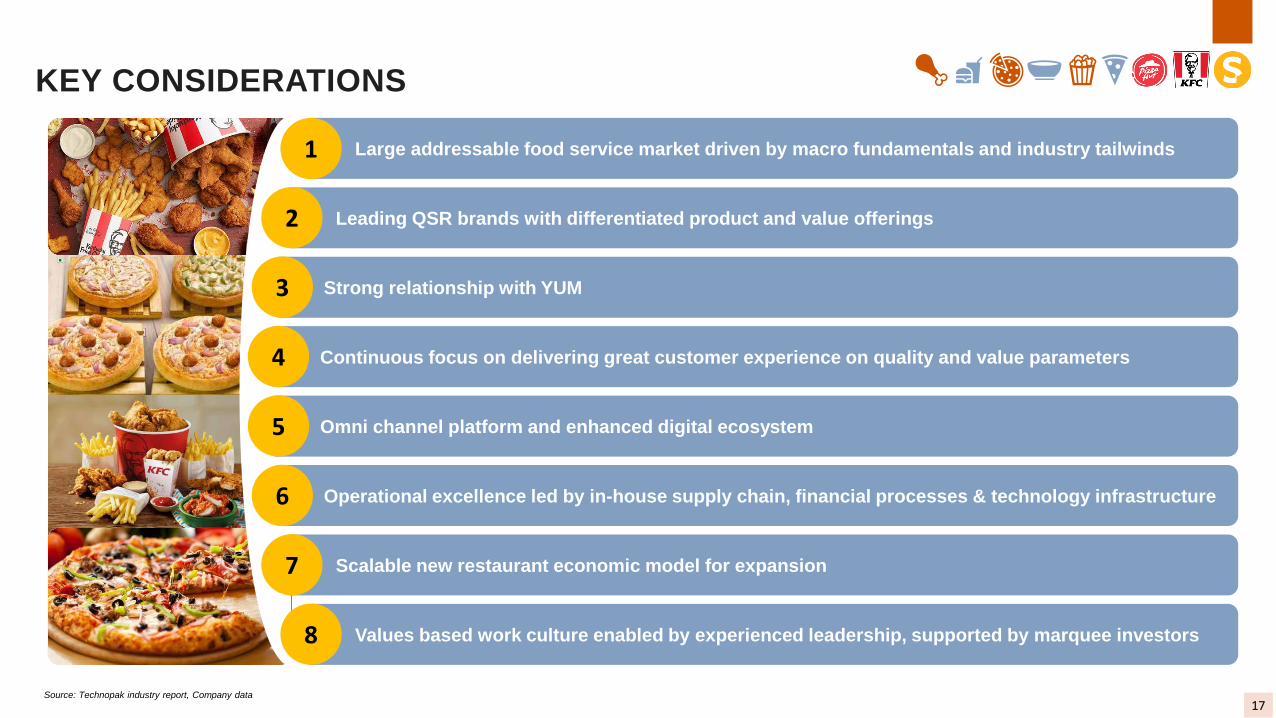
Large addressable food service market driven by macro fundamentals and industry tailwinds
Leading QSR brands with differentiated product and value offerings
Strong relationship with YUM
Continuous focus on delivering great customer experience on quality and value parameters
Omni channel platform and enhanced digital ecosystem
Operational excellence led by in-house supply chain, financial processes & technology infrastructure
Scalable new restaurant economic model for expansion
Values based work culture enabled by experienced leadership, supported by marquee investors
1
8
2
7
3
6
4
5
Source: Technopak industry report, Company data
KEY CONSIDERATIONS
17
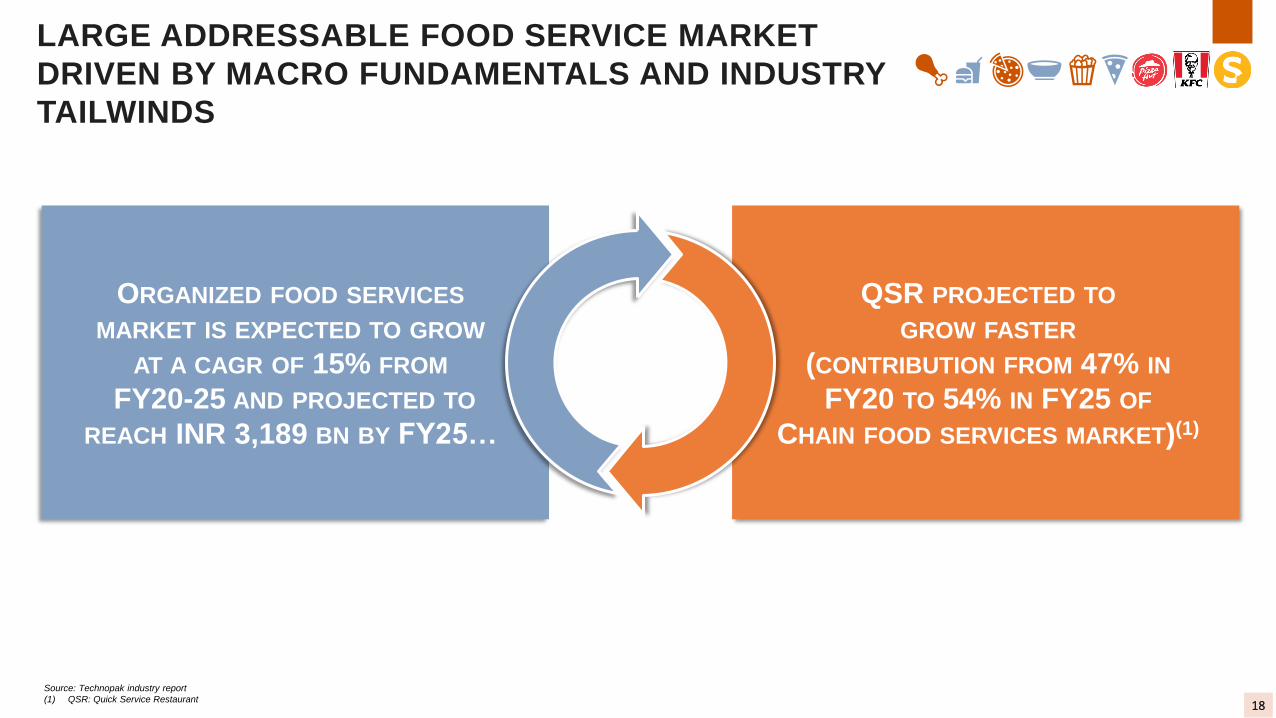
QSR PROJECTED TO
GROW FASTER
(CONTRIBUTION FROM 47% IN
FY20 TO 54% IN FY25 OF
CHAIN FOOD SERVICES MARKET)(1)
ORGANIZED FOOD SERVICES
MARKET IS EXPECTED TO GROW
AT A CAGR OF 15% FROM
FY20-25 AND PROJECTED TO
REACH INR 3,189 BN BY FY25…
Source: Technopak industry report
(1) QSR: Quick Service Restaurant
LARGE ADDRESSABLE FOOD SERVICE MARKET
DRIVEN BY MACRO FUNDAMENTALS AND INDUSTRY
TAILWINDS
18
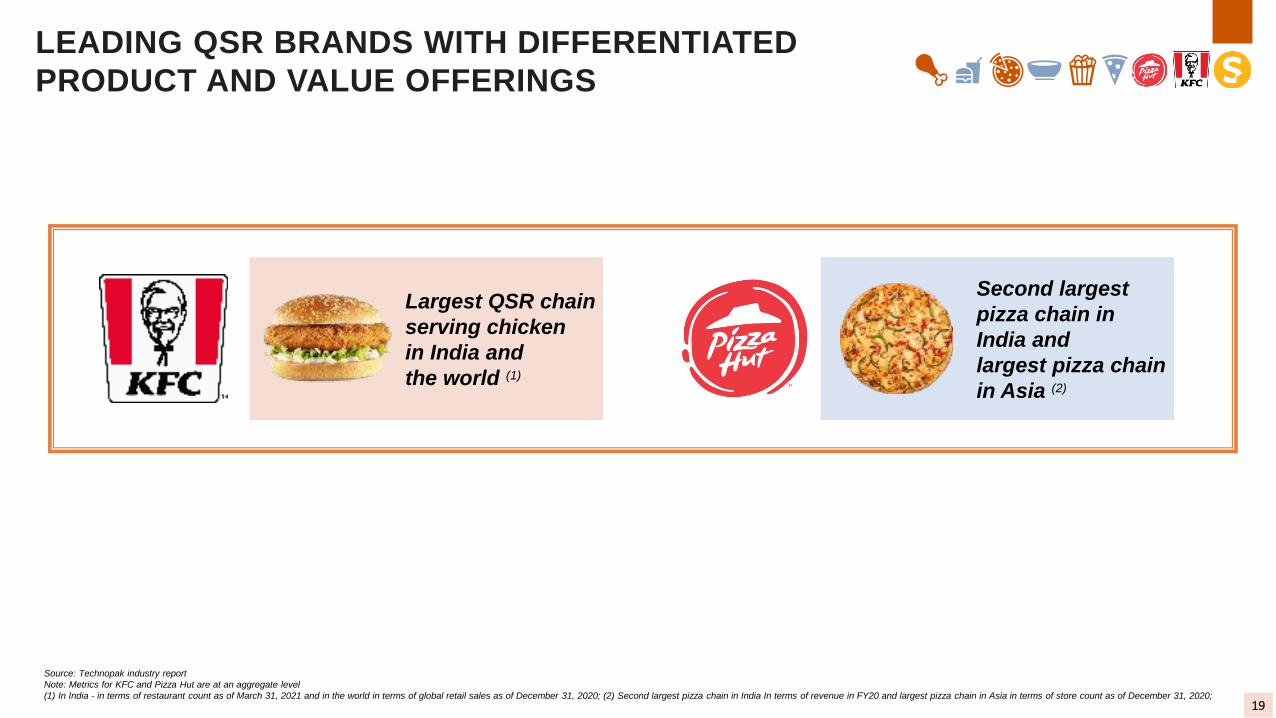
Largest QSR chain
serving chicken
in India and
the world (1)
Second largest
pizza chain in
India and
largest pizza chain
in Asia (2)
Source: Technopak industry report
Note: Metrics for KFC and Pizza Hut are at an aggregate level
(1) In India - in terms of restaurant count as of March 31, 2021 and in the world in terms of global retail sales as of December 31, 2020; (2) Second largest pizza chain in India In terms of revenue in FY20 and largest pizza chain in Asia in terms of store count as of December 31, 2020;
LEADING QSR BRANDS WITH DIFFERENTIATED
PRODUCT AND VALUE OFFERINGS
19
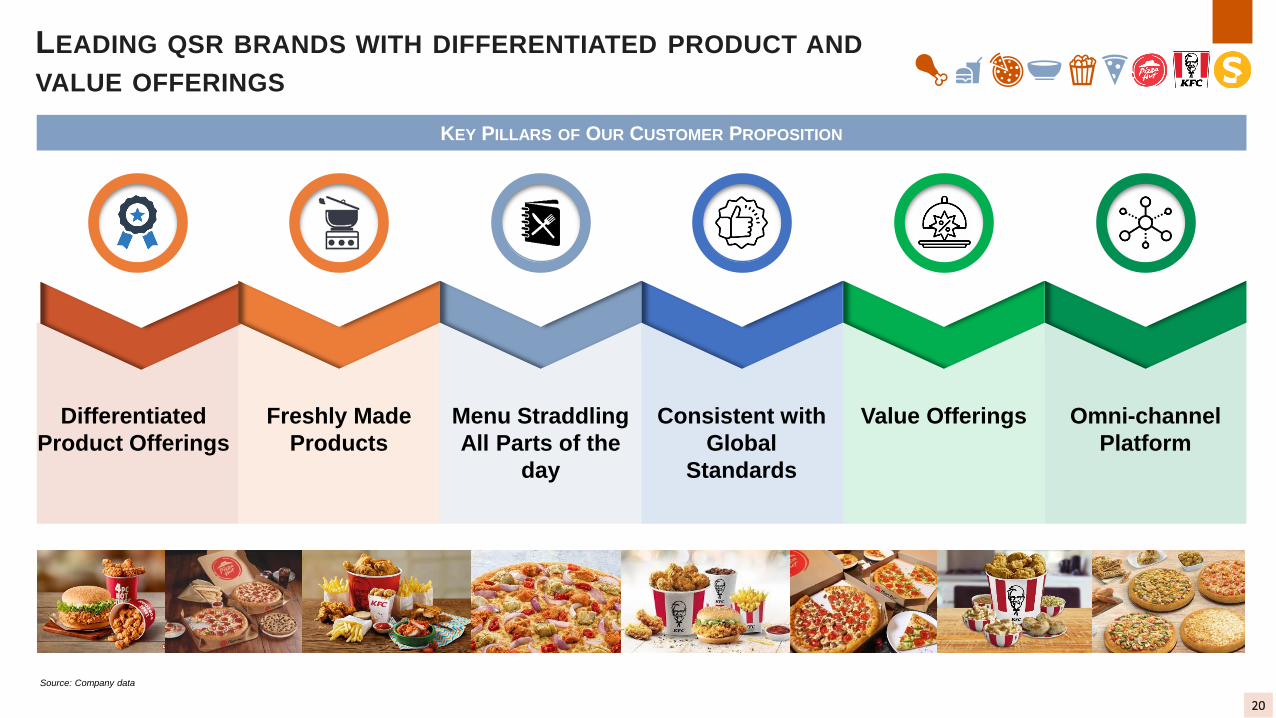
Source: Company data
KEY PILLARS OF OUR CUSTOMER PROPOSITION
Differentiated
Product Offerings
Freshly Made
Products
Menu Straddling
All Parts of the
day
Value Offerings Omni-channel
Platform
LEADING QSR BRANDS WITH DIFFERENTIATED PRODUCT AND
VALUE OFFERINGS
Consistent with
Global
Standards
20
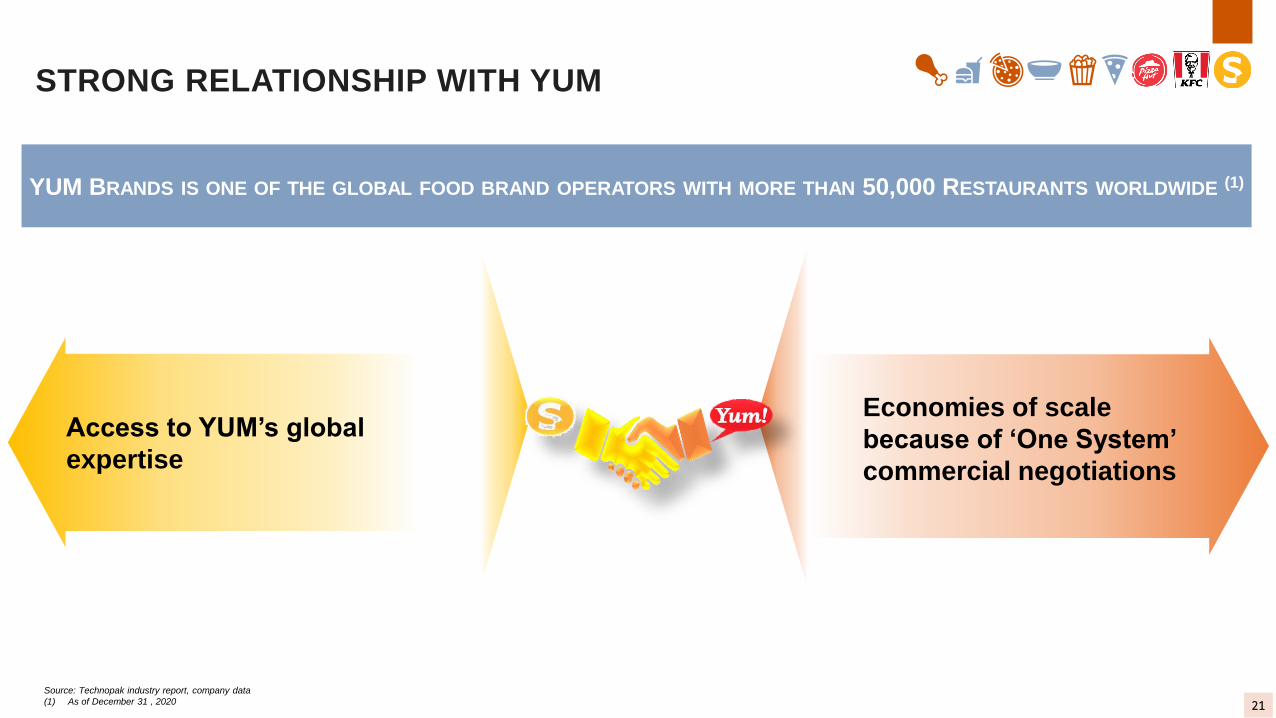
Access to YUM’s global
expertise
Source: Technopak industry report, company data
(1) As of December 31 , 2020
YUM BRANDS IS ONE OF THE GLOBAL FOOD BRAND OPERATORS WITH MORE THAN 50,000 RESTAURANTS WORLDWIDE (1)
Economies of scale
because of ‘One System’
commercial negotiations
STRONG RELATIONSHIP WITH YUM
21
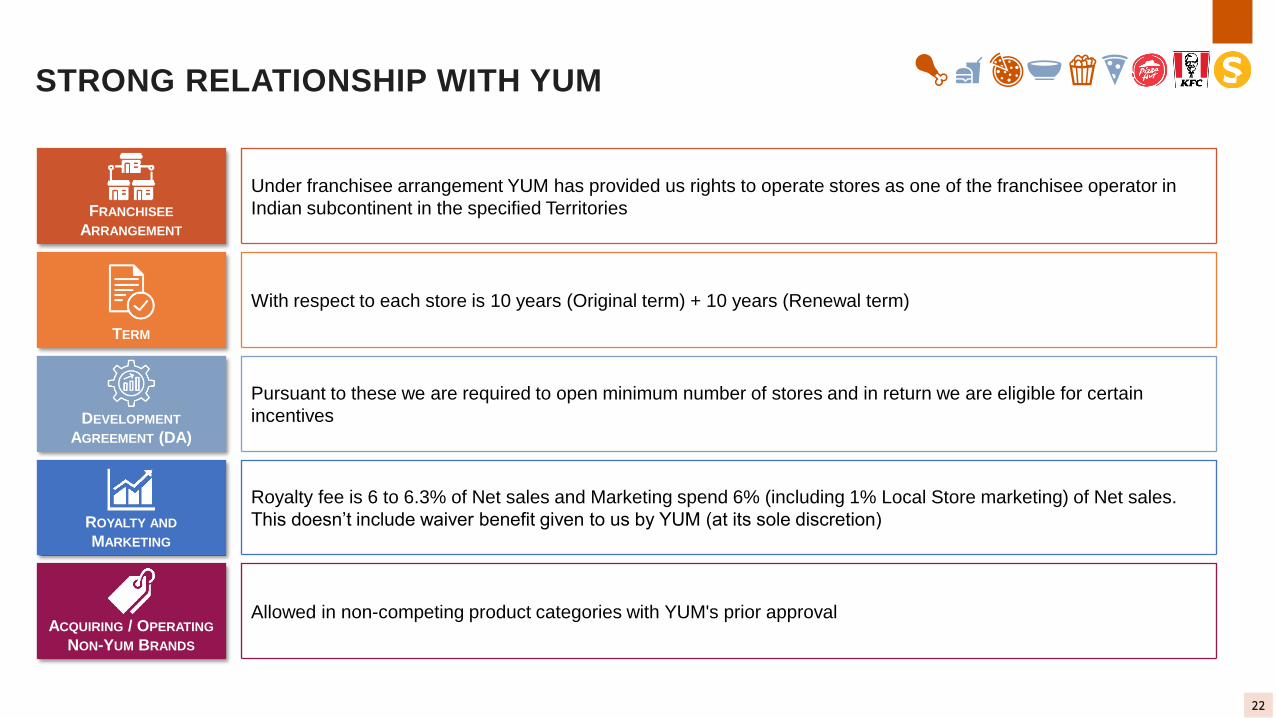
STRONG RELATIONSHIP WITH YUM
FRANCHISEE
ARRANGEMENT
TERM
DEVELOPMENT
AGREEMENT (DA)
ROYALTY AND
MARKETING
ACQUIRING / OPERATING
NON-YUM BRANDS
Under franchisee arrangement YUM has provided us rights to operate stores as one of the franchisee operator in
Indian subcontinent in the specified Territories
With respect to each store is 10 years (Original term) + 10 years (Renewal term)
Pursuant to these we are required to open minimum number of stores and in return we are eligible for certain
incentives
Royalty fee is 6 to 6.3% of Net sales and Marketing spend 6% (including 1% Local Store marketing) of Net sales.
This doesn’t include waiver benefit given to us by YUM (at its sole discretion)
Allowed in non-competing product categories with YUM's prior approval
22
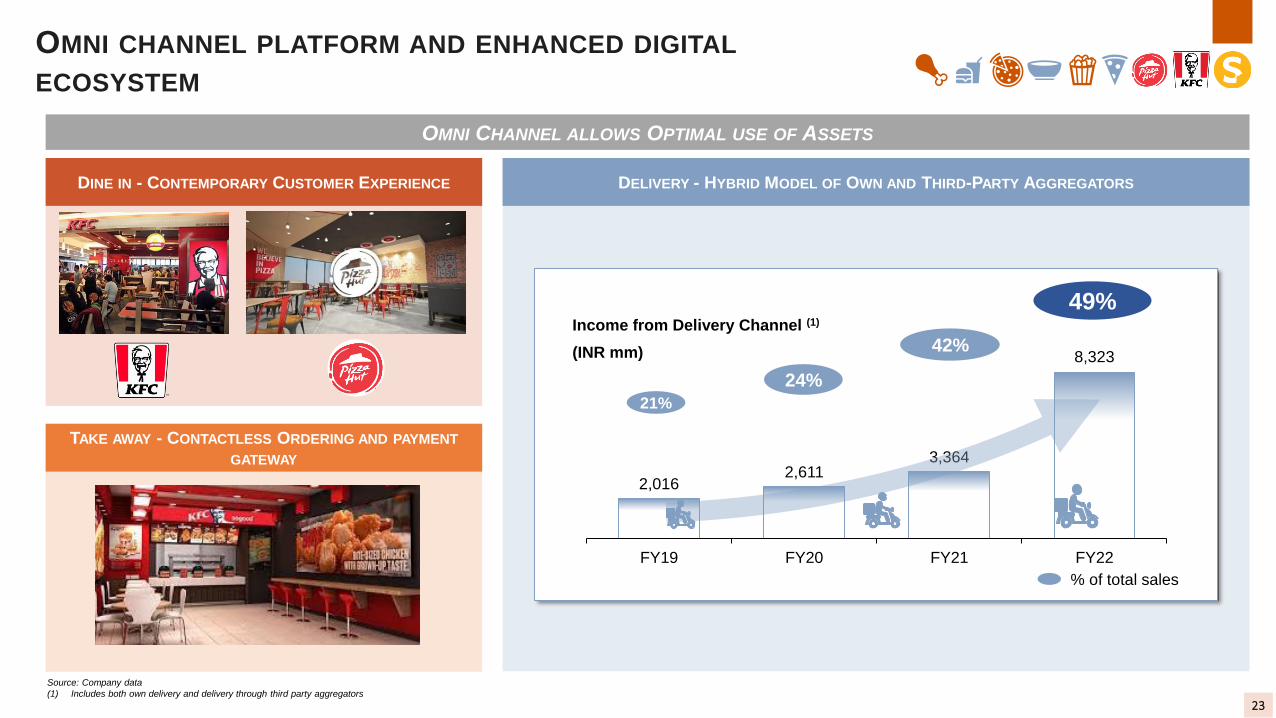
TAKE AWAY - CONTACTLESS ORDERING AND PAYMENT
GATEWAY
DINE IN - CONTEMPORARY CUSTOMER EXPERIENCE
OMNI CHANNEL ALLOWS OPTIMAL USE OF ASSETS
Source: Company data
(1) Includes both own delivery and delivery through third party aggregators
DELIVERY - HYBRID MODEL OF OWN AND THIRD-PARTY AGGREGATORS
Income from Delivery Channel (1)
(INR mm)
2,0162,611
3,364
8,323
FY19 FY20 FY21 FY22
% of total sales
21%
24%
42%
49%
OMNI CHANNEL PLATFORM AND ENHANCED DIGITAL
ECOSYSTEM
23
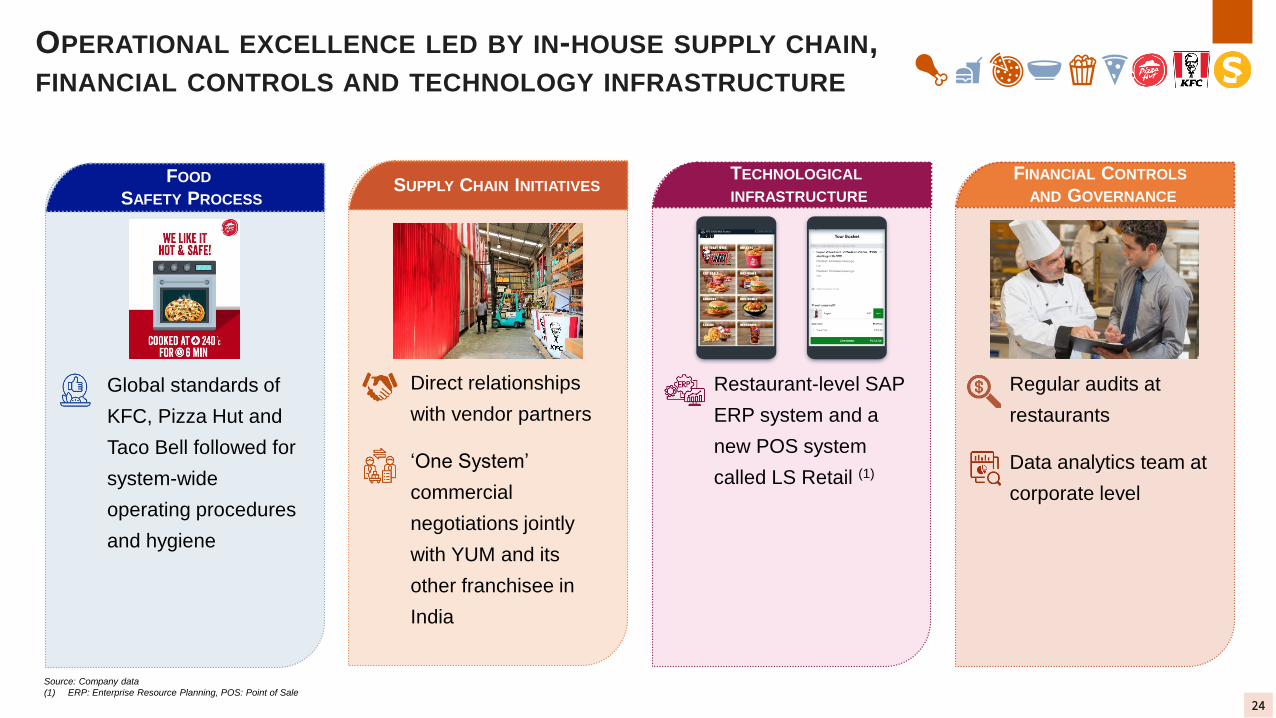
Restaurant-level SAP
ERP system and a
new POS system
called LS Retail (1)
Regular audits at
restaurants
Data analytics team at
corporate level
Source: Company data
(1) ERP: Enterprise Resource Planning, POS: Point of Sale
TECHNOLOGICAL
INFRASTRUCTURE
FINANCIAL CONTROLS
AND GOVERNANCE
Direct relationships
with vendor partners
‘One System’
commercial
negotiations jointly
with YUM and its
other franchisee in
India
SUPPLY CHAIN INITIATIVES
OPERATIONAL EXCELLENCE LED BY IN-HOUSE SUPPLY CHAIN,
FINANCIAL CONTROLS AND TECHNOLOGY INFRASTRUCTURE
Global standards of
KFC, Pizza Hut and
Taco Bell followed for
system-wide
operating procedures
and hygiene
FOOD
SAFETY PROCESS
24
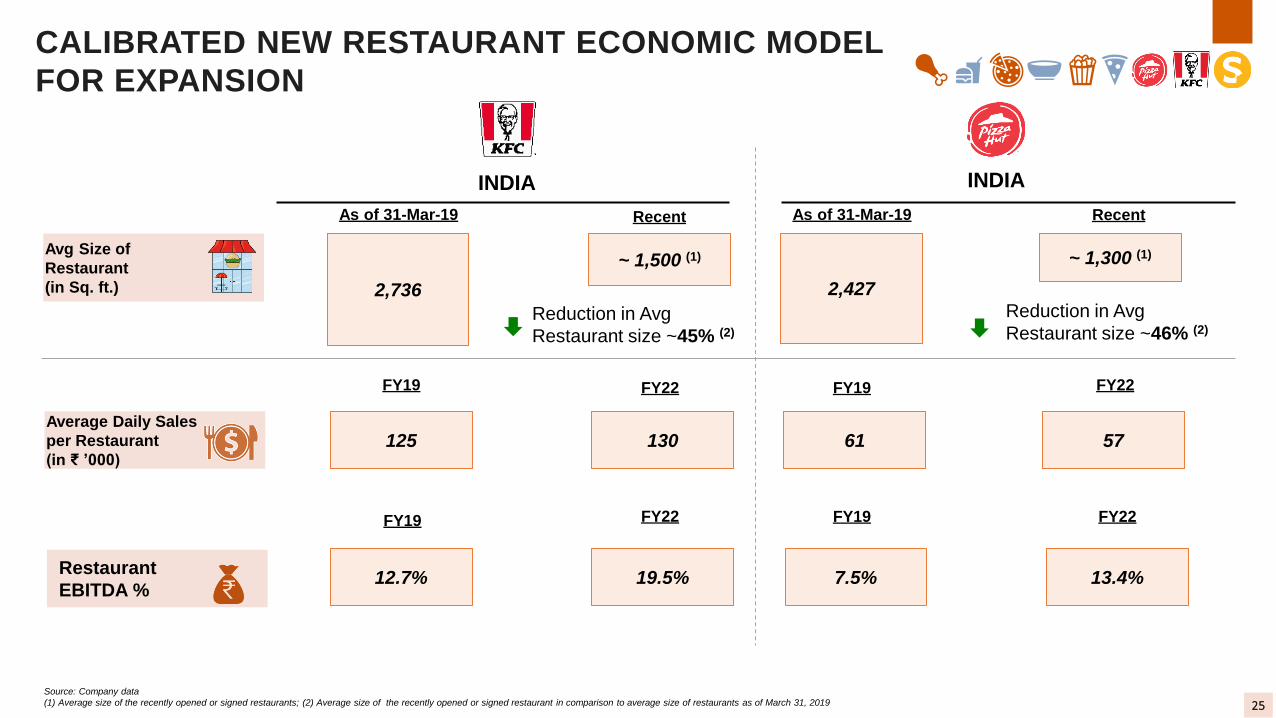
CALIBRATED NEW RESTAURANT ECONOMIC MODEL
FOR EXPANSION
Source: Company data
(1) Average size of the recently opened or signed restaurants; (2) Average size of the recently opened or signed restaurant in comparison to average size of restaurants as of March 31, 2019
As of 31-Mar-19 Recent
2,736
~ 1,500 (1)
As of 31-Mar-19
2,427
~ 1,300 (1)Avg Size of
Restaurant
(in Sq. ft.)
FY19 FY22 FY19 FY22
125 130 61 57Average Daily Sales
per Restaurant
(in ₹ ’000)
Reduction in Avg
Restaurant size ~45% (2)
Reduction in Avg
Restaurant size ~46% (2)
Restaurant
EBITDA %
FY22
12.7% 19.5% 7.5% 13.4%
FY22FY19FY19
INDIA INDIA
25
Recent
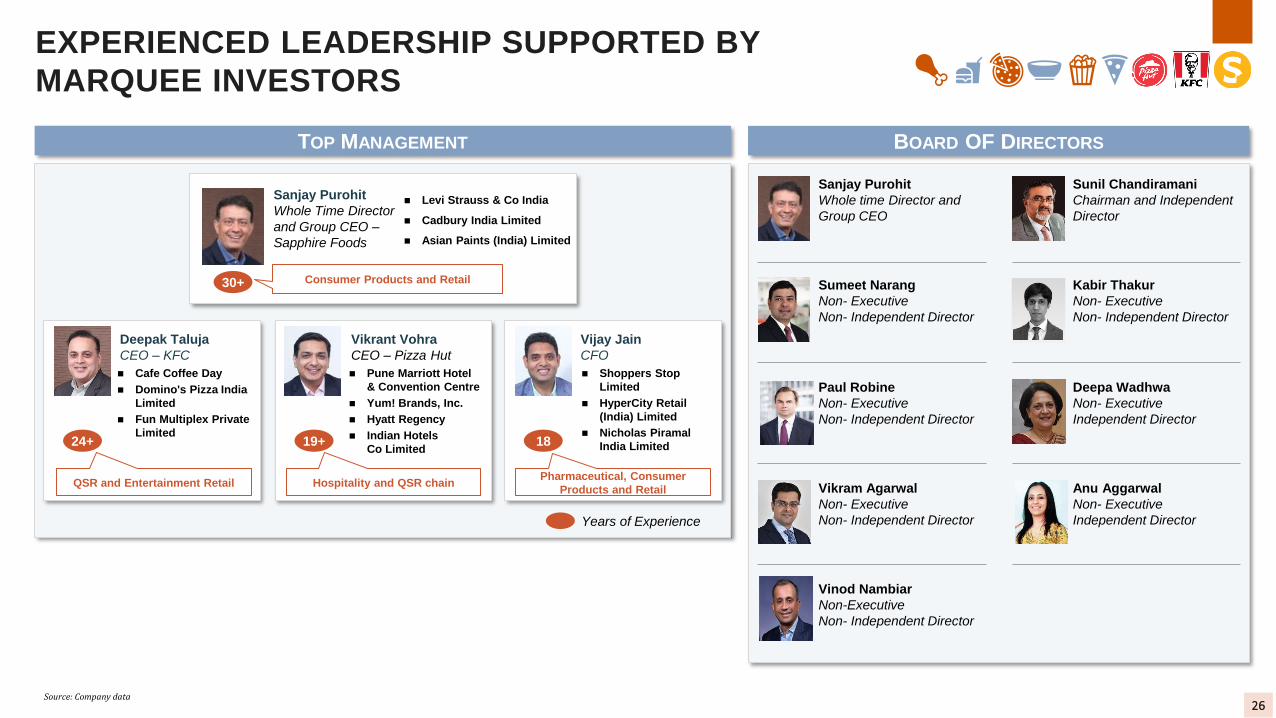
EXPERIENCED LEADERSHIP SUPPORTED BY
MARQUEE INVESTORS
Sanjay Purohit
Whole Time Director
and Group CEO –
Sapphire Foods
Vijay Jain
CFO
Years of Experience
TOP MANAGEMENT BOARD OF DIRECTORS
Sanjay Purohit
Whole time Director and
Group CEO
Sumeet Narang
Non- Executive
Non- Independent Director
Paul Robine
Non- Executive
Non- Independent Director
Deepa Wadhwa
Non- Executive
Independent Director
Vikram Agarwal
Non- Executive
Non- Independent Director
Anu Aggarwal
Non- Executive
Independent Director
Vinod Nambiar
Non-Executive
Non- Independent Director
Vikrant Vohra
CEO – Pizza Hut
Deepak Taluja
CEO – KFC
Source: Company data
Sunil Chandiramani
Chairman and Independent
Director
Kabir Thakur
Non- Executive
Non- Independent Director
◼ Levi Strauss & Co India
◼ Cadbury India Limited
◼ Asian Paints (India) Limited
◼ Cafe Coffee Day
◼ Domino's Pizza India
Limited
◼ Fun Multiplex Private
Limited
◼ Pune Marriott Hotel
& Convention Centre
◼ Yum! Brands, Inc.
◼ Hyatt Regency
◼ Indian Hotels
Co Limited
◼ Shoppers Stop
Limited
◼ HyperCity Retail
(India) Limited
◼ Nicholas Piramal
India Limited1819+24+
Consumer Products and Retail
QSR and Entertainment Retail
30+
Hospitality and QSR chainPharmaceutical, Consumer
Products and Retail
26
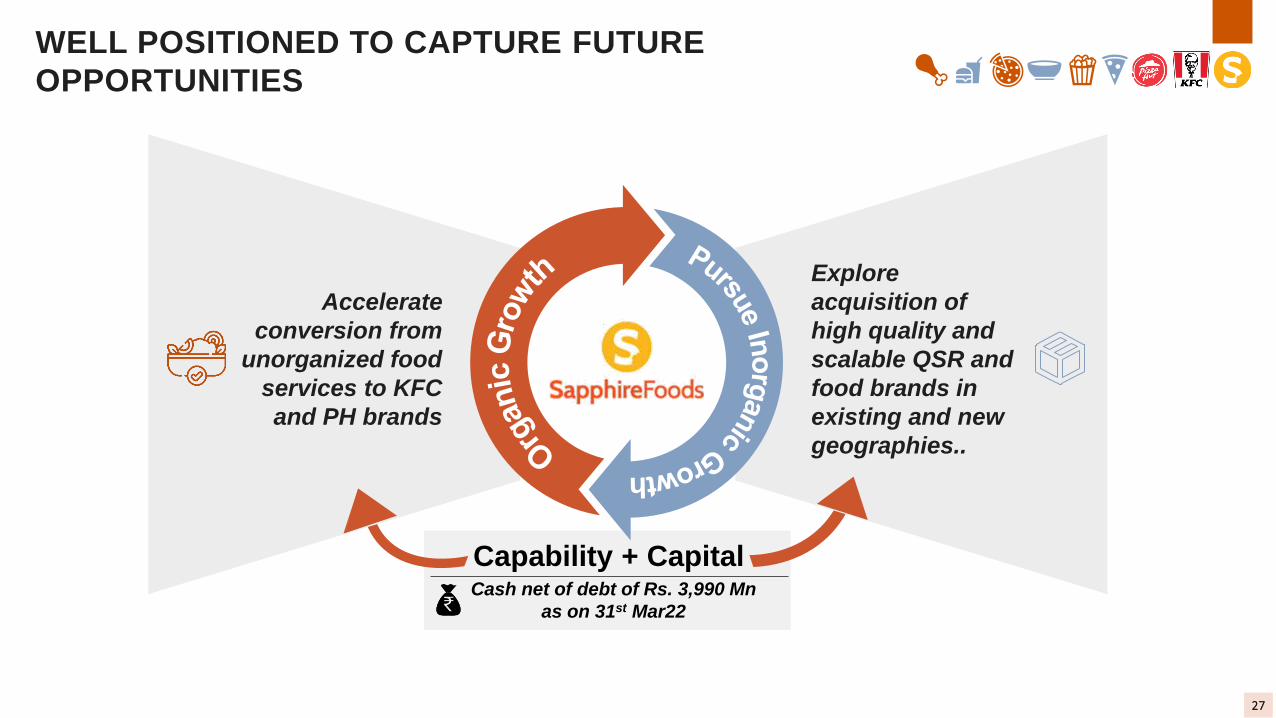
WELL POSITIONED TO CAPTURE FUTURE
OPPORTUNITIES
Capability + CapitalCash net of debt of Rs. 3,990 Mn
as on 31st Mar22
Accelerate
conversion from
unorganized food
services to KFC
and PH brands
Explore
acquisition of
high quality and
scalable QSR and
food brands in
existing and new
geographies..
27
THANK YOU
Sapphire Foods India Limited
CIN: L55204MH2009PLC197005
Mr. Rahul Kapoor
Email ID: [email protected]
www.sapphirefoods.in
Orient Capital (a division of Link Group)
Mr. Nachiket Kale
Email ID: [email protected]
+91 9920940808
www.orientcap.com
Company: Investor Relations Partner: